Exhibit 99.1
The Research Intelligence SaaS Solution for Science & Technology Mar 2017 OTCQB: RSSS Corporate Presentation
OTCQB:RSSS Forward - Looking Statements This presentation contains forward - looking statements that relate to future activities, events or developments. All statements, other than statements of fact, that address activities, events or developments that the company or its management expect, project, believe or anticipate will or may occur in the future, or that relate to historical periods that will be reported in future filings with the Securities and Exchange Commission, are forward - looking statements. Forward - looking statements are made based on management’s assumptions and assessments in light of past experience and trends, current conditions, expected future developments and other relevant factors. Forward - looking statements are not guarantees of performance, and actual results, developments and business decisions may differ from those envisaged by these forward - looking statements. These forward - looking statements are also subject to risks and uncertainties which can affect the company’s performance in both the near - and long - term. The company identifies many of these risks and uncertainties that could affect its performance in its SEC filings, including its most recent reports on Form 10 - K and Form 10 - Q, particularly under the heading "Risk Factors." Copies of these filings are available online from the SEC or at the company’s website. The company undertakes no duty to update any statement in light of new information or future events, or for any other reason. © 2017 Research Solutions, Inc. – All Rights Reserved 2
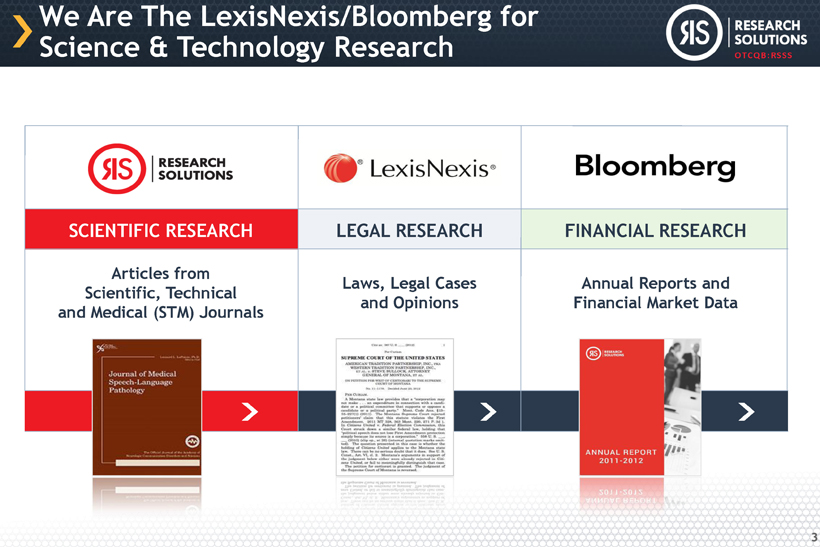
OTCQB:RSSS We Are The LexisNexis/Bloomberg for Science & Technology Research 3 SCIENTIFIC RESEARCH Articles from Scientific, Technical and Medical (STM) Journals Laws, Legal Cases and Opinions Annual Reports and Financial Market Data FINANCIAL RESEARCH LEGAL RESEARCH
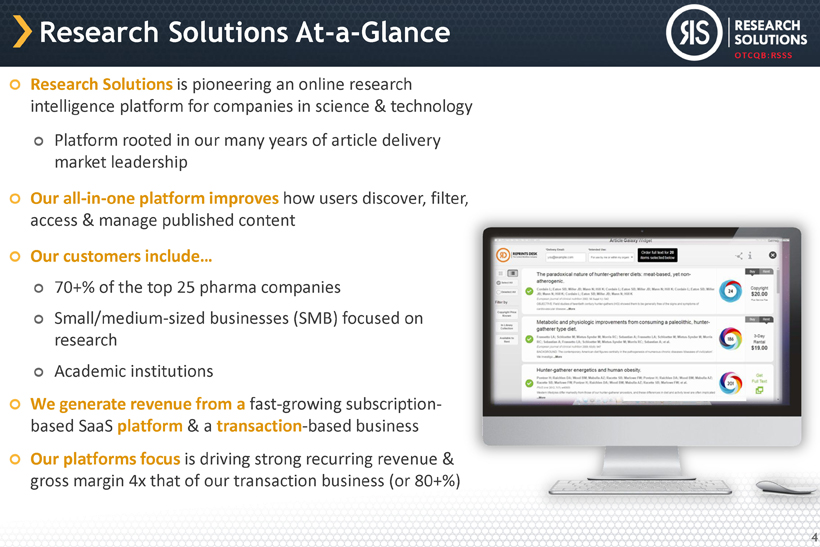
OTCQB:RSSS Research Solutions At - a - Glance Research Solutions is pioneering an online research intelligence platform for companies in science & technology Platform rooted in our many years of article delivery market leadership Our all - in - one platform improves how users discover, filter, access & manage published content Our customers include… 70 +% of the top 25 pharma companies Small/medium - sized businesses (SMB) focused on research Academic institutions We generate revenue from a fast - growing subscription - based SaaS platform & a transaction - based business Our platforms focus is driving strong recurring revenue & gross margin 4 x that of our transaction business (or 80 +%) IP: I’d replace with this screenshot 4
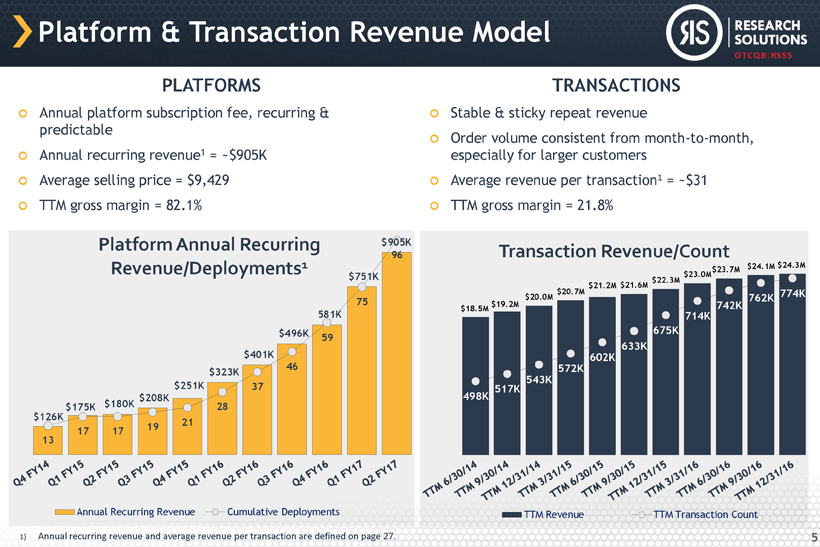
OTCQB:RSSS PLATFORMS Annual platform subscription fee, recurring & predictable Annual recurring revenue 1 = ~$905K Average selling price = $9,429 TTM gross margin = 82.1% Platform & Transaction Revenue Model 5 $126K $ 175 K $180K $ 208 K $251K $323K $401K $496K 581K $ 751 K $905K 13 17 17 19 21 28 37 46 59 75 96 Platform Annual Recurring Revenue/Deployments 1 Annual Recurring Revenue Cumulative Deployments TRANSACTIONS Stable & sticky repeat revenue Order volume consistent from month - to - month, especially for larger customers Average revenue per transaction 1 = ~$31 TTM gross margin = 21.8% $18.5M $ 19.2 M $20.0M $ 20.7 M $21.2M $21.6M $22.3M $23.0M $23.7M $ 24.1 M $24.3M 498 K 517K 543K 572K 602K 633K 675 K 714K 742 K 762K 774K Transaction Revenue/Count TTM Revenue TTM Transaction Count 1) Annual recurring revenue and average revenue per transaction are defined on page 27.
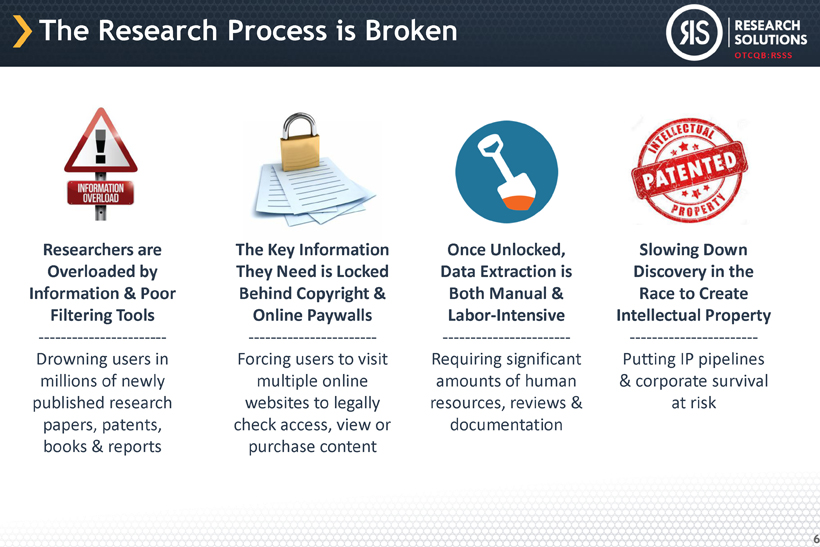
OTCQB:RSSS The Research Process is Broken 6 Researchers are Overloaded by Information & Poor Filtering Tools ----------------------- Drowning users in millions of newly published research papers, patents, books & reports The Key Information They Need is Locked Behind Copyright & Online Paywalls ----------------------- Forcing users to visit multiple online websites to legally check access, view or purchase content Once Unlocked, Data Extraction is Both Manual & Labor - Intensive ----------------------- Requiring significant amounts of human resources, reviews & documentation Slowing Down Discovery in the Race to Create Intellectual Property ----------------------- Putting IP pipelines & corporate survival at risk
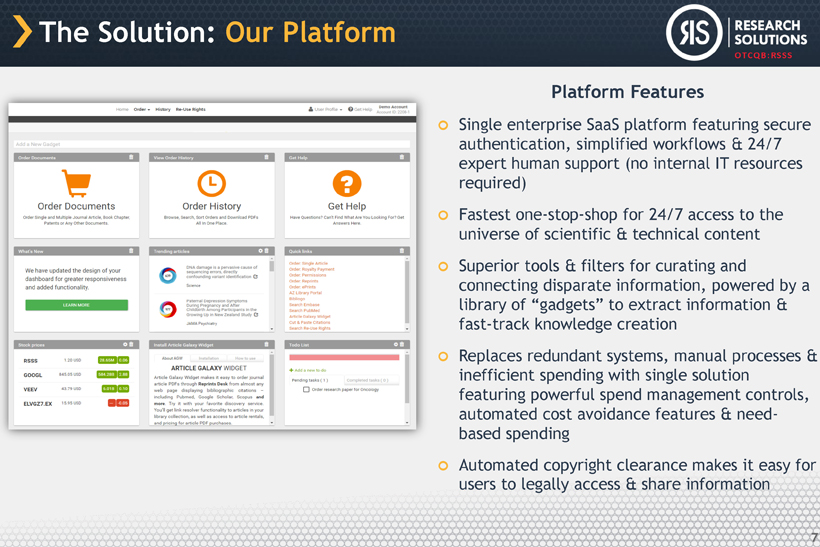
OTCQB:RSSS The Solution: Our Platform 7 Platform Features Single enterprise SaaS platform featuring secure authentication, simplified workflows & 24 / 7 expert human support (no internal IT resources required) Fastest one - stop - shop for 24 / 7 access to the universe of scientific & technical content Superior tools & filters for curating and connecting disparate information, powered by a library of “gadgets” to extract information & fast - track knowledge creation Replaces redundant systems, manual processes & inefficient spending with single solution featuring powerful spend management controls, automated cost avoidance features & need - based spending Automated copyright clearance makes it easy for users to legally access & share information
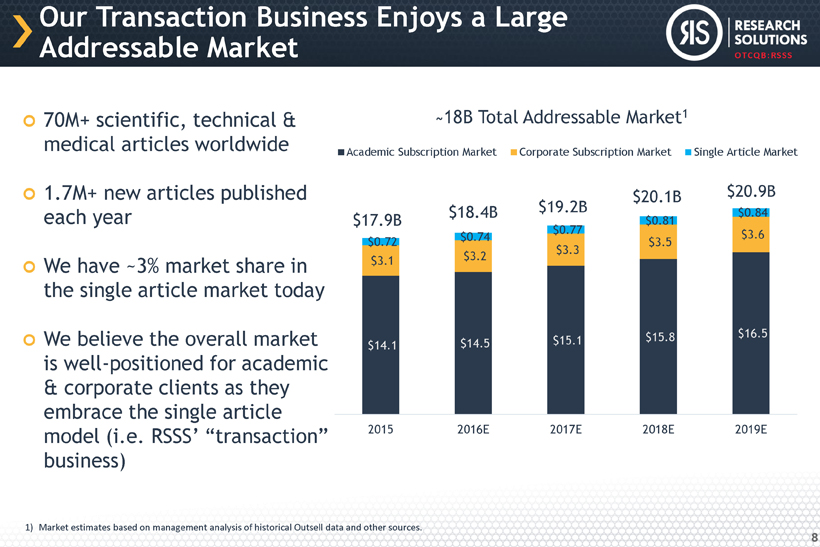
OTCQB:RSSS Our Transaction Business Enjoys a Large Addressable Market 8 70M+ scientific, technical & medical articles worldwide 1.7M+ new articles published each year We have ~3% market share in the single article market today We believe the overall market is well - positioned for academic & corporate clients as they embrace the single article model (i.e. RSSS’ “transaction” business) 1) Market estimates based on management analysis of historical Outsell data and other sources. $14.1 $ 14.5 $15.1 $15.8 $ 16.5 $3.1 $3.2 $3.3 $3.5 $ 3.6 $0.72 $0.74 $ 0.77 $0.81 $0.84 2015 2016E 2017E 2018E 2019E ̴ 18 B Total Addressable Market 1 Academic Subscription Market Corporate Subscription Market Single Article Market $17.9B $ 18.4 B $19.2B $20.1B $ 20.9 B
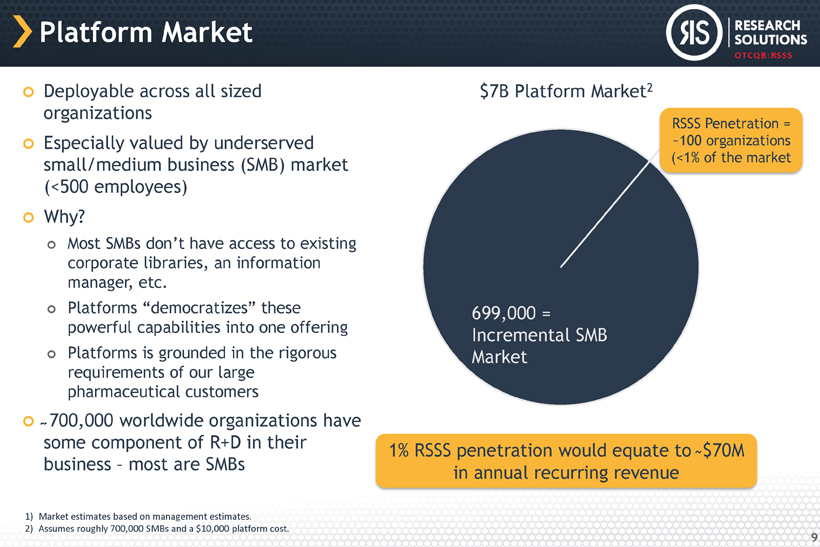
OTCQB:RSSS Platform Market 9 Deployable across all sized organizations Especially valued by underserved small/medium business (SMB) market (< 500 employees) Why? Most SMBs don’t have access to existing corporate libraries, an information manager, etc. Platforms “democratizes” these powerful capabilities into one offering Platforms is grounded in the rigorous requirements of our large pharmaceutical customers ̴̴ 700 , 000 worldwide organizations have some component of R+D in their business – most are SMBs 1) Market estimates based on management estimates. 2) Assumes roughly 700,000 SMBs and a $10,000 platform cost. $7B Platform Market 2 1 % RSSS penetration would equate to ̴ $ 70 M in annual recurring revenue 699 , 000 = Incremental SMB Market RSSS Penetration = ~100 organizations (<1% of the market
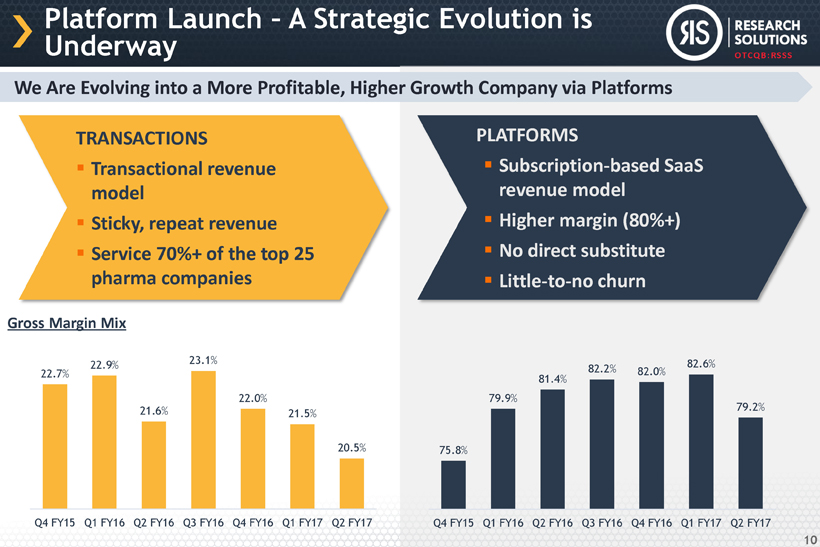
OTCQB:RSSS 22.7 % 22.9% 21.6 % 23.1% 22.0% 21.5 % 20.5 % Q4 FY15 Q1 FY16 Q2 FY16 Q3 FY16 Q4 FY16 Q1 FY17 Q2 FY17 Platform Launch – A Strategic Evolution is Underway We Are Evolving into a More Profitable, Higher Growth Company via Platforms PLATFORMS ▪ Subscription - based SaaS revenue model ▪ Higher margin (80%+) ▪ No direct substitute ▪ Little - to - no churn TRANSACTIONS ▪ Transactional revenue model ▪ Sticky, repeat revenue ▪ Service 70 %+ of the top 25 pharma companies 10 Gross Margin Mix 75.8 % 79.9 % 81.4% 82.2 % 82.0% 82.6 % 79.2% Q4 FY15 Q1 FY16 Q2 FY16 Q3 FY16 Q4 FY16 Q1 FY17 Q2 FY17
OTCQB:RSSS Sales & Marketing Strategy Selling direct in the U.S. and secondary markets Int’l represented by network of resellers in Europe & Asia covering: Japan (since ’ 10 ) Two new resellers covering key markets: • Denmark, Finland, Germany, Iceland, Norway, Sweden, Belgium, France, Italy, Luxembourg, Switzerland, The Netherlands Marketing driven by: Content - driven inbound marketing SEO+SEM Channel alliances Advertising & events Direct response & integrated marketing campaigns 11
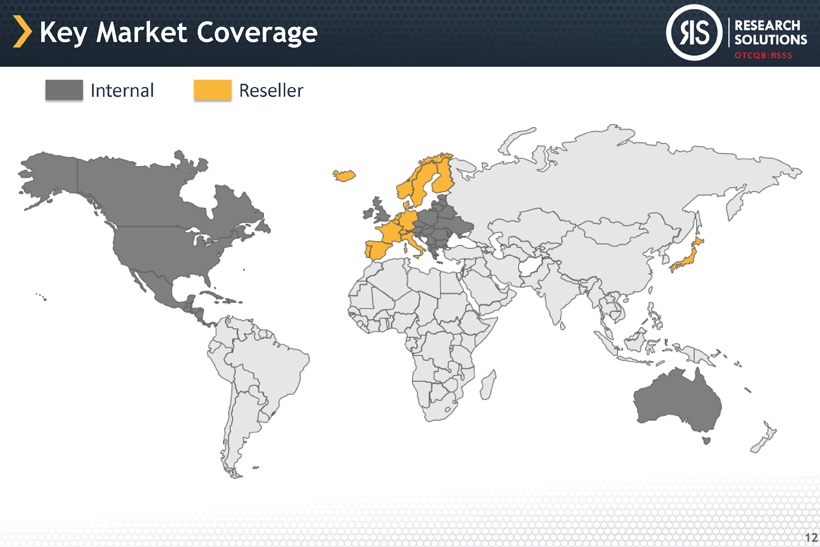
OTCQB:RSSS Key Market Coverage 12 Reseller Internal
OTCQB:RSSS Loyal, Marquee Customer Base Stable & growing base of 100 + platform customers & ~ 1 , 000 transaction customers ~$ 1 M in ARR from platform subscriptions Virtually zero top customer churn Revenue concentrations Top customer: ~ 4 % of revenue Top 10 customers: ~ 27 % of revenue Top 35 customers: ~ 53 % of revenue 13
OTCQB:RSSS We’re Partnered with Leading, Long - Established Publishers & Data Sources 14
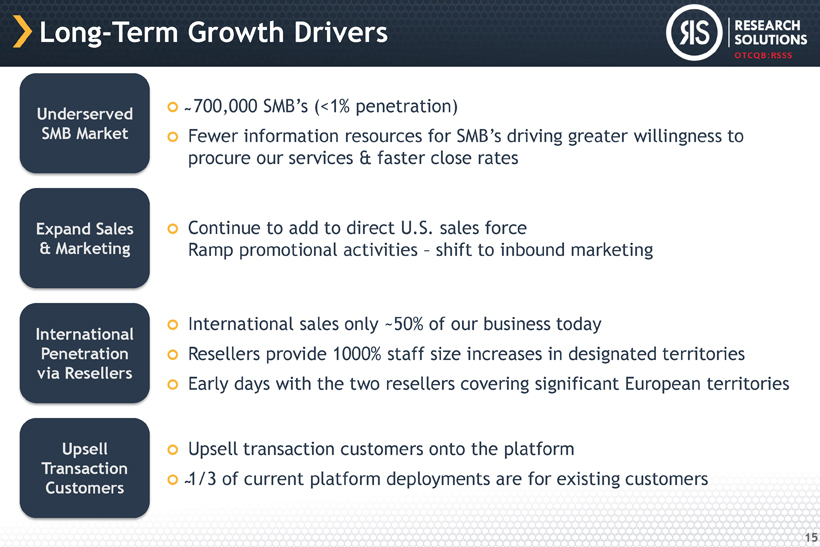
OTCQB:RSSS Long - Term Growth Drivers 15 Underserved SMB Market Expand Sales & Marketing International Penetration via Resellers Upsell Transaction Customers ̴ 700 , 000 SMB’s (< 1 % penetration) Fewer information resources for SMB’s driving greater willingness to procure our services & faster close rates Continue to add to direct U.S. sales force Ramp promotional activities – shift to inbound marketing International sales only ~ 50 % of our business today Resellers provide 1000 % staff size increases in designated territories Early days with the two resellers covering significant European territories Upsell transaction customers onto the platform ̴ 1 / 3 of current platform deployments are for existing customers

FINANCIAL OVERVIEW
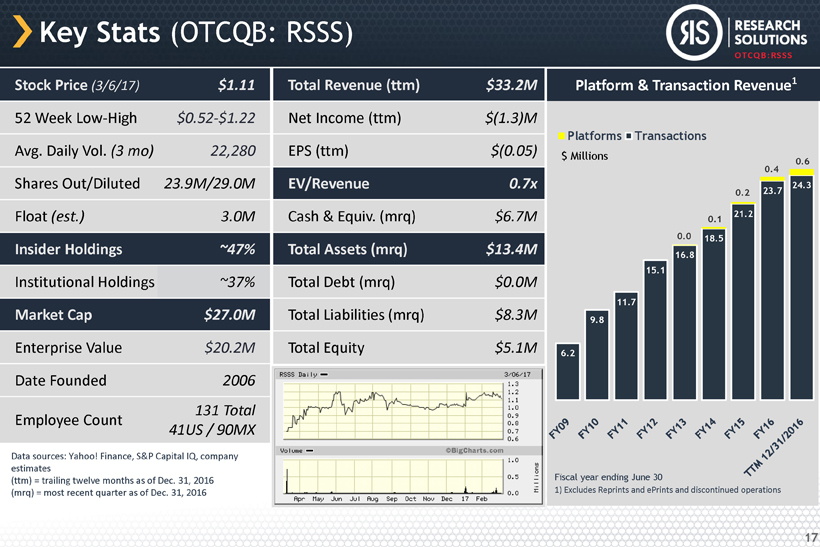
OTCQB:RSSS Platform & Transaction Revenue 1 Key Stats (OTCQB: RSSS) 17 Stock Price (3/6/17) $1.11 52 Week Low - High $0.52 - $1.22 Avg. Daily Vol. (3 mo) 22,280 Shares Out/Diluted 23.9M/29.0M Float (est.) 3.0M Insider Holdings ~47% Institutional Holdings ~37% Market Cap $27.0M Enterprise Value $20.2M Date Founded 2006 Employee Count 131 Total 41US / 90MX Data sources: Yahoo! Finance, S&P Capital IQ, company estimates (ttm) = trailing twelve months as of Dec. 31 , 2016 (mrq) = most recent quarter as of Dec. 31 , 2016 Total Revenue (ttm) $33.2M Net Income (ttm) $(1.3)M EPS (ttm) $(0.05) EV/Revenue 0.7x Cash & Equiv. (mrq) $6.7M Total Assets (mrq) $13.4M Total Debt (mrq) $0.0M Total Liabilities (mrq) $8.3M Total Equity $5.1M 6.2 9.8 11.7 15.1 16.8 18.5 21.2 23.7 24.3 0.0 0.1 0.2 0.4 0.6 Platforms Transactions $ Millions Fiscal year ending June 30 1 ) Excludes Reprints and ePrints and discontinued operations
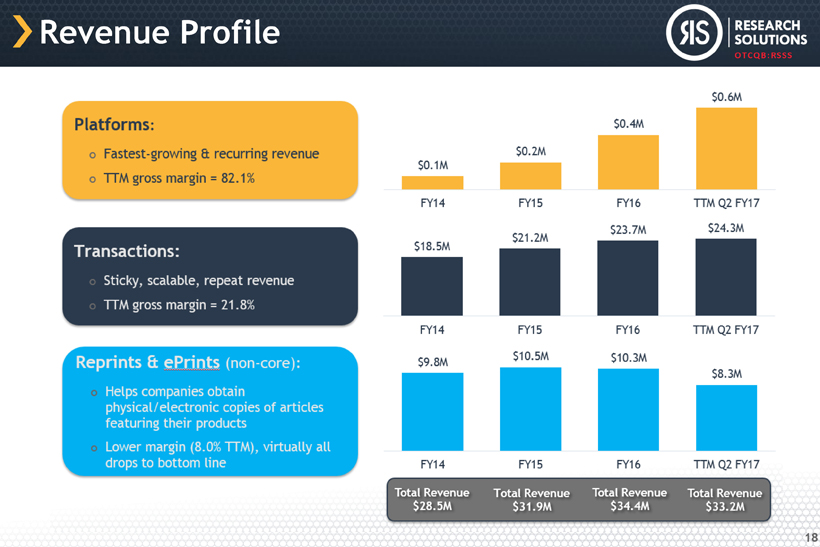
OTCQB:RSSS Revenue Profile 18
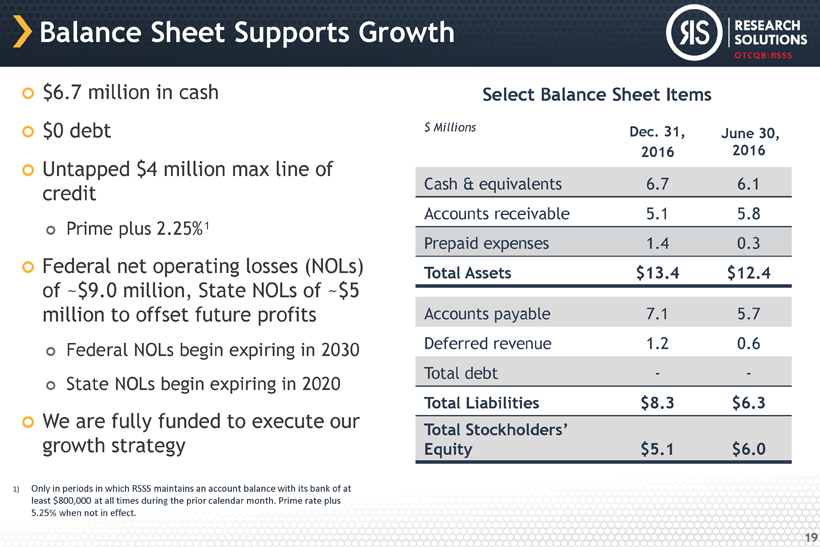
OTCQB:RSSS Balance Sheet Supports Growth $ 6.7 million in cash $ 0 debt Untapped $ 4 million max line of credit Prime plus 2.25 % ¹ Federal net operating losses (NOLs) of ~$ 9.0 million, State NOLs of ~$ 5 million to offset future profits Federal NOLs begin expiring in 2030 State NOLs begin expiring in 2020 We are fully funded to execute our growth strategy 19 Select Balance Sheet Items $ Millions Dec. 31, 2016 June 30, 2016 Cash & equivalents 6.7 6.1 Accounts receivable 5.1 5.8 Prepaid expenses 1.4 0.3 Total Assets $13.4 $12.4 Accounts payable 7.1 5.7 Deferred revenue 1.2 0.6 Total debt - - Total Liabilities $8.3 $6.3 Total Stockholders’ Equity $5.1 $6.0 1) Only in periods in which RSSS maintains an account balance with its bank of at least $800,000 at all times during the prior calendar month. Prime rate plus 5.25% when not in effect.
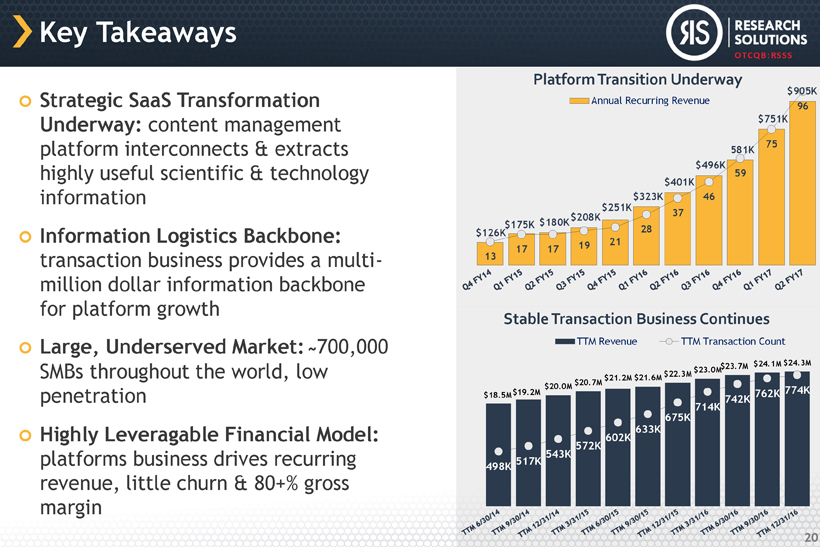
OTCQB:RSSS Key Takeaways Strategic SaaS Transformation Underway: content management platform interconnects & extracts highly useful scientific & technology information Information Logistics Backbone: transaction business provides a multi - million dollar information backbone for platform growth Large, Underserved Market: ̴ 700 , 000 SMBs throughout the world, low penetration Highly Leveragable Financial Model: platforms business drives recurring revenue, little churn & 80 +% gross margin 20 $ 126 K $175K $ 180 K $ 208 K $251K $323K $ 401 K $496K 581 K $751K $ 905 K 13 17 17 19 21 28 37 46 59 75 96 Platform Transition Underway Annual Recurring Revenue $18.5M $ 19.2 M $20.0M $ 20.7 M $ 21.2 M $21.6M $22.3M $ 23.0 M $23.7M $ 24.1 M $24.3M 498 K 517 K 543K 572K 602 K 633K 675 K 714K 742 K 762 K 774K Stable Transaction Business Continues TTM Revenue TTM Transaction Count
OTCQB:RSSS Contact Us Peter Derycz, Chairman & CEO Alan Urban, CFO Research Solutions, Inc. 15821 Ventura Blvd., Suite 165 Encino, California 91436 For more information, please visit: www.researchsolutions.com Investor Relations Contact: Cody Slach or Sean Mansouri Liolios Investor Relations 949 - 574 - 3860 • RSSS@liolios.com 21
Appendix 22
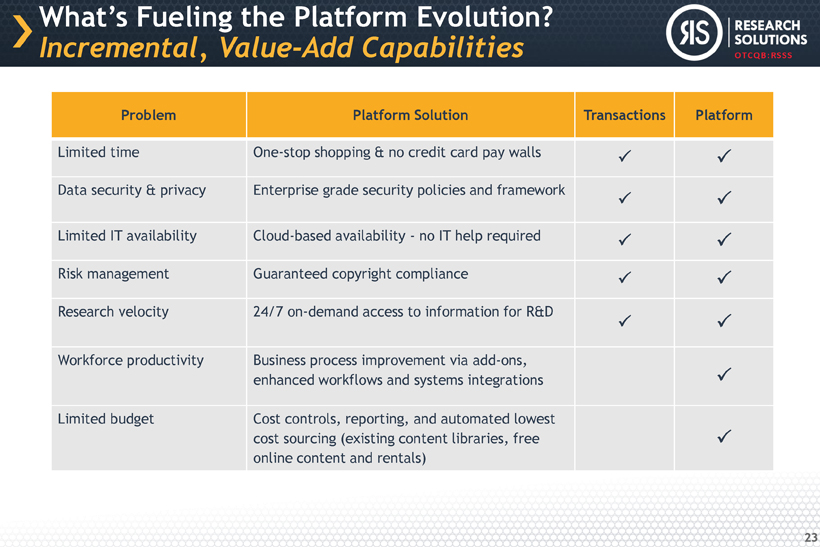
OTCQB:RSSS What’s Fueling the Platform Evolution? Incremental, Value - Add Capabilities 23 Problem Platform Solution Transactions Platform Limited time One - stop shopping & no credit card pay walls Data security & privacy Enterprise grade security policies and framework Limited IT availability Cloud - based availability - no IT help required Risk management Guaranteed copyright compliance Research velocity 24/7 on - demand access to information for R&D Workforce productivity Business process improvement via add - ons, enhanced workflows and systems integrations Limited budget Cost controls, reporting, and automated lowest cost sourcing (existing content libraries, free online content and rentals)
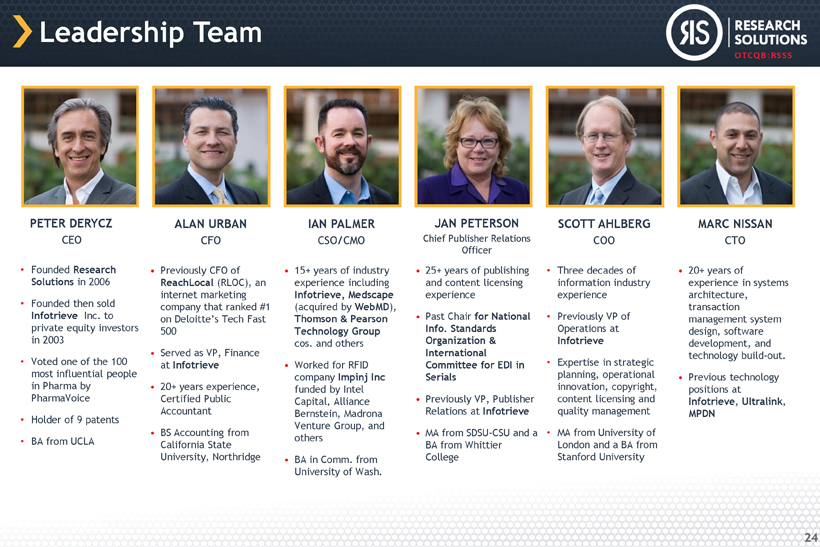
OTCQB:RSSS PETER DERYCZ CEO • Founded Research Solutions in 2006 • Founded then sold Infotrieve Inc. to private equity investors in 2003 • Voted one of the 100 most influential people in Pharma by PharmaVoice • Holder of 9 patents • BA from UCLA ALAN URBAN CFO • Previously CFO of ReachLocal (RLOC), an internet marketing company that ranked #1 on Deloitte’s Tech Fast 500 • Served as VP, Finance at Infotrieve • 20+ years experience, Certified Public Accountant • BS Accounting from California State University, Northridge IAN PALMER CSO/CMO • 15+ years of industry experience including Infotrieve, Medscape (acquired by WebMD ), Thomson & Pearson Technology Group cos. and others • Worked for RFID company Impinj Inc funded by Intel Capital, Alliance Bernstein, Madrona Venture Group, and others • BA in Comm. from University of Wash. JAN PETERSON Chief Publisher Relations Officer • 25+ years of publishing and content licensing experience • Past Chair for National Info. Standards Organization & International Committee for EDI in Serials • Previously VP, Publisher Relations at Infotrieve • MA from SDSU - CSU and a BA from Whittier College SCOTT AHLBERG COO • Three decades of information industry experience • Previously VP of Operations at Infotrieve • Expertise in strategic planning, operational innovation, copyright, content licensing and quality management • MA from University of London and a BA from Stanford University MARC NISSAN CTO • 20+ years of experience in systems architecture, transaction management system design, software development, and technology build - out. • Previous technology positions at Infotrieve , Ultralink , MPDN Leadership Team 24
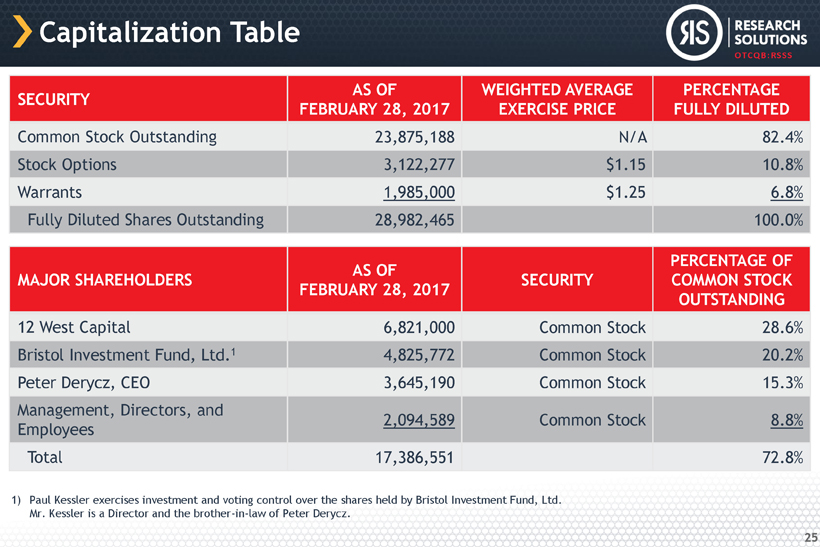
OTCQB:RSSS Capitalization Table SECURITY AS OF FEBRUARY 28, 2017 WEIGHTED AVERAGE EXERCISE PRICE PERCENTAGE FULLY DILUTED Common Stock Outstanding 23,875,188 N/A 82.4% Stock Options 3,122,277 $1.15 10.8% Warrants 1,985,000 $1.25 6.8% Fully Diluted Shares Outstanding 28,982,465 100.0% MAJOR SHAREHOLDERS AS OF FEBRUARY 28, 2017 SECURITY PERCENTAGE OF COMMON STOCK OUTSTANDING 12 West Capital 6,821,000 Common Stock 28.6% Bristol Investment Fund, Ltd. 1 4,825,772 Common Stock 20.2% Peter Derycz, CEO 3,645,190 Common Stock 15.3% Management, Directors, and Employees 2,094,589 Common Stock 8.8% Total 17,386,551 72.8% 1) Paul Kessler exercises investment and voting control over the shares held by Bristol Investment Fund, Ltd. Mr. Kessler is a Director and the brother - in - law of Peter Derycz. 25
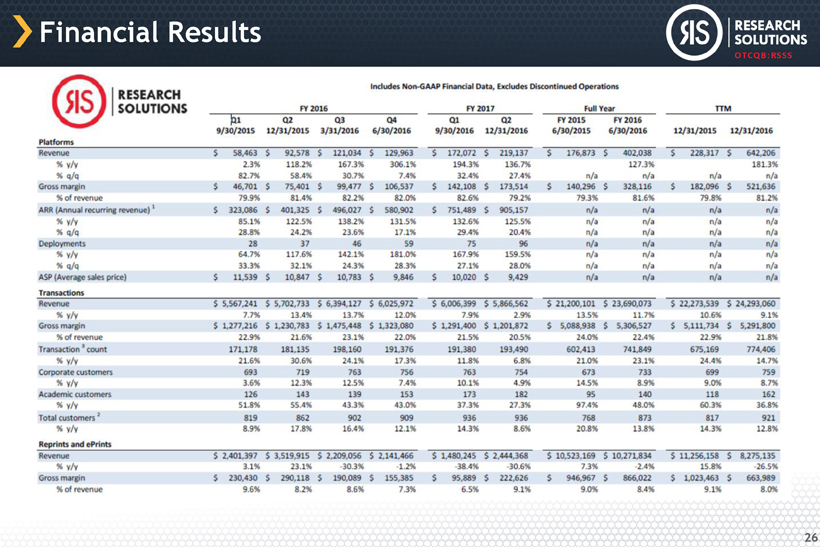
OTCQB:RSSS Financial Results 26
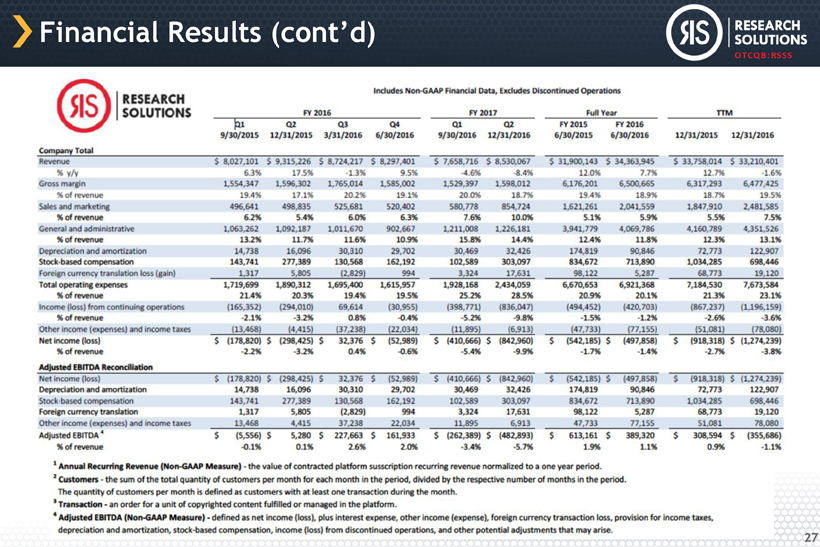
OTCQB:RSSS Financial Results (cont’d) 27