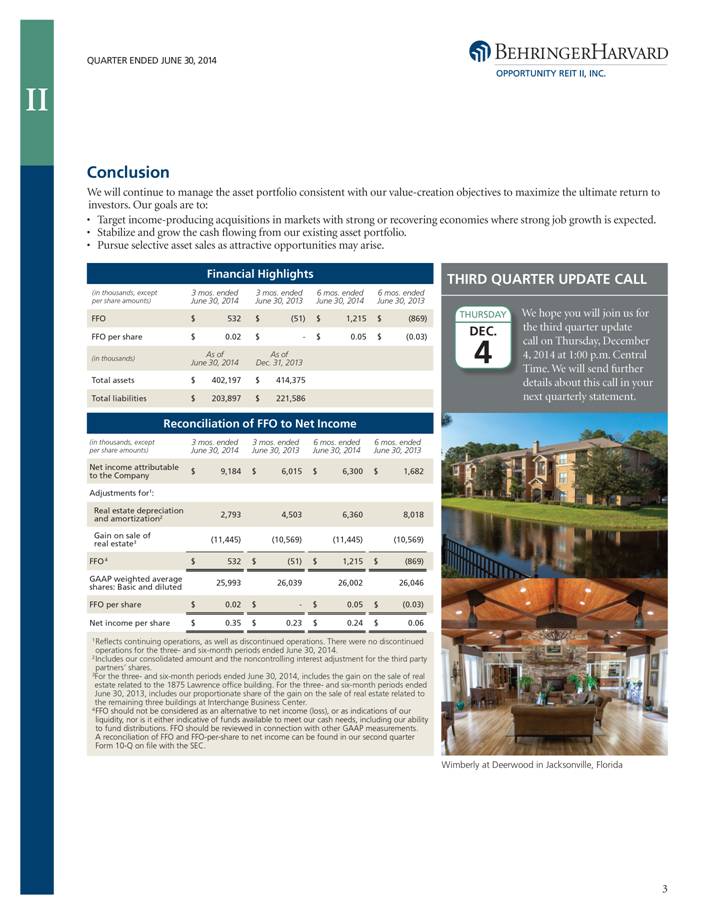
| QUARTER ENDED JUNE 30, 2014 II Conclusion We will continue to manage the asset portfolio consistent with our value-creation objectives to maximize the ultimate return to investors. Our goals are to: • Target income-producing acquisitions in markets with strong or recovering economies where strong job growth is expected. • Stabilize and grow the cash flowing from our existing asset portfolio. • Pursue selective asset sales as attractive opportunities may arise. Financial Highlights (in thousands, except per share amounts) 3 mos. ended June 30, 2014 3 mos. ended June 30, 2013 6 mos. ended June 30, 2014 6 mos. ended June 30, 2013 FFO $ 532 $ (51) $ 1,215 $ (869) FFO per share $ 0.02 $ - $ 0.05 $ (0.03) (in thousands) As of June 30, 2014 As of Dec. 31, 2013 Total assets $ 402,197 $ 414,375 Total liabilities $ 203,897 $ 221,586 THIRD QUARTER UPDATE CALL We hope you will join us for the third quarter update call on Thursday, December 4, 2014 at 1:00 p.m. Central Time. We will send further details about this call in your next quarterly statement. THURSDAY DEC. 4 Reconciliation of FFO to Net Income (in thousands, except per share amounts) 3 mos. ended June 30, 2014 3 mos. ended June 30, 2013 6 mos. ended June 30, 2014 6 mos. ended June 30, 2013 Net income attributable to the Company $ 9,184 $ 6,015 $ 6,300 $ 1,682 Adjustments for1: Real estate depreciation and amortization2 2,793 4,503 6,360 8,018 Gain on sale of real estate3 (11,445) (10,569) (11,445) (10,569) FFO 4 $ 532 $ (51) $ 1,215 $ (869) GAAP weighted average shares: Basic and diluted 25,993 26,039 26,002 26,046 FFO per share $ 0.02 $ - $ 0.05 (0.03) Net income per share $ 0.35 $ 0.23 0.24 0.06 1 Reflects continuing operations, as well as discontinued operations. There were no discontinued operations for the three- and six-month periods ended June 30, 2014. 2 Includes our consolidated amount and the noncontrolling interest adjustment for the third party partners’ shares. 3 For the three- and six-month periods ended June 30, 2014, includes the gain on the sale of real estate related to the 1875 Lawrence office building. For the three- and six-month periods ended June 30, 2013, includes our proportionate share of the gain on the sale of real estate related to the remaining three buildings at Interchange Business Center. 4 FFO should not be considered as an alternative to net income (loss), or as indications of our liquidity, nor is it either indicative of funds available to meet our cash needs, including our ability to fund distributions. FFO should be reviewed in connection with other GAAP measurements. A reconciliation of FFO and FFO-per-share to net income can be found in our second quarter Form 10-Q on file with the SEC. Wimberly at Deerwood in Jacksonville, Florida 3 |