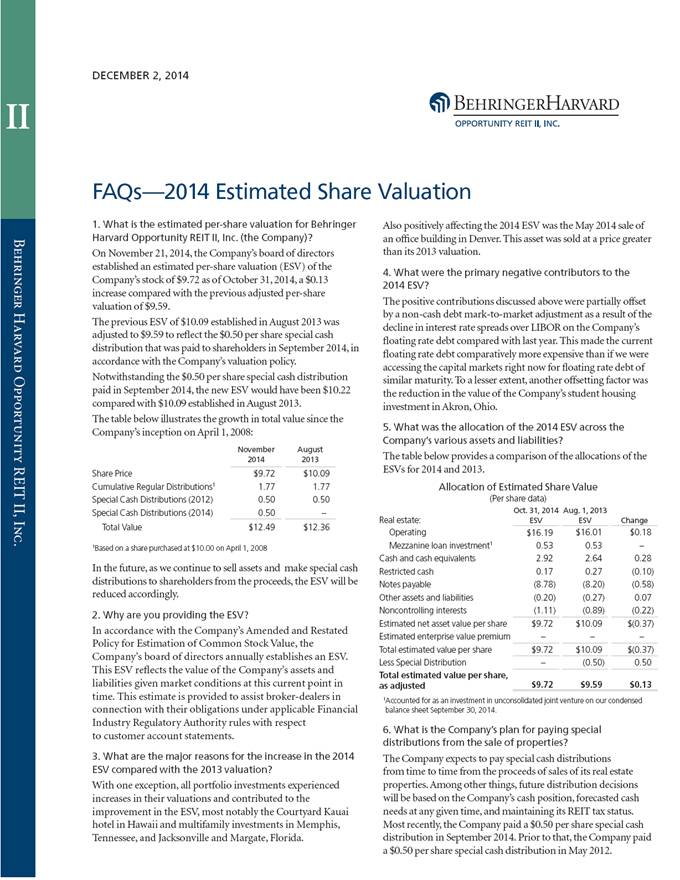
| FAQs—2014 Estimated Share Valuation DECEMBER 2, 2014 1. What is the estimated per-share valuation for Behringer Harvard Opportunity REIT II, Inc. (the Company)? On November 21, 2014, the Company’s board of directors established an estimated per-share valuation (ESV) of the Company’s stock of $9.72 as of October 31, 2014, a $0.13 increase compared with the previous adjusted per-share valuation of $9.59. The previous ESV of $10.09 established in August 2013 was adjusted to $9.59 to reflect the $0.50 per share special cash distribution that was paid to shareholders in September 2014, in accordance with the Company’s valuation policy. Notwithstanding the $0.50 per share special cash distribution paid in September 2014, the new ESV would have been $10.22 compared with $10.09 established in August 2013. The table below illustrates the growth in total value since the Company’s inception on April 1, 2008: November 2014 August 2013 Share Price $9.72 $10.09 Cumulative Regular Distributions1 1.77 1.77 Special Cash Distributions (2012) 0.50 0.50 Special Cash Distributions (2014) 0.50 – Total Value $12.49 $12.36 1Based on a share purchased at $10.00 on April 1, 2008 In the future, as we continue to sell assets and make special cash distributions to shareholders from the proceeds, the ESV will be reduced accordingly. 2. Why are you providing the ESV? In accordance with the Company’s Amended and Restated Policy for Estimation of Common Stock Value, the Company’s board of directors annually establishes an ESV. This ESV reflects the value of the Company’s assets and liabilities given market conditions at this current point in time. This estimate is provided to assist broker-dealers in connection with their obligations under applicable Financial Industry Regulatory Authority rules with respect to customer account statements. 3. What are the major reasons for the increase in the 2014 ESV compared with the 2013 valuation? With one exception, all portfolio investments experienced increases in their valuations and contributed to the improvement in the ESV, most notably the Courtyard Kauai hotel in Hawaii and multifamily investments in Memphis, Tennessee, and Jacksonville and Margate, Florida. Also positively affecting the 2014 ESV was the May 2014 sale of an office building in Denver. This asset was sold at a price greater than its 2013 valuation. 4. What were the primary negative contributors to the 2014 ESV? The positive contributions discussed above were partially offset by a non-cash debt mark-to-market adjustment as a result of the decline in interest rate spreads over LIBOR on the Company’s floating rate debt compared with last year. This made the current floating rate debt comparatively more expensive than if we were accessing the capital markets right now for floating rate debt of similar maturity. To a lesser extent, another offsetting factor was the reduction in the value of the Company’s student housing investment in Akron, Ohio. 5. What was the allocation of the 2014 ESV across the Company’s various assets and liabilities? The table below provides a comparison of the allocations of the ESVs for 2014 and 2013. Allocation of Estimated Share Value (Per share data) Real estate: Oct. 31, 2014 ESV Aug. 1, 2013 ESV Change Operating $16.19 $16.01 $0.18 Mezzanine loan investment1 0.53 0.53 – Cash and cash equivalents 2.92 2.64 0.28 Restricted cash 0.17 0.27 (0.10) Notes payable (8.78) (8.20) (0.58) Other assets and liabilities (0.20) (0.27) 0.07 Noncontrolling interests (1.11) (0.89) (0.22) Estimated net asset value per share $9.72 $10.09 $(0.37) Estimated enterprise value premium – – – Total estimated value per share $9.72 $10.09 $(0.37) Less Special Distribution – (0.50) 0.50 Total estimated value per share, as adjusted $9.72 $9.59 $0.13 1 Accounted for as an investment in unconsolidated joint venture on our condensed balance sheet September 30, 2014. 6. What is the Company’s plan for paying special distributions from the sale of properties? The Company expects to pay special cash distributions from time to time from the proceeds of sales of its real estate properties. Among other things, future distribution decisions will be based on the Company’s cash position, forecasted cash needs at any given time, and maintaining its REIT tax status. Most recently, the Company paid a $0.50 per share special cash distribution in September 2014. Prior to that, the Company paid a $0.50 per share special cash distribution in May 2012. For Internal Use Only FOR BROKERDEALER USE ONLY Behringer Harvard Opportunity REIT II, Inc. II |