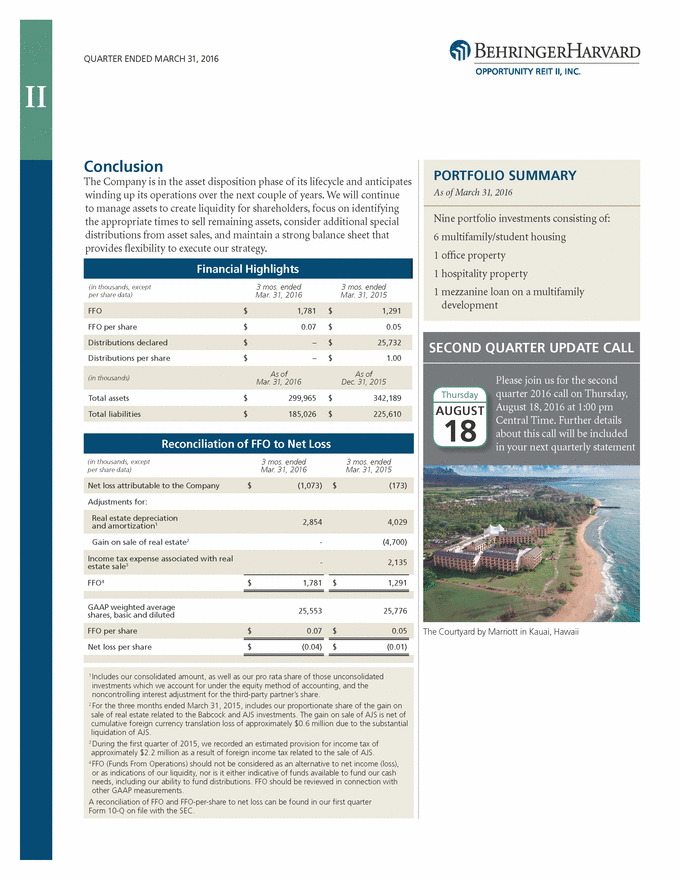
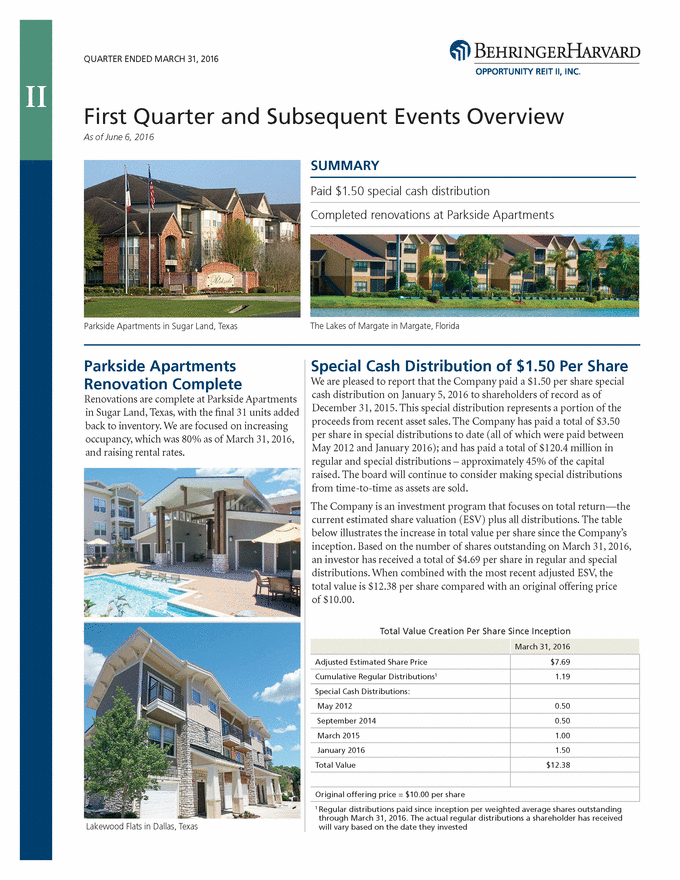
QUARTER ENDED MARCH 31, 2016 Conclusion The Company is in the asset disposition phase of its lifecycle and anticipates winding up its operations over the next couple of years. We will continue to manage assets to create liquidity for shareholders, focus on identifying the appropriate times to sell remaining assets, consider additional special distributions from asset sales, and maintain a strong balance sheet that provides flexibility to execute our strategy. 3 mos. ended Mar. 31, 2016 3 mos. ended Mar. 31, 2015 (in thousands, except per share data) FFO per share $ 0.07 $ 0.05 Distributions per share $ – $ 1.00 (in thousands) Mar. 31, 2016 Dec. 31, 2015 Total assets $ 299,965 $ 342,189 about this call will be included (in thousands, except per share data) 3 mos. ended Mar. 31, 2016 3 mos. ended Mar. 31, 2015 Adjustments for: 2,854 4,029 and amortization1 Gain on sale of real estate2 - (4,700) 2,135 - estate sale3 FFO4 $ 1,781 $ 1,291 GAAP weighted average shares, basic and diluted 25,553 25,776 Net loss per share $ (0.04) $ (0.01) 1 Includes our consolidated amount, as well as our pro rata share of those unconsolidated investments which we account for under the equity method of accounting, and the noncontrolling interest adjustment for the third-party partner’s share. 2 For the three months ended March 31, 2015, includes our proportionate share of the gain on sale of real estate related to the Babcock and AJS investments. The gain on sale of AJS is net of cumulative foreign currency translation loss of approximately $0.6 million due to the substantial liquidation of AJS. 3 During the first quarter of 2015, we recorded an estimated provision for income tax of approximately $2.2 million as a result of foreign income tax related to the sale of AJS. 4 FFO (Funds From Operations) should not be considered as an alternative to net income (loss), or as indications of our liquidity, nor is it either indicative of funds available to fund our cash needs, including our ability to fund distributions. FFO should be reviewed in connection with other GAAP measurements. A reconciliation of FFO and FFO-per-share to net loss can be found in our first quarter Form 10-Q on file with the SEC. FFO per share$0.07 $0.05 Income tax expense associated with real Real estate depreciation Net loss attributable to the Company $(1,073) $(173) Reconciliation of FFO to Net Loss Total liabilities$185,026$225,610 As of As of SECOND QUARTER UPDATE CALL Please join us for the second quarter 2016 call on Thursday, August 18, 2016 at 1:00 pm Central Time. Further details in your next quarterly statement The Courtyard by Marriott in Kauai, Hawaii Thursday AUGUST 18 Distributions declared $–$25,732 FFO$1,781$1,291 Financial Highlights PORTFOLIO SUMMARY As of March 31, 2016 Nine portfolio investments consisting of: 6 multifamily/student housing 1 office property 1 hospitality property 1 mezzanine loan on a multifamily development II