UNITED STATES
SECURITIES AND EXCHANGE COMMISSION
Washington, D.C. 20549
SCHEDULE 14A
Proxy Statement Pursuant to Section 14(a) of the Securities
Exchange Act of 1934
(Amendment No. )
Filed by the Registrant x
Filed by a Party other than the Registrant o
Check the appropriate box:
o Preliminary Proxy Statement
o Confidential, for Use of the Commission Only (as permitted by Rule 14a-6(e)(2))
x Definitive Proxy Statement
o Definitive Additional Materials
o Soliciting Material Pursuant to §240.14a-12
NEULION, INC.
(Name of Registrant as Specified In Its Charter)
(Name of Person(s) Filing Proxy Statement, if other than the Registrant)
Payment of Filing Fee (Check the appropriate box):
x No fee required.
oFee computed on table below per Exchange Act Rules 14a-6(i)(1) and 0-11.
| 1. | Title of each class of securities to which transaction applies: |
| 2. | Aggregate number of securities to which transaction applies: |
| 3. | Per unit price or other underlying value of transaction computed pursuant to Exchange Act Rule 0-11 (Set forth the amount on which the filing fee is calculated and state how it was determined): |
| 4. | Proposed maximum aggregate value of transaction: |
| 5. | Total fee paid: |
| ¨ | Fee paid previously with preliminary materials. |
| ¨ | Check box if any part of the fee is offset as provided by Exchange Act Rule 0-11(a)(2) and identify the filing for which the offsetting fee was paid previously. Identify the previous filing by registration statement number, or the Form or Schedule and the date of its filing. |
| 1. | Amount Previously Paid: |
| 2. | Form, Schedule or Registration Statement No.: |
| 3. | Filing Party: |
| 4. | Date Filed: |

NEULION, INC.
NOTICE OF SPECIAL MEETING OF
SHAREHOLDERS TO BE HELD ON SEPTEMBER 27, 2010
and
INFORMATION CIRCULAR
DATED AUGUST 12, 2010
These materials require your immediate attention. If you are in doubt as to how to deal with these materials, or the matters referred to herein, please consult your investment dealer, stockbroker, bank manager or other professional advisor.
TABLE OF CONTENTS
| NOTICE OF SPECIAL MEETING OF SHAREHOLDERS | i |
| GLOSSARY OF TERMS | 1 |
| CURRENCY AND EXCHANGE RATE | 3 |
| FORWARD-LOOKING INFORMATION | 3 |
| SUMMARY INFORMATION | 5 |
The Meeting | 5 |
The TransVideo Acquisition | 5 |
Valuation Reports and Fairness Opinion | 5 |
Recommendation of the Acquisition Special Committee and of the Board | 5 |
The Share Exchange Agreement | 5 |
Shareholder Approval Required for the TransVideo Resolution | 6 |
Risk Factors | 6 |
The Articles of Amendment | 6 |
TSX Requirement for Shareholder Approvals and an Independent Valuation | 7 |
Recommendation of the Board | 7 |
The Private Placement | 8 |
Shareholder Approval Required for the Private Placement Resolution | 8 |
Recommendation of the Private Placement Special Committee and of the Board | 8 |
Dilution to Shareholders | 8 |
Beneficial Ownership After Giving Effect to the TransVideo Acquisition and the Private Placement | 8 |
| GENERAL PROXY INFORMATION | 9 |
| Solicitation of Proxies | 9 |
| Appointment and Revocation of Proxies | 9 |
| Exercise of Discretion by Proxies | 9 |
| Record Date | 10 |
| Advice to Beneficial Shareholders | 10 |
| THE TRANSVIDEO ACQUISITION | 10 |
| Background to the TransVideo Acquisition | 10 |
| Valuation Reports and Fairness Opinion | 12 |
| Prior Valuations | 13 |
| Timing | 13 |
| Anticipated Benefits of the TransVideo Acquisition | 13 |
| Recommendation of the Acquisition Special Committee and of the Board | 13 |
| The Share Exchange Agreement | 14 |
| Shareholder Approval Required for the TransVideo Resolution | 15 |
| Interests of Experts | 15 |
| Expenses of the TransVideo Acquisition | 15 |
| Risk Factors | 15 |
| THE ARTICLES OF AMENDMENT | 16 |
| Class 3 Preference Shares Attributes | 16 |
| Shareholder Approval Required for the Articles of Amendment Resolution | 17 |
| Dissent Rights | 17 |
| THE PRIVATE PLACEMENT | 18 |
| Background to the Private Placement | 18 |
| Summary of Subscription Agreements | 19 |
| Shareholder Approval Required for the Private Placement Resolution | 20 |
| DILUTION TO SHAREHOLDERS | 20 |
INTEREST OF INFORMED PERSONS IN MATTERS TO BE ACTED UPON AND IN OTHER PREVIOUSLY DISCLOSED MATERIAL TRANSACTIONS | 20 |
| VOTING SECURITIES AND PRINCIPAL HOLDERS THEREOF | 21 |
| Voting Trust Agreement | 22 |
| INDEBTEDNESS OF DIRECTORS AND EXECUTIVE OFFICERS | 22 |
| EQUITY COMPENSATION PLANS | 22 |
| MANAGEMENT CONTRACTS | 22 |
| ADDITIONAL INFORMATION RESPECTING TRANSVIDEO | 22 |
| QUORUM | 22 |
| RELIANCE | 22 |
| ADDITIONAL INFORMATION | 23 |
| APPROVAL OF BOARD OF DIRECTORS OF NEULION | 24 |
| TRANSVIDEO AUDITOR’S CONSENT | 25 |
| VALUATOR’S CONSENT | 26 |
| APPENDIX “A” TRANSVIDEO RESOLUTION | A-1 |
| APPENDIX “B” ARTICLES OF AMENDMENT RESOLUTION | B-1 |
| APPENDIX “C” PRIVATE PLACEMENT RESOLUTION | C-1 |
| APPENDIX “D” INFORMATION CONCERNING TRANSVIDEO | D-1 |
| APPENDIX “E” PRO FORMA FINANCIAL STATEMENTS | E-1 |
| APPENDIX “F” FAIRNESS OPINION | F-1 |
| APPENDIX “G” TRANSVIDEO VALUATION REPORT | G-1 |
| APPENDIX “H” NEULION VALUATION REPORT | H-1 |
| APPENDIX “I” SECTION 190 OF THE CBCA | I-1 |
| APPENDIX “J” SHARE EXCHANGE AGREEMENT | J-1 |
| APPENDIX “K” NEULION FINANCIAL INFORMATION | K-1 |
NEULION, INC.
NOTICE OF SPECIAL MEETING OF SHAREHOLDERS
NOTICE IS HEREBY GIVEN that a special meeting (the “Meeting”) of the shareholders (the “Shareholders”) of NeuLion, Inc. (“NeuLion” or the “Corporation”) will be held at the offices of McCarthy Tétrault LLP, Suite 5300, Toronto Dominion Bank Tower, Toronto ON, M5K 1E6, Canada, at 11:00 a.m. (Toronto time) on September 27, 2010 for the following purposes:
| 1. | TO CONSIDER and, if deemed advisable, to pass, with or without variation, a resolution, the full text of which is set forth in Appendix “A” to the management information circular (the “Circular”) accompanying this notice of meeting (the “Notice”), authorizing and approving the acquisition of all of the issued and outstanding shares of TransVideo International Ltd. in exchange for 22,000,802 common shares (the “Common Shares”) of NeuLion, all as more particularly described in the Circular; |
| 2. | TO CONSIDER and, if deemed advisable, to pass, with or without variation, a special resolution, the full text of which is set forth in Appendix “B” to the Circular accompanying this Notice, authorizing and approving the amendment of the articles of the Corporation in order to create the Class 3 Preference Shares (the “Class 3 Preference Shares”), all as more particularly described in the Circular; |
| 3. | TO CONSIDER and, if deemed advisable, to pass, with or without variation, a resolution, the full text of which is set forth in Appendix “C” to the Circular accompanying this Notice, authorizing and approving the issuance of approximately 16,666,667 Class 3 Preference Shares to JK&B Capital V, L.P., JK&B Capital V Special Opportunities Fund, L.P. and Gabriel A. Battista, at a subscription price of CAD$0.60 per Class 3 Preference Share, all as more particularly described in the Circular; and |
| 4. | TO TRANSACT such other business as may properly come before the Meeting or any adjournment thereof. |
Information relating to the matters to be addressed at the Meeting is set forth in the Circular which accompanies this Notice. The amendment to the articles of the Corporation to create the Class 3 Preference Shares will give rise to dissent rights pursuant to section 190 of the Canada Business Corporations Act, the particulars of which are described in the Circular.
The Circular is deemed to form part of this Notice. Also accompanying this Notice is a form of proxy. Any adjournment of the Meeting will be held at a time and place to be specified at the Meeting.
The record date for the determination of Shareholders entitled to receive notice of and to vote at the Meeting is August 23, 2010.
It is important that your Common Shares are represented at the Meeting. A Shareholder may attend the Meeting in person or may be represented by proxy. If you are unable to attend in person, please fill in, sign and return the enclosed form of proxy in the envelope provided for that purpose.
A Shareholder wishing to be represented by proxy at the Meeting or any adjournment thereof must deposit his, her or its executed form of proxy with NeuLion’s transfer agent and registrar, Computershare Investor Services Inc., 100 University Avenue, 9th Floor, Toronto, Ontario, M5J 2Y1, Attention: Proxy Department (Fax No. (416) 263-9524), at least 48 hours, excluding Saturday, Sunday and holidays, preceding the day of the Meeting or any adjournment or postponement of the Meeting at which the proxy is to be used or by delivering it to the Chair of the Meeting before the time of voting on the day of the Meeting or any adjournment thereof.
i
DATED at Toronto, Ontario, this 12th day of August, 2010.
| BY ORDER OF THE BOARD OF DIRECTORS | ||
| “Roy E. Reichbach” (signed) | ||
| Roy E. Reichbach | ||
| General Counsel, Corporate Secretary and Director | ||
ii
GLOSSARY OF TERMS
The following is a glossary of certain terms used in this Circular, including the appendices, unless otherwise defined therein.
“Acquisition Special Committee” means the independent committee of the Board, comprised of John R. Anderson, David Kronfeld, Shirley Strum Kenny and Gabriel A. Battista, with a mandate to consider and advise the Board with respect to the terms of the TransVideo Acquisition;
“Articles of Amendment” means the amendment to the articles of the Corporation creating the Class 3 Preference Shares;
“Articles of Amendment Resolution” means the form of special resolution approving the Articles of Amendment, the full text of which is set forth in Appendix “B” to this Circular;
“AvantaLion” means AvantaLion LLC;
“Beneficial Shareholders” means Shareholders that do not hold their Common Shares in their own name;
“Board” means the board of directors of NeuLion;
“CBCA” means the Canada Business Corporations Act, and the regulations made thereunder as promulgated or amended from time to time;
“Circular” means this management information circular, dated August 12, 2010, together with all appendices hereto, delivered by NeuLion to the Shareholders in connection with the Meeting;
“Class 3 Preference Shares” means the Class 3 Preference Shares of NeuLion to be created pursuant to the Articles of Amendment;
“Closing” has the meaning ascribed thereto under the heading “The TransVideo Acquisition - The Share Exchange Agreement”;
“Common Shares” means the common shares of NeuLion;
“Computershare” means Computershare Investor Services Inc.;
“Corporation” means NeuLion, Inc.;
“Corporation Exchange Shares” has the meaning ascribed thereto under the heading “The TransVideo Acquisition - The Share Exchange Agreement ”;
“Effective Date” means the date the TransVideo Acquisition becomes effective, which is scheduled to occur on or about October 1, 2010, or such other date as NeuLion and the Exchanging Shareholders may agree in writing;
“Exchange” has the meaning ascribed thereto under the heading “The TransVideo Acquisition - The Share Exchange Agreement”;
“Exchanging Shareholders” has the meaning ascribed thereto under the heading “Summary Information - The Share Exchange Agreement” and “Exchanging Shareholder” means any of them;
“Fairness Opinion” means the opinion of UHY, dated June 18, 2010, a copy of which is attached as Appendix “F” to this Circular;
1
“GAAP” means generally accepted accounting principles;
“Intermediary” means a broker or an agent of that broker or another similar entity in whose name Common Shares are registered for a Beneficial Shareholder;
“IPTV” means Internet protocol television;
“JK&B” means JK&B Capital V, L.P. and JK&B Capital V Special Opportunities Fund, L.P.;
“KyLinTV” means KyLinTV, Inc.;
“Meeting” means the special meeting of Shareholders to be held on September 27, 2010, and any adjournment(s) thereof;
“MI 61-101” means Multilateral Instrument 61-101 - Protection of Minority Security Holders in Special Transactions;
“NeuLion” means NeuLion, Inc.;
“NeuLion Valuation Report” means the valuation report of NeuLion prepared by UHY, dated May 5, 2010, a copy of which is attached as Appendix “H” to this Circular;
“New York Islanders” means the New York Islanders Hockey Club, L.P.;
“Notice” means the notice of special meeting which accompanies this Circular;
“Opinion Engagement Letter” means the letter, dated June 11, 2010, between UHY and the Acquisition Special Committee;
“Private Placement” means the issuance of approximately 16,666,667 Class 3 Preference Shares to JK&B and Gabriel A. Battista, at a subscription price of CAD$0.60 per Class 3 Preference Share, pursuant to the terms of the Subscription Agreements;
“Private Placement Resolution” means the form of resolution approving the Private Placement, the full text of which is set forth in Appendix “C” to this Circular;
“Private Placement Special Committee” means the independent committee of the Board, comprised of Roy E. Reichbach and Shirley Strum Kenny, with a mandate to consider and advise the Board with respect to the terms of the Private Placement;
“Record Date” means the close of business on August 23, 2010;
“Renaissance” means Renaissance Property Associates, LLC;
“Share Exchange Agreement” has the meaning ascribed thereto under the heading “The TransVideo Acquisition - The Share Exchange Agreement”;
“Shareholders” means the shareholders of NeuLion;
“Subscription Agreements” has the meaning ascribed thereto under the heading “The Private Placement - Summary of Subscription Agreements”;
“Subsidiary” means, with respect to a specified body corporate, any body corporate of which more than 50% of the outstanding shares ordinarily entitled to elect a majority of the board of directors thereof (whether or not shares of any other class or classes shall or might be entitled to vote upon the happening of a certain event or contingency) are at the time owned directly or indirectly by such specified body corporate, and shall include any body corporate, partnership, joint venture or other entity over which it exercises direction or control or which is in a like relation to a subsidiary;
2
“TransVideo” means TransVideo International Ltd.;
“TransVideo Acquisition” means the acquisition by NeuLion of all of the issued and outstanding shares of TransVideo, in exchange for the issuance of 22,000,802 Common Shares, pursuant to the terms of the Share Exchange Agreement;
“TransVideo Digital” means Beijing Digital TransVideo Technology Co. Ltd., a wholly-owned subsidiary of TransVideo;
“TransVideo Exchange Shares” has the meaning ascribed thereto under the heading “The TransVideo Acquisition - The Share Exchange Agreement”;
“TransVideo Resolution” means the form of resolution approving the TransVideo Acquisition, the full text of which is set forth in Appendix “A” to this Circular;
“TransVideo Valuation Report” means the valuation report of TransVideo prepared by UHY, dated May 5, 2010, a copy of which is attached as Appendix “G” to this Circular;
“TSX” means the Toronto Stock Exchange;
“UHY” means UHY Advisors FLVS, Inc.;
“United States” or “U.S.” means the United States of America;
“Valuation Engagement Letter” means the letter, dated March 31, 2010, between UHY and the Acquisition Special Committee;
“Valuation Reports” means the NeuLion Valuation Report and the TransVideo Valuation Report; and
“Voting Trust Agreement” means the voting trust agreement dated October 20, 2008 to which AvantaLion, Charles B. Wang and Nancy Li, among others, are parties.
CURRENCY AND EXCHANGE RATE
Unless otherwise provided, all dollar figures (“$”, “dollars” and similar expressions) refer to United States dollars (“U.S.”, “USD” and other similar expressions). Any reference to “CAD$” refers to Canadian dollars. As at July 30, 2010, the Bank of Canada noon rate for the conversion of United States dollars to Canadian dollars was USD$1 to CAD$1.0290.
FORWARD-LOOKING INFORMATION
Certain statements contained in this Circular constitute “forward-looking information” within the meaning of applicable Canadian and U.S. securities legislation. The use of any of the words “anticipate”, “plan”, “continue”, “estimate”, “expect”, “may”, “will”, “project”, “goal”, “predict”, “potential”, “should”, “believe” and similar expressions are intended to identify forward-looking information and statements. The information and statements involve known and unknown risks, uncertainties and other factors that may cause actual results or events to differ materially from those anticipated in such forward-looking information and statements. Such statements reflect NeuLion’s current views with respect to certain events, and are subject to certain risks, uncertainties and assumptions. Many factors could cause NeuLion’s actual results, performance, or achievements to vary from those described in this Circular. Should one or more of these risks or uncertainties materialize, or should assumptions underlying forward-looking statements prove incorrect, actual results may vary materially from those described in this Circular as intended, planned, anticipated, believed, estimated, or expected. Specific forward-looking statements in this Circular include, among others, statements pertaining to the following:
3
| § | the completion of the TransVideo Acquisition; |
| § | the completion of the Private Placement; |
| § | the realization of anticipated benefits of the TransVideo Acquisition; and |
| § | NeuLion’s business strategy. |
Although NeuLion believes that the expectations with respect to such forward-looking statements are reasonable, there can be no assurance that such expectations will prove to be correct. NeuLion’s actual results could differ materially from those anticipated in these forward-looking statements as a result of the risk factors set forth below and elsewhere in this Circular, including the appendices attached hereto:
| § | failure to realize the anticipated benefits of the TransVideo Acquisition or the Private Placement; |
| § | general economic conditions in the U.S., Canada and globally; and |
| § | variations in foreign exchange rates or interest rates. |
The reader is further cautioned that financial statements, including pro forma financial statements, have been prepared in accordance with U.S. GAAP and are subject to U.S. auditing and auditor independence standards, which differ from Canadian GAAP and auditing and auditor independence standards in certain material respects, and thus may not be comparable to financial statements of Canadian companies.
Readers are cautioned that the above risks are only some of those that we may face. We urge you to consider those factors. The forward-looking statements contained herein are expressly qualified in their entirety by this cautionary statement. The forward-looking statements speak only as of the date of this Circular. NeuLion does not intend nor does it assume any obligation to update these forward-looking statements to reflect new information, subsequent events or otherwise, except as required by law.
4
| SUMMARY INFORMATION The following is a summary of certain information contained elsewhere in this Circular, including the appendices hereto and should be read together with, and is qualified in its entirety by reference to, the more detailed information contained or referred to elsewhere in this Circular or in the appendices hereto. Unless otherwise defined herein, terms with initial capital letters used in this summary shall have the meanings given to such terms in the “Glossary of Terms.” The Meeting The Meeting will be held at the offices of McCarthy Tétrault LLP, Suite 5300, Toronto Dominion Bank Tower, Toronto ON, M5K 1E6, Canada at 11:00 a.m. (Toronto time) on September 27, 2010. See “General Proxy Information”. The TransVideo Acquisition At the Meeting, Shareholders will be asked to consider the TransVideo Resolution in the form set out in Appendix “A” to this Circular. TransVideo is a private company formed under the laws of the British Virgin Islands. TransVideo operates its business through its wholly-owned subsidiary, TransVideo Digital, a corporation organized pursuant to the laws of the People’s Republic of China. TransVideo is a leading IPTV technology and solution provider with its principal office in the ZhongGuanCun Hi-Tech District of Beijing, China. Reference is made to Appendix “D”, “Information Concerning TransVideo”, for a detailed description of TransVideo. Valuation Reports and Fairness Opinion The services of UHY were retained by the Acquisition Special Committee to provide a range of the expected fair market value of the Corporation and TransVideo and to address the fairness, from a financial point of view to NeuLion, of the issuance and delivery of the 22,000,802 Common Shares by NeuLion in exchange for all of the issued and outstanding shares of TransVideo pursuant to the TransVideo Acquisition. Pursuant to such engagement, UHY has delivered the Fairness Opinion to the Acquisition Special Committee. The Fairness Opinion states that, subject to the assumptions, conditions and limitations contained therein, in the opinion of UHY as of June 18, 2010, the issuance and delivery of the 22,000,802 Common Shares by NeuLion in exchange for all of the issued and outstanding shares of TransVideo (excluding its 32.74% inte rest in KyLinTV) pursuant to the TransVideo Acquisition is fair, from a financial point of view, to NeuLion. The Fairness Opinion and the Valuation Reports were provided by UHY for the information and assistance of our Acquisition Special Committee in connection with its consideration of the TransVideo Acquisition and such opinion does not constitute a recommendation as to any action the Acquisition Special Committee, the Board, or any of the Shareholders should take in connection with the TransVideo Acquisition or any aspect thereof and is not a recommendation to any person on how such person should vote with respect to the TransVideo Acquisition or any other matter presented at the Meeting. Neither the Valuation Reports nor the Fairness Opinion may be relied upon by any person or party other than the Acquisition Special Committee. See “The TransVideo Acquisition – Valuation Reports and Fairness Opinion”. Recommendation of the Acquisition Special Committee and of the Board After careful consideration, the Board, based upon the unanimous recommendation of the Acquisition Special Committee, has determined (with Charles B. Wang abstaining due to his position as a director, the Chairman and a significant Shareholder of NeuLion and the controlling shareholder of AvantaLion and Nancy Li, Mr. Wang’s spouse, also abstaining) that the TransVideo Acquisition is fair to, and in the best interests of, NeuLion and has approved the TransVideo Acquisition. The Board unanimously recommends that the Shareholders vote FOR the TransVideo Res olution. See “The TransVideo Acquisition – Recommendation of the Acquisition Special Committee and of the Board”. The Share Exchange Agreement In connection with the TransVideo Acquisition, the Corporation has entered into the Share Exchange Agreement with each of AvantaLion, Wang Yunchuan, Hao Jingfang, Wang Qi, Tan Zhongjun, Wang Xiaohong, Shu Wei, and Zhao Yun (each, an “Exchanging Shareholder” and collectively, the “Exchanging Shareholders”), a copy of which is attached as Appendix “J” to this Circular. The Exchanging Shareholders collectively own 100% of the issued and outstanding shares of TransVideo. Pursuant to the Share Exchange Agreement, the Corporation will issue, subject to certain conditions, an aggregate of 22,000,802 Common Shares to the Exchanging Shareholders in exchange for 3,200,000 shares of TransVideo, which shares represent all of the issued and outstanding shares of TransVideo. The Share Exchange Agreement contains certain conditions to the closing of the Exchange, including the accuracy of the representations and warranties, execution and delivery by the Corporation and the other parties thereto of the agreements that are described in this Circular and approval from the Shareholders and the TSX. |
5
| Of the 22,000,802 Common Shares of NeuLion issuable in connection with the TransVideo Acquisition, 17,820,650, or 81%, of the Common Shares are issuable to AvantaLion, a company controlled by Mr. Wang. See “The TransVideo Acquisition – The Share Exchange Agreement” and Appendix “J” to this Circular. Shareholder Approval Required for the TransVideo Resolution The TransVideo Resolution must be approved by a majority of the votes cast by the Shareholders other than Mr. Wang, Ms. Li, AvantaLion, any other person who may be a related party of TransVideo, and any other person who is a joint actor of Mr. Wang, Ms. Li or AvantaLion, who vote in respect of the TransVideo Resolution, in person or by proxy, at the Meeting. As of July 30, 2010, a total of 51,440,204 Common Shares will be excluded from voting on the TransVideo Acquisition. See “Voting Securities and Principal Holders Thereof” for a breakdown of the Common Shares owned and controlled by Mr. Wang and Ms. Li, all of which will be excluded from voting on the TransVideo Resolution. Risk Factors The TransVideo Acquisition is subject to certain risks. The Shareholders should carefully consider the risks described in Appendix “D” to this Circular, “Information Concerning TransVideo – Risk Factors”, for a more detailed description of the risk factors applicable to NeuLion following the TransVideo Acquisition. The Articles of Amendment At the Meeting, the Shareholders will be asked to consider the Articles of Amendment Resolution in the form set out in Appendix “B” of this Circular, which resolution would approve the creation of the Class 3 Preference Shares. If the Articles of Amendment Resolution is passed by the Shareholders, the Class 3 Preference Shares will bear certain rights, preferences, privileges and restrictions, including the following: · Dividends, subject to certain restrictions, at the rate of eight percent (8%) per annum, accrued daily, compounded annually and payable in cash upon a liquidation event for up to five (5) years, as well as the right to receive any dividends paid to Common Shares. · In the event of any liquidation, dissolution or winding up of the Corporation, the holders of Class 3 Preference Shares shall be entitled to receive, in preference to the holders of Common Shares, an amount equal to the aggregate Redemption Amount (as defined in the Articles of Amendment) of all Class 3 Preference Shares, together with any accrued but unpaid dividends. · The holders of Class 3 Preference Shares shall have the right to convert any or all Class 3 Preference Shares, at the option of the holder, at any time, into Common Shares on a one for one basis. In addition, the Class 3 Preference Shares shall automatically be converted into Common Shares in the event that the holders of a majority of the outstanding Class 3 Preference Shares consent to such conversion. · In the event of a conversion to Common Shares, accrued but unpaid dividends shall be paid in cash and shall not increase the number of Common Shares issuable upon such conversion. · There will be proportional adjustments for stock splits, stock dividends, recapitalizations and the like. · The Class 3 Preference Shares will vote together with Common Shares and not as a separate class, except as specifically provided under the section “Protective Provisions” of the Articles of Amendment or as otherwise required by law. Each Class 3 Preference Share shall have a number of votes equal to the number of Common Shares then issuable upon the conversion of such Class 3 Preference Shares. |
6
· Subject to applicable law, the consent of 66⅔% of the Class 3 Preference Shares voting alone shall be required to: a) change the rights and terms of the Class 3 Preference Shares; and b) authorize, create or issue any security either preferential to or on parity with the Class 3 Preference Shares. · The consent of a majority of the Class 3 Preference Shares shall be required to pay any dividend to or redeem any Class 3 Preference Shares or Common Shares (other than the payment of dividends on the Class 3 Preference Shares as contemplated in the Articles of Amendment and other than purchases of Common Shares from employees or other service providers upon termination of service). · At any time after five years from the date of issuance, the holders of a majority of the Class 3 Preference Shares may elect to have the Corporation redeem the Class 3 Preference Shares for an amount equal to CAD$0.60 per Class 3 Preference Share plus all accrued and unpaid dividends. At any time after five years from the date of issuance, the Corporation may, at its option, redeem the Class 3 Preference Shares for an amount equal to CAD$0.60 per Class 3 Preference Share plus all accrued and unpaid dividends. This summary is qualified in its entirety by the provisions of the Articles of Amendment attached as Exhibit 1 to the Articles of Amendment Resolution annexed hereto as Appendix “B”. The Articles of Amendment Resolution must be approved by at least 66⅔% of the votes cast by the Shareholders at the Meeting either in person or by proxy. Shareholders have the right to dissent in respect of the Articles of Amendment Resolution. A Shareholder who dissents has the right to be paid the fair value of his, her or its Common Shares if the Corporation has received from such holder a written notice of dissent at or prior to the Meeting and such dissenting holder has otherwise complied with the dissent provisions of the CBCA. See “The Articles of Amendment – Dissent Rights”. TSX Requirement for Shareholder Approvals and an Independent Valuation The TransVideo Acquisition and the Private Placement are subject to the approval of the TSX and since the TransVideo Acquisition and the Private Placement will (i) provide for the issuance to insiders of the Corporation of greater than 10% of the number of the current outstanding Common Shares and (ii) provide for the issuance of greater than 25% of the current outstanding Common Shares, the rules of the TSX require that the Corporation obtain approval of the TransVideo Acquisition and the Private Placement from the holders of a majority of the Common Shares, excluding the votes attached to the Common Shares held by Mr. Wang, AvantaLion, any other person who may be a related party of TransVideo, and any other person who is a joint actor of Mr. Wang and AvantaLion, including Ms. Li as spouse of Mr. Wang, David Kronfeld and Gabriel A. Battista. In addition, since the value of the consideration to be received by the insiders or other related parties exceeds 2% of the market capitalization of the Corporation, the TSX requires that: (i) the proposed transactions be approved by the Board on the recommendation of the directors who are unrelated to the transactions; and (ii) the value of the consideration be established in an independent report. In addition, since the value of the consideration to be received by the insiders or other related parties exceeds 10% of the market capitalization of the issuer, TSX will require that the transaction be approved by the Shareholders, other than the insiders. Recommendation of the Board The Board has unanimously concluded that the Articles of Amendment are in the best interests of NeuLion and recommends that the Shareholders vote FOR the approval of the Articles of Amendment Resolution. |
7
The Private Placement At the Meeting, the Shareholders will be asked to consider the Private Placement Resolution in the form set out in Appendix “C” to this Circular. On May 28, 2010 NeuLion and JK&B Capital executed a non-binding term sheet in connection with the Private Placement. Pursuant to the Private Placement, NeuLion will issue approximately 16,666,667 Class 3 Preference Shares, at a price of CAD$0.60 per share, representing a 28% premium over CAD$0.465, which was the price of the Common Shares at the close of business on May 28, 2010. However, the actual number of Class 3 Preference Shares to be issued in the Private Placement depends on the foreign exchange currency rate at the time the Private Placement is closed, as the price per share is in Canadian dollars but the $10 million investment is in US dolla rs. The actual number of Class 3 Preference Shares issued will be determined using the Bank of Canada noon rate for the conversion of Canadian dollars to U.S. dollars on the business day immediately prior to the Closing. For example, applying the Bank of Canada noon rate on July 19, 2010, CAD$1 converted into US$0.9471, which means that CAD$0.60 converted into US$0.57. US$10 million divided by US$0.57 equals 17,543,860 Class 3 Preference Shares. Applying hypothetical Bank of Canada noon rates: ● if CAD$1 converted into US$0.90, then CAD$0.60 converted into US$0.54, and US$10 million divided by US$0.54 equals 18,518,519 Class 3 Preference Shares; and ● if CAD$1 converted into US$1.05, then CAD$0.60 converted into US$0.63, and US$10 million divided by US$0.63 equals 15,873,016 Class 3 Preference Shares. The Subscription Agreements provide that Mr. Battista, JK&B Capital V Special Opportunities Fund, L.P. and JK&B Capital V, L.P. will subscribe for 0.6%, 42.74% and 56.66% of the Class 3 Preference Shares issued pursuant to the Private Placement, respectively. The Corporation has been advised that JK&B does not currently hold any Common Shares. Mr. Battista currently controls (either directly or indirectly) 120,350 common shares (less than 0.01% of the issued and outstanding Common Shares). It is expected that as of the closing of the Private Placement and the TransVideo Acquisition, Mr. Battista, JK&B Capital V Special Opportunities Fund, L.P. and JK&B Capital V, L.P. will hold approximately 240,542 Common Shares (0.2% of the issued and outstanding Common Shares), 7,123,667 Common Shares (4.58% of the issued and outstanding Common Shares) and 9,443,000 Common Shares (6.07% of the issued and outstanding Common Shares), respectively. The proceeds of the Private Placement will be used for general working capital purposes. Mr. Wang, our Chairman, a significant shareholder of NeuLion and a holder of an ownership interest in JK&B Capital V Special Opportunities Fund, L.P., Ms. Li, his spouse, and Mr. Kronfeld, a director of NeuLion and a holder of ownership interests in JK&B, will not be voting in connection with the Private Placement Resolution. Mr. Battista is participating in th e Private Placement and will not be voting in connection with the Private Placement Resolution. MI 61-101 also requires that, unless exempted, a valuation report must be prepared in connection with the value of the non-cash assets in a related party transaction. The Private Placement is exempt from this requirement by application of the “Fair market value not more than 25% of market capitalization” exemption contained in section 5.5(a) of MI 61-101. Shareholder Approval Required for the Private Placement Resolution The Private Placement Resolution must be approved by a majority of the votes cast by the Shareholders other than Mr. Wang, Ms. Li, AvantaLion, Mr. Kronfeld, Mr. Battista, any other person who may be a related party of JK&B, and any other person who is a joint actor of Mr. Wang, Ms. Li, AvantaLion, Mr. Kronfeld or Mr. Battista, who vote in respect of the Private Placement Resolution, in person or by proxy, at the Meeting. As of July 30, 2010 a total of 52,508,681 Common Shares will be excluded from voting on the Private Placement Resolution. Recommendation of the Private Placement Special Committee and of the Board After careful consideration, the Board, based upon the unanimous recommendation of the Private Placement Special Committee, has determined (with Mr. Wang, Ms. Li, Mr. Kronfeld and Mr. Battista abstaining) that the Private Placement is in the best interests of NeuLion and has approved the Private Placement, subject to approval of the Shareholders. The Board unanimously recommends that the Shareholders vote FOR the approval of the Private Placement Resolution. Dilution to Shareholders As of July 30, 2010, 116,980,017 Common Shares were issued and outstanding. If the transactions described herein had closed on July 30, 2010, a total of approximately 16,666,667 (14.2% dilution) Common Shares would have been issued to JK&B as a result of the Private Placement, a total of 22,000,802 (18.8% dilution) Common Shares would have been issued to the Exchanging Shareholders and as a result of both transactions, a total of 38,667,469 (33.0% dilution) Common Shares would have been issued. Beneficial Ownership After Giving Effect to the TransVideo Acquisition and the Private Placement After giving effect to the TransVideo Acquisition and the Private Placement, Mr. Wang will own, directly and indirectly, approximately 24,159,743 Common Shares of NeuLion as of July 30, 2010. This excludes 39,160,894 Common Shares beneficially owned by Ms. Li, Mr. Wang’s spouse, as to which Mr. Wang disclaims beneficial ownership. Ms. Li will own, directly and indirectly, 39,160,894 Common Shares as of July 30, 2010. This excludes 24,159,743 Common Shares beneficially owned by Mr. Wang, Ms. Li’s spouse, as to which Ms. Li disclaims beneficial ownership. |
8
GENERAL PROXY INFORMATION
Solicitation of Proxies
This Circular is furnished in connection with the solicitation by management of NeuLion of proxies to be used at the Meeting of the Shareholders to be held at the offices of McCarthy Tétrault LLP, Suite 5300, Toronto Dominion Bank Tower, Toronto ON, M5K 1E6, Canada at 11:00 a.m. (Toronto time) on September 27, 2010 or at any adjournment thereof for the purposes set forth in the Notice. Proxies will be solicited primarily by mail and electronic mail but may also be solicited personally, by telephone or by facsimile by the directors, officers or employees of NeuLion. The costs of solicitation will be borne by NeuLion. Pursuant to National Instrument 54-101─ Communication with Beneficial Owners of Securities of a Reporting Issuer, arrangements have been made with clearing agencies, brokerag e houses and other financial intermediaries to forward proxy solicitation material to the Beneficial Shareholders. NeuLion will provide, without cost to such persons, upon request to the Corporate Secretary of NeuLion, additional copies of the foregoing documents required for this purpose. The Circular and the form of proxy will be first sent to Shareholders on or about August 24, 2010. Except where otherwise indicated, information contained herein is given as of July 30, 2010.
Appointment and Revocation of Proxies
The persons named in the enclosed form of proxy are representatives of management and officers of NeuLion. A Shareholder desiring to appoint some other person, who need not be a Shareholder, to represent him, her or it at the Meeting or any adjournment thereof may do so by filling in the name of such person in the blank space provided in the proxy or by completing another proper form of proxy. A Shareholder wishing to be represented by proxy at the Meeting or any adjournment thereof must, in all cases, deposit the completed and executed proxy with Computershare, 100 University Avenue, 9th Floor, Toronto, Ontario, M5J 2Y1, Attention: Proxy Department (Fax No. (416) 263-9524), at least 48 hours, excluding Saturday, Sunday and ho lidays, preceding the date of the Meeting or any adjournment or postponement of the Meeting at which the proxy is to be used, or by delivering it to the Chair of the Meeting before the time of voting on the day of the Meeting or any adjournment thereof. A proxy should be executed by the Shareholder or his or her attorney duly authorized in writing or, if the Shareholder is a corporation, by an officer or solicitor thereof duly authorized.
In addition to any other manner permitted by law, a proxy may be revoked before it is exercised by an instrument in writing executed in the same manner as a proxy and deposited to the attention of the Corporate Secretary of NeuLion at the registered office of NeuLion at any time up to and including the last business day before the day of the Meeting or any adjournment or postponement thereof at which the proxy is to be used or with the Chair of the Meeting on the day of the Meeting prior to its commencement or any adjournment thereof, and thereupon the proxy is revoked.
A registered Shareholder attending the Meeting has the right to vote in person and if he or she does so, his or her proxy is nullified with respect to the matters such person votes upon and any subsequent matters thereafter to be voted upon at the Meeting or any adjournment thereof.
Exercise of Discretion by Proxies
The Common Shares represented by proxies in favour of management nominees will be voted in accordance with the instructions of the Shareholder on any ballot that may be called for and, if a Shareholder specifies a choice with respect to any matter to be acted upon at the Meeting, the Common Shares represented by proxy shall be voted accordingly. If a specification is not made with respect to any matter such Common Shares will be voted by the management nominees FOR the approval of the TransVideo Resolution, the Articles of Amendment Resolution and the Private Placement Resolution.
9
The enclosed form of proxy also confers discretionary authority upon the persons named therein to vote with respect to any amendments or variations to the matters identified in the Notice and with respect to any other matters which may properly come before the Meeting in such manner as the nominee in his judgment may determine. At the date hereof, management of NeuLion knows of no such amendments, variations or other matters to come before the Meeting.
Record Date
The Shareholders at the Record Date are entitled to receive notice of, and to vote at, the Meeting.
Advice to Beneficial Shareholders
The information set forth in this section is of significant importance to many Shareholders of NeuLion as a substantial number of Shareholders are Beneficial Shareholders. Beneficial Shareholders should note that only proxies deposited by Shareholders whose names appear on the records of NeuLion as of the Record Date as the registered holders of Common Shares can be recognized and acted upon at the Meeting. If Common Shares are listed in an account statement provided to a Shareholder by a broker then, in almost all cases, those Common Shares will not be registered in the Shareholder’s name on the records of NeuLion. Such Common Shares will more likely be registered under the name of an Intermediary, such as the Shareholder’s broker or an agent of that broker or another similar entity. & #160;Common Shares held by an Intermediary can only be voted by the Intermediary upon the instructions of the Beneficial Shareholder. Without specific instructions from the Beneficial Shareholders, Intermediaries are prohibited from voting Common Shares.
Beneficial Shareholders should ensure that instructions respecting the voting of their Common Shares are communicated in a timely manner to the Intermediary and in accordance with the instructions provided by their Intermediary. Applicable regulatory rules require Intermediaries to seek voting instructions from Beneficial Shareholders in advance of Shareholder meetings. Every Intermediary has its own mailing procedures and provides its own return instructions to clients. These instructions should be carefully followed by Beneficial Shareholders in order to ensure that their Common Shares are voted at the Meeting.
Although a Beneficial Shareholder may not be recognized directly at the Meeting for the purpose of Common Shares registered in the name of their Intermediary, a Beneficial Shareholder may attend the Meeting as proxyholder for the Intermediary and vote the Common Shares in that capacity. Beneficial Shareholders who wish to attend the Meeting and indirectly vote their Common Shares as a proxyholder should enter their own names in the blank space on the form of proxy provided to them by their Intermediary and return the same to their Intermediary in accordance with the instructions provided by their Intermediary well in advance of the Meeting.
THE TRANSVIDEO ACQUISITION
At the Meeting, the Shareholders will be asked to consider the TransVideo Resolution in the form set forth in Appendix “A” to this Circular.
Background to the TransVideo Acquisition
In an effort to obtain greater control over the future development of TransVideo’s set top boxes and to expand NeuLion’s opportunities for marketing its IPTV Services in China, at its November 12, 2009 meeting, the Board formed the Acquisition Special Committee, comprised of John R. Anderson, David Kronfeld (Chair), Shirley Strum Kenny and Gabriel A. Battista, to consider a proposal to acquire TransVideo. The Board formed the Acquisition Special Committee due to the interested nature of certain directors in the potential transaction. Each member of the Acquisition Special Committe e is considered to be independent for the purposes of MI 61-101. The Acquisition Special Committee met in December 2009 to discuss organizational matters.
10
At the March 16, 2010 meeting of the Board, management made a presentation recommending the acquisition of TransVideo by NeuLion. In the presentation, management explained its proposal for a possible acquisition of TransVideo. The Board unanimously approved pursuing such transaction subject to negotiating the terms of the acquisition and to resolving the issue of the fairness of the transaction, given the interest of Charles B. Wang, the Corporation’s Chairman, in AvantaLion, the majority owner of TransVideo. The Board authorized the Acquisition Special Committee to retain and instruct one or more outside advisors and to determine such advisors’ fees and other retainer terms in connection with the proposed TransVideo Acquisition.
Following the March 16, 2010 meeting, the Acquisition Special Committee convened to address organizational matters, including the selection of its legal advisor. The Acquisition Special Committee agreed to retain Borden Ladner Gervais LLP as its independent legal counsel.
The Acquisition Special Committee met on March 24 and 25 and May 11 and 19, 2010 with a partner of Borden Ladner Gervais LLP in attendance. Counsel advised the Acquisition Special Committee with respect to the Acquisition Special Committee’s duties in light of Mr. Wang’s position as a significant Shareholder of the Corporation and controlling shareholder of AvantaLion and explained the fiduciary duty of the directors.
The Acquisition Special Committee solicited proposals from two independent financial advisors to advise on the transaction. Following a review of the proposals and discussions with the candidates, the Acquisition Special Committee retained UHY as its independent financial advisor with the responsibility to prepare and deliver to the Acquisition Special Committee a formal valuation of TransVideo and of NeuLion.
On April 1, 2010, the Chair of the Acquisition Special Committee met with a representative of UHY to determine the projected timeline for completing the process of evaluating the proposed acquisition and to review any assistance or action to be provided by the Acquisition Special Committee, NeuLion and TransVideo. UHY was asked to prepare separate valuations of TransVideo and of NeuLion and then make a presentation to the Acquisition Special Committee.
On May 11, 2010, UHY presented the Valuation Reports to the Acquisition Special Committee. Subsequent to the presentation, and having considered the Valuation Reports, the Acquisition Special Committee determined the number of shares of NeuLion (expressed as a percentage of shares outstanding) to be issued to the Exchanging Shareholders, which it considered to be fair to NeuLion. On May 18, 2010, Bruce Richman, a managing director of UHY, met with G. Scott Paterson, a director of the Corporation, independently to discuss the valuation.
Based on management's proposal, the Acquisition Special Committee initially considered an acquisition which would include all of TransVideo’s operating assets. After further consideration and discussion amongst the Acquisition Special Committee, Mr. Kronfeld, in his role as Chair of the Acquisition Special Committee, had a discussion with Mr. Paterson in May 2010 regarding negotiating with Mr. Wang, in his role as controlling shareholder of AvantaLion, to exclude KyLinTV from the proposed acquisition and to accept instead post-acquisition ownership of approximately 15% of the Common Shares on a fully diluted basis. The Acquisition Special Committee presented the proposal to acquire TransVideo exclusive of KyLinTV to Mr. Wang, who accepted the proposal.
On May 19, 2010, the Acquisition Special Committee met and unanimously agreed to recommend the TransVideo Acquisition to the Board. On May 19, 2010, Mr. Kronfeld made a presentation to the Board regarding the process undertaken by the Acquisition Special Committee and stated that the Acquisition Special Committee unanimously recommended to the Board that NeuLion pursue the TransVideo Acquisition. The Board unanimously agreed to follow the recommendation of the Acquisition Special Committee and publicly announced that it had reached an agreement in principle to acquire the operating interests of TransVideo.
11
Valuation Reports and Fairness Opinion
Financial Forecasts
Management of NeuLion provided UHY with a one-year financial forecast for 2010, based on the Corporation’s operating history and assumptions about new business going forward. Additionally, Management provided UHY with a range of growth rates based on industry trends, that would be used to forecast the years 2011 to 2014.
In particular, the financial forecast was derived using the following assumptions:
| (i) | Revenue – forecasted using expected growth rates from existing customers and Management's best estimates regarding new business going forward; |
| (ii) | Cost of Revenue – forecasted as a percentage of revenues; and |
| (iii) | Operating Expenses – forecasted using historical growth rates, changes in revenue and inflation. |
Valuation Reports
The TransVideo Acquisition is a “related party transaction” for the Corporation as defined in MI 61-101 due to the fact that TransVideo is currently majority owned by AvantaLion, a corporation controlled by Mr. Wang, the Chairman of the Board. Mr. Wang is a “related party” of the Corporation (as defined in MI 61-101) as he is a director, the Chairman and a significant Shareholder of NeuLion. Generally, MI 61-101 requires a reporting issuer engaged in a related party transaction to: (i) obtain a valuation of the subject matter of the proposed transaction; and (ii) obtain the approval of the reporting issuer's “minority shareholders” (as that term is defined in MI 61-101).
Pursuant to the Valuation Engagement Letter, the Acquisition Special Committee retained UHY, an independent valuator, to prepare a formal valuation of NeuLion and of TransVideo. The Valuation Reports were one factor, among others, that the Acquisition Special Committee considered in assessing the TransVideo Acquisition and making its recommendations to the Board.
The Acquisition Special Committee has determined UHY to be qualified and independent within the meaning of MI 61-101 and that the Valuation Reports satisfied the requirements of MI 61-101. UHY has advised that neither it nor any of its affiliates: (i) is an “issuer insider”, “associated entity” or “affiliated entity” (as those terms are defined in MI 61-101) of NeuLion or TransVideo and their respective subsidiaries; (ii) is an advisor to TransVideo and its subsidiaries in connection with the TransVideo Acquisition; (iii) is a manager, co-manager or a member of a soliciting dealer group formed for purposes of the TransVideo Acquisition; (iv) is the external auditor of NeuLion or TransVideo and their respective subsidiaries; or (v) has a material financial interest in the completion of the T ransVideo Acquisition.
Pursuant to the Valuation Engagement Letter, UHY was paid a fee based on its hourly rates for the time spent on the engagement estimated to range from $50,000 to $55,000. In addition, UHY is to be reimbursed for its reasonable out-of-pocket expenses and will be held harmless by NeuLion under certain circumstances arising in connection with the Valuation Reports. The fees to be paid to UHY under the Valuation Engagement Letter were agreed between UHY and the Acquisition Special Committee. None of the fees paid to UHY were contingent upon the conclusions reached by UHY.
UHY's valuation professionals have significant experience in providing valuation advice for various purposes, including mergers and acquisitions and fairness opinions, amongst other things.
For the purposes of the Valuation Reports, “fair market value” is defined as the price at which the property would change hands between a willing buyer and a willing seller when the former is not under any compulsion to buy and the latter is not under any compulsion to sell, both parties having reasonable knowledge of relevant facts. This definition is similar to the definition of fair market value in MI 61-101.
As contained in the TransVideo Valuation Report, UHY concluded that, as of March 31, 2010, the fair market value of TransVideo (including its interest in KyLinTV, which interest will not be acquired by NeuLion) was in the range of $40,690,000 to $52,870,000, including a value of $21,060,000 for TransVideo's 32.74% interest in KyLinTV. The Acquisition Special Committee determined that the range of values for TransVideo, assuming the exclusion of its interest in KyLinTV, would be $19,630,000 to $31,810,000. In the NeuLion Valuation Report, UHY concluded that, as of March 31, 2010, the fair market value of NeuLion was in the range of $104,900,000 to $157,100,000. The Valuation Reports were provided to the Acquisition Special Com mittee as one factor in its consideration of the TransVideo Acquisition and were not, and are not, a recommendation by UHY as to any action that the Acquisition Special Committee, the Board, any Shareholder or any other person should take in connection with the TransVideo Acquisition. Under the terms of the Valuation Engagement Letter, such Valuation Reports may not be used for any other purpose without UHY’s prior consent or be relied upon by any other person, including any Shareholder. The Valuation Reports were provided for the use of the Acquisition Special Committee and should not be construed as a recommendation to invest in, or divest of, any of NeuLion's or TransVideo's securities. The Valuation Reports are subject to the scope, assumptions, limitations and restrictions and qualifications contained therein and must be considered in their entirety by the reader as selecting and relying on only specific portions of the analyses or factors considered, without considering all factor s and analyses together, could create a misleading view of the process underlying the Valuation Reports. In particular, the preparation of a valuation is a complex process and it is not appropriate to extract partial analyses or make summary descriptions. Any attempt to do so could lead to undue emphasis on a particular factor or analysis. The Valuation Reports should be read in their entirety and are included as Appendix “G” and Appendix “H” to this Circular.
12
Fairness Opinion
The Acquisition Special Committee retained UHY to address the fairness, from a financial point of view, of the issuance and delivery of 22,000,802 Common Shares by NeuLion in exchange for all of the issued and outstanding shares of TransVideo pursuant to the TransVideo Acquisition. Pursuant to such engagement, UHY has delivered the Fairness Opinion to the Acquisition Special Committee. The Fairness Opinion states that, subject to the assumptions, conditions and limitations contained therein, in the opinion of UHY as of June 18, 2010, the issuance and delivery of 22,000,802 Common Shares by NeuLion in exchange for all of the issued and outstanding shares of TransVideo pursuant to the TransVideo Acquisition is fair, from a financial point of view, to NeuLion.
Pursuant to the terms of the Opinion Engagement Letter, UHY is entitled to an aggregate fee of $145,000. In addition, UHY is to be reimbursed for its reasonable out-of-pocket expenses, including outside legal fees, and will be held harmless by NeuLion under certain circumstances arising in connection with the Fairness Opinion. The fees to be paid to UHY under the Opinion Engagement Letter were agreed between UHY and the Acquisition Special Committee. None of the fees payable to UHY are contingent upon the conclusions reached by UHY in the Fairness Opinion or on the completion of the TransVideo Acquisition.
The opinion expressed by UHY was provided for the information and assistance of our Acquisition Special Committee in connection with its consideration of the TransVideo Acquisition and such opinion does not constitute a recommendation as to any action the Acquisition Special Committee, the Board, or any Shareholder should take in connection with the TransVideo Acquisition or any aspect thereof and is not a recommendation to any person on how such person should vote with respect to the TransVideo Acquisition or any other matter presented at the Meeting. The Fairness Opinion may not be relied upon by any person or party other than the Acquisition Special Committee.
The Fairness Opinion should not be construed as a recommendation to invest in or divest of any common shares of NeuLion or TransVideo. The Fairness Opinion is subject to the assumptions and limitations contained therein and should be read in its entirety. The Fairness Opinion is one factor, among others, that the Acquisition Special Committee considered in assessing the TransVideo Acquisition and making its recommendation to the Board. The Fairness Opinion is included as Appendix “F” to this Circular.
In rendering the Fairness Opinion, UHY assumed and relied upon the accuracy and completeness of all information supplied or otherwise made available to it by NeuLion, TransVideo or our or their respective representatives or advisors or otherwise obtained by UHY from other sources. With respect to financial projections of NeuLion and TransVideo, we advised UHY, and UHY assumed, without independent investigation, that such projections were reasonably prepared and reflected the best then available estimates and good faith judgment of NeuLion’s and TransVideo’s respective senior management as to NeuLion’s and TransVideo’s expected future competitive, operating and regulatory environments and related financial performance. UHY expressed no opinion with respect to such projections or the assumptions o n which they were based.
The Fairness Opinion was necessarily based upon financial, economic, market and other conditions as they existed and could be evaluated, and the information made available to the UHY, as of the date of such opinion. UHY does not have any obligation to advise any person of any change in any fact or matter affecting its opinion which may come or be brought to UHY’s attention after the date of such opinion.
Prior Valuations
To the knowledge of the directors and officers of the Corporation, after reasonable inquiry, other than the TransVideo Valuation Report and the Fairness Opinion, there have been no prior valuations (as defined in MI 61-101) prepared in respect of TransVideo or its securities or material assets within the two-year period preceding the date of this Circular.
Timing
It is the objective of both NeuLion and the Exchanging Shareholders to have the Effective Date occur on or about October 1, 2010. The Effective Date could be delayed, however, for a number of reasons. It is not possible, therefore, to state with certainty when or if the Effective Date will occur.
Anticipated Benefits of the TransVideo Acquisition
The TransVideo Acquisition, if consummated, will provide NeuLion with greater control over the future development of TransVideo's set top boxes. TransVideo's existing relationships in China will also afford NeuLion with substantial opportunities for marketing its IPTV services in that geographic region.
This description of the TransVideo Acquisition is qualified in its entirety by reference to the full text of the Share Exchange Agreement, which is attached as Appendix “J” to this Circular.
If the requisite Shareholder approval is obtained and the conditions to the completion of the transactions contemplated in the Share Exchange Agreement are met, the TransVideo Acquisition will result in TransVideo becoming a wholly-owned subsidiary of NeuLion on the Effective Date.
Recommendation of the Acquisition Special Committee and of the Board
The Board established the Acquisition Special Committee with the mandate to consider and advise the Board as to the terms of the TransVideo Acquisition. The Acquisition Special Committee unanimously recommended to the Board that the consideration payable to the shareholders of TransVideo should consist of that number of Common Shares representing approximately 15% of the Common Shares outstanding, on a fully diluted basis, after giving effect to the TransVideo Acquisition (prior to giving effect to the proposed Private Placement). After careful consideration of the Valuation Reports, the Fairness Opinion and other factors, the Acquisition Special Committee unanimously concluded that the consideration to be paid by NeuLion to the Exchanging Shareholders for their 100% interest in TransVideo (excluding the interest in KyLinTV) pursuant to the TransVideo Acquisition was fair from a financial point of view to NeuLion.
13
After careful consideration, the Board, based upon the unanimous recommendation of the Acquisition Special Committee, has determined (with Mr. Wang abstaining due to his position as director, Chairman and a significant Shareholder of NeuLion and the controlling shareholder of AvantaLion, and with Ms. Li, the spouse of Mr. Wang, abstaining) that the TransVideo Acquisition is fair to, and in the best interests of, NeuLion.
The conclusions and recommendations of the Board are based upon a number of factors, including the following:
| (a) | TransVideo will be managed by the same experienced team of professionals that have demonstrated their ability to efficiently manage the operations of NeuLion and to deliver on development and acquisition opportunities; |
| (b) | the recommendation of the Acquisition Special Committee; |
| (c) | the Fairness Opinion; |
| (d) | the Valuation Reports; and |
| (e) | the strategic benefits that TransVideo brings to NeuLion’s future prospects. |
The foregoing discussion of the factors reviewed by the Acquisition Special Committee and the Board is not intended to be exhaustive. In view of the wide variety of factors considered in connection with their evaluation of the TransVideo Acquisition, the Acquisition Special Committee and the Board did not find it practicable to, and therefore did not, quantify or assign relative weights to specific factors or methodologies in reaching their conclusions. In addition, individual members of the Acquisition Special Committee and the Board may have given different weights to different factors.
The Board unanimously recommends that the Shareholders vote FOR the approval of the TransVideo Resolution. Unless instructions are given to vote against the TransVideo Resolution, the persons whose names appear on the enclosed proxy form will vote FOR the approval of the TransVideo Resolution.
The Share Exchange Agreement
The TransVideo Acquisition will be undertaken and shall be consummated pursuant to the terms of the Share Exchange Agreement. The Share Exchange Agreement contains covenants, representations and warranties of and from each of NeuLion and the Exchanging Shareholders and various conditions precedent, both mutual and with respect to each of the parties and TransVideo.
The following is a summary of certain provisions of the Share Exchange Agreement, attached as Appendix “J” to this Circular, and is qualified in its entirety by the full text thereof.
In connection with the TransVideo Acquisition, the Corporation has entered into a Share Exchange Agreement with the Exchanging Shareholders, dated as of August 12, 2010, included herewith as Appendix “J” (the “Share Exchange Agreement”) to this Circular. The Exchanging Shareholders collectively own 100% of the issued and outstanding shares of TransVideo.
Pursuant to the Share Exchange Agreement, the Corporation will issue, subject to certain conditions set forth below, an aggregate of 22,000,802 Common Shares (the “Corporation Exchange Shares”) to the Exchanging Shareholders in exchange for 3,200,000 shares of TransVideo (the “TransVideo Exchange Shares”), which shares represent all of the issued and outstanding shares of TransVideo (the “Exchange”). The Share Exchange Agreement contains certain conditions to the closing of the Exchange (the “Closing”), including the accuracy of the representations and warranties, performance by execution and delivery by the Corporation and the other parties thereto of the agreements that are described in this Circular, approval from the Shareholders and the TSX.
Of the 22,000,802 Common Shares issuable in connection with the TransVideo Acquisition, 81% of the Common Shares are issuable to AvantaLion, a company controlled by Mr. Wang.
14
After giving effect to the TransVideo Acquisition only, Mr. Wang will beneficially own, directly and indirectly, approximately 24,159,743 Common Shares of NeuLion as of July 30, 2010. The Share Exchange Agreement contains various representations and warranties between the Corporation on the one hand, and the Exchanging Shareholders on the other hand, with respect to themselves and TransVideo, that are subject, in some cases, to specified exceptions and qualifications. The representations and warranties, which are substantially reciprocal, relate to, among other things, organization and good standing, corporate power and authority to enter into the Share Exchange Agreement and to consummate the transactions contemplated thereby, the absence of violations of, or conflicts with, governing documents or applicable law as a r esult of entering into the Share Exchange Agreement and binding obligations. In addition, the Exchanging Shareholders, severally as to each of themselves, have made certain representations and warranties, related to, among other things, ownership of the TransVideo Exchange Shares, litigation and their status as an accredited investor. The Exchanging Shareholders, jointly and not severally, also made certain representations and warranties related to, among other things, subsidiaries, capitalization and related matters, litigation, title to and condition of properties, absence of undisclosed liabilities, any changes to TransVideo since January 1, 2010, material contracts, employees, tax returns, licenses, intellectual property and financial statements. The Corporation has also made certain representations and warranties related to, among other things, the due authorization and valid issuance of the Corporation Exchange Shares. All such representations and warranties will s urvive the Closing until the third anniversary of the date of the Share Exchange Agreement, except that the representations and warranties made by the Exchanging Shareholders with respect to ownership, authority and capitalization and related matters as to themselves and TransVideo shall survive indefinitely and the representations and warranties made by the Exchanging Shareholders with respect to tax matters shall survive until 60 days after the expiration of the applicable statute of limitations.
Pursuant to the Share Exchange Agreement, the Corporation has the right to indemnification from each Exchanging Shareholder, severally and not jointly, for, among other things, breaches of any representation or warranty made by the Exchanging Shareholders severally and not jointly, and from each Exchanging Shareholder, jointly and not severally, for, among other things, breaches of any representation or warranty made by the Exchanging Shareholders jointly and not severally. The Corporation shall indemnify the Exchanging Shareholders for, among other things, breaches of any representation or warranty made by the Corporation. No party seeking indemnification under the Share Exchange Agreement shall be entitled to indemnification until the aggregate amount of Damages (as defined in the Share Exchange Agreement) to su ch party exceeds US$50,000, at which time, the party seeking indemnification shall be entitled to indemnification for the total amount of such Damages.
Shareholder Approval Required for the TransVideo Resolution
The TransVideo Resolution must be approved by a majority of the votes cast by the Shareholders, other than by Mr. Wang, Ms. Li, AvantaLion, any other person who may be a related party of TransVideo, and any other person who is a joint actor of Mr. Wang, Ms. Li and AvantaLion, who vote in respect of the TransVideo Resolution, in person or by proxy, at the Meeting.
As of July 30, 2010, a total of 51,440,204 Common Shares will be excluded from voting on the TransVideo Acquisition. See “Voting Securities and Principal Holders Thereof” for a breakdown of the Common Shares owned and controlled by Mr. Wang and Ms. Li, all of which will be excluded from voting on the TransVideo Resolution.
Interests of Experts
Certain legal matters relating to the TransVideo Acquisition and the Private Placement are to be passed upon at the consummation of the transactions by McCarthy Tétrault LLP and Loeb & Loeb LLP, on behalf of NeuLion. As of the Record Date, the partners and associates of McCarthy Tétrault LLP and Loeb & Loeb LLP beneficially owned, directly or indirectly, less than 1% of the outstanding Common Shares.
Expenses of the TransVideo Acquisition
The estimated costs to be incurred by NeuLion relating to the TransVideo Acquisition, including, without limitation, NeuLion’s accounting and legal fees, the payment of the financial fees to UHY, employees and consultants and the preparation and printing of this Circular are expected to aggregate approximately $550,000.00.
Risk Factors
The TransVideo Acquisition would be subject to certain risks. The Shareholders should carefully consider the risks described in Appendix “D” to this Circular, “Information Concerning TransVideo – Risk Factors”, for a more detailed description of the risk factors applicable to NeuLion following the TransVideo Acquisition. Readers should also carefully consider the risk factors relating to the business of NeuLion identified in the section entitled “Risk Factors” in the Corporation’s Form 10-K found on SEDAR at www.sedar.com and at the Securities and Exchange Commission’s website at www.sec.gov, which is incorporated herein by reference.
15
In addition to the foregoing, the Shareholders should consider the following risk factors:
Conditions Precedent and Required Regulatory and Third Party Approvals
The completion of the TransVideo Acquisition and the Private Placement are subject to a number of conditions precedent, some of which are outside the control of NeuLion, including, without limitation, receipt of Shareholder approval at the Meeting and approval by the TSX. There can be no certainty, nor can NeuLion provide any assurance, that these conditions will be satisfied or, if satisfied, when they will be satisfied.
The Anticipated Benefits of the TransVideo Acquisition May Not Be Realized
NeuLion is proposing to complete the TransVideo Acquisition to create the opportunity to realize certain benefits including those set forth under the heading “The TransVideo Acquisition - Anticipated Benefits of the TransVideo Acquisition”. A variety of factors, including those risk factors set forth in this Circular and in the documents incorporated by reference herein, may adversely affect the ability to achieve the anticipated benefits of the TransVideo Acquisition.
Risk Factors Associated with the Share Exchange Agreement
As consideration for all of the issued and outstanding shares of TransVideo being transferred to NeuLion pursuant to the Share Exchange Agreement, NeuLion shall issue 22,000,802 Common Shares, which as of July 30, 2010 will represent approximately 14.14% of the issued and outstanding Common Shares on completion of the TransVideo Acquisition and the Private Placement, the effect of which will result in a dilution of the equity interest of the Shareholders. However, the actual number of Class 3 Preference Shares to be issued in connection with the Private Placement depends on the foreign exchange currency rate on the business day immediately preceding the closing date of the Private Placement, as the price per share is in Canadian dollars b ut the $10 million investment is in US dollars. The actual number of Class 3 Preference Shares will be determined using the Bank of Canada noon rate for the conversion of Canadian dollars to U.S. dollars on the business day immediately prior to the Closing. For example, applying the Bank of Canada noon rate on July 19, 2010, CAD$1 converted into US$0.9471, which means that CAD$0.60 converted into US$0.57. US$10 million divided by US$0.57 equals 17,543,860 Class 3 Preference Shares. Applying hypothetical Bank of Canada noon rates:
- if CAD$1 converted into US$0.90, then CAD$0.60 converted into US$0.54, and US$10 million divided by US$0.54 equals 18,518,519 Class 3 Preference Shares; and
- if CAD$1 converted into US$1.05, then CAD$0.60 converted into US$0.63, and US$10 million divided by US$0.63 equals 15,873,016 Class 3 Preference Shares.
Potential Undisclosed Liabilities
In connection with the TransVideo Acquisition, NeuLion has completed a due diligence investigation of the assets and liabilities of TransVideo. There may be liabilities that NeuLion failed to or was unable to discover in its due diligence and NeuLion may not be indemnified for some or all of these liabilities following the completion of the TransVideo Acquisition. The discovery of any material liabilities could have a material adverse effect on the business, financial condition and results of operations of the Corporation.
THE ARTICLES OF AMENDMENT
At the Meeting, the Shareholders will be asked to consider the Articles of Amendment Resolution in the form set forth in Appendix “B” to this Circular, which resolution would approve the creation of the Class 3 Preference Shares. See also “—Dissent Rights”.
Class 3 Preference Shares Attributes
If the Private Placement Resolution is passed by the Shareholders, the Class 3 Preference Shares will have certain rights, preferences, privileges and restrictions, including the following:
| · | Dividends, subject to certain conditions, at the rate of eight percent (8%) per annum, accrued daily, compounded annually and payable in cash upon a liquidation event for up to five (5) years, as well as the right to receive any dividends paid to Common Shares. |
16
| · | In the event of any liquidation, dissolution or winding up of the Corporation, the holders of Class 3 Preference Shares shall be entitled to receive, in preference to the holders of Common Shares, an amount equal to the aggregate Redemption Amount (as defined in the Articles of Amendment) of all Class 3 Preference Shares, together with any accrued but unpaid dividends. |
| · | The holders of Class 3 Preference Shares shall have the right to convert any or all Class 3 Preference Shares, at the option of the holder, at any time, into Common Shares on a one for one basis. In addition, the Class 3 Preference Shares shall automatically be converted into Common Shares in the event that the holders of a majority of the outstanding Class 3 Preference Shares consent to such conversion. |
| · | In the event of a conversion to Common Shares, accrued but unpaid dividends shall be paid in cash and shall not increase the number of Common Shares issuable upon such conversion. |
| · | There will be proportional adjustments for stock splits, stock dividends, recapitalizations and the like. |
| · | The Class 3 Preference Shares will vote together with Common Shares and not as a separate class, except as specifically provided under the section “Protective Provisions” of the Articles of Amendment or as otherwise required by law. Each Class 3 Preference Share shall have a number of votes equal to the number of Common Shares then issuable upon the conversion of such Class 3 Preference Shares. |
| · | Subject to applicable law, the consent of 66⅔% of the Class 3 Preference Shares voting alone shall be required to: |
| a) | change the rights and terms of the Class 3 Preference Shares; and |
| b) | authorize, create or issue any security either preferential to or on parity with the Class 3 Preference Shares. |
| · | The consent of a majority of the Class 3 Preference Shares shall be required to pay any dividend to or redeem any Class 3 Preference Shares or Common Shares (other than the payment of dividends on the Class 3 Preference Shares as contemplated in the Articles of Amendment and other than purchases of Common Shares from employees or other service providers upon termination of service). |
| · | At any time after five years from the date of issuance, the holders of a majority of the Class 3 Preference Shares may elect to have the Corporation redeem the Class 3 Preference Shares for an amount equal to CAD$0.60 per Class 3 Preference Share plus all accrued and unpaid dividends. At any time after five years from the date of issuance, the Corporation may, at its option, redeem the Class 3 Preference Shares for an amount equal to CAD$0.60 per Class 3 Preference Share plus all accrued and unpaid dividends. |
Shareholder Approval Required for the Articles of Amendment Resolution
The Articles of Amendment Resolution must be approved by at least 66⅔% of the votes cast by the Shareholders who vote in respect of the Articles of Amendment Resolution, in person or by proxy, at the Meeting.
The Board recommends that the Shareholders vote FOR the approval of the Articles of Amendment Resolution. Unless instructions are given to vote against the Articles of Amendment Resolution, the persons whose names appear on the enclosed proxy form will vote FOR the approval of the Articles of Amendment Resolution.
Dissent Rights
Under the provisions of section 190 of the CBCA, a registered holder of Common Shares may dissent in respect of the Articles of Amendment Resolution. If the Articles of Amendment are filed, a registered holder of Common Shares who, in connection with the Articles of Amendment Resolution, has exercised the right of dissent pursuant to section 190 of the CBCA in strict compliance with the procedures set forth in the CBCA and who has not withdrawn the notice of the exercise of such rights as permitted by section 190 of the CBCA will be entitled to be paid the fair value for his, her or its Common Shares. Shareholders of Common Shares are not entitled to dissent with respect to their Common Shares if they vote any of such shares in favour of the Articles of Amendment Resolution, or if the directors do not act to amend the Articles of the C orporation.
17
A brief summary of the provisions of section 190 of the CBCA is set forth below.
The following summary does not purport to provide a comprehensive statement of the procedures to be followed by a dissenting Shareholder who seeks to exercise dissent rights. Section 190 of the CBCA requires strict adherence to the procedures established therein and failure to do so may result in the loss of dissent rights.
Accordingly, each Shareholder who might desire to exercise dissent rights should carefully consider and comply with the provisions in section 190 of the CBCA.
Each dissenting Shareholder who wishes to exercise dissent rights is required to send a written objection to the Articles of Amendment to the Corporation at or prior to the Meeting. The address of the Corporation for such purpose is: 463 King Street West, Third Floor, Toronto, Ontario M5V 1K4, Canada, Attn: General Counsel and Corporation Secretary. The execution or exercise of a proxy does not constitute a written objection for the purposes of section 190 of the CBCA. Within ten days after the Articles of Amendment Resolution is adopted by the Shareholders, the Corporation must so notify each of the dissenting Shareholders who is then required, within twenty days after receipt of such notice (or, if such Shareholder does not receive such notice, within twenty days after learning of the adoption of the special resolution), to send to the Corporation a written notice containing that person’s name and address, the number of Common Shares in respect of which that Shareholder dissents and a demand for payment of the fair value of such Common Shares. Within thirty days after sending such written notice, the dissenting Shareholder must also send to NeuLion the share certificate or certificates representing all of that Shareholder’s Common Shares.
If the Articles of Amendment are filed, NeuLion is required to determine the fair value of the Common Shares and to make a written offer to pay such amount to the dissenting Shareholder. If such offer is not made or not accepted within thirty days, any dissenting Shareholder may apply to the court to fix the fair value of the Common Shares. There is no obligation on the Corporation to apply to the court. If any application is made, the dissenting Shareholder will be entitled to be paid the amount fixed by the court.
The text of section 190 of the CBCA is set out in Appendix “I” to this Circular.
Registered holders of Common Shares who wish to exercise dissent rights should seek legal advice, as failure to adhere to the requirements set out in section 190 of the CBCA may result in the loss or unavailability of any right to dissent.
THE PRIVATE PLACEMENT
At the Meeting, the Shareholders will be asked to consider the Private Placement Resolution in the form set forth in Appendix “C” to this Circular.
Background to the Private Placement
The JK&B Transaction
Prior to May 2010, the Board considered a number of financing alternatives that could be available to the Corporation. At the May 12, 2010 meeting of the Board, Mr. Kronfeld indicated that JK&B Capital had an interest in a transaction for preferred shares at a price that would exceed the current market price for the Common Shares. It was decided that any offer by JK&B should be directed to Roy E. Reichbach, General Counsel and Corporate Secretary of the Corporation, on behalf of the Board.
18
On May 24, 2010, Mr. Reichbach was advised by Marc Sokol, Managing Director of JK&B, that JK&B was sending a proposed term sheet for US$10 million in preferred investment in the Corporation. Mr. Reichbach sent the Board an e-mail advising them of the pending term sheet and proposing May 26, 2010 for a Board meeting to discuss the transaction and potentially appoint a special committee. The term sheet was received on May 25, 2010. After the various members of the Board exchanged e-mails and phone calls, May 25, 2010 at 6 p.m. was set as the time of the Board meeting to discuss the proposed private placement transaction and potentially appoint a special committee.
On May 25, 2010, the Board convened telephonically, discussed the term sheet and appointed the Private Placement Special Committee comprised of Mr. Reichbach and Dr. Kenny, who were also appointed co-chairs of such special committee. The Board agreed to meet again on May 28, 2010 at noon.
On May 26, 2010, the Private Placement Special Committee discussed the term sheet and proposed modifications. They agreed that Mr. Reichbach would negotiate with JK&B’s representative.
On May 26, 2010 and May 27, 2010, numerous discussions were held between Messrs. Reichbach and Sokol. JK&B agreed to significant revisions to the initial term sheet.
On May 27, 2010, the Private Placement Special Committee met telephonically to discuss the status of the negotiations with JK&B. After discussion, the Private Placement Special Committee agreed to recommend that the Board approve the term sheet, as negotiated and revised. Mr. Reichbach then discussed the status of the negotiations with all of the other members of the Board individually.
On May 28, 2010, the Board convened telephonically to discuss the revised term sheet. After discussion, on the recommendation of the Private Placement Special Committee, the Board unanimously approved the execution of the term sheet.
On May 28, 2010, NeuLion and JK&B Capital V, L.P. executed a non-binding term sheet in connection with the Private Placement.
Pursuant to the agreed upon terms, and subject to the approval of the Articles of Amendment Resolution and the Private Placement Resolution, NeuLion will issue approximately 16,666,667 Class 3 Preference Shares at a price of CAD$0.60 per share, representing a 28% premium over CAD$0.465, which was the price of the Common Shares at the close of business on May 28, 2010. However, the actual number of Class 3 Preference Shares to be issued in connection with the Private Placement depends on the foreign exchange currency rate on the business day immediately preceding the closing date of the Private Placement, as the price per share is in Canadian dollars but the $10 million investment is in US dollars. The actual number of Class 3 Preference Shares will be d etermined using the Bank of Canada noon rate for the conversion of Canadian dollars to U.S. dollars on the business day immediately prior to the Closing. For example, applying the Bank of Canada noon rate on July 19, 2010, CAD$1 converted into US$0.9471, which means that CAD$0.60 converted into US$0.57. US$10 million divided by US$0.57 equals 17,543,860 Class 3 Preference Shares. Applying hypothetical Bank of Canada noon rates:
- if CAD$1 converted into US$0.90, then CAD$0.60 converted into US$0.54, and US$10 million divided by US$0.54 equals 18,518,519 Class 3 Preference Shares; and
- if CAD$1 converted into US$1.05, then CAD$0.60 converted into US$0.63, and US$10 million divided by US$0.63 equals 15,873,016 Class 3 Preference Shares.
The Subscription Agreements provide that Mr. Battista, JK&B Capital V Special Opportunities Fund, L.P. and JK&B Capital V, L.P. will subscribe for 0.6%, 42.74% and 56.66% of the Class 3 Preference Shares issued pursuant to the Private Placement, respectively.
The Corporation has been advised that JK&B does not currently hold any Common Shares. Mr. Battista currently controls (either directly or indirectly) 140,542 Common Shares (less than 0.01% of the issued and outstanding Common Shares).
It is expected that as of the closing of the Private Placement and the TransVideo Acquisition, Mr. Battista, JK&B Capital V Special Opportunities Fund, L.P. and JK&B Capital V, L.P. will hold approximately 240,542 Common Shares (0.2% of the issued and outstanding Common Shares), 7,123,667 Common Shares (4.58% of the issued and outstanding Common Shares) and 9,443,000 Common Shares (6.07% of the issued and outstanding Common Shares), respectively.
The proceeds of the Private Placement will be used for general working capital purposes.
Mr. Wang, a director, the Chairman and a significant Shareholder of NeuLion and a holder of an ownership interest in JK&B Capital V Special Opportunities Fund, L.P., Ms. Li, his spouse, and Mr. Kronfeld, a holder of ownership interests in JK&B, will not be voting in connection with the Private Placement Resolution. Mr. Battista is participating in the Private Placement and will not be voting in connection with the Private Placement Resolution. To the knowledge of NeuLion after reasonable inquiry, none of Mr. Wang, Ms. Li, Mr. Kronfeld or Mr. Battista have knowledge of any material information concerning NeuLion or its securities that has not been general ly disclosed.
MI 61-101 also requires that, unless exempted, a valuation report must be prepared in connection with the value of the non-cash assets in a related party transaction. The Private Placement is exempt from this requirement by application of the “Fair market value not more than 25% of market capitalization” exemption contained in section 5.5(a) of MI 61-101.
Summary of Subscription Agreements
In connection with the Private Placement, the Corporation has entered into a subscription agreement with each of JK&B and Mr. Battista (collectively, the “Subscription Agreements”), pursuant to which the Corporation will issue, subject to certain conditions set forth below, approximately 16,666,667 shares of Class 3 Preference Shares at a purchase price of CAD$0.60 per Class 3 Preference Share, for up to a maximum total purchase price of US$10 million. The Corporation will use the proceeds from the sale of the Class 3 Preference Shares for general working capital purposes. The Subscription Agreements contain certain conditions to the closing of the sale of the Class 3 Preference Shares, including the execution and delivery by the Corporation a nd the other parties thereto of the agreements described herein and the procurement of Board, Shareholder and other necessary approvals in connection with the Private Placement.
19
The Corporation makes representations and warranties in the Subscription Agreements on a variety of topics, including those related to (i) organization, good standing and qualification, (ii) authorization and binding obligations, (iii) compliances with laws, (iv) compliance with other instruments, (v) consents and approvals, (vi) its status as a “reporting issuer,” (vii) no stop orders with respect to its securities, (viii) valid issuance of its outstanding Common Shares, (ix) filing of all reports required to be filed by it under the securities laws, (x) taxes, (xi) stabilizing or manipulating the price of its Common Shares and (xii) accuracy of its books and records.
Pursuant to each Subscription Agreement, the purchaser agrees to indemnify and hold harmless the Corporation and its officers and directors from, among other things, any losses, damages and expenses incurred by it in investigating, preparing or defending against any claim, lawsuit, administrative proceeding or investigation arising out of a breach of any representation or warranty of the purchaser or any breach by a purchaser of, or failure of the purchaser to comply with, any covenant or agreement made by a purchaser in such Subscription Agreement.
Shareholder Approval Required for the Private Placement Resolution
The Private Placement Resolution must be approved by a majority of the votes cast by the Shareholders (other than Mr. Wang, Ms. Li, Mr. Kronfeld and Mr. Battista) who vote in respect of the Private Placement Resolution, in person or by proxy, at the Meeting.
As of July 30, 2010, a total of 52,508,681 Common Shares will be excluded from voting on the Private Placement Resolution, of which 140,542 Common Shares and 927,935 Common Shares would otherwise have been voted, either directly or indirectly, by Mr. Battista and by Mr. Kronfeld, respectively. Also, see “Voting Securities and Principal Holders Thereof” for a breakdown of the Common Shares owned and controlled by Mr. Wang and Ms. Li, all of which will be excluded from voting on the Private Placement Resolution.
After careful consideration, the Board, based upon the recommendation of the Private Placement Special Committee, has determined (with Mr. Wang. Mr. Battista, Mr. Kronfeld and Ms. Li abstaining) that the Private Placement is fair to, and in the best interests of, NeuLion. The Board unanimously recommends that the Shareholders vote FOR the approval of the Private Placement Resolution. Unless instructions are given to vote against the Private Placement Resolution, the persons whose names appear on the enclosed proxy form will vote FOR the approval of the Private Placement Resolution.
The Subscription Agreements provide that it is a condition of closing of the Private Placement that rights of dissent in relation to the Private Placement shall not have been exercised by the holders of more than 1% of the issued and outstanding Common Shares.
DILUTION TO SHAREHOLDERS
As of July 30, 2010, 116,980,017 Common Shares were issued and outstanding. If the transactions described herein had closed on July 30, 2010 a total of 16,666,667 (14.2% dilution) Common Shares would have been issued to JK&B as a result of the Private Placement, a total of 22,000,802 (18.8% dilution) Common Shares would have been issued to the Exchanging Shareholders and as a result of both transactions, a total of 38,667,469 (33.0% dilution) Common Shares would have been issued.
INTEREST OF INFORMED PERSONS IN MATTERS TO BE ACTED UPON AND IN OTHER
PREVIOUSLY DISCLOSED MATERIAL TRANSACTIONS
To the knowledge of NeuLion, no informed person (as such term is defined under applicable securities laws and the CBCA), or any associate or affiliate of any informed person has or had a material interest, direct or indirect, in any transaction since the beginning of NeuLion’s most recently completed fiscal year or in any proposed transaction which has materially affected or would materially affect NeuLion, except as disclosed elsewhere herein and below.
The Corporation has entered into certain transactions and agreements in the normal course of operations with related parties. Significant related party transactions are as follows:
TransVideo
Set top box purchases from TransVideo amounted to $1,029,136 and $2,745,000 and transcoder licensing fees amounted to $78,000 and $125,000 for the years ended December 31, 2009 and 2008, respectively. Included in cost of equipment revenue is the cost of set top boxes sold of $937,204 and $2,816,490 for the years ended December 31, 2009 and 2008, respectively.
20
KyLinTV
KyLinTV is an IPTV company that is controlled by Mr. Wang. On June 1, 2008, the Corporation entered into an agreement with KyLinTV to build and deliver the setup and back office operation of an IPTV service. The Corporation also provides and charges KyLinTV for administrative and general corporate support. For each of the periods presented, the amounts received for these services provided by the Corporation for the years ended December 31, 2009 and 2008 were $645,722 and $1,233,353, respectively. During the year ended December 31, 2008, the Corporation purchased computer equipment from KyLinTV in the amount of $620,000.
New York Islanders
The Corporation provides information technology related professional services to the New York Islanders, a professional hockey club that is owned by Mr. Wang.
Renaissance
Renaissance is a real estate management company owned by Mr. Wang. In June 2009, the Corporation signed a sublease agreement with Renaissance for office space in Plainview, New York. Rent expense paid by the Corporation to Renaissance of $388,975 and zero, inclusive of taxes and utilities, is included in selling, general and administrative expense for the years ended December 31, 2009 and 2008, respectively.
VOTING SECURITIES AND PRINCIPAL HOLDERS THEREOF
The authorized share capital of NeuLion consists of an unlimited number of Common Shares, an unlimited number of Class 1 Preference Shares, issuable in series, and an unlimited number of Class 2 Preference Shares, issuable in series. As of July 30, 2010, 116,980,017 Common Shares were issued and outstanding, each of which carries the right to one vote on each matter that may come before the Meeting. The holders of Class 1 Preference Shares and holders of Class 2 Preference Shares are not entitled to receive notice of, to attend or to vote at any meeting of the Shareholders. As of the date hereof there are no Class 1 Preference Shares or Class 2 Preference Shares issued and outstanding.
To the knowledge of the directors and officers of NeuLion as at July 30, 2010, no person or company beneficially owns, or controls or directs, directly or indirectly, voting securities carrying more than 10% of the voting rights attached to any class of outstanding voting securities of NeuLion, other than as set forth below. These numbers do not include convertible securities exercisable for Common Shares within 60 days. See also “Security Ownership of Certain Beneficial Owners”.
| Name of Shareholder | Number of Common Shares | Percentage of Common Shares |
| Nancy Li | 39,160,894(1)(2) | 33.5% |
| Charles B. Wang | 12,279,310(2)(3) | 10.5% |
______________
| (1) | This figure excludes 12,279,310 Common Shares beneficially owned by Ms. Li’s spouse, Mr. Wang (which includes 10,000,000 Common Shares beneficially owned by AvantaLion). Ms. Li disclaims beneficial ownership of all such Common Shares. It also excludes 900,000 options to acquire Common Shares, of which 225,000 were exercisable as at July 30, 2010. |
| (2) | The voting of these Common Shares is subject to the Voting Trust Agreement described below. |
| (3) | This figure includes 10,000,000 Common Shares beneficially owned by AvantaLion. It excludes 39,160,894 Common Shares beneficially owned by Ms. Li, Mr. Wang’s spouse. Mr. Wang disclaims beneficial ownership of all Ms. Li’s Common Shares. It also excludes 10,000,000 warrants to acquire Common Shares held by AvantaLion. |
21
Voting Trust Agreement
AvantaLion, Mr. Wang and Ms. Li are parties to the Voting Trust Agreement pursuant to which all Common Shares directly or indirectly controlled by them were deposited with Computershare so that Common Shares controlled by AvantaLion, Mr. Wang and Ms. Li representing more than 9.9% of the total issued and outstanding Common Shares may not be voted in relation to:
| · | the election of directors; |
| · | any matters related to security-based compensation; and |
| · | any other matters which may change the governance structure of NeuLion as disclosed in the management information circular dated September 4, 2008 relating to the shareholder approval of the business combination of the entities then known as JumpTV Inc. and NeuLion, Inc. |
The voting restriction does not apply to any arm’s-length transferee of any of the Common Shares held by AvantaLion, Mr. Wang or Ms. Li. The Voting Trust Agreement will terminate on the first to occur of:
| · | five years from October 20, 2008; |
| · | the date when the Common Shares cease to be listed and posted for trading on the TSX; and |
| · | the date that AvantaLion, Mr. Wang and Ms. Li no longer own any Common Shares. |
INDEBTEDNESS OF DIRECTORS AND EXECUTIVE OFFICERS
As at July 30, 2010, there was no outstanding indebtedness of any director or officer to NeuLion or any of its subsidiaries.
EQUITY COMPENSATION PLANS
See “Securities Authorized for Issuance Under the Equity Compensation Plans” contained in NeuLion’s Information Circular dated April 30, 2010, which section is incorporated herein by reference, for more information with respect to the Corporation’s equity compensation plans.
MANAGEMENT CONTRACTS
No management functions of NeuLion or any of its subsidiaries are performed to any substantial degree by a person other than the directors or executive officers of NeuLion, or its subsidiaries.
ADDITIONAL INFORMATION RESPECTING TRANSVIDEO
TransVideo is a private company formed under the laws of the British Virgin Islands. The registered address of TransVideo is SHRM Trustees (BVI) Limited of Trinity Chambers, P.O. Box 4301, Road Town, Tortola, British Virgin Islands, its principal place of business is in Beijing with the address at 2nd Floor, Tower B, Bei Fa Plaza, No. 15, Xueyuan South Road, Haidian District, Beijing P.R. China 100088. Reference is made to Appendix “D” to this Circular “Information Concerning TransVideo” for a detailed description of TransVideo and its securities, business and assets.
QUORUM
The presence of two Shareholders, present in person or by proxy, entitled to cast votes holding or representing by proxy at least 10% of the Common Shares will constitute a quorum at the Meeting or any adjournment or postponement thereof. NeuLion’s list of Shareholders as of the Record Date has been used to deliver to Shareholders the Notice and this Circular as well as to determine who is eligible to vote.
RELIANCE
The information concerning TransVideo and JK&B contained in this Circular has been provided by AvantaLion and JK&B, respectively. Although NeuLion has no knowledge that would indicate that any of the information provided by AvantaLion and JK&B is untrue or incomplete, NeuLion does not assume any responsibility for the accuracy or completeness of such information or the failure of AvantaLion or JK&B to disclose events that may have occurred or may affect the completeness or accuracy of such information.
22
ADDITIONAL INFORMATION
NeuLion is a corporation incorporated and existing pursuant to the provisions of the CBCA.
NeuLion’s principal executive office is located at 1600 Old Country Road, Plainview, New York, 11803, United States, and its registered office is located at 463 King Street West, Third Floor, Toronto, Ontario, M5V 1K4, Canada.
Additional information relating to NeuLion, including the documents incorporated herein by reference, can be found on SEDAR at www.sedar.com and at the Securities and Exchange Commission’s website at www.sec.gov. Shareholders may obtain additional information, including copies of the documents incorporated herein by reference without charge, by contacting the Corporate Secretary of NeuLion, 463 King Street West, Third Floor, Toronto, Ontario M5V 1K4, Canada, telephone (416) 368-6464. Financial information of NeuLion is provided in Appendix “K” to this Circular.
23
APPROVAL OF BOARD OF DIRECTORS OF NEULION
The Board of Directors of NeuLion has approved the content and the delivery of this Circular to Shareholders.
| Toronto, Ontario | |
August 12, 2010 | |
| “Roy E. Reichbach” (signed) | |
| Roy E. Reichbach | |
| General Counsel, Corporate Secretary and Director |
24
TRANSVIDEO AUDITOR’S CONSENT
To: The Board of Directors and Stockholders of NeuLion, Inc.
CONSENT OF INDEPENDENT REGISTERED PUBLIC ACCOUNTING FIRM
We have issued our report dated April 25, 2010 with respect to the audited consolidated financial statements of TransVideo International Ltd. for the years ended December 31, 2009 and 2008, and the unaudited consolidated financial statements of TransVideo International Ltd. for the three months ended March 31, 2010 and 2009, which are included in the Information Circular prepared by NeuLion, Inc. dated August 12, 2010 (the “Circular”). We consent to the use of the aforementioned report in the Circular and to the use of our name in the Circular.
/s/ Samuel H. Wong & Co., LLP Certified Public Accountants | South San Francisco, California August 12, 2010 |
25
VALUATOR’S CONSENT
We refer to the valuation which we prepared for the special committee of the board of directors of NeuLion, Inc. (“NeuLion”), copies of which are attached to the management information circular of NeuLion dated August 12, 2010 (the “Circular”) relating to the proposed acquisition of TransVideo International Ltd. by NeuLion (the “Valuations”). We consent to the filing of the Valuations with all applicable United States and Canadian securities regulatory authorities and the inclusion of the Valuations in the Circular.
DATED: August 12, 2010
/s/ UHY Advisors FLVS, Inc.
26
APPENDIX “A”
TRANSVIDEO RESOLUTION
Capitalized terms herein have the meanings ascribed thereto in the management information circular of NeuLion, Inc. (the “Corporation”) dated August 12, 2010.
BE IT RESOLVED AS A RESOLUTION OF THE DISINTERESTED SHAREHOLDERS OF THE CORPORATION THAT:
| 1. | the acquisition by the Corporation of TransVideo International Ltd. (“TransVideo”) pursuant to the terms of the Share Exchange Agreement among the Corporation, AvantaLion LLC and the other shareholders of TransVideo listed therein (the “Share Exchange Agreement”) is hereby approved, ratified and confirmed; |
| 2. | the Corporation is authorized to perform its obligations under the Share Exchange Agreement, as amended, including but not limited to directly or indirectly acquiring all of the issued and outstanding shares of TransVideo, and to issue up to 22,000,802 Common Shares to the shareholders of TransVideo as consideration for the acquisition of TransVideo, all in accordance with the terms of the Share Exchange Agreement; |
| 3. | notwithstanding that this resolution has been duly passed, the board of directors of the Corporation may, without further notice to or approval of the holders of the Shareholders, subject to the terms of the Share Exchange Agreement, cause the Corporation to amend or terminate the Share Exchange Agreement or revoke this resolution at any time prior to the consummation of the acquisition of all of the issued and outstanding shares of TransVideo pursuant to the Share Exchange Agreement; and |
| 4. | any one director or officer of the Corporation is hereby authorized, for and on behalf of the Corporation, to execute and, if appropriate, deliver all other documents and instruments and do all other things as in the opinion of such director or officer may be necessary or advisable to implement this resolution and the matters authorized hereby, including to direct or cause the Corporation to take any such action, such determination to be conclusively evidenced by the execution and delivery of any such document or instrument, and the taking of any such action. |
A-1
APPENDIX “B”
ARTICLES OF AMENDMENT RESOLUTION
Capitalized terms herein have the meanings ascribed thereto in the management information circular of NeuLion, Inc. (the “Corporation”) dated August 12, 2010.
BE IT RESOLVED AS SPECIAL RESOLUTION OF THE SHAREHOLDERS OF THE CORPORATION THAT:
| 1. | the Corporation is hereby authorized to amend the articles of the Corporation to create the Class 3 Preference Shares having such share conditions described in Exhibit 1 hereto and make the corresponding changes to its form of Certificate of Incorporation approved in connection with the continuance of the Corporation under the laws of the State of Delaware authorized by the shareholders of the Corporation on May 13, 2009; |
| 2. | subject to paragraph 3 of this resolution, each of the directors and officers of the Corporation is hereby authorized and directed to do all things which s/he considers necessary or desirable to give full effect to this resolution and to execute all documents, including without limitation the execution and filing of the articles of amendment of the Corporation with such changes, additions and alterations to the Class 3 Preference Share conditions in Exhibit 1 hereto as s/he may approve and the approval of any such officer or director of any such changes, additions and alterations shall be conclusively evidenced by his or her execution of the said articles of amendment; and |
| 3. | the directors of the Corporation are authorized to revoke this special resolution before it is acted on, if they deem it appropriate to do so, without further notice to or approval of the Shareholders of the Corporation. |
B-1
Exhibit 1
| 1. | COMMON SHARE PROVISIONS |
The Corporation is authorized to issue an unlimited number of Common Shares. The rights, privileges, restrictions and conditions attaching to the Common Shares are as follows:
| A. | DIVIDENDS |
Dividends: The holders of the Common Shares will be entitled to receive dividends if, as and when declared by the board of directors out of the assets of the Corporation properly applicable to the payment of dividends in such amounts and payable in such manner as the board of directors may from time to time determine. Subject to the rights of the holders of Class 1 Preference Shares, Class 2 Preference Shares, Class 3 Preference Shares and any other class of shares of the Corporation entitled to receive dividends in priority to or concurrently with the holders of the Common Shares, the board of directors may in its sole discretion declare dividends on the Common Shares to the exclusion of any other class of shares of the Corporation.
| B. | LIQUIDATION |
Liquidation: In the event of the liquidation, dissolution or winding up of the Corporation or other distribution of assets of the Corporation among its shareholders for the purpose of winding up its affairs, the holders of the Common Shares will, subject to the rights of the holders of Class 1 Preference Shares, Class 2 Preference Shares, Class 3 Preference Shares and any other class of shares of the Corporation entitled to receive assets of the Corporation upon such a distribution in priority to or concurrently with the holders of the Common Shares, be entitled to participate in the distribution. Such distribution will be made in equal amounts per share on all the Common Shares at the time outstanding without preference or distinction.
| C. | VOTING |
Voting: The holders of the Common Shares will be entitled to receive notice of and to attend all annual and special meetings of the shareholders of the Corporation and to one vote in respect of each Common Share held at all such meetings.
| 2. | CLASS 1 PREFERENCE SHARE PROVISIONS |
The Corporation is authorized to issue an unlimited number of Class 1 Preference Shares. The rights, privileges, restrictions and conditions attaching to the Class 1 Preference Shares are as follows:
| A. | The Class 1 Preference Shares may at any time or from time to time be approved for issuance and be issued by the board of directors in one or more series. Prior to the issue of the shares of any such series, the board of directors shall, subject to the limitations set out below, fix the number of shares authorized in, and determine the designation, rights, privileges, restrictions and conditions attaching to the shares of, such series including, without limitation: |
B-2
| (i) | the rate, amount or method of calculation of dividends, if any, and whether the same are subject to adjustments; |
| (ii) | whether such dividends are cumulative, partly cumulative or non-cumulative; |
| (iii) | the dates, manner and currency of payments of dividends and the dates from which dividends accrue or become payable; |
| (iv) | if redeemable, retractable or purchasable, the redemption, retraction, or purchase prices and the terms and conditions of redemption, retraction or purchase, with or without provision for sinking or similar funds; |
| (v) | any conversion, exchange or reclassification rights; and |
| (vi) | any other rights, privileges, restrictions and conditions not inconsistent with these provisions; |
the whole being subject to the receipt by the Director under the Canada Business Corporations Act of articles of amendment designating and fixing the number of Class 1 Preference Shares in such series and setting forth the rights, privileges, restrictions and conditions attaching to such series of Class 1 Preference Shares and the issue by the Director of a certificate of amendment with respect to the articles of amendment so filed.
| B. | The Class 1 Preference Shares of each series shall, with respect to the payment of dividends and the distribution of assets in the event of the liquidation, dissolution or winding-up of the Corporation, whether voluntary or involuntary, or any other distribution of the assets of the Corporation among its shareholders for the purpose of winding-up its affairs, rank and be entitled to a preference over the Common Shares and the shares of any other class ranking junior to the Class 1 Preference Shares. |
| C. | The holders of Class 1 Preference Shares shall not, as such, have any pre-emptive right to subscribe for, purchase or receive any part of any issue of securities of the Corporation now or hereafter authorized. |
| 3. | CLASS 2 PREFERENCE SHARE PROVISIONS |
The Corporation is authorized to issue an unlimited number of Class 2 Preference Shares. The rights, privileges, restrictions and conditions attaching to the Class 2 Preference Shares are as follows:
B-3
| A. | The Class 2 Preference Shares may at any time or from time to time be approved for issuance and be issued by the board of directors in one or more series. Prior to the issue of the shares of any such series, the board of directors shall, subject to the limitations set out below, fix the number of shares authorized in, and determine the designation, rights, privileges, restrictions and conditions attaching to the shares of, such series including, without limitation: |
| (i) | the rate, amount or method of calculation of dividends, if any, and whether the same are subject to adjustments; |
| (ii) | whether such dividends are cumulative, partly cumulative or non cumulative; |
| (iii) | the dates, manner and currency of payments of dividends and the dates from which dividends accrue or become payable; |
| (iv) | if redeemable, retractable or purchasable, the redemption, retraction, or purchase prices and the terms and conditions of redemption, retraction or purchase, with or without provision for sinking or similar funds; |
| (v) | any conversion, exchange or reclassification rights; and |
| (vi) | any other rights, privileges, restrictions and conditions not inconsistent with these provisions; |
the whole being subject to the receipt by the Director under the Canada Business Corporations Act of articles of amendment designating and fixing the number of Class 2 Preference Shares in such series and setting forth the rights, privileges, restrictions and conditions attaching to such series of Class 2 Preference Shares and the issue by the Director of a certificate of amendment with respect to the articles of amendment so filed.
| B. | The Class 2 Preference Shares of each series shall, with respect to the payment of dividends and the distribution of assets in the event of the liquidation, dissolution or winding-up of the Corporation, whether voluntary or involuntary, or any other distribution of the assets of the Corporation among its shareholders for the purpose of winding-up its affairs, rank and be entitled to a preference over the Common Shares, the Class 1 Preference Shares, and the shares of any other class ranking junior to the Class 2 Preference Shares. |
| C. | The holders of Class 2 Preference Shares shall not, as such, have any pre-emptive right to subscribe for, purchase or receive any part of any issue of securities of the Corporation now or hereafter authorized. |
B-4
| 4. | CLASS 3 PREFERENCE SHARE PROVISIONS |
The Corporation is authorized to issue a maximum number of ● Class 3 Preference Shares.[The bullet will be replaced by the amount equal to: (the Bank of Canada noon exchange rate for the Canadian dollar against the U.S. dollar on the business day immediately preceding the closing date) x (USD$10,000,000) / (CDN$0.60)] The rights, privileges, restrictions and conditions attaching to the Class 3 Preference Shares are as follows:
| A. | DIVIDENDS |
| (i) | Cumulative Dividends: The holders of the Class 3 Preference Shares, in priority to the holders of Common Shares, Class 1 Preference Shares, Class 2 Preference Shares and all other shares ranking junior to the Class 3 Preference Shares, will be entitled to receive and the Corporation will pay thereon, as and when declared by the board of directors out of the assets of the Corporation properly applicable to the payment of dividends, fixed preferential cumulative dividends at the rate of 8% per annum on the Redemption Amount (as hereinafter defined) per share for a period of five years from the date of issuance. Dividends will be prorated for stub periods. |
| (ii) | Dividends Preferential: Except with the consent in writing of the holders of a majority of the Class 3 Preference Shares outstanding, no dividend will at any time be declared and paid on or set apart for payment on the Common Shares, Class 1 Preference Shares, Class 2 Preference Shares or on any other shares ranking junior to the Class 3 Preference Shares in any financial year unless and until the cumulative dividends stated in clause 4.A(i) on all the Class 3 Preference Shares outstanding have been declared and paid or set apart for payment. |
| (iii) | Equivalent Dividends on Common Shares: In addition to clause 4.A(i) holders of Class 3 Preference Shares will also be entitled to receive pari passu dividends paid to the holders of Common Shares if, as and when declared by the board of directors out of the assets of the Corporation properly applicable to the payment of dividends. A holder of a Class 3 Preference Share shall be entitled to receive a dividend on such share equal to the product of the Common Share Equivalent multiplied by the per share dividend declared on each Common Share. The term “Common Share Equivalent”, at any particular time, refers to that number of Common Share(s) which would be received by a holder of a Class 3 Preference Share upon a conversion at that time of such share(s) into Common Shares. |
B-5
| B. | LIQUIDATION, ETC. |
| (i) | Participation upon Liquidation, Dissolution or Winding Up: In the event of the liquidation, dissolution or winding up of the Corporation or other distribution of assets of the Corporation among its shareholders for the purpose of winding up its affairs (a “Liquidation Event”), the holders of the Class 3 Preference Shares will be entitled to receive from the assets of the Corporation a sum equivalent to the aggregate Redemption Amount (as hereinafter defined) of all Class 3 Preference Shares held by them respectively before any amount is paid or any assets of the Corporation are distributed to the holders of any Common Shares, Class 1 Preference Shares, Class 2 Preference Shares or shares of any other class ranking junior to the Class 3 Preference Shares. After payment to the holders of the Class 3 Preference Shares of the amount so payable to them as above provided such holders shall not be entitled to any further distribution from the Corporation. |
| C. | VOTING |
| (i) | The holders of the Class 3 Preference Shares will be entitled to receive notice of and to attend all annual and special meetings of the shareholders of the Corporation and to one vote in respect of each Common Share Equivalent (determined for each Class 3 Preference Share held by such holder) at all such meetings. |
| (ii) | Except for matters where holders of the Class 3 Preference Shares are by law required or permitted herein to vote as a class, holders of Class 3 Preference Shares shall vote together with the holders of Common Shares as a single class. |
| D. | RETRACTION |
| (i) | Majority Holder Redemption: Holders of the majority of the Class 3 Preference Shares will be entitled to require the Corporation to redeem, subject to the requirements of the Canada Business Corporations Act as now enacted or as the same may from time to time be amended, re-enacted or replaced, at any time all, but not less than all of the Class 3 Preference Shares held by all holders by tendering to the Corporation at its registered office the share certificates representing the Class 3 Preference Shares together with a request in writing (a “Majority Redemption Request”) specifying (i) that the holders desire to have all, but not less than all of the Class 3 Preference Shares represented by such certificates redeemed by t he Corporation, (ii) the business day (herein referred to as the “Redemption Date”) on which the holders desire to have the Corporation redeem such Class 3 Preference Shares, and (iii) written authorization from holders holding not less than 50.1% of the Class 3 Preference Shares then outstanding supporting the Majority Redemption Request or minutes from a duly convened meeting of the holders of the Class 3 Preference Shares at which a majority of such holders passed a resolution to support the Majority Redemption Request. The Redemption Date will be not less than 30 days (or such shorter period to which the Corporation may consent) after the day on which the Majority Redemption Request is given to the Corporation. Upon receipt of the share certificates representing all of the Class 3 Preference Shares being redeemed by a holder, the Corporation will on the Redemption Date redeem such Class 3 Preference Shares by paying to such holder the Redemption Amount (as hereinafter defined) for each such Class 3 Preference Share being redeemed. Such payment will be made by cheque or, with the consent of a majority of the holders, by any other means of immediately available funds. |
B-6
| (ii) | Constraints: Notwithstanding the foregoing: (a) a Majority Redemption Request may only be issued after [•] [Insert date of fifth anniversary following the date the Class 3 Preference Shares are issued] (the “Fifth Anniversary”) and (b) any payments to be made pursuant to this clause 4D shall be subject to clause 4J. |
| E. | REDEMPTION |
| (i) | Redemption by Corporation: The Corporation may, upon giving notice as hereinafter provided, redeem, subject to the requirements of the Canada Business Corporations Act at any time the whole or from time to time (subject to subsection (v) and the conversion provisions set forth in Section F below) any part of the then outstanding Class 3 Preference Shares from any one or more of the holders thereof as the board of directors may in its sole discretion determine on payment of CAD$0.60 for each share to be redeemed, plus all accrued and unpaid dividends thereon, the whole constituting and being herein referred to as the “Redemption Amount”. |
| (ii) | Idem: In the case of redemption of Class 3 Preference Shares under the provisions of clause 4E(i) hereof, the Corporation will at least 21 days (or, if a majority of the holders of the Class 3 Preference Shares to be redeemed consent, such shorter period to which they may consent) before the date specified for redemption mail (or, with the consent of any particular holder, otherwise deliver) a notice in writing of the intention of the Corporation to redeem such Class 3 Preference Shares to each person who at the record date for the determination of shareholders entitled to receive notice is a holder of Class 3 Preference Shares to be redeemed. Such notice will (subject to the consent of any particular holder referred to above) be mailed by letter, postage prepaid, addressed to each such holder at the holder’s address as it appears on the records of the Corporation or in the event of the address of any such holder not so appearing then to the last known address of such holder; provided, however, that accidental failure to give any such notice to one or more of such holders will not affect the validity of such redemption. Such notice will set out the Redemption Amount and the date on which redemption is to take place and if part only of the shares held by the person to whom it is addressed is to be redeemed the number thereof so to be redeemed. On or after the date so specified for |
B-7
| redemption, the Corporation will pay or cause to be paid to or to the order of the holders of the Class 3 Preference Shares to be redeemed the Redemption Amount thereof on presentation and surrender at the registered office of the Corporation or any other place designated in such notice of the certificates representing the Class 3 Preference Shares called for redemption. Such payment will be made by cheque or, with the consent of any particular holder, by any other means of immediately available funds. If a part only of the shares represented by any certificate are redeemed a new certificate for the balance will be issued at the expense of the Corporation. From and after the date specified for redemption in any such notice the holders of the Class 3 Preference Shares called for redemption will cease to be entitled to dividends and will not be entitled to exercise any of the right s of holders of Class 3 Preference Shares in respect thereof unless payment of the Redemption Amount is not made upon presentation of certificates in accordance with the foregoing provisions, in which case the rights of the holders of the said Class 3 Preference Shares will remain unaffected. The Corporation will have the right at any time after the mailing (or delivery, as the case may be) of notice of its intention to redeem any Class 3 Preference Shares to deposit the Redemption Amount of the shares so called for redemption or of such of the said shares represented by certificates as have not at the date of such deposit been surrendered by the holders thereof in connection with such redemption to a special account in any chartered bank or in any trust company in Canada or in the United States, named in such notice, to be paid without interest to or to the order of the respective holders of such Class 3 Preference Shares called for redemption upon presentation and surrender to such bank or trust company of the certificates representing the same, and upon such deposit being made or upon the date specified for redemption in such notice, whichever is the later, the Class 3 Preference Shares in respect whereof such deposit has been made will be redeemed and the rights of the holders thereof after such deposit or such redemption date, as the case may be, will be limited to receiving without interest their proportionate part of the total Redemption Amount so deposited against presentation and surrender of the said certificates held by them respectively and any interest allowed on such deposit will belong to the Corporation. |
| (iii) | Change of Control Redemption: In the event of a Change of Control (as hereinafter defined), then subject to the conversion provisions set forth in Section F below, the Corporation shall forthwith redeem at any time the whole of the then outstanding Class 3 Preference Shares from the holders thereof on payment of the Redemption Amount in respect of each such share. |
| (iv) | For the purposes of these Articles, a “Change of Control” means any one of: |
B-8
| a) | the consummation of a merger, amalgamation, plan of arrangement or other transaction or series of related transactions resulting in the combination of the Corporation with or into another entity, where the shareholders of the Corporation immediately prior to any such transaction(s) directly or indirectly do not continue to hold more than a 50% voting interest in the continuing or surviving entity immediately following such transaction or series of related transactions and no shareholder who held less than a 50% voting interest in the Corporation before such event holds directly or indirectly more than a 50% voting interest in the continuing or surviving entity immediately following such event, |
| b) | a sale or transfer of all or substantially all of the Corporation’s assets (other than a sale or transfer to a wholly-owned subsidiary of the Corporation), or |
| c) | an exclusive license of all or substantially all of the Corporation’s intellectual property (other than a license to a wholly-owned subsidiary of the Corporation); |
provided, in each case, that the transaction is entered into at arm’s length with all shareholders of the Corporation and provided, however, that a transaction will not constitute a Change of Control if:
| i) | its sole purpose is to change the jurisdiction of the Corporation’s incorporation; or |
| ii) | it will create a holding company that will be owned in substantially the same proportions by the persons who held the Corporation’s securities immediately prior to such transaction; |
| iii) | the principal purpose of the transaction is a bona fide equity financing transaction and no one Person will hold a majority of the Corporation’s shares after completion of the transaction; or |
| iv) | a majority of the holders of the Class 3 Preference Shares and a majority of each other class of shares of the Corporation (determined separately on a class by class basis) determine that such event should not be treated as a Change of Control for the purposes of this provision. |
| (v) | Constraints: Notwithstanding the foregoing: (x) the Corporation may only give notice to redeem Class 3 Preference Shares in accordance with clause 4E(ii) after the Fifth Anniversary and (y) any payments to be made pursuant to this clause 4E shall be subject to clause 4J. |
B-9
| F. | CONVERSION |
| (i) | Conversion Privilege: Each issued Class 3 Preference Share may at any time (including after a notice of redemption is received but prior to the redemption date) be converted, at the option of the holder, into one Common Share (subject to variation in accordance with clause 4G(i), the “Conversion Ratio”). The conversion privilege herein provided for may be exercised by notice in writing given to the Corporation accompanied by a certificate or certificates representing the Class 3 Preference Shares in respect of which the holder thereof desires to exercise such right of conversion and such notice will be signed by the holder of the Class 3 Preference Shares in respect of which such right is being exercised and will specify the number of Class 3 Preference Shares which th e holder desires to have converted. Upon receipt of such notice the Corporation will issue certificates representing fully paid Common Shares upon the basis above prescribed and in accordance with the provisions hereof to the holder of the Class 3 Preference Shares represented by the certificate or certificates accompanying such notice. In the event of conversion, all accrued but unpaid dividends on the Class 3 Preference Shares shall be paid in cash or as otherwise permitted by applicable law and shall not increase the Common Shares issuable upon such conversion. |
| (ii) | Idem: All Common Shares resulting from any conversion of Class 3 Preference Shares into Common Shares pursuant to clause 4.F(i) hereof will be deemed to be fully paid and non-assessable. |
| (iii) | Automatic Conversion: In the event of a Liquidation Event all of the issued and outstanding Class 3 Preference Shares shall automatically be converted into Common Shares at the Conversion Ratio where it is determined by the Corporation that the holder of a Class 3 Preference Share would receive greater consideration (based on the cash and or fair market value of publicly traded securities to be received) from the Corporation if such holder held the Common Share Equivalent in lieu of such Class 3 Preference Shares. The Corporation shall, where this clause is operative, take such steps as may be required or are desirable to effect the conversion of the issued and outstanding Class 3 Preference Shares into Common Shares. |
| (iv) | Majority Conversion: Holders of a majority of the Class 3 Preference Shares will be entitled to require the holders of all Class 3 Preference Shares to convert their shares into Common Shares (at the Conversion Ratio) on a specified conversion date, by giving notice (“Mandatory Conversion Notice”) to the Corporation. Upon receipt of a Mandatory Conversion Notice the Corporation shall take such steps as may be required or are desirable (including filing articles of amendment) to convert the issued and outstanding Class 3 Preference Shares into Common Shares. Any Mandatory Conversion Notice delivered to the Corporation shall be accompanied by written authorization from holders holding not less than 50.1% of the Class 3 Preference Shares then outstanding suppor ting the Mandatory Conversion Notice or minutes from a duly convened meeting of the holders of the Class 3 Preference Shares at which a majority of such holders passed a resolution to support the Mandatory Conversion Notice. |
B-10
| G. | ANTIDILUTION |
| (i) | If the Common Shares are subdivided, consolidated or if a stock dividend is paid or if such Common Shares are otherwise varied pursuant to a share capital reorganization, an equivalent change, as the board of directors may in its sole discretion determine, will be made to the Conversion Ratio or otherwise to the Class 3 Preference Shares or if a stock dividend is paid or if such Common Shares are otherwise varied pursuant to a share capital reorganization. |
| H. | SPECIAL PROTECTION |
| (i) | Protective Provisions: Subject to applicable law, the approval of holders of 66⅔% of the Class 3 Preference Shares (voting alone) shall be required to: |
| a) | change the rights or terms of the Class 3 Preference Shares or increase the authorized number thereof; or |
| b) | authorize, create or issue any security either preferential to or on parity with the Class 3 Preference Shares, including any Class 1 or Class 2 Preference Shares. |
| (ii) | Declaration of Dividends: The consent of holders of a majority of the Class 3 Preference Shares shall be required to pay any dividend to or redeem any preference shares (other than the Class 3 Preference Shares) or Common Shares (other than the payment of dividends on the Class 3 Preference Shares as contemplated above and other than purchases of Common Shares from employees or other service providers upon termination of service). |
| I. | PRE-EMPTIVE RIGHTS |
| (i) | Subject to applicable laws and the requirements of any stock exchange on which the Corporation’s securities may be listed and posted for trading, if any additional Common Shares are to be issued by the Corporation, the Corporation will first offer (the “Offer”) such Common Shares to each of the holders of the Class 3 Preference Shares (individually, an “Investor” and collectively, the “Investors”) by providing such Investor with notice, sent to the last address of the Investor shown on the books and records of the Corporation, of the Corporation’s intention to issue additional Common Shares and the number and class thereof to be so issued, the purchase price for each Common Share and the date of issuance (to the extent such facts are known by the Corporat ion). |
B-11
| (ii) | Each Investor will have the right to purchase that proportion of the Common Shares so offered that is equal to the proportion of Class 3 Preference Shares owned beneficially or of record by the Investor to the aggregate issued Common Shares, Class 1 Preference Shares and Class 2 Preference Shares then outstanding at the date notice is given of such Offer. Such right will be exercisable by the Investor by giving notice to the Corporation within five days of receipt of the notice from the Corporation. |
| (iii) | In the event the Investor accepts the Offer, the Investor will take up and pay for all or any of the Common Shares to which the Investor is entitled on the closing of the transaction. |
| (iv) | The rights of the Investors in this clause 4I will not apply to issuances of: |
| a) | Common Shares issued or issuable: |
| i) | upon the conversion of Convertible Securities (as defined below); |
| ii) | upon the exercise of options granted pursuant to any stock option plan or other equity incentive plan, in either case approved by the board of directors; |
| iii) | in conjunction with arm’s length debt financing (including, without limitation, commercial credit arrangements or equipment financing), acquisitions, joint ventures or strategic investments of the Corporation and its subsidiaries; |
| iv) | as a dividend or distribution on any class of securities of the Corporation; or |
| b) | any Common Shares or Convertible Securities issued pursuant to a bona fide arm’s length business acquisition by the Corporation, whether by merger, consolidation, purchase of assets, the sale or exchange of shares or otherwise. |
| (v) | For the purposes of this clause 4I, “Convertible Securities” means any evidences of indebtedness, shares or other securities convertible into or exchangeable for Common Shares. |
B-12
| J. | TAXES |
| (i) | Withholding Tax: Notwithstanding any other provision of these Articles, the Corporation shall be entitled to deduct and withhold (and/or recover) from any amounts payable to holders of shares of the Corporation the amount of all Taxes which the Corporation may be required or permitted to deduct and withhold in accordance with applicable law. All such withheld amounts shall be timely remitted to the relevant governmental authority and all such remitted amounts shall be treated as having been paid to the relevant holder. For purposes hereof “Tax” means any local, domestic or foreign tax of any kind or nature whatsoever, any levy, impost, duty or other charge of a similar nature, and includes any sales tax, value-added tax, goods and services tax, transfer tax or withholding tax (including any penalty, interest, or addition to tax). |
| (ii) | Shareholder Certification: Each holder of shares of the Corporation shall provide such tax representations, information, or other documentation to the Corporation which may reasonably be considered by the Corporation to be required or advantageous in the context of the payment of a dividend, a transaction deemed to be a dividend for tax purposes, the conversion of any shares or in the event of a Liquidation Event. |
| (iii) | Preferred Share Tax: Notwithstanding any other provision of these Articles: |
| a. | The amount of any dividend otherwise payable (“Dividend Entitlement”) on the Class 3 Preference Shares shall be reduced to ensure that the sum of the dividend paid on such shares together with any Part VI.1 Tax (as defined below) imposed on the Corporation in respect of the dividend does not exceed the Dividend Entitlement. |
| b. | The Corporation shall be entitled to reduce the amount otherwise payable (“Repurchase Entitlement”) to a holder of Class 3 Preference Shares on a redemption, retraction, or repurchase of such shares by the amount that ensures that the sum of the amount paid by the Corporation to the holder in such a transaction together with any Part VI.1 Tax (as defined below) imposed on the Corporation in respect of the redemption, retraction, or repurchase transaction does not exceed the Repurchase Entitlement. |
| c. | The term “Part VI.1 Tax” refers to the Part VI.1 tax imposed on the Corporation in respect of a dividend or a deemed dividend pursuant to the Income Tax Act (Canada) (“Tax Act”). The applicable Part VI.1. tax shall be calculated by the Corporation, acting reasonably, and by: (I) applying the maximum “dividend allowance” (within the meaning of subsection 191.1(2) of the Tax Act) to which the Corporation is entitled; and (II) net of the maximum credit for such tax to which the Corporation is entitled pursuant to the mechanism in paragraph 110(1)(k) of the Tax Act. |
B-13
| d. | The maximum dividend allowance in paragraph C(I) shall be calculated on the basis that (I) the Corporation is not associated (within the meaning of the Tax Act) with any other corporation; and (II) no dividends or deemed dividends have been paid by the Corporation on any other class of shares of the Corporation. |
| e. | The Part VI.1 tax will be allocated, for purposes of this Section J(iii), to the holders of Class 3 Preference Shares pro rata for each fiscal year of the Corporation. A holder's pro rata share is determined by dividing the total amount of dividends (including deemed dividends) the holder of Class 3 Preference Shares was entitled to receive in respect of those shares in the applicable fiscal year of the Corporation but for this Section J(iii), by the total amount of dividends (including deemed dividends) all holders of Class 3 Preference Shares were entitled to receive in respect of those shares in that fiscal year but for this Section J(iii). |
| f. | Notwithstanding any other provision of these share conditions, the amount by which any payment to a holder of Class 3 Preference Shares is reduced pursuant to this Section J(iii) will not be considered part of the amount paid or payable to such holder on account of a dividend on such shares or proceeds in respect of the redemption, retraction or repurchase of such shares, as applicable, and the amount of the dividend or proceeds, as the case may be, will be the reduced amount calculated in accordance with this section. |
| g. | At least 10 business days prior to any payment being made by the Corporation that would involve a reduction in accordance with this Section J(iii), the Corporation will provide to each affected holder of Class 3 Preference Shares (at its address shown on the books of the Corporation) its calculation of any payments to be made to the holders of Class 3 Preference Shares and a detailed calculation of the Part VI.1 tax. Affected holders shall be entitled to discuss the calculation of the adjustments pursuant to this Section J(iii) with the Corporation. |
B-14
APPENDIX “C”
PRIVATE PLACEMENT RESOLUTION
Capitalized terms herein have the meanings ascribed thereto in the management information circular of NeuLion, Inc. (the “Corporation”) dated August 12, 2010.
BE IT RESOLVED AS RESOLUTION OF THE DISINTERESTED SHAREHOLDERS OF THE CORPORATION THAT:
| 1. | the Corporation is authorized to perform its obligations under each Subscription Agreement, including but not limited to issuing US$10 million worth of Class 3 Preference Shares of the Corporation to JK&B Capital V, L.P., JK&B Capital V Special Opportunities Fund, L.P. and Gabriel A. Battista, at a subscription price of CAD$0.60 per share, all in accordance with the terms of the Subscription Agreements; |
| 2. | notwithstanding that this resolution has been duly passed, the board of directors of the Corporation may, without further notice to or approval of the Shareholders, subject to the terms of the Subscription Agreement, cause the Corporation to amend or terminate the Subscription Agreements or revoke this resolution at any time prior to the issuance of the Class 3 Preference Shares pursuant to the Subscription Agreements; and |
| 3. | any one director or officer of the Corporation is hereby authorized, for and on behalf of the Corporation, to execute and, if appropriate, deliver all other documents and instruments and do all other things as in the opinion of such director or officer may be necessary or advisable to implement this resolution and the matters authorized hereby, including to direct or cause the Corporation to take any such action, such determination to be conclusively evidenced by the execution and delivery of any such document or instrument, and the taking of any such action. |
C-1
APPENDIX “D”
INFORMATION CONCERNING TRANSVIDEO
Capitalized terms herein have the meanings ascribed thereto in the management information circular of NeuLion, Inc., of which this Appendix “D” forms a part.
Summary Description of the Business
TransVideo operates its business through its wholly-owned subsidiary, TransVideo Digital, a corporation organized pursuant to the laws of the People’s Republic of China (“PRC” or “China”). TransVideo is a leading Internet protocal televison (“IPTV”) company technology and solution provider headquartered in the ZhongGuanCun Hi-Tech District of Beijing, China. When TransVideo was established in 2004, its management team hired scientists from Chinese universities that developed technology to service the end-to-end IPTV market. In 2005, a year after its incorporation, the first version of the IPTV transmission was released, and as TransVideo’s business partner, KyLinTV's IPTV services were launched in USA and Canada based upon the TransVideo’s IPTV system with NeuLion being the platform delivery partner. Since 2005 TransVideo has continued to develop and enhance its cutting edge IPTV technology and solutions for end-to-end IPTV service providers in the market space around the world. Through its business partner relationship with NeuLion and KyLinTV, TransVideo has delivered IPTV, set top boxes (“STB”) and Transcoders and its IPTV system solutions to dozens of ethnic IPTV operators, including delivery of more than 200,000 STBs. During 2008, TransVideo launched a new IPTV end to end solution for the domestic market and has won critical project in the Chinese domestic market by working with provincial government agency and local SARFT bureau in the country. During 20 09 and 2010, TransVideo has released newer versions of its HD STB products and the new transcoding solutions and products and has won critical project as sole CODEC solution supplier for CCTV.com’s newly launched China Network TV (CNTV) site and the H.264 signal processing and delivery project CCTV’s Vancouver Winter Olympics project in 2010. TransVideo will continue to develop its business presence in China through working closely with its anchor business partner and customers and tap into the business opportunity in the vast market for IPTV product and services.
Products and Services
TransVideo provides its business partners with the following equipment and technology:
| § | Transcoding Devices: Transcoding Devices are high quality head-end products for view networks which are used in public internet or broadband network operations and provide key components for IP video applications. |
| § | Time Shift Systems: Time Shift Systems are online processing systems which enable customers to have control over channels’ time-shift and play back. This means that customers can have control over live television. |
| § | Set Top Boxes: TransVideo offers two different set top boxes, including the i-Box 2000 and the i-Box 3000. |
| § | TV Center Rich-Media Services Platform: This is an efficient management services platform for multimedia services, providing a more flexible and dynamic service operation management capabilities for operators of IPTV networks. |
| § | Studio Content Production and Management: This is a network program production and audit/video information publication application system. The major functions include contract management, program management, program release and system management. |
TransVideo also offers its customers several services including:
| § | Cast Live TV Solution: This service is typically applied to TV broadcast platforms for broadband customers. The service offers a multi-channel broadcast with the look and feel of a typical television viewing experience. |
| § | Video On-Demand: This service allows a viewer to watch any content, at any time and as many times as they would like. |
| § | Push Network Pushing Solution: This service is designed to address the needs of enterprises that wish to broadcast internal content such as company news. This systems ensures the timely broadcast of information for public areas. |
| § | Download Home Media Center: This service utilizes the TV Center Rich-Media Services Platform and the Studio Content Production and Management products described above to download audio/video content, photo sharing, voice over internet protocol and the sharing of audio/video messages between family members. |
D-1
Business Areas
TransVideo currently operates through two business areas: international and domestic.
International Business
TransVideo’s international business area is focused on providing end-to-end IPTV companies with Set Top Boxes and Transcoders, which are both used by IPTV companies to stream content to consumers. As of the date of this Circular, TransVideo has sold its products to two main partners in the international market: NeuLion, Inc. (“NeuLion”), an IPTV service and technology provider that builds and manages private broadcasting networks for companies interested in reaching specific target audiences, and KyLinTV, a service provider of live television broadcasting and on-demand movies from mainland PRC, Hong Kong and Taiwan. Mr. Charles B. Wang, a majority shareholder of AvantaLion, TransVideo’s majority shareholder, is the Chairman of the boa rd of directors of NeuLion and owns directly or indirectly 10.5% of NeuLion’s outstanding common stock. Ms. Nancy Li, Mr. Wang’s wife, is the chief executive officer of NeuLion.
Domestic Business
TransVideo’s domestic business area consists of four sources:
| § | Beijing iMedia Technology Co. Ltd. (a wholly-owned subsidiary of China iMedia Enterprise Ltd., in which TransVideo holds a 66% equity interest), an entity which is focused on providing educational content to the domestic Chinese market through the iBaby brand name; |
| § | Sales of Set Top Boxes; |
| § | Sales of Transcoder technology; and |
| § | Site Licenses. |
Corporate Structure
TransVideo is a private company formed under the laws of the British Virgin Islands with its principal place of business at 2nd Floor, Tower B, Bei Fa Plaza, No. 15, Xueyuan South Road, Haidian District, Beijing P.R. China 100088. The registered office of TransVideo is located at the offices of SHRM Trustees (BVI) Limited of Trinity Chambers, P.O. Box 4301, Road Town, Tortola, British Virgin Islands.
TransVideo has a 66% equity interest in China iMedia Enterprise Ltd., which operates its business through its wholly-owned subsidiary, Beijing iMedia Technology Co., Ltd. In addition, TransVideo intends to invest in a new joint venture called China Sports Media Technology. According to the current understanding between each of the parties to this joint venture, TransVideo will ultimately have a 10% equity interest in China Sports Media Technology, although there is no assurance that such investment will actually occur or occur on these terms.
The chart below illustrates the corporate structure of TransVideo as of the date of this Circular.

For additional information regarding each of the entities discussed above, see “Summary Description of the Business—Business Areas.”
Dividends or Distributions
TransVideo has neither declared nor paid any dividends on its common stock, and TransVideo does not currently anticipate paying any dividends. There are no restrictions in TransVideo’s constating documents that would restrict or prevent TransVideo from paying dividends.
D-2
Summary Consolidated Financial Information and Financial Statements
The following table sets forth certain selected consolidated financial information for TransVideo for the years ended December 31, 2009 and 2008, and for the three-month periods ended March 31, 2010 and 2009. This table should be read in conjunction with the TransVideo financial statements, including the notes thereto, attached as Schedules 1 and 2 to, and forming a part of, this Circular.
| Three months ended March 31, | Year ended December 31, | ||||||||||||||
| Income Statement Data | 2010 | 2009 | 2009 | 2008 | |||||||||||
| Revenue | 409,205 | 1,150,389 | $ | 2,274,779 | $ | 9,062,627 | |||||||||
| Cost of Revenue | (308,832 | ) | (406,036 | ) | (1,184,435 | ) | (6,160,579 | ) | |||||||
| Other Operating Expenses | (437,677 | (570,912 | ) | (1,994,161 | ) | (2,398,583 | ) | ||||||||
| Operating Income (Loss) | (337,304 | ) | 173,441 | (903,817 | ) | 503,465 | |||||||||
| Other Income (Expense) | (606,751 | ) | 37,905 | 75,062 | 22,226 | ||||||||||
| Earnings (Loss) Before Taxes | (944,055 | ) | 211,346 | (828,755 | ) | 525,691 | |||||||||
| Provision For Income Taxes | - | - | -0- | (1,477 | ) | ||||||||||
| Net Income (Loss) | (944,055 | ) | 211,346 | (828,755 | ) | 524,214 | |||||||||
| Balance Sheet Data | |||||||||||||||
| Total assets | 5,104,981 | - | 6,071,510 | 6,993,493 | |||||||||||
| Total liabilities | 1,063,636 | - | 1,109,119 | 1,238,590 | |||||||||||
Management’s Discussion and Analysis
The following Management’s Discussion and Analysis (MD&A) includes financial information from, and should be read in conjunction with, TransVideo’s audited consolidated financial statements, including the notes thereto, for the years ended December 31, 2009 and 2008, attached as Schedule 1, and TransVideo’s unaudited consolidated financial statements, included the notes thereto, for the three months ended March 31, 2010 and 2009, attached as Schedule 2 forming a part of, this Information Circular and the disclosure contained throughout this Information Circular.
Cautions Regarding Forward-Looking Statements
This Management’s Discussion and Analysis contains certain forward-looking statements, which reflect management’s expectations regarding TransVideo’s growth, results of operations, performance and business prospects and opportunities.
Statements about TransVideo’s future plans and intentions, results, levels of activity, performance, goals or achievements or other future events constitute forward-looking statements. Wherever possible, words such as “may,” “will,” “should,” “could,” “expect,” “plan,” “intend,” “anticipate,” “believe,” “estimate,” “predict,” or “potential” or the negative or other variations of these words, or similar words or phrases, have been used to identify these forward-looking statements. These statements reflect management’s current beliefs and are based on information currently available to management as at the date hereof.
Forward-looking statements involve significant risk, uncertainties and assumptions. Many factors could cause actual results, performance or achievements to differ materially from the results discussed or implied in the forward-looking statements. These factors should be considered carefully and readers should not place undue reliance on the forward-looking statements. Although the forward-looking statements contained in this Management’s Discussion and Analysis are based upon what management believes to be reasonable assumptions, TransVideo cannot assure readers that actual results will be consistent with these forward-looking statements. These forward-looking statements are made as of the date of this Management’s Discussion and Analysis, and the TransVideo assumes n o obligation to update or revise them to reflect new events or circumstances, except as required by law. Many factors could cause the actual results, performance or achievements of TransVideo to be materially different from any future results, performance or achievements that may be expressed or implied by such forward-looking statements, including: general economic and market segment conditions; competitor activity; product performance; capability and acceptance; international risk and currency exchange rates; and technology changes. More detailed assessment of the risks that could cause actual results to materially differ from current expectations is contained herein and in the “Risk Factors.”
Recent Development
Sale of Operating Interests
On May 19, 2010, TransVideo reached an agreement in principle to sell the operating interests of TransVideo, in exchange for 22,000,802 common shares of NeuLion. TransVideo shareholders will own approximately 15% of NeuLion on a fully diluted basis, upon the consummation of the transaction. TransVideo's passive investment in KyLinTV, will not be transferred as part of the transaction.
The closing of the transaction remains subject to the negotiation and execution of a definitive agreement and regulatory and Shareholder approvals, which are anticipated to occur during summer 2010.
D-3
Overview
TransVideo operates its business through its wholly-owned subsidiary, Beijing TransVideo. TransVideo is a leading public IPTV technology and solution provider with its principal place of business in the ZhongGuanCun Hi-Tech district of China. When TransVideo was established in 2004, its management team hired scientists from Chinese universities that developed technology to service the end-to-end IPTV market. In 2005, a year after its incorporation, the first version of the IPTV transmission was released, and TransVideo’s services were launched in Canada, Europe, Japan, Korea, the Middle East and Australia. Since 2005 TransVideo has continued to develop cutting edge IPTV technology and solutions for end-to-end IPTV service providers around the world.
TransVideo currently operates in two business areas:
| · | International Business. TransVideo’s international business is focused on providing end-to-end IPTV companies with Set Top Boxes and Transcoders, which are both used by IPTV companies to stream content to consumers. As of the date of this Information Circular, TransVideo has sold its products to two main partners in the international market: NeuLion Inc., or NeuLion, an IPTV service and technology provider that builds and manages private broadcasting networks for companies interested in reaching specific target audiences, and KyLinTV, Inc., a provider of live television broadcasting and on-demand movies from the PRC. |
| · | Domestic Business. TransVideo’s domestic business consists of five sources: (i) China Sports Media Company (a future joint venture with China State General Administration of Sports in which TransVideo will have a 10% equity interest), an entity which will aggregate sports content from various associations in the PRC and will deliver to Chinese customers through the “New Sports Media” IPTV platform; (ii) Beijing iMedia Technology Co. Ltd. (a wholly-owned subsidiary of China IMedia Enterprise Ltd., an entity in which TransVideo holds a 66% equity interest), an entity which is focused on providing educational content to the domestic Chinese market through the iBaby brand name; (iii) Sales of Set Top Boxes; (iv) Sales of Transcoder technology; and (v) Site Licenses. |
Products and Services
TransVideo provides its business partners with the following equipment and technology:
| § | Transcoding Devices: Transcoding Devices are high quality head-end products for view networks which are used in public internet or broadband network operations and provide key components for IP video applications. |
| § | Time Shift Systems: Time Shift Systems are online processing systems which enable customers to have control over channels’ time-shift and play back. This means that customers can have control over live television. |
| § | Set Top Boxes: TransVideo offers two different Set Top Boxes, including the i-Box 2000 and the i-Box 3000. |
| § | TV Center Rich-Media Services Platform: This is an efficient management services platform for multimedia services, providing a more flexible and dynamic service operation management capabilities for operators of IPTV networks. |
| § | Studio Content Production and Management: This is a network program production and audit/video information publication application system. The major functions include contract management, program management, program release and system management. |
TransVideo also offers its customers several services including:
D-4
| § | Cast Live TV Solution: This service is typically applied to TV broadcast platforms for broadband customers. The service offers a multi-channel broadcast with the look and feel of a typical television viewing experience. |
| § | Video On-Demand: This service allows a viewer to watch any content, at any time and as many times as they would like. |
| § | Push Network Pushing Solution: This service is designed to address the needs of enterprises that wish to broadcast internal content such as company news. This systems ensures the timely broadcast of information for public areas. |
| § | Download Home Media Center: This service utilizes the TV Center Rich-Media Services Platform and the Studio Content Production and Management products described above to download audio/video content, photo sharing, voice over internet protocol and the sharing of audio/video messages between family members. |
Operations
Revenue
TransVideo earns revenue from 3 areas:
| (i) | Retailed packaged goods, which are recognized when products are shipped; |
| (ii) | License fees, which are recognized over the life of the contract; and |
| (iii) | Maintenance fees, which are recognized as the service is performed. |
Operating Expenses
| (i) | Cost of Revenues |
Cost of revenue includes manufacturing and distribution costs sold and programs licensed, operating costs related to product support service centers and product distribution centers, costs incurred to support and maintain Source Code IPTV products and services, inventory valuation adjustments, and the amortization of capitalized research and development costs associated with software products that have reached technological feasibility. Capitalized research and development costs are amortized over the estimated lives of the products.
| (ii) | Research and Development |
Research and development expenses include payroll, employee benefits and other headcount-related expenses associated with product development. Research and development costs also include third-party development and programming costs, localization costs incurred to translate software for international markets, the amortization of purchased software code and services content, and in-process research and development. Such costs related to software development are included in research and development expense until the point of technological feasibility is reached, which for software products, is generally shortly before the products are released to manufacturing. Once technological feasibility is reached, such costs are capitalized and amortized to cost of revenue over the estimated lives of the products.
| (iii) | Sales and Marketing |
Sales and marketing expenses include payroll, employee benefits and other headcount-related expenses associated with sales and marketing personnel, and the costs of advertising, promotions, tradeshows, seminars and other programs. Advertising costs are expenses as incurred. TransVideo did not incur any advertising expenses in fiscal years 2009 and 2008.
D-5
| (iv) | General and Administrative |
General and administrative expenses are comprised of executive compensation, general overhead such as finance department and administrative staff, depreciation expenses, travel and lodging, meals and entertainment, utilities, and research and development expenses.
Other Income
Other income primarily represents interest income earned on bank account balances held with various financial institutions.
Selected Annual Information
The selected consolidated annual information set out below for the years ended December 31, 2009 and 2008 and as at December 31, 2009 and 2008 has been derived from TransVideo’s audited consolidated financial statements and accompanying notes. Readers should read the following information in conjunction with those statements and related notes.
Consolidated Statement of Operations Data:
| 2009 | 2008 | ||
| $ | $ | ||
| Revenue | 2,274,779 | 9,062,627 | |
| Cost of revenue | (1,184,435) | (6,160,579) | |
| Other operating expenses | (1,994,161) | (2,398,583) | |
| Operating income (loss) | (903,817) | 503,465 | |
| Net income (loss) | (828,755) | 524,214 | |
| Basic and diluted loss per share | (0.24) | 0.21 | |
Consolidated Balance Sheet Data:
| 2009 | 2008 | ||
| $ | $ | ||
| Cash | 1,521,168 | 4,284,829 | |
| Inventory | 634,492 | 897,800 | |
| Total assets | 6,071,510 | 6,993,493 | |
| Total liabilities | 1,109,119 | 1,238,590 | |
| Total shareholders’ equity | 4,962,391 | 5,754,903 | |
The impact of the financial crisis led to a decrease in revenue in fiscal 2009 as compared to fiscal 2008, as customers reduced their inventory and dramatically slowed or reduced their purchases of STB products from TransVideo. This in turn forced TransVideo to decrease expenses in all other areas of the business.
Additionally, a customer of TransVideo, KylinTV established a WOFE in Beijing to fund its operation in China whereas in fiscal 2008, KylinTV paid Transvideo service revenue to outsource its operation in China to Beijing TransVideo.
D-6
Results of Operations
Comparison of Fiscal Year Ended December 31, 2009 to Fiscal Year Ended December 31, 2008
| 2009 | 2008 | Change | ||||||||||
| $ | $ | % | ||||||||||
| Revenue | 2,274,779 | 9,062,627 | (75%) | |||||||||
| Operating Expenses | ||||||||||||
| Cost of revenue | 1,184,435 | 6,160,579 | (81%) | |||||||||
| Research and development | 635,316 | 431,894 | 47% | |||||||||
| Sales and marketing | 284,531 | 316,079 | (10%) | |||||||||
| General and administrative | 1,074,314 | 1,650,610 | (35%) | |||||||||
| 3,178,596 | 8,559,162 | (63%) | ||||||||||
| Operating income (loss) | (903,817 | ) | 503,465 | - | ||||||||
| Other income | 75,062 | 22,226 | 238% | |||||||||
| Earnings (loss) before income taxes | (828,755 | ) | 525,691 | - | ||||||||
| Provision for income taxes | - | (1,477 | ) | - | ||||||||
| Net income (loss) | (828,755 | ) | 524,214 | - | ||||||||
Revenue
Revenue decreased from $9.1 million for the year ended December 31, 2008 to $2.3 million for the year ended December 31, 2009. The decrease was due to the impact of the financial crisis as customers reduced their inventory and dramatically slowed or reduced their purchases of STB products from TransVideo. The other factor that contributed to the decrease was that in January 2009, KylinTV established a WOFE in Beijing to fund its operation in China whereas in fiscal 2008, KylinTV paid Transvideo service revenue to outsource its operation in China to Beijing TransVideo.
Costs and Expenses
| (i) | Cost of Revenue |
Cost of revenue decreased from $6.2 million or 68% of revenue for the year ended December 31, 2008 to $1.2 million or 52% of revenue for the year ended December 31, 2009. The decrease of $5.0 million was due to the decrease in revenue. The improvement of 16% as a percentage of revenue was due to the fact that outsourcing KylinTV’s China operation had a much lower margin rate than the rest of the business. Once this line of business ceased in January 2009, margins improved.
| (ii) | Research and Development |
Research and development increased from $0.4 million for the year ended December 31, 2008 to $0.6 million for the year ended December 31, 2009. The increase of $0.2 million was due to more research and development efforts invested by TransVideo into the new version of the STBs as well as the new IPTV head-end system and platforms to support high definition and other new standards.
| (iii) | Sales and Marketing |
Sales and marketing was $0.3 million for the years ended December 31, 2008 and 2009.
D-7
| (iv) | General and Administrative |
General and administrative decreased from $1.7 million for the year ended December 31, 2008 to $1.1 million for the year ended December 31, 2009. The decrease of $0.6 million was due to reducing facility leasing and certain personnel and expenses in the administration and support functions.
Other Income
Other income increased from a nominal amount for the year ended December 31, 2008 to $0.1 million for the year ended December 31, 2009. The increase of $0.1 million was due to interest earned on higher cash balances during the year.
D-8
Comparison of Three months Ended March 31, 2010 to Three months Ended March 31, 2009
| 2010 | 2009 | Change | ||||||||||
| $ | $ | % | ||||||||||
| Revenue | 409,205 | 1,150,389 | (64%) | |||||||||
| Operating Expenses | ||||||||||||
| Cost of revenue | 308,832 | 406,036 | (24%) | |||||||||
| Research and development | 184,210 | 158,829 | 16 | |||||||||
| Sales and marketing | 58,124 | 80,653 | (28%) | |||||||||
| General and administrative | 195,343 | 331,430 | (41%) | |||||||||
| 437,677 | 570,912 | |||||||||||
| Operating income (loss) | (337,304 | ) | 173,441 | |||||||||
| Other income (loss) | (606,751 | ) | 37,905 | - | ||||||||
| Earnings (loss) before income taxes | (944,055 | ) | 211,346 | - | ||||||||
| Provision for income taxes | - | - | - | |||||||||
| Net income (loss) | (944,055 | ) | 211,346 | - | ||||||||
Revenue
Revenue decreased from $1.2 million for the three months ended March 31, 2009 to $0.4 million for the three months ended March 31, 2010. The decrease of $0.8 million was due to the impact of the international financial crisis. The STB sales revenue in the three months ended March 31, 2009 was most delivery of international orders made during early Q4 of 2008. During the three months ended March 31, 2010, the international STB revenue has not recovered to the previous level.
Costs and Expenses
| (i) | Cost of Revenue |
Cost of revenue decreased from $0.4 million or 35% of revenue for the three months ended March 31, 2009 to $0.3 million or 75% of revenue for the three months ended March 31, 2010. The decrease of $0.1 million was due to decrease of sales and changes to the sales structure.
| (ii) | Research and Development |
Research and development was $0.2 million for the three months ended March 31, 2009 and 2010.
Sales and Marketing
Sales and marketing was $0.1 million for the three months ended March 31, 2009 and 2010.
| (iii) | General and Administrative |
General and administrative decreased from $0.3 million for the three months ended March 31, 2009 to $0.2 million for the three months ended March 31, 2010. The decrease of $0.1 million was due to the decrease of office rental expenses as well as organizational changes that reduced headcount on manufacturing and support functions.
Other Income (loss)
Other income decreased from a nominal amount for the three months ended March 31, 2009 to a loss of $0.6 million for the three months ended March 31, 2010. The decrease was due to a non-cash loss on the investment in KyLinTV.
D-9
Liquidity and Capital Resources
During the year ended December 31, 2009, TransVideo’s cash position decreased by $2.8 million. TransVideo used $2.8 million to fund operations which included $2.1 million in working capital changes.
As of December 31, 2009, TransVideo’s principal sources of liquidity included $1.5 million in cash and $0.4 million in accounts receivable.
TransVideos’s cash balance of $1.5 million at December 31, 2009, represent cash on hand, demand deposits placed with bank or other financial institutions and all highly liquid investments with an original maturity of three months or less as of the purchase date of such investments. TransVideo believes that their cash balances are secure notwithstanding the current global economy. TransVideo’s investment policy is to invest in low-risk short-term investments which are primarily term deposits. TransVideo has not had a history of any defaults on these term deposits, nor does it expect any in the future given the short term to maturity of these investments.
TransVideo’s business is still in the early stages, with only a few years of operating history. From TransVideo’s inception, it has incurred net losses and has an accumulated deficit of $0.3 million. TransVideo continues to review its operating structure to maximize revenue opportunity and further reduce costs. Based on its current business plan and internal forecasts, and considering the risks that are present in the current global economy, TransVideo believes that its cash on hand will be sufficient to meet its working capital and operating cash requirements for the next twelve months. Cash from operations could be affected by various risks and uncertainties, including, but not limited to, the risks detailed herein in the section titled “Risk Factors.” If TransVideo’s actual cash needs are greater than forecasted and if cash on hand is insufficient to meet its working capital and cash requirements for the next twelve months, TransVideo will require outside capital in addition to cash flow from operations in order to fund its business. TransVideo’s short operating history, its current lack of profitability and the prolonged upheaval in the capital markets could each or all be factors that might negatively impact its ability to obtain outside capital on reasonable terms, or at all. If TransVideo were ever unable to obtain needed capital, it would reevaluate and reprioritize its planned capital expenditures and operating activities. It cannot be assured that TransVideo will ultimately be able to generate sufficient revenue or reduce its costs in the anticipated time frame to become profitable and have sustainable cash flows.
Working Capital Requirements
The net working capital at December 31, 2009 was $4.6 million, a decrease of $0.7 million from the December 31, 2008 net working capital of $5.3. The decreased working capital is primarily due to a decrease in cash of $2.8 million offset by an increase in due from related parties of $2.2 million.
Current assets at December 31, 2009 were $5.7 million, a decrease of $0.8 million from the December 31, 2008 balance of $6.5 million. The change is primarily due to a decrease in cash of $2.8 million offset by an increase in due from related parties of $2.2 million.
Current liabilities at December 31, 2009 were $1.1 million, a decrease of $0.1 million from the December 31, 2008 balance of $1.2 million.
D-10
Summarized Balance Sheet Data:
| 2009 | 2008 | |||||||||||
| $ | $ | |||||||||||
| Current Assets | ||||||||||||
| Cash | 1,521,168 | 4,284,829 | ||||||||||
| Accounts receivable | 426,825 | 301,636 | ||||||||||
| Other receivable | 261,786 | 372,860 | ||||||||||
| Due from related parties | 2,724,822 | 513,514 | ||||||||||
| Inventory | 634,492 | 897,800 | ||||||||||
| Prepaid taxes and expenses | 117,993 | 130,265 | ||||||||||
| Total current assets | 5,687,086 | 6,500,904 | ||||||||||
Current Liabilities | ||||||||||||
| Accounts and other payables | 452,048 | 602,452 | ||||||||||
| Taxes payable | 49,939 | 58,417 | ||||||||||
| Due to related parties | 115,000 | 13,577 | ||||||||||
| Deferred revenue | - | 50,000 | ||||||||||
| Accrued liabilities | 55,987 | 44,443 | ||||||||||
| Customer deposits | 436,143 | 469,701 | ||||||||||
| Total current liabilities | 1,109,119 | 1,238,590 | ||||||||||
| Working capital ratio | 5.13 | 5.25 | ||||||||||
Off-Balance Sheet Arrangements
TransVideo did not have any off-balance sheet arrangements as of December 31, 2009.
Contractual Obligations and Commitments
The following table summarizes TransVideo’s contractual commitments as at December 31, 2009, and the effect those commitments are expected to have on liquidity and cash flow in future periods:
| (a) | Operating Lease Commitments |
| $ | ||||
| 2010 | 67,745 | |||
| 2011 | 67,745 | |||
| 2012 | 40,254 | |||
| 175,744 |
| (b) | Statutory Reserve Commitments |
In compliance with PRC laws, TransVideo is required to appropriate a portion of its net income to its statutory reserve up to a maximum of 50% of an enterprise’s registered capital in the PRC. TransVideo had future unfunded commitments, as provided below.
| $ | ||||
| PRC Subsidiaries registered capital | ||||
| Beijing TransVideo | 2,922,660 | |||
| Beijing iMedia | 3,000,000 | |||
| Statutory reserve ceiling based | ||||
| on 50% of PRC registered capital | 2,961,330 | |||
| Less: retained earnings appropriated to statutory reserve | (535 | ) | ||
| 2,960,795 |
D-11
Related Party Transactions
In the normal course of business of selling its products and purchasing of raw materials, TransVideo conducts transactions with the following related parties: (a) Avantalion, (b) KyLinTV, (c) Beijing KyLinTV Co., Ltd. (“BJ KyLinTV”) and (d) NeuLion. Avantalion owns 90% of TransVideo. Avantalion represents a 39% stake ownership in KyLinTV. BJ KyLinTV is a subsidiary of KyLinTV. At December31, 2009, NeuLion held 17.1% ownership of KyLinTV; subsequently, Neulion reduced its investment in KylinTV. At April 25, 2010, Neulion held 12.2% of KylinTV.
In the event that TransVideo has both receivables from, and payables to the related parties it will, in accordance with FIN 39 (FASB ASC 210-20), setoff the balances in order to arrive at a single balance that is either due from, or due to the related parties. TransVideo outstanding related party receivables and payables at December 31, 2009 and 2008 are detailed in the following table.
| As of December 31, 2009 | ||||||||||
| Ref. | Subsidiary | Nature of Balance | Related Party | Balance | Description of Transaction | |||||
| A | BJ Transvideo | Sale of Products resulting in Trade Receivable from | KyLinTV | $ | 14,279 | BJ TransVideo licensed content to KyLinTV in December 2009 | ||||
| B | TVI | Sale of Products resulting in Trade Receivable from | KyLinTV | 34,700 | TVI licensed content to KyLinTV in December 2009 | |||||
| C | TVI | Sale of Products resulting in Trade Receivable from | NeuLion | 298,291 | TVI sold set top boxes to NeuLion in November 2009 on credit | |||||
| Subtotal of related party sales | 347,270 | |||||||||
| D | BJ i-Media | Loan Receivable from | BJ KyLinTV | 877,552 | BJ i-Media lent funds to BJ KyLinTV in May 2009 | |||||
| E | TVI | Loan Receivable from | KyLinTV | 1,500,000 | TVI lent funds to KyLinTV in May 2009 | |||||
| Subtotal loans to related parties | 2,377,552 | |||||||||
| Gross related party receivables | $ | 2,724,822 | ||||||||
| Ref. | Subsidiary: | Nature of Balance | Related Party | Balance | Description of Transaction | |||||
| F | TVI | Future sales of product resulting in a liability | KyLinTV | $ | 105,000 | KyLinTV issued an advance to TransVideo in December 2009 as a deposit for the purchase of products | ||||
| G | TVI | Loan Payable to | Avantalion | 10,000 | TransVideo borrowed fund from Avantalion in June 2009 | |||||
| Subtotal loans from related party | 115,000 | |||||||||
| Gross related party payables | $ | 115,000 | ||||||||
| A. | BJ Transvideo licensed $14,279 worth of content to KyLinTV in December 2009. |
| B. | TVI licensed $34,700 worth of content to KyLinTV in December 2009. |
| C. | TVI sold $298,291 worth of products to NeuLion on credit. |
| D. | BJ i-Media loaned $877,552 to BJ KyLinTV. The loan is unsecured, interest free and has no fixed payment terms. |
D-12
| E. | TransVideo loaned $1,500,000 to KyLinTV. The loan is unsecured, interest free and has no fixed payment terms. |
| F. | KyLinTV advanced $105,000 to TransVideo for the purchase of products. |
| G. | TransVideo borrowed $10,000 from Avantalion in June 2009. |
| As of December 31, 2008 | ||||||||||
| Ref. | Subsidiary | Nature of Balance | Related Party | Balance | Description of Transaction | |||||
| A | BJ Transvideo | Sale of services resulting in Trade Receivable from | KyLinTV | $ | 457,834 | BJ Transvideo provided services to KyLinTV in November 2008 | ||||
| B | TransVideo | Sale of services resulting in Trade Receivable from | NeuLion | 55,680 | TransVideo performed transcoding services to NeuLion in March 2008 | |||||
| Subtotal of related party sales | 513,514 | |||||||||
| Gross related party receivables | 513,514 | |||||||||
| Ref. | Subsidiary: | Nature of Balance | Related Party | Balance | Description of Transaction | |||||
| C | BJ Transvideo | Trade payable for services provided by | BJ KyLinTV | 13,577 | BJ KyLinTV provided services to BJ Transvideo in December 2008 | |||||
| Subtotal sales from related party | 13,577 | |||||||||
| Gross related party payables | $ | 13,577 | ||||||||
| A. | BJ Transvideo provided $457,834 worth of service to KyLinTV in November 2008. |
| B. | TransVideo performed $55,680 worth of transcoding service to NeuLion in March 2008. |
| C. | BJ KyLinTV provided $13,577 services to BJ TransVideo in December 2008. |
The related party receivable balance detailed above, and the related transactions that comprise that balance were integral and material to TransVideo’s operations. TransVideo was reliant on transactions with the above related parties in order to conduct its business normally. TransVideo acknowledges that it has the responsibility to comply with paragraph c of SFAS 57 (FASB ASC 850) which calls for the dollar amounts of transactions for each of the periods for which income statements are presented and the effects of any change in the method of establishing the terms from that used in the preceding period.
TransVideo's related party receivables and payables in the period presented were in the form of either short-term loans bearing no interest, or trade payables and receivables relating to the purchase of products, materials, and services for which payment was due within a short period of time. Management believes that the net receivables from related parties are fully recoverable.
D-13
TransVideo believes that related party transactions have in the past, had a significant bearing on TransVideo’s financial statements. As of December 31, 2009, approximately 68% of TransVideo’s sales were with related parties.
Critical Accounting Estimates
The discussion and analysis of our financial condition and results of operations are based upon our consolidated financial statements, which have been prepared in accordance with accounting principles generally accepted in the United States consistently applied throughout all periods. The preparation of these financial statements requires us to make estimates and judgments that affect the reported amounts of assets, liabilities, revenues and expenses and related disclosure of contingent assets and liabilities. On an ongoing basis, we evaluate our estimates, including those related to inventory allowances, bad debts, long-lived assets, income taxes, contingencies and litigation, the determination of the useful lives of long-lived assets and the assumptions used in determining the fair value of share and stock based compensation. & #160;We base our estimates on historical experience and on various other assumptions that are believed to be reasonable under the circumstances, the results of which form the basis for making judgments about the carrying values of assets and liabilities that are not readily apparent from other sources. Actual results may differ from these estimates under different assumptions or conditions.
We believe the following critical accounting policies affect our more significant judgments and estimates used in the preparation of our consolidated financial statements:
Long-Lived Assets
TransVideo amortizes their long-lived assets over the estimated useful life of the asset. TransVideo evaluates all of our long-lived assets, excluding goodwill, periodically for impairment when events or changes in facts and circumstances indicate that their carrying value may not be recoverable. Events or changes in facts and circumstances can include a significant adverse change in the business climate, strategic change in business direction, decline or discontinuance of a product line or service, a reduction in our customer base or a restructuring. If one of these events or circumstances indicates that the carrying value of an asset may not be recoverable, or that our estimated amortization period was not appropriate, we would record an impairment charge against our long lived assets. The amount of impairment would be measured as the difference between the carrying value and the fair value of the impaired asset as calculated using a net realizable value methodology. An impairment charge would be recorded as an operating expense in the period of the impairment and as a reduction in the carrying value of that asset.
At December 31, 2009, TransVideo determined that no events or changes in facts existed such that a further analysis for impairment was required.
Accounts Receivable
Accounts receivable are carried at original invoice amount. TransVideo maintains a provision for estimated losses resulting from the inability of its customers to make required payments. Management considers the following factors when determining the collectability of specific customer accounts: customer credit-worthiness; past transaction history with the customer; current economic industry trends; and changes in customer payment terms. If the financial conditions of the TransVideo's customers were to deteriorate, adversely affecting their ability to make payments, additional allowances would be required.
Inventory
Inventory consists of STBs and is recorded at the lower of cost or market value and consists of raw materials, work in progress and finished goods. Cost is accounted for on a weighted average method and includes all costs of purchase and other costs incurred in bringing the inventories to their present location and condition. TransVideo evaluates its ending inventories for estimated excess quantities and obsolescence. This evaluation includes analyses of sales levels and projections of future demand within specific time horizons. Inventories in excess of future demand are reserved. In addition, TransVideo assesses the impact of changing technology and market conditions on its inventory-on-hand and writes off inventories that are considered obsolete.
D-14
Amortization Policies and Useful Lives
TransVideo amortizes the cost of property, plant and equipment and intangible assets over the estimated useful service lives of these items. The determinations of estimated useful lives of these long-lived assets involve considerable judgment. In determining these estimates, TransVideo takes into account industry trends and company specific factors including changing technologies and expectations for the in-service period of these assets. On an annual basis, TransVideo reassesses its existing estimates of useful lives to ensure they match the anticipated life of the technology from a revenue producing perspective. If technological change happens more quickly than anticipated, TransVideo might have to shorten its estimate of the useful life of certain equipment which could result in higher amortization expense in future periods or an i mpairment charge to write down the value of this equipment.
Recent Accounting Pronouncements
In June 2009, FASB issued Statement No. 166, Accounting for Transfers for Financial Assets (FASB ACE 860 Transfers and Servicing) and FASB Statement No. 167 (FASB No. 167 (FASB ASC 810, Consolidation), a revision to FASB Interpretation No. 46 (Revised December 2003), Consolidation of Variable Interest Entities (FASB ASC 810 Consolidation). TransVideo is still evaluating the impact of this pronouncement.
Statement 166 is a revision to FASB Statement No. 140, Accounting for Transfers and Servicing of Financial Assets and Extinguishments of Liabilities (FASB ASC 860 Transfers and Servicing), and will require more information about transfers of financial assets, including securitization transactions, and where entities have continuing exposure to the risks related to transferred financial assets. It eliminates the concept of “qualifying special-purpose entity,” changes the requirements for derecognizing financial assets, and requires additional disclosures. Statement No. 166 (FASB ASC 860 Transfers and Servicing) must be applied as of t he beginning of each reporting entities first annual reporting period that begins after November 15, 2009, for interim periods within that first annual reporting period and for interim and annual reporting periods thereafter. Earlier application is prohibited. This Statement must be applied to transfer occurring on or after the effective date. TransVideo is still evaluating the impact of this pronouncement.
Statement 167 is a revision of FASB Interpretation No. 46 (Revised December 2003), Consolidation of Variable Interest Entities (FASB ASC 810 Consolidation), and changes how a reporting entity determines when an entity is insufficiently capitalized or is not controlled through voting (or similar rights) should be consolidated. The determination of whether a reporting entity is required to consolidate another entity is based on, among other things, the other entity’s purpose and design and the reporting entity’s ability to direct the activities of the other entity that most significantly impact the other entity’s economic performance. Statement No. 167 (FASB ASC 810 Consolidation) shall be effective as of the beginning of each reporting entity’s first annual reporting period that begins after November 15, 2009, for interim periods within that first annual reporting period, and for interim and annual reporting periods thereafter. Earlier application is prohibited. TransVideo is still evaluating the impact of this pronouncement.
On June 30, 2009, FASB issued FASB Statement No. 168, Accounting Standards Codification (FASB ASC 105 Generally Accepted Accounting Principles) a replacement of FASB Statement No. 162, the Hierarchy of Generally Accepted Accounting Principles. On the effective date of this standard, FASB Accounting Standards Codification (ASC) became the source of authoritative U.S. accounting and reporting standards for nongovernmental entities, in addition to the guidance issued by the Securities and Exchange Commission (SEC). This statement is effective for financial statements issued for interim and annual periods ending after September 15, 2009. If an accounting change results from the application of t his guidance, an entity should disclose the nature and reason for the change in accounting principle in their financial statements. This new standard flattens the GAAP hierarchy to two levels; one that is authoritative (in FASB ASC) and one that is non-authoritative (not in FASB ASC). Exceptions include all rules and interpretive releases of the SEC under the authority of federal securities laws, which are sources of authoritative GAAP for SEC registrants, and certain grandfathered guidance having an effective date before March 15, 1992. Statement No. 168 is the final standard that will be issued by FASB in that form. There will no longer be, for example, accounting standards in the form of statements, staff positions, Emerging Issues Task Force (EITF) abstracts, or AICPA Accounting Statements of Position. TransVideo is still evaluating the impact of this pronouncement.
D-15
Capitalization and Description of Share Capital
The following table sets forth the capitalization of TransVideo as of December 31, 2009, the date of its most recent year-end balance sheet, and as at March 31, 2010. See Schedule 2.
| Security | Amount Outstanding as of December 31, 2009 | Amount Outstanding as at March 31, 2010 |
| TransVideo Shares | 3,200,000 | 3,200,000 |
As at the date hereof, the authorized capital of TransVideo consists of US$50,000, which is made up of one class and one series of shares divided into 5,000,000 shares, US$0.01 par value per share. Of the outstanding authorized shares of TransVideo, 3,200,000 shares are issued and outstanding. Each outstanding TransVideo share has been duly and validly authorized and issued, is fully paid and non-assessable, was issued in compliance with all applicable securities laws, is free of any liens and is not subject to pre-emptive rights or rights of first refusal created by statute, the TransVideo articles and memorandum of association, or any agreement to which TransVideo is a party or by which it is bound.
Options to Purchase Securities
There are no outstanding or authorized options, warrants, calls, exchange rights or other securities convertible into capital stock of TransVideo.
Principal Security Holders
To the knowledge of the directors and officers of TransVideo, as at the date hereof, no person or company beneficially owns, or controls or directs, directly or indirectly, voting securities carrying more than 10% of the voting rights attached to any class of outstanding voting securities of TransVideo, other than the TransVideo common stock owned beneficially and of record as set forth below:
| Name of Shareholder | Number of TransVideo Common Stock | Percentage of TransVideo Common Stock |
| AvantaLion (1) | 2,592,000 | 81% |
(1) AvantaLion is an entity controlled by Charles B. Wang, the Chairman of the board of directors of NeuLion.
Directors and Executive Officers
The following table sets forth the names and municipalities of residence of those individuals who are directors and officers of TransVideo as at the date hereof, their current positions or offices with TransVideo, the date when they first became a director and/or officer of TransVideo, the number of TransVideo common stock beneficially owned, directly or indirectly, or under their direction or control and their principal occupations during the past five years:
| Name and Municipality of Residence | Office or Position Held | Director/Officer Since | Number of TransVideo Common Stock Beneficially Owned, Directly or Indirectly, or under Direction or Control | Principal Occupation During the Past Five Years |
Jianbing Duan, Beijing, China | Chairman of the Board | 2004 | 7,854,545 | Executive Manager of TransVideo |
| Yunchan Wang, Beijing, China | General Manager and President | 2004 | 232,000 | Executive Business Manager of TransVideo |
D-16
| Name and Municipality of Residence | Office or Position Held | Director/Officer Since | Number of TransVideo Common Stock Beneficially Owned, Directly or Indirectly, or under Direction or Control | Principal Occupation During the Past Five Years |
| Jingfang Hao, Beijing Province, China | Senior Vice President, Business Development | 2004 | 232,000 | Executive Manager of TransVideo |
| Xiahong Wang, Beijing, China | Director, Research and Development | 2004 | 40,000 | Research and Development Manager of TransVideo |
| Wei Shu, Beijing, Province, China | Director, Research and Development | 2004 | 40,000 | Research and Development Manager of TransVideo |
Yun Zhao, Beijing, China | Vice President, Sales and Marketing | 2004 | 8,000 | Sales and Marketing Manager of TransVideo |
The directors and executive officers of TransVideo, as a group, beneficially own as at the date hereof, directly or indirectly, or exercise control or direction over 608,000 TransVideo common stock, representing approximately 19% of the TransVideo common stock as at the date hereof.
No TransVideo directors or officers will become officers or directors of NeuLion.
No person who is now, or was at any time during 2009, a director or executive officer of TransVideo, or associate thereof, is, or at any time since the beginning of the most recently completed financial year of TransVideo has been, indebted to TransVideo, or had indebtedness during that period which was the subject of a guarantee, support agreement, letter of credit or other similar arrangement or understanding provided by TransVideo other than such loans to Wang Yunchuan RMB300,000 and Hao Jingfang RMB250,000 in 2006 by Beijing TransVideo, which shall be waived by Beijing TransVideo. Those loans have been included in the balance sheet of Beijing TransVideo and the audited report.
Risk Factors
You should carefully consider all of the information in this Circular, including various changing regulatory, competitive, economic, political and social risks and conditions described below, before making a decision to approve the TransVideo Acquisition. One or more of a combination of these risks could materially impact TransVideo’s business, results of operations and financial condition.
D-17
Risks Related to Our Business
TransVideo may need additional capital to fund continued growth, which may not be available on acceptable terms or at all.
TransVideo’s ability to increase revenue will depend in part on its ability to continue growing the business by developing IPTV platforms for new customers as well as maintaining and increasing its private networks’ subscriber bases, which may require significant additional capital that may not be available to us. TransVideo may need additional financing due to future developments, changes in its business plan or failure of its current business plan to succeed, which could result from increased marketing, distribution or programming costs. TransVideo’s actual funding requirements could vary materially from its current estimates. If additional financing is needed, TransVideo may not be able to raise sufficient funds on favorable terms or at all. Recent developments in the fi nancial markets such as the scarcity of capital have made it more difficult for early stage companies such as TransVideo to access capital markets on acceptable terms or at all. If TransVideo fails to obtain any necessary financing on a timely basis, then its ability to execute the current business plan may be limited, and the business of TransVideo could be adversely affected.
The global economic crisis could result in decreases in customer traffic and otherwise adversely affect TransVideo’s business and financial results and have a material adverse effect on its liquidity and capital resources.
The global economy, including the Chinese economy, is experiencing a severe recession. As a business that is dependent upon consumer discretionary spending, TransVideo faces a challenging fiscal 2010 because our IPTV platform customers’ subscribers and our private network subscribers may have less money for discretionary spending as a result of job losses, foreclosures, bankruptcies, reduced access to credit and sharply falling home prices. Any resulting decreases in customer traffic and revenue will negatively impact its financial performance because reduced revenue results and smaller profit margins. Additionally, many of the long-term effects and consequences of the economic recession are currently unknown; any one or all of them could potentially have a material adverse effect on TransVideo&# 8217;s liquidity and capital resources, including its ability to raise additional capital if needed, or otherwise negatively impact its business and financial results.
TransVideo is an early-stage enterprise with a short operating history, which makes it difficult to evaluate its prospects.
TransVideo is still in the early stage of building out its business. Many of the expenses, problems and delays encountered by an enterprise in its early stage may be beyond its control. As an early-stage enterprise, TransVideo expends significant funds on:
| · | marketing; |
| · | programming and website development; |
| · | maintaining adequate video-streaming and database software; |
| · | building subscriber management systems; |
| · | pursuing and maintaining distribution agreements with our content partners and channel partners; and |
| · | acquiring and maintaining Internet distribution rights to our content. |
From its inception, TransVideo has incurred substantial net losses, and it expects to continue operating at a loss in the near future. If TransVideo is ultimately unable to generate sufficient revenue to become profitable and have sustainable positive cash flows, NeuLion could lose its investment.
TransVideo may also encounter certain problems or delays in building our business, including those related to:
| · | regulatory policies and compliance; |
| · | marketing; |
| · | consumer acceptance of Internet-based television; |
| · | unsuccessful commercial launches of new programming content; |
| · | costs and expenses that exceed current estimates; and |
| · | financing needs |
D-18
Delays in the timely design, construction, deployment and commercial operation of TransVideo’s business, and consequently the achievement of positive cash flow, could result from a variety of causes, many of which are beyond its control. Substantial delays in any of these matters could delay or prevent TransVideo from achieving profitable operations.
Demand for set top boxes may be insufficient for TransVideo to achieve and sustain profitability.
IPTV is an emerging service. Potential TransVideo IPTV platform customers may be slow to adopt the Internet as a medium through which they distribute their own content, and their and its subscribers may be slow or refuse to adopt IPTV as a preferred method of viewing content. TransVideo cannot estimate with any certainty the potential demand for its set top boxes or its ability to satisfy that demand. Among other things, acceptance of TransVideo’s services will depend upon:
| · | its ability to develop and introduce new services that offer enhanced performance and functionality, in a timely manner, in response to changing market conditions, customer and subscriber requirements or its competitors’ technological advances; |
| · | the cost and availability of technology, such as computer hardware and high-speed Internet connections, that are required to utilize TransVideo’s service; |
| · | the marketing and pricing strategies that we employ relative to those of TransVideo’s competitors; |
| · | the acceptance of TransVideo’s subscriber management systems; |
| · | whether TransVideo acquires, markets and distributes high-quality programming consistent with subscribers’ tastes; and |
| · | the willingness of subscribers to pay pay-per-view or subscription fees to obtain NeuLion’s service via set top boxes. |
TransVideo’s results of operations will depend in part upon TransVideo’s ability and that of TransVideo’s IPTV platform customers to increase TransVideo’s respective subscriber bases while maintaining its preferred pricing structures, managing costs and controlling subscriber churn rates. If demand does not develop as expected, then it may not be able to generate enough revenue to generate positive cash flow or achieve and sustain profitability.
One of TransVideo’s objectives is to acquire and maintain programming that sustains loyal audiences in or across various demographic groups. The attractiveness of TransVideo’s content offerings and TransVideo’s ability to retain and grow the audiences for TransVideo’s programs will be an important factor in its ability to sell subscriptions and advertising. TransVideo’s content offerings may not attract or retain the number of subscribers that it anticipates and some content may offend or alienate subscribers that are outside of the target audience for that content. There can be no assurance that TransVideo’s content offerings will enable it to retain its various audiences. If TransVideo loses the rights to distribute any specific programming or channels and fail to attract comparable programming with similar audience loyalty, the attractiveness of TransVideo’s service to subscribers or advertisers could decline and TransVideo’s business could be adversely affected.
TransVideo may have difficulty and incur substantial costs in scaling and adapting its existing systems architecture to accommodate increased traffic, technology advances or customer requirements.
TransVideo’s future success will depend on its ability to adapt to rapidly changing technologies, to adapt its services to evolving industry standards and to improve the performance and reliability of its services. The IPTV industry and the Internet and the video entertainment industries in general are characterized by rapid technological change, frequent new product innovations, changes in customer requirements and expectations and evolving industry standards. There is no assurance that one or more of the technologies utilized by TransVideo will not become obsolete or that its services will be in demand at the time they are offered. If TransVideo or its suppliers are unable to keep pace with technological and industry changes, TransVideo’s business may be unsuccessful.
D-19
In the future, TransVideo may be required to make changes to its systems architecture or move to a completely new architecture. To the extent that demand for TransVideo’s services, content and other media offerings increases, it will need to expand its infrastructure, including the capacity of TransVideo’s hardware servers and the sophistication of TransVideo’s software. If TransVideo is required to switch architectures, it may incur substantial costs and experience delays or interruptions in its service. These delays or interruptions in service may cause users and customers to become dissatisfied and move to competing providers of IPTV services. An unanticipated loss of traffic, increased costs, inefficiencies or failures to adapt to new technologies or user requirements a nd the associated adjustments to TransVideo’s systems architecture could harm its operating results and financial condition.
TransVideo depends on third parties to develop technologies used in key elements of its IPTV services. More advanced technologies that it may wish to use may not be available to us on reasonable terms or in a timely manner. Further, TransVideo’s competitors may have access to technologies not available to us, which may enable these competitors to offer entertainment products of greater interest to consumers or at more competitive costs.
TransVideo could suffer failures or damage due to events that are beyond its control, which could adversely affect its brand and operating results.
TransVideo’s success as a business depends, in part, on its ability to provide consistently high-quality video streams to its customers’ and to its own subscribers via its distribution infrastructure and IPTV technology on a consistent basis. TransVideo’s distribution infrastructure is susceptible to natural or man-made disasters such as earthquakes, floods, fires, power loss and sabotage, as well as interruptions from technology malfunctions, computer viruses and hacker attacks. Other potential service interruptions may result from unanticipated demands on network infrastructure, increased traffic or problems in customer service. TransVideo’s ability to control technical and customer service issues is further limited by its dependence on channel partners for technical integrati on of its distribution infrastructure. Significant disruptions in the TransVideo distribution infrastructure would likely affect the quality and continuity of TransVideo’s service, could harm TransVideo’s goodwill and the TransVideo brand and ultimately could significantly and negatively impact the amount of revenue it may earn. TransVideo may not carry sufficient business interruption insurance to compensate for losses that could occur as a result of an interruption in its services.
TransVideo depends upon third parties for:
| · | the provision of programming in connection with TransVideo’s service, including TransVideo’s channel partners and other third-party content providers; and |
| · | the availability and performance of STBs. |
Any failure by third parties to provide these services could significantly harm TransVideo’s ability to conduct TransVideo’s business. Furthermore, financial difficulties experienced by TransVideo’s third-party providers — such as bankruptcy, insolvency, liquidation or winding up of daily operations — for any reason whatsoever could also have negative consequences on TransVideo’s business.
TransVideo operates in competitive and evolving markets.
TransVideo operates in competitive and evolving markets locally, nationally and globally. These markets are subject to rapid technological change and changes in customer preferences and demand. In seeking market acceptance, TransVideo will encounter competition for both subscribers and advertising revenue from many sources, including other IPTV services, direct broadcast satellite television services and digital and traditional cable systems that carry sports and ethnic programming. Traditional cable and satellite television already has a well-established and dominant market presence for its services, and Internet portals, video file-sharing service providers and other third-party providers of video content over the Internet may distribute ethnic video content. Many of these competitors have substantially greater financial, marketing and other resources than we do. As the IPTV market grows (resulting from higher bandwidths, faster modems and wider programming selections), an increasing number of Internet-based video program offerings will be available to TransVideo’s current and potential customers. In addition, TransVideo’s competitors, in both the traditional satellite and cable television broadcasting and IPTV markets, could exclusively contract with sports and ethnic content providers that are not under contract with us, creating significant competition in both the sports and ethnic programming and IPTV markets. TransVideo’s revenue could be materially adversely affected if we are unable to compete successfully with traditional and other emerging providers of video programming services.
D-20
TransVideo does not have exclusive Internet distribution rights to all of its content and the cost of renewing such rights or obtaining such rights for new content may be higher than expected.
Many of TransVideo’s content and channel partner agreements give it the exclusive Internet distribution rights to the related content and channels. If this content or these channels are offered elsewhere on the Internet on more attractive terms, TransVideo could lose these subscribers, which would have an adverse effect on its results of operations.
TransVideo must negotiate with potential partners to acquire the Internet distribution rights for TransVideo’s programming. In addition, TransVideo will need to renew its agreements with existing partners. TransVideo anticipates that, as the IPTV market grows, license fees relating to Internet distribution rights for programming (including sports and ethnic programming), or for the rights to substitute advertising into the live video streamers of the content, will increase. License fees payable under the partner agreements may be significantly more costly to renew than anticipated.
In addition, some of the existing partner agreements that give TransVideo exclusive Internet distribution rights have renewal mechanisms that are tied to its ability to generate specified revenue share amounts or specified subscriber numbers in respect of particular channels. If TransVideo is unable to meet these targets, then we may have to renegotiate the agreements when they come up for renewal or may lose one or more of its exclusive licenses. Renegotiated license fees may be more expensive than anticipated. TransVideo may be unable to obtain its programming consistently at a cost that is reasonable or appealing to its customers, which may adversely affect its marketing efforts, reputation, brand and revenue.
There is uncertainty relating to TransVideo’s ability to enforce its rights under its channel and content partner agreements.
Many of TransVideo’s channel and content partner agreements for ethnic programming are with foreign entities and are governed by the laws of foreign jurisdictions. If a partner breaches an agreement with it, then it will incur the additional costs of determining its rights and obligations under the agreement under applicable foreign laws and enforcing the agreement in a foreign jurisdiction. Many of the jurisdictions to which TransVideo’s partner agreements are subject do not have sophisticated and/or impartial legal systems and we may face practical difficulties in enforcing any of TransVideo’s rights in such jurisdictions. TransVideo may not be able to enforce such rights or may determine that it would be too costly to enforce such rights. In addition, many of TransVideo& #8217;s partner agreements contain arbitration provisions that govern disputes under the agreements and there is uncertainty with respect to the enforceability of such arbitration provisions under the laws of related foreign jurisdictions. If a dispute were to arise under an agreement and the related arbitration provision was not effective, then TransVideo would be exposed to the additional costs of settling the dispute through traditional legal avenues rather than through an arbitration process.
TransVideo’s business may be impaired by third-party intellectual property rights in the programming content of TransVideo’s channel and content partners.
TransVideo relies on its channel and content partners to secure the primary rights to redistribute programming and other content over the Internet. There is no assurance that TransVideo’s partners have successfully licensed all relevant programming components that are necessary for Internet redistribution. Other parties may claim certain intellectual property rights in the content that TransVideo licenses from its partners. For example, TransVideo’s partners may not have sufficient rights in the underlying content to license distribution rights to their content to us, or a given partner may not identify programming that we are not permitted to distribute in time for us to stop distribution of the offending programming. In addition, as the IPTV market grows, advertisers may begin to attempt to enforce intellectual property rights in advertisements included in TransVideo’s partners’ programming, and we may inadvertently infringe the intellectual property rights of such advertisers by distributing such advertisements over the Internet or by inserting TransVideo’s own advertising in replacement of such advertisements.
D-21
In the event that TransVideo’s partners are in breach of the distribution rights related to specific programming and other content, it may be required to cease distributing or marketing the relevant content to prevent any infringement of related rights, and may be subject to claims of damages for infringement of such rights. TransVideo may also be required to file a claim against a given partner if the distribution rights related to specific programming are breached, and there is no assurance that we would be successful in any such claim.
TransVideo may be subject to other third-party intellectual property rights claims.
Companies in the Internet, technology and media industries often own large numbers of patents, copyrights, trademarks and trade secrets and frequently enter into litigation based on allegations of infringement or other violations of intellectual property rights. As TransVideo faces increasing competition, the possibility of intellectual property rights claims against us grows. TransVideo’s technologies may not be able to withstand third-party claims or rights against their use. Intellectual property claims, whether having merit or otherwise, could be time consuming and expensive to litigate or settle and could divert management resources and attention. In addition, many of TransVideo’s agreements with network service providers require us to indemnify these providers for third-par ty intellectual property infringement claims, which could increase TransVideo’s costs as a result of defending such claims and may require that we pay the network service providers’ damages if there were an adverse ruling in any such claims.
If litigation is successfully brought by a third party against us in respect of intellectual property, TransVideo may be required to cease distributing or marketing certain products or services, obtain licenses from the holders of the intellectual property at material cost, redesign affected products in such a way as to avoid infringing intellectual property rights or seek alternative licenses from other third parties which may offer inferior programming, any or all of which could materially adversely affect TransVideo’s business, financial condition and results of operations. If those intellectual property rights are held by a competitor, we may be unable to obtain the intellectual property at any price, which could also adversely affect TransVideo’s competitive position. An adverse determination cou ld also prevent us from offering its services and could require that we procure substitute products or services. Any of these results could harm TransVideo’s business, financial condition and results of operations.
TransVideo relies on its channel and content partners to ensure intellectual property rights compliance globally.
TransVideo is exposed to liability risk in respect of the content that it redistributes over the Internet, relating to both infringement of third-party rights to the content and infringement of the laws of various jurisdictions governing the type and/or nature of the content. TransVideo relies in large part on its channel and content partners’ obligations under its partner agreements to advise it of any potential or actual infringement so that it may take appropriate action if such content is not intellectual property rights-compliant or is otherwise obscene, defamatory or indecent. There is a risk that TransVideo’s partners will not advise it in time, or at all, in respect of such content, and expose it to liability for its redistribution of such content over the Internet. Any alleged liability could harm TransVideo’s business by damaging its reputation, requiring it to incur legal costs in defense of any such claim, exposing it to significant awards of damages and costs and diverting management’s attention, any of which could have an adverse effect on TransVideo’s business, results of operations and financial condition.
Increased subscriber turnover could adversely affect TransVideo’s financial performance.
Customer subscriber churn has a significant financial impact on TransVideo’s results of operations, and it cannot reliably predict the amount of churn that we will experience over the long term. Given the increasingly competitive nature of the IPTV industry, it may not be able to reduce churn without significantly increasing TransVideo’s spending on customer acquisition and retention incentives, which would have a negative effect on TransVideo’s earnings and free cash flow. There can be no assurance that an increase in competition from other IPTV providers, new technology entrants, programming theft and other factors will not contribute to a relatively higher churn than we have experienced historically. To the extent that TransVideo’s churn is greater than currently anticipated, it may be more costly for us to acquire a sufficient customer base to generate revenue.
D-22
Current economic conditions have led certain consumers to reduce their spending on non-essential items. A reduction in consumer discretionary spending or an inability to pay for subscribed services could result in a decrease in or loss of subscribers, which would reduce TransVideo’s future revenue and negatively impact TransVideo's business, financial condition and results of operations.
Increased subscriber acquisition costs could adversely affect TransVideo’s financial performance.
TransVideo anticipates spending substantial funds on advertising and other marketing to attract new subscribers and maintain TransVideo’s subscriber base. TransVideo’s ability to achieve break-even cash flows depends in part on its ability to achieve and maintain lower subscriber acquisition costs over time. TransVideo’s subscriber acquisition costs, both in the aggregate and on a per-new-subscriber basis, may materially increase in the future to the extent that we introduce new promotions, whether in response to competition or otherwise. Any material increase in subscriber acquisition or retention costs from current levels could have a material adverse effect on TransVideo’s business, financial condition and results of operations.
TransVideo may not be successful in developing a version of its service that will gain widespread adoption by users of alternate devices to access the Internet.
In the coming years, the number of individuals who access the Internet through devices other than a personal computer, such as personal digital assistants, mobile telephones and television set top devices, is expected to increase dramatically. TransVideo’s services are designed for rich, graphical environments such as those available on personal and laptop computers. The lower resolution, functionality and memory associated with alternative devices may make the distribution of content through such devices difficult, and we may be unsuccessful in TransVideo’s efforts to provide a compelling service for users of alternative devices. If TransVideo is unable to attract and retain a substantial number of alternative device users to its services, we will fail to capture a sufficient share of an i ncreasingly important portion of the market for online media.
In addition, TransVideo intends to introduce new services and/or functionalities to increase its customers’ and subscriber bases and long-term profitability, such as targeted advertising insertion and personal video recording. These services are dependent on successful integration of new technologies into the TransVideo distribution infrastructure, negotiations with third-party content and network system providers, subscriber acceptance and the maintenance of future technologies to support these services. If TransVideo is unsuccessful in implementing such services, or the economic attractiveness of these services is lower than anticipated, then TransVideo’s business and operating results could be adversely affected.
TransVideo may be unable to manage rapidly expanding operations.
TransVideo is continuing to grow and diversify its business both domestically and internationally. As a result, it will need to expand and adapt its operational infrastructure. If TransVideo is unable to manage its growth effectively, it could have a material adverse effect on its business, financial condition and results of operations. To manage growth effectively, TransVideo must, among other things, continue to develop its internal and external sales forces, the distribution infrastructure capability, customer service operations and information systems, maintain its relationships with content and channel partners, effectively enter new areas of the sports and ethnic programming markets and effectively manage the demands of day-to-day operations in new areas while attempting to execute TransVideoR 17;s business strategy and realize the projected growth and revenue targets developed by TransVideo’s management. TransVideo will also need to continue to expand, train and manage its employee base, and its management must assume even greater levels of responsibility. If we are unable to manage growth effectively, we may experience a decrease in subscriber growth and an increase in subscriber churn, which could have a material adverse effect on TransVideo’s financial condition, profitability and cash flows.
Internet transmissions may be subject to theft and malicious attacks, which could cause us to lose subscribers and revenue.
Like all Internet transmissions, TransVideo’s streaming content may be subject to interception and malicious attack. Pirates may be able to obtain or redistribute TransVideo’s programs without paying fees to us. The TransVideo distribution infrastructure is exposed to spam, viruses, worms, spyware, denial of service or other attacks by hackers and other acts of malice. Theft of TransVideo’s content or attacks on the TransVideo distribution infrastructure would reduce future potential revenue and increase TransVideo’s net subscriber acquisition costs.
D-23
If TransVideo’s security technology is compromised, it could adversely affect TransVideo’s ability to contract for licenses to distribute programming over the Internet. TransVideo uses security measures intended to make theft of its content more difficult. However, if it is required to upgrade or replace existing security technology, the cost of such security upgrades or replacements could have a material adverse effect on TransVideo’s financial condition, profitability and cash flows. In addition, other illegal methods that compromise Internet transmissions may be developed in the future. If TransVideo cannot control compromises of its channels, then TransVideo’s revenue, net subscriber acquisition costs, churn and ability to contract for licenses to distribute progr amming over the Internet could be materially adversely affected.
There is no assurance that the current costs of Internet connections and network access will not rise with increasing popularity of IPTV services, which would adversely affect TransVideo’s business.
TransVideo relies on Internet service providers for its principal connections and network access and to stream audio and video content to subscribers. As demand for IPTV services increases, there can be no assurance that Internet service providers will continue to price their network access services on reasonable terms. The distribution of streaming media requires distribution of large content files and providers of network access may change their business model and increase their prices significantly, which could slow the widespread acceptance of such services. In order for TransVideo’s media content services to be successful, there must be a reasonable price model in place to allow for the continuous distribution of large streaming media files. TransVideo has limited or no control ov er the extent to which any of these circumstances may occur, and if network access prices rise significantly, then TransVideo’s business and operating results would likely be adversely affected.
TransVideo’s business depends on the continued growth and maintenance of the Internet infrastructure.
The success and the availability of Internet-based products and services depends in part upon the continued growth and maintenance of the Internet infrastructure itself, including its protocols, architecture, network backbone, data capacity and security. Spam, viruses, worms, spyware, denial of service or other attacks by hackers and other acts of malice may affect not only the Internet’s speed, reliability and availability but also its continued desirability as a vehicle for commerce, information and user engagement. If the Internet proves unable to meet the new threats and increased demands placed upon it, TransVideo’s business plans, user and advertiser relationships, site traffic and revenues could be adversely affected.
Privacy concerns relating to elements of TransVideo’s service could damage its reputation and deter current and potential users from using its products and services.
From time to time, concerns may be expressed about whether TransVideo’s products and services compromise the privacy of users and others. Concerns about TransVideo’s collection, use or sharing of personal information or other privacy-related matters, even if unfounded, could damage TransVideo’s reputation and result in a loss of user confidence and ultimately in a loss of users, partners or advertisers, which could adversely affect TransVideo’s business and operating results.
TransVideo may have exposure to greater than anticipated tax liabilities.
TransVideo is subject to income taxes and non-income taxes in a variety of jurisdictions, and TransVideo’s tax structure is subject to review by both domestic and foreign taxation authorities. The determination of TransVideo’s world-wide provision for income taxes and other tax liabilities requires significant judgment and, in the ordinary course of its business, there are many transactions and calculations where the ultimate tax determination is uncertain. Although we believe that our estimates are reasonable, the ultimate tax outcome may differ from the amounts recorded on our consolidated financial statements and may materially affect our financial results in the period or periods for which such determination is made.
D-24
We are subject to foreign business, political and economic disruption risks.
We contract with various entities from around the world, including in respect of the acquisition of the Internet distribution rights to the content. As a result, we are exposed to foreign business, political and economic risks, which could adversely affect our financial position and results of operations, including:
| · | difficulties in managing partner relationships from outside of a given partner’s jurisdiction; |
| · | political and economic instability; |
| · | less developed infrastructures in newly industrializing countries; |
| · | susceptibility to interruption of channel feeds in foreign areas due to war, terrorist attacks, medical epidemics, changes in political regimes and general interest rate and currency instability; |
| · | exposure to possible litigation or claims in foreign jurisdictions; and |
| · | competition from foreign-based IPTV providers and the existence of protectionist laws and business practices that favor such providers. |
Risks Related to Doing Business in China
Contract drafting, interpretation and enforcement in China involves significant uncertainty.
TransVideo has entered into numerous contracts governed by PRC law, many of which are material to its business. As compared with contracts in the United States, contracts governed by PRC law tend to contain less detail and are not as comprehensive in defining contracting parties’ rights and obligations. As a result, contracts in China are more vulnerable to disputes and legal challenges. In addition, contract interpretation and enforcement in China is not as developed as in the United States, and the result of any contract dispute is subject to significant uncertainties. Therefore, there is no assurance that TransVideo will not be subject to disputes under its material contracts, and if such disputes arise, it cannot assure you that it will prevail. Due to the materiality of certain contracts to TransVideo’s business, any dispute involving such contracts, even without merit, may materially and adversely affect TransVideo’s reputation and business operations.
You may experience difficulties in effecting service of legal process, enforcing foreign judgments or bringing original actions in China based on United States or other foreign laws against TransVideo and its management.
Substantially all of TransVideo’s assets, and substantially all of its directors and officers, reside within China. As a result, it may not be possible to effect service of process within the United States or elsewhere outside China upon its officers and directors who do not reside in the United States, including with respect to matters arising under U.S. federal securities laws or applicable state securities laws. Moreover, we have been advised that China does not have treaties with the United States or many other countries provide the reciprocal recognition and enforcement of judgments of courts. As a result, you may have substantial difficulty protecting your interests through actions against TransVideo’s officers and directors th at acquirors of a corporation with assets and management members located in the United States would not experience.
Uncertainties with respect to the PRC legal system could adversely affect TransVideo.
TransVideo’s operations in China are governed by PRC laws and regulations. TransVideo is generally subject to laws and regulations in China. The PRC legal system is based on written statutes. Prior court decisions may be cited for reference but have limited precedential value.
However, China has not developed a fully integrated legal system and recently enacted laws and regulations may not sufficiently cover all aspects of economic activities in China. In particular, because these laws and regulations are relatively new, and because of the limited volume of published decisions and their nonbinding nature, the interpretation and enforcement of these laws and regulations involve uncertainties. In addition, the PRC legal system is based in part on government policies and internal rules (some of which are not published on a timely basis or at all) that may have a retroactive effect. As a result, TransVideo may not be aware of its violation of these policies and rules until some time after the violation. In addition, any litigation in China may be protracted and result in substantial costs and diversion of resources and management attention.
D-25
Legal Proceedings and Regulatory Actions
TransVideo is not a party to any legal proceedings nor, to the best of management’s knowledge, are any legal proceedings threatened or pending.
The auditor of TransVideo is Samuel H. Wong & Co., LLP and its address is 400 Oyster Point Blvd., Ste. 122, South San Francisco, CA 94080.
| 1 | TVD and BJ KylinTV | Service Agreement | 2009-1-1 | TVD provides HR, administration, financial and technology services to BJ KyLinTV |
| 2 | KylinTV and TransVideo | Computer Software License and Product Distribution Agreement between | 2009-1-1 | TVD license IPTV software to KylinTV and KylinTV distributes STB for TVI |
| 3 | iMedia 160STB/160 pieces of STB Sales Contract | TVDI-iBox-SC09002 | 2009-12-1 | TVD sells 160 pieces of STBs to Beijing i-Media Technology Co., Ltd. |
| 4 | CCTV.com and TVD | CINC-SP-0912-745 | 2009-12-24 | TVD provides transcoding and transmitting services to CCTV |
| 5 | DETV SET-TOP-BOX SALE CONTRACT | TVBJ-IBX-1001-0001 | 2010-2-8 | TVD sells STBs to DETV |
| 6 | Tianjing Ji County | STB Sales | 2008-7-22 | TVD sells STBs to Tianjing Ji County |
| 7 | Tianjing Ji County | STB Sales | 2009-5-6 | TVD sells STBs to Tianjing Ji County |
D-26
Schedule 1
TransVideo Financial Statements
Transvideo International Ltd.
Consolidated Financial Statements
December 31, 2009 and 2008
(Stated in US Dollars)
D-27
Transvideo International Ltd.
| Contents | Pages |
| Report of Independent Registered Public Accounting Firm | D-29 |
| Consolidated Balance Sheets | D-30 - D-31 |
| Consolidated Statements of Operations | D-32 |
| Consolidated Statements of Changes in Stockholders’ Equity | D-33 |
| Consolidated Statements of Cash Flows | D-34 |
| Notes to Consolidated Financial Statements | D-35 - D-47 |
D-28
| To: | The Board of Directors and Stockholders |
| Transvideo International Ltd. |
Report of Independent Registered Public Accounting Firm
We have audited the accompanying consolidated balance sheets of Transvideo International Ltd. as of December 31, 2009 and 2008, and the related consolidated statements of operations, changes in stockholders' equity, and cash flows for the years then ended. These financial statements are the responsibility of the Company's management. Our responsibility is to express an opinion on these financial statements based on our audits.
We conducted our audits in accordance with the standards of the Public Company Accounting Oversight Board (United States). Those standards require that we plan and perform the audit to obtain reasonable assurance about whether the financial statements are free of material misstatement. An audit includes examining, on a test basis, evidence supporting the amounts and disclosures in the financial statements. An audit also includes assessing the accounting principles used and significant estimates made by management, as well as evaluating the overall financial statement presentation. We believe that our audits provide a reasonable basis for our opinion.
In our opinion, the consolidated financial statements referred to above present fairly, in all material respects, the financial position of Transvideo International Ltd. as of December 31, 2009 and 2008, and the results of its operations and its cash flows for each of the years then ended in conformity with accounting principles generally accepted in the United States of America.
| South San Francisco, California | Samuel H. Wong & Co., LLP | |
| April 25, 2010 | Certified Public Accountants |
D-29
Transvideo International Ltd.
Consolidated Balance Sheets
As of December 31, 2009 and 2008
(Stated in US Dollars)
| ASSETS | Note | 12/31/2009 | 12/31/2008 | ||||||||
| Current Assets | |||||||||||
| Cash | 2D | $ | 1,521,168 | $ | 4,284,829 | ||||||
| Accounts receivable | 2E,3 | 426,825 | 301,636 | ||||||||
| Other receivable | 261,786 | 372,860 | |||||||||
| Due from related parties | 5 | 2,724,822 | 513,514 | ||||||||
| Inventory | 2F,4 | 634,492 | 897,800 | ||||||||
| Prepaid taxes and expenses | 117,993 | 130,265 | |||||||||
| Total current assets | 5,687,086 | 6,500,904 | |||||||||
| Non-Current Assets | |||||||||||
Equipment, net | 2G,6 | 321,188 | 428,852 | ||||||||
Intangible assets, net | 2H,7 | 15,131 | 16,123 | ||||||||
| Other assets | 48,105 | 47,614 | |||||||||
| Total non-current assets | 384,424 | 492,589 | |||||||||
| Total assets | $ | 6,071,510 | $ | 6,993,493 | |||||||
| LIABILITIES | |||||||||||
| Current Liabilities | |||||||||||
| Accounts and other payables | $ | 452,048 | $ | 602,452 | |||||||
| Taxes payable | 49,939 | 58,417 | |||||||||
| Due to related parties | 5 | 115,000 | 13,577 | ||||||||
| Deferred revenue | 2J | - | 50,000 | ||||||||
| Accrued liabilities | 55,987 | 44,443 | |||||||||
| Customer deposits | 2I | 436,143 | 469,701 | ||||||||
| Total current liabilities | 1,109,119 | 1,238,590 | |||||||||
| Total liabilities | $ | 1,109,119 | $ | 1,238,590 | |||||||
See Notes to Financial Statements and Accountant’s Report
D-30
Transvideo International Ltd.
Consolidated Balance Sheets
As of December 31, 2009 and 2008
(Stated in US Dollars)
| STOCKHOLDERS' EQUITY | |||||||||||
| 12/31/2009 | 12/31/2008 | ||||||||||
Common stock - $0.01 par value, 5,000,000 shares authorized; 3,200,000 and 3,163,200 shares issued and outstanding at December 31, 2009 and 2008, respectively | $ | 32,000 | $ | 31,632 | |||||||
| Additional paid in capital | 4,157,781 | 4,134,123 | |||||||||
| Statutory reserve | 2K,8(b) | 535 | 535 | ||||||||
| Retained earnings/(accumulated deficit) | (330,524 | ) | 432,593 | ||||||||
| Accumulated other comprehensive income | 2L | 567,554 | 555,337 | ||||||||
| Non-controlling interest | 535,045 | 600,683 | |||||||||
| Total stockholders’ equity | 4,962,391 | 5,754,903 | |||||||||
| Total liabilities and stockholders’ equity | $ | 6,071,510 | $ | 6,993,493 | |||||||
See Notes to Financial Statements and Accountant’s Report
D-31
Transvideo International Ltd.
Consolidated Statements of Operations
For the years ended December 31, 2009 and 2008
(Stated in US Dollars)
| Note | 12/31/2009 | 12/31/2008 | |||||||||
| Revenues | 2M | $ | 2,274,779 | $ | 9,062,627 | ||||||
| Operating expenses: | |||||||||||
| Cost of revenues | 2N | 1,184,435 | 6,160,579 | ||||||||
| Research and development | 2P | 635,316 | 431,894 | ||||||||
| Sales and marketing | 2Q | 284,531 | 316,079 | ||||||||
| General and administrative | 2R | 1,074,314 | 1,650,610 | ||||||||
Total operating expenses | 3,178,596 | 8,559,162 | |||||||||
| Operating income/(loss) | (903,817 | ) | 503,465 | ||||||||
| Other income/(expense) | 13 | 75,062 | 22,226 | ||||||||
| Earnings (loss) before tax | (828,755 | ) | 525,691 | ||||||||
| Provision for income taxes | 2T,10 | - | (1,477 | ) | |||||||
| Net income (loss) | $ | (828,755 | ) | $ | 524,214 | ||||||
| Net income (loss) attributable to: | |||||||||||
| - Common stockholders | $ | (763,116 | ) | $ | 596,691 | ||||||
| - Non-controlling interest | $ | (65,639 | ) | $ | (72,477 | ) | |||||
| Earnings (loss) per share | 2V,12 | ||||||||||
| - Basic | $ | (0.24 | ) | $ | 0.21 | ||||||
| - Diluted | $ | (0.24 | ) | $ | 0.21 | ||||||
| Weighted average shares outstanding | |||||||||||
| - Basic | 3,184,769 | 2,896,440 | |||||||||
| - Diluted | 3,184,769 | 2,896,440 | |||||||||
See Notes to Financial Statements and Accountant’s Report
D-32
Transvideo International Ltd.
Consolidated Statements of Changes in Stockholders’ Equity
As of December 31, 2009 and 2008
(Stated in US Dollars)
| Retained | Accumulated | |||||||||||||||||||||||||||||||
| Number | Additional | Non- | Earnings/ | Other | ||||||||||||||||||||||||||||
| of | Common | Paid in | Statutory | Controlling | (Accumulated | Comprehensive | ||||||||||||||||||||||||||
| Shares | Stock | Capital | Reserve | Interest | Deficit) | Income | Total | |||||||||||||||||||||||||
| Balance at January 1, 2008 | 2,742,000 | $ | 27,420 | $ | 3,863,344 | $ | 535 | $ | 673,160 | $ | (164,098 | ) | $ | 461,864 | $ | 4,862,225 | ||||||||||||||||
Issuance of common stock for cash and employee compensation | 421,200 | 4,212 | 270,779 | - | - | - | - | 274,991 | ||||||||||||||||||||||||
| Net income | - | - | - | - | - | 524,214 | - | 524,214 | ||||||||||||||||||||||||
Appropriation of loss to non-c ontrolling interest | - | - | - | - | (72,477 | ) | 72,477 | - | - | |||||||||||||||||||||||
Foreign currency translation adjustment | - | - | - | - | - | - | 93,473 | 93,473 | ||||||||||||||||||||||||
| Balance at December 31, 2008 | 3,163,200 | $ | 31,632 | $ | 4,134,123 | $ | 535 | $ | 600,683 | $ | 432,593 | $ | 555,337 | $ | 5,754,903 | |||||||||||||||||
| Balance at January 1, 2009 | 3,163,200 | $ | 31,632 | $ | 4,134,123 | $ | 535 | $ | 600,683 | $ | 432,593 | $ | 555,337 | $ | 5,754,903 | |||||||||||||||||
Issuance of common stock for cash and employee compensation | 36,800 | 368 | 23,658 | - | - | - | - | 24,026 | ||||||||||||||||||||||||
| Net loss | - | - | - | - | - | (828,755 | ) | - | (828,755 | ) | ||||||||||||||||||||||
Appropriation of loss to non- controlling interest | - | - | - | - | (65,639 | ) | 65,639 | - | - | |||||||||||||||||||||||
Foreign currency translation adjustment | - | - | - | - | - | - | 12,217 | 12,217 | ||||||||||||||||||||||||
| Balance at December 31, 2009 | 3,200,000 | $ | 32,000 | $ | 4,157,781 | $ | 535 | $ | 535,045 | $ | (330,524 | ) | $ | 567,554 | $ | 4,962,391 | ||||||||||||||||
| Comprehensive Income | Accumulated | |||||||||||
| 12/31/2008 | 12/31/2009 | Total | ||||||||||
| Net income (loss) | $ | 524,214 | $ | (828,755 | ) | $ | (304,541 | ) | ||||
| Other Comprehensive Income | ||||||||||||
| Foreign currency translation adjustment | 93,473 | 12,217 | 105,690 | |||||||||
| $ | 617,687 | $ | (816,538 | ) | $ | (198,851 | ) | |||||
See Notes to Financial Statements and Accountant’s Report
D-33
Transvideo International Ltd.
Consolidated Statements of Cash Flows
For the years ended December 31, 2009 and 2008
(Stated in US Dollars)
| 12/31/2009 | 12/31/2008 | ||||||||||
| Cash Flows from Operating Activities | Note | ||||||||||
| Net income (loss) | $ | (828,755 | ) | $ | 524,214 | ||||||
| Adjustments to reconcile net income to net cash from operations: | |||||||||||
| Stock and share based compensation | 15 | 23,658 | 270,779 | ||||||||
| Depreciation | 119,373 | 120,682 | |||||||||
| Amortization | 2,860 | 2,846 | |||||||||
| Decrease/(increase) in accounts and other receivable | (14,114 | ) | 617,141 | ||||||||
| Decrease/(increase) in related party receivable | (2,211,309 | ) | 103,737 | ||||||||
| Decrease/(increase) in inventory | 263,308 | 804,543 | |||||||||
| Decrease/(increase) in prepaid tax and expense | 12,271 | (119,816 | ) | ||||||||
| Increase/(decrease) in accounts and other payable | (150,403 | ) | (569,974 | ) | |||||||
| Increase/(decrease) in taxes payable | (8,478 | ) | 41,034 | ||||||||
| Increase/(decrease) in related party payable | 101,423 | 13,578 | |||||||||
| Increase/(decrease) in accrued liabilities | 11,544 | 44,444 | |||||||||
| Increase/(decrease) in customer deposits | (33,557 | ) | 383,303 | ||||||||
| Increase/(decrease) in deferred revenue | (50,000 | ) | (333,333 | ) | |||||||
| Cash sourced/(used) in operating activities | (2,762,179 | ) | 1,903,178 | ||||||||
| Cash Flows from Investing Activities | |||||||||||
| Purchases of equipment | (11,709 | ) | (169,576 | ) | |||||||
| Purchase of intangible assets | (1,867 | ) | (5,834 | ) | |||||||
| (Increase)/decrease in other assets | (490 | ) | 39,122 | ||||||||
| Cash (used)/sourced in investing activities | (14,068 | ) | (136,288 | ) | |||||||
| Cash Flows from Financing Activities | |||||||||||
| Issuance of common stock | 368 | 4,212 | |||||||||
| Cash sourced/(used) in financing activities | 368 | 4,212 | |||||||||
| Net increase/(decrease) in cash & cash equivalents for the year | (2,775,879 | ) | 1,771,102 | ||||||||
| Effect of foreign currency translation adjustment | 12,217 | 93,473 | |||||||||
| Cash & cash equivalents at beginning of year | 4,284,829 | 2,420,254 | |||||||||
| Cash & cash equivalents at end of year | $ | 1,521,168 | $ | 4,284,829 | |||||||
| Supplementary cash flow information: | |||||||||||
| Interest received | 57,639 | 24,243 | |||||||||
| Interest paid | 1,513 | 3,407 | |||||||||
| Income taxes paid | - | 1,477 | |||||||||
D-34
Transvideo International Ltd.
Notes to Consolidated Financial Statements
As of and for the years ended December 31, 2009 and 2008
| 1. | Organization and Principal Business Activities |
Transvideo International Ltd. (the “Company” or “TVI”) is a British Virgin Islands Company, incorporated on February 5, 2004 under the British Virgin Islands Business Companies Act, 2004. The Company operates through its directly and indirectly held subsidiaries. The Company directly holds (a) Beijing Digital Transvideo Technology Co., Ltd. (“BJ Transvideo”) and (b) China iMedia Enterprise Ltd. (“China iMedia”). BJ Transvideo was incorporated and is domiciled in the Peoples Republic of China (the “PRC”). China iMedia was incorporated on February 5, 2004 under the British Virgin Islands Business Companies Act, 2004. The Company through its holding of China iMedia indirectly holds Beijing i-Media Technology Co., Ltd. (“BJ i-Media”) w hich was incorporated and is domiciled in the PRC.
Business
The Company’s primary business activity is the provision of network digital audio/video technology products, which include but are not limited to: Box series H.264 IP Set Top Boxes, Transcode H.264 Real Time Transcoding Devices, Studio Content Production Management Systems and TV center Rich-media services platforms. The Company’s products are widely applied on commercial IPTV operation platforms, which include Broadband Live Broadcast, TV-experience of VOD, Regional Hotel Entertainment VOD, Enterprise Remote Video Education, Business Area Video Publicity, and Family Media Center.
BJ Transvideo is a network digital audio/video technology provider. It is principally engaged in the sale of Set Top Boxes (STB), STB's spare parts and STB's software licenses.
China iMedia and BJ i-Media are engaged in baby education services, sales of STB, and production of new media services.
| 2. | Summary of Significant Accounting Policies |
| (A) | Method of Accounting |
The Company maintains its general ledger and journals with the accrual method accounting for financial reporting purposes. The financial statements and notes are representations of management. Accounting policies adopted by the Company conform to generally accepted accounting principles in the United States of America and have been consistently applied in the presentation of financial statements.
| (B) | Consolidation |
The consolidated financial statements include all the financial statements of the Company and its two PRC subsidiaries and one BVI subsidiary. Inter-company transactions, such as sales, cost of sales, due to/due from balances, investment in subsidiaries, and subsidiaries’ capitalization have been eliminated.
The Company’s subsidiaries and investment interests as of December 31, 2009 are detailed below:
| Name of Entities | Date of Incorporation | Place of Incorporation | Attributable Equity Interest | Registered Capital |
| China iMedia | 2/5/2004 | BVI | 66% | USD 79,992 |
| BJ Transvideo | 4/11/2003 | PRC | 100% | RMB 24,066,280 |
| BJ i-Media | 6/1/2004 | PRC | 66% | RMB 22,153,024 |
D-35
Transvideo International Ltd.
Notes to Consolidated Financial Statements
As of and for the years ended December 31, 2009 and 2008
| (C) | Use of Estimates |
The preparation of financial statements in conformity with generally accepted accounting principles in the United States of America requires management to make estimates and assumptions that affect the reported amounts of assets and liabilities and disclosure of contingent assets and liabilities at the date of the financial statements and the reported amounts of revenues and expenses during the reporting period. Management makes these estimates using the best information available at the time the estimates are made; however, actual results could differ materially from these estimates.
| (D) | Cash and Cash Equivalent |
Cash and cash equivalents are carried at cost and represent cash on hand, demand deposits placed with banks or other financial institutions and all highly liquid investments with an original maturity of three months or less as of the purchase date of such investments.
| (E) | Accounts Receivable |
Trade receivables are recognized and carried at the original invoice amount less allowance for any uncollectible amounts. An estimate for doubtful accounts is made when collection of the full amount is no longer probable. Bad debts are written off as incurred.
| (F) | Inventory |
Inventory is stated at the lower of cost or market value. Cost is computed using the weighted average method and includes all costs of purchase and other costs incurred in bringing the inventories to their present location and condition. Market value is determined by reference to the sales proceeds of items sold in the ordinary course of business or estimates based on prevailing market conditions.
| (G) | Property, Plant, and Equipment |
Property, plant, and equipment are stated at cost. Repairs and maintenance to these assets are charged to expense as incurred; major improvements enhancing the function and/or useful life are capitalized. When items are sold or retired, the related cost and accumulated depreciation are removed from the accounts and any gains or losses arising from such transactions are recognized.
Property, plant, and equipment are depreciated using the straight-line method over their estimated useful life with a 10% salvage value. Their useful lives are as follows:
| Fixed Assets Classification | Estimated Useful Life |
| Office equipment | 5 Years |
| Motor vehicles | 5 Years |
| (H) | Intangible Assets |
Intangible assets are stated at cost less accumulated amortization and impairment loss. Amortization is provided over their estimated useful lives, using the straight-line method. Estimated useful lives of the intangibles are as follows:
| Asset Class | Estimated Useful Life |
| Accounting software | 5 years |
D-36
Transvideo International Ltd.
Notes to Consolidated Financial Statements
As of and for the years ended December 31, 2009 and 2008
| (I) | Customer Deposits |
Customer deposits represent the money the Company has received from customers in advance for the purchase of goods. The Company considers customer deposits as a liability until the title of goods have been transferred at which point the balance will be credited to sales revenue.
| (J) | Deferred Revenue |
Deferred revenue represents money the Company has received in advance for its software license distribution. The Company considers deferred revenue as a liability until software license has been amortized, at such point the balances will be transferred to sales revenue.
| (K) | Statutory Reserve |
Statutory reserve refer to the amount appropriated from the net income in accordance with laws or regulations, which can be used to recover losses and increase capital, as approved, and, are to be used to expand production or operation. PRC laws prescribe that an enterprise operating at a profit, must appropriate, on an annual basis, from its earnings, an amount to the statutory reserve to be used for future company development. Such an appropriation is made until the reserve reaches a maximum equalling 50% of the enterprise’s capital.
| (L) | Comprehensive Income |
In accordance with SFAS No. 130, “Reporting Comprehensive Income” (FASB ASC 220), comprehensive income is defined to include all changes in equity except those resulting from investments by owners and distributions to owners. Among other disclosures, all items that are required to be recognized under current accounting standards as components of comprehensive income are required to be reported in a financial statement that is presented with the same prominence as other financial statements. The Company’s other comprehensive income is attributable to foreign currency translation adjustment.
| (M) | Recognition of Revenue |
Revenue is recognized when persuasive evidence of an arrangement exists, delivery has occurred, the fee is fixed or determinable, and collectability is probable.
Revenue for retail packaged products are recognized as products are shipped. The license fee related for the source code to the IPTV Serve Software is recorded as deferred revenue and amortized under a straight-line basis over the related products’ life cycles. Maintenance service fee is recognized as service has been rendered to customers.
| (N) | Cost of Revenues |
Cost of revenue includes manufacturing and distribution costs for products sold and programs licensed, operating costs related to product support service centers and product distribution centers, costs incurred to support and maintain Source Code IPTV products and services, inventory valuation adjustments, and the amortization of capitalized research and development costs associated with software products that have reached technological feasibility. Capitalized research and development costs are amortized over the estimated lives of the products.
| (O) | Product Warranty |
The Company provides for the estimated costs of fulfilling obligations under hardware and software warranties at the time the related revenue is recognized. For hardware warranties, the Company estimates the costs based on historical and projected product failure rates, historical and projected repair costs, and knowledge of specific product failures (if any). The specific hardware warranty terms and conditions vary depending upon the product sold, but generally include parts and labor over a period of one year. For software warranties, the Company estimates the costs to provide bug fixes, such as security patches, over the estimated life of the software.
D-37
Transvideo International Ltd.
Notes to Consolidated Financial Statements
As of and for the years ended December 31, 2009 and 2008
| (P) | Research and Development |
Research and development expenses include payroll, employee benefits and other headcount-related expenses associated with product development. Research and development expenses also include third-party development and programming costs, localization costs incurred to translate software for international markets, the amortization of purchased software code and services content, and in-process research and development. Such costs related to software development are included in research and development expense until the point that technological feasibility is reached, which for software products, is generally shortly before the products are released to manufacturing. Once technological feasibility is reached, such costs are capitalized and amortized to cost of revenue over the estimated lives of the products.
| (Q) | Sales and Marketing |
Sales and marketing expenses include payroll, employee benefits and other headcount-related expenses associated with sales and marketing personnel, and the costs of advertising, promotions, tradeshows, seminars, and other programs. Advertising costs are expensed as incurred. The Company did not incur any advertising expenses in fiscal years 2009 and 2008.
| (R) | General & Administrative Expenses |
General and administrative expenses are comprised of executive compensation, general overhead such as the finance department and administrative staff, depreciation expenses, travel and lodging, meals and entertainment, utility, and research and development expenses.
| (S) | Retirement Benefits |
Full-time employees of the Company are entitled to staff welfare benefits including medical insurance, welfare subsidies, unemployment insurance, and pension benefits through a PRC government-mandated multi-employer defined contribution plan. The Company is required to accrue for these benefits based on certain percentages of the employees’ salaries. Costs related to the retirement benefits are charged to the Company’s statements of operations as incurred.
| (T) | Income Tax |
The Company uses the accrual method of accounting to determine and report its taxable reduction of income taxes for the year in which they are available. In accordance with SFAS No. 109 “Accounting for Income Taxes” (FASB ASC 740), the Company accounts for income tax using an asset and liability approach and allows for recognition of deferred tax benefits in future years. Under the asset and liability approach, deferred taxes are provided for the net tax effects of temporary differences between the carrying amounts of assets and liabilities for financial reporting purposes and the amounts used for income tax purposes. A valuation allowance is provided for deferred tax assets if it is more likely than not that such items will either expire before the Company is able to realize their benefits, or that future realization is uncertain.
D-38
Transvideo International Ltd.
Notes to Consolidated Financial Statements
As of and for the years ended December 31, 2009 and 2008
In respect of the Company and its subsidiaries domiciled and operated in the British Virgin Islands and People’s Republic of China, the taxation of these entities are summarized below:
| Entities | Countries of Domicile | Income Tax Rate |
| TVI | BVI | 0.00% |
| China iMedia | BVI | 0.00% |
| BJ Transvideo | PRC | 25.00% |
| BJ i-Media | PRC | 25.00% |
| (U) | Foreign Currency Translation |
For financial reporting purposes, the Company’s two PRC operating subsidiaries BJ Transvideo and Beijing i-Media maintain their financial statements in functional currency, which is the Renminbi (RMB). The functional currency has been translated into United States dollars. Assets and liabilities are translated at the exchange rates at the balance sheet dates and revenue and expenses are translated at the average exchange rates, and stockholders’ equity is translated at historical exchange rates. Translation adjustments are not included in determining net income but are included in foreign exchange adjustment to other comprehensive income, a component of stockholders’ equity.
| 2009 | 2008 | |
| Year end RMB : US$ exchange rate | 6.8372 | 6.8542 |
| Average yearly RMB : US$ exchange rate | 6.8409 | 6.9623 |
| *Source data quoted from “Oanda.com” | ||
RMB is not freely convertible into foreign currency and all foreign exchange transactions must take place through authorized institutions. No representation is made that the RMB amounts could have been, or could be, converted into US$ at the rates used in translation.
| (V) | Earnings Per Share |
The Company computes earnings per share (“EPS”) in accordance with Statement of Financial Accounting Standards No. 128, “Earnings per share” (FASB ASC 260), and SEC Staff Accounting Bulletin No. 98 (“SAB 98”). SFAS No. 128 requires companies with complex capital structures to present basic and diluted EPS. Basic EPS is measured as the income or loss available to common shareholders divided by the weighted average common shares outstanding for the period. Diluted EPS is similar to basic EPS but presents the dilutive effect on a per share basis of potential common shares (e.g., contingent shares, convertible securities, options, and warrants) as if they had been converted at the beginning of the periods presented, or issuance date, if later. Potential common shares that have an anti-dilutive effect (i .e., those that increase income per share or decrease loss per share) are excluded from the calculation of diluted EPS.
| (W) | Recent Accounting Pronouncements |
In June 2009, FASB issued FASB Statement No. 166, Accounting for Transfers for Financial Assets (FASB ASC 860 Transfers and Servicing) and FASB Statement No. 167 (FASB ASC 810 Consolidation), a revision to FASB Interpretation No. 46 (Revised December 2003), Consolidation of Variable Interest Entities (FASB ASC 810 Consolidation). The Company is still evaluating the impact of the above pronouncement.
Statement 166 is a revision to FASB Statement No. 140, Accounting for Transfers and Servicing of Financial Assets and Extinguishments of Liabilities (FASB ASC 860 Transfers and Servicing), and will require more information about transfers of financial assets, including securitization transactions, and where entities have continuing exposure to the risks related to transferred financial assets. It eliminates the concept of a “qualifying special-purpose entity,” changes the requirements for derecognizing financial assets, and requires additional disclosures. Statement No. 166 (FASB ASC 860 Transfers and Serv icing) must be applied as of the beginning of each reporting entity’s first annual reporting period that begins after November 15, 2009, for interim periods within that first annual reporting period and for interim and annual reporting periods thereafter. Earlier application is prohibited. This Statement must be applied to transfers occurring on or after the effective date. The Company is still evaluating the impact of the above pronouncement.
D-39
Transvideo International Ltd.
Notes to Consolidated Financial Statements
As of and for the years ended December 31, 2009 and 2008
Statement 167 is a revision to FASB Interpretation No. 46 (Revised December 2003), Consolidation of Variable Interest Entities (FASB ASC 810 Consolidation), and changes how a reporting entity determines when an entity that is insufficiently capitalized or is not controlled through voting (or similar rights) should be consolidated. The determination of whether a reporting entity is required to consolidate another entity is based on, among other things, the other entity’s purpose and design and the reporting entity’s ability to direct the activities of the other entity that most significantly impact the other entity’s economic performance. Statement No. 167 (FASB ASC 810 Consolidation) shall be effective as of the beginning of each reporting entity’s first annual reporting period that begins after November 15, 2009, for interim periods within that first annual reporting period, and for interim and annual reporting periods thereafter. Earlier application is prohibited. The Company is still evaluating the impact of the above pronouncement.
On June 30, 2009, FASB issued FASB Statement No. 168, Accounting Standards Codification™ (FASB ASC 105 Generally Accepted Accounting Principles) a replacement of FASB Statement No. 162 the Hierarchy of Generally Accepted Accounting Principles. On the effective date of this standard, FASB Accounting Standards Codification™ (ASC) became the source of authoritative U.S. accounting and reporting standards for nongovernmental entities, in addition to guidance issued by the Securities and Exchange Commission (SEC). This statement is effective for financial statements issued for interim and annual periods ending after September 15, 2009. If an accounting c hange results from the application of this guidance, an entity should disclose the nature and reason for the change in accounting principle in their financial statements. This new standard flattens the GAAP hierarchy to two levels: one that is authoritative (in FASB ASC) and one that is non-authoritative (not in FASB ASC). Exceptions include all rules and interpretive releases of the SEC under the authority of federal securities laws, which are sources of authoritative GAAP for SEC registrants, and certain grandfathered guidance having an effective date before March 15, 1992. Statement No. 168 is the final standard that will be issued by FASB in that form. There will no longer be, for example, accounting standards in the form of statements, staff positions, Emerging Issues Task Force (EITF) abstracts, or AICPA Accounting Statements of Position. The Company is still evaluating the impact of the above pronouncement.
In October 2009, the FASB issued ASU 2009-13, Revenue Recognition (Topic 605) — Multiple-Deliverable Revenue Arrangements, a consensus of the FASB Emerging Issues Task Force (“ASU 2009-13”). ASU 2009-13 addresses the accounting for multiple-deliverable arrangements where products or services are accounted for separately rather than as a combined unit, and addresses how to separate 71 deliverables and how to measure and allocate arrangement consideration to one or more units of accounting. Existing GAAP requires an entity to use vendor-specific objective evidence (“VSOE”) or third-party evidence of a selling price to separate deliverables in a multiple-deliverable selling arrangement. As a result of ASU 2009-13, multiple-deliverable arrangements will be separated in more circumstances than under current guidance. ASU 2009-13 establishes a selling price hierarchy for determining the selling price of a deliverable. The selling price will be based on VSOE if it is available, on third-party evidence if VSOE is not available, or on an estimated selling price if neither VSOE nor third-party evidence is available. ASU 2009-13 also requires that an entity determine its best estimate of selling price in a manner that is consistent with that used to determine the selling price of the deliverable on a stand-alone basis, and increases the disclosure requirements related to an entity’s multiple-deliverable revenue arrangements. ASU 2009-13 must be prospectively applied to all revenue arrangements entered into or materially modified in fiscal years beginning on or after June 15, 2010, and early adoption is permitted. Entities may elect, but are not required, to adopt the amendments retrospectively for all periods presented. The Company expects to adopt the prov isions of ASU 2009-13 on January 1, 2011 and does not believe that the adoption of this standard will have a material impact on the financial position, results of operations, or cash flows of the Company.
In December 2009, the FASB issued ASU 2009-17, Consolidations (Topic 810) — Improvements to Financial Reporting by Enterprises Involved with Variable Interest Entities. ASU 2009-17 replaces the quantitative-based risk and rewards calculation for determining which reporting entity, if any, has a controlling financial interest in a variable interest entity with an approach focused on identifying which reporting entity has the power to direct the activities of a variable interest entity that most significantly impact the entity’s economic performance and (1) the obligation to absorb losses of the entity or (2) the right to receive benefits from the entity. An approach that is expected to be primarily qualitative will be more effective for identifying which reporting ent ity has a controlling financial interest in a variable interest entity. ASU 2009-17 also requires additional disclosures about a reporting entity’s involvement in variable interest entities. The provisions of ASU 2009-17 are to be applied beginning in the first fiscal period beginning after November 15, 2009. The Company adopted ASU 2009-17 on January 1, 2010 and does not anticipate that the adoption of this standard will have a material effect on the financial position, results of operations, or cash flows of the Company.
D-40
Transvideo International Ltd.
Notes to Consolidated Financial Statements
As of and for the years ended December 31, 2009 and 2008
| 3. | Accounts Receivable |
Accounts receivable at December 31, consisted of the following:-
| Accounts Receivable | ||||||||
| 12/31/2009 | 12/31/2008 | |||||||
| Gross accounts receivable | $ | 431,136 | $ | 307,194 | ||||
| Allowance for bad debt | (4,311 | ) | (5,558 | ) | ||||
| Net accounts receivable | $ | 426,825 | $ | 301,636 | ||||
| Allowance for Bad Debt | ||||||||
| 12/31/2009 | 12/31/2008 | |||||||
| Beginning balance | $ | (5,558 | ) | $ | - | |||
| Allowance provided | - | (5,558 | ) | |||||
| Bad debt written off | - | - | ||||||
| Reversal | 1,247 | - | ||||||
| Ending balance | $ | (4,311 | ) | $ | (5,558 | ) | ||
| Accounts Receivable Aging Report | ||||||||
| 12/31/2009 | 12/31/2008 | |||||||
| <30 days | $ | 414,713 | $ | 217,784 | ||||
| 30-60 days | - | - | ||||||
| 60-90 days | - | 13 | ||||||
| 90-180 days | - | 72,072 | ||||||
| 180-360 days | - | - | ||||||
| >360 days | 12,112 | 11,767 | ||||||
| Total | $ | 426,825 | $ | 301,636 | ||||
| 4. | Inventory |
| 12/31/2009 | 12/31/2008 | |||||||
| Raw materials | $ | 449,876 | $ | 744,553 | ||||
| Work in progress | 26,198 | 33,221 | ||||||
| Finished goods | 158,418 | 120,026 | ||||||
| $ | 634,492 | $ | 897,800 | |||||
D-41
Transvideo International Ltd.
Notes to Consolidated Financial Statements
As of and for the years ended December 31, 2009 and 2008
| 5. | Due to/Due from Related Parties |
In the normal course of business of selling its products and purchasing of raw materials, the Company conducts transactions with the following related parties: (a) Avantalion LLC (“Avantalion”), (b) KyLinTV, Inc. (“KyLinTV”), (c) Beijing KyLinTV Co., Ltd. (“BJ KyLinTV”) and (d) NeuLion, Inc. (“NeuLion”). Avantalion owns 90% of the Company. Avantalion represents a 39% stake ownership in KyLinTV. BJ KyLinTV is a subsidiary of KyLinTV. At December31, 2009, NeuLion held 17.1% ownership of KyLinTV; subsequently, Neulion reduced its investment in KylinTV. At April 25, 2010, Neulion’s held 12.2% of KylinTV.
In the event that the Company has both receivables from, and payables to the related parties it will, in accordance with FIN 39 (FASB ASC 210-20), setoff the balances in order to arrive at a single balance that is either due from, or due to the related parties. The Company’s outstanding related party receivables and payables at December 31, 2009 and 2008 are detailed in the following table.
| As of December 31, 2009 | |||||
| Ref. | Subsidiary | Nature of Balance | Related Party | Balance | Description of Transaction |
| A | BJ Transvideo | Sale of Products resulting in Trade Receivable from | KyLinTV | $ 14,279 | BJ Transvideo licensed content to KyLinTV in December 2009 |
| B | TVI | Sale of Products resulting in Trade Receivable from | KyLinTV | 34,700 | TVI licensed content to KyLinTV in December 2009 |
| C | TVI | Sale of Products resulting in Trade Receivable from | NeuLion | 298,291 | TVI sold set top boxes to NeuLion in November 2009 on credit |
| Subtotal of related party sales | 347,270 | ||||
| D | BJ i-Media | Loan Receivable from | BJ KyLinTV | 877,552 | BJ i-Media lent funds to BJ KyLinTV in May 2009 |
| E | TVI | Loan Receivable from | KyLinTV | 1,500,000 | TVI lent funds to KyLinTV in May 2009 |
| Subtotal loans to related parties | 2,377,552 | ||||
| Gross related party receivables | $ 2,724,822 | ||||
| Ref. | Subsidiary: | Nature of Balance | Related Party | Balance | Description of Transaction |
| F | TVI | Future sales of product resulting in a liability | KyLinTV | $ 105,000 | KyLinTV issued an advance to TVI in December 2009 as a deposit for the purchase of products |
| G | TVI | Loan Payable to | Avantalion | 10,000 | TVI borrowed fund from Avantalion in June 2009 |
| Subtotal loans from related party | 115,000 | ||||
| Gross related party payables | $ 115,000 | ||||
| A. | BJ Transvideo licensed $14,279 worth of content to KyLinTV in December 2009. |
| B. | TVI licensed $34,700 worth of content to KyLinTV in December 2009. |
| C. | TVI sold $298,291 worth of products to NeuLion on credit. |
D-42
Transvideo International Ltd.
Notes to Consolidated Financial Statements
As of and for the years ended December 31, 2009 and 2008
| D. | BJ i-Media lent $877,552 to BJ KyLinTV. The loan is unsecured, interest free and has no fixed payment terms. |
| E. | TVI lent $1,500,000 to KyLinTV. The loan is unsecured, interest free and has no fixed payment terms. |
| F. | KyLinTV advanced $105,000 to TVI for the purchase of products. |
| G. | TVI borrowed $10,000 from Avantalion in June 2009. |
| As of December 31, 2008 | |||||
| Ref. | Subsidiary | Nature of Balance | Related Party | Balance | Description of Transaction |
| A | BJ Transvideo | Sale of services resulting in Trade Receivable from | KyLinTV | $ 457,834 | BJ Transvideo provided services to KyLinTV in November 2008 |
| B | TVI | Sale of services resulting in Trade Receivable from | NeuLion | 55,680 | TVI performed transcoding services to NeuLion in March 2008 |
| Subtotal of related party sales | 513,514 | ||||
| Gross related party receivables | 513,514 | ||||
| Ref. | Subsidiary: | Nature of Balance | Related Party | Balance | Description of Transaction |
| C | BJ Transvideo | Trade payable for services provided by | BJ KyLinTV | 13,577 | BJ KyLinTV provided services to BJ Transvideo in December 2008 |
| Subtotal sales from related party | 13,577 | ||||
| Gross related party payables | $ 13,577 | ||||
| A. | BJ Transvideo provided $457,834 worth of service to KyLinTV in November 2008. |
| B. | TVI performed $55,680 worth of transcoding service to NeuLion in March 2008. |
| C. | BJ KyLinTV provided $13,577 services to BJ Tranvideo in December 2008. |
The related party receivable balance detailed above, and the related transactions that comprise that balance were integral and material to the Company’s operations. The Company was reliant on transactions with the above related parties in order to conduct its business normally. The Company acknowledges that it has the responsibility to comply with paragraph c of SFAS 57 (FASB ASC 850) which calls for the dollar amounts of transactions for each of the periods for which income statements are presented and the effects of any change in the method of establishing the terms from that used in the preceding period.
The Company’s related party receivables and payables in the period presented were in the form of either short-term loans bearing no interest, or trade payables and receivables relating to the purchase of products, materials, and services for which payment was due within a short period of time. Management believes that the net receivables from related parties are fully recoverable.
The Company believes that related party transactions have in the past, had a significant bearing on the Company’s financial statements. As of December 31, 2009, approximately 68% of the Company’s sales were with related parties.
D-43
Transvideo International Ltd.
Notes to Consolidated Financial Statements
As of and for the years ended December 31, 2009 and 2008
| 6. | Equipment |
| Accumulated | ||||||||||||
| 12/31/2009 | Cost | Depreciation | Net | |||||||||
| Office equipment | $ | 581,128 | $ | 328,808 | $ | 252,320 | ||||||
| Motor vehicles | 143,942 | 75,074 | 68,868 | |||||||||
| $ | 725,070 | $ | 403,882 | $ | 321,188 | |||||||
| Accumulated | ||||||||||||
| 12/31/2008 | Cost | Depreciation | Net | |||||||||
| Office equipment | $ | 569,776 | $ | 235,467 | $ | 334,309 | ||||||
| Motor vehicles | 143,586 | 49,043 | 94,543 | |||||||||
| $ | 713,362 | $ | 284,510 | $ | 428,852 | |||||||
| 7. | Intangible Assets |
| 12/31/2009 | Cost | Accumulated Amortization | Net | |||||||||
| Accounting software | $ | 22,926 | $ | 7,795 | $ | 15,131 | ||||||
| 12/31/2008 | Cost | Accumulated Amortization | Net | |||||||||
| Accounting software | $ | 21,059 | $ | 4,936 | $ | 16,123 | ||||||
| 8. | Commitments |
| (a) | Operating Lease Commitment |
The annual lease expense for the years ended December 31, 2009 and 2008 was $67,745 and $67,745, respectively. The future minimum lease payments under non-cancelable operating leases until termination are shown below:
| Fiscal Years | Minimum Lease Payments | |||
| 2010 | $ | 67,745 | ||
| 2011 | 67,745 | |||
| 2012 | 40,254 | |||
| Total | $ | 175,744 | ||
D-44
Transvideo International Ltd.
Notes to Consolidated Financial Statements
As of and for the years ended December 31, 2009 and 2008
| (b) | Statutory Reserve Commitment |
In compliance with PRC laws, the Company is required to appropriate a portion of its net income to its statutory reserve up to a maximum of 50% of an enterprise’s registered capital in the PRC. The Company had future unfunded commitments, as provided below.
| 12/31/2009 | 12/31/2008 | |||||||
| PRC Subsidiaries registered capital | ||||||||
| Beijing Transvideo | $ | 2,922,660 | $ | 2,922,660 | ||||
| Beijing iMedia | 3,000,000 | 3,000,000 | ||||||
| Statutory reserve ceiling based | ||||||||
| on 50% of PRC registered capital | 2,961,330 | 2,961,330 | ||||||
Less: Retained earnings appropriated to statutory reserve | (535 | ) | (535 | ) | ||||
| Reserve commitment outstanding | $ | 2,960,795 | $ | 2,960,795 | ||||
| 10. | Income Tax |
The Company and its wholly owned subsidiary China iMedia are not subject to income tax because they are domiciled in British Virgin Islands.
On March 16, 2007, the PRC government passed new tax legislation that repealed preferential tax treatment for foreign investment enterprises in the PRC and enacted new tax regulations that became effective January 1, 2008. Under such regulations, with certain exceptions, both domestic and foreign enterprises will be taxed at a standard enterprise income tax rate of 25%. BJ Transvideo and BJ i-Media’s operations are both conducted in the PRC which makes them subject to the 25% income tax rate.
BJ Transvideo and BJ i-Media on a full year basis, incurred net operating losses for the year ended December 31, 2009; accordingly, they did not provide for income taxes for 2009. They also did not recognize a deferred tax asset as a result of their net operating losses because they believed it was unlikely that such assets would be realized on a carry forward basis. For the year ended December 31, 2008, BJ both Transvideo and BJ i-Media recognized net operating income. The Company believes that it has enough accumulated net operating losses in prior periods to offset a significant portion of the operating income earned in 2008; therefore, the Company only accrued in a minimal income tax expense of $1,477 for the year. The Company does not believe that operating loss prior to 2008 will be ca rried forward beyond 2008; accordingly, the Company has not accrued any deferred tax assets at December 31, 2008.
The differences between the Company's statutory tax rate and effective tax rate for the years ended December 31, 2009 and 2008 are shown in the following table:
| December 31, 2009 | December 31, 2008 | |||||||
| PRC statutory tax rate | 25.00% | 25.00% | ||||||
| Accruals and reconciling items | - | 24.72% | ||||||
| Effective tax rate | N/A | 0.28% | ||||||
D-45
Transvideo International Ltd.
Notes to Consolidated Financial Statements
As of and for the years ended December 31, 2009 and 2008
| 11. | Concentration of Risk |
| (A) | Demand risk |
The Company had concentrations of risk in demand for its products because its sales of products with related parties KyLinTV and NeuLion accounted for a significant portion of total sales.
| 12. | Earnings per Share |
| 12 months | 12 months | |||||||
| ended | Ended | |||||||
| December 31, | December 31, | |||||||
| 2009 | 2008 | |||||||
| Basic earnings per share numerator | ||||||||
| Net income (loss) attributable to common stockholders | $ | (763,116 | ) | $ | 596,691 | |||
| Diluted earnings per share numerator | $ | (763,116 | ) | $ | 596,691 | |||
| Original shares: | 3,163,200 | 2,742,000 | ||||||
| Additions from actual events | ||||||||
| - Issuance of common stock | 21,569 | 154,440 | ||||||
| Basic weighted average shares outstanding | 3,184,769 | 2,896,440 | ||||||
| Dilutive shares: | ||||||||
| Diluted weighted average shares outstanding: | 3,184,769 | 2,896,440 | ||||||
| Earnings (loss) per share | ||||||||
| - Basic | $ | (0.24 | ) | $ | 0.21 | |||
| - Diluted | $ | (0.24 | ) | $ | 0.21 | |||
| Weighted average shares outstanding | ||||||||
| - Basic | 3,184,769 | 2,896,440 | ||||||
| - Diluted | 3,184,769 | 2,896,440 | ||||||
| 13. | Other Income/Expense |
| 12/31/2009 | 12/31/2008 | |||||||
| Other income | $ | 27,443 | $ | 2,011 | ||||
| Other expenses | (8,507 | ) | (621 | ) | ||||
| Interest income | 57,639 | 24,243 | ||||||
| Interest expense | (1,513 | ) | (3,407 | ) | ||||
| Total other income (loss) & expense | $ | 75,062 | $ | 22,226 | ||||
D-46
Transvideo International Ltd.
Notes to Consolidated Financial Statements
As of and for the years ended December 31, 2009 and 2008
| 14. | Financial Instruments |
The Company's financial instruments consist of cash and cash equivalents, accounts and other receivables, accounts and other payables, accrued liabilities, and amounts due from and due to related parties. The fair values of these financial instruments approximate their carrying values due to the relatively short-term maturity of these instruments.
Interest Rate and Credit Risk
Financial instruments that potentially subject the Company to concentrations of credit risks consist principally of accounts receivable and amounts due from related parties.
The Company's accounts receivable are from repeat customers. The Company extends credits to its customer and has accrued an allowance for doubtful accounts to account for the risk of default by its customers. Management regularly monitors the level of accounts receivable attributable to each customer and the length of time taken for amounts to be settled and where necessary, takes appropriate action to collect on past due balances.
Management does not believe that there is a concentration of credit risk arising from any one customer related to accounts receivables. In the event that a customer becomes unable to pay its balance due, the maximum loss would be the carrying value of the accounts receivable. Management does believe there is significant concentration of risk from related parties and if any of the related parties as detailed in Note 5 become insolvent, the Company may suffer material losses.
Currency Risk
The Company generates revenues and incurs expenses and expenditures primarily in China and is exposed to risk from changes in foreign currency rates if it were to actually convert its RMB into USD. The Company has not hedged its exposure to currency fluctuations.
Liquidity Risk
Liquidity risk is the risk that the Company will not be able to meet its financial obligations as they become due. The Company's objective to managing liquidity risk is to ensure that it has sufficient cash available to meet its liabilities when they become due. The ability to settle it obligations is reliant on the Company collecting its accounts receivables and amounts due from related parties in a timely manner and by maintaining sufficient cash on hand.
D-47
Schedule 2
TransVideo Interim Financial Statements
Transvideo International Ltd.
Consolidated Financial Statements
March 31, 2010 and December 31, 2009
(Stated in US Dollars)
D-48
Transvideo International Ltd.
| Contents | Pages |
| Report of Independent Registered Public Accounting Firm | D-50 |
| Consolidated Balance Sheets | D-51 - D-52 |
| Consolidated Statements of Operations | D-53 |
| Consolidated Statements of Changes in Stockholders’ Equity | D-54 |
| Consolidated Statements of Cash Flows | D-55 |
| Notes to Consolidated Financial Statements | D-56 - D-71 |
D-49
| To: | The Board of Directors and Stockholders |
| Transvideo International Ltd. |
Report of Independent Registered Public Accounting Firm
We have reviewed the accompanying consolidated interim balance sheets of Transvideo International Ltd. as of March 31, 2010 and December 31, 2009, and the related consolidated statements of operations, changes in stockholders’ equity, and cash flows for the three-month periods ended March 31, 2010 and 2009. These consolidated interim financial statements are the responsibility of the Company's management.
We conducted our review in accordance with the standards of the Public Company Accounting Oversight Board (United States). A review of interim financial statements consists principally of applying analytical procedures and making inquiries of persons responsible for financial and accounting matters. It is substantially less in scope than an audit conducted in accordance with the standards of the Public Company Accounting Oversight Board, the objective of which is the expression of an opinion regarding the financial statements taken as a whole. Accordingly, we do not express such an opinion.
Based on our review, we are not aware of any material modifications that should be made to the accompanying consolidated interim financial statements for them to be in conformity with U.S. generally accepted accounting principles.
| South San Francisco, California | Samuel H. Wong & Co., LLP | |
| June 7, 2010 | Certified Public Accountants |
D-50
Transvideo International Ltd.
Consolidated Balance Sheets
As of March 31, 2010 and December 31, 2009
(Stated in US Dollars)
| ASSETS | Note | 3/31/2010 | 12/31/2009 | |||||||||
| Current Assets | ||||||||||||
| Cash | 2D | $ | 1,421,827 | $ | 1,521,168 | |||||||
| Accounts receivable | 2E,3 | 384,652 | 426,825 | |||||||||
| Other receivable | 251,484 | 261,786 | ||||||||||
| Due from related parties | 5 | 1,032,716 | 2,724,822 | |||||||||
| Inventory | 2F,4 | 572,896 | 634,492 | |||||||||
| Prepaid taxes and expenses | 197,431 | 117,993 | ||||||||||
| Total current assets | 3,861,006 | 5,687,086 | ||||||||||
| Non-Current Assets | ||||||||||||
| Investment | 2J,6 | 890,284 | - | |||||||||
Equipment, net | 2G,7 | 295,923 | 321,188 | |||||||||
Intangible assets, net | 2H,8 | 14,298 | 15,131 | |||||||||
| Other assets | 43,470 | 48,105 | ||||||||||
| Total non-current assets | 1,243,975 | 384,424 | ||||||||||
| Total assets | $ | 5,104,981 | $ | 6,071,510 | ||||||||
| LIABILITIES | ||||||||||||
| Current Liabilities | ||||||||||||
| Accounts and other payables | $ | 503,522 | $ | 452,048 | ||||||||
| Taxes payable | 46,012 | 49,939 | ||||||||||
| Due to related parties | 5 | 86,477 | 115,000 | |||||||||
| Accrued liabilities | 57,562 | 55,987 | ||||||||||
| Customer deposits | 2I | 370,063 | 436,143 | |||||||||
| Total current liabilities | 1,063,636 | 1,109,119 | ||||||||||
| Total liabilities | $ | 1,063,636 | $ | 1,109,119 | ||||||||
See Notes to Financial Statements and Accountant’s Report
D-51
Transvideo International Ltd.
Consolidated Balance Sheets
As of March 31, 2010 and December 31, 2009
(Stated in US Dollars)
STOCKHOLDERS' EQUITY | ||||||||||||
| 3/31/2010 | 12/31/2009 | |||||||||||
Common stock - $0.01 par value, 5,000,000 shares authorized; 3,200,000 shares issued and outstanding at March 31, 2010 and December 31, 2009, respectively. | $ | 32,000 | $ | 32,000 | ||||||||
| Additional paid in capital | 4,157,781 | 4,157,781 | ||||||||||
| Statutory reserve | 2K,9(b) | 535 | 535 | |||||||||
| Retained earnings/(accumulated deficit) | (1,258,731 | ) | (330,524 | ) | ||||||||
| Accumulated other comprehensive income | 2L | 590,563 | 567,554 | |||||||||
| Non-controlling interest | 519,197 | 535,045 | ||||||||||
| Total stockholders’ equity | 4,041,345 | 4,962,391 | ||||||||||
| Total liabilities and stockholders’ equity | $ | 5,104,981 | $ | 6,071,510 | ||||||||
See Notes to Financial Statements and Accountant’s Report
D-52
Transvideo International Ltd.
Consolidated Statements of Operations
For the three-month periods ended March 31, 2010 and 2009
(Stated in US Dollars)
| Note | 3/31/2010 | 3/31/2009 | ||||||||||
| Revenues | 2M | $ | 409,205 | $ | 1,150,389 | |||||||
| Operating expenses: | ||||||||||||
| Cost of revenues | 2N | 308,832 | 406,036 | |||||||||
| Research and development | 2P | 184,210 | 208,197 | |||||||||
| Sales and marketing | 2Q | 58,124 | 80,653 | |||||||||
| General and administrative | 2R | 195,343 | 282,062 | |||||||||
Total operating expenses | 746,509 | 976,948 | ||||||||||
| Operating income/(loss) | (337,304 | ) | 173,441 | |||||||||
| Other income/(expense) | 13 | (606,751 | ) | 37,905 | ||||||||
| Earnings (loss) before tax | (944,055 | ) | 211,346 | |||||||||
| Provision for income taxes | 2T,11 | - | - | |||||||||
| Net income (loss) | $ | (944,055 | ) | $ | 211,346 | |||||||
| Net income (loss) attributable to: | ||||||||||||
| - Common stockholders | $ | (928,207 | ) | $ | 222,006 | |||||||
| - Non-controlling interest | $ | (15,848 | ) | $ | (10,660 | ) | ||||||
| Earnings (loss) per share | 2V,12 | |||||||||||
- Basic | $ | (0.29 | ) | $ | 0.07 | |||||||
- Diluted | $ | (0.29 | ) | $ | 0.07 | |||||||
| Weighted average shares outstanding | ||||||||||||
- Basic | 3,200,000 | 3,163,200 | ||||||||||
- Diluted | 3,200,000 | 3,163,200 | ||||||||||
See Notes to Financial Statements and Accountant’s Report
D-53
Transvideo International Ltd.
Consolidated Statements of Changes in Stockholders’ Equity
As of March 31, 2010 and December 31, 2009
(Stated in US Dollars)
| Retained | Accumulated | |||||||||||||||||||||||||||||||
| Number | Additional | Non- | Earnings/ | Other | ||||||||||||||||||||||||||||
| of | Common | Paid in | Statutory | Controlling | (Accumulated | Comprehensive | ||||||||||||||||||||||||||
| Shares | Stock | Capital | Reserve | Interest | Deficit) | Income | Total | |||||||||||||||||||||||||
| Balance at January 1, 2009 | 3,163,200 | $ | 31,632 | $ | 4,134,123 | $ | 535 | $ | 600,683 | $ | 432,593 | $ | 555,337 | $ | 5,754,903 | |||||||||||||||||
| Issuance of common stock for cash and employee compensation | 36,800 | 368 | 23,658 | - | - | - | - | 24,026 | ||||||||||||||||||||||||
| Net loss | - | - | - | - | - | (828,755 | ) | - | (828,755 | ) | ||||||||||||||||||||||
| Appropriation of loss to non-controlling interest | - | - | - | - | (65,639 | ) | 65,639 | - | - | |||||||||||||||||||||||
| Foreign currency translation adjustment | - | - | - | - | - | - | 12,217 | 12,217 | ||||||||||||||||||||||||
| Balance at December 31, 2009 | 3,200,000 | $ | 32,000 | $ | 4,157,781 | $ | 535 | $ | 535,045 | $ | (330,524 | ) | $ | 567,554 | $ | 4,962,391 | ||||||||||||||||
| Balance at January 1, 2010 | 3,200,000 | $ | 32,000 | $ | 4,157,781 | $ | 535 | $ | 535,045 | $ | (330,524 | ) | $ | 567,554 | $ | 4,962,391 | ||||||||||||||||
| Issuance of common stock for cash and employee compensation | - | - | - | - | - | - | - | - | ||||||||||||||||||||||||
| Net loss | - | - | - | - | - | (944,055 | ) | - | (944,055 | ) | ||||||||||||||||||||||
| Appropriation of loss to non-controlling interest | - | - | - | - | (15,848 | ) | 15,848 | - | - | |||||||||||||||||||||||
| Foreign currency translation adjustment | - | - | - | - | - | - | 23,009 | 23,009 | ||||||||||||||||||||||||
| Balance at March 31, 2010 | 3,200,000 | $ | 32,000 | $ | 4,157,781 | $ | 535 | $ | 519,197 | $ | (1,258,731 | ) | $ | 590,563 | $ | 4,041,345 | ||||||||||||||||
| Comprehensive Income | Accumulated | |||||||||||
| 12/31/2009 | 3/31/2010 | Total | ||||||||||
| Net income (loss) | $ | (828,755 | ) | $ | (944,055 | ) | $ | (1,772,810 | ) | |||
| Other Comprehensive Income | ||||||||||||
| Foreign currency translation adjustment | 12,217 | 23,009 | 35,226 | |||||||||
| $ | (816,538 | ) | $ | (921,046 | ) | $ | (1,737,584 | ) | ||||
See Notes to Financial Statements and Accountant’s Report
D-54
Transvideo International Ltd.
Consolidated Statements of Cash Flows
For the three-month periods ended March 31, 2010 and 2009
(Stated in US Dollars)
| 3/31/2010 | 3/31/2009 | ||||||||
| Cash Flows from Operating Activities | Note | ||||||||
| Net income (loss) | $ | (944,055 | ) | $ | 211,347 | ||||
| Adjustments to reconcile net income to net cash from operations: | |||||||||
| Loss on long term investment | 609,716 | - | |||||||
| Depreciation | 30,248 | 32,982 | |||||||
| Amortization | 1,103 | 482 | |||||||
| Decrease/(increase) in accounts and other receivable | 52,473 | (722,066 | ) | ||||||
| Decrease/(increase) in due from related party | 192,106 | 448,290 | |||||||
| Decrease/(increase) in inventory | 61,596 | 209,912 | |||||||
| Decrease/(increase) in prepaid tax and expense | (79,438 | ) | 19,738 | ||||||
| Increase/(decrease) in accounts and other payable | 51,474 | (301,936 | ) | ||||||
| Increase/(decrease) in taxes payable | (3,927 | ) | (8,902 | ) | |||||
| Increase/(decrease) in due to related party | (28,523 | ) | (13,577 | ) | |||||
| Increase/(decrease) in accrued liabilities | 1,574 | (4,921 | ) | ||||||
| Increase/(decrease) in customer deposits | (66,080 | ) | (114,685 | ) | |||||
| Increase/(decrease) in deferred revenue | - | (50,000 | ) | ||||||
| Cash sourced/(used) in operating activities | (121,733 | ) | (293,336 | ) | |||||
| Cash Flows from Investing Activities | |||||||||
| Purchases of equipment | (4,982 | ) | (12,589 | ) | |||||
| Purchase of intangible assets | (270 | ) | (4 | ) | |||||
| (Increase)/decrease in other assets | 4,635 | 8,013 | |||||||
| Cash (used)/sourced in investing activities | (617 | ) | (4,579 | ) | |||||
| Cash Flows from Financing Activities | |||||||||
| Issuance of common stock | - | - | |||||||
| Cash sourced/(used) in financing activities | - | - | |||||||
| Net increase/(decrease) in cash & cash equivalents for the year | (122,350 | ) | (297,915 | ) | |||||
| Effect of foreign currency translation adjustment | 23,009 | 32,178 | |||||||
| Cash & cash equivalents at beginning of year | 1,521,168 | 4,284,829 | |||||||
| Cash & cash equivalents at end of year | $ | 1,421,827 | $ | 4,019,092 | |||||
| Supplementary cash flow information: | |||||||||
| Interest received | $ | 12,523 | $ | 37,902 | |||||
| Interest paid | - | - | |||||||
| Income taxes paid | - | - | |||||||
| Non-cash investing activity: | |||||||||
| Conversion of loan from related party to investment | $ | 1,500,000 | $ | - | |||||
See Notes to Financial Statements and Accountant’s Report
D-55
Transvideo International Ltd.
Notes to Consolidated Financial Statements
As of March 31, 2010 and December 31, 2009
And for the three-month periods ended March 31, 2010 and 2009
| 1. | Organization and Principal Business Activities |
Transvideo International Ltd. (the “Company” or “TVI”) is a British Virgin Islands Company, incorporated on February 5, 2004 under the British Virgin Islands Business Companies Act, 2004. The Company operates through its directly and indirectly held subsidiaries. The Company directly holds (a) Beijing Digital Transvideo Technology Co., Ltd. (“BJ Transvideo”) and (b) China iMedia Enterprise Ltd. (“China iMedia”). BJ Transvideo was incorporated and is domiciled in the Peoples Republic of China (the “PRC”). China iMedia was incorporated on February 5, 2004 under the British Virgin Islands Business Companies Act, 2004. The Company through its holding of China iMedia indirectly holds Beijing i-Media Technology Co., Ltd. (“BJ i-Media”) w hich was incorporated and is domiciled in the PRC.
Business
The Company’s primary business activity is the provision of network digital audio/video technology products, which include but are not limited to: Box series H.264 IP Set Top Boxes (STB), Transcode H.264 Real Time Transcoding Devices, Studio Content Production Management Systems and TV center Rich-media services platforms. The Company’s products are widely applied on commercial IPTV operation platforms, which include Broadband Live Broadcast, TV-experience of VOD, Regional Hotel Entertainment VOD, Enterprise Remote Video Education, Business Area Video Publicity, and Family Media Center.
BJ Transvideo is a network digital audio/video technology provider. It is principally engaged in the sale of STB, STB's spare parts and STB's software licenses.
China iMedia and BJ i-Media are engaged in baby education services, sales of STB, and production of new media services.
| 2. | Summary of Significant Accounting Policies |
| (A) | Method of Accounting |
The Company maintains its general ledger and journals with the accrual method accounting for financial reporting purposes. The financial statements and notes are representations of management. Accounting policies adopted by the Company conform to generally accepted accounting principles in the United States of America and have been consistently applied in the presentation of financial statements.
| (B) | Consolidation |
The consolidated financial statements include all the financial statements of the Company and its two PRC subsidiaries and one BVI subsidiary. Inter-company transactions, such as sales, cost of sales, due to/due from balances, investment in subsidiaries, and subsidiaries’ capitalization have been eliminated.
The Company’s subsidiaries and investment interests as of March 31, 2010 are detailed below:
| Name of Entities | Date of Incorporation | Place of Incorporation | Attributable Equity Interest | Registered Capital |
| China iMedia | 2/5/2004 | BVI | 66% | USD 79,992 |
| BJ Transvideo | 4/11/2003 | PRC | 100% | RMB 25,566,438 |
| BJ i-Media | 6/1/2004 | PRC | 66% | RMB 24,066,280 |
D-56
Transvideo International Ltd.
Notes to Consolidated Financial Statements
As of March 31, 2010 and December 31, 2009
And for the three-month periods ended March 31, 2010 and 2009
| (C) | Use of Estimates |
The preparation of financial statements in conformity with generally accepted accounting principles in the United States of America requires management to make estimates and assumptions that affect the reported amounts of assets and liabilities and disclosure of contingent assets and liabilities at the date of the financial statements and the reported amounts of revenues and expenses during the reporting period. Management makes these estimates using the best information available at the time the estimates are made; however, actual results could differ materially from these estimates.
| (D) | Cash and Cash Equivalents |
Cash and cash equivalents are carried at cost and represent cash on hand, demand deposits placed with banks or other financial institutions and all highly liquid investments with an original maturity of three months or less as of the purchase date of such investments.
| (E) | Accounts Receivable |
Trade receivables are recognized and carried at the original invoice amount less allowance for any uncollectible amounts. An estimate for doubtful accounts is made when collection of the full amount is no longer probable. Bad debts are written off as incurred.
| (F) | Inventory |
Inventory is stated at the lower of cost or market value. Cost is computed using the weighted average method and includes all costs of purchase and other costs incurred in bringing the inventories to their present location and condition. Market value is determined by reference to the sales proceeds of items sold in the ordinary course of business or estimates based on prevailing market conditions.
| (G) | Property, Plant, and Equipment |
Property, plant, and equipment are stated at cost. Repairs and maintenance to these assets are charged to expense as incurred; major improvements enhancing the function and/or useful life are capitalized. When items are sold or retired, the related cost and accumulated depreciation are removed from the accounts and any gains or losses arising from such transactions are recognized.
Property, plant, and equipment are depreciated using the straight-line method over their estimated useful life with a 10% salvage value. Their useful lives are as follows:
| Fixed Assets Classification | Estimated Useful Life |
| Office equipment | 5 Years |
| Motor vehicles | 5 Years |
| (H) | Intangible Assets |
Intangible assets are stated at cost less accumulated amortization and impairment loss. Amortization is provided over their estimated useful lives, using the straight-line method. Estimated useful lives of the intangibles are as follows:
| Asset Class | Estimated Useful Life |
| Accounting software | 5 years |
D-57
Transvideo International Ltd.
Notes to Consolidated Financial Statements
As of March 31, 2010 and December 31, 2009
And for the three-month periods ended March 31, 2010 and 2009
| (I) | Customer Deposits |
Customer deposits represent the money the Company has received from customers in advance for the purchase of goods. The Company considers customer deposits as a liability until the title of goods have been transferred at which point the balance will be credited to sales revenue.
| (J) | Investment in Equity Securities |
The equity method of accounting was used to account for the Company’s investment in equity securities for which the Company did not have controlling equity interest. Non-controlling equity interest for the Company is typically a position of less than 50% beneficial ownership.
The consolidated statement of income includes the Company's share of the post-acquisition results of the investment’s performance for the year. In the consolidated balance sheet, investments in equity securities are stated at the Company's share of the net assets of the investments plus any potential premium, or less discounts paid at the time of acquisition, and less any identified impairment loss.
The Company’s owns a 32.74% stake in KyLinTV, Inc. (“KyLinTV”). KyLinTv is principally engaged in the business of providing IPTV service.
| (K) | Statutory Reserve |
Statutory reserve refer to the amount appropriated from the net income in accordance with laws or regulations, which can be used to recover losses and increase capital, as approved, and, are to be used to expand production or operation. PRC laws prescribe that an enterprise operating at a profit, must appropriate, on an annual basis, from its earnings, an amount to the statutory reserve to be used for future company development. Such an appropriation is made until the reserve reaches a maximum equalling 50% of the enterprise’s capital.
| (L) | Comprehensive Income |
In accordance with SFAS No. 130, “Reporting Comprehensive Income”, comprehensive income is defined to include all changes in equity except those resulting from investments by owners and distributions to owners. Among other disclosures, all items that are required to be recognized under current accounting standards as components of comprehensive income are required to be reported in a financial statement that is presented with the same prominence as other financial statements. The Company’s other comprehensive income is attributable to foreign currency translation adjustment.
| (M) | Recognition of Revenue |
Revenue is recognized when persuasive evidence of an arrangement exists, delivery has occurred, the fee is fixed or determinable, and collectability is probable.
Revenue for retail packaged products are recognized as products are shipped. The license fee related for the source code to the IPTV Serve Software is recorded as deferred revenue and amortized under a straight-line basis over the related products’ life cycles. Maintenance service fee is recognized as service has been rendered to customers.
D-58
Transvideo International Ltd.
Notes to Consolidated Financial Statements
As of March 31, 2010 and December 31, 2009
And for the three-month periods ended March 31, 2010 and 2009
| (N) | Cost of Revenues |
Cost of revenue includes manufacturing and distribution costs for products sold and programs licensed, operating costs related to product support service centers and product distribution centers, costs incurred to support and maintain Source Code IPTV products and services, inventory valuation adjustments, and the amortization of capitalized research and development costs associated with software products that have reached technological feasibility. Capitalized research and development costs are amortized over the estimated lives of the products.
| (O) | Product Warranty |
The Company provides for the estimated costs of fulfilling obligations under hardware and software warranties at the time the related revenue is recognized. For hardware warranties, the Company estimates the costs based on historical and projected product failure rates, historical and projected repair costs, and knowledge of specific product failures (if any). The specific hardware warranty terms and conditions vary depending upon the product sold, but generally include parts and labor over a period of one year. For software warranties, the Company estimates the costs to provide bug fixes, such as security patches, over the estimated life of the software.
| (P) | Research and Development |
Research and development expenses include payroll, employee benefits and other headcount-related expenses associated with product development. Research and development expenses also include third-party development and programming costs, localization costs incurred to translate software for international markets, the amortization of purchased software code and services content, and in-process research and development. Such costs related to software development are included in research and development expense until the point that technological feasibility is reached, which for software products, is generally shortly before the products are released to manufacturing. Once technological feasibility is reached, such costs are capitalized and amortized to cost of revenue over the estimated lives of the products.
| (Q) | Sales and Marketing |
Sales and marketing expenses include payroll, employee benefits and other headcount-related expenses associated with sales and marketing personnel, and the costs of advertising, promotions, tradeshows, seminars, and other programs. Advertising costs are expensed as incurred. The Company did not incur any advertising expenses in years 2010 and 2009.
| (R) | General & Administrative Expenses |
General and administrative expenses are comprised of executive compensation, general overhead such as the finance department and administrative staff, depreciation expenses, travel and lodging, meals and entertainment, utility, and research and development expenses.
| (S) | Retirement Benefits |
Full-time employees of the Company are entitled to staff welfare benefits including medical insurance, welfare subsidies, unemployment insurance, and pension benefits through a PRC government-mandated multi-employer defined contribution plan. The Company is required to accrue for these benefits based on certain percentages of the employees’ salaries. Costs related to the retirement benefits are charged to the Company’s statements of operations as incurred.
D-59
Transvideo International Ltd.
Notes to Consolidated Financial Statements
As of March 31, 2010 and December 31, 2009
And for the three-month periods ended March 31, 2010 and 2009
| (T) | Income Tax |
The Company uses the accrual method of accounting to determine and report its taxable reduction of income taxes for the year in which they are available. In accordance with SFAS No. 109 “Accounting for Income Taxes” (FASB ASC 740), the Company accounts for income tax using an asset and liability approach and allows for recognition of deferred tax benefits in future years. Under the asset and liability approach, deferred taxes are provided for the net tax effects of temporary differences between the carrying amounts of assets and liabilities for financial reporting purposes and the amounts used for income tax purposes. A valuation allowance is provided for deferred tax assets if it is more likely than not that such items will either expire before the Company is able to realize their benefits, or that future realization is uncertain.
In respect of the Company and its subsidiaries domiciled and operated in the British Virgin Islands and People’s Republic of China, the taxation of these entities are summarized below:
| Entities | Countries of Domicile | Income Tax Rate |
| TVI | BVI | 0.00% |
| China iMedia | BVI | 0.00% |
| BJ Transvideo | PRC | 25.00% |
| BJ i-Media | PRC | 25.00% |
| (U) | Foreign Currency Translation |
For financial reporting purposes, the Company’s two PRC operating subsidiaries BJ Transvideo and Beijing i-Media maintain their financial statements in functional currency, which is the Renminbi (RMB). The functional currency has been translated into United States dollars. Assets and liabilities are translated at the exchange rates at the balance sheet dates and revenue and expenses are translated at the average exchange rates, and stockholders’ equity is translated at historical exchange rates. Translation adjustments are not included in determining net income but are included in foreign exchange adjustment to other comprehensive income, a component of stockholders’ equity.
| 3/31/2010 | 12/31/2009 | |
| Period end RMB : US$ exchange rate | 6.8361 | 6.8372 |
| Average period RMB : US$ exchange rate | 6.8360 | 6.8409 |
| *Source data quoted from “Oanda.com” | ||
RMB is not freely convertible into foreign currency and all foreign exchange transactions must take place through authorized institutions. No representation is made that the RMB amounts could have been, or could be, converted into US$ at the rates used in translation.
| (V) | Earnings Per Share |
The Company computes earnings per share (“EPS”) in accordance with Statement of Financial Accounting Standards No. 128, “Earnings per share” (FASB ASC 260), and SEC Staff Accounting Bulletin No. 98 (“SAB 98”). SFAS No. 128 requires companies with complex capital structures to present basic and diluted EPS. Basic EPS is measured as the income or loss available to common shareholders divided by the weighted average common shares outstanding for the period. Diluted EPS is similar to basic EPS but presents the dilutive effect on a per share basis of potential common shares (e.g., contingent shares, convertible securities, options, and warrants) as if they had been converted at the beginning of the periods presented, or issuance date, if later. Potential common shares that have an anti-dilutive effect (i .e., those that increase income per share or decrease loss per share) are excluded from the calculation of diluted EPS.
D-60
Transvideo International Ltd.
Notes to Consolidated Financial Statements
As of March 31, 2010 and December 31, 2009
And for the three-month periods ended March 31, 2010 and 2009
| (W) | Recent Accounting Pronouncements |
In June 2009, FASB issued FASB Statement No. 166, Accounting for Transfers for Financial Assets (FASB ASC 860 Transfers and Servicing) and FASB Statement No. 167 (FASB ASC 810 Consolidation), a revision to FASB Interpretation No. 46 (Revised December 2003), Consolidation of Variable Interest Entities (FASB ASC 810 Consolidation). The Company is still evaluating the impact of the above pronouncement.
Statement 166 is a revision to FASB Statement No. 140, Accounting for Transfers and Servicing of Financial Assets and Extinguishments of Liabilities (FASB ASC 860 Transfers and Servicing), and will require more information about transfers of financial assets, including securitization transactions, and where entities have continuing exposure to the risks related to transferred financial assets. It eliminates the concept of a “qualifying special-purpose entity,” changes the requirements for derecognizing financial assets, and requires additional disclosures. Statement No. 166 (FASB ASC 860 Transfers and Serv icing) must be applied as of the beginning of each reporting entity’s first annual reporting period that begins after November 15, 2009, for interim periods within that first annual reporting period and for interim and annual reporting periods thereafter. Earlier application is prohibited. This Statement must be applied to transfers occurring on or after the effective date. The Company is still evaluating the impact of the above pronouncement.
Statement 167 is a revision to FASB Interpretation No. 46 (Revised December 2003), Consolidation of Variable Interest Entities (FASB ASC 810 Consolidation), and changes how a reporting entity determines when an entity that is insufficiently capitalized or is not controlled through voting (or similar rights) should be consolidated. The determination of whether a reporting entity is required to consolidate another entity is based on, among other things, the other entity’s purpose and design and the reporting entity’s ability to direct the activities of the other entity that most significantly impact the other entity’s economic performance. Statement No. 167 (FASB ASC 810 Consolidation) shall be effective as of the beginning of each reporting entity’s first annual reporting period that begins after November 15, 2009, for interim periods within that first annual reporting period, and for interim and annual reporting periods thereafter. Earlier application is prohibited. The Company is still evaluating the impact of the above pronouncement.
On June 30, 2009, FASB issued FASB Statement No. 168, Accounting Standards Codification™ (FASB ASC 105 Generally Accepted Accounting Principles) a replacement of FASB Statement No. 162 the Hierarchy of Generally Accepted Accounting Principles. On the effective date of this standard, FASB Accounting Standards Codification™ (ASC) became the source of authoritative U.S. accounting and reporting standards for nongovernmental entities, in addition to guidance issued by the Securities and Exchange Commission (SEC). This statement is effective for financial statements issued for interim and annual periods ending after September 15, 2009. If an accounting c hange results from the application of this guidance, an entity should disclose the nature and reason for the change in accounting principle in their financial statements. This new standard flattens the GAAP hierarchy to two levels: one that is authoritative (in FASB ASC) and one that is non-authoritative (not in FASB ASC). Exceptions include all rules and interpretive releases of the SEC under the authority of federal securities laws, which are sources of authoritative GAAP for SEC registrants, and certain grandfathered guidance having an effective date before March 15, 1992. Statement No. 168 is the final standard that will be issued by FASB in that form. There will no longer be, for example, accounting standards in the form of statements, staff positions, Emerging Issues Task Force (EITF) abstracts, or AICPA Accounting Statements of Position. The Company is still evaluating the impact of the above pronouncement.
D-61
Transvideo International Ltd.
Notes to Consolidated Financial Statements
As of March 31, 2010 and December 31, 2009
And for the three-month periods ended March 31, 2010 and 2009
In October 2009, the FASB issued ASU 2009-13, Revenue Recognition (Topic 605) — Multiple-Deliverable Revenue Arrangements, a consensus of the FASB Emerging Issues Task Force (“ASU 2009-13”). ASU 2009-13 addresses the accounting for multiple-deliverable arrangements where products or services are accounted for separately rather than as a combined unit, and addresses how to separate 71 deliverables and how to measure and allocate arrangement consideration to one or more units of accounting. Existing GAAP requires an entity to use vendor-specific objective evidence (“VSOE”) or third-party evidence of a selling price to separate deliverables in a multiple-deliverable selling arrangement. As a result of ASU 2009-13, multiple-deliverable arrangements will be separated in more circumstances than under current guidance. ASU 2009-13 establishes a selling price hierarchy for determining the selling price of a deliverable. The selling price will be based on VSOE if it is available, on third-party evidence if VSOE is not available, or on an estimated selling price if neither VSOE nor third-party evidence is available. ASU 2009-13 also requires that an entity determine its best estimate of selling price in a manner that is consistent with that used to determine the selling price of the deliverable on a stand-alone basis, and increases the disclosure requirements related to an entity’s multiple-deliverable revenue arrangements. ASU 2009-13 must be prospectively applied to all revenue arrangements entered into or materially modified in fiscal years beginning on or after June 15, 2010, and early adoption is permitted. Entities may elect, but are not required, to adopt the amendments retrospectively for all periods presented. The Company expects to adopt the prov isions of ASU 2009-13 on January 1, 2011 and does not believe that the adoption of this standard will have a material impact on the financial position, results of operations, or cash flows of the Company.
In December 2009, the FASB issued ASU 2009-17, Consolidations (Topic 810) — Improvements to Financial Reporting by Enterprises Involved with Variable Interest Entities. ASU 2009-17 replaces the quantitative-based risk and rewards calculation for determining which reporting entity, if any, has a controlling financial interest in a variable interest entity with an approach focused on identifying which reporting entity has the power to direct the activities of a variable interest entity that most significantly impact the entity’s economic performance and (1) the obligation to absorb losses of the entity or (2) the right to receive benefits from the entity. An approach that is expected to be primarily qualitative will be more effective for identifying which reporting ent ity has a controlling financial interest in a variable interest entity. ASU 2009-17 also requires additional disclosures about a reporting entity’s involvement in variable interest entities. The provisions of ASU 2009-17 are to be applied beginning in the first fiscal period beginning after November 15, 2009. The Company adopted ASU 2009-17 on January 1, 2010 and does not anticipate that the adoption of this standard will have a material effect on the financial position, results of operations, or cash flows of the Company.
In January 2010, the FASB issued ASU 2010-02, Consolidation (Topic 810) — Accounting and Reporting for Decreases in Ownership of a Subsidiary — A Scope Clarification. ASU 2010-02 clarifies that the scope of previous guidance in the accounting and disclosure requirements related to decreases in ownership of a subsidiary apply to (i) a subsidiary or a group of assets that is a business or nonprofit entity; (ii) a subsidiary that is a business or nonprofit entity that is transferred to an equity method investee or joint venture; and (iii) an exchange of a group of assets that constitutes a business or nonprofit activity for a noncontrolling interest in an entity. ASU 2010-02 also expands the disclosure requirements about deconsolidation of a subsidiary or derecognition of a group of assets to include (i) the valuation techniques used to measure the fair value of any retained investment; (ii) the nature of any continuing involvement with the subsidiary or entity acquiring a group of assets; and (iii) whether the transaction that resulted in the deconsolidation or derecognition was with a related party or whether the former subsidiary or entity acquiring the assets will become a related party after the transaction. The provisions of ASU 2010-02 will be effective for the first reporting period beginning after December 13, 2009. The Company adopted the provisions of ASU 2010-02 on January 1, 2010 and does not anticipate that the adoption of this standard will have a material impact on the financial position, results of operations, or cash flows of the Company.
D-62
Transvideo International Ltd.
Notes to Consolidated Financial Statements
As of March 31, 2010 and December 31, 2009
And for the three-month periods ended March 31, 2010 and 2009
In January 2010 the FASB issued ASU 2010-06, Fair Value Measurements and Disclosures (Topic 820) —Improving Disclosures About Fair Value Measurements. ASU 2010-06 clarifies the requirements for certain disclosures around fair value measurements and also requires registrants to provide certain additional disclosures about those measurements. The new disclosure requirements include (i) the significant amounts of transfers into and out of Level 1 and Level 2 fair value measurements during the period, along with the reason for those transfers, and (ii) separate presentation of information about purchases, sales, issuances and settlements of fair value measurements with significant unobservable inputs. ASU 2010-06 is effective for interim and annual reporting periods beginning after December 15, 2009. The Company adopted the provisions of ASU 2010-06 on January 1, 2010 and does not anticipate that the adoption of this standard will have a material impact on the financial position, results of operations, or cash flows of the Company.
| 3. | Accounts Receivable |
Accounts receivable at March 31, 2010 and December 31, 2009, consisted of the followings:-
| Accounts Receivable | ||||||||
| 3/31/2010 | 12/31/2009 | |||||||
| Gross accounts receivable | $ | 388,537 | $ | 431,136 | ||||
| Allowance for bad debt | (3,885 | ) | (4,311 | ) | ||||
| Net accounts receivable | $ | 384,652 | $ | 426,825 | ||||
| Allowance for Bad Debt | ||||||||
| 3/31/2010 | 12/31/2009 | |||||||
| Beginning balance | $ | (4,311 | ) | $ | (5,558 | ) | ||
| Allowance provided | - | - | ||||||
| Bad debt written off | - | - | ||||||
| Reversal | 426 | 1,247 | ||||||
| Ending balance | $ | (3,885 | ) | $ | (4,311 | ) | ||
| Accounts Receivable Aging Analysis | ||||||||
| 3/31/2010 | 12/31/2009 | |||||||
| <30 days | $ | 62,506 | $ | 414,713 | ||||
| 30-60 days | 222,829 | - | ||||||
| 60-90 days | 99,317 | - | ||||||
| 90-180 days | - | - | ||||||
| 180-360 days | - | - | ||||||
| >360 days | - | 12,112 | ||||||
| Total | $ | 384,652 | $ | 426,825 | ||||
D-63
Transvideo International Ltd.
Notes to Consolidated Financial Statements
As of March 31, 2010 and December 31, 2009
And for the three-month periods ended March 31, 2010 and 2009
| 4. | Inventory |
| 3/31/2010 | 12/31/2009 | |||||||
| Raw materials | $ | 424,634 | $ | 449,876 | ||||
| Work in progress | 17,511 | 26,198 | ||||||
| Finished goods | 130,751 | 158,418 | ||||||
| $ | 572,896 | $ | 634,492 | |||||
| 5. | Due to/Due from Related Parties |
In the normal course of business of selling its products and purchasing of raw materials, the Company conducts transactions with the following related parties: (a) Avantalion LLC (“Avantalion”), (b) KyLinTV, Inc. (“KyLinTV”), (c) Beijing KyLinTV Co., Ltd. (“BJ KyLinTV”) and (d) NeuLion, Inc. (“NeuLion”). Avantalion owns 90% of the Company. Avantalion represents a 39% stake ownership in KyLinTV. BJ KyLinTV is a subsidiary of KyLinTV. At December 31, 2009, NeuLion held 17.1% ownership of KyLinTV; subsequently, Neulion reduced its investment in KylinTV. At April 25, 2010, Neulion’s held 12.2% of KylinTV.
In the event that the Company has both receivables from, and payables to the related parties it will, in accordance with FIN 39 (FASB ASC 210-20), setoff the balances in order to arrive at a single balance that is either due from, or due to the related parties. The Company’s outstanding related party receivables and payables at March 31, 2010 and December 31, 2009 are detailed in the following table.
| As of March 31, 2010 | |||||
| Ref. | Subsidiary | Nature of Balance | Related Party | Balance | Description of Transaction |
| A | BJ TVD | Sale of Products resulting in Trade Receivable from | KyLinTV | $ 16,547 | BJ TVI licensed content to KyLinTV in December 2009 |
| B | BJ TVD | Sale of Products resulting in Trade Receivable from | BJ KylinTV | 33,211 | BJ TVD provided service to BJ KylinTV in January 2010 |
| C | TVI | Sale of Products resulting in Trade Receivable from | KyLinTV | 17,660 | TVI sold content royalty to KyLinTV in December 2009 |
| D | TVI | Sale of Products resulting in Trade Receivable from | NeuLion | 9,314 | TVI sold products to NeuLion in February 2010 on credit |
| E | TVI | Sale of Products resulting in Trade Receivable from | NeuLion | 78,291 | TVI sold products to NeuLion in November 2009 on credit |
| Subtotal of related party sales | 155,023 | ||||
| F | BJ i-Media | Loan Receivable from | BJ KyLinTV | 877,693 | BJ KyLinTV borrowed funds from BJ i-Media in May 2009 |
| Subtotal loans to related parties | 877,693 | ||||
| Gross related party receivables | $ 1,032,716 | ||||
| Ref. | Subsidiary: | Nature of Balance | Related Party | Balance | Description of Transaction |
| G | BJ TVD | Advances From | BJ KyLinTV | $ 76,477 | BJ TVD received advances from BJ KylinTV in December 2009 |
| H | TVI | Loan Payable to | Avantalion | 10,000 | TVI borrowed fund from Avantalion in June 2009 |
| Gross related party payables | $ 86,477 | ||||
D-64
Transvideo International Ltd.
Notes to Consolidated Financial Statements
As of March 31, 2010 and December 31, 2009
And for the three-month periods ended March 31, 2010 and 2009
| A. | BJ TVI licensed 16,547 worth of content to KyLinTV in December 2009 |
| B. | BJ TVD provided 33,211 worth of service to BJ KylinTV in January 2010. |
| C. | TVI sold 17,660 worth of content royalty to KyLinTV in December 2009. |
| D. | TVI sold 9,314 worth of products to NeuLion in February 2010 on credit. |
| E. | TVI sold 78,291 worth of products to NeuLion in November 2009 on credit |
| F. | BJ i-Media lent $877,693 to BJ KyLinTV. The loan is unsecured, interest free and has no fixed payment terms. |
| G. | BJ KylinTV paid 76,477 advances to BJ TVD for purchase of service in January 2010 |
| H. | TVI borrowed $10,000 from Avantalion in June 2009. |
| As of December 31, 2009 | |||||
| Ref. | Subsidiary | Nature of Balance | Related Party | Balance | Description of Transaction |
| A | BJ Transvideo | Sale of Products resulting in Trade Receivable from | KyLinTV | $ 14,279 | BJ Transvideo licensed content to KyLinTV in December 2009 |
| B | TVI | Sale of Products resulting in Trade Receivable from | KyLinTV | 34,700 | TVI licensed content to KyLinTV in December 2009 |
| C | TVI | Sale of Products resulting in Trade Receivable from | NeuLion | 298,291 | TVI sold set top boxes to NeuLion in November 2009 on credit |
| Subtotal of related party sales | 347,270 | ||||
| D | BJ i-Media | Loan Receivable from | BJ KyLinTV | 877,552 | BJ i-Media lent funds to BJ KyLinTV in May 2009 |
| E | TVI | Loan Receivable from | KyLinTV | 1,500,000 | TVI lent funds to KyLinTV in May 2009 |
| Subtotal loans to related parties | 2,377,552 | ||||
| Gross related party receivables | $ 2,724,822 | ||||
| Ref. | Subsidiary: | Nature of Balance | Related Party | Balance | Description of Transaction |
| F | TVI | Future sales of product resulting in a liability | KyLinTV | $ 105,000 | KyLinTV issued an advance to TVI in December 2009 as a deposit for the purchase of products |
| G | TVI | Loan Payable to | Avantalion | 10,000 | TVI borrowed fund from Avantalion in June 2009 |
| Subtotal loans from related party | 115,000 | ||||
| Gross related party payables | $ 115,000 | ||||
| A. | BJ Transvideo licensed $14,279 worth of content to KyLinTV in December 2009. |
D-65
Transvideo International Ltd.
Notes to Consolidated Financial Statements
As of March 31, 2010 and December 31, 2009
And for the three-month periods ended March 31, 2010 and 2009
| B. | TVI licensed $34,700 worth of content to KyLinTV in December 2009. |
| C. | TVI sold $298,291 worth of products to NeuLion on credit. |
| D. | BJ i-Media lent $877,552 to BJ KyLinTV. The loan is unsecured, interest free and has no fixed payment terms. |
| E. | TVI lent $1,500,000 to KyLinTV. The loan was unsecured, interest free and has no fixed payment terms. The amount has been converted to capital during the first quarter of 2010. |
| F. | KyLinTV advanced $105,000 to TVI for the purchase of products. |
| G. | TVI borrowed $10,000 from Avantalion in June 2009. |
The related party receivable balance detailed above, and the related transactions that comprise that balance were integral and material to the Company’s operations. The Company was reliant on transactions with the above related parties in order to conduct its business normally. The Company acknowledges that it has the responsibility to comply with paragraph c of SFAS 57 (FASB ASC 850) which calls for the dollar amounts of transactions for each of the periods for which income statements are presented and the effects of any change in the method of establishing the terms from that used in the preceding period.
The Company’s related party receivables and payables in the period presented were in the form of either short-term loans bearing no interest, or trade payables and receivables relating to the purchase of products, materials, and services for which payment was due within a short period of time. Management believes that the net receivables from related parties are fully recoverable.
The Company believes that related party transactions have in the past, had a significant bearing on the Company’s financial statements. As of December 31, 2009, approximately 68% of the Company’s sales were with related parties.
D-66
Transvideo International Ltd.
Notes to Consolidated Financial Statements
As of March 31, 2010 and December 31, 2009
And for the three-month periods ended March 31, 2010 and 2009
| 6. | Investment |
The Company invested $1,500,000 on KyLinTV, Inc. in the acquisition of 32.74% equity position. The investment balance $890,284 consisted of principal and post-acquisition investment loss attributed to KyLinTV’s current year operation result.
The following tabulation presented the condensed balance sheet and statement of income of KyLinTV, Inc. as of and for the three months ended March 31, 2010.
| KyLinTV, Inc. | |||||||||
| Condensed Balance Sheet | Condensed Statement of Income | ||||||||
| Assets | 3/31/2010 | 3/31/2010 | |||||||
| Current Assets | $ | 10,584,739 | Revenue | $ | 2,229,078 | ||||
| Non-Current Assets | 890,564 | Cost of revenue | 1,147,771 | ||||||
| Total Assets | 11,475,303 | Gross profit | 1,081,307 | ||||||
| Liabilities | Operation expenses | 2,943,604 | |||||||
| Current Liabilities | 5,948,049 | Earnings before tax | (1,862,297 | ) | |||||
| Total Liabilities | 5,948,049 | ||||||||
| Net Assets | 5,527,254 | Income tax | - | ||||||
| Total Liabilities & Net Assets | $ | 11,475,303 | Net income | $ | (1,862,297 | ) | |||
| 7. | Equipment |
| Accumulated | ||||||||||||
| 3/31/2010 | Cost | Depreciation | Net | |||||||||
| Office equipment | $ | 586,088 | $ | 352,565 | $ | 233,523 | ||||||
| Motor vehicles | 143,965 | 81,565 | 62,400 | |||||||||
| $ | 730,053 | $ | 434,130 | $ | 295,923 | |||||||
| Accumulated | ||||||||||||
| 12/31/2009 | Cost | Depreciation | Net | |||||||||
| Office equipment | $ | 581,128 | $ | 328,808 | $ | 252,320 | ||||||
| Motor vehicles | 143,942 | 75,074 | 68,868 | |||||||||
| $ | 725,070 | $ | 403,882 | $ | 321,188 | |||||||
The depreciation expenses were $30,248 and $119,372 for the three months and twelve months ended March 31, 2010 and December 31, 2009 respectively.
D-67
Transvideo International Ltd.
Notes to Consolidated Financial Statements
As of March 31, 2010 and December 31, 2009
And for the three-month periods ended March 31, 2010 and 2009
| 8. | Intangible Assets |
| 3/31/2010 | Cost | Accumulated Amortization | Net | |||||||||
| Accounting software | $ | 23,196 | $ | 8,898 | $ | 14,298 | ||||||
| 12/31/2009 | Cost | Accumulated Amortization | Net | |||||||||
| Accounting software | $ | 22,926 | $ | 7,795 | $ | 15,131 | ||||||
| 9. | Commitments |
| (a) | Operating Lease Commitment |
The annual lease expenses for the three months and twelve months ended March 31, 2010 and December 31, 2009 were $16,936 and $67,745, respectively. The future minimum lease payments under non-cancelable operating leases until termination are shown below:
| Fiscal Years | Minimum Lease Payments | |||
| 2010 | $ | 50,809 | ||
| 2011 | 67,745 | |||
| 2012 | 40,254 | |||
| Total | $ | 158,808 | ||
| (b) | Statutory Reserve Commitment |
In compliance with PRC laws, the Company is required to appropriate a portion of its net income to its statutory reserve up to a maximum of 50% of an enterprise’s registered capital in the PRC. The Company had future unfunded commitments, as provided below.
| 3/31/2010 | 12/31/2009 | |||||||
| PRC Subsidiaries registered capital | ||||||||
| Beijing Transvideo | $ | 3,502,660 | $ | 2,922,660 | ||||
| Beijing iMedia | 3,000,000 | 3,000,000 | ||||||
| Statutory reserve ceiling based | ||||||||
| on 50% of PRC registered capital | 3,251,330 | 2,961,330 | ||||||
Less: Retained earnings appropriated to statutory reserve | (535 | ) | (535 | ) | ||||
| Reserve commitment outstanding | $ | 3,250,795 | $ | 2,960,795 | ||||
D-68
Transvideo International Ltd.
Notes to Consolidated Financial Statements
As of March 31, 2010 and December 31, 2009
And for the three-month periods ended March 31, 2010 and 2009
10. Income Tax
The Company and its subsidiary China iMedia are not subject to income tax because they are domiciled in British Virgin Islands.
On March 16, 2007, the PRC government passed new tax legislation that repealed preferential tax treatment for foreign investment enterprises in the PRC and enacted new tax regulations that became effective January 1, 2008. Under such regulations, with certain exceptions, both domestic and foreign enterprises will be taxed at a standard enterprise income tax rate of 25%. BJ Transvideo and BJ i-Media’s operations are both conducted in the PRC which makes them subject to the 25% income tax rate.
BJ Transvideo and BJ i-Media incurred net operating losses for the three months ended March 31, 2010 and 2009 accordingly. They did not provide for income taxes for 2010 and 2009. They also did not recognize a deferred tax asset as a result of their net operating losses because they believed it was unlikely that such assets would be realized on a carry forward basis.
The differences between the Company's statutory tax rate and effective tax rate for the three months ended March 31, 2010 and 2009 are shown in the following table:
| March 31, 2010 | March 31, 2009 | |||||||
| PRC statutory tax rate | 25.00 | % | 25.00 | % | ||||
| Accruals and reconciling items | - | - | ||||||
| Effective tax rate | N/A | N/A | ||||||
| 11. | Concentration of Risk |
| (A) | Demand risk |
The Company had concentrations of risk in demand for its products because its sales of products with related parties KyLinTV and NeuLion accounted for a significant portion of total sales.
D-69
Transvideo International Ltd.
Notes to Consolidated Financial Statements
As of March 31, 2010 and December 31, 2009
And for the three-month periods ended March 31, 2010 and 2009
| 12. | Earnings per Share |
| 3 months | 3 months | |||||||
| ended | ended | |||||||
| March 31, | March 31, | |||||||
| 2010 | 2009 | |||||||
| Basic earnings per share numerator | ||||||||
| Net income (loss) attributable to common stockholders | $ | (928,207 | ) | $ | 222,006 | |||
| Diluted earnings per share numerator | $ | (928,207 | ) | $ | 222,006 | |||
| Original shares: | 3,200,000 | 3,163,200 | ||||||
| Additions from actual events | ||||||||
| - Issuance of common stock | - | - | ||||||
| Basic weighted average shares outstanding | 3,200,000 | 3,163,200 | ||||||
| Dilutive shares: | ||||||||
| Diluted weighted average shares outstanding: | 3,200,000 | 3,163,200 | ||||||
| Earnings (loss) per share | ||||||||
| - Basic | $ | (0.29 | ) | $ | 0.07 | |||
| - Diluted | $ | (0.29 | ) | $ | 0.07 | |||
| Weighted average shares outstanding | ||||||||
| - Basic | 3,200,000 | 3,163,200 | ||||||
| - Diluted | 3,200,000 | 3,163,200 | ||||||
| 13. | Other Income/Expense |
| 3 months | 3 months | |||||||
| ended | ended | |||||||
| March 31, | March 31, | |||||||
| 2010 | 2009 | |||||||
| Other income | $ | 10,311 | $ | 3 | ||||
| Other expenses | (19,870 | ) | - | |||||
| Investment loss | (609,716 | ) | - | |||||
| Interest income | - | 37,902 | ||||||
| Interest expense | 12,524 | - | ||||||
| Total other income/(loss) | $ | (606,751 | ) | $ | 37,905 | |||
D-70
Transvideo International Ltd.
Notes to Consolidated Financial Statements
As of March 31, 2010 and December 31, 2009
And for the three-month periods ended March 31, 2010 and 2009
| 14. | Financial Instruments |
The Company's financial instruments consist of cash and cash equivalents, accounts and other receivables, accounts and other payables, accrued liabilities, and amounts due from and due to related parties. The fair values of these financial instruments approximate their carrying values due to the relatively short-term maturity of these instruments.
Interest Rate and Credit Risk
Financial instruments that potentially subject the Company to concentrations of credit risks consist principally of accounts receivable and amounts due from related parties.
The Company's accounts receivable are from repeat customers. The Company extends credits to its customer and has accrued an allowance for doubtful accounts to account for the risk of default by its customers. Management regularly monitors the level of accounts receivable attributable to each customer and the length of time taken for amounts to be settled and where necessary, takes appropriate action to collect on past due balances.
Management does not believe that there is a concentration of credit risk arising from any one customer related to accounts receivables. In the event that a customer becomes unable to pay its balance due, the maximum loss would be the carrying value of the accounts receivable. Management does believe there is significant concentration of risk from related parties and if any of the related parties as detailed in Note 5 become insolvent, the Company may suffer material losses.
Currency Risk
The Company generates revenues and incurs expenses and expenditures primarily in China and is exposed to risk from changes in foreign currency rates if it were to actually convert its RMB into USD. The Company has not hedged its exposure to currency fluctuations.
Liquidity Risk
Liquidity risk is the risk that the Company will not be able to meet its financial obligations as they become due. The Company's objective to managing liquidity risk is to ensure that it has sufficient cash available to meet its liabilities when they become due. The ability to settle it obligations is reliant on the Company collecting its accounts receivables and amounts due from related parties in a timely manner and by maintaining sufficient cash on hand.
D-71
APPENDIX “E”
PRO FORMA FINANCIAL STATEMENTS
PRO FORMA CONSOLIDATED FINANCIAL STATEMENTS
[unaudited]
[Expressed in U.S. dollars, unless otherwise noted]
The pro forma statements have been prepared by management using accounting policies in accordance with United States generally accepted accounting principles (“GAAP”). The accounting policies used in the preparation of the pro forma statements are consistent with those used by the Company in preparation of its consolidated financial statements for the fiscal year ended December 31, 2009 and the three month period ended March 31, 2010.
The pro forma statements have been prepared using the following information:
| (i) | Unaudited consolidated financial statements of NeuLion, Inc., as at and for the three month period ended March 31, 2010; |
| (ii) | Unaudited consolidated financial statements of TransVideo International Ltd., as at and for the three month period ended March 31, 2010; |
| (iii) | Audited consolidated financial statements of NeuLion, Inc. as at and for the fiscal year ended December 31, 2009; |
| (iv) | Audited consolidated financial statements of TransVideo International Ltd., Inc. as at and for the fiscal year ended December 31, 2009; |
| (v) | Such other supplementary information as was considered necessary to reflect the Acquisition in the Pro Forma Statements. |
The pro forma statements do not include any anticipated financial benefits from such items as cost savings arising from the TransVideo Acquisition. The pro forma statements are not necessarily indicative of the results of operations or the financial position that would have resulted had the TransVideo Acquisition been effected on the dates indicated, or the results that may be obtained in the future.
E-1
| PRO FORMA CONSOLIDATED BALANCE SHEET | ||||||||||||||||||||
| Unaudited | ||||||||||||||||||||
| [Expressed in U.S. dollars, except for number of shares] | ||||||||||||||||||||
| As at March 31, 2010 | ||||||||||||||||||||
| TransVideo | ||||||||||||||||||||
| International, | Pro Forma | Pro Forma | ||||||||||||||||||
| NeuLion, Inc | Ltd. | Adjustments | Notes | Total | ||||||||||||||||
| $ | $ | $ | $ | |||||||||||||||||
| ASSETS | ||||||||||||||||||||
| Current | ||||||||||||||||||||
| Cash and cash equivalents | 7,790,483 | 1,421,827 | 0 | 9,212,310 | ||||||||||||||||
| Accounts receivable, net of allowance for doubtful accounts | 1,934,129 | 384,652 | 0 | 2,318,781 | ||||||||||||||||
| Other receivables | 790,155 | 251,484 | 0 | 1,041,639 | ||||||||||||||||
| Inventory | 552,243 | 572,896 | 0 | 1,125,139 | ||||||||||||||||
| Prepaid expenses and deposits | 1,167,924 | 197,431 | 0 | 1,365,355 | ||||||||||||||||
| Due from related party | 208,050 | 1,032,716 | 0 | 1,240,766 | ||||||||||||||||
| Total current assets | 12,442,984 | 3,861,006 | 0 | 16,303,990 | ||||||||||||||||
| Property, plant and equipment, net | 5,319,973 | 295,923 | 0 | 5,615,896 | ||||||||||||||||
| Investment | 0 | 890,284 | (840,284 | ) | 4(ii) | 0 | ||||||||||||||
| Intangible assets, net | 8,997,673 | 14,298 | 6,529,292 | 4(i) | 15,541,263 | |||||||||||||||
| Goodwill | 6,757,194 | 0 | 6,757,194 | |||||||||||||||||
| Other assets | 485,533 | 43,470 | 0 | 529,003 | ||||||||||||||||
| Total assets | 34,003,357 | 65,104,981 | 5,639,008 | 44,747,346 | ||||||||||||||||
| LIABILITIES AND SHAREHOLDERS' EQUITY | ||||||||||||||||||||
| Current | ||||||||||||||||||||
| Accounts payable | 3,969,950 | 503,522 | 0 | 4,473,472 | ||||||||||||||||
| Accrued liabilities | 5,612,260 | 427,625 | 0 | 6,039,885 | ||||||||||||||||
| Derivative liability | 389,400 | 0 | 389,400 | |||||||||||||||||
| Due to related parties | 109,686 | 86,477 | 0 | 196,163 | ||||||||||||||||
| Taxes payable | 0 | 46,012 | 0 | 46,012 | ||||||||||||||||
| Deferred revenue | 3,785,884 | 0 | 3,785,884 | |||||||||||||||||
| Total current liabilities | 13,867,180 | 1,063,636 | 0 | 14,930,816 | ||||||||||||||||
| Long-term deferred revenue | 505,634 | 0 | 505,634 | |||||||||||||||||
| Other long-term liabilities | 654,276 | 0 | 654,276 | |||||||||||||||||
| Total liabilities | 15,027,090 | 1,063,636 | 0 | 16,090,726 | ||||||||||||||||
| Shareholders' equity | ||||||||||||||||||||
| Share capital | ||||||||||||||||||||
| Common shares | 11,287,406 | 32,000 | 9,648,353 | 4(i) | 20,967,759 | |||||||||||||||
| Additional paid-in capital | 55,214,311 | 4,157,781 | (4,157,781 | ) | 4(i) | 55,214,311 | ||||||||||||||
| Promissory notes receivable | (209,250 | ) | 0 | (209,250 | ) | |||||||||||||||
| Statutory reserve | 0 | 535 | (535 | ) | 4(i) | 0 | ||||||||||||||
| Accumulated other comprehensive income | 0 | 590,563 | (590,563 | ) | 4(i) | 0 | ||||||||||||||
| Non-controlling interest | 0 | 519,197 | (519,197 | ) | 4(i) | 0 | ||||||||||||||
| Accumulated deficit | (47,316,200 | ) | (1,258,731 | ) | 1,258,731 | 4(i) | (47,316,200 | ) | ||||||||||||
| Total shareholders' equity | 18,976,267 | 4,041,345 | 5,639,008 | 28,656,620 | ||||||||||||||||
| Total liabilities and shareholders' equity | 34,003,357 | 5,104,981 | 5,639,008 | 44,747,346 | ||||||||||||||||
| See accompanying notes | ||||||||||||||||||||
E-2
| PRO FORMA CONSOLIDATED STATEMENT OF OPERATIONS AND | ||||||||||||||||||||
| COMPREHENSIVE LOSS | ||||||||||||||||||||
| Unaudited | ||||||||||||||||||||
| [Expressed in U.S. dollars, except for number of shares] | ||||||||||||||||||||
| For the three months ended March 31, 2010 | ||||||||||||||||||||
| TransVideo | ||||||||||||||||||||
| International, | Pro Forma | Pro Forma | ||||||||||||||||||
| NeuLion, Inc | Ltd. | Adjustments | Notes | Total | ||||||||||||||||
| $ | $ | $ | $ | |||||||||||||||||
| Revenue | ||||||||||||||||||||
| Services revenue | 7,462,899 | 0 | 7,462,899 | |||||||||||||||||
| Equipment revenue | 381,596 | 409,205 | 0 | 790,801 | ||||||||||||||||
| 7,844,495 | 409,205 | 0 | 8,253,700 | |||||||||||||||||
| Costs and expenses | ||||||||||||||||||||
| Cost of services revenue, exclusive of depreciation and | ||||||||||||||||||||
| amortization shown separately below | 3,364,407 | 0 | 3,364,407 | |||||||||||||||||
| Cost of equipment revenue | 354,690 | 308,832 | 0 | 663,522 | ||||||||||||||||
| Selling, general and adminstrative, excluding stock-based compensation | 7,332,912 | 437,677 | 0 | 7,770,589 | ||||||||||||||||
| Depreciation and amortization | 1,276,965 | 321,992 | 5 | (i) | 1,598,957 | |||||||||||||||
| 12,328,974 | 746,509 | 321,992 | 13,397,475 | |||||||||||||||||
| Operating loss | (4,484,479 | ) | (337,304 | ) | (321,992 | ) | (5,143,775 | ) | ||||||||||||
| Other income (expense) | ||||||||||||||||||||
| Unrealized gain (loss) on derivative | 999,900 | 0 | 999,900 | |||||||||||||||||
| (Loss) gain on foreign exchange | (49,129 | ) | 0 | (49,129 | ) | |||||||||||||||
| Investment income | 21,906 | (606,751 | ) | 609,716 | 5 | (ii) | 24,871 | |||||||||||||
| 972,677 | (606,751 | ) | 0 | 975,642 | ||||||||||||||||
| Net and comprehensive loss for the period | (3,511,802 | ) | (944,055 | ) | 287,729 | (4,168,133 | ) | |||||||||||||
| Loss per weighted average number of shares outstanding – basic and diluted | $ | (0.03 | ) | $ | (0.29 | ) | $ | (0.03 | ) | |||||||||||
| Weighted average number of shares outstanding – basic and diluted | 116,742,433 | 3,200,000 | 138,743,235 | |||||||||||||||||
| See accompanying notes | ||||||||||||||||||||
E-3
| PRO FORMA CONSOLIDATED STATEMENT OF OPERATIONS AND | ||||||||||||||||||||
| COMPREHENSIVE LOSS | ||||||||||||||||||||
| Unaudited | ||||||||||||||||||||
| [Expressed in U.S. dollars, except for number of shares] | ||||||||||||||||||||
| For the fiscal year ended December 31, 2009 | ||||||||||||||||||||
| TransVideo | ||||||||||||||||||||
| International, | Pro Forma | Pro Forma | ||||||||||||||||||
| NeuLion, Inc | Ltd. | Adjustments | Notes | Total | ||||||||||||||||
| $ | $ | $ | $ | |||||||||||||||||
| Revenue | ||||||||||||||||||||
| Services revenue | 26,464,400 | 0 | 26,464,400 | |||||||||||||||||
| Equipment revenue | 1,629,277 | 2,274,779 | 0 | 3,904,056 | ||||||||||||||||
| 28,093,677 | 2,274,779 | 0 | 30,368,456 | |||||||||||||||||
| Costs and expenses | ||||||||||||||||||||
| Cost of services revenue, exclusive of depreciation and | ||||||||||||||||||||
| amortization shown separately below | 12,850,002 | 0 | 12,850,002 | |||||||||||||||||
| Cost of equipment revenue | 1,537,150 | 1,184,435 | 0 | 2,721,585 | ||||||||||||||||
| Selling, general and adminstrative, excluding stock-based compensation | 28,767,049 | 1,994,161 | 0 | 30,761,210 | ||||||||||||||||
| Depreciation and amortization | 4,141,117 | 1,305,858 | 5(iii) | 5,446,975 | ||||||||||||||||
| 47,295,318 | 3,178,596 | 1,305,858 | 51,779,772 | |||||||||||||||||
| Operating loss | (19,201,641 | ) | (903,817 | ) | (1,305,858 | ) | (21,411,316 | ) | ||||||||||||
| Other income (expense) | ||||||||||||||||||||
| Unrealized gain (loss) on derivative | (801,350 | ) | 0 | (801,350 | ) | |||||||||||||||
| (Loss) gain on foreign exchange | 68,245 | 0 | 68,245 | |||||||||||||||||
| Investment income | 293,825 | 75,062 | 0 | 368,887 | ||||||||||||||||
| (439,280 | ) | 75,062 | 0 | (364,218 | ) | |||||||||||||||
| Net and comprehensive loss for the period | (19,640,921 | ) | (828,755 | ) | (1,305,858 | ) | (21,775,534 | ) | ||||||||||||
| Loss per weighted average number of shares outstanding – basic and diluted | $ | (0.18 | ) | $ | (0.24 | ) | $ | (0.16 | ) | |||||||||||
| Weighted average number of shares outstanding – basic and diluted | 111,314,653 | 3,184,769 | 133,315,455 | |||||||||||||||||
| See accompanying notes | ||||||||||||||||||||
E-4
NOTES TO PRO FORMA CONSOLIDATED FINANCIAL STATEMENTS
Unaudited
[Expressed in U.S. dollars, unless otherwise noted]
1. Description of Transaction
On May 19, 2010, the Corporation announced that it had reached an agreement in principle to acquire the operating interests of TransVideo International Ltd. (“TransVideo”), a manufacturer of set top boxes utilized by the Company, in exchange for 22,000,802 Company common shares. TransVideo shareholders will own approximately 15% of the Company, on a fully diluted basis, upon the consummation of the transaction. TransVideo’s passive investment in KyLinTV, Inc., an IPTV company that is controlled by Charles B. Wang, the Chairman of the Board of Directors of the Company, will not be transferred as part of the transaction.
The proposed transaction, if consummated, will provide the Company with greater control over the future development of TransVideo's set top boxes. TransVideo's existing relationships in China will also afford the Company with substantial opportunities for marketing its IPTV services.
TransVideo is controlled by AvantaLion LLC, a company controlled by Mr. Wang. If the proposed transaction is consummated, AvantaLion will receive approximately 17.8 million Company common shares, which will result in Mr. Wang controlling approximately 40 million Company common shares (inclusive of 10 million warrants) of the approximately 139 million Company common shares (not including such 10 million warrants) that will be outstanding after consummation.
The agreement in principle was negotiated by an independent committee of the Board of Directors of the Company, after commissioning an independent valuation and obtaining independent legal counsel. The independent committee's recommendation to proceed with the transaction was unanimously approved by the full Board of Directors.
The closing of the transaction remains subject to the negotiation and execution of a definitive agreement and regulatory and shareholder approvals, which are anticipated to occur during summer 2010.
2. Basis of Presentation
The accompanying unaudited pro forma consolidated statements of operations give effect to the merger as if it had occurred on January 1, 2009. The unaudited pro forma consolidated balance sheet gives effect to the merger as if it had occurred on March 31, 2010. The unaudited pro forma consolidated statements of operations and balance sheet are herein collectively referred to as the “pro forma statements”.
The pro forma statements have been prepared by management using accounting policies in accordance with United States generally accepted accounting principles (“GAAP”). The accounting policies used in the preparation of the pro forma statements are consistent with those used by the Company.
The pro forma statements have been prepared and should be read in conjunction with the following information:
| (i) | Unaudited consolidated financial statements of NeuLion, Inc., as at and for the three month period ended March 31, 2010; |
| (ii) | Unaudited consolidated financial statements of TransVideo International Ltd., as at and for the three month period ended March 31, 2010; |
| (iii) | Audited consolidated financial statements of NeuLion, Inc. as at and for the fiscal year ended December 31, 2009; |
| (iv) | Audited consolidated financial statements of TransVideo International Ltd., Inc. as at and for the fiscal year ended December 31, 2009; |
| (v) | Such other supplementary information as was considered necessary to reflect the Acquisition in the pro forma statements. |
E-5
NOTES TO PRO FORMA CONSOLIDATED FINANCIAL STATEMENTS
Unaudited
[Expressed in U.S. dollars, unless otherwise noted]
The pro forma statements do not include any anticipated financial benefits from such items as cost savings arising from the Acquisition. The pro forma statements are not necessarily indicative of the results of operations or the financial position that would have resulted had the Acquisition been effected on the dates indicated, or the results that may be obtained in the future.
In the preparation of the pro forma statements, the purchase price allocation of the tangible and intangible assets is preliminary and may be adjusted as a result of obtaining additional information regarding preliminary estimates of fair values made at the date of purchase.
3. Accounting for the Acquisition
The purchase price of $9,680,353 represents the fair value of 22,000,802 of common shares on June 15, 2010.
The following table summarizes the estimated fair values of the assets acquired and liabilities assumed at the date of acquisition. The Company is obtaining third party valuations of certain intangible assets and evaluating certain liabilities and assets, thus the allocations of the purchase price is preliminary.
| Cash | $ | 1,421,827 | ||
| Other current assets | 2,439,179 | |||
| Property plant and equipment | 295,923 | |||
| Other long-term assets | 57,768 | |||
| Current liabilities | (1,063,636 | ) | ||
| Customer relationships | 6,529,292 | |||
| Net assets acquired | $ | 9,680,353 |
Of the $6,529,292 of acquired intangible assets, the entire amount was assigned to customer relationships.
As noted above, the purchase price allocation of the tangible and intangible assets is preliminary and may be adjusted as a result of obtaining additional information regarding preliminary estimates of fair values made at the date of purchase.
4. Pro Forma Balance Sheet Assumptions and Adjustments
The unaudited pro forma consolidated balance sheet as at March 31, 2010 incorporates the following adjustments:
| (i) | Replacement of TransVideo’s share capital, additional paid in capital, statutory reserve, accumulated deficit, accumulated other comprehensive income and non-controlling interest with the total purchase price of $9,680,353 to share capital representing the fair value of the 22,000,802 common shares being issued to TransVideo shareholders. The difference between the fair value of the common shares of $9,680,353 and the fair value of TransVideo’s assets has been allocated to intangible assets. |
| (ii) | To eliminate investment in KyLinTV, Inc. that is not included as part of the acquisition. |
E-6
NOTES TO PRO FORMA CONSOLIDATED FINANCIAL STATEMENTS
Unaudited
[Expressed in U.S. dollars, unless otherwise noted]
5. Pro Forma Statement of Operations Adjustments
The unaudited pro forma consolidated statement of operations for the three months ending March 31, 2010 incorporates the following adjustment:
| (i) | Recording of $321,992 in depreciation and amortization for the three months ended March 31, 2010, as a result of the fair value of intangible assets acquired in the acquisition. |
| (ii) | To eliminate investment in KyLinTV. Inc, that is not included as part of the acquisition. |
The unaudited pro forma consolidated statement of operations for the year ending December 31, 2009 incorporates the following adjustment:
| (iii) | Recording of $1,305,858 in depreciation and amortization for the year ended December 31, 2009, as a result of the fair value of intangible assets acquired in the acquisition. |
6. Loss Per Share
Basic loss per share is computed by dividing net loss for the period by the weighted average number of shares outstanding for the period. Diluted loss per share is computed by dividing net loss for the period by the weighted average number of shares outstanding and if dilutive, potential common shares using the treasury stock method. Potential common shares consist of stock options, restricted share units, stock appreciation rights and warrants. None of the Company’s convertible instruments are dilutive.
EPS for periods prior to the business combination are restated. The retroactive restatement is based on the same number of weighted-average shares outstanding that NeuLion used in each historic period. The denominator of the historical, restated EPS calculation has been adjusted by adding in the 22,000,802 shares being issued to TransVideo shareholders.
E-7
APPENDIX “F”
FAIRNESS OPINION
F-1
30 S. Wacker Drive, Suite 2850 Chicago, IL 60606 | |
| UHY Advisors FLVS, Inc. | |
| Telephone 312-578-9600 | |
| Fax 312-346-6500 | |
| Web www.uhy-us.com |
June 18, 2010
The Special Committee of the
Board of Directors of NeuLion, Inc.
c/o David Kronfeld, Chairman
JK&B Capital
Two Prudential Plaza
180 N. Stetson Avenue, Suite 4500
Chicago, IL 60601
To Special Committee Members:
You have requested our opinion as to the fairness, from a financial point of view, of the consideration to be received by NeuLion, Inc, a Canadian corporation, (“NeuLion”) in its proposed strategic acquisition (the “Transaction”) of all of the shares of capital stock of TransVideo International Ltd, a British Virgin Islands company (“TransVideo”). The Transaction is contemplated to be consummated pursuant to a Share Exchange Agreement (the “SEA”) between NeuLion and all of the shareholders of TransVideo. Pursuant to the SEA, NeuLion will exchange 22,000,802 of its common shares (“NL Exchange Shares”) for all of the capital stock of TransVideo. ��For purposes of this opinion, we have reviewed a draft of the SEA provided to us by NeuLion on June 18 , 2010 and have assumed that the final form of that agreement will not differ in any material respect from the draft SEA provided to us.
In connection with our opinion, we have:
| 1. | considered the audited financial statements of TransVideo as of and for the years ending December 31, 2008 and 2009 and internally prepared financial statements of TransVideo as of and for the three month period ending March 31, 2010; |
| 2. | considered the internally prepared financial projections for the years ending December 31, 2010 through 2015 for TransVideo and Beijing iMedia Technology Co. Ltd. and for TransVideo’s anticipated joint venture (the “Joint Venture”) with the China Sports General Administration Ministry (China Sports Media Co); |
An Independent Member of Urbach Hacker Young International Limited
F-2
The Special Committee of the
Board of Directors of NeuLion, Inc.
June 18, 2010
Page 2 of 8
| 3. | reviewed China Sports Media Co Business Operations Plan dated as of November 2009 (the “Business Plan”) and Memorandum of Understanding dated March 20, 2010 (the “MOU”) between TransVideo and the China State General Administration of Sports both of which relate to the Joint Venture; |
| 4. | considered the audited consolidated financial statements of NeuLion as of and for the years ending December 31, 2007, December 31, 2008 and December 31, 2009 and the internally prepared financial statements of NeuLion as of and for the three month period ending March 31, 2010; |
| 5. | considered the Form 10-Ks for NeuLion for the years ending December 31,2008 (NeuLion was then known as JumpTV, Inc.) and for December 31, 2009 and NeuLion’s Form 10-Q for the quarter ending March 31, 2010, as such documents were filed with the United States Securities and Exchange Commission; |
| 6. | considered the financial projections of NeuLion prepared by its management for the years ending December 31, 2010 through 2014; |
| 7. | considered information provided to us by NeuLion’s management regarding the Dish Network contract, warrants, subscriber targets and other public information; |
| 8. | discussed with members of the senior management of both NeuLion and TransVideo the business, operations, historical financial results and future prospects of each company; |
| 9. | reviewed valuations of NeuLion and TransVideo as of March 31, 2010 prepared by us and issued on May 5, 2010 (“UHY Valuation Reports”); |
| 10. | reviewed valuation methods and data contained in UHY Valuation Reports to determine whether the range of fair market value determined for NeuLion and TransVideo was still relevant as of the date hereof; |
| 11. | reviewed the drafts of NeuLion, Inc “Notice of Special Meeting of Shareholders to be Held on July 28, 2010” and “Information Circular dated June 18, 2010”; |
| 12. | verified with senior management of both NeuLion and TransVideo that the historical financial statements of NeuLion and TransVideo provided to us remain accurate and complete; |
F-3
The Special Committee of the
Board of Directors of NeuLion, Inc.
June 18, 2010
Page 3 of 8
| 13. | verified with senior management of NeuLion and TransVideo that all financial projections provided to us in connection with the UHY Valuation Reports were still considered by NeuLion’s and TransVideo’s management to be their best estimate of the future performance of each respective business; |
| 14. | verified with NeuLion’s senior management that TransVideo intends to distribute its 32.74% equity interest in KyLinTV, Inc. (“KyLinTV”) to its shareholders prior to the close of the Transaction; |
| 15. | verified with senior management of NeuLion and TransVideo that there were no other material changes to the business, operations, assets, liabilities, or prospects of either of them, the Joint Venture or any business in which it holds an equity investment of more than 5%; |
| 16. | performed an analysis of the value of the NL Exchange Shares based on the recent prices of NeuLion’s common shares on the Toronto Stock Exchange; |
| 17. | performed an analysis of the value of the NL Exchange Shares based on the expected range of fair market value of NeuLion after applying a minority interest discount and compare this with the fair market value of TransVideo without its ownership interest of KyLinTV; |
| 18. | reviewed the term sheet dated May 28, 2010 for the sale (the “Stock Sale”) by NeuLion of 16,666,667 Class 3 Preference Shares for US $10,000,000, which shares are convertible into common shares of NeuLion and was advised by senior management of NeuLion that there has been no material change in the terms and conditions of such sale; and |
| 19. | considered such other information, financial studies, analyses and investigations and financial, economic and market criteria as we deemed relevant and appropriate for purposes of this opinion. |
The opinion expressed below is subject to the following qualifications and limitations:
| i. | In arriving at our opinion, we have relied upon and assumed, without independent verification (nor assumed any obligation to verify), the accuracy and completeness of all historical financial and other information that was furnished to us by NeuLion or TransVideo or its representatives, or advisors or obtained by us from other sources. |
F-4
The Special Committee of the
Board of Directors of NeuLion, Inc.
June 18, 2010
Page 4 of 8
| ii. | With respect to all financial projections for TransVideo, NeuLion, or its respective subsidiaries, portfolio investments or the Joint Venture that were provided to us, we have relied upon and assumed, without independent verification, (nor assumed any obligation to verify) that such projections were prepared in good faith, were based on reasonable assumptions and reflected the best currently available estimates and judgments of NeuLion’s and TransVideo’s senior management as to the expected future competitive, operating and regulatory environments and related financial performance of the respective business, company or opportunity to which such projections relate. We express no opinion with respect to such projections or the assumptions on which they are based. |
| iii. | We have assumed that the Transaction will be synergistic to NeuLion and that the Transaction will not have a material negative effect on the financial projections provided to us for NeuLion or TransVideo. |
| iv. | We have assumed that the Joint Venture will be consummated by TransVideo in accordance with the Business Plan and MOU. |
| v. | We have not provided any attestation or other services with respect to either the historical financial information or financial projections provided to us and thus, we have not rendered any opinion with respect to the financial projections or budgets which have been provided to us. |
| vi. | Our services have been limited to this opinion and the UHY Valuation Reports and we did not provide, and have not been requested to provide, any financial advisory or other services and did not solicit third party indications of interest in acquiring all or any part of TransVideo or NeuLion. |
| vii. | Our opinion does not constitute a view regarding the solvency of TransVideo or NeuLion prior to or subsequent to the Transaction. We have not performed any procedures to determine the solvency of NeuLion or TransVideo. As such, this opinion does not constitute a solvency opinion, and should not be relied upon for such purposes. |
| viii. | Our opinion does not address, and should not be construed to address, either the underlying business decision to enter into the Transaction or whether the consideration to be paid by NeuLion in the Transaction represents the lowest price that would be accepted. |
F-5
The Special Committee of the
Board of Directors of NeuLion, Inc.
June 18, 2010
Page 5 of 8
| ix. | We express no view as to the federal, state or local tax consequences of the Transaction nor any opinion as to securities or other laws or regulations that might be implicated by the Transaction or apply to NeuLion. |
| x. | We have assumed the accuracy and completeness of all representations and warranties in the SEA, the compliance by the parties thereto of all covenants and obligations therein and the absence of any basis for a claim for indemnification or contribution thereunder. |
| xi. | Our opinion is based on business, financial, economic, market and other conditions as they exist and can be evaluated as of the date hereof or as of the date of the information provided to us. |
| xii. | The opinion is effective as of the date hereof. We have no obligation to update the opinion unless requested by you in writing to do so and expressly disclaim any responsibility to do so in the absence of any such request. |
| xiii. | Our opinion does not constitute a recommendation as to any action the Board of Directors of NeuLion or any committee therof, any stockholder of NeuLion or any other person should take in connection with the Transaction or any aspect thereof and is not a recommendation to any person on how such person should vote with respect to the Transaction or any other matter submitted to stockholders for approval or consideration. |
| xiv. | Our opinion relates solely to the fairness, from a financial point of view, to NeuLion of the consideration to be received by NeuLion in the Transaction. We express no opinion herein as to the relative merits of the Transaction, the Stock Sale and any other transactions or business strategies discussed by the Board of Directors of NeuLion as alternatives to the Transaction or the decision of the Board of Directors of NeuLion to proceed with the Transaction, nor do we express any opinion on the structure, terms or effect of any other aspect of the Transaction or the other transactions contemplated by the SEA. Our opinion does not address the fairness of the amount or nature of the consideration to any person other than NeuLion. |
We will receive a fee as compensation for our services in rendering this opinion. Our fee is not contingent upon the successful consummation of the Transaction.
F-6
The Special Committee of the
Board of Directors of NeuLion, Inc.
June 18, 2010
Page 6 of 8
Our opinion has been prepared at the request and solely for the benefit and use of the Special Committee of the Board of Directors of NeuLion. Our opinion may not be relied upon by any other person (including, without limitation, any stock or security holder or creditor of NeuLion or TransVideo or any purchaser in the Stock Sale) or used for any other purpose. Our opinion may not be quoted or referred to, in whole or in part, filed with, or furnished or disclosed to any other party, or used for any other purpose, without our prior written consent.
Based upon and subject to the foregoing, it is our opinion that as of the date hereof, the issuance and delivery of the NL Exchange Shares in exchange for all of the outstanding common stock of TransVideo is fair, from a financial point of view, to NeuLion.
Yours sincerely,
UHY Advisors FLVS, Inc.
By:________________________
F-7
APPENDIX “G”
TRANSVIDEO VALUATION REPORT
CHICAGO, ILLINOIS
VALUATION REPORT
VALUATION REPORT
TRANSVIDEO INTERNATIONAL, LTD
PREPARED MAY 5, 2010
PREPARED MAY 5, 2010
G-1

Table of Contents
ENGAGEMENT SUMMARY
3
BUSINESS OVERVIEW
7
ECONOMIC OUTLOOK
39
INDUSTRY OUTLOOK
45
VALUATION ANALYSIS
50
CONCLUSION: RANGE OF VALUE
59
VALUATION SCHEDULES 1 - 19
APPENDICES:
APPENDICES:
A - SOURCES OF INFORMATION
B - CONTINGENT AND LIMITING CONDITIONS C -
VALUATOR’S CERTIFICATION
VALUATOR’S CERTIFICATION
D - CURRICULUM VITAE OF BRUCE L. RICHMAN
G-2

Engagement Summary
G-3

Engagement Summary
UHY Advisors FLVS, Inc. (“UHY”) was engaged by the Special Committee of the Board of Directors of NeuLion, Inc. (“NeuLion”
or the “Company”) (“Client”), as an independent valuator, to perform a business valuation and determine a range of fair market value
for TransVideo International Ltd. (“TransVideo”) as of March 31, 2010 (“Valuation Date”). This valuation opinion and related report
are only for the Client’s corporate planning purposes in connection with the potential acquisition of TransVideo by NeuLion and
should not be utilized, referred to, or distributed for any other purpose without the express written consent of UHY. Our engagement,
nor our valuation conclusions expressed in our report, are not to be considered a fairness opinion or any indication as what one may be
able to raise capital for in the public market or from any individual investor.
Standard and Definition of Value
The standard of value used in our analysis is fair market value. Fair market value is defined in Internal Revenue Service Revenue
Ruling 59-60 (“Revenue Ruling 59-60”) as:
Ruling 59-60 (“Revenue Ruling 59-60”) as:
…the price at which the property would change hands between a willing buyer and a willing seller when the former is not
under any compulsion to buy and the latter is not under any compulsion to sell, both parties having reasonable knowledge of
relevant facts.
under any compulsion to buy and the latter is not under any compulsion to sell, both parties having reasonable knowledge of
relevant facts.
Fair market value is also defined in the International Glossary of Business Valuation Terms1 as:
The price, expressed in terms of cash equivalents, at which property would change hands between a hypothetical willing
and able buyer and a hypothetical willing and able seller, acting at arm’s length in an open and unrestricted market, when
neither is under compulsion to buy or sell and when both have reasonable knowledge of the relevant facts.
and able buyer and a hypothetical willing and able seller, acting at arm’s length in an open and unrestricted market, when
neither is under compulsion to buy or sell and when both have reasonable knowledge of the relevant facts.
1 The International Glossary of Business Valuation Terms is a joint effort of the American Institute of Certified Public Accountants, American Society of
Appraisers, Canadian Institute of Chartered Business Valuators, National Association of Certified Valuation Analysts, and The Institute of Business Appraisers.
Appraisers, Canadian Institute of Chartered Business Valuators, National Association of Certified Valuation Analysts, and The Institute of Business Appraisers.
Page | 4
G-4

Scope of Work
We have considered the follow factors in our analysis of TransVideo.
1. The nature of the business and the history of the enterprise from its inception. 2. The economic
outlook in general and the condition and outlook of the specific industry in particular. 3. The book
value of the stock and the financial condition of the business.
outlook in general and the condition and outlook of the specific industry in particular. 3. The book
value of the stock and the financial condition of the business.
4. The earning capacity of the Practice.
5. The dividend-paying capacity.
6. Whether or not the enterprise has goodwill or other intangible value.
7. Sales of the stock and the size of the block or stock to be valued.
7. Sales of the stock and the size of the block or stock to be valued.
8. The market price of stocks of corporations engaged in the same or a similar line of business having their stocks actively traded in a
free and open market, either on an exchange or over-the-counter.
free and open market, either on an exchange or over-the-counter.
As part of our assignment we performed a site visit to the office of TransVideo located at 2F Tower B, Beifa Plaza, No.15 Xueyuan South
Road, Haidian District, Beijing. We also performed management interviews with key management personnel at TransVideo concerning the
Company, its historic operations, nature and operations of the Company, including trends and prospects for growth as of the Valuation Date
and Managements financial forecast. Additionally, we reviewed various documents and material provided by Management and those
available through our research. A summary of those documents are included in Appendix A of our report.
Page | 5
G-5

Level of Value
Obtain indirectly by reference to
STRATEGIC VALUE
control values via strategic premium
Strategic Premium/Merger Economics
Obtain indirectly by reference to freely
CONTROL VALUE
traded values via control premium
Premium for Control
Lack of Control Discount
FREELY TRADED VALUE OR
Obtain indirectly by reference to control
MARKETABLE,
values via lack of control discount
NON-CONTROLLING
Lack of Marketability Discount
Obtain indirectly by reference to freely
NON-MARKETABLE,
traded values via lack of marketability
NON-CONTROLLING
discount
Source: Based on Z. Christopher Mercer, "Understanding and Quantifying Control Premiums: The Value of Control vs. Synergies of Strategic
Advantages, Part II," The Journal of Business Valuation, p.51.
Advantages, Part II," The Journal of Business Valuation, p.51.
In this report, we used a Control Value basis for the 100% equity ownership of TransVideo.
Premise of Value
TransVideo was valued on a going-concern basis, which assumes that the businesses will continue operating into the future.
Page | 6
G-6

Business Overview
Page | 7
G-7

Business History and Overview
Beijing Digital TransVideo Technology Co., Ltd (“TransVideo” or the “Company”) is an operating company that is incorporated in the
People’s Republic of China. The Company is a wholly owned subsidiary of TransVideo International Ltd. (“the “Holding Company”)
which is incorporated in the British Virgin Islands and has no significant operations. This valuation report focuses on the operating
company, Beijing Digital TransVideo Technology Co., Ltd (“TransVideo” or the “Company”).
TransVideo is a leading public internet based internet protocol television (“IPTV”) technology and solution provider headquartered in
the ZhongGuanCun Hi-Tech district, of Beijing China. When the Company was established in 2004, its management team hired
scientists from Chinese universities that developed technology to service the end-to-end IPTV market. In 2005, a year after its
incorporation, the first version of the IPTV transmission was released, and the Company’s services were launched in Canada, Europe,
Japan, Korea, the Middle East and Australia. Since 2005 the Company has continued to develop cutting edge IPTV technology and
solutions for end-to-end IPTV service providers around the world.
TransVideo International Ltd.
(Holding Company)
Beijing Digital TransVideo
China iMedia Enterprise Ltd.
Technology Co., Ltd.
(Holding Company)
(Wholly Owned Subsidiary)
China Sports Media Company -
(66% Equity Ownership)
Joint Venture to be Formed
(10% Equity Ownership)
Beijing iMedia Technology Co.,
Ltd.
(Wholly Owned Subsidiary)
Page | 8
G-8

Ownership
AvantaLion, LLC has an 81% equity ownership interest in TransVideo. This entity is controlled by Charles Wang, who also sits on the
Board of Directors of NeuLion, Inc. TransVideo’s ownership breakdown is in the following table:
Board of Directors of NeuLion, Inc. TransVideo’s ownership breakdown is in the following table:
Owner
Ownership
Percentage
AvantaLion (entity controlled by Charles Wang)
81.00%
Employees:
Yunchuan Wang
7.25
Jingfang Hao
7.25
XiaHong Wang
1.25
Wei Shu
1.25
Daniel Zhao
0.25
Former Employees:
Qi Wang
0.94
ZhongJun Tan
0.81
Total
100%
Page | 9
G-9

Employees
At the end of 2009 the Company had a total of fifty nine employees. Forty of these of whom were located in Beijing, and ten were
located in Shenzen. Additionally, twenty two of these employees work in research and development, which is a critical area for the
success of the Company.
located in Shenzen. Additionally, twenty two of these employees work in research and development, which is a critical area for the
success of the Company.
The Company’s management team is headed by the following executives, who all have significant leadership experience in the
technology industry:
technology industry:
• Mr. Jianbing Duan, Chairman of the Board;
• Mr. Yunchan Wang, CEO and President;
• Mr. Jingfang Hao, Executive Vice Price of Business Development;
• Mr. Daniel Zhao, Vice President of Sales and Marketing;
• Ms. XiaHong Wang, Vice President of Research and Development; and
• Mr. Wei Shu, Vice President of Research and Development
Page | 10
G-10
Reception desk at TransVideo’s headquarters
Page | 11
G-11
Office workspace at TransVideo’s headquarters
Page | 12
G-12

Operations
The Company’s business plan is to focus on three main business segments: International, Domestic, and Platform Business, which are
detailed below.
detailed below.
International Business
The Company’s International business segment is focused on providing end-to-end IPTV companies with Set Top Boxes and
Transcoders, which are both used by IPTV companies to stream content to consumers. To date, the Company has sold its products to
two main partners in the International market: NeuLion Inc. and KyLinTV. Both of these companies are related to TransVideo with
common shareholders2. Additionally, TransVideo has a 31.8% equity ownership interest in KyLinTV.
The Company’s largest customer in the International Business segment is, NeuLion, Inc. which is focused on entering into agreements
with companies seeking their own private networks to reach target audiences. NeuLion provides these companies with complete IPTV
services. NeuLion has recently entered into an agreement with Dish TV where NeuLion will provide set top boxes to their
subscribers.
with companies seeking their own private networks to reach target audiences. NeuLion provides these companies with complete IPTV
services. NeuLion has recently entered into an agreement with Dish TV where NeuLion will provide set top boxes to their
subscribers.
KylinTV provides live television broadcasting and on demand movies from China. The company delivers its services through resellers
to TV sets over the internet ( IPTV), focusing on delivering content to the Chinese community in North America. As an IPTV service,
KylinTV is quite easy to use. Regardless of the Internet provider, subscribers need only have high-speed Internet access, connect their
Internet cable into a set top box(STB) provided by KylinTV, which is connected to their set, to receive DVD-quality TV programming.
2 Charles Wang is the Chairman of the Board of Directors of NeuLion, Inc., and owns 48.5% of the outstanding common equity. Mr. Wang’s wife, Nanci Li, is also the
CEO of NeuLion, Inc. Additionally, Mr. Wang invested $1 million in KyLinTV through AvantaLion LLC in February, 2010.
CEO of NeuLion, Inc. Additionally, Mr. Wang invested $1 million in KyLinTV through AvantaLion LLC in February, 2010.
Page | 13
G-13

Both of these companies are considered leaders in the international IPTV marketplace, and TransVideo’s goal is to continue to provide
technology and set top boxes and other IPTV technologies to them as they continue to grow.
technology and set top boxes and other IPTV technologies to them as they continue to grow.
As discussed in detail later in this report, the International Business segment is forecast to be a major portion of the Company’s
business. According to management’s projections, International Business from NeuLion and KyLinTV is expected to generate
approximately 66% of total revenue in 2010. However, this business segment is not the Company’s highest prospect for growth
relative to the other business segments. In fact, based on management’s financial projections, they expect this share of the Company’s
revenue to decline to approximately 18% of total revenue by 2015.
Domestic Business
TransVideo’s Domestic Business Segment, currently the second largest source of revenue for the Company, is broken down into five
sources, two of which are joint ventures that are discussed in detail in our report:
sources, two of which are joint ventures that are discussed in detail in our report:
w China Sports Media Company (a future Joint Venture with China State General Administration of Sports in
which TransVideo will have a 10% interest)
which TransVideo will have a 10% interest)
w Beijing iMedia Technology Co., Ltd. (TransVideo has a 66% interest in this company which markets the iBaby
brand of equipment and content)
brand of equipment and content)
w Sale of Set Top Boxes
w Sale of Transcoder Technology
w Site Licenses
w Site Licenses
The combined revenue from all five of these sources is projected to equal 33% of total revenue in 2010. Management has indicated that
significant revenue growth is projected over the next five years. The major growth area is in the sale of Set Top Boxes to Chinese
consumers in the domestic market through partnerships with SARFT (State Administration of Radio, Film, and Television), which is
the Chinese government entity that is in charge of the state owned enterprises in the television, radio, and film industries. This is
TransVideo’s core business, and management expects to generate in excess of $30 million of revenue by 2015.
According to management, there is a significant market opportunity to provide STB’s to customers in the Beijing, Tianjin, JianSu, and
ShanXi provinces that are beyond the reach of traditional broadcast mechanisms currently being used. Management believes that more
provincial broadcasters and State owned media company partners are expected to adopt the TransVideo IPTV model and technology
platforms, and will jointly roll out public internet based video and programming services. TransVideo’s strategy is to develop 3 - 5
Page | 14
G-14

jointly operated IPTV service platforms with SARF, targeting 300 thousand plus subscribers for each of the four provinces (the service
revenue portion of this project is part of the Platform Business, discussed later in this report).
revenue portion of this project is part of the Platform Business, discussed later in this report).
China Sports Media Company
One of the Company’s opportunities is a future joint venture known as the China Sports Media Company (“China Sports Media”). As
of the date of this report, TransVideo has signed a Memorandum of Understanding (MOA) with the Ministry of Sports General
Administration, which documents the terms and conditions for the project. Management expects to sign a formal agreement before the
end of the second quarter of 2010, at which point the joint venture will be officially established. Management has explained that, the
following entities will participate in the joint venture along with TransVideo:
w China Sports General Administration Ministry;
w China Olympic Committee/China General Sports Associations;
w China Sports Publication Corporation;
w China Sports Publication Corporation;
w www.sports.cn;
w Approximately 50-60 Chinese national sports organizations
• The Joint Venture is planning to develop partnerships with these organizations over the next 1-3 years,
starting with selective national sports associations, and then extending the business model to more areas.
starting with selective national sports associations, and then extending the business model to more areas.
TransVideo is expected to initially own a 10% interest in this joint venture. AvantaLion, LLC is expected to own 39% of the joint
venture and to contribute approximately $3.75 million of capital as needed. Management has indicated that, at some point in the future,
TransVideo may acquire AvantaLion’s interest and increase their ownership to 49%. If this takes place, TransVideo would have to
plan on investing the required capital.
Page | 15
G-15
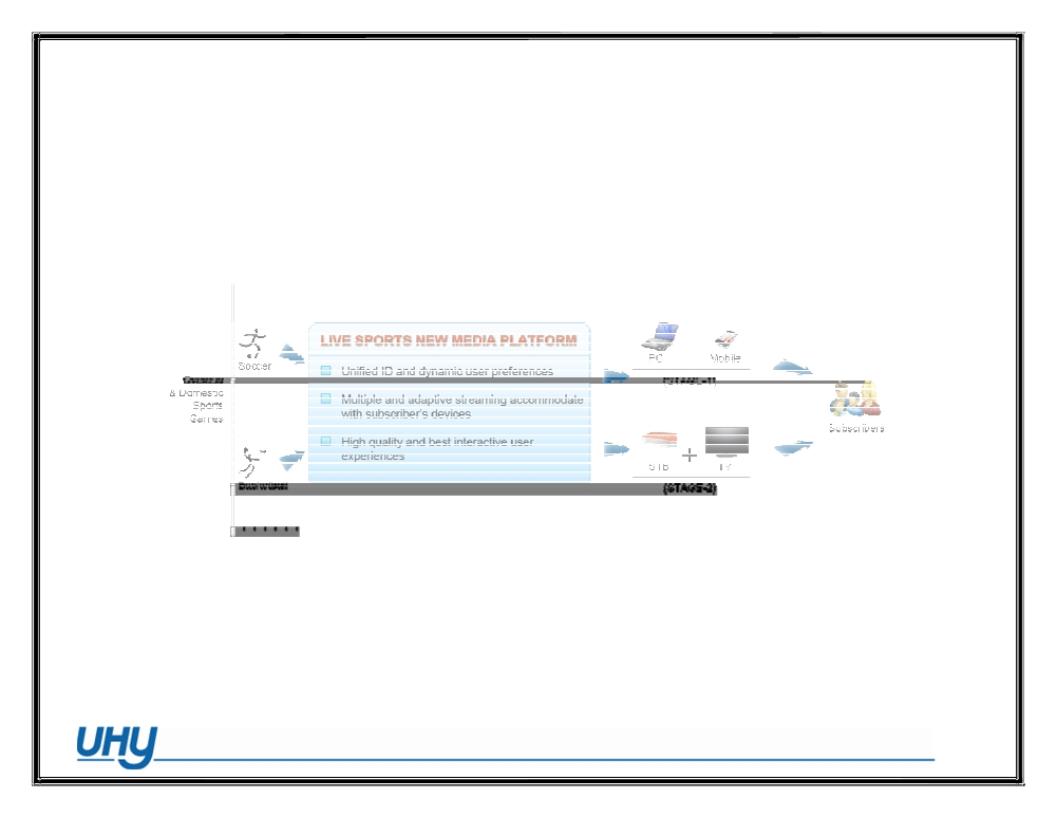
This Sports Media joint venture is positioned to aggregate sports content from various associations in China, and to deliver to Chinese
customers through the “New Sports Media” IPTV platform, for which TransVideo will be responsible for building and supplying the
technology. According to management, this joint venture has five major business areas including the following:
customers through the “New Sports Media” IPTV platform, for which TransVideo will be responsible for building and supplying the
technology. According to management, this joint venture has five major business areas including the following:
1) NextGen Live Sports New Media Platform
a) The goal of this business area is to cooperate with the various National Sports Associations to develop a local
sports broadcasting and licensing business in the Chinese TV industry. A visual representation of this business
area, in which the joint venture gathers content and distributes it to subscribers through the live sports new media
platform, is shown below:
sports broadcasting and licensing business in the Chinese TV industry. A visual representation of this business
area, in which the joint venture gathers content and distributes it to subscribers through the live sports new media
platform, is shown below:
2) iSports Education and Media Terminal Products
a) The goal of this business area is to develop terminal products (similar to a set top box) with sports games, sports
training courses, and sports related information to stream to subscribers.
training courses, and sports related information to stream to subscribers.
Page | 16
G-16

3) Digital Sports Media Library & Services
a) The goal of this business area is to establish the Chinese Professional Sports Digital Media Library to
accumulate and manage the storage and distribution of the digital game footage.
accumulate and manage the storage and distribution of the digital game footage.
b) The Library will service all the relevant National Sports associations and give them access to all the current and
historical sports content.
historical sports content.
c) This business area is also set up to provide the copyright registration and administration and consulting services to
all the associations to ensure that the legal rights and licenses are properly documented and protected.
all the associations to ensure that the legal rights and licenses are properly documented and protected.
4) China Sports TV Broadcasting Network;
a) The China Sports Media Co. will work closely with national sports associations as well as provincial TV stations
and the provincial SARFT to explore potential collaborations on domestic TV channels through selective TV
column or live game broadcasting.
and the provincial SARFT to explore potential collaborations on domestic TV channels through selective TV
column or live game broadcasting.
5) China Sports Oversea Broadcasting Platform
a) In this business area, the China Sports Media Co. will work with KylinTV to start the China Sports Channel and
the China Sports SVOD packages on KylinTV’s platform to stream to subscribers in North America and Europe.
the China Sports SVOD packages on KylinTV’s platform to stream to subscribers in North America and Europe.
Because China Sports Media is a relatively new joint venture, currently operating under the terms of a memorandum of understanding,
between the partners, 2010 revenues are projected to be relatively low, at approximately $582 thousand. Management has indicated
that the venture will need a capital infusion of approximately $3.75 million to fund operations over the next several years. TransVideo
will initially own a 10% interest in China Sports Media and AvantaLion, LLC will own a 39% interest. Eventually, this ownership may
change if TransVideo is acquired by NeuLion and AvantaLion’s 39% interest is contributed to TransVideo. If this was to take place,
TransVideo would also be assuming the responsibility to invest the required capital.
Page | 17
G-17

Beijing iMedia Technology Co., Ltd. - Joint Venture
TransVideo has an indirect 66% ownership interest in Beijing iMedia Technology Co., Ltd. through its 66% ownership of China
iMedia Enterprise Ltd. Beijing iMedia Technology Co., Ltd. is focused on providing educational content to the domestic Chinese
market through the iBaby brand name. The other 34% is owned by AvantaLion, LLC, an entity that is controlled by Charles Wang.
Beijing iMedia Technology Co., Ltd. is focused on providing the next generation parenting consumer product that offers the following
features:
o Basic parenting and pregnancy information
o Providing information to young parents regarding baby’s growth and aging
o Guiding young parents with step to step processes for nurturing their babies
o Guiding young parents with step to step processes for nurturing their babies
o Providing information on parenting in terms of nutrition, growth, behavioral habits, and psychology of infants based on
their age (months or years)
their age (months or years)
o Inspiring babies to start understanding the world through colorful graphics containing basic concepts, basic logic,
language development, etc.
language development, etc.
o Playing audio and video content such as children’s songs, cartoons, books, etc.
TransVideo International Ltd.
(Holding Company)
China iMedia Enterprise
Ltd.
Ltd.
(Holding Company)
Beijing iMedia Technology
Co., Ltd.
Co., Ltd.
(Wholly Owned Subsidiary)
Page | 18
G-18

This product will be sold as a box that is prepackaged with content, and is also able to access the internet to download additional
information, updates, etc. The business is to aggregate content from providers such as online stores or video distributors, and to load
this content onto the iBabyBox, at which point it will be distributed to the end customer via one or more distribution channels
including maternal supplies stores, parent-child centers, maternity hospitals, kindergarten, etc. A visual representation of the business
model is shown below.
Page | 19
G-19

Revenue is expected to be generated from the sale of the iBabyBox, which is expected to have a gross margin of approximately 40% or
more. In the future, this joint venture may be able to generate revenue through classified advertising and ecommerce, although the
feasibility of these sources is unknown and as such has not been included in management’s forecast.
more. In the future, this joint venture may be able to generate revenue through classified advertising and ecommerce, although the
feasibility of these sources is unknown and as such has not been included in management’s forecast.
iBaby has a goal of reaching $10 million in annual revenue by 2014, which would translate to a compound annual growth rate in the
range of 60 - 80%.
range of 60 - 80%.
Platform Business
TransVideo’s third source of business is the Platform Business, which is an effort to partner with the leading content providers in the
provincial SARFT organizations, to provide platform services and share annual subscription proceeds. Management’s strategy for
pursuing this business is to invest in the infrastructure necessary to provide turnkey solutions to the holders of IPTV licenses to run
joint platforms in China. This means that the Company will handle the following services:
w Subscriber Management
w Accounting and Billing
w Services Management
w Services Management
w System Monitoring
w Streaming Services
w Load Balance
w Storage Scheduling
w Authentication Upgrades
While the revenue from the two other business segments is primarily related to the sale of set top boxes, transcoders, and other
hardware, the revenue generated by the Platform Business is tied to charges and fees for services, which makes it a much higher
margin business.
hardware, the revenue generated by the Platform Business is tied to charges and fees for services, which makes it a much higher
margin business.
Page | 20
G-20
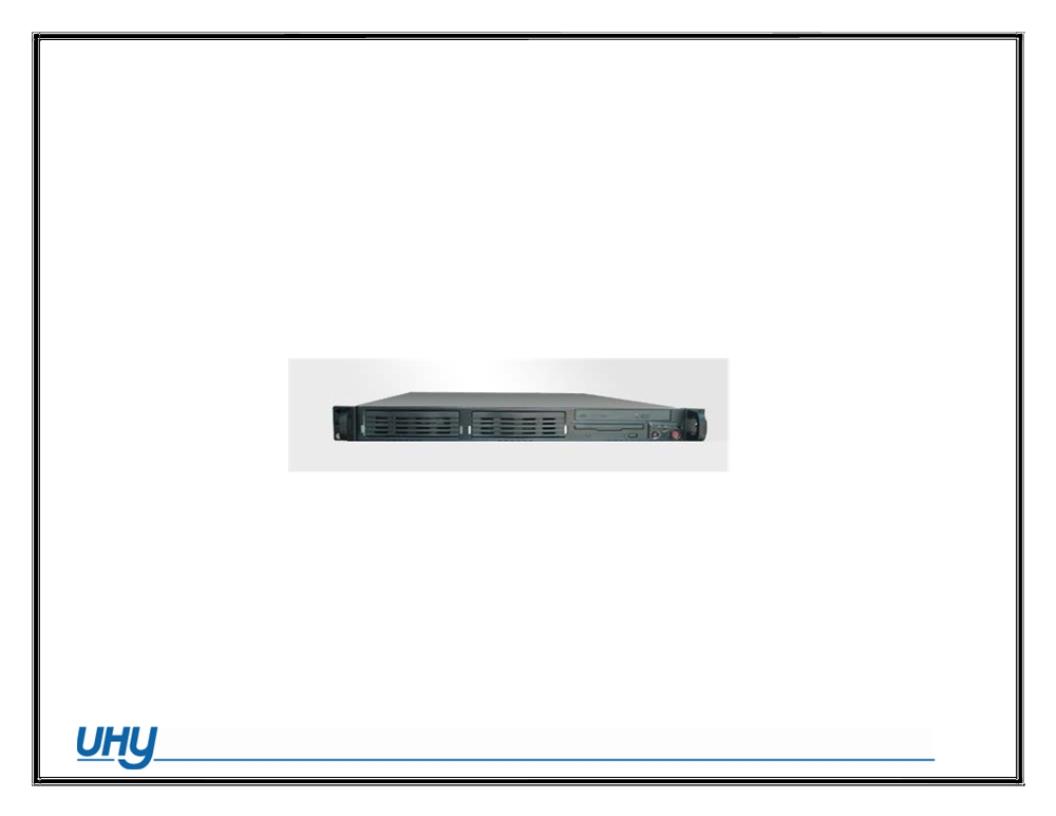
Products and Technology:
TransVideo provides its business partners in KylinTV, iMedia and iSports, as well as NeuLion, with the following equipment and
technology:
technology:
• Transcoding Devices
o TransVideo H.264 Real Time Transcoding Devices are high quality head-end products for video networks. These
products are used in public internet or broadband network operations, and provide key components for IP video
applications. This product benefits from optimized H.264 encoding formats which utilize advanced algorithms. The
encoding efficiency of this product results in clear, fluent, and close to DVD picture quality.
o This product supports high quality video stream output in various sizes and formats, which reduces the compressed
output code stream so that it can be adaptable to different bandwidth environments and operation requirements.
output code stream so that it can be adaptable to different bandwidth environments and operation requirements.
• Time Shift Systems
o This product is an online processing system which enables the customer to have control over channels’ time-shift and
play back. This means that the customer can have control over live television (i.e. instant replay).
play back. This means that the customer can have control over live television (i.e. instant replay).
Page | 21
G-21
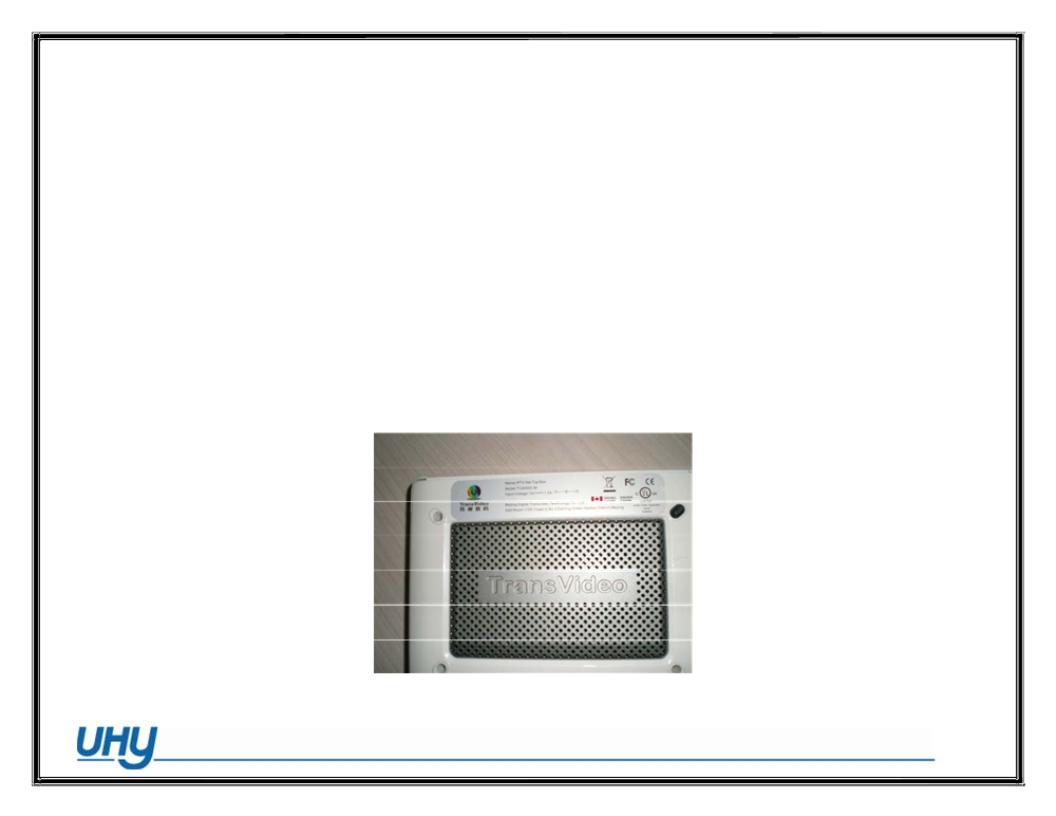
• Set Top Boxes
o The Company offers two different Set Top Boxes (STB’s) including the i-Box 2000 version and the i-Box 3000 version.
The iBox 3000 is an improvement on the iBox 2000 version, with a built in hard drive in the hardware framework. As a
result, this product supports the following functions:
The iBox 3000 is an improvement on the iBox 2000 version, with a built in hard drive in the hardware framework. As a
result, this product supports the following functions:
w IP Live TV
w VOD (Video on Demand)
w SVOD Subscription
w SVOD Subscription
w Push Service
w Home Media Center
w EPG (Electronic Program Guide)
w VoIP (Voice over IP)
w VoIP (Voice over IP)
w Instant Messaging
Page | 22
G-22

• TV Center Rich-Media Services Platform
o This is an efficient management service platform for multimedia services. It provides more flexible and dynamic service
operation management capabilities for operators of IPTV networks.
operation management capabilities for operators of IPTV networks.
• Studio Content Production and Management
o This is a network program production and audio/video information publication application system developed by
Transvideo. The major functions include:
Transvideo. The major functions include:
w Contract Management
w Program Management
w Program Release
w Program Release
w System Management
In addition to the Company’s products, the following IPTV solution services are offered by TransVideo, based on its basic platform,
including i-Studio, i-transcode, i-TVcenter and i-Box:
including i-Studio, i-transcode, i-TVcenter and i-Box:
• Cast TV Live Solution
o This service is typically applied to TV broadcast platforms for broadband customers. The service offers a multi-channel
broadcast with the look and feel of a typical television viewing experience. This service is suitable for initial deployment
oriented to a mass entertainment platform. This service also suits professional TV station's deployment oriented to special
people groups. Some real world stories for this application include the following: ƒ North America KyLinTV IPTV
broadcast platform. KyLinTV platform is a multi-IPTV application platform, covering TransVideo i-Cast and i-VOD
solutions. Through the public internet, KyLinTV broadcasts nearly 40 channels of live and recorded programs for North
American Chinese on a daily basis.
o The North America Philippine TV station directly broadcasts Philippine programs of 4 satellite channels and
provides services for Philippine customers in North America through the public internet. ƒ The New York
Islanders use this service to provide live broadcasts and non-real time content for Video on Demand (“VOD”)
service.
provides services for Philippine customers in North America through the public internet. ƒ The New York
Islanders use this service to provide live broadcasts and non-real time content for Video on Demand (“VOD”)
service.
Page | 23
G-23

• Video on Demand
o In a traditional television broadcast, the viewer is completely passive because they can only watch the program that the
TV station broadcasts. VOD allows the viewer to watch any content, at any time, as many times as they want.
TV station broadcasts. VOD allows the viewer to watch any content, at any time, as many times as they want.
• Push Network Pushing Solution
o This service is designed to address the needs of enterprises that wish to broadcast internal content such as company
news. This system ensures the timely broadcast of information to public areas.
news. This system ensures the timely broadcast of information to public areas.
• Download Home Media Center
o This service utilizes the TV Center Rich-Media Services Platform and the Studio Content Production and Management
products described above to download audio/video content, photo sharing, VOIP and the sharing of audio/video
messages between family members.
products described above to download audio/video content, photo sharing, VOIP and the sharing of audio/video
messages between family members.
TransVideo’s IPTV solutions service line is more fully explained in the following illustrations:
Page | 24
G-24
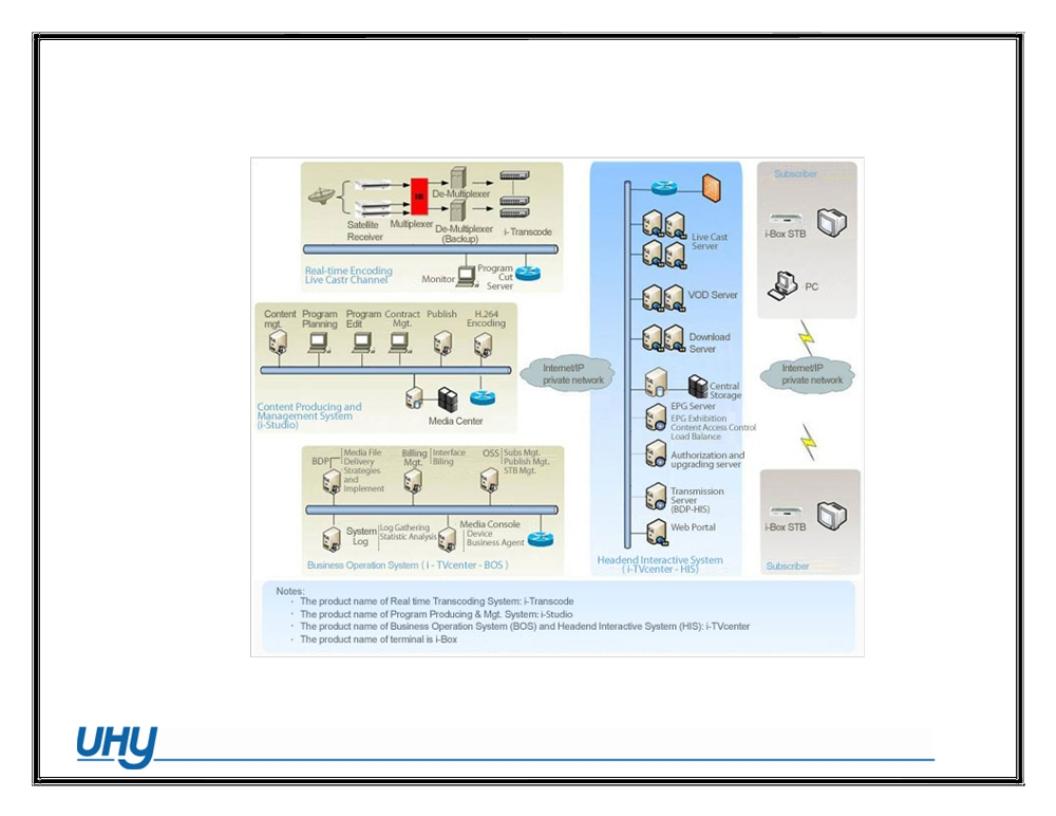
Illustration of IPTV Solution Services
Page | 25
G-25

Competition
According to management the Company has no direct competitors because of its unique business model. However, the following
companies compete with TransVideo for some portion of the IPTV marketplace, either as technology suppliers or operators of IPTV
networks.
companies compete with TransVideo for some portion of the IPTV marketplace, either as technology suppliers or operators of IPTV
networks.
1)
Envivio
a) Envivio began in 2000 as an inventor of video encoding technology. Since its inception, Envivio has amassed dozens of patents,
pioneered video-over-IP methods, and continually leads with support for emerging technology, from the first H.264 encoder
and the first encoder to simultaneously support multiple devices and networks, to the first solution for protecting and delivering
premium TV services to the iPhone.
pioneered video-over-IP methods, and continually leads with support for emerging technology, from the first H.264 encoder
and the first encoder to simultaneously support multiple devices and networks, to the first solution for protecting and delivering
premium TV services to the iPhone.
b) Envivio provides the major products like live or offline H.264 SD/HD Encoder are delivering millions of content streams to
hundreds of different styles of mobile phones, set top boxes, as well as PC platforms.
hundreds of different styles of mobile phones, set top boxes, as well as PC platforms.
c) Envivio is headquartered in South San Francisco, California and has a worldwide presence with offices in New York, New
York; London, England; Rennes, France; Beijing, China; and Tokyo, Japan.
York; London, England; Rennes, France; Beijing, China; and Tokyo, Japan.
d) On September 12, 2008, Envivio closed $25 million in new venture capital funding. The $25 million in financing is being co-
led by private equity firms Harbourvest and Atlantic Bridge, as well as Samsung Ventures. These lead investors are joined by
many of the current members of Envivio’s investor portfolio which includes Crédit Agricole Private Equity, Crescendo
Ventures, Innovacom (France Telecom), Harbinger Venture Management, Intel Capital, NTT Finance, Saints Capital, Sigma
Designs and Solidarity Fund QFL.
2)Tandberg (OSLO: TAA.OL)
a) Tandberg is the leading provider of telepresence, high-definition videoconferencing and mobile video products and services.
The Company has dual headquarters in New York and Oslo. Tandberg designs, develops and markets systems and software
for video, voice and data communication. This company provides sales, support and value-added services in more than 90
countries worldwide. Tandberg is publicly traded on the Oslo Stock Exchange under the ticker TAA.OL. On Dec 04, 2009,
Cisco announced that their subsidiary Cisco Systems Netherlands Holdings BV (“Cisco BV”) had tendered a voluntary offer to
purchase approximately 102 million shares, or approximately 91.1% of the shares including voting rights. Enough shares were
tendered by April 2010 to complete the transaction. This was followed by a compulsory acquisition of the remaining shares not
already owned by Cisco BV. The transaction was valued at approximately USD$3.3 billion, based on the exchange rate in
effect in January2010. Based on Tandberg’s reported 2009 revenues of USD$902.6 million and operating profit of
USD$193.8 million, the deal was priced at 3.66x revenue and 17.0x operating profit.
Page | 26
G-26

b) Beijing Gehua CATV Network Co., Ltd.
c) Founded in 1999, Beijing Gehua CATV Network Co., Ltd, (“Gehua CATV”), is responsible for the construction, development,
management, running and maintenance of cable TV networks, as well as receiving, transmitting, and broadcasting cable TV
programs in Beijing. Gehua CATV went public in 2001 on the Shanghai Stock Market, and in May, 2004, the company issued
1.25 billion yuan worth of convertible company bonds. Currently, this company has installed over 10 thousand kilometers fiber
cable, and over 100 thousand electrical cable networks in Beijing. Gehua CATV has 3.65 million customers with its service
covering 18 districts and counties.
3)Wasu Digital TV Media Group Co., Ltd
a) Wasu Digital TV Media Group Co., Ltd (“Wasu Digital”), is an industry leader in digital TV network services throughout the
Zhejiang Province. This company has grown from a cable TV service provider to an integrated business operator by offering
multiple services including wireless TV, mobile TV and digital TV. In 2006, Wasu Digital transformed cable TV service into
digital TV for households in Hangzhou, where its digital TV service now reaches 1.2 million customers and over 95% of
households in urban areas. Through a partnership with Unicom, Wasu Digital began to offer programs through the broadband,
making it the first company to operate IPTV services in Hangzhou. Moreover, its interactive digital TV service allows
customers to view live and TV-on-demand TV programs, to playback programs and to access value-added content (such as
games, TV SMS and Home Bank etc). According to www.lmtw.com (Liumeiti network), by the end of year 2009, Wasu
Digital has 560 thousand interactive TV (IPTV) customers, of which, 420 thousand were located in the Zhejiang Province. This
company has obtained three licenses, including IPTV license, mobile TV license and the Internet TV operation license, which
is a new license issued by SARFT.
4)Shenzhen Topway Video Communication Co., Ltd.
a) Shenzhen Topway Video Communication Co., Ltd. (“Topway Video”) is owned and managed by the Shenzhen Media Group.
This entity is the first corporation to specialize in running a cable TV network in China. Topway Video’s operations include the
construction, development, operation and management of the cable TV network business in Shenzhen in addition to the
reception, transmission and broadcasting of cable TV programs. This company also offers digital TV, interactive TV, HD TV,
cable broadband, and internet TV services to its customers.
5)
Tudou.com
a) Tudou.com is the largest online video sharing platform in China. Using this website, users can upload, view and share video
clips. Tudou went live on April 15, 2005 and has grown into one of the world's largest content delivery networks, serving over
300 million videos each day, with more than 50,000 new videos published each day from more than 2500 content partners.
Tudou focuses on advertising model as its core revenue model.
b) Tudou has raised several rounds of funding, the latest being $57 million in spring 2008 for a total of $85 million.
Page | 27
G-27

6) Youku.com
a) Youku.com is China’s leading Internet video website and premier online video brand. Youku offers a mix of professionally-
produced and user-generated video from their network of over 2,000 media partners from China, Asia, and around the world.
Youku.com was officially launched in December 2006 and has grown rapidly ever since. As of December 2009, Youku attracts
more than 30 million unique viewers a day, and 200 million a month according to Nielsen and iResearch. Total user time spent
exceeded 40 billion minutes per month.
b) In December, 2009, this Company received a fifth round of investments totaling $40 million. The investors included Brookside
Capital Partners (a subsidiary of Bain Capital), Sutter Hill Ventures, Farallon Capital, Chengwei Ventures, and Maverick
Capital.
Capital Partners (a subsidiary of Bain Capital), Sutter Hill Ventures, Farallon Capital, Chengwei Ventures, and Maverick
Capital.
7)
56.com
a)56.com is one of the largest video-sharing website in China that focuses on advertising model as its core revenue model. b) To
date, 56.com has received more than $30 million venture capital investments from firms including Sequoia Capital, Steamboat
and SIG.
date, 56.com has received more than $30 million venture capital investments from firms including Sequoia Capital, Steamboat
and SIG.
It is clear that the IPTV and video on demand industry is fragmented, and that the Company has significant competition from various
types of companies. TransVideo should be able to leverage its relationships with respected IPTV service providers and strategic
operators such as NeuLion and KyLinTV, however it will need to continue its history of innovation to differentiate itself in the
crowded marketplace.
types of companies. TransVideo should be able to leverage its relationships with respected IPTV service providers and strategic
operators such as NeuLion and KyLinTV, however it will need to continue its history of innovation to differentiate itself in the
crowded marketplace.
Dividends
TransVideo has not paid dividends since its inception.
Legal Proceedings
Management has indicated that TransVideo does not have any pending or threatened litigation outstanding as of the date of this report.
Page | 28
G-28

Financial Statement Analysis
Schedules 1 and 3 present the balance sheets of TransVideo as of December 31, 2008 through December 31, 2009. Presented in Schedule 2
are common size balance sheets for the Company as of the same dates.
are common size balance sheets for the Company as of the same dates.
Below are the Company’s key reported balance sheet items for December 31, 2008 through 2009.
Description
2009
2008
Cash & Equivalents
$1,500,918
$ 4,274,837
Accounts Receivable
225,557
637,291
Other Receivable, Net
1,129,437
357,483
Inventories
1,312,420
1,381,513
Total Current Assets
4,188,799
6,658,727
Net Fixed Assets
353,319
481,627
Total Assets
6,115,947
7,185,821
2,060,524
4,413,677
Working Capital
Accounts Payable
90,430
215,885
Accrued Expenses and Other Current Liabilities
6,249
6,120
Other Payables
588,718
660,639
Due to Stockholders
598,186
587,054
Total Liabilities
2,584,774
2,765,053
Shareholders' Equity
$3,531,173
$4,420,768
Page | 29
G-29

A discussion of the Company’s key balance sheet items follows:
•The Company’s cash and equivalents balance has fallen considerably from 2008 to 2009, largely as a result of the Company’s poor
financial performance in 2009. The Company’s liquidity needs will continue to be a concern going forward, as management is
projecting negative cash flow for 2010.
financial performance in 2009. The Company’s liquidity needs will continue to be a concern going forward, as management is
projecting negative cash flow for 2010.
•The Company’s accounts receivable balance is $200 thousand as of December 31, 2009, which is low relative to the balance as of
December 31, 2008. However, the Company’s revenue took a steep fall in 2009, so it is logical that the accounts receivable balance
would be lower.
December 31, 2008. However, the Company’s revenue took a steep fall in 2009, so it is logical that the accounts receivable balance
would be lower.
•The Company’s other account receivable is from the OEM supplier that manufactures the Set Top Boxes for TransVideo. Although this
is a relatively large year over year increase, the Company has not recorded an allowance for doubtful accounts for this line item and
considers the OEM to be a credit worthy supplier.
is a relatively large year over year increase, the Company has not recorded an allowance for doubtful accounts for this line item and
considers the OEM to be a credit worthy supplier.
•The Company’s inventory balance of approximately $930 thousand as of December 31, 2009 is mostly made up of raw materials and
finished goods (set top boxes, transcoders, etc). This is a high level of inventory relative to 2009 sales, however volume is expected
to increase going forward. Management has indicated that they anticipate keeping an inventory of 10,000 to 15,000 STBs on hand
just to handle the NeuLion business with Dish Network.
•Total current assets at December 31, 2009 were $4.2 million, a decrease of $2.5 million from the December 31, 2008 balance of $6.7
million. As mentioned earlier, the change is primarily due to a decrease in cash and cash equivalents of $2.8 million.
million. As mentioned earlier, the change is primarily due to a decrease in cash and cash equivalents of $2.8 million.
•The net working capital at December 31, 2009 was $2.1 million, a decrease of $2.3 million from the December 31, 2008 net working
capital of $4.4 million. The decreased working capital is primarily due to funding an operating loss of approximately $900 thousand,
and using cash to fund long term investments.
capital of $4.4 million. The decreased working capital is primarily due to funding an operating loss of approximately $900 thousand,
and using cash to fund long term investments.
o Because the company used significant funds in 2009 and projects a loss for 2010, it will need to generate positive cash flow
going forward. The China Sports Media joint venture will potentially need additional funds of up to $3.75 million from its
partners. Currently it is anticipated that the majority of those funds will come from AvantaLion, LLC. The Beijing iMedia
Technology Co joint venture has enough liquidity to fund its operations for the time being, although TransVideo as a whole
needs to generate positive cash flow going forward.
Page | 30
G-30

• The Company has no interest bearing debt as of December 31, 2009. In general, the Company’s balance sheet is adequate as of the
valuation date, with sufficient current assets to cover current liabilities and not long-term debt. However, liquidity will be a critical
component of the Company’s success going forward. If positive cash flow is not generated from operations by the end of 2010, the
Company will need additional sources of working capital to fund it growth plans going forward.
Schedule 4 presents the income statements of TransVideo for the years ended December 31, 2008 through December 31, 2009. Presented in
Schedule 5 are common size income statements for the Company for the same time periods. Operating results are summarized below.
Schedule 5 are common size income statements for the Company for the same time periods. Operating results are summarized below.
Description
2009
2008
Net Revenues
$1,731,055
$11,522,275
Gross Profit
510,860
5,294,683
Operating Expenses
1,522,119
2,514,659
Total Other Income
118,571
92,939
Net Income
$ (892,688)
$2,871,509
• The company had net revenue of $11.5 million for the year ended December 31, 2008, which subsequently suffered a steep decline to
$1.7 million. The reason that revenue fell so dramatically was twofold. First, prior to 2009 the Company had an agreement with
KyLinTV, in which KyLinTV outsourced all of its programming, channel packaging, call center, and internal operating services to
TransVideo. This relationship was ended, and KyLinTV moved these operations in house, which resulted in lost revenue of $2
million for TransVideo. Further, the poor economic climate caused NeuLion, the Company’s other main business partner, to stop
ordering set top boxes. The combination of these factors hurt the company’s revenue figure, although the Company did experience
positive growth in the sale of set top boxes to consumers in the domestic market.
• As a result of the sharp decline in revenue, the Company’s gross profit was dramatically lower in 2009 relative 2008. The Company’s
operating margin was also significantly impacted because operating expenses remained fairly high at $1.5 million for 2009, which
caused an operating loss of $1million.
operating margin was also significantly impacted because operating expenses remained fairly high at $1.5 million for 2009, which
caused an operating loss of $1million.
Page | 31
G-31
• As discussed in detail in the following section of the report, the Company’s future financial performance is expected to turn around
significantly compared to the dismal year in 2009. As TransVideo adjusts to a more favorable economic climate and new business
opportunities, management expects the company to begin generating positive cash flow going forward.
significantly compared to the dismal year in 2009. As TransVideo adjusts to a more favorable economic climate and new business
opportunities, management expects the company to begin generating positive cash flow going forward.
Investments
As previously discussed, KylinTV is an IPTV service provider that is dedicated to the Chinese community living in North America. KylinTV
offers access to over 60 of the most popular TV channels and 30,000 + hours of Video-On-Demand programming. With the launch of its
strategic partnership with Phoenix China News and Entertainment (Phoenix CNE) in 2009, Kylin TV Europe also offers more than 20
popular Chinese TV channels from mainland China, Hong Kong, Macau and Taiwan to viewers in Europe.
The company is controlled by Charles B. Wang, founder of Computer Associates and Chairman of the Board of NeuLion; and Charles
Dolan, founder of Cablevision. KyLinTV is based in Plainview, New York.
Dolan, founder of Cablevision. KyLinTV is based in Plainview, New York.
KylinTV is in business to create the best Chinese language IPTV platform overseas for spreading the Chinese culture. Through the use of
IPTV, KylinTV’s patent pending Video technology brings high quality broadcast channels and VOD to the TV set using existing Home DSL
or Cable broadband. This makes KylinTV very easy to set up and use. The company’s business relationship with TransVideo brings to North
America the exclusive broadcasting of mainland China television and local videos on demand.
It is important to note that on February 26, 2010, a group of investors invested $10.0 million in KyLinTV for 15.1% of its equity, which
reduced the Company’s equity interest in KyLinTV to 31.8%. Of the total $10.0 million investment, $1.0 million was invested by
AvantaLion LLC, a company controlled by Charles Wang, while the remainder was invested by Investor AB, which is a Nordic-based
industrial holding company that has a long history in this investment circle.3
3 www.investorab.com
Page | 32
G-32

Financial Projections4
TransVideo management has prepared detailed financial projections for the years ended December 31, 2010 through 2015 which are shown in Schedules
8 through 11. Below is a summary of the projected revenue, cost of revenue, and value added taxes5.
8 through 11. Below is a summary of the projected revenue, cost of revenue, and value added taxes5.
For the Years Ending December 31
Description
12/31/2010
12/31/2011
12/31/2012
12/31/2013
12/31/2014
12/31/2015
REVENUE
International (see schedule 10)
$
3,748,000
$
6,248,000
$
7,565,000
$
8,785,000
$
10,037,000
$
12,768,200
Domestic (see schedule 11)
1,898,284
5,487,654
10,805,075
19,135,882
30,435,742
46,295,220
Platform
45,882
875,294
2,294,118
4,350,000
7,491,176
13,041,176
Total Revenue
$
5,692,166
$
12,610,948
$
20,664,193
$
32,270,882
$
47,963,918
$
72,104,597
COST OF REVENUE
International (see schedule 10)
$
2,895,478
$
4,514,574
$
5,460,735
$
6,040,800
$
7,259,853
$
9,277,382
Domestic (see schedule 11)
866,453
3,499,915
7,898,376
15,304,846
24,837,564
38,996,880
Platform
37,353
344,118
826,471
1,358,824
2,344,118
3,861,765
Total Cost of Revenue
$
3,799,284
$
8,358,607
$
14,185,582
$
22,704,470
$
34,441,535
$
52,136,027
TAXES
Domestic
$
76,755
$
160,269
$
251,945
$
388,052
$
590,216
$
846,604
Platform
2,294
43,764
114,705
217,501
374,559
652,059
Total Taxes
$
79,049
$
204,033
$
366,650
$
605,553
$
964,775
$
1,498,663
GROSS PROFIT
$
1,813,833
$
4,048,308
$
6,111,961
$
8,960,859
$
12,557,608
$
18,469,907
4 These financial projections were provided by the management of TransVideo. We have not audited or provided any attest services with respect to this prospective data.
5 The Peoples Republic of China has a layer of taxes called Value Added Taxes, which are assessed at various rates according to the gross margin on a specific product
or service. The Company’s forecast includes a Value Added Tax of 17% on the sale of set top boxes, and 5% on service revenue for the Domestic and Platform business
segments.
Page | 33
G-33

The following discussion relates to management’s financial projections for the years 2010 - 2015. Note that these projections were provided
by the management of TransVideo. We have not audited or provided any attest services with respect to this prospective data.
by the management of TransVideo. We have not audited or provided any attest services with respect to this prospective data.
•
International Business
o International Business segment is expected to be the Company’s largest source of revenue in 2010. ƒ Sales to KyLinTV are
forecasted to be approximately $1.3 million in 2010, and are forecasted to increase to $4.1 million in 2015. Almost all of the
forecasted sales are for Set Top Boxes, as this is the Company’s core competency.
forecasted to be approximately $1.3 million in 2010, and are forecasted to increase to $4.1 million in 2015. Almost all of the
forecasted sales are for Set Top Boxes, as this is the Company’s core competency.
w Sales to NeuLion are partially attributable to its deal with Dish Network, and are projected by management to add
revenues of $2.5 million in 2010, and grow to approximately $8.6 million by 2015. Similar to the KyLinTV forecast, a
majority of these sales are set top boxes. Management has projected unit sales of STBs to NeuLion to start at 31,000
units in 2010 and increase each year, reaching 104,400 units by 2015.
w The international business segment is forecasted to be a strong area for the Company, and is expected to grow from $3
million in 2010 to slightly less than $17 million in 2015. The growth will primarily be through the marketing efforts
and growth of NeuLion and KyLinTV, which are forecasted to increase their respective market shares in North
America and Europe.
million in 2010 to slightly less than $17 million in 2015. The growth will primarily be through the marketing efforts
and growth of NeuLion and KyLinTV, which are forecasted to increase their respective market shares in North
America and Europe.
o International Business revenue is primarily generated through the sale of equipment, so the gross margins will be lower than
the margins on its service income from the Platform Business.
the margins on its service income from the Platform Business.
o There are no value added taxes assessed to the International Business segment, because these sales occur to entities that are
outside of the People’s Republic of China.
outside of the People’s Republic of China.
•
Domestic Business
o The Domestic business segment is the Company’s second largest source of revenue in 2010, and is expected to have a much
faster growth rate than the International and Platform business segments.
faster growth rate than the International and Platform business segments.
o As previously mentioned, there are five main sources of revenue within the Domestic business area. By far the largest growth
area is the sale of set top boxes to the domestic consumers in the four Chinese provinces in conjunction with SARFT (State
Administration of Radio, Film, and Television). This is expected to generate revenue of $34 million in 2015 as a result of the
extremely large potential consumer base.
area is the sale of set top boxes to the domestic consumers in the four Chinese provinces in conjunction with SARFT (State
Administration of Radio, Film, and Television). This is expected to generate revenue of $34 million in 2015 as a result of the
extremely large potential consumer base.
Page | 34
G-34

oThe second largest sources of revenue growth over the forecast are from the Company’s two joint ventures (iMedia and iSport).
Management projects the sales of set top boxes through iMedia using the iBaby brand name to generate $450 thousand of revenue
in 2010, and increase to $4.8 million by 2015. Projections for the sale of STBs through the future China Sports Media joint
venture (iSport) start at a modest $140 thousand in 2010 and increase to $2.4 million by 2015. ƒ As previously discussed, the
iMedia business is new and in the early stages of being rolled out. The iSport venture is just operating under a memorandum of
understand as of the date of this report, with a formal agreement expected to be finalized by the end of the second quarter of 2010.
Also, management’s projections for the sale of set top boxes in the domestic market are somewhat aggressive. Accordingly, as
with any new business venture that does not have an established track record, the risk of attaining the projected numbers of unit
sales is inherently high. oDomestic Business revenue is also projected to be earned from sales of set top boxes and transcoders to
as yet unidentified sources. Management has indicated that revenues from lines not specifically identified as iBaby, iBox or
iSports are reserved for potential future cooperative deals with cities and provinces throughout China, where TransVideo will
contribute the platform and the backend, as well as running the delivery services as NeuLion, and develop a revenue sharing
arrangement with the provincial SARFT organization. Management has indicated they expect to close two provincial deals for
IPTV platforms and STBs in 2010. In 2011 - 2014, the expectation is that the subscriber base will experience good growth and
more deals will be closed in China. Those deals will contribute both equipment and site license revenues. oAdditional revenues
are projected to be generated from site licenses throughout the forecast period. ƒ The gross margin in 2010 is approximately
54% because revenue from site licensing is forecast to be approximately $330 thousand. However, revenue from site licenses is
only forecast to increase to $2.3 million in 2015, compared to approximately $44 million for set top boxes, and transcoders.
Accordingly, the gross margin is forecast to decline over time from 54% in 2010 to 20% in 2015.
•
Platform Business
o Platform revenue is forecast to increase from $46 thousand in 2010 to $13 million in 2015. The Company expects strong
growth in this segment, stemming from future partnerships with SARFT organizations to provide platform services that reach
a large subscription base in the domestic market. Again, it is important to note that the SARFT has not officially entered into
any agreements with the Company.
growth in this segment, stemming from future partnerships with SARFT organizations to provide platform services that reach
a large subscription base in the domestic market. Again, it is important to note that the SARFT has not officially entered into
any agreements with the Company.
o Platform Business gross margins are forecast to be approximately 19% in 2010, but increase to 70% in 2015 as a result of
increased economies of scale. This is a much higher gross margin than the International Business Segments, and contributes a
substantial amount of cash flow to the Company’s bottom line.
increased economies of scale. This is a much higher gross margin than the International Business Segments, and contributes a
substantial amount of cash flow to the Company’s bottom line.
Page | 35
G-35

• Gross Profit Margin
o As a result of the three business segment forecasts above, the total cost of revenue for the Company’s products is expected to
increase from 67% to 72% in 2015, as a result of relatively low margin set top box sales representing the majority of revenues
at the tail end of the forecast. This translates to a gross profit of $1.8 million in 2010, which is set to increase to $52 million in
2015.
increase from 67% to 72% in 2015, as a result of relatively low margin set top box sales representing the majority of revenues
at the tail end of the forecast. This translates to a gross profit of $1.8 million in 2010, which is set to increase to $52 million in
2015.
• Operating Expenses
The Company’s two largest operating expenses for the forecast period are salaries and benefits and sales commissions (excluding
depreciation and amortization) as shown in the table on the next page.
depreciation and amortization) as shown in the table on the next page.
Page | 36
G-36

For the Years Ending December 31
12/31/2010
12/31/2011
12/31/2012
12/31/2013
12/31/2014
12/31/20156
GROSS PROFIT (from pg. 33)
$
1,813,833
$
4,048,308
$
6,111,961
$
8,960,859
$
12,557,608
$
18,469,907
OPERATING EXPENSES
Salaries and Benefits
1,234,429
1,786,245
2,295,711
2,658,567
3,002,953
3,236,757
Sales Commission
56,949
164,630
324,152
574,076
913,072
1,388,857
Office Rental
93,783
135,985
197,179
285,909
414,568
601,124
Office Expense
22,556
32,707
47,425
68,766
99,711
144,581
Telecom Hosting and Network
30,223
43,823
63,543
92,138
133,600
193,720
Postage
3,574
5,182
7,513
10,894
15,797
22,905
Travel
81,072
117,554
170,453
247,157
358,378
519,648
Entertainment
15,956
23,136
33,547
48,644
70,533
102,273
Repair Cost
16,176
23,456
34,011
49,316
71,508
103,687
Research and Development
58,824
85,294
123,676
179,331
260,030
377,043
Information Technology
2,441
3,540
5,133
7,442
10,791
15,647
Consulting
81,076
117,560
170,462
247,170
358,396
519,675
Depreciation and Amortization
155,831
494,417
1,244,043
1,895,287
3,293,537
4,871,278
OPERATING INCOME
(39,057)
1,014,779
1,395,113
2,596,162
3,554,734
6,372,712
Other Income / (Expense)
Interest Expense (-)
(2,941)
(2,941)
(2,941)
(2,941)
(2,941)
(2,941)
Total Other Income / (Expense)
(2,941)
(2,941)
(2,941)
(2,941)
(2,941)
(2,941)
PRE-TAX INCOME / (LOSS)
(41,998)
1,011,838
1,392,172
2,593,221
3,551,793
6,369,771
Income Tax Expense1
-
(252,960)
(348,043)
(648,305)
(887,948)
(1,592,443)
NET INCOME / (LOSS)
$
(41,998)
$
758,878
$
1,044,129
$
1,944,916
$
2,663,845
$
4,777,328
6 These financial projections were provided by the management of TransVideo. We have not audited or provided any attest services with respect to this prospective data.
Page | 37
Page | 37
G-37

o Salaries and benefits are forecasted based on the number of people in each department (research and development, marketing
and supports, sales and marketing, platform operations and service, etc) multiplied by an average salary figure for that group.
Accordingly, the Company expects to have 57 total employees in 2010 resulting in total salary and benefits of $1.2 million. By
2015, this is expected to increase to 94 employees with total salary and benefits of $3.2 million. ƒ The System Research and
Development and Platform Operations departments are expected to grow significantly, as the Company will need to continue its
history of innovation, and has clearly forecasted significant growth in the Platform Business area.
o Sales Commissions are forecasted to be 3% of total domestic sales. Accordingly, this expense is forecasted to increase with the
increase in the Company’s domestic business forecast.
increase in the Company’s domestic business forecast.
o Other operating expenses were forecasted for 2010, and were grown at 45% on an annual basis from 2011 through 2015. As a
result, the Company’s forecasted total operating expenses as a percentage of revenue are expected to decline from 37% in
2010 to 17% of revenue in 2015.
result, the Company’s forecasted total operating expenses as a percentage of revenue are expected to decline from 37% in
2010 to 17% of revenue in 2015.
•
Pre-Tax Income
o As a result of the assumptions described above, the management of TransVideo is projecting a loss of approximately $42
thousand in 2010, but is projecting to generate positive income of $759 thousand by 2011. Pre-tax income is projected to
increase at a fairly steady rate to $6.4 million in 2015, before the People’s Republic of China Enterprise Income Tax of 25%
is applied.
thousand in 2010, but is projecting to generate positive income of $759 thousand by 2011. Pre-tax income is projected to
increase at a fairly steady rate to $6.4 million in 2015, before the People’s Republic of China Enterprise Income Tax of 25%
is applied.
Page | 38
G-38

Economic Outlook
Page | 39
G-39

In conjunction with our analysis of the fair market value of the Company, we reviewed the Chinese economic condition at or around the
Valuation Date. The following is a summary of our findings.
Valuation Date. The following is a summary of our findings.
The following article published by the Economist provides an in depth analysis of the outlook for the Chinese Economy. In general, the
Chinese economy is healthy and has done a good job of bouncing back from the difficult economic climate prevalent over the last two years.
Chinese economy is healthy and has done a good job of bouncing back from the difficult economic climate prevalent over the last two years.
CHINA rebounded more swiftly from the global downturn than any other big economy, thanks largely to its enormous
monetary and fiscal stimulus. In the year to the fourth quarter of 2009, its real GDP is estimated to have grown by more
than 10%. But many skeptics claim that its recovery is built on wobbly foundations. Indeed, they say, China now looks
ominously like Japan in the late 1980s before its bubble burst and two lost decades of sluggish growth began. Worse, was
China to falter now, while the recovery in rich countries is still fragile, it would be a severe blow not just at home but to the
whole of the world economy.
On the face of it, the similarities between China today and bubble-era Japan are worrying. Extraordinarily high saving and
an undervalued exchange rate have fuelled rapid export-led growth and the world’s biggest cur rent-account
surplus. Chronic overinvestment has, it is argued, resulted in vast excess capacity and falling returns on capital. A flood of
bank lending threatens a future surge in bad loans, while markets for shares and property look dangerously frothy.
Just as in the late 1980s, when Japan’s economy was tipped to overtake America’s, China’s strong rebound has led many
to proclaim that it will become number one sooner than expected. In contrast, a recent flurry of bearish reports warns that
China’s economy could soon implode. James Chanos, a hedge-fund investor (and one of the first analysts to spot that
Enron’s profits were pure fiction), says that China is “Dubai times 1,000, or worse”. Another hedge fund, Pivot Capital
Management, argues that the chances of a hard landing, with a slump in capital spending and a banking crisis, are
increasing.
However, a close inspection of pessimists’ three main concerns—overvalued asset prices, overinvestment and excessive
bank lending—suggests that China’s economy is more robust than they think. Start with asset markets. Chinese share
prices are nowhere near as giddy as Japan’s were in the late 1980s. In 1989 Tokyo’s stock market had a price-earnings
ratio of almost 70; today’s figure for Shanghai A shares is 28, well below its long-run average of 37. Granted, prices
jumped by 80% last year, but markets in other large emerging economies went up even more: Brazil, India and Russia
rose by an average of 120% in dollar terms. And Chinese profits have rebounded faster than those elsewhere. In the three
months to November, industrial profits were 70% higher than a year before.
China’s property market is certainly hot. Prices of new apartments in Beijing and Shanghai leapt by 50-60% during 2009.
Some lavish projects have much in common with those in Dubai—notably “The World”, a luxury development in Tianjin,
120km (75 miles) from Beijing, in which homes will be arranged as a map of the world, along with the world’s biggest
indoor ski slope and a seven-star hotel.
Some lavish projects have much in common with those in Dubai—notably “The World”, a luxury development in Tianjin,
120km (75 miles) from Beijing, in which homes will be arranged as a map of the world, along with the world’s biggest
indoor ski slope and a seven-star hotel.
Page | 40
G-40

Average home prices nationally, however, cannot yet be called a bubble. On January 14th the National Development and
Reform Commission reported that average prices in 70 cities had climbed by 8% in the year to December, the fastest pace
for 18 months; other measures suggest a bigger rise. But this followed a fall in prices in 2008. By most measures average
prices have fallen relative to incomes in the past decade (see chart 1).
The most cited evidence of a bubble—and hence of impending collapse—is the ratio of average home prices to average
annual household incomes. This is almost ten in China; in most developed economies it is only four or five. However, Tao
Wang, an economist at UBS, argues that this rich-world yardstick is misleading. Chinese homebuyers do not have
average incomes but come largely from the richest 20-30% of the urban population. Using this group’s average income,
the ratio falls to rich-world levels. In Japan the price-income ratio hit 18 in 1990, obliging some buyers to take out 100-year
mortgages.
Furthermore, Chinese homes carry much less debt than Japanese properties did 20 years ago. One-quarter of Chinese
buyers pay cash. The average mortgage covers only about half of a property’s value. Owner-occupiers must make a
minimum deposit of 20%, investors one of 40%. Chinese households’ total debt stands at only 35% of their disposable
income, compared with 130% in Japan in 1990.
buyers pay cash. The average mortgage covers only about half of a property’s value. Owner-occupiers must make a
minimum deposit of 20%, investors one of 40%. Chinese households’ total debt stands at only 35% of their disposable
income, compared with 130% in Japan in 1990.
China’s property boom is being financed mainly by saving, not bank lending. According to Yan Wang, an economist at
BCA Research, a Canadian firm, only about one-fifth of the cost of new construction (commercial and residential) is
financed by bank lending. Loans to homebuyers and property developers account for only 17% of Chinese banks’ total,
against 56% for American banks. A bubble pumped up by saving is much less dangerous than one fuelled by credit. When
the market begins to crack, highly leveraged speculators are forced to sell, pushing prices lower, which causes more
borrowers to default.
Even if China does not (yet) have a credit-fuelled housing bubble, the fact that property prices in Beijing and Shanghai are
beyond the reach of most ordinary people is a serious social problem. The government has not kept its promise to build
more low-cost housing, and it is clearly worried about rising prices. In an attempt to thwart speculators, it has reimposed a
sales tax on homes sold within five years, has tightened the stricter rules on mortgages for investment properties and is
trying to crack down on illegal flows of foreign capital into the property market. The government does not want to come
down too hard, as it did in 2007 by cutting off credit, because it needs a lively property sector to support economic
recovery. But if it does not tighten policy soon, a full-blown bubble is likely to inflate.
Page | 41
G-41

The world’s capital
China’s second apparent point of similarity to Japan is overinvestment. Total fixed investment jumped to an estimated 47%
of GDP last year—ten points more than in Japan at its peak. Chinese investment is certainly high: in most developed
countries it accounts for around 20% of GDP. But you cannot infer waste from a high investment ratio alone. It is hard to
argue that China has added too much to its capital stock when, per person, it has only about 5% of what America or Japan
has. China does have excess capacity in some industries, such as steel and cement. But across the economy as a whole,
concerns about overinvestment tend to be exaggerated.
Pivot Capital Management points to China’s incremental capital-output ratio (ICOR), which is calculated as annual
investment divided by the annual increase in GDP, as evidence of the collapsing efficiency of investment. Pivot argues
that in 2009 China’s ICOR was more than double its average in the 1980s and 1990s, implying that it required much more
investment to generate an additional unit of output. However, it is misleading to look at the ICOR for a single year. With
slower GDP growth, because of a collapse in global demand, the ICOR rose sharply everywhere. The return to investment
in terms of growth over a longer period is more informative. Measuring this way, BCA Research finds no significant
increase in China’s ICOR over the past three decades.
Mr. Chanos has drawn parallels between China and the huge misallocation of resources in the Soviet Union, arguing that
China is heading the same way. The best measure of efficiency is total factor productivity (TFP), the increase in output not
directly accounted for by extra inputs of capital and labor. If China were as wasteful as Mr. Chanos contends, its TFP
growth would be negative, as the Soviet Union’s was. Yet over the past two decades China has enjoyed the fastest growth
in TFP of any country in the world.
Even in industries which clearly do have excess capacity, China’s critics overstate their case. A recent report by the
European Union Chamber of Commerce in China estimates that in early 2009 the steel industry was operating at only 72%
of capacity. That was at the depth of the global downturn. Demand has picked up strongly since then. The report claims
that the industry’s overcapacity is illustrated by “a startling figure”: in 2008, China’s output of steel per person was higher
than America’s. So what? At China’s stage of industrialization it should use a lot of steel. A more relevant yardstick is the
America of the early 20th century. According to Ms Wang of UBS, China’s steel capacity of almost 0.5 tons per person is
slightly lower than America’s output in 1920 (0.6 tons) and far below Japan’s peak of 1.1 tons in 1973.
Many commentators complain that China’s capital-spending spree last year has merely exacerbated its industrial
overcapacity. However, the boom was driven mainly by infrastructure investment, whereas investment in manufacturing
slowed quite sharply (see chart 2). Given the scale of the spending, some money is sure to have been wasted, but by and
large, investment in roads, railways and the electricity grid will help China sustain its growth in the years ahead.
Page | 42
G-42

Some analysts disagree. Pivot, for instance, argues that China’s infrastructure has already reached an advanced level. It
has six of the world’s ten longest bridges and it boasts the world’s fastest train; there is little room for further productive
investment. That is nonsense. A country in which two-fifths of villages lack a paved road to the nearest market town still
has plenty of scope for building roads. The same goes for railways. Again, a comparison of China today with the America
of a century ago is pertinent. China has roughly the same land area as America, but 13 times more people than the United
States did then. Yet on current plans it will have only 110,000km of railway by 2012, compared with more than 400,000km
in America in 1916. Unlike Japan, which built “bridges to nowhere” to prop up its economy, China needs better
infrastructure.
It is true that in the short term, the revenue from some infrastructure projects may not be enough to service debts, so the
government will have to cover losses. But in the long term such projects should lift productivity across the economy.
During Britain’s railway mania in the mid-19th century, few railways made a decent financial return, but they brought huge
long-term economic benefits.
government will have to cover losses. But in the long term such projects should lift productivity across the economy.
During Britain’s railway mania in the mid-19th century, few railways made a decent financial return, but they brought huge
long-term economic benefits.
The biggest cause for worry about China is the third point of similarity to Japan: the recent tidal wave of bank lending.
Total credit jumped by more than 30% last year. Even assuming that this slows to less than 20% this year, as the
government has hinted, total credit outstanding could hit 135% of GDP by December. The authorities are perturbed. This
week they increased banks’ reserve requirement ratio by half a percentage point. They have also raised the yield on
central-bank bills.
However, too many commentators talk as if Chinese banks have been on a lending binge for years. Instead, the spurt in
2009, which was engineered by the government to revive the economy, followed several years in which credit grew more
slowly than GDP (see chart 3). Michael Buchanan, of Goldman Sachs, estimates that since 2004 China’s excess credit
(the gap between the growth rates of credit and nominal GDP) has risen by less than in most developed economies.
Even so, recent lending has been excessive; combined with overcapacity in some industries, it is likely to cause an
increase in banks’ non-performing loans. Ms Wang calculates that if 20% of all new lending last year and another 10% of
this year’s lending turned bad, this would create new bad loans equivalent to 5.5% of GDP by 2012, on top of 2% now.
That is far from trivial, but well below the 40% of GDP that bad loans amounted to in the late 1990s.
Much of the past year’s bank lending should really be viewed as a form of fiscal stimulus. Infrastructure projects that have
little hope of repaying loans will end up back on the government’s books. It would have been much better if such projects
had been financed more transparently through the government’s budget, but the important question is whether the state
can afford to cover the losses.
little hope of repaying loans will end up back on the government’s books. It would have been much better if such projects
had been financed more transparently through the government’s budget, but the important question is whether the state
can afford to cover the losses.
Page | 43
G-43

Official gross government debt is less than 20% of GDP, but China bears argue that this is an understatement, because it
excludes local-government debt and the bonds issued by the asset-management companies that took over banks’
previous non-performing loans. Total government debt could be 50% of GDP. But that is well below the average ratio in
rich countries, of around 90%. Moreover, the Chinese government owns lots of assets, for example shares of listed
companies which are worth 35% of GDP7.
Based on the views of economists at the end of 2009, China’s economy is in good shape and still has excellent growth prospects. The
fact that there are undeveloped villages and areas beyond the reach of traditional sources of television indicate that there is a great deal
of potential in the Company’s domestic market. This is a key factor in our analysis because TransVideo is forecasting a large portion
of their revenue to come from Domestic sources, especially through partnerships with SARFT, which is discussed in the industry
outlook section of this report.
7 Not Just Another Fake, January 14, 2010, www.economist.com
Page | 44
G-44

Industry Outlook
Page | 45
G-45

Internet Protocol Television
Internet Protocol television (IPTV) is a system through which internet television services are delivered using the architecture and
networking methods of the Internet Protocol Suite over a packet-switched network infrastructure, e.g., the Internet and broadband
Internet access networks, instead of being delivered through traditional radio frequency broadcast, satellite signal, and cable television
(CATV) formats.
networking methods of the Internet Protocol Suite over a packet-switched network infrastructure, e.g., the Internet and broadband
Internet access networks, instead of being delivered through traditional radio frequency broadcast, satellite signal, and cable television
(CATV) formats.
IPTV services may be classified into three main groups: live television, time-shifted programming, and video on demand. It is
distinguished from general Internet-based or web-based multimedia services by its on-going standardization process (e.g., European
Telecommunications Standards Institute) and preferential deployment scenarios in subscriber-based telecommunications networks with
high-speed access channels into end-user premises via set-top boxes or other customer-premises equipment. 8
The “IPTV” phrase was coined in 1995 by the founders of Precept, who designed and built the first internet protocol video product.
Although IPTV was a major technological achievement its progress was held back by the lack of widespread consumer access to high
speed broadband. Now that Broadband is more prevalent, IPTV is gaining traction and the future prospects for the technology are
extremely promising.
Although IPTV was a major technological achievement its progress was held back by the lack of widespread consumer access to high
speed broadband. Now that Broadband is more prevalent, IPTV is gaining traction and the future prospects for the technology are
extremely promising.
According to research from Informa Telecoms & Media, the global IPTV market reached 29.7 million subscribers at the end of 2009,
which is up from 19.4 million at the end of 2008. The article also indicates that widespread adoption of the technology is still slow, and
is highly concentrated in France, the United States, China, and South Korea.
which is up from 19.4 million at the end of 2008. The article also indicates that widespread adoption of the technology is still slow, and
is highly concentrated in France, the United States, China, and South Korea.
IPTV has only 5% of the multichannel television market and less than 2% penetration of the world’s households. IPTV has gained
market share in markets where on or more competing forms of multichannel television are absent or weak such as Iceland, Qatar
Cyprus, Slovenia, Croatia, Estonia, Montenegro, and Greece. 9
market share in markets where on or more competing forms of multichannel television are absent or weak such as Iceland, Qatar
Cyprus, Slovenia, Croatia, Estonia, Montenegro, and Greece. 9
An IPTV Global Forecast published by the Multimedia Research Group in May, 2009 indicated that the number of global IPTV
subscribers will grow from 26.7 million in 2009 to 81 million in 2013, which equates to a compound annual growth rate of 32%. The
forecast continues to say that the size of the global IPTV market is $6.7 billion in terms of service revenue, which will grow to $19.9
billion by 2013, equating to a compound annual growth rate of 31%.
8 www.wikipedia.com
9 IPTV Gaining Traction Slowly But Surely, James Middleton, March 23, 2010 www.telecoms.com
Page | 46
G-46

Another forecast of the IPTV market is prepared by Cisco Visual Networking Index Forecast - 2008-2013. This is a broader forecast
that takes into account various types of internet activity, but includes discrete projections for the IPTV market. The following bullet
points indicate some highlights from the Cisco forecast:
that takes into account various types of internet activity, but includes discrete projections for the IPTV market. The following bullet
points indicate some highlights from the Cisco forecast:
• The sum of all forms of video (TV, video on demand, Internet, and P2P) will account for over 91 percent of global consumer
traffic by 2013.
traffic by 2013.
• Internet video alone will account for over 60 percent of all consumer Internet traffic in 2013.
• In 2013, Internet video will be nearly 700 times the U.S. Internet backbone in 2000. It would take well over half a million years
to watch all the online video that will cross the network each month in 2013. Internet video will generate over 18 exabytes per
month in 2013.
to watch all the online video that will cross the network each month in 2013. Internet video will generate over 18 exabytes per
month in 2013.
• Video communications traffic growth is accelerating. Though still a small fraction of overall Internet traffic, video over instant
messaging and video calling are experiencing high growth. Video communications traffic will increase tenfold from 2008 to
2013.
messaging and video calling are experiencing high growth. Video communications traffic will increase tenfold from 2008 to
2013.
• Real-time video is growing in importance. By 2013, Internet TV will be over 4 percent of consumer Internet traffic, and ambient
video will be 8 percent of consumer Internet traffic. Live TV has gained substantial ground in the past few years: globally, P2P
TV is now slightly over 7 percent of overall P2P traffic at over 200 petabytes per month.
video will be 8 percent of consumer Internet traffic. Live TV has gained substantial ground in the past few years: globally, P2P
TV is now slightly over 7 percent of overall P2P traffic at over 200 petabytes per month.
• Video-on-demand (VoD) traffic will double every two years through 2013. Consumer IPTV and CATV traffic will grow at a 53
percent CAGR between 2008 and 2013, compared to a CAGR of 40 percent for consumer Internet traffic.
percent CAGR between 2008 and 2013, compared to a CAGR of 40 percent for consumer Internet traffic.
Although the growth of the IPTV market is considerable, the set top box portion of the IPTV market is the major concern of
TransVideo, due to its core competency of supplying set top boxes to consumers. This portion of the Cisco forecast is analyzed in
detail below.
TransVideo, due to its core competency of supplying set top boxes to consumers. This portion of the Cisco forecast is analyzed in
detail below.
Page | 47
G-47

Internet Video to TV
"Internet Video to TV" includes video delivered via Internet to a TV screen, by way of an Internet-enabled set-top box or equivalent
device. Examples of devices now available include Microsoft's Xbox 360 and the Roku digital video player, through which users can
download film and television content.
device. Examples of devices now available include Microsoft's Xbox 360 and the Roku digital video player, through which users can
download film and television content.
Consumer Internet Video to TV, 2008-2013
2008
2009
2010
2011
2012
2013 CAGR 2008-2013
By Geography (PB per month)
North America
3
56
146
444
789
1,233
234%
Western Europe
10
23
86
217
371
553
124%
Asia Pacific
5
19
40
101
200
327
134%
Japan
9
41
85
183
252
330
106%
Latin America
0
1
2
7
16
28
232%
Central Eastern Europe
2
9
21
49
75
111
120%
Middle East and Africa
0
1
2
5
8
13
180%
Total (PB per month)
Consumer video to TV
29
149
381
1,004
1,711
2,594
146%
Source: Cisco VNI, 2009
Page | 48
G-48

According to the IPTV industry forecasts illustrated on the previous page, the IPTV market is poised for tremendous growth in the
Asian markets, especially in the consumer internet video to television which requires the use of set top boxes manufactured by
TransVideo. As IPTV continues to gain market share, the sale of set top boxes should grow at a similar rate. However, a major concern
is the ability of TransVideo to continue its track record of innovation that has allowed it to stay competitive in the marketplace. As
more set top box manufacturers enter the marketplace, there is a risk that the technology will become commodity like, which could
have a negative impact on revenue growth and profit margins going forward.
Additionally, there are concerns about the regulatory environment imposed on IPTV companies by SARFT, (state administration of
radio, film and television) as well as MIIT (Ministry of Information Industry Technology). According to an article published on
February 24, 2010, SARFT stopped the IPTV service run by Guangxi Telecom in fourteen cities of the Guangxi Province because
these services were illegal.
radio, film and television) as well as MIIT (Ministry of Information Industry Technology). According to an article published on
February 24, 2010, SARFT stopped the IPTV service run by Guangxi Telecom in fourteen cities of the Guangxi Province because
these services were illegal.
However, SARFT has not banned the IPTV services provided to residents of Shanghai, Harebin, and Hangzhou. In fact, SARFT
recently granted approval to China Telecom to expand IPTV services to more than 10 cities10.
recently granted approval to China Telecom to expand IPTV services to more than 10 cities10.
Accordingly, even though the growth prospects in the IPTV industry are strong, the regulatory environment provides an additional
element of risk to the operations of TransVideo.
element of risk to the operations of TransVideo.
6www.c114.net
Page | 49
G-49

Valuation Analysis
Page | 50
G-50

Valuation Methods
The methods used to develop a value for the Company in this engagement were:
w
The Asset Approach
o The asset approach, sometimes referred to as the “cost” approach, is a general way of determining a value indication of a
business, business ownership interest, or security using one or more methods based on the value of the assets net
liabilities. Each asset and liability of the business is valued separately and then summed up to produce the total value
of the business. This method is most commonly used for investment or holding companies that do not have ongoing
operations of their own. It may also be used for operating businesses that are not profitable or only marginally
profitable. Generally, this method is not the most appropriate method for valuing a profitable, operating business.
w
The Market Approach
o The market approach is a general way of determining a value indication of a business, business ownership interest,
security, or intangible asset by using one or more methods that compare the subject to similar businesses, business
ownership interests, securities, or intangible assets that have been sold. This approach, however, can be difficult to
utilize for small, closely held businesses because guideline and other market directed indicators are scarce and reliable
information can be difficult to obtain. Nonetheless, this approach can and should be used to a limited degree for private
businesses, when sufficient relevant market data exists.
w
The Income Approach
o The income approach is a general way of determining a value indication of a business, business ownership interest,
security, or intangible asset by using one or more methods to convert anticipated economic benefits into a present single
amount. This approach assumes that the investor could invest in a property with similar investment
characteristics, although not necessarily the same business. The computations under this approach generally determine
that the value of the business is equal to the expected future income or cash flows divided by a required rate of return
(which is based upon the relative risk of the investment).
Page | 51
G-51

As indicated previously in this report, the three approaches of valuation considered are (1) the asset approach, (2) the income
approach, and (3) the market approach. We also investigated whether there were any other published industry methods for valuing this
type of business. The narrative that follows discusses our consideration of each approach and the method ultimately used to value the
Company.
approach, and (3) the market approach. We also investigated whether there were any other published industry methods for valuing this
type of business. The narrative that follows discusses our consideration of each approach and the method ultimately used to value the
Company.
As described above, the asset approach arrives at value by determining the fair market value of each individual asset and liability of
the Company and then accumulating the total value of the net assets.
the Company and then accumulating the total value of the net assets.
An asset-based approach is most appropriate when valuing an investment or real estate holding company, or a business appraised on a
basis other than as a going concern. It is not normally used to value a profitable operating company because it does not consider the
ongoing earnings capacity of the Company. Accordingly, we did not use the asset approach to value TransVideo.
basis other than as a going concern. It is not normally used to value a profitable operating company because it does not consider the
ongoing earnings capacity of the Company. Accordingly, we did not use the asset approach to value TransVideo.
The market approach is an objective way to establish the fair market value of a business, when sufficient comparable market activity
can be identified and relevant financial information about the transactions can be obtained. When using the market approach, the
valuator identifies actual market transactions (referred to as “guidelines” or “comparables”), derives ratios from those transactions, and
then applies the ratios to the subject company to derive its fair market value. One method used under the market approach utilizes
valuation multiples based on information derived from minority shares of publicly traded guideline companies, while a second method
utilizes recent transactions involving the sale of companies similar in nature to the subject company.
Public Guideline Company Method
Under this method, the valuator attempts to locate publicly traded companies that are similar to the subject company in order to make a
comparison of value. To apply this method, we first asked management if they were aware of any public companies that were either
competitors or otherwise similar to TransVideo. However, management indicated that there were no true comparables.
comparison of value. To apply this method, we first asked management if they were aware of any public companies that were either
competitors or otherwise similar to TransVideo. However, management indicated that there were no true comparables.
We also conducted a computerized database search for publicly traded companies that might be considered comparable to the
Company. We conducted our computerized search looking for guideline companies using the Capital IQ database, based on the
following screening criteria:
Company. We conducted our computerized search looking for guideline companies using the Capital IQ database, based on the
following screening criteria:
• Company Type: Public
• Industry Classification/Key Word Search: Telecommunications and/or Internet Protocol Television (IPTV)
Page | 52
G-52

Based on the above search criteria and screening of companies, we were unable to find any guideline public companies that were
similar enough in terms of size and scope of operations. As previously discussed under competition, we did review one transaction in
which a company identified by management as a competitor of TransVideo was involved in a transaction. The common stock of
Tandberg, a leading provider of telepresence, high-definition videoconferencing and mobile video products and services, was acquired
by Cisco BV through a tender offer in December 2009 for a total purchase price of approximately USD$3.3 billion. Based on
Tandberg’s 2009 revenues and operating profit, the transaction occurred at multiples of 3.66x revenues and 17.0x operating profit. This
was most likely a synergistic deal, as Cisco and Tandberg had an ongoing business relationship prior to the tender offer.
Income Approach
Discounted Cash Flow Method
A discussion of the Company’s projected financial performance presented in Schedule 8 was included in a previous section of this
report. Additional adjustments were made to adjust the Company’s projected pre-tax income to net cash flow available to potential
debt and equity holders of the Company, as reflected in Schedule 12.
report. Additional adjustments were made to adjust the Company’s projected pre-tax income to net cash flow available to potential
debt and equity holders of the Company, as reflected in Schedule 12.
The analysis begins with pre-tax income, which was tax effected based on TransVideo’s enterprise income tax rate of 25% in the
People’s Republic of China. However, The Company has a net operating loss carry forward of $390,302, which was applied to the
projected income tax expense in 2011 and 2012, at which point it was exhausted. Next, management’s estimate of depreciation was
added back, and the estimate of future capital expenditures was deducted from cash flow. Finally, additional estimated working capital
necessary to fund TransVideo’s projected growth were subtracted each year based on a rate of 5% of incremental revenue.
The resulting projected cash flow represents the cash flow available to debt and equity holders of the Company for the years 2010
through 2015. These cash flows were discounted back to present value on the valuation date of March 31, 2010, based on the
Company’s weighted average cost of capital (discount rate).
through 2015. These cash flows were discounted back to present value on the valuation date of March 31, 2010, based on the
Company’s weighted average cost of capital (discount rate).
The discount rate was determined using the build-up method. The components of the discount rate include a risk-free rate, an equity
risk premium, a small size premium, an industry risk adjustment, and a company specific risk premium.
risk premium, a small size premium, an industry risk adjustment, and a company specific risk premium.
The risk-free rate is the return that an investor would require, at a bare minimum, to invest in an extremely safe investment. This rate as
of March 31, 2009 was determined to be 4.06%. Added to the risk-free rate is an equity risk premium, which represents the premium
that common stockholders required in the public market place over investors in risk-free investments. For the purposes of our analysis
we have selected an equity risk premium of 5.85%.
Page | 53
G-53
The next portion of the analysis relates to the riskiness of the various business segments of the Company. In addition to analyzing the
competition, financial strength, profitability, and economic factors, we performed a detailed analysis of the Companies different
service lines to determine the level of risk associated with the projections by analyzing benchmark rates of return for venture capital
investments based on stages of the business life cycle. The illustration below shows some general guidelines that venture capital
investors use when analyzing potential deals:
Rates of Return Sought by Venture Capital Investors
Typical Expected
Annual
Holding Period
Stage
ROR%
(Years)
Seed and startup
50-100%
More than 10
First stage
40-60
5-10
Second Stage
30-40
4-7
Expansion
20-30
3-5
Bridge and mezzanine
20-30
1-3
LBOs
30-50
3-5
Turnarounds
50+
3-5
We determined that new, untested, product lines or business segments deserved higher risk premiums, such as those found in the first
and second stage rates of return, while proven business segments would have rates of return seen in the second stage and expansion
stage of the life cycle. After our analysis of the company’s various sources of gross profit, we determined that the Company’s total cost
of equity should be approximately 35%. As a result, we added an additional company specific risk premium of 25%.
The sum of the components discussed above result in an after-tax cost of equity of 34.91%, which was rounded to 35%.
Based on the nature of the Company’s operations, its relatively small amount of hard assets, and its lack of an established financial
track record, we determined that the Company will not have access to debt financing. Accordingly, the Company’s weighted average
cost of capital is 35%, which is equal to the cost of equity.
track record, we determined that the Company will not have access to debt financing. Accordingly, the Company’s weighted average
cost of capital is 35%, which is equal to the cost of equity.
The weighted average cost of capital derived above, is appropriate to use as a discount rate for converting projected cash flows to a
present value. In the case of TransVideo, management provided projected cash flows for the discrete period 2010 through 2015.
Terminal period earnings before interest, taxes, depreciation and amortization (EBITDA) were determined by applying a long-term
growth rate to the EBITDA projected for 2015.
present value. In the case of TransVideo, management provided projected cash flows for the discrete period 2010 through 2015.
Terminal period earnings before interest, taxes, depreciation and amortization (EBITDA) were determined by applying a long-term
growth rate to the EBITDA projected for 2015.
Page | 54
G-54

The present value of the Company’s projected cash flows for 2012 through 2015 was determined to be approximately $1.2 million, as
reflected in Schedule 12. Additionally, we analyzed the exit multiple that TransVideo might expect to apply to EBITDA at the end of
the discrete forecast period. Terminal year EBITDA was determined using a long term growth rate of 15%. The terminal year EBITDA
figures were then multiplied by exit multiples of 6x, 8x, and 10x forward looking EBITDA. The multiples were based on our analysis
of Guideline Company pricing, as well as reports on global middle market M&A activity around the time of the Valuation Date. The
resulting terminal values under each scenario were then discounted to present value. Applying the exit multiples to forward looking
EBITDA resulted in terminal values ranging from $77.6 million to $129 million.
The present value of the discrete cash flows from the projection and terminal values resulted in a total value of invested capital under
the low, middle, and high scenarios of $17.3 million, $22.6 million, and $28.0 million, respectively. Since the Company has no interest
bearing debt on its balance sheet, this is also the value for 100% of TransVideo’s common stock. This information is summarized in
the table below:
the low, middle, and high scenarios of $17.3 million, $22.6 million, and $28.0 million, respectively. Since the Company has no interest
bearing debt on its balance sheet, this is also the value for 100% of TransVideo’s common stock. This information is summarized in
the table below:
Page | 55
G-55

Terminal Value Range - EBITDA Multiples
Derivation of Terminal Value
Low
Mid
High
Terminal Year EBITDA
$
12,927,206
$
12,927,206
$
12,927,206
Terminal Year Exit Multiple
6.0
8.0
10.0
TERMINAL VALUE
$
77,563,236
$
103,417,648
$
129,272,060
Derivation of Value
Sum of Present Values of Cash Flow Measure
$
1,241,132
$
1,241,132
$
1,241,132
Present Value of Terminal Value
16,047,058
21,396,077
26,745,096
Value of Total Invested Capital
17,288,190
22,637,209
27,986,228
- Interest Bearing Debt
-
-
-
VALUE OF EQUITY CAPITAL
$
17,288,190
$
22,637,209
$
27,986,228
VALUATION INDICATION:
DISCOUNTED FUTURE CASH FLOW VALUATION
$
17,290,000
$
22,635,000
$
27,985,000
Finally, we applied an overall discount for lack of marketability of 5% to the operating value of the Company in order to reflect the
discount for a controlling interest. This resulted in a range of operating value from $16.4 million to $26.6 million.
discount for a controlling interest. This resulted in a range of operating value from $16.4 million to $26.6 million.
The values indicated above are based on the operating cash flows and EBITDA projected to be received from sales of TransVideo’s
products and services. However, it does not reflect the benefits to be received from TransVideo’s investments in other companies.
products and services. However, it does not reflect the benefits to be received from TransVideo’s investments in other companies.
TransVideo has ownership interests in three entities: KyLinTV, China Sports Media Co. Ltd. (iSports)11, and Beijing iMedia
Technology Co., Ltd. (iMedia/iBaby). We have determined the value of each of these entities and added it to the operating value of
TransVideo. Our analysis of the Company’s ownership in KyLinTV is detailed in Schedule 19, and the analysis of the Company’s
ownership interests in iSports, and iMedia are detailed in Schedules 15 through 18. A discussion of our valuation analysis is presented
below.
11 This entity is currently operating according to the terms of a memorandum of understanding between the partners. The official entity has not yet been formed
as of the valuation date.
as of the valuation date.
Page | 56
G-56

It should be noted that TransVideo generates revenue from sales to these two related ventures, which is reflected in TransVideo’s
projected income statements, net of related costs. The revenues earned by TransVideo are reflected on the projected income statements
of the entities as cost of revenues. But the returns on investment to TransVideo have not been reflected in the projected income
statements. Accordingly, these entities have been valued separately to arrive at the value of total equity for TransVideo.
We used management’s financial projections from 2010 through 2015 for iSports and iMedia to perform a discounted cash flow
analysis of those investments. Because both of these entities are early stage technology companies, the first several years of each
forecast do not generate positive cash flow. In fact, iSports is not expected to generate positive cash flow until 2012, and iMedia is not
expected to generate positive cash flow until 2012. For the valuation analysis of the investment in KylinTV, we utilized the financial
information from a recent round of capital raised by the company in February 2010.
Due to the high level of risk that the ventures will successfully execute their respective business plans and generate the projected levels
of cash flow, we utilized venture capital rates of return to estimate the cost of equity for each Company. Our analysis utilized a 40%
cost of equity to discount the future cash flows to their present value.
of cash flow, we utilized venture capital rates of return to estimate the cost of equity for each Company. Our analysis utilized a 40%
cost of equity to discount the future cash flows to their present value.
At the end of management’s discrete forecast periods, we utilized EBITDA exit multiples in the range of 6x to 10x terminal period
EBITDA, consistent with the approach used to value TransVideo. These multiples were applied to terminal year EBITDA figures
grown at a long term growth rate of 15%. Accordingly, the present value of discrete period and terminal period cash flows for iMedia
was determined to be in the range of $4.6 million to $7.4 million, as reflected in Schedule 16. Since this entity does not have any
interest bearing debt, the value of total invested capital is equal to the value of equity. Next, TransVideo’s 66.1% ownership
percentage was applied, and a discount for lack of marketability of 10% was taken to reflect a discount for the lack of liquidity
associated with this controlling interest. Although TransVideo has control over the operations of iMedia, it lacks the liquidity offered
by a public stock exchange. The resulting range of value was $2.8 million to $4.5 million for TransVideo’s investment in iMedia.
A similar analysis was performed to value TransVideo’s investment in iSports. The present value of the discrete period and terminal
period cash flows for iSports was determined to be in the range of $6.2 million to $11.0 million. Since this entity also does not have
any interest bearing debt, the value of total invested capital is equal to the value of equity. Next, TransVideo’s current 10% ownership
percentage was applied, and a discount for lack of marketability of 30% was applied to reflect the discount for lack of marketability for
a minority interest. A greater marketability discount is required because TransVideo lacks both liquidity and the right to make
significant unilateral decisions affecting the operations of iSports. The resulting range of value was $430 thousand to $770 thousand.
Our analysis of TransVideo’s equity ownership of the two entities is shown in greater detail in Schedules 15 through 18.
Page | 57
G-57

We determined the value of the Company’s equity ownership in KylinTV based on a February, 2010 transaction involving a 15.1%
equity transaction priced at $10 million. This translates to a post money value for 100% equity interest of $66 million. After applying
TransVideo’s 31.8% ownership interest, we arrived at the value of equity of $21.1 million on a non-controlling, non-marketable basis.
No further discount is necessary because the February 2010 transaction represents a non-marketable, minority value.
After adjusting for TransVideo’s equity ownership interest in the three entities discussed above, we arrived at a range of fair market
value from $40.7 million to $52.9 million.
value from $40.7 million to $52.9 million.
Page | 58
G-58

Conclusion: Range of Value
Page | 59
G-59

Conclusion: Range of Value
As of the Valuation Date of March 31, 2010, the fair market value of the total invested capital of TransVideo International Ltd. (the
“Business Value”) is estimated to be in the range of:
“Business Value”) is estimated to be in the range of:
$40,690,000 to $52,870,000
This value is subject to the terms, conditions, analysis, limitations, and assumptions contained in this report.
If this communication contains statements concerning taxation, those statements are provided for information purposes
only and are not intended to constitute tax advice which may be relied upon to avoid penalties under any federal, state,
local or other tax statutes or regulations, nor do they resolve any tax issue in your favor. Upon request, we can provide you
with express written tax advice after necessary factual development and subject to such conditions and qualifications as
we may deem appropriate in the circumstances.
Page | 60
G-60

SCHEDULES
G-61

VALUATION OF TRANSVIDEO INTERNATIONAL LTD. (C CORPORATION)
AS OF MARCH 31, 2010
AS OF MARCH 31, 2010
SCHEDULE
1
Reported Balance Sheets
As of December 31,
Line
Description
2009
2008
ASSETS
1
Cash & Equivalents
$
1,500,918
$
4,274,837
2
Accounts Receivable
225,557
637,291
3
Prepayment
-
120
4
Imputed Interest
4,119
-
5
Other Receivable, Net
1,129,437
357,483
6
Inventories (1)
1,312,420
1,381,513
7
Prepaid Expenses & Deposits
16,348
7,483
8
Total Current Assets
4,188,799
6,658,727
9
Fixed Assets, Net (2)
353,319
481,627
10
Intangible Assets, Net
12,132
12,374
11
Investment
1,500,000
-
12
Deferred Taxes
61,697
33,093
13
TOTAL ASSETS
$
6,115,947
$
7,185,821
LIABILITIES
14
Accounts Payable
$
90,430
$
215,885
15
Accrued Expenses & Other Current Liabilities
6,249
6,120
16
Other Payables
588,718
660,639
17
Advances from Customers
844,692
775,352
18
Due to Stockholders
598,186
587,054
19
Total Current Liabilities
2,128,275
2,245,050
20
Minority Interests
456,499
520,003
21
Total Liabilities
2,584,774
2,765,053
SHAREHOLDERS' EQUITY
22
Common Stock
32,000
31,632
23
Paid-In Capital
2,994,093
2,994,093
24
Transaction Adjustment
443,623
440,899
25
Retained Earnings
61,457
954,144
26
Total Equity
3,531,173
4,420,768
27
TOTAL LIABILITIES & EQUITY
$
6,115,947
$
7,185,821
(#) - See Schedule 2 for detail of indicated amounts.
Historical financial information derived from compiled financial statements. UHY Advisors FLVS, Inc. has not audited, reviewed, or compiled the financial statement
information presented above and, accordingly, we do not express an opinion or any form of assurance on the information.
information presented above and, accordingly, we do not express an opinion or any form of assurance on the information.
G-62

VALUATION OF TRANSVIDEO INTERNATIONAL LTD. (C CORPORATION)
AS OF MARCH 31, 2010
AS OF MARCH 31, 2010
SCHEDULE
2
Notes to Reported Balance Sheets
As of December 31,
Line
Description
2009
2008
(1) Inventories Include:
1
Raw Materials
$
698,550
$
802,316
2
Low Value Consumables
162
162
3
Work-In-Progress
26,072
33,155
4
Finished Goods
587,636
545,880
5
Total Inventory
$
1,312,420
$
1,381,513
(2) Fixed Assets, Net Include:
6
PC and Electronic Equipment
$
477,102
$
466,918
7
Motor Vehicles
144,132
143,997
8
Software
3,918
3,914
9
Furniture and Office Equipment
105,797
105,495
10
Leasehold Improvement
28,687
47,750
11
Total Gross Fixed Assets
759,636
768,074
12
Accumulated Depreciation
(406,317)
(286,447)
13
Net Fixed Assets
$
353,319
$
481,627
G-63

VALUATION OF TRANSVIDEO INTERNATIONAL LTD. (C CORPORATION)
AS OF MARCH 31, 2010
AS OF MARCH 31, 2010
SCHEDULE
3
Reported Common Size Balance Sheets
As of December 31,
Line
Description
2009
2008
ASSETS
1
Cash & Equivalents
24.54%
59.49%
2
Accounts Receivable
3.69%
8.87%
3
Prepayment
-
-
5
Other Receivable, Net
18.47%
4.97%
6
Inventories
21.46%
19.23%
7
Prepaid Expenses & Deposits
0.27%
0.10%
8
Total Current Assets
68.43%
92.66%
9
Fixed Assets, Net
5.78%
6.70%
10
Intangible Assets, Net
0.20%
0.17%
11
Investment
24.53%
-
12
Deferred Taxes
1.01%
0.46%
13
TOTAL ASSETS
100.00%
100.00%
LIABILITIES
14
Accounts Payable
1.48%
3.00%
15
Accrued Expenses & Other Current Liabilities
0.10%
0.09%
16
Other Payables
9.63%
9.19%
17
Advances from Customers
13.81%
10.79%
18
Due to Stockholders
9.78%
8.17%
19
Total Current Liabilities
34.80%
31.24%
20
Minority Interests
7.46%
7.24%
21
Total Liabilities
42.26%
38.48%
SHAREHOLDERS' EQUITY
22
Common Stock
0.52%
0.44%
23
Paid-In Capital
48.96%
41.67%
24
Transaction Adjustment
7.25%
6.14%
25
Retained Earnings
1.00%
13.28%
26
Total Equity
57.73%
61.53%
27
TOTAL LIABILITIES & EQUITY
100.00%
100.00%
Sub-totals and totals may not foot due to rounding.
G-64

VALUATION OF TRANSVIDEO INTERNATIONAL LTD. (C CORPORATION) AS
OF MARCH 31, 2010
OF MARCH 31, 2010
SCHEDULE
4
Reported Income Statements
Annualized
For the Years Ended December 31,
Growth Rate
Line
Description
2009
2008
2008-2009
1
Total Revenues
$
1,731,055
$
11,522,275
(84.98%)
2
Cost of Revenue
1,220,195
6,227,592
(80.41%)
3
GROSS PROFIT
510,860
5,294,683
(90.35%)
COSTS AND EXPENSES
4
Selling and Distribution
285,408
811,475
(64.83%)
5
General and Administrative
1,236,711
1,703,184
(27.39%)
6
Total Operating Expenses
1,522,119
2,514,659
(39.47%)
7
OPERATING LOSS
(1,011,259)
2,780,024
n/m
Other Income / (Expense)
8
Interest Income
56,031
14,265
292.79%
9
Minority Interest Income
63,504
77,305
(17.85%)
10
Other Income
7,555
1,981
281.37%
11
Other Expenses
(8,519)
(612)
1291.99%
12
Total Other Income / (Expense)
118,571
92,939
27.58%
13
EARNINGS BEFORE TAXES
(892,688)
2,872,963
n/m
14
Income Tax Expense / (Benefit)
-
1,454
(100.00%)
15
NET LOSS
$
(892,688)
$
2,871,509
n/m
Historical financial information provided to us by management and derived from compiled financial statements. UHY Advisors FLVS, Inc. has not
audited, reviewed, or compiled the financial statement information presented above and, accordingly, we do not express an opinion or any form of
assurance on the information.
audited, reviewed, or compiled the financial statement information presented above and, accordingly, we do not express an opinion or any form of
assurance on the information.
G-65

VALUATION OF TRANSVIDEO INTERNATIONAL LTD. (C CORPORATION) AS
OF MARCH 31, 2010
OF MARCH 31, 2010
SCHEDULE
5
Reported Common Size Income Statements
For the Years Ended December 31,
Line
Description
2009
2008
1
Total Revenues
100.00%
100.00%
2
Cost of Revenue
70.49%
54.05%
3
GROSS PROFIT
29.51%
45.95%
COSTS AND EXPENSES
4
Selling and Distribution
16.49%
7.04%
5
General and Administrative
71.44%
14.78%
6
Total Operating Expenses
87.93%
21.82%
7
OPERATING LOSS
(58.42%)
24.13%
Other Income / (Expense)
8
Interest Income
3.24%
0.12%
9
Minority Interest Inc
3.67%
0.67%
10
Other Inc
0.44%
0.02%
11
Other Expen
(0.49%)
(0.01%)
12
Total Other Income / (Expense)
6.85%
0.81%
13
EARNINGS BEFORE TAXES
(5157%)
2493%
14
Income Tax Expense / (Benefit)
-
0.01%
15
NET LOSS
(51.57%)
24.92%
Sub-totals and totals may not foot due to rounding.
Sub-totals and totals may not foot due to rounding.
G-66

VALUATION OF TRANSVIDEO INTERNATIONAL LTD. (C CORPORATION) AS
OF MARCH 31, 2010
OF MARCH 31, 2010
SCHEDULE
6
Reported Cash Flow Statements
For the Years Ended December 31,
Line
Description
2009
2008
OPERATING ACTIVITIES
1
Net Income / (Loss)
$
(892,688)
$
2,871,508
2
Depreciation and Amortization
149,597
134,721
3
Minority Interest
(63,504)
(77,305)
4
Inventories
69,093
339,687
5
Accounts Receivable
411,734
(2,450,424)
6
Other Receivable
(784,818)
136,565
7
Accounts Payable
(125,455)
97,992
10
Customer Advance
69,340
763,489
11
Other Payable
(72,289)
53,378
12
Accrued Liabilities
129
6,120
13
Income Tax and Other Tax Payable
(28,605)
(50,499)
14
Net Cash Flow from Operating Activities
$
(1,267,466)
$
1,825,232
INVESTING ACTIVIES
15
Capital Expenditures
$
(21,045)
$
(148,269)
16
Purchase of Other Enterprise
(1,500,000)
-
17
Net Cash Flow from Investing Activities
$
(1,521,045)
$
(148,269)
FINANCING ACTIVITIES
18
Proceeds from Shareholders
$
368
$
4,212
19
Net Cash Flow from Financing Activities
$
368
$
4,212
20
NET CASH FLOW
$
(2,788,143)
$
1,681,175
21
Effect of Exchange Rate on Cash
14,224
191,188
22
Beginning Cash
4,274,837
2,402,475
23
ENDING CASH
$
1,500,918
$
4,274,838 Historical financial
information provided to us by management and derived from compiled financial statements. UHY Advisors FLVS, Inc. has not audited, reviewed, or compiled the
financial statement information presented above and, accordingly, we do not express an opinion or any form of assurance on the information.
information provided to us by management and derived from compiled financial statements. UHY Advisors FLVS, Inc. has not audited, reviewed, or compiled the
financial statement information presented above and, accordingly, we do not express an opinion or any form of assurance on the information.
G-67

VALUATION OF TRANSVIDEO INTERNATIONAL LTD. (C CORPORATION) AS
OF MARCH 31, 2010
OF MARCH 31, 2010
SCHEDULE
7
Key Reported Balance Sheet Ratios
As of December 31,
Line
Description
2009
2008
Key Balance Sheet Figures
1
Total Assets
$
6,115,947
$
7,185,821
2
Inventory
1,312,420
1,381,513
3
Fixed Assets
353,319
481,627
4
Total Liabilities
2,584,774
2,765,053
5
Total Shareholders' Equity
3,531,173
4,420,768
6
Working Capital
2,060,524
4,413,677
Liquidity Ratios
7
Current Ratio
1.97
2.97
Activity Ratios
8
Average Asset Turnover
0.26
n/m
9
Average Inventory Turnover
0.91
n/m
11
Average A/R Turnover
4.01
n/m
12
Average Working Capital Turnover
0.53
n/m
13
Average Days A/R Outstanding
90.97
n/m
14
Average Days A/P Outstanding
45.81
n/m
Balance Sheet Leverage Ratios
15
Total Liabilities / Total Assets
0.42
0.38
16
Shareholders' Equity / Total Assets
0.58
0.62
17
Fixed Assets / Shareholders' Equity
0.10
0.11
18
Total Liabilities / Shareholders' Equity
0.73
0.63
G-68

VALUATION OF TRANSVIDEO INTERNATIONAL LTD. (C
CORPORATION) AS OF MARCH 31, 2010
CORPORATION) AS OF MARCH 31, 2010
SCHEDULE
8
Projected Income Statements
For the Years Ending December 31
Description
12/31/2010
12/31/2011
12/31/2012
12/31/2013
12/31/2014
12/31/2015
REVENUE
1
International (see schedule 10)
$
3,748,000
$
6,248,000
$
7,565,000
$
8,785,000
$
10,037,000
$
12,768,200
2
Domestic (see schedule 11)
1,898,284
5,487,654
10,805,075
19,135,882
30,435,742
46,295,220
3
Platform
45,882
875,294
2,294,118
4,350,000
7,491,176
13,041,176
4
Total Revenue
$
5,692,166
$
12,610,948
$
20,664,193
$
32,270,882
$
47,963,918
$
72,104,597
COST OF REVENUE
5
International (see schedule 10)
$
2,895,478
$
4,514,574
$
5,460,735
$
6,040,800
$
7,259,853
$
9,277,382
6
Domestic (see schedule 11)
866,453
3,499,915
7,898,376
15,304,846
24,837,564
38,996,880
7
Platform
37,353
344,118
826,471
1,358,824
2,344,118
3,861,765
8
Total Cost of Revenue
$
3,799,284
$
8,358,607
$
14,185,582
$
22,704,470
$
34,441,535
$
52,136,027
TAXES
9
Domestic
$
76,755
$
160,269
$
251,945
$
388,052
$
590,216
$
846,604
10
Platform
2,294
43,764
114,705
217,501
374,559
652,059
11
Total Taxes
$
79,049
$
204,033
$
366,650
$
605,553
$
964,775
$
1,498,663
12
GROSS PROFIT
$
1,813,833
$
4,048,308
$
6,111,961
$
8,960,859
$
12,557,608
$
18,469,907
OPERATING EXPENSES
13
Salaries and Benefits
1,234,429
1,786,245
2,295,711
2,658,567
3,002,953
3,236,757
14
Sales Commission
56,949
164,630
324,152
574,076
913,072
1,388,857
15
Office Rental
93,783
135,985
197,179
285,909
414,568
601,124
16
Office Expense
22,556
32,707
47,425
68,766
99,711
144,581
17
Telecom Hosting and Network
30,223
43,823
63,543
92,138
133,600
193,720
18
Postage
3,574
5,182
7,513
10,894
15,797
22,905
19
Travel
81,072
117,554
170,453
247,157
358,378
519,648
20
Entertainment
15,956
23,136
33,547
48,644
70,533
102,273
21
Repair Cost
16,176
23,456
34,011
49,316
71,508
103,687
22
Research and Development
58,824
85,294
123,676
179,331
260,030
377,043
23
Information Technology
2,441
3,540
5,133
7,442
10,791
15,647
24
Consulting
81,076
117,560
170,462
247,170
358,396
519,675
25
Depreciation and Amortization
155,831
494,417
1,244,043
1,895,287
3,293,537
4,871,278
26
OPERATING INCOME
(39,057)
1,014,779
1,395,113
2,596,162
3,554,734
6,372,712
Other Income / (Expense)
27
Interest Expense (-)
(2,941)
(2,941)
(2,941)
(2,941)
(2,941)
(2,941)
28
Total Other Income / (Expense)
(2,941)
(2,941)
(2,941)
(2,941)
(2,941)
(2,941)
29
PRE-TAX INCOME / (LOSS)
(41,998)
1,011,838
1,392,172
2,593,221
3,551,793
6,369,771
30
Income Tax Expense1
-
(252,960)
(348,043)
(648,305)
(887,948)
(1,592,443)
31
NET INCOME / (LOSS)
$
(41,998)
$
758,878
$
1,044,129
$
1,944,916
$
2,663,845
$
4,777,328
Memo
32
EBIT (earnings before interest and taxes)
$
(39,057)
$
1,014,779
$
1,395,113
$
2,596,162
$
3,554,734
$
6,372,712
33
EBITDA (EBIT + depreciation and amort.)
116,774
1,509,196
2,639,156
4,491,449
6,848,271
11,243,990
Notes:
Notes:
1. The Company is subject to turnover taxes of 17% applied to the sale of set top boxes, and 5% applied to value added
service revenue. 2. TVD, the operating subsidiary of TVI, is incorporated in the People's Republic of China, and is subject to a
25% Enterprise Income Tax .
service revenue. 2. TVD, the operating subsidiary of TVI, is incorporated in the People's Republic of China, and is subject to a
25% Enterprise Income Tax .
G-69

VALUATION OF TRANSVIDEO INTERNATIONAL LTD. (C
CORPORATION) AS OF MARCH 31, 2010
CORPORATION) AS OF MARCH 31, 2010
SCHEDULE
9
Common Size Projected Income Statements
For the Years Ending December 31
Description
12/31/2010
12/31/2011
12/31/2012
12/31/2013
12/31/2014
12/31/2015
REVENUE
1
International (see schedule 10)
65.84%
49.54%
36.61%
27.22%
20.93%
17.71%
2
Domestic (see schedule 11)
33.35%
43.51%
52.29%
59.30%
63.46%
64.21%
3
Platform
0.81%
6.94%
11.10%
13.48%
15.62%
18.09%
4
Total Revenue
100.00%
100.00%
100.00%
100.00%
100.00%
100.00%
COST OF REVENUE
5
International (see schedule 10)
50.87%
35.80%
26.43%
18.72%
15.14%
12.87%
6
Domestic (see schedule 11)
15.22%
27.75%
38.22%
47.43%
51.78%
54.08%
7
Platform
0.66%
2.73%
4.00%
4.21%
4.89%
5.36%
8
Total Cost of Revenue
66.75%
66.28%
68.65%
70.36%
71.81%
72.31%
TAXES
9
Domestic
1.35%
1.27%
1.22%
1.20%
1.23%
1.17%
10
Platform
0.04%
0.35%
0.56%
0.67%
0.78%
0.90%
11
Total Taxes
1.39%
1.62%
1.77%
1.88%
2.01%
2.08%
12
GROSS PROFIT1
31.87%
32.10%
29.58%
27.77%
26.18%
25.62%
OPERATING EXPENSES
13
Salaries and Benefits
21.69%
14.16%
11.11%
8.24%
6.26%
4.49%
14
Sales Commission
1.00%
1.31%
1.57%
1.78%
1.90%
1.93%
15
Office Rental
1.65%
1.08%
0.95%
0.89%
0.86%
0.83%
16
Office Expense
0.40%
0.26%
0.23%
0.21%
0.21%
0.20%
17
Telecom Hosting and Network
0.53%
0.35%
0.31%
0.29%
0.28%
0.27%
18
Postage
0.06%
0.04%
0.04%
0.03%
0.03%
0.03%
19
Travel
1.42%
0.93%
0.82%
0.77%
0.75%
0.72%
20
Entertainment
0.28%
0.18%
0.16%
0.15%
0.15%
0.14%
21
Repair Cost
0.28%
0.19%
0.16%
0.15%
0.15%
0.14%
22
Research and Development
1.03%
0.68%
0.60%
0.56%
0.54%
0.52%
23
Information Technology
0.04%
0.03%
0.02%
0.02%
0.02%
0.02%
24
Consulting
1.42%
0.93%
0.82%
0.77%
0.75%
0.72%
25
Depreciation and Amortization
2.74%
3.92%
6.02%
5.87%
6.87%
6.76%
26
OPERATING INCOME
(0.69%)
8.05%
6.75%
8.04%
7.41%
8.84%
Other Income / (Expense)
27
Interest Expense (-)
(0.05%)
(0.02%)
(0.01%)
(0.01%)
(0.01%)
-
28
Total Other Income / (Expense)
(0.05%)
(0.02%)
(0.01%)
(0.01%)
(0.01%)
-
29
PRE-TAX INCOME / (LOSS)
(0.74%)
8.02%
6.74%
8.04%
7.41%
8.83%
30
Income Tax Expense1
-
(2.01%)
(1.68%)
(2.01%)
(1.85%)
(2.21%)
31
NET INCOME / (LOSS)
(0.74%)
6.02%
5.05%
6.03%
5.55%
6.63%
Memo
32
EBIT (earnings before interest and taxes)
(0.69%)
8.05%
6.75%
8.04%
7.41%
8.84%
33
EBITDA (EBIT + depreciation and amort.)
2.05%
11.97%
12.77%
13.92%
14.28%
15.59%
G-70

VALUATION OF TRANSVIDEO INTERNATIONAL LTD. (C
CORPORATION) AS OF MARCH 31, 2010
CORPORATION) AS OF MARCH 31, 2010
10Projected Income Statements - International Business
For the Years Ending December 31
12/31/2010
12/31/2011
12/31/2012
12/31/2013
12/31/2014
12/31/2015
SOURCES OF INTERNATIONAL REVENUE
1
KyLin TV
$
1,298,000
$
2,723,000
$
3,440,000
$
3,660,000
$
3,872,000
$
4,144,000
2
NeuLion
2,450,000
3,525,000
4,125,000
5,125,000
6,165,000
8,624,200
3
Total International Revenue
$
3,748,000
$
6,248,000
$
7,565,000
$
8,785,000
$
10,037,000
$
12,768,200
COST OF INTERNATIONAL REVENUE
4
KyLin TV
$
1,059,640
$
2,185,750
$
2,699,706
$
2,860,800
$
3,283,971
$
3,512,353
5
NeuLion
1,835,838
2,328,824
2,761,029
3,180,000
3,975,882
5,765,029
6
Total Cost of International Revenue
$
2,895,478
$
4,514,574
$
5,460,735
$
6,040,800
$
7,259,853
$
9,277,382
INTERNATIONAL GROSS MARGIN
7
KyLin TV
$
238,360
$
537,250
$
740,294
$
799,200
$
588,029
$
631,647
8
NeuLion
614,162
1,196,176
1,363,971
1,945,000
2,189,118
2,859,171
9
Total International Gross Margin
$
852,522
$
1,733,426
$
2,104,265
$
2,744,200
$
2,777,147
$
3,490,818
G-71

VALUATION OF TRANSVIDEO INTERNATIONAL LTD. (C
CORPORATION) AS OF MARCH 31, 2010
CORPORATION) AS OF MARCH 31, 2010
11Projected Income Statements - Domestic Business
For the Years Ending December 31
12/31/2010
12/31/2011
12/31/2012
12/31/2013
12/31/2014
12/31/2015
SOURCES OF DOMESTIC REVENUE
1
iBaby (STB and User License)
$
454,268
$
848,113
$
1,437,418
$
2,379,784
$
3,451,940
$
5,151,339
2
iSports
140,477
500,985
1,019,836
1,450,498
1,893,161
2,548,154
3
Product Revenue (iBox STB)
402,000
2,343,000
5,915,000
12,640,000
21,385,000
34,340,000
4
Product Revenue (Transcoder)
490,000
640,000
720,000
600,000
1,080,000
960,000
5
Product Revenue (Big Box)
86,538
355,556
512,821
665,600
1,025,641
1,495,726
6
Product Revenue (Site License)
325,000
800,000
1,200,000
1,400,000
1,600,000
1,800,000
7
Total Domestic Revenue
$
1,898,283
$
5,487,654
$
10,805,075
$
19,135,882
$
30,435,742
$
46,295,219
COST OF DOMESTIC REVENUE
8
iBaby (STB and User License)
$
341,026
$
760,000
$
1,330,000
$
2,001,000
$
3,135,000
$
4,655,000
9
iSports
105,556
386,496
811,966
1,136,752
1,461,538
1,948,718
10
Product ( iBox STB)
358,974
2,093,590
5,366,667
11,647,436
19,461,538
31,256,410
11
Product (Transcoder)
-
-
-
-
-
-
12
Product (Big Box)
60,897
259,829
389,744
519,658
779,487
1,136,752
13
Product (Site License)
-
-
-
-
-
-
14
Total Cost of Domestic Revenue
$
866,453
$
3,499,915
$
7,898,377
$
15,304,846
$
24,837,563
$
38,996,880
DOMESTIC VALUE ADDED TAXES
15
iBaby (STB and User License)
$
18,586
$
11,667
$
10,900
$
50,101
$
28,878
$
44,166
16
iSports
5,746
17,291
30,907
44,406
58,505
79,203
17
Product ( iBox STB)
7,314
42,400
93,217
168,736
326,988
524,210
18
Product (Transcoder)
24,500
32,000
36,000
30,000
54,000
48,000
19
Product (Big Box)
4,359
16,274
20,923
24,810
41,846
61,026
20
Product (Site License)
16,250
40,000
60,000
70,000
80,000
90,000
21
Total Value Added Taxes
$
76,755
$
159,632
$
251,947
$
388,053
$
590,217
$
846,605
DOMESTIC GROSS MARGIN
22
iBaby (STB and User License)
$
94,656
$
76,446
$
96,518
$
328,683
$
288,062
$
452,173
23
iSports
29,175
97,198
176,963
269,340
373,118
520,233
24
Product ( iBox STB)
35,712
207,010
455,116
823,828
1,596,474
2,559,380
25
Product (Transcoder)
465,500
608,000
684,000
570,000
1,026,000
912,000
26
Product (Big Box)
21,282
79,453
102,154
121,132
204,308
297,948
27
Product (Site License)
308,750
760,000
1,140,000
1,330,000
1,520,000
1,710,000
28
Total Domestic Gross Margin
$
955,075
$
1,828,107
$
2,654,751
$
3,442,983
$
5,007,962
$
6,451,734
G-72

VALUATION OF TRANSVIDEO INTERNATIONAL LTD. (C CORPORATION)
AS OF MARCH 31, 2010
AS OF MARCH 31, 2010
SCHEDULE
12
Discounted Cash Flow Valuation Method
Projected Cash Flow to Total Invested Capital for the Years Ending December 31,
Line
Description
12/31/2010
12/31/2011
12/31/2012
12/31/2013
12/31/2014
12/31/2015
1
Pre-Tax Net Income (per schedule 8)
$
(41,998)
$
1,011,838
$
1,392,172
$
2,593,221
$
3,551,793
$
6,369,771
2
Income Taxes1
-
(252,960)
(348,043)
(648,305)
(887,948)
(1,592,443)
3
Enterprise Income Tax NOL Carryforward2
-
232,508
-
-
-
-
4
Depreciation and Amortization
155,831
494,417
1,244,043
1,895,287
3,293,537
4,871,278
5
Capital Expenditures3
(299,412)
(897,059)
(1,776,470)
(2,656,471)
(4,121,765)
(6,771,764)
6
Net Change in Working Capital4
-
(345,939)
(402,663)
(580,334)
(784,652)
(1,207,034)
7
PROJECTED CASH FLOW
$
(185,579)
$
242,805
$
109,039
$
603,398
$
1,050,965
$
1,669,808
Add Back 1st Qtr 2010 Cash Flow Shortfall
351,879
4/1 - 12/31/10 Cash Flow
$
166,300
8
Present Value Factor5
35.00%
0.89356
0.68720
0.50904
0.37706
0.27931
0.20689
9
PRESENT VALUE OF PROJECTED CASH FLOW
$
148,599
$
166,856
$
55,505
$
227,517
$
293,545
$
345,467
Terminal Value Range - EBITDA Multiples
Source / Comments
Derivation of Terminal Value
Low
Mid
High
10
Terminal Year EBITDA
$
12,927,206
$
12,927,206
$
12,927,206
2015 EBITDA plus terminal growth at 15%
11
Terminal Year Exit Multiple
6.0
8.0
10.0
12
TERMINAL VALUE
$
77,563,236
$
103,417,648
$
129,272,060
Derivation of Value
13
Sum of Present Values of Cash Flow Measure
$
1,237,489
$
1,237,489
$
1,237,489
14
Present Value of Terminal Value
16,047,058
21,396,077
26,745,096
15
Value of Total Invested Capital
17,284,547
22,633,566
27,982,585
16
- Interest Bearing Debt
-
-
-
17
VALUE OF EQUITY CAPITAL
$
17,284,547
$
22,633,566
$
27,982,585
VALUATION INDICATION:
Rounded to Nearest:
18
DISCOUNTED FUTURE CASH FLOW VALUATION
$
17,285,000
$
22,635,000
$
27,985,000
$5,000
Notes:
1. TVD, the operating subsidiary of TVI, is incorporated in the People's Republic of China, and is subject to a 25% income tax rate which was applied to future income.
2. According to Note #10 of the financial statements, the Company has a NOL of $190,510 as of December 31, 2009. An additional $199,792 was added to this total, as a result of forecasted losses in 2010. Accordingly, an aggregate NOL of $390,302 has been applied to future years' net
income to reduce future income taxes.
income to reduce future income taxes.
3. Capital Expenditures were estimated by management, and include capital expenditures for the Domestic, International, and Platform Businesses. 4. Change
in Net Working Capital is based on normal working capital to revenue ratio of 5%.
in Net Working Capital is based on normal working capital to revenue ratio of 5%.
5. A mid-year discounted convention was used.
G-73

VALUATION OF TRANSVIDEO INTERNATIONAL LTD. (C CORPORATION) AS
OF MARCH 31, 2010
OF MARCH 31, 2010
SCHEDULE
13
Derivation of Discount Rate
Line
Derivation of Capitalization Rate and Factor
Source/Comments
1
Risk Free Rate
4.06%
2
Equity Risk Premium
5.85%
Expected market return less the risk free rate.
3
Company Specific Risk Premium
25.00%
Based on the weighted average risk assessment of the Companies existing and future
operations, as well as the size of the Company.
4
COST OF EQUITY
34.91%
% of Total
Type of Capital
Capital
Cost
Product
5
Equity
100%
34.91%
34.91%
The Company will be 100% equity financed.
8
Debt
-
-
-
9
Weighted Average Cost of Capital (rounded)
35.00%
G-74

VALUATION OF TRANSVIDEO INTERNATIONAL LTD. (C CORPORATION) AS
OF MARCH 31, 2010
OF MARCH 31, 2010
SCHEDULE
14
Weighted Indication of Value and Conclusion of Value
Low
Midpoint
High
Line
Indicated Values by Method
Range
Value
Range
1
INDICATED RANGE OF VALUE
$
17,285,000
$
22,635,000
$
27,985,000
See Schedule 12.
Conclusion of Value
2
Value of Operating Equity on a Marketable Basis
$
17,285,000
$
22,635,000
$
27,985,000
See above.
3
- Discount for Lack of Marketability
5.00%
(864,250)
(1,131,750)
(1,399,250)
4
Value of Operating Equity on a Non-Marketable Basis
$
16,420,750
$
21,503,250
$
26,585,750
Investments and Joint Ventures (see schedules 15-19):
5
Value of 66% Ownership Interest in Beijing iMedia Technology Co. Limited Joint Venture
2,775,000
3,615,000
4,455,000
6
Value of 10% Ownership Interest in China Sports Media Company Joint Venture
430,000
600,000
770,000
7
Value of 31.8% Ownership Interest in KyLin Tv
21,060,000
21,060,000
21,060,000
8
Total Value of Equity on a Non-Marketable Basis
$
40,685,750
$
46,778,250
$
52,870,750
9
Conclusion of Value (rounded)
$
40,690,000
$
46,780,000
$
52,870,000
G-75

VALUATION OF TRANSVIDEO'S OWNERSHIP INTEREST IN
iMEDIA/iBABY AS OF MARCH 31, 2010
iMEDIA/iBABY AS OF MARCH 31, 2010
SCHEDULE
15
Projected Income Statements1
For the Years Ending December 31
Description
12/31/2010
12/31/2011
12/31/2012
12/31/2013
12/31/2014
12/31/2015
REVENUE
1
B2B Revenue
$
140,108
$
424,277
$
1,409,087
$
2,987,223
$
5,757,981
$
8,881,806
2
B2C Revenue
716,265
1,315,588
1,496,847
2,017,235
2,221,882
2,517,159
3
Telesales Revenue
102,324
219,265
187,106
268,965
333,282
839,053
4
Total Revenue
958,697
1,959,130
3,093,040
5,273,423
8,313,145
12,238,018
COST OF REVENUE
5
Hardware Cost
437,500
811,765
1,291,294
2,151,176
3,274,706
4,524,471
6
Content Cost
7,206
15,441
26,353
47,353
78,235
118,176
7
Total Cost of Revenue
444,706
827,206
1,317,647
2,198,529
3,352,941
4,642,647
TAXES
8
Value Added Tax
38,348
78,365
123,722
210,937
332,526
489,521
9
Total Taxes
38,348
78,365
123,722
210,937
332,526
489,521
10
GROSS PROFIT
475,643
1,053,559
1,651,671
2,863,957
4,627,678
7,105,850
OPERATING EXPENSES
11
Salaries & Benefits
407,803
473,069
668,630
794,195
984,552
1,183,901
12
Office Expense
58,676
60,294
60,294
60,294
60,294
60,294
13
Marketing
274,209
346,596
452,172
614,175
729,309
995,335
14
Commissions
70,271
133,087
213,853
354,130
546,631
786,346
15
Travel
4,853
7,353
9,853
9,853
9,853
9,853
16
Entertainment
4,793
9,796
15,465
26,367
41,566
61,190
17
Shipping
2,882
5,404
5,929
8,050
8,997
11,818
18
Hosting & Network
5,147
-
-
-
-
-
19
Platform Service Fee
3,797
26,426
59,735
124,529
231,618
402,618
20
Consulting
294
294
294
294
294
204
21
Depreciation and Amortization
34,542
41,507
44,949
50,067
54,292
58,689
22
Total Operating Expenses
867,267
1,103,826
1,531,174
2,041,954
2,667,406
3,570,248
23
OPERATING INCOME
$
(391,624)
$
(50,267)
$
120,497
$
822,003
$
1,960,272
$
3,535,602
Memo
24
EBIT (earnings before interest and taxes)
$
(391,624)
$
(50,267)
$
120,497
$
822,003
$
1,960,272
$
3,535,602
25
EBITDA (EBIT + depreciation and amort.)
(357,082)
(8,760)
165,446
872,070
2,014,564
3,594,291
Notes:
1. This forecast was prepared by Management of TransVideo.
G-76

VALUATION OF TRANSVIDEO'S OWNERSHIP INTEREST IN iMEDIA/iBABY AS OF
MARCH 31, 2010
MARCH 31, 2010
SCHEDULE
16
Discounted Cash Flow Valuation Method
Projected Cash Flow to Total Invested Capital for the Years Ending December 31,
Line
Description
12/31/2010
12/31/2011
12/31/2012
12/31/2013
12/31/2014
12/31/2015
1
Operating Income (see schedule 15)
$
(391,624)
$
(50,267)
$
120,497
$
822,003
$
1,960,272
$
3,535,602
2
Income Taxes1
-
-
(30,124)
(205,501)
(490,068)
(883,901)
3
Benefit of Income Tax NOL Carryforward2
-
-
30,124
80,349
4
Depreciation and Amortization
34,542
41,507
44,949
50,067
54,292
58,689
5
Capital Expenditures3
(51,765)
(15,196)
(27,157)
(17,941)
(22,647)
(19,412)
6
Net Change in Working Capital4
(95,870)
(100,043)
(113,391)
(218,038)
(303,972)
(392,487)
7
PROJECTED CASH FLOW
$
(504,717)
$
(123,999)
$
24,898
$
510,939
$
1,197,877
$
2,298,491
8
Add Back 1st Qtr 2010 Loss
97,355
9
4/1 - 12/31/10
$
(407,362)
10
Present Value Factor
40.00%
0.88146
0.65666
0.46904
0.33503
0.23931
0.17093
11
PRESENT VALUE OF PROJECTED CASH FLOW
$
(359,073)
$
(81,425)
$
11,678
$
171,180
$
286,661
$
392,890
Terminal Value Range - EBITDA Multiples
Source / Comments
Derivation of Terminal Value
Low
Mid
High
12
Terminal Year EBITDA
$
4,133,435
$
4,133,435
$
4,133,435
2015 EBITDA plus terminal growth.
13
Terminal Year Exit Multiple
6.0
8.0
10.0
14
TERMINAL VALUE
$
24,800,608
$
33,067,477
$
41,334,347
Derivation of Value
15
Sum of Present Values of Cash Flow Measure
$
421,911
$
421,911
$
421,911
16
Present Value of Terminal Value
4,239,261
5,652,348
7,065,435
17
Value of Total Invested Capital
4,661,172
6,074,258
7,487,345
18
- Interest Bearing Debt
-
-
-
19
VALUE OF 100% of EQUITY CAPITAL
$
4,661,172
$
6,074,258
$
7,487,345
20
OWNERSHIP PERCENTAGE
66.1%
66.1%
66.1%
21
VALUE OF TRANSVIDEO'S 66.1% OWNERSHIP INTEREST
$
3,081,034
$
4,015,085
$
4,949,135
22
DISCOUNT FOR LACK OF MARKETABILITY
10.00%
(308,103)
(401,509)
(494,914)
Non-MARKETABLE VALUE OF TRANSVIDEO'S
23
66.1% OWNERSHIP INTEREST
$
2,772,931
$
3,613,576
$
4,454,221
VALUATION INDICATION:
Rounded to Nearest:
24
DISCOUNTED FUTURE CASH FLOW VALUATION (Rounded)
$
2,775,000
$
3,615,000
$
4,455,000
$5,000
Notes:
Notes:
1. Assumes a 25% income tax rate which was applied to future income. 2.Applies
net losses from 2010 and 2011 to offset future years' income tax expense 3.
Capital Expenditures were estimated by management,.
net losses from 2010 and 2011 to offset future years' income tax expense 3.
Capital Expenditures were estimated by management,.
4. Change in Net Working Capital is based on normal working capital to revenue ratio of 10%.
G-77

VALUATION OF TRANSVIDEO'S OWNERSHIP INTEREST IN iSPORTS AS OF
MARCH 31, 2010
MARCH 31, 2010
SCHEDULE
17
Projected Income Statements1
For the Years Ending December 31
Description
12/31/2010
12/31/2011
12/31/2012
12/31/2013
12/31/2014
12/31/2015
REVENUE
1
Game Copyright Transaction
$
42,892
$
361,520
$
747,549
$
1,004,902
$
1,348,039
$
1,629,902
2
Digital Media Library & Services
29,412
230,392
401,961
534,314
642,157
752,451
3
NextGen Live Games Broadcasting Platform
375,607
3,669,257
8,902,155
16,830,647
27,049,872
38,869,399
4
Educational & Media Collection Box
131,029
1,339,235
2,716,426
4,322,471
6,221,000
8,220,059
5
Overseas Broadcasting Platform
3,081
69,726
201,788
413,224
751,740
1,293,715
6
Total Revenue
582,021
5,670,129
12,969,880
23,105,557
36,012,808
50,765,526
COST OF REVENUE
7
Game Copyright Transaction
21,446
180,760
373,775
502,451
674,020
814,951
8
NextGen Live Games Broadcasting Platform
95,868
824,290
1,830,547
2,904,246
4,227,179
5,734,025
9
Educational & Media Collection Box
165,221
730,026
1,510,368
2,378,665
3,365,297
4,387,274
10
Total Cost of Revenue
282,534
1,735,076
3,714,690
5,785,362
8,266,496
10,936,250
TAXES
11
Game Copyright Transaction (2.75%)
1,180
9,942
20,558
27,635
37,071
44,822
12
Digital Media Library & Services (5.5%)
1,618
12,672
22,108
29,387
35,319
41,385
13
NextGen Live Games Broadcasting Platform (5.5%)
20,658
201,809
489,619
925,686
1,487,743
2,137,817
14
Educational & Media Collection Box (5.5%)
7,207
73,658
149,403
237,736
342,155
452,103
15
Overseas Broadcasting Platform (5.5%)
169
3,835
11,098
22,727
41,346
71,154
16
Total Taxes
30,832
301,915
692,786
1,243,171
1,943,633
2,747,282
17
GROSS PROFIT
268,655
3,633,138
8,562,404
16,077,025
25,802,679
37,081,994
OPERATING EXPENSES
18
Salaries
194,069
412,108
591,422
948,529
1,156,863
1,336,765
19
Staff Benefits
119,245
265,893
395,975
612,294
752,797
870,706
20
Marketing
477,997
457,628
1,084,447
2,956,535
5,368,656
8,138,749
21
Sponsorship and Public Relations
70,413
231,922
568,637
1,000,356
1,546,611
2,172,882
22
Travel
64,372
132,801
293,877
593,155
952,673
1,324,905
23
Platform Service Fee
223,765
1,892,791
3,785,506
5,501,182
7,282,894
9,217,294
24
Commission
75,426
704,335
1,654,878
3,183,166
5,176,725
7,509,045
25
Other Operating Expenses
616
13,945
40,358
82,645
150,348
258,743
26
Office Rent & Expenses
17,647
17,647
52,941
88,235
141,176
141,176
27
Depreciation and Amortization
15,767
21,218
17,804
19,015
17,623
18,240
28
Total Operating Expenses
1,259,317
4,150,288
8,485,844
14,985,112
22,546,365
30,988,506
29
OPERATING INCOME
$
(990,662)
$
(517,150)
$
76,560
$
1,091,912
$
3,256,314
$
6,093,488
Memo
30
EBIT (earnings before interest and taxes)
$
(990,662)
$
(517,150)
$
76,560
$
1,091,912
$
3,256,314
$
6,093,488
31
EBITDA (EBIT + depreciation and amort.)
(974,895)
(495,932)
94,364
1,110,927
3,273,936
6,111,729
Notes:
Notes:
1. This forecast was prepared by Management of TransVideo.
G-78

VALUATION OF TRANSVIDEO'S OWNERSHIP INTEREST IN iSPORTS AS
OF MARCH 31, 2010
OF MARCH 31, 2010
SCHEDULE
18
Discounted Cash Flow Valuation Method
Projected Cash Flow to Total Invested Capital for the Years Ending December 31,
Line
Description
12/31/2010
12/31/2011
12/31/2012
12/31/2013
12/31/2014
12/31/2015
1
Operating Income (see schedule 17)
$
(990,662)
$
(517,150)
$
76,560
$
1,091,912
$
3,256,314
$
6,093,488
2
Income Taxes1
-
-
(19,140)
(272,978)
(814,078)
(1,523,372)
2
Benefit of Income Tax NOL Carryforward2
-
-
19,140
272,978
84,835
3
Depreciation and Amortization
15,767
21,218
17,804
19,015
17,623
18,240
4
Capital Expenditures3
(17,344)
(23,340)
(19,584)
(20,916)
(19,385)
(20,064)
5
Net Change in Working Capital4
(58,202)
(508,811)
(729,975)
(1,013,568)
(1,290,725)
(1,475,272)
6
PROJECTED CASH FLOW
$
(1,050,441)
$
(1,028,083)
$
(655,195)
$
76,443
$
1,234,583
$
3,093,020
Add Back 1st Qtr 2010 Loss
26,003
7
4/1 - 12/31/10
$
(1,024,438)
8
Present Value Factor
40.00%
0.88146
0.65666
0.46904
0.33503
0.23931
0.17093
9
PRESENT VALUE OF PROJECTED CASH FLOW
$
(903,000)
$
(675,100)
$
(307,314)
$
25,611
$
295,445
$
528,702
Terminal Value Range - EBITDA Multiples
Source / Comments
Derivation of Terminal Value
Low
Mid
High
10
Terminal Year EBITDA
$
7,028,488
$
7,028,488
$
7,028,488
2015 EBITDA plus terminal growth.
11
Terminal Year Exit Multiple
6.0
8.0
10.0
12
TERMINAL VALUE
$
42,170,927
$
56,227,902
$
70,284,878
Derivation of Value
13
Sum of Present Values of Cash Flow Measure
$
(1,035,657)
$
(1,035,657)
$
(1,035,657)
14
Present Value of Terminal Value
7,208,435
9,611,246
12,014,058
15
Value of Total Invested Capital
6,172,778
8,575,589
10,978,401
16
- Interest Bearing Debt
-
-
-
17
VALUE OF 100% of EQUITY CAPITAL
$
6,172,778
$
8,575,589
$
10,978,401
18
OWNERSHIP PERCENTAGE
10.0%
10.0%
10.0%
19
VALUE OF TRANSVIDEO'S 10% OWNERSHIP INTEREST
$
617,278
$
857,559
$
1,097,840
20
DISCOUNT FOR LACK OF MARKETABILITY
30.0%
(185,183)
(257,268)
(329,352)
Non-MARKETABLE VALUE OF TRANSVIDEO'S
21
10% OWNERSHIP INTEREST
$
432,095
$
600,291
$
768,488
VALUATION INDICATION:
Rounded to Nearest:
22
DISCOUNTED FUTURE CASH FLOW VALUATION (Rounded)
$
430,000
$
600,000
$
770,000
$5,000
Notes:
1. Assumes a 25% iEnterprise ncome tax rate which was applied to future income.
2.Applies net losses from 2010 and 2011 to offset future years' income tax expense
2.Applies net losses from 2010 and 2011 to offset future years' income tax expense
3. Capital Expenditures were not provided by management. For purposes of this projectiont they are assumed to equal 110% of deprecaition
expense. 4. Change in Net Working Capital is based on normal working capital to revenue ratio of 10%.
expense. 4. Change in Net Working Capital is based on normal working capital to revenue ratio of 10%.
G-79

VALUATION OF TRANSVIDEO INTERNATIONAL LTD. (C CORPORATION)
AS OF MARCH 31, 2010
AS OF MARCH 31, 2010
SCHEDULE
19
Calculation of Ownership Interest in KyLin TV
Line
Description
Calculations
Calculation of TransVideo's Ownership in KyLin TV1
1
Value of 15.1% Interest in KyLin TV, Inc. (non-marketable, non-controlling basis)
$
10,000,000
2
÷ 15.1% Owership Interest
15.10%
3
Implied 100% Equity Value (non-marketable, non-controlling basis)
$
66,225,166
4
x Ownership Percentage
31.80%
5
Value of TransVideo's Ownership (non-marketable, non-controlling basis)
$
21,059,603
Rounded to Nearest:
6
Value of NeuLion's Ownership (non-marketable, non-controlling basis)
$
21,060,000
$5,000
Notes:
1. On February 26, 2010, a group of investors invested $10.0 million in KyLinTV for 15.1% of its equity, which reduced NeuLion's equity interest in KyLinTV from 17.1% to 12.2%. Of the total $10.0 million investment, $1.0 million was invested by
AvantaLion LLC, a company controlled by the Chairman of the Board of Directors of the Company.
AvantaLion LLC, a company controlled by the Chairman of the Board of Directors of the Company.
G-80

APPENDIX A
SOURCES OF INFORMATION
G-81

Appendix A
Sources of Information
In conducting our valuation analysis, we relied upon information including, but not limited to, the following items:
1. Internal consolidated financial statements of TransVideo International Ltd. and Subsidiaries as of and for the
years ended December 31, 2009 and 2008
years ended December 31, 2009 and 2008
2. Internal management projections of TransVideo for the years ending December 31, 2010 through 2015
3. Internal management projections of iBaby; and iMedia for the years ending December 31, 2010 through 2015
4. Trans Video International business plan overview, as of December 2009
5. iMedia/ iBaby Business Outlook 2010-2014 presentation prepared by the management of Beijing iMedia Technology Co., Ltd.
6. China Sports Media Co. Business & Operation Plan presentation, as of November 2009
6. China Sports Media Co. Business & Operation Plan presentation, as of November 2009
7. Memorandum of Understanding (MOA) between the business partners involved in the China Sports Media Co. joint venture
8. Various contracts provided over the period 2004 to 2010
8. Various contracts provided over the period 2004 to 2010
9. Information from the Company’s Website www.transvideo.com.cn, as well as other industry and competitor Websites and
regulatory filings
regulatory filings
10. Software License and Product Distribution Agreement between NeuLion and TransVideo dated September 29, 2006
11. Public company information and market transaction data from Capital I.Q.
11. Public company information and market transaction data from Capital I.Q.
12. Merger Tracker M&A Market Analysis, December 2009, William Blair & Company
13. Not Just Another Fake, Economist.com, January 14, 2010
13. Not Just Another Fake, Economist.com, January 14, 2010
14. Various other internal documents and information provided by the management of TransVideo
15. Various other external industry and valuation resource materials
15. Various other external industry and valuation resource materials
In addition to the documents and information detailed above, representatives of UHY met with members of TransVideo management,
including Jianbing Duan and Andrew Zhang, at the offices of the Company in Beijing, China on April 19, 2010, to discuss the
financial results of the business, its outlook, and discuss information regarding the business.
including Jianbing Duan and Andrew Zhang, at the offices of the Company in Beijing, China on April 19, 2010, to discuss the
financial results of the business, its outlook, and discuss information regarding the business.
G-82

APPENDIX B
CONTINGENT AND LIMITING CONDITIONS
G-83

Appendix B
CONTINGENT AND LIMITING CONDITIONS
This valuation is subject to the following contingent and limiting conditions:
1. Information, estimates, and opinions contained in this report are obtained from sources considered reliable; however, UHY Advisors FLVS, Inc. has not independently
verified such information and no liability for such sources is assumed by the valuation analysts identified in this report. UHY Advisors FLVS, Inc. has not audited, reviewed,
or compiled the financial information provided to us and, accordingly, express no audit opinion or any other form of assurance on this information.
2. All facts and data set forth in the report are true and accurate to the best of the valuation analysts’ knowledge and belief. We have not knowingly withheld or omitted
anything from our report affecting our value estimate.
3. We assume that there are no hidden or unexpected conditions of the business that would adversely affect value, other than as indicated in this report.
4. This valuation was performed as of the valuation date and for the purpose specifically stated in the report. The valuation is valid only for the stated valuation date and
for the stated specific purpose. The report may not be used for any other purpose. The report and conclusion of value are not to be construed as investment advice in any
manner whatsoever.
5. The various estimates of value presented in this report apply to this valuation only and may not be used out of the context presented herein. Any other use of this report
may lead the user to an incorrect conclusion for which UHY Advisors FLVS, Inc. assumes no responsibility.
may lead the user to an incorrect conclusion for which UHY Advisors FLVS, Inc. assumes no responsibility.
6. Possession of this report, or a copy thereof, does not carry with it the right of publication of all or part of any item nor may it be used for any purpose without the previous
written consent of the valuation analysts, and in any event only with proper authorization. Authorized copies of this report will be signed in blue ink by a Managing Director
and/or Principal of UHY Advisors FLVS, Inc. Unsigned copies, or copies not signed in blue ink, should be considered to be incomplete.
7. No change of any item in this appraisal report shall be made by anyone other than UHY Advisors FLVS, Inc., and we shall have no responsibility for any such
unauthorized change.
8. Unless stated otherwise in this report, we express no opinion as to: 1) the tax consequences of any transaction that may result; 2) the effect of the tax consequences of any
net value received or to be received as a result of a transaction; and 3) the possible impact on the value resulting from any need to effect a transaction to pay taxes.
net value received or to be received as a result of a transaction; and 3) the possible impact on the value resulting from any need to effect a transaction to pay taxes.
9. This valuation and report were prepared for the users identified in this report. None of the contents of this valuation report shall be conveyed to any third party or
to the public through any means without the express written consent of UHY Advisors FLVS, Inc.
10. Our valuation opinion is necessarily based on the definition of value stated in the report. An actual transaction in the interests of the business may be concluded at a
higher value or lower value, depending on the circumstances surrounding the business, the appraised business interest, and the motivations and knowledge of both the buyers
and sellers at that time. UHY Advisors FLVS, Inc. makes no guarantees about what value individual buyers and sellers may reach in an actual transaction.
11. No investigation of titles to property or of any claims on ownership of the property of the business by any individuals or company has been undertaken. Unless
otherwise stated in our report, title is assumed to be clear and free of encumbrances and as provided to us.
12. We have relied on the representations of the owners, management, and other third parties concerning the value and useful condition of all equipment, real estate,
investments used in the business, and any other assets or liabilities, except as specifically stated otherwise in this report. We have not attempted to confirm whether or
not all assets of the business are free and clear of liens and encumbrances or that the entity has good title to all assets.
investments used in the business, and any other assets or liabilities, except as specifically stated otherwise in this report. We have not attempted to confirm whether or
not all assets of the business are free and clear of liens and encumbrances or that the entity has good title to all assets.
13. Unless otherwise provided for in writing and agreed to by both parties in advance, the extent of the liability for the completeness or accuracy of the data, opinions,
comments, recommendations and conclusions shall not exceed the amount paid to UHY Advisors FLVS, Inc. for professional fees, and then only to the party or parties
for whom this report was originally prepared.
comments, recommendations and conclusions shall not exceed the amount paid to UHY Advisors FLVS, Inc. for professional fees, and then only to the party or parties
for whom this report was originally prepared.
G-84

14. It should be specifically noted that the valuation assumes the business will be competently managed and maintained by financially sound owners, throughout the expected
period of ownership. This valuation engagement does not entail an evaluation of management’s effectiveness, nor are we responsible for future marketing efforts and
other management or ownership actions upon which actual results will depend. The conclusion of value arrived at herein is based on the assumption that the current level
of management expertise and effectiveness would continue to be maintained, and that the character and integrity of the business through any sale, reorganization,
exchange, or diminution of the owners’ participation would not be materially or significantly changed.
15. Valuation reports may contain prospective financial information, estimates, or opinions that represent the view of the business’ management and/or the valuation analysts
about reasonable expectations at a particular point in time, but such information, estimates, or opinions are not offered as predictions or as assurances that a particular
level of income or profit will be achieved or that specific events will occur. We do not provide assurance on the achievability of results forecasted by the business or its
representatives because events and circumstances frequently do not occur as expected; differences between actual and expected results may be material; and achievement
of the forecasted results is dependent on actions, plans, and assumptions of management.
16. Any decision to purchase, sell, or transfer any interest in the subject company shall be your sole responsibility, as well as the structure to be utilized and the price to be
accepted.
accepted.
17. Public information and industry and statistical information have been obtained from sources we believe to be reliable. However, we make no representation as to the
accuracy or completeness of such information and have performed no procedures to corroborate the information.
accuracy or completeness of such information and have performed no procedures to corroborate the information.
18. No opinion is intended to be expressed for matters that require legal or other specialized expertise, investigation, or knowledge beyond that customarily employed by
appraisers valuing businesses.
appraisers valuing businesses.
19. Neither all nor any part of the contents of this report should be disseminated to the public through advertising media, public relations, news media, sales media, mail,
direct transmittal, or any other means of communication, including but not limited to the Securities Exchange Commission or other governmental agency or regulatory
body, without the prior written consent and approval of UHY Advisors FLVS, Inc.
direct transmittal, or any other means of communication, including but not limited to the Securities Exchange Commission or other governmental agency or regulatory
body, without the prior written consent and approval of UHY Advisors FLVS, Inc.
20. UHY Advisors FLVS, Inc. does not consent to be “expertised” with respect to matters involving the Securities and Exchange Commission. For purposes of this report,
the foregoing sentence means that UHY Advisors FLVS, Inc. shall not be referred to by name or anonymously in any filing or document. Should you breach this stipulation
and refer to UHY Advisors FLVS, Inc. by name or anonymously, you will amend such filing or document upon written request by UHY Advisors FLVS, Inc.
21. It is assumed that there are no regulations of any government entity to control or restrict the use of the underlying assets of the business, unless specifically referred to in
the report, and that the underlying assets will not operate in violation of any applicable government regulations, codes, ordinances, or statutes. Unless otherwise stated, no
effort has been made to determine the possible effect, if any, on the subject business due to future Federal, state, or local legislation, including any environmental or ecological
matters or interpretations thereof.
22. UHY Advisors FLVS, Inc. is not an environmental consulting firm nor audit firm, and it takes no responsibility for any actual or potential environmental liabilities. Any
person entitled to rely on this report, wishing to know whether such liabilities exist, or the scope and their effect on the value of the property of the business, is
encouraged to obtain a professional environmental assessment. UHY Advisors FLVS, Inc. does not conduct or provide environmental assessments and has not
performed one for the subject property of the business.
23. UHY Advisors FLVS, Inc. has not determined independently whether the business is subject to any present or future liability relating to environmental matters
(including, but not limited to CERCLA/Superfund liability) nor the scope of any such liabilities. UHY Advisors FLVS, Inc.’s valuation takes no such liabilities into
account, except as they have been reported to us or by an environmental consultant working for the business, and then only to the extent that the liability was reported to
us in an actual or estimated dollar amount. Such matters, if any, are noted in the report. To the extent such information has been reported to us, we have relied on it
without verification and UHY Advisors FLVS, Inc. offers no warranty or representation as to its accuracy or completeness.
24. UHY Advisors FLVS, Inc. has not made a specific compliance survey or analysis of the subject property of the business to determine whether it is subject to, or in
compliance with, the American Disabilities Act of 1990, and this valuation does not consider the effect, if any, of noncompliance.
compliance with, the American Disabilities Act of 1990, and this valuation does not consider the effect, if any, of noncompliance.
25. We are not required to give testimony in court, or be in attendance during any hearings or depositions, with reference to the business being valued, unless previous
arrangements have been made.
arrangements have been made.
26. This valuation reflects facts and conditions existing at the valuation date. Subsequent events have not been considered, and we have no obligation to update our report
for such events and conditions. However, we reserve the right to disclose such subsequent events discovered after the valuation date which we determine may be
meaningful to the intended user of this report.
for such events and conditions. However, we reserve the right to disclose such subsequent events discovered after the valuation date which we determine may be
meaningful to the intended user of this report.
G-85

APPENDIX C
VALUATOR’S CERTIFICATION
G-86

Appendix C
Valuator’s Certification
We certify that, to the best of any knowledge and belief:
w
The statements of fact contained in this report are true and correct, subject to the assumptions and conditions stated.
w
The reported analyses, opinions, and conclusions are limited only by the reported assumptions and limiting conditions and are our
personal, impartial, and unbiased professional analyses, opinions, and conclusions.
wOur engagement in this assignment was not contingent upon developing or reporting predetermined results.
wOur compensation for completing this assignment is not contingent upon the development or reporting of a predetermined value or
direction in value that favors the cause of the client, the amount of the value opinion, the attainment of a stipulated result, or the
occurrence of a subsequent event directly related to the intended use of this appraisal.
w Our analyses, opinions, and conclusions were developed, and this report has been prepared, in conformity with the Uniform Standards of
Professional Appraisal Practice, and the American Institute of Certified Public Accountants Statement on Standards for Valuation
Services.
Professional Appraisal Practice, and the American Institute of Certified Public Accountants Statement on Standards for Valuation
Services.
w This report was prepared under the direction of Bruce L. Richman, CPA/ABV, CVA. Neither any of the professionals who worked on this
engagement, nor the managing directors of UHY Advisors FLVS, Inc.. have any present or contemplated future interest in TransVideo
International Ltd., any personal interest with respect to the parties involved, or any other interest that might prevent us from performing an
unbiased valuation.
engagement, nor the managing directors of UHY Advisors FLVS, Inc.. have any present or contemplated future interest in TransVideo
International Ltd., any personal interest with respect to the parties involved, or any other interest that might prevent us from performing an
unbiased valuation.
W
No one provided significant business assistance to the signer of this report, except for Patrick Corden and James Kazmier, CPA/ABV,
ASA
Bruce L. Richman, CPA/ABV, CVA
G-87

APPENDIX D
CURRICULUM VITAE OF
BRUCE L. RICHMAN
BRUCE L. RICHMAN
G-88

Appendix D
CURRICULUM VITAE OF BRUCE L. RICHMAN
BACKGROUND:
Since 1980, Mr. Richman has been actively involved in business valuations, mergers and acquisitions and other financial and tax consulting matters. He is a
Managing Director of UHY Advisors FLVS, Inc. In his current position, Mr. Richman is responsible for various corporate valuation projects, forensic/litigation
assignments, and valuation consulting services in the United States and for U.S. clients internationally.
Managing Director of UHY Advisors FLVS, Inc. In his current position, Mr. Richman is responsible for various corporate valuation projects, forensic/litigation
assignments, and valuation consulting services in the United States and for U.S. clients internationally.
PROFESSIONAL EXPERIENCE:
Prior to joining UHY, Mr. Richman was the Managing Director at the Trenwith Valuation, LLC (a subsidiary of BDO Seidman, LLP) and until June 2004 was a
Partner in the Business Valuation Practice Group for BDO Seidman, LLP. Prior to joining BDO, Mr. Richman was the President of the Investigative Valuation
Group, LLC. Before that, he was a partner in a national CPA firm and was in involved with business valuations consulting services. In addition to the business
valuation area, Mr. Richman has extensive experience in the area of tax planning and compliance as well as the financial analysis and structuring of a wide variety
of real estate projects, including real estate syndications, due diligence, workouts, and the strategic planning for troubled real estate. Mr. Richman has directed
hundreds of engagements involving “going-concern” valuations. His valuation experience covers a full spectrum of industries from hospitality to manufacturing
and private equity groups. He has been involved in several major litigation support projects as an expert witness, having testified in numerous courts and
arbitration panels.
The results from Mr. Richman’s valuation projects have been used for the following purposes, among others:
*
Income, gift, and estate taxes
*
Workouts and reorganizations
*
Litigation and expert testimony
*
Strategic planning
*
Lost profits & Shareholder disputes
*
Ownership succession & buy-sell agreements
*
Mergers and acquisitions
*
Corporate Financial Reporting
*
Matrimonial matters
*
Intellectual Property
*
Private equity groups
*
Hedge Funds
G-89

EDUCATIONAL BACKGROUND:
Mr. Richman received his Bachelor of Science in Business Administration from North Adams State College in 1978; a Master’s of Science in Accounting from
The Ohio State University in 1980; and a Master’s of Science in Taxation from Bentley College in 1994. In 2009, Mr. Richman earned an MBA from the J.L.
Kellogg Graduate School of Management at Northwestern University with a major in International Business. Bruce has also taken other specialized training in
Business Valuation.
AFFILIATIONS:
Mr. Richman is a Certified Public Accountant (CPA); an ABV - Accredited in Business Valuations by the AICPA; a Certified Valuation Analyst (CVA) and a
Certified Forensic Accountant. Mr. Richman is also a candidate for the ASA designation with the American Society of Appraisers, specializing in business
valuation. He is also a member of The Forensic CPA Society.
Certified Forensic Accountant. Mr. Richman is also a candidate for the ASA designation with the American Society of Appraisers, specializing in business
valuation. He is also a member of The Forensic CPA Society.
Mr. Richman has published various articles, manuals and books in the areas of business valuation and financial matters, and has been a speaker at various
professional associations. Mr. Richman has also been quoted in the Wall Street Journal and USA Today and has appeared on MSNBC and CNNfn.
professional associations. Mr. Richman has also been quoted in the Wall Street Journal and USA Today and has appeared on MSNBC and CNNfn.
G-90
APPENDIX “H”
NEULION VALUATION REPORT
CONFIDENTIAL TREATMENT REQUESTED:
INFORMATION FOR WHICH CONFIDENTIAL TREATMENT HAS BEEN REQUESTED IS OMITTED AND MARKED WITH “*******” OR OTHERWISE CLEARLY INDICATED. AN UNREDACTED VERSION OF THIS DOCUMENT HAS ALSO BEEN PROVIDED TO THE SECURITIES AND EXCHANGE COMMISSION.

CHICAGO, ILLINOIS
VALUATION REPORT
VALUATION REPORT
NEULION INCORPORATED
PREPARED MAY 5, 2010
PREPARED MAY 5, 2010
H-1

Table of Contents
ENGAGEMENT SUMMARY
3
BUSINESS OVERVIEW
7
ECONOMIC OUTLOOK
47
INDUSTRY OUTLOOK
53
VALUATION ANALYSIS
62
CONCLUSION OF RANGE OF VALUE
74
VALUATION SCHEDULES 1
31 APPENDICES:
31 APPENDICES:
A STOCK OPTIONS, WARRANTS, AND DILUTIVE SECURITIES
B DESCRIPTION OF GUIDELINE PUBLIC COMPANIES
C SOURCES OF INFORMATION
D CONTINGENT AND LIMITING CONDITIONS
E VALUATOR’S CERTIFICATION
F CIRRICULUM VITAE
H-2

ENGAGEMENT SUMMARY
H-3

Engagement Summary
UHY Advisors FLVS, Inc. (“UHY”) was engaged by the Special Committee of the Board of Directors of NeuLion Inc. (“NeuLion” or
the “Company”) (“Client”), as an independent valuator, to perform a business valuation and determine a range of fair market value for
NeuLion as of March 31, 2010 (“Valuation Date”). This valuation opinion and related report are only for the Client’s corporate
planning purposes in connection with the potential acquisition of TransVideo International, Ltd. by NeuLion and should not be
utilized, referred to, or distributed for any other purpose without the express written consent of UHY. Our engagement, nor our
valuation conclusions expressed in our report, are not to be considered a fairness opinion or any indication as what one may be able to
raise capital for in the public market or from any individual investor.
Standard and Definition of Value
The standard of value used in our analysis is fair market value. Fair market value is defined in Internal Revenue Service Revenue
Ruling 59-60 (“Revenue Ruling 59-60”) as:
Ruling 59-60 (“Revenue Ruling 59-60”) as:
…the price at which the property would change hands between a willing buyer and a willing seller when the former is not
under any compulsion to buy and the latter is not under any compulsion to sell, both parties having reasonable knowledge of
relevant facts.
under any compulsion to buy and the latter is not under any compulsion to sell, both parties having reasonable knowledge of
relevant facts.
Fair market value is also defined in the International Glossary of Business Valuation Terms1 as:
The price, expressed in terms of cash equivalents, at which property would change hands between a hypothetical willing
and able buyer and a hypothetical willing and able seller, acting at arms length in an open and unrestricted market, when
neither is under compulsion to buy or sell and when both have reasonable knowledge of the relevant facts.
and able buyer and a hypothetical willing and able seller, acting at arms length in an open and unrestricted market, when
neither is under compulsion to buy or sell and when both have reasonable knowledge of the relevant facts.
1 The International Glossary of Business Valuation Terms is a joint effort of the American Institute of Certified Public Accountants, American Society of
Appraisers, Canadian Institute of Chartered Business Valuators, National Association of Certified Valuation Analysts, and The Institute of Business Appraisers.
Appraisers, Canadian Institute of Chartered Business Valuators, National Association of Certified Valuation Analysts, and The Institute of Business Appraisers.
Page | 4
H-4

Scope of Work
We have considered the follow factors in our analysis of NeuLion.
1. The nature of the business and the history of the enterprise from its inception.
2. The economic outlook in general and the condition and outlook of the specific industry in particular.
3. The bookvalue of the stock and the financial condition of the business.
4. The earning capacity of the Practice.
5. The dividend-paying capacity.
6. Whether or not the enterprise has goodwill or other intangible value.
7. Sales of the stock and the size of the block or stock to be valued.
7. Sales of the stock and the size of the block or stock to be valued.
8. The market price of stocks of corporations engaged in the same or a similar line of business having their stocks actively traded in a
free and open market, either on an exchange or over-the-counter.
free and open market, either on an exchange or over-the-counter.
As part of our assignment, on April 15, 2010 we performed a site visit to the office of NeuLion located at 1600 Old Country Road in
Plainview, NY. We also performed management interviews with key management personnel at NeuLion concerning the Company, its
historic operations, nature and operations of the Company, including trends and prospects for growth as of the Valuation Date and
Managements financial forecast. Additionally, we reviewed various documents and material provided by Management and those available
through our research. A summary of those documents are included in Appendix A of our report.
Page | 5
H-5

Level of Value
Obtain indirectly by reference to
STRATEGIC VALUE
control values via strategic premium
Strategic Premium/Merger Economics
Obtain indirectly by reference to freely
CONTROL VALUE
traded values via control premium
Premium for Control
Lack of Control Discount
FREELY TRADED VALUE OR
Obtain indirectly by reference to control
MARKETABLE,
values via lack of control discount
NON-CONTROLLING
Lack of Marketability Discount
Obtain indirectly by reference to freely
NON-MARKETABLE,
traded values via lack of marketability
NON-CONTROLLING
discount
Source: Based on Z. Christopher Mercer, "Understanding and Quantifying Control Premiums: The Value of Control vs. Synergies of Strategic
Advantages, Part II," The Journal of Business Valuation, p.51.
Advantages, Part II," The Journal of Business Valuation, p.51.
In this report, we used a Control Value basis for the 100% equity ownership of NeuLion.
Premise of Value
NeuLion was valued on a going-concern basis, which assumes that the businesses will continue operating into the future.
Page | 6
H-6

Business History and Overview
NeuLion was incorporated on January 14, 2000 under the Canada Business Corporations Act, and its common shares are listed on the
Toronto Stock Exchange. NeuLion is a technology company that offers an end-to-end suite of internet television technology services.
Toronto Stock Exchange. NeuLion is a technology company that offers an end-to-end suite of internet television technology services.
NeuLion partners with large professional sports organizations such as the NHL, NFL, NCAA programs, and international content
providers to stream media through the internet anywhere in the world. The service is called “IPTV”, which refers to the distribution of
streamed audio, video and other multimedia content, over an Internet Protocol network. NeuLion’s business model is set up to
provide customized network platforms for content that is provided by its clients. NeuLion acquires, processes, and streams content
through private networks to subscribers and pay-per-view customers on Internet-connected browser-based devices such as personal
computers, laptops and mobile devices and on standard television sets through Internet-connected set top boxes (“STBs”).
Page | 7
H-7
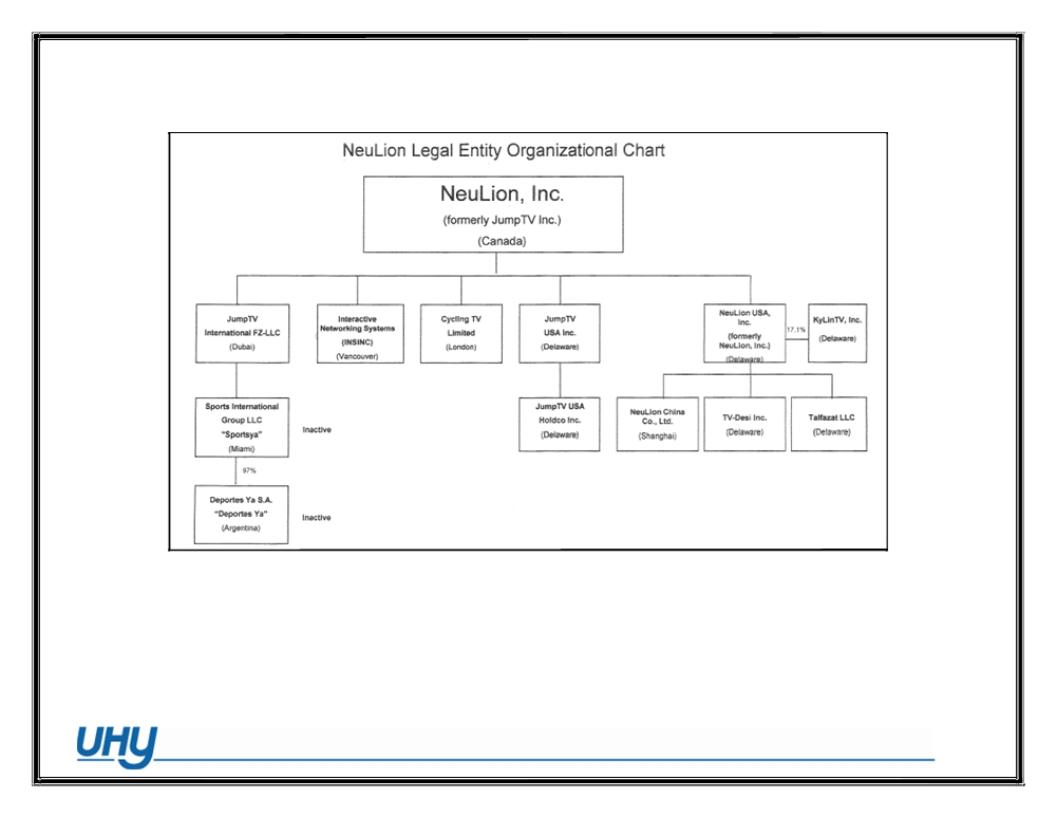
The following flowchart shows the current organization structure for NeuLion:
Page | 8
H-8

Employees
As of March 10, 2010, The Company had 224 total employees, all of whom were full-time employees.
Ms. Nancy Li, NeuLion’s CEO, is married to the Chairman of the Board, Charles Wang, and has been the CEO of the Company since
the merger with Jump TV in 2008. G. Scott Paterson, the former CEO of Jump TV, is now the Vice Chairman of the Company. Mr.
Paterson has an extensive background in the technology sector, and was an investment banker focused on start up technology
companies earlier in his career. In general, the management team at the Company is experienced and have worked together previously
at Computer Associates. Management has indicated the need to add more seasoned professionals to drive revenue going forward. The
current officers of NeuLion include:
Name
Age
Office
Nancy Li
52
Chief Executive Officer
G. Scott Paterson
46
Vice Chairman
Arthur J. McCarthy
53
Chief Financial Officer
Roy E. Reichbach
47
General Counsel and Corporate Secretary
Horngwei (Michael) Her
46
Executive Vice President of Research and Development
Ronald Nunn
57
Executive Vice President of Operations
J. Christopher Wagner
50
Executive Vice President of Sales
Page | 9
H-9

Market Price Information
There is no established public trading market for NeuLion’s shares in the United States. The principal established foreign public trading
market for the Shares is the Toronto Stock Exchange. It is important to note that NeuLion’s stock is thinly traded, and pink sheeted. At the
end of the first quarter 2010, NeuLion’s stock price was $0.64, with 3 month average volume of approximately 15 thousand2.
market for the Shares is the Toronto Stock Exchange. It is important to note that NeuLion’s stock is thinly traded, and pink sheeted. At the
end of the first quarter 2010, NeuLion’s stock price was $0.64, with 3 month average volume of approximately 15 thousand2.
Time Period
High Low
2010
First Quarter
$0.84
$0.50
2009
First Quarter
$0.62
$0.28
Second Quarter
$0.81
$0.45
Third Quarter
$1.20
$0.70
Fourth Quarter
$1.00
$0.62
Shareholders
As of March 10, 2010, there were approximately 171 holders of record of Shares. Charles Wang and G. Scott Paterson are major
shareholders with 48.5% and 7.5% ownership interests in the Company, respectively.
shareholders with 48.5% and 7.5% ownership interests in the Company, respectively.
Dividends
The Company has paid no dividends since its inception.
2 Yahoo Finance.
Page | 10
H-10

NeuLion’s Operations
The Company’s business model has evolved from a professional IT services and international programming provider to an end-to-end
provider of IPTV services. The Company believes that it ability to provide end-to-end services is a competitive advantage over smaller
players in the industry, that may only be able to provide one piece of the IPTV solution. The diagram below presents the general suite
of services offered by NeuLion, and illustrates how partner content is captured, processed, delivered, and monetized:
Page | 11
H-11

• NeuLion provides services for hundreds of television channels. The
Company transcodes and delivers live linear channels, libraries of
video on demand, and live events using industry set top boxes and
consumer devices.
Company transcodes and delivers live linear channels, libraries of
video on demand, and live events using industry set top boxes and
consumer devices.
• The IPTV experience is better than cable and satellite and they use the
internet so you can go anywhere in the world.
internet so you can go anywhere in the world.
• NeuLion is different than typical IPTV companies because it
provides the full suite of end-to-end services.
provides the full suite of end-to-end services.
• NeuLion’s service encodes, delivers, stores and manages an
unlimited range of multimedia content and the operational support
system maintains all billing and customer support services.
unlimited range of multimedia content and the operational support
system maintains all billing and customer support services.
• The visual illustration to the right shows how NeuLion acquires
various forms of content, as well as the other processes that bring the
media to market.
various forms of content, as well as the other processes that bring the
media to market.
Page | 12
H-12

Service Lines and Content Partners
NeuLion provides television solutions, web solutions, and sports media solutions. The Company’s client base can be broken down into
three main segments as shown below:
three main segments as shown below:
• Professional Sports (B2B)
• Collegiate Sports (B2B)
• International Programming (B2B and B2C)
Professional Sports Programming (B2B)
NeuLion provides professional sports organizations a complete sports media platform that includes web and video publishing, ecommerce
tools, auctions, live streaming, ticketing, and a donor management systems. It is typically the responsibility of the partners to market the
service, while NeuLion designs and builds a platform that brings the media to market. Below is a sample list of some clients that NeuLion
has partnered with in the professional sports market:
• National Football League (NFL);
• National Hockey League (NHL);
• Major League Soccer (MLS);
• Indy Car Series
• American Hockey League (AHL)
Projected
Professional Sports and Variety Programming Revenue
2009
2010
Subscription Revenue
$3,629,604
$4,107,000
Technology Services Revenue (website, set-up, transcoder, professional)
786,215
663,000
Total
$4,415,819
$4,770,000
Total revenue from professional and variety networks services was approximately $4.4 million in 2009, which translates to approximately
16% of the Company’s total revenue for 2009. This is projected by Management to be $4.8 million in 2010, which translates to
approximately 12% of NeuLion’s total projected revenue.
16% of the Company’s total revenue for 2009. This is projected by Management to be $4.8 million in 2010, which translates to
approximately 12% of NeuLion’s total projected revenue.
Page | 13
H-13
Collegiate Sports Programming (B2B)
The Company also provides over one hundred NCAA organizations with sports media platforms that create and maintain websites, handle
merchandising, ticketing, and donor management programs which help increase donations to athletic programs. For instance, the University
of North Dakota recently used NeuLion to re launch its website, www.fightingsioux.com. Also, NeuLion has a cutting edge ticketing and
donor management system that handles ticket sales for many NCAA organizations through an easy to use seating request process that
features attendance-driven loyalty programs and print-at-home ticketing. NeuLion's sports media platform integrates digital ticketing, a
donor database, and a "priority points calculator" that allows fans and donors to track their purchases and donations with a points system that
can be used to earn tickets, venue access, and other items. In fact, NeuLion recently entered new ticketing deals with Duke University and
Ohio State University.
The following table shows a breakdown for revenue from collegiate sports programming in terms of subscription, ecommerce, and
technology services revenue for the year ended December 31, 2009.
technology services revenue for the year ended December 31, 2009.
Projected
College Networks Services
2009
2010
Subscription
$4,664,752
$5,598,000
Ecommerce (advertising, merchandising, ticketing, donor management, auction)
2,104,326
2,531,000
Technology Services (website, set-up, transcoder, professional)
1,544,647
1,854,000
Total
$8,313,725
$9,983,000
Total revenue from College Networks Services was approximately $8.3 million in 2009, which translates to approximately 30% of
NeuLion’s total revenue. Management has projected revenue to be $10.0 million in 2010, which translates to approximately 24% of
NeuLion’s projected 2010 revenue.
NeuLion’s total revenue. Management has projected revenue to be $10.0 million in 2010, which translates to approximately 24% of
NeuLion’s projected 2010 revenue.
Page | 14
H-14

Ethnic/International and Specialty Programming (B2B and B2C)
NeuLion also offers what is referred to in the industry as “ethnic television,” which the Company defines as programming directed at a
specific diaspora community, as determined by a shared nationality, language or culture, and generally excluding communities for which
English is the primary language. The Company has license agreements directly with channel partners representing approximately 185
channels in 55 countries that give NeuLion rights to stream, predominantly on an exclusive world-wide basis, the channel partners’ live
linear television feeds over the public internet using proprietary private networks such as Talfazat and TV-Desi. The Company has
significant opportunities for growth with its Talfazat (Arabic), KyLinTV (Chinese), and TV Desi (South Asian) content. Additionally,
NeuLion recently entered into an agreement with Arab Radio and Television Network (ART) on April 13, 2010 to distribute Arabic content
through an IPTV platform in Canada.
NeuLion’s subsidiary, INSINC, also distributes government and entertainment content. Its clients in those industries include Business News
Network (BNN), CTV News Channel, Rogers Sportsnet, TVG Networks, The Canadian Press, the Canadian Ministry of Justice, the BC
Ministry of Education, and the Legislative Assemblies of British Columbia and Newfoundland and Labrador, among others. NeuLion also
has relationships with other specialty programming customers such as Sky Angel U.S. LLC, which streams faith-based programming.
Projected
Ethnic, International, and Specialty
2009
2010
Subscription:
Sky Angel
$2,306,609
$2,531,000
International B2B
2,891,859
3,670,000
Other International B2C
4,712,055
3,797,000
INSINC
270,699
2,741,000
Total Subscription
$10,181,222
$12,739,000
Technology Services (website, set-up, transcoder, professional)
1,708,108
3,571,000
Equipment (set top boxes)
1,629,275
1,852,000
Total
$13,518,605
$18,162,000
Total revenue from ethnic/international and specialty programming was approximately
$13.5 million in
2009, which translates to
approximately 48% of NeuLion’s total revenue. Management has projected this to be $18.2 million in 2010, or 51% of NeuLion’s total
projected revenue for 2010.
Page | 15
H-15

New Deals and Business Partners
Dish Network NeuLion recently entered into a new deal with Dish Network
to take advantage a new strategy to bring IPTV to the New York market. Dish Network has had difficulty in highly populated metropolitan
areas such as Manhattan, because some apartment buildings do not allow tenants to install satellite dishes on top of their buildings. As a
result, Dish Network has partnered with NeuLion to offer its customers ethnic content (Arabic and Chinese) through STB’s without using
satellite dishes. The STB’s are provided by NeuLion.
Under the terms of the agreement, NeuLion will sell Set Top Boxes to Dish Network, and receive a fee per subscriber ranging from ******* to
******* per month depending on the total number of subscribers. In order for Dish to renew this contract they will need to have *******
subscribers by the end of 2012.
******* per month depending on the total number of subscribers. In order for Dish to renew this contract they will need to have *******
subscribers by the end of 2012.
Based on achieving certain levels of subscribers, Dish has a right to receive up to a total of 2 million warrants to purchase common stock of
NeuLion. These warrants are subject to a vesting schedule based on Dish achieving certain levels of subscribers. The first threshold is 20,000
subscribers for the first series of warrants, with the additional thresholds increasing to the highest threshold of 150,000 subscribers. This
information is broken down in the table below.
Threshold for Vesting
Series Number of Warrants Exercise Price
Expiration*
(number of subscribers)
D-1
150,000
$1.50
20,000 or more
January 4, 2013
D-2
200,000
1.50
40,000 or more
January 4, 2013
D-3
300,000
1.50
60,000 or more
January 4, 2014
D-4
600,000
2.00
100,000 or more
January 4, 2015
D-5
750,000
2.00
150,000 or more
January 4, 2015
* Earlier of termination of contract or expiration date. The contract expires at the end of 2012, subject to automatic
renewal if Dish achieves a level of ******* subscribers by such date.
renewal if Dish achieves a level of ******* subscribers by such date.
Page | 16
H-16

Other New Deals
Additionally, the Company has entered in a number of different deals within its professional sports, college sports, and international
programming business lines. NeuLion has been able to leverage its industry leading technology and end-to-end capabilities to add high-
profile clients including Major League Soccer, the NHL, Ole Miss Athletics, Duke University, Arab Radio and Television Network, TV-
Desi, and others.
programming business lines. NeuLion has been able to leverage its industry leading technology and end-to-end capabilities to add high-
profile clients including Major League Soccer, the NHL, Ole Miss Athletics, Duke University, Arab Radio and Television Network, TV-
Desi, and others.
NeuLion recently announced a new deal with Major League Soccer for a dedicated online video service that will be built and managed by
NeuLion. The service will have DVR-like functionality and HD quality video which will enable fans to watch and engage with the game
through a number of exciting and interactive real time services. NeuLion will provide Major League Soccer with end-to-end services that
will deliver up to 300 games as well as archived games and real time highlights3.
The NHL and NeuLion also partnered to create the “NHL Ice Time - Playoffs Edition” app, which is the first official NHL app for Apple’s
new product, the iPad. The app allows fans access to live scores, live in-game stats, condensed versions of full games, highlight reels, video
archives, game photos, and more4. The original NHL Ice Time app was the first application for the iPhone and iTouch, and was released in
more than 70 countries outside the United States.
NeuLion continues to increase its reputation and brand awareness through its leading technology and high-profile partners. Recently,
NeuLion was nominated for the “Best in Sports Technology” award at the 2010 Sports Business Awards.
NeuLion was nominated for the “Best in Sports Technology” award at the 2010 Sports Business Awards.
3 www.marketwire.com /press-release/NeuLion-Chosen-as-Major-League-Soccers-Digital-Video-Partner
4 www.nhl.com/ice/news
4 www.nhl.com/ice/news
Page | 17
H-17

Facilities
The Company leases office space in the following locations:
Location
Toronto, Ontario, Canada
Shanghai, China
Shanghai, China
Sanford, Florida
New York, New York
Plainview, New York
London, England
Centennial, Colorado
Plainview, New York
London, England
Centennial, Colorado
Burnaby, British Columbia, Canada
• The Company is headquartered out of Plainview, NY, with approximately 70 people on location;
• The Company has a Toronto office as a result of the merger with Jump TV. The office is small with no significant operations other
than a marketing and sales staff of approximately 15 people. The Toronto office is important due to its large presence with the NHL
and Maple Leaf Entertainment;
than a marketing and sales staff of approximately 15 people. The Toronto office is important due to its large presence with the NHL
and Maple Leaf Entertainment;
• The Company’s office in Shanghai, China is focused on product and network development, and it currently houses approximately 40
development technicians;
development technicians;
• The Company’s Sanford, FL office has approximately 50 employees. This office houses a small development group; a support group
for end users (NHL, NCAA), B2B clients, and NeuLion billings; and web marketing employees. This office also has a project
management group for college and small broadcast operations to handle streaming and video content;
for end users (NHL, NCAA), B2B clients, and NeuLion billings; and web marketing employees. This office also has a project
management group for college and small broadcast operations to handle streaming and video content;
• The Company’s London office has four employees who handle the Cycling TV operations;
• The Company’s Centennial, CO office employs a college sports sales staff;
• The Company’s Burnaby, British Columbia, Canada office employs 15 people. The office is primarily focused on minor league
hockey in Canada and servicing Canadian TV customers. These were former customers of INSINC, which was recently acquired.
hockey in Canada and servicing Canadian TV customers. These were former customers of INSINC, which was recently acquired.
Page | 18
H-18

A picture of the Company’s headquarters is shown below:
Page | 19
H-19
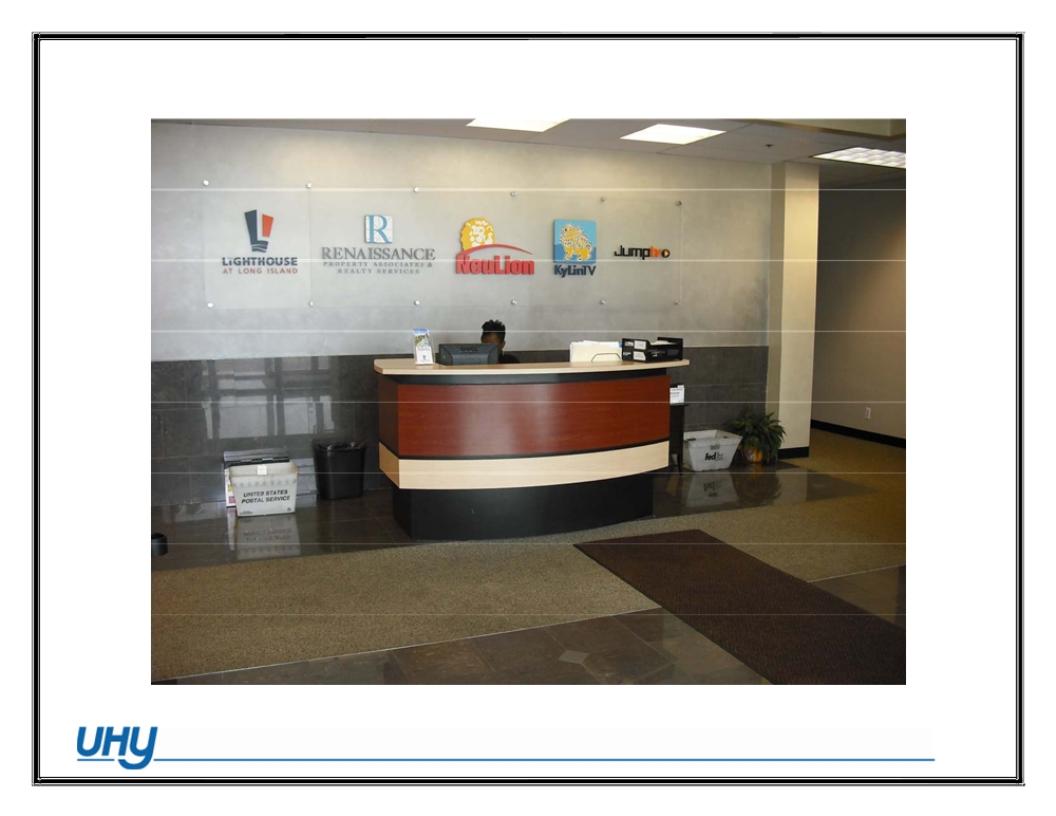
A picture of the reception desk at the Company’s headquarters is shown below:
Page | 20
H-20

A picture of the Company’s main editing room at their headquarters is shown below:
Page | 21
H-21

Competition:
The IPTV industry has experienced the launch of various closed network IPTV services around the world. As IPTV companies strive to
maintain and grow their customer bases, fixed line telecommunications companies will likely see closed network IPTV as a central element
of a “triple-play” strategy that will package telephone, television and Internet services in a single offering. Moreover, certain IPTV service
providers have an internal IP distribution strategy whereby they make their live linear feeds, as well as repurposed content, available through
their own websites on a paid basis or free advertisement-supported basis.
Management of NeuLion indicated that the following three entities all have end-to-end IPTV network capabilities and are generally
considered direct competitors of NeuLion, due to the fact that NeuLion has such a strong emphasis in the sports segment:
considered direct competitors of NeuLion, due to the fact that NeuLion has such a strong emphasis in the sports segment:
• www.mlb.com/tv
o Major League Baseball streams IPTV through a licensing agreement with MLB Advanced Media. This company is
considered a major competitor, and has control of the baseball sports market in the IPTV industry.
considered a major competitor, and has control of the baseball sports market in the IPTV industry.
• www.cstv.com
o College Sports TV, which was purchased by CBS 4 - 5 years ago for $325 million. $74 million of the purchase price
was allocated to the Broadband business, which was doing $10-$12 million in revenue at the time. The cable piece of
the business accounted for the remaining $250 million.
was allocated to the Broadband business, which was doing $10-$12 million in revenue at the time. The cable piece of
the business accounted for the remaining $250 million.
• www.performtv.net
o This is a private company based in the United Kingdom that is focused on the Premiership League (English Soccer
League). APEX, a Russian, UK based investment firm, is the controlling shareholder.
League). APEX, a Russian, UK based investment firm, is the controlling shareholder.
In addition to the competitors that were identified by Management, NeuLion competes with the following list of IPTV companies:
International Content Providers
• www.mediaZone.com
o Media Zone is an online broadcaster that specializes in sports (Rugby, Tennis, etc.) and international programming by
subscription and pay per view access to live and on-demand programming.
subscription and pay per view access to live and on-demand programming.
•
Page | 22
H-22

• www.joost.com
o Joost is an IPTV distribution Company based in the Netherlands that works with content copyright owners to provide
professionally produced online video. The IPTV platform brings together advertisers, content owners, and viewers
(viewers view content free of charge).
professionally produced online video. The IPTV platform brings together advertisers, content owners, and viewers
(viewers view content free of charge).
• www.africast.tv
o Africast Global Media is the world’s leading broadcaster of African ethnic television over broadband Internet. This
company broadcasts over 40 channels from 25 African countries.
company broadcasts over 40 channels from 25 African countries.
• www.wactchindia.tv
o Watch India TV is a subscription based online broadcaster of Indian TV shows. This company’s target market is the
non-resident Indian population, which is approximately 30 million people.
non-resident Indian population, which is approximately 30 million people.
International Sports Providers
• www.universalsports.com
o Universal Sports is a partnership between NBC Sports and InterMedia Partners that is an online broadcaster of Olympic
sports and lifestyle sports programming.
sports and lifestyle sports programming.
College and Domestic Sports Providers
• www.espn.com
o ESPN Broadband is a business unit of ESPN (Entertainment Sports Programming Network) that provides sports
content to users over a high speed internet connection through ESPN Motion, ESPN 260, ESPN Pnlin
content to users over a high speed internet connection through ESPN Motion, ESPN 260, ESPN Pnlin
• www.scout.com
o Scout is an integrated sports publishing company that offers sports websites related to College and Professional Sports.
The Company also publishes college and professional magazines.
The Company also publishes college and professional magazines.
Page | 23
H-23

In addition to these companies, NeuLion competes with Hispanic content providers, ethnic content providers, and many smaller players that
provide a much narrower choice of services, but do not necessarily have the full end-to-end capabilities.
provide a much narrower choice of services, but do not necessarily have the full end-to-end capabilities.
The Company seeks to be an end-to-end service provider for its customers, meaning that NeuLion can provide all of the necessary services to
bring the customers content to market. NeuLion’s technology and services are directed at the entire spectrum of content aggregation and
delivery to the end user. Many companies in the IPTV market offer narrower choices of services than NeuLion. For example, some content
providers deliver only their own content, while NeuLion offers the content of multiple providers. NeuLion also provides the Set Top Boxes
(“STB’s”) used to view content on a television set. These STB’s are procured from key suppliers including TransVideo International, Ltd.
An additional source of competition includes operators of pirated video content and bootleggers. These are not legitimate entities, but they
are competitors in the IPTV market, and some even offer ethnic content which competes with NeuLion’s international and ethnic offerings.
are competitors in the IPTV market, and some even offer ethnic content which competes with NeuLion’s international and ethnic offerings.
Page | 24
H-24

Business Risks
There are several risks that effect NeuLion currently and their ability to meet their financial projections. Below is a summary of risk factors
that could have a negative impact on the Company.
that could have a negative impact on the Company.
Supplier Dependence:
NeuLion depends upon TransVideo International, Ltd. and Tatung Technology Incorporated to provide the STBs used by its customers.
However, NeuLion has indicated that these boxes are becoming somewhat of a commodity in the marketplace. Also, the Company relies on
outside parties for content.
However, NeuLion has indicated that these boxes are becoming somewhat of a commodity in the marketplace. Also, the Company relies on
outside parties for content.
Access to Working Capital:
The Company runs the risk of burning through its cash due to its status as a second stage venture company, and the lack of borrowing
capacity inherent with early stage technology companies. This is a serious risk as any major glitches in operations or loss of business could
have a serious financial impact on NeuLion. NeuLion’s current financial position could also impact any capital needs for growth internally
and externally.
capacity inherent with early stage technology companies. This is a serious risk as any major glitches in operations or loss of business could
have a serious financial impact on NeuLion. NeuLion’s current financial position could also impact any capital needs for growth internally
and externally.
Consumer Demand for IPTV:
IPTV is a relatively new service, and potential customers may be slow to use the internet as a medium through which they watch television
and receive media content. At the same time, as IPTV becomes an accepted medium more competition will enter the market putting more
pressure on NeuLion.
and receive media content. At the same time, as IPTV becomes an accepted medium more competition will enter the market putting more
pressure on NeuLion.
Subscriber Turnover:
Because the IPTV market is increasingly competitive, increased subscriber churn could have a significant negative impact on the Company’s
operations due to increased costs related to customer acquisition and retention.
operations due to increased costs related to customer acquisition and retention.
Regulation:
Governments and regulatory authorities in some jurisdictions in which NeuLion’s subscribers reside could potentially impose rules and
regulations affecting the content distributed over IPTV, however the extent of the regulation is unknown as of the date of this report.
regulations affecting the content distributed over IPTV, however the extent of the regulation is unknown as of the date of this report.
Page | 25
H-25

Legal Proceedings:
Management has indicated that there is no litigation currently pending or threatened against NeuLion or any of the Company’s
directors in their capacity as such.
directors in their capacity as such.
Page | 26
H-26

Investments
KylinTV was launched in September 2005, and is the only IPTV service dedicated to the Chinese community living in North America. This
company offers access to over 60 of the most popular Chinese TV channels and more than 40,000 hours of Video-On-Demand
programming. The company is controlled by Charles B. Wang, founder of Computer Associates and Chairman of the Board of NeuLion; and
Charles Dolan, founder of Cablevision.
company offers access to over 60 of the most popular Chinese TV channels and more than 40,000 hours of Video-On-Demand
programming. The company is controlled by Charles B. Wang, founder of Computer Associates and Chairman of the Board of NeuLion; and
Charles Dolan, founder of Cablevision.
• As of March 31, 2010 NeuLion has a 12.2% equity position in KyLinTV. As of December 31, 2009, the NeuLion had an equity
interest in KyLinTV of 17.1%.
interest in KyLinTV of 17.1%.
o On February 26, 2010, a group of investors invested $10.0 million in KyLinTV for 15.1% of its equity, which reduced
NeuLion’s equity interest in KyLinTV to 12.2%. Of the total $10.0 million investment, $1.0 million was invested by
AvantaLion LLC, a company controlled by Charles Wang, while the remainder was invested by Investor AB, which is a
Nordic-based industrial holding company that has a long history in this investment circle.5
• Beijing TransVideo Digital Technology Co. Limited, a related entity, has a 31.8% ownership interest in Kylin TV.
KyLin TV is in business to create the best Chinese language IPTV platform overseas for spreading the Chinese culture. Through the use of
IPTV, KyLinTV TV’s patent pending Video technology brings high quality broadcast channels and VOD to the TV set using existing Home
DSL or Cable broadband. KyLinTV is based in Plainview, New York. Through the use of the Technology, set top boxes, and Platform from
NeuLion and TransVideo, KyLinTV is able to bring to North America the exclusive broadcasting of mainland China television and local
videos on demand.
5 www.investorab.com
Page | 27
H-27

The income statement and balance sheet of KyLinTV are summarized below for the years ended December 31, 2008 and 2009:
KyLinTV Condensed Income Statements6
December 31, 2009
December 31, 2008
Condensed income statement information:
Net sales
$8,127,760
$6,568,101
Net loss
$(5,604,118)
$(8,148,974)
Condensed balance sheet information:
Current assets
$1,924,891
$927,427
Non-current assets
$913,977
$2,411,319
Total assets
$2,838,868
$3,338,746
Current liabilities
$15,168,149
$10,063,909
Non-current liabilities
$-
$-
Equity (deficiency)
$(12,329,281)
$(6,725,163)
Total liabilities and equity
$2,838,868
$3,338,746
NeuLion and KyLinTV have an agreement wherein NeuLion builds and delivers the set up and back office operation of KyLinTV TV’s
IPTV service. As part of this agreement, NeuLion earns a portion of the subscriber revenue generated from KyLinTV subscribers. In 2008
and 2009, this generated NeuLion subscriber revenue of $0.9 million and $1.7 million, respectively. Management has projected this revenue
to be $2.1 million in 2010.
6 KyLinTV TV’s financial statements are derived from NeuLion, Inc’s 2010 10K.
Page | 28
H-28

INSINC
On October 31, 2009, NeuLion acquired INSINC, a Canadian IPTV company for an aggregate purchase price of $6,694,293.
INSINC is a media company that is positioned to take advantage of the rapidly expanding broadband online video market. The company
offers an enabling platform, with proprietary software tools for broadcasting video over the Internet. INSINC offers a range of software tools
for broadcasting video content over IPTV using the NeuLion platform.
offers an enabling platform, with proprietary software tools for broadcasting video over the Internet. INSINC offers a range of software tools
for broadcasting video content over IPTV using the NeuLion platform.
Similar to NeuLion, its largest clients are in the area of sports, and include the Western Hockey League (WHL), Ontario Hockey League
(OHL), Central Hockey League (CHL), British Columbia Hockey League (BCHL), Central Canadian Hockey League (CCHL), Alberta
Junior Hockey League (AJHL), and Central Junior Hockey League (CJHL). When combined with NeuLion clients such as the National
Hockey League (NHL) and the American Hockey League (AHL), the Company will have a strong presence in the delivery of online video
experiences for the North American hockey world.
INSINC's other sports clients include the Canadian Football League (CFL) which is similar to NeuLion’s relationship with the National
Football League (NFL) and approximately 175 US colleges, schools and conferences for which NeuLion provides online broadcasting of
football and sports programming.
Football League (NFL) and approximately 175 US colleges, schools and conferences for which NeuLion provides online broadcasting of
football and sports programming.
INSINC also provides its services to government and entertainment broadcasting sectors with clients including Business News Network
(BNN), CTV News Channel, Rogers Sportsnet, TVG Networks, The Canadian Press, the Canadian Ministry of Justice, the BC Ministry of
Education, and the Legislative Assemblies of British Columbia and Newfoundland and Labrador.
(BNN), CTV News Channel, Rogers Sportsnet, TVG Networks, The Canadian Press, the Canadian Ministry of Justice, the BC Ministry of
Education, and the Legislative Assemblies of British Columbia and Newfoundland and Labrador.
Page | 29
H-29

The income statement for INSINC for 2009 is included in the Company’s consolidated statement of operations from October 31, 2009
through December 31, 2009, and is summarized in the table below.
through December 31, 2009, and is summarized in the table below.
Description
2009
Revenue
$575,347
Cost of Revenue
$(238,309)
Operating Expenses
$(264,816)
Depreciation and Amortization
$(8,965)
Loss on Foreign Exchange
$(6,169)
Net Income
$57,088
A breakdown of INSINC’s projected operations for 2010 through 2014 is shown in the table below. This forecast was part of a valuation of
INSINC’s intangible assets as of October 31, 2009 as prepared by Peter Ott & Associates, Inc with input from Management.
Description
12/31/2010
12/31/2011
12/31/2012
12/31/2013
12/31/2014
Revenue
Existing Contract Revenue
$
4,661,638
$
4,937,191
$
5,325,734
$
5,808,061
$
5,049,175
New Customer Revenue
438,362
767,133
1,150,699
1,553,444
1,941,805
Total Revenue
5,100,000
5,704,324
6,476,433
7,361,505
6,990,980
Cost of Sales
Existing Contract Cost of Sales
$
2,463,360
$
2,488,125
$
2,521,467
$
2,557,705
$
2,214,187
New Customer Cost of Sales
241,099
421,923
632,884
854,394
1,067,993
Total Cost of Sales
$
2,704,459
$
2,910,048
$
3,154,351
$
3,412,099
$
3,282,180
Gross Profit
Existing Contract Gross Profit
$
2,198,278
$
2,449,066
$
2,804,267
$
3,250,356
$
2,834,988
New Customer Gross Profit
197,263
345,210
517,815
699,050
873,812
Total Gross Profit
$
2,395,541
$
2,794,276
$
3,322,082
$
3,949,406
$
3,708,800
Operating Expenses
SG&A Costs
1,238,846
1,272,899
1,316,272
1,357,431
1,238,964
Operating Income
$
1,156,695
$
1,521,377
$
2,005,810
$
2,591,975
$
2,469,836
Income Tax Expense
347,009
433,593
541,569
699,834
666,856
Net Income
$
809,686
$
1,087,784
$
1,464,241
$
1,892,141
$
1,802,980
Page | 30
H-30

Prior Transactions
The current Company (NeuLion) is the result of a merger between Jump TV Inc. and NeuLion, Inc. that was completed on October 20, 2008
with a total purchase price of $33,558,784. Under the terms of the Merger, NeuLion issued 49,577,427 shares directly, as well as 1,840,097
shares subject to a performance escrow relating to a prior acquisition, which represented approximately the entire issued and outstanding
shares of NeuLion prior to closing, to the security holders of NeuLion USA in exchange for their NeuLion USA securities. The escrow
shares were subsequently cancelled in September 2009. Pursuant to the Merger, the Company also issued 5,000,000 warrants to purchase
shares, fully vested and exercisable for two years at US$0.63 per share, and 2,700,000 employee stock options to purchase shares, vesting in
equal monthly amounts over 48 months and exercisable for five years at US$0.60 per Share, to employees of NeuLion USA who became
employees of the Company.
On October 20, 2008, the following two transactions also took place which produced aggregate gross proceeds of CDN$11 million, or
USD$9.2 million:
USD$9.2 million:
1. AvantaLion LLS, which is an entity controlled by Mr. Charles Wang, Chairman of the Board of Directors, purchased 10 million units
from Jump TV’s treasury stock at CDN$1 per unit. Each unit consists of the following:
from Jump TV’s treasury stock at CDN$1 per unit. Each unit consists of the following:
a.
1 common share
b.½ common share purchase warrant, with an exercise price of CDN$1 (exercisable for a period of two years)
2. Mr. G. Scott Paterson, CEO of Jump TV, purchased 1 million units under the same terms as Mr. Wang.
2. Mr. G. Scott Paterson, CEO of Jump TV, purchased 1 million units under the same terms as Mr. Wang.
On June 4, 2009, the company then known as NeuLion, Inc. changed its name to NeuLion USA, Inc. (“NeuLion USA”). On July 13, 2009,
Jump TV Inc. changed its name to NeuLion, Inc. (the “Company” or “NeuLion”). In conjunction with the name change, NeuLion’s stock
symbol on the Toronto Stock Exchange was changed from “JTV” to “NLN”.
Jump TV Inc. changed its name to NeuLion, Inc. (the “Company” or “NeuLion”). In conjunction with the name change, NeuLion’s stock
symbol on the Toronto Stock Exchange was changed from “JTV” to “NLN”.
Management has indicated that Mr. Paterson is the only member of Jump TV senior management that is still with NeuLion, Inc.
Page | 31
H-31

Financial Statement Analysis
Schedules 1 and 3 present the balance sheets of NeuLion as of December 31, 2007 through December 31, 2009. Presented in schedule 2 are
common size balance sheets for the Company as of the same dates. The financial statements presented in this report represent the combined
assets and liabilities, and results of operations from NeuLion USA and NeuLion, Inc., as detailed in the excerpt from the Company’s 2009
Audited Financial Statements taken from the 2009 Form 10K:
“On October 20, 2008, the company now known as NeuLion USA, Inc. (“NeuLion USA”) completed a merger (the
“Merger”) with the company then known as NeuLion, Inc. (“NeuLion” or the “Company”) that was accounted for as a
reverse takeover. As a result of the Merger, NeuLion USA became the legal subsidiary of NeuLion.
“Merger”) with the company then known as NeuLion, Inc. (“NeuLion” or the “Company”) that was accounted for as a
reverse takeover. As a result of the Merger, NeuLion USA became the legal subsidiary of NeuLion.
On June 4, 2009, the company now known as NeuLion, Inc., a Delaware corporation and wholly-owned subsidiary of
the company then known as Jump TV Inc., a Canadian corporation, changed its name to NeuLion USA. On July 13,
2009, Jump TV Inc. changed its name to NeuLion.
the company then known as Jump TV Inc., a Canadian corporation, changed its name to NeuLion USA. On July 13,
2009, Jump TV Inc. changed its name to NeuLion.
These consolidated financial statements for the years ended December 31, 2009 and 2008, and as at December 31,
2009 and 2008 are issued under the name of the legal acquirer in the Merger (NeuLion) but are deemed to be a
continuation of the accounting acquirer (NeuLion USA). These financial statements reflect the assets, liabilities and
results of operations of NeuLion USA, the accounting acquirer, and only include the assets, liabilities and results of
operations of NeuLion, the legal acquirer, subsequent to the reverse takeover on October 20, 2008.”7
7 NeuLion Inc. 2009 Form 10K
Page | 32
H-32

Below are NeuLion’s key reported balance sheet items as of December 31, 2007 through 2009.
Key Reported Balance Sheet Items8
Key Reported Balance Sheet Items8
Description
2009
20089
200710
Cash & Equivalents
$12,957,679
$27,323,021
$608,464
Inventories
928,592
347,600
323,500
Accounts Receivable
1,809,147
2,284,242
2,017,137
Prepaid Expenses & Deposits
966,101
1,830,260
525,637
Total Current Assets
17,765,679
33,320,146
3,663,593
Net Fixed Assets
5,754,255
6,474,989
2,281,667
Customer Relationships
9,462,904
5,668,916
-
Trademarks
79,167
80,415
-
Goodwill
6,757,194
6,846,183
-
Total Assets
$40,269,163
$53,737,682
$7,211,951
Working Capital
$964,371
$18,110,823
$242,774
Total Liabilities
$17,998,829
$16,724,104
$3,965,018
Shareholders' Equity
$22,270,334
$37,013,578
$3,246,933
A discussion of NeuLion’s key balance sheet items follows:
• The Company’s cash and equivalents balance has fluctuated considerably over the observed period. Although NeuLion successfully
executed an IPO, it is still spending significant funds on early stage expenses. NeuLion does not have a credit facility, so it relies on
cash to fund its operations. The Company’s cash outlays are offset by the capital that has periodically been raised over the past five
executed an IPO, it is still spending significant funds on early stage expenses. NeuLion does not have a credit facility, so it relies on
cash to fund its operations. The Company’s cash outlays are offset by the capital that has periodically been raised over the past five
8This information comes from audited financial statements contained in NeuLion 2009 10k, and Jump TV’s 2008 10K
9 The 2008 Balance Sheet includes financial information for Jump TV after the date of the acquisition in October, 2008.
10 The 2007 Balance Sheet does not include the results of Jump TV.
10 The 2007 Balance Sheet does not include the results of Jump TV.
Page | 33
H-33

years. The most recent round of financing caused the spike in cash in 2008, which has subsequently fallen to approximately $13
million in 2009. During 2009, NeuLion used $11.7 million to fund operations, which included working capital changes of $1.8
million, $1.2 million to purchase fixed assets and $1.6 million to acquire INSINC. NeuLion is burning through cash very quickly,
which could be a problem if the Company does not generate positive cash flow in the near future.
•The Company’s average accounts receivable balance is $1.8 million as of December 31, 2009, which is relatively low as a percentage
of revenue compared to the guideline public companies (these entities will be discussed in detail later in the report). The Company’s
average accounts receivable turnover ratio is 14.5 turns compared to the guideline public company median of 5.7. The Company’s
allowance for doubtful accounts was $30 thousand as of December 31, 2009, and $291 thousand as of December 31, 2008.
Accordingly, NeuLion’s credit policy and collection efforts appear to be fairly effective.
•The Company’s inventory balance of approximately $930 thousand as of December 31, 2009 is made up of Set Top Boxes. This is a
fairly low level of inventory because the Company is focused on providing end-to-end services as opposed to just selling STB’s.
Service revenue is recurring, while STB revenue is not. Management expects revenue from STB sales to have a much slower growth
rate than services revenue.
fairly low level of inventory because the Company is focused on providing end-to-end services as opposed to just selling STB’s.
Service revenue is recurring, while STB revenue is not. Management expects revenue from STB sales to have a much slower growth
rate than services revenue.
•Total current assets at December 31, 2009 were $17.8 million, a decrease of $15.5 million from the December 31, 2008 balance of $33.3
million. As mentioned earlier, the change is primarily due to a decrease in cash and cash equivalents of $14.4 million.
million. As mentioned earlier, the change is primarily due to a decrease in cash and cash equivalents of $14.4 million.
•Current liabilities at December 31, 2009 were $16.8 million, an increase of $1.6 million from the December 31, 2008 balance of $15.2
million. The change is primarily due to the fair value of the derivative liability of $1.4 million (which is a non-cash liability).
million. The change is primarily due to the fair value of the derivative liability of $1.4 million (which is a non-cash liability).
•The net working capital at December 31, 2009 was $964 thousand, a significant decrease from the December 31, 2008 net working
capital of $18.1 million. The decreased working capital is primarily due to funding operations of $11.7 million and the fair value of
the derivative liability of $1.4 million on December 31, 2009 (which is a non-cash liability).
capital of $18.1 million. The decreased working capital is primarily due to funding operations of $11.7 million and the fair value of
the derivative liability of $1.4 million on December 31, 2009 (which is a non-cash liability).
o Because the company used significant funds in 2009, it will need to generate positive cash flow going forward. If the Company
is unable to generate positive cash flow it is likely that additional capital will need to be raised to continue funding losses.
is unable to generate positive cash flow it is likely that additional capital will need to be raised to continue funding losses.
•The Company has no interest bearing debt as of December 31, 2009. In general, the Company’s balance sheet is fairly healthy, but the
liquidity position will be a critical component of NeuLion’s success going forward. If positive cash flow is not generated NeuLion
will need additional cash going forward.
liquidity position will be a critical component of NeuLion’s success going forward. If positive cash flow is not generated NeuLion
will need additional cash going forward.
Page | 34
H-34

Schedule 4 presents the income statements of NeuLion for the years ended December 31, 2007 through December 31, 2009. Presented in
schedule 5 are common size income statements for the Company for the same time periods.
schedule 5 are common size income statements for the Company for the same time periods.
Key Reported Income Statement Items11
Description
2009
200812
200713
Net Revenues
$28,093,677
$13,443,339
$7,810,711
Gross Profit
$13,706,525
$5,804,190
$2,306,457
Operating Expenses
$32,908,166
$16,830,832
$4,771,434
Total Other Income
$(439,280)
$(610,618)
$(2,050,782)
Net Income
$(19,640,921)
$(11,637,260)
$(4,515,759)
EBITDA
$(15,499,804)
$(10,064,768)
$(3,954,682)
In the following section of this report, the term “organic” refers to the period-over-period changes in NeuLion’s revenues and expenses,
excluding the revenues and expenses of INSINC, a business that was recently acquired by the NeuLion, and excluding Jump TV. This
allows for a better comparison of current year and prior year revenues and expenses, and to understand changes that have occurred, without
regard to the effect of the Merger or the acquisition of INSINC. Also, the term “Acquired Business” refers to Jump TV.
Please note that a set of proforma income statements for 2007 and 2008 presented as if NeuLion and Jump TV had merged on January 1,
2007 is shown after the discussion of the Company’s actual audited financial statements.
2007 is shown after the discussion of the Company’s actual audited financial statements.
Revenue
The Company’s revenue generation can be traced back to three major sources including Professional Sports, NCAA Sports, and
International/Ethnic Programming which account for the 16%, 30%, and 48% of the Company’s 2009 total revenue, respectively. However,
in more general terms, NeuLion’s revenue can be divided into service revenue and equipment revenue which is the focus of our financial
statement analysis.
International/Ethnic Programming which account for the 16%, 30%, and 48% of the Company’s 2009 total revenue, respectively. However,
in more general terms, NeuLion’s revenue can be divided into service revenue and equipment revenue which is the focus of our financial
statement analysis.
11 This information comes from audited financial statements contained in NeuLion 2009 10k, and Jump TV’s 2008 10K
12 The 2008 Income Statement includes the results of operations for Jump TV after the date of the acquisition in October, 2008.
13 The 2007 Income Statement does not include the results of Jump TV.
Page | 35
H-35

•
Service Revenue oServices revenue includes revenue from subscribers, eCommerce and technology services. Services revenue
increased from $9.5 million for the year ended December 31, 2008 to $26.5 million for the year ended December 31, 2009.
According to the Company’s 10K, the increase was due to the organic growth in services revenue, the effect of the Merger on
October 20, 2008 and the acquisition of INSINC effective October 31, 2009. The organic growth in the Company’s services revenue
was $5.6 million. The growth in the Acquired Business comprised $10.8 million, and INSINC comprised $0.6 million, of total
services revenue.
■ Subscriber revenue increased from $7.0 million for the year ended December 31, 2008 to $18.5 million for the year
ended December 31, 2009. The increase was due to the growth in subscribers, the effect of the Merger on October 20,
2008 and the acquisition of INSINC effective October 31, 2009. The organic growth in the Company’s subscriber
revenue was $4.5 million resulting from $4.0 million in revenue growth from the Company’s existing customers
coupled with $0.5 million in revenue generated from 15 new customers. The growth in the Acquired Business was
$6.7 million and INSINC comprised $0.3 million of total subscriber revenue for the year.
■ eCommerce revenue increased from $0.9 million for the year ended December 31, 2008 to $3.9 million for the year
ended December 31, 2009. The Acquired Business comprised all of eCommerce revenue for the year.
ended December 31, 2009. The Acquired Business comprised all of eCommerce revenue for the year.
■ Technology services revenue increased from $1.6 million for the year ended December 31, 2008 to $4.1 million for
the year ended December 31, 2009. The increase was due to organic growth in technology services revenue, the effect
of the Merger on October 20, 2008, and the October 31, 2009 effective date of the acquisition of INSINC. As new
customers begin streaming video or develop their user interface, the Company earns technology services revenue.
This revenue is recognized over the life of the contractual relationship. The organic growth in the Company’s
technology services revenue was$1.0 million. The growth in the Acquired Business was$1.2 million. INSINC
comprised $0.3 million of total technology services revenue for the year.
•
Equipment Revenue
o Equipment revenue decreased from $3.9 million for the year ended December 31, 2008 to $1.6 million for the year ended
December 31, 2009. The decrease in equipment revenue is a result of the uneven nature of the revenue stream. The
Company’s customers often place large single orders to meet minimum order requirements to manage the lead time between
ordering and shipping and to minimize the related shipping costs.
December 31, 2009. The decrease in equipment revenue is a result of the uneven nature of the revenue stream. The
Company’s customers often place large single orders to meet minimum order requirements to manage the lead time between
ordering and shipping and to minimize the related shipping costs.
Page | 36
H-36

Cost of Revenue
• Cost of services revenue increased from $4.5 million, or 47%, of services revenue for the year ended December 31, 2008 to $12.8
million or 49% of services revenue for the year ended December 31, 2009. This increase was due to the costs associated with
increased revenue, the effect of the Merger on October 20, 2008 and the acquisition of INSINC effective October 31, 2009. Cost of
services revenue for the Acquired Business increased by $5.9 million. INSINC comprised $0.3 million of total costs of services
revenue for the year.
• Organic cost of services revenue increased from $2.5 million or 39.7% of services revenue for the year ended December 31, 2008 to
$4.6 million or 39.0% of services revenue for the year ended December 31, 2009. The $2.1 million increase was a result of
additional costs relating to co-location and network fees in support of increased revenue. The 0.7% improvement (as a percentage
of services revenue) primarily relates to negotiated lower rates on bandwidth costs.
• Cost of equipment revenue decreased from $3.1 million for the year ended December 31, 2008 to $1.5 million for the year ended
December 31, 2009 on lower revenue. Cost of equipment revenue is directly variable with changes in equipment revenue. Cost of
equipment revenue as a percentage of equipment revenue increased from 80% for the year ended December 31, 2008 to 94% for the
year ended December 31, 2009 due to increased shipping costs related to TV-Desi and Talfazat rental STBs that generate no
equipment revenue.
Operating Expenses
• Operating Expenses increased from $14.2 million for the year ended December 31, 2008 to $28.8 million for the year ended
December 31, 2009. The Acquired Business accounted for $9.1 million of the total increase, INSINC accounted for $0.3 million and
the remaining increase of $5.2 million relates to the organic increase. The individual variances are due to the following:
December 31, 2009. The Acquired Business accounted for $9.1 million of the total increase, INSINC accounted for $0.3 million and
the remaining increase of $5.2 million relates to the organic increase. The individual variances are due to the following:
o Wages and benefits increased from $8.8 million for the year ended December 31, 2008 to $20.0 million for the year ended
December 31, 2009. The Acquired Business accounted for $6.5 million of the total increase of $11.2 million in wages and
benefits for the year. The organic increase of $4.5 million was primarily related to the increase in employees to support the
increased revenue and the Merger with the Acquired Business. In conjunction with the Merger, the Company added senior
management and provided market level compensation for the CEO. INSINC comprised $0.2 million of total wages and
benefits for the year.
Page | 37
H-37

o Stock-based compensation expense decreased from $1.8 million for the year ended December 31, 2008 to $1.2 million for the
year ended Decembeor 31, 2009. This decrease was the result of 5 million fully vested warrants being issued in the prior year.
year ended Decembeor 31, 2009. This decrease was the result of 5 million fully vested warrants being issued in the prior year.
o Marketing expenses increased from a $0.4 million for the year ended December 31, 2008 to $1.1 million for the year ended
December 31, 2009. The Acquired Business accounted for $0.5 million of the total increase of $0.7 million in marketing
expenses for the year. The Acquired Business is more of a business-to-consumer focused business and incurs higher
marketing expenses including search engine marketing and search engine optimization on the Internet.
o Professional fees increased from $1.2 million for the year ended December 31, 2008 to $1.7 million for the year ended
December 31, 2009. The increase was primarily related to professional fees incurred in connection with the acquisition of
INSINC.
December 31, 2009. The increase was primarily related to professional fees incurred in connection with the acquisition of
INSINC.
o Depreciation and amortization increased from $1.5 million for the year ended December 31, 2008 to $4.1 million for the year
ended December 31, 2009. The increase was due to amortization on assets acquired in the Merger ($1.9 million) and
amortization of the intangible assets acquired in the acquisition of INSINC.
ended December 31, 2009. The increase was due to amortization on assets acquired in the Merger ($1.9 million) and
amortization of the intangible assets acquired in the acquisition of INSINC.
o Other SG&A expenses increased from $2.0 million for the year ended December 31, 2008 to $4.8 million for the year ended
December 31, 2009. The Acquired Business accounted for $2.3 million of the total increase of $2.8 million for the year. The
organic increase of $0.5 million was primarily related to increases in bank and processing fees and corporate systems costs of
$0.4 million.
December 31, 2009. The Acquired Business accounted for $2.3 million of the total increase of $2.8 million for the year. The
organic increase of $0.5 million was primarily related to increases in bank and processing fees and corporate systems costs of
$0.4 million.
o It is important to note that the Company has never paid income taxes, because it has never generated positive net income.
Accordingly, the Company has a tax loss carry-forward available to offset future taxable income of $93.4 million as of
December 31, 2009 that expires between the tax years 2010 and 2029. If the Company is able to generate positive net income
in subsequent to 2009, the Company will record the benefit as a reduction in income tax expense.
Page | 38
H-38

Proforma Income Statements:
The table below presents the unaudited, combined proforma income statements for NeuLion and Jump TV, as if the two had been merged
since the beginning of 2007. Please note that the net loss of $92 million in 2008 is partially attributable to impairment charges totaling $54
million.
since the beginning of 2007. Please note that the net loss of $92 million in 2008 is partially attributable to impairment charges totaling $54
million.
NeuLion and Jump TV - Combined Proforma Income Statements14
2008
2007
Total revenue
$ 25,708,760
$16,785,370
Total cost of sales
$(18,836,212)
$(14,282,438)
Gross profit
$6,872,548
$2,502,932
Total sales, general and administrative
$(38,482,996)
$(32,487,244)
Stock-based compensation
$(3,374,767)
$(5,293,738)
Impairment of goodwill
$(47,882,317)
$-
Impairment of long-lived assets
$(5,982,030)
$-
Depreciation and amortization
$(3,602,169)
$(3,202,306)
Net loss
(92,459,364)
$(36,019,502)
14 This financial information is from NeuLion’s 2009 10K.
Page | 39
H-39

Financial Projections15
Management of NeuLion provided us with a financial forecast from 2010 through 2014 based on the Company’s operating history and
assumptions about new business going forward. Please note that the percentages in between the columns represent annual growth rates.
The breakdown below is an indication of the Company’s expected financial performance for 2010 - 2014, which is presented in greater
detail in Schedule 10. The Company used 2010 as a basis for forecasting years 2011 through 2014. Please refer to schedules 9 - 13 for
a detail of Management’s projection.
Description
2010
2011
2012
2013
2014
Net Revenues
$41,251,000
56%
$60,192,000
46%
$81,467,900
35%
$103,101,500
27%
$123,453,200
20%
Cost of Revenues
18,687,000
45%
25,514,450
37%
33,771,065
32%
41,622,318
23%
49,293,084
18%
Gross Profit
22,564,000
66%
34,677,650
54%
47,696,835
38%
61,479,182
29%
74,160,116
21%
Operation Expenses
28,691,000
0%
34,106,000
19%
41,107,000
21%
47,536,000
16%
52,509,000
10%
Depreciation
3,296,000
3,511,000
1,336,255
1,430,000
1,425,000
Amortization
2,328,524
2,216,000
2,216,167
1,984,916
796,631
Net Income
(11,751,524) n/a
(5,155,350) n/a
3,037,413
n/a
10,528,266
287%
19,429,485
86%
EBITDA
(6,127,000) n/a
571,650
n/a
6,589,835
1053%
13,943,182
112%
21,651,116
55%
• Total Revenue is forecast to increase from approximately $28 million as reported in 2009 to $41 million in 2010, representing a 56%
growth in revenue. Management has indicated that NeuLion is on pace to meet its 2010 forecast through the first quarter of 2010 as a
result of strong growth in service and equipment revenue. Subsequent to 2010, revenue is forecast to increase at a slower rate each
year, until it reaches $123 million in 2014. This resents a compound annual growth rate of 31.53%, which is consistent with the
industry forecasts presented in the industry analysis section of this report. Below is a breakdown of the various components of
revenue.
15 Note that these projections were provided by the management of NeuLion. We have not audited or rendered any opinion with respect to this prospective data. The
actual future results could be different than those forecasted by management and the difference could be material.
actual future results could be different than those forecasted by management and the difference could be material.
Page | 40
H-40

o Subscription: 33% Growth Rate for 2010
■ Subscription revenue is expected to grow in almost every segment from $18.5 million in 2009 to $24.7 million in
2010.
2010.
■ Substantial growth is expected in the INSINC, International (B2B), and Dish Network segments. Dish Network is
expected to generate approximately $600 thousand of additional subscriber revenue in 2010. Please refer to our section
on Dish Network for a full discussion.
expected to generate approximately $600 thousand of additional subscriber revenue in 2010. Please refer to our section
on Dish Network for a full discussion.
o E-Commerce: 40% Growth Rate for 2010
■ E-commerce, which contains advertising, merchandising, ticketing and auction revenue, is expected to have
significant growth from $3.9 million in 2009 to $5.5 million in 2010.
significant growth from $3.9 million in 2009 to $5.5 million in 2010.
■ The two fastest growing segments are advertising which is expected to increase 63%, and college networks which is
expected to increase at a 20% growth rate.
expected to increase at a 20% growth rate.
o Technology Services: 59% Growth Rate for 2010
■ Technology services revenue is expected to increase significantly from $4.0 million in 2009 to $6.2 million in 2010,
which is attributable to significant growth from INSINC and Dish Network. Please refer to our section on Dish
Network for a full discussion.
which is attributable to significant growth from INSINC and Dish Network. Please refer to our section on Dish
Network for a full discussion.
■ The Company is less aggressive on its outlook for most other technology service segments including Professional
Sports and Variety, Sky Angel and International.
Sports and Variety, Sky Angel and International.
o Equipment: 185% Growth Rate for 2010
■ Equipment revenue is expected to increase from $1.6 million in 2009 to $4.7 million in 2010.
■ The Company is expecting to substantially increase revenue from the sale of STB’s as a result of the recent agreement
with Dish Network, and growth with Sky Angel faith based programming. Please refer to our section on Dish Network
for a full discussion.
Page | 41
H-41

• Gross Margin
o The Company’s gross margin is forecast to increase from 55% in 2010 to 60% in 2014. The Company’s cost of goods sold is
forecast to decline as a percentage of revenue which is consistent with the Company’s historical performance. From 2007
through 2009, cost of revenue has fallen which has caused gross profit margins to increase each year from 30% in 2007 to
49% in 2009.
forecast to decline as a percentage of revenue which is consistent with the Company’s historical performance. From 2007
through 2009, cost of revenue has fallen which has caused gross profit margins to increase each year from 30% in 2007 to
49% in 2009.
• Operating Margin and EBITDA
o The Company’s operating expenses are forecast to increase from approximately $29 million in 2010 to $53 million by 2014.
This represents a slower growth rate than revenue and cost of goods sold, because a portion of the Company’s operating
expenses are fixed costs. As a result, the Company is forecast to generate positive EBITDA in 2011, which increases each
year thereafter to $22 million in 2014.
This represents a slower growth rate than revenue and cost of goods sold, because a portion of the Company’s operating
expenses are fixed costs. As a result, the Company is forecast to generate positive EBITDA in 2011, which increases each
year thereafter to $22 million in 2014.
Page | 42
H-42

Dish Network Analysis
Based on our analysis of Management’s projections for NeuLion, Inc. we performed additional due diligence on the portion of the
forecast related to Dish Network, which was previously discussed under the New Deals and Business Partners section of this report. As
part of our analysis, we set up two different scenarios to test the conservativeness of Management’s forecast. The first scenario, which
is the base case “Scenario A”, uses Management forecasts, while “Scenario B” uses more aggressive growth assumptions. The
assumptions and results of the forecasts are detailed below.
In Scenario A, we used Managements detailed projections for 2010 to model NeuLion’ subscriber revenue, set top box revenue, and
technology revenue from the agreement with Dish Network. In addition, we used Management’s assumptions about the cost of
revenues for each of these sources to develop a forecasted gross margin from 2010 through 2014. Accordingly, Scenario A is based on
Management’s assumption that there will be zero subscribers in the first quarter of 2010, an average of ******* in the second quarter, an
average of ******* in the third quarter, and an average of ******* in the fourth quarter. Subscription revenue for these subscribers was
based on a pricing structure that is summarized in the table below:
Number of Subscribers
Revenue Per Subscriber
******* subs or *******
*******
******* subs
*******
******* subs
*******
******* subs
*******
Accordingly, Management’s forecast assumes a total of ******* subscribers by the end of 2010, translating to subscriber revenue of
$615,000, and a gross profit of $480,000.
$615,000, and a gross profit of $480,000.
The next component of Management’s forecast is the sale of set top boxes to Dish, which is based on the following pricing structure:
Number of Set Top Boxes Revenue Per STB
******* STB's *******
*******
******* STB's
*******
******* STB's
*******
Page | 43
H-43

Accordingly, the revenue from set top box sales to Dish Network (assuming a 1 to 1 subscriber to STB relationship) was $2,785,500 in
2010, translating to a gross profit of $1,210,500.
2010, translating to a gross profit of $1,210,500.
The third and final piece of the forecast is the technology piece, which was estimated to have revenue of $183,000 and a gross margin
of $163,000 in 2010.
of $163,000 in 2010.
Accordingly, Management projected total revenues relating to the Dish Network agreement to be $3,583,500 for 2010 and a gross
profit of $1,853,500 for 2010.
profit of $1,853,500 for 2010.
Using Management’s 2010 projection, we increased the number of subscribers at the total revenue growth rate from 2011 through 2014
in Management’s forecast which is shown in the table below.
in Management’s forecast which is shown in the table below.
Scenario A:
Description
2010
2011
2012
2013
2014
NeuLion Total Revenue Growth Rates
45.92%
35.35%
26.55%
19.74%
Per Management Financial Forecast
Number of Subs Year End
*******
*******
*******
*******
*******
Annual Sub Revenue
$615,000
$1,877,250
$2,472,180
$3,104,681
$3,721,591
Annual STB Revenue
2,785,500
976,500
1,096,429
1,115,082
1,049,007
Annual Technology Revenue
183,000
233,000
184,000
180,000
180,000
Total Dish Revenue
$3,583,500
$3,086,750
3,752,609
$4,399,763
$4,950,598
Total Cost of Goods Sold
(1,730,000)
(1,120,512)
(1,314,824)
(1,445,274)
(1,536,623)
Gross Profit
$1,853,500
$1,966,238
$2,437,786
$2,954,488
$3,413,976
Based on the above analysis it is clear that the forecast is conservative, since the target of hitting ******* subscribers by the end of
2012 was not met and only the series D-1 and D2 warrants would be vested. Further, Management is assuming that even though Dish
Network would not have received ******* subscribers by the end of 2012 to exercise its option to renew the
contract, that Dish Network would choose to renew the contract anyway.
Page | 44
H-44

To show the sensitivity of NeuLion’s projections, we performed a Scenario B analysis which contains significantly more aggressive
growth assumptions.
growth assumptions.
It is important to note that since there is no history for this business plan by Dish Network, there is no true supportable basis to include
this aggressive projection in NeuLion’s forecasted results at this time.
this aggressive projection in NeuLion’s forecasted results at this time.
Using the same pricing structure and gross profit margin calculations for the three sources of business from the Dish Network deal, we
have updated the growth assumptions so that the Dish meet its level of subscribers by 2012 to renew the agreement. Scenario B is
summarized in the table below.
have updated the growth assumptions so that the Dish meet its level of subscribers by 2012 to renew the agreement. Scenario B is
summarized in the table below.
Scenario B:
Description
2010
2011
2012
2013
2014
NeuLion Total Revenue Growth Rates
90.00%
75.00%
50.00%
50.00%
Number of Subs Year End
*******
*******
*******
*******
*******
Annual Sub Revenue
$615,000
$2,167,313
$3,606,328
$ 5,494,008
$ 8,061,012
Annual STB Revenue
2,785,500
1,913,625
3,029,906
3,534,891
5,302,336
Annual Technology Revenue
183,000
233,000
184,000
180,000
180,000
Total Dish Revenue
$3,583,500
$4,313,938
$6,820,234
$9,208,898
$13,543,348
Total Cost of Goods Sold
(1,730,000)
(1,844,858)
(2,890,149)
(3,583,774)
(5,326,148)
Gross Profit
$1,853,500
$2,469,080
$3,930,085
$5,625,125
$8,217,199
As shown above, if the 150,000 subscriber threshold is met in 2014, then all of the Dish Network warrants would be vested, and the
gross margin in each year from 2011 through 2015 is increased significantly relative to Scenario A. Accordingly, if Management’s
forecast had utilized more aggressive assumptions it would have a positive impact on the Company’s value16.
gross margin in each year from 2011 through 2015 is increased significantly relative to Scenario A. Accordingly, if Management’s
forecast had utilized more aggressive assumptions it would have a positive impact on the Company’s value16.
16 It should be noted that more aggressive assumptions typically require a much higher discount rate to account for the significant risk associate with the probability of
achieving such aggressive results.
achieving such aggressive results.
Page | 45
H-45

The difference in gross profit margins between Scenario A and Scenario B is shown in the table below:
Description
2010
2011
2012
2013
2014
Scenario B Number of Subs
*******
*******
*******
*******
*******
Scenario A Number of Subs
*******
*******
*******
*******
*******
Cumulative Difference
*******
*******
*******
*******
*******
Scenario B Gross Profit
$1,853,500
$2,469,080
$3,930,085
$5,625,125
$8,217,199
Scenario A Gross Profit
1,853,500
1,966,238
2,437,786
2,954,488
3,413,976
Difference
$
-
$502,842
$1,492,299
$2,670,637
The impact of this difference on the value of NeuLion would be such that the range of value could increase by approximately $19 million on
the low end and approximately $28 million on the high end. It should be noted, that given the additional risk in achieving the higher number of
subscribers it is possible that the discount rate might be adjusted for the additional risk, and thus reduce the variance in value due to the
increase in forecasted subscribers.
subscribers it is possible that the discount rate might be adjusted for the additional risk, and thus reduce the variance in value due to the
increase in forecasted subscribers.
Page | 46
$4,803,223
H-46

Economic Outlook
Page | 47
H-47

In conjunction with our analysis of the fair market value of the Company, we reviewed the national economic condition at or around the
Valuation Date. The following is a summary of our findings.17
Valuation Date. The following is a summary of our findings.17
General Economic Conditions
The gross domestic product (GDP), the broadest measure of the U.S. economy, grew at a 5.7% annual rate in the fourth quarter of 2009. This
was the GDP’s fastest pace in more than six years. GDP growth this quarter was much stronger than some analysts had forecasted, as
economists surveyed by Briefing.com had forecasted growth at an annual rate of 4.7%. To many, this quarter’s economic growth provides
yet another sign that an economic recovery is taking hold. Although the GDP report does not mark an official end to the recession, two
straight quarters of economic growth is typically a sign of a recovery. Many economists agree that the recession ended at some point in the
middle of 2009.
Gross Domestic Product
The U.S. Department of Commerce reported that the nation's economy—as indicated by the GDP—increased at an annual rate of 5.7% in the
fourth quarter. The economy grew at a 2.2% annualized rate in the third quarter of 2009. The GDP is the total market value of goods and
services produced in the U.S. economy and is generally considered the most comprehensive measure of economic growth.
fourth quarter. The economy grew at a 2.2% annualized rate in the third quarter of 2009. The GDP is the total market value of goods and
services produced in the U.S. economy and is generally considered the most comprehensive measure of economic growth.
The fourth quarter increase in real GDP primarily reflected positive contributions from private inventory investment, exports, and personal
consumption expenditures. Imports, which are a subtraction in the calculation of GDP, increased. Despite this quarter’s growth, the
economy contracted by 2.4% in 2009. The economy grew by 0.4% and 2.1% in 2008 and 2007, respectively. Although the GDP declined
this year, the third and fourth-quarter figures signal that the worst is over to many economists.
The 2009 decrease in real GDP primarily reflected negative contributions from nonresidential fixed investment, exports, private inventory
investment, residential fixed investment, and personal consumption expenditures that were partly offset by positive contributions from
federal government spending.
investment, residential fixed investment, and personal consumption expenditures that were partly offset by positive contributions from
federal government spending.
17 Part of the contents of the economic outlook section of this valuation report are quoted from the Economic Outlook Update 4Q 2009 published by Business Valuation
Resources, LLC, reprinted with permission. The editors and Business Valuation Resources, LLC, while considering the contents to be accurate as of the date of
publication of the Update, take no responsibility for the information contained therein.
Resources, LLC, reprinted with permission. The editors and Business Valuation Resources, LLC, while considering the contents to be accurate as of the date of
publication of the Update, take no responsibility for the information contained therein.
Page | 48
H-48

Fixed Investments
Business spending, also known as nonresidential fixed investment, grew 2.9% in the fourth quarter. This is the first quarterly growth since
the second quarter of 2008. Business spending decreased 5.9% in the third quarter and 9.6% in the second quarter. Business spending
declined by 17.9% in 2009, after growing 1.6% and 6.2% in 2008 and 2007, respectively.
the second quarter of 2008. Business spending decreased 5.9% in the third quarter and 9.6% in the second quarter. Business spending
declined by 17.9% in 2009, after growing 1.6% and 6.2% in 2008 and 2007, respectively.
Business spending on structures (nonresidential structures) decreased 15.4% in the fourth quarter and 18.4% in the previous quarter. This is
the sixth consecutive quarterly decline. Business expenditures on equipment and software increased at an annual rate of 13.3% in the fourth
quarter—the largest increase since the first the first quarter of 2006.
the sixth consecutive quarterly decline. Business expenditures on equipment and software increased at an annual rate of 13.3% in the fourth
quarter—the largest increase since the first the first quarter of 2006.
Consumer Prices and Inflation Rates
Inflationary pressures were relatively tame during the fourth quarter of 2009. The Federal Open Market Committee (FOMC) stated in their
most recent release that they expect inflation to “remain subdued for some time.”
most recent release that they expect inflation to “remain subdued for some time.”
According to the U.S. Department of Commerce, the price index for gross domestic purchases, which measures prices paid by U.S. residents,
increased 2.1% in the fourth quarter. The price index for gross domestic purchases measures prices paid by U.S. residents. In the third
quarter, the index increased 1.3%. Excluding food and energy prices, the price index for gross domestic purchases increased by 1.2% in the
fourth quarter, compared with an increase of 0.3% in the third quarter.
Consumer spending, also known as personal consumption, continued to rise this quarter. Consumer spending increased 2.0% in the fourth
quarter after growing 2.8% in the third. Consumer spending declined 0.6% in 2009, after dropping 0.2% in 2008 and increasing 2.6% in
2007. Consumer spending on durable goods—items meant to last three or more years—decreased 0.9% in the fourth quarter after growing
20.4% in the third. The large increase in durable goods purchases last quarter largely reflected motor vehicle purchases under the Cash for
Clunkers program. Consumer spending on durable goods declined 4.0% in 2009, after decreasing 4.5% in 2008 and increasing 4.3% in 2007.
Energy Prices
As reported by the Energy Information Administration (EIA), the spot price for a barrel of West Texas Intermediate (WTI) crude oil was
$79.39 at the end of the fourth quarter, an increase from $70.46 per barrel at the end of the third quarter and $69.82 at the end of the second.
The regular retail gas price (conventional areas) was $2.56 per gallon at the end of the fourth quarter, compared with $2.43 per gallon at the
end of the third quarter and $2.59 per gallon at the end of the second. At their current prices, WTI crude oil and retail gas prices are
significantly higher then they were one year ago when the EIA reported that, at the end of the fourth quarter of 2008, the United States spot
price for a barrel of WTI crude oil was $44.60 and the regular retail gas price (conventional areas) was $1.59 per gallon.
Page | 49
H-49

Interest Rates
The Federal Open Market Committee (FOMC) met two times during the fourth quarter of 2009, issuing two statements on their target for the
federal funds rate. The federal funds rate is the interest rate at which a commercial bank lends immediately available funds in balances at
the Federal Reserve to another commercial bank.
federal funds rate. The federal funds rate is the interest rate at which a commercial bank lends immediately available funds in balances at
the Federal Reserve to another commercial bank.
At their first scheduled meeting this quarter (November 4), the FOMC decided to keep the target for the federal funds rate unchanged at a
range of 0% to 0.25%. The press release stated that the information received by the FOMC since their last meeting suggested that economic
activity continued to pick up, though conditions in financial markets were roughly unchanged. They noted that activity in the housing sector
has increased. Although household spending appeared to be increasing, the FOMC found that it is still constrained by ongoing job losses,
sluggish income growth, lower housing wealth, and tight credit. Although businesses are still cutting back on fixed investment and staffing,
they are doing so at a slower pace. Further, businesses continued to make progress in bringing inventory stocks into better alignment with
sales. The Committee also expected inflation to remain subdued.
Unemployment
The U.S. Department of Labor reported that the unemployment rate continued to climb in the fourth quarter. Unemployment averaged 10.0%
during the fourth quarter, up from 9.7% in the third quarter. The number of unemployed persons averaged 15.406 million in the fourth
quarter, up from an average of 14.895 million last quarter. At the start of the recession in December 2007, the number of unemployed
persons was 7.7 million, and the unemployment rate was 5.0%.
Among the unemployed, the number of long-term unemployed (those jobless for 27 weeks and over) continued to trend up, reaching 6.1
million. In December, 4 in 10 unemployed workers were jobless for 27 weeks or longer.
million. In December, 4 in 10 unemployed workers were jobless for 27 weeks or longer.
Stock Markets
Stocks continued to climb this quarter, with the major stock indexes ending the year with double-digit gains. December 31 marked the end of
what has been the worst calendar decade for stocks since the 1820s, when reliable stock-market records began, according to data compiled
by Yale University finance professor William Goetzmann. However, according to The Wall Street Journal, the rally from the stock market's
12-year low in March represents the strongest rebound since 1933. And it wasn't just big stocks that rallied. Encouraged by government
efforts to restart the financial system and stimulate the economy, investors who had fled from all but the very safest investments in 2008
dove back into the most volatile stocks and bonds, racking up big gains along the way, found The Wall Street Journal.
Page | 50
H-50

Going into 2010, the economy seems to be showing enough momentum that few investors fear a sudden dip back into recession, although
most still expect a slow recovery. The Wall Street Journal noted that the market continues to benefit from the Federal Reserve's pledge to
keep interest rates low for an "extended period" and the federal government's stimulus dollars that continue to pour into the economy. "We're
probably still only in the early stages of a potentially big economic recovery but I think it's probably not until well into next year [2010] that
investors begin to broadly recognize it," says Thomas Lee, U.S. equity strategist at J.P. Morgan Chase.
Bond Markets
Despite the stock market’s big gains in 2009, The Wall Street Journal reported that many individual investors remained skeptical. Between
March and the end of November, they pulled $13 billion out of U.S. stock mutual funds and poured $239 billion into bond funds, according
to Morningstar Inc. (although some of the money heading into bond funds reflected a shift out of money-market funds yielding essentially
zero).
March and the end of November, they pulled $13 billion out of U.S. stock mutual funds and poured $239 billion into bond funds, according
to Morningstar Inc. (although some of the money heading into bond funds reflected a shift out of money-market funds yielding essentially
zero).
The five-year Treasury ended the fourth quarter of 2009 with a yield of 2.69%, up from 2.31% at the end of the previous quarter. The 30-
day T-bill rate was at 0.04% at the end of the fourth quarter, down from 0.06% at the end of last quarter.
day T-bill rate was at 0.04% at the end of the fourth quarter, down from 0.06% at the end of last quarter.
Economic Outlook
According to Consensus Economics, Inc., publisher of Consensus Forecasts - USA, the real GDP is forecasted to increase at a rate of 3.0% in
the first quarter of 2010, then at a rate of 3.0% in the second quarter of 2010 (percentage change from previous quarter, seasonally adjusted
annual rates). They forecast real GDP to grow 2.9% in 2010, 3.1% in 2011, and 3.3% in 2012 (average percentage change on previous
calendar year). In the long term, they predict real GDP to grow by an average annual rate of 2.6% between 2015 and 2019. Every month,
Consensus Economics surveys a panel of prominent U.S. economic and financial forecasters for their predictions on a range of variables
including future growth, inflation, current account and budget balances, and interest rates.
According to the survey, consumer prices will increase 2.2% in 2010, 1.9% in 2011, and 2.0% in 2012. In the long term, Consensus
Forecasts - USA forecasts consumer prices will grow at an average annual rate of 2.4% between 2015 and 2019. They forecast producer
prices to increase 2.7% in 2010 and 1.8% in 2011. They also expect real disposable personal income to grow 2.0% in 2010 and 2.4% in
2011.
Forecasts - USA forecasts consumer prices will grow at an average annual rate of 2.4% between 2015 and 2019. They forecast producer
prices to increase 2.7% in 2010 and 1.8% in 2011. They also expect real disposable personal income to grow 2.0% in 2010 and 2.4% in
2011.
Page | 51
H-51

Interest rates on three-month Treasury bills and 10-year Treasury bonds will rise over the next year, according to the forecasters of
Consensus Forecasts - USA. According to the survey, the three-month Treasury bill rate will rise to 0.2% by the end of April 2010, then to
1.0% by the end of January 2011. They forecast the yield on the 10-year Treasury bond will rise to 3.8% at the end of April 2010, then to
4.4% by the end of January 2011. According to the survey, the three-month Treasury rate will average 3.3% between the years 2011-2014,
and 4.2% between the years 2015-2019. The 10-year Treasury bond yield is expected to average 4.9% between the years 2011-2014, and
5.5% between the years 2015-2019.
The 32 participants in The Livingston Survey released their newest predictions in December. The forecasters, who are surveyed by the
Federal Reserve Bank of Philadelphia twice a year, project real GDP to grow at an annual rate of 2.6% between 4Q 2009 and 2Q 2010. They
then expect GDP to increase at an annual rate of 3.0% between 2Q 2010 and 4Q 2010.
Federal Reserve Bank of Philadelphia twice a year, project real GDP to grow at an annual rate of 2.6% between 4Q 2009 and 2Q 2010. They
then expect GDP to increase at an annual rate of 3.0% between 2Q 2010 and 4Q 2010.
The Survey also noted that forecasts for the unemployment rate have been revised upward for 2010 and are expected to remain relatively
high through the end of next year. The forecasters expect the unemployment rate will rise to 10.3% by June 2010, up from their previous
estimate of 9.8%. They expect unemployment to drop slightly to 9.9% by December 2010.
high through the end of next year. The forecasters expect the unemployment rate will rise to 10.3% by June 2010, up from their previous
estimate of 9.8%. They expect unemployment to drop slightly to 9.9% by December 2010.
The forecasters in The Livingston Survey have increased their predictions for consumer price (CPI) inflation. They expect CPI inflation to
average 2.2% in 2010, up from the previous estimate of 1.7%. They predict CPI inflation will be 1.8% in 2011. Inflation (as measured by
the consumer price index) is predicted to average 2.4% over the next 10 years, slightly lower than the forecast of 2.5% reported in the prior
16 surveys, and thus representing the first change in expected inflation since the survey of December 2001. The Survey estimates producer
price (PPI) inflation will average 2.4% in 2010—up from the previous estimate of 1.3%—before averaging 2.2% in 2011.
The forecasters from the Survey have increased their previous projections for future S&P 500 values. They expect the S&P to rise to 1,155
by June 30, 2010 before climbing to 1,197 by December 31, 2010. They believe the S&P will end 2011 at 1,250.
by June 30, 2010 before climbing to 1,197 by December 31, 2010. They believe the S&P will end 2011 at 1,250.
Page | 52
H-52

Industry Outlook
Page | 53
H-53

Internet Protocol Television
Internet Protocol television (IPTV) is a system through which internet television services are delivered using the architecture and
networking methods of the Internet Protocol Suite over a packet-switched network infrastructure, e.g., the Internet and broadband
Internet access networks, instead of being delivered through traditional radio frequency broadcast, satellite signal, and cable television
(CATV) formats.
networking methods of the Internet Protocol Suite over a packet-switched network infrastructure, e.g., the Internet and broadband
Internet access networks, instead of being delivered through traditional radio frequency broadcast, satellite signal, and cable television
(CATV) formats.
IPTV services may be classified into three main groups: live television, time-shifted programming, and video on demand. It is
distinguished from general Internet-based or web-based multimedia services by its on-going standardization process (e.g., European
Telecommunications Standards Institute) and preferential deployment scenarios in subscriber-based telecommunications networks with
high-speed access channels into end-user premises via set-top boxes or other customer-premises equipment. 18
The “IPTV” phrase was coined in 1995 by the founders of Precept, who designed and built the first internet protocol video product.
Although IPTV was a major technological achievement its progress was held back by the lack of widespread consumer access to high
speed broadband. Now that Broadband is more prevalent, IPTV is gaining traction and the future prospects for the technology are
extremely promising.
Although IPTV was a major technological achievement its progress was held back by the lack of widespread consumer access to high
speed broadband. Now that Broadband is more prevalent, IPTV is gaining traction and the future prospects for the technology are
extremely promising.
According to research from Informa Telecoms & Media, the global IPTV market reached 29.7 million subscribers at the end of 2009,
which is up from 19.4 million at the end of 2008. However, widespread adoption of the technology is still slow, and is highly
concentrated in France, the United States, China, and South Korea.
which is up from 19.4 million at the end of 2008. However, widespread adoption of the technology is still slow, and is highly
concentrated in France, the United States, China, and South Korea.
IPTV has only 5% of the multichannel television market and less than 2% penetration of the world’s households. IPTV has gained
market share in markets where one or more competing forms of multichannel television are absent or weak such as Iceland, Qatar
Cyprus, Slovenia, Croatia, Estonia, Montenegro, and Greece. 19
market share in markets where one or more competing forms of multichannel television are absent or weak such as Iceland, Qatar
Cyprus, Slovenia, Croatia, Estonia, Montenegro, and Greece. 19
Although IPTV is only a small portion of the multichannel television market, it is clear that this is a high growth area. There are a
number of reasons that consumers are choosing IPTV services over traditional offerings such as cable and satellite. Consumers are
interested in less expensive service offerings, bundled services, new offerings, etc. These are broken down in the table below:
number of reasons that consumers are choosing IPTV services over traditional offerings such as cable and satellite. Consumers are
interested in less expensive service offerings, bundled services, new offerings, etc. These are broken down in the table below:
18 www.wikipedia.com
19 IPTV Gaining Traction Slowly But Surely, James Middleton, March 23, 2010 www.telecoms.com
Page | 54
H-54

Other reasons that consumers are switching to IPTV service is that television’s role is evolving from a passive experience to an
interactive, personalized experience. Consumers are no longer content to simply watch what is broadcast at a particular time. Instead,
the TV experience is being enhanced through digital recorders, video on demand, surfing the internet while watching TV, texting
and/or instant messaging while watching TV, interactive voting (example: American Idol).
Page | 55
H-55

The following table indicates the list of features that consumers find most appealing about the interactive television experience:
The most important feature in the market today is on-demand television and movie viewing. This has experience large gains in recent
years with both free and premium content offerings from service providers. It is logical that consumers would show preference for a
service that allows them to watch programming that conforms to their schedule. The challenge for service providers such as NeuLion
years with both free and premium content offerings from service providers. It is logical that consumers would show preference for a
service that allows them to watch programming that conforms to their schedule. The challenge for service providers such as NeuLion
Page | 56
H-56

is obtaining the on-demand rights for the content. The extent to which the content is monetized (advertising, subscription, sponsorship,
etc.) will impact the degree to which content owners are willing to release content.20
etc.) will impact the degree to which content owners are willing to release content.20
An IPTV Global Forecast published by the Multimedia Research Group in May, 2009 indicated that the number of global IPTV
subscribers will grow from 26.7 million in 2009 to 81 million in 2013, which equates to a compound annual growth rate of 32%. The
forecast continues to say that the size of the global IPTV market is $6.7 billion in terms of service revenue, which will grow to $19.9
billion by 2013, equating to a compound annual growth rate of 31%.
subscribers will grow from 26.7 million in 2009 to 81 million in 2013, which equates to a compound annual growth rate of 32%. The
forecast continues to say that the size of the global IPTV market is $6.7 billion in terms of service revenue, which will grow to $19.9
billion by 2013, equating to a compound annual growth rate of 31%.
Another forecast of the IPTV market, is the Cisco Visual Networking Index Forecast 2008-2013. This is a broader forecast that takes
into account various types of internet activity, but includes discrete projections for the IPTV market. The following bullet points
indicate some highlights from the Cisco forecast:
into account various types of internet activity, but includes discrete projections for the IPTV market. The following bullet points
indicate some highlights from the Cisco forecast:
• The sum of all forms of video (TV, video on demand, Internet, and P2P) will account for over 91 percent of global consumer
traffic by 2013.
traffic by 2013.
• Internet video alone will account for over 60 percent of all consumer Internet traffic in 2013.
• In 2013, Internet video will be nearly 700 times the U.S. Internet backbone in 2000. It would take well over half a million years
to watch all the online video that will cross the network each month in 2013. Internet video will generate over 18 exabytes per
month in 2013.
to watch all the online video that will cross the network each month in 2013. Internet video will generate over 18 exabytes per
month in 2013.
• Video communications traffic growth is accelerating. Though still a small fraction of overall Internet traffic, video over instant
messaging and video calling are experiencing high growth. Video communications traffic will increase tenfold from 2008 to
2013.
messaging and video calling are experiencing high growth. Video communications traffic will increase tenfold from 2008 to
2013.
• Real-time video is growing in importance. By 2013, Internet TV will be over 4 percent of consumer Internet traffic, and ambient
video will be 8 percent of consumer Internet traffic. Live TV has gained substantial ground in the past few years: globally, P2P
TV is now slightly over 7 percent of overall P2P traffic at over 200 petabytes per month.
video will be 8 percent of consumer Internet traffic. Live TV has gained substantial ground in the past few years: globally, P2P
TV is now slightly over 7 percent of overall P2P traffic at over 200 petabytes per month.
• Video-on-demand (VoD) traffic will double every two years through 2013. Consumer IPTV and CATV traffic will grow at a 53
percent CAGR between 2008 and 2013, compared to a CAGR of 40 percent for consumer Internet traffic.
percent CAGR between 2008 and 2013, compared to a CAGR of 40 percent for consumer Internet traffic.
20 IPTV and the Digital Home, 2009 Parks & Associates
Page | 57
H-57

Global Mobile Highlights
• Globally, mobile data traffic will double every year through 2013, increasing 66x between 2008 and 2013. Mobile data traffic
will grow at a CAGR of 131 percent between 2008 and 2013, reaching over 2 exabytes per month by 2013.
will grow at a CAGR of 131 percent between 2008 and 2013, reaching over 2 exabytes per month by 2013.
• Almost 64 percent of the world's mobile data traffic will be video by 2013. Mobile video will grow at a CAGR of 150 percent
between 2008 and 2013.
• Mobile broadband handsets with higher than 3G speeds and laptop aircards will drive over 80 percent of global mobile traffic by
2013. A single high-end phone (such as an iPhone or Blackberry) generates more data traffic than 30 basic-feature cell phones.
A laptop aircard generates more data traffic than 450 basic-feature cell phones.
2013. A single high-end phone (such as an iPhone or Blackberry) generates more data traffic than 30 basic-feature cell phones.
A laptop aircard generates more data traffic than 450 basic-feature cell phones.
Page | 58
H-58

The following table shows a breakdown of consumer internet traffic by segment and geography, forecasted out to 2013. It is clear that
Internet Video to PC and Internet Video to TV are the two highest growth areas:
Internet Video to PC and Internet Video to TV are the two highest growth areas:
Consumer Internet Traffic, 2008-2013
2008
2009
2010
2011
2012
2013
CAGR 2008-2013
By Sub-Segment (PB per month)
Web/Email
1,239
1,595
2,040
2,610
3,377
3,965
26%
File Sharing
3,345
4,083
5,022
6,248
7,722
9,629
24%
Internet Gaming
47
87
135
166
217
239
39%
Internet Voice
103
129
152
174
183
190
13%
Internet Video Communications*
36
57
94
160
239
354
58%
Internet Video to PC*
1,112
2,431
4,268
6,906
9,630
12,442
62%
Internet Video to TV*
29
149
381
1,004
1,711
2,594
146%
Ambient Video
110
224
634
1,332
2,089
2,715
90%
By Geography (PB per month)
North America
1,279
1,881
2,807
4,357
5,839
7,213
41%
Western Europe
1,622
2,177
2,989
4,333
5,841
7,450
36%
Asia Pacific
2,487
3,707
5,382
7,570
10,306
13,311
40%
Japan
268
421
614
905
1,172
1,415
39%
Latin America
165
270
437
655
921
1,243
50%
Central Eastern Europe
163
242
397
619
843
1,153
48%
Middle East and Africa
37
57
100
162
246
343
56%
Total (PB per month)
Consumer Internet traffic
6,020
8,755
12,726
18,601
25,168
32,129
40%
Source: Cisco VNI, 2009
*Video Communications: includes PC-based video calling, webcam viewing, and web-based video monitoring *Internet Video
to PC: free or pay TV or VoD viewed on a PC, excludes P2P video file downloads *Internet Video to TV: free or pay TV or
VoD delivered via Internet but viewed on a TV screen using a STB or media gateway
to PC: free or pay TV or VoD viewed on a PC, excludes P2P video file downloads *Internet Video to TV: free or pay TV or
VoD delivered via Internet but viewed on a TV screen using a STB or media gateway
Page | 59
H-59
The following table breaks down the consumer internet video to personal computer (in terms of petabytes), forecasted from 2008
through 2013.
through 2013.
"Internet Video to PC" refers to online video that is downloaded or “streamed” for viewing on a PC screen. It excludes peer-to-peer
downloads, and is distinct from Internet-delivery of video to a TV screen through a set-top box (STB) or equivalent device. Much of
the video viewed on PC is short-form content, and a large part of it is made up of free clips, episodes, and other content offered by
traditional content producers such as movie studios and television networks.
Consumer Internet Video to PC, 2008-2013
2008
2009
2010
2011
2012
2013
CAGR 2008-2013
By Geography (PB per month)
North America
246
579
1,063
1,830
2,345
2,744
62%
Western Europe
183
396
715
1,276
1,960
2,840
73%
Asia Pacific
608
1,263
2,095
3,126
4,382
5,585
56%
Japan
23
62
120
189
251
306
68%
Latin America
34
82
151
242
348
468
68%
Central Eastern Europe
15
41
99
189
259
374
90%
Middle East and Africa
4
9
25
53
84
124
101%
Total (PB per month)
Consumer Internet video to PC
1,112
2,431
4,268
6,906
9,630
12,442
62%
Source: Cisco VNI, 2009
Page | 60
H-60

The following table breaks down the consumer internet video to television (in terms of petabytes), forecasted from 2008 through 2013.
"Internet Video to TV" includes video delivered via Internet to a TV screen, by way of an Internet-enabled set-top box or equivalent
device. Examples of devices now available include Microsoft's Xbox 360 and the Roku digital video player, through which users can
download film and television content.
device. Examples of devices now available include Microsoft's Xbox 360 and the Roku digital video player, through which users can
download film and television content.
Consumer Internet Video to TV, 2008-2013
2008
2009
2010
2011
2012
2013
CAGR 2008-2013
By Geography (PB per month)
North America
3
56
146
444
789
1,233
234%
Western Europe
10
23
86
217
371
553
124%
Asia Pacific
5
19
40
101
200
327
134%
Japan
9
41
85
183
252
330
106%
Latin America
0
1
2
7
16
28
232%
Central Eastern Europe
2
9
21
49
75
111
120%
Middle East and Africa
0
1
2
5
8
13
180%
Total (PB per month)
Consumer video to TV
29
149
381
1,004
1,711
2,594
146%
Source: Cisco VNI, 2009
According to the IPTV industry forecasts illustrated above, the IPTV market is poised for tremendous growth. Now that consumer
access to broadband is prevalent, acceptance of IPTV as a media source will continue to increase. NeuLion’s strategy is to leverage its
partnerships with high profile organizations such as the NFL, NHL, and NCAA to continue as a major player in the sports market.
Also, the Company should be able to continue its growth through its competitive advantage of providing end-to end service.
Page | 61
H-61

Valuation Analysis
Page | 62
H-62

Valuation Methods
The approaches considered to develop a value for the Company in this engagement were:
■
The Asset Approach
o The asset approach, sometimes referred to as the “cost” approach, is a general way of determining a value indication of a
business, business ownership interest, or security using one or more methods based on the value of the assets net
liabilities. Each asset and liability of the business is valued separately and then summed up to produce the total value
of the business. This method is most commonly used for investment or holding companies that do not have ongoing
operations of their own. It may also be used for operating businesses that are not profitable or only marginally
profitable. Generally, this method is not the most appropriate method for valuing a profitable, operating business.
business, business ownership interest, or security using one or more methods based on the value of the assets net
liabilities. Each asset and liability of the business is valued separately and then summed up to produce the total value
of the business. This method is most commonly used for investment or holding companies that do not have ongoing
operations of their own. It may also be used for operating businesses that are not profitable or only marginally
profitable. Generally, this method is not the most appropriate method for valuing a profitable, operating business.
■
The Market Approach
o The market approach is a general way of determining a value indication of a business, business ownership interest,
security, or intangible asset by using one or more methods that compare the subject to similar businesses, business
ownership interests, securities, or intangible assets that have been sold. This approach, however, can be difficult to
utilize for small, closely held businesses because guideline and other market directed indicators are scarce and reliable
information can be difficult to obtain. Nonetheless, this approach can and should be used to a limited degree for private
businesses, when sufficient relevant market data exists.
security, or intangible asset by using one or more methods that compare the subject to similar businesses, business
ownership interests, securities, or intangible assets that have been sold. This approach, however, can be difficult to
utilize for small, closely held businesses because guideline and other market directed indicators are scarce and reliable
information can be difficult to obtain. Nonetheless, this approach can and should be used to a limited degree for private
businesses, when sufficient relevant market data exists.
■
The Income Approach
o The income approach is a general way of determining a value indication of a business, business ownership interest,
security, or intangible asset by using one or more methods to convert anticipated economic benefits into a present single
amount. This approach assumes that the investor could invest in a property with similar investment
characteristics, although not necessarily the same business. The computations under this approach generally determine
that the value of the business is equal to the expected future income or cash flows divided by a required rate of return
(which is based upon the relative risk of the investment).
security, or intangible asset by using one or more methods to convert anticipated economic benefits into a present single
amount. This approach assumes that the investor could invest in a property with similar investment
characteristics, although not necessarily the same business. The computations under this approach generally determine
that the value of the business is equal to the expected future income or cash flows divided by a required rate of return
(which is based upon the relative risk of the investment).
Page | 63
H-63

As indicated previously in this report, the three approaches of valuation considered are (1) the asset approach, (2) the income
approach, and (3) the market approach. We also investigated whether there were any other published industry methods for valuing this
type of business. The narrative that follows discusses our consideration of each approach and the method ultimately used to value the
Company.
approach, and (3) the market approach. We also investigated whether there were any other published industry methods for valuing this
type of business. The narrative that follows discusses our consideration of each approach and the method ultimately used to value the
Company.
As described above, the asset approach arrives at value by determining the fair market value of each individual asset and liability of
the Company and then accumulating the total value of the net assets.
the Company and then accumulating the total value of the net assets.
An asset-based approach is most appropriate when valuing an investment or real estate holding company, or a business appraised on a
basis other than as a going concern. It is not normally used to value a profitable operating company because it does not consider the
ongoing earnings capacity of the Company. Accordingly, we did not use the asset approach to value NeuLion.
basis other than as a going concern. It is not normally used to value a profitable operating company because it does not consider the
ongoing earnings capacity of the Company. Accordingly, we did not use the asset approach to value NeuLion.
The market approach is an objective way to establish the fair market value of a business, when sufficient comparable market activity
can be identified and relevant financial information about the transactions can be obtained. When using the market approach, the
valuator identifies actual market transactions (referred to as “guidelines” or “comparables”), derives ratios from those transactions, and
then applies the ratios to the subject company to derive its fair market value. One method used under the market approach utilizes
valuation multiples based on information derived from minority shares of publicly traded guideline companies, while a second method
utilizes recent transactions involving the sale of companies similar in nature to the subject company. Both of these methods were
utilized in our analysis of NeuLion.
The following section of the report begins with a discussion of the Income Approach, which is followed by the guideline public
company method and transaction method under the market approach.
company method and transaction method under the market approach.
Income Approach
Discounted Cash Flow Method
A discussion of the Company’s projected financial performance, as presented in Schedule 11, was presented in a previous section of
this report. Additional adjustments were made to adjust NeuLion’s projected EBITDA to net cash flow, which represents the cash
available to debt and equity holders of the Company as detailed on Schedule 14.
this report. Additional adjustments were made to adjust NeuLion’s projected EBITDA to net cash flow, which represents the cash
available to debt and equity holders of the Company as detailed on Schedule 14.
Our analysis begins with pre-tax income, from which no income tax was deducted due to the Company’s NOL carryforward of $93
million that has accumulated since the Company’s inception. The Company has the option to apply its $93,170,139 NOL carryforward
against future income until it has been exhausted or upon expiration. The NOL carryforward does not begin to expire until 2026 ($198
million that has accumulated since the Company’s inception. The Company has the option to apply its $93,170,139 NOL carryforward
against future income until it has been exhausted or upon expiration. The NOL carryforward does not begin to expire until 2026 ($198
Page | 64
H-64

thousand income tax allowance will expire in 2010, because the Company is not expected to generate a profit).21
Depreciation is added back based on the depreciation of its fixed assets, in addition to expected depreciation from future capital
expenditures. Amortization based on the current amount of intangible assets (trademarks and customer relationships) was also added
back according to estimates in the Company’s audited financial statements.
expenditures. Amortization based on the current amount of intangible assets (trademarks and customer relationships) was also added
back according to estimates in the Company’s audited financial statements.
Next, Management’s estimate of capital expenditures was deducted from cash flow, representing additional assets that will be needed
to grow operations and replace fixed assets currently in use. The 2010 estimate was based on Management’s specific estimates, and
subsequent periods were estimated based on a percentage of revenue. It should be noted that the Company’s capital expenditures are
expected to be relatively low.
to grow operations and replace fixed assets currently in use. The 2010 estimate was based on Management’s specific estimates, and
subsequent periods were estimated based on a percentage of revenue. It should be noted that the Company’s capital expenditures are
expected to be relatively low.
Finally, additions to the Company’s net working capital position were subtracted to estimate the additional working capital necessary
to fund the Company’s operations. In 2010, the Management estimated that it would require approximately $12 thousand of additional
working capital. Subsequent to 2010, Management estimated that NeuLion will need to supplement its working capital position to
maintain a working capital balance equal to approximately 2.5% of revenue. After this adjustment, the resulting projected cash flow
represents the cash flow available to debt and equity holders of the Company, which must be discounted back to present value based
on the Company’s weighted average cost of capital, which is discussed below.
We have calculated a discount rate using the build-up method. The components of the discount rate include a risk-free rate, an equity
risk premium, a small size premium, an industry premium, and a company specific risk premium.
risk premium, a small size premium, an industry premium, and a company specific risk premium.
The risk-free rate is the return that an investor would require, at a bare minimum, to invest in an extremely safe investment. In this
particular instance, the yield for 20-year Constant Maturity U.S. Treasury Bonds is used as an indication of the risk-free rate. This rate
as of March 31, 2009 is 4.55%. Added to the risk-free rate is an equity risk premium, which represents the premium that common
stockholders required in the public market place over investors in long-term government bonds. The appropriate equity risk premium
has been determined based on several different sources of data. One source, an ongoing study published by Morningstar known as
Ibbotson SBBI 2009 Valuation Yearbook (“SBBI”), indicates that the market expected equity risk premium of common stock returns
over long-term government bond returns for the period 1926 through 2008 is 5.73%, which is the supply-side equity risk premium. The
SBBI analyses make extensive use of the rate of return databases compiled by the Center for Research in Security Prices at the
University of Chicago, Booth School of Business.
Next, a small size premium of 5.81% was added for the risks associated with small companies that fall within the 10th decile of all
common stocks ranked by market capitalization. Additionally, a negative risk adjustment of (0.19%) was subtracted based on the
common stocks ranked by market capitalization. Additionally, a negative risk adjustment of (0.19%) was subtracted based on the
21 Valuation of the NOL benefit assumes there is no change of control.
Page | 65
H-65

industry premium for SIC 84, representing companies in the Cable and Other Pay Television Services as published by the SBBI 2009
Yearbook. The total of the equity risk premium, size premium, and negative industry premium is 11.35%.
Yearbook. The total of the equity risk premium, size premium, and negative industry premium is 11.35%.
The final component encompasses the subject company’s specific risk factors that have not already been captured in the previous
equity risk premiums. This risk premium takes into consideration the detailed analysis performed by the valuation analyst, including
factors such as the company’s management structure, the ability of the company to raise capital, and other unique risks relating to the
subject company. Based on our understanding of NeuLion, we estimate these specific risks to require an additional 4.00% return. This
specific company risk premium was based on consideration of the following factors:
• Competition: NeuLion’s competitive advantage is the end-to-end suite of services that it is able to offer its partners. However, the
Company does have significant competition in the industry, and it is likely that more players will enter the market due to
substantial growth forecasts for IPTV. This is seen as an additional risk factor in our analysis of company specific risk.
Company does have significant competition in the industry, and it is likely that more players will enter the market due to
substantial growth forecasts for IPTV. This is seen as an additional risk factor in our analysis of company specific risk.
• Financial Strength: The Company’s has a reasonably healthy balance sheet as of the Valuation Date, but the working capital
position is a point of concern because the Company has burned a significant amount of cash in its development stages. The
Company will need to generate positive cash flow going forward in order to have sufficient working capital to support
operations. This is viewed as an additional risk factor in our analysis.
• Management Depth: The Company has put together a savvy management team that has a strong track record in the industry. As
previously mentioned, the Company is looking to add seasoned professionals to drive revenue growth, but NeuLion has
excellent leadership. This is seen as a neutral risk factor in our analysis.
previously mentioned, the Company is looking to add seasoned professionals to drive revenue growth, but NeuLion has
excellent leadership. This is seen as a neutral risk factor in our analysis.
• Profitability & Stability of Earnings: This is a significant risk factor because the Company has not yet generated positive cash flow
in its short operating history. Although the Company is forecasting positive cash flow in 2011, this factor is seen as an
additional risk factor in our analysis.
in its short operating history. Although the Company is forecasting positive cash flow in 2011, this factor is seen as an
additional risk factor in our analysis.
• Economic Factors: The global economic downturn had a negative impact on nearly every industry; however NeuLion was able to
increase its revenue each year from 2007 through 2009. Given the cautiously optimistic economic outlook, the economic
environment is viewed as a neutral risk factor in our analysis.
increase its revenue each year from 2007 through 2009. Given the cautiously optimistic economic outlook, the economic
environment is viewed as a neutral risk factor in our analysis.
The sum of the components discussed above result in an after-tax cost of equity of 19.90%.
We estimated the Company’s cost of debt to be 5.36%, based on the Company’s estimated cost of borrowing and application of the
Company’s estimated income tax rate of 33%, which is the combined basic Canadian Federal and Provincial Statutory Tax Rate.
Company’s estimated income tax rate of 33%, which is the combined basic Canadian Federal and Provincial Statutory Tax Rate.
We then derived a weighted average cost of capital for the Company of 18.0% using these rates and a capital structure consisting of
10% debt to total capital.
10% debt to total capital.
Page | 66
H-66

The weighted average cost of capital derived above, is appropriate to use as a discount rate for converting projected future cash flows
to a present value. In the case of NeuLion, cash flows were projected by management from 2010 until 2014, with an additional
terminal period which incorporates the Company’s long term financial performance beyond the length of the discrete forecast. Since
the valuation date is March 31, 2010, the negative cash flow projected to be realized during the first quarter of 2010 was added back,
so that the projected period for 2010 runs from April 1 to December 31. The present value of the Company’s projected cash flows for
2012 through 2014 was determined to be $14.0 million, as reflected in Schedule 14.
Additionally, we performed an analysis of the exit multiple that the Company would be able to achieve at the end of the discrete
forecast period based. Terminal year EBITDA was determined for low, middle, and high scenarios using a long term growth rate of
15%. The terminal year EBITDA figures were then multiplied by EBITDA exit multiples of 6x, 8x, and 10x EBITDA. The resulting
terminal values under each scenario were then discounted to present value.
After the addition of the Company’s equity interest in KyLinTV, and the present value of its Net Operating Loss carryforward, the
present value of all cash flows from management’s discrete projection and exit multiples yielded a total value of invested capital under
the low, middle, and high scenarios of $105 million, $130 million, and $154 million, respectively. Since the Company has no interest
bearing debt on its balance sheet, this is also the value of equity. This information is summarized in the table below:
Terminal Value Range - EBITDA Multiples
Source / Comments
Derivation of Terminal Value
Low
Mid
High
Terminal Year EBITDA
$
24,898,783
$
24,898,783
$
24,898,783
2015 EBITDA plus terminal growth of 15%
Terminal Year Exit Multiple
6.0
8.0
10.0
TERMINAL VALUE
$
149,392,698
$
199,190,264
$
248,987,830
Derivation of Value
Sum of Present Values of Cash Flow During Projection Period
$
14,033,132
$
14,033,132
$
14,033,132
Present Value of Terminal Value
73,931,458
98,575,278
123,219,097
Present Value of NOL
8,992,860
8,992,860
8,992,860
See Schedule 16.
Value of Equity Interest in KyLinTV
8,080,000
8,080,000
8,080,000
See Schedule 15.
Value of Total Invested Capital
$
105,037,450
$
129,681,270
$
154,325,089
- Interest Bearing Debt
-
-
-
VALUE OF EQUITY CAPITAL
$
105,037,450
$
129,681,270
$
154,325,089
VALUATION INDICATION:
Rounded to Nearest:
DISCOUNTED FUTURE CASH FLOW VALUATION
$
105,035,000
$
129,680,000
$
154,325,000
$5,000
Page | 67
H-67

Public Guideline Company Method
Under this method, the valuator attempts to locate publicly traded companies that are similar to the subject company in order to make a
comparison of value. To apply this method, we first asked Management if they were aware of any public companies that were either
competitors or otherwise similar to NeuLion. Management indicated that there were no true comparables. However, Management
used KIT Digital as a public guideline company for their annual impairment testing for financial reporting purposes. A description of
KIT Digital is contained in the Description of Guideline Public Companies section of this report.
We also conducted a computerized database search for publicly traded companies that might be considered comparable to the
Company. We conducted our computerized search looking for guideline companies using the Capital IQ database, based on the
following screening criteria:
Company. We conducted our computerized search looking for guideline companies using the Capital IQ database, based on the
following screening criteria:
• Company Type: Public
• Industry Classification: Telecommunications and/or Internet Protocol Television (IPTV)
Based on the above search criteria and screening of companies, we found a number of potential guideline companies that we presented
to Management. Ultimately, we determined that the following companies were most comparable to NeuLion:
to Management. Ultimately, we determined that the following companies were most comparable to NeuLion:
Guideline Company
Ticker
Logo
Kit Digital, Inc.
KITD
Espial Group, Inc.
TSX:ESP
BigBand Networks, Inc.
BBND
SeaChange International Inc.
SEAC
DivX, Inc.
DIVX
Real Networks Inc.
RNWK
Akamai Technologies Inc.
AKAM
Page | 68
H-68

It is important to note that NeuLion has not generated positive net income; earnings before interest and taxes (“EBIT”); or earnings
before interest, taxes, depreciation, and amortization (“EBITDA”) in 2009, or any other year since its inception. Further, revenues
based off of book value and asset values are not meaningful indications of value in the technology sector. As a result, the only useful
guideline public company multiple is the invested capital to revenue multiple.
To determine the high end of the range of value for the guideline public company approach, we analyzed Akamai Technologies, Inc.
which reported an invested capital to revenue multiple of approximately 6.4. Based on our analysis of Akamai, we determined that it
was much larger and more profitable than NeuLion, so we made an adjustment to lower the invested capital to revenue multiple from
approximately 6.4 to 4.5. This also ended up being in the same range as the multiple for KIT Digital at 4.41. This adjusted invested
capital to revenue multiple was applied to NeuLion’s fiscal year end revenues of $28 million, resulting in a value of invested capital of
$126,421,547. The Company has no interest bearing debt as of March 31, 2009, so the resulting value of invested capital is equal to the
value of equity.
To determine the low end of the range of value for the guideline public company approach, we analyzed the average of all guideline
public companies’ invested capital to revenue multiples. In our analysis, we used the adjusted multiple of 4.5 for Akamai to calculate
this average invested capital to revenue multiple, which was determined to be 2.49. This was applied to NeuLion’s calendar year end
revenues of $28 million, resulting in a value of invested capital of $69,953,256. The Company has no interest bearing debt as of March
31, 2009, so the resulting value of invested capital is equal to the value of equity.
Next, a control premium was added to the value of operating equity to reflect the premium paid for a controlling ownership interest. To
determine this premium we used data from Mergerstat and their Broadcasting and Communications industry groups. Finally, the value
of NeuLions’s equity interest in KyLin TV was added to arrive at the adjusted value of equity of $92,025,000 for the low end of the
range, and $159,785,000 for the high end of the range. These calculations are shown in detail on the following page.
Page | 69
H-69

Invested Capital to Revenue
Derivation of Market Multiples
Low
High
Notes / Comments
Market Multiples
2.760
6.430
See Schedule 25.
- Adjustment
(0.270)
(1.929)
Market Multiples
2.49
4.50
Invested Capital to Revenue
Derivation of Value
Low
High
Adjusted Financial Measures
$
28,093,677
$
28,093,677
NeuLion 2009 Revenue.
x Market Multiple
2.49
4.50
See above.
Capitalized Value: Total Invested Capital
69,953,256
126,421,547
- Interest Bearing Debt
-
-
NeuLion has no interest bearing debt.
Value of Equity Capital
$
69,953,256
$
126,421,547
Rounded to Nearest:
Control Premium
20%
13,990,651
25,284,309
$1,000
VALUE OF EQUITY CAPITAL
83,943,907
151,705,856
+ Value of Equity Interest in KyLin TV
8,080,000
8,080,000
See Schedule 15.
Adjusted Value of Equity Capital
$
92,023,907
$
159,785,856
INDICATION OF VALUE:
Rounded to Nearest:
5,000
GUIDELINE COMPANY VALUATION
$
92,025,000
$
159,785,000
Page | 70
H-70

Merged and Acquired Company Method
The merged and acquired company method uses information derived from transactions involving the purchase or sale of similar
businesses. The type and quality of information relating to market transactions is not comprehensive. Private databases, as well as
other industry sources were researched. Information regarding selected transactions is then assembled, analyzed, and multiples are
determined using this data. Transaction announcements do not always provide sufficient information to be used in a valuation analysis.
Typically, a revenue or earnings multiple may be all that is available. These multiples are then applied to the corresponding data for the
Company to determine a market value.
We conducted a computerized database search of several databases for guideline transactions based on the following screening criteria:
• Transaction Type: Merger or Acquisition
• Industry Classification: Telecommunications and/or Internet Protocol Television (IPTV)
Based on the above search criteria and screening of companies, we found a number of potential transactions. However, due to the lack
of information and differences in scope of operations, the list of transactions was reduced to the following:
of information and differences in scope of operations, the list of transactions was reduced to the following:
1. Permira Advisers Ltd. and News Corp. (NYSE: NWS.A) made an offer to acquire 28% of the series A common stock of NDS
Group plc (NASDAQGS: NNDS) for $1.026.4 billion in cash on June 27, 2008. A description of the target and the valuation
fundamentals are below.
Group plc (NASDAQGS: NNDS) for $1.026.4 billion in cash on June 27, 2008. A description of the target and the valuation
fundamentals are below.
a. NDS Group Ltd. develops and provides open end-to-end digital technology and services to digital pay-television
platform operators and content providers. It offers VideoGuard, a conditional access and digital rights management
technology that provides security solutions in PCs, mobile handsets, removable media, and portable media players; PC
Show, a solution that enables pay-TV and telecom operators to offer video entertainment services on PCs; VideoGuard
Express, a solution designed for entry-level satellite or cable operators; and RadioGuard, an in-band on-channel solution
that enables digital multicast and multi-channel broadcasting for HD radio. It also provides MediaHighway, a
middleware for set top boxes (STBs) and digital video recorders (DVRs) that enables a host of services for subscribers;
XTV, a DVR technology; electronic program guides(EPGs); advertising solutions that improve audien ce
measurement, addressability, and interactivity in zapping and fragmentation; home networking solutions; and Unified
Headend that enables operators to centrally control content delivery to multiple platforms over multiple networks. In
addition, it offers iTV interactive infrastructure and tools that enable customers to create revenue-generating interactive
TV applications, such as voting, shopping, and TV games. Further, it provides STB specification, verification, and
Page | 71
H-71

integration; systems integration and vendor management; interactive TV consulting; EPG design; and DVB service
information management services. It offers solutions for satellite, cable, IPTV, terrestrial, and mobile networks, as well
as hybrid systems, which combine broadcast and IP.
information management services. It offers solutions for satellite, cable, IPTV, terrestrial, and mobile networks, as well
as hybrid systems, which combine broadcast and IP.
Implied Market Value of Invested Capital (“MVIC”)
3,665.85
($USDmm, Historical rate):
Implied Equity Value ($USDmm, Historical rate):
3,665.85
Implied MVIC/Revenues:
4.31
Implied MVIC/EBITDA:
17.1
Implied Equity Value/LTM Net Income:
22.90
Implied Equity Value/Book Value:
3.94
2. Amino Technologies Plc (AIM: AMO) acquired 100% of AssetHouse Technology Ltd. for £1.4 million (US$2.74 million) on a
debt-free basis, payable in cash on June 10, 2008. A description of the target and the valuation fundamentals are below.
debt-free basis, payable in cash on June 10, 2008. A description of the target and the valuation fundamentals are below.
a. AssetHouse Technology Limited designs, develops, and delivers digital proposition management solutions for on-
demand entertainment providers. It offers AssetFactory platform, an on-demand proposition management software
application that handles digital product life cycle from content acquisition, contract management , proposition
development, and promotion to delivery to the end customer. The company serves network operators, content
producers, Web TV firms, IPTV service providers, and broadcasters.
Implied MVIC ($USDmm, Historical rate):
2.74
Implied Equity Value ($USDmm, Historical rate):
2.74
Implied MVIC/Revenues:
3.50
3. Tsinghua Tongfang Co. Ltd. (SHSE: 600100) agreed to acquire a 22.82% stake in BesTV from Shanghai Tongwei Investment
Company for CNY 100 million (US$ 14.0 million) on February 27, 2008. A description of the target and the valuation
fundamentals are below.
Company for CNY 100 million (US$ 14.0 million) on February 27, 2008. A description of the target and the valuation
fundamentals are below.
Page | 72
H-72

a. BesTV Network Television Technology Development Co., Ltd., a media company, engages in the IPTV business in
China. The company was founded in 2005 and is based in China.
China. The company was founded in 2005 and is based in China.
Implied MVIC ($USDmm, Historical rate):
61.34
Implied Equity Value ($USDmm, Historical rate):
61.34
Implied Enterprise Value/Revenues:
6.80
NeuLion has not generated positive net income; earnings before interest and taxes (“EBIT”); or earnings before interest, taxes,
depreciation, and amortization (“EBITDA”) in 2009, or any other year since its inception. Further, multiples of revenue were the only
multiples available for four of the five transactions. As a result, the only useful transaction multiple is the price to revenue multiple of
the transactions.
depreciation, and amortization (“EBITDA”) in 2009, or any other year since its inception. Further, multiples of revenue were the only
multiples available for four of the five transactions. As a result, the only useful transaction multiple is the price to revenue multiple of
the transactions.
Based on our analysis of these three transactions, we developed a range of total invested capital to revenue multiples of 4.3 to 6.8.
When these figures are applied to NeuLion’s fiscal year end revenue of $28 million, the resulting values of invested capital are
$128,885,000 and $199,115,000. Because the Company has no interest bearing debt as of the Valuation Date, these values also
represent the value of operating equity. Finally, the value of the Company’s equity interest in KyLin TV was added to arrive at the
total value of equity, which was rounded to $128,885,000 for the low, and $199,115,000 for the high end of the range as shown in the
chart below.
Description
Invested Capital to Revenue
Notes / Comments
Low
High
Adjusted Financial Measure
$
28,093,677
$
28,093,677
NeuLion 2009 Revenue.
x Market Multiple
4.3
6.8
See Schedule 27.
Capitalized Value: Total Invested Capital
120,802,811
191,037,004
- Interest Bearing Debt
-
-
NeuLion has no interest bearing debt.
Value of Equity Capital
$
120,802,811
$
191,037,004
+ Value of Equity Interest in KyLin TV
8,080,000
8,080,000
See Schedule 15.
Adjusted Value of Equity Capital
$
128,882,811
$
199,117,004
INDICATION OF VALUE:
Rounded to Nearest:
MERGER AND ACQUISITION VALUATION
$
128,885,000
$
199,115,000
$5,000
Page | 73
H-73

CONCLUSION OF RANGE OF VALUE
As of the Valuation Date of March 31, 2010, the fair market value of the total invested capital of the NeuLion (the “Business Value”) is estimated
to be in the range of:
to be in the range of:
$104,900,000 to $157,100,000
This value is subject to the terms, conditions, analysis, limitations, and assumptions contained in this report. A summary of the range of Business
Value is shown in the chart and table below:
Value is shown in the chart and table below:
Range of Fair MarketValue of NeuLion, Inc as of March 31, 2010
Conclusion of Value
$104,900,00
$157,100,000
Market Transactions
Guideline Public Company
Discounted Cash Flow
$50,000
$90,000
$130,000
$170,000
$210,000
Range ($000's)
Indicated Values by Method
Low
High
Weight
Low
High
Income Approach: Discounted Future Cash Flow Valuation Method (See Schedule 14)
$
105,035,000
$
154,325,000
85.00%
$
89,279,750
$
131,176,250
Market Approach: Guideline Company Valuation Method (See Schedule 26)
92,025,000
159,785,000
10.00%
9,202,500
15,978,500
Market Approach: Merger and Acquisition Valuation Method (See Schedule 28)
128,885,000
199,115,000
5.00%
6,444,250
9,955,750
Weighted Range of Value
$
104,926,500
$
157,110,500
Rounded:
$
104,900,000
$
157,100,000
If this communication contains statements concerning taxation, those statements are provided for information purposes only and are
not intended to constitute tax advice which may be relied upon to avoid penalties under any federal, state, local or other tax statutes
or regulation, nor do they resolve any tax issue in your favor. Upon request, we can provide you with express written tax advice after
necessary factual development and subject to such conditions and qualifications as we may deem appropriate in the circumstances.
Page | 74
H-74

Schedules
H-75

VALUATION OF NEULION INC. (C CORPORATION) AS OF
MARCH 31, 2010
MARCH 31, 2010
SCHEDULE
1
Reported Balance Sheets
As of December 31,
1
Line
Description
2009
2008
2007
ASSETS
1
Cash & Equivalents
$
12,957,679
$
27,323,021
$
608,464
2
Short Term Investments
-
-
-
3
Accounts Receivable
1,809,147
2,284,242
2,017,137
4
Tax Receivable
35,334
983,253
-
5
Other Receivable, Net
821,834
227,711
-
6
Inventories
928,592
347,600
323,500
7
Prepaid Expenses & Deposits
966,101
1,830,260
525,637
8
Due From Related Parties
246,992
324,059
188,855
9
Total Current Assets
17,765,679
33,320,146
3,663,593
10
Fixed Assets, Net (1)
5,754,255
6,474,989
2,281,667
Intangible Assets:
11
Customer Relationships
9,462,904
5,668,916
-
12
Trademarks
79,167
80,416
-
13
Goodwill
6,757,194
6,846,183
-
14
Other Assets
449,964
1,347,032
260,305
15
Investment in Affiliate
-
-
1,006,386
16
Deferred Direct Broadcast Operating Costs
-
-
-
17
TOTAL ASSETS
$
40,269,163
$
53,737,682
$
7,211,951
LIABILITIES
18
Accounts Payable
$
5,383,518
$
4,465,388
$
67,295
19
Accrued Expenses & Other Current Liabilities
5,822,385
7,595,116
830,371
20
Derivative Liability
1,389,300
-
-
21
Due to Related Parties
298,595
56,826
2,093,907
22
Deferred Revenue
3,907,510
3,091,993
429,246
23
Total Current Liabilities
16,801,308
15,209,323
3,420,819
24
Long-Term Deferred Revenue
469,191
638,510
544,199
25
Other Liabilities
728,330
876,271
-
26
Total Liabilities
17,998,829
16,724,104
3,965,018
SHAREHOLDERS' EQUITY
27
Common Stock
11,260,415
6,762,097
68,871
28
Paid-In Capital
55,023,567
56,500,258
17,580,329
29
Promissory Note Receivable
(209,250)
(209,250)
-
30
Accumulated Deficit
(43,804,398)
(26,039,527)
(14,402,267)
31
Total Equity
22,270,334
37,013,578
3,246,933
32
TOTAL LIABILITIES & EQUITY
$
40,269,163
$
53,737,682
$
7,211,951
Notes:
1. The 2008 financial statements include Jump TV after the date of the merger in October,
2008. (#) - See Schedule 2 for detail of indicated amounts.
2008. (#) - See Schedule 2 for detail of indicated amounts.
Historical financial information derived from audited financial statements. UHY Advisors FLVS, Inc. has not audited, reviewed, or compiled the financial statement
information presented above and, accordingly, we do not express an opinion or any form of assurance on the information.
information presented above and, accordingly, we do not express an opinion or any form of assurance on the information.
H-76

VALUATION OF NEULION INC. (C CORPORATION) AS OF
MARCH 31, 2010
MARCH 31, 2010
SCHEDULE
2
Notes to Reported Balance Sheets
As of December 31,
Line
Description
2009
2008
2007
(1) Fixed Assets, Net Include:
1
Computer Hardware
$
6,752,515
$
5,655,658
$
1,933,047
2
Computer Software
4,649,297
3,812,944
1,123,053
3
Furniture and Fixtures
186,617
184,062
71,557
4
Leashold Improvements
6,471
6,471
775
5
Total Gross Fixed Assets
11,594,900
9,659,135
3,128,432
6
Accumulated Amortization
(4,803,652)
(2,147,153)
(846,765)
7
Non-Cash Impairment
(1,036,993)
(1,036,993)
-
8
$
5,754,255
$
6,474,989
$
2,281,667
H-77

VALUATION OF NEULION INC. (C CORPORATION) AS OF
MARCH 31, 2010
MARCH 31, 2010
SCHEDULE
3
Reported Common Size Balance Sheets
As of December 31,
Line
Description
2009
2008
2007
ASSETS
1
Cash & Equivalents
32.18%
50.85%
8.44%
2
Short Term Investments
-
-
-
3
Accounts Receivable
4.49%
4.25%
27.97%
4
Tax Receivable
0.09%
1.83%
-
5
Other Receivable, Net
2.04%
0.42%
-
6
Inventories
2.31%
0.65%
4.49%
7
Prepaid Expenses & Deposits
2.40%
3.41%
7.29%
8
Due From Related Parties
0.61%
0.60%
2.62%
9
Total Current Assets
44.12%
62.01%
50.81%
10
Fixed Assets, Net
14.29%
12.05%
31.64%
Intangible Assets:
11
Customer Relationships
23.50%
10.55%
-
12
Trademarks
0.20%
0.15%
-
13
Goodwill
16.78%
12.74%
-
14
Other Assets
1.12%
2.51%
3.61%
15
Investment in Affiliate
-
-
13.95%
16
Deferred Direct Broadcast Operating Costs
-
-
-
17
TOTAL ASSETS
100.00%
100.00%
100.00%
LIABILITIES
18
Accounts Payable
13.37%
8.31%
0.93%
19
Accrued Expenses & Other Current Liabilities
14.46%
14.13%
11.51%
20
Derivative Liability
3.45%
-
-
21
Due to Related Parties
0.74%
0.11%
29.03%
22
Deferred Revenue
9.70%
5.75%
5.95%
23
Total Current Liabilities
41.72%
28.30%
47.42%
24
Long-Term Deferred Revenue
1.17%
1.19%
7.55%
25
Other Liabilities
1.81%
1.63%
-
26
Total Liabilities
44.70%
31.12%
54.97%
SHAREHOLDERS' EQUITY
27
Common Stock
27.96%
12.58%
0.95%
28
Paid-In Capital
136.64%
105.14%
243.77%
29
Promissory Note Receivable
(0.52%)
(0.39%)
-
30
Accumulated Deficit
(108.78%)
(48.46%)
(199.70%)
31
Total Equity
55.30%
68.87%
45.02%
32
TOTAL LIABILITIES & EQUITY
100.00%
100.00%
Sub-totals and totals may not foot due to rounding.
100.00%
H-78

VALUATION OF NEULION INC. (C CORPORATION)
AS OF MARCH 31, 2010
AS OF MARCH 31, 2010
SCHEDULE
4
Reported Income Statements
Annualized
For the Years Ended December 31,
Growth Rates
1
Line
Description
2009
2008
2007
2008-2009
2007-2009
REVENUE
1
Service Revenue
$
26,464,400
$
9,542,689
$
1,284,142
177.33%
353.97%
2
Equipment Revenue
1,629,277
3,900,650
6,526,569
(58.23%)
(50.04%)
3
Total Revenues
$
28,093,677
$
13,443,339
$
7,810,711
108.98%
89.65%
COST OF REVENUE
4
Service Revenue
12,850,002
4,519,062
325,097
184.35%
71.01%
5
Equipment Revenue
1,537,150
3,120,087
5,179,157
(50.73%)
(45.52%)
6
Total Cost of Revenue
14,387,152
7,639,149
5,504,254
88.33%
61.67%
7
GROSS PROFIT / (LOSS)
13,706,525
5,804,190
2,306,457
136.15%
143.78%
COSTS AND EXPENSES
8
Selling, General and Administrative
28,767,049
14,221,347
4,210,357
102.28%
161.39%
9
Amortization
4,141,117
1,572,492
561,077
163.35%
171.67%
10
Impairment of Long-Lived Assets
-
1,036,993
-
(100.00%)
n/m
11
Total Operating Expenses
32,908,166
16,830,832
4,771,434
95.52%
162.62%
12
OPERATING LOSS
(19,201,641)
(11,026,642)
(2,464,977)
74.14%
179.10%
Other Income / (Expense)
13
Unrealized Loss on Derivate
(801,350)
-
-
n/m
n/m
14
Gain on Foreign Exchange
68,245
265,720
-
(74.32%)
n/m
15
Investment Income
293,825
130,048
33,161
125.94%
197.67%
16
Equity in Loss of Affiliate
-
(1,006,386)
(2,083,943)
(100.00%)
(100.00%)
17
Total Other Income / (Expense)
(439,280)
(610,618)
(2,050,782)
(28.06%)
(53.72%)
19
NET LOSS
$
(19,640,921)
$
(11,637,260)
$
(4,515,759)
68.78%
108.55%
Notes:
1. The 2008 financial statements include the operations of Jump TV after the date of the merger in October, 2008.
Historical financial information provided to us by management and derived from audited financial statements. UHY Advisors FLVS, Inc. has not audited, reviewed, or compiled the
financial statement information presented above and, accordingly, we do not express an opinion or any form of assurance on the information.
financial statement information presented above and, accordingly, we do not express an opinion or any form of assurance on the information.
H-79

VALUATION OF NEULION INC. (C CORPORATION)
AS OF MARCH 31, 2010
AS OF MARCH 31, 2010
SCHEDULE
5
Reported Common Size Income Statements
For the Years Ended December 31,
Line
Description
2009
2008
2007
REVENUE
1
Service Revenue
94.20%
70.98%
16.44%
2
Equipment Revenue
5.80%
29.02%
83.56%
3
Total Revenues
100.00%
100.00%
100.00%
COST OF REVENUE
4
Service Revenue
45.74%
33.62%
4.16%
5
Equipment Revenue
5.47%
23.21%
66.31%
6
Total Cost of Revenue
51.21%
56.82%
70.47%
7
GROSS PROFIT / (LOSS)
48.79%
43.18%
29.53%
COSTS AND EXPENSES
8
Selling, General and Administrative
102.40%
105.79%
53.90%
9
Amortization
14.74%
11.70%
7.18%
10
Impairment of Long-Lived Assets
-
7.71%
-
11
Total Operating Expenses
117.14%
125.20%
61.09%
12
OPERATING LOSS
(68.35%)
(82.02%)
(31.56%)
Other Income / (Expense)
13
Unrealized Loss on Derivate
(2.85%)
-
-
14
Gain on Foreign Exchange
0.24%
1.98%
-
15
Investment Income
1.05%
0.97%
0.42%
16
Equity in Loss of Affiliate
-
(7.49%)
(26.68%)
17
Total Other Income / (Expense)
(1.56%)
(4.54%)
(26.26%)
19
NET LOSS
(69.91%)
(86.57%)
Sub-totals and totals may not foot due to rounding.
(57.81%)
H-80

VALUATION OF NEULION INC. (C CORPORATION)
AS OF MARCH 31, 2010
AS OF MARCH 31, 2010
SCHEDULE
6
Reported Cash Flow Statements
For the Years Ended December 31,
Line
Description
2009
2008
2007
OPERATING ACTIVITIES
1
Net Income / (Loss)
$
(19,640,921)
$
(11,637,260)
(4,515,759)
2
Depreciation and Amortization
4,141,117
1,572,492
561,077
3
Equity in Loss of Affiliate
-
1,006,386
2,083,943
4
Stock Based Compensation
1,167,789
1,848,906
-
5
Unrelized Loss on Derivatives
801,350
-
-
6
Impairment of Long Lived Assets
-
1,036,993
-
7
Accounts Receivable
848,375
1,943,307
(2,011,788)
8
Inventories
(580,992)
(24,100)
(323,500)
9
Prepaid Expenses & Other
1,832,496
191,621
(731,361)
10
Other Receivables
(701,145)
4,441
-
12
Taxes Receivable
966,367
37,398
-
13
Due From Related Parties
77,067
(135,204)
1,371,074
14
Accounts Payable
275,907
(306,999)
(176)
15
Accrued Liabilities
(1,364,330)
604,465
484,084
16
Deferred Revenue
510,383
244,846
921,195
17
Long-Term Liabilities
(267,941)
41,833
-
18
Due To Related Parties
241,769
(2,043,626)
2,076,205
19
Net Cash Flow from Operating Activities
$
(11,692,709)
$
(5,614,501)
$
(85,006)
INVESTING ACTIVIES
20
Capital Expenditures
$
(1,198,432)
$
(1,443,438)
$
(1,628,411)
21
Acquisition of INSINC, net of cash of $344,371
(1,561,905)
-
-
22
Acquisition of NeuLion, Inc.
-
21,738,421
-
23
Net Cash Flow from Investing Activities
$
(2,760,337)
$
20,294,983
$
(1,628,411)
FINANCING ACTIVITIES
24
Capital Contribuions
$
-
$
2,600,000
$
670,000
25
Private Placement - Charles Wang (AvantaLion LLC) & G. Scott Paterson
-
9,214,700
-
26
Proceeds from Exercise of Stock Options
87,704
219,375
-
27
Net Cash Flow from Financing Activities
$
87,704
$
12,034,075
$
670,000
28
NET CASH FLOW
$
(14,365,342)
$
26,714,557
$
(1,043,417)
29
Beginning Cash
27,323,021
608,464
1,651,881
30
ENDING CASH
$
12,957,679
$
27,323,021
$ 608,464
Historical financial information provided to us by management and derived from audited financial statements. UHY Advisors FLVS, Inc. has not audited, reviewed, or compiled the financial statement information presented
above and, accordingly, we do not express an opinion or any form of assurance on the information.
above and, accordingly, we do not express an opinion or any form of assurance on the information.
H-81

VALUATION OF NEULION INC. (C CORPORATION)
AS OF MARCH 31, 2010
AS OF MARCH 31, 2010
SCHEDULE
7
Key Reported Balance Sheet Ratios
As of December 31,
Line
Description
2009
2008
2007
Key Balance Sheet Figures
1
Total Assets
$
40,269,163
$
53,737,682
$
7,211,951
2
Inventory
928,592
347,600
323,500
3
Fixed Assets
5,754,255
6,474,989
2,281,667
4
Total Liabilities
17,998,829
16,724,104
3,965,018
5
Total Shareholders' Equity
22,270,334
37,013,578
3,246,933
6
Working Capital
964,371
18,110,823
242,774
Liquidity Ratios
7
Current Ratio
1.06
2.19
1.07
Activity Ratios
8
Average Asset Turnover
0.60
0.44
n/m
9
Average Inventory Turnover
22.55
22.77
n/m
11
Average A/R Turnover
13.73
6.25
n/m
12
Average Working Capital Turnover
2.95
1.46
n/m
13
Average Days A/R Outstanding
26.59
58.39
n/m
14
Average Days A/P Outstanding
124.93
108.29
n/m
Balance Sheet Leverage Ratios
15
Total Liabilities / Total Assets
0.45
0.31
0.55
16
Shareholders' Equity / Total Assets
0.55
0.69
0.45
17
Fixed Assets / Shareholders' Equity
0.26
0.17
0.70
18
Total Liabilities / Shareholders' Equity
0.81
0.45
1.22
H-82

VALUATION OF NEULION INC. (C CORPORATION)
AS OF MARCH 31, 2010
AS OF MARCH 31, 2010
SCHEDULE
8
Key Reported Income Statement Ratios
For the Years Ended December 31,
Line Description
2009
2008
2007
Key Income Statement Figures
1
Net Revenues
$
28,093,677
$
13,443,339
$
7,810,711
2
EBITDA
(15,499,804)
(10,064,768)
(3,954,682)
3
Depreciation and Amortization
4,141,117
1,572,492
561,077
4
EBIT
(19,640,921)
(11,637,260)
(4,515,759)
5
Net Income
(19,640,921)
(11,637,260)
(4,515,759)
H-83

VALUATION OF NEULION INC. (C CORPORATION) AS
OF MARCH 31, 2010
OF MARCH 31, 2010
SCHEDULE9Management Projected Quarterly Revenue Detail for the Year Ended December 31, 20101
Common
Line
Description
Total 2009
Q1 2010
Q2 2010
Q3 2010
Q4 2010
Total 2010
Size
Service Revenue
1
Subscription Revenue
2
College Networks
$
4,664,752
$
1,311,000
$
1,099,000
$
1,143,000
$
2,045,000
$
5,598,000
13.57%
3
Dish Network
-
-
90,000
190,000
336,000
616,000
1.49%
4
Pro Sports and Variety (WEB)
3,629,604
795,000
737,000
864,000
1,711,000
4,107,000
9.96%
5
Sky Angel (STB)
2,306,609
614,000
626,000
639,000
652,000
2,531,000
6.14%
6
International - B2B (STB)
2,891,859
829,000
877,000
942,000
1,022,000
3,670,000
8.90%
7
Other2
4,712,055
946,000
948,000
950,000
953,000
3,797,000
9.20%
8
INSINC
270,699
590,000
620,000
765,000
766,000
2,741,000
6.64%
9
New Business - Sports (MLS, Other)
-
-
150,000
250,000
300,000
700,000
1.70%
10
New Business - International B2B
-
-
100,000
300,000
500,000
900,000
2.18%
Total Subscription Revenue
$
18,475,578
$
5,085,000
$
5,247,000
$
6,043,000
$
8,285,000
$
24,660,000
59.78%
E-Commerce Revenue (includes advertising, merchandising, ticketing and auction revenue)
11
Advertising
$
1,838,451
$
500,000
$
350,000
$
750,000
$
1,400,000
$
3,000,000
7.27%
12
College Networks
2,104,326
457,000
610,000
624,000
840,000
2,531,000
6.14%
13
Cycling TV
1,031
-
-
-
-
-
-
14
SportsYA
6,050
-
-
-
-
-
-
15
Total E-Commerce Revenue
$
3,949,858
$
957,000
$
960,000
$
1,374,000
$
2,240,000
$
5,531,000
13.41%
Technology Services Revenue (includes site fees, set-up fees, transcoder and professional fees)
16
College Networks
$
1,544,647
$
450,000
$
459,000
$
468,000
$
477,000
$
1,854,000
4.49%
17
Dish Network
-
9,000
58,000
58,000
58,000
183,000
0.44%
18
Pro Sports and Variety
786,215
124,000
117,000
347,000
75,000
663,000
1.61%
19
Sky Angel (STB)
202,272
51,000
34,000
-
-
85,000
0.21%
20
In t
erna
ti
ona
l
-
B2B (STB)
451,033
81,000
87,000
102,000
120,000
390,000
095%
21
Other1
24,126
-
-
-
-
-
-
22
Professional Services
726,029
162,000
162,000
151,000
162,000
637,000
1.54%
23
INSINC
304,648
350,000
450,000
750,000
909,000
2,459,000
5.96%
24
New Business
-
-
30,000
50,000
70,000
150,000
24
Total Technology Services Revenue
$
4,038,970
$
1,227,000
$
1,397,000
$
1,926,000
$
1,871,000
$
6,421,000
15.57%
25
Total Service Revenue
$
26,464,406
$
7,269,000
$
7,604,000
$
9,343,000
$
12,396,000
$
36,612,000
88.75%
Equipment Revenue
26
Sky Angel
$
77,270
$
10,000
$
135,000
$
260,000
$
260,000
$
665,000
1.61%
27
Dish Network
173,000
989,000
1,050,000
575,000
2,787,000
6.76%
28
International - B2B (STB)
1,432,583
167,000
325,000
238,000
337,000
1,067,000
2.59%
29
Other International (Talfazat and TV-Desi)
119,422
30,000
30,000
30,000
30,000
120,000
0.29%
30
Total Equipment Revenue
$
1,629,275
$
380,000
$
1,479,000
$
1,578,000
$
1,202,000
$
4,639,000
11.25%
31
Total Revenue
$
28,093,677
$
7,649,000
$
9,083,000
$
10,921,000
$
13,598,000
$
41,251,000
100.00%
Notes:
1. Refer to schedule 9A for a detailed list of management assumptions.
2. Revenue from related parties including Talfazat, LATAM, INTL RoW, TV-Desi, Cycling TV, and WCQ.
H-84

VALUATION OF NEULION INC. (C CORPORATION) AS
OF MARCH 31, 2010
OF MARCH 31, 2010
SCHEDULE
9A Detailed Assumptions for 2010 Management Projections
Description
2010 Financial Projection Assumptions
Service Revenue
Subscription Revenue
1
College Networks
Management assumed a 20% increase over last year, and incorporates seasonality into the forecast.
2
Dish Network
Management estimated ******* subscribers to be added during the year. Pricing is based on ******* for the *******; ******* for the *******; ******* for *******;
and ******* thereafter.
3
Pro Sports and Variety (WEB)
NHL
Estimated $150K per month thru Q3; $200K a month commencing Q4 (new hockey season).
NFL
Assumed 20% over prior year increase.
AHL
Assumed 20% growth rate quarter over prior year quarter to capture seasonality.
ESPN
Estimated based on $11,500 fixed monthly fee plus $40/archive (630 (Q1), 200 (Q2), 0 (Q3) & 630 (Q4)) and Managed CDN Support of $2,500/month (Q1), $750/month
ESPN (continued)
for April & May (Q2), $0 (Q3), $2,500/month (Q4)
ESPN (continued)
• Q1 (11,500 x 3) + (40 x 630) + (2,500 x 3) = 67,200
ESPN (continued)
• Q2 (11,500 x 3) + (40 x 200) + (750 x 2) = 44,000
ESPN (continued)
• Q3 (11,500 x 3) = 34,500
ESPN (continued)
• Q4 (11,500 x 3) + (40 x 630) + (2,500 x 3) = 67,200
Indy
Included only the fixed monthly fee portion of billing since this is the only part that Indy is currently paying.
Tennis Channel
This contract has been terminated.
PBR
Assumed 10% growth rate quarter over prior year quarter to capture seasonality.
TNA (Wrestling)
Estimated $5K/month and usage of $2K/quarter (additional $5K for Q1 is development for PPV packages).
USL (United Soccer League)
Contract termination notice received from client.
HRTV (Horce Racing)
Assumed 10% growth rate sequentially since this is non-seasonal in nature.
Skate Canada
Assumed 10% growth rate sequentially since this is non-seasonal in nature.
nTouch
Q1 is based on $3.5K per month, and remaining quarters are based on $5K per month.
Others
Assumed 10% growth rate quarter over prior year quarter to capture seasonality.
4
Sky Angel (STB)
Sky Angel will launch a PC version on 3/1/10 @ $15/month per subscriber; NeuLion share is $7.50/month per subscriber. Overall growth rate is assumed to be 2% sequentially.
5
International - B2B (STB)
KyLin
Estimate is based on average subs of 31,000 (Q1), 33,000 (Q2), 36,000 (Q3) & 38,000 (Q4). Assumes 40,000 ending subs at 12/31.
Media Opportunities IPTV
Assumed 5% growth rate sequentially since this is non-seasonal in nature.
nTouch
Assumed 10% growth rate sequentially since this is non-seasonal in nature.
BommTV
Assumed 10% growth rate sequentially since this is non-seasonal in nature.
RSN
Assumed 10% growth rate sequentially since this is non-seasonal in nature.
Multi Tennant STB
Assumed 5% growth rate sequentially since this is non-seasonal in nature.
ABS-CBN Global Limited
Assumed 2% growth rate sequentially since this is non-seasonal in nature; ABS contract expires 5/31/2010.
6
Other
Talfazat
Assumed 2.5% growth rate sequentially since this is non-seasonal in nature.
LATAM
Assumed continued churn rate of 4% per month on this revenue stream.
INTL RoW
Assumed continued churn rate of 8% per month on this revenue stream.
TV-Desi
Assumed 5% growth rate sequentially since this is non-seasonal in nature.
CyclingTV
Anticipate no growth in Cycling revenues due to loss of content.
7
INSINC
INSINC's total budgeted revenue is $5.2M; 53% is subscription revenue and 47% is technology revenue (allocation is based on Jan 2010 actual results).
H-85

VALUATION OF NEULION INC. (C CORPORATION) AS
OF MARCH 31, 2010
OF MARCH 31, 2010
SCHEDULE
9A Detailed Assumptions for 2010 Management Projections (continued)
Description
Projection Assumptions
E-Commerce Revenue
8
Advertising
Assumed increasing quarter over prior year quarter growth rate to capture seasonality and incremental increases for (1) improved trafficking to maximize CPM
and (2) new advertising opportunities in video.
9
College Networks
Assumed increasing quarter over prior year quarter to capture seasonality and incremental increase in new clients for 2010 - budget incorporates a 20% year over year increase.
Technology Services Revenue
10
College Networks
Includes annual maintenance fees charge to each college. Growth is based on 20% year to year increase.
11
Dish Network
This is based on 30 transcoders @ ******* and ******* one time set up fee amortized over two year and *******/month customer support commencing Q2
12
Pro Sports and Variety
NHL
Estimate represents the amortized setup fee, which ends Q3/2010 and $20,000 per month for customer support; Q3 includes $250,000 for a special project.
ESPN
Estimate based on amortized $100K Setup Fee amortized over 2 years.
Other
Estimate based on amortized Setup Fee.
13
Sky Angel (STB)
Represents Amortized Setup and transcoder fees. Initial terms of contract expires on 6/30/2010.
14
International - B2B (STB)
Media Opportunities IPTV
Represents amortized transcoder fees and the initial contract ends 2/28/2010.
nTouch
Represents amortized setup and transcoder fees.
BommTV
Represents amortized setup and transcoder fees.
RSN
Represents amortized setup and transcoder fees.
Others
Represents amortized setup and transcoder fees.
15
Professional Services
RPA
Estimate based on billable amounts.
Islanders
Estimate based on billable amounts of $60K/quarter of IT services and $35K/quarter for Islanders TV for Q1, Q2 & Q4, and $24K for Q3 for Islanders TV due to off season.
Smile Tain
Estimate based on billable amounts.
KyLin
Estimate based on billable amounts.
16
INSINC
INSINC's to ta l bu dg ete d
revenue
i
s
$52M; 47% is su bscrip ti
on revenue an
d 53% is te chn ol
ogy revenue
(a ll
oca
ti
on
is b
ase
d
on
2009'
s ac
tu al
resu
lt
s
)
Equipment Revenue
17
Sky Angel
Estimate based on STB purchase of 0 (Q1), 1,000 (Q2), 2,000 (Q3) & 2,000 (Q4) @ $125/STB plus $10K shipping revenue every quarter.
18
Dish Network
Estimate is based on 0 subs (Q1) and average subs ******* (Q2), ******* (Q3) & ******* (Q4); therefore, STB purchase will be ******* (Q1), ******* (Q2), ******* (Q3) & ******* (Q4).
STB Pricing structure is:
1,000-5,000 STB's at $125.00/STB; 5,100-10,000 STB's at $115.00/STB; >= 10,100 STB's at $105.00/STB.
19
International - B2B (STB)
Media Opportunities IPTV
Estimate based on 240 STBs purchases and shipping revenue
nTouch
Estimate based on purchases of STB of 300 (Q1) and 600 each remaining quarter plus $3,000 per quarter for shipping.
RSN
Estimate based on STB purchase of 40 (Q1), 0 (Q2), 300 (Q3) & 200 (Q4)
BommTV
Estimate based on STB purchase of 750 (Q1), 500 (Q2), 500 (Q3) & 500 (Q4)
Other / New Business
Estimate based on STB purchase of 150 (Q1), 1300 (Q2), 300 (Q3) & 1200 (Q4)
20
Talfazat
Assumed 2.5% growth rate sequentially since this is non-seasonal in nature
21
TV-Desi
Assumed 5% growth rate sequentially since this is non-seasonal in nature
H-86

VALUATION OF NEULION INC. (C CORPORATION) AS
OF MARCH 31, 2010
OF MARCH 31, 2010
SCHEDULE
10
Projected Quarterly Cost of Sales Detail for the Year Ended December 31, 2010
Line
Description
Q1 2010
Q2 2010
Q3 2010
Q4 2010
Total 2010
1
Total Revenue
$
7,649,000
$
9,083,000
$
10,921,000
$
13,598,000
$
41,251,000
Cost of Sales
Service
2
Subscription - Content Licensing Costs
$
1,389,000
$
1,240,000
$
1,349,000
$
1,835,000
$
5,813,000
3
Broadcast1
2,130,393
1,887,716
1,829,413
2,084,043
7,931,565
4
E-Commerce2
226,000
222,000
325,000
535,000
1,308,000
5
Technology3
78,000
78,000
87,000
104,000
347,000
6
Total - Service
$
3,823,393
$
3,427,716
$
3,590,413
$
4,558,043
$
15,399,565
7
Total - Equipment
288,000
1,054,000
1,140,000
803,000
3,287,435
8
Total Cost of Sales
$
4,111,393
$
4,481,716
$
4,730,413
$
5,361,043
$
18,687,000
9
Gross Profit
$
3,537,607
$
4,601,284
$
6,190,587
$
8,236,957
$
22,564,000
Notes:
1. This includes costs related to Dish Network, Switch and Data, HP Lease Allocation, Bandcon Allocation, and Switch and Data
Allocation. 2. This includes costs related to Advertising and College Networks.
Allocation. 2. This includes costs related to Advertising and College Networks.
3. This includes costs related to Professional and Variety, Colllege Networks, Professional Services, SkyAngel, International B2B, INSINC, and Dish Network.
H-87

VALUATION OF NEULION INC. (C CORPORATION) AS
OF MARCH 31, 2010
OF MARCH 31, 2010
SCHEDULE
11
Projected Income Statements
Percentages represent annual growth rates
Reported
For the Years Ending December 31
Line
Description
12/31/2009
12/31/2010
12/31/2011
12/31/2012
12/31/2013
12/31/2014
(Per Schedule 9)
1
Net Revenues
$
26,464,400
56%
$
41,251,000
46%
$
60,192,100
35%
$
81,467,900
27%
$
103,101,500
20%
$
123,453,200
2
Cost of Revenues
12,850,002
45%
18,687,000
37%
25,514,450
32%
33,771,065
23%
41,622,318
18%
49,293,084
3
GROSS PROFIT / (LOSS)
13,614,398
66%
22,564,000
54%
34,677,650
38%
47,696,835
29%
61,479,182
21%
74,160,116
4
Operating Expenses
28,767,049
-
28,691,000
19%
34,106,000
21%
41,107,000
16%
47,536,000
10%
52,509,000
5
Depreciation
2,658,856
3,296,000
3,511,000
1,336,255
1,430,000
1,425,000
6
Amortization
1,482,261
2,328,524
2,216,000
2,216,167
1,984,916
796,631
7
PRE-TAX INCOME / (LOSS)
(19,733,048)
n/a
(11,751,524)
n/a
(5,155,350)
n/a
3,037,413
247%
10,528,266
85%
19,429,485
8
Income Tax Expense1
-
-
-
-
-
-
9
NET INCOME / (LOSS)
$
(19,733,048)
n/a
$
(11,751,524)
n/a
$
(5,155,350)
n/a
$
3,037,413
247%
$
10,528,266
85%
$
19,429,485
Memo
10
EBIT (earnings before interest and taxes)
$
(19,733,048)
n/a
$
(11,751,524)
n/a
$
(5,155,350)
n/a
$
3,037,413
247%
$
10,528,266
85%
$
19,429,485
11
EBITDA (EBIT + depreciation and amort.)
(15,591,931)
n/a
(6,127,000)
n/a
571,650
1053%
6,589,835
112%
13,943,182
55%
21,651,116
Breakdown of Sources of Revenue
12
Total NeuLion Revenue (see above)
$
26,464,400
$
41,251,000
$
60,192,100
$
81,467,900
$
103,101,500
$
123,453,200
13
- INSINC Revenue2
(575,347)
(5,100,000)
(5,704,324)
(6,476,433)
(7,361,505)
(6,990,980)
14
- Dish Network Subscriber Revenue3
-
(615,000)
(1,877,250)
(2,472,180)
(3,104,681)
(3,721,591)
15
- Dish Set Top Box Revenue3
-
(2,785,500)
(976,500)
(1,096,429)
(1,115,082)
(1,049,007)
16
- Dish Technology Revenue3
-
(183,000)
(233,000)
(184,000)
(180,000)
(180,000)
17
A: NeuLion Core Business Revenue
$
25,889,053
$
32,567,500
$
51,401,026
$
71,238,858
$
91,340,232
$
111,511,622
18
Core Business Revenue Growth Rate
n/m
26%
58%
39%
28%
22%
19
Total NeuLion Cost of Revenue
$
12,850,002
$
18,687,000
$
25,514,450
$
33,771,065
$
41,622,318
$
49,293,084
20
- Cost of INSINC Revenue2
(238,309)
(2,704,459)
(2,910,048)
(3,154,351)
(3,412,099)
(3,282,180)
21
- Cost of Dish Subscriber Revenue4
-
(135,000)
(412,079)
(542,674)
(681,515)
(816,935)
22
- Cost of Dish Set Top Box Revenue5
-
(1,575,000)
(688,433)
(752,150)
(743,759)
(699,688)
23
- Cost of Dish Technology Revenue6
-
(20,000)
(20,000)
(20,000)
(20,000)
(20,000)
24
B: NeuLion Core Business Cost of Revenue
$
12,611,693
$
14,252,541
$
21,483,890
$
29,301,890
$
36,764,945
$
44,474,281
25
A: NeuLion Core Business Revenue
$
25,889,053
$
32,567,500
$
51,401,026
$
71,238,858
$
91,340,232
$
111,511,622
26
B: NeuLion Core Business Cost of Revenue
(12,611,693)
(14,252,541)
(21,483,890)
(29,301,890)
(36,764,945)
(44,474,281)
27
NeuLion Core Business Gross Profit (A-B)
$
13,277,360
$
18,314,959
$
29,917,136
$
41,936,968
$
54,575,287
$
67,037,341
28
Core Business Revenue Growth Rate
n/m
38%
63%
40%
30%
23%
Notes:
1. For the purposes of our analysis we have assumed that the Company will not pay income taxes as a result of having an income tax carryforward of approximately $93 million as of the Valuation Date to be applied to future earnings. 2. INSINC forecasted
revenue and cost of revenue were derived from the INSINC Inc. Intangible Asset Valuation report as of October 31, 2009 prepared by Peter Ott & Associates and detailed in Schedule 13. 3. Dish Network subscriber revenue was forecast based on
management's estimate of 2010 subscribers, number of set top boxes sold, and technology revenue per Schedule 9A. The number of subscribers was grown at the total revenue growth rate for 2011 - 2014, which drives the subscriber and set top box
revenue figures. Technology revenue is based strictly on the two amortizedd set up fees, and recurring monthly customer support charges detailed in Schedule 9A. 4. Dish Network cost of revenue for subscribers is based off of managements assumption in
2010 of22% of subscriber revenue.
5. Dish Network cost of set top box revenue is based on the cost of set top boxes fro mTransVideo which was $75 in 2011, $72 in 2012, $70 in 2013, and $70 in
2014. 6. Cost of Dish Technology revenue is constant based on management projected level of $55.55 per transcoder, per month.
2014. 6. Cost of Dish Technology revenue is constant based on management projected level of $55.55 per transcoder, per month.
H-88

VALUATION OF NEULION INC. (C CORPORATION) AS
OF MARCH 31, 2010
OF MARCH 31, 2010
SCHEDULE
12
Common Size Projected Income Statements
Reported
For the Years Ending December 31
Line
Description
12/31/2009
12/31/2010
12/31/2011
12/31/2012
12/31/2013
12/31/2014
1
Net Revenues
100.00%
100.00%
100.00%
100.00%
100.00%
100.00%
2
Cost of Revenues
48.56%
45.30%
42.39%
41.45%
40.37%
39.93%
3
GROSS PROFIT / (LOSS)
51.44%
54.70%
57.61%
58.55%
59.63%
60.07%
4
Operating Expenses
108.70%
69.55%
56.66%
50.46%
46.11%
42.53%
5
Depreciation
10.05%
7.99%
5.83%
1.64%
1.39%
1.15%
6
Amortization
5.60%
5.64%
3.68%
2.72%
1.93%
0.65%
7
PRE-TAX INCOME / (LOSS)
(74.56%)
(28.49%)
(8.56%)
3.73%
10.21%
15.74%
8
Income Tax Expense1
-
-
-
-
-
-
9
NET INCOME / (LOSS)
(74.56%)
(28.49%)
(8.56%)
3.73%
10.21%
15.74%
Memo
10
EBIT (earnings before interest and taxes)
(74.56%)
(28.49%)
(8.56%)
3.73%
10.21%
15.74%
11
EBITDA (EBIT + depreciation and amort.)
(58.92%)
(14.85%)
0.95%
8.09%
13.52%
17.54%
H-89

VALUATION OF NEULION INC. (C CORPORATION) AS
OF MARCH 31, 2010
OF MARCH 31, 2010
SCHEDULE
13
INSINC Projected Income Statements1
Description
12/31/2010
12/31/2011
12/31/2012
12/31/2013
12/31/2014
Revenue
1
Existing Contract Revenue
$
4,661,638
$
4,937,191
$
5,325,734
$
5,808,061
$
5,049,175
2
New Customer Revenue
438,362
767,133
1,150,699
1,553,444
1,941,805
3
Total Revenue
5,100,000
5,704,324
6,476,433
7,361,505
6,990,980
Cost of Sales
4
Existing Contract Cost of Sales
$
2,463,360
$
2,488,125
$
2,521,467
$
2,557,705
$
2,214,187
5
New Customer Cost of Sales
241,099
421,923
632,884
854,394
1,067,993
6
Total Cost of Sales
$
2,704,459
$
2,910,048
$
3,154,351
$
3,412,099
$
3,282,180
Gross Profit
7
Existing Contract Gross Profit
$
2,198,278
$
2,449,066
$
2,804,267
$
3,250,356
$
2,834,988
8
New Customer Gross Profit
197,263
345,210
517,815
699,050
873,812
9
Total Gross Profit
$
2,395,541
$
2,794,276
$
3,322,082
$
3,949,406
$
3,708,800
Operating Expenses
10
SG&A Costs
1,238,846
1,272,899
1,316,272
1,357,431
1,238,964
11
Operating Income
$
1,156,695
$
1,521,377
$
2,005,810
$
2,591,975
$
2,469,836
12
Income Tax Expense
347,009
433,593
541,569
699,834
666,856
13
Net Income
$
809,686
$
1,087,784
$
1,464,241
$
1,892,141
$
1,802,980
Notes:
1. This forecast was part of a valuation of INSINC’s intangible assets as of October 31, 2009 as prepared by Peter Ott & Associates, Inc with input from Management.
H-90

VALUATION OF NEULION INC. (C CORPORATION)
AS OF MARCH 31, 2010
AS OF MARCH 31, 2010
SCHEDULE
14
Discounted Cash Flow Valuation Method
Projected Cash Flow to Total Invested Capital for the Years Ending December 31,
Source / Comments
Line
Description
12/31/2010
12/31/2011
12/31/2012
12/31/2013
12/31/2014
1
Pre-Tax Net Income
$
(11,751,524)
$
(5,155,350)
$
3,037,413
$
10,528,266
$
19,429,485
See Schedule 11.
2
Income Taxes1
-
-
-
-
-
3
Depreciation
3,296,000
3,511,000
1,336,255
1,430,000
1,425,000
See Schedule 11.
4
Amortization
2,328,524
2,216,000
2,216,167
1,984,916
796,631
See Schedule 11.
5
Capital Expenditures2
(2,334,000)
(902,882)
(1,222,019)
(1,546,523)
(1,851,798)
6
Net Change in Working Capital3
(12,500)
(473,528)
(531,895)
(540,840)
(508,792)
7
PROJECTED CASH FLOW
$
(8,473,500)
$
(804,760)
$
4,835,921
$
11,855,819
$
19,290,526
8
Add Back 1st Qtr 2010 Loss4
3,031,375
9
4/1 - 12/31/2010
$
(5,442,125)
10
Present Value Factor5
18.00%
0.93982
0.81311
0.68907
0.58396
0.49488
11
PRESENT VALUE OF PROJECTED CASH FLOW (A)
$
(5,114,618)
$
(654,358)
$
3,332,288
$
6,923,324
$
9,546,496
Terminal Value Range - EBITDA Multiples
Source / Comments
Derivation of Terminal Value
Low
Mid
High
12
Terminal Year EBITDA
$
24,898,783
$
24,898,783
$
24,898,783
2015 EBITDA plus terminal growth of 15%
13
Terminal Year Exit Multiple
6.0
8.0
10.0
14
TERMINAL VALUE
$
149,392,698
$
199,190,264
$
248,987,830
Derivation of Value
15
Sum of Present Values of Cash Flow During Projection Period
$
14,033,132
$
14,033,132
$
14,033,132
16
Present Value of Terminal Value
73,931,458
98,575,278
123,219,097
17
Present Value of NOL
8,992,860
8,992,860
8,992,860
See Schedule 16.
18
Value of Equity Interest in KyLinTV
8,080,000
8,080,000
8,080,000
See Schedule 15.
19
Value of Total Invested Capital
$
105,037,450
$
129,681,270
$
154,325,089
18
- Interest Bearing Debt
-
-
-
20
VALUE OF EQUITY CAPITAL
$
105,037,450
$
129,681,270
$
154,325,089
VALUATION INDICATION:
Rounded to Nearest:
21
DISCOUNTED FUTURE CASH FLOW VALUATION
$
105,035,000
$
129,680,000
$
154,325,000
$5,000
Notes:
1. For the purposes of our analysis we have assumed that the Company will not pay income taxes as a result of having an income tax carryforward of approximately $93 million as of the Valuation Date to be applied to
future earnings. 2. Capital Expenditures for the year ended December 31, 2010 were estimated based on the Company's budget. Subsequent years were forecast to equal approximately 1.5% of revenue. 3. Change in Net
Working Capital for the year ended December 31, 2010 was estimated based on the Company's budget. Subsequent years were forecast to equal approximately 2.5% of revenue. 4. Since the Valuation Date is March 31,
2010, the Company's forecasted 1Q EBITDA was subtracted along with 25% of the forecasted capital expenditures, and net change in working capital. 5. A majority of the Company's revenue is generated in the first and
fourth quarters as a result of the different sports seasons. Accordingly, a mid-year discounted convention was used.
H-91

VALUATION OF NEULION INC. (C CORPORATION)
AS OF MARCH 31, 2010
AS OF MARCH 31, 2010
SCHEDULE
15
Calculation of Ownership Interest in KyLin TV
Line
Description
Calculations
Calculation of NeuLion's Ownership in KyLin TV1
1
Value of 15.1% Interest in KyLin TV, Inc. (non-marketable, non-controlling basis)
$
10,000,000
2
÷ 15.1% Owership Interest
15.10%
3
Implied 100% Equity Value (non-marketable, non-controlling basis)
$
66,225,166
4
x Ownership Percentage
12.20%
5
Value of NeuLion's Ownership (non-marketable, non-controlling basis)
$
8,079,470
Rounded to Nearest:
6
Value of NeuLion's Ownership (non-marketable, non-controlling basis)
$
8,080,000
$5,000
Notes:
1. On February 26, 2010, a group of investors invested $10.0 million in KyLinTV for 15.1% of its equity, which reduced NeuLion's equity interest in KyLinTV from 17.1% to 12.2%. Of the total $10.0 million
investment, $1.0 million was invested by AvantaLion LLC, a company controlled by the Chairman of the Board of Directors of the Company.
investment, $1.0 million was invested by AvantaLion LLC, a company controlled by the Chairman of the Board of Directors of the Company.
H-92

VALUATION OF NEULION INC. (C CORPORATION)
AS OF MARCH 31, 2010
AS OF MARCH 31, 2010
SCHEDULE
16
Calculation of Net Operating Loss Carryforward
NOL
Line
Description
Carryforward
Date of Expiration
Source
1
Amount of NOL
$
21,263,325
12/31/2026
NeuLion Audited 2009 Financial Statement as filed with the SEC.
2
Amount of NOL
25,544,598
12/31/2027
NeuLion Audited 2009 Financial Statement as filed with the SEC.
3
Amount of NOL
28,851,457
12/31/2028
NeuLion Audited 2009 Financial Statement as filed with the SEC.
4
Amount of NOL
17,510,759
12/31/2029
NeuLion Audited 2009 Financial Statement as filed with the SEC.
5
A: Total NOL Carryforward
$
93,170,139
NeuLion Audited 2009 Financial Statement as filed with the SEC.
Forecasted
Projection Year
Pre-Tax Income
6
2010
$
(11,751,524)
7
2011
(5,155,350)
8
2012
3,037,413
9
2013
10,528,266
10
2014
19,429,485
11
B: Aggregate Income Over Discrete Forecast
$
16,088,290
12
A: Total NOL Carryforward
$
93,170,139
13
B: Aggregate Income Over Discrete Forecast
(16,088,290)
14
NOL Carryforward Balance - 2015 (A-B)
$
77,081,849
15
12/31/2015
12/30/2016
12/30/2017
16
NOL Carryforward Balance
$
77,081,849
$
54,737,941
$
29,042,447
17
- Pretax Income1
(22,343,908)
(25,695,494)
(29,042,447)
18
Remaining NOL (Prior Year NOL - Pretax Income)
$
54,737,941
$
29,042,447
$
-
19
33% Tax Rate x Pretax Income
$
7,373,490
$
8,479,513
$
9,584,008
20
Present Value Factor@ 18%2
0.41939
0.35542
0.30120
21
Present Value
$
3,092,368
$
3,013,789
$
2,886,703
22
Total Present Value
$
8,992,860
Notes:
1. Pre-tax income from 2015 through 2019 was forecast to increase at a rate of 15% per year for the purposes of analyzing
the NOL. 2. A midyear discounting convention was used.
the NOL. 2. A midyear discounting convention was used.
H-93

VALUATION OF NEULION INC. (C CORPORATION)
AS OF MARCH 31, 2010
AS OF MARCH 31, 2010
SCHEDULE
17
Derivation of Discount Rate
Line
Derivation of Capitalization Rate and Factor
Source/Comments
1
Long-Term Government Bond Yield-to-Maturity
4.55%
Constant Maturity 20 year Treasuries as of 03/31/2010, per Federal Reserve Release H.15.
2
Ibbotson Common Stock Premium
5.73%
Average annual return premium of large capitalization stocks per SBBI 2009 Yearbook.
3
Small Capitalization Stock Premium
5.81%
Average annual return premium of small capitalization stocks (10th decile) per SBBI 2009 Yearbook.
4
Industry Adjustment
(0.19%)
Industry Adjustment - SIC Code 484, Cable and Other Pay Television Services per SBBI 2009 Yearbook.
5
+ Total Equity Premium
11.35%
6
+ Company Specific Risk Premium
4.00%
Based on Valuators assessment of specific company risks.
7
COST OF EQUITY
19.90%
8
Cost of Borrowing
8.00%
Estimated Marginal Cost of Borrowing.
9
- Tax Shield1
33.00%
(2.64%) Based on estimated tax rate.
10
COST OF DEBT
5.36%
% of Total
Type of Capital
Capital
Cost
Product
11
Equity
90%
19.90%
17.91%
12
Debt
10%
5.36%
0.54%
Based on industry capital structure and estimated debt capacity of the Company.
13
Weighted Average Cost of Capital
18.45%
14
Weighted Average Cost of Capital (rounded)
18.00%
Notes:
Notes:
1. The income tax rate used is the combined basic Canadian federal and provincial statutory tax rates presented in the Company's audited financial statements as filed with the SEC.
H-94

VALUATION OF NEULION INC. (C CORPORATION) AS
OF MARCH 31, 2010
OF MARCH 31, 2010
SCHEDULE
18
Guideline Company Information, Capitalization, and Fundamentals
Line
Description
NeuLion
Median
Average
High
Low
Company 1
Company 2
Company 3
Company 4
Company 5
Company 6
Company 7
Company Information
1
Ticker Symbol
NLN
KITD
TSX:ESP
BBND
SEAC
DIVX
RNWK
AKAM
2
Company Name
NeuLion
KIT digital,
Espial
BigBand
SeaChange
DivX, Inc.
RealNetwor
Akamai
3
Exchange
TSX
NasdaqGM
TSX
NasdaqGM
NasdaqGM
NasdaqGS
NasdaqGS
NasdaqGS
5
Fiscal Year End (Most Recent, Fully-Reported)
12/31/2009
12/31/2009
12/31/2009
12/31/2009
1/31/2010
12/31/2009
12/31/2009
12/31/2009
Capitalization ($ Thousands)
6
Total Shares Outstanding - MRQ
116,744
17,597
14,052
67,457
31,072
32,889
135,140
172,085
7
20 Day Average Stock Price
$
0.571
$
11.597
$
0.989
$
3.248
$
7.396
$
7.273
$
5.087
$
30.962
8
Market Value of Equity (MVE)
$
66,661
$
229,809
$
988,805
$
5,328,096
$
13,897
$
204,072
$
13,897
$
219,100
$
229,809
$
239,202
$
687,457
$
5,328,096
9
Total Interest Bearing Debt (TIBD) - MRQ
-
-
29,252
199,725
-
4,539
500
-
-
-
-
199,725
10
Market Value of Invested Capital (MVIC)
66,661
229,809
1,018,057
5,527,821
14,397
208,611
14,397
219,100
229,809
239,202
687,457
5,527,821
Fundamentals ($ Thousands)
Balance Sheet Items:
11
Cash - MRQ
$
12,958
$
24,894
$
76,698
$
277,030
$
6,791
$
6,791
$
8,712
$
24,894
$
37,647
$
8,589
$
277,030
$
173,224
12
Accounts Receivable - MRQ
2,056
20,218
44,563
148,696
1,961
20,218
1,961
18,495
54,278
7,356
60,937
148,696
13
Inventory - MRQ
929
-
3,353
17,830
-
708
-
4,933
17,830
-
-
-
14
Total Current Assets - MRQ
17,766
153,920
264,981
854,425
11,551
30,139
11,551
201,513
121,669
153,920
481,653
854,425
15
Net Fixed Assets - MRQ
3,424
11,417
44,134
190,211
1,895
5,697
2,924
11,417
39,682
1,895
57,114
190,211
16
Goodwill - MRQ
6,757
3,341
16,472
55,876
-
36,492
3,341
1,656
55,876
17,940
-
-
17
Total Assets - MRQ
40,269
223,588
503,488
2,116,683
20,040
80,414
20,040
223,588
267,147
209,658
606,883
2,116,683
19
TIBD - MRQ
-
-
29,252
199,725
-
4,539
500
-
-
-
-
199,725
20
Total Common Equity - MRQ
22,270
177,922
388,891
1,780,449
15,832
33,991
15,832
150,276
177,922
187,958
375,811
1,780,449
21
Net Worth (Common, Tangible) - MRQ
15,513
148,620
372,419
1,780,449
(2,501)
(2,501)
12,491
148,620
122,046
170,018
375,811
1,780,449
Income Statement Items:
22
Revenue - TTM
28,094
139,514
275,366
889,434
12,218
47,284
12,218
139,514
201,665
75,184
562,264
889,434
23
Cost of Goods Sold - TTM
14,387
58,345
92,557
234,850
2,965
21,720
2,965
58,345
98,412
9,465
222,142
234,850
24
Gross Profit - TTM
13,707
81,169
182,809
654,584
9,253
25,564
9,253
81,169
103,253
65,719
340,122
654,584
25
EBITDA - TTM
(15,061)
132
50,117
361,519
(26,184)
3,027
(2,401)
132
15,066
(341)
(26,184)
361,519
26
EBIT - TTM
(19,202)
(3,828)
26,008
255,611
(57,638)
(1,175)
(3,828)
(8,325)
3,615
(6,204)
(57,638)
255,611
27
Adjusted Net Income (ANI) - TTM
(19,641)
(4,157)
(13,393)
149,710
(216,764)
(19,942)
(4,157)
(6,739)
1,323
2,819
(216,764)
149,710
28
Cash Flow - TTM (ANI + Dnepr.)
(16,982)
1,718
5,790
239,027
(194,110)
(18,095)
(3,862)
1,718
9,318
6,536
(194,110)
239,027
Source: Capital IQ, a division of Standard & Poor's.
H-95

VALUATION OF NEULION INC. (C CORPORATION) AS
OF MARCH 31, 2010
OF MARCH 31, 2010
SCHEDULE
19
Guideline Company Ratio Analysis - Liquidity and Financial Leverage
Line
Description
NeuLion
Median
Average
High
Low
KITD
TSX:ESP
BBND
SEAC
DIVX
RNWK
AKAM
Liquidity
1
Quick Ratio - MRQ
0.89
1.04
1.31
2.54
0.59
0.59
2.54
0.80
1.51
1.03
1.66
1.04
2
Current Ratio - MRQ
1.06
2.75
3.46
9.95
0.65
0.65
2.75
3.73
2.00
9.95
2.37
2.76
3
Cash Ratio - MRQ
0.77
1.95
2.66
8.76
0.15
0.15
2.07
3.18
0.65
8.76
1.89
1.95
4
Average Working Capital Turnover - MRQ
58.17
3.26
2.04
6.62
(5.94)
(5.94)
3.33
1.89
6.62
1.09
4.04
3.26
Financial Leverage Ratios
5
Total Liabilities to Net Worth - MRQ
0.81
0.49
0.51
1.37
0.12
1.37
0.27
0.49
0.50
0.12
0.61
0.19
Total Interest Bearing Debt (TIBD) to:
6
EBITDA
-
-
0.26
1.50
(0.21)
1.50
(0.21)
-
-
-
-
0.55
7
Net Worth
-
-
0.04
0.13
-
0.13
0.03
-
-
-
-
0.11
8
Market Value of Equity
-
-
0.01
0.04
-
0.02
0.04
-
-
-
-
0.04
9
Interest Expense to TIBD
n/a
(0.01)
(0.13)
-
(0.37)
(0.37)
-
n/a
n/a
n/a
n/a
(0.01)
10
Debt to Equity
-
-
0.04
0.13
-
0.13
0.03
-
-
-
-
0.11
11
Debt to Total Capital
-
-
0.01
0.04
-
0.02
0.03
-
-
-
-
0.04
12
Assets to Equity
1.81
1.49
1.51
2.37
1.12
2.37
1.27
1.49
1.50
1.12
1.61
1.19
13
Total Debt Ratio
-
-
0.12
0.59
-
0.10
0.12
-
-
-
-
0.59
14
Interest Coverage
n/a
23.17
37.51
90.04
(0.69)
(0.69)
n/a
n/a
23.17
n/a
n/a
90.04
15
Fixed Charge Coverage Ratio
n/a
23.17
37.66
90.04
(0.24)
(0.24)
n/a
n/a
23.17
n/a
n/a
90.04
16
Times Interest Earned (CF to Interest Expense)
n/a
59.73
46.75
84.19
(3.68)
(3.68)
n/a
n/a
59.73
n/a
n/a
84.19
17
Cash Flow to Total Debt
n/a
(3.99)
(3.50)
1.20
(7.72)
(3.99)
(7.72)
n/a
n/a
n/a
n/a
1.20
H-96

VALUATION OF NEULION INC. (C CORPORATION) AS
OF MARCH 31, 2010
OF MARCH 31, 2010
SCHEDULE20Guideline Company Ratio Analysis - Activity, DuPont Analysis, and Business Risk
Line
Description
NeuLion
Median
Average
High
Low
KITD
TSX:ESP
BBND
SEAC
DIVX
RNWK
AKAM
Activity Ratios
1
Average A/R Turnover
12.05
5.97
7.13
16.01
3.31
3.31
5.83
6.22
4.02
16.01
8.58
5.97
2
Average A/P Turnover
5.70
16.23
20.99
64.48
6.31
7.61
6.31
15.65
18.07
64.48
16.23
18.56
3
Average Inventory Turnover
43.97
25.24
23.35
33.32
11.50
33.32
n/a
25.24
11.50
n/a
n/a
n/a
4
Average A/R Collection Period (Days)
29.20
62.05
64.14
109.50
21.90
109.50
62.05
58.40
91.25
21.90
43.80
62.05
5
Average A/P Payment Period (Days)
124.10
58.40
87.60
237.25
40.15
105.85
237.25
54.75
40.15
43.80
58.40
73.00
6
Average Inventory Processing Period (Days)
8.30
14.60
18.69
30.42
11.06
11.06
n/a
14.60
30.42
n/a
n/a
n/a
7
Cash Conversion Cycle (Days)
(87.00)
18.00
38.00
81.00
15.00
15.00
n/a
18.00
81.00
n/a
n/a
n/a
8
Average Total Asset Turnover
0.60
0.61
0.63
0.81
0.37
0.78
0.57
0.61
0.80
0.37
0.81
0.44
9
Average Fixed Asset Turnover
7.92
9.36
10.58
28.73
4.30
10.96
4.30
10.42
5.38
28.73
9.36
4.88
10
Average Equity Turnover
0.95
0.97
0.97
1.81
0.41
1.81
0.69
0.97
1.15
0.41
1.21
0.52
DuPont Analysis
11
Profitability (Net Income ÷ Sales)
(69.91%)
(4.83%)
(14.05%)
16.83%
(42.17%)
(42.17%)
(34.02%)
(4.83%)
0.66%
3.75%
(38.55%)
16.83%
12
Asset Turnover (Sales ÷ Assets)
60.00%
61.00%
62.57%
81.00%
37.00%
78.00%
57.00%
61.00%
80.00%
37.00%
81.00%
44.00%
13
Leverage (Assets ÷ Equity)
181.00%
149.00%
150.71%
237.00%
112.00%
237.00%
127.00%
149.00%
150.00%
112.00%
161.00%
119.00%
14
Return on Equity - DuPont Formula
(75.92%)
(4.39%)
(20.87%)
8.81%
(77.96%)
(77.96%)
(24.63%)
(4.39%)
0.79%
1.55%
(50.27%)
8.81%
Business Risk Ratios
15
Business Risk - Operating Income Variability
(0.97)
(0.67)
(0.76)
1.85
(2.88)
(0.82)
(0.67)
(2.80)
(2.88)
1.85
(0.51)
0.54
16
Sales Variability
1.04
0.25
0.34
0.81
0.17
0.81
0.17
0.24
0.18
0.35
0.25
0.40
17
Operating Leverage
n/a
1.42
0.86
1.91
(0.53)
0.78
1.44
(0.53)
(0.52)
1.55
1.91
1.42
H-97

VALUATION OF NEULION INC. (C CORPORATION) AS
OF MARCH 31, 2010
OF MARCH 31, 2010
SCHEDULE
21
Guideline Company Ratio Analysis - Profitability Margins and Tax Rates
Line
Description
NeuLion
Median
Average
High
Low
KITD
TSX:ESP
BBND
SEAC
DIVX
RNWK
AKAM
Profitability Ratios
Gross Profit Margin:
1
Most Recent Fiscal Year End
48.79%
60.49%
65.63%
86.24%
51.20%
54.06%
75.73%
58.18%
51.20%
86.24%
60.49%
73.51%
2
Five Year Average (Fiscal Year End)
57.75%
63.89%
63.50%
91.66%
41.08%
41.08%
71.25%
52.51%
47.63%
91.66%
63.89%
76.51%
SG&A to Sales:
3
Most Recent Fiscal Year End
102.40%
47.66%
44.25%
69.78%
22.88%
47.66%
51.19%
30.87%
22.88%
69.78%
49.50%
37.86%
4
Five Year Average (Fiscal Year End)
152.30%
53.72%
58.35%
131.92%
24.53%
131.92%
69.12%
28.82%
24.53%
57.69%
53.72%
42.65%
Adjusted Net Income Margin:
5
Most Recent Fiscal Year End
(69.91%)
(4.83%)
(14.54%)
16.97%
(42.17%)
(42.17%)
(34.02%)
(4.83%)
0.66%
0.19%
(38.55%)
16.97%
6
Five Year Average (Fiscal Year End)
(126.17%)
(1.51%)
(20.89%)
36.09%
(131.29%)
(131.29%)
(66.29%)
(6.98%)
(1.51%)
11.27%
12.49%
36.09%
Adjusted Net Income to Average Net Worth:
7
Most Recent Fiscal Year End
(66.26%)
(4.67%)
(20.19%)
8.82%
(76.26%)
(76.26%)
(23.42%)
(4.67%)
0.76%
0.07%
(46.65%)
8.82%
8
Five Year Average (Fiscal Year End)
n/a
(0.90%)
(20.76%)
33.28%
(149.36%)
(149.36%)
16.00%
(59.33%)
(0.90%)
16.65%
(1.68%)
33.28%
EBIT Margin:
9
Most Recent Fiscal Year End
(68.35%)
(5.97%)
(4.63%)
28.63%
(31.33%)
(2.48%)
(31.33%)
(5.97%)
1.79%
(12.78%)
(10.25%)
28.63%
10
Five Year Average (Fiscal Year End)
(104.76%)
(5.47%)
(20.67%)
25.78%
(103.53%)
(103.53%)
(56.44%)
(5.47%)
(3.29%)
8.02%
(9.73%)
25.78%
EBIT to Average Total Assets:
11
Most Recent Fiscal Year End
(40.85%)
(3.64%)
(3.17%)
12.40%
(17.72%)
(1.93%)
(17.72%)
(3.64%)
1.44%
(4.50%)
(8.26%)
12.40%
12
Five Year Average (Fiscal Year End)
n/a
(5.19%)
(16.29%)
11.64%
(72.93%)
(72.93%)
(46.69%)
(5.32%)
(2.01%)
6.49%
(5.19%)
11.64%
EBITDA Margin:
13
Most Recent Fiscal Year End
(53.61%)
0.09%
3.68%
40.51%
(19.65%)
6.40%
(19.65%)
0.09%
7.47%
(4.40%)
(4.66%)
40.51%
14
Five Year Average (Fiscal Year End)
(94.56%)
0.14%
(13.71%)
35.52%
(93.10%)
(93.10%)
(50.87%)
0.14%
3.22%
12.54%
(3.44%)
35.52%
Adjusted Tax Rate
15
Most Recent Fiscal Year End
-
15.83%
264.24%
1750.38%
(5.59%)
(5.59%)
-
15.83%
28.04%
1750.38%
(1.53%)
62.58%
16
Five Year Average (Fiscal Year End)
-
21.96%
75.22%
412.52%
(1.45%)
(1.45%)
-
10.91%
24.64%
412.52%
21.96%
57.93%
H-98

VALUATION OF NEULION INC. (C CORPORATION) AS
OF MARCH 31, 2010
OF MARCH 31, 2010
SCHEDULE
22
Guideline Company Ratio Analysis - Return Ratios
Line
Description
NeuLion
Median
Average
High
Low
KITD
TSX:ESP
BBND
SEAC
DIVX
RNWK
AKAM
Return Ratios
Return on Average Invested Capital:
1
Most Recent Fiscal Year End
(66.26%)
(4.67%)
(18.61%)
7.87%
(64.55%)
(64.55%)
(23.09%)
(4.67%)
0.76%
0.07%
(46.65%)
7.87%
2
Five Year Average (Fiscal Year End)
n/a
(3.10%)
(33.22%)
19.70%
(132.11%)
(132.11%)
(110.11%)
(15.18%)
(0.90%)
9.18%
(3.10%)
19.70%
Return on Average Total Equity:
3
Most Recent Fiscal Year End
(66.26%)
(4.67%)
(20.19%)
8.82%
(76.26%)
(76.26%)
(23.42%)
(4.67%)
0.76%
0.07%
(46.65%)
8.82%
4
Five Year Average (Fiscal Year End)
n/a
105.46%
108.93%
291.17%
(73.26%)
111.81%
(73.26%)
291.17%
105.46%
103.83%
102.27%
121.26%
Return on Average Common Equity:
5
Most Recent Fiscal Year End
(66.26%)
(4.67%)
(20.19%)
8.82%
(76.26%)
(76.26%)
(23.42%)
(4.67%)
0.76%
0.07%
(46.65%)
8.82%
6
Five Year Average (Fiscal Year End)
n/a
0.54%
(24.21%)
34.38%
(181.54%)
(181.54%)
18.78%
(52.59%)
0.54%
14.81%
(3.82%)
34.38%
H-99

VALUATION OF NEULION INC. (C CORPORATION) AS
OF MARCH 31, 2010
OF MARCH 31, 2010
SCHEDULE
23
Guideline Company Ratio Analysis - Growth Statistics
Line
NeuLion
Median
Average
High
Low
KITD
TSX:ESP
BBND
SEAC
DIVX
RNWK
AKAM
Growth Statistics
Revenue Growth:
1
Annual - FYE
108.99%
(0.08%)
10.71%
102.06%
(24.81%)
102.06%
20.84%
(24.71%)
(0.08%)
(24.81%)
(7.03%)
8.70%
2
Five Year Compound Annual Growth - FYE
79.66%
4.56%
9.36%
37.08%
(4.61%)
37.08%
2.72%
(4.61%)
4.56%
3.54%
7.30%
14.94%
EBIT Growth:
3
Annual - FYE
92.21%
(64.54%)
(85.52%)
(3.47%)
(207.61%)
(91.53%)
(36.42%)
(207.61%)
(64.54%)
(160.65%)
(34.42%)
(3.47%)
4
Five Year Compound Annual Growth - FYE
45.16%
(18.28%)
(55.54%)
27.39%
(223.55%)
(27.87%)
8.66%
(18.28%)
(173.19%)
(223.55%)
18.06%
27.39%
EBITDA Growth:
5
Annual - FYE
78.94%
(54.83%)
(64.54%)
2.49%
(125.02%)
(125.02%)
(54.83%)
(99.28%)
(22.08%)
(115.50%)
(37.55%)
2.49%
6
Five Year Compound Annual Growth - FYE
38.77%
(138.17%)
(97.18%)
28.99%
(212.46%)
(189.44%)
1.06%
(138.17%)
(212.46%)
(194.34%)
24.12%
28.99%
Net Income Growth:
7
Annual - FYE
68.78%
(22.57%)
(54.63%)
5.10%
(168.91%)
5.10%
(22.57%)
(168.91%)
(86.74%)
(98.69%)
(11.12%)
0.53%
8
Five Year Compound Annual Growth - FYE
45.82%
(23.37%)
(60.77%)
17.00%
(192.95%)
17.00%
(3.42%)
(23.37%)
(164.13%)
(43.59%)
(192.95%)
(14.95%)
Total Assets:
9
Annual - FYE
(25.06%)
7.34%
12.29%
94.66%
(23.08%)
94.66%
(13.51%)
(4.50%)
14.17%
7.34%
(23.08%)
10.98%
10
Five Year Compound Annual Growth - FYE
n/a
21.23%
21.41%
48.25%
(11.42%)
48.25%
21.23%
23.82%
5.15%
44.31%
(11.42%)
18.55%
H-100

VALUATION OF NEULION INC. (C CORPORATION) AS
OF MARCH 31, 2010
OF MARCH 31, 2010
SCHEDULE24Guideline Company Ratio Analysis - Depreciation and Capital Expenditures
Line
Description
NeuLion
Median
Average
High
Low
KITD
TSX:ESP
BBND
SEAC
DIVX
RNWK
AKAM
Depreciation and Capital Spending
Depreciation to Capital Expenditures:
1
Annual (Fiscal Year End)
221.95%
171.34%
230.28%
740.44%
95.69%
171.34%
180.98%
183.09%
95.69%
740.44%
134.79%
105.63%
2
Five Year Average (Fiscal Year End)
74.34%
89.94%
109.38%
233.01%
62.55%
87.01%
114.90%
92.15%
89.94%
233.01%
86.09%
62.55%
Capital Expenditures to Revenue:
3
Annual (Fiscal Year End)
4.26%
2.99%
3.45%
9.41%
0.71%
2.28%
1.33%
3.31%
4.14%
0.71%
2.99%
9.41%
4
Five Year Average (Fiscal Year End)
36.95%
5.68%
6.37%
15.32%
2.65%
5.95%
3.21%
6.76%
5.68%
2.65%
5.03%
15.32%
H-101

VALUATION OF NEULION INC. (C CORPORATION) AS
OF MARCH 31, 2010
OF MARCH 31, 2010
SCHEDULE
25
Guideline Valuation Multiples - Market Value of Invested Capital
Line
Description
Median
Average
High
Low
Company 1
Company 2
Company 3
Company 4
Company 5
Company 6
Company 7
Company Information
1
Ticker Symbol
KITD
TSX:ESP
BBND
SEAC
DIVX
RNWK
AKAM
2
Company Name
KIT digital,
Espial Group,
BigBand
SeaChange
DivX, Inc.
RealNetworks
Akamai
3
Exchange
NasdaqGM
TSX
NasdaqGM
NasdaqGM
NasdaqGS
NasdaqGS
NasdaqGS
4
Most Recent Quarter Available
12/31/2009
12/31/2009
12/31/2009
1/31/2010
3/31/2010
12/31/2009
3/31/2010
5
Fiscal Year End (Most Recent, Fully-Reported)
12/31/2009
12/31/2009
12/31/2009
1/31/2010
12/31/2009
12/31/2009
12/31/2009
Valuation Multiples
6
MVIC to Revenues - FYE
1.57
2.76
6.43
1.14
4.41
1.18
1.57
1.14
3.39
1.22
6.43
7
MVIC to Revenues - 3 yr avg
1.43
3.23
7.40
1.18
7.40
1.43
1.31
1.18
2.88
1.19
7.25
8
MVIC to Revenues - 5 yr avg
1.45
4.09
10.33
1.32
10.33
1.45
1.41
1.32
3.50
1.40
9.22
9
MVIC to Gross Profit - FYE
2.70
4.19
8.75
1.56
8.16
1.56
2.70
2.23
3.93
2.02
8.75
10
MVIC to Gross Profit - 3 yr avg
2.36
5.02
13.72
1.96
13.72
1.96
2.30
2.36
3.11
1.97
9.70
11
MVIC to Gross Profit - 5 yr avg
2.74
6.70
21.29
2.02
21.29
2.02
2.63
2.74
3.79
2.23
12.17
12
MVIC to EBITDA - FYE
4.63
(1.54)
68.92
(77.01)
68.92
(6.00)
n/m
15.25
(77.01)
(26.25)
15.87
13
MVIC to EBITDA - 3 yr avg
16.28
10.45
54.67
(28.41)
(17.19)
(2.36)
54.67
16.28
31.62
(28.41)
18.52
14
MVIC to EBITDA - 5 yr avg
24.92
13.86
72.29
(38.33)
(18.70)
(3.13)
72.29
31.87
28.13
(38.33)
24.92
15
MVIC to EBIT - FYE
(11.93)
(22.86)
63.57
(177.54)
(177.54)
(3.76)
(26.32)
63.57
(26.51)
(11.93)
22.46
16
MVIC to EBIT - 3 yr avg
(2.08)
15.59
78.12
(37.91)
(14.03)
(2.08)
(37.91)
69.89
78.12
(10.56)
25.68
17
MVIC to EBIT - 5 yr avg
(13.77)
(7.40)
45.42
(59.29)
(15.91)
(2.77)
(39.95)
(59.29)
45.42
(13.77)
34.45
18
MVIC to Total Assets - FYE
1.13
1.44
2.65
0.72
2.59
0.72
0.98
0.86
1.15
1.13
2.65
19
MVIC to Total Assets - 3 yr avg
0.97
1.71
4.48
0.68
4.48
0.68
0.97
0.96
1.19
0.77
2.95
20
MVIC to Total Assets - 5 yr avg
1.24
2.14
6.08
0.68
6.08
0.93
1.24
1.02
1.50
0.68
3.56
H-102

VALUATION OF NEULION INC. (C CORPORATION)
AS OF MARCH 31, 2010
AS OF MARCH 31, 2010
SCHEDULE
26
Guideline Company Valuation Method
Invested Capital to Revenue
Derivation of Market Multiples
Low
High
Notes / Comments
1
Market Multiples
2.760
6.430
See Schedule 25.
2
- Adjustment1,2
(0.270)
(1.929)
3
Market Multiples
2.49
4.50
Invested Capital to Revenue
Derivation of Value
Low
High
4
Adjusted Financial Measures
$
28,093,677
$
28,093,677
NeuLion 2009 Revenue.
5
x Market Multiple
2.49
4.50
See above.
6
Capitalized Value: Total Invested Capital
69,953,256
126,421,547
7
- Interest Bearing Debt
-
-
NeuLion has no interest bearing debt.
8
Value of Equity Capital
$
69,953,256
$
126,421,547
Rounded to Nearest:
9
Control Premium3
20%
13,990,651
25,284,309
$1,000
10
VALUE OF EQUITY CAPITAL
83,943,907
151,705,856
11
+ Value of Equity Interest in KyLin TV
8,080,000
8,080,000
See Schedule 15.
12
Adjusted Value of Equity Capital
$
92,023,907
$
159,785,856
INDICATION OF VALUE:
Rounded to Nearest:
13
GUIDELINE COMPANY VALUATION
$
92,025,000
$
159,785,000
5,000
Notes:
1. The average of the guideline public companies was used to determine the lower level of the range. However an adjustment to the Akamai multiple was made due to it being much larger
than NeuLion. 2.The Akamai multiple was used to determine the high of the range. However an adjustment to the Akamai multiple was made due to it being much larger than NeuLion. 3.
Review of Mergerstat control premiums for the Broadcasting and Communication Industry Groups.
than NeuLion. 2.The Akamai multiple was used to determine the high of the range. However an adjustment to the Akamai multiple was made due to it being much larger than NeuLion. 3.
Review of Mergerstat control premiums for the Broadcasting and Communication Industry Groups.
H-103

VALUATION OF NEULION INC. (C CORPORATION)
AS OF MARCH 31, 2010
AS OF MARCH 31, 2010
SCHEDULE
27
Merger and Acquisition Analysis - Capital IQ
Figures in Millions (except multiples)
Market
Summary Financial Data
Multiple
Transaction
MVIC
MVIC to:
Line
Seller
Buyer
Date
Revenues
EBITDA
Price
Revenues
1
NDS Group plc (nka:NDS Group Ltd.)
Permira Advisers Ltd.; News Corp.
02/05/09
$
850.1
$
214.0
$
3,665.7
4.312
2
AssetHouse Technology Limited
Amino Technologies plc
06/10/08
0.8
NA
2.7
3.500
3
BesTV Network Television Technology Development Co. Ltd.
Tsinghua Tongfang Co. Ltd.
2/27/2008*
9.0
NA
61.3
6.800
4
Median
$
9.0
$
214.0
$
61.3
4.312
5
Average
286.6
214.0
1,243.2
4.871
6
High
850.1
214.0
3,665.7
6.800
7
Low
0.8
214.0
2.7
3.500
Notes:
*This transaction was announced on February 27, 2008, but no closing date was
available. EBITDA is defined as earnings before interest, taxes, depreciation, and
amortization. EBIT is defined as earnings before interest and taxes.
available. EBITDA is defined as earnings before interest, taxes, depreciation, and
amortization. EBIT is defined as earnings before interest and taxes.
"n/a" reflects that information is not available.
H-104

VALUATION OF NEULION INC. (C CORPORATION)
AS OF MARCH 31, 2010
AS OF MARCH 31, 2010
SCHEDULE
28
Merger and Acquisition Valuation Method
Line
Description
Invested Capital to Revenue
Notes / Comments
Low
High
1
Adjusted Financial Measure
$
28,093,677
$
28,093,677
NeuLion 2009 Revenue.
2
x Market Multiple1
4.3
6.8
See Schedule 27.
3
Capitalized Value: Total Invested Capital
120,802,811
191,037,004
4
- Interest Bearing Debt
-
-
NeuLion has no interest bearing debt.
5
Value of Equity Capital
$
120,802,811
$
191,037,004
6
+ Value of Equity Interest in KyLin TV
8,080,000
8,080,000
See Schedule 15.
7
Adjusted Value of Equity Capital
$
128,882,811
$
199,117,004
INDICATION OF VALUE:
Rounded to Nearest:
8
MERGER AND ACQUISITION VALUATION
$
128,885,000
$
199,115,000
$5,000
Notes:
Notes:
1. This range of multiples was developed based on the relatively limited amount of transaction activity in the IPTV industry.
H-105

VALUATION OF NEULION INC. (C CORPORATION)
AS OF MARCH 31, 2010
AS OF MARCH 31, 2010
SCHEDULE
29
Weighted Indication of Value and Conclusion of Value
Line
Indicated Values by Method
Low
High
Weight
Low
High
1
Income Approach: Discounted Future Cash Flow Valuation Method (See Schedule 14)
$
105,035,000
$
154,325,000
85.00%
$
89,279,750
$
131,176,250
2
Market Approach: Guideline Company Valuation Method (See Schedule 26)
92,025,000
159,785,000
10.00%
9,202,500
15,978,500
3
Market Approach: Merger and Acquisition Valuation Method (See Schedule 28)
128,885,000
199,115,000
5.00%
6,444,250
9,955,750
4
Weighted Range of Value
$
104,926,500
$
157,110,500
5
Rounded:
$
104,900,000
$
157,100,000
Conclusion of Value
Low
High
6
Weighted Range of Value
$
104,926,500
$
157,110,500
7
÷ Total Shares Issued and Outstanding
116,731,794
116,731,794
8
Equity Value Per Share Based on Outstanding Shares
$
0.90
$
1.35
9
Equity Value (per middle point)
$
104,926,500
$
157,110,500
10
Proceeds From Exercise of Securities in the Money
7,862,619
15,757,619
11
Equity Value of Subject Interest - Including Proceeds From Exercise of Dilutive Securities
$
112,789,119
$
172,868,119
12
Equity Value of Subject Interest - Rounded
$
112,789,000
$
172,868,000
13
÷ Total Shares Issued and Outstanding Including Dilutive Securities
130,423,682
136,923,682
14
Fully Diluted Range of Value Per Share
$
0.86
$
1.26
H-106

VALUATION OF NEULION INC. (C CORPORATION)
AS OF MARCH 31, 2010
AS OF MARCH 31, 2010
SCHEDULE
30
Calculation of Proceeds From Sale of Dilutive Securities - Low
Summary of
Summary of
Proceeds
Number of
from
Options
Number
Exercise
Retention
Number
Exercise
Line
Description
Shares
Exercise
Exercise Price Outstanding
Proceeds
Exercise Price
Outstanding
Proceeds
1
Fully Dilluted Shares1
116,731,794
$
0.47
4,428,022
$
2,081,170
$
0.64
182,500
$
116,800
0.58
50,000
$
29,000
0.70
111,642
$
78,149
2
Options In The Money2
7,694,522
$
4,087,470
0.60
2,646,500
$
1,587,900
0.80
21,500
$
17,200
0.64
30,000
$
19,200
3
Restricted Share Units
6,724
$
-
0.67
500,000
$
335,000
$
315,642
$
212,149
0.88
40,000
$
35,200
4
Stock Appreciation Rights
675,000
413,000
$
7,694,522
$
4,087,470
5
Warrants
5,000,000
3,150,000
Stock
Appreciation
6
Retention Warrants
315,642
212,149
Warrants
Number
Exercise
Rights
Number
Exercise
Exercise Price Outstanding
Proceeds
Exercise Price
Outstanding
Proceeds
7
Fully Dilluted Shares
130,423,682
$
7,862,619
$
0.63
5,000,000
$
3,150,000
$
0.60
475,000
$
285,000
[a] Assumes holders elect to receive SAR benefit in shares of Neulion
0.64
200,000
$
128,000
[b] There is no exercise price for restricted share units
$
5,000,000
$
3,150,000
$
675,000
$
413,000
Notes:
Notes:
1. Based on 12/31/09 Listed
Price. 2. Based on $0.91 Market
Price.
Price. 2. Based on $0.91 Market
Price.
H-107

VALUATION OF NEULION INC. (C CORPORATION)
AS OF MARCH 31, 2010
AS OF MARCH 31, 2010
SCHEDULE
31
Calculation of Proceeds From Sale of Dilutive Securities - High
Summary of
Summary of
Proceeds
Number of
from
Options
Number
Exercise
Retention
Number
Exercise
Line
Description
Shares
Exercise
Exercise Price Outstanding
Proceeds
Exercise Price
Outstanding
Proceeds
1
Fully Dilluted Shares1
116,731,794
$
0.47
4,428,022
$
2,081,170
$
0.64
182,500
$
116,800
0.58
50,000
$
29,000
0.70
111,642
$
78,149
2
Options In The Money2
7,694,522
$
4,087,470
0.60
2,646,500
$
1,587,900
0.80
21,500
$
17,200
0.64
30,000
$
19,200
3
Restricted Share Units
6,724
$
-
0.67
500,000
$
335,000
$
315,642
$
212,149
0.88
40,000
$
35,200
4
Stock Appreciation Rights
675,000
413,000
$
7,694,522
$
4,087,470
Stock
5
Warrants
11,500,000
11,045,000
Appreciation
Warrants
Number
Exercise
Rights
Number
Exercise
6
Retention Warrants
315,642
212,149
Exercise Price Outstanding
Proceeds
Exercise Price
Outstanding
Proceeds
7
Fully Dilluted Shares
136,923,682
$
15,757,619
$
0.63
5,000,000
$
3,150,000
$
0.60
475,000
$
285,000
1.19
5,500,000
$
6,545,000
0.64
200,000
$
128,000
[a] Assumes holders elect to receive SAR benefit in shares of Neulion
1.35
1,000,000
$
1,350,000
[b] There is no exercise price for restricted share units
$
675,000
$
413,000
$
11,500,000
$
11,045,000
Notes:
1. Based on 12/31/09 Listed
Price. 2. Based on $1.36 Market
Price.
Price. 2. Based on $1.36 Market
Price.
H-108

Appendix A - Stock Options, Warrants, and Dilutive Securities
H-109

NeuLion, Inc.
Summary of Securities Outstanding Under Stock Option and Stock-Based Compensation Plans
#
#
Security Class
Outstanding
Exercisable
Comments
Stock Options [a]
8,657,897
2,851,117 Exercise price range: $0.47 to $6.43
Wtd. avg. exercise price: $0.98
Restricted share units [b]
6,724
- Non-vested at 12/31/09
Stock appreciation rights [c]
1,675,000
1,229,551 Exercise price range: $0.60 to $4.00
Wtd. avg. exercise price: $2.63
Warrants [d]
17,697,500
17,624,198 Exercise price range: $0.63 to $6.23
Wtd. avg. exercise price: $1.07
Retention Warrants [e]
847,892
463,708 Exercise price range: $0.64 to $3.86
Wtd. avg. exercise price: $2.67
Potential Additional Shares
28,885,013
22,168,574
[e] Exercisable for 1 share per option. Average weighted remaining option life is 3.68 years. [b]
Represents the right to 1 share per vested restricted share unit. Units vest on a monthly basis. [c] The
holder may elect to receive cash compensation or to receive shares equal to the number of units granted
under the SARS plan, less the exercise price.
Represents the right to 1 share per vested restricted share unit. Units vest on a monthly basis. [c] The
holder may elect to receive cash compensation or to receive shares equal to the number of units granted
under the SARS plan, less the exercise price.
[d] Exercisable for 1 share per warrant. Average weighted remaining warrant life is 0.91 years.
[e] Exercisable for 1 share per warrant. Average weighted remaining warrant life is 2.87 years.
[e] Exercisable for 1 share per warrant. Average weighted remaining warrant life is 2.87 years.
H-110

Appendix B - Description of Guideline Public Companies
H-111

Below are descriptions of the Guideline Public Companies used in our analysis22:
■ KIT digital is a leading, global provider of on-demand, Internet Protocol (IP)-based video asset management solutions. KIT
VX, the company's end-to-end software platform, enables enterprise clients to acquire, manage and distribute video assets
across the three screens of today's world: the personal computer, mobile device, and IPTV-enabled television set. The
application of VX ranges from commercial video distribution to internal corporate deployments, including corporate
communications, human resources, training, security and surveillance. KIT digital's client base includes more than 600
enterprise customers across 30+ countries, including The Associated Press, Best Buy, Bristol-Myers Squibb, Disney-ABC,
General Motors, Google, IMG Worldwide, Intel, McDonald's, News Corp, Telefonica, the U.S. Department of Defense,
Verizon, and Vodafone. KIT digital maintains principal offices in Prague, Cologne, Dubai, London, Melbourne (Australia),
New York, Stockholm and Toronto.
■ Espial Group Inc. engages in the development and marketing of software solutions that enable the delivery of Internet
Protocol Television (IPTV). The company’s IPTV is a platform that facilitates the provision of digital television and other
video services with Internet like functionality over an Internet protocol enabled broadband network infrastructure. Its
products and services consists of Evo IPTV Service Platform that includes Evo Client Middleware, an IPTV middleware
and applications platform; Evo Server Middleware, a software that coordinates various IPTV components, such as VOD
and DRM servers, EPG data sources, and billing and other systems; and Evo Applications for Web based browser and
portal services, which comprise Evo Portal, Browser, BML Browser, and Skin Tones. The company’s products and services
also comprise Evo Future-Proof Framework that includes Evo Service Creation Environment, an intuitive software
environment to help design and develop Evo Applications; MediaBase video on demand products; IPTV services; and
legacy products, such as a suite of software for accessing in-room guest services, including browser and user interface
products to enable services, such as local hotel information, VOD, interactive games, Web mail, and Internet on TV. It has
operations in Europe, the Asia Pacific, and North America. Espial Group’s solutions enable communications service
providers, including telecommunications, cable TV, satellite TV, and Internet service providers to deploy IPTV services to
the subscribers. The company was founded in 1997 and is headquartered in Ottawa, Canada.
22 www.capitaliq.com
H-112

■ BigBand Networks, Inc. develops, markets, and sells network-based platforms in the United States and internationally. The
company’s network-based platforms enable cable operators and telecommunications companies to offer video services
across coaxial, fiber, and copper networks. Its digital simulcast product application enables service providers to create a
digital version of analog inputs, and deliver analog and digital video streams to subscribers. The company also offers
BigBand Broadband Multimedia-Service Router, a platform that is used for the real-time processing and switching of video;
BigBand Broadband Edge QAM, which converts digital video and data streams into quadrature amplitude
modulated RF carriers that transport video and data across cable networks to subscriber set top boxes and cable modems;
BigBand Media Services Platform, a chassis-based platform that enables service providers to offer personalized video
applications; and Converged Video Exchange, a control plane solution designed to manage various numbers of video
sessions, while optimizing network bandwidth utilization. In addition, it offers switched digital video solutions that enable
service providers to transmit video channels to subscribers only when the subscribers in a service group are in the process
of watching those channels; and broadcast video solutions, which enable digital media processing and transport
technologies for service providers. Further, the company provides an alternative solution to deliver IP video services to
home computers, IP set top boxes, and other IP consumer devices. BigBand Networks, Inc. sells its products in the United
States and Canada primarily through its direct sales force; and internationally through a combination of direct sales to
service providers and sales through independent resellers. The company was founded in 1998 and is headquartered in
Redwood City, California.
■ SeaChange International, Inc. develops, manufactures, and markets digital video systems worldwide. The company operates
in three segments: Software, Servers and Storage, and Media Services. The Software segment develops, sells, and supports
advertising, video on demand (VOD), middleware, and broadcast software. This segment also offers professional services,
installation, training, project management, product maintenance, technical support, and software development services. The
Servers and Storage segment develops VOD and broadcast servers. This segment also offers professional services,
installation, training, project management, product maintenance, and technical support. The Media Services segment
provides media content services, including video, television programming, and advertising content aggregation and
distribution. This segment specializes in aggregating content for video on demand and pay-per-view platforms, and
provides marketing, promotional, and production services to cable operators and telecommunications providers in Europe.
SeaChange International serves cable system operators, telecommunications companies, and broadcast television
companies. The company sells its products directly, as well as through independent agents and distributors. SeaChange
International, Inc. was founded in 1993 and is headquartered in Acton, Massachusetts.
H-113

■ DivX, Inc. creates products and provides services to enhance the consumers’ media experience. It primarily offers video
compression-decompression software library (codec), as well as consumer software, including the DivX Player application.
The company’s technologies enable users to compress, secure, distribute, and view digital video and participate in its digital
media ecosystem. It offers various consumer software product bundles, including DivX and DivX Pro for Windows and
Mac bundles. The company also provides DivX Mobile Player that allows users to playback DivX videos on their handsets
from various sources; and DivX Author for Windows operating system, which allows users to combine and edit multiple
videos into a single DivX video, add the features of the DivX format, and slideshows with videos, photos, and music. In
addition, it provides technology licensing for independent software vendors, consumer hardware de vice
manufacturers, content creators, and consumers. Further, the company offers certification programs to integrated circuit
manufacturers, original design manufacturers, original equipment manufacturers, and software vendors. Additionally, it
provides Open Video System, a hosted service that allows content creators to deliver DivX video content over the Internet.
The company markets its technologies to a range of integrated circuit manufacturers, original design manufacturers, original
equipment manufacturers, retailers, operators, and software developers. DivX, Inc. was incorporated in 2000 and is
headquartered in San Diego, California.
■ RealNetworks, Inc. provides network-delivered digital media products and services worldwide. It develops and markets
software products and services that enable the creation, distribution, and consumption of digital media, including audio and
video. The company operates in four segments: Technology Products and Solutions (TPS), Media Software and Services
(MSS), Games, and Music. The TPS segment primarily offers software-as-a-service offerings, which include ringback
tones, music-on-demand, video-on-demand, and messaging services, as well as system software licen se sales and
intellectual property licensing. This segment also licenses Helix server software that allows companies to broadcast live and
on-demand audio, video, and other multimedia programming to users over the Internet. The MSS segment offers
RealPlayer, a media player software, which includes features and services that enable consumers to discover, play,
download, manage, and edit digital video. The Games segment offers various casual games available through digital
downloads or online portals, social networks, and mobile devices. This segment also involves in game development,
publishing, licensing, and distribution. It distributes games principally in North America, Europe, and Latin America
through the company’s own Web sites, which are operated under the GameHouse, RealArcade, Zylom, and Atrativa brands,
and through Web sites owned or managed by third parties. In addition, this segment develops and distributes games for
other platforms, including mobile phones, other handheld devices, and videogame consoles. The Music segment offers
Rhapsody, a subscription and advertising-supported music service; Rhapsody.com, a free Web-based limited version digital
music service; and Rhapsody MP3 music store, where consumers purchase and download individual digital music tracks.
The company was founded in 1994 and is headquartered in Seattle, Washington.
H-114

■ Akamai Technologies, Inc. provides services for accelerating and improving the delivery of content and applications over the
Internet in the United States and internationally. The company offers Application Performance solutions that improve the
performance of dynamic applications used by enterprises to connect with their employees, suppliers, and customers. Its
Application Performance solutions include Web Application Accelerator, which enables enterprises to run various
applications; and IP Application Accelerator that is designed to address core Internet weaknesses to optimize the
performance and real-time sensitivity associated with IP-enabled applications delivered over Internet-related protocols. It
also provides Digital Asset solutions that enable enterprises to execute their large file management and distribution
strategies. The company’s Digital Asset solutions include Akamai Media Delivery solution that delivers media content on
behalf of its customers; and Electronic Software Delivery solution, which handles the distribution of software for its
customers. In addition, it offers Dynamic Site solutions, which accelerate business-to-consumer Websites that integrate
collaborative content and applications into their online architecture; Advertising Decision solutions that enable advertisers,
agencies, publishers, and networks to buy and sell advertising; and custom solutions to commercial and government
customers. Additionally, the company offers other solutions, such as EdgeControl tools that provide reporting and
management capabilities; network data feeds and Website analytics, which provide customers with real time data about the
performance of their content and applications over the Internet; and performance management services that help customers
better understand their Web operations with tools that measure various aspects of an application’s performance. Akamai
Technologies, Inc. was founded in 1998 and is headquartered in Cambridge, Massachusetts.
H-115

Appendix C - Sources of Information
H-116

Several sources of information were used to complete this valuation. They include but are not limited to the following:
1.
2009 NeuLion Form 10K as filed with the SEC.
2.
2008 Jump TV Form 10K as filed with the SEC.
3. Audited Financial Statements for NeuLion for December 31, 2007 through December 31, 2009
4. Management prepared financial forecast for the years 2010 through 2015.
4. Management prepared financial forecast for the years 2010 through 2015.
5. Management provided information regarding the Dish Network contract, warrants, and subscriber targets.
6. Valuation of INSINC’s intangible assets as of October 31, 2009 as prepared by Peter Ott & Associates, Inc.
7. Valuation of Jump TV’s intangible assets as of October 20, 2008 as prepared by Peter Ott & Associates, Inc.
8. Proposed TransVideo Acquisition Executive Summary, Board Presentation dated March 16, 2010.
9. Discussion Materials- Executive Summary of Potential Transaction with NeuLion and Jump TV as prepared by Oppenheimer.
10. Management Prepared Goodwill Impairment Analysis, as of January 6, 2010.
11. Software License and Product Distribution Agreement between NeuLion and TransVideo dated September 29, 2006.
12. Information from the Company’s website www.neulion.com, as well as other industry and competitor websites.
12. Information from the Company’s website www.neulion.com, as well as other industry and competitor websites.
13. Public company information and market transaction data from Capital I.Q.
14. Ibbotson 2009 SBBI Yearbook, Morningstar
15. 2009 Ibbotson Cost of Capital Yearbook, Morningstar
16. Federal Reserve Statistical Release H.15
16. Federal Reserve Statistical Release H.15
17. U.S. Economic data obtained from National Economic Review - Business Valuation Resources, Inc.
18. Other internal schedules, reports, marketing materials and data provided by the management of NeuLion, Inc.
19. Conversations with various industry participants.
20. Various external industry and valuation resource materials.
In addition to the documentation detailed above, an interview with members of NeuLion management, including Art McCarthy, Roy
Riechbach, Chris Wagner, Charles Wang, and Nanci Li, was conducted during our site visit at the Company’s headquarters in
Plainview, New York.
Riechbach, Chris Wagner, Charles Wang, and Nanci Li, was conducted during our site visit at the Company’s headquarters in
Plainview, New York.
H-117

Appendix D - Contingent and Limiting Condition
H-118

This valuation report is subject to the following contingent and limiting Conditions:
1.Information, estimates, and opinions contained in this report are obtained from sources considered reliable; however, UHY Advisors
FLVS, Inc. has not independently verified such information and no liability for such sources is assumed by the valuation analysts
identified in this report. UHY Advisors FLVS, Inc. has not audited, reviewed, or compiled the financial information provided to us
and, accordingly, express no audit opinion or any other form of assurance on this information. 2.All facts and data set forth in the report
are true and accurate to the best of the valuation analysts’ knowledge and belief. We have not knowingly withheld or omitted anything
from our report affecting our value estimate.
3.
We assume that there are no hidden or unexpected conditions of the business that would adversely affect value, other than as
indicated in this report.
4. This valuation was performed as of the valuation date and for the purpose specifically stated in the report. The valuation is valid
only for the stated valuation date and for the stated specific purpose. The report may not be used for any other purpose. The
report and conclusion of value are not to be construed as investment advice in any manner whatsoever.
only for the stated valuation date and for the stated specific purpose. The report may not be used for any other purpose. The
report and conclusion of value are not to be construed as investment advice in any manner whatsoever.
5. The various estimates of value presented in this report apply to this valuation only and may not be used out of the context presented
herein. Any other use of this report may lead the user to an incorrect conclusion for which UHY Advisors FLVS, Inc. assumes no
responsibility.
herein. Any other use of this report may lead the user to an incorrect conclusion for which UHY Advisors FLVS, Inc. assumes no
responsibility.
6. Possession of this report, or a copy thereof, does not carry with it the right of publication of all or part of any item nor may it be used
for any purpose without the previous written consent of the valuation analysts, and in any event only with proper authorization.
Authorized copies of this report will be signed in blue ink by a Managing Director and/or Principal of UHY Advisors FLVS, Inc.
Unsigned copies, or copies not signed in blue ink, should be considered to be incomplete.
7.
No change of any item in this appraisal report shall be made by anyone other than UHY Advisors FLVS, Inc., and we shall have
no responsibility for any such unauthorized change.
8. Unless stated otherwise in this report, we express no opinion as to: 1) the tax consequences of any transaction that may result; 2) the
effect of the tax consequences of any net value received or to be received as a result of a transaction; and 3) the possible impact on
the value resulting from any need to effect a transaction to pay taxes.
effect of the tax consequences of any net value received or to be received as a result of a transaction; and 3) the possible impact on
the value resulting from any need to effect a transaction to pay taxes.
9. This valuation and report were prepared for the users identified in this report. None of the contents of this valuation report shall be
conveyed to any third party or to the public through any means without the express written consent of UHY Advisors FLVS, Inc.
conveyed to any third party or to the public through any means without the express written consent of UHY Advisors FLVS, Inc.
10. Our valuation opinion is necessarily based on the definition of value stated in the report. An actual transaction in the interests of
the business may be concluded at a higher value or lower value, depending on the circumstances surrounding the business, the
appraised business interest, and the motivations and knowledge of both the buyers and sellers at that time. UHY Advisors FLVS,
Inc. makes no guarantees about what value individual buyers and sellers may reach in an actual transaction.
H-119

11. No investigation of titles to property or of any claims on ownership of the property of the business by any individuals or company
has been undertaken. Unless otherwise stated in our report, title is assumed to be clear and free of encumbrances and as provided
to us.
has been undertaken. Unless otherwise stated in our report, title is assumed to be clear and free of encumbrances and as provided
to us.
12. We have relied on the representations of the owners, management, and other third parties concerning the value and useful condition
of all equipment, real estate, investments used in the business, and any other assets or liabilities, except as specifically stated
otherwise in this report. We have not attempted to confirm whether or not all assets of the business are free and clear of liens and
encumbrances or that the entity has good title to all assets.
13. Unless otherwise provided for in writing and agreed to by both parties in advance, the extent of the liability for the completeness or
accuracy of the data, opinions, comments, recommendations and conclusions shall not exceed the amount paid to UHY Advisors
FLVS, Inc. for professional fees, and then only to the party or parties for whom this report was originally prepared.
accuracy of the data, opinions, comments, recommendations and conclusions shall not exceed the amount paid to UHY Advisors
FLVS, Inc. for professional fees, and then only to the party or parties for whom this report was originally prepared.
14. It should be specifically noted that the valuation assumes the business will be competently managed and maintained by financially
sound owners, throughout the expected period of ownership. This valuation engagement does not entail an evaluation of
management’s effectiveness, nor are we responsible for future marketing efforts and other management or ownership actions upon
which actual results will depend. The conclusion of value arrived at herein is based on the assumption that the current level of
management expertise and effectiveness would continue to be maintained, and that the character and integrity of the business
through any sale, reorganization, exchange, or diminution of the owners’ participation would not be materially or significantly
changed.
15. Valuation reports may contain prospective financial information, estimates, or opinions that represent the view of the business’
management and/or the valuation analysts about reasonable expectations at a particular point in time, but such information,
estimates, or opinions are not offered as predictions or as assurances that a particular level of income or profit will be achieved or
that specific events will occur. We do not provide assurance on the achievability of results forecasted by the business or its
representatives because events and circumstances frequently do not occur as expected; differences between actual and expected
results may be material; and achievement of the forecasted results is dependent on actions, plans, and assumptions of management.
16. Any decision to purchase, sell, or transfer any interest in the subject company shall be your sole responsibility, as well as the
structure to be utilized and the price to be accepted.
structure to be utilized and the price to be accepted.
17. Public information and industry and statistical information have been obtained from sources we believe to be reliable. However,
we make no representation as to the accuracy or completeness of such information and have performed no procedures to
corroborate the information.
we make no representation as to the accuracy or completeness of such information and have performed no procedures to
corroborate the information.
18. No opinion is intended to be expressed for matters that require legal or other specialized expertise, investigation, or knowledge
beyond that customarily employed by appraisers valuing businesses.
beyond that customarily employed by appraisers valuing businesses.
H-120

19. Neither all nor any part of the contents of this report should be disseminated to the public through advertising media, public
relations, news media, sales media, mail, direct transmittal, or any other means of communication, including but not limited to the
Securities Exchange Commission or other governmental agency or regulatory body, without the prior written consent and approval
of UHY Advisors FLVS, Inc.
relations, news media, sales media, mail, direct transmittal, or any other means of communication, including but not limited to the
Securities Exchange Commission or other governmental agency or regulatory body, without the prior written consent and approval
of UHY Advisors FLVS, Inc.
20. UHY Advisors FLVS, Inc. does not consent to be “expertised” with respect to matters involving the Securities and Exchange
Commission or the Ontario Securities Commission. For purposes of this report, the foregoing sentence means that UHY Advisors
FLVS, Inc. shall not be referred to by name or anonymously in any filing or document. Should you breach this stipulation and
refer to UHY Advisors FLVS, Inc. by name or anonymously, you will amend such filing or document upon written request by
UHY Advisors FLVS, Inc.
21. It is assumed that there are no regulations of any government entity to control or restrict the use of the underlying assets of the
business, unless specifically referred to in the report, and that the underlying assets will not operate in violation of any applicable
government regulations, codes, ordinances, or statutes. Unless otherwise stated, no effort has been made to determine the possible
effect, if any, on the subject business due to future Federal, state, or local legislation, including any environmental or ecological
matters or interpretations thereof.
22. UHY Advisors FLVS, Inc. is not an environmental consulting firm nor audit firm, and it takes no responsibility for any actual or
potential environmental liabilities. Any person entitled to rely on this report, wishing to know whether such liabilities exist, or the
scope and their effect on the value of the property of the business, is encouraged to obtain a professional environmental assessment.
UHY Advisors FLVS, Inc. does not conduct or provide environmental assessments and has not performed one for the subject
property of the business.
23. UHY Advisors FLVS, Inc. has not determined independently whether the business is subject to any present or future liability
relating to environmental matters (including, but not limited to CERCLA/Superfund liability) nor the scope of any such liabilities.
UHY Advisors FLVS, Inc.’s valuation takes no such liabilities into account, except as they have been reported to us or by an
environmental consultant working for the business, and then only to the extent that the liability was reported to us in an actual or
estimated dollar amount. Such matters, if any, are noted in the report. To the extent such information has been reported to us, we
have relied on it without verification and UHY Advisors FLVS, Inc. offers no warranty or representation as to its accuracy or
completeness.
24. UHY Advisors FLVS, Inc. has not made a specific compliance survey or analysis of the subject property of the business to
determine whether it is subject to, or in compliance with, the American Disabilities Act of 1990, and this valuation does not
consider the effect, if any, of noncompliance.
determine whether it is subject to, or in compliance with, the American Disabilities Act of 1990, and this valuation does not
consider the effect, if any, of noncompliance.
H-121

25. We are not required to give testimony in court, or be in attendance during any hearings or depositions, with reference to the
business being valued, unless previous arrangements have been made.
business being valued, unless previous arrangements have been made.
26. This valuation reflects facts and conditions existing at the valuation date. Subsequent events have not been considered, and we
have no obligation to update our report for such events and conditions. However, we reserve the right to disclose such subsequent
events discovered after the valuation date which we determine may be meaningful to the intended user of this report.
have no obligation to update our report for such events and conditions. However, we reserve the right to disclose such subsequent
events discovered after the valuation date which we determine may be meaningful to the intended user of this report.
H-122

Appendix E - Valuator’s Certification
H-123

We certify that, to the best of our knowledge and belief…
♦ The statements of fact contained in this report are true and correct, subject to the assumptions and conditions stated.
♦ The reported analyses, opinions, and conclusions are limited only by the reported assumptions and limiting conditions and are our
personal, impartial, unbiased, and professional analyses, opinions, and conclusions.
personal, impartial, unbiased, and professional analyses, opinions, and conclusions.
♦ Our engagement in this assignment was not contingent upon developing or reporting predetermined results.
♦ Our compensation for completing this assignment is not contingent upon the development or reporting of a predetermined value or
direction in value that favors the cause of the client, the amount of the value opinion, the attainment of a stipulated result, or the
occurrence of a subsequent event directly related to the intended use of this appraisal.
♦ Our analyses, opinions, and conclusions were developed, and this report has been prepared, in conformity with the Uniform
Standards of Professional Appraisal Practice, and the American Institute of Certified Public Accountants Statement on
Standards for Valuation Services.
Standards of Professional Appraisal Practice, and the American Institute of Certified Public Accountants Statement on
Standards for Valuation Services.
♦ This report was prepared under the direction of Bruce L. Richman, CPA, ABV. Neither any of the professionals who worked on
this engagement, nor the managing directors of UHY Advisors FLVS, Inc., have any present or contemplated future interest in
NeuLion, Inc., any personal interest with respect to the parties involved, or any other interest that might prevent us from
performing an unbiased valuation.
this engagement, nor the managing directors of UHY Advisors FLVS, Inc., have any present or contemplated future interest in
NeuLion, Inc., any personal interest with respect to the parties involved, or any other interest that might prevent us from
performing an unbiased valuation.
♦ No one provided significant professional assistance to the signer of this report, except for Patrick Corden and James Kazmier.
Bruce L. Richman, CPA/ABV, CVA
H-124

Appendix F - Curriculum Vitae
H-125

Bruce L. Richman
BACKGROUND:
Since 1980, Mr. Richman has been actively involved in business valuations, mergers and acquisitions and other financial and tax consulting matters. He is a
Managing Director of UHY Advisors FLVS, Inc. In his current position, Mr. Richman is responsible for various corporate valuation projects, forensic/litigation
assignments, and consulting services in the United States and for U.S. clients internationally.
Managing Director of UHY Advisors FLVS, Inc. In his current position, Mr. Richman is responsible for various corporate valuation projects, forensic/litigation
assignments, and consulting services in the United States and for U.S. clients internationally.
PROFESSIONAL EXPERIENCE:
Prior to joining UHY, Mr. Richman was the Managing Director at the Trenwith Valuation, LLC (a subsidiary of BDO) and until June 2004 was a Partner in the
Business Valuation Practice Group for BDO Seidman, LLP. Prior to joining BDO, Mr. Richman was the President of the Investigative Valuation Group, LLC.
Before that, he was a partner in a national CPA firm and was in involved with business valuations consulting services. In addition to the business valuation area,
Mr. Richman has extensive experience in the area of tax planning and compliance as well as the financial analysis and structuring of a wide variety of real estate
projects, including real estate syndications, due diligence, workouts, and the strategic planning for troubled real estate. Mr. Richman has directed hundreds of
engagements involving “going-concern” valuations. His valuation experience covers a full spectrum of industries from hospitality to manufacturing and private
equity groups. He has been involved in several major litigation support projects as an expert witness, having testified in numerous courts and arbitration panels.
The results from Mr. Richman’s valuation projects have been used for the following purposes, among others:
*
Income, gift, and estate taxes
*
Workouts and reorganizations
*
Litigation and expert testimony
*
Strategic planning
*
Lost profits & Shareholder disputes
*
Ownership succession & buy-sell agreements
*
Mergers and acquisitions
*
Corporate Financial Reporting
*
Matrimonial matters
*
Intellectual Property
*
Private equity groups
*
Hedge Funds
EDUCATIONAL BACKGROUND:
Mr. Richman received his Bachelor of Science in Business Administration from North Adams State College in 1978; a Masters of Science in Accounting from
The Ohio State University in 1980; and a Masters of Science in Taxation from Bentley College in 1994. In 2009, Mr. Richman earned an MBA from the J.L.
Kellogg Graduate School of Management at Northwestern University with a major in International Business. Bruce has also taken other specialized training in
Business Valuation.
AFFILIATIONS:
Mr. Richman is a Certified Public Accountant (CPA); an ABV - Accredited in Business Valuations by the AICPA; a Certified Valuation Analyst (CVA) and a
Certified Forensic Accountant. Mr. Richman is also a candidate for the ASA designation with the American Society of Appraisers, specializing in business
valuation. He is also a member of The Forensic CPA Society.
Certified Forensic Accountant. Mr. Richman is also a candidate for the ASA designation with the American Society of Appraisers, specializing in business
valuation. He is also a member of The Forensic CPA Society.
Mr. Richman has published various articles, manuals and books in the areas of business valuation and financial matters, and has been a speaker at various
professional associations. Mr. Richman has also been quoted in the Wall Street Journal and USA Today and has appeared on MSNBC and CNNfn.
professional associations. Mr. Richman has also been quoted in the Wall Street Journal and USA Today and has appeared on MSNBC and CNNfn.
H-126
APPENDIX “I”
SECTION 190 OF THE CBCA
190. (1) Subject to sections 191 and 241, a holder of shares of any class of a corporation may dissent if the corporation is subject to an order under paragraph 192(4)(d) that affects the holder or if the corporation resolves to (a) amend its articles under section 173 or 174 to add, change or remove any provisions restricting or constraining the issue, transfer or ownership of shares of that class; (b) amend its articles under section 173 to add, change or remove any restriction on the business or businesses that the corporation may carry on; (c) amalgamate otherwise than under section 184; (d) be continued under section 188; (e) sell, lease or exchange all or substantially all its property under subsection 189(3); or (f) carry out a going-private transaction or a squeeze-out transaction. | |
| Further right | (2) A holder of shares of any class or series of shares entitled to vote under section 176 may dissent if the corporation resolves to amend its articles in a manner described in that section. |
| If one class of shares | (2.1) The right to dissent described in subsection (2) applies even if there is only one class of shares. |
| Payment for shares | (3) In addition to any other right the shareholder may have, but subject to subsection (26), a shareholder who complies with this section is entitled, when the action approved by the resolution from which the shareholder dissents or an order made under subsection 192(4) becomes effective, to be paid by the corporation the fair value of the shares in respect of which the shareholder dissents, determined as of the close of business on the day before the resolution was adopted or the order was made. |
| No partial dissent | (4) A dissenting shareholder may only claim under this section with respect to all the shares of a class held on behalf of any one beneficial owner and registered in the name of the dissenting shareholder. |
| Objection | (5) A dissenting shareholder shall send to the corporation, at or before any meeting of shareholders at which a resolution referred to in subsection (1) or (2) is to be voted on, a written objection to the resolution, unless the corporation did not give notice to the shareholder of the purpose of the meeting and of their right to dissent. |
| Notice of resolution | (6) The corporation shall, within ten days after the shareholders adopt the resolution, send to each shareholder who has filed the objection referred to in subsection (5) notice that the resolution has been adopted, but such notice is not required to be sent to any shareholder who voted for the resolution or who has withdrawn their objection. |
| Demand for payment | (7) A dissenting shareholder shall, within twenty days after receiving a notice under subsection (6) or, if the shareholder does not receive such notice, within twenty days after learning that the resolution has been adopted, send to the corporation a written notice containing |
I-1
(a) the shareholder’s name and address; (b) the number and class of shares in respect of which the shareholder dissents; and (c) a demand for payment of the fair value of such shares. | |
| Share certificate | (8) A dissenting shareholder shall, within thirty days after sending a notice under subsection (7), send the certificates representing the shares in respect of which the shareholder dissents to the corporation or its transfer agent. |
| Forfeiture | (9) A dissenting shareholder who fails to comply with subsection (8) has no right to make a claim under this section. |
| Endorsing certificate | (10) A corporation or its transfer agent shall endorse on any share certificate received under subsection (8) a notice that the holder is a dissenting shareholder under this section and shall forthwith return the share certificates to the dissenting shareholder. |
| Suspension of rights | (11) On sending a notice under subsection (7), a dissenting shareholder ceases to have any rights as a shareholder other than to be paid the fair value of their shares as determined under this section except where (a) the shareholder withdraws that notice before the corporation makes an offer under subsection (12), (b) the corporation fails to make an offer in accordance with subsection (12) and the shareholder withdraws the notice, or (c) the directors revoke a resolution to amend the articles under subsection 173(2) or 174(5), terminate an amalgamation agreement under subsection 183(6) or an application for continuance under subsection 188(6), or abandon a sale, lease or exchange under subsection 189(9), in which case the shareholder’s rights are reinstated as of the date the notice was sent. |
| Offer to pay | (12) A corporation shall, not later than seven days after the later of the day on which the action approved by the resolution is effective or the day the corporation received the notice referred to in subsection (7), send to each dissenting shareholder who has sent such notice (a) a written offer to pay for their shares in an amount considered by the directors of the corporation to be the fair value, accompanied by a statement showing how the fair value was determined; or (b) if subsection (26) applies, a notification that it is unable lawfully to pay dissenting shareholders for their shares. |
| Same terms | (13) Every offer made under subsection (12) for shares of the same class or series shall be on the same terms. |
| Payment | (14) Subject to subsection (26), a corporation shall pay for the shares of a dissenting shareholder within ten days after an offer made under subsection (12) has been accepted, but any such offer lapses if the corporation does not receive an acceptance thereof within thirty days after the offer has been made. |
I-2
| Corporation may apply to court | (15) Where a corporation fails to make an offer under subsection (12), or if a dissenting shareholder fails to accept an offer, the corporation may, within fifty days after the action approved by the resolution is effective or within such further period as a court may allow, apply to a court to fix a fair value for the shares of any dissenting shareholder. |
| Shareholder application to court | (16) If a corporation fails to apply to a court under subsection (15), a dissenting shareholder may apply to a court for the same purpose within a further period of twenty days or within such further period as a court may allow. |
| Venue | (17) An application under subsection (15) or (16) shall be made to a court having jurisdiction in the place where the corporation has its registered office or in the province where the dissenting shareholder resides if the corporation carries on business in that province. |
| No security for costs | (18) A dissenting shareholder is not required to give security for costs in an application made under subsection (15) or (16). |
| Parties | (19) On an application to a court under subsection (15) or (16), (a) all dissenting shareholders whose shares have not been purchased by the corporation shall be joined as parties and are bound by the decision of the court; and (b) the corporation shall notify each affected dissenting shareholder of the date, place and consequences of the application and of their right to appear and be heard in person or by counsel. |
| Powers of court | (20) On an application to a court under subsection (15) or (16), the court may determine whether any other person is a dissenting shareholder who should be joined as a party, and the court shall then fix a fair value for the shares of all dissenting shareholders. |
| Appraisers | (21) A court may in its discretion appoint one or more appraisers to assist the court to fix a fair value for the shares of the dissenting shareholders. |
| Final order | (22) The final order of a court shall be rendered against the corporation in favour of each dissenting shareholder and for the amount of the shares as fixed by the court. |
| Interest | (23) A court may in its discretion allow a reasonable rate of interest on the amount payable to each dissenting shareholder from the date the action approved by the resolution is effective until the date of payment. |
| Notice that subsection (26) applies | (24) If subsection (26) applies, the corporation shall, within ten days after the pronouncement of an order under subsection (22), notify each dissenting shareholder that it is unable lawfully to pay dissenting shareholders for their shares. |
| Effect where subsection (26) applies | (25) If subsection (26) applies, a dissenting shareholder, by written notice delivered to the corporation within thirty days after receiving a notice under subsection (24), may (a) withdraw their notice of dissent, in which case the corporation is deemed to consent to the withdrawal and the shareholder is reinstated to their full rights as a shareholder; or |
I-3
(b) retain a status as a claimant against the corporation, to be paid as soon as the corporation is lawfully able to do so or, in a liquidation, to be ranked subordinate to the rights of creditors of the corporation but in priority to its shareholders. | |
| Limitation | (26) A corporation shall not make a payment to a dissenting shareholder under this section if there are reasonable grounds for believing that (a) the corporation is or would after the payment be unable to pay its liabilities as they become due; or (b) the realizable value of the corporation’s assets would thereby be less than the aggregate of its liabilities. R.S., 1985, c. C-44, s. 190; 1994, c. 24, s. 23; 2001, c. 14, ss. 94, 134(F), 135(E). |
I-4
APPENDIX “J”
SHARE EXCHANGE AGREEMENT
This Share Exchange Agreement, dated as of August 12, 2010, is made by and among NeuLion, Inc., a company incorporated under the laws of Canada (the “Acquiror Company”), TransVideo International Ltd., a BVI business company incorporated under the laws of the British Virgin Islands (the “Company”) and AvantaLion LLC, a Delaware limited liability company and Wang Yunchuan, Hao Jingfang, Wang Qi, Tan Zhongjun, Wang Xiaohong, Shu Wei, Zhao Yun (each a “Shareholder” and collectively, the “Shareholders”).
RECITALS
WHEREAS, the Shareholders own 3,200,000 shares of US$0.01 each, being 100% of the issued and outstanding shares (the “Shares”) in the Company;
WHEREAS, the Shareholders desire to transfer to the Acquiror Company, and the Acquiror Company desires to acquire from the Shareholders, all of the Shares, in exchange for 22,000,802 common shares of the Acquiror Company (the “Acquiror Company Common Shares”) to be issued on the Closing Date, on the terms and conditions as set forth herein.
NOW, THEREFORE, in consideration of the respective representations, warranties, covenants, agreements, and conditions hereinafter set forth, and other good and valuable consideration, the sufficiency of which is hereby acknowledged, the parties hereto hereby agree as follows:
ARTICLE I
DEFINITIONS
1.1 Except as otherwise expressly provided herein or, unless the context otherwise requires, the terms defined in this Section 1.1 will have the meanings herein specified for all purposes of this Agreement.
“Acquiror Company” has the meaning set forth in the preamble.
“Acquiror Company Common Shares” has the meaning set forth in the recitals.
“Affiliate” means any Person that directly or indirectly controls, is controlled by or is under common control with the indicated Person.
“Agreement” means this Share Exchange Agreement, including all Schedules and Exhibits hereto, as it may be from time to time amended, modified or supplemented.
“Circular” means the information circular of the Acquiror Company to be prepared with respect to the Meeting and the Exchange and in accordance with the requirements of National Instrument 61-101 – Take-Over Bids and Special Transactions.
“Closing” has the meaning set forth in Section 3.1.
J-1
“Closing Date” has the meaning set forth in Section 3.1.
“Code” means the Internal Revenue Code of 1986, as amended.
“Commission” means the Securities and Exchange Commission or any other federal agency then administering the Securities Act.
“Company” has the meaning set forth in the preamble.
“Company Balance Sheet” means the Company’s audited balance sheet at December 31, 2009.
“Company Intellectual Property” has the meaning set forth in Section 4.2.22.
“Damages” means any and all liabilities, obligations, damages, deficiencies, Taxes, fines, penalties, expenses, Proceedings, demands, assessments, judgments, costs and expenses, including reasonable attorneys’ fees and costs of collection, defense and settlement.
“Environmental Laws” means any Law or other requirement relating to the environment, natural resources, or public or employee health and safety.
“Environmental Permit” means all licenses, permits, authorizations, approvals, franchises and rights required under any applicable Environmental Law or Order.
“Equity Security” means any stock or similar security, including, without limitation, securities containing equity features and securities containing profit participation features, or any security convertible into or exchangeable for, with or without consideration, any stock or similar security, or any security carrying any warrant, right or option to subscribe to or purchase any shares of capital stock, or any such warrant, right or option.
“Exchange” has the meaning set forth in Section 2.1.
“Fair Market Value” means as of the Closing Date CDN $0.435, and as of any other date, (x) if such shares are listed on one or more securities exchanges the closing price on shares on the principal exchange on which such shares are then trading on the most recent trading day preceding such date of determination or (y) if such shares are not publicly traded, the value as determined in good faith by the board of directors of the Acquiror Company.
“Financial Statements” has the meaning set forth in Section 4.2.23.
“GAAP” means, with respect to any Person, United States generally accepted accounting principles applied on a basis consistent with such Person’s past practices.
“Governmental Authority” means any federal or national, state or provincial, municipal or local government, governmental authority, regulatory or administrative agency, governmental commission, department, board, bureau, agency or instrumentality, political subdivision, commission, court, tribunal, official, arbitrator or arbitral body, in each case whether U.S. or non-U.S.
J-2
“Indebtedness” means any obligation, contingent or otherwise. Any obligation secured by a Lien on, or payable out of the proceeds of, or production from, property of the relevant party will be deemed to be Indebtedness.
“Insolvency Proceeding” means any one or more of the following in relation to any Person:
(a) it is unable to pay its debts as they fall due; or
(b) the value of its liabilities (including its contingent and prospective liabilities) exceeds the value of its assets; or
(c) it fails to comply with the requirements of a statutory demand that has not been set aside under Section 157 of the Insolvency Act, 2003 of the British Virgin Islands; or
(d) execution or other process issued on a judgment, decree or order of a court in favour of a creditor of it is returned wholly or partly unsatisfied; or
(e) it has taken any action or steps have been taken or legal proceedings have been started or threatened against it for (i) its winding up, liquidation, administration, dissolution, amalgamation, reconstruction, reorganisation, arrangement, adjustment, consolidation or protection or relief of creditors (whether by way of voluntary arrangement, scheme of arrangement or otherwise), or (ii) the enforcement of any security interest over any or all of its assets; or (iii) the appointment of a liquidator, receiver, controller, inspector, manager, supervisor, administrative receiver, administrator, trustee or similar officer or official of it or of any or all of its assets; or
(f) a compromise or arrangement has been proposed, agreed to or sanctioned under any of Sections 177, 178 and 179A of the BVI Business Companies Act, 2004 of the British Virgin Islands (the “BVI Companies Act”) in respect of it, or an application has been made to, or filed with, a court for permission to convene a meeting to vote on a proposal for any such compromise or arrangement; or
(g) a merger or consolidation is proposed, approved, agreed to or sanctioned under any of Sections 170 to 174 (inclusive) of the BVI Companies Act in respect of it; or
(h) action is being taken by the Registrar of Corporate Affairs pursuant to Section 213 of the BVI Companies Act to dissolve or strike it off the British Virgin Islands register of companies; or
(i) action is proposed, approved, agreed to or being taken pursuant to Section 184 of the BVI Companies Act to continue it as a company incorporated under the laws of a jurisdiction outside the British Virgin Islands; or
J-3
(j) it is, in any jurisdiction, subject to or threatened by any actions, steps, procedures or other proceedings under any applicable bankruptcy, insolvency, rehabilitation or other reorganisation laws; or
(k) any actions, steps, procedures or other proceedings equivalent or analogous to any of those set out in any of (a) – (j) above (inclusive) of this definition have been taken, started or threatened against it in any jurisdiction, including the seeking by it (or any other person in relation to it) of winding up, liquidation, administration, dissolution,
“Intellectual Property” means all industrial and intellectual property, including, without limitation, all U.S. and non-U.S. patents, patent applications, patent rights, trademarks, trademark applications, common law trademarks, Internet domain names, trade names, service marks, service mark applications, common law service marks, and the goodwill associated therewith, copyrights, in both published and unpublished works, whether registered or unregistered, copyright applications, franchises, licenses, know-how, trade secrets, technical data, designs, customer lists, confidential and proprietary information, processes and formulae, all computer software programs or applications, layouts, inventions, development tools and all documentation and media constituting, describing or relating to the above, including manuals, memoranda , and records, whether such intellectual property has been created, applied for or obtained anywhere throughout the world.
“Laws” means, with respect to any Person, any U.S. or non-U.S. federal, national, state, provincial, local, municipal, international, multinational or other law (including common law), constitution, statute, code, ordinance, rule, regulation or treaty applicable to such Person.
“Lien” means any mortgage, pledge, security interest, encumbrance, lien or charge of any kind, including, without limitation, any conditional sale or other title retention agreement, any lease in the nature thereof and the filing of or agreement to give any financing statement under the Uniform Commercial Code (or similar statute) of any jurisdiction and including any lien or charge arising by Law.
“Material Adverse Effect” means, when used with respect to the Acquiror Company or the Company, as the case may be, any change, effect or circumstance which, individually or in the aggregate, would reasonably be expected to (a) have a material adverse effect on the business, assets, financial condition or results of operations of the Acquiror Company or the Company, as the case may be, in each case taken as a whole or (b) materially impair the ability of the Acquiror Company, the Company or the Shareholders, as the case may be, to perform their obligations under this Agreement, excluding any change, effect or circumstance resulting from (i) the announcement, pendency or consummation of the transactions contemplated by this Agreement, (ii) changes in the United States or Canadian securities markets generally, or (iii) cha nges in general economic, currency exchange rate, political or regulatory conditions in industries in which the Acquiror Company or the Company, as the case may be, operate.
J-4
“Meeting” means the special meeting of shareholders of the Acquiror Company to be called and held with respect to the Exchange and in accordance with the requirements of National Instrument 61-101 – Take-Over Bids and Special Transactions.
“Order” means any award, decision, injunction, judgment, order, ruling, subpoena, or verdict entered, issued, made, or rendered by any Governmental Authority.
“Organizational Documents” means (a) the articles or certificate of incorporation, memorandum of association and the by-laws or code of regulations of a corporation or company; (b) the partnership agreement and any statement of partnership of a general partnership; (c) the limited partnership agreement and the certificate of limited partnership of a limited partnership; (d) the articles or certificate of formation and operating agreement of a limited liability company; (e) any other document performing a similar function to the documents specified in clauses (a), (b), (c) and (d) adopted or filed in connection with the creation, formation or organization of a Person; and (f) any and all amendments to any of the foregoing.
“Permitted Liens” means (a) Liens for Taxes not yet payable or in respect of which the validity thereof is being contested in good faith by appropriate proceedings and for the payment of which the relevant party has made adequate reserves; (b) Liens in respect of pledges or deposits under workmen’s compensation Laws or similar legislation, carriers, warehousemen, mechanics, laborers and materialmen and similar Liens, if the obligations secured by such Liens are not then delinquent or are being contested in good faith by appropriate proceedings conducted and for the payment of which the relevant party has made adequate reserves; (c) statutory Liens incidental to the conduct of the business of the relevant party which were not incurred in connection with the borrowing of money or the obtaining of advances or credits and that do not in the aggregate materially detract from the value of its property or materially impair the use thereof in the operation of its business; and (d) Liens that would not have a Material Adverse Effect.
“Person” means all natural persons, corporations, business trusts, associations, companies, partnerships, limited liability companies, joint ventures and other entities, governments, agencies and political subdivisions.
“Proceeding” means any action, arbitration, audit, hearing, investigation, litigation, or suit (whether civil, criminal, administrative or investigative) commenced, brought, conducted, or heard by or before, or otherwise involving, any Governmental Authority.
“Securities Act” means the Securities Act of 1933, as amended, or any similar federal statute, and the rules and regulations of the Commission thereunder, all as the same will be in effect at the time.
“Shareholders” has the meaning set forth in the preamble.
“Shares” has the meaning set forth in the recitals.
“Subsidiary” means, with respect to the Company, any corporation, limited liability company, joint venture or partnership of which the Company (a) beneficially owns, either directly or indirectly, more than 50% of (i) the total combined voting power of all classes of voting securities of such entity, (ii) the total combined equity interests, or (iii) the capital or profit interests, in the case of a partnership; or (b) otherwise has the power to vote or to direct the voting of sufficient securities to elect a majority of the board of directors or similar governing body.
J-5
“Taxes” means all foreign, federal, state or local taxes, charges, fees, levies, imposts, duties and other assessments, as applicable, including, but not limited to, any income, alternative minimum or add-on, estimated, gross income, gross receipts, sales, use, transfer, transactions, intangibles, ad valorem, value-added, franchise, registration, title, license, capital, paid-up capital, profits, withholding, payroll, employment, unemployment, excise, severance, stamp, occupation, premium, real property, recording, personal property, federal highway use, commercial rent, environmental (including, but not limited to, taxes under Section 59A of the Code) or windfall profit tax, custom, duty or other tax, governmental fee or other like assessment or charge of any kind whatsoever, together with any interest, penalties or addition s to tax with respect to any of the foregoing; and “Tax” means any of the foregoing Taxes.
“Tax Return” means any return, declaration, report, claim for refund or credit, information return, statement or other similar document filed with any Governmental Authority with respect to Taxes, including any schedule or attachment thereto, and including any amendment thereof.
1.2 References. For all purposes of this Agreement: (i) the words “hereof”, “herein”, “hereunder”, and words of similar import when used in this Agreement shall refer to this Agreement as a whole and not to any particular provision of this Agreement; (ii) section references contained in this Agreement are references to Sections in this Agreement unless otherwise specified; (iii) the term “including” shall mean “including without limitation”; (iv) the definitions contained in this Agreement are applicable to the singular as well as the plural forms of such terms and to the masculine as well as to the feminine and neuter genders of such terms; (v) any agreement, instrument or statute defined or referred to herein or in any instrument or certificate delivered in connection herewith means such agreement, instrument or statute as from time to time amended, modified or supplemented and includes (in the case of agreements or instruments) references to all attachments thereto and instruments incorporated therein; (vi) any references to a Person are also to its permitted successors and assigns; (vii) all Article and Section titles or captions contained in this Agreement or in any Exhibit or Schedule referred to herein and the table of contents of this Agreement are for convenience only and shall not be deemed a part of this Agreement or affect the meaning or interpretation of this Agreement; (viii) unless otherwise specified, all references herein to numbered Articles and Sections are to Articles and Sections of this Agreement, as applicable, and all references herein to Schedules or Exhibits are to Schedules and Exhibits to this Agreement; and (vii) unless otherwise specified, all references contained in this Agreement, in any Exhibit or Schedule referred to herein or in any instrument or document delivered pursuant hereto to dollars or “$” shall mean United States dollars.
J-6
ARTICLE II
EXCHANGE OF SHARES AND SHARE CONSIDERATION
2.1 Share Exchange. At the Closing, the Shareholders shall sell and transfer the Shares to the Acquiror Company and the Acquiror Company agrees to purchase and accept transfer of the Shares and, in consideration therefor, subject to Section 2.2, the Acquiror Company shall issue to the Shareholders the Acquiror Company Common Shares (the “Exchange”). Each Shareholder shall receive such number of Acquiror Company Common Shares as set forth opposite such Shareholder’s name on Schedule A, attached hereto.
2.2 Withholding. The Acquiror Company shall be entitled to deduct and withhold from the Acquiror Company Common Shares otherwise payable pursuant to this Agreement to each Shareholder such amounts as it is required to deduct and withhold with respect to the making of such payment under the Code or any provision of state, local, provincial or foreign tax Law. To the extent that amounts are so withheld, such withheld amounts shall be treated for all purposes of this Agreement as having been paid to such Shareholder in respect of which such deduction and withholding was made. Notwithstanding the foregoing, the Acquiror Company at its option, may require any such amounts required t o be deducted and withheld to be reimbursed in cash to the Acquiror Company by such Shareholder prior to the time any Acquiror Company Common Shares are issued to such Shareholder.
2.3 Section 368 Reorganization. For U.S. federal income tax purposes, the Exchange is intended to constitute a “reorganization” within the meaning of Section 368(a)(1)(B) of the Code. The parties to this Agreement hereby adopt this Agreement as a “plan of reorganization” within the meaning of Sections 1.368-2(g) and 1.368-3(a) of the United States Treasury Regulations. Notwithstanding the foregoing or anything else to the contrary contained in this Agreement, the parties acknowledge and agree that no party is making any representation or warranty as to the qualification of the Exchange as a reorganization under Section 368 of the Code or as to the effect , if any, that any transaction consummated prior to, on or after the Closing Date has or may have on any such reorganization status. The parties acknowledge and agree that each (i) has had the opportunity to obtain independent legal and tax advice with respect to the transaction contemplated by this Agreement, and (ii) is responsible for paying its own Taxes, including without limitation, any adverse Tax consequences that may result if the transaction contemplated by this Agreement is not determined to qualify as a reorganization under Section 368 of the Code.
ARTICLE III
CLOSING DATE
3.1 Closing Date. The closing of the Exchange (the “Closing”) will take place (i) at the offices of Loeb & Loeb LLP, 345 Park Avenue, New York, New York 10154 at 10:00 a.m. (Eastern Time) on the date (the “Closing Date”) upon which all of the conditions set forth in Articles VII and VIII have either been satisfied or, in the case of conditions not satisfied, waived in writing by the party entitled to the benefit of such conditions or (ii) at such other place and time as the parties may agree in writing.
J-7
ARTICLE IV
REPRESENTATIONS AND WARRANTIES OF SHAREHOLDERS
4.1 Each Shareholder, severally as to itself, hereby represents and warrants to the Acquiror Company:
4.1.1 Authority. Such Shareholder has the right, power, authority and capacity to execute and deliver this Agreement, to consummate the transactions contemplated by this Agreement and to perform such Shareholder’s obligations under this Agreement. This Agreement has been duly and validly authorized and approved, executed and delivered by such Shareholder. Assuming this Agreement has been duly and validly authorized, executed and delivered by the parties hereto other than such Shareholder, this Agreement is duly authorized, executed and delivered by such Shareholder and constitutes the legal, valid and binding obligation of such Shareholder, enforceable against such Shareh older in accordance with its terms, except as such enforcement is limited by general equitable principles, or by bankruptcy, insolvency and other similar Laws affecting the enforcement of creditors rights generally.
4.1.2 No Conflict. Neither the execution or delivery by such Shareholder of this Agreement nor the consummation or performance by such Shareholder of the transactions contemplated hereby will, directly or indirectly, (a) contravene, conflict with, or result in a violation of any provision of the Organizational Documents of such Shareholder (if such Shareholder is not a natural person); (b) contravene, conflict with, constitute a default (or an event or condition which, with notice or lapse of time or both, would constitute a default) under, or result in the termination or acceleration of, any agreement or instrument to which such Shareholder is a party or by which the properties or assets of such Sh areholder is bound; or (c) contravene, conflict with, or result in a violation of, any Law or Order to which such Shareholder, or any of the properties or assets of such Shareholder, may be subject.
4.1.3 Ownership of Shares. Such Shareholder is the legal and registered holder, owns, of record and beneficially, and has good, valid and indefeasible title to and the right to transfer to the Acquiror Company pursuant to this Agreement, such Shareholder’s Shares free and clear of any and all Liens. There are no options, rights, voting trusts, shareholder agreements or any other contracts or understandings to which such Shareholder is a party or by which such Shareholder or such Shareholder’s Shares are bound with respect to the issuance, sale, transfer, voting or registration of such Shareholder’s Shares. At the Closing Date, the Acquiror Company will acquire good, valid and marketable title to such Shareholder’s Shares free and clear of any and all Liens. The number of Shares so legally and beneficially owned by such Shareholder, along with the jurisdiction in which such Shareholder is resident, is set forth opposite such Shareholder’s name on Schedule A hereto.
4.1.4 Litigation. There is no pending Proceeding against such Shareholder that involves the Shares or that challenges, or may have the effect of preventing, delaying or making illegal, or otherwise interfering with, any of the transactions contemplated by this Agreement and, to the knowledge of such Shareholder, no such Proceeding has been threatened, and no event or circumstance exists that is reasonably likely to give rise to or serve as a basis for the commencement of any such Proceeding.
J-8
4.1.5 No Brokers or Finders. No Person has, or as a result of the transactions contemplated herein will have, any right or valid claim against such Shareholder for any commission, fee or other compensation as a finder or broker, or in any similar capacity, and such Shareholder will indemnify and hold the Acquiror Company harmless against any liability or expense arising out of, or in connection with, any such claim in accordance with Article IX.
4.1.6 Investment Representations.
(a) Schedule 4.1.6(a) sets forth the name of such Shareholder if such Shareholder is an accredited investor (each, an “Accredited Investor”) within the meaning of Rule 501(a) under the Securities Act.
(b) Schedule 4.1.6(b) sets forth name of such Shareholder if such Shareholder is not a U.S. Person within the meaning of Rule 902(k) under the Securities Act.
(c) Section 4.1.6(c) sets forth the name of such Shareholder if such Shareholder is not an Accredited Investor (a “Non-Accredited Investor”). Such Non-Accredited Investor, either individually or through a representative, has such knowledge and experience in financial and business matters as to be capable of evaluating his, her or its investment in the Acquiror Company Common Shares.
(d) Such Shareholder understands and agrees that the Acquiror Company Common Shares to be issued pursuant to this Agreement and the Exchange have not been registered under the Securities Act or any state, local or foreign securities laws. and that the issuance of the Acquiror Company Common Shares is being effected in reliance upon an exemption from registration afforded either under Section 4(2) of the Securities Act for transactions by an issuer not involving a public offer or Regulation S for offers and sale of securities outside the U.S.
(e) Such Shareholder represents, warrants and covenants that it is acquiring the Acquiror Company Common Shares with investment intent and not with a view to resale. Such Shareholder also acknowledges that it has been advised to consult its own legal advisors with respect to applicable resale restrictions and that it is responsible for complying with such restrictions.
4.2 The Shareholders, jointly and not severally, represent and warrant to the Acquiror Company:
4.2.1 Organization and Qualification. The Company is duly incorporated, validly existing and in good standing under the laws of British Virgin Islands, has all requisite authority and power (corporate and other), governmental licenses, authorizations, consents and approvals to carry on its business as presently conducted and as contemplated to be conducted, to own, hold and operate its properties and assets as now owned, held and operated by it, to enter into this Agreement, to carry out the provisions hereof except where the failure to be so organized, existing and in good standing or to have such authority or power will not, in the aggregate, have a Material Adverse Effect. The Company is duly qualified, licensed or domesticated as a foreign corporation in good standing in each jurisdiction wherein the nature of its activities or its properties owned or leased makes such qualification, licensing or domestication necessary, except where the failure to be so qualified, licensed or domesticated will not have a Material Adverse Effect. Set forth on Schedule 4.2.1 is a list of those jurisdictions in which the Company presently conducts its business, owns, holds and operates its properties and assets.
J-9
4.2.2 Subsidiaries. Schedule 4.2.2 shall set forth the name and jurisdiction of formation or incorporation of the Subsidiaries of the Company and the jurisdictions wherein such Subsidiary presently conducts its business, owns, holds and operates its properties and assets. Each entity set forth on Schedule 4.2.2 is duly incorporated, validly existing and in good standing under the Laws of its jurisdiction or formation or incorporation, has all requisite authority and power (corporate and other), governmental licenses, authorizations, consents and approvals to carry on its business as presently conducted and as contemplated to be conducted, to own, hold and operate its properties and assets as now owned, held an d operated by it.
4.2.3 Organizational Documents. Copies of the Organizational Documents of the Company and its Subsidiaries have been made available to the Acquiror Company prior to the execution of this Agreement, are true and complete and have not been amended or repealed. Neither the Company nor any of its Subsidiaries is in violation or breach of any of the provisions of its Organizational Documents.
4.2.4 Authorization and Validity of this Agreement. The Company has all requisite authority and power (corporate and other), governmental licenses, authorizations, consents and approvals to enter into this Agreement, to consummate the transactions contemplated by this Agreement, to perform its obligations under this Agreement, and to record the transfer of the Shares and the delivery of the new certificates representing the Shares registered in the name of the Acquiror Company. The execution, delivery and performance by the Company of this Agreement have been duly authorized by all necessary corporate action and do not require from the Company’s board of directors or the Shareholder s any consent or approval that has not been validly and lawfully obtained. The execution, delivery and performance by the Company of this Agreement require no authorization, consent, approval, license, exemption of or filing or registration with any Governmental Authority or other Person.
4.2.5 No Violation. Neither the execution nor the delivery by the Company of this Agreement nor the consummation or performance by the Company of the transactions contemplated hereby will, directly or indirectly, (a) contravene, conflict with, or result in a violation of any provision of the Organizational Documents of the Company; (b) contravene, conflict with, constitute a default (or an event or condition which, with notice or lapse of time or both, would constitute a default) under, or result in the termination or acceleration of, or result in the imposition or creation of any Lien under, any agreement or instrument to which the Company is a party or by which the properties or assets of the Comp any are bound; (c) contravene, conflict with, or result in a violation of, any Law or Order to which the Company, or any of the properties or assets owned or used by the Company, may be subject; or (d) contravene, conflict with, or result in a violation of, the terms or requirements of, or give any Governmental Authority the right to revoke, withdraw, suspend, cancel, terminate or modify, any licenses, permits, authorizations, approvals, franchises or other rights held by the Company or that otherwise relate to the business of, or any of the properties or assets owned or used by, the Company, except, in the case of clause (b), (c), or (d), for any such contraventions, conflicts, violations, or other occurrences as would not have a Material Adverse Effect.
J-10
4.2.6 Binding Obligations. Assuming this Agreement has been duly and validly authorized, executed and delivered by the parties hereto other than the Company, this Agreement is duly authorized, executed and delivered by the Company and constitutes the legal, valid and binding obligation of the Company, enforceable against the Company in accordance with its terms, except as such enforcement is limited by general equitable principles, or by bankruptcy, insolvency and other similar Laws affecting the enforcement of creditors rights generally.
4.2.7 Capitalization and Related Matters.
(a) Capitalization. The authorized capital of the Company consists of 5,000,000 shares, of which 3,200,000 shares are issued and outstanding. Except as set forth in Schedule 4.2.7(a), there are no outstanding or authorized options, warrants, calls, purchase agreements, participation agreements, subscription rights, conversion rights, exchange rights or other securities or contracts that could require the Company to issue, sell or otherwise cause to become outstanding any of its authorized but unissued shares or any securities convertible into, exchangeable for or carrying a right or option to purchase shares or to create, authorize, issue, sell or otherwise cause to become outstanding an y new class of shares. There are no outstanding shareholders’ agreements, voting trusts or arrangements, registration rights agreements, rights of first refusal or other contracts pertaining to the capital stock of the Company. The issuance of all of the shares of the Company described in this Section 4.2.7 has been made in compliance with the laws of the British Virgin Islands. All issued and outstanding shares of the Company are duly authorized, validly issued, fully paid and nonassessable and have not been issued in violation of any preemptive or similar rights.
(b) No Redemption Requirements. Except as set forth in Schedule 4.2.7(b), there are no outstanding contractual obligations (contingent or otherwise) of the Company or any of its Subsidiaries to retire, repurchase, redeem or otherwise acquire any outstanding capital shares of, or other ownership interests in, the Company or any of its Subsidiaries or to provide funds to or make any investment (in the form of a loan, capital contribution or otherwise) in any other Person.
(c) Shareholders. The Shareholders are the sole beneficial holders of all of the outstanding capital shares of the Company. Except as expressly provided in this Agreement, no holder of Shares or any other security of the Company or any other Person is entitled to any preemptive right, right of first refusal or similar right as a result of the issuance of the shares or otherwise. There is no voting trust, agreement or arrangement among any Shareholders of any capital stock of the Company affecting the exercise of the voting rights of any such capital stock.
(d) No Rights to Purchase. Except for the Acquiror Company’s right to acquire from the Shareholders the Shares which are being transferred hereunder, there do not now exist any stock or other options, warrants or rights of any nature or kind whatsoever, actual, contingent or executory, for the purchase, sale or transfer of any of the securities in the capital of the Company which are owned by the Shareholders.
J-11
4.2.8 Compliance with Laws and Other Instruments. The business and operations of the Company and its Subsidiaries have been and are being conducted in accordance with all applicable Laws and Orders. Neither the Company nor any of its Subsidiaries has received notice of any violation (or any Proceeding involving an allegation of any violation) of any applicable Law or Order by or affecting the Company or its Subsidiaries and, to the knowledge of the Company, no Proceeding involving an allegation of violation of any applicable Law or Order is threatened or contemplated.
4.2.9 Litigation and Insolvency Proceedings. There is no Proceeding (whether federal, state, local or foreign) pending or, to the knowledge of the Company, threatened against or affecting the Company or any Subsidiary or any of their properties, assets, business or employees. To the knowledge of the Company, there is no fact that might result in or form the basis of any such Proceeding. Neither the Company nor any of its Subsidiaries are subject to any Orders. No Insolvency proceeding has occurred in relation to the Company or any of its Subsidiaries.
4.2.10 No Brokers or Finders. No person has, or as a result of the transactions contemplated herein will have, any right or valid claim against the Company for any commission, fee or other compensation as a finder or broker, or in any similar capacity, and the Shareholders will indemnify and hold the Acquiror Company harmless against any liability or expense arising out of, or in connection with, any such claim in accordance with Article IX.
4.2.11 Title to and Condition of Properties. The Company owns (with good and marketable title in the case of real property) or holds under valid leases or other rights to use all real property, plants, machinery and equipment necessary for the conduct of the business of the Company as presently conducted, free and clear of all Liens, except Permitted Liens. The material buildings, plants, machinery and equipment necessary for the conduct of the business of the Company as presently conducted are structurally sound, are in good operating condition and repair and are adequate for the uses to which they are being put, in each case, taken as a whole, and none of such buildings, plants, machine ry or equipment is in need of maintenance or repairs, except for ordinary, routine maintenance and repairs that are not material in nature or cost.
4.2.12 Absence of Undisclosed Liabilities. Except as set forth on Schedule 4.2.12, the Company has no debt, obligation or liability (whether accrued, absolute, contingent, liquidated or otherwise, whether due or to become due, whether or not known to the Company) arising out of any transaction entered into at or prior to the Closing Date, including no obligation to fund any joint venture or other entity, or any act or omission at or prior to the Closing Date, except to the extent set forth on or reserved against on the Company Balance Sheet. All debts, obligations or liabilities with respect to directors and officers of the Company will be cancelled prior to the Closing. The Co mpany has not incurred any liabilities or obligations under agreements entered into in the usual and ordinary course of business since January 1, 2010.
J-12
4.2.13 Changes. The Company has, since January 1, 2010:
(a) not conducted its business or entered into any transaction other than in the usual and ordinary course of business, except for this Agreement;
(b) not suffered or experienced any change in, or affecting, its condition (financial or otherwise), properties, assets, liabilities, business, operations, results of operations or prospects other than changes, events or conditions in the usual and ordinary course of its business, none of which would have a Material Adverse Effect;
(c) not made any loans or advances to any Person other than travel advances and reimbursement of expenses made to employees, officers and directors in the ordinary course of business;
(d) not created or permitted to exist any Lien on any material property or asset of the Company, other than Permitted Liens;
(e) not issued, sold, disposed of or encumbered, or authorized the issuance, sale, disposition or encumbrance of, or granted or issued any option to acquire any shares of its capital stock or any other of its securities or any Equity Security, or altered the term of any of its outstanding securities or made any change in its outstanding shares of capital stock or its capitalization, whether by reason of reclassification, recapitalization, stock split, combination, exchange or readjustment of shares, stock dividend or otherwise;
(f) not declared, set aside, made or paid any dividend or other distribution to any of its shareholders;
(g) not terminated or modified any Material Company Contract except for termination upon expiration in accordance with the terms thereof;
(h) not released, waived or cancelled any claims or rights relating to or affecting the Company in excess of US $5,000 in the aggregate or instituted or settled any Proceeding involving in excess of US $5,000 in the aggregate;
(i) not paid, discharged or satisfied any claim, obligation or liability in excess of US $5,000 in the aggregate, except for liabilities incurred prior to the date of this Agreement in the ordinary course of business;
(j) not created, incurred, assumed or otherwise become liable for any Indebtedness in excess of US $5,000 in the aggregate, other than professional fees;
(k) not guaranteed or endorsed in a material amount any obligation or net worth of any Person;
(l) not acquired the capital stock or other securities or any ownership interest in, or substantially all of the assets of, any other Person;
J-13
(m) not changed its method of accounting or the accounting principles or practices utilized in the preparation of its Financial Statements, other than as required by GAAP;
(n) not entered into any agreement, or otherwise obligated itself, to do any of the foregoing.
4.2.14 Material Company Contracts. Schedule 4.2.14 sets forth all of the contracts to which the Company or any Subsidiary is a party (the “Material Company Contracts”). The Company has provided to the Acquiror Company, prior to the date of this Agreement, true, correct and complete copies of each written Material Company Contract, including each amendment, supplement and modification thereto.
4.2.15 No Defaults. Each Material Company Contract is a valid and binding agreement of the Company that is party thereto, and is in full force and effect. The Company is not in breach or default of any Material Company Contract to which it is a party and, to the knowledge of the Company, no other party to any Material Company Contract is in breach or default thereof. Except as would not have a Material Adverse Effect, no event has occurred or circumstance exists that (with or without notice or lapse of time) would (a) contravene, conflict with or result in a violation or breach of, or become a default or event of default under, any provision of any Material Company Contract or (b) permit the Company or any other Person the right to declare a default or exercise any remedy under, or to accelerate the maturity or performance of, or to cancel, terminate or modify any Material Company Contract. The Company has not received notice of the pending or threatened cancellation, revocation or termination of any Material Company Contract to which it is a party. There are no renegotiations of, or attempts to renegotiate, or outstanding rights to renegotiate any material terms of any Material Company Contract.
4.2.16 Employees.
(a) The Company is in full compliance with all Laws regarding employment, wages, hours, benefits, equal opportunity, collective bargaining, the payment of taxes, occupational safety and health and plant closing. The Company is not liable for the payment of any compensation, damages, taxes, fines, penalties or other amounts, however designated, for failure to comply with any of the foregoing Laws.
(b) The Company does not maintain or contribute to any employee benefit, bonus, commission, incentive, deferred compensation, stock purchase, stock option, severance, change in control or fringe benefit plans.
(c) No director, officer or employee of the Company is a party to, or is otherwise bound by, any contract (including any confidentiality, non-competition or proprietary rights agreement) with any other Person that in any way adversely affects or will materially affect (a) the performance of his or her duties as a director, officer or employee of the Company or (b) the ability of the Company to conduct its business. Each employee of the Company is employed on an at-will basis and the Company does not have any contract with any of its employees which would interfere with its ability to discharge its employees.
J-14
4.2.17 Tax Returns and Audits.
(a) Tax Returns. The Company and its Subsidiaries have filed all Tax Returns required to be filed by or on behalf of the Company and its Subsidiaries and all such Tax Returns are correct and complete. The Company and its Subsidiaries have paid all Taxes required to have been paid (whether or not reflected on any Tax Return). No Governmental Authority in any jurisdiction where the Company or any of its Subsidiaries do not file a Tax Return has made a claim, assertion or threat to the Company or its Subsidiaries that such entity is or may be subject to taxation by such jurisdiction; there are no Liens with respect to Taxes on the Company or any of its Subsidiaries’ propert y or assets other than Permitted Liens; and there are no Tax rulings, requests for rulings, or closing agreements relating to the Company or any of its Subsidiaries for any period (or portion of a period) that would affect any period after the date hereof. The Company and its Subsidiaries have withheld, and will continue until the Closing Date to withhold, any Taxes which are required by applicable Law to be withheld and has timely paid or remitted, and will continue until the Closing Date to pay and remit, on a timely basis, the full amount of any Taxes which have been or will be withheld, to the applicable Governmental Authority. Transactions in respect of goods or services between the Company and its Subsidiaries and any affiliated or related Person have occurred for arm’s length consideration, and the Company and its Subsidiaries have complied with all contemporaneous documentation requirements and all other transfer pricing requirements in respect of affiliated or related party transact ions. Neither the Company nor any of its Subsidiaries is a party to any agreement, waiver, extension or arrangement with any Governmental Authority which relates to any extension of time with respect to the filing of any Tax Return, any payment of Taxes or any assessment.
(b) No Adjustments, Changes. Neither the Company or any of its Subsidiaries nor any other Person on behalf of the Company or its Subsidiaries (a) has executed or entered into a closing agreement pursuant to Section 7121 of the Code or any predecessor provision thereof or any similar provision of state, local or foreign Law; or (b) has agreed to or is required to make any adjustments pursuant to Section 481(a) of the Code or any similar provision of state, local or foreign Law.
(c) No Disputes. There is no pending audit, examination, investigation, dispute, proceeding or claim with respect to any Taxes of the Company or any of its Subsidiaries, nor is any such claim or dispute pending or contemplated. The Company has delivered or made available to the Acquiror Company true, correct and complete copies of all of its and its Subsidiaries Tax Returns, if any, examination reports and statements of deficiencies assessed or asserted against or agreed to by the Company or any Subsidiary since its inception and any and all correspondence with respect to the foregoing.
(d) Not a U.S. Real Property Holding Corporation. Neither the Company nor any of its Subsidiaries is and has been a United States real property holding corporation within the meaning of Section 897(c)(2) of the Code at any time during the applicable period specified in Section 897(c)(1)(A)(ii) of the Code.
J-15
(e) No Tax Allocation/ Sharing. Neither the Company or any of its Subsidiaries is a party to any Tax allocation or sharing agreement and does not have any liability for the Taxes of any other Person under any Tax Law or as a transferee or successor, or by contract or otherwise.
(f) No Other Arrangements. Neither the Company nor any Subsidiary (i) is a party to any agreement, contract or arrangement for services that would result, individually or in the aggregate, in the payment of any amount that would not be deductible by reason of Section 162(m), 280G or 404 of the Code (or any similar provision of state, local or foreign Law, (ii) has any outstanding closing agreement, ruling request, request for consent to change a method of accounting, subpoena or request for information to or from a Governmental Authority in connection with any Tax matter or (iii) is a party to any reportable transaction within the meaning of Treasury Regulation Section 1.6011-4 (or any similar provision of state, local or foreign Law).
(g) Canadian Tax. None of the Shares will constitute “taxable Canadian property” for purposes of the Income Tax Act (Canada).
4.2.18 Insurance. All existing insurance plans of the Company are in full force and effect, all insurance premiums thereon have been paid in full when due and no notice of cancellation, nonrenewal or termination has been issued or received by the Company. Schedule 4.2.18 lists all insurance policies of any kind or nature maintained as of the date hereof by or on behalf of the Company.
4.2.19 Licenses. The Company and its Subsidiaries possess from the appropriate Governmental Authority all licenses, permits, authorizations, approvals, franchises and rights that are necessary for the Company and its Subsidiaries to engage in its business as currently conducted and to permit the Company and its Subsidiaries to own and use its properties and assets in the manner in which it currently owns and uses such properties and assets (collectively, “Company Permits”). Neither the Company nor any Subsidiary has received notice from any Governmental Authority or other Person that there is lacking any license, permit, authorization, approval, franchise or right necessary fo r the Company or any of its Subsidiaries to engage in its business as currently conducted and to permit the Company and its Subsidiaries to own and use its properties and assets in the manner in which it currently owns and uses such properties and assets. The Company Permits are valid and in full force and effect. No event has occurred or circumstance exists that may (with or without notice or lapse of time): (a) constitute or result, directly or indirectly, in a violation of or a failure to comply with any Company Permit; or (b) result, directly or indirectly, in the revocation, withdrawal, suspension, cancellation or termination of, or any modification to, any Company Permit. Neither the Company nor any Subsidiary has received notice from any Governmental Authority or any other Person regarding: (a) any actual, alleged, possible or potential contravention of any Company Permit; or (b) any actual, proposed, possible or potential revocation, withdrawal, suspension, cancellation, termination of, or modification to, any Company Permit. All applications required to have been filed for the renewal of such Company Permits have been duly filed on a timely basis with the appropriate Persons, and all other filings required to have been made with respect to such Company Permits have been duly made on a timely basis with the appropriate Persons. All Company Permits are renewable by their terms or in the ordinary course of business without the need to comply with any special qualification procedures or to pay any amounts other than routine fees or similar charges, all of which have, to the extent due, been duly paid.
J-16
4.2.20 Governmental Inquiries. The Company has provided to the Company a copy of each material written inspection report, questionnaire, inquiry, demand or request for information received by the Company from any Governmental Authority, and the Company’s response thereto, and each material written statement, report or other document filed by the Company with any Governmental Authority.
4.2.21 Bank Accounts and Safe Deposit Boxes. Schedule 4.2.21 discloses the title and number of each bank or other deposit or financial account, and each lock box and safety deposit box used by the Company and its Subsidiaries, the financial institution at which that account or box is maintained and the names of the persons authorized to draw against the account or otherwise have access to the account or box, as the case may be.
4.2.22 Intellectual Property.
(a) Schedule 4.2.22(a) sets forth a true, correct and complete list of all Intellectual Property owned or licensed by the Company or any Subsidiary (the “Company Intellectual Property”), specifying as to each, as applicable: (i) the description of such Company Intellectual Property; (ii) the owner of such Company Intellectual Property; and (iii) the jurisdictions by or in which such Company Intellectual Property has been issued or registered or in which an application for such issuance or registration has been filed.
(b) Except as set forth on Schedule 4.2.22(b):
(i) within the past three (3) years (or prior thereto if the same is still pending or subject to appeal or reinstatement), the Company has not been sued or charged in writing with or been a defendant in any Proceeding that involves a claim of infringement of any Intellectual Property; and
(ii) to the knowledge of the Shareholders, there is no claim of infringement of the Company Intellectual Property brought by the Company against any Person in the past three (3) years and so far as they are aware, there has been no material infringement by any Person of any Company Intellectual Property in the year prior to the date of this Agreement.
(c) Neither the current use by the Company of the Company Intellectual Property infringes nor the continued use of the Company Intellectual Property after the Closing will infringe the rights of any other Person.
(d) All employees, agents, consultants or contractors who have contributed to or participated in the creation or development of any copyrightable, patentable or trade secret material on behalf of the Company which is material to the operation of the business (excluding Intellectual Property owned by or held by the Company for the use of clients of the Company) have executed an assignment or an agreement to assign in favor of the Company (or such predecessor in interest, as applicable) all right, title and interest in such material.
J-17
4.2.23 Financial Statements. Schedule 4.2.23 sets forth the Company’s Balance Sheet and the related audited statements of income and cash flows, and the Company’s unaudited interim balance sheet as of March 31, 2010 and the related unaudited interim statements of income and cash flows for the three months then ended (collectively, the “Financial Statements”). The Financial Statements comply in all material respects with and were prepared in accordance with GAAP applied on a consistent basis during the periods involved and fairly present in all material respects (subject, in the case of unaudited statements, to normal, recurring audit adjustments) the financial posi tion of the Company as at the dates thereof and the results of its operations and cash flows for the periods then ended.
4.2.24 Environmental and Safety Matters. Except as set forth on Schedule 4.2.24, (a) the Company has at all time been and is in compliance with all Environmental Laws applicable to the Company, (b) there are no Proceedings pending or threatened against the Company alleging the violation of any Environmental Law or Environmental Permit applicable to the Company or alleging that the Company is a potentially responsible party for any environmental site contamination and (c) neither this Agreement nor the consummation of the transactions contemplated by this Agreement shall impose any obligations to notify or obtain the consent of any Governmental Authority or third Persons under any Environmental Laws applicable to the Company.
4.2.25 No Improper Payments. Neither the Company nor any of its Subsidiaries has offered, paid or agreed to pay, directly or indirectly, any money or thing of value (tangible or intangible) to any Person (or to any Affiliate of such Person) who is or was either an official of any regulatory authority or a director, manager, officer or employee or other representative of any past or present customer of the Company or any of its Subsidiaries for the purpose, or with the intent, of having such Person use his/her influence to obtain or maintain business for the Company or any of its Subsidiaries or otherwise affect the business, affairs, operations or assets of the Company in any financial or other manner.
4.2.26 Compliance with Applicable Securities Law. The Exchange is exempt from the take-over bid requirements under Part XX – Take-Over Bids and Issuer Bids of the Securities Act (Ontario) by virtue of the exemption available in Section 100.2 of the Securities Act (Ontario) and Part 6 of OSC Rule 62-504 – Take-Over Bids and Issuer Bids (and all analogous provisions in provinces other than Ontario) and is otherwise in compliance with all applicable Canadian securities Law.
4.2.27 Manufacturing. Each Subsidiary maintains good out-sourcing manufacturing practices and abides by the requirements of applicable Law including any guidelines, policies, or other standards from time to time promulgated or issued by any Governmental Authority with respect to the manufacture of its respective products.
J-18
4.2.28 Inventories. The inventories of the Subsidiaries do not include any material items that are slow moving, below standard quality or of a quality or quantity not useable or saleable in the normal course of business, the value of which has not been written down on the books of the applicable Subsidiary of account to net realizable market value. The inventory levels of the Subsidiaries have been maintained at such amounts as are required for the operations of their respective business as previously conducted and as proposed to be conducted, and such inventory levels are adequate therefor.
4.2.29 Company Information. The financial statements provided by the Company to UHY Advisors, Inc. in connection with its preparation of a business valuation of the Company, were accurate and based on reasonable assumptions and projections.
ARTICLE V
REPRESENTATIONS AND WARRANTIES OF THE ACQUIROR COMPANY
The Acquiror Company represents and warrants to the Shareholders as follows:
5.1 Organization and Qualification. The Acquiror Company is duly organized, validly existing and in good standing under the laws of Canada, has all requisite authority and power (corporate and other), governmental licenses, authorizations, consents and approvals to carry on its business as presently conducted and to own, hold and operate its properties and assets as now owned, held and operated by it, except where the failure to be so organized, existing and in good standing, or to have such authority and power, governmental licenses, authorizations, consents or approvals would not have a Material Adverse Effect. The Acquiror Company is duly qualified, licensed or domesticated as a foreig n corporation in good standing in each jurisdiction wherein the nature of its activities or its properties owned, held or operated makes such qualification, licensing or domestication necessary, except where the failure to be so duly qualified, licensed or domesticated and in good standing would not have a Material Adverse Effect.
5.2 Organizational Documents. True, correct and complete copies of the Organizational Documents of the Acquiror Company have been made available to the Shareholders prior to the execution of this Agreement, and no action has been taken to amend or repeal such Organizational Documents. The Acquiror Company is not in violation or breach of any of the provisions of its Organizational Documents, except for such violations or breaches as would not have a Material Adverse Effect.
5.3 Authorization. Subject to its receipt of shareholder approval in the manner required by Law and to the approval of the Toronto Stock Exchange, the Acquiror Company has all requisite authority and power (corporate and other), governmental licenses, authorizations, consents and approvals to enter into this Agreement, to consummate the transactions contemplated by this Agreement and to perform its obligations hereunder. The execution, delivery and performance by the Acquiror Company of this Agreement have been duly authorized by all necessary corporate action and do not require from the Acquiror Company any consent or approval that has not been validly and lawfully obtained except for ap proval by the Acquiror Company shareholders and the Toronto Stock Exchange.
J-19
5.4 No Violation. Neither the execution nor the delivery by the Acquiror Company of this Agreement nor the consummation or performance by the Acquiror Company of the transactions contemplated hereby will, directly or indirectly, (a) contravene, conflict with, or result in a violation of any provision of the Organizational Documents of the Acquiror Company; (b) contravene, conflict with, constitute a default (or an event or condition which, with notice or lapse of time or both, would constitute a default) under, or result in the termination or acceleration of, or result in the imposition or creation of any Lien under, any agreement or instrument to which the Acquiror Company is a party or by which the properties or assets of the Acquiror Company is bound; (c) contravene, conflict with, or result in a violation of, any Law or Order to which the Acquiror Company, or any of the properties or assets owned or used by the Acquiror Company, may be subject; or (d) contravene, conflict with, or result in a violation of, the terms or requirements of, or give any Governmental Authority the right to revoke, withdraw, suspend, cancel, terminate or modify, any licenses, permits, authorizations, approvals, franchises or other rights held by the Acquiror Company or that otherwise relate to the business of, or any of the properties or assets owned or used by, the Acquiror Company, except, in the case of clause (b), (c), or (d), for any such contraventions, conflicts, violations, or other occurrences as would not have a Material Adverse Effect.
5.5 Binding Obligations. Assuming this Agreement has been duly and validly authorized, executed and delivered by the parties thereto other than the Acquiror Company, this Agreement is duly authorized, executed and delivered by the Acquiror Company and constitutes the legal, valid and binding obligations of the Acquiror Company, enforceable against the Acquiror Company in accordance with their respective terms, except as such enforcement is limited by general equitable principles, or by bankruptcy, insolvency and other similar Laws affecting the enforcement of creditors rights generally.
5.6 Securities Laws. Assuming the accuracy of the representations and warranties of the Shareholders in Section 4.1.6, the issuance of the Acquiror Company Common Shares pursuant to this Agreement will be, when issued and paid for in accordance with the terms of this Agreement, issued in accordance with exemptions from the registration and prospectus delivery requirements of the Securities Act and the registration permit or qualification requirements of all applicable state securities laws.
5.7 Duly Authorized. The issuance of the Acquiror Company Common Shares has been duly authorized and, upon delivery to the Shareholders of certificates therefor in accordance with the terms of this Agreement, the Acquiror Company Common Shares will have been validly issued and fully paid, and will be nonassessable, have the rights, preferences and privileges specified, will be free of preemptive rights and will be free and clear of all Liens and restrictions, other than Liens created by the Shareholders and restrictions on transfer imposed by this Agreement and the Securities Act.
5.8 No Brokers or Finders. No Person has, or as a result of the transactions contemplated herein will have, any right or valid claim against the Acquiror Company for any commission, fee or other compensation as a finder or broker, or in any similar capacity.
J-20
ARTICLE VI
COVENANTS
6.1 Interim Operations of the Company. Except as otherwise contemplated by this Agreement or consented to in writing by Acquiror Company, which consent shall not be unreasonably withheld, between the date of this Agreement and the Closing Date, the Shareholders shall cause the Company to, conduct its business in the ordinary course and use commercially reasonable efforts to preserve substantially intact its business, keep available the services of their present officers and employees, preserve in all respects their present business relationships and goodwill, retain all Company Intellectual Property and to make all capital expenditures as currently planned or as necessary, in each case in the ordinary course o f business.
Except as set forth on Schedule 6.1, between the date of this Agreement and the Closing Date, the Shareholders shall not permit the Company to, and shall procure that the Company does not:
(a) amend its Organizational Documents;
(b) organize any Subsidiary or acquire any capital stock of any Person or any equity or ownership interest in any business, dispose of any Subsidiary, start up any new business or merge, consolidate or enter into any share exchange with or into any other Person (except the transactions contemplated by this Agreement);
(c) issue, sell or otherwise dispose of any of its equity interests, or create or suffer to be created any encumbrance thereon, or reclassify, split up or otherwise change any of its equity interests, or grant or enter into any options, covenants or calls or other rights to purchase or convert any obligation into any of its equity interests;
(d) incur or guarantee any Indebtedness for borrowed money or incur any obligation or liability (contingent or otherwise) to a third party, except to the extent required in the ordinary course of business and for contracts and agreements entered into in the ordinary course of business;
(e) pay, discharge or satisfy any claim, liability or obligation (whether fixed or contingent), other than in the ordinary course of business;
(f) make any loans or advances in excess of $10,000 in the aggregate to any Person, other than extensions of credit to customers and expense allowances and advances to employees of the Company, in each case in the ordinary course of business;
(g) make, grant or enter into any (i) increase in the compensation of, or benefits or severance payable to, any employee of the Company, other than customary adjustments in compensation consistent with past practice or (ii) agreement to hire any employee other than in the ordinary course of business consistent with past practices;
J-21
(h) sell, assign, transfer, convey, lease, pledge, encumber or otherwise dispose of or agree to sell, assign, transfer, convey, lease, pledge, encumber or otherwise dispose of any assets or properties of the Company with an aggregate book value in excess of $10,000, other than (i) sales of inventory in the ordinary course of business and (ii) the disposition of used or worn out equipment or other tangible personal property no longer used in the business of the Company;
(i) cancel any debts to the Company in excess of $10,000 in the aggregate, except for cancellations of bad debts made in the ordinary course of business, or waive any other rights or claims of the Company in excess of $10,000, except for waivers, compromises or other adjustments of rights or claims against customers or suppliers made in the ordinary course of business;
(j) settle any Proceeding against the Company;
(k) change its accounting methods or classifications, except as required by GAAP;
(l) enter into any agreement, contract, commitment or arrangement which involves any joint venture, partnership or other arrangement involving sharing of profits with any Person or that would restrict the Company from carrying on business anywhere in the world;
(m) enter into any agreement, contract, commitment or arrangement that would be required to be listed on Schedule 4.2.14 or amend, modify or terminate any Material Company Contract other than in the ordinary course of business;
(n) make a material election or change to a material election in respect of Taxes, amend any Tax Return, enter into any tax allocation agreement, tax sharing agreement, tax indemnity agreement or closing agreement to which the Company is a party, settle or compromise any material claim or assessment in respect of Taxes; or take any action with respect to the computation of Taxes or the preparation of Tax Returns that is inconsistent with past practice;
(o) in any other manner, modify, change or otherwise alter the fundamental nature of the business of the Company as presently conducted; or
(p) enter a binding commitment to perform any of the foregoing.
6.2 Public Announcements. Prior to the Closing Date, the Company, the Shareholders and the Acquiror Company shall consult with each other in issuing any press releases or otherwise making public statements or filings and other communications with the Commission or any regulatory agency or stock market or trading facility with respect to the transactions contemplated hereby and neither party shall issue any such press release or otherwise make any such public statement, filings or other communications without the prior written consent of the other, which consent shall not be unreasonably withheld or delayed, except that no prior consent shall be required if such disclosure is required by law, in whic h case the disclosing party shall provide the other party with prior notice of such public statement, filing or other communication and shall incorporate into such public statement, filing or other communication the reasonable comments of the other party.
J-22
6.3 Confidentiality.
6.3.1 The Acquiror Company, the Shareholders, and the Company will maintain in confidence, and will cause their respective directors, officers, employees, agents, and advisors to maintain in confidence any written, oral, or other information obtained in confidence from another party in connection with this Agreement or the transactions contemplated by this Agreement, unless (a) such information is already known to such party or to others not bound by a duty of confidentiality or such information becomes publicly available through no fault of such party, (b) the use of such information is necessary in making any required filing with the Commission or any other securities regulatory authority, or obtaining any consent or approval required for the consummation of the transacti ons contemplated by this Agreement, or (c) the furnishing or use of such information is required by or necessary in connection with legal proceedings.
6.3.2 In the event that any party is required to disclose any information of another party pursuant to clause (b) or (c) of Section 6.3.1, the party requested or required to make the disclosure (the “disclosing party”) shall provide the party that provided such information (the “providing party”) with prompt notice of any such requirement so that the providing party may seek a protective order or other appropriate remedy and/or waive compliance with the provisions of this Section 6.3. If, in the absence of a protective order or other remedy or the receipt of a waiver by the providing party, the disclosing party is nonetheless, in the opinion of counsel, legally compelled to disclose the information of the providing party, the disclosing pa rty may, without liability hereunder, disclose only that portion of the providing party’s information which such counsel advises is legally required to be disclosed, provided that the disclosing party exercises its reasonable efforts to preserve the confidentiality of the providing party’s information, including, without limitation, by cooperating with the providing party to obtain an appropriate protective order or other relief assurance that confidential treatment will be accorded the providing party’s information.
6.3.3 If the transactions contemplated by this Agreement are not consummated, each party will return or destroy as much of such written information as the other party may reasonably request.
6.4 Preparation of Circular and Other Disclosure Materials. The Acquiror Company shall schedule the Meeting and solicit proxies approving this Agreement and the transactions contemplated hereby. In connection with such Meeting, the Acquiror Company will prepare the Circular to be distributed to its shareholders prior to such Meeting. The Company will use all reasonable efforts to take all actions necessary to cooperate in the preparation and delivery of the Circular and any amendments thereto and such other information and documents relating to Acquiror Company shareho lder approval and disclosure regarding the Company as the parties believe is necessary or advisable.
6.5 Information to be Provided. Upon written request by the Acquiror Company, the Company shall promptly provide such information that is required by the Acquiror Company in order to prepare the Circular with adequate disclosure and information in sufficient detail to permit the shareholders of the Acquiror Company to form a reasoned judgment concerning the respective matters to be placed before them at the Meeting, including the Exchange.
J-23
6.6 Meeting. The Acquiror Company has done, or will do, all such acts and things as may be necessary to comply, in all respects, with applicable laws and regulatory requirements in relation to the Meeting, including the preparation and sending of the Circular to all persons required by applicable Law.
6.7 Compliance. Any Shareholder that constitutes a “control person” (as such term is defined in applicable Canadian securities Law) of the Acquiror Company as a result of the Exchange or otherwise will comply with all applicable resale restrictions, in respect of the Acquiror Company Common Shares.
6.8 Reasonable Efforts. Subject to the terms and conditions of this Agreement, each party hereto will use its reasonable best efforts to cause the conditions set forth in Articles VII and VIII to be satisfied and the Closing to occur at the earliest practicable date.
6.9 Resale Restrictions on Acquiror Company Common Shares. The Shareholders understand and acknowledge that the Acquiror Company Common Shares to be issued in connection with the Exchange will be subject to resale restrictions under applicable securities laws and the Shareholders agree to comply with such restrictions. For purposes of complying with such securities laws, the Shareholders understand and acknowledge that upon the issuance of the Acquiror Company Common Shares, all the certificates representing the Acquiror Company Common Shares, as well as all certifi cates issued in exchange for or in substitution of the foregoing securities, shall bear the following legend:
“THE SECURITIES REPRESENTED BY THIS CERTIFICATE HAVE NOT BEEN REGISTERED UNDER THE SECURITIES ACT OF 1933, AS AMENDED (THE “ACT”), OR ANY APPLICABLE STATE OR FOREIGN SECURITIES LAWS, AND MAY NOT BE SOLD, MORTGAGED, PLEDGED, HYPOTHECATED OR OTHERWISE TRANSFERRED WITHOUT AN EFFECTIVE REGISTRATION STATEMENT FOR SUCH SECURITIES UNDER THE ACT OR THE AVAILABILITY OF AN EXEMPTION FROM SUCH REGISTRATION REQUIREMENTS. UNLESS PERMITTED UNDER SECURITIES LEGISLATION, THE HOLDER OF THIS SECURITY MUST NOT TRADE THE SECURITY BEFORE [INSERT DATE THAT IS 4 MONTHS AND ONE DAY FROM CLOSING DATE].”
ARTICLE VII
CONDITIONS PRECEDENT OF THE ACQUIROR COMPANY
The Acquiror Company’s obligation to acquire the Shares and to take the other actions required to be taken by the Acquiror Company at the Closing Date is subject to the satisfaction, at or prior to the Closing Date, of each of the following conditions (any of which may be waived by the Acquiror Company, in whole or in part):
J-24
7.1 Accuracy of Representations. The representations and warranties of the Shareholders set forth in this Agreement or in any Schedule or certificate delivered pursuant hereto that are not qualified as to materiality shall be true and correct in all material respects as of the date of this Agreement and the Closing Date, except to the extent a representation or warranty is expressly limited by its terms to another date. The representations and warranties of the Company and the Shareholders set forth in this Agreement or in any Schedule or certificate delivered pursuant hereto that are qualified as to materiality shall be true and correct in all respects as of the date of this Agreement an d the Closing Date, except to the extent a representation or warranty is expressly limited by its terms to another date.
7.2 Performance by the Company and Shareholders.
7.2.1 All of the covenants and obligations that the Company and the Shareholders are required to perform or to comply with pursuant to this Agreement (considered collectively), and each of these covenants and obligations (considered individually), must have been duly performed and complied with.
7.2.2 The Shareholders shall have properly completed and duly executed an Internal Revenue Service Form W-8 or W-9, as applicable.
7.2.3 Each document required to be delivered by the Company and the Shareholders pursuant to this Agreement shall have been delivered.
7.3 No Force Majeure Event. There shall not have been any delay, error, failure or interruption in the conduct of the business of the Company, or any loss, injury, delay, damage, distress, or other casualty, due to force majeure including but not limited to (a) acts of God; (b) fire or explosion; (c) war, acts of terrorism or other civil unrest; or (d) national emergency.
7.4 Certificate of Officer. The Company will have delivered to the Acquiror Company a certificate executed by an officer of the Company, certifying the satisfaction of the conditions specified in Sections 7.1, 7.2, and 7.3 and such other matters as the Acquiror Company may reasonably request.
7.5 Certificate of Shareholders. Each Shareholder will have delivered to the Acquiror Company a certificate executed by such Shareholder, if a natural person, or an authorized officer of the Shareholder, if an entity, certifying the satisfaction of the conditions specified in Sections 7.1 and 7.2 and such other matters as the Acquiror Company may reasonably request.
7.6 Consents.
7.6.1 All material consents, waivers, approvals, authorizations or orders required to be obtained, and all filings required to be made, by the Company and/or the Shareholders for the authorization, execution and delivery of this Agreement and the consummation by them of the transactions contemplated by this Agreement, shall have been obtained and made by the Company or the Shareholders, as the case may be.
7.6.2 Acquiror Company shall have received approval from its shareholders on such basis as prescribed by Laws and requirements of the Toronto Stock Exchange, including approval by a majority of its shareholders, excluding the shares of any of the Shareholders, their Affiliates and persons with whom they may act jointly or in concert.
J-25
7.7 Documents. The Company and the Shareholders must deliver to the Acquiror Company at the Closing:
7.7.1 duly executed share transfer forms (in the form as set out in Exhibit A) transferring the Shares from the Shareholders to the Acquiror Company;
7.7.2 certified copy of the register of members of the Company evidencing that the transfer of the Shares from the Shareholders to the Acquiror Company has been registered;
7.7.3 a duly executed and issued share certificate in the name of the Acquiror Company in respect of the Shares;
7.7.4 a directors’ resolution of the Company in the agreed form, duly passed, approved and completed in all respects (the “Directors’ Resolution”). The Shareholders shall also procure that each action and other matter specified in such Directors’ Resolution has been completed at Closing and has been notified to the Registrar of Corporate Affairs (the “Registrar”) (if applicable) and the Shareholders have produced evidence thereof to the Acquiror Company;
7.7.5 if required, a member’s resolution of the Company in the agreed form, duly passed, approved and completed in all respects (the “Member’s Resolution”). The Shareholders shall also procure that each action and other matter specified in any such Member’s Resolution has been completed at Closing and has been notified to the Registrar (if applicable) and the Shareholders have produced evidence thereof to the Acquiror Company; and
7.7.6 such other documents and evidence as the Acquiror Company may reasonably request for the purpose of (a) evidencing the accuracy of any of the representations and warranties of the Company and the Shareholders pursuant to Section 7.1, (b) evidencing the performance of, or compliance by the Company and the Shareholders with, any covenant or obligation required to be performed or complied with by the Company or the Shareholders, as the case may be, (c) evidencing the satisfaction of any condition referred to in this Article VII, or (d) otherwise facilitating the consummation or performance of any of the transactions contemplated by this Agreement.
7.8 No Proceedings. There must not have been commenced or threatened against the Acquiror Company, the Company or the Shareholders, or against any Affiliate thereof, any Proceeding (which Proceeding remains unresolved as of the Closing Date) (a) involving any challenge to, or seeking damages or other relief in connection with, any of the transactions contemplated by this Agreement, or (b) that may have the effect of preventing, delaying, making illegal, or otherwise interfering with any of the transactions contemplated by this Agreement. There must not have occurred any Insolvency Proceeding in relation to the Company.
7.9 No Claim Regarding Stock Ownership or Consideration. There must not have been made or threatened by any Person any claim asserting that such Person (a) is the holder of, or has the right to acquire or to obtain beneficial ownership of the Shares or any other stock, voting, equity, or ownership interest in, the Company, or (b) is entitled to all or any portion of the Acquiror Company Common Shares.
J-26
7.10 KylinTV Inc. The Company shall have assigned or transferred, via declaration of dividend or otherwise, its entire ownership interest in KyLinTV, Inc. to the Shareholders.
ARTICLE VIII
CONDITIONS PRECEDENT OF THE COMPANY
AND THE SHAREHOLDERS
The Shareholders’ obligation to transfer the Shares and the obligations of the Company to take the other actions required to be taken by the Company in advance of or at the Closing Date are subject to the satisfaction, at or prior to the Closing Date, of each of the following conditions (any of which may be waived by the Company and the Shareholders jointly, in whole or in part):
8.1 Accuracy of Representations. The representations and warranties of the Acquiror Company set forth in this Agreement or in any Schedule or certificate delivered pursuant hereto that are not qualified as to materiality shall be true and correct in all material respects as of the date of this Agreement and the Closing Date except to the extent a representation or warranty is expressly limited by its terms to another date. The representations and warranties of the Acquiror Company set forth in this Agreement or in any Schedule or certificate delivered pursuant hereto that are qualified as to materiality shall be true and correct in all respects as of the date of this Agreement and the Clo sing Date, except to the extent a representation or warranty is expressly limited by its terms to another date.
8.2 Performance by the Acquiror Company.
8.2.1 All of the covenants and obligations that the Acquiror Company is required to perform or to comply with pursuant to this Agreement (considered collectively), and each of these covenants and obligations (considered individually), must have been performed and complied with in all respects.
8.2.2 Each document required to be delivered by the Acquiror Company pursuant to this Agreement must have been delivered.
8.3 No Force Majeure Event. There shall not have been any delay, error, failure or interruption in the conduct of the business of the Acquiror Company, or any loss, injury, delay, damage, distress, or other casualty, due to force majeure including but not limited to (a) acts of God; (b) fire or explosion; (c) war, acts of terrorism or other civil unrest; or (d) national emergency.
8.4 Certificate of Officer. The Acquiror Company will have delivered to the Company a certificate, dated the Closing Date, executed by an officer of the Acquiror Company, certifying the satisfaction of the conditions specified in Sections 8.1, 8.2, and 8.3 and such other matters as the Company may reasonably request.
J-27
8.5 Consents. All material consents, waivers, approvals, authorizations or orders required to be obtained, and all filings required to be made, by the Acquiror Company for the authorization, execution and delivery of this Agreement and the consummation by it of the transactions contemplated by this Agreement, shall have been obtained and made by the Acquiror Company, except where the failure to receive such consents, waivers, approvals, authorizations or orders or to make such filings would not have a Material Adverse Effect on the Company or the Acquiror Company.
8.6 Documents. The Acquiror Company must have caused the following documents to be delivered to the Company and/or the Shareholders:
8.6.1 share certificates evidencing each Shareholder’s Acquiror Company Common Shares in the amount set forth opposite such Shareholder’s name on Schedule A;
8.6.2 a Secretary’s Certificate, dated the Closing Date, certifying attached copies of (A) the Organizational Documents of the Acquiror Company, (B) the resolutions of the Acquiror Company board of directors approving this Agreement and the transactions contemplated hereby; and (C) the incumbency of each authorized officer of the Acquiror Company signing this Agreement and any other agreement or instrument contemplated hereby to which the Acquiror Company is a party;
8.6.3 such other documents as the Company may reasonably request for the purpose of (i) evidencing the accuracy of any representation or warranty of the Acquiror Company pursuant to Section 8.1, (ii) evidencing the performance by the Acquiror Company of, or the compliance by the Acquiror Company with, any covenant or obligation required to be performed or complied with by the Acquiror Company, (iii) evidencing the satisfaction of any condition referred to in this Article VIII, or (iv) otherwise facilitating the consummation of any of the transactions contemplated by this Agreement.
8.7 No Proceedings. Since the date of this Agreement, there must not have been commenced or threatened against the Acquiror Company, the Company or the Shareholders, or against any Affiliate thereof, any Proceeding (which Proceeding remains unresolved as of the date of this Agreement) (a) involving any challenge to, or seeking damages or other relief in connection with, any of the transactions contemplated hereby, or (b) that may have the effect of preventing, delaying, making illegal, or otherwise interfering with any of the transactions contemplated hereby.
ARTICLE IX
INDEMNIFICATION; REMEDIES
9.1 Survival. All representations, warranties, covenants, and obligations in this Agreement shall expire on the third anniversary of the date of this Agreement, except that the representation and warranties contained in Sections 4.1 and 4.2.7 shall survive indefinitely (the “Survival Period”) and the representations and warranties contained in Sections 4.2.17 (Tax Returns and Audits) shall survive until 60 days after the expiration of the applicable Tax statute of limitations. The right to indemnification, payment of Damages or other remedy based on such representations, warranties, covenants, and obligations will not be affected by any investigation conducted with respect to, or any knowledge acquired (or capable of being acquired) at any time, whether before or after the execution and delivery of this Agreement, with respect to the accuracy or inaccuracy of or compliance with, any such representation, warranty, covenant, or obligation. The waiver of any condition based on the accuracy of any representation or warranty, or on the performance of or compliance with any covenant or obligation, will not affect the right to indemnification, payment of Damages, or other remedy based on such representations, warranties, covenants, and obligations.
J-28
9.2 Indemnification by the Shareholders.
9.2.1 From and after the execution of this Agreement until the expiration of the Survival Period:
(a) each Shareholder, severally and not jointly, shall indemnify and hold harmless the Acquiror Company from and against any Damages arising, directly or indirectly, from or in connection with any breach of any representation or warranty made by such Shareholder in Section 4.1 of this Agreement and the failure by such Shareholder to perform any covenants or agreement in this Agreement to be performed by such Shareholder.
(b) the Shareholders, jointly and not severally, shall indemnify and hold harmless the Acquiror Company from and against any Damages arising, directly or indirectly, from or in connection with (i) any breach of any representation or warranty made by the Shareholders in Section 4.2 of this Agreement; (ii) any breach by the Shareholders of any covenant or obligation of the Company in this Agreement required to be performed by the Company or the Shareholders on or prior to the Closing Date; (iii) any and all losses, claims, damages, or liabilities against the Company or the Shareholders occurring on or prior to the Closing Date or (iv) any Taxes arising from the transfer contemplated in Section 7.10 hereof.
9.3 Third Party Claims. If any legal proceedings are instituted or any claim or demand is asserted by any Person (a “Third Party Claim”) in respect of which the Acquiror Company may seek indemnification from the Shareholders pursuant to the provisions of Article IX, the Acquiror Company shall promptly cause written notice of the assertion of any such claim or demand to be made to the Shareholders. The Acquiror Party shall have the right at any time, at its option and expense, to defend against, negotiate or, with the consent of the Shareholders, settle any such claim, and in such case, the Shareholders shall not be liable for the fees and expenses of counsel employed by the Ac quiror Company. Shareholders and Acquiror Company shall cooperate fully with each other in connection with the defense, negotiation and settlement of any such legal proceeding, claim or demand.
9.4 Limitations on Amount. The Acquiror Company shall not be entitled to indemnification unless and until the aggregate amount of Damages with respect to such matters under Section 9.2 exceeds US$50,000, at which time, the Acquiror Company shall be entitled to indemnification for the total amount of such Damages; provided however, that this Section 9.4 will not apply to any breach of the Shareholders representations and warranties of which Acquiror Company had knowledge at any time prior to the date on which such representation and warranty is made or any intentional breach of any covenant or obligation.
J-29
9.5 Determining Damages. Materiality qualifications to the representations and warranties of the Shareholders shall not be taken into account in determining the amount of Damages occasioned by a breach of any such representation and warranty for purposes of determining whether the threshold set forth in Section 9.4 have been met.
9.6 Characterization of Indemnification Payments. Acquiror Company and the Shareholders agree to treat any indemnification payment under this Agreement, to the maximum extent permitted by applicable Law, as an adjustment to the consideration received by the Shareholders.
9.7 Exclusivity. From and after the Closing, the sole and exclusive remedy of any party for Damages with respect to any and all claims arising out of or in connection with this Agreement shall be pursuant to the provisions set forth in this Article IX; provided, however, that the foregoing shall not limit the right of any party to assert a claim based on fraud.
ARTICLE X
TERMINATION
10.1 Termination Procedures. This Agreement may be terminated before the Closing Date only as follows:
(a) by written agreement of Acquiror Company and the Shareholders at any time;
(b) by Acquiror Company, by notice to the Shareholders at any time, if satisfaction of any of the conditions specified in Article VIII becomes impossible and such condition has not been waived by the Shareholders; or
(c) by the Shareholders, by notice to Acquiror Company at any time, if satisfaction of any of the conditions specified in Article VII becomes impossible and such condition has not been waived by Acquiror Company.
10.2 Frustration of Closing Conditions. Neither Acquiror Company nor any of the Shareholders may rely on the failure of any condition set forth in this Article X to be satisfied if such failure was caused by such party’s failure to act in good faith or use its reasonable efforts to cause the Closing to occur, as required in Section 6.8.
10.3 Effect of Termination. In the event that this Agreement is terminated pursuant to Section 10.1, this Agreement shall terminate without any liability or further obligation of any party or any of its officers, directors, members or shareholders, Affiliates, advisors, agents or representatives to any other Person, except for the obligations of Acquiror Company, the Shareholders and the Company under Sections 6.3 (relating to confidentiality), 11.1 (relating to payment of expenses), 11.3, 11.4, 11.7, 11.10, 11.11, which obligations shall survive indefinitely. Notwithstanding termination of this Agreement, nothing in this Section 10.3 shall be deemed to release any party from any liability for any breach by su ch party of the terms and provisions of this Agreement prior to the date of termination.
J-30
ARTICLE XI
GENERAL PROVISIONS
11.1 Expenses. Except as otherwise expressly provided in this Agreement, each party to this Agreement will bear its respective expenses incurred in connection with the preparation, execution, and performance of this Agreement and the transactions contemplated by this Agreement, including all fees and expenses of agents, representatives, counsel, accountants and valuation experts.
11.2 Notices. All notices, consents, waivers, and other communications under this Agreement must be in writing and will be deemed to have been duly given when (a) delivered by hand (with written confirmation of receipt), (b) sent by facsimile (with written confirmation of receipt) or email, or (c) when received by the addressee, if sent by a nationally recognized overnight delivery service (receipt requested), in each case to the appropriate addresses and facsimile numbers set forth below (or to such other addresses and facsimile numbers as a party may designate by written notice to the other parties):
If to Acquiror Company: NeuLion, Inc. 1600 Old Country Road Plainview, NY 11803 USA Attention: Roy E. Reichbach, General Counsel Telephone No.: 516-622-8300 Facsimile No.: 516-622-7510 Email: roy.reichbach@neulion.com |
If to the Company: TransVideo International Ltd. c/o Robert T. Bell The Charles B. Wang Foundation Park 80 West Plaza 2 Saddle Brook, NJ 07663 USA Telephone No.: 201-368-7880 Facsimile No.:201-368-7884 Email: rtbell@cbwfoundation.org |
J-31
If to the Shareholders: AvantaLion LLC c/o Robert T. Bell The Charles B. Wang Foundation Park 80 West Plaza 2 Saddle Brook, NJ 07663 USA Telephone No.: 201-368-7880 Facsimile No.:201-368-7884 Email: rtbell@cbwfoundation.org |
11.3 Consent to Jurisdiction. Each of the parties (a) consent to submit itself to the personal jurisdiction of the Eastern District Court of New York or any New York state court located in Nassau County, New York in the event any dispute or controversy arises under this Agreement or the transaction contemplated hereby, (b) shall not attempt to deny or defeat such personal jurisdiction by motion or other request for leave from any such court and (c) shall not bring any action related to this Agreement or the transaction contemplated hereby in any court other than the courts specified herein. Each of the parties hereby irrevocable and unconditionally consents to service of process in the ma nner provided for notice in Section 11.2. Nothing in this Agreement will affect the right of any party to this Agreement to serve process in any other manner permitted by Law.
11.4 Waiver of Jury Trial. EACH PARTY IRREVOCABLY WAIVES ALL RIGHT TO TRIAL BY JURY IN ANY ACTION, PROCEEDING OR COUNTERCLAIM (WHETHER BASED ON CONTRACT, TORT OR OTHERWISE) ARISING OUT OF OR RELATING TO THIS AGREEMENT OR THE ACTIONS OF SUCH PARTY IN THE NEGOTIATION, ADMINISTRATION, PERFORMANCE AND ENFORCEMENT HEREOF.
11.5 Further Assurances. The parties agree (a) to furnish upon request to each other such further information, (b) to execute and deliver to each other such other documents, and (c) to do such other acts and things, all as the other party may reasonably request for the purpose of carrying out the intent of this Agreement and the documents referred to in this Agreement.
11.6 Waiver. The rights and remedies of the parties to this Agreement are cumulative and not alternative. Neither the failure nor any delay by any party in exercising any right, power, or privilege under this Agreement or the documents referred to in this Agreement will operate as a waiver of such right, power, or privilege, and no single or partial exercise of any such right, power, or privilege will preclude any other or further exercise of such right, power, or privilege or the exercise of any other right, power, or privilege. To the maximum extent permitted by applicable Law, (a) no claim or right arising out of this Agreement or the documents referred to in this Agreement can be discharged by one party, in whole or in part, by a waiver or renunciation of the claim or right unless in writing signed by the other party; (b) no waiver that may be given by a party will be applicable except in the specific instance for which it is given; and (c) no notice to or demand on one party will be deemed to be a waiver of any obligation of such party or of the right of the party giving such notice or demand to take further action without notice or demand as provided in this Agreement or the documents referred to in this Agreement.
J-32
11.7 Entire Agreement and Modification. This Agreement supersedes all prior agreements between the parties with respect to its subject matter and constitutes (along with the documents referred to in this Agreement) a complete and exclusive statement of the terms of the agreement between the parties with respect to its subject matter. This Agreement may not be amended except by a written agreement executed by the party against whom the enforcement of such amendment is sought.
11.8 Assignments, Successors, and No Third-Party Rights. No party may assign any of its rights under this Agreement without the prior consent of the other parties. Subject to the preceding sentence, this Agreement will apply to, be binding in all respects upon, and inure to the benefit of and be enforceable by the respective successors and permitted assigns of the parties. Nothing expressed or referred to in this Agreement will be construed to give any Person other than the parties to this Agreement any legal or equitable right, remedy, or claim under or with respect to this Agreement or any provision of this Agreement. This Agreement and all of its provisions and co nditions are for the sole and exclusive benefit of the parties to this Agreement and their successors and assigns.
11.9 Severability. If any provision of this Agreement is held invalid or unenforceable by any court of competent jurisdiction, the other provisions of this Agreement will remain in full force and effect. Any provision of this Agreement held invalid or unenforceable only in part or degree will remain in full force and effect to the extent not held invalid or unenforceable.
11.10 Governing Law. This Agreement will be governed by the laws of the State of New York without regard to conflicts of laws principles.
11.11 Counterparts. This Agreement may be executed in one or more counterparts, each of which will be deemed to be an original copy of this Agreement and all of which, when taken together, will be deemed to constitute one and the same agreement.
J-33
IN WITNESS WHEREOF, the parties have executed and delivered this Share Exchange Agreement as of the date first written above.
Acquiror Company: NEULION, INC. | |||
| By: | |||
| Name: | |||
| Title: | |||
| Company | |||
| TRANSVIDEO INTERNATIONAL LTD. | |||
| By: | |||
| Name: | |||
| Title: | |||
| Shareholders: | |||
| AVANTALION LLC | |||
| By: | |||
| Name: | |||
| Title: | |||
| Wang Yunchuan | |||
| Hao Jingfang | |||
| Wang Qi | |||
| Tan Zhongjun | |||
| Wang Xiaohong | |||
J-34
| Shu Wei | ||
| Zhao Yun |
J-35
SCHEDULE A
| hareholder | Jurisdiction of Residency | Shares | Acquiror Company Common Shares |
| AvantaLion LLC | Delaware | 2,592,000 | 17,820,650 |
| Wang Yunchuan | PRC | 232,000 | 1,595,058 |
| Hao Jingfang | PRC | 232,000 | 1,595,058 |
| Wang Qi | PRC | 30,000 | 206,258 |
| Tan Zhongjun | PRC | 26,000 | 178,757 |
| Wang Xiaohong | PRC | 40,000 | 275,010 |
| Shu Wei | PRC | 40,000 | 275,010 |
| Zhao Yun | PRC | 8,000 | 55,002 |
| Total | 3,200,000 | 22,000,802 |
J-36
Pursuant to Item 601(b)(2) of Regulation S-K, the Schedules to the Share Exchange Agreement (the "Agreement") setting forth the exceptions to the representations and warranties of shareholders made in Article IV of the Agreement have been omitted from this filing. NeuLion, Inc. agrees to furnish supplementally a copy of the omitted Schedules to the Securities and Exchange Commission upon request.
J-37
EXHIBIT A
TRANSVIDEO INTERNATIONAL LTD.
(the "Company")
A BVI Business Company
with BVI Company Number 580404
SHARE TRANSFER FORM
[ ] ("the Transferor"), for good and valuable consideration received by him/her/it from NeuLion, Inc. ("the Transferee") of 1600 Old Country Road, Plainview, NY 11803, USA, does hereby:
| 1. | transfer to the Transferee the [ ] fully paid shares in the Company (of a par value of US$0.01 each) (the "Shares") standing in the Transferor's name in the Register of Members of the Company to hold unto the Transferee, its administrators and assigns, subject to the several conditions on which the Transferor held the same at the time of execution of this Share Transfer Form; and |
| 2. | consents that the Transferor's name remains on the Register of Members of the Company until such time as the Company enters the Transferee's name in the Register of Members of the Company. |
And the Transferee does hereby agree to take the Shares subject to the same conditions.
This Share Transfer Form may be executed in counterparts each of which when executed and delivered shall constitute an original but all such counterparts together shall constitute one and the same instrument.
As Witness Our Hands
Signed by the Transferor on _____2010
in the presence of:
| Witness | For and on behalf of the Transferor [Name] |
Signed by the Transferee on ____2010 in the presence of: | ||
| Witness | For and on behalf of the Transferee NeuLion Inc. |
J-38
APPENDIX “K”
K-1
NeuLion Annual Financial Statements
NeuLion, Inc.
Consolidated Financial Statements
December 31, 2009 and 2008
(Stated in US Dollars)
K-2
Item 7. Management’s Discussion and Analysis of Financial Condition and Results of Operations
On June 4, 2009, the company then known as NeuLion, Inc. changed its name to NeuLion USA, Inc. (“NeuLion USA”). On July 13, 2009, JumpTV Inc. changed its name to NeuLion, Inc. (the “Company” or “NeuLion”). In conjunction with the name change, NeuLion’s stock symbol on the Toronto Stock Exchange was changed from “JTV” to “NLN”. This Item 7 reflects these name changes.
The following Management's Discussion & Analysis (“MD&A”) of NeuLion’s financial condition and results of operations, prepared as of March 16, 2010, should be read in conjunction with the Company's audited consolidated financial statements and accompanying notes for the years ended December 31, 2009 and 2008, which have been prepared in accordance with United States generally accepted accounting principles (“U.S. GAAP”). All dollar amounts are in U.S. dollars (“US$” or “$”) unless stated otherwise. As at March 10, 2010, the Bank of Canada noon rate for conversion of United States dollar to Canadian dollars was US$1 to CDN$1.0243.
Effective October 20, 2008, NeuLion completed a merger (the “Merger”) with NeuLion USA, a Delaware corporation, that was accounted for as a reverse takeover. NeuLion USA is an Internet Protocol television company that provides a comprehensive suite of technology and services to content owners and aggregators. As a result of the Merger, NeuLion USA became the legal subsidiary of NeuLion, and NeuLion was required to register its common shares in the United States under Section 12 of the Securities Exchange Act of 1934, as amended. On June 8, 2009, NeuLion’s Registration Statement on Form 10 became effective. The common shares of NeuLion are referred to herein as “Shares,” or each individually as a “Share.”
Effective October 31, 2009, NeuLion consummated the acquisition of 100% of the outstanding securities of Interactive Netcasting Systems Inc. ("INSINC"), a corporation organized under the federal laws of Canada that is a provider of sports, government and entertainment webcasting services. Under the terms of the acquisition, shareholders of INSINC received consideration consisting of 6,000,012 Shares of the Company, CDN$2.5 million in cash, 1 million Share purchase warrants to acquire Shares at US$1.35 per Share and 500,000 Share purchase warrants to acquire Shares at US$1.80 per Share. Both series of warrants are exercisable for a period of 2 years.
Our MD&A is intended to enable readers to gain an understanding of NeuLion's current results and financial position. To do so, we provide information and analysis comparing the results of operations and financial position for the current year to those of the preceding comparable year. We also provide analysis and commentary that we believe is required to assess the Company's future prospects. Accordingly, certain sections of this report contain forward-looking statements that are based on current plans and expectations. These forward-looking statements are affected by risks and uncertainties that are discussed in NeuLion’s annual report on Form 10-K (the “10-K”), and below in the section titled “Cautions Regarding Forward-Looking Statements”, and could have a material impact on future prospects. Readers are cautioned that actual results could vary from those forecasted in this MD&A.
Cautions Regarding Forward-Looking Statements
This MD&A contains certain forward-looking statements, which reflect management’s expectations regarding the Company’s growth, results of operations, performance and business prospects and opportunities.
Statements about the Company’s future plans and intentions, results, levels of activity, performance, goals or achievements or other future events constitute forward-looking statements. Wherever possible, words such as "may," "will," "should," "could," "expect," "plan," "intend," "anticipate," "believe," "estimate," "predict," or "potential" or the negative or other variations of these words, or similar words or phrases, have been used to identify these forward-looking statements. These statements reflect management’s current beliefs and are based on information currently available to management as at the date hereof.
K-3
Forward-looking statements involve significant risk, uncertainties and assumptions. Many factors could cause actual results, performance or achievements to differ materially from the results discussed or implied in the forward-looking statements. These factors should be considered carefully and readers should not place undue reliance on the forward-looking statements. Although the forward-looking statements contained in this MD&A are based upon what management believes to be reasonable assumptions, the Company cannot assure readers that actual results will be consistent with these forward-looking statements. These forward-looking statements are made as of the date of this MD&A, and the Company assumes no obligation to update or revise them to reflect new events or circumstances, exce pt as required by law. Many factors could cause the actual results, performance or achievements of the Company to be materially different from any future results, performance or achievements that may be expressed or implied by such forward-looking statements, including: general economic and market segment conditions; competitor activity; product performance; capability and acceptance; international risk and currency exchange rates; and technology changes. More detailed assessment of the risks that could cause actual results to materially differ from current expectations is contained herein and in the "Risk Factors" section of the 10-K.
MERGER AND REVERSE TAKE-OVER
On October 20, 2008, the Company completed the Merger with NeuLion USA. Under the terms of the Merger, NeuLion issued 49,577,427 Shares directly, as well as 1,840,097 Shares subject to a performance escrow relating to a prior acquisition, which represented approximately the entire issued and outstanding Shares of NeuLion prior to closing, to the securityholders of NeuLion USA in exchange for their NeuLion USA securities. The escrow Shares were subsequently cancelled in September 2009. Pursuant to the Merger, the Company also issued 5,000,000 warrants to purchase Shares, fully vested and exercisable for two years at US$0.63 per Share, and 2,700,000 employee stock options to purchase Shares, vesting in equal monthly amounts over 48 months and exercisable for five years at US$0.60 per Share, to employees of NeuLion USA who became employees of the Company.
On October 20, 2008, AvantaLion LLC, an entity controlled by Charles B. Wang, the Chairman of the Board of Directors of the Company and the spouse of Nancy Li, our CEO and the founder and CEO of NeuLion USA, purchased 10,000,000 units from NeuLion's treasury at a price of CDN$1.00 per unit. Each unit (a "Unit") consists of one Share, one-half of one Series A Share purchase warrant and one-half of one Series B Share purchase warrant. Each whole Series A Share purchase warrant is exercisable at CDN$1.25, and each whole Series B Share purchase warrant is exercisable at CDN$1.50, in each case for a period of two years from the date of grant. G. Scott Paterson, our Vice Chairman, also purchased 1,000,000 Units on the same terms. The aggregate gross proceeds from the sale of Units were Cdn$11.0 million or US$9.2 million .
In accordance with Accounting Standards Codification Topic 805 (“ASC 805”), “Business Combinations” the Company has determined that NeuLion USA was the accounting acquirer and accordingly has accounted for the Merger as a reverse takeover. Therefore, the financial statements and this MD&A for the years ended December 31, 2009 and 2008 reflect the assets, liabilities and results of operations of NeuLion USA, the accounting acquirer, and only include the assets, liabilities and results of operations of NeuLion, the legal acquirer, subsequent to the reverse takeover on October 20, 2008 (the “Acquired Business”). This MD&A is issued under the name of the legal acquirer (NeuLion), but is deemed to be a continuation of the accounting acquirer (NeuLion USA ).
ACQUISITION OF INSINC
Effective October 31, 2009, the Company completed the acquisition of INSINC. INSINC is based in Burnaby, British Columbia, Canada, and has 20 employees. INSINC offers a range of software tools for streaming video content over the Internet. Its largest clients are in the area of sports, including the Western Hockey League (“WHL”), Ontario Hockey League (“OHL”), Central Hockey League (“CHL”), British Columbia Hockey League (“BCHL”), Central Canadian Hockey League (“CCHL”), Alberta Junior Hockey League (“AJHL”), the Central Junior Hockey League (“CJHL”) and the Canadian Football League (“CFL”).
INSINC also provides services within the government and entertainment broadcasting sectors with clients including Business News Network (“BNN”), CTV News Channel, Rogers Sportsnet, TVG Networks, The Canadian Press, the Canadian Ministry of Justice, the BC Ministry of Education, and the Legislative Assemblies of British Columbia and Newfoundland and Labrador, among others.
Under the terms of the acquisition, shareholders of INSINC received consideration consisting of 6,000,012 Shares of the Company, CDN $2.5 million in cash, 1 million Share purchase warrants to acquire Shares at USD $1.35 per Share and 500,000 Share purchase warrants to acquire Shares at USD $1.80 per Share. Both series of warrants are exercisable for a period of 2 years.
K-4
The aggregate purchase price of $6,694,293 represents the fair value of 6,000,012 Shares issued of $4,035,043 (determined using the market price of the Shares at the time of issuance), cash in the amount of $2,320,500 and the fair value of the Share purchase warrants in the amount of $338,750 (determined using the Black-Scholes-Merton model).
The preliminary fair values of the assets acquired are as follows:
| Balance Sheet Data: | |||
| October 31, | |||
| 2009 | |||
| $ | |||
| Cash | 344,371 | ||
| Accounts receivable | 306,551 | ||
| Prepaid expenses and deposits | 92,351 | ||
| Other receivables | 338,504 | ||
| Fixed assets | 739,690 | ||
| Accounts payable and accrued liabilities | (1,171,884 | ) | |
| Long-term liabilities | (120,000 | ) | |
| Deferred revenue | (125,815 | ) | |
| Intangible assets - contractual agreements | 5,180,000 | ||
| Intangible assets - tradename | 95,000 | ||
| Goodwill | 1,015,525 | ||
| Total | 6,694,293 | ||
As noted above, the purchase price allocation of the tangible and intangible assets is preliminary and may be adjusted as a result of obtaining additional information regarding preliminary estimates of fair values made at the date of purchase.
INSINC recorded revenues of CDN $5.6 million, EBITDA of CDN$0.4 million and net income of CDN$0.3 million for the year ended December 31, 2008.
The results of operations for INSINC for fiscal 2009 have been included in the Company’s consolidated statements of operations from the October 31, 2009 effective date of the acquisition to December 31, 2009 and are summarized below.
| Income Statement Data: | |||
| Year ended | |||
| 31-Dec-09 | |||
| $ | |||
| Total revenue | 575,347 | ||
| Total cost of revenue | (238,309 | ) | |
| Total selling, general and adminstrative costs | (264,816 | ) | |
| Depreciation and amortization | (8,965 | ) | |
| Loss on foreign exchange | (6,169 | ) | |
| Net income | 57,088 | ||
K-5
OVERVIEW
The Company is a leading Internet Protocol (“IP”) television company, providing end-to-end IPTV services. “IPTV” refers to the distribution over an IP network of streamed audio, video and other multimedia content, similar to television programming content, using industry-standard streaming protocols. We build and manage private networks for content owners and aggregators (our content partners) that are used to stream content to multiple platforms through browser-based devices. That content includes live and on-demand sports and international and variety programming, which we then deliver to subscribers and pay-per-view customers for viewing on Internet-connected browser-based devices such as personal computers, laptops and mobile devices and on standard television sets through Internet-connected set top boxes ( “STBs”). NeuLion’s main business objective is to enter into agreements with companies seeking their own private networks to reach target audiences and to provide complete IPTV services to these companies. We also acquire the rights to certain sports and international content from television broadcasters (our channel partners), which we then stream to end users through our own private networks.
Our business model has evolved from a professional IT services and international programming provider to an end-to-end provider of the following IPTV services. By “end-to-end provider of IPTV services,” we mean that we provide the following services:
| · | content management - encoding of various digital and analog TV and video formats; |
| · | subscriber management - managing subscriber access and control of subscriber accounts; |
| · | digital rights management — preserving the integrity of the content and protecting it from unauthorized access; |
| · | billing services - enabling customers to view subscription accounts, providing pay-per-view transactional billing and payment processing; |
| · | delivery - delivering streamed audio, video and other multimedia content anywhere, anytime through the Company’s IPTV service and infrastructure; and |
| · | advertising insertion. |
On January 7, 2010, the Company announced that it had signed a multi-year partnership to distribute certain DISH Network L.L.C. (“DISH Network”) international channels using NeuLion's IPTV platform. The partnership with NeuLion enhances DISH Network's international programming offerings by providing consumers without access to satellite TV the ability to enjoy select DISH Network international channels through IPTV.
Customer Relationships
We have two types of relationships: business-to-business (“B2B”) and business-to-consumer (“B2C”).
B2B relationships have been our primary focus in the past and are expected to be the focus in the future. A B2B relationship is focused on providing an end-to-end solution to a customer to enable that customer to provide its content, by way of an IPTV platform built for that customer, to its end users. B2B customers typically aggregate the content, negotiate the licensing rights and directly market the availability of the content. This customer avails itself of the full services of the Company in delivery to its end users. This type of relationship is typical in the professional and college sports properties and in our agreements with international and broad-based content providers.
Our B2C relationships are individual consumer oriented. We have signed distribution agreements with our channel partners and content providers in exchange for revenue share or royalty payments to such providers. We then market the content on one (or more) of the proprietary targeted websites that we have developed which are focused on a specific diaspora community, as well as on the general Company website for purchase by an end user. We often aggregate the content into bundles or packages of similar interest (e.g. Talfazat for the Middle East community; TV-Desi for the South Asian community). We incur marketing expenses in promoting the availability of such content.
The United States and Canada are the principal markets in which our sales occur.
K-6
Products and Services
Sports programming
Through our comprehensive end-to-end IPTV solution, we provide our sports programming content partners with the ability to deliver live and on-demand content. We maintain distribution and technology services agreements with leading professional and collegiate sports properties as well as with the sports network ESPN. Amongst professional sports leagues, NeuLion counts the National Football League (NFL), the National Hockey League (NHL) and the American Hockey League (AHL). Through our recent acquisition of Interactive Netcasting Systems Inc. (“INSINC”), a provider of sports, government and entertainment webcasting services, we expanded our portfolio of sports content pa rtners to include the Western Hockey League (WHL), the Ontario Hockey League (OHL), the Central Hockey League (CHL), the British Columbia Hockey League (BCHL), the Central Canadian Hockey League (CCHL), the Alberta Junior Hockey League (AJHL), the Central Junior Hockey League (CJHL) and the Canadian Football League (CFL).
We also operate our own portfolio of sports-oriented websites, including Cycling.tv, CollegeSportsDirect.com and selected World Cup soccer properties. On the collegiate level, we are the premier partner for National Collegiate Athletic Association (NCAA) colleges and universities, with agreements in place with approximately 170 colleges, universities or related sites.
Ethnic/international and specialty programming
The Company also offers what is referred to in the industry as “ethnic television,” which the Company defines as programming directed at a specific diaspora community, as determined by a shared nationality, language or culture, and generally excluding communities for which English is the primary language. We have license agreements directly with channel partners representing approximately 185 channels in 55 countries that give NeuLion rights to stream, predominantly on an exclusive world-wide basis, the channel partners’ live linear television feeds over the public Internet using our proprietary private networks such as Talfazat and TV-Desi.
Our subsidiary, INSINC, also distributes government and entertainment content. Its clients in those industries include Business News Network (BNN), CTV News Channel, Rogers Sportsnet, TVG Networks, The Canadian Press, the Canadian Ministry of Justice, the BC Ministry of Education, and the Legislative Assemblies of British Columbia and Newfoundland and Labrador, among others.
We also have relationships with other specialty programming customers such as Sky Angel U.S. LLC, which streams faith-based programming.
Services
Our suite of technology and other services is directed at the entire spectrum of content aggregation and delivery. Our services include:
| · | content ingestion; |
| · | web site design and hosting; |
| · | live and on-demand streaming of content on multiple platforms; |
| · | billing services; |
| · | facilitating online merchandise sales; |
| · | mobile features (streaming highlights, alerts, wallpaper and ring tones); |
| · | online ticketing; |
| · | auction engine (jerseys, tickets); |
| · | social networking; |
K-7
| · | customer and fan support; and |
| · | marketing and advertising sales. |
Distribution Methods
We distribute content through two primary methods:
| · | Internet-connected browser-based devices such as personal computers, laptops and mobile devices; and |
| · | standard television sets through use of our Internet-connected STBs. |
Both of our distribution methods take advantage of an open IPTV network, the public Internet. As a result, content delivered by NeuLion is available globally and is potentially unlimited in breadth.
Revenue
We earn revenue in two broad categories: services revenue and equipment revenue. Services revenue includes subscriber revenue, eCommerce revenue and technology services revenue. Equipment revenue includes the sale and shipping of STBs. Our revenue streams are described in detail in Item 7- Management’s Discussion & Analysis under the caption “OPERATIONS”.
Competition
New technologies and entrants could have a material adverse effect on the demand for NeuLion’s IPTV offerings. For example, fixed line telecommunications and mobile telephony companies who offer or plan to offer video services may be competitors of NeuLion. Together with other industry observers, we have witnessed and expect to continue to witness the launch of various closed network IPTV services around the world. As they strive to maintain and grow their customer bases, fixed line telecommunications companies will likely see closed network IPTV as a central element of a “triple-play” strategy that will package telephone, television and Internet services in a single offering. Moreover, certain IPTV service providers have an internal IP distribution strategy whereby they make their live linear feeds, as well as repur posed content, available through their own websites on a paid basis or free advertisement-supported basis.
We also face competition from other online content providers who offer sports, entertainment, and/or international programming. In addition, there are multiple operators of pirated video content who stream content for which they have not received consent from the legal and beneficial owners of such content. Furthermore, there are multiple front-end providers that provide a menu of links to streaming video content via websites on the Internet. These “bootleggers” and front-end providers have varying menus of ethnic content and offer such content at varying degrees of streaming quality.
We may also be placed at a competitive disadvantage to the extent that other video providers are able to offer programming of higher technical quality than we can. While we expect to continue to improve the technical quality of our products and services and offer our video content at increasingly higher streaming speeds, we cannot assure you that we will be able to compete effectively with other video providers.
To distinguish our product line from our competitors’ offerings, we seek to be a “one-stop shopping” source for our customers. Our suite of technology and other services, discussed above, is directed at the entire spectrum of content aggregation and delivery. Many companies in our markets offer far narrower choices of services than we offer. For example, some content providers deliver only their own content, while we offer the content of multiple providers. Or, an agency may provide only online ticketing services, while we also provide related online shopping and fan networking. We also provide the STBs used to view our content on a television set. We strive to meet every customer’s needs at every level and partner with them across product lines and extensions.
K-8
Overall Performance - Overview
The Company uses the term “organic” to refer to the period-over-period changes in its revenues and expenses, excluding the revenues and expenses of the Acquired Business and INSINC. This permits readers to better compare current year and prior year revenues and expenses, and to understand changes that have occurred, without regard to the effect of the Merger or the acquisition of INSINC.
Year ended December 31, 2009
Revenue for fiscal 2009 was $28.1 million, up 110% from $13.4 million in fiscal 2008. The revenue growth of $14.7 million was due to an increase in services revenue of $16.9 million, offset by a decrease in our equipment revenue of $2.2 million. The revenue growth was due to the following:
| · | organic growth of $3.3 million; |
| · | increase in revenue from the Acquired Business of $10.8 million (2008 revenue was from the date of the Merger on October 20, 2008 to December 31, 2008); and |
| · | revenue from INSINC of $0.6 million (revenue included in 2009 was from the October 31, 2009 effective date of the acquisition to December 31, 2009). |
The organic increase in services revenue is consistent with the increasing scope of operations. As the number of subscribers increases, there is a cumulative effect of increasing subscriber revenue on a quarter over quarter basis. The decrease in equipment revenue is a result of the uneven nature of this revenue stream – customers often place large single orders made to meet minimum order requirements, to manage the lead time between ordering and shipping and to minimize the related shipping costs. The lead time on new orders is approximately 12 weeks from placing an order to receipt of goods. The purchase by customers of STBs is a leading indicator of future subscriptions.
Our net loss for fiscal 2009 was $19.6 million, or a loss of $0.18 per basic and diluted Share, compared with a net loss of $11.6 million, or a loss of $0.21 per basic and diluted Share, in fiscal 2008. The increase in net loss of $8.0 million was due to the following:
| · | Increase in organic loss of $2.6 million (excluding non-operating expenses); |
| · | Increase in loss in the Acquired Business of $4.8 million, excluding non-operating expenses (2008 loss was from the date of the Merger on October 20, 2008 to December 31, 2008); and |
| · | Increase in non-operating expenses of $0.6 million (detailed below in the Net Loss to EBITDA reconciliation). |
On a pro forma basis (excluding INSINC), as if the Merger had occurred on January 1, 2008, revenue increased from $25.7 million to $27.5 million. Our net loss for fiscal 2008 (excluding INSINC) was $92.5 million or a loss of $0.90 per basic and diluted Share. The improvement in net loss of $72.9 million on a pro forma basis was due to the following:
| · | Increase in organic loss of $2.6 million (excluding non-operating expenses); |
| · | Reduction in net loss in the Acquired Business of $20.4 million due to cost reductions in most areas of the business (excluding non-operating expenses); and |
| · | Reduction in non-operating expenses of $55.1 million (detailed below in the Net Loss to EBITDA reconciliation). |
Our non-GAAP Adjusted EBITDA loss was $13.9 million in fiscal 2009 compared with a non-GAAP Adjusted EBITDA loss of $6.6 million in fiscal 2008. The increase in non-GAAP Adjusted EBITDA loss is due to the cash impact of the items noted above. On a pro forma basis, our non-GAAP Adjusted EBITDA loss decreased from a loss of $31.6 million in fiscal 2008 to a loss of $13.9 million in fiscal 2009. This decrease is due to cost reductions in most areas of the Acquired Business offset by the increased organic costs.
K-9
The Company reports non-GAAP Adjusted EBITDA loss because it is a key measure used by management to evaluate the results of the Company and make strategic decisions about the Company. Non-GAAP Adjusted EBITDA loss represents net loss before interest, income taxes, depreciation and amortization, stock-based compensation, impairment of long-lived assets, unrealized loss on derivatives, equity in loss of affiliate, investment income and foreign exchange gain. This measure does not have any standardized meaning prescribed by generally accepted accounting principles (“GAAP”) and therefore is unlikely to be comparable to the calculation of similar measures used by other companies, and should not be viewed as an alternative to measures of financial performance or changes in cash flows calculated in acc ordance with GAAP.
The reconciliation from net loss to non-GAAP Adjusted EBITDA loss is as follows:
| Years ended, | ||||||||||||
| Pro forma | ||||||||||||
| 2009 | 2008 | 2008 | ||||||||||
| (excl. INSINC) | ||||||||||||
| $ | $ | $ | ||||||||||
| Net loss | (19,640,921 | ) | (11,637,260 | ) | (92,459,364 | ) | ||||||
| Add back: | ||||||||||||
| Impairment of goodwill | - | - | 47,882,317 | |||||||||
| Impairment of long-lived assets | - | 1,036,993 | 5,982,030 | |||||||||
| Depreciation and amortization | 4,141,117 | 1,572,492 | 3,602,169 | |||||||||
| Stock-based compensation | 1,167,789 | 1,848,906 | 3,374,767 | |||||||||
| Unrealized loss on derivative | 801,350 | - | - | |||||||||
| Equity in loss of affiliate | - | 1,006,386 | 1,006,386 | |||||||||
| Investment income and foreign exchange gain | (362,070 | ) | (395,768 | ) | (998,753 | ) | ||||||
| Non-GAAP Adjusted EBITDA loss | (13,892,735 | ) | (6,568,251 | ) | (31,610,448 | ) | ||||||
OPERATIONS
Revenue
The Company earns revenue in two broad categories:
| (i) | Services revenue, which includes: |
| · | Subscriber revenue, which is recognized over the period of service or usage; |
| · | eCommerce revenue, which is recognized as the service is performed; and |
| · | Technology revenue, which consists of the set up and transcoder revenue and is recognized over the life of the contract. |
| (ii) | Equipment revenue, which is recognized when title of the STB passes to the customer. |
While our revenues have increased due to the organic growth in our existing business, the Merger and the acquisition of INSINC, we are currently uncertain as to the long-term impact of the downturn in the global economy on our business.
K-10
Cost and Expenses
Cost of services revenue
Cost of services revenue primarily consists of:
| · | Cost of subscriber revenue, which consists of : |
| · | royalty payments |
| · | network operating costs |
| · | bandwidth usage fees |
| · | colocation fees |
| · | Cost of eCommerce revenue, which consists of: |
| · | merchandising, donor and ticket sales, which has no associated cost – revenue is booked on a net basis |
| · | cost of advertising revenue is subject to revenue shares with the content provider |
| · | Cost of technology services revenue, which consists of: |
| · | third party transcoder software purchased |
| · | maintenance costs for transcoders |
Cost of equipment revenue
Equipment revenue consists of the sale of STBs to content partners and/or end users to enable the end user to receive the content over the Internet and display the signal on a television. Cost of equipment revenue primarily consists of purchases from TransVideo International, Ltd. (“Transvideo”) and Tatung Technology Incorporation of the products and parts for resale to customers. Shipping revenue and costs are included in equipment revenue and cost of equipment revenue, respectively.
Selling, general and administrative expenses, including stock-based compensation
Selling, general and administrative (“SG&A”) costs, including stock-based compensation, include:
| · | Wages and benefits – represents compensation for the Company's full-time and part-time employees as well as fees for consultants who are used by the Company from time to time; |
| · | Stock-based compensation – we estimate the fair value of our options, warrants and stock appreciation rights (“Convertible Securities”) for financial accounting purposes using the Black-Scholes-Merton model, which requires a number of subjective assumptions, including the expected life of the Convertible Securities, risk-free interest rate, dividend rate, forfeiture rate and future volatility of the price of our Shares. We expense the estimated fair value over the vesting period of the Convertible Securities. The vesting period is normally over a four-year period, vesting in an equal amount each month; however, the Board of Directors has the discretion to grant options with different vesting periods; |
| · | Marketing – represents expenses for both global and local marketing programs that focus on various target sports properties and ethnic communities. These initiatives include both on-line and off-line marketing expenditures. These expenditures also include search engine marketing and search engine optimization; |
| · | Professional fees – represents legal, accounting and recruiting fees; and |
| · | Other SG&A expenses – represents travel expenses, rent, office supplies, corporate IT services, credit card processing fees and other general operating expenses. |
K-11
Equity in loss of affiliate
From January 1, 2008 through December 31, 2009, the Company's equity interest in KyLinTV was 17.1%. KyLinTV is a company that is controlled by the Chairman of the Board of Directors of the Company. The Company also provides and charges KyLinTV for administrative and general corporate support. Management has determined that as a result of the 17.1% equity interest combined with the services that the Company provides KyLinTV, the Company continues to have significant influence on the operating activities of KyLinTV; therefore the Company continues to account for KyLinTV using the equity method of accounting for investment.
The Company’s proportionate share of the equity loss from KyLinTV has been accounted for as a charge on the Company's consolidated statements of operations and comprehensive loss. Due to KyLinTV’s accumulated losses, the investment had been reduced to zero as at December 31, 2008. No further charges will be recorded as the Company has no obligation to fund the losses of KyLinTV.
On February 26, 2010, a group of investors invested $10.0 million in KyLinTV for 15.1% of its equity, which reduced the Company’s equity interest in KyLinTV to 12.2%. Of the total $10.0 million investment, $1.0 million was invested by AvantaLion LLC, a company controlled by the Chairman of the Board of Directors of the Company.
K-12
SELECTED ANNUAL INFORMATION
The selected consolidated financial information set out below for the three years ended December 31, 2009, 2008 and 2007 and as at December 31, 2009, 2008 and 2007 has been derived from the Company’s audited consolidated financial statements and accompanying notes posted on www.sedar.com and at www.sec.gov. Readers should read the following information in conjunction with those statements and related notes.
| Years ended, | ||||||||||||
December 31, 2009 | December 31, 2008 | December 31, 2007 | ||||||||||
| $ | $ | $ | ||||||||||
| Consolidated Statement of Operations Data: | ||||||||||||
| Revenue | 28,093,677 | 13,443,339 | 7,810,711 | |||||||||
| Cost of sales | (14,387,152 | ) | (7,639,149 | ) | (5,504,254 | ) | ||||||
Selling, general and administrative expenses, including stock based compensation | (28,767,049 | ) | (14,221,347 | ) | (4,210,357 | ) | ||||||
| Net loss for the year | (19,640,921 | ) | (11,637,260 | ) | (4,515,759 | ) | ||||||
| Basic and diluted loss per share | (0.18 | ) | (0.21 | ) | (0.11 | ) | ||||||
| As at, | ||||||||||||
December 31, 2009 | December 31, 2008 | December 31, 2007 | ||||||||||
| $ | $ | $ | ||||||||||
| Consolidated Balance Sheet Data: | ||||||||||||
| Cash and cash equivalents | 12,957,679 | 27,323,021 | 608,464 | |||||||||
| Total assets | 40,269,163 | 53,737,682 | 7,211,951 | |||||||||
| Non-current liabilities | 1,197,521 | 1,514,781 | 544,199 | |||||||||
| Total liabilities | 17,998,829 | 16,724,104 | 3,965,018 | |||||||||
| Share capital | 11,260,415 | 6,762,097 | 68,871 | |||||||||
| Total shareholders' equity | 22,270,334 | 37,013,578 | 3,246,933 | |||||||||
The Company’s business model has evolved from a professional IT services and international programming provider to fiscal 2007, where it began to pursue the objective of being an end-to-end provider of IPTV services. Fiscal 2007 revenue increased to $7.8 million, which included $1.3 million in services revenue and $6.5 million in equipment revenue. Fiscal 2007 included the sale of $6.4 million in equipment revenue to two customers as these customers launched their IPTV strategies. These two customers accounted for 85% of total revenue. Cost of sales increased by $5.0 million, primarily for cost of equipment revenue, which is a lower margin component of the Company’s business. The increase in loss was due to expanding operations and continued investment in research and development. Losses were funded by our CEO.
Fiscal 2008 included the acquisition of the Acquired Business, described above. In fiscal 2008 revenue increased to $13.4 million, which included $9.5 million in services revenue and $3.9 million in equipment revenue. Of the $13.4 million, the Merger described above contributed $3.3 million in revenue. The balance of the revenue growth (“organic growth”) was growth in services revenue, offset by a decline in equipment revenue. Services revenue is primarily recurring revenue; subscriber growth provides a baseline of revenue that continues to grow month over month, albeit with some seasonality impact depending on the sports season. The continuous trend over the past three years has been increasing services revenue from operating as an end-to-end IPTV service provider. 60; In fiscal 2008 costs continued to scale with the growth in the existing business, and then were accelerated through the Merger (for example, the Company experienced increased wages due to the increased headcount and increased travel expenses due to having multiple offices). Net loss increased to $11.6 million due to growth in operations, the additional operating costs acquired in the Merger, and costs related to non-cash stock-based compensation. Losses prior to the Merger were funded by a capital contribution in 2008 of $2.6 million by our CEO. Included in the Merger was cash from the Acquired Business of $22.9 million, which increased the Company’s cash balance to $27.3 million at December 31, 2008.
K-13
In fiscal 2009 revenue increased to $28.1 million, which included $26.5 million in services revenue and $1.6 million in equipment revenue. Of the total revenue growth of $14.7 million, the Acquired Business contributed $10.8 million in revenue, while INSINC contributed $0.6 million in revenue. The balance of the organic growth occurred in services revenue, offset by a decline in equipment revenue. Net loss increased from $11.6 million in 2008 to $19.4 million in 2009, primarily due to the inclusion of the Acquired Business for 12 months in 2009 as opposed to 2 months in 2008. The Company is currently reviewing its operating structure to maximize revenue opportunities, further reduce costs and achieve profitability.
K-14
RESULTS OF OPERATIONS
Comparison of Fiscal Year Ended December 31, 2009 to Fiscal Year Ended December 31, 2008
Our consolidated financial statements for our fiscal years ended December 31, 2009 and 2008 have been prepared in accordance with U.S. GAAP. Included in note 17 of the financial statements is the reconciliation between our consolidated financial statements prepared in accordance with U.S. GAAP and Canadian GAAP.
| 2009 | 2008 | Change | ||||||||||
| $ | $ | % | ||||||||||
| Revenue | ||||||||||||
| Services revenue | 26,464,400 | 9,542,689 | 177 | % | ||||||||
| Equipment revenue | 1,629,277 | 3,900,650 | -58 | % | ||||||||
| Total Revenue | 28,093,677 | 13,443,339 | 109 | % | ||||||||
| Costs and expenses | ||||||||||||
| Cost of services revenue, exclusive of depreciation | ||||||||||||
| and amortization shown separately below | 12,850,002 | 4,519,062 | 184 | % | ||||||||
| Cost of equipment revenue | 1,537,150 | 3,120,087 | -51 | % | ||||||||
| Selling, general and administrative, including | ||||||||||||
| stock-based compensation | 28,767,049 | 14,221,347 | 102 | % | ||||||||
| Depreciation and amortization | 4,141,117 | 1,572,492 | 163 | % | ||||||||
| Impairment of long-lived assets | - | 1,036,993 | - | |||||||||
| 47,295,318 | 24,469,981 | 93 | % | |||||||||
| Operating loss | (19,201,641 | ) | (11,026,642 | ) | 74 | % | ||||||
| Other income (expense) | ||||||||||||
| Unrealized loss on derivative | (801,350 | ) | - | - | ||||||||
| Gain on foreign exchange | 68,245 | 265,720 | -74 | % | ||||||||
| Investment income | 293,825 | 130,048 | 126 | % | ||||||||
| Equity in loss of affiliate | - | (1,006,386 | ) | - | ||||||||
| (439,280 | ) | (610,618 | ) | -28 | % | |||||||
| Net and comprehensive loss for the year | (19,640,921 | ) | (11,637,260 | ) | 69 | % | ||||||
Revenue
Services revenue
Services revenue includes revenue from subscribers, eCommerce and technology services. Services revenue increased from $9.5 million for the year ended December 31, 2008 to $26.5 million for the year ended December 31, 2009. The increase was due to the organic growth in services revenue, the effect of the Merger on October 20, 2008 and the acquisition of INSINC effective October 31, 2009. The organic growth in our services revenue was $5.6 million. The growth in the Acquired Business comprised $10.8 million, and INSINC comprised $0.6 million, of total services revenue.
Subscriber revenue increased from $7.0 million for the year ended December 31, 2008 to $18.5 million for the year ended December 31, 2009. The increase was due to the growth in subscribers, the effect of the Merger on October 20, 2008 and the acquisition of INSINC effective October 31, 2009. The organic growth in our subscriber revenue was $4.5 million resulting from $4.0 million in revenue growth from our existing customers coupled with $0.5 million in revenue generated from 15 new customers. The growth in the Acquired Business was $6.7 million and INSINC comprised $0.3 mi llion of total subscriber revenue for the year.
K-15
eCommerce revenue increased from $0.9 million for the year ended December 31, 2008 to $3.9 million for the year ended December 31, 2009. The Acquired Business comprised all of eCommerce revenue for the year.
Technology services revenue increased from $1.6 million for the year ended December 31, 2008 to $4.1 million for the year ended December 31, 2009. The increase was due to organic growth in technology services revenue, the effect of the Merger on October 20, 2008, and the October 31, 2009 effective date of the acquisition of INSINC. As new customers begin streaming video or develop their user interface, we earn technology services revenue. This revenue is recognized over the life of the contractual relationship. The organic growth in our technology services revenue was $1.0 million. The growth in the Acquired Business was $1.2 million. INSINC comprised $0.3 million of total technology services revenue for the year.
Equipment revenue
Equipment revenue decreased from $3.9 million for the year ended December 31, 2008 to $1.6 million for the year ended December 31, 2009. The decrease in equipment revenue is a result of the uneven nature of the revenue stream; customers often place large single orders to meet minimum order requirements to manage the lead time between ordering and shipping and to minimize the related shipping costs. The lead time on new orders is approximately 12 weeks from order to receipt. The timing of specific orders is not consistent period over period. We sell our STBs to customers, who in turn sell or give them to new users, and we sell directly to users. The demand for S TBs is driven by new subscribers and the level of inventory carried by our customers. Our customers do not have the right of return on purchased STBs. Initial orders by new customers and new users will impact the trend of STB revenues. The Company expects STB revenue to have a much slower growth rate than services revenue. Services revenue is recurring revenue whereas STB revenue is earned on new customers and/or new subscribers.
Costs and Expenses
Cost of services revenue
Cost of services revenue increased from $4.5 million, or 47%, of services revenue for the year ended December 31, 2008 to $12.8 million or 49% of services revenue for the year ended December 31, 2009. This increase was due to the costs associated with increased revenue, the effect of the Merger on October 20, 2008 and the acquisition of INSINC effective October 31, 2009. Cost of services revenue for the Acquired Business increased by $5.9 million. INSINC comprised $0.3 million of total costs of services revenue for the year.
Organic cost of services revenue increased from $2.5 million or 39.7% of services revenue for the year ended December 31, 2008 to $4.6 million or 39.0% of services revenue for the year ended December 31, 2009. The $2.1 million increase was a result of additional costs relating to co-location and network fees in support of increased revenue. The 0.7% improvement (as a percentage of services revenue) primarily relates to negotiated lower rates on bandwidth costs.
Cost of equipment revenue
Cost of equipment revenue decreased from $3.1 million for the year ended December 31, 2008 to $1.5 million for the year ended December 31, 2009 on lower revenue. Cost of equipment revenue is directly variable with changes in equipment revenue. Cost of equipment revenue as a percentage of equipment revenue increased from 80% for the year ended December 31, 2008 to 94% for the year ended December 31, 2009 due to increased shipping costs related to TV-Desi and Talfazat rental STBs that generate no equipment revenue.
K-16
Selling, general and administrative, including stock-based compensation
Selling, general and administrative, including stock-based compensation, increased from $14.2 million for the year ended December 31, 2008 to $28.8 million for the year ended December 31, 2009. The Acquired Business accounted for $9.1 million of the total increase, INSINC accounted for $0.3 million and the remaining increase of $5.2 million relates to the organic increase. The individual variances are due to the following:
| · | Wages and benefits increased from $8.8 million for the year ended December 31, 2008 to $20.0 million for the year ended December 31, 2009. The Acquired Business accounted for $6.5 million of the total increase of $11.2 million in wages and benefits for the year. The organic increase of $4.5 million was primarily related to the increase in employees to support the increased revenue and the Merger with the Acquired Business. In conjunction with the Merger, the Company added senior management and provided market level compensation for the CEO. INSINC comprised $0.2 million of total wages and benefits for the year. |
| · | Stock-based compensation expense decreased from $1.8 million for the year ended December 31, 2008 to $1.2 million for the year ended December 31, 2009. This decrease was the result of 5 million fully vested warrants being issued in the prior year. |
| · | Marketing expenses increased from a $0.4 million for the year ended December 31, 2008 to $1.1 million for the year ended December 31, 2009. The Acquired Business accounted for $0.5 million of the total increase of $0.7 million in marketing expenses for the year. The Acquired Business is more of a business-to-consumer focused business and incurs higher marketing expenses including search engine marketing and search engine optimization on the Internet. |
| · | Professional fees increased from $1.2 million for the year ended December 31, 2008 to $1.7 million for the year ended December 31, 2009. The increase was primarily related to professional fees incurred in connection with the acquisition of INSINC. |
| · | Other SG&A expenses increased from $2.0 million for the year ended December 31, 2008 to $4.8 million for the year ended December 31, 2009. The Acquired Business accounted for $2.3 million of the total increase of $2.8 million for the year. The organic increase of $0.5 million was primarily related to increases in bank and processing fees and corporate systems costs of $0.4 million. |
Equity in loss of affiliate
Equity in loss of our affiliate, KyLinTV, decreased from $1.0 million for the year ended December 31, 2008 to zero for the year ended December 31, 2009. The decrease is as a result of the cumulative losses exceeding the full value of the Company’s investment in 2008. Due to KyLinTV’s accumulated losses, the investment had been reduced to zero at December 31, 2008. The Company still owns its equity position in the affiliate; however, the Company is not required to fund any additional losses, and as such no further charges will be incurred.
Depreciation and amortization
Depreciation and amortization increased from $1.5 million for the year ended December 31, 2008 to $4.1 million for the year ended December 31, 2009. The increase was due to amortization on assets acquired in the Merger ($1.9 million) and amortization of the intangible assets acquired in the acquisition of INSINC.
Unrealized loss on derivative
Unrealized loss on derivative increased from zero for the year ended December 31, 2008 to $0.8 million for the year ended December 31, 2009. The increase was due to the adoption of ASC 815-40, effective January 1, 2009, which required the Company to record at fair value all convertible securities denominated in a currency other than the Company’s functional currency. On January 1, 2009, the grant date fair value of warrants denominated in Canadian dollars of $2.5 million was reallocated from additional paid-in capital and a derivative liability was recorded in the amount of $0.6 million with an adjustment to opening accumulated deficit of $1.9 million. The difference between the fair value at J anuary 1, 2009 of $0.6 million and the fair value at December 31, 2009 of $1.4 million resulted in an unrealized loss on derivative of $0.8 million.
K-17
These warrants have been recorded at their relative fair values at issuance, determined using the Black-Scholes-Merton model, and will continue to be recorded at fair value at each subsequent balance sheet date. Any change in value between reporting periods will be recorded as other income (expense). These warrants will continue to be reported as a liability until such time as they are exercised or expire.
Impairment of long-lived assets
Long-lived assets must be tested for recoverability whenever events or changes in circumstances indicate that their carrying amount may not be recoverable. For the Company, long-lived assets include intangible and capital assets. Ongoing negative developments in the general economic climate would be considered an event that would be a possible indicator of impairment. An impairment loss is recognized as the difference between fair value and carrying amount when the carrying amount of a long-lived asset is not recoverable and exceeds its fair value. The fair value of the intangible assets acquired in the Merger was determined on October 20, 2008; therefore, management believed the fair v alue of the assets acquired in the Merger is consistent with the carrying amount at December 31, 2008. The Company tested the fair value of the non-Merger long-lived assets as at December 31, 2008 and determined that the carrying value of such capital assets exceeded their fair value by $1.0 million. Accordingly, the Company recorded a non-cash impairment charge of $1.0 million during 2008. No such charges were recorded in 2009.
SELECTED UNAUDITED QUARTERLY FINANCIAL INFORMATION
AND REVIEW OF FOURTH QUARTER PERFORMANCE
The following tables set out selected consolidated unaudited financial information for each of the last eight quarters with the last one being the most recent quarter ended December 31, 2009. In the opinion of management, this information has been prepared on the same basis as the audited consolidated financial statements as filed on www.sedar.com and www.sec.gov, and all necessary adjustments, consisting only of normal recurring adjustments, have been included in the amounts stated below to present fairly the unaudited quarterly results when read in conjunction with the audited consolidated financial statements and the notes to those statements. The ope rating results for any quarter should not be relied upon as any indication of any future period.
Included in Note 17 of the financial statements is the reconciliation between our consolidated financial statements prepared in accordance with U.S. GAAP and Canadian GAAP.
| 2009 | 2008 | |||||||
| Q4 | Q3 | Q2 | Q1 | Q4 | Q3 | Q2 | Q1 | |
| $ | $ | $ | $ | $ | $ | $ | $ | |
| Income Statement Data: | ||||||||
| Revenue | 8,995,911 | 6,061,302 | 6,462,438 | 6,574,026 | 5,807,550 | 2,699,041 | 2,987,128 | 1,949,620 |
| Cost of revenue | 4,024,35 | 3,224,838 | 3,293,481 | 3,844,483 | 3,205,272 | 1,534,807 | 1,753,689 | 1,145,381 |
| Net loss for the period | (1,454,962) | (7,463,951) | (4,928,130) | (5,793,878) | (7,223,468) | (1,377,667) | (1,549,979) | (1,486,146) |
| Basic and diluted loss per share | (0.01) | (0.07) | (0.04) | (0.05) | (0.13) | (0.03) | (0.04) | (0.03) |
K-18
Comparison of Three Months Ended December 31, 2009 to Three Months Ended December 31, 2008
Revenue
Services revenue
Services revenue includes revenue from subscribers, eCommerce and technology services. Services revenue increased from $5.6 million for the three months ended December 31, 2008 to $8.7 million for the three months ended December 31, 2009. The increase is a combination of the organic growth in services revenue and the effect of the Merger on October 20, 2008. The organic growth in our services revenue was $1.5 million. The growth in the Acquired Business was $1.0 million. INSINC comprised $0.6 million of total services revenue for the period.
Subscriber revenue increased from $4.0 million for the three months ended December 31, 2008 to $6.0 million for the three months ended December 31, 2009. The increase is a combination of the growth in subscribers, the effect of the Merger on October 20, 2008 and the acquisition of INSINC effective October 31, 2009. The organic growth in our subscriber revenue was $1.4 million resulting from $1.2 in revenue from existing customers and $0.2 million in revenue generated from 14 new customers. The growth in the Acquired Business was $0.3 million. INSINC comprised $0.3 million of total subscriber revenue for the period.
eCommerce revenue increased from $0.8 million for the three months ended December 31, 2008 to $1.4 million for the three months ended December 31, 2009. The Acquired Business comprised all of eCommerce revenue for the period.
Technology services revenue increased from $0.8 million for the three months ended December 31, 2008 to $1.3 million for the three months ended December 31, 2009. The increase is a combination of the organic growth in technology services revenue, the effect of the Merger on October 20, 2008 and the effect of the acquisition of INSINC effective October 31, 2009. As new customers begin streaming video or develop their user interface, we earn technology services revenue. This revenue is recognized over the life of the contractual relationship. The organic growth in our technology services revenue was $0.1 million. The growth in the Acquired Business was $0.1 million. INSINC comprised $0.3 million of total technology services revenue for the period.
Equipment revenue
Equipment revenue increased from $0.2 million for the three months ended December 31, 2008 to $0.3 million for the three months ended December 31, 2009. The increase in equipment revenue is a result of the uneven nature of the revenue stream.
Costs and Expenses
Cost of services revenue
Cost of services revenue increased from $3.0 million or 54% of services revenue for the three months ended December 31, 2008 to $3.7 million or 43% of services revenue for the three months ended December 31, 2009. This increase was a combination of the costs associated with increased revenue and the acquisition of INSINC effective October 31, 2009. INSINC comprised $0.3 million of the total cost of services revenue for the period.
Organic cost of services revenue increased from $1.0 million or 42% for the three months ended December 31, 2008 to $1.4 million or 36% for the three months ended December 31, 2009. The $0.4 million increase was a result of additional costs relating to colocation and network fees in support of increased revenue. The 6% improvement (as a percentage of services revenue) primarily relates to negotiated lower rates on bandwidth costs.
Cost of equipment revenue
Cost of equipment revenue increased from $0.2 million for the three months ended December 31, 2008 to $0.3 million for the three months ended December 31, 2009 on increased revenue. Cost of equipment revenue is directly variable with changes in equipment revenue.
K-19
Selling, general and administrative, including stock-based compensation
Selling, general and administrative, including stock-based compensation, decreased from $8.3 million for the three months ended December 31, 2008 to $7.6 million for the three months ended December 31, 2009. The individual variances are due to the following:
| · | Wages and benefits increased from $4.3 million for the three months ended December 31, 2008 to $5.3 million for the three months ended December 31, 2009. The organic increase of $0.8 million was primarily related to the increase in employees to support the increased revenue and the Merger with the Acquired Business. In conjunction with the Merger, the Company added senior management and provided market level compensation for the CEO. INSINC comprised $0. 2 million of total wages and benefits for the period. |
| · | Stock-based compensation expense decreased from $1.8 million for the three months ended December 31, 2008 to $0.2 million for the three months ended December 31, 2009. This decrease was the result of 5 million fully vested warrants being issued in the prior period. |
| · | Marketing expenses were $0.3 million for the three months ended December 31, 2008 and 2009. |
| · | Professional fees decreased from $0.6 million for the three months ended December 31, 2008 to $0.5 million for the three months ended December 31, 2009. |
| · | Other SG&A expenses were $1.3 million for the three months ended December 31, 2008 and 2009. |
Depreciation and amortization
Depreciation and amortization increased from $0.9 million for the three months ended December 31, 2008 to $1.1 million for the three months ended December 31, 2009. The increase was due to amortization of the intangible assets acquired in the acquisition of INSINC.
Unrealized gain on derivative
Unrealized gain on derivative increased from zero for the three months ended December 31, 2008 to $2.2 million for the three months ended December 31, 2009. The increase was due to the adoption of ASC 815-40. The difference between the fair value at September 30, 2009 of $3.6 million and the fair value at December 31, 2009 of $1.4 million resulted in an unrealized gain on derivative of $2.2 million.
Impairment of long-lived assets
As described above, the Company recorded a non-cash long-lived asset impairment charge of $1.0 million during the three months ended December 31, 2008. There were no such comparable amounts recorded in the current period.
K-20
LIQUIDITY AND CAPITAL RESOURCES
During the year ended December 31, 2009, the Company’s cash position decreased by $14.4 million. The Company used $11.7 million to fund operations, which included working capital changes of $1.8 million, $1.2 million to purchase fixed assets and $1.6 million to acquire INSINC.
As of December 31, 2009, our principal sources of liquidity included cash and cash equivalents of $13.0 million and trade accounts receivable of $1.8 million. We do not have a credit facility.
At December 31, 2009, approximately 79% of our cash and cash equivalents were held in interest bearing bank accounts with a U.S. bank that received an A- rating by Standard and Poors and an A2 rating by Moody’s and 7% of our cash and cash equivalents were held in bank accounts with two of the top five Canadian commercial banks. The Company believes that these U.S. and Canadian financial institutions are secure notwithstanding the current global economy and that we will be able to access the remaining balance of bank deposits as these deposits are with large reputable banks. Our investment policy is to invest in low-risk short-term investments which are primarily term deposits. We have not had a history of any defaults on these term deposits, nor do we expect any in the future given the short term to maturity of these investments.
The Company’s business is still in the early stages, with only a few years of operating history. From the Company’s inception, it has incurred substantial net losses and has an accumulated deficit of $43.8 million; management expects these losses to continue in the short term. The Company continues to review its operating structure to maximize revenue opportunity, further reduce costs and achieve profitability. Based on our current business plan and internal forecasts, and considering the risks that are present in the current global economy, we believe that our cash on hand will be sufficient to meet our working capital and operating cash requirements for the next twelve months, which will include expenditures of significant funds for ma rketing, building its subscriber management systems, programming and website development, maintaining adequate video streaming and database software, pursuing and maintaining channel distribution agreements with its channel partners, fees relating to acquiring and maintaining Internet streaming rights to its content and the construction and maintenance of the Company’s delivery infrastructure and office facilities. Cash from operations could be affected by various risks and uncertainties, including, but not limited to, the risks detailed herein or incorporated by reference in our 10-K in the section titled “Risk Factors.” If our actual cash needs are greater than forecasted and if cash on hand is insufficient to meet our working capital and cash requirements for the next twelve months, we will require outside capital in addition to cash flow from operations in order to fund our business. Our short operating history, our current lack of profitability and the prolo nged upheaval in the capital markets could each or all be factors that might negatively impact our ability to obtain outside capital on reasonable terms, or at all. If we were ever unable to obtain needed capital, we would reevaluate and reprioritize our planned capital expenditures and operating activities. We cannot assure you, however, that we will ultimately be able to generate sufficient revenue or reduce our costs in the anticipated time frame to become profitable and have sustainable cash flows.
Working Capital Requirements
The net working capital at December 31, 2009 was $1.3 million, a decrease of $16.8 million from the December 31, 2008 net working capital of $18.1 million. The decreased working capital is primarily due to funding operations of $11.7 million and the fair value of the derivative liability of $1.4 million on December 31, 2009 (which is a non-cash liability).
Current assets at December 31, 2009 were $17.8 million, a decrease of $15.5 million from the December 31, 2008 balance of $33.3 million. The change is primarily due to a decrease in our cash and cash equivalents of $14.4 million.
Current liabilities at December 31, 2009 were $16.8 million, an increase of $1.6 million from the December 31, 2008 balance of $15.2 million. The change is primarily due to the fair value of the derivative liability of $1.4 million (which is a non-cash liability).
K-21
Cash Flows
Summary Balance Sheet Data:
| December 31, | |||||||
| 2009 | 2008 | ||||||
| $ | $ | ||||||
| Current Assets | |||||||
| Cash and cash equivalents | 12,957,679 | 27,323,021 | |||||
| Accounts receivable, net | 1,809,147 | 2,284,242 | |||||
| Taxes receivable | 35,334 | 983,253 | |||||
| Other receivables | 821,834 | 227,711 | |||||
| Inventory | 928,592 | 347,600 | |||||
| Prepaid expenses and deposits | 966,101 | 1,830,260 | |||||
| Due from related parties | 246,992 | 324,059 | |||||
| Total current assets | 17,765,679 | 33,320,146 | |||||
| Current Liabilities | |||||||
| Accounts payable | 5,383,518 | 4,465,388 | |||||
| Accrued liabilities | 5,822,385 | 7,595,116 | |||||
| Derivative liability | 1,389,300 | - | |||||
| Due to related parties | 298,595 | 56,826 | |||||
| Deferred revenue | 3,907,510 | 3,091,993 | |||||
| Total current liabilities | 16,801,308 | 15,209,323 | |||||
| Working capital ratio | 1.06 | 2.19 | |||||
Comparative Summarized Cash Flows
| Year Ended | ||||||||
| December 31, | ||||||||
| 2009 | 2008 | |||||||
| $ | $ | |||||||
| Cash used in operating activities | (11,692,709 | ) | (5,614,501 | ) | ||||
| Cash (used in) provided by investing activities | (2,760,337 | ) | 20,294,983 | |||||
| Cash provided by financing activities | 87,704 | 12,034,075 | ||||||
Operating activities
Cash used in operating activities for the year ended December 31, 2009 was $11.7 million. Changes in net cash used in operating activities reflect the net loss of $19.6 million for the year, less:
| · | non-cash items in the amount of $6.1 million, which relates to stock-based compensation, depreciation and amortization and unrealized loss on derivative; and |
| · | changes in operating assets and liabilities of $1.8 million. |
K-22
Investing activities
Cash used in investing activities for the year ended December 31, 2009 was $2.8 million. These funds were used to acquire INSINC ($1.6 million) and to purchase fixed assets ($1.2 million).
Financing activities
Cash provided by financing activities was $0.1 million for the year ended December 31, 2009. The funds were received from stock option and retention warrant exercises.
Off-Balance Sheet Arrangements
The Company did not have any off-balance sheet arrangements as of December 31, 2009.
Contractual Obligations and Commitments
The following table summarizes the Company’s contractual commitments as at December 31, 2009, and the effect those commitments are expected to have on liquidity and cash flow in future periods:
| Total | 2010 | 2011 | 2012 | 2013 | 2014 | Thereafter | |
| $ | $ | $ | $ | $ | $ | $ | |
| Operating leases | 8,004,585 | 1,702,605 | 1,190,740 | 1,151,882 | 1,128,252 | 790,076 | 2,041,030 |
| Operating lease recovery (1) | (5,243,520) | (667,177) | (667,177) | (682,518) | (703,996) | (703,996) | (1,818,656) |
| Minimum guarantees (2) | 4,042,389 | 1,911,913 | 910,476 | 835,000 | 385,000 | 0 | 0 |
| Capital lease obligations | 125,989 | 116,408 | 9,581 | 0 | 0 | 0 | 0 |
| Long-term liabilties | 244,739 | 122,194 | 63,292 | 0 | 0 | 0 | 59,253 |
| 7,174,182 | 3,185,943 | 1,506,912 | 1,304,364 | 809,256 | 86,080 | 281,627 | |
| (1) The Company has signed a sublease for its Toronto office which offsets the operating lease commitment. | |||||||
| (2) Minimum guarantees of payments to content providers for licensing of content and/or minimum performance payments. | |||||||
Financial Instruments
The Company's financial instruments are comprised of cash and cash equivalents, accounts receivable, other receivables, taxes receivable, deposits, accounts payable, accrued liabilities, amounts due to/from related parties, and deferred revenue.
Fair value of financial instruments
Fair value of a financial instrument is defined as the amount for which the instrument could be exchanged in a current transaction between willing parties. The estimated fair value of our financial instruments approximates their carrying value due to the short maturity term of these financial instruments.
Risks associated with financial instruments
[i] Foreign exchange risk
The Company is exposed to foreign exchange risk as a result of transactions in currencies other than its functional currency of the United States dollar. The majority of the Company’s revenues are transacted in U.S. dollars, whereas a portion of its expenses are transacted in U.S. or Canadian dollars. The Company does not use derivative instruments to hedge against foreign exchange risk.
K-23
[ii] Interest rate risk
The Company is exposed to interest rate risk on its invested cash and cash equivalents and its short-term investments. The interest rates on these instruments are based on the bank's rate and therefore are subject to change with the market. The Company does not use derivative financial instruments to reduce its interest rate risk.
[iii] Credit risk
The Company sells its services to a variety of customers under various payment terms and therefore is exposed to credit risk. The Company has adopted policies and procedures designed to limit this risk. The maximum exposure to credit risk at the reporting date is the carrying value of receivables. The Company establishes an allowance for doubtful accounts that represents its estimate of incurred losses in respect of accounts receivable.
RELATED PARTY TRANSACTIONS
The Company has entered into certain transactions and agreements in the normal course of operations with related parties. Significant related party transactions are as follows:
TransVideo
TransVideo is a company that is controlled by the Chairman of the Board of Directors of the Company that designs and sells equipment and technology for IPTV content delivery. STB purchases amounted to $1,029,136 and $2,745,000 and transcoder licensing fees amounted to $8,000 and $125,000 for the years ended December 31, 2009 and 2008, respectively. Included in cost of equipment revenue is the cost of STBs sold of $937,204 and $2,816,490 for the years ended December 31, 2009 and 2008, respectively.
KyLinTV
KyLinTV is an IPTV company that is controlled by the Chairman of the Board of Directors of the Company. On June 1, 2008, the Company entered into an agreement with KyLinTV to build and deliver the setup and back office operation of an IPTV service. The Company also provides and charges KyLinTV for administrative and general corporate support. For each of the periods presented, the amounts received for these services provided by the Company for the years ended December 31, 2009 and 2008 were $645,722 and $1,233,353, respectively. During the year ended December 31, 2008, the Company purchased computer equipment from KyLinT V in the amount of $620,000.
New York Islanders Hockey Club, L.P. (“New York Islanders”)
The Company provides IT-related professional services to the New York Islanders, a professional hockey club that is owned by the Chairman of the Board of Directors of the Company.
Renaissance Property Associates, LLC (“Renaissance”)
Renaissance is a real estate management company owned by the Chairman of the Board of Directors of the Company. In June 2009, the Company signed a sublease agreement with Renaissance for office space in Plainview, New York. Rent expense paid by the Company to Renaissance of $388,975 and zero, inclusive of taxes and utilities, is included in selling, general and administrative expense for the years ended December 31, 2009 and 2008, respectively.
Patstar, Inc. (“Patstar”)
Patstar, an investment holding company, is controlled by the Vice Chairman of the Board of Directors of the Company. Rent expense paid to the Company by Patstar of $3,649 and $2,596 is included as a recovery in selling, general and administrative expense for the years ended December 31, 2009 and 2008, respectively.
K-24
Hawaii IPTV, LLC (“Hawaii”)
The Company had an IPTV customer, Hawaii, an IPTV company, whose principals are family members of the Chairman of the Board of Directors of the Company. Hawaii ceased operations during the third quarter of 2009.
The Smile Train, Inc. (“Smile Train”)
The Company provides IT-related professional services to Smile Train, a public charity whose founder and significant benefactor is the Chairman of the Board of Directors of the Company.
The Company recognized revenue from related parties for the years ended December 31 as follows:
| December 31, | December 31, | |||
| 2009 | 2008 | |||
| $ | $ | |||
New York Islanders | 395,681 | 296,451 | ||
Renaissance | 140,580 | 120,000 | ||
Smile Train | 108,000 | 120,000 | ||
Hawaii | 41,789 | 57,577 | ||
KyLinTV | 1,755,985 | 920,550 | ||
| 2,442,035 | 1,514,578 |
As at December 31, 2009 and 2008, the amounts due from (to) related parties are as follows:
| December 31, | December 31, | |||
| 2009 | 2008 | |||
$ | $ | |||
New York Islanders | (304 | ) | 29,189 | |
Renaissance | — | (1,146 | ) | |
Smile Train | — | 27,000 | ||
Hawaii | — | 17,527 | ||
TransVideo | (298,291 | ) | (55,680 | ) |
KyLinTV | 246,992 | 250,343 | ||
| (51,603 | ) | 267,233 |
Investment in Affiliate – KyLinTV
The Company records its investment in KyLinTV using the equity method.
From January 1, 2008 through December 31, 2009, the Company's equity interest in the affiliate was 17.1%. As previously discussed, the Company also provides and charges KyLinTV for administrative and general corporate support. Management has determined that as a result of the 17.1% equity interest combined with the services that the Company provides KyLinTV, the Company continues to have significant influence on the operating activities of KyLinTV; therefore, the Company continues to account for its investment in KyLinTV using the equity method of accounting for investment.
The Company’s proportionate share of the equity loss from KyLinTV has been accounted for as a charge on the Company's consolidated statements of operations and comprehensive loss. Due to KyLinTV’s accumulated losses, the investment had been reduced to zero as at December 31, 2008. No further charges will be recorded as the Company has no obligation to fund the losses of KyLinTV.
K-25
The results of operations and financial position of the Company's equity basis investment in KyLinTV are summarized below for the years ended December 31:
| Year ended, | Year ended, | |||
| December 31, | December 31, | |||
| 2009 | 2008 | |||
| $ | $ | |||
Condensed income statement information: | ||||
Net sales | 8,127,760 | 6,568,101 | ||
Net loss | (5,604,118 | ) | (8,148,974 | ) |
| December 31, | December 31, | |||
| 2009 | 2008 | |||
$ | $ | |||
Condensed balance sheet information: | ||||
Current assets | 1,924,891 | 927,427 | ||
Non-current assets | 913,977 | 2,411,319 | ||
Total assets | 2,838,868 | 3,338,746 | ||
Current liabilities | 15,168,149 | 10,063,909 | ||
Non-current liabilities | — | — | ||
Equity (deficiency) | (12,329,281 | ) | (6,725,163 | ) |
Total liabilities and equity | 2,838,868 | 3,338,746 | ||
On February 26, 2010, a group of investors invested $10.0 million in KyLinTV for 15.1% of its equity, which reduced the Company’s equity interest in KyLinTV to 12.2%. Of the total $10.0 million investment, $1.0 million was invested by AvantaLion LLC, a company controlled by the Chairman of the Board of Directors of the Company.
CRITICAL ACCOUNTING ESTIMATES
The discussion and analysis of our financial condition and results of operations are based upon our consolidated financial statements, which have been prepared in accordance with accounting principles generally accepted in the United States consistently applied throughout all periods. The preparation of these financial statements requires us to make estimates and judgments that affect the reported amounts of assets, liabilities, revenues and expenses and related disclosure of contingent assets and liabilities. On an ongoing basis, we evaluate our estimates, including those related to inventory allowances, bad debts, long-lived assets, goodwill, income taxes, contingencies and litigation, the determination of the useful lives of long-lived assets, allocation of the purchase price for acquisitions and the assumptions used in determining the fair value of stock options and warrants. We base our estimates on historical experience and on various other assumptions that are believed to be reasonable under the circumstances, the results of which form the basis for making judgments about the carrying values of assets and liabilities that are not readily apparent from other sources. Actual results may differ from these estimates under different assumptions or conditions.
We believe the following critical accounting policies affect our more significant judgments and estimates used in the preparation of our consolidated financial statements:
Business Combinations
We allocate the purchase price to tangible assets, intangible assets, and liabilities based on fair values, with the excess of purchase price being allocated to goodwill.
In 2009, our acquisition of INSINC resulted in the allocation of a portion of the purchase price to acquired intangible assets. In order to determine the fair value of these intangible assets, we make estimates and judgments based on assumptions about the future expected cash flows. We also make estimates about the useful life of those acquired intangible assets. Should different conditions prevail, we could record write-downs of intangible assets or changes in the estimate of useful life of those intangible assets, which would result in changes to amortization expense.
K-26
Acquired definite lived intangible assets are initially recorded at fair value based on the present value of the estimated cash flows of the assets acquired and are amortized over the future income producing period, which we consider to be the useful life, on a straight-line basis, which approximates the pattern in which we expect to generate economic benefits from the asset.
Goodwill
Goodwill is subject to an annual impairment test or on a more frequent basis if necessary. Goodwill is tested for impairment at the beginning of the fourth quarter of each fiscal year. We also test for impairment more frequently if events or circumstances warrant. The Company as a whole is considered one reporting unit. If we determine that our carrying value exceeds our fair value, we compare the implied fair value of the goodwill (determined as the excess fair value over the fair value assigned to our other assets and liabilities) to the carrying amount of goodwill. If the carrying value of goodwill were to exceed the implied fair value of goodwill, an impairment loss would be recognized.
At October 1, 2009, we determined that there had been no impairment of goodwill. At December 31, 2009 we determined that no event existed between October 1, 2009 and December 31, 2009 such that goodwill needed to be tested further.
Long-Lived Assets
We amortize our long-lived assets over the estimated useful life of the asset. We evaluate all of our long-lived assets, excluding goodwill, periodically for impairment when events or changes in facts and circumstances indicate that their carrying value may not be recoverable. Events or changes in facts and circumstances can include a significant adverse change in the business climate, strategic change in business direction, decline or discontinuance of a product line or service, a reduction in our customer base or a restructuring. If one of these events or circumstances indicates that the carrying value of an asset may not be recoverable, or that our estimated amortization period was not appropriate, we would record an impairment charge against our long lived assets. The amount of impairment would be measured as the difference between the carrying value and the fair value of the impaired asset as calculated using a net realizable value methodology. An impairment charge would be recorded as an operating expense in the period of the impairment and as a reduction in the carrying value of that asset.
At December 31, 2009, we determined that no events or changes in facts existed such that a further analysis for impairment was required.
Stock-based Compensation and Other Stock-Based Payments
We estimate the fair value of our options, warrants, restricted share units and stock appreciation rights for financial accounting purposes using the Black-Scholes-Merton model, which requires a number of subjective assumptions, including the expected life of the Convertible Securities, risk-free interest rate, dividend rate, forfeiture rate, future volatility of the price of our Shares and vesting period. The use of subjective assumptions could materially affect the fair value estimate.
For a period of time prior to our initial public offering (“IPO”) in August 2006, there was no active market for our Shares. Since we have been public for less than the vesting period of our Convertible Securities, we do not consider the volatility of our Share price to be representative of the estimated future volatility when computing the fair value of options granted. Accordingly, until such time that a representative volatility can be determined based on our Share price, we will use a blended rate of our own Share price volatility for the period we have been public and the average of three similar companies for the pre-IPO period. We estimate the risk-free interest rate based on the Federal Reserve Rate. Since we do not have a sufficient history relating to options granted and exercised subsequent to our IPO, we base our estimate of the expected life of the Convertible Security using the simplified method based on the period for which our Convertible Securities vest or four years. Our Convertible Securities vest on a monthly basis; therefore we have estimated our forfeiture rate at zero, as actual forfeitures are known and recorded on a timely basis.
K-27
The fair values of the Convertible Securities issued are being recognized as compensation expense over the applicable vesting period, which for the majority of Convertible Securities is four years.
We determine the fair value of our restricted share units based on our Share price on the date the Shares are issued. Restricted share units give the holder the right to Share for each vested restricted share unit. These awards vest on a monthly basis over the vesting period, which is four years. Stock-based compensation expense related to restricted share units is recorded based on the market value of the Shares when the Shares are issued, which generally coincides with the vesting period of these awards.
Stock appreciation rights give the holder the right to elect either to receive cash in an amount equal to the excess of the quoted market price over the stock appreciation right price or to receive Shares equal to the fair value of the Shares less the exercise price divided by the market value of the Shares from treasury or receive Shares by making a cash payment equal to the exercise price. The Board of Directors has discretionary authority to accept or reject a cash payment request in whole or in part. Stock-based compensation expense is calculated as the fair value of all vested stock appreciation rights on each reporting date, and is classified as a current liability on the consolidated balance sheets. If the holder elects to purchase Shares, the liability is credited to additional paid in capital.
Stock-based compensation expense is reported in our Consolidated Statements of Operations and Comprehensive Loss within Selling, General and Administrative Expenses.
Accounts Receivable
Accounts receivable are carried at original invoice amount. The Company maintains a provision for estimated losses resulting from the inability of its customers to make required payments. Management considers the following factors when determining the collectability of specific customer accounts: customer credit-worthiness; past transaction history with the customer; current economic industry trends; and changes in customer payment terms. If the financial conditions of the Company's customers were to deteriorate, adversely affecting their ability to make payments, additional allowances would be required.
Inventory
Inventory consists of STBs and is recorded at the lower of cost and net realizable value and consists of finished goods. Cost is accounted for on a first-in, first-out basis. The Company evaluates its ending inventories for estimated excess quantities and obsolescence. This evaluation includes analyses of sales levels and projections of future demand within specific time horizons. Inventories in excess of future demand are reserved. In addition, the Company assesses the impact of changing technology and market conditions on its inventory-on-hand and writes off inventories that are considered obsolete.
Amortization Policies and Useful Lives
The Company amortizes the cost of property, plant and equipment and intangible assets over the estimated useful service lives of these items. The determinations of estimated useful lives of these long-lived assets involve considerable judgment. In determining these estimates, the Company takes into account industry trends and company specific factors including changing technologies and expectations for the in-service period of these assets. On an annual basis, the Company reassesses its existing estimates of useful lives to ensure they match the anticipated life of the technology from a revenue producing perspective. If technological change happens more quickly than anticipated, the Company might have to shorten its estimate of the useful life of certain equipment which could result in higher amortization expense in future periods or an impairment charge to write down the value of this equipment.
Taxes
We have tax loss carryforwards available to offset future taxable income of $93.4 million as of December 31, 2009 that expire between the tax years 2010 and 2029, and have not been fully audited by relevant authorities. We have not recorded a financial statement benefit for these attributes as we have no history of profitability. To the extent we use tax loss carryforwards subsequent to 2009, we expect to record the benefit as a reduction in income tax expense.
K-28
RECENTLY ISSUED ACCOUNTING PRONOUNCEMENTS
In June 2009, the FASB issued guidance now codified as ASC Topic 105, “Generally Accepted Accounting Principles” (“ASC 105”) as the single source of authoritative non-governmental U.S. GAAP. ASC 105 does not change current U.S. GAAP, but is intended to simplify user access to all authoritative U.S. GAAP by providing all authoritative literature related to a particular topic in one place (the “Codification”). On the effective date of ASC 105, the Codification supers eded all then-existing non-SEC accounting and reporting standards, and all other non-grandfathered non-SEC accounting literature not included in the Codification became non-authoritative. The provisions of ASC 105 are effective for interim and annual periods ending after September 15, 2009. The Company adopted ASC 105 in the third quarter of 2009. This pronouncement had no effect on our consolidated financial position, results of operations or cash flows, but impacted the financial reporting process by replacing all references to pre-Codification standards with references to the applicable Codification topic.
Effective January 1, 2009, the Company adopted ASC Topic 805-10, “Business Combinations” (“ASC 805”). ASC 805 requires the acquiring entity in a business combination to recognize all assets acquired and liabilities assumed in the transaction, establishes the acquisition-date fair value as the measurement objective for all assets acquired and liabilities assumed and requires the acquirer to disclose certain information related to the nature and financial effect of the business combination. ASC 805 also establishes principles and requirements for how an acquirer recognizes any non-controlling interest in the acquiree and the goodwill acquired in a business combination.
In October 2009, the FASB issued ASU 2009-13, “Multiple-Deliverable Revenue Arrangements” (“ASU 2009-13”). ASU 2009-13 amends guidance included within ASC Topic 605-25 to require an entity to use an estimated selling price when vendor-specific objective evidence or acceptable third party evidence does not exist for any products or services included in a multiple element arrangement. The arrangement consideration should be allocated among the products and services based upon their relative selling prices, thus eliminating the use of the residual method of allocation. ASU 2009-13 also requires expanded qualitative and quantitative disclosures regarding significant judgments made and changes in applying this guidance. ASU 2009-13 is effective prospectively for revenue arrangements entered into or materially modified in fiscal years beginning on or after June 15, 2010. Early adoption and retrospective application are also permitted. The Company is currently evaluating the impact of adopting the provisions of ASU 2009-13.
Effective January 1, 2009, the Company adopted ASC Topic 815-40, “Derivatives and Hedging” (“ASC 815-40”). One of the conclusions reached under ASC 815-40 was that an equity-linked financial instrument would not be considered indexed to the entity’s own stock if the strike price is denominated in a currency other than the issuer’s functional currency. The conclusion reached under ASC 815-40 clarified the accounting treatment for these and certain other financial instruments. ASC 815-40 specifies that a contract would not be treated as a derivative if it met the following conditions: 60;(a) indexed to the Company’s own stock; and (b) classified in shareholders’ equity in the Company’s statement of financial position. The Company’s outstanding warrants denominated in Canadian dollars as detailed in note 17 are not considered to be indexed to its own stock because the exercise price is denominated in Canadian dollars and the Company’s functional currency is United States dollars. Therefore, these warrants have been treated as derivative financial instruments and recorded at their fair value as a liability. All other outstanding convertible securities are considered to be indexed to the Company’s stock, because their exercise price is denominated in the same currency as the Company’s functional currency, and are included in shareholders’ equity.
In February 2008, the Canadian Institute of Chartered Accountants (“CICA”) issued new Handbook Section 3064, Goodwill and Intangible Assets, which replaces Section 3062, Goodwill and Other Intangible Assets, and Section 3450, Research and Development Costs. The new standard addresses when an internally developed intangible asset meets the criteria for recognition as an asset. The section also issued amendments to Section 1000, Fin ancial Statement Concepts. These changes were effective for fiscal years beginning on or after October 1, 2008, with earlier adoption permitted, and have been adopted by the Company effective January 1, 2009. The objectives of the changes are to reinforce a principles-based approach to the recognition of costs as assets and to clarify the application of the concept of matching revenues and expenses in Section 1000. Collectively, these changes bring Canadian practice closer to International Financial Reporting Standards (“IFRS”) by eliminating the practice of recognizing as assets a variety of start-up, pre-production and similar costs that do not meet the definition and recognition criteria of an asset. There was no material effect on the Company’s consolidated financial statements as a result of adopting CICA Handbook Section 3064.
K-29
In February 2008, the CICA Accounting Standards Board confirmed that the changeover to IFRS from Canadian GAAP will be required for publicly accountable enterprises, effective for the interim and annual financial statements relating to fiscal years beginning on or after January 1, 2011. The Company became an SEC issuer effective June 8, 2009 and expects to continue to use U.S. GAAP until the date that IFRS is implemented in the United States, which is currently estimated to occur no sooner than 2014.
Effective January 1, 2009 the Company adopted CICA Handbook Section 1582 “Business Combinations” which replaces Section 1581. This standard establishes the principles and requirements of the acquisition method for business combination and related disclosures and applies prospectively to business combinations for which the acquisition date.
Effective January 1, 2009, the Company adopted CICA Handbook Section 1601 “Consolidated Financial Statements” and section 1602 “Non-controlling Interest” which replace Section 1600. Section 1601 establishes standards for the preparation of consolidated financial statements. Section 1602 provides guidance on accounting for a non-controlling interest in a subsidiary in consolidated financial statements subsequent to a business combination. The adoption of Sections 1582, 1601, and 1602 did not materially impact the Company's consolidated financial statements as the provisions of these standards are substantially similar to the Company's accounting in accordance
with U.S. GAAP.
OUTSTANDING SHARE DATA
The Company had total Shares outstanding as at March 10, 2010 of 116,744,404. In addition, as at such date the Company had 28,617,125 outstanding options, SARs, restricted share units, warrants and retention warrants, which are each exchangeable for one Share upon exercise.
DISCLOSURE CONTROLS AND CONTROLS OVER FINANCIAL REPORTING
Evaluation of Disclosure Controls and Procedures:
The Company maintains appropriate disclosure controls and procedures and internal controls over financial reporting (each as defined in National Instrument 52-109, Certification of Disclosure in Issuers' Annual and Interim Filings (“NI 52-109”) of the Canadian Securities Administrators) to ensure that information disclosed externally is complete, reliable and timely. The Company's Chief Executive Officer and Chief Financial Officer evaluated, or caused an evaluation under their direct supervision of, the design and operating effectiveness of the Company's disclosure controls and procedures (“DC&P”) and internal controls over financial reporting (“ICFR”) as at December 31, 2009, and have concl uded that such DC&P and ICFR were appropriately designed and were operating effectively, except as outlined below. See “Limitation on scope of design” below.
K-30
Limitation on Scope of Design:
We have limited the scope of design of our internal controls and procedures and internal controls over financial reporting to exclude controls, policies and procedures of INSINC, which was acquired effective October 31, 2009. The chart below presents the summary financial information of INSINC.
| Balance Sheet Data: | Income Statement Data: | |||
| December 31 | Year ended | |||
| 2009 | 31-Dec-09 | |||
| $ | $ | |||
| Current assets | 503,564 | Total revenue | 575,347 | |
| Long-term assets | 186,133 | Total cost of revenue | 238,309 | |
| Current liabilities | 653,657 | Net income for the year | 57,088 | |
| Long-term liabilities | 120,000 |
The scope limitation is in accordance with section 3.3(1)(b) of NI 52-109 to which this MD&A relates, which allows an issuer to limit its design of DC&P and ICFR to exclude controls, policies and procedures of a business that the issuer acquired not more than 365 days prior to the end of the fiscal period.
Item 7A. Quantitative and Qualitative Disclosures About Market Risk
As a smaller reporting company, we are not required to include this information in our annual report on Form 10-K.
Item 8. Financial Statements and Supplementary Data
Financial statements are attached hereto beginning with page F-1.
Item 9. Changes in and Disagreements With Accountants on Accounting and Financial Disclosure
Ernst & Young LLP (Canada) served as auditors of NeuLion from October 2005 to May 2009. At the Annual and Special Meeting of Shareholders held in May 2009, our shareholders appointed Ernst & Young (US) as our auditors for the fiscal year 2009 and authorized the Board to fix the remuneration of the auditors. No reportable event has occurred in connection with the audits of the Company’s financial statements by Ernst & Young LLP (Canada).
K-31
NeuLion, Inc.
INDEX TO FINANCIAL STATEMENTS
Page | |
| K-33 | |
Financial Statements: | |
| Consolidated Balance Sheets | K-34 |
| K-35 | |
| K-36 | |
| K-37 | |
| K-38 |
K-32
Report of Independent Registered Public Accounting Firm
The Board of Directors and Shareholders
NeuLion, Inc.
We have audited the accompanying consolidated balance sheets of NeuLion, Inc. (the “Company”) as of December 31, 2009 and 2008, and the related consolidated statements of operations and comprehensive loss, shareholders' equity, and cash flows for the years then ended. These financial statements are the responsibility of the Company's management. Our responsibility is to express an opinion on these financial statements based on our audits.
We conducted our audits in accordance with the standards of the Public Company Accounting Oversight Board (United States). Those standards require that we plan and perform the audit to obtain reasonable assurance about whether the financial statements are free of material misstatement. We were not engaged to perform an audit of the Company's internal control over financial reporting. Our audits included consideration of internal control over financial reporting as a basis for designing audit procedures that are appropriate in the circumstances, but not for the purpose of expressing an opinion on the effectiveness of the Company's internal control over financial reporting. Accordingly, we express no such opinion. An audit also includes examining, on a test basis, evidence supporting the amounts and disclosures in t he financial statements, assessing the accounting principles used and significant estimates made by management, and evaluating the overall financial statement presentation. We believe that our audits provide a reasonable basis for our opinion.
In our opinion, the financial statements referred to above present fairly, in all material respects, the consolidated financial position of NeuLion, Inc. at December 31, 2009 and 2008, and the consolidated results of its operations and its cash flows for the years then ended, in conformity with U.S. generally accepted accounting principles.
As discussed in Note 2 to the consolidated financial statements, the Company adopted the guidance issued in Financial Accounting Standards Board (“FASB”) Statement No. 141(R), “Business Combinations” (codified in FASB Accounting Standards Codification (“ASC”) Topic 805, “Business Combinations”) and Emerging Issues Task Force 07-5, “Determining Whether an Instrument (or Embedded Feature) Is Indexed to an Entity's Own Stock” (codified in FASB ASC Topic 815-40) on January 1, 2009.
/s/ Ernst & Young LLP
Jericho, New York
March 17, 2010
K-33
NEULION, INC.
CONSOLIDATED BALANCE SHEETS
[Expressed in U.S. dollars, unless otherwise noted]
As at December 31, | ||||||
| 2009 | 2008 | |||||
| $ | $ | |||||
| ASSETS | ||||||
| Current | ||||||
| Cash and cash equivalents | 12,957,679 | 27,323,021 | ||||
| Accounts receivable, net of allowance for doubtful accounts of $129,550 and $290,538, | ||||||
respectively [note 2] | 1,809,147 | 2,284,242 | ||||
| Taxes receivable | 35,334 | 983,253 | ||||
| Other receivables | 821,834 | 227,711 | ||||
| Inventory | 928,592 | 347,600 | ||||
| Prepaid expenses and deposits | 966,101 | 1,830,260 | ||||
Due from related party [note 7] | 246,992 | 324,059 | ||||
| Total current assets | 17,765,679 | 33,320,146 | ||||
Property, plant and equipment, net [note 5] | 5,754,255 | 6,474,989 | ||||
Intangible assets, net [notes 3 and 6] | 9,542,071 | 5,749,332 | ||||
Goodwill [notes 3 and 6] | 6,757,194 | 6,846,183 | ||||
| Other assets | 449,964 | 1,347,032 | ||||
| Total assets | 40,269,163 | 53,737,682 | ||||
| LIABILITIES AND SHAREHOLDERS' EQUITY | ||||||
| Current | ||||||
| Accounts payable | 5,383,518 | 4,465,388 | ||||
| Accrued liabilities | 5,822,385 | 7,595,116 | ||||
Derivative liability [note 16] | 1,389,300 | — | ||||
Due to related parties [note 7] | 298,595 | 56,826 | ||||
| Deferred revenue | 3,907,510 | 3,091,993 | ||||
| Total current liabilities | 16,801,308 | 15,209,323 | ||||
| Long-term deferred revenue | 469,191 | 638,510 | ||||
| Other long-term liabilities | 728,330 | 876,271 | ||||
| Total liabilities | 17,998,829 | 16,724,104 | ||||
| Shareholders' equity | ||||||
Share capital [note 9] | 11,260,415 | 6,762,097 | ||||
| Common shares (par value: none; authorized: unlimited; issued and outstanding: | ||||||
| 116,731,794 and 110,084,044, respectively) | ||||||
| Additional paid-in capital | 55,023,567 | 56,500,258 | ||||
| Promissory notes receivable | (209,250 | ) | (209,250 | ) | ||
| Accumulated deficit | (43,804,398 | ) | (26,039,527 | ) | ||
| Total shareholders' equity | 22,270,334 | 37,013,578 | ||||
| Total liabilities and shareholders' equity | 40,269,163 | 53,737,682 | ||||
See accompanying notes
K-34
NEULION, INC.
CONSOLIDATED STATEMENTS OF OPERATIONS AND
COMPREHENSIVE LOSS
COMPREHENSIVE LOSS
[Expressed in U.S. dollars, unless otherwise noted]
| Years ended December 31, | |||||||
| 2009 | 2008 | ||||||
| $ | $ | ||||||
| Revenue | |||||||
| Services revenue | 26,464,400 | 9,542,689 | |||||
| Equipment revenue | 1,629,277 | 3,900,650 | |||||
| 28,093,677 | 13,443,339 | ||||||
| Costs and Expenses | |||||||
| Cost of services revenue, exclusive of depreciation and | 12,850,002 | 4,519,062 | |||||
| amortization shown separately below | |||||||
| Cost of equipment revenue | 1,537,150 | 3,120,087 | |||||
Selling, general and administrative, including stock-based compensation [note 10] | 28,767,049 | 14,221,347 | |||||
| Depreciation and amortization | 4,141,117 | 1,572,492 | |||||
| Impairment of long-lived assets | — | 1,036,993 | |||||
| 47,295,318 | 24,469,981 | ||||||
| Operating loss | (19,201,641 | ) | (11,026,642 | ) | |||
| Other income (expense) | |||||||
Unrealized loss on derivative [note 16] | (801,350 | ) | — | ||||
| Gain on foreign exchange | 68,245 | 265,720 | |||||
| Investment income | 293,825 | 130,048 | |||||
| Equity in loss of affiliate | — | (1,006,386 | ) | ||||
| (439,280 | ) | (610,618 | ) | ||||
| Net and comprehensive loss for the year | (19,640,921 | ) | (11,637,260 | ) | |||
| Net loss per weighted average number of shares | |||||||
outstanding - basic and diluted [note 11] | $(0.18 | ) | $(0.21 | ) | |||
| Weighted average number of shares | |||||||
outstanding - basic and diluted [note 11] | 111,314,653 | 55,995,297 | |||||
See accompanying notes
K-35
NEULION, INC.
CONSOLIDATED STATEMENTS OF SHAREHOLDERS' EQUITY
[Expressed in U.S. dollars, unless otherwise noted]
| Total | |||||||||||||||||||||||
| Additional | Promissory | Accumulated | shareholders' | ||||||||||||||||||||
| Common shares | paid-in capital | Notes | deficit | equity | |||||||||||||||||||
| # | $ | $ | $ | $ | $ | ||||||||||||||||||
| Balance, December 31, 2007 | 44,018,383 | 68,871 | 17,580,329 | — | (14,402,267 | ) | 3,246,933 | ||||||||||||||||
| Capital contribution | — | — | 2,600,000 | — | — | 2,600,000 | |||||||||||||||||
| Exercise of stock options | 5,559,044 | 8,698 | 419,927 | (209,250 | ) | — | 219,375 | ||||||||||||||||
| 49,577,427 | 77,569 | 20,600,256 | (209,250 | ) | (14,402,267 | ) | 6,066,308 | ||||||||||||||||
| Issuance of shares in connection | |||||||||||||||||||||||
| with merger | 49,490,372 | (77,569 | ) | 31,615,091 | — | — | 31,537,522 | ||||||||||||||||
| Private placement | 11,000,000 | 6,750,700 | 2,464,000 | — | — | 9,214,700 | |||||||||||||||||
| Issuance of common shares for | |||||||||||||||||||||||
| RSUs | 16,245 | 6,518 | — | — | — | 6,518 | |||||||||||||||||
| Release of common shares from | — | 4,879 | — | — | — | 4,879 | |||||||||||||||||
| escrow for services | |||||||||||||||||||||||
| Stock-based compensation | — | — | 1,820,911 | — | — | 1,820,911 | |||||||||||||||||
| Net loss | — | — | — | — | (11,637,260 | ) | (11,637,260 | ) | |||||||||||||||
| Balance, December 31, 2008 | 110,084,044 | 6,762,097 | 56,500,258 | (209,250 | ) | (26,039,527 | ) | 37,013,578 | |||||||||||||||
| Cumulative effect of change in | |||||||||||||||||||||||
accounting principle [notes 2 | |||||||||||||||||||||||
| and 16] | — | — | (2,464,000 | ) | — | 1,876,050 | (587,950 | ) | |||||||||||||||
| Exercise of stock options for | |||||||||||||||||||||||
| common shares | 187,417 | 115,831 | (28,127 | ) | — | — | 87,704 | ||||||||||||||||
| Issuance of common shares on | |||||||||||||||||||||||
| acquisition of Interactive | |||||||||||||||||||||||
| Netcasting Systems Inc. | |||||||||||||||||||||||
(“INSINC”) [note 3[i]] | 6,000,012 | 4,048,442 | 325,351 | — | — | 4,373,793 | |||||||||||||||||
| Stock-based compensation: | |||||||||||||||||||||||
| Issuance of common shares on | |||||||||||||||||||||||
| vesting of restricted share units | 52,498 | 31,631 | — | — | — | 31,631 | |||||||||||||||||
| Release of common shares from | |||||||||||||||||||||||
| escrow for services | — | 51,757 | — | — | — | 51,757 | |||||||||||||||||
| Issuance of common shares under | |||||||||||||||||||||||
| Directors’ Compensation Plan | 407,823 | 250,657 | — | — | — | 250,657 | |||||||||||||||||
| Stock options and warrants | — | — | 690,085 | — | — | 690,085 | |||||||||||||||||
| Net loss | — | — | — | — | (19,640,921 | ) | (19,640,921 | ) | |||||||||||||||
| Balance, December 31, 2009 | 116,731,794 | 11,260,415 | 55,023,567 | (209,250 | ) | (43,804,398 | ) | 22,270,334 | |||||||||||||||
See accompanying notes
K-36
[Expressed in U.S. dollars, unless otherwise noted]
| Years ended December 31, | |||||||
| 2009 | 2008 | ||||||
| $ | $ | ||||||
| OPERATING ACTIVITIES | |||||||
| Net loss | (19,640,921 | ) | (11,637,260 | ) | |||
| Adjustments to reconcile net loss to cash used in operating activities | |||||||
Depreciation and amortization [notes 5 and 6] | 4,141,117 | 1,572,492 | |||||
| Equity in loss of affiliate | — | 1,006,386 | |||||
Stock-based compensation [note 10] | 1,167,789 | 1,848,906 | |||||
Unrealized loss on derivative [notes 2 and 16] | 801,350 | — | |||||
| Impairment of long-lived assets | — | 1,036,993 | |||||
| Changes in operating assets and liabilities | |||||||
| Accounts receivable | 848,375 | 1,943,307 | |||||
| Inventory | (580,992 | ) | (24,100 | ) | |||
| Prepaid expenses, deposits and other assets | 1,832,496 | 191,621 | |||||
| Other receivables | (701,145 | ) | 4,441 | ||||
| Taxes receivable | 966,367 | 37,398 | |||||
| Due from related parties | 77,067 | (135,204 | ) | ||||
| Accounts payable | 275,907 | (306,999 | ) | ||||
| Accrued liabilities | (1,364,330 | ) | 604,465 | ||||
| Deferred revenue | 510,383 | 244,846 | |||||
| Long-term liabilities | (267,941 | ) | 41,833 | ||||
| Due to related parties | 241,769 | (2,043,626 | ) | ||||
| Cash used in operating activities | (11,692,709 | ) | (5,614,501 | ) | |||
| INVESTING ACTIVITIES | |||||||
| Purchase of property, plant and equipment | (1,198,432 | ) | (1,443,438 | ) | |||
Acquisition of INSINC, net of cash of $344,371 [note 3[i]] | (1,561,905 | ) | — | ||||
| Acquisition of NeuLion, Inc. | — | 21,738,421 | |||||
| Cash (used in) provided by investing activities | (2,760,337 | ) | 20,294,983 | ||||
| FINANCING ACTIVITIES | |||||||
| Capital contributions | — | 2,600,000 | |||||
| Private placement | — | 9,214,700 | |||||
| Proceeds from exercise of stock options | 87,704 | 219,375 | |||||
| Cash provided by financing activities | 87,704 | 12,034,075 | |||||
| Net (decrease) increase in cash and cash equivalents during the year | (14,365,342 | ) | 26,714,557 | ||||
| Cash and cash equivalents, beginning of year | 27,323,021 | 608,464 | |||||
| Cash and cash equivalents, end of year | 12,957,679 | 27,323,021 | |||||
See accompanying notes
K-37
NEULION, INC.
NOTES TO CONSOLIDATED FINANCIAL STATEMENTS
[Expressed in U.S. dollars, unless otherwise noted]
December 31, 2009
1. Nature of Operations
On October 20, 2008, the company now known as NeuLion USA, Inc. (“NeuLion USA”) completed a merger (the “Merger”) with the company then known as NeuLion, Inc. (“NeuLion” or the “Company”) that was accounted for as a reverse takeover. As a result of the Merger, NeuLion USA became the legal subsidiary of NeuLion, and NeuLion was required to register its common shares (the “Shares”) in the United States under the Securities and Exchange Act of 1934, as amended. On June 8, 2009, NeuLion’s Registration Statement on Form 10 became effective.
On June 4, 2009, the company now known as NeuLion, Inc., a Delaware corporation and wholly-owned subsidiary of the company then known as JumpTV Inc., a Canadian corporation, changed its name to NeuLion USA. On July 13, 2009, JumpTV Inc. changed its name to NeuLion. In conjunction with the name change, NeuLion’s stock symbol was changed from “JTV” to “NLN” on the Toronto Stock Exchange. This Annual Report on Form 10-K reflects these name changes.
These consolidated financial statements for the years ended December 31, 2009 and 2008, and as at December 31, 2009 and 2008 are issued under the name of the legal acquirer in the Merger (NeuLion) but are deemed to be a continuation of the accounting acquirer (NeuLion USA). These financial statements reflect the assets, liabilities and results of operations of NeuLion USA, the accounting acquirer, and only include the assets, liabilities and results of operations of NeuLion, the legal acquirer, subsequent to the reverse takeover on October 20, 2008 (the “Acquired Business”).
The Company’s primary business is to build and manage private networks for content owners and aggregators (the Company’s content partners) that are used to stream content to multiple platforms through browser-based devices. That content includes live and on-demand sports and international and variety programming, which the Company then delivers to subscribers and pay-per-view customers for viewing on Internet-connected browser-based devices such as personal computers, laptops and mobile devices and on standard television sets through Internet-connected set top boxes (“STBs”). The Company also acquires the rights to certain sports and international content from television broadcasters (our channel partners), which the Company then streams to end users through the Company's own private networ ks.
2. Basis of Presentation and Significant Accounting Policies
The accompanying consolidated financial statements include all of our wholly-owned subsidiaries and have been prepared in accordance with United States generally accepted accounting principles (“U.S. GAAP”). See Note 17 for reconciliation of U.S. GAAP to Canadian generally accepted accounting principles (“Canadian GAAP”). The Company also has an investment in KyLinTV, Inc. ("KyLinTV") in which, as at December 31, 2009, it had a 17.1% equity interest (2008 – 17.1%). KyLinTV is accounted for using the equity method of accounting.
Use of estimates
The preparation of financial statements in conformity with U.S. GAAP requires management to make estimates and assumptions that affect the reported amounts of assets and liabilities and disclosure of contingent assets and liabilities at the date of the consolidated financial statements and the reported amounts of revenue and expenses during the reporting periods. Actual results could differ from those estimates. Significant estimates made by management include the determination of the useful lives of long-lived assets, impairment of intangible assets and goodwill, inventory obsolescence, assumptions used in stock-based compensation and the allowance for doubtful accounts. On an ongoing basis, management reviews its estimates to ensure they appropriately reflect changes in the Company's business and new information as it becomes available. If historical experience and other factors used by management to make these estimates do not reasonably reflect future actual results, the Company's consolidated financial position and results of operations could be materially impacted.
K-38
NEULION, INC.
NOTES TO CONSOLIDATED FINANCIAL STATEMENTS
[Expressed in U.S. dollars, unless otherwise noted]
December 31, 2009
Revenue recognition
Revenue is recognized when persuasive evidence of an arrangement exists, prices are determinable, collectability is reasonably assured and the goods or services have been delivered. If any of these criteria are not met, revenue is deferred until such time as all of the criteria are met.
For arrangements with multiple elements, the Company allocates revenue to each element using the residual method; this allocation is based on vendor specific objective evidence ("VSOE") of fair value of the undelivered items. VSOE is based on the price that the Company charges for the undelivered element based on the sales price of each element when sold on a standalone basis. In addition, the Company defers the portion of the arrangement fee equal to the fair value of the undelivered elements until they are delivered.
The Company, at the request of one customer, has entered into a "bill and hold" arrangement. The Company accounts for its bill and hold revenue arrangement consistent with the provisions of Financial Accounting Standards Board (“FASB”) Accounting Standards Codification (“ASC”) Topic 605, “Revenue Recognition,” and recognizes revenue when the risk of ownership has passed to the customer and a fixed commitment to purchase the goods is received. The Company does not retain any specific performance obligations such that the earning process is not complete and ordered goods are segregated from the Company's inventory and not subject to fulfilling other orders. Inventory consists of finished goods. For the years ended December 31, 2009 and 2008, the Company recog nized zero and $2,500,000 in revenue associated with this arrangement, respectively.
The Company earns revenue as follows:
[i] Services Revenue:
Subscriber revenue
Subscriber revenue consists of recurring revenue based on subscriber usage, bandwidth usage fees for the Company infrastructure and/or technology usage fees based on the number of subscribers. The subscriber revenue is typically generated on a monthly, quarterly or annual basis and can be either a fixed fee per user or a variable fee measured by bandwidth use or as a percentage of end user pricing. Revenue is recognized over the term of the subscription. The Company defers the appropriate portion of cash received for which services have not yet been rendered and recognizes the revenue over the term of the subscription, which is generally between thirty days and one year. Pay-per-view revenues are deferred and recognized in the period when the content is viewed.
eCommerce revenue
eCommerce revenue consists of the Company’s services provided to its content providers which include software applications for merchandising (i.e. sale of merchandise), ticketing for a content provider’s events and management of a content provider’s donor efforts. Included in eCommerce revenue is advertising revenue earned through the insertion of advertising impressions on websites and in streaming video at a cost per thousand impressions. Advertising revenue is recognized based on the number of impressions displayed (“served”) during the period. Deferred revenue for eCommerce represents the timing difference between collection of advertising revenue and when the advertisements are served which is typically between thirty and ninety days.
Technology revenue
Technology revenue consists of the setup and maintenance services the Company provides such as website (Internet) or console (STB) design, user interface optimization and streaming configuration. Included in technology revenue is the licensing of the technology required to convert, compress and transmit video signals to the Company’s content distribution network and ultimately to end users. Revenue is recognized as the service is performed. Deferred revenue on technology fees is as follows:
K-39
NEULION, INC.
NOTES TO CONSOLIDATED FINANCIAL STATEMENTS
[Expressed in U.S. dollars, unless otherwise noted]
December 31, 2009
[a] Setup fees are deferred at the beginning of the service period and recognized over the term of the arrangement, which is generally three to five years.
[b] Maintenance fees are deferred at the beginning of the maintenance period and are recognized in revenue over the term of the maintenance service, which is generally one year.
[c] Licensing fees for software are deferred at the beginning of the service period and recognized over the term of the arrangement, which is generally three to five years.
[ii] Equipment revenue
Equipment revenue consists of the sale of STBs to content partners and/or end users to enable the end user to receive the content over the internet and display the signal on a standard television. Shipping charges are included in total equipment revenue. Revenue is recognized generally upon shipment to the customer. The customer does not have any right of return on STBs.
Cash and cash equivalents
Cash and cash equivalents consist of cash and short-term investments, such as money market funds, that have maturities of less than three months.
Accounts receivable
Accounts receivable are carried at original invoice amount. The Company maintains a provision for estimated losses resulting from the inability of its customers to make required payments. Management considers the following factors when determining the collectability of specific customer accounts: customer credit-worthiness, past transaction history with the customer, current economic industry trends and changes in customer payment terms. If the financial conditions of the Company's customers were to deteriorate, adversely affecting their ability to make payments, additional allowances would be required. As of December 31, 2009 and 2008, the allowance for doubtful accounts was $129,550 and $290,538, respectively.
Inventory
Inventory consists of STBs, which are finished goods and are recorded at the lower of cost and net realizable value. Cost is accounted for on a first-in, first-out basis. The Company evaluates its ending inventories for estimated excess quantities and obsolescence. This evaluation includes analyses of sales levels and projections of future demand within specific time horizons. Inventories in excess of future demand are reserved. In addition, the Company assesses the impact of changing technology and market conditions on its inventory-on-hand and writes off inventories that are considered obsolete. As at December 31, 2009 and 2008, the Company’s inventory reserves were zero and $9,700, respectively.
Property, plant and equipment
Property, plant and equipment are carried at cost less accumulated depreciation. Expenditures for maintenance and repairs are expensed currently, while renewals and betterments that materially extend the life of an asset are capitalized. The cost of assets sold, retired or otherwise disposed of, and the related allowance for depreciation, are eliminated from the accounts, and any resulting gain or loss is recognized.
K-40
NEULION, INC.
NOTES TO CONSOLIDATED FINANCIAL STATEMENTS
[Expressed in U.S. dollars, unless otherwise noted]
December 31, 2009
Depreciation is provided using the straight-line method over the estimated useful lives of the assets, which are as follows:
| Computer hardware | 5 years |
| Computer software | 3 years |
| Furniture and fixtures | 7 years |
| Leasehold improvements | Shorter of useful life and lease term |
The Company reviews the carrying value of property, plant and equipment for impairment whenever events and circumstances indicate that the carrying value of an asset may not be recoverable from the estimated future cash flows expected to result from its use and eventual disposition. If these future undiscounted cash flows are less than the carrying value of the asset, then the carrying amount of the asset is written down to its fair value, based on the related estimated discounted future cash flows. The factors considered by management in performing this assessment include current operating results, trends and prospects, the manner in which the property, plant and equipment is used and the effects of obsolescence, demand, competition and other economic factors. Based on this assessment, there was an impairment loss of zero and $1,036,993 for the years ended December 31, 2009 and 2008, respectively.
Intangible Assets
Intangible assets are recorded at cost less amortization. Cost for intangible assets acquired through business combinations represents their fair market value at the date of acquisition. Amortization is calculated using the straight-line method over the estimated useful lives of the intangible assets which are as follows:
| Customer relationships | 5 years |
| Trademarks | 1 year |
The Company reviews the carrying value of its definite lived intangible assets for impairment whenever events and circumstances indicate that the carrying value of an asset may not be recoverable from the estimated future cash flows expected to result from its use and eventual disposition. If these future undiscounted cash flows are less than the carrying value of the asset, then the carrying amount of the asset is written down to its fair value, based on the related estimated discounted future cash flows. The factors considered by management in performing this assessment include current operating results, trends and prospects, the manner in which the intangible assets are used and the effects of obsolescence, demand, competition and other economic factors. Based on this assessment, no impairment was recorded for the years ended Decemb er 31, 2009 and 2008.
Goodwill
Goodwill represents the excess, at the date of acquisition, of the cost of an acquired business over the fair value of the identifiable assets acquired and liabilities assumed. Goodwill is not amortized but is subject to an annual impairment test at the reporting unit level and between annual tests if changes in circumstances indicate a potential impairment. The Company performs an annual goodwill impairment test as of October 1 of each calendar year. Goodwill impairment is assessed based on a comparison of the fair value of each reporting unit to the underlying carrying value of the reporting unit's net assets, including goodwill. If the carrying value of the reporting unit exceeds its fair value, the Company performs the second step of the goodwill impairment test to determine the amount of the impairment loss. The second step of the impairment test involves comparing the implied fair value of the reporting unit's goodwill with its carrying amount to measure the amount of impairment loss, if any. The Company's impairment test was based on its single operating segment and reporting unit structure. For the years ended December 31, 2009 and 2008, there was no impairment loss.
K-41
NEULION, INC.
NOTES TO CONSOLIDATED FINANCIAL STATEMENTS
[Expressed in U.S. dollars, unless otherwise noted]December 31, 2009
Investee companies that are not consolidated, but over which the Company exercises significant influence, are accounted for under the equity method of accounting. Whether or not the Company exercises significant influence with respect to an investee depends on an evaluation of several factors including, among others, representation on the investee's board of directors and voting rights. Under the equity method of accounting, an investee's accounts are not reflected within the Company's consolidated balance sheets and statements of operations and comprehensive loss; however, the Company's share of the losses of the investee company is reflected in the caption "Equity in loss of affiliate" in the consolidated statements of operations and comprehensive loss. Due to KyLinTV’s accumulated losses, the investment had been red uced to zero at December 31, 2008. No further charges will be recorded as the Company has no obligation to fund the losses of KyLinTV.
Deferred transcoder costs
Deferred transcoder costs represent the unamortized costs of licensing fees incurred related to the setup of new channels for NeuLion's customers. These costs are being recognized as a charge to the consolidated statements of operations and comprehensive loss consistent with the related revenue over the remaining initial contractual term between NeuLion and its customers, which typically ranges from three to five years. Deferred transcoder costs are included in other assets on the consolidated balance sheet.
Income taxes
Income taxes are accounted for under the provisions on ASC Topic 740, “Income Taxes Recognition” (“ASC 740”). ASC 740 requires that income tax accounts be computed using the liability method. Deferred taxes are determined based upon the estimated future tax effects of differences between the financial reporting and tax reporting bases of assets and liabilities given the provisions of currently enacted tax laws.
ASC 740 requires an entity to recognize the financial statement impact of a tax position when it is more likely than not that the position will be sustained upon examination. If the tax position meets the more-likely-than-not recognition threshold, the tax effect is recognized at the largest amount of the benefit that has greater than a fifty percent likelihood of being realized upon ultimate settlement. ASC 740 also provides guidance for classification, interest and penalties, accounting in interim periods, disclosure, and transition. ASC 740 requires that a liability created for unrecognized tax benefits be presented as a separate liability and not combined with deferred tax liabilities or assets.
The Company operates in a number of countries worldwide. The income tax liability is therefore a consolidation of the tax liabilities in various locations. The tax rate is affected by the profitability of operations in various locations, tax rates and taxation systems of the countries in which the Company operates its tax policies and the impact of certain tax planning strategies which have been implemented.
To determine the worldwide tax liability the Company makes estimates of possible tax liabilities. Tax filings, positions and strategies are subject to review under local or international tax audit and the outcomes of such reviews are uncertain. In addition, these audits generally take place years after the period in which the tax provision in question was provided and it may take a substantial amount of time before the final outcome of any audit is known. Future tax audits could differ materially from the amounts recorded in our financial statements.
K-42
NEULION, INC.
NOTES TO CONSOLIDATED FINANCIAL STATEMENTS
[Expressed in U.S. dollars, unless otherwise noted]December 31, 2009
A valuation allowance is recorded to reduce deferred tax assets to the amount that is more likely than not to be realized. The Company has recorded substantial tax losses over the years, therefore a full valuation allowance has been recorded against all net deferred tax assets.
Foreign currency translation
The functional currency of the Company is the U.S. dollar. Monetary assets and liabilities denominated in foreign currencies are translated into U.S. dollars at exchange rates in effect at the balance sheet dates, and non-monetary assets and liabilities in foreign currencies are translated at exchange rates in effect on the date of the transaction. These transactional foreign exchange gains or losses are included in the consolidated statements of operations and comprehensive loss.
Financial instruments
The Company's financial instruments consist of cash and cash equivalents, accounts receivable, other receivables, due from/to related parties, accounts payable and accrued liabilities which are primarily denominated in U.S. dollars. The carrying amount of such instruments approximates their fair values principally due to the short term nature of these items. Unless otherwise noted, it is management's opinion that the Company is not exposed to significant interest rate, currency or credit risk arising from these financial instruments.
The Company is exposed to credit risk with respect to accounts receivable arising from the potential for counterparties to default on their contractual obligations to the Company. The Company controls credit risk through credit approvals, credit limits and monitoring procedures. The Company performs credit evaluations on its customers, but generally does not require collateral to support accounts receivable. The Company establishes an allowance for doubtful accounts that corresponds with the specific credit risk of its customers, historical trends and economic circumstances.
Advertising
Advertising costs are expensed as incurred and totaled $1,138,400 and $366,756 for the years ended December 31, 2009 and 2008, respectively.
Stock-based compensation and other stock-based payments
The Company accounts for all stock options and warrants using a fair value-based method. The fair value of each stock option and warrant granted is estimated on the date of the grant using the Black-Scholes-Merton option pricing model and the related stock-based compensation expense is recognized over the vesting period. The fair value of stock options, retention warrants and warrants granted to employees is measured at the date of the grant. The fair value of the warrants granted to non-employees is measured as the warrants vest. The offsetting entry is an increase to additional paid-in capital for an amount equal to the stock-based compensation expense related to the issuance of stock options. Upon exercise, the proceeds of the options and warrants together with the fair value recorded in a dditional paid-in capital are reclassified to share capital.
Stock appreciation rights give the holder the right to elect to either receive cash in an amount equal to the excess of the quoted market price over the stock appreciation right price or to receive Shares equal to the fair value of the Shares less the exercise price divided by the market value of the Shares from treasury or receive Shares by making a cash payment equal to the exercise price. The Board of Directors has discretionary authority to accept or reject a cash payment request in whole or in part. Stock-based compensation expense is calculated as the fair value of the vested portion of the stock appreciation rights outstanding, with ongoing measurement of the outstanding liability at each reporting date. The liability is classified as a current liability on the consolidated balance sheets. & #160;If the holder elects to purchase Shares, the liability is credited to additional paid-in capital.
K-43
NEULION, INC.
NOTES TO CONSOLIDATED FINANCIAL STATEMENTS
[Expressed in U.S. dollars, unless otherwise noted]December 31, 2009
Recently issued accounting standards
In June 2009, the FASB issued guidance now codified as ASC Topic 105, “Generally Accepted Accounting Principles” (“ASC 105”) as the single source of authoritative non-governmental U.S. GAAP. ASC 105 does not change current U.S. GAAP, but is intended to simplify user access to all authoritative U.S. GAAP by providing all authoritative literature related to a particular topic in one place (the “Codification”). On the effective date of ASC 105, the Codification superseded all then-existing non-SEC accounting and reporting standards, and all other non-grandfathered non-SEC accounting literature not included in the Codification became non-authoritative. The provisions of ASC 105 are effective for interim and annual periods ending after September 15, 2009. The Company adopted ASC 105 in the third quarter o f 2009. This pronouncement had no effect on our consolidated financial position, results of operations or cash flows, but impacted the financial reporting process by replacing all references to pre-Codification standards with references to the applicable Codification topic.
Effective January 1, 2009, the Company adopted ASC Topic 805-10, “Business Combinations” (“ASC 805”). ASC 805 requires the acquiring entity in a business combination to recognize all assets acquired and liabilities assumed in the transaction, establishes the acquisition-date fair value as the measurement objective for all assets acquired and liabilities assumed and requires the acquirer to disclose certain information related to the nature and financial effect of the business combination. ASC 805 also establishes principles and requirements for how an acquirer recognizes any non-controlling interest in the acquiree and the goodwill acquired in a business combination.
In October 2009, the FASB issued ASU 2009-13, “Multiple-Deliverable Revenue Arrangements” (“ASU 2009-13”). ASU 2009-13 amends guidance included within ASC Topic 605-25 to require an entity to use an estimated selling price when vendor specific objective evidence or acceptable third party evidence does not exist for any products or services included in a multiple element arrangement. The arrangement consideration should be allocated among the products and services based upon their relative selling prices, thus eliminating the use of the residual method of allocation. ASU 2009-13 also requires expanded qualitative and quantitative disclosures regarding significant judgments made and changes in applying this guidance. ASU 2009-13 is effective prospectively for revenue arrangements en tered into or materially modified in fiscal years beginning on or after June 15, 2010. Early adoption and retrospective application are also permitted. The Company is currently evaluating the impact of adopting the provisions of ASU 2009-13.
Effective January 1, 2009, the Company adopted ASC Topic 815-40, “Derivatives and Hedging” (“ASC 815-40”). One of the conclusions reached under ASC 815-40 was that an equity-linked financial instrument would not be considered indexed to the entity’s own stock if the strike price is denominated in a currency other than the issuer’s functional currency. The conclusion reached under ASC 815-40 clarified the accounting treatment for these and certain other financial instruments. ASC 815-40 specifies that a contract would not be treated as a derivative if it met the following conditions: 60;(a) indexed to the Company’s own stock; and (b) classified in shareholders’ equity in the Company’s statement of financial position. The Company’s outstanding warrants denominated in Canadian dollars as detailed in note 16 are not considered to be indexed to its own stock because the exercise price is denominated in Canadian dollars and the Company’s functional currency is United States dollars. Therefore, these warrants have been treated as derivative financial instruments and recorded at their fair value as a liability. All other outstanding convertible instruments are considered to be indexed to the Company’s stock, because their exercise price is denominated in the same currency as the Company’s functional currency, and are included in shareholders’ equity.
K-44
NEULION, INC.
NOTES TO CONSOLIDATED FINANCIAL STATEMENTS
[Expressed in U.S. dollars, unless otherwise noted]December 31, 2009
Comparative Information
We have reclassified certain prior year information to conform with the current year’s presentation.
3. Business Combinations
[i] Interactive Netcasting Systems Inc. (“INSINC”)
On October 31, 2009, the Company consummated the acquisition of 100% of the outstanding securities of INSINC. Under the terms of the acquisition agreement, shareholders of INSINC received consideration consisting of 6,000,012 Shares of the Company, CDN$2.5 million in cash, 1,000,000 Share purchase warrants to acquire Shares at US$1.35 per share and 500,000 Share purchase warrants to acquire Shares at US$1.80 per share. Both series of warrants are exercisable for a period of 2 years. In addition, the Company incurred approximately $515,000 of direct transaction costs.
INSINC's core business is to provide live and archived video sports, government and entertainment content to audiences online with integrated pay-per-view and commerce transaction processing.
The purchase price of $6,694,293 represents the fair value of 6,000,012 of Shares issued of $4,035,043, cash in the amount of $2,320,500 and the fair value of the Share purchase warrants in the amount of $338,750.
The following table summarizes the estimated fair values of the assets acquired and liabilities assumed at the date of acquisition. The Company is obtaining third party valuations of certain intangible assets and evaluating certain liabilities and assets, thus the allocation of the purchase price is preliminary.
| As at October 31, 2009 | ||||
| Cash | $ | 344,371 | ||
| Other current assets | 737,406 | |||
| Property, plant and equipment | 739,690 | |||
| Intangible assets | 5,275,000 | |||
| Goodwill | 1,015,525 | |||
| Total assets | 8,111,992 | |||
| Current liabilities | (1,297,699 | ) | ||
| Long-term liabilities | (120,000 | ) | ||
| Net assets acquired, net of cash | $ | 6,694,293 |
Of the $5,275,000 of acquired intangible assets, $95,000 was assigned to the INSINC brand, and $5,180,000 was assigned to customer relationships. None of the intangible assets are expected to be deductible for tax purposes.
All of the $1,015,525 of goodwill was assigned to the Company as a whole as the company operates in one segment. The goodwill is not expected to be deductible for tax purposes.
As noted above, the purchase price allocation of the tangible and intangible assets is preliminary and may be adjusted as a result of obtaining additional information regarding preliminary estimates of fair values made at the date of purchase.
K-45
NEULION, INC.
NOTES TO CONSOLIDATED FINANCIAL STATEMENTS
[Expressed in U.S. dollars, unless otherwise noted]
December 31, 2009
Pro forma
The results of operations for NeuLion and INSINC have been included in the Company’s consolidated statements of operations since the effectiveness of the acquisition on October 31, 2009. The following unaudited pro forma financial information presents the combined results of the Company and the acquisition as if the acquisition had occurred at the beginning of 2008:
| Unaudited Pro Forma | ||||||||
| December 31, | December 31, | |||||||
| 2009 | 2008 | |||||||
| $ | $ | |||||||
| Total revenue | 31,429,239 | 18,668,330 | ||||||
| Total cost of services revenue, exclusive of depreciation and | ||||||||
| amortization shown separately below | (14,712,545 | ) | (7,705,373 | ) | ||||
| Total cost of equipment revenue | (1,537,150 | ) | (3,120,087 | ) | ||||
| Total sales, general and administrative | (28,971,112 | ) | (13,695,033 | ) | ||||
| Stock-based compensation | (1,167,789 | ) | (1,848,906 | ) | ||||
| Impairment of long-lived assets | — | (1,036,993 | ) | |||||
| Depreciation and amortization | (5,315,560 | ) | (3,130,535 | ) | ||||
| Operating loss | (20,274,917 | ) | (11,868,597 | ) | ||||
| Net loss | (20,714,197 | ) | (12,479,215 | ) | ||||
| Net loss per weighted average number of shares | ||||||||
| outstanding – basic and diluted | (0.18 | ) | (0.20 | ) | ||||
In determining the pro forma amounts above, the Company made adjustments to depreciation and amortization as a result of the revised fair values of tangible and intangible assets performed as a result of the acquisition.
[ii] NeuLion
On October 20, 2008, NeuLion completed the Merger with NeuLion USA. Under the terms of the Merger, NeuLion issued 49,577,427 Shares, which represented approximately the entire issued and outstanding shares of NeuLion prior to closing, to the securityholders of NeuLion USA, in exchange for their NeuLion USA securities.
In accordance with ASC Topic 805, “Business Combinations” (“ASC 805”), the Company determined that NeuLion USA was the accounting acquirer and accordingly has accounted for the Merger as a reverse take-over.
The purchase price of $33,186,247 represents the fair value of 49,577,427 Shares issued ($31,656,119), the fair value of vested equity instruments ($515,364) and direct transaction costs ($1,014,764).
K-46
NEULION, INC.
NOTES TO CONSOLIDATED FINANCIAL STATEMENTS
[Expressed in U.S. dollars, unless otherwise noted]
December 31, 2009
The following table summarizes the final fair values of the assets acquired and liabilities assumed at the date of acquisition.
| As at October 20, 2008 | |||
| Cash | $ | 22,884,683 | |
| Current assets | 5,038,462 | ||
| Property, plant and equipment | 5,046,405 | ||
| Other long-term assets | 1,040,516 | ||
| Intangible assets | 6,000,000 | ||
| Goodwill | 5,741,669 | ||
| Total assets | 45,751,735 | ||
| Current liabilities | (11,731,050 | ) | |
| Other long-term liabilities | (834,438 | ) | |
| Net assets acquired | $ | 33,186,247 | |
Of the $6,000,000 of acquired intangible assets, $100,000 was assigned to the JumpTV brand, and $5,900,000 was assigned to customer relationships. None of the intangible assets are expected to be deductible for tax purposes
All of the $5,741,669 of goodwill was assigned to the Company as a whole as the company operates in one segment. The goodwill is not expected to be deductible for tax purposes.
Pro forma
The results of operations for NeuLion and NeuLion USA (the accounting acquirer) have been included in the Company’s consolidated statements of operations since the completion of the Merger on October 20, 2008. The following unaudited pro forma financial information presents the combined results of the Company and the Merger as if the Merger had occurred at the beginning of 2008:
| Unaudited Pro Forma | ||||||||
| December 31, | December 31, | |||||||
| 2009 | 2008 | |||||||
| $ | $ | |||||||
| [actual] | [pro forma] | |||||||
| Total revenue | 28,093,677 | 25,708,760 | ||||||
| Total cost of services revenue, exclusive of depreciation and | ||||||||
| amortization shown separately below | (12,850,002 | ) | (15,716,125 | ) | ||||
| Total cost of equipment revenue | (1,537,150 | ) | (3,120,087 | ) | ||||
| Total sales, general and administrative | (27,599,260 | ) | (38,482,996 | ) | ||||
| Stock-based compensation [a] | (1,167,789 | ) | (3,374,767 | ) | ||||
| Impairment of goodwill [b] | — | (47,882,317 | ) | |||||
| Impairment of long-lived assets [c] | — | (5,982,030 | ) | |||||
| Depreciation and amortization [d] | (4,141,117 | ) | (3,602,169 | ) | ||||
| Operating loss | (19,201,641 | ) | (92,451,731 | ) | ||||
| Net loss | (19,640,921 | ) | (92,459,364 | ) | ||||
| Net loss per weighted average number of shares | ||||||||
| outstanding – basic and diluted | (0.18 | ) | (0.90 | ) | ||||
[a] In accordance with ASC 718, these amounts represent stock-based compensation for the Company’s stock options, restricted share units, stock appreciation rights, warrants and retention warrants.
K-47
NEULION, INC.
NOTES TO CONSOLIDATED FINANCIAL STATEMENTS
[Expressed in U.S. dollars, unless otherwise noted]
December 31, 2009
[b] As at March 31, 2008, the Company's market capitalization decreased below the carrying value of the Company. Management considered this to be an indicator of impairment, and accordingly, performed a goodwill impairment test and recorded a non-cash goodwill impairment charge of $47,882,317.
[c] As at December 31, 2008, the Company determined that the business climate had changed such that the carrying value of the Company’s long-lived assets may not be fully recoverable. Accordingly, the Company recorded non-cash impairment charges of $4,945,037 prior to the Merger and $1,036,993 subsequent to the Merger.
[d] In determining the pro forma amounts above, the Company made adjustments to depreciation and amortization as a result of the revised fair values of tangible and intangible assets performed as a result of the acquisition.
4. Economic Dependence and Concentration of Credit Risk
For the year ended December 31, 2008, three customers accounted for 54% of revenue as follows: 32%, 12% and 10%.
As at December 31, 2008, one customer accounted for 25% of the accounts receivable.
There were no comparable amounts recorded in 2009.
5. Property, Plant and Equipment
The details of property and equipment and the related accumulated depreciation are set forth below:
| December 31, 2009 | ||||||||||||||||
| Accumulated | Non-cash | Net book | ||||||||||||||
| Cost | amortization | Impairment | value | |||||||||||||
| $ | $ | $ | $ | |||||||||||||
| Computer hardware | 6,752,515 | 2,428,478 | 978,720 | 3,345,317 | ||||||||||||
| Computer software | 4,649,297 | 2,319,488 | — | 2,329,809 | ||||||||||||
| Furniture and fixtures | 186,617 | 49,215 | 58,273 | 79,129 | ||||||||||||
| Leasehold improvements | 6,471 | 6,471 | — | — | ||||||||||||
| 11,594,900 | 4,803,652 | 1,036,993 | 5,754,255 | |||||||||||||
| December 31, 2008 | ||||||||||||||||
| Accumulated | Non-cash | Net book | ||||||||||||||
| Cost | amortization | Impairment | value | |||||||||||||
| $ | $ | $ | $ | |||||||||||||
| Computer hardware | 5,655,658 | 1,101,877 | 978,720 | 3,575,061 | ||||||||||||
| Computer software | 3,812,944 | 1,003,139 | — | 2,809,805 | ||||||||||||
| Furniture and fixtures | 184,062 | 35,666 | 58,273 | 90,123 | ||||||||||||
| Leasehold improvements | 6,471 | 6,471 | — | — | ||||||||||||
| 9,659,135 | 2,147,153 | 1,036,993 | 6,474,989 | |||||||||||||
K-48
NEULION, INC.
NOTES TO CONSOLIDATED FINANCIAL STATEMENTS
[Expressed in U.S. dollars, unless otherwise noted]
December 31, 2009
ASC Topic 360, “Property, Plant and Equipment” (“ASC 360”), requires that a long-lived asset be tested for recoverability whenever events or changes in circumstances indicate that its carrying amount may not be recoverable. An impairment loss is recognized as the difference between fair value and carrying amount when the carrying amount of a long-lived asset is not recoverable and exceeds its fair value. The Company determined that during the year ended December 31, 2008 the business climate had changed such that the carrying value of the Company’s property, plant and equipment may not be fully recoverable. Accordingly, the Company recorded a non-cash impairment charge of $1,036,993 for the year ended December 31, 2008. There were no such comparable amounts in the current year.
Depreciation expense for the years ended December 31, 2009 and 2008 was $2,658,856 and $1,321,824, respectively.
6. Goodwill and Intangible Assets
The change in the net carrying amount of goodwill is set forth below:
| $ | ||||
| Balance – December 31, 2007 | — | |||
| Acquisition of NeuLion | 6,846,183 | |||
| Balance – December 31, 2008 | 6,846,183 | |||
| Acquisition of INSINC | 1,015,525 | |||
| Final purchase price adjustment for NeuLion | (1,104,514 | ) | ||
| Balance – December 31, 2009 | 6,757,194 | |||
The details of intangible assets and the related accumulated amortization are set forth below:
| December 31, 2009 | ||||||||||||
| Accumulated | Net book | |||||||||||
| Cost | amortization | value | ||||||||||
$ | $ | $ | ||||||||||
| Customer relationships | 11,080,000 | 1,617,096 | 9,462,904 | |||||||||
| Trademarks | 195,000 | 115,833 | 79,167 | |||||||||
| 11,275,000 | 1,732,929 | 9,542,071 | ||||||||||
| December 31, 2008 | ||||||||||||
| Accumulated | Net book | |||||||||||
| Cost | amortization | value | ||||||||||
| $ | $ | $ | ||||||||||
| Customer relationships | 5,900,000 | 231,084 | 5,668,916 | |||||||||
| Trademarks | 100,000 | 19,584 | 80,416 | |||||||||
| 6,000,000 | 250,668 | 5,749,332 | ||||||||||
Amortization expense for the years ended December 31, 2009 and 2008 was $1,482,261 and $250,668, respectively.
K-49
NEULION, INC.
NOTES TO CONSOLIDATED FINANCIAL STATEMENTS
[Expressed in U.S. dollars, unless otherwise noted]
December 31, 2009
Based on the amount of intangible assets subject to amortization, the Company's estimated amortization expense over the next five years is as follows:
$ | ||||
| 2010 | 2,328,524 | |||
| 2011 | 2,216,000 | |||
| 2012 | 2,216,167 | |||
| 2013 | 1,984,916 | |||
| 2014 | 796,631 | |||
7. Related Party Transactions
The Company has entered into certain transactions and agreements in the normal course of operations with related parties. Significant related party transactions are as follows:
TransVideo International, Ltd. (“TransVideo”)
TransVideo is a company controlled by the Chairman of the Board of Directors of the Company that designs and sells equipment and technology for IPTV content delivery. STB purchases amounted to $1,029,136 and $2,745,000 and transcoder licensing fees amounted to $78,000 and $125,000 for the years ended December 31, 2009 and 2008, respectively. Included in cost of equipment revenue is the cost of STBs sold of $937,204 and $2,816,490 for the years ended December 31, 2009 and 2008, respectively.
KyLinTV
KyLinTV is an IPTV company that is controlled by the Chairman of the Board of Directors of the Company. On June 1, 2008, the Company entered into an agreement with KyLinTV to build and deliver the setup and back office operation of an IPTV service. The Company also provides and charges KyLinTV for administrative and general corporate support. For each of the periods presented, the amounts received for these services provided by the Company for the years ended December 31, 2009 and 2008 were $645,722 and $1,233,353, respectively. During the year ended December 31, 2008, the Company purchased computer equipment from KyLinTV in the amount of $620,000.
New York Islanders Hockey Club, LP (“New York Islanders”)
The Company provides IT related professional services to the New York Islanders, a professional hockey club that is owned by the Chairman of the Board of Directors of the Company.
Renaissance Property Associates, LLC (“Renaissance”)
Renaissance is a real estate management company owned by the Chairman of the Board of Directors of the Company. In June 2009, the Company signed a sublease agreement with Renaissance for office space in Plainview, New York. Rent expense paid by the Company to Renaissance of $388,975 and zero, inclusive of taxes and utilities, is included in selling, general and administrative expense for the years ended December 31, 2009 and 2008, respectively.
K-50
NEULION, INC.
NOTES TO CONSOLIDATED FINANCIAL STATEMENTS
[Expressed in U.S. dollars, unless otherwise noted]
December 31, 2009
Patstar, Inc. (“Patstar”)
Patstar, an investment holding company, is controlled by the Vice Chairman of the Board of Directors of the Company. Rent expense paid to the Company by Patstar of $3,649 and $2,596 is included as a recovery in selling, general and administrative expense for the years ended December 31, 2009 and 2008, respectively.
Hawaii IPTV, LLC (“Hawaii”)
The Company had an IPTV customer, Hawaii, an IPTV company, whose principals are family members of the Chairman of the Board of Directors of the Company. Hawaii ceased operations during the third quarter of 2009.
The Smile Train, Inc. (“Smile Train”)
The Company provides IT related professional services to Smile Train, a public charity whose founder and significant benefactor is the Chairman of the Board of Directors of the Company.
The Company recognized revenue from related parties for the years ended December 31 as follows:
| December 31, | December 31, | |||||||
| 2009 | 2008 | |||||||
| $ | $ | |||||||
| New York Islanders | 395,681 | 296,451 | ||||||
| Renaissance | 140,580 | 120,000 | ||||||
| Smile Train | 108,000 | 120,000 | ||||||
| Hawaii | 41,789 | 57,577 | ||||||
| KyLinTV | 1,755,985 | 920,550 | ||||||
| 2,442,035 | 1,514,578 | |||||||
As at December 31, 2009 and 2008, the amounts due from (to) related parties are as follows:
| December 31, | December 31, | |||||||
| 2009 | 2008 | |||||||
| $ | $ | |||||||
| New York Islanders | (304 | ) | 29,189 | |||||
| Renaissance | — | (1,146 | ) | |||||
| Smile Train | — | 27,000 | ||||||
| Hawaii | — | 17,527 | ||||||
| TransVideo | (298,291 | ) | (55,680 | ) | ||||
| KyLinTV | 246,992 | 250,343 | ||||||
| (51,603 | ) | 267,233 | ||||||
K-51
NEULION, INC.
NOTES TO CONSOLIDATED FINANCIAL STATEMENTS
[Expressed in U.S. dollars, unless otherwise noted]
December 31, 2009
Investment in affiliate – KyLinTV
The Company records its investment in KyLinTV using the equity method.
From January 1, 2008 through December 31, 2009, the Company's equity interest in the affiliate was 17.1%. As previously discussed, the Company also provides and charges KyLinTV for administrative and general corporate support. Management has determined that as a result of the 17.1% equity interest combined with the services that the Company provides KyLinTV, the Company continues to have significant influence on the operating activities of KyLinTV; therefore, the Company continues to account for its investment in KyLinTV using the equity method of accounting for investment.
The Company’s proportionate share of the equity loss from KyLinTV has been accounted for as a charge on the Company's consolidated statements of operations and comprehensive loss. Due to KyLinTV’s accumulated losses, the investment had been reduced to zero as at December 31, 2008. No further charges will be recorded as the Company has no obligation to fund the losses of KyLinTV.
The results of operations and financial position of the Company's equity basis investment in KyLinTV are summarized below for the years ended December 31:
| Year ended, | Year ended, | |||||||
| December 31, | December 31, | |||||||
| 2009 | 2008 | |||||||
| $ | $ | |||||||
| Condensed income statement information: | ||||||||
| Net sales | 8,127,760 | 6,568,101 | ||||||
| Net loss | (5,604,118 | ) | (8,148,974 | ) | ||||
| December 31, | December 31, | |||||||
| 2009 | 2008 | |||||||
| $ | $ | |||||||
| Condensed balance sheet information: | ||||||||
| Current assets | 1,924,891 | 927,427 | ||||||
| Non-current assets | 913,977 | 2,411,319 | ||||||
| Total assets | 2,838,868 | 3,338,746 | ||||||
| Current liabilities | 15,168,149 | 10,063,909 | ||||||
| Non-current liabilities | — | — | ||||||
| Equity (deficiency) | (12,329,281 | ) | (6,725,163 | ) | ||||
| Total liabilities and equity | 2,838,868 | 3,338,746 | ||||||
On February 26, 2010, a group of investors invested $10.0 million in KyLinTV for 15.1% of its equity, which reduced the Company’s equity interest in KyLinTV to 12.2%. Of the total $10.0 million investment, $1.0 million was invested by AvantaLion LLC, a company controlled by the Chairman of the Board of Directors of the Company.
K-52
NEULION, INC.
NOTES TO CONSOLIDATED FINANCIAL STATEMENTS
[Expressed in U.S. dollars, unless otherwise noted]
December 31, 2009
8. 401(K) Profit Sharing Plan
The Company sponsors a 401(k) Profit Sharing Plan to provide retirement and incidental benefits for its eligible employees. Employees may contribute a percentage of their annual compensation through salary reduction, subject to certain qualifications and Internal Revenue Code limitations. The Company provides for voluntary matching contributions up to certain limits. Matching contributions vest over five years.
For the years ended December 31, 2009 and 2008, the Company made aggregate net matching contributions of $436,716 and $113,000, respectively.
9. Share Capital
Share capital consists of the following:
| December 31, | December 31, | |||||||
| 2009 | 2008 | |||||||
| $ | $ | |||||||
| Authorized | ||||||||
| Unlimited common shares, voting, no par value, discretionary non- | ||||||||
| cumulative dividend | ||||||||
| Unlimited Class 1 preference shares, non-voting, no par value, | ||||||||
| discretionary partly cumulative or non-cumulative dividends | ||||||||
| Unlimited Class 2 preference shares, non-voting, no par value, | ||||||||
| discretionary partly cumulative or non-cumulative dividends | ||||||||
| Issued and outstanding | ||||||||
| Common shares | ||||||||
| December 31, 2009: Issued and outstanding: 116,731,794 | ||||||||
| (December 31, 2008: Issued and outstanding: 110,084,044) | 11,260,415 | 6,762,097 | ||||||
During the year ended December 31, 2009, the Company completed the following issuances:
| Date | # | $ | ||||||
| Balance – December 31, 2008 | 110,084,044 | 6,762,097 | ||||||
| Exercise of stock options and retention warrants | 187,417 | 115,831 | ||||||
Issuance of Shares in connection with acquisition [note 3[i]] | 6,000,012 | 4,048,442 | ||||||
| Issuance of restricted share units | 52,498 | 31,631 | ||||||
| Issuance of Shares pursuant to Directors’ Compensation Plan | 407,823 | 250,657 | ||||||
| Release of Shares from escrow for services | — | 51,757 | ||||||
| Balance – December 31, 2009 | 116,731,794 | 11,260,415 | ||||||
K-53
NEULION, INC.
NOTES TO CONSOLIDATED FINANCIAL STATEMENTS
[Expressed in U.S. dollars, unless otherwise noted]
December 31, 2009
10. Stock Option and Stock-Based Compensation Plans
[i] Amended and Restated Stock Option Plan [the “Plan”]
The Plan applies to all grants of options to directors, officers, employees and consultants of the Company or any entity controlled by the Company. The exercise price for any new option granted under the Plan is determined by the closing price of the Company’s Shares prior to the grant date. If the option is granted on a pre-determined basis the exercise price is determined using the five-day volume weighted average price of the Company's Shares prior to the date of grant. In all cases the exercise price is not less than fair market value. Options are exercisable during a period established at the time of their grant provided that such period will expire no later than five years after the date of grant, subject to early termination of the option in the event the holder of the optio n dies or ceases to be a director, officer or employee of the Company or ceases to provide ongoing management or consulting services to the Company or entity controlled by the Company. The maximum number of Shares issuable upon exercise of options granted pursuant to the Plan is equal to the greater of [i] 4,000,000 Shares; and [ii] 12.5% of the number of issued and outstanding Shares.
A summary of stock option activity under the Plan is as follows:
| Weighted average | ||||||||
| exercise price | ||||||||
| # | $ | |||||||
| Outstanding, December 31, 2008 | 10,298,707 | 1.19 | ||||||
| Granted | 790,000 | 0.63 | ||||||
| Exercised | (180,354 | ) | 0.46 | |||||
| Forfeited | (2,250,456 | ) | 1.86 | |||||
| Outstanding, December 31, 2009 | 8,657,897 | 0.98 | ||||||
The following table summarizes stock option information of the Plan as at December 31, 2009:
| Weighted average | Aggregate | |||||||||||||||
| Exercise | Number | remaining | Number | intrinsic | ||||||||||||
| price | outstanding | contractual life | exercisable | value | ||||||||||||
| $ | # | [years] | # | $ | ||||||||||||
| 0.47 | 4,428,022 | 3.88 | 1,238,626 | 247,725 | ||||||||||||
| 0.58 | 50,000 | 3.50 | 50,000 | 4,500 | ||||||||||||
| 0.60 | 2,646,500 | 3.80 | 821,160 | 57,481 | ||||||||||||
| 0.64 | 30,000 | 3.25 | 13,121 | 394 | ||||||||||||
| 0.67 | 500,000 | 4.84 | 20,534 | — | ||||||||||||
| 0.88 | 40,000 | 4.63 | 3,723 | — | ||||||||||||
| 1.80 | 100,000 | 0.69 | 100,000 | — | ||||||||||||
| 2.50 | 175,000 | 1.24 | 171,167 | — | ||||||||||||
| 3.00 | 81,250 | 2.44 | 59,091 | — | ||||||||||||
| 4.00 | 17,500 | 1.32 | 16,111 | — | ||||||||||||
| 5.00 | 100,000 | 1.61 | 84,736 | — | ||||||||||||
| 6.05 | 450,000 | 2.27 | 243,566 | — | ||||||||||||
| 6.26 | 37,125 | 2.38 | 27,367 | — | ||||||||||||
| 6.43 | 2,500 | 1.94 | 1,915 | — | ||||||||||||
| 8,657,897 | 3.68 | 2,851,117 | 310,100 | |||||||||||||
K-54
NEULION, INC.
NOTES TO CONSOLIDATED FINANCIAL STATEMENTS
[Expressed in U.S. dollars, unless otherwise noted]
December 31, 2009
The aggregate intrinsic value in the table above represents the total pre-tax intrinsic value (the difference between the company’s closing stock price on the last trading day of fiscal 2009 and the exercise price, multiplied by the number of in-the-money options) that would have been received by the option holders had all option holders exercised their options on December 31, 2009. The amount changes based on the fair market value of the Company’s Shares.
For the year ended December 31, 2009 and 2008, $638,442 and $127,243, respectively, were recorded for total stock-based compensation expense related to stock options under the Plan. The weighted average exercise price of options exercisable as at December 31, 2009 was $1.42.
The Company estimates the fair value of stock options granted using a Black-Scholes-Merton option pricing model. The assumptions used in determining the fair value of stock options granted are as follows:
| Years ended December 31, | ||||
| 2009 | 2008 | |||
| Weighted average | ||||
| Exercise price of stock options granted | $0.46 | $0.51 | ||
| Fair value of stock options granted | $0.32 | $0.34 | ||
| Expected volatility | 98% | 79% | ||
| Risk-free interest rate | 1.97% | 2.26% | ||
| Expected life [years] | 4 | 4 | ||
| Dividend yield | 0% | 0% | ||
The exercise price of stock options is calculated using the five day volume weighted average price of the Company’s Shares on the Toronto Stock Exchange preceding the grant date. The Company estimates volatility based on a blended rate between the Company’s historical volatility and the volatility of comparable companies. The Company estimates the risk-free rate based on the federal reserve rate. The Company estimates the expected life of stock options to be four years for all option grants.
As at December 31, 2009, there was $2,304,070 of total unrecognized compensation cost related to non-vested stock options which is expected to be recognized over a weighted-average period of 2.68 years.
[ii] Restricted Share Plan
Restricted share units give the holder the right to one Share for each vested restricted share unit. These awards vest on a monthly basis over a 48-month period. The maximum number of restricted shares issuable shall be no greater than the equivalent of 1,000,000 Shares.
| A summary of restricted share activity under the restricted share plan is as follows: | ||||
| # | ||||
| Outstanding, December 31, 2008 | 59,222 | |||
| Vested and issued for Shares | (52,498 | ) | ||
| Outstanding, December 31, 2009 | 6,724 | |||
During the years ended December 31, 2009 and 2008, the Company recognized stock-based compensation expense of $31,631 and $6,518, respectively, related to its restricted share plan.
K-55
NEULION, INC.
NOTES TO CONSOLIDATED FINANCIAL STATEMENTS
[Expressed in U.S. dollars, unless otherwise noted]
December 31, 2009
[iii] Warrants
The Company granted to a channel partner 7,500 warrants with an expiry of five years from the date of issuance at an exercise price of $6.00 per warrant. For the years ended December 31, 2009 and 2008, no compensation expense was recognized related to these warrants as the total fair value of these warrants were previously recorded as part of the purchase price of a previous acquisition. These warrants expire on April 27, 2011.
The Company granted, as part of an acquisition, 10,000 warrants at an exercise price of $6.00 per warrant. Each warrant is exercisable into one Share, vest immediately and expires on May 31, 2011. The fair value of these warrants, in the amount of $229, was included in the purchase price of the Acquired Business.
In connection with the Company obtaining broadcast rights from a channel partner, the Company granted 100,000 warrants with an exercise price of $6.23 to purchase Shares of the Company. For the years ended December 31, 2009 and 2008, the Company expensed $920 and $182, respectively. These warrants expire on November 30, 2011.
The Company granted 50,000 warrants to a television manufacturer. The exercise price of these warrants will be determined based on meeting certain milestones. As at December 31, 2009, these milestones have not been met, therefore the measurement date has not occurred. Accordingly, for the years ended December 31, 2009 and 2008, no compensation expense was recognized related to these warrants. Each warrant is exercisable into one cShare of the Company, vests over four years and expires on August 3, 2012.
The Company issued 30,000 warrants to a sports media broadcaster at an exercise price of $2.20 per warrant. Each warrant is exercisable into one Share of the Company, vests immediately and expires on November 5, 2017. The fair value of these warrants in the amount of $7,341 was included as part of the purchase price of the Acquired Business.
On October 20, 2008, AvantaLion LLC, an entity controlled by Charles B. Wang, the Chairman of the Company, purchased 10,000,000 units from the Company’s treasury at a price of Cdn$1.00 per unit. Each unit (a "Unit") consists of one (1) Share and one-half of one Series A Share purchase warrant and one-half of one Series B Share purchase warrant. Each whole Series A Share purchase warrant is exercisable at Cdn$1.25, and each whole Series B Share purchase warrant is exercisable at Cdn$1.50, in each case for a period of two years from the date of grant. G. Scott Paterson, Vice Chairman of the Company, also purchased 1,000,000 Units on the same terms. The aggregate gross proceeds from the sale of Units were Cdn$11 million. Refer to Note 16 for further information.
On October 20, 2008, the Company granted 5,000,000 fully-vested warrants with an exercise price of $0.63 exercisable for two years to employees of the Company in connection with the Merger.
On October 31, 2009, the Company granted 1,000,000 Share purchase warrants to acquire Shares at $1.35 per share and 500,000 Share purchase warrants to acquire Shares at $1.80 per share in conjunction with the acquisition of INSINC. Both series of warrants are exercisable for a period of 2 years. The fair value of these warrants, in the amount of $338,750, has been included in the purchase price of INSINC.
The total stock-based compensation expense related to warrants during the years ended December 31, 2009 and 2008 was $920 and $1,678,896, respectively.
K-56
NEULION, INC.
NOTES TO CONSOLIDATED FINANCIAL STATEMENTS
[Expressed in U.S. dollars, unless otherwise noted]
December 31, 2009
A summary of the warrant activity is as follows:
| Weighted average | ||||||||
| exercise price | ||||||||
| # | $ | |||||||
| Outstanding, December 31, 2008 | 16,538,800 | 1.09 | ||||||
| Granted | 1,500,000 | 1.50 | ||||||
| Forfeited | (341,300 | ) | 4.04 | |||||
| Outstanding, December 31, 2009 | 17,697,500 | 1.07 | ||||||
The fair value of warrants was determined using the Black-Scholes-Merton option pricing model.
The following table summarizes the warrant information as at December 31, 2009:
| Weighted average | Aggregate | |||||||||||||||
| Exercise | Number | remaining | Number | intrinsic | ||||||||||||
| Price | outstanding | contractual life | exercisable | value | ||||||||||||
| $ | # | [years] | # | $ | ||||||||||||
| 0.63 | 5,000,000 | 0.80 | 5,000,000 | 200,000 | ||||||||||||
| 1.19 | 5,500,000 | 0.80 | 5,500,000 | — | ||||||||||||
| 1.35 | 1,000,000 | 1.84 | 1,000,000 | — | ||||||||||||
| 1.43 | 5,500,000 | 0.80 | 5,500,000 | — | ||||||||||||
| 1.80 | 500,000 | 1.84 | 500,000 | — | ||||||||||||
| 2.20 | 30,000 | 7.85 | 30,000 | — | ||||||||||||
| 6.00 | 17,500 | 1.34 | 17,059 | — | ||||||||||||
| 6.23 | 100,000 | 1.92 | 77,139 | — | ||||||||||||
| n/a | 50,000 | — | — | — | ||||||||||||
| 17,697,500 | 0.91 | 17,624,198 | 200,000 | |||||||||||||
The weighted fair value of warrants granted during the years ended December 31, 2009 and 2008 was, based on the following assumptions:
| Years ended December 31, | ||||
| 2009 | 2008 | |||
| Weighted average | ||||
| Exercise price of stock options granted | $1.50 | $0.99 | ||
| Expected volatility | 100% | 85% | ||
| Risk-free interest rate | 2.28% | 1.84% | ||
| Expected life [years] | 2 | 2 | ||
| Dividend yield | 0% | 0% | ||
As at December 31, 2009, there was $843 of total unrecognized compensation cost related to non-vested warrants which is expected to be recognized over a weighted-average period of 0.9 years.
K-57
NEULION, INC.
NOTES TO CONSOLIDATED FINANCIAL STATEMENTS
[Expressed in U.S. dollars, unless otherwise noted]
December 31, 2009
[iv] Retention Warrant Plan ["Warrant Plan"]
The Company’s retention warrant plan [the "Warrant Plan"] applies to all grants of retention warrants to employees and consultants of the Company or any entity controlled by the Company. The exercise price for any retention warrant granted under the Warrant Plan will be determined by the five-day average closing price of the Company's Shares prior to the date of grant but cannot be less than such a price. Retention warrants are exercisable during a period established at the time of their grant provided that such period will expire no later than five years after the date of grant, subject to early termination of the retention warrant in the event the holder of the retention warrant dies or ceases to be an employee or consultant of the Company or ceases to provide ongoing management or consulting services to the Company or entity controlled by the Company. The maximum number of Shares issuable upon exercise of retention warrants granted pursuant to the Warrant Plan is equal to 2,500,000 Shares.
A summary of the retention warrant activity during the year ended December 31, 2009 is as follows:
| Weighted average | ||||||||
| exercise price | ||||||||
| # | $ | |||||||
| Outstanding, December 31, 2008 | 1,350,440 | 2.68 | ||||||
| Exercised | (7,063 | ) | 0.65 | |||||
| Forfeited | (495,485 | ) | 2.72 | |||||
| Outstanding, December 31, 2009 | 847,892 | 2.67 | ||||||
The following table summarizes the retention warrant information as at December 31, 2009:
| Weighted average | Aggregate | |||||||||||||||
| Exercise | Number | remaining | Number | intrinsic | ||||||||||||
| price | outstanding | contractual life | exercisable | value | ||||||||||||
| $ | # | [years] | $ | $ | ||||||||||||
| 0.64 | 182,500 | 3.20 | 90,869 | 2,726 | ||||||||||||
| 0.70 | 111,642 | 3.29 | 47,047 | — | ||||||||||||
| 0.80 | 21,500 | 3.62 | 12,439 | — | ||||||||||||
| 3.86 | 532,250 | 2.64 | 313,353 | — | ||||||||||||
| 847,892 | 2.87 | 463,708 | 2,726 | |||||||||||||
There were no retention warrants granted during the years ended December 31, 2009 and 2008.
As at December 31, 2009, there was $65,943 of total unrecognized compensation cost related to non-vested retention warrants which is expected to be recognized over a weighted-average period of 1.9 years.
[v] Stock Appreciation Rights Plan ["SARS"]
The maximum number of units that can be granted under the SARS Plan is equivalent to the greater of 4,150,000 or 5% of the aggregate number of issued and outstanding Shares. The exercise price shall be determined by the Board of Directors at the time of grant but in no event shall the exercise price be lower than the market price of the Shares at the time of the grant. Each unit granted under the SARS Plan has a maximum life of five years from the date of the grant. The SARS Plan provides the unitholder the right to settle the award as follows:
K-58
NEULION, INC.
NOTES TO CONSOLIDATED FINANCIAL STATEMENTS
[Expressed in U.S. dollars, unless otherwise noted]
December 31, 2009
| [1] | Receive cash compensation less the exercise price or to purchase or receive an equivalent number of Shares, less the exercise price; |
| [2] | In lieu of receiving a cash settlement, the unitholder can elect to receive a number of Shares equal to the fair value of the Shares less the exercise price divided by the market value of the Shares from treasury; or |
| [3] | Elect to pay the Company the exercise price and receive Shares equal to the number of units granted under the SARS Plan from treasury. |
The Board of Directors has discretionary authority to accept or reject a cash payment request in whole or in part.
A summary of the SARS activity during the year ended December 31, 2009 is as follows:
| Weighted average | ||||||||
| exercise price | ||||||||
| # | $ | |||||||
| Outstanding, December 31, 2008 | 1,947,177 | 2.97 | ||||||
| Forfeited | (272,177 | ) | 5.03 | |||||
| Outstanding, December 31, 2009 | 1,675,000 | 2.63 | ||||||
The following table summarizes the SARS information as at December 31, 2009:
| Weighted average | Aggregate | |||||||||||||||
| Exercise | Number | remaining | Number | intrinsic | ||||||||||||
| price | outstanding | contractual life | exercisable | value | ||||||||||||
| $ | # | [years] | # | $ | ||||||||||||
| 0.60 | 475,000 | 3.81 | 142,077 | 9,945 | ||||||||||||
| 0.64 | 200,000 | 3.33 | 87,474 | 2,624 | ||||||||||||
| 4.00 | 1,000,000 | 1.24 | 1,000,000 | — | ||||||||||||
| 1,675,000 | 2.21 | 1,229,551 | 12,569 | |||||||||||||
The weighted fair value of stock appreciation rights granted during the year ended December 31, 2008 was $0.05 based on the following assumptions:
| Years ended December 31 | ||||
| 2009 | 2008 | |||
| Weighted average | ||||
| Exercise price of stock options granted | n/a | $0.60 | ||
| Expected volatility | n/a | 79% | ||
| Risk-free interest rate | n/a | 2.41 | ||
| Expected life [years] | n/a | 4 | ||
| Dividend yield | n/a | 0% | ||
K-59
NEULION, INC.
NOTES TO CONSOLIDATED FINANCIAL STATEMENTS
[Expressed in U.S. dollars, unless otherwise noted]
December 31, 2009
[vi] Directors’ Compensation Plan [“Directors’ Plan”]
Non-management directors of the Company receive a minimum 50% of their retainers and fees in the form of Shares and may elect to receive a greater portion of their retainers and fees in Shares. The number of Shares to be issued to non-management directors is determined by dividing the dollar value of the retainers and fees by the closing price of the Shares on the relevant payment date. The maximum number of Shares available to be issued by the Company under the Directors’ Plan is 500,000.
During the year ended December 31, 2009, the Company issued 407,823 Shares with a fair value of $250,657 in regards to fees and retainers to non-management directors. There were no comparable amounts in the prior year.
11. Loss per Share
Basic loss per share is computed by dividing net loss for the period by the weighted average number of Shares outstanding for the period. Diluted loss per share is computed by dividing net loss for the year by the weighted average number of Shares outstanding, and excludes the effect of dilutive potential Shares, as their inclusion would be anti-dilutive due to the losses recorded by the Company.
The following table summarizes the potential Shares that were outstanding as at December 31, 2009 and 2008 but were not included in the computation of diluted loss per share as their effect would have been anti-dilutive. See note 10 for additional details.
| 2009 | 2008 | |||||||
| # | # | |||||||
| Stock options | 8,657,897 | 10,298,707 | ||||||
| Restricted share units | 6,724 | 59,222 | ||||||
| Stock appreciation rights | 1,675,000 | 1,947,177 | ||||||
| Warrants | 17,697,500 | 16,538,800 | ||||||
| Retention warrants | 847,892 | 1,350,440 | ||||||
| Contingent performance consideration | — | 3,680,194 | ||||||
12. Supplemental Cash Flow Information
For each of the years presented, the Company did not pay any cash income taxes or cash interest expense.
13. Commitments and Contingencies
Commitments
The Company has operating lease commitments for its premises in the United States (Plainview, New York; New York, New York; and Sanford, Florida), Canada (Toronto, Ontario and Vancouver, British Columbia) and England (London). In addition, the Company has operating leases for certain computer hardware and infrastructure equipment. Furthermore, the Company has marketing and content license fee commitments to channel partners. Future minimum annual payments over the next five years and thereafter (exclusive of taxes, insurance and maintenance costs) under these commitments are as follows:
K-60
NEULION, INC.
NOTES TO CONSOLIDATED FINANCIAL STATEMENTS
[Expressed in U.S. dollars, unless otherwise noted]
December 31, 2009
| $ | ||||
| 2010 | 3,185,943 | |||
| 2011 | 1,506,912 | |||
| 2012 | 1,304,364 | |||
| 2013 | 809,256 | |||
| 2014 | 86,080 | |||
| Thereafter | 281,627 | |||
| 7,174,182 |
Rent expense for the years ended December 31, 2009 and 2008 was $955,420 and $448,854, respectively.
The Company has signed a sublease for its Toronto office, which is expected to create a total recovery of $5,243,517.
Contingencies
During the ordinary course of business activities, the Company may be contingently liable for litigation and a party to claims. Management believes that adequate provisions have been made in the accounts where required. Although the extent of potential costs and losses, if any is uncertain, management believes that the ultimate resolution of such contingencies will not have an adverse effect on the consolidated financial position or results of operations of the Company.
14. Segmented Information
The Company operates, as one reportable segment, to provide end-to-end enterprise-level IPTV and other professional services. Substantially all of Company’s revenues and long-lived assets are in the United States.
15. Income Taxes
The reconciliation of income taxes computed at the Canadian statutory tax rate to the Company’s effective income tax rate for the years ended December 31, 2009 and 2008 is as follows:
| 2009 | 2008 | |||||||
| $ | $ | |||||||
| Combined basic federal and provincial rates | 33.0% | 33.5% | ||||||
| Income tax benefit based on statutory income tax rate | (6,481,504 | ) | (3,898,482 | ) | ||||
| Increase in income taxes resulting from: | ||||||||
| Non-deductible expenses and foreign rate differential | 409,699 | 631,824 | ||||||
| Income while Company was an S Corp. and not subject to tax | — | 1,597,396 | ||||||
| Increase in valuation allowance | 6,071,805 | 1,669,262 | ||||||
| Income tax expense | — | — | ||||||
The increase in valuation allowance consists of the creation of additional tax losses which have not been recognized for accounting purposes.
K-61
NEULION, INC.
NOTES TO CONSOLIDATED FINANCIAL STATEMENTS
[Expressed in U.S. dollars, unless otherwise noted]
December 31, 2009
Deferred income taxes result principally from temporary differences in the recognition of loss carry forwards and expense items for financial and income tax reporting purposes. Significant components of the Company’s deferred tax assets as of December 31, 2009 and 2008 were as follows:
| December 31, | December 31, | |||||||
| 2009 | 2008 | |||||||
| $ | $ | |||||||
| Deferred revenue | 1,722,245 | 1,129,610 | ||||||
| Property, plant and equipment | 2,423,828 | 1,177,388 | ||||||
| Intangible assets | (291,668 | ) | 426,542 | |||||
| Share issue costs | 1,754,781 | 3,143,219 | ||||||
| Net operating losses | 29,540,867 | 22,155,774 | ||||||
| 35,150,053 | 28,032,533 | |||||||
| Valuation allowance | (35,150,053 | ) | (28,032,533 | ) | ||||
| Total deferred tax assets | — | — | ||||||
The Company has approximately $93,368,139 in non-capital tax losses available to be applied against future years' income, which expire as follows:
| $ | ||||
| 2010 | 198,000 | |||
| 2026 | 21,263,325 | |||
| 2027 | 25,544,598 | |||
| 2028 | 28,851,457 | |||
| 2029 | 17,510,759 | |||
| 93,368,139 |
Due to the losses incurred since inception and expected future operating results, a 100% valuation allowance has been recorded against the Company's net deferred tax assets as it is more likely than not that the future tax asset resulting from the tax losses available for carry-forward will not be realized through the reduction of future income tax payments.
The Company does not have any uncertain tax provisions under ASC 740.
16. Derivative Instruments
The Company’s only derivative instruments are 11,000,000 warrants, the exercise price for which are denominated in a currency other than the Company’s functional currency, as follows:
| · | 5,500,000 Series A warrants exercisable at Cdn$1.25 that expire on October 20, 2010. |
| · | 5,500,000 Series B warrants exercisable at Cdn$1.50 that expire on October 20, 2010. |
These warrants have been recorded at their relative fair values at issuance and will continue to be recorded at fair value at each subsequent balance sheet date. Any change in value between reporting periods will be recorded as other income (expense). These warrants will continue to be reported as a liability until such time as they are exercised or expire. The fair value of these warrants is estimated using the Black-Scholes-Merton option-pricing model.
K-62
NEULION, INC.
NOTES TO CONSOLIDATED FINANCIAL STATEMENTS
[Expressed in U.S. dollars, unless otherwise noted]
December 31, 2009
As of January 1, 2009, the grant date fair value of these warrants in the amount of $2,464,000 was reallocated from additional paid-in-capital and a derivative liability was recorded in the amount of $587,950, being the fair value of the warrants on January 1, 2009 offset by an adjustment to accumulated deficit of $1,876,050.
As of December 31, 2009, the fair value of the warrants was determined to be $1,389,300; accordingly, the Company recorded $801,350 in other expense for the year ended December 31, 2009, respectively, related to the change in the fair value of these warrants. There is no cash flow impact for these derivatives until the warrants are exercised. If these warrants are exercised, the Company will receive the proceeds from the exercise at the current exchange rate at the time of exercise.
17. Reconciliation of U.S. GAAP to Canadian GAAP
The consolidated financial statements of the Company are prepared in U.S. dollars in accordance with U.S. GAAP. The following adjustments and disclosures would be required in order to present these consolidated financial statements in accordance with Canadian GAAP:
Reconciliation to Canadian GAAP
Income Statements Items using Canadian GAAP
| 2009 | 2008 | |||||
| $ | $ | |||||
| NET LOSS USING UNITED STATES GAAP | (19,640,921 | ) | (11,637,260 | ) | ||
| Add (deduct) adjustments for: | ||||||
| Adjustment for stock based compensation on SARS[i] | 131,343 | 16,599 | ||||
| Adjustment for unrealized loss on derivative [ii] | 801,350 | — | ||||
| NET LOSS USING CANADIAN GAAP | (18,708,228 | ) | (11,620,661 | ) | ||
| NET AND COMPREHENSIVE LOSS PER SHARE | ||||||
| USING CANADIAN GAAP - basic and diluted | $(0.17 | ) | $(0.21 | ) | ||
| Balance Sheet Items using Canadian GAAP | ||||||||||||||||
| 2009 | 2008 | |||||||||||||||
| U.S. | Canadian | U.S. | Canadian | |||||||||||||
| GAAP | GAAP | GAAP | GAAP | |||||||||||||
| $ | $ | $ | $ | |||||||||||||
| Accrued liabilities [i] | 5,822,385 | 5,662,128 | 7,595,116 | 7,578,517 | ||||||||||||
| Derivative liability [ii] | 1,389,300 | — | — | — | ||||||||||||
| Total current liabilities [i] | 16,801,308 | 15,251,751 | 15,209,323 | 15,192,724 | ||||||||||||
| Total liabilities [i] | 17,998,829 | 16,449,272 | 16,724,104 | 16,707,505 | ||||||||||||
| Accumulated deficit [i] | (43,804,398 | ) | (44,731,156 | ) | (26,039,527 | ) | (26,022,928 | ) | ||||||||
| Total shareholders’ equity [i] | 22,270,334 | 23,807,576 | 37,013,578 | 37,030,177 | ||||||||||||
K-63
NEULION, INC.
NOTES TO CONSOLIDATED FINANCIAL STATEMENTS
[Expressed in U.S. dollars, unless otherwise noted]
December 31, 2009
Cash Flows Items using Canadian GAAP
| 2009 | 2008 | |||||||||||||||
| U.S. | Canadian | U.S. | Canadian | |||||||||||||
| GAAP | GAAP | GAAP | GAAP | |||||||||||||
| $ | $ | $ | $ | |||||||||||||
| Net loss [ii] | (19,640,921 | ) | (18,708,228 | ) | (11,637,260 | ) | (11,620,661 | ) | ||||||||
| Stock-based compensation [ii] | 1,167,789 | 1,036,446 | 1,848,906 | 1,832,307 | ||||||||||||
Areas of material difference between Canadian GAAP and U.S. GAAP and their impact on the consolidated financial statements are as follows:
[i] SARs
| · | Under U.S. GAAP, the Company recognizes a liability and compensation expense for the fair value of the SARs on each reporting date. |
| · | Under Canadian GAAP, the Company recognizes a liability and compensation expense for the “in the money” value of the SARs on each reporting date. |
[ii] Derivative Liability
| · | Canadian Institute of Chartered Accountants (“CICA”) Handbook Section 3861, Financial Instruments – Disclosure and Presentation, establishes standards for presentation of financial instruments and non-financial derivatives, and identifies the information that should be disclosed about them. The revisions change the accounting for certain financial instruments that have liability and equity characteristics. |
| · | Under U.S. GAAP, the Company recognizes a derivative liability on the consolidated balance sheets for the fair value of all convertible instruments with an exercise price denominated in a currency other than the Company’s functional currency. The Company fair values this liability on each reporting date with the corresponding entry to unrealized gain (loss) on derivative on the consolidated statement of operations. |
| · | Under Canadian GAAP, the Company records these convertible instruments at fair value on the grant date and includes them within additional paid in capital on the consolidated balance sheets. The Company does not recognize any changes in fair value. |
K-64
NEULION, INC.
NOTES TO CONSOLIDATED FINANCIAL STATEMENTS
[Expressed in U.S. dollars, unless otherwise noted]
December 31, 2009
CICA Handbook Section 1535 – Capital Disclosures
The Company manages the following accounts in regards to capital management:
| December 31, | December 31, | |||||||
| 2009 | 2008 | |||||||
| $ | $ | |||||||
| Shareholders' equity | ||||||||
| Share capital | 11,260,415 | 6,762,097 | ||||||
| Additional paid in capital | 55,023,567 | 56,500,258 | ||||||
| Promissory note receivable | (209,250 | ) | (209,250 | ) | ||||
| Accumulated deficit | (43,804,398 | ) | (26,039,527 | ) | ||||
| 22,270,334 | 37,013,578 | |||||||
(the figures in the table above are in accordance with U.S. GAAP)
The Company’s outstanding share capital is comprised of Shares. At December 31, 2009, an unlimited number of Shares were authorized and 116,731,794 (December 2008 − 110,084,044) Shares were issued and outstanding. Approximately 57% of the Shares are held by insiders, and the remaining shares are widely held. Further information on the Company’s outstanding share capital is provided in note 9 of these consolidated financial statements.
At December 31, 2009, a total of 8,657,897 stock options were outstanding, 6,724 restricted share units, 17,697,500 warrants, 847,892 retention warrants and 1,675,000 SARs, which convertible securities cumulatively represented 25% of the Company’s issued and outstanding share capital. Pursuant to guidelines set by the Company’s respective equity plans, stock option grants are limited to the greater of 12.5% of the issued and outstanding Shares outstanding and 4,000,000, restricted share unit grants have been fully granted, r etention warrants are limited to 2,500,000 and SARs grants are limited to the greater of 5% of the issued and outstanding Shares and 4,150,000. The Company is currently in compliance with these guidelines.
The Company’s objective in managing capital is to ensure a sufficient liquidity position to finance its revenue growth, general and administrative expenses, working capital and capital expenditures.
In order to maintain or adjust its capital structure, the Company may issue new shares and/or purchase shares for cancellation pursuant to normal course issuer bids.
To finance its activities, the Company has relied on revenue growth and issuance of common equity. Since inception, the Company has financed its activities primarily through public offerings of Shares.
The Company’s policy is to maintain a minimal level of debt. At this time the Company has not utilized debt facilities as part of its capital management program nor has it paid dividends to its shareholders.
The capital management objectives for the period ended December 31, 2009 remained the same as those of the previous fiscal year.
The Company is not subject to any externally imposed capital requirements.
K-65
NEULION, INC.
NOTES TO CONSOLIDATED FINANCIAL STATEMENTS
[Expressed in U.S. dollars, unless otherwise noted]
December 31, 2009
CICA Handbook Sections 3862 and 3863 – Financial Instruments – Disclosures and Presentation
The Company's financial instruments are comprised of cash and cash equivalents, short-term investments, accounts receivable, interest receivable, other receivables, accounts payable, other accrued liabilities, amounts due to/from related party, notes payable and obligations under capital lease.
The fair value of a financial instrument is defined as the amount at which the instrument could be exchanged in a current transaction between willing parties.
The fair value of assets and liabilities were as follows:
| December 31, | December 31, | |||||||
| 2009 | 2008 | |||||||
| $ | $ | |||||||
| Financial Assets | ||||||||
| Held-for-Trading | ||||||||
| Cash and cash equivalents | 12,957,679 | 27,323,021 | ||||||
| Loans and Receivables | ||||||||
| Accounts receivable | 1,809,147 | 2,284,242 | ||||||
| Other receivables | 821,834 | 227,711 | ||||||
| Due from related parties | 246,992 | 324,059 | ||||||
| Financial Liabilities | ||||||||
| Other Financial Liabilities | ||||||||
| Accounts payable | 5,383,518 | 4,465,388 | ||||||
| Accrued liabilities | 5,822,385 | 7,595,116 | ||||||
| Due to related parties | 298,595 | 56,826 | ||||||
All fair values denoted above approximate their carrying values due to their short term nature and/or variable interest rates.
Risk management is primarily the responsibility of the Company’s corporate finance function. Significant risks are regularly monitored and actions are taken, when appropriate, according to the Company’s approved policies, established for that purpose. In addition, as required, these risks are reviewed with the Company’s Board of Directors.
Foreign Exchange Risk
The Company is exposed to foreign exchange risk as a result of transactions in currencies other than its functional currency of the United States dollar. The majority of the Company’s revenues are transacted in U.S. dollars, whereas a portion of its expenses are transacted in U.S. or Canadian dollars. The Company does not use derivative instruments to hedge against foreign exchange risk.
Interest Rate Risk
The Company is exposed to interest rate risk on its invested cash and cash equivalents. The interest rates on these instruments are based on the banks’ applicable rate and therefore are subject to change with the market. The Company does not use derivative financial instruments to reduce its interest rate risk.
K-66
NEULION, INC.
NOTES TO CONSOLIDATED FINANCIAL STATEMENTS
[Expressed in U.S. dollars, unless otherwise noted]
December 31, 2009
Credit Risk
The Company sells its services to a variety of customers under various payment terms and therefore is exposed to credit risk. The Company has adopted policies and procedures designed to limit this risk. The maximum exposure to credit risk at the reporting date is the carrying value of receivables. The Company establishes an allowance for doubtful accounts that represents its estimate of incurred losses in respect of accounts receivable. The Company believes that the concentration of credit risk is limited due to the Company’s primary source of revenues to date being subscription revenues, for which monies are received in advance principally through credit cards.
There is no significant credit risk related to the Company's cash and cash equivalents. Credit risk is managed through conducting financial and other assessments of these investments on an ongoing basis.
The following table sets out details of the age of accounts receivable that are outstanding and related allowance for doubtful accounts:
| December 31, | December 31, | |||||||
| 2009 | 2008 | |||||||
| $ | $ | |||||||
| Current | 938,298 | 1,697,271 | ||||||
| 31-60 days | 409,804 | 287,070 | ||||||
| 61-90 days | 262,836 | 105,525 | ||||||
| Over 90 days | 327,759 | 484,914 | ||||||
| Less: Allowance for doubtful accounts | (129,550 | ) | (290,538 | ) | ||||
| Total accounts receivable, net | 1,809,147 | 2,284,242 | ||||||
The carrying amount of accounts receivable is reduced through the use of an allowance account and the amount of the loss is recognized in the consolidated statements of operations and comprehensive loss. When a receivable balance is considered uncollectible, it is written off against the allowance for accounts receivable. Subsequent recoveries of amounts previously written off are credited against operating expenses in the consolidated statements of operations and comprehensive loss.
In addition, recent Canadian GAAP accounting pronouncements that may impact the Company's financial position and results of operations and disclosure requirements are as follows:
Recent Accounting Pronouncements
In February 2008, the CICA issued new Handbook Section 3064, Goodwill and Intangible Assets, which replaces Section 3062, Goodwill and Other Intangible Assets, and Section 3450, Research and Development Costs. The new standard addresses when an internally developed intangible asset meets the criteria for recognition as an asset. The section also issued amendments to Section 1000, Financial Statement Concepts. These changes are effective for fiscal years beginning on or after October 1, 2008, with earlier adoption permitted, and have been adopted by the Company effective January 1 , 2009. The objectives of the changes are to reinforce a principle-based approach to the recognition of costs as assets and to clarify the application of the concept of matching revenues and expenses in Section 1000. Collectively, these changes bring Canadian practice closer to International Financial Reporting Standards (“IFRS”) by eliminating the practice of recognizing as assets a variety of start-up, pre-production and similar costs that do not meet the definition and recognition criteria of an asset. There was no material effect on the Company’s consolidated financial statements as a result of adopting CICA Handbook Section 3064.
K-67
NEULION, INC.
NOTES TO CONSOLIDATED FINANCIAL STATEMENTS
[Expressed in U.S. dollars, unless otherwise noted]
December 31, 2009
In February 2008, the CICA Accounting Standards Board confirmed that the changeover to IFRS from Canadian GAAP will be required for publicly accountable enterprises, effective for the interim and annual financial statements relating to fiscal years beginning on or after January 1, 2011. The Company became an SEC issuer effective June 8, 2009 and expects to continue to use U.S. GAAP until the date that IFRS is implemented in the United States, which is currently estimated to occur no sooner than 2014.
Effective January 1, 2009 the Company adopted CICA Handbook Section 1582 “Business Combinations” which replaces Section 1581. This standard establishes the principles and requirements of the acquisition method for business combination and related disclosures and applies prospectively to business combinations for which the acquisition date.
Effective January 1, 2009, the Company adopted CICA Handbook Section 1601 “Consolidated Financial Statements” and section 1602 “Non-controlling Interest” which replace Section 1600. Section 1601 establishes standards for the preparation of consolidated financial statements. Section 1602 provides guidance on accounting for a non-controlling interest in a subsidiary in consolidated financial statements subsequent to a business combination. The adoption of Sections 1582, 1601, and 1602 did not materially impact the Company's consolidated financial statements as the provisions of these standards are substantially similar to the Company's accounting in accordance with U.S. GAAP.
K-68
NeuLion Interim Financial Statements
NeuLion, Inc.
Consolidated Financial Statements
March 31, 2010 and December 31, 2009
(Stated in US Dollars)
K-69
CONSOLIDATED BALANCE SHEETS
[Expressed in U.S. dollars, unless otherwise noted]
| March 31, | December 31, | |||||||
| 2010 | 2009 | |||||||
| [unaudited] | [audited] | |||||||
| $ | $ | |||||||
| ASSETS | ||||||||
| Current | ||||||||
| Cash and cash equivalents | 7,790,483 | 12,957,679 | ||||||
Accounts receivable, net of allowance for doubtful accounts of $186,302 and $129,550, | ||||||||
| respectively | 1,934,129 | 1,844,481 | ||||||
| Other receivables | 790,155 | 821,834 | ||||||
| Inventory | 552,243 | 928,592 | ||||||
| Prepaid expenses and deposits | 1,167,924 | 966,101 | ||||||
Due from related parties [note 5] | 208,050 | 246,992 | ||||||
| Total current assets | 12,442,984 | 17,765,679 | ||||||
| Property, plant and equipment, net | 5,319,973 | 5,754,255 | ||||||
| Intangible assets, net | 8,997,673 | 9,542,071 | ||||||
| Goodwill | 6,757,194 | 6,757,194 | ||||||
| Other assets | 485,533 | 449,964 | ||||||
| Total assets | 34,003,357 | 40,269,163 | ||||||
| LIABILITIES AND SHAREHOLDERS' EQUITY | ||||||||
| Current | ||||||||
| Accounts payable | 3,969,950 | 5,383,518 | ||||||
| Accrued liabilities | 5,612,260 | 5,822,385 | ||||||
Derivative liability [note 11] | 389,400 | 1,389,300 | ||||||
Due to related parties [note 5] | 109,686 | 298,595 | ||||||
| Deferred revenue | 3,785,884 | 3,907,510 | ||||||
| Total current liabilities | 13,867,180 | 16,801,308 | ||||||
| Long-term deferred revenue | 505,634 | 469,191 | ||||||
| Other long-term liabilities | 654,276 | 728,330 | ||||||
| Total liabilities | 15,027,090 | 17,998,829 | ||||||
| Shareholders' equity | ||||||||
| Share capital | 11,287,406 | 11,260,415 | ||||||
| Common shares (par value: none; authorized: unlimited; issued and outstanding: | ||||||||
116,751,942 and 116,731,794, respectively) | ||||||||
| Additional paid-in capital | 55,214,311 | 55,023,567 | ||||||
| Promissory notes receivable | (209,250 | ) | (209,250 | ) | ||||
| Accumulated deficit | (47,316,200 | ) | (43,804,398 | ) | ||||
| Total shareholders' equity | 18,976,267 | 22,270,334 | ||||||
| Total liabilities and shareholders' equity | 34,003,357 | 40,269,163 | ||||||
See accompanying notes
K-70
CONSOLIDATED STATEMENTS OF OPERATIONS AND
COMPREHENSIVE LOSS
[unaudited]
[Expressed in U.S. dollars, unless otherwise noted]
Three months ended March 31, | ||||||||
| 2010 | 2009 | |||||||
| $ | $ | |||||||
| Revenue | ||||||||
| Services revenue | 7,462,899 | 6,034,330 | ||||||
| Equipment revenue | 381,596 | 539,696 | ||||||
| 7,844,495 | 6,574,026 | |||||||
| Costs and Expenses | ||||||||
| Cost of services revenue, exclusive of depreciation and | 3,364,407 | 3,383,879 | ||||||
| amortization shown separately below | ||||||||
| Cost of equipment revenue | 354,690 | 460,604 | ||||||
Selling, general and administrative, including stock-based compensation [note 8] | 7,332,912 | 7,173,340 | ||||||
| Depreciation and amortization | 1,276,965 | 1,014,681 | ||||||
| 12,328,974 | 12,032,504 | |||||||
| Operating loss | (4,484,479 | ) | (5,458,478 | ) | ||||
| Other income (expense) | ||||||||
Unrealized gain (loss) on derivative [note 11] | 999,900 | (476,850 | ) | |||||
| (Loss) gain on foreign exchange | (49,129 | ) | 44,226 | |||||
| Investment income | 21,906 | 97,224 | ||||||
| 972,677 | (335,400 | ) | ||||||
| Net and comprehensive loss for the period | (3,511,802 | ) | (5,793,878 | ) | ||||
| Net loss per weighted average number of shares | ||||||||
outstanding - basic and diluted [note 6] | $(0.03 | ) | $(0.05 | ) | ||||
| Weighted average number of shares | ||||||||
outstanding - basic and diluted [note 6] | 116,742,433 | 110,089,579 | ||||||
See accompanying notes
K-71
CONSOLIDATED STATEMENT OF SHAREHOLDERS' EQUITY
[unaudited]
[Expressed in U.S. dollars, unless otherwise noted]
| Total | ||||||||||||||||||||||||
| Additional | Promissory | Accumulated | shareholders' | |||||||||||||||||||||
| Common shares | paid-in capital | Notes | deficit | equity | ||||||||||||||||||||
| # | $ | $ | $ | $ | $ | |||||||||||||||||||
| Balance, December 31, 2009 | 116,731,794 | 11,260,415 | 55,023,567 | (209,250 | ) | (43,804,398 | ) | 22,270,334 | ||||||||||||||||
| Exercise of stock options for | ||||||||||||||||||||||||
| common shares | 15,312 | 11,559 | (4,362 | ) | — | — | 7,197 | |||||||||||||||||
| Stock-based compensation: | ||||||||||||||||||||||||
| Issuance of common shares on | ||||||||||||||||||||||||
| vesting of restricted share units | 4,836 | 2,929 | — | — | — | 2,929 | ||||||||||||||||||
| Release of common shares from | ||||||||||||||||||||||||
| escrow for services | — | 12,503 | — | — | — | 12,503 | ||||||||||||||||||
| Stock options and warrants | — | — | 195,106 | — | — | 195,106 | ||||||||||||||||||
| Net loss | — | — | — | — | (3,511,802 | ) | (3,511,802 | ) | ||||||||||||||||
| Balance, March 31, 2010 | 116,751,942 | 11,287,406 | 55,214,311 | (209,250 | ) | (47,316,200 | ) | 18,976,267 | ||||||||||||||||
See accompanying notes
K-72
CONSOLIDATED STATEMENTS OF CASH FLOWS
[unaudited]
[Expressed in U.S. dollars, unless otherwise noted]
Three months ended March 31, | ||||||||
| 2010 | 2009 | |||||||
| $ | $ | |||||||
| OPERATING ACTIVITIES | ||||||||
| Net loss | (3,511,802 | ) | (5,793,878 | ) | ||||
| Adjustments to reconcile net loss to cash used in operating activities | ||||||||
| Depreciation and amortization | 1,276,965 | 1,014,681 | ||||||
Stock-based compensation [note 8] | 207,257 | 253,743 | ||||||
Unrealized (gain) loss on derivative [note 11] | (999,900 | ) | 476,850 | |||||
| Changes in operating assets and liabilities | ||||||||
| Accounts receivable | (120,910 | ) | 432,869 | |||||
| Inventory | 376,349 | (35,620 | ) | |||||
| Prepaid expenses, deposits and other assets | (237,392 | ) | 96,785 | |||||
| Other receivables | 62,941 | (169,209 | ) | |||||
| Due from related parties | 38,942 | (301,620 | ) | |||||
| Accounts payable | (1,413,568 | ) | (1,226,057 | ) | ||||
| Accrued liabilities | (206,844 | ) | (124,851 | ) | ||||
| Deferred revenue | (85,183 | ) | (137,384 | ) | ||||
| Long-term liabilities | (74,054 | ) | (102,639 | ) | ||||
| Due to related parties | (188,909 | ) | 243,581 | |||||
| Cash used in operating activities | (4,876,108 | ) | (5,372,749 | ) | ||||
| INVESTING ACTIVITIES | ||||||||
| Purchase of property, plant and equipment | (298,285 | ) | (382,404 | ) | ||||
| Cash used in investing activities | (298,285 | ) | (382,404 | ) | ||||
| FINANCING ACTIVITIES | ||||||||
| Proceeds from exercise of stock options | 7,197 | — | ||||||
| Cash provided by financing activities | 7,197 | — | ||||||
| Net decrease in cash and cash equivalents during the period | (5,167,196 | ) | (5,755,153 | ) | ||||
| Cash and cash equivalents, beginning of period | 12,957,679 | 27,323,021 | ||||||
| Cash and cash equivalents, end of period | 7,790,483 | 21,567,868 | ||||||
See accompanying notes
K-73
NOTES TO CONSOLIDATED FINANCIAL STATEMENTS
[Expressed in U.S. dollars, unless otherwise noted]
Information as at March 31, 2010 and for the three months ended
March 31, 2010 and 2009 is unaudited
1. Nature of Operations
On June 4, 2009, NeuLion, Inc. changed its name to NeuLion USA Inc. (“NeuLion USA”). On July 13, 2009, JumpTV Inc. changed its name to NeuLion, Inc. (“NeuLion” or the “Company”). In conjunction with the name change, NeuLion’s stock symbol on the Toronto Stock Exchange was changed from “JTV” to “NLN”. This Quarterly Report on Form 10-Q reflects the name changes described above as they are effective as of the date of filing this report.
The Company is a leading Internet Protocol (“IP”) television company, providing end-to-end IPTV services. “IPTV” refers to the distribution over an IP network of streamed audio, video and other multimedia content, similar to television programming content, using industry-standard streaming protocols. The Company builds and manages private networks for content owners and aggregators (its content partners) that are used to stream content, including live and on-demand sports and international and variety programming, which the Company then delivers to subscribers and pay-per-view customers for viewing on Internet-connected browser-based devices such as personal computers, laptops and mobile devices and on standard television sets through Internet-connected set top boxes (“STBs”). N euLion’s main business objective is to enter into agreements with companies seeking their own private networks to reach target audiences and to provide complete IPTV services to these companies. The Company also acquires the rights to certain sports and international content from television broadcasters (its channel partners), which the Company then streams to end users through its own private networks.
2. Basis of Presentation and Significant Accounting Policies
The Company’s accounting policies are consistent with those presented in our annual consolidated financial statements as at December 31, 2009. These interim unaudited consolidated financial statements do not include all footnote disclosures required by U.S. generally accepted accounting principles ["GAAP"] for annual financial statements and therefore should be read in conjunction with the audited consolidated financial statements, including the notes thereto, for the year ended December 31, 2009 as filed in the Company’s Annual Report on Form 10-K.
The preparation of these financial statements is in conformity with U.S. GAAP, which requires management to make certain estimates that affect the reported amounts in the interim unaudited consolidated financial statements, and the disclosures made in the accompanying notes. Despite the Company’s intention to establish accurate estimates and use reasonable assumptions, actual results may differ from these estimates. All significant intercompany transactions and accounts have been eliminated on consolidation.
In the opinion of management, these interim unaudited consolidated financial statements contain all of the adjustments of a normal and recurring nature necessary to present fairly the Company’s financial position as at March 31, 2010 and December 31, 2009 and the results of operations and cash flows for the three-month periods ended March 31, 2010 and 2009.
Recently issued accounting standard
In October 2009, the Financial Accounting Standards Board issued ASU 2009-13, “Multiple-Deliverable Revenue Arrangements” (“ASU 2009-13”). ASU 2009-13 amends guidance included within ASC Topic 605-25 to require an entity to use an estimated selling price when vendor specific objective evidence or acceptable third party evidence does not exist for any products or services included in a multiple element arrangement. The arrangement consideration should be allocated among the products and services based upon their relative selling prices, thus eliminating the use of the residual method of allocation. ASU 2009-13 also requires expanded qualitative and quantitative disclosures regarding significant judgments made and changes in applying this guidance. ASU 2009-13 is effective prospectively for revenue arrangements entered into or materially modified in fiscal years beginning on or after June 15, 2010. Early adoption and retrospective application are also permitted. The Company is currently evaluating the impact of adopting the provisions of ASU 2009-13.
K-74
NEULION, INC.
NOTES TO CONSOLIDATED FINANCIAL STATEMENTS
[Expressed in U.S. dollars, unless otherwise noted]
Information as at March 31, 2010 and for the three months ended
March 31, 2010 and 2009 is unaudited
Advertising
Advertising costs are expensed as incurred and totaled $246,592 and $180,344 for the three months ended March 31, 2010 and 2009, respectively
Comparative Information
Certain prior period information was reclassified to conform with the current period’s presentation.
3. Business Combination
On October 31, 2009, the Company consummated the acquisition of 100% of the outstanding securities of Interactive Netcasting Systems Inc. (“INSINC”). Under the terms of the acquisition agreement, shareholders of INSINC received consideration consisting of 6,000,012 common shares of the Company, CDN$2.5 million in cash, 1,000,000 Share purchase warrants to acquire common shares at US$1.35 per common share and 500,000 Share purchase warrants to acquire common shares at US$1.80 per common share. Both series of warrants are exercisable for a period of two years. In addition, the Company incurred approximately $515,000 of direct transaction costs.
Pro forma
The results of operations for INSINC have been included in the Company’s consolidated statements of operations since the effective date of the acquisition on October 31, 2009. The following unaudited pro forma financial information presents the combined results of the Company and the acquisition as if the acquisition had occurred at the beginning of 2009:
| March 31, | March 31, | |||||||
| 2010 | 2009 | |||||||
| $ | $ | |||||||
| [unaudited | [unaudited | |||||||
| actual] | pro forma] | |||||||
| Total revenue | 7,844,495 | 7,906,742 | ||||||
Total cost of services revenue, exclusive of depreciation and | ||||||||
| amortization shown separately below | (3,364,407 | ) | (4,240,507 | ) | ||||
Total cost of equipment revenue | (354,690 | ) | (460,604 | ) | ||||
| Total selling, general and administrative expenses | (7,125,655 | ) | (7,280,866 | ) | ||||
| Stock-based compensation | (207,257 | ) | (253,743 | ) | ||||
| Depreciation and amortization | (1,276,965 | ) | (1,326,090 | ) | ||||
| Operating loss | (4,484,479 | ) | (5,655,068 | ) | ||||
| Net loss | (3,511,802 | ) | (5,990,468 | ) | ||||
| Net loss per weighted average number of shares | ||||||||
| outstanding – basic and diluted | (0.03 | ) | (0.05 | ) | ||||
In determining the pro forma amounts above, the Company made adjustments to depreciation and amortization as a result of the revised fair values of tangible and intangible assets performed as a result of the acquisition.
K-75
NEULION, INC.
NOTES TO CONSOLIDATED FINANCIAL STATEMENTS
[Expressed in U.S. dollars, unless otherwise noted]
Information as at March 31, 2010 and for the three months ended
March 31, 2010 and 2009 is unaudited
4. Economic Dependence and Concentration of Credit Risk
For the three months ended March 31, 2009, one customer accounted for 12% of revenue.
There were no significant concentrations of revenue in 2010.
5. Related Party Transactions
The Company has entered into certain transactions and agreements in the normal course of operations with related parties. Significant related party transactions are as follows:
TransVideo International, Ltd. (“TransVideo”)
TransVideo is a company controlled by the Chairman of the Board of Directors of the Company that designs and sells equipment and technology for IPTV content delivery. STB purchases amounted to $18,628 and $395,280 and transcoder licensing fees paid amounted to zero and $28,000 for the three months ended March 31, 2010 and 2009, respectively. Included in cost of equipment revenue is the cost of STBs sold of $111,996 and $369,160 for the three months ended March 31, 2010 and 2009, respectively.
KyLinTV, Inc. (“KyLinTV”)
KyLinTV is an IPTV company that is controlled by the Chairman of the Board of Directors of the Company. On June 1, 2008, the Company entered into an agreement with KyLinTV to build and deliver the setup and back office operation of an IPTV service. The Company also provides and charges KyLinTV for administrative and general corporate support. The amounts received for these services provided by the Company for the three months ended March 31, 2010 and 2009 were $145,101 and $150,615, respectively.
New York Islanders Hockey Club, LP (“New York Islanders”)
The Company provides IT related professional services to the New York Islanders, a professional hockey club that is owned by the Chairman of the Board of Directors of the Company.
Renaissance Property Associates, LLC (“Renaissance”)
Renaissance is a real estate management company owned by the Chairman of the Board of Directors of the Company. In June 2009, the Company signed a sublease agreement with Renaissance for office space in Plainview, New York. Rent expense paid by the Company to Renaissance of $103,627 and zero, inclusive of taxes and utilities, is included in selling, general and administrative expense for the three months ended March 31, 2010 and 2009, respectively.
Patstar, Inc. (“Patstar”)
Patstar, an investment holding company, is controlled by the Vice Chairman of the Board of Directors of the Company. Rent expense paid to the Company by Patstar of $999 and $891 is included as a recovery in selling, general and administrative expense for the three months ended March 31, 2010 and 2009, respectively.
K-76
NEULION, INC.
NOTES TO CONSOLIDATED FINANCIAL STATEMENTS
[Expressed in U.S. dollars, unless otherwise noted]
Information as at March 31, 2010 and for the three months ended
March 31, 2010 and 2009 is unaudited
Hawaii IPTV, LLC (“Hawaii”)
The Company had as an IPTV customer, Hawaii, whose principals are family members of the Chairman of the Board of Directors of the Company. Hawaii ceased operations during the third quarter of 2009.
The Smile Train, Inc. (“Smile Train”)
The Company provides IT related professional services to Smile Train, a public charity whose founder and significant benefactor is the Chairman of the Board of Directors of the Company.
The Company recognized revenue from related parties for the three months ended March 31 as follows:
| March 31, | March 31, | |||||||
| 2010 | 2009 | |||||||
| $ | $ | |||||||
| New York Islanders | 96,979 | 60,000 | ||||||
| Renaissance | 30,000 | 30,000 | ||||||
| Smile Train | 27,000 | — | ||||||
| Hawaii | — | 16,471 | ||||||
| KyLinTV | 477,213 | 401,485 | ||||||
| 631,192 | 507,956 | |||||||
| As at March 31, 2010 and December 31, 2009, the amounts due from (to) related parties are as follows: | ||||||||
| March 31, | December 31, | |||||||
| 2010 | 2009 | |||||||
| $ | $ | |||||||
| New York Islanders | (1,035 | ) | (304 | ) | ||||
| TransVideo | (108,651 | ) | (298,291 | ) | ||||
| KyLinTV | 208,050 | 246,992 | ||||||
| 98,364 | (51,603 | ) | ||||||
Investment in affiliate – KyLinTV
The Company records its investment in KyLinTV using the equity method.
From January 1, 2008 through February 26, 2010 the Company's equity interest in KyLinTV was 17.1%. On February 26, 2010, a group of private investors invested $10.0 million in KyLinTV, which reduced the Company’s equity interest to 12.2%. Of the total $10.0 million investment, $1.0 million was invested by AvantaLion LLC, a company controlled by the Chairman of the Board of Directors of the Company. As previously discussed, the Company also provides and charges KyLinTV for administrative and general corporate support. Management has determined that as a result of the 12.2% equity interest combined with the services that the Company provides KyLinTV, the Company continues to have significant influence on the operating acti vities of KyLinTV; therefore, the Company continues to account for its investment in KyLinTV using the equity method.
K-77
NEULION, INC.
NOTES TO CONSOLIDATED FINANCIAL STATEMENTS
[Expressed in U.S. dollars, unless otherwise noted]
Information as at March 31, 2010 and for the three months ended
March 31, 2010 and 2009 is unaudited
The Company’s proportionate share of the equity loss from KyLinTV has been accounted for as a charge on the Company's consolidated statements of operations and comprehensive loss. Due to KyLinTV’s accumulated losses, the investment had been reduced to zero as at December 31, 2008. No further charges will be recorded as the Company has no obligation to fund the losses of KyLinTV.
The results of operations and financial position of the Company's equity basis investment in KyLinTV are summarized below for the three months ended:
| March 31, | March 31, | |||||||
| 2010 | 2009 | |||||||
| $ | $ | |||||||
| Condensed income statement information: | ||||||||
| Net sales | 2,229,078 | 1,955,083 | ||||||
| Net loss | (1,862,297 | ) | (1,480,781 | ) | ||||
| March 31, | December 31, | |||||||
| 2010 | 2009 | |||||||
| $ | $ | |||||||
| Condensed balance sheet information: | ||||||||
| Current assets | 10,584,739 | 1,924,891 | ||||||
| Non-current assets | 890,564 | 913,977 | ||||||
| Total assets | 11,475,303 | 2,838,868 | ||||||
| Current liabilities | 5,948,049 | 15,168,149 | ||||||
| Equity (deficiency) | 5,527,254 | (12,329,281 | ) | |||||
| Total liabilities and equity | 11,475,303 | 2,838,868 | ||||||
6. Loss per Share
Basic loss per share is computed by dividing net loss for the period by the weighted average number of common shares outstanding for the period. Diluted loss per share is computed by dividing net loss for the period by the weighted average number of common shares and dilutive potential common shares outstanding. For the three months ended March 31, 2010 and 2009, diluted earnings per share excludes the effect of dilutive potential common shares, as their inclusion would be anti-dilutive due to the losses recorded by the Company.
The following table summarizes the potential common shares that were outstanding as at March 31, 2010 and 2009 but were not included in the computation of diluted loss per share as their effect would have been anti-dilutive.
K-78
NEULION, INC.
NOTES TO CONSOLIDATED FINANCIAL STATEMENTS
[Expressed in U.S. dollars, unless otherwise noted]
Information as at March 31, 2010 and for the three months ended
March 31, 2010 and 2009 is unaudited
| March 31, | March 31, | |||||||
| 2010 | 2009 | |||||||
| # | # | |||||||
| Stock options | 9,639,975 | 8,952,995 | ||||||
| Restricted share units | 1,888 | 42,977 | ||||||
| Stock appreciation rights | 1,675,000 | 1,843,741 | ||||||
| Warrants | 19,697,500 | 16,197,500 | ||||||
| Retention warrants | 801,788 | 1,088,531 | ||||||
| Contingent performance consideration | — | 3,680,194 | ||||||
7. Contingencies
During the ordinary course of business activities, the Company may be contingently liable for litigation and a party to claims. Management believes that adequate provisions have been made in the accounts where required. Although the extent of potential costs and losses, if any is uncertain, management believes that the ultimate resolution of such contingencies will not have an adverse effect on the consolidated financial position or results of operations of the Company.
8. Stock Option and Stock-Based Compensation Plans
The following table shows the breakdown total stock-based compensation expense included in the interim consolidated statement of operations:
| March 31, | March 31, | |||||||
| 2010 | 2009 | |||||||
| $ | $ | |||||||
| Stock options and warrants | 195,106 | 209,900 | ||||||
| Restricted share plan units | 2,929 | 5,846 | ||||||
| Stock appreciation rights | (46,530 | ) | 31,785 | |||||
| Escrowed shares | 12,503 | 6,212 | ||||||
| Directors compensation | 43,249 | — | ||||||
| 207,257 | 253,743 | |||||||
On January 4, 2010, the Company granted 2,000,000 Series D Warrants to a customer of the Company that are exercisable if the customer achieves certain subscriber levels. In accordance with Accounting Standards Codification (“ASC”) Topic 718, the Company has not recorded any expense for these warrants during the three months ended March 31, 2010 as the subscriber levels have not been met.
On March 19, 2010, the Company granted 1,250,000 stock options to employees of the Company with an exercise price of $0.59 that vest evenly over 48 months and expire in 60 months.
9. Segmented Information
The Company operates, as one reportable segment, to provide end-to-end enterprise-level IPTV and other professional services. Substantially all of Company’s revenues originate from and long-lived assets are located in the United States.
K-79
NEULION, INC.
NOTES TO CONSOLIDATED FINANCIAL STATEMENTS
[Expressed in U.S. dollars, unless otherwise noted]
Information as at March 31, 2010 and for the three months ended
March 31, 2010 and 2009 is unaudited
10. Income Taxes
The Company accounts for income taxes in accordance with ASC Topic 740, “Income Taxes Recognition”. There were no accrued interest and penalties associated with uncertain tax positions as of March 31, 2010 or December 31, 2009.
The Company’s effective tax rate is zero due to current year losses and the associated valuation allowance on the Company’s net operating losses.
11. Derivative Instruments
Effective January 1, 2009, the Company adopted ASC Topic 815-40, “Derivatives and Hedging” (“ASC 815-40”). One of the conclusions reached under ASC 815-40 was that an equity-linked financial instrument would not be considered indexed to the entity’s own stock if the strike price is denominated in a currency other than the issuer’s functional currency. The conclusion reached under ASC 815-40 clarified the accounting treatment for these and certain other financial instruments. ASC 815-40 specifies that a contract would not be treated as a derivative if it met the following conditions: (a) indexed to the Company’s own stock; and (b) classified in shareholders’ equity in the Company’s statement of financial position. The CompanyR 17;s outstanding warrants denominated in Canadian dollars are not considered to be indexed to its own stock because the exercise price is denominated in Canadian dollars and the Company’s functional currency is United States dollars. Therefore, these warrants have been treated as derivative financial instruments and recorded at their fair value as a liability. All other outstanding convertible instruments are considered to be indexed to the Company’s stock, because their exercise price is denominated in the same currency as the Company’s functional currency, and are included in shareholders’ equity.
The Company’s only derivative instruments are 11,000,000 warrants, the exercise price for which are denominated in a currency other than the Company’s functional currency, as follows:
| · | 5,500,000 Series A warrants exercisable at Cdn$1.25 that expire on October 20, 2010. |
| · | 5,500,000 Series B warrants exercisable at Cdn$1.50 that expire on October 20, 2010. |
These warrants have been recorded at their relative fair values at issuance and will continue to be recorded at fair value at each subsequent balance sheet date. Any change in value between reporting periods will be recorded as other income (expense). These warrants will continue to be reported as a liability until such time as they are exercised or expire. The fair value of these warrants is estimated using the Black-Scholes-Merton option-pricing model.
As of January 1, 2009, the grant date fair value of these warrants in the amount of $2,464,000 was reallocated from additional paid-in-capital and a derivative liability was recorded in the amount of $587,950, being the fair value of the warrants on January 1, 2009 offset by an adjustment to accumulated deficit of $1,876,050.
As of March 31, 2010, the fair value of the warrants was determined to be $389,400; accordingly, the Company recorded an unrealized gain of $999,900 and an unrealized loss of $476,850 in other income (expense) on the consolidated statements of operations for the three months ended March 31, 2010 and 2009, respectively, related to the change in the fair value of these warrants. There is no cash flow impact for these derivatives until the warrants are exercised. If these warrants are exercised, the Company will receive the proceeds from the exercise at the current exchange rate at the time of exercise.
K-80
The following Management’s Discussion & Analysis (“MD&A”) of the financial condition and results of operations of NeuLion, Inc. (the “Company”, “NeuLion”, “we”, “us”, “our” and similar phrases), prepared as of May 11, 2010, should be read in conjunction with the Company's unaudited consolidated financial statements and accompanying notes for the three months ended March 31, 2010 and 2009, which have been prepared in accordance with United States generally accepted accounting principles (“U.S. GAAP”). For additional information and details, readers are referred to the Company’s Annual Report on Form 10-K (“Annual Report”), for the year ended December 31, 2009, which can be found on www.sedar.com and www.sec.gov. All dollar amounts set forth in this MD&A are in U.S. dollars (“US$” or “$”) unless stated otherwise. As at April 30, 2010, the Bank of Canada noon rate for conversion of United States dollar to Canadian dollars was US$1 to CDN$1.0116.
Our MD&A is intended to enable readers to gain an understanding of NeuLion's current results and financial position. To do so, we provide information and analysis comparing the results of operations and financial position for the current period to those of the preceding comparable period. We also provide analysis and commentary that we believe is required to assess the Company's future prospects. Accordingly, certain sections of this report contain forward-looking statements that are based on current plans and expectations. These forward-looking statements are affected by risks and uncertainties that are discussed in NeuLion’s Annual Report, and below in the section titled “Cautions Regarding Forward-Looking Statements”, and could have a material impact on future prospe cts. Readers are cautioned that actual results could vary from those forecasted in this MD&A.
Cautions Regarding Forward-Looking Statements
This MD&A contains certain forward-looking statements that reflect management’s expectations regarding the Company’s growth, results of operations, performance and business prospects and opportunities.
Statements about the Company’s future plans and intentions, results, levels of activity, performance, goals or achievements or other future events constitute forward-looking statements. Wherever possible, words such as ”may,” ”will,” ”should,” ”could,” ”expect,” ”plan,” ”intend,” ”anticipate,” ”believe,” ”estimate,” ”predict,” or ”potential“ or the negative or other variations of these words, or similar words or phrases, have been used to identify these forward-looking statements. These statements reflect management’s current beliefs and are based on information available to management as at the date hereof.
Forward-looking statements involve significant risk, uncertainties and assumptions. Many factors could cause actual results, performance or achievements to differ materially from the results discussed or implied in the forward-looking statements. These factors should be considered carefully and readers should not place undue reliance on the forward-looking statements. Although the forward-looking statements contained in this Quarterly Report on Form 10-Q are based upon what management believes to be reasonable assumptions, the Company cannot assure readers that actual results will be consistent with these forward-looking statements. These forward-looking statements are made as of the date of this MD&A and the Company assumes no obligation to update or revise them to reflect new events or circumstances, except as required by law. M any factors could cause the actual results, performance or achievements of the Company to be materially different from any future results, performance or achievements that may be expressed or implied by such forward-looking statements, including: the integration of the businesses of NeuLion and Interactive Netcasting Systems Inc.; our continued relationships with our channel partners; general economic and market segment conditions; competitor activity; product capability and acceptance, rates; technology changes and international risk and currency exchange. More specific risks include that NeuLion and Interactive Netcasting Systems Inc. will not be able to realize some or all expected synergies due to incompatibilities in our businesses, the inability of management to bring about such synergies or a changing business environment rendering such synergies inadvisable or uneconomical. After integrating the businesses, the suite of service offerings may not perform as expected if shifting demand moves in a direction away from our expected business model, if competitors are able to take market share away from us or if changing technology adversely impacts us. In addition, while the Company expects its content partners and those of its subsidiaries to continue and expand their relationship with each of us, there can be no assurance that such relationships will continue as expected, or at all. A more detailed assessment of the risks that could cause actual results to materially differ from current expectations is contained in the "Risk Factors" section of the Company's Annual Report available on www.sedar.com and www.sec.gov.
K-81
RECENT DEVELOPMENTS
On January 7, 2010, the Company announced that it had signed a multi-year partnership to distribute certain DISH Network L.L.C. (“DISH Network”) international channels using NeuLion's IPTV platform. The partnership with NeuLion enhances DISH Network's international programming offerings by providing consumers without access to satellite TV the ability to enjoy select DISH Network international channels through IPTV. In connection with this agreement, the Company granted 2,000,000 Series D Warrants that are exercisable if certain subscriber levels are achieved.
On March 25, 2010, NeuLion announced a partnership with Major League Soccer (“MLS”), a professional soccer league in the United States, for a dedicated online video service built and managed by NeuLion. NeuLion provides MLS with an end-to-end service and will deliver up to 300 MLS, SuperLiga and InterLiga games as well as other Soccer United Marketing events during the season, including condensed archive games and real time highlights, to a viewer's browser.
On April 13, 2010, NeuLion announced a long-term partnership to distribute Arab Radio and Television Network (“ART”), channels using NeuLion's IPTV platform in Canada. ART, through its International Media Distribution (“IMD”), is the exclusive aggregator and provider of Arabic content to NeuLion in Canada. The new television service leverages ART/IMD's extensive library and premium content coupled with NeuLion technology for a new Arabic IPTV destination in Canada. The new service, branded Talfazat-ART, will launch in June 2010 and be offered as both a subscription and pay-per-view service.
OVERVIEW
The Company is a leading Internet Protocol (“IP”) television company, providing end-to-end IPTV services. “IPTV” refers to the distribution over an IP network of streamed audio, video and other multimedia content, similar to television programming content, using industry-standard streaming protocols. We build and manage private networks for content owners and aggregators (our content partners) that are used to stream content, including live and on-demand sports and international and variety programming, which we then deliver to subscribers and pay-per-view customers for viewing on Internet-connected browser-based devices such as personal computers, laptops and mobile devices and on standard television sets through Internet-connected set top boxes (“STBs”). NeuLion’s main business objective is to enter into agreements with companies seeking their own private networks to reach target audiences and to provide complete IPTV services to these companies. We also acquire the rights to certain sports and international content from television broadcasters (our channel partners), which we then stream to end users through our own private networks.
Our business model has evolved from a professional IT services and international programming provider to an end-to-end provider of IPTV services. By “end-to-end provider of IPTV services,” we mean that we provide the following services:
| · | content management — encoding and transcoding of various digital and analog TV and video formats; |
| · | subscriber management — managing subscriber access and control of subscriber accounts; |
| · | digital rights management — preserving the integrity of the content and protecting it from unauthorized access; |
| · | billing services — enabling customers to view subscription accounts, providing pay-per-view transactional billing and payment processing; |
| · | delivery — delivering streamed audio, video and other multimedia content anywhere, anytime through the Company’s IPTV service and infrastructure; and |
| · | advertising insertion. |
K-82
Customer Relationships
We have two types of relationships: business-to-business (“B2B”) and business-to-consumer (“B2C”).
B2B relationships have been our primary focus in the past and are expected to be the focus in the future. A B2B relationship is focused on providing an end-to-end solution to a customer to enable that customer to provide its content, by way of an IPTV platform built for that customer, to its end users. B2B customers typically aggregate the content, negotiate the licensing rights and directly market the availability of the content. This customer avails itself of the full services of the Company in delivery to its end users. This type of relationship is typical in the professional and college sports properties and in our agreements with international and broad-based content providers.
Our B2C relationships are individual consumer oriented. We have signed distribution agreements with our channel partners and content providers in exchange for revenue share or royalty payments to such providers. We then market the content on one (or more) of the proprietary targeted websites that we have developed which are focused on a specific diaspora community, as well as on the general Company website for purchase by an end user. We often aggregate the content into bundles or packages of similar interest (e.g. Talfazat for the Middle East community; TV-Desi for the South Asian community). We incur marketing expenses in promoting the availability of such content.
The United States and Canada are the principal markets in which our sales occur.
Products and Services
Sports programming
Through our comprehensive end-to-end IPTV solution, we provide our sports programming content partners with the ability to deliver live and on-demand content. We maintain distribution and technology services agreements with leading professional and collegiate sports properties as well as with the sports network ESPN. Amongst professional sports leagues, NeuLion counts the National Football League (NFL), the National Hockey League (NHL), MLS and the American Hockey League (AHL) as clients. Through our recent acquisition of Interactive Netcasting Systems Inc. (“INSINC”), a provider of sports, government and entertainment webcasting services, we expanded our portfolio of sports content partners to include the Western Hockey League (WHL), the Ontario Hockey League (OHL), the Central Hockey League (CHL), the British Columbia Ho ckey League (BCHL), the Central Canadian Hockey League (CCHL), the Alberta Junior Hockey League (AJHL), the Central Junior Hockey League (CJHL) and the Canadian Football League (CFL).
We also operate our own portfolio of sports-oriented websites, including Cycling.tv, CollegeSportsDirect.com and selected World Cup soccer properties. On the collegiate level, we are the premier partner for National Collegiate Athletic Association (NCAA) colleges and universities, with agreements in place with approximately 165 colleges, universities or related sites.
Ethnic/international and specialty programming
The Company also offers what is referred to in the industry as “ethnic television,” which the Company defines as programming directed at a specific diaspora community, as determined by a shared nationality, language or culture, and generally excluding communities for which English is the primary language. We have license agreements directly with channel partners representing approximately 170 channels in 50 countries that give NeuLion rights to stream, predominantly on an exclusive world-wide basis, the channel partners’ live linear television feeds over the public Internet using our proprietary private networks such as Talfazat and TV-Desi.
Our subsidiary, INSINC, also distributes government and entertainment content. Its clients in those industries include Business News Network (BNN), CTV News Channel, Rogers Sportsnet, TVG Networks, The Canadian Press, the Canadian Ministry of Justice, the BC Ministry of Education, and the Legislative Assemblies of British Columbia and Newfoundland and Labrador, among others.
We also have relationships with other specialty programming customers such as Sky Angel U.S. LLC, which streams faith based programming.
K-83
Services
Our suite of technology and other services is directed at the entire spectrum of content aggregation and delivery. Our services include:
| · | content ingestion; |
| · | web site design and hosting; |
| · | live and on-demand streaming of content on multiple platforms; |
| · | billing services; |
| · | facilitating online merchandise sales; |
| · | mobile features (streaming highlights, alerts, wallpaper and ring tones); |
| · | online ticketing; |
| · | auction engine (jerseys, tickets); |
| · | social networking; |
| · | customer and fan support; and |
| · | marketing and advertising sales. |
Distribution Methods
We distribute content through two primary methods:
| · | Internet-connected browser-based devices such as personal computers, laptops and mobile devices; and |
| · | standard television sets through use of our Internet-connected STBs. |
Both of our distribution methods take advantage of an open IPTV network, the public Internet. As a result, content delivered by NeuLion is available globally and is potentially unlimited in breadth.
Revenue
We earn revenue in two broad categories: services revenue and equipment revenue. Services revenue includes subscriber revenue, eCommerce revenue and technology services revenue. Equipment revenue includes the sale and shipping of STBs. Our revenue streams are described in detail under the heading “OPERATIONS”.
K-84
Overall Performance — Three months ended March 31, 2010 vs Three months ended March 31, 2009
Highlights
| Ø | Services Revenue, which is the Company’s recurring revenue stream, increased by 25% as compared to the same period a year ago |
| Ø | Cost of Services Revenue, exclusive of depreciation and amortization, remained unchanged as compared to the same period a year ago despite Services Revenue increasing by 25% |
| Ø | Non-GAAP Adjusted EBITDA Loss (see page 17 for detailed calculation) improved by 29% as compared to the same period a year ago |
Overview
Revenue for the three months ended March 31, 2010 was $7.8 million, an increase of 18% from $6.6 million for the three months ended March 31, 2009. The revenue growth was due to the following:
| · | organic growth of $0.3 million; and |
| · | revenue from INSINC of $0.9 million. |
The organic revenue growth of $0.3 million was due to an increase in services revenue of $0.5 million, offset by a decrease in our equipment revenue of $0.2 million.
The organic increase in services revenue is consistent with the increasing scope of our operations. As the number of subscribers increase, there is a cumulative effect of increasing subscriber revenue on a quarter over quarter basis. The decrease in equipment revenue is a result of the uneven nature of this revenue stream – customers often place large single orders made to meet minimum order requirements, to manage the lead time between ordering and shipping and to minimize the related shipping costs. The lead time on new orders is approximately 12 weeks from placing an order to receipt of goods. The purchase by customers of STBs is a leading indicator of future subscriptions.
Our net loss for the three months ended March 31, 2010 was $3.5 million, or a loss of $0.03 per basic and diluted common share, compared with a net loss of $5.8 million, or a loss of $0.05 per basic and diluted common share, for the three months ended March 31, 2009. The improvement in net loss of $2.3 million or 40% was primarily due to the following:
| · | an increase in total revenue of $1.2 million; |
| · | a slight decrease in cost of services revenue, exclusive of depreciation and amortization despite the increase in revenue; |
| · | a slight increase in selling, general and administrative expenses, including stock-based compensation of $0.2 million; and |
| · | an unrealized gain on derivative of $1.0 million for the three months ended March 31, 2010 as compared to a $0.5 million loss on derivative for the three months ended March 31, 2009 (non-cash item). |
On a pro forma basis, as if the acquisition of INSINC had occurred on January 1, 2009, revenue decreased slightly from $7.9 million for the three months ended March 31, 2010 to $7.8 million for the three months ended March 31, 2009. Our pro forma net loss for the three months ended March 31, 2009 was $6.0 million or a loss of $0.05 per basic and diluted common share. The improvement in net loss of $2.5 million or 41% on a pro forma basis was primarily due to the following:
| · | a decrease of $0.8 million in cost of services revenue, exclusive of depreciation and amortization; and |
| · | an unrealized gain on derivative of $1.0 million for the three months ended March 31, 2010 as compared to a $0.5 million loss on derivative for the three months ended March 31, 2009 (non-cash item). |
K-85
Our non-GAAP Adjusted EBITDA loss (as defined below) was $3.0 million for the three months ended March 31, 2010 compared with a non-GAAP Adjusted EBITDA loss of $4.2 million for the three months ended March 31, 2009. The decrease in non-GAAP Adjusted EBITDA loss is due to the impact of the items noted above. On a pro forma basis, our non-GAAP Adjusted EBITDA loss improved from a loss of $4.1 million for the three months ended March 31, 2009 to a loss of $3.0 million for the three months ended March 31, 2010. This improvement is due to cost reductions in most area s of the business.
The Company reports non-GAAP Adjusted EBITDA loss because it is a key measure used by management to evaluate the results of the Company and make strategic decisions about the Company, including potential acquisitions. Non-GAAP Adjusted EBITDA loss represents net loss before interest, income taxes, depreciation and amortization, stock-based compensation, unrealized loss on derivatives, investment income and foreign exchange gain. This measure does not have any standardized meaning prescribed by U.S. GAAP and therefore is unlikely to be comparable to the calculation of similar measures used by other companies, and should not be viewed as an alternative to measures of financial performance or changes in cash flows calculated in accordance with U.S. GAAP.
The reconciliation from net loss to non-GAAP Adjusted EBITDA loss is as follows:
| Three months ended March 31, | ||||||||||||
| Pro forma | ||||||||||||
| 2010 | 2009 | 2009 | ||||||||||
| $ | $ | $ | ||||||||||
| Net loss | (3,511,802 | ) | (5,793,878 | ) | (5,990,468 | ) | ||||||
| Add back: | ||||||||||||
| Depreciation and amortization | 1,276,965 | 1,014,681 | 1,326,090 | |||||||||
| Stock-based compensation | 207,257 | 253,743 | 253,743 | |||||||||
| Unrealized (gain) loss on derivative | (999,900 | ) | 476,850 | 476,850 | ||||||||
| Investment income and foreign exchange gain/loss | 27,223 | (141,450 | ) | (141,450 | ) | |||||||
| Non-GAAP Adjusted EBITDA loss | (3,000,257 | ) | (4,190,054 | ) | (4,075,235 | ) | ||||||
OPERATIONS
Revenue
The Company earns revenue in two broad categories:
| (i) | Services revenue, which includes: | |
| ● | Subscriber revenue, which is recognized over the period of service or usage; | |
| ● | eCommerce revenue, which is recognized as the service is performed; and | |
| ● | Technology revenue, which consists of the set up and transcoder revenue and is recognized over the life of the contract. | |
| (ii) | Equipment revenue, which is recognized when title of the STB passes to the customer. | |
K-86
Cost and Expenses
Cost of services revenue
Cost of services revenue primarily consists of:
| · | Cost of subscriber revenue, which consists of : |
| · | royalty payments |
| · | network operating costs |
| · | bandwidth usage fees |
| · | colocation fees |
| · | Cost of eCommerce revenue, which consists of: |
| · | merchandising, donor and ticket sales, which has no associated cost – revenue is booked on a net basis |
| · | cost of advertising revenue is subject to revenue shares with the content provider |
| · | Cost of technology services revenue, which consists of: |
| · | third party transcoder licenses purchased |
| · | maintenance costs for transcoders |
Cost of equipment revenue
Equipment revenue consists of the sale of STBs to content partners and/or end users to enable the end user to receive the content over the Internet and display the signal on a television. Cost of equipment revenue primarily consists of purchases from TransVideo International, Ltd. and Tatung Technology Incorporation of the products and parts for resale to customers. Shipping revenue and costs are included in equipment revenue and cost of equipment revenue, respectively.
Selling, general and administrative expenses, including stock-based compensation
Selling, general and administrative (“SG&A”) costs, including stock-based compensation, include:
| · | Wages and benefits – represents compensation for the Company's full-time and part-time employees as well as fees for consultants who are used by the Company from time to time; |
| · | Stock-based compensation – we estimate the fair value of our options, warrants and stock appreciation rights (“Convertible Securities”) for financial accounting purposes using the Black-Scholes-Merton model, which requires a number of subjective assumptions, including the expected life of the Convertible Securities, risk-free interest rate, dividend rate, forfeiture rate and future volatility of the price of our common shares. We expense the estimated fair value over the vesting period of the Convertible Securities, which is normally over a four-year period, vesting in an equal amount each month; however, the Board of Directors has the discretion to grant options with different vesting periods; |
| · | Marketing – represents expenses for both global and local marketing programs that focus on various target sports properties and ethnic communities. These initiatives include on-line and off-line marketing expenditures, search engine marketing and search engine optimization; |
| · | Professional fees – represents legal, accounting and recruiting fees; and |
| · | Other SG&A expenses – represents travel expenses, rent, office supplies, corporate IT services, credit card processing fees and other general operating expenses. |
K-87
SELECTED INTERIM INFORMATION
The selected interim consolidated financial information set out below for the eight most recently completed quarters has been derived from the Company’s unaudited interim consolidated financial statements and accompanying notes posted on www.sedar.com and www.sec.gov. Readers should read the following information in conjunction with those statements and related notes.
| Three months ended, | ||||||||||||||||||||||||||||||||
| 2010 | 2009 | 2008 | ||||||||||||||||||||||||||||||
| March 31, | December 31, | September 30, | June 30, | March 31, | December 31, | September 30, | June 30, | |||||||||||||||||||||||||
| $ | $ | $ | $ | $ | $ | $ | $ | |||||||||||||||||||||||||
| Income Statement Data: | ||||||||||||||||||||||||||||||||
| Revenue | 7,844,495 | 8,995,911 | 6,061,302 | 6,462,438 | 6,574,026 | 5,807,550 | 2,699,041 | 2,987,128 | ||||||||||||||||||||||||
| Cost of revenue | 3,719,097 | 4,024,350 | 3,224,838 | 3,293,481 | 3,844,483 | 3,205,272 | 1,534,807 | 1,753,689 | ||||||||||||||||||||||||
| Net loss for the period | (3,511,802 | ) | (1,454,962 | ) | (7,463,951 | ) | (4,928,130 | ) | (5,793,878 | ) | (7,223,468 | ) | (1,377,667 | ) | (1,549,979 | ) | ||||||||||||||||
| Basic and diluted loss per share | (0.03 | ) | (0.01 | ) | (0.07 | ) | (0.04 | ) | (0.05 | ) | (0.13 | ) | (0.03 | ) | (0.04 | ) | ||||||||||||||||
The selected interim information for the periods from Q4 2008 (subsequent to October 20, 2008) to Q1 2010 represents income statement data for NeuLion. For the periods from Q2 2008 to Q4 2008 (prior to October 20, 2008), the selected interim information represents income statement data for NeuLion USA, Inc., our wholly owned subsidiary, prior to the merger between NeuLion and NeuLion USA, Inc.
The selected interim information for the periods from Q4 2009 (subsequent to October 31, 2009) to Q1 2010 includes income statement data for INSINC. For the periods from Q2 2008 to Q4 2009 (prior to October 31, 2009), the selected interim information excludes income statement data for INSINC.
The Q4 2008 net loss includes a non-cash impairment charge of $1.0 million. This non-cash impairment charge was not incurred in the comparative periods.
Through Q1 2009 to Q1 2010, net losses include a non-cash loss (gain) on derivative charge of $0.5 million, $0.3 million, $2.2 million, $(2.2) million and $(1.0) million, respectively. These non-cash losses (gains) on derivative were not incurred in comparative periods.
K-88
RESULTS OF OPERATIONS
Comparison of Three Months Ended March 31, 2010 to Three Months Ended March 31, 2009
Our consolidated financial statements for the three months ended March 31, 2010 and 2009 have been prepared in accordance with U.S. GAAP.
| 2010 | 2009 | Change | |||||||||
| $ | $ | % | |||||||||
| Revenue | |||||||||||
| Services revenue | 7,462,899 | 6,034,330 | 24% | ||||||||
| Equipment revenue | 381,596 | 539,696 | -29% | ||||||||
| Total Revenue | 7,844,495 | 6,574,026 | 19% | ||||||||
| Costs and expenses | |||||||||||
| Cost of services revenue, exclusive of depreciation | |||||||||||
| and amortization shown separately below | 3,364,407 | 3,383,879 | -1% | ||||||||
| Cost of equipment revenue | 354,690 | 460,604 | -23% | ||||||||
| Selling, general and administrative, including | |||||||||||
| stock-based compensation | 7,332,912 | 7,173,340 | 2% | ||||||||
| Depreciation and amortization | 1,276,965 | 1,014,681 | 26% | ||||||||
| 12,328,974 | 12,032,504 | 2% | |||||||||
| Operating loss | (4,484,479 | ) | (5,458,478 | ) | -18% | ||||||
| Other income (expense) | |||||||||||
| Unrealized gain (loss) on derivative | 999,900 | (476,850 | ) | -310% | |||||||
| (Loss) gain on foreign exchange | (49,129 | ) | 44,226 | -211% | |||||||
| Investment income | 21,906 | 97,224 | -77% | ||||||||
| 972,677 | (335,400 | ) | -390% | ||||||||
| Net and comprehensive loss for the period | (3,511,802 | ) | (5,793,878 | ) | -39% | ||||||
Revenue
Services revenue
Services revenue includes revenue from subscribers, eCommerce and technology services. Services revenue increased from $6.0 million for the three months ended March 31, 2009 to $7.5 million for the three months ended March 31, 2010. The increase was due to the acquisition of INSINC which accounted for $0.9 million of revenue coupled with organic growth of $0.6 million.
Subscriber revenue increased from $4.2 million for the three months ended March 31, 2009 to $5.1 million for the three months ended March 31, 2010. The increase was due to the acquisition of INSINC which accounted for $0.4 million coupled with organic growth of $0.5 million. Of the $0.5 million organic increase, $0.1 million was from new customers.
eCommerce revenue increased from $0.9 million for the three months ended March 31, 2009 to $1.0 million for the three months ended March 31, 2010. The increase was due to an increase in advertising revenue.
Technology services revenue increased from $0.9 million for the three months ended March 31, 2009 to $1.4 million for the three months ended March 31, 2010. The increase was due to the acquisition of INSINC, which accounted for $0.5 million.
K-89
Equipment revenue
Equipment revenue decreased from $0.5 million for the three months ended March 31, 2009 to $0.4 million for the three months ended March 31, 2010. The decrease in equipment revenue is a result of the uneven nature of the revenue stream; customers often place large single orders to meet minimum order requirements to manage the lead time between ordering and shipping and to minimize the related shipping costs. The Company expects STB revenue to have a much slower growth rate than services revenue. Services revenue is recurring revenue whereas STB revenue is earned on new customers and/or new subscribers.
Costs and Expenses
Cost of services revenue
Cost of services revenue remained unchanged, from $3.4 million, or 56%, of services revenue for the three months ended March 31, 2009 to $3.4 million, or 45%, of services revenue for the three months ended March 31, 2010, despite an increase in services revenue of $1.5 million or 24%. Included in cost of services revenue is $0.4 million from INSINC. The 11% improvement (as a percentage of services revenue) primarily relates to negotiated lower rates on bandwidth costs.
Cost of equipment revenue
Cost of equipment revenue decreased from $0.5 million for the three months ended March 31, 2009 to $0.4 million for the three months ended March 31, 2010 because of decreased equipment sales. Cost of equipment revenue is directly variable with changes in equipment revenue. Cost of equipment revenue as a percentage of equipment revenue increased from 85% for the three months ended March 31, 2009 to 93% for the three months ended March 31, 2010 due to increased shipping costs related to TV-Desi and Talfazat rental STBs that generate no equipment revenue.
Selling, general and administrative, including stock-based compensation
Selling, general and administrative, including stock-based compensation, increased from $7.2 million for the three months ended March 31, 2009 to $7.3 million for the three months ended March 31, 2010. INSINC comprised $0.5 million of the total $7.3 million for the three months ended March 31, 2010. The individual variances are due to the following:
| · | Wages and benefits increased from $5.2 million for the three months ended March 31, 2009 to $5.3 million for the three months ended March 31, 2010. INSINC comprised $0.3 million of total wages and benefits for the period. The organic decrease of $0.2 million was due to a decrease in headcount. |
| · | Stock-based compensation expense decreased from $0.3 million for the three months ended March 31, 2009 to $0.2 million for the three months ended March 31, 2010. The decrease primarily relates to the decrease in fair value of the Company’s stock appreciation rights. |
| · | Marketing expenses were $0.2 million for the three months ended March 31, 2009 and 2010. |
| · | Professional fees increased from $0.4 million for the three months ended March 31, 2009 to $0.5 million for the three months ended March 31, 2010. The increase primarily represents legal expenses incurred on behalf of INSINC. |
| · | Other SG&A expenses were $1.1 million for the three months ended March 31, 2009 and 2010. INSINC accounted for $0.2 million of the total $1.1 million for the period. The organic decrease of $0.2 million was primarily the result of decreases in travel and office expenses. |
K-90
Depreciation and amortization
Depreciation and amortization increased from $1.0 million for the three months ended March 31, 2009 to $1.3 million for the three months ended March 31, 2010. The increase was due to the amortization of INSINC’s acquired fixed and intangible assets.
Unrealized gain on derivative
Unrealized gain on derivative decreased from a loss of $0.5 million for the three months ended March 31, 2009 to a gain of $1.0 million for the three months ended March 31, 2010. The Company adopted ASC 815-40, effective January 1, 2009, which required the Company to record at fair value all Convertible Securities denominated in a currency other than the Company’s functional currency. On January 1, 2009, the grant date fair value of warrants denominated in Canadian dollars of $2.5 million was reallocated from additional paid-in capital and a derivative liability was recorded in the amount of $0.6 million with an adjustment to opening accumulated deficit of $1.9 million. The difference between the fair value at March 31, 2010 of $0 .4 million and the fair value at December 31, 2009 of $1.4 million resulted in an unrealized gain on derivative of $1.0 million.
These warrants have been recorded at their relative fair values at issuance, determined using the Black-Scholes-Merton model, and will continue to be recorded at fair value at each subsequent balance sheet date. Any change in value between reporting periods will be recorded as other income (expense). These warrants will continue to be reported as a liability until such time as they are exercised or expire.
K-91
LIQUIDITY AND CAPITAL RESOURCES
During the three months ended March 31, 2010, the Company’s cash position decreased by $5.2 million. The Company used $4.9 million to fund operations, which included working capital changes of $1.9 million. Historically, cash used for working capital is the highest in the first fiscal quarter. Management does not anticipate similar usages of cash for working capital for the remainder of the fiscal year. Additionally, the Company spent $0.3 million to purchase fixed assets.
As of March 31, 2010, our principal sources of liquidity included cash and cash equivalents of $7.8 million and trade accounts receivable of $1.9 million. We do not have a credit facility. We continue to closely monitor our cash balances to ensure that we have sufficient cash on hand to meet our operating needs. Management believes that the Company has sufficient liquidity to meet its working capital and capital expenditure requirements for the next twelve months.
At March 31, 2010, approximately 76% of our cash and cash equivalents were held in bank accounts with a U.S. bank that received an A- rating by Standard and Poors and an A2 rating by Moody’s and 13% of our cash and cash equivalents were held in bank accounts with two of the top five Canadian commercial banks. The Company believes that these U.S. and Canadian financial institutions are secure notwithstanding the current global economy and that we will be able to access the remaining balance of bank deposits as these deposits are with large reputable banks. Our investment policy is to invest in low-risk short-term investments which are primarily term deposits. We have not had a history of any defaults on these term deposits, nor do we expect any in th e future given the short term to maturity of these investments.
The Company’s business is still in the early stages, with only a few years of operating history. From the Company’s inception, it has incurred substantial net losses and has an accumulated deficit of $47.3 million; management expects these losses to continue in the short term. The Company continues to review its operating structure to maximize revenue opportunity, further reduce costs and achieve profitability. Based on our current business plan and internal forecasts, and considering the risks that are present in the current global economy, we believe that our cash on hand will be sufficient to meet our working capital and operating cash requirements for the next twelve months. However, we will require expenditures of signifi cant funds for marketing, building our subscriber management systems, programming and website development, maintaining adequate video streaming and database software, pursuing and maintaining channel distribution agreements with our channel partners, fees relating to acquiring and maintaining Internet streaming rights to our content and the construction and maintenance of the Company’s delivery infrastructure and office facilities. Cash from operations could be affected by various risks and uncertainties, including, but not limited to, the risks detailed herein or incorporated by reference in our Annual Report in the section titled “Risk Factors.” If our actual cash needs are greater than forecasted and if cash on hand is insufficient to meet our working capital and cash requirements for the next twelve months, we will require outside capital in addition to cash flow from operations in order to fund our business. Our short operating history, our current lack of p rofitability and the prolonged upheaval in the capital markets could each or all be factors that might negatively impact our ability to obtain outside capital on reasonable terms, or at all. If we were ever unable to obtain needed capital, we would reevaluate and reprioritize our planned capital expenditures and operating activities. We cannot assure you that we will ultimately be able to generate sufficient revenue or reduce our costs in the anticipated time frame to become profitable and have sustainable cash flows.
Working Capital Requirements
The net working capital at March 31, 2010 was a deficit of $1.4 million, a decrease of $2.4 million from the December 31, 2009 net working capital of $1.0 million. Included in current liabilities at March 31, 2010 and December 31, 2009 is approximately $4.2 million and $5.3 million, respectively, of liabilities, that the Company does not anticipate to settle in cash. Excluding these liabilities, the Company’s working capital ratio at March 31, 2010 and December 31, 2009 is 1.28 and 1.54, respectively.
K-92
The decreased working capital is primarily due to a decrease in cash and cash equivalents of $5.2 million offset by a decrease in accounts payable of $1.4 million and a decrease in the derivative liability of $1.0 million (which is a non-cash liability).
Current assets at March 31, 2010 were $12.5 million, a decrease of $5.3 million from the December 31, 2009 balance of $17.8 million. The change is primarily due to a decrease in our cash and cash equivalents of $5.2 million.
Current liabilities at March 31, 2010 were $13.9 million, a decrease of $2.9 million from the December 31, 2009 balance of $16.8 million. The change is primarily due to a decrease in accounts payable and accrued liabilities of $1.6 million and a decrease in the fair value of the derivative liability of $1.0 million (which is a non-cash liability).
Cash Flows
Summary Balance Sheet Data:
| March 31, | December 31, | |||||||
| 2010 | 2009 | |||||||
| $ | $ | |||||||
| Current Assets | ||||||||
| Cash and cash equivalents | 7,790,483 | 12,957,679 | ||||||
| Accounts receivable, net | 1,934,129 | 1,844,481 | ||||||
| Other receivables | 790,155 | 821,834 | ||||||
| Inventory | 552,243 | 928,592 | ||||||
| Prepaid expenses and deposits | 1,167,924 | 966,101 | ||||||
| Due from related parties | 208,050 | 246,992 | ||||||
| Total current assets | 12,442,984 | 17,765,679 | ||||||
| Current Liabilities | ||||||||
| Accounts payable | 3,969,950 | 5,383,518 | ||||||
| Accrued liabilities | 5,612,260 | 5,822,385 | ||||||
| Derivative liability | 389,400 | 1,389,300 | ||||||
| Due to related parties | 109,686 | 298,595 | ||||||
| Deferred revenue | 3,785,884 | 3,907,510 | ||||||
| Total current liabilities | 13,867,180 | 16,801,308 | ||||||
| Working capital ratio | 0.90 | 1.06 | ||||||
Comparative Summarized Cash Flows
| Three months ended | ||||||||
| March 31, | ||||||||
| 2010 | 2009 | |||||||
| $ | $ | |||||||
| Cash used in operating activities | (4,876,108 | ) | (5,372,749 | ) | ||||
| Cash used in investing activities | (298,285 | ) | (382,404 | ) | ||||
| Cash provided by financing activities | 7,197 | - | ||||||
Operating activities
Cash used in operating activities for the three months ended March 31, 2010 was $4.9 million. Changes in net cash used in operating activities reflect the net loss of $3.5 million for the period, less:
K-93
| · | non-cash items in the amount of $0.5 million, which relates to stock-based compensation, depreciation and amortization and unrealized gain on derivative; and |
| · | changes in operating assets and liabilities of $1.9 million. |
Investing activities
Cash used in investing activities for the three months ended March 31, 2010 was $0.3 million. These funds were used to purchase fixed assets.
Financing activities
Cash provided by financing activities was a nominal amount for the three months ended March 31, 2010. The funds were received from stock option exercises.
Off-Balance Sheet Arrangements
The Company did not have any off-balance sheet arrangements as of March 31, 2010.
Financial Instruments
The Company's financial instruments are comprised of cash and cash equivalents, accounts receivable, other receivables, deposits, accounts payable, accrued liabilities, amounts due to/from related parties, and deferred revenue.
Fair value of financial instruments
Fair value of a financial instrument is defined as the amount for which the instrument could be exchanged in a current transaction between willing parties. The estimated fair value of the Company’s financial instruments approximates their carrying value due to the short maturity term of these financial instruments.
Risks associated with financial instruments
Foreign exchange risk
The Company is exposed to foreign exchange risk as a result of transactions in currencies other than its functional currency of the United States dollar. The majority of the Company’s revenues are transacted in U.S. dollars, whereas a portion of its expenses are transacted in U.S. or Canadian dollars. The Company does not use derivative instruments to hedge against foreign exchange risk.
Interest rate risk
The Company is exposed to interest rate risk on its invested cash and cash equivalents and its short-term investments. The interest rates on these instruments are based on the bank's rate and therefore are subject to change with the market. The Company does not use derivative financial instruments to reduce its interest rate risk.
Credit risk
The Company sells its services to a variety of customers under various payment terms and therefore is exposed to credit risk. The Company has adopted policies and procedures designed to limit this risk. The maximum exposure to credit risk at the reporting date is the carrying value of receivables. The Company establishes an allowance for doubtful accounts that represents its estimate of incurred losses in respect of accounts receivable.
K-94
RELATED PARTY TRANSACTIONS
The Company has entered into certain transactions and agreements in the normal course of operations with related parties. Significant related party transactions are as follows:
TransVideo International, Ltd. (“TransVideo”)
TransVideo is a company controlled by the Chairman of the Board of Directors of the Company that designs and sells equipment and technology for IPTV content delivery. STB purchases amounted to $18,628 and $395,280 and transcoder licensing fees amounted to zero and $28,000 for the three months ended March 31, 2010 and 2009, respectively. Included in cost of equipment revenue is the cost of STBs sold of $111,996 and $369,160 for the three months ended March 31, 2010 and 2009, respectively.
KyLinTV, Inc. (“KyLinTV”)
KyLinTV is an IPTV company that is controlled by the Chairman of the Board of Directors of the Company. On June 1, 2008, the Company entered into an agreement with KyLinTV to build and deliver the setup and back office operation of an IPTV service. The Company also provides and charges KyLinTV for administrative and general corporate support. The amounts received for these services provided by the Company for the three months ended March 31, 2010 and 2009 were $145,101 and $150,615, respectively.
New York Islanders Hockey Club, LP (“New York Islanders”)
The Company provides IT related professional services to the New York Islanders, a professional hockey club that is owned by the Chairman of the Board of Directors of the Company.
Renaissance Property Associates, LLC (“Renaissance”)
Renaissance is a real estate management company owned by the Chairman of the Board of Directors of the Company. In June 2009, the Company signed a sublease agreement with Renaissance for office space in Plainview, New York. Rent expense paid by the Company to Renaissance of $103,627 and zero, inclusive of taxes and utilities, is included in selling, general and administrative expense for the three months ended March 31, 2010 and 2009, respectively.
Patstar, Inc. (“Patstar”)
Patstar, an investment holding company, is controlled by the Vice Chairman of the Board of Directors of the Company. Rent expense paid to the Company by Patstar of $999 and $891 is included as a recovery in selling, general and administrative expense for the three months ended March 31, 2010 and 2009, respectively.
Hawaii IPTV, LLC (“Hawaii”)
The Company had as an IPTV customer, Hawaii, whose principals are family members of the Chairman of the Board of Directors of the Company. Hawaii ceased operations during the third quarter of 2009.
The Smile Train, Inc. (“Smile Train”)
The Company provides IT related professional services to Smile Train, a public charity whose founder and significant benefactor is the Chairman of the Board of Directors of the Company.
K-95
The Company recognized revenue from related parties for the three months ended March 31 as follows:
| March 31, | March 31, | |||||||
| 2010 | 2009 | |||||||
| $ | $ | |||||||
| New York Islanders | 96,979 | 60,000 | ||||||
| Renaissance | 30,000 | 30,000 | ||||||
| Smile Train | 27,000 | — | ||||||
| Hawaii | — | 16,471 | ||||||
| KyLinTV | 477,213 | 401,485 | ||||||
| 631,192 | 507,956 | |||||||
As at March 31, 2010 and December 31, 2009, the amounts due from (to) related parties are as follows:
| March 31, | December 31, | |||||||
| 2010 | 2009 | |||||||
| $ | $ | |||||||
| New York Islanders | (1,035 | ) | (304 | ) | ||||
| TransVideo | (108,651 | ) | (298,291 | ) | ||||
| KyLinTV | 208,050 | 246,992 | ||||||
| 98,364 | (51,603 | |||||||
Investment in affiliate – KyLinTV
The Company records its investment in KyLinTV using the equity method.
From January 1, 2008 through February 26, 2010 the Company's equity interest in KyLinTV was 17.1%. On February 26, 2010, a group of private investors invested $10.0 million in KyLinTV, which reduced the Company’s equity interest to 12.2%. Of the total $10.0 million investment, $1.0 million was invested by AvantaLion LLC, a company controlled by the Chairman of the Board of Directors of the Company. As previously discussed, the Company also provides and charges KyLinTV for administrative and general corporate support. Management has determined that as a result of the 12.2% equity interest combined with the services that the Company provides KyLinTV, the Company continues to have significant influence on the operating activities of KyLinTV; therefore, the C ompany continues to account for its investment in KyLinTV using the equity method.
The Company’s proportionate share of the equity loss from KyLinTV has been accounted for as a charge on the Company's consolidated statements of operations and comprehensive loss. Due to KyLinTV’s accumulated losses, the investment had been reduced to zero as at December 31, 2008. No further charges will be recorded as the Company has no obligation to fund the losses of KyLinTV.
The results of operations and financial position of the Company's equity basis investment in KyLinTV are summarized below for the three months ended:
| March 31, | March 31, | |||||||
| 2010 | 2009 | |||||||
| $ | $ | |||||||
| Condensed income statement information: | ||||||||
| Net sales | 2,229,078 | 1,955,083 | ||||||
| Net loss | (1,862,297 | ) | (1,480,781 | ) | ||||
K-96
| March 31, | December 31, | |||||||
| 2010 | 2009 | |||||||
| $ | $ | |||||||
| Condensed balance sheet information: | ||||||||
| Current assets | 10,584,739 | 1,924,891 | ||||||
| Non-current assets | 890,564 | 913,977 | ||||||
| Total assets | 11,475,303 | 2,838,868 | ||||||
| Current liabilities | 5,948,049 | 15,168,149 | ||||||
| Non-current liabilities | — | — | ||||||
| Equity (deficiency) | 5,527,254 | (12,329,281 | ) | |||||
| Total liabilities and equity | 11,475,303 | 2,838,868 | ||||||
RECENTLY ISSUED ACCOUNTING PRONOUNCEMENTS
In October 2009, the Financial Accounting Standards Board issued ASU 2009-13, “Multiple-Deliverable Revenue Arrangements” (“ASU 2009-13”). ASU 2009-13 amends guidance included within ASC Topic 605-25 to require an entity to use an estimated selling price when vendor specific objective evidence or acceptable third party evidence does not exist for any products or services included in a multiple element arrangement. The arrangement consideration should be al located among the products and services based upon their relative selling prices, thus eliminating the use of the residual method of allocation. ASU 2009-13 also requires expanded qualitative and quantitative disclosures regarding significant judgments made and changes in applying this guidance. ASU 2009-13 is effective prospectively for revenue arrangements entered into or materially modified in fiscal years beginning on or after June 15, 2010. Early adoption and retrospective application are also permitted. The Company is currently evaluating the impact of adopting the provisions of ASU 2009-13.
OUTSTANDING SHARE DATA
The Company had total common shares outstanding as at May 11, 2010 of 116,800,066. In addition, as at such date the Company had 31,816,151 outstanding options, SARs, restricted share units, warrants and retention warrants, which are each exchangeable for one common share upon exercise.
DISCLOSURE CONTROLS AND CONTROLS OVER FINANCIAL REPORTING
Evaluation of Disclosure Controls and Procedures
The Company maintains appropriate disclosure controls and procedures and internal controls over financial reporting (each as defined in National Instrument 52-109, Certification of Disclosure in Issuers' Annual and Interim Filings (“NI 52-109”), of the Canadian Securities Administrators) to ensure that information disclosed externally is complete, reliable and timely. The Company's Chief Executive Officer and Chief Financial Officer evaluated, or caused an evaluation under their direct supervision of, the design and operating effectiveness of the Company's disclosure controls and procedures (“DC&P”) and internal controls over financial reporting (“ICFR”) as at March 31, 2010, and have conclud ed that such DC&P and ICFR were appropriately designed and were operating effectively, except as outlined below. See “Limitation on Scope of Design” below.
K-97
Limitation on Scope of Design
We have limited the scope of design of our internal controls and procedures and internal controls over financial reporting to exclude controls, policies and procedures of INSINC, which we acquired effective October 31, 2009. The chart below presents the summary financial information of INSINC.
| Balance Sheet Data: | Income Statement Data: | |||
| March 31, | Three months ended | |||
| 2010 | March 31, 2010 | |||
| $ | $ | |||
| Current assets | 614,858 | Total revenue | 875,774 | |
| Long-term assets | 252,969 | Total cost of revenue | 369,320 | |
| Current liabilities | 795,840 | Net income for the period | 4,762 | |
| Long-term liabilities | 82,640 |
The scope limitation is in accordance with section 3.3(1)(b) of NI 52-109 to which this MD&A relates, which allows an issuer to limit its design of DC&P and ICFR to exclude controls, policies and procedures of a business that the issuer acquired not more than 365 days prior to the end of the fiscal period.
Not applicable.
K-98
| NEULION, INC. | |
 | SAM SAMPLE 123 SAMPLES STREET SAMPLETOWN SS X9X X9X CANADA | 000001 | Security Class COMMON Holder Account Number �� C9999999999 IND |
Form of Proxy - Special Meeting to be held on September 27, 2010
This Form of Proxy is solicited by and on behalf of management of NeuLion, Inc. (the “Corporation”).
Notes to proxy
| 1. | Every holder has the right to appoint some other person or company of their choice, who need not be a holder, to attend and act on their behalf at the meeting or any adjournment or postponement thereof. If you wish to appoint a person or company other than the persons whose names are printed herein, please insert the name of your chosen proxyholder in the space provided (see reverse). |
| 2. | If the securities are registered in the name of more than one owner (for example, joint ownership, trustees, executors, etc.), then all those registered should sign this proxy. If you are voting on behalf of a corporation or another individual you must sign this proxy with signing capacity stated, and you may be required to provide documentation evidencing your power to sign this proxy. |
| 3. | This proxy should be signed in the exact manner as the name(s) appear(s) on the proxy. |
| 4. | If this proxy is not dated, it will be deemed to bear the date on which it is mailed by Management to the holder. |
| 5. | The securities represented by this proxy will be voted as directed by the holder, however, if such a direction is not made in respect of any matter, this proxy will be voted as recommended by Management. |
| 6. | The securities represented by this proxy will be voted in favour or withheld from voting or voted against each of the matters described herein, as applicable, in accordance with the instructions of the holder, on any ballot that may be called for and, if the holder has specified a choice with respect to any matter to be acted on, the securities will be voted accordingly. |
| 7. | This proxy confers discretionary authority in respect of amendments or variations to matters identified in the Notice of Meeting or other matters that may properly come before the meeting or any adjournment or postponement thereof. |
| 8. | This proxy should be read in conjunction with the accompanying documentation provided by Management. |
Proxies submitted must be received by 11:00 am (Toronto time) on September 23, 2010.
 | SAM SAMPLE | C9999999999 IND C01 |  |
Appointment of Proxyholder I/We being holder(s) of common shares of NeuLion, Inc. hereby appoint: Roy Reichbach, General Counsel and Corporate Secretary, or failing this person, Arthur McCarthy, Chief Financial Officer | OR | Print the name of the person you are appointing if this person is someone other than the Management Nominees listed herein. | |
as my/our proxyholder with full power of substitution and to attend, act and to vote for and on behalf of the shareholder in accordance with the following directions (or if no directions have been given, as the proxyholder sees fit) and all other matters that may properly come before the Special Meeting (the “Meeting”) of shareholders of NeuLion, Inc. (“NeuLion” or the “Corporation”) to be held at the offices of McCarthy Tétrault LLP, Suite 5300, Toronto Dominion Bank Tower, Toronto, ON M5K 1E6, Canada, on September 27, 2010 at 11:00 am (Toronto time) and at any adjournment or postponement thereof.
| VOTING RECOMMENDATIONS ARE INDICATED BY | HIGHLIGHTED TEXT | OVER THE BOXES. |
| For | Against | ||
1.TransVideo Acquisition Management recommends that you vote FOR a resolution authorizing and approving the acquisition of all of the issued and outstanding shares of TransVideo International Ltd. in exchange for 22,000,802 common shares of the Corporation, as more specifically set out in the Information Circular (the "Circular") accompanying the notice of the Meeting (the "Notice"). | o | o | |
| For | Against | ||
2.Articles of Amendment Management recommends that you vote FOR a special resolution authorizing and approving the amendment of the articles of the Corporation in order to create the Class 3 Preference Shares ("Class 3 Preference Shares"), as more specifically set out in the Circular accompanying the Notice. | o | o | |
| For | Against | ||
3.Private Placement Management recommends that you vote FOR a resolution authorizing and approving the issuance of approximately 16,666,667 Class 3 Preference Shares to JK & B Capital V, L.P., JK&B Capital V Special Opportunities Fund, L.P. and Gabriel A. Battista, as more specifically set out in the Circular accompanying the Notice. | o | o |
Authorized Signature(s) - This section must be completed for your instructions to be executed. | Signature(s) | Date | ||
I/We authorize you to act in accordance with my/our instructions set out above. I/We hereby revoke any proxy previously given with respect to the Meeting. If no voting instructions are indicated above, this Proxy will be voted as recommended by Management. |  | |||