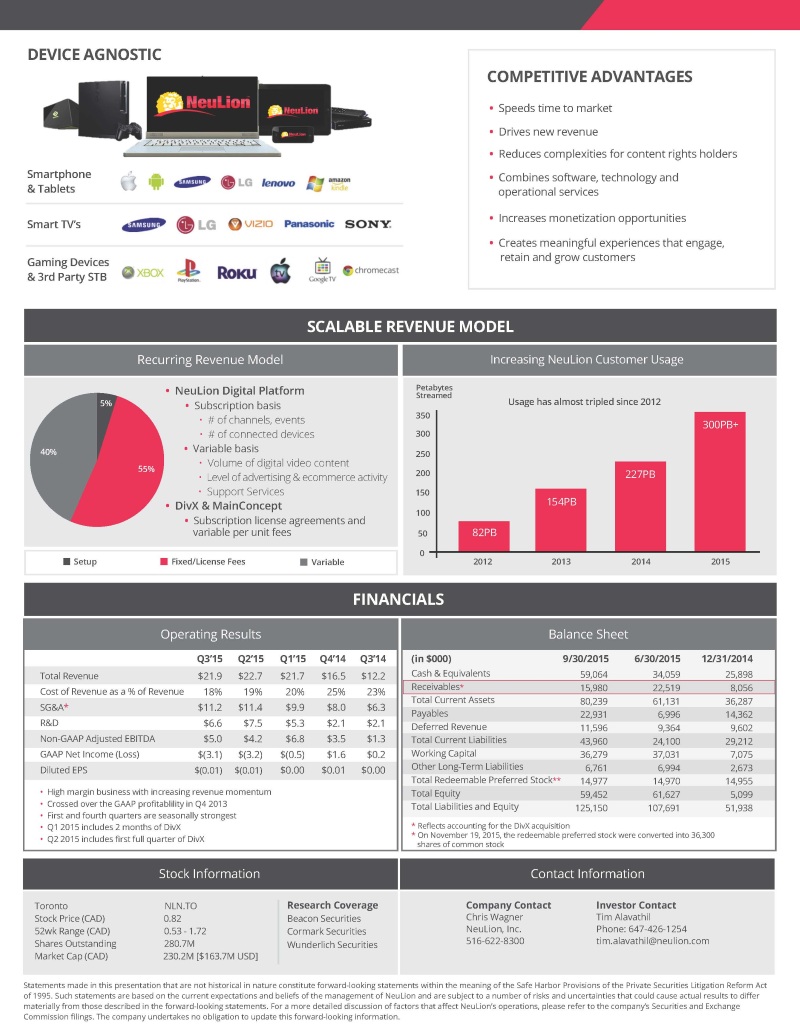
Investor Factsheet neulion.com NeuLion offers solutions that power the highest quality digital experiences for live and on-demand content up to 4K anywhere, on any device. Through its end-to-end technology platform, NeuLion enables digital content management, distribution and monetization across the entire ecosystem — content owners, content creators and consumers. The company’s complete OTT and TVE solution reduces complexities for content rights holders, speeds time to market and enables scalability. GROWTH INITIATIVES • Land new clients • Expand existing relationships • Enhance technology and product offerings • Strategic partnerships and acquisitions INVESTMENT HIGHLIGHTS • Enormous industry tailwinds and market opportunity • Proprietary, turnkey, end-to-end, cloud-based configurable solution • Large, well-known blue-chip customer base • Compelling financial metrics • Respected and experienced leadership team EMPOWERING THE ECOSYSTEM Multi-Screen OTT Consumer Electronic Professional Content & TVE Platform Licensing Tools & Technologies BLUE CHIP CUSTOMER BASE Sports & TVE Technology Value Chain Consumer Software Consumer Electronics From content creators and providers to technology and consumer electronics ACCELERATING ADOPTION OF DIGITAL VIDEO DRIVING NEULION’S GROWTH Internet Video Traffic (Exabytes) (1) 120 90 104.9 60 30 25 0 2014 2019 (1) Cisco VNI Global IP Traffic Forecast 2014-2019 as of May 2015 (2) Parks Associates Growth of 4K Resolution and Adoption Global 4K-enabled TV Shipments (Millions of Units) (2) 124 100 330+ 75 50 25 11.6 0 2014 2019 DEVICE AGNOSTIC COMPETITIVE ADVANTAGES • Speeds time to market • Drives new revenue • Reduces complexities for content rights holders Smartphone & Tablets Smart TV’s Gaming Devices & 3rd Party STB Recurring Revenue Model • NeuLion Digital Platform • Combines software, technology and operational services • Increases monetization opportunities • Creates meaningful experiences that engage, retain and grow customers SCALABLE REVENUE MODEL Increasing NeuLion Customer Usage Petabytes Streamed 5% 40% 55% Setup • Subscription basis • # of channels, events • # of connected devices • Variable basis • Volume of digital video content • Level of advertising & ecommerce activity • Support Services • DivX & MainConcept • Subscription license agreements and variable per unit fees Fixed/License Fees Variable Usage has almost tripled since 2012 350 300PB+ 300 250 200 227PB 150 154PB 100 50 82PB 0 2012 2013 2014 2015 FINANCIALS Operating Results Q3’15 Q2’15 Total Revenue $21.9 $22.7 Q1’15 Q4’14 Q3’14 (in $000) Cash & Equivalents $21.7 $16.5 $12.2 Balance Sheet 9/30/2015 6/30/2015 12/31/2014 59,064 34,059 25,898 Cost of Revenue as a % of Revenue 18% 19% 20% 25% 23% SG&A* $11.2 $11.4 $9.9 $8.0 $6.3 R&D $6.6 $7.5 $5.3 $2.1 $2.1 Non-GAAP Adjusted EBITDA $5.0 $4.2 $6.8 $3.5 $1.3 GAAP Net Income (Loss) $(3.1) $(3.2) $(0.5) $1.6 $0.2 Diluted EPS $(0.01) $(0.01) $0.00 $0.01 $0.00 • High margin business with increasing revenue momentum • Crossed over the GAAP profitablility in Q4 2013 • First and fourth quarters are seasonally strongest • Q1 2015 includes 2 months of DivX • Q2 2015 includes first full quarter of DivX Receivables* 15,980 22,519 8,056 Total Current Assets 80,239 61,131 36,287 Payables 22,931 6,996 14,362 Deferred Revenue 11,596 9,364 9,602 Total Current Liabilities 43,960 24,100 29,212 Working Capital 36,279 37,031 7,075 Other Long-Term Liabilities 6,761 6,994 2,673 Total Redeemable Preferred Stock** 14,977 14,970 14,955 Total Equity 59,452 61,627 5,099 Total Liabilities and Equity 125,150 107,691 51,938 * Reflects accounting for the DivX acquisition * On November 19, 2015, the redeemable preferred stock were converted into 36,300 shares of common stock Stock Information Contact Information Toronto NLN.TO Research Coverage Company Contact Investor Contact Stock Price (CAD) 0.82 Beacon Securities Chris Wagner Tim Alavathil 52wk Range (CAD) 0.53 - 1.72 Cormark Securities NeuLion, Inc. Phone: 647-426-1254 Shares Outstanding 280.7M Wunderlich Securities 516-622-8300 tim.alavathil@neulion.com Market Cap (CAD) 230.2M [$163.7M USD] Statements made in this presentation that are not historical in nature constitute forward-looking statements within the meaning of the Safe Harbor Provisions of the Private Securities Litigation Reform Act of 1995. Such statements are based on the current expectations and beliefs of the management of NeuLion and are subject to a number of risks and uncertainties that could cause actual results to differ materially from those described in the forward-looking statements. For a more detailed discussion of factors that affect NeuLion’s operations, please refer to the company’s Securities and Exchange Commission filings. The company undertakes no obligation to update this forward-looking information.