UNITED STATES
SECURITIES AND EXCHANGE COMMISSION
Washington, D.C. 20549
FORM N-CSR/A
CERTIFIED SHAREHOLDER REPORT OF REGISTERED MANAGEMENT INVESTMENT COMPANIES
Investment Company Act file number 811-22027
FundVantage Trust
(Exact name of registrant as specified in charter)
301 Bellevue Parkway
Wilmington, DE 19809
(Address of principal executive offices) (Zip code)
Joel L. Weiss
JW Fund Management LLC
100 Springdale Rd., Suite A3-416
Cherry Hill, NJ 08003
(Name and address of agent for service)
Registrant’s telephone number, including area code: 856-528-3500
Date of fiscal year end: April 30
Date of reporting period: April 30, 2017
EXPLANATORY NOTE: Registrant is filing this amendment to its Form N-CSR for the fiscal quarter ended April 30, 2017 originally filed with the Securities and Exchange Commission on July 7, 2017 (Accession Number 0001193125-17-224297). The purpose of this amendment is to revise the Aggregate Audit Fees under Item 4(a) which was previously incorrect. Except as set forth above, this amendment does not amend, update or change any other items or disclosures found in the original Form N-CSR filing.
Form N-CSR is to be used by management investment companies to file reports with the Commission not later than 10 days after the transmission to stockholders of any report that is required to be transmitted to stockholders under Rule 30e-1 under the Investment Company Act of 1940 (17 CFR 270.30e-1). The Commission may use the information provided on Form N-CSR in its regulatory, disclosure review, inspection, and policymaking roles.
A registrant is required to disclose the information specified by Form N-CSR, and the Commission will make this information public. A registrant is not required to respond to the collection of information contained in Form N-CSR unless the Form displays a currently valid Office of Management and Budget (“OMB”) control number. Please direct comments concerning the accuracy of the information collection burden estimate and any suggestions for reducing the burden to Secretary, Securities and Exchange Commission, 450 Fifth Street, NW, Washington, DC 20549-0609. The OMB has reviewed this collection of information under the clearance requirements of 44 U.S.C. § 3507.
Item 1. Reports to Stockholders.
The Reports to Shareholders are attached herewith.
BRADESCO LATIN AMERICAN EQUITY FUND
Annual Investment Adviser’s Report
April 30, 2017
(Unaudited)
Dear Shareholder,
Across the globe, the last twelve months will be remembered for the political backlash against globalization.
In the US, Donald Trump’s shock victory in the Presidential election demonstrated the power of an economic platform based on protectionism (in terms of trade and immigration flows) and fiscal expansion (through tax cuts and the expansion of infrastructure investments).
In Europe, the UK voted to leave the European Union, creating uncertainty across the continent about not only the economic implications but also the political consequences of the split. Also within the framework of increasing conservatism, the Italian population rejected a referendum that would have seen some modernization of the Italian political system, the failed vote climaxing in the resignation of Prime Minister, Matteo Renzi.
In the face of increasing global uncertainty and the absence of inflationary pressure, monetary authorities in the Eurozone, UK and Japan decided to broaden accommodative policies. Going against this movement, the US Federal Reserve raised interest rates, due to a tightening labor market and an expected increase of inflation.
In China, the government was active in trying to revive the economy, adding fiscal and monetary stimulus, removing fears of a sharp slowdown in economic activity.
China’s economic activity was strong in the first months of 2017. Nonetheless, we expect economic growth in China to weaken, particularly after mid-2017, as the government tightens policy. Three recent developments support this expectation. First, after monetary and fiscal easing that started at the end of the second half of 2015 and continued for most of 2016, the government initiated a policy shift in late September 2016 by implementing macroprudential measures to cool off the Property sector. Second, the central bank hiked several policy rates in early 2017.
Finally, the government has lowered its GDP growth target, setting a 2017 goal of around 6.5% in 2017, compared with its 6.5%-7.0% target for 2016.
Overall, in 2016, the divergence of monetary policy between the US and other developed countries continued. In summary, even though short-term impacts of politically disruptive dialogues on the real economy were lower than expected, in the medium term they could be detrimental to the world economy.
In Brazil, continuing recession and progress with fiscal reforms creates space for the start of a rate cutting cycle. For 2016, Brazil’s GDP declined by 3.6%, following a contraction of 3.8% in 2015. Political instability, lack of investor and consumer confidence, high-interest rates and deterioration of the labor market form the backdrop of this negative environment. As a direct consequence of weak domestic demand,
1
BRADESCO LATIN AMERICAN EQUITY FUND
Annual Investment Adviser’s Report (Continued)
April 30, 2017
(Unaudited)
inflation fell from 10.7% in 2015 to 6.3% in 2016. Another result of extended economic contraction is fiscal deterioration and its knock-on effect on public debt, requiring a review of public sector spending. In this sense, the approval of the Proposed Amendment to the Constitution (PEC 241), which stipulates a ceiling for the growth of public spending, was a sign that Congress was ready to restore fiscal balance. In addition, the government also sent Congress a proposal for Pension Reform. Falling inflation (current and expected) and improvement of the fiscal perspective in the medium term was fundamental for COPOM to reduce the SELIC rate by 300 basis points as of April 2017 (to 11.25%). In summary, despite the negative repercussions of the economic contraction, the main positive of 2016 was that the government began trying to find solutions to structural problems, such as in the case of public spending.
In Mexico, economic activity has been resilient, in spite of the recent shocks. The deterioration in bilateral relations with its top trading partner (the U.S.) and the sharp rise of inflation (caused by the liberalization of gasoline prices and the MXN sell-off) have weakened Mexico’s growth prospects. Yet Mexico’s GDP growth only slowed down moderately in 2016, to 2.3% (from 2.6% in 2015), and activity began 2017 on solid footing (the monthly GDP proxy rose by 3% year over year in January).
Overall, higher inflation (eating through real wages), tighter monetary and fiscal policies, and the uncertainties surrounding trade relations with the U.S. will likely weigh down internal demand, while exports will likely be a buffer. Importantly, the central bank just announced a whopping dividend of MXN 321.7 billion (1.5% of GDP) stemming from exchange-rate gains on international reserves. This dividend, recorded as government revenues, marks a crucial step toward meeting the government’s fiscal targets in 2017 and hence averting a rating downgrade. Of course, the reduced likelihood of a downgrade is positive for the MXN valuation, which had been appreciating recently as a result of central bank intervention and the more constructive dialogue between the Mexican and U.S. governments.
Peru’s growth prospects have weakened substantially after two unexpected shocks. First, a corruption scandal involving previous administrations and construction firms has paralyzed some of the largest infrastructure projects in the country. Second, a weather shock that began as heavy rainfall in January has mutated into a full-fledged “coastal El Niño”, triggering destructive flooding and landslides. The impact on activity, though likely to be temporary and concentrated in agriculture and fishing in the northern coast, extends to the manufacturing (Lima’s eastern industrial area was severely affected), construction and mining industries. Against this backdrop, the government is expected to implement expansive macro policies. The Ministry of Finance has already announced a fiscal stimulus package (0.8 pp of GDP). The central bank is likely to cut rates, but it will probably wait a bit (at least until it is confident that inflation expectations will remain anchored). Also, the strong increase of the terms of trade (driven by metal prices) will serve as a cushion against these economic headwinds.
2
BRADESCO LATIN AMERICAN EQUITY FUND
Annual Investment Adviser’s Report (Continued)
April 30, 2017
(Unaudited)
Portfolio Review and Outlook
Latam equities had a good run in the last twelve months, posting a strong 17% in USD led by Brazilian (29.7%) and Chilean (15.4%) markets. Sector-wise the main highlights were Materials and Financials.
The performance, however, was uneven. Mexico posted a negative 1.7% performance while Colombia delivered a positive 1.9%.
The inflection point in Brazilian politics together with the turnaround in commodities favored the notable outperformance of the Brazilian equity market. The rally in commodity prices that began in 4Q16 extended into 1Q17.
Fund-wise, we saw a positive gain of 13.63% in the period, but the fund underperformed the benchmark by 2.73%.
The largest detractor to performance relative to the index was the index’s weighting in Banco Bradesco, in which the fund is not permitted to invest because of regulatory constraints. During the period Banco Bradesco was up 29%.
Brazilian banks were particularly benefited by the strong flows into EM and Brazilian markets.
Investors were positive in Brazil mainly due to (1) gradual advances of reforms to allow a more benign trajectory for the country’s debt-to-GDP dynamics and overall competiveness; (2) declining domestic interest rates to boost economic activity in the second half of 2017 onwards, lower discount rates for equities and increase attractiveness of equities versus domestic fixed income; and (3) a benign outlook for a hefty earnings growth range in 2017-2018 given low base, high commodity prices, strong USD-BRL, lower interest rates and operating leverage as Brazil finds its way out of recession.
We prefer Itau over Bradesco.
The second largest detractor was our underweight in America Movil. The stock was up 11.04% in USD. We are underweight on AMX, given increasing competition in Mexico and Colombia, coupled with a tough regulatory environment, which is taking a toll on profitability.
The company’s first quarter of 2017 results surprised on the upside, with revenues up 19% y/y, EBITDA up 6% y/y and Earnings up 13x. Most of the beat came from a 4% weaker MXN, while also counting with improvements in Brazil, Colombia and smaller operations. Mexico came slightly below expectations in revenues and margins.
3
BRADESCO LATIN AMERICAN EQUITY FUND
Annual Investment Adviser’s Report (Continued)
April 30, 2017
(Unaudited)
The performance data quoted represents past performance and is no guarantee of future results. Investment return and principal value will fluctuate so that an investor’s shares, when redeemed, may be worth more or less than their original cost. Current performance may be lower or higher. For performance current to the most recent month-end, please call (866) 640-5705.
Brazil posted relevant improvements in mobile growth and margins. Mobile service revenues accelerated sequentially, signaling a more rational pricing behavior and possibly indicating a positive read-across for Vivo/Tim. Margins improved on cost reductions associated with certain technical areas.
Still on the negative side, our overweight in Concentradora Fibra Danhos, an experienced real estate developer, contributed negatively to performance as the stock dropped 18% in the period.
Adverse performance could be in part explained by the interest rate cycle but also by the impact that Trump initiatives could have on Mexico and especially on industrial real estate assets.
On the positive side, our overweight in Itau worked well and was the most important contributor to performance.
We are positive in Itau as we believe Itau has been the most proactive Brazilian bank in adjusting its business model to the more challenging business environment in recent years (high indebtedness levels, deterioration in growth conditions, competition from government-controlled banks) by reducing costs, making opportunistic acquisitions, growing fee businesses, improving the digital channel and de-risking its loan portfolio.
Another important contributor to performance was our overweight on Cia Energetica de Sao Paulo (“CESP”). The stock outperformed on the back of government talks resuming studies for the potential privatization of CESP. According to the management team, political developments, the end of the power crisis and the normalization of micro conditions removed uncertainties that dented the possibilities of privatization in the past few years.
Latam equity fundamentals have begun to see some improvement in the second half of the year. Recovery in commodity prices, improving default trends, and stronger foreign currency in the second half of 2016 have started to materialize in better rating trends, while continued capex reductions, liability management exercises, and conservative corporate behavior (with some exceptions) have helped alleviate the pressure of declining earnings growth.
However, while many of these trends should carry on, the uncertainty about the new US administration’s policies has increased the risks for the trajectory of the region.
In particular, the outlook for Latin America has turned less clear as countries such as Mexico are in the direct firing line of US trade protectionism and the risks around the magnitude of the expected economic recovery of the region are pointing to the downside. Additionally, corruption-related headlines involving Temer’s government in Brazil are reminders of the country’s still fragile recovery prospects.
4
BRADESCO LATIN AMERICAN EQUITY FUND
Annual Investment Adviser’s Report (Concluded)
April 30, 2017
(Unaudited)
As a result, while growth in Latin America is expected to pick up in 2017, Bradesco Asset Management forecasts are now more tepid than a few months back.
Also, despite offering compelling investment opportunities within EM peers, Latin America is still vulnerable to global factors.
Natalia Kerkis – Portfolio Manager
May 22, 2017
This letter is intended to assist shareholders in understanding how the Fund performed during the fiscal year ended April 30, 2017 and reflects the views of the investment adviser at the time of this writing. Of course, these views may change and do not guarantee the future performance of the Fund or the markets.
Portfolio composition is subject to change. The current and future portfolio holdings of the Fund are subject to investment risks. The investment return and principle value of an investment in the Fund will fluctuate so that an investor’s shares, when redeemed, may be worth more or less than their original cost.
5
BRADESCO LATIN AMERICAN HARD CURRENCY BOND FUND
Annual Investment Adviser’s Report
April 30, 2017
(Unaudited)
Dear Fund Shareholder,
Across the globe, the last twelve months will be remembered for the political backlash against globalization.
In the US, Donald Trump’s shock victory in the Presidential election demonstrated the power of an economic platform based on protectionism (in terms of trade and immigration flows) and fiscal expansion (through tax cuts and the expansion of infrastructure investments).
In Europe, the UK voted to leave the European Union, creating uncertainty across the continent about not only the economic implications but also the political consequences of the split. Also within the framework of increasing conservatism, the Italian population rejected a referendum that would have seen some modernization of the Italian political system, the failed vote climaxing in the resignation of Prime Minister, Matteo Renzi.
In the face of increasing global uncertainty and the absence of inflationary pressure, monetary authorities in the Eurozone, UK and Japan decided to broaden accommodative policies. Going against this movement, the US Federal Reserve raised interest rates, due to a tightening labor market and an expected increase of inflation.
In China, the government was active in trying to revive the economy, adding fiscal and monetary stimulus, removing fears of a sharp slowdown in economic activity.
China’s economic activity was strong in the first months of 2017. Nonetheless, we expect economic growth in China to weaken, particularly after mid-2017, as the government tightens policy. Three recent developments support this expectation. First, after monetary and fiscal easing that started at the end of the second half of 2015 and continued for most of 2016, the government initiated a policy shift in late September 2016 by implementing macroprudential measures to cool off the Property sector. Second, the central bank hiked several policy rates in early 2017.
Finally, the government has lowered its GDP growth target, setting a 2017 goal of around 6.5% in 2017, compared with its 6.5%-7.0% target for 2016.
Overall, in 2016, the divergence of monetary policy between the US and other developed countries continued. In summary, even though short-term impacts of politically disruptive dialogues on the real economy were lower than expected, in the medium term they could be detrimental to the world economy.
In Brazil, continuing recession and progress with fiscal reforms creates space for the start of a rate cutting cycle. For 2016, Brazil’s GDP declined by 3.6%, following a contraction of 3.8% in 2015. Political instability, lack of investor and consumer confidence, high-interest rates and deterioration of the labor market form the backdrop of this negative environment. As a direct consequence of weak domestic demand,
6
BRADESCO LATIN AMERICAN HARD CURRENCY BOND FUND
Annual Investment Adviser’s Report (Continued)
April 30, 2017
(Unaudited)
inflation fell from 10.7% in 2015 to 6.3% in 2016. Another result of extended economic contraction is fiscal deterioration and its knock-on effect on public debt, requiring a review of public sector spending. In this sense, the approval of the Proposed Amendment to the Constitution (PEC 241), which stipulates a ceiling for the growth of public spending, was a sign that Congress was ready to restore fiscal balance. In addition, the government also sent Congress a proposal for Pension Reform. Falling inflation (current and expected) and improvement of the fiscal perspective in the medium term was fundamental for The Monetary Policy Committee of the Brazilian Central Bank (“COPOM”) to reduce the SELIC rate (the Brazilian Central Bank’s overnight rate) by 300 basis points as of April 2017 (to 11.25%). In summary, despite the negative repercussions of the economic contraction, the main positive of 2016 was that the government began trying to find solutions to structural problems, such as in the case of public spending.
In Mexico, economic activity has been resilient, in spite of the recent shocks. The deterioration in bilateral relations with its top trading partner (the U.S.) and the sharp rise of inflation (caused by the liberalization of gasoline prices and the Mexican peso (“MEX”) sell-off) have weakened Mexico’s growth prospects. Yet Mexico’s GDP growth only slowed down moderately in 2016, to 2.3% (from 2.6% in 2015), and activity began 2017 on solid footing (the monthly GDP proxy rose by 3% year over year in January).
Overall, higher inflation (eating through real wages), tighter monetary and fiscal policies, and the uncertainties surrounding trade relations with the U.S. will likely weigh down internal demand, while exports will likely be a buffer. Importantly, the central bank just announced a whopping dividend of MXN 321.7 billion (1.5% of GDP) stemming from exchange-rate gains on international reserves. This dividend, recorded as government revenues, marks a crucial step toward meeting the government’s fiscal targets in 2017 and hence averting a rating downgrade. Of course, the reduced likelihood of a downgrade is positive for the MXN valuation, which had been appreciating recently as a result of central bank intervention and the more constructive dialogue between the Mexican and U.S. governments.
Peru’s growth prospects have weakened substantially after two unexpected shocks. First, a corruption scandal involving previous administrations and construction firms has paralyzed some of the largest infrastructure projects in the country. Second, a weather shock that began as heavy rainfall in January has mutated into a full-fledged “coastal El Niño”, triggering destructive flooding and landslides. The impact on activity, though likely to be temporary and concentrated in agriculture and fishing in the northern coast, extends to the manufacturing (Lima’s eastern industrial area was severely affected), construction and mining industries. Against this backdrop, the government is expected to implement expansive macro policies. The Ministry of Finance has already announced a fiscal stimulus package (0.8 pp of GDP). The central bank is likely to cut rates, but it will probably wait a bit (at least until it is confident that inflation expectations will remain anchored). Also, the strong increase of the terms of trade (driven by metal prices) will serve as a cushion against these economic headwinds.
7
BRADESCO LATIN AMERICAN HARD CURRENCY BOND FUND
Annual Investment Adviser’s Report (Continued)
April 30, 2017
(Unaudited)
Portfolio Review and Outlook
From May 1, 2016 to April 30, 2017 the Bradesco Latin American Hard Currency Bond Fund (the “Fund”) Institutional Class shares returned 9.82%. The CS (Credit Suisse) Latin America Corporate Index 0-6Y A/B Buckets, the Fund’s benchmark, performed 10.64% during the same period.
Brazil has been the best performing country in the period. The resilience recently shown by the Brazilian corporate bonds has been surprising investors. Following the strong performance delivered until the broad market correction in November (US elections), spreads across the class kept narrowing over the following months amid a tough sequence of domestic and international events.
Brazil benefited from positive political events. In particular, Brazil’s outperformance was triggered notably by the impeachment of Dilma Rousseff and the change in government that followed. Just to have an idea of the change in the mood regarding Brazilian assets, 5Y Brazilian CDS was at the 340 level in April 2017 and moved down to 218 in April 2017. Strong spread compression in Brazilian curve also contributed positively to performance as the country represents around 75% of the fund.
Our strategy to be invested in government related companies after the impeachment in Brazil proved to be right as we were able to capture the compression of the spreads and outperformance of those companies.
All sectors delivered solid performances, but Oil & Gas (with Petrobras being the main highlight due to the change in management), Metals & Mining (mainly due to higher commodity prices and CSN, Vale, Gerdau) and Financials (BANBRA perps, Caixa’s curve) were the best performing sectors in the period (based on returns and attribution).
Looking at individual performance, it is not surprising that most of the outperformers were Brazilian credits. In particular, the long-end of Petrobras, Vale, Gerdau and Banco do Brazil curves are among the best performing credits.
Latam corporate fundamentals have begun to see some improvement in the second half of the year. Recovery in commodity prices, improving default trends, and stronger FX in 2H16 have started to materialize in better credit rating trends, while continued capex reductions, liability management exercises, and conservative corporate behavior (with some exceptions) have helped alleviate the pressure of declining earnings growth.
However, while many of these trends should carry on, the uncertainty about the new US administration’s policies has increased the risks for the trajectory of the region.
8
BRADESCO LATIN AMERICAN HARD CURRENCY BOND FUND
Annual Investment Adviser’s Report (Concluded)
April 30, 2017
(Unaudited)
In particular, the outlook for Latin America has turned less clear as countries such as Mexico are in direct firing line of US trade protectionism and the risks around the magnitude of the expected economic recovery of the region are pointing to the downside. Additionally, corruption-related headlines involving Temer’s government in Brazil are reminders of the country’s still fragile recovery prospects.
As a result, while growth in Latin America is expected to pick up in 2017, Bradesco Asset Management forecasts are now more tepid than a few months back.
Also, despite offering the highest yields among Emerging Market peers, Latin America is more vulnerable to global factors.
However, the region is more sensitive to interest rate fluctuations given its longer average duration and the main base of bondholders is dominated by foreign investors rather than locals, which makes it more vulnerable to fund outflows.
Clayton Rodrigues – Portfolio Manager
May 22, 2017
This letter is intended to assist shareholders in understanding how the Fund performed during the fiscal year ended April 30, 2017 and reflects the views of the investment adviser at the time of this writing. Of course, these views may change and do not guarantee the future performance of the Fund or the markets.
Portfolio composition is subject to change. The current and future portfolio holdings of the Fund are subject to investment risks. The investment return and principle value of an investment in the Fund will fluctuate so that an investor’s shares, when redeemed, may be worth more or less than their original cost.
9
BRADESCO LATIN AMERICAN EQUITY FUND
Annual Report
Performance Data
April 30, 2017
(Unaudited)
Comparison of Change in Value of $100,000 (investment minimum) Investment in Bradesco Latin American Equity Fund’s Institutional Class vs. MSCI EM (Emerging Markets) Latin America Net Total Return Index.
Average Annual Total Returns for the Periods Ended April 30, 2017 | ||||||||||||
| 1 Year | 3 Year | Since Inception | ||||||||||
Institutional Class | 13.63 | % | -6.49 | % | -5.15%* | |||||||
MSCI EM (Emerging Markets) Latin America Net | ||||||||||||
Total Return Index | 16.36 | % | -4.83 | % | -3.06%** | |||||||
| * | Institutional Class shares of the Bradesco Latin American Equity Fund (the “Fund”) commenced operations on December 20, 2013. |
| ** | Benchmark performance is from the commencement date of Institutional Class shares of the Fund (December 20, 2013) and is not the commencement date of the benchmark itself. |
The performance data quoted represents past performance and does not guarantee future results. The investment return and principal value of an investment in the Fund will fluctuate so that an investor’s shares, when redeemed, may be worth more or less than their original cost. The graph and table do not reflect the deduction of taxes that a shareholder would pay on Fund distributions or redemption of Fund shares. Current performance may be lower or higher. Performance data current to the most recent month-end may be obtained by calling (866) 640-5705.
The Fund’s total gross and net operating expense ratio, as stated in the current prospectus dated September 1, 2016, is 2.99% and 1.76%, respectively, of the Fund’s average daily net assets for Institutional Class shares, which may differ from the actual expenses incurred by the Fund for the period covered by this report. A 2.00% redemption fee applies to shares redeemed within 30 days of purchase. The redemption fee is not reflected in the returns shown above. BRAM US LLC (“BRAM US” or the “Adviser”) has contractually agreed to waive or otherwise reduce its annual compensation received from the Fund to the extent necessary to ensure that the Fund’s “Total Annual Fund Operating Expenses”, excluding taxes, any class specific fees and expenses (such as Rule 12b-1 distribution fees, shareholder service fees or transfer agency fees) “Acquired Fund” fees and expenses, interest, extraordinary items and brokerage
10
BRADESCO LATIN AMERICAN EQUITY FUND
Annual Report
Performance Data
April 30, 2017
(Unaudited)
commissions, do not exceed 1.75% of average daily net assets of the Fund (the “Expense Limitation”). The Expense Limitation will remain in place until August 31, 2017, unless the Board of Trustees of the FundVantage Trust (the “Trust”) approves its earlier termination. The Adviser may recoup any expenses or fees it has reimbursed within a three-year period from the year in which the Adviser reduced its compensation and/or assumed expenses of the Fund. The Adviser is permitted to seek reimbursement from the Fund, subject to certain limitations, for fees it waived and Fund expenses it paid to the extent the total annual fund operating expenses do not exceed the limits described above or any lesser limits in effect as the time of reimbursement. No recoupment will occur unless the Fund’s expenses are below the Expense Limitation.
The Fund intends to evaluate performance as compared to that of the MSCI EM (Emerging Markets) Latin America Net Total Return Index (net of foreign withholding taxes) (the “Index”). The Index is a free float-adjusted market capitalization weighted index that is designed to measure the equity market performance of emerging markets in Latin America. The MSCI EM (Emerging Markets) Latin America Net Total Return Index consists of the following 5 emerging market country indexes: Brazil, Chile, Colombia, Mexico, and Peru. An index is unmanaged and it is not possible to invest in an index.
The Fund is non-diversified which means it may be invested in a limited number of issuers geographically particularly Latin America and more susceptible to any economic, political and regulatory events. The Fund invests primarily in markets of emerging countries which are riskier and may be considered speculative. In addition, many emerging securities markets have far lower trading volumes, currency devaluation risk and less liquidity than developed markets. The Fund may invest in derivatives (futures, options, and swaps), depositary receipts and small to mid-capitalization companies all of which may cause greater volatility and less liquidity. Funds that invest in derivatives are subject to the risks of the underlying securities which may be more sensitive to changes in market conditions and may amplify risks. The use of certain derivatives may also have a leveraging effect which may increase the volatility of the Fund and reduce its returns.
Foreign securities are subject to political, social, or economic risks including instability in the country of the issuer of a security, variation in international trade patterns, the possibility of the imposition of exchange controls, expropriation, confiscatory taxation, limits on movement to currency or other assets and nationalization of assets.
11
BRADESCO LATIN AMERICAN EQUITY FUND
Annual Report
Performance Data
April 30, 2017
(Unaudited)
Comparison of Change in Value of $10,000 Investment in Bradesco Latin American Equity Fund’s Retail Class vs. MSCI EM (Emerging Markets) Latin America Net Total Return Index.
Average Annual Total Returns for the Periods Ended April 30, 2017 | ||||||||
| 1 Year | Since Inception | |||||||
Retail Class | 13.43 | % | -8.83%* | |||||
MSCI EM (Emerging Markets) Latin America Net | ||||||||
Total Return Index | 16.36 | % | -6.46%** | |||||
| * | Retail Class shares of the Bradesco Latin American Equity Fund (the “Fund”) commenced operations on June 9, 2014. |
| ** | Benchmark performance is from the commencement date of Retail Class shares of the Fund (June 9, 2014) only and is not the commencement date of the benchmark itself. |
The performance data quoted represents past performance and does not guarantee future results. The investment return and principal value of an investment in the Fund will fluctuate so that an investor’s shares, when redeemed, may be worth more or less than their original cost. The graph and table do not reflect the deduction of taxes that a shareholder would pay on Fund distributions or redemption of Fund shares. Current performance may be lower or higher. Performance data current to the most recent month-end may be obtained by calling (866) 640-5705.
The Fund’s total gross and net operating expense ratio, as stated in the current prospectus dated September 1, 2016, is 3.24% and 2.01%, respectively, of the Fund’s average daily net assets for Retail Class shares, which may differ from the actual expenses incurred by the Fund for the period covered by this report. A 2.00% redemption fee applies to shares redeemed within 30 days of purchase. The redemption fee is not reflected in the returns shown above. BRAM US LLC (“BRAM US” or the “Adviser”) has contractually agreed to waive or otherwise reduce its annual compensation received from the Fund to the extent necessary to ensure that the Fund’s “Total Annual Fund Operating Expenses”, excluding taxes, any class specific fees and expenses (such as Rule 12b-1 distribution fees, shareholder service fees or transfer agency fees) “Acquired Fund” fees and expenses, interest, extraordinary items and brokerage
12
BRADESCO LATIN AMERICAN EQUITY FUND
Annual Report
Performance Data (Concluded)
April 30, 2017
(Unaudited)
commissions, do not exceed 1.75% of average daily net assets of the Fund (the “Expense Limitation”). The Expense Limitation will remain in place until August 31, 2017, unless the Board of Trustees of the FundVantage Trust (the “Trust”) approves its earlier termination. The Adviser may recoup any expenses or fees it has reimbursed within a three-year period from the year in which the Adviser reduced its compensation and/or assumed expenses of the Fund. The Adviser is permitted to seek reimbursement from the Fund, subject to certain limitations, for fees it waived and Fund expenses it paid to the extent the total annual fund operating expenses do not exceed the limits described above or any lesser limits in effect as the time of reimbursement. No recoupment will occur unless the Fund’s expenses are below the Expense Limitation.
The Fund intends to evaluate performance as compared to that of the MSCI EM (Emerging Markets) Latin America Net Total Return Index (net of foreign withholding taxes) (the “Index”). The Index is a free float-adjusted market capitalization weighted index that is designed to measure the equity market performance of emerging markets in Latin America. The MSCI EM (Emerging Markets) Latin America Net Total Return Index consists of the following 5 emerging market country indexes: Brazil, Chile, Colombia, Mexico, and Peru. An index is unmanaged and it is not possible to invest in an index.
The Fund is non-diversified which means it may be invested in a limited number of issuers geographically particularly Latin America and more susceptible to any economic, political and regulatory events. The Fund invests primarily in markets of emerging countries which are riskier and may be considered speculative. In addition, many emerging securities markets have far lower trading volumes, currency devaluation risk and less liquidity than developed markets. The Fund may invest in derivatives (futures, options, and swaps), depositary receipts and small to mid-capitalization companies all of which may cause greater volatility and less liquidity. Funds that invest in derivatives are subject to the risks of the underlying securities which may be more sensitive to changes in market conditions and may amplify risks. The use of certain derivatives may also have a leveraging effect which may increase the volatility of the Fund and reduce its returns.
Foreign securities are subject to political, social, or economic risks including instability in the country of the issuer of a security, variation in international trade patterns, the possibility of the imposition of exchange controls, expropriation, confiscatory taxation, limits on movement to currency or other assets and nationalization of assets.
13
BRADESCO LATIN AMERICAN HARD CURRENCY BOND FUND
Annual Report
Performance Data
April 30, 2017
(Unaudited)
Comparison of Change in Value of $100,000 (investment minimum) Investment in Bradesco Latin American Hard Currency Bond Fund’s Institutional Class vs. CS (Credit Suisse) Latin America Corporate Index 0-6Y A/B Buckets.
Average Annual Total Returns for the Periods Ended April 30, 2017 | ||||||||||||
| 1 Year | 3 Year | Since Inception | ||||||||||
Institutional Class | 9.82 | % | 1.55 | % | 2.60%* | |||||||
CS (Credit Suisse) Latin America Corporate Index 0-6Y A/B Buckets | 10.64 | % | 3.71 | % | 4.50%** | |||||||
| * | Institutional Class shares of the Bradesco Latin American Hard Currency Bond Fund (the “Fund”) commenced operations on December 20, 2013. |
| ** | Benchmark performance is from the commencement date of Institutional Class shares of the Fund (December 20, 2013 and is not the commencement date of the benchmark itself. |
The performance data includes adjustments in accordance with accounting principles generally accepted in the United States of America and, consequently, the net asset value for financial reporting purposes and the returns based upon those net asset values may differ from the net asset values and returns for shareholder transactions.
The performance data quoted represents past performance and does not guarantee future results. The investment return and principal value of an investment in the Fund will fluctuate so that an investor’s shares, when redeemed, may be worth more or less than their original cost. The graph and table do not reflect the deduction of taxes that a shareholder would pay on Fund distributions or redemption of Fund shares. Current performance may be lower or higher. Performance data current to the most recent month-end may be obtained by calling (866) 640-5705.
The Fund’s total gross and net operating expense ratio, as stated in the current prospectus dated September 1, 2016, is 2.42% and 1.51%, respectively, of the Fund’s average daily net assets for Institutional Class shares, which may differ from the actual expenses incurred by the Fund for the period covered by this report. A 2.00% redemption fee applies to shares redeemed within 30 days of purchase. The redemption fee is not reflected in the returns shown above. BRAM US LLC (“BRAM US” or the “Adviser”) has contractually agreed to waive or otherwise reduce its annual
14
BRADESCO LATIN AMERICAN HARD CURRENCY BOND FUND
Annual Report
Performance Data
April 30, 2017
(Unaudited)
compensation received from the Fund to the extent necessary to ensure that the Fund’s “Total Annual Fund Operating Expenses”, excluding taxes, any class-specific fees and expenses (such as Rule 12b-1 distribution fees, shareholder service fees or transfer agency fees), “Acquired Fund” fees and expenses, interest, extraordinary items and brokerage commissions, do not exceed 1.50% of average daily net assets of the Fund (the “Expense Limitation”). The Expense Limitation will remain in place until August 31, 2017, unless the Board of Trustees of the FundVantage Trust (the “Trust”) approves its earlier termination. The Adviser may recoup any expenses or fees it has reimbursed within a three-year period from the year in which the Adviser reduced its compensation and/or assumed expenses of the Fund. The Adviser is permitted to seek reimbursement from the Fund, subject to certain limitations, for fees it waived and Fund expenses it paid to the extent the total annual fund operating expenses do not exceed the limits described above or any lesser limits in effect as the time of reimbursement. No recoupment will occur unless the Fund’s expenses are below the Expense Limitation amount. Total returns would be lower had such fees and/or expenses not been waived and/or reimbursed.
The Fund intends to evaluate performance as compared to that of the CS (Credit Suisse) Latin America Corporate Index 0-6Y A/B Buckets (the “Index”). The Index is a subset index of the Credit Suisse-Latin America Corporate Index (“CS-LACI”). It contains bonds with less than 6 years to maturity and rated “B-” or higher (composite of Moody’s, S&P, and Fitch ratings as determined by Credit Suisse’s methodology). CS-LACI is a diversified basket of liquid, tradable Latin American corporate bond issues that are denominated in US dollars. This index provides a region-specific benchmark that represents characteristics, pricing, and total return performance of different asset classes within the Latin American corporate bond universe. This index is divided into three different categories, including supranational, quasi-sovereign, and corporate bonds and can be broken down by country of issuance. An index is unmanaged and it is not possible to invest in an index.
The Fund is non-diversified which means it may be invested in a limited number of issuers particularly in Latin America and more susceptible to any economic, political and regulatory events. The Fund invests primarily in markets of emerging countries which are riskier and may be considered speculative as well as derivatives which may amplify volatility. In addition, many emerging securities markets have far lower trading volumes, currency devaluation risk and less liquidity than developed markets. The Fund invests in below investment grade bonds (known as “junk bonds”) and may be less liquid and subject to greater volatility. The Fund is subject to the same risks as the underlying bonds in the portfolio such as credit, prepayment, sovereign debt, call and interest rate risk. As interest rates rise the value of bond prices will decline.
Foreign securities are subject to political, social, or economic risks including instability in the country of the issuer of a security, variation in international trade patterns, the possibility of the imposition of exchange controls, expropriation, confiscatory taxation, limits on movement to currency or other assets and nationalization of assets.
15
BRADESCO LATIN AMERICAN HARD CURRENCY BOND FUND
Annual Report
Performance Data
April 30, 2017
(Unaudited)
Comparison of Change in Value of $10,000 Investment in Bradesco Latin American Hard Currency Bond Fund’s Retail Class vs. CS (Credit Suisse) Latin America Corporate Index 0-6Y A/B Buckets.
Average Annual Total Returns for the Period Ended April 30, 2017 |
| |||||||||
| 1 Year | Since Inception | |||||||||
Retail Class | 9.38 | % | 0.71%* | |||||||
CS (Credit Suisse) Latin America Corporate Index 0-6Y A/B Buckets | 10.64 | % | 3.18%** | |||||||
| * | Retail Class shares of the Bradesco Latin American Hard Currency Bond Fund (the “Fund”) commenced operations on June 9, 2014. |
| ** | Benchmark performance is from the commencement date of Retail Class shares of the Fund (June 9, 2014) only and is not the commencement date of the benchmark itself. |
The performance data includes adjustments in accordance with accounting principles generally accepted in the United States of America and, consequently, the net asset value for financial reporting purposes and the returns based upon those net asset values may differ from the net asset values and returns for shareholder transactions.
The performance data quoted represents past performance and does not guarantee future results. The investment return and principal value of an investment in the Fund will fluctuate so that an investor’s shares, when redeemed, may be worth more or less than their original cost. The graph and table do not reflect the deduction of taxes that a shareholder would pay on Fund distributions or redemption of Fund shares. Current performance may be lower or higher. Performance data current to the most recent month-end may be obtained by calling (866) 640-5705.
The Fund’s total gross and net operating expense ratio, as stated in the current prospectus dated September 1, 2016, is 2.67% and 1.76%, respectively, of the Fund’s average daily net assets for Retail Class shares, which may differ from the actual expenses incurred by the Fund for the period covered by this report. A 2.00% redemption fee applies to shares redeemed within 30 days of purchase. The redemption fee is not reflected in the returns shown above. BRAM US LLC (“BRAM US” or the “Adviser”) has contractually agreed to waive or otherwise reduce its annual
16
BRADESCO LATIN AMERICAN HARD CURRENCY BOND FUND
Annual Report
Performance Data (Concluded)
April 30, 2017
(Unaudited)
compensation received from the Fund to the extent necessary to ensure that the Fund’s “Total Annual Fund Operating Expenses”, excluding taxes, any class-specific fees and expenses (such as Rule 12b-1 distribution fees, shareholder service fees or transfer agency fees), “Acquired Fund” fees and expenses, interest, extraordinary items and brokerage commissions, do not exceed 1.50% of average daily net assets of the Fund (the “Expense Limitation”). The Expense Limitation will remain in place until August 31, 2017, unless the Board of Trustees of the FundVantage Trust (the “Trust”) approves its earlier termination. The Adviser may recoup any expenses or fees it has reimbursed within a three-year period from the year in which the Adviser reduced its compensation and/or assumed expenses of the Fund. The Adviser is permitted to seek reimbursement from the Fund, subject to certain limitations, for fees it waived and Fund expenses it paid to the extent the total annual fund operating expenses do not exceed the limits described above or any lesser limits in effect as the time of reimbursement. No recoupment will occur unless the Fund’s expenses are below the Expense Limitation amount. Total returns would be lower had such fees and/or expenses not been waived and/or reimbursed.
The Fund intends to evaluate performance as compared to that of the CS (Credit Suisse) Latin America Corporate Index 0-6Y A/B Buckets (the “Index”). The Index is a subset index of the Credit Suisse Latin America Corporate Index (“CS-LACI”). It contains bonds with less than 6 years to maturity and rated “B-” or higher (composite of Moody’s, S&P, and Fitch ratings as determined by Credit Suisse’s methodology). CS-LACI is a diversified basket of liquid, tradable Latin American corporate bond issues that are denominated in US dollars. This index provides a region-specific benchmark that represents characteristics, pricing, and total return performance of different asset classes within the Latin American corporate bond universe. This index is divided into three different categories, including supranational, quasi-sovereign, and corporate bonds and can be broken down by country of issuance. An index is unmanaged and it is not possible to invest in an index.
The Fund is non-diversified which means it may be invested in a limited number of issuers particularly in Latin America and more susceptible to any economic, political and regulatory events. The Fund invests primarily in markets of emerging countries which are riskier and may be considered speculative as well as derivatives which may amplify volatility. In addition, many emerging securities markets have far lower trading volumes, currency devaluation risk and less liquidity than developed markets. The Fund invests in below investment grade bonds (known as “junk bonds”) and may be less liquid and subject to greater volatility. The Fund is subject to the same risks as the underlying bonds in the portfolio such as credit, prepayment, sovereign debt, call and interest rate risk. As interest rates rise the value of bond prices will decline.
Foreign securities are subject to political, social, or economic risks including instability in the country of the issuer of a security, variation in international trade patterns, the possibility of the imposition of exchange controls, expropriation, confiscatory taxation, limits on movement to currency or other assets and nationalization of assets.
17
BRADESCO FUNDS
Fund Expense Disclosure
April 30, 2017
(Unaudited)
As a shareholder of the Bradesco Funds (each a “Fund” and together, the “Funds”), you incur two types of costs: (1) transaction costs, including redemption fees; and (2) ongoing costs, including management fees and other Fund expenses. This example is intended to help you understand your ongoing costs (in dollars) of investing in a Fund and to compare these costs with the ongoing costs of investing in other mutual funds.
This example is based on an investment of $1,000 invested from November 1, 2016, through April 30, 2017 and held for the entire period.
Actual Expenses
The first line for each Fund in the accompanying tables provide information about actual account values and actual expenses. You may use the information in this line, together with the amount you invested, to estimate the expenses that you paid over the period. Simply divide your account value by $1,000 (for example, an $8,600 account value divided by $1,000 = 8.6), then multiply the result by the number in the first line under the heading entitled “Expenses Paid During Period” to estimate the expenses you paid on your account during this period.
Hypothetical Example for Comparison Purposes
The second line for each Fund in the accompanying tables provide information about hypothetical account values and hypothetical expenses based on such Fund’s actual expense ratio and an assumed rate of return of 5% per year before expenses, which is not the Fund’s actual return. The hypothetical account values and expenses may not be used to estimate the actual ending account balance or expenses you paid for the period. You may use this information to compare the ongoing costs of investing in the Fund(s) and other funds. To do so, compare this 5% hypothetical example with the 5% hypothetical examples that appear in the shareholder reports of other funds.
Please note that the expenses shown in the accompanying tables are meant to highlight your ongoing costs only and do not reflect any transactional costs, such as redemption fees. Therefore, the second line of the accompanying tables are useful in comparing ongoing costs only and will not help you determine the relative total costs of owning different funds. In addition, if these transactional costs were included, your costs would have been higher.
18
BRADESCO FUNDS
Fund Expense Disclosure (Concluded)
April 30, 2017
(Unaudited)
| Bradesco Latin American Equity Fund | |||||||||||||||
Beginning Account Value |
Ending Account Value |
Expenses Paid | |||||||||||||
Institutional Class | |||||||||||||||
Actual | $ | 1,000.00 | $ | 993.30 | $ | 8.65 | |||||||||
Hypothetical (5% return before expenses) | 1,000.00 | 1,016.12 | 8.75 | ||||||||||||
Retail Class | |||||||||||||||
Actual | $ | 1,000.00 | $ | 992.20 | $ | 9.88 | |||||||||
Hypothetical (5% return before expenses) | 1,000.00 | 1,014.88 | 9.99 | ||||||||||||
| Bradesco Latin American Hard Currency Bond Fund | |||||||||||||||
Beginning Account Value |
Ending Account Value |
Expenses Paid | |||||||||||||
Institutional Class | |||||||||||||||
Actual | $ | 1,000.00 | $ | 1,029.30 | $ | 7.55 | |||||||||
Hypothetical (5% return before expenses) | 1,000.00 | 1,017.36 | 7.50 | ||||||||||||
Retail Class | |||||||||||||||
Actual | $ | 1,000.00 | $ | 1,027.90 | $ | 8.80 | |||||||||
Hypothetical (5% return before expenses) | 1,000.00 | 1,016.12 | 8.75 | ||||||||||||
| * | Expenses are equal to an annualized expense ratio for the six-month period ended April 30, 2017 of 1.75% and 2.00% for the Institutional Class and the Retail Class shares, respectively, multiplied by the average account value over the period, multiplied by the number of days in the most recent period (181), then divided by 365 to reflect the period. The Fund’s ending account values on the first line in the table are based on the actual six-month total returns for the Fund of (0.67)% and (0.78)% for the Institutional Class and the Retail Class shares, respectively. |
| ** | Expenses are equal to an annualized expense ratio for the six-month period ended April 30, 2017 of 1.50% and 1.75% for the Institutional Class and the Retail Class shares, respectively, multiplied by the average account value over the period, multiplied by the number of days in the most recent period (181), then divided by 365 to reflect the period. The Fund’s ending account values on the first line in the table are based on the actual six-month total returns for the Fund of 2.93% and 2.79% for the Institutional Class and the Retail Class shares, respectively. |
19
BRADESCO LATIN AMERICAN EQUITY FUND
Portfolio Holdings Summary Table
April 30, 2017
(Unaudited)
The following table presents a summary by sector of the portfolio holdings of the Fund:
| % of Net Assets | Value | |||||||||
COMMON STOCK: | ||||||||||
Banks | 17.0 | % | $ | 2,648,238 | ||||||
Food | 8.5 | 1,335,546 | ||||||||
REITS | 7.0 | 1,090,767 | ||||||||
Retailing | 6.5 | 1,021,704 | ||||||||
Oil & Gas | 6.3 | 981,306 | ||||||||
Building Materials | 6.1 | 951,893 | ||||||||
Telecommunications | 6.1 | 948,297 | ||||||||
Diversified Financial Services | 5.0 | 781,831 | ||||||||
Pharmaceuticals | 3.6 | 557,833 | ||||||||
Commercial Services | 2.9 | 454,749 | ||||||||
Airlines | 2.8 | 443,600 | ||||||||
Electric | 2.7 | 428,195 | ||||||||
Insurance | 1.9 | 291,987 | ||||||||
Software | 1.4 | 220,798 | ||||||||
Water Utilities | 1.1 | 170,978 | ||||||||
Transportation Infrastructure | 0.9 | 144,716 | ||||||||
Auto Parts & Equipment | 0.9 | 138,475 | ||||||||
Preferred Stocks | 15.9 | 2,478,150 | ||||||||
Registered Investment Company | 4.6 | 713,647 | ||||||||
Liabilities in Excess of Other Assets | (1.2 | ) | (186,304 | ) | ||||||
|
|
|
| |||||||
NET ASSETS | 100.0 | % | $ | 15,616,406 | ||||||
|
|
|
| |||||||
Portfolio holdings are subject to change at any time.
The accompanying notes are an integral part of the financial statements.
20
BRADESCO LATIN AMERICAN EQUITY FUND
Portfolio of Investments
April 30, 2017
| Number of Shares | Value | |||||||
COMMON STOCKS — 80.7% |
| |||||||
Argentina — 0.5% | ||||||||
Adecoagro SA* | 6,500 | $ | 72,085 | |||||
|
| |||||||
Brazil — 48.0% | ||||||||
Alupar Investimento SA | 33,500 | 198,211 | ||||||
Ambev SA, ADR | 58,200 | 333,486 | ||||||
B2W Cia Digital* | 6,618 | 27,418 | ||||||
Banco do Brasil SA | 28,100 | 290,203 | ||||||
BB Seguridade Participacoes SA | 31,100 | 291,987 | ||||||
BM&FBovespa SA - Bolsa de Valores Mercadorias e Futuros | 108,700 | 648,286 | ||||||
BR Malls Participacoes SA | 43,800 | 195,124 | ||||||
CCR SA | 11,900 | 66,135 | ||||||
Cia de Saneamento de Minas Gerais-COPASA | 15,100 | 170,978 | ||||||
Cosan SA Industria e Comercio | 13,700 | 159,140 | ||||||
EcoRodovias Infraestrutura e Logistica SA | 26,534 | 78,581 | ||||||
Energisa SA | 32,300 | 229,984 | ||||||
Ez Tec Empreendimentos e Participacoes SA | 11,900 | 76,183 | ||||||
Hypermarcas SA | 59,000 | 557,833 | ||||||
International Meal Co. Alimentacao SA* | 36,000 | 68,846 | ||||||
Itau Unibanco Holding SA, SP ADR | 97,290 | 1,196,667 | ||||||
Itausa - Investimentos Itau SA* | 5,173 | 16,054 | ||||||
Klabin SA | 44,500 | 221,094 | ||||||
Linx SA | 39,328 | 220,798 | ||||||
Lojas Renner SA | 68,600 | 637,577 | ||||||
| Number of Shares | Value | |||||||
COMMON STOCKS — (Continued) |
| |||||||
Brazil — (Continued) | ||||||||
Multiplan Empreendimentos Imobiliarios SA | 7,913 | $ | 169,344 | |||||
Petroleo Brasileiro SA*. | 46,600 | 210,387 | ||||||
Petroleo Brasileiro SA, SP ADR* | 67,900 | 611,779 | ||||||
Sao Martinho SA | 28,000 | 155,171 | ||||||
Telefonica Brasil SA | 19,547 | 228,045 | ||||||
Vale SA, SP ADR | 53,452 | 438,841 | ||||||
|
| |||||||
| 7,498,152 | ||||||||
|
| |||||||
Chile — 5.2% | ||||||||
Itau CorpBanca | 15,800,000 | 144,031 | ||||||
Parque Arauco SA | 143,439 | 375,445 | ||||||
SACI Falabella | 36,000 | 287,863 | ||||||
|
| |||||||
| 807,339 | ||||||||
|
| |||||||
Colombia — 0.8% | ||||||||
Grupo de Inversiones Suramericana SA | 10,100 | 133,545 | ||||||
|
| |||||||
Mexico — 23.9% | ||||||||
Alsea SAB de CV | 65,700 | 233,655 | ||||||
America Movil SAB de CV, SP ADR, Class L | 46,800 | 720,252 | ||||||
Arca Continental SAB de CV | 44,200 | 325,021 | ||||||
Cemex SAB de CV, SP ADR* | 37,600 | 346,672 | ||||||
Concentradora Fibra Danhos SA de CV, REIT | 61,650 | 105,876 | ||||||
Corp. Inmobiliaria Vesta SAB de CV | 120,000 | 168,795 | ||||||
Grupo Aeroportuario del Centro Norte SAB de CV, ADR | 10,000 | 443,600 | ||||||
The accompanying notes are an integral part of the financial statements.
21
BRADESCO LATIN AMERICAN EQUITY FUND
Portfolio of Investments (Concluded)
April 30, 2017
| Number of Shares | Value | |||||||
COMMON STOCKS — (Continued) |
| |||||||
Mexico — (Continued) | ||||||||
Grupo Cementos de Chihuahua SAB de CV | 35,000 | $ | 166,380 | |||||
Grupo Financiero Banorte SAB de CV, Class O | 109,600 | 632,499 | ||||||
Rassini SAB de CV | 29,277 | 138,475 | ||||||
Wal-Mart de Mexico SAB de CV | 199,700 | 449,783 | ||||||
|
| |||||||
| 3,731,008 | ||||||||
|
| |||||||
Peru — 2.3% | ||||||||
Credicorp Ltd. | 2,400 | 368,784 | ||||||
|
| |||||||
TOTAL COMMON STOCKS |
| 12,610,913 | ||||||
|
| |||||||
PREFERRED STOCKS — 15.9% |
| |||||||
Brazil — 15.1% | ||||||||
Alupar Investimento SA | 28,177 | 55,483 | ||||||
Banco do Estado do Rio Grande do Sul SA, Class B | 14,000 | 63,295 | ||||||
Cia Energetica de Minas Gerais | 21,400 | 59,601 | ||||||
Cia Energetica de Sao Paulo, Class B | 72,400 | 409,895 | ||||||
Gerdau SA | 57,300 | 176,735 | ||||||
Itausa - Investimentos Itau SA | 315,700 | 978,714 | ||||||
Lojas Americanas SA | 59,200 | 312,408 | ||||||
Suzano Papel e Celulose SA, Class A | 71,200 | 299,017 | ||||||
|
| |||||||
| 2,355,148 | ||||||||
|
| |||||||
| Number of Shares | Value | |||||||
PREFERRED STOCKS — (Continued) |
| |||||||
Colombia — 0.8% | ||||||||
Bancolombia SA | 12,600 | $ | 123,002 | |||||
|
| |||||||
TOTAL PREFERRED STOCKS |
| 2,478,150 | ||||||
|
| |||||||
REGISTERED INVESTMENT COMPANY — 4.6% |
| |||||||
Dreyfus Government Cash Management Fund, Institutional Shares, | 713,647 | 713,647 | ||||||
|
| |||||||
TOTAL REGISTERED INVESTMENT |
| 713,647 | ||||||
|
| |||||||
TOTAL INVESTMENTS - 101.2% |
| 15,802,710 | ||||||
LIABILITIES IN EXCESS OF OTHER ASSETS - (1.2)% | (186,304 | ) | ||||||
|
| |||||||
NET ASSETS - 100.0% | $ | 15,616,406 | ||||||
|
| |||||||
| * | Non-income producing. |
| (a) | Rate periodically changes. Rate disclosed is the daily yield on April 30, 2017. |
| ADR | American Depository Receipt |
| REIT | Real Estate Investment Trust |
| SP | ADR Sponsored American Depository Receipt |
The accompanying notes are an integral part of the financial statements.
22
BRADESCO LATIN AMERICAN HARD CURRENCY BOND FUND
Portfolio Holdings Summary Table
April 30, 2017
(Unaudited)
The following table presents a summary by security type of the portfolio holdings of the Fund:
| % of Net Assets | Value | |||||||
SECURITY TYPE: | ||||||||
Corporate Bonds and Notes | 80.9 | % | $ | 12,969,293 | ||||
Government Bonds | 8.0 | 1,290,495 | ||||||
Registered Investment Company | 9.3 | 1,489,002 | ||||||
Other Assets in Excess of Liabilities | 1.8 | 280,725 | ||||||
|
|
|
| |||||
NET ASSETS | 100.0 | % | $ | 16,029,515 | ||||
|
|
|
| |||||
Portfolio holdings are subject to change at any time.
The accompanying notes are an integral part of the financial statements.
23
BRADESCO LATIN AMERICAN HARD CURRENCY BOND FUND
Portfolio of Investments
April 30, 2017
| Par Value | Value | |||||||
CORPORATE BONDS AND NOTES — 80.9% |
| |||||||
Austria — 0.1% | ||||||||
OAS Investments GmbH | $ | 200,000 | $ | 11,000 | ||||
|
| |||||||
Brazil — 27.8% | ||||||||
Banco Daycoval SA | 200,000 | 205,500 | ||||||
Banco do Brasil SA | 700,000 | 728,000 | ||||||
Banco Votorantim SA | 300,000 | 321,750 | ||||||
BM&FBovespa SA | 500,000 | 526,900 | ||||||
Caixa Economica Federal | 300,000 | 288,000 | ||||||
Centrais Eletricas Brasileiras SA | 500,000 | 512,000 | ||||||
Cia Brasileira de Aluminio | 200,000 | 194,500 | ||||||
Embraer SA | 500,000 | 526,875 | ||||||
Itau Unibanco Holding SA | 200,000 | 212,570 | ||||||
Itau Unibanco Holding SA | 300,000 | 316,878 | ||||||
Itau Unibanco Holding SA | 200,000 | 209,250 | ||||||
Votorantim Cimentos SA | 400,000 | 408,500 | ||||||
|
| |||||||
| 4,450,723 | ||||||||
|
| |||||||
Canada — 1.9% | ||||||||
St Marys Cement, Inc. Canada 5.75%, 01/28/2027(b) | 300,000 | 299,625 | ||||||
|
| |||||||
| Par Value | Value | |||||||
| CORPORATE BONDS AND NOTES — (Continued) | ||||||||
Cayman Islands — 17.7% | ||||||||
BR Malls International Finance Ltd. | $ | 400,000 | $ | 404,400 | ||||
Braskem Finance Ltd. | 250,000 | 272,813 | ||||||
Braskem Finance Ltd. | 200,000 | 210,000 | ||||||
Cosan Overseas Ltd. | 600,000 | 602,700 | ||||||
Fibria Overseas Finance Ltd. | 400,000 | 413,000 | ||||||
Suzano Trading Ltd. | 200,000 | 213,300 | ||||||
Vale Overseas Ltd. | 500,000 | 512,350 | ||||||
Vale Overseas Ltd. | 200,000 | 218,560 | ||||||
|
| |||||||
| 2,847,123 | ||||||||
|
| |||||||
Chile — 1.3% | ||||||||
Itau CorpBanca | 200,000 | �� | 206,310 | |||||
|
| |||||||
Colombia — 2.7% | ||||||||
Bancolombia SA | 400,000 | 440,500 | ||||||
|
| |||||||
Luxembourg — 7.4% | ||||||||
Cosan Luxembourg SA | 400,000 | 417,520 | ||||||
Klabin Finance SA | 360,000 | 364,140 | ||||||
Ultrapar International SA | 400,000 | 401,500 | ||||||
|
| |||||||
| 1,183,160 | ||||||||
|
| |||||||
The accompanying notes are an integral part of the financial statements.
24
BRADESCO LATIN AMERICAN HARD CURRENCY BOND FUND
Portfolio of Investments (Concluded)
April 30, 2017
| Par Value | Value | |||||||
CORPORATE BONDS AND NOTES — (Continued) |
| |||||||
Mexico — 7.9% | ||||||||
Alfa SAB de CV | $ | 500,000 | $ | 528,750 | ||||
America Movil SAB de CV | 300,000 | 322,593 | ||||||
Grupo Bimbo SAB de CV | 400,000 | 422,259 | ||||||
|
| |||||||
| 1,273,602 | ||||||||
|
| |||||||
Netherlands — 10.8% | ||||||||
Petrobras Global Finance BV | 500,000 | 566,250 | ||||||
Petrobras Global Finance BV | 1,000,000 | 1,166,000 | ||||||
|
| |||||||
| 1,732,250 | ||||||||
|
| |||||||
Virgin Islands — 3.3% | ||||||||
Gerdau Trade, Inc. | 500,000 | 525,000 | ||||||
|
| |||||||
TOTAL CORPORATE BONDS AND NOTES (Cost $12,769,195) | 12,969,293 | |||||||
|
| |||||||
GOVERNMENT BONDS — 8.0% |
| |||||||
Brazilian Government International Bond | 300,000 | 320,595 | ||||||
Brazilian Government International Bond | 300,000 | 348,000 | ||||||
| Par Value | Value | |||||||
GOVERNMENT BONDS — (Continued) |
| |||||||
Mexico Government International Bond | $ | 600,000 | $ | 621,900 | ||||
|
| |||||||
TOTAL GOVERNMENT BONDS | 1,290,495 | |||||||
|
| |||||||
| Number of Shares | ||||||||
REGISTERED INVESTMENT COMPANY — 9.3% |
| |||||||
Dreyfus Government Cash Management Fund, Institutional Shares, 0.69%(d) | 1,489,002 | 1,489,002 | ||||||
TOTAL REGISTERED INVESTMENT COMPANY (Cost $1,489,002) | 1,489,002 | |||||||
TOTAL INVESTMENTS - 98.2% (Cost $15,474,348) | 15,748,790 | |||||||
OTHER ASSETS IN EXCESS OF LIABILITIES - 1.8% | 280,725 | |||||||
|
| |||||||
NET ASSETS - 100.0% | $ | 16,029,515 | ||||||
|
| |||||||
| (a) | Investment with a total aggregate value of $11,000 or 0.07% of net assets was in default as of April 30, 2017. |
| (b) | This security is callable. |
| (c) | Security is perpetual. Date shown is next call date. |
| (d) | Rate periodically changes. Rate disclosed is the daily yield on April 30, 2017. |
The accompanying notes are an integral part of the financial statements.
25
BRADESCO FUNDS
Statements of Assets and Liabilities
April 30, 2017
| Bradesco Latin American Equity Fund | Bradesco Latin American Hard Currency Bond Fund | |||||||||
Assets | ||||||||||
Investments, at value (Cost $14,598,400 and $15,474,348, respectively) | $ | 15,802,710 | $ | 15,748,790 | ||||||
Cash | 101 | — | ||||||||
Deposit with Broker | — | 103,500 | ||||||||
Receivable for investments sold | 866,697 | — | ||||||||
Receivable for capital shares sold | 1,000 | 7 | ||||||||
Dividends and interest receivable | 65,072 | 220,067 | ||||||||
Prepaid expenses and other assets | 43,369 | 43,560 | ||||||||
|
|
|
| |||||||
Total assets | 16,778,949 | 16,115,924 | ||||||||
|
|
|
| |||||||
Liabilities | ||||||||||
Payable for investments purchased | 1,071,792 | — | ||||||||
Payable for audit fees. | 37,150 | 36,000 | ||||||||
Payable for administration and accounting fees | 11,060 | 10,893 | ||||||||
Payable for custodian fees | 10,813 | 8,741 | ||||||||
Payable for transfer agent fees | 8,756 | 11,443 | ||||||||
Payable for legal fees. | 8,501 | 10,127 | ||||||||
Payable to Investment Adviser | 7,244 | 5,716 | ||||||||
Payable for printing fees | 6,545 | 2,691 | ||||||||
Payable for distribution fees | 62 | 20 | ||||||||
Accrued expenses | 620 | 778 | ||||||||
|
|
|
| |||||||
Total liabilities | 1,162,543 | 86,409 | ||||||||
|
|
|
| |||||||
Net Assets | $ | 15,616,406 | $ | 16,029,515 | ||||||
|
|
|
| |||||||
Net Assets Consisted of: | ||||||||||
Capital stock, $0.01 par value | $ | 18,741 | $ | 16,340 | ||||||
Paid-in capital | 18,344,038 | 16,507,356 | ||||||||
Accumulated net investment income | 26,848 | 81,844 | ||||||||
Accumulated net realized loss from investments, foreign currency transactions, futures contracts and translation of assets and liabilities denominated in foreign currency | (3,978,364 | ) | (850,467 | ) | ||||||
Net unrealized appreciation on investments and foreign currency translations | 1,205,143 | 274,442 | ||||||||
|
|
|
| |||||||
Net Assets | $ | 15,616,406 | $ | 16,029,515 | ||||||
|
|
|
| |||||||
Institutional Class: | ||||||||||
Net asset value, offering and redemption price per share ($15,313,919 / 1,837,580) and ($15,929,959 / 1,623,872 shares) | $ | 8.33 | $ | 9.81 | ||||||
|
|
|
| |||||||
Retail Class: | ||||||||||
Net asset value, offering and redemption price per share ($302,487 / 36,500) and ($99,556 / 10,123 shares) | $ | 8.29 | $ | 9.83 | ||||||
|
|
|
| |||||||
The accompanying notes are an integral part of the financial statements.
26
BRADESCO FUNDS
Statements of Operations
For the Year Ended April 30, 2017
| Bradesco Latin American Equity Fund | Bradesco Latin American Hard Currency Bond Fund | |||||||||
Investment Income | ||||||||||
Dividends | $ | 444,013 | $ | 1,727 | ||||||
Less: foreign taxes withheld | (40,770 | ) | — | |||||||
Interest | — | 776,817 | ||||||||
|
|
|
| |||||||
Total investment income | 403,243 | 778,544 | ||||||||
|
|
|
| |||||||
Expenses | ||||||||||
Advisory fees (Note 2) | 143,127 | 115,732 | ||||||||
Administration and accounting fees | 74,860 | 73,494 | ||||||||
Registration and filing fees | 28,036 | 28,326 | ||||||||
Transfer agent fees (Note 2) | 24,678 | 27,862 | ||||||||
Custodian fees (Note 2) | 23,046 | 19,052 | ||||||||
Audit fees | 21,429 | 18,499 | ||||||||
Legal fees | 21,151 | 25,818 | ||||||||
Trustees’ and officers’ fees (Note 2) | 18,642 | 21,535 | ||||||||
Printing and shareholder reporting fees | 9,752 | 13,129 | ||||||||
Distribution fees (Retail Class) (Note 2) | 448 | 240 | ||||||||
Other expenses | 20,004 | 20,912 | ||||||||
|
|
|
| |||||||
Total expenses before waivers and reimbursements | 385,173 | 364,599 | ||||||||
|
|
|
| |||||||
Less: waivers and reimbursements (Note 2) | (134,253 | ) | (132,864 | ) | ||||||
|
|
|
| |||||||
Net expenses after waivers and reimbursements | 250,920 | 231,735 | ||||||||
|
|
|
| |||||||
Net investment income | 152,323 | 546,809 | ||||||||
|
|
|
| |||||||
Net realized and unrealized gain/(loss) from investments | ||||||||||
Net realized gain from investments* | 186,192 | 103,778 | ||||||||
Net realized gain from written options** | — | 16,313 | ||||||||
Net realized loss from foreign currency transactions | (60,885 | ) | — | |||||||
Net realized gain from futures contracts** | — | 28,227 | ||||||||
Net change in unrealized appreciation/(depreciation) on investments | 1,586,804 | 733,527 | ||||||||
Net change in unrealized appreciation/(depreciation) on foreign currency translations | 507 | — | ||||||||
|
|
|
| |||||||
Net realized and unrealized gain on investments | 1,712,618 | 881,845 | ||||||||
|
|
|
| |||||||
Net increase in net assets resulting from operations | $ | 1,864,941 | $ | 1,428,654 | ||||||
|
|
|
| |||||||
| * | Includes realized loss on purchased options of $132,891 for the Bradesco Latin American Hard Currency Bond Fund. Primary risk exposure is equity contracts. |
| ** | Primary risk exposure is interest rate contracts. |
The accompanying notes are an integral part of the financial statements.
27
BRADESCO LATIN AMERICAN EQUITY FUND
Statements of Changes in Net Assets
| For the Year Ended April 30, 2017 | For the Year Ended April 30, 2016 | |||||||||
Increase/(Decrease) in net assets from operations: | ||||||||||
Net investment income | $ | 152,323 | $ | 136,551 | ||||||
Net realized gain/(loss) from investments and foreign currency transactions | 125,307 | (2,459,753 | ) | |||||||
Net change in unrealized appreciation/(depreciation) on investments and foreign currency translations | 1,587,311 | 154,864 | ||||||||
|
|
|
| |||||||
Net increase/(decrease) in net assets resulting from operations. | 1,864,941 | (2,168,338 | ) | |||||||
|
|
|
| |||||||
Less Dividends and Distributions to Shareholders: | ||||||||||
Net investment income: | ||||||||||
Institutional Class | (54,684 | ) | — | |||||||
Retail Class | (760 | ) | — | |||||||
|
|
|
| |||||||
Total from net investment income | (55,444 | ) | — | |||||||
|
|
|
| |||||||
Increase in Net Assets Derived from Capital Share Transactions (Note 4) | 228,589 | 27,302 | ||||||||
|
|
|
| |||||||
Total increase/(decrease) in net assets | 2,038,086 | (2,141,036 | ) | |||||||
|
|
|
| |||||||
Net assets | ||||||||||
Beginning of year | 13,578,320 | 15,719,356 | ||||||||
|
|
|
| |||||||
End of year | $ | 15,616,406 | $ | 13,578,320 | ||||||
|
|
|
| |||||||
Accumulated net investment gain/(loss), end of year | $ | 26,848 | $ | (11,810 | ) | |||||
|
|
|
| |||||||
The accompanying notes are an integral part of the financial statements
28
BRADESCO LATIN AMERICAN HARD CURRENCY BOND FUND
Statements of Changes in Net Assets
| For the Year Ended April 30,2017 | For the Year Ended April 30,2016 | |||||||||
Increase/(Decrease) in net assets from operations: | ||||||||||
Net investment income | $ | 546,809 | $ | 478,991 | ||||||
Net realized gain/loss from investments, written options, foreign currency transactions and futures contracts | 148,318 | (874,581 | ) | |||||||
Net change in unrealized appreciation/(depreciation) on investments and foreign currency translations | 733,527 | (322,417 | ) | |||||||
|
|
|
| |||||||
Net increase/decrease in net assets resulting from operations | 1,428,654 | (718,007 | ) | |||||||
|
|
|
| |||||||
Less Dividends and Distributions to Shareholders from: | ||||||||||
Net investment income: | ||||||||||
Institutional Class | (480,850 | ) | (473,674 | ) | ||||||
Retail Class | (2,751 | ) | (2,776 | ) | ||||||
|
|
|
| |||||||
Total from net investment income | (483,601 | ) | (476,450 | ) | ||||||
|
|
|
| |||||||
Increase in Net Assets Derived from Capital Share Transactions (Note 4) | 412,839 | 406,479 | ||||||||
|
|
|
| |||||||
Total increase/(decrease) in net assets | 1,357,892 | (787,978 | ) | |||||||
|
|
|
| |||||||
Net assets | ||||||||||
Beginning of year | 14,671,623 | 15,459,601 | ||||||||
|
|
|
| |||||||
End of year | $ | 16,029,515 | $ | 14,671,623 | ||||||
|
|
|
| |||||||
Accumulated net investment income, end of year | $ | 81,844 | $ | 18,636 | ||||||
|
|
|
| |||||||
The accompanying notes are an integral part of the financial statements.
29
BRADESCO LATIN AMERICAN EQUITY FUND
Financial Highlights
Contained below is per share operating performance data for Institutional Class shares outstanding, total investment return, ratios to average net assets and other supplemental data for each of the respective periods. The total returns in the table represent the rate that an investor would have earned or lost on an investment in the Fund (assuming reinvestment of all dividends and distributions). This information has been derived from information provided in the financial statements and should be read in conjunction with the financial statements and the notes thereto.
| Institutional Class | ||||||||||||||||||||
| For the Year Ended April 30, 2017 | For the Year Ended April 30, 2016 | For the Year Ended April 30, 2015 | For the Period December 20, 2013* to April 30, 2014 | |||||||||||||||||
Per Share Operating Performance | ||||||||||||||||||||
Net asset value, beginning of period | $ | 7.36 | $ | 8.54 | $ | 10.24 | $ | 10.00 | ||||||||||||
|
|
|
|
|
|
|
| |||||||||||||
Net investment income(1) . | 0.08 | 0.07 | 0.06 | 0.06 | ||||||||||||||||
Net realized and unrealized gain/(loss) on investments | 0.92 | (1.25 | ) | (1.75 | )(2) | 0.18 | ||||||||||||||
|
|
|
|
|
|
|
| |||||||||||||
Net increase/(decrease) in net assets resulting from operations | 1.00 | (1.18 | ) | (1.69 | ) | 0.24 | ||||||||||||||
|
|
|
|
|
|
|
| |||||||||||||
Dividends and distributions to shareholders from: | ||||||||||||||||||||
Net investment income | (0.03 | ) | — | (0.01 | ) | — | ||||||||||||||
|
|
|
|
|
|
|
| |||||||||||||
Net asset value, end of period | $ | 8.33 | $ | 7.36 | $ | 8.54 | $ | 10.24 | ||||||||||||
|
|
|
|
|
|
|
| |||||||||||||
Total investment return(3) | 13.63 | % | (13.82 | )% | (16.51 | )%(2) | 2.40 | % | ||||||||||||
Ratio/Supplemental Data | ||||||||||||||||||||
Net assets, end of period (in thousands) | $ | 15,314 | $ | 13,481 | $ | 15,637 | $ | 1,024 | ||||||||||||
Ratio of expenses to average net assets | 1.75 | % | 1.75 | % | 1.75 | % | 1.75 | %(4) | ||||||||||||
Ratio of expenses to average net assets without waivers and expense reimbursements(5) | 2.69 | % | 2.98 | % | 3.27 | % | 23.40 | %(4) | ||||||||||||
Ratio of net investment income to average net assets | 1.07 | % | 1.08 | % | 0.60 | % | 1.70 | %(4) | ||||||||||||
Portfolio turnover rate | 108.93 | % | 76.71 | % | 120.72 | % | 15.55 | %(6) | ||||||||||||
| * | Commencement of operations. |
| (1) | The selected per share data was calculated using the average shares outstanding method for the period. |
| (2) | During the period, the Adviser reimbursed the Fund for a loss on an investment not meeting the Fund’s investment guidelines. Had this reimbursement not occurred, the Net realized and unrealized gain/(loss) on investments and the Total investment return would have been $(1.83) and (17.29)%, respectively. |
| (3) | Total investment return is calculated assuming a purchase of shares on the first day and a sale of shares on the last day of each period reported and includes reinvestment of dividends and distributions, if any. Total return for periods less than one year are not annualized. |
| (4) | Annualized. |
| (5) | During the period, certain fees were waived and/or reimbursed. If such fee waivers and/or reimbursements had not occurred, the ratios would have been as indicated (See Note 2). |
| (6) | Not annualized. |
The accompanying notes are an integral part of the financial statements.
30
BRADESCO LATIN AMERICAN EQUITY FUND
Financial Highlights
Contained below is per share operating performance data for Retail Class shares outstanding, total investment return, ratios to average net assets and other supplemental data for the respective period. The total return in the table represents the rate that an investor would have earned or lost on an investment in the Fund (assuming reinvestment of all dividends and distributions). This information has been derived from information provided in the financial statements and should be read in conjunction with the financial statements and the notes thereto.
| Retail Class | ||||||||||||
| For the Year Ended April 30, 2017 | For the Year Ended April 30, 2016 | For the Period June 9, 2014* to April 30, 2015 | ||||||||||
Per Share Operating Performance | ||||||||||||
Net asset value, beginning of period | $ | 7.33 | $ | 8.53 | $ | 10.86 | ||||||
|
|
|
|
|
| |||||||
Net investment income(1) | 0.07 | 0.06 | 0.02 | |||||||||
Net realized and unrealized gain/(loss) on investments | 0.91 | (1.26 | ) | (2.35 | )(2) | |||||||
|
|
|
|
|
| |||||||
Net increase/(decrease) in net assets resulting from operations | 0.98 | (1.20 | ) | (2.33 | ) | |||||||
|
|
|
|
|
| |||||||
Dividends to shareholders from: | ||||||||||||
Net investment income | (0.02 | ) | — | — | ||||||||
|
|
|
|
|
| |||||||
Net asset value, end of period | $ | 8.29 | $ | 7.33 | $ | 8.53 | ||||||
|
|
|
|
|
| |||||||
Total investment return(3) | 13.43 | % | (14.07 | )% | (21.46 | )%(2) | ||||||
Ratio/Supplemental Data | ||||||||||||
Net assets, end of period (in thousands) | $ | 302 | $ | 97 | $ | 83 | ||||||
Ratio of expenses to average net assets | 2.00 | % | 2.00 | % | 2.00 | %(4) | ||||||
Ratio of expenses to average net assets without waivers and expense reimbursements(5) | 2.97 | % | 3.21 | % | 4.58 | %(4) | ||||||
Ratio of net investment income to average net assets | 0.92 | % | 0.83 | % | 0.25 | %(4) | ||||||
Portfolio turnover rate | 108.93 | % | 76.71 | % | 120.72 | %(6) | ||||||
| * | Commencement of operations. |
| (1) | The selected per share data was calculated using the average shares outstanding method for the period. |
| (2) | During the period, the Adviser reimbursed the Fund for a loss on an investment not meeting the Fund’s investment guidelines. Had this reimbursement not occurred, the Net realized and unrealized gain/(loss) on investments and the Total investment return would have been $(2.49) and (22.65)%, respectively. |
| (3) | Total investment return is calculated assuming a purchase of shares on the first day and a sale of shares on the last day of each period reported and includes reinvestment of dividends and distributions, if any. Total return for periods less than one year are not annualized. |
| (4) | Annualized. |
| (5) | During the period, certain fees were waived and/or reimbursed. If such fee waivers and/or reimbursements had not occurred, the ratios would have been as indicated (See Note 2). |
| (6) | Reflects portfolio turnover for the Fund for the year ended April 30, 2015. |
The accompanying notes are an integral part of the financial statements.
31
BRADESCO LATIN AMERICAN HARD CURRENCY BOND FUND
Financial Highlights
Contained below is per share operating performance data for Institutional Class shares outstanding, total investment return, ratios to average net assets and other supplemental data for each of the respective periods. The total returns in the table represent the rate that an investor would have earned or lost on an investment in the Fund (assuming reinvestment of all dividends and distributions). This information has been derived from information provided in the financial statements and should be read in conjunction with the financial statements and the notes thereto.
| Institutional Class | ||||||||||||||||||||
| For the Year Ended April 30, 2017 | For the Year Ended April 30, 2016 | For the Year Ended April 30, 2015 | For the Period December 20 2013* to April 30, 2014 | |||||||||||||||||
Per Share Operating Performance | ||||||||||||||||||||
Net asset value, beginning of period | $ | 9.22 | $ | 10.01 | $ | 10.34 | $ | 10.00 | ||||||||||||
|
|
|
|
|
|
|
| |||||||||||||
Net investment income(1) | 0.34 | 0.31 | 0.25 | 0.13 | ||||||||||||||||
Net realized and unrealized gain/(loss) on investments | 0.55 | (0.79 | ) | (0.24 | ) | 0.28 | ||||||||||||||
|
|
|
|
|
|
|
| |||||||||||||
Net increase/(decrease) in net assets resulting from operations | 0.89 | (0.48 | ) | 0.01 | 0.41 | |||||||||||||||
|
|
|
|
|
|
|
| |||||||||||||
Dividends and distributions to shareholders from: | ||||||||||||||||||||
Net investment income | (0.30 | ) | (0.31 | ) | (0.27 | ) | (0.07 | ) | ||||||||||||
Net realized gains | — | — | (0.07 | ) | — | |||||||||||||||
|
|
|
|
|
|
|
| |||||||||||||
Total dividends and distributions to shareholders | (0.30 | ) | (0.31 | ) | (0.34 | ) | (0.07 | ) | ||||||||||||
|
|
|
|
|
|
|
| |||||||||||||
Net asset value, end of period. | $ | 9.81 | $ | 9.22 | $ | 10.01 | $ | 10.34 | ||||||||||||
|
|
|
|
|
|
|
| |||||||||||||
Total investment return(2) | 9.82 | % | (4.72 | )% | 0.07 | % | 4.10 | % | ||||||||||||
Ratio/Supplemental Data | ||||||||||||||||||||
Net assets, end of period (in thousands) | $ | 15,930 | $ | 14,580 | $ | 15,362 | $ | 4,704 | ||||||||||||
Ratio of expenses to average net assets | 1.50 | % | 1.50 | % | 1.50 | % | 1.50 | %(3) | ||||||||||||
Ratio of expenses to average net assets without waivers and expense reimbursements(4) | 2.36 | % | 2.41 | % | 2.81 | % | 7.61 | %(3) | ||||||||||||
Ratio of net investment income to average net assets | 3.54 | % | 3.35 | % | 2.48 | % | 3.59 | %(3) | ||||||||||||
Portfolio turnover rate | 49.01 | % | 50.22 | % | 109.19 | % | 6.52 | %(5) | ||||||||||||
| * | Commencement of operations. |
| (1) | The selected per share data was calculated using the average shares outstanding method for the period. |
| (2) | Total investment return is calculated assuming a purchase of shares on the first day and a sale of shares on the last day of each period reported and includes reinvestment of dividends and distributions, if any. Total return for periods less than one year are not annualized. |
| (3) | Annualized. |
| (4) | During the period, certain fees were waived and/or reimbursed. If such fee waivers and/or reimbursements had not occurred, the ratios would have been as indicated (See Note 2). |
| (5) | Not annualized. |
The accompanying notes are an integral part of the financial statements.
32
BRADESCO LATIN AMERICAN HARD CURRENCY BOND FUND
Financial Highlights
Contained below is per share operating performance data for Retail Class shares outstanding, total investment return, ratios to average net assets and other supplemental data for the respective period. The total return in the table represents the rate that an investor would have earned or lost on an investment in the Fund (assuming reinvestment of all dividends and distributions). This information has been derived from information provided in the financial statements and should be read in conjunction with the financial statements and the notes thereto.
| Retail Class | |||||||||||||||
| For the Year Ended April 30, 2017 | For the Year Ended April 30, 2016 | For the Period June 9, 2014* to April 30, 2015 | |||||||||||||
Per Share Operating Performance | |||||||||||||||
Net asset value, beginning of period | $ | 9.25 | $ | 10.03 | $ | 10.53 | |||||||||
|
|
|
|
|
| ||||||||||
Net investment income(1) | 0.32 | 0.28 | 0.20 | ||||||||||||
Net realized and unrealized gain/(loss) on investments | 0.54 | (0.78 | ) | (0.41 | ) | ||||||||||
|
|
|
|
|
| ||||||||||
Net increase/(decrease) in net assets resulting from operations | 0.86 | (0.50 | ) | (0.21 | ) | ||||||||||
|
|
|
|
|
| ||||||||||
Dividends and distributions to shareholders from: | |||||||||||||||
Net investment income | (0.28 | ) | (0.28 | ) | (0.22 | ) | |||||||||
Net realized gains. | — | — | (0.07 | ) | |||||||||||
|
|
|
|
|
| ||||||||||
Total dividends and distributions to shareholders | (0.28 | ) | (0.28 | ) | (0.29 | ) | |||||||||
|
|
|
|
|
| ||||||||||
Net asset value, end of period | $ | 9.83 | $ | 9.25 | $ | 10.03 | |||||||||
|
|
|
|
|
| ||||||||||
Total investment return(2) | 9.38 | % | (4.83 | )% | (1.97 | )% | |||||||||
Ratio/Supplemental Data | |||||||||||||||
Net assets, end of period (in thousands) | $ | 100 | $ | 92 | $ | 97 | |||||||||
Ratio of expenses to average net assets | 1.75 | % | 1.75 | % | 1.75 | %(3) | |||||||||
Ratio of expenses to average net assets without waivers and expense reimbursements(4) | 2.61 | % | 2.66 | % | 3.11 | %(3) | |||||||||
Ratio of net investment income to average net assets | 3.29 | % | 3.10 | % | 2.27 | %(3) | |||||||||
Portfolio turnover rate | 49.01 | % | 50.22 | % | 109.19 | %(5) | |||||||||
| * | Commencement of operations. |
| (1) | The selected per share data was calculated using the average shares outstanding method for the period. |
| (2) | Total investment return is calculated assuming a purchase of shares on the first day and a sale of shares on the last day of each period reported and includes reinvestment of dividends and distributions, if any. Total return for periods less than one year are not annualized. |
| (3) | Annualized. |
| (4) | During the period, certain fees were waived. If such fee waivers had not occurred, the ratios would have been as indicated (See Note 2). |
| (5) | Reflects portfolio turnover for the Fund for the year ended April 30, 2015. |
The accompanying notes are an integral part of the financial statements.
33
BRADESCO FUNDS
Notes to Financial Statements
April 30, 2017
1. Organization and Significant Accounting Policies
The Bradesco Latin American Equity Fund and the Bradesco Latin American Hard Currency Bond Fund (each a “Fund” and together the “Funds”) are non-diversified, open-end management investment companies registered under the Investment Company Act of 1940, as amended (the “1940 Act”). The Funds commenced operations on December 20, 2013. The Funds are each a separate series of FundVantage Trust (the “Trust”) which was organized as a Delaware statutory trust on August 28, 2006. The Trust is a “series trust” authorized to issue an unlimited number of separate series or classes of shares of beneficial interest. Each series is treated as a separate entity for certain matters under the 1940 Act, and for other purposes, and a shareholder of one series is not deemed to be a shareholder of any other series. The Funds are each authorized to issue and offer Class A, Class C, Institutional Class and Retail Class shares. As of October 31, 2016, Class A and Class C shares had not been issued for the Funds.
The Funds are investment companies and follow accounting and reporting guidance in the Financial Accounting Standards Board Accounting Standards Codification Topic 946.
Portfolio Valuation — Each Fund’s net asset value (“NAV”) is calculated once daily at the close of regular trading hours on the New York Stock Exchange (“NYSE”) (typically 4:00 p.m. Eastern time) on each day the NYSE is open. Securities held by each Fund are valued using the closing price or the last sale price on a national securities exchange or the National Association of Securities Dealers Automatic Quotation System (“NASDAQ”) market system where they are primarily traded. Equity securities listed on any national or foreign exchange market system will be valued at the last sale price. Equity securities traded in the over-the-counter market are valued at their closing price. If there were no transactions on that day, securities traded principally on an exchange will be valued at the mean of the last bid and ask prices prior to the market close. Prices for equity securities normally are supplied by an independent pricing service approved by the FundVantage Trust’s Board of Trustees (“Board of Trustees”). Fixed income securities are valued based on market quotations, which are furnished by an independent pricing service. Fixed income securities having remaining maturities of 60 days or less are generally valued at amortized cost, provided such amount approximates fair value. Debt securities are valued on the basis of broker quotations or valuations provided by a pricing service, which utilizes information with respect to recent sales, market transactions in comparable securities, quotations from dealers, and various relationships between securities in determining value. Futures contracts are generally valued using the settlement price determined by the relevant exchange. Valuations developed through pricing techniques may materially vary from the actual amounts realized upon sale of the securities. Any assets held by the Funds that are denominated in foreign currencies are valued daily in U.S. dollars at the foreign currency exchange rates that are prevailing at the time that the Funds determine the daily NAV per share. Foreign securities may trade on weekends or other days when the Funds do not calculate NAV. As a result, the market value of these investments may change on days when you cannot buy or sell shares of the Funds. Foreign securities are valued based on prices from the primary market in which they are traded and are translated from the local currency into U.S. dollars using current exchange rates. Investments in any mutual fund are
34
BRADESCO FUNDS
Notes to Financial Statements (Continued)
April 30, 2017
valued at their respective NAVs as determined by those mutual funds each business day (which may use fair value pricing as disclosed in their prospectuses). Securities that do not have a readily available current market value are valued in accordance with procedure adopted by the Trust’s Board of Trustees. The Board of Trustees has adopted methods for valuing securities and other assets in circumstances where market quotes are not readily available and has delegated to the Adviser the responsibility for applying the valuation methods. Relying on prices supplied by pricing services or dealers or using fair valuation may result in values that are higher or lower than the values used by other investment companies and investors to price the same investments. In the event that market quotes are not readily available, and the security or asset cannot be valued pursuant to one of the valuation methods, the value of the security or asset will be determined in good faith by the Adviser. The Trust has established a Valuation Committee which performs certain functions including the oversight of the Adviser’s fair valuation determinations.
Fair Value Measurements — The inputs and valuations techniques used to measure fair value of each Fund’s investments are summarized into three levels as described in the hierarchy below:
| • Level 1 — | quoted prices in active markets for identical securities; |
| • Level 2 — | other significant observable inputs (including quoted prices for similar securities, interest rates, prepayment speeds, credit risk, etc.); and |
| • Level 3 — | significant unobservable inputs (including each Fund’s own assumptions in determining the fair value of investments). |
The fair value of a Fund’s bonds are generally based on quotes received from brokers of independent pricing services. Bonds with quotes that are based on actual trades with a sufficient level of activity on or near the measurement date are classified as Level 2 assets.
The inputs or methodology used for valuing securities are not necessarily an indication of the risk associated with investing in those securities. Transfers in and out are recognized at the value at the end of the period.
Significant events (such as movement in the U.S. securities market, or other regional and local developments) may occur between the time that foreign markets close (where the security is principally traded) and the time that each Fund calculates its NAV (generally, the close of the NYSE) that may impact the value of securities traded in these foreign markets. As a result, each Fund fair values foreign securities using an independent pricing service which considers the correlation of the trading patterns of the foreign security to the intraday trading in the U.S. markets for investments such as American Depositary Receipts, financial futures, exchange traded funds and certain indexes as well as prices for similar securities. Such fair valuations are categorized as Level 2 in the hierarchy.
35
BRADESCO FUNDS
Notes to Financial Statements (Continued)
April 30, 2017
The following is a summary of the inputs used, as of April 30, 2017, in valuing each Fund’s investments carried at fair value:
| Bradesco Latin American Equity Fund | ||||||||||||||||
| Total Value at 04/30/17 | Level 1 Quoted Price | Level 2 Other Significant Observable Inputs | Level 3 Significant Unobservable Inputs | |||||||||||||
Common Stocks | $ | 12,610,913 | $ | 12,610,913 | $ | — | $ | — | ||||||||
Preferred Stocks | 2,478,150 | 2,478,150 | — | — | ||||||||||||
Registered Investment Company. | 713,647 | 713,647 | — | — | ||||||||||||
|
|
|
|
|
|
|
| |||||||||
Total Assets | $ | 15,802,710 | $ | 15,802,710 | $ | — | $ | — | ||||||||
|
|
|
|
|
|
|
| |||||||||
| Bradesco Latin American Hard Currency Bond Fund | ||||||||||||||||
| Total Value at 04/30/17 | Level 1 Quoted Price | Level 2 Other Significant Observable Inputs | Level 3 Significant Unobservable Inputs | |||||||||||||
Corporate Bonds and Notes | $ | 12,969,293 | $ | — | $ | 12,969,293 | $ | — | ||||||||
Government Bonds | 1,290,495 | — | 1,290,495 | — | ||||||||||||
Registered Investment Company | 1,489,002 | 1,489,002 | — | — | ||||||||||||
|
|
|
|
|
|
|
| |||||||||
Total Assets | $ | 15,748,790 | $ | 1,489,002 | $ | 14,259,788 | $ | — | ||||||||
|
|
|
|
|
|
|
| |||||||||
At the end of each quarter, management evaluates the classification of Levels 1, 2 and 3 assets and liabilities. Various factors are considered, such as changes in liquidity from the prior reporting period; whether or not a broker is willing to execute at the quoted price; the depth and consistency of prices from third party pricing services; and the existence of contemporaneous, observable trades in the market. Additionally, management evaluates the classification of Level 1 and Level 2 assets and liabilities on a quarterly basis for changes in listings or delistings on national exchanges.
Due to the inherent uncertainty of determining the fair value of investments that do not have readily available market value, the fair value of each Fund’s investments may fluctuate from period to period. Additionally, the fair value of investments may differ significantly from the values that would have been used had a ready market existed for such investments and may differ materially from the values each Fund may ultimately realize. Further, such investments may be subject to legal and other restrictions on resale or otherwise less liquid than publicly traded securities.
36
BRADESCO FUNDS
Notes to Financial Statements (Continued)
April 30, 2017
For fair valuations using significant unobservable inputs, U.S. generally accepted accounting principles (“U.S. GAAP”) require each Fund to present a reconciliation of the beginning to ending balances for reported market values that presents changes attributable to total realized and unrealized gains or losses, purchase and sales, and transfers in and out of Level 3 during the period. Transfers in and out between Levels are based on values at the end of the period. U.S. GAAP also requires each Fund to disclose amounts and reasons for all transfers in and out of Level 1 and Level 2 fair value measurements. A reconciliation of Level 3 investments is presented only when a Fund had an amount of Level 3 investments at the end of the reporting period that was meaningful in relation to its net assets. The amounts and reasons for all transfers in and out of each Level within the three-tier hierarchy are disclosed when such Fund had an amount of total transfers during the reporting period that was meaningful in relation to its net assets as of the end of the reporting period.
For the year ended April 30, 2017, there were no significant transfers among Levels 1, 2 and 3 for the Funds.
Forward Foreign Currency Contracts — A forward foreign currency contract (“Forward Contract”) is a commitment to buy or sell a specific amount of a foreign currency at a negotiated price on a specified future date. Forward Contracts can help a fund manage the risk of changes in currency exchange rates. These contracts are marked-to-market daily at the applicable forward currency translation rates. A fund records realized gains or losses at the time the Forward Contract is closed. A Forward Contract is extinguished through a closing transaction or upon delivery of the currency or entering an offsetting contract. The fund’s maximum risk of loss from counterparty credit risk related to Forward Contracts is the fair value of the contract.
Futures Contracts — The Funds may use futures contracts for hedging or speculative purposes consistent with its investment objective. Upon entering into a futures contract, the Funds must deposit initial margin in addition to segregating cash or liquid assets sufficient to meet its obligation to purchase or provide securities, or to pay the amount owed at the expiration of an index-based futures contract. Such liquid assets may consist of cash, cash equivalents, liquid debt or equity securities or other acceptable assets. Pursuant to the futures contract, the Funds agree to receive from, or pay to the broker, an amount of cash equal to the daily fluctuation in value of the contract. Such a receipt of payment is known as “variation margin” and is recorded by the Funds as an unrealized gain or loss. When the contract is closed, the Funds record a realized gain or loss equal to the difference between the proceeds from (or cost of) the closing transactions and the Funds’ basis in the contract. Futures contracts have market risks, including the risk that the change in the value of the contract may not correlate with changes in the value of the underlying securities. Use of long futures contracts subjects the Funds to risk of loss in excess of the amount shown on the Statements of Assets and Liabilities, up to the notional value of the futures contract. Use of short futures contracts subjects the Funds to unlimited risk of loss.
As of April 30, 2017, the Funds had no open future contracts.
37
BRADESCO FUNDS
Notes to Financial Statements (Continued)
April 30, 2017
Purchased Options — The Funds are subject to equity and other risk exposure in the normal course of pursuing its investment objectives. The Funds purchase option contracts. This transaction is used to hedge against the values of equities. The risk associated with purchasing an option is that the Funds pays a premium whether or not the option is exercised. Additionally, the Funds bear the risk of loss of premium and change in market value should the counterparty not perform under the contract. Put and call options are accounted for in the same manner as other securities owned. The cost of securities acquired through the exercise of call options is increased by the premiums paid. The proceeds from securities sold through the exercise of put options are decreased by the premiums paid.
For the year ended April 30, 2017, the Bradesco Latin American Hard Currency Bond Fund’s quarterly average volume of derivatives was as follows:
Purchased Options (Cost) |
| $26,041 |
Options Written — The Funds are subject to equity and other risk exposure in the normal course of pursuing its investment objectives and may enter into options written to hedge the values of equities. Such options may relate to particular securities or domestic stock indices, and may or may not be listed on a domestic securities exchange or issued by the Options Clearing Corporation. An option contract is a commitment that gives the purchaser of the contract the right, but not the obligation, to buy or sell an underlying asset at a specific price on or before a specified future date. On the other hand, the writer of an option contract is obligated, upon the exercise of the option, to buy or sell an underlying asset at a specific price on or before a specified future date. The maximum risk of loss associated with writing put options is limited to the exercised fair value of the option contract. The maximum risk of loss associated with writing call options is potentially unlimited. The Funds also have the additional risk of being unable to enter into a closing transaction at an acceptable price if a liquid secondary market does not exist. The Funds also may write over-the-counter options where completing the obligation depends upon the credit standing of the other party. Option contracts also involve the risk that they may result in loss due to unanticipated developments in market conditions or other causes. Written options are initially recorded as liabilities to the extent of premiums received and subsequently marked to market to reflect the current value of the option written. Gains or losses are realized when the option transaction expires or closes. When an option is exercised, the proceeds on sales for a written call option or the purchase cost for a written put option is adjusted by the amount of the premium received. Listed option contracts present minimal counterparty credit risk since they are exchange traded and the exchange’s clearinghouse, as counterparty to all exchange-traded options, guarantees the options against default. A Fund’s maximum risk of loss from counterparty credit risk related to OTC option contracts is limited to the premium paid. As of April 30, 2017, the Funds had no written options.
38
BRADESCO FUNDS
Notes to Financial Statements (Continued)
April 30, 2017
The Bradesco Latin American Hard Currency Bond Fund had transactions in options written during the year ended April 30, 2017 as follows:
| Number of Contracts | Premium | |||||||||
Outstanding, April 30, 2016 | — | $ | — | |||||||
Options Written | 133 | 49,813 | ||||||||
Options Closed | (133 | ) | (49,813 | ) | ||||||
|
|
|
| |||||||
Outstanding, April 31, 2017 | — | $ | — | |||||||
|
|
|
| |||||||
Use of Estimates — The preparation of financial statements in conformity with U.S. GAAP requires management to make estimates and assumptions that affect the amounts reported in the financial statements and accompanying notes at the date of the financial statements and the reported amounts of revenues and expenses during the period. Actual results could differ from those estimates and those differences could be material.
Investment Transactions, Investment Income and Expenses — Investment transactions are recorded on trade date for financial statement preparation purposes. Realized gains and losses on investments sold are recorded on the identified cost basis. Interest income is recorded on the accrual basis. Accretion of discounts and amortization of premiums are recorded on a daily basis using the effective yield method except for short term securities, which records discounts and premiums on a straight-line basis. Dividends are recorded on the ex-dividend date. General expenses of the Trust are generally allocated to each fund in proportion to its relative daily net assets. Expenses directly attributable to a particular fund in the Trust are charged directly to that fund. The Funds’ investment income, expenses (other than class-specific expenses) and unrealized and realized gains and losses are allocated daily to each class of shares of such Fund based upon the relative proportion of net assets of each class at the beginning of the day.
Foreign Currency Translation — Assets and liabilities initially expressed in non-U.S. currencies are translated into U.S. dollars based on the applicable exchange rates at the date of the last business day of the financial statement period. Purchases and sales of securities, interest income, dividends, variation margin received and expenses denominated in foreign currencies are translated into U.S. dollars at the exchange rates in effect on the transaction date.
Each Fund does not separately report the effect of changes in foreign exchange rates from changes in market prices of securities held. Such changes are included with the net realized gain or loss and change in unrealized appreciation or depreciation on investment securities in a Fund’s Statement of Operations. Other foreign currency transactions resulting in realized and unrealized gain or loss are reported separately as net realized gain or loss and change in unrealized appreciation or depreciation on foreign currencies in a Fund’s Statement of Operations.
39
BRADESCO FUNDS
Notes to Financial Statements (Continued)
April 30, 2017
Dividends and Distributions to Shareholders — Dividends from net investment income, if any, are declared and paid at least annually to shareholders of the Bradesco Latin American Equity Fund and dividends from net investment income, if any, are declared and paid quarterly to shareholders of the Bradesco Latin American Hard Currency Bond Fund. Distributions from net realized capital gains, if any, will be declared and paid at least annually to shareholders and recorded on ex-date for both Funds. Income dividends and capital gain distributions are determined in accordance with U.S. federal income tax regulations, which may differ from U.S. GAAP. These differences may include the treatment of non-taxable dividends, expiring capital loss carryforwards and losses deferred due to wash sales and excise tax regulations. Permanent book and tax basis differences relating to shareholder distributions will result in reclassifications within the components of net assets.
U.S. Tax Status — No provision is made for U.S. income taxes as it is each Fund’s intention to continue to qualify for and elect the tax treatment applicable to regulated investment companies under Subchapter M of the Internal Revenue Code of 1986, as amended (the “Internal Revenue Code”), and make the requisite distributions to its shareholders which will be sufficient to relieve it from U.S. income and excise taxes.
Other — In the normal course of business, each Fund may enter into contracts that provide general indemnifications. Each Fund’s maximum exposure under these arrangements is dependent on claims that may be made against each Fund in the future, and, therefore, cannot be estimated; however, based on experience, the risk of material loss for such claims is considered remote.
Currency Risk — Each Fund invests in securities of foreign issuers, including American Depositary Receipts. These markets are subject to special risks associated with foreign investments not typically associated with investing in U.S. markets. Because the foreign securities in which each Fund may invest generally trade in currencies other than the U.S. dollar, changes in currency exchange rates will affect each Fund’s NAV, the value of dividends and interest earned and gains and losses realized on the sale of securities. Because the NAV for each Fund is determined on the basis of U.S. dollars, each Fund may lose money by investing in a foreign security if the local currency of a foreign market depreciates against the U.S. dollar, even if the local currency value of each Fund’s holdings goes up. Generally, a strong U.S. dollar relative to these other currencies will adversely affect the value of each Fund’s holdings in foreign securities.
Foreign Securities Market Risk — Securities of many non-U.S. companies may be less liquid and their prices more volatile than securities of comparable U.S. companies. Securities of companies traded in many countries outside the U.S., particularly emerging markets countries, may be subject to further risks due to the inexperience of local investment professionals and financial institutions, the possibility of permanent or temporary termination of trading and greater spreads between bid and asked prices of securities. In addition, non-U.S. stock exchanges and investment professionals are subject to less governmental regulation, and commissions may be higher than in the United States. Also, there may be delays in the settlement of non-U.S. stock exchange transactions.
40
BRADESCO FUNDS
Notes to Financial Statements (Continued)
April 30, 2017
Emerging Markets Risk — The Bradesco Latin American Equity Fund and the Bradesco Latin American Hard Currency Bond Fund each invests in emerging market instruments which are subject to certain credit and market risks. The securities and currency markets of emerging market countries are generally smaller, less developed, less liquid and more volatile than the securities and currency markets of the United States and other developed markets. Disclosure and regulatory standards in many respects are less stringent than in other developed markets. There also may be a lower level of monitoring and regulation of securities markets in emerging market countries and the activities of investors in such markets and enforcement of existing regulations may be extremely limited. Political and economic structures in many of these countries may be in their infancy and developing rapidly, and such countries may lack the social, political and economic stability characteristics of more developed countries.
Debt Investment Risk — Debt investments are affected primarily by the financial condition of the companies or other entities that have issued them and by changes in interest rates. There is a risk that an issuer of a Fund’s debt investments may not be able to meet its financial obligations (e.g., may not be able to make principal and/or interest payments when they are due or otherwise default on other financial terms) and/or go bankrupt. Securities such as high-yield/high-risk bonds, e.g., bonds with low credit ratings by Moody’s (Ba or lower) or Standard & Poor’s (BB and lower) or if unrated are of comparable quality as determined by the manager, are especially subject to credit risk during periods of economic uncertainty or during economic downturns and are more likely to default on their interest and/or principal payments than higher rated securities. Debt investments may be affected by changes in interest rates. Debt investments with longer durations tend to be more sensitive to changes in interest rates, making them more volatile than debt investments with shorter durations or floating or adjustable interest rates. The value of debt investments may fall when interest rates rise.
Recent Accounting Pronouncement — In October 2016, the U.S. Securities and Exchange Commission (“SEC”) issued a new rule, Investment Company Reporting Modernization, which, among other provisions, amends Regulation S-X to require standardized, enhanced disclosures, particularly related to derivatives, in investment company financial statements. Compliance with the amendments to Regulation S-X is required for financial statements filed with the SEC on or after August 1, 2017. Management is currently evaluating the impact that the amendments will have on the Funds’ financial statements and related disclosures.
2. Transactions with Related Parties and Other Service Providers
BRAM US LLC (“BRAM US” or the “Adviser”) serves as investment adviser to each Fund pursuant to an investment advisory agreement with the Trust (the “Advisory Agreement”). For its services, the Adviser is paid a monthly fee at the annual rate of 1.00% of the Bradesco Latin American Equity Fund’s average daily net assets, and 0.75% of the Bradesco Latin American Hard Currency Bond Fund’s average
41
BRADESCO FUNDS
Notes to Financial Statements (Continued)
April 30, 2017
daily net assets. The Adviser has contractually agreed to reduce its investment advisory fee and/or reimburse certain expenses of each Fund to the extent necessary to ensure that the “Total Annual Fund Operating Expenses”, excluding taxes, any class specific fees and expenses (such as Rule 12b-1 distribution fees, shareholder service fees or transfer agency fees), “Acquired Fund” fees and expenses, interest, extraordinary items and brokerage commissions, do not exceed 1.75% and 1.50% (on an annual basis) of the Bradesco Latin American Equity Fund and the Bradesco Latin American Hard Currency Bond Fund’s average daily net assets (the “Expense Limitations”), respectively. The Expense Limitations will remain in place with respect to each Fund until August 31, 2017, unless the Board of Trustees of the Trust approves its earlier termination. The Adviser is entitled to recover, subject to approval by the Board of Trustees, such amounts reduced or reimbursed for a period of up to three (3) years from the year in which the Adviser reduced its compensation and/or assumed expenses for each Fund. The Adviser is permitted to seek reimbursement from the Fund, subject to certain limitations, for fees it waived and Fund expenses it paid to the extent the total annual fund operating expenses do not exceed the limits described above or any lesser limits in effect as the time of reimbursement. No recoupment will occur with respect to a Fund unless such Fund’s expenses are below the Expense Limitation amount.
For the year ended April 30, 2017, investment advisory fees accrued and waived were $143,127 and $134,253 and $115,732 and $115,732 for the Bradesco Latin American Equity Fund and the Bradesco Latin American Hard Currency Bond Fund, respectively. Additionally, the Adviser reimbursed expenses and other fees of $17,132 for the Bradesco Latin American Hard Currency Bond Fund
As of April 30, 2017, the amounts of potential recoupment by the Adviser were as follows:
| Expiration | ||||||||||||||||
| 04/30/2018 | 04/30/2019 | 04/30/2020 | Total | |||||||||||||
Bradesco Latin American Equity Fund | $ | 161,787 | $ | 155,890 | $ | 134,253 | $ | 451,930 | ||||||||
Bradesco Latin American Hard Currency Bond Fund | 158,963 | 130,601 | 132,864 | 422,428 | ||||||||||||
Other Service Providers
BNY Mellon Investment Servicing (US) Inc. (“BNY Mellon”) serves as administrator and transfer agent for the Funds. For providing administrative and accounting services, BNY Mellon is entitled to receive a monthly fee equal to an annualized percentage rate of each Funds’ average daily net assets and is subject to certain minimum monthly fees. For providing transfer agency services, BNY Mellon is entitled to receive a monthly fee, subject to certain minimum, and out of pocket expenses.
42
BRADESCO FUNDS
Notes to Financial Statements (Continued)
April 30, 2017
The Bank of New York Mellon (the “Custodian”) provides certain custodial services to the Funds. The Custodian is entitled to receive a monthly fee, subject to certain minimum, and out of pocket expenses.
Foreside Funds Distributors LLC (the “Underwriter”) provides principal underwriting services to the Funds pursuant to an underwriting agreement between the Trust and the Underwriter.
The Trust and the Underwriter are parties to an underwriting agreement. The Trust has adopted a distribution plan for Retail Class shares in accordance with Rule 12b-1 under the 1940 Act. Pursuant to the Retail Class shares plan, the Fund compensates the Underwriter for direct and indirect costs and expenses incurred in connection with advertising, marketing and other distribution services in an amount not to exceed 0.25% on an annualized basis of the average daily net assets of the Fund’s Retail Class shares.
Trustees and Officers
The Trust is governed by its Board of Trustees. The Trustees receive compensation in the form of an annual retainer and per meeting fees for their services to the Trust. The remuneration paid to the Trustees by the Funds during the year ended April 30, 2017 was $6,819 and $7,856 for the Bradesco Latin American Equity Fund and the Bradesco Latin American Hard Currency Bond Fund, respectively. An employee of BNY Mellon serves as the Secretary of the Trust and is not compensated by the Funds or the Trust.
Effective June 1, 2016 and July 1, 2016, JW Fund Management LLC (“JWFM”) provides a Principal Executive Officer and Principal Financial Officer, respectively, to the Trust. JWFM is compensated for the services provided to the Trust. Until May 31, 2016 and June 30, 2016, certain employees of BNY Mellon served as Principal Executive Officer and Principal Financial Officer, respectively, to the Trust. They were not compensated by the Trust or the Funds.
Freeh Group International Solutions, LLC provides the Trust with a Chief Compliance Officer and an Anti-Money Laundering Officer.
3. Investment in Securities
For the year ended April 30, 2017, aggregate purchases and sales of investment securities (excluding short-term investments) of the Funds were as follows:
| Purchases | Sales | |||||||
Bradesco Latin American Equity Fund | $ | 15,365,532 | $ | 15,028,407 | ||||
Bradesco Latin American Hard Currency Bond Fund. | 7,079,089 | 7,252,729 | ||||||
43
BRADESCO FUNDS
Notes to Financial Statements (Continued)
April 30, 2017
4. Capital Share Transactions
For the years ended April 30, 2017 and 2016, transactions in capital shares (authorized shares unlimited) were as follows:
| Bradesco Latin American Equity Fund | ||||||||||||||||||||
| For the Year Ended April 30, 2017 | For the Year Ended April 30, 2016 | |||||||||||||||||||
| Shares | Amount | Shares | Amount | |||||||||||||||||
Institutional Class | ||||||||||||||||||||
Reinvestments | 6,235 | $ | 46,574 | — | $ | — | ||||||||||||||
|
|
|
|
|
|
|
| |||||||||||||
Net Increase | 6,235 | $ | 46,574 | — | $ | — | ||||||||||||||
|
|
|
|
|
|
|
| |||||||||||||
Retail Class | ||||||||||||||||||||
Sales | 30,987 | $ | 240,030 | 3,513 | $ | 27,302 | ||||||||||||||
Reinvestments | 94 | 700 | — | — | ||||||||||||||||
Redemption Fees* | — | 70 | — | — | ||||||||||||||||
Redemptions | (7,795 | ) | (58,785 | ) | — | — | ||||||||||||||
|
|
|
|
|
|
|
| |||||||||||||
Net Increase | 23,286 | $ | 182,015 | 3,513 | $ | 27,302 | ||||||||||||||
|
|
|
|
|
|
|
| |||||||||||||
Total Net Increase | 29,521 | $ | 228,589 | 3,513 | $ | 27,302 | ||||||||||||||
|
|
|
|
|
|
|
| |||||||||||||
| Bradesco Latin American Hard Currency Bond Fund | ||||||||||||||||||||
| For the Year Ended April 30, 2017 | For the Year Ended April 30, 2016 | |||||||||||||||||||
| Shares | Amount | Shares | Amount | |||||||||||||||||
Institutional Class | ||||||||||||||||||||
Sales | — | $ | — | 800,010 | $ | 7,208,092 | ||||||||||||||
Reinvestments | 43,336 | 410,899 | 45,121 | 404,420 | ||||||||||||||||
Redemptions | — | — | (800,010 | ) | (7,208,092 | ) | ||||||||||||||
|
|
|
|
|
| |||||||||||||||
Net Increase | 43,336 | $ | 410,899 | 45,121 | $ | 404,420 | ||||||||||||||
|
|
|
|
|
|
|
| |||||||||||||
Retail Class | ||||||||||||||||||||
Sales | 128 | $ | 1,207 | 13 | $ | 115 | ||||||||||||||
Reinvestments | 203 | 1,927 | 216 | 1,944 | ||||||||||||||||
Redemption Fees* | — | 5 | — | — | ||||||||||||||||
Redemptions | (127 | ) | (1,199 | ) | — | — | ||||||||||||||
|
|
|
|
|
|
|
| |||||||||||||
Net Increase | 204 | $ | 1,940 | 229 | $ | 2,059 | ||||||||||||||
|
|
|
|
|
|
|
| |||||||||||||
Total Net Increase | 43,540 | $ | 412,839 | 45,350 | $ | 406,479 | ||||||||||||||
|
|
|
|
|
|
|
| |||||||||||||
| * | There is a 2.00% redemption fee that may be charged on shares redeemed which have been held for 30 days or less. The redemption fee is retained by the Funds for the benefit of the remaining shareholders and recorded as paid-in-capital. |
44
BRADESCO FUNDS
Notes to Financial Statements (Continued)
April 30, 2017
5. Federal Tax Information
The Funds have followed the authoritative guidance on accounting for and disclosure of uncertainty in tax positions, which requires the Funds to determine whether a tax position is more likely than not to be sustained upon examination, including resolution of any related appeals or litigation processes, based on the technical merits of the position. The Funds have determined that there was no effect on the financial statements from following this authoritative guidance. In the normal course of business, the Funds are subject to examination by federal, state and local jurisdictions, where applicable, for tax years for which applicable statutes of limitations have not expired.
Distributions are determined in accordance with federal income tax regulations, which may differ in amount or character from net investment income and realized gains for financial reporting purposes. Accordingly, the character of distributions and composition of net assets for tax purposes may differ from those reflected in the accompanying financial statements. To the extent these differences are permanent, such amounts are reclassified within the components of net assets based on the tax treatment; temporary differences do not require reclassifications. Net assets were not affected by these adjustments.
The following permanent differences as of April 30, 2017, primarily attributed to gains and losses on foreign currency transactions, gain on the sale of a passive foreign investment company security, and disallowed expenses, were reclassified among the following accounts:
| Accumulated Net Investment Income/(Loss) | Accumulated Net Realized Gain/(Loss) | Paid-in-Capital | |||||||||||||
Bradesco Latin American Equity Fund | $ | (58,221 | ) | $ | 58,980 | $ | (759 | ) | |||||||
Bradesco Latin American Hard Currency Bond Fund | — | — | — | ||||||||||||
For the year ended April 30, 2017, the tax character of distributions paid by the Bradesco Latin American Equity Fund and Bradesco Latin American Hard Currency Bond Fund were $55,444 and $483,601 of ordinary income dividends, respectively. For the year ended April 30, 2016, there were no distributions for the Bradesco Latin American Equity Fund, and the tax character of distributions paid by the Bradesco Latin American Hard Currency Bond Fund was $476,450 of ordinary income dividends. Distributions from net investment income and short-term capital gains are treated as ordinary income for federal income tax purposes.
45
BRADESCO FUNDS
Notes to Financial Statements (Continued)
April 30, 2017
As of April 30, 2017, the components of distributable earnings on a tax basis were as follows:
| Capital Loss Carryforward | Undistributed Ordinary Income | Undistributed Long-Term Gain | Unrealized Appreciation | Qualified Late-Year Losses | |||||||||||||||||||||
Bradesco Latin American Equity Fund | $ | (3,738,966 | ) | $ | 26,848 | $ | — | $ | 965,746 | $ | — | ||||||||||||||
Bradesco Latin American Hard Currency Bond Fund | (801,526 | ) | 125,330 | — | 182,015 | — | |||||||||||||||||||
The differences between the book and tax basis components of distributable earnings relate primarily to the timing and recognition of income and gains for federal income tax purposes. Foreign currency and short-term capital gains are reported as ordinary income for federal income tax purposes.
As of April 30, 2017, the federal tax cost, aggregate gross unrealized appreciation and depreciation of securities held by the Funds were as follows:
| Gross | Gross | |||||||||||||||||||
| Federal Tax | Unrealized | Unrealized | Net Unrealized | |||||||||||||||||
| Cost | Appreciation | Depreciation | Appreciation | |||||||||||||||||
Bradesco Latin American Equity Fund | $ | 14,837,798 | $ | 1,598,412 | $ | (633,500 | ) | $ | 964,912 | |||||||||||
Bradesco Latin American Hard Currency Bond Fund | 15,566,776 | 480,447 | (298,433 | ) | 182,014 | |||||||||||||||
Pursuant to federal income tax rules applicable to regulated investment companies, the Funds may elect to treat certain capital losses between November 1 and April 30 and late year ordinary losses ((i) ordinary losses between January 1 and April 30, and (ii) specified ordinary and currency losses between November 1 and April 30) as occurring on the first day of the following tax year. For the year ended April 30, 2017, any amount of losses elected within the tax return will not be recognized for federal income tax purposes until May 1, 2017. For the year ended April 30, 2017, the Funds had no capital loss deferrals.
Accumulated capital losses represent net capital loss carryforwards as of April 30, 2017 that may be available to offset future realized capital gains and thereby reduce future capital gains distributions. As of April 30, 2017, the Bradesco Latin American Equity Fund had capital loss carryforwards of $3,738,966, of which $1,916,206 are short-term losses and $1,822,760 are long-term losses. As of April 30, 2017, the Bradesco Latin American Hard Currency Bond Fund had capital loss carryforwards of $801,526, of which $587,615 are short-term losses and $213,911 are long-term losses.
46
BRADESCO FUNDS
Notes to Financial Statements (Concluded)
April 30, 2017
6. Subsequent Events
Management has evaluated the impact of all subsequent events on each Fund through the date the financial statements were issued and has determined that there was the following subsequent event:
The Board of Trustees of FundVantage Trust (the “Trust”) approved a plan to liquidate and terminate the Funds. The plan of liquidation provides that the Funds will cease their business, liquidate their assets and distribute their liquidation proceeds to all of the Funds’ shareholders of record. Final liquidation of the Funds occurred on June 14, 2017.
The Funds ceased accepting purchase orders and closed to all new and existing investors on May 19, 2017.
If a shareholder has not redeemed his or her shares by the liquidation date, the shareholder’s shares automatically will be redeemed and proceeds will be sent to the shareholder of record. Liquidation proceeds will be paid in cash at the Fund’s applicable net asset value per share.
As the liquidation of the Funds approaches, the Funds’ investment adviser is expected to increase the portion of each Fund’s assets held in cash and similar investments and reduce maturities of non-cash investments in order to prepare for an orderly liquidation and to meet anticipated redemption requests. This may adversely affect a Fund’s yield. The impending liquidation of the Funds may result in large redemptions, which could adversely affect a Fund’s expense ratio, although existing contractual fee waivers will be maintained. Also, as the Funds’ liquidation approaches, the Funds will cease to pursue their respective investment objectives.
The redemption of shares held by a shareholder as part of the liquidation generally will be considered a taxable event. Prior to final liquidation, the Funds made distributions of income. These distributions will have the tax and other consequences described in the Funds’ prospectus and statement of additional information. A shareholder should consult with the shareholder’s tax advisor to discuss the Funds’ liquidation and the tax consequences to the shareholder.
47
BRADESCO FUNDS
Report of Independent Registered Public Accounting Firm
To the Board of Trustees of FundVantage Trust and Shareholders of the
Bradesco Latin American Equity Fund and Bradesco Latin American Hard Currency Bond Fund
We have audited the accompanying statements of assets and liabilities, including the portfolios of investments, of the Bradesco Latin American Equity Fund and Bradesco Latin American Hard Currency Bond Fund (the “Funds”), each a series of FundVantage Trust as of April 30, 2017, and the related statements of operations for the year then ended, the statements of changes in net assets and the financial highlights for the two years in the period then ended. These financial statements and financial highlights are the responsibility of the Funds’ management. Our responsibility is to express an opinion on these financial statements and financial highlights based on our audits. The financial highlights for the year ended April 30, 2015 and the period ended April 30, 2014 were audited by other independent registered public accountants whose report thereon, dated June 22, 2015, expressed and unqualified opinion on those financial highlights.
We conducted our audits in accordance with standards of the Public Company Accounting Oversight Board (United States). Those standards require that we plan and perform the audits to obtain reasonable assurance about whether the financial statements and financial highlights are free of material misstatement. The Funds are not required to have, nor were we engaged to perform, an audit of the Funds’ internal control over financial reporting. Our audits included consideration of internal control over financial reporting as a basis for designing audit procedures that are appropriate in the circumstances, but not for the purposes of expressing an opinion on the effectiveness of the Funds’ internal control over financial reporting. Accordingly, we express no such opinion. An audit includes examining, on a test basis, evidence supporting the amounts and disclosures in the financial statements. Our procedures included confirmation of securities owned as of April 30, 2017, by correspondence with the custodian and brokers or by other appropriate auditing procedures where replies from brokers were not received. An audit also includes assessing the accounting principles used and significant estimates made by management, as well as evaluating the overall financial statement presentation. We believe that our audits provide a reasonable basis for our opinion.
In our opinion, the financial statements and financial highlights referred to above present fairly, in all material respects, the financial position of Bradesco Latin American Equity Fund and Bradesco Latin American Hard Currency Bond Fund, as of April 30, 2017, the results of their operations for the year then ended, the changes in their net assets and the financial highlights for the two years in the period then ended, in conformity with accounting principles generally accepted in the United States of America.
TAIT, WELLER & BAKER LLP
Philadelphia, Pennsylvania
June 26, 2017
48
BRADESCO FUNDS
Shareholder Tax Information
(Unaudited)
The Funds are required by Subchapter M of the Internal Revenue Code of 1986, as amended, to advise their shareholders of the U.S. federal tax status of distributions received by the Funds’ shareholders in respect of such fiscal year. During the fiscal year ended April 30, 2017, the Bradesco Latin American Equity Fund and Bradesco Latin American Hard Currency Bond Fund paid $55,444 and $483,601 of ordinary income dividends, respectively, to its shareholders. Dividends from net investment income and short-term capital gains are treated as ordinary income dividends for federal income tax purposes.
The percentage of qualified interest income related dividends not subject to withholding tax for non-resident aliens and foreign corporations are 0.47% and 0.21% for the Bradesco Latin American Equity Fund and Bradesco Latin American Hard Currency Bond Fund, respectively.
The Bradesco Latin American Equity Fund designates 98.23% of the ordinary income distribution as qualified dividend income pursuant to the Jobs and Growth Tax Relief Reconciliation Act of 2003. There was no percentage of qualified dividend income for the Bradesco Latin American Hard Currency Bond Fund.
The Bradesco Latin American Equity Fund recognized foreign source income of $370,338 and has elected to pass through to their shareholders the foreign taxes paid of $7,188 for year ended April 30, 2017.
All designations are based on financial information available as of the date of this annual report and, accordingly, are subject to change. For each item, it is the intention of the Funds to designate the maximum amount permitted under the Internal Revenue Code of 1986, as amended, and the regulations thereunder.
Because the Funds’ fiscal year is not the calendar year, another notification will be sent with respect to calendar year 2017. The second notification, which will reflect the amount, if any, to be used by calendar year taxpayers on their U.S. federal income tax returns, will be made in conjunction with Form 1099-DIV and will be mailed in January 2018.
Foreign shareholders will generally be subject to U.S. withholding tax on the amount of their ordinary income dividends. They will generally not be entitled to a foreign tax credit or deduction for the withholding taxes paid by a Fund, if any.
In general, dividends received by tax-exempt recipients (e.g., IRAs and Keoghs) need not be reported as taxable income for U.S. federal income tax purposes. However, some retirement trusts (e.g., corporate, Keogh and 403(b)(7) plans) may need this information for their annual information reporting.
Shareholders are advised to consult their own tax advisers with respect to the tax consequences of their investment in a Fund.
49
BRADESCO FUNDS
Other Information
(Unaudited)
Proxy Voting
Policies and procedures that the Funds use to determine how to vote proxies relating to portfolio securities as well as information regarding how the Funds voted proxies relating to portfolio securities for the most recent 12-month period ended June 30 are available without charge, upon request, by calling (866) 640-5705 and on the Securities and Exchange Commission’s (“SEC”) website at http:// www.sec.gov.
Quarterly Portfolio Schedules
The Trust files its complete schedule of portfolio holdings with the SEC for the first and third fiscal quarters of each fiscal year (quarters ended July 31 and January 31) on Form N-Q. The Trust’s Forms N-Q are available on the SEC’s website at http://www.sec.gov and may be reviewed and copied at the SEC’s Public Reference Room in Washington, D.C. Information on the operation of the SEC’s Public Reference Room may be obtained by calling 1-800-SEC-0330.
50
BRADESCO FUNDS
Privacy Notice
(Unaudited)
The privacy of your personal financial information is extremely important to us. When you open an account with us, we collect a significant amount of information from you in order to properly invest and administer your account. We take very seriously the obligation to keep that information private and confidential, and we want you to know how we protect that important information.
We collect nonpublic personal information about you from applications or other forms you complete and from your transactions with us or our affiliates. We do not disclose information about you, or our former clients, to our affiliates or to service providers or other third parties, except as permitted by law. We share only the information required to properly administer your accounts, which enables us to send transaction confirmations, monthly or quarterly statements, financials and tax forms. Even within FundVantage Trust and its affiliated entities, a limited number of people who actually service accounts will have access to your personal financial information. Further, we do not share information about our current or former clients with any outside marketing groups or sales entities.
To ensure the highest degree of security and confidentiality, FundVantage Trust and its affiliates maintain various physical, electronic and procedural safeguards to protect your personal information. We also apply special measures for authentication of information you request or submit to us on our web site.
If you have questions or comments about our privacy practices, please call us at (866) 640-5705.
51
BRADESCO FUNDS
Fund Management
(Unaudited)
FundVantage Trust (the “Trust”) is governed by a Board of Trustees (the “Trustees”). The primary responsibility of the Trustees is to represent the interest of the Trust’s shareholders and to provide oversight management of the Trust.
The following tables present certain information regarding the Board of Trustees and officers of the Trust. None of the Trustees are an “interested person” of the Trust, the Adviser, another investment adviser of a series of the Trust, or Foreside Funds Distributors LLC, the principal underwriter of the Trust (“Underwriter”), within the meaning of the 1940 Act and each Trustee is referred to as an “Independent Trustee” and is listed under such heading below. The address of each Trustee and Officer as it relates to the Trust’s business is 301 Bellevue Parkway, 2nd Floor, Wilmington, DE 19809.
The Statement of Additional Information for the Fund contains additional information about the Trustees and is available, without charge, upon request by calling (866) 640-5705.
Name and Date of Birth | Position(s) Held with Trust | Term of Office and Length of Time Served | Principal Occupation(s) During Past Five Years | Number of Funds in Trust Complex Overseen by Trustee | Other Directorships Held by Trustee | |||||
| INDEPENDENT TRUSTEES | ||||||||||
ROBERT J. CHRISTIAN Date of Birth: 2/49 | Trustee and Chairman of the Board | Shall serve until death, resignation or removal. Trustee and Chairman since 2007. | Retired since February 2006; Executive Vice President of Wilmington Trust Company from February 1996 to February 2006; President of Rodney Square Management Corporation (“RSMC”) (investment advisory firm)from 1996 to 2005; Vice President of RSMC from 2005 to 2006. | 42 | Optimum Fund Trust (registered investment company with 6 portfolios). | |||||
IQBAL MANSUR Date of Birth: 6/55 | Trustee | Shall serve until death, resignation or removal. Trustee since 2007. | University Professor, Widener University. | 42 | None. | |||||
52
BRADESCO FUNDS
Fund Management (Continued)
(Unaudited)
Name and Date of Birth | Position(s) Held with Trust | Term of Office and Length of Time Served | Principal Occupation(s) During Past Five Years | Number of Funds in Trust Complex Overseen by Trustee | Other Directorships Held by Trustee | |||||
NICHOLAS M. MARSINI, JR. Date of Birth: 8/55 | Trustee | Shall serve until death, resignation or removal. Trustee since 2016. | Retired since March 2016. President of PNC Bank Delaware from June 2011 to March 2016; Executive Vice President Finance of BNY Mellon from July 2010 to January 2011; Executive Vice President and Chief Financial Officer of PNC Global Investment Servicing from September 1997 to July 2010. | 42 | Brinker Capital Destinations Trust (registered investment company with 10 portfolios). | |||||
STEPHEN M. WYNNE Date of Birth: 1/55 | Trustee | Shall serve until death, resignation or removal. Trustee since 2009. | Retired since December 2010; Chief Executive Officer of US Funds Services, BNY Mellon Asset Servicing from July 2010 to December 2010; Chief Executive Officer of PNC Global Investment Servicing from March 2008 to July 2010; President, PNC Global Investment Servicing from 2003 to 2008. | 42 | Copeland Trust (registered investment company with 2 portfolios). Context Capital Funds (registered investment company with 1 portfolio). | |||||
NANCY B. WOLCOTT Date of Birth: 11/54 | Trustee | Shall serve until death, resignation or removal. Trustee since 2011. | Retired since May 2014; EVP, Head of GFI Client Service Delivery, BNY Mellon from January 2012 to May 2014; EVP, Head of US Funds Services, BNY Mellon from July 2010 to January 2012; President of PNC Global Investment Servicing from 2008 to July 2010; Chief Operating Officer of PNC Global Investment Servicing from 2007 to 2008; Executive Vice President of PFPC Worldwide Inc. from 2006 to 2007. | 42 | None. | |||||
53
BRADESCO FUNDS
Fund Management (Concluded)
(Unaudited)
Name and Date of Birth | Position(s) Held with Trust | Term of Office and Length of Time Served | Principal Occupation(s) During Past Five Years | |||
| EXECUTIVE OFFICERS | ||||||
JOEL L. WEISS Date of Birth: 1/63 | President and Chief Executive Officer | Shall serve until death, resignation or removal. Officer since 2007. | President of JW Fund Management LLC since June 2016; Vice President and Managing Director of BNY Mellon Investment Servicing (US) Inc. and predecessor firms from 1993 to June 2016. | |||
T. RICHARD KEYES Date of Birth: 1/57 | Treasurer and Chief Financial Officer | Shall serve until death, resignation or removal. Officer since 2016. | President of TRK Fund Consulting since July 2016; Head of Tax — U.S. Fund Services of BNY Mellon Investment Servicing (US) Inc. and predecessor firms from February 2006 to July 2016. | |||
VINCENZO A. SCARDUZIO Date of Birth: 4/72 | Secretary | Shall serve until death, resignation or removal. Officer since 2012. | Director and Vice President Regulatory Administration of BNY Mellon Investment Servicing (US) Inc. and predecessor firms since 2001. | |||
DAVID C. LEBISKY Date of Birth: 5/72 | Chief Compliance Officer and Anti-Money Laundering Officer | Shall serve until death, resignation or removal. Officer since 2015. | President of Lebisky Compliance Consulting LLC since October 2015; Senior Consultant, Freeh Group International Solutions, LLC (a global risk management firm) since 2015; Scotia Institutional Investments US, LP, Director of Regulatory Administration from 2010 to 2014. | |||
54
[THIS PAGE INTENTIONALLY LEFT BLANK.]
Investment Adviser
BRAM US LLC
Park Avenue, 32nd Floor
New York, New York, 10022
Administrator
BNY Mellon Investment Servicing (US) Inc.
301 Bellevue Parkway
Wilmington, DE 19809
Transfer Agent
BNY Mellon Investment Servicing (US) Inc.
4400 Computer Drive
Westborough, MA 01581
Principal Underwriter
Foreside Funds Distributors LLC
400 Berwyn Park
899 Cassatt Road
Berwyn, PA 19312
Custodian
The Bank of New York Mellon
225 Liberty Street
New York, NY 10286
Independent Registered Public Accounting Firm
Tait, Weller & Baker LLP
1818 Market Street, Suite 2400
Philadelphia, PA 19103
Legal Counsel
Pepper Hamilton LLP
3000 Two Logan Square
18th and Arch Streets
Philadelphia, PA 19103

BRADESCO LATIN AMERICAN
EQUITY FUND
BRADESCO LATIN AMERICAN HARD CURRENCY
BOND FUND
of
FundVantage Trust
Institutional Class
Retail Class
ANNUAL REPORT
April 30, 2017
This report is submitted for the general information of the shareholders of the Bradesco Latin American Equity Fund and the Bradesco Latin American Hard Currency Bond Fund. It is not authorized for distribution unless preceded or accompanied by a current prospectus for the Bradesco Latin American Equity Fund and the Bradesco Latin American Hard Currency Bond Fund.
BRA-0417
DUPONT CAPITAL EMERGING MARKETS FUND
Annual Investment Adviser’s Report
April 30, 2017
(Unaudited)
Dear Fund Shareholder,
The DuPont Capital Emerging Markets Fund returned +21.77%, (net of fees) for the twelve-month period ending April 30, 2017, outperforming the MSCI Emerging Markets Net Dividend Index (the “Index”) by +2.64%.
Emerging Markets enjoyed healthy absolute annual returns over the twelve-months ending April 30, 2017, with the Index gaining 19.13% overall during the period. As 2016 evolved, incipient fears of a Chinese economic tailspin and global deflationary forces were dispelled, propelling emerging equities higher during the summer months. Following a period of valuation consolidation during the fall months, and an outbreak of uncertainty around international trade prospects and policies in the wake of the U.S. election results, renewed economic confidence and optimism have propelled the index to a string of consecutive monthly gains during the calendar year-to-date. Indeed, in U.S dollar terms, the Index advanced in nine of the last twelve months, registering monthly returns in excess of 2% on seven of those occasions.
Political dynamics, both domestic and global, remain a permanent feature of the investment landscape in Emerging regions, with this year providing several volatility-inducing examples. Brazilian corruption scandals that escalated to Presidential impeachment and replacement, a short-lived Turkish coup attempt that elicited authoritarian responses and constitutional reforms, and further erosion of the South African government’s generational hegemony all influenced sovereign risk profiles. However, these impacts of the events were largely localized for the most part, with indications of a globally more synchronized re-convergence of economic growth and reflation prospects holding sway over broader sentiment.
The Fund’s relative outperformance was predicated primarily on favorable stock selection decisions within both countries and economic sectors. Overweight exposures to rail freight operations in Russia and heavy duty automotive sub-suppliers in Brazil bolstered returns within the Industrials sector, despite the detrimental impact from top-tier aircraft and aerospace holdings. The Technology sector also proved to be a positive source of relative returns, as bellwether semiconductor and electronics names in Taiwan and Korea continued to flex their operational strengths and scale advantages in the context of a favorable content cycle. The same group of companies have also exhibited encouragingly shareholder-friendly improvements on both corporate governance and capital return fronts.
The main headwind from the perspective of intra-sector positioning came from Financials. Here the culprits were a relative over-allocation to Eastern European banks, where negative interest rate policies in the broader Eurozone had a detrimental spillover effect onto net interest margins, while local institutions were also contending with domestic political and mortgage book reforms. The Fund’s long established fundamental under-allocation to Chinese banks, on quality and credit grounds, was beneficial in aggregate but became notably less rewarding during latter months.
1
DUPONT CAPITAL EMERGING MARKETS FUND
Annual Investment Adviser’s Report (Continued)
April 30, 2017
(Unaudited)
Country positioning, on the other hand, combined to deliver a negative contribution to overall relative returns. The largest geographic allocation headwinds related to underweight positions in Taiwan and China, although these were more than offset by a handful of highly-selective alternative holdings that were identified in the non-benchmark markets of Pakistan and Argentina. Mexico provided the strongest intra-country relative performance, thanks to positions in cement and steel, which benefited from the weakening domestic currency. A lack of exposure to Brazilian commodity names in iron ore and oil, due to corporate governance and environmental concerns, provided a weakness elsewhere within Latin American materials.
Investment Environment and Outlook
We remain positioned for cyclicals to outperform defensives, overlaid with a portfolio profile that is anchored on attractive longer term valuation metrics and through-cycle value-creation opportunities. Our pro-cyclical positioning reflects a view that the directionality of GDP growth rates globally appears to be re-converging positively to an extent that has not been seen since the immediate post-financial crisis phase early in this decade. Furthermore, we continue to find relative valuations more compelling or with greater upside skew among capital expenditure-exposed or asset intensive industrials and demographically advantaged or operationally geared consumer cyclicals.
While acknowledging that political tail risks proliferate, they appear to be manageable from a portfolio risk-calibration and exposure perspective. Looking at the global trade environment overall, our contention and evaluation that – despite rhetoric - the new U.S. administration would not have the economic incentives to enact aggressively protectionist legislation has been the case so far. However, anti-globalization sentiment continues to coalesce in many quarters and is a risk factor that merits vigilance.
From a portfolio construction perspective, qualitative overlays come from a selective underweight stance to those segments of China where we see structural risks accruing and from being positioned for further rises in U.S. interest rates. China continues to have an outsized impact on sentiment, from both a direct growth contribution and a derived-demand perspective. While we believe that the Chinese authorities have the policy and financial wherewithal to avoid a ‘hard landing’ scenario for GDP growth as they seek to re-balance the internal dynamics and international profile of their economy, we have concerns at the debt levels and credit quality in certain industries and state-owned enterprises. As such, we are underweight domestic lenders and those institutions that could be most vulnerable to asymmetric risks and asset impairments in the financial sector. With regard to the outlook for U.S. monetary policy, we seek to be under-exposed to those sovereign states or companies that are unduly dependent on dollar-denominated borrowing or funds, as we do not expect the greenback to demonstrate weakness on a real effective exchange rate (REER) basis.
2
DUPONT CAPITAL EMERGING MARKETS FUND
Annual Investment Adviser’s Report (Concluded)
April 30, 2017
(Unaudited)
Given this balance of risks, we reiterate a diversified preference for cyclically-sensitive investments, on valuation and risk-reward grounds, while ensuring that top-down and currency exposures in the portfolio remain prudently and coherently diversified.
We appreciate your investment in the Fund and look forward to communicating further developments and updates with you.
DuPont Capital Management Corporation
This letter is intended to assist shareholders in understanding how the Fund performed during the fiscal year ended April 30, 2017 and reflects the views of the investment adviser at the time of this writing. These views may change and do not guarantee future performance of the Fund or the markets.
Portfolio composition is subject to change. The current and future portfolio holdings of the Fund are subject to investment risks. The investment return and principal value of an investment in the Fund will fluctuate so that an investor’s shares, when redeemed, may be worth more or less than their original cost.
Mutual fund investing involves risks, including possible loss of principal. The Fund invests primarily in markets of emerging countries which are riskier than more developed markets and may be considered speculative. Emerging markets are riskier than more developed markets because they tend to develop unevenly or may never fully develop. Emerging markets are more likely to experience hyperinflation and currency valuations, which adversely affect returns to U.S. investors. In addition, many emerging markets have far lower trading volumes and less liquidity than developed markets.
Foreign securities are subject to political, social, and economic risks including instability in the country of the issuer of a security, variation in international trade patterns, the possibility of the imposition of exchange controls, expropriation, confiscatory taxation, limits on movement to currency or other assets and nationalization of assets. The value of debt securities generally falls when interest rates rise.
3
DUPONT CAPITAL EMERGING MARKETS FUND
Annual Report
Performance Data
April 30, 2017
(Unaudited)
Comparison of Change in Value of $1,000,000 (investment minimum) Investment in the DuPont Capital Emerging Markets Fund
Class I Shares vs MSCI Emerging Markets Net Dividend Index
| Average Annual Total Returns for the Periods Ended April 30, 2017 | ||||||||
| 1 Year | 3 Year | 5 Year | Since Inception* | |||||
Class I Shares | 21.77% | -1.89% | -1.75% | -2.43% | ||||
MSCI Emerging Markets Net Dividend Index | 19.13% | 1.79% | 1.49% | 0.20%** | ||||
| * | The DuPont Capital Emerging Markets Fund (the “Fund”) commenced operations on December 6, 2010. |
| ** | Benchmark performance is from inception date of the Fund only and is not the inception date of the benchmark itself. |
The performance data quoted represents past performance and does not guarantee future results. The investment return and principal value of an investment in the Fund will fluctuate so that an investor’s shares, when redeemed, may be worth more or less than their original cost. The graph and table do not reflect the deduction of taxes that a shareholder would pay on Fund distributions or redemption of Fund shares. Current performance may be lower or higher. Performance data current to the most recent month-end may be obtained by calling (888) 447-0014.
As stated in the current prospectus dated September 1, 2016, the Fund’s “Total Annual Fund Operating Expenses” and “Total Annual Fund Operating Expenses After Fee Waiver and/or Expense Reimbursement” are 1.66% and 1.30%, respectively of the Fund’s average daily net assets, which may differ from the actual expenses incurred by the Fund for the period covered by this report. DuPont Capital Management Corporation (the “Adviser”) has contractually agreed to reduce its investment advisory fee and/or reimburse certain expenses of the Fund to the extent necessary to ensure that the Fund’s total operating expenses, excluding taxes, “Acquired Fund” fees and expenses, interest,
4
DUPONT CAPITAL EMERGING MARKETS FUND
Annual Report
Performance Data (Concluded)
April 30, 2017
(Unaudited)
extraordinary items, and brokerage commissions do not exceed 1.27% (on an annual basis) of the Fund’s average daily net assets (the “Expense Limitation”). The Expense Limitation will remain in place until August 31, 2017, unless the Board of Trustees of FundVantage Trust (the “Trust”) approves its earlier termination. Effective September 1, 2016, the Fund’s Expense Limitation (on an annual basis) was reduced from 1.60% of the Fund’s average daily net assets to its current rate of 1.27%. The Adviser is entitled to recover, subject to approval by the Board of Trustees, such amounts reduced or reimbursed for a period of up to three (3) years from the year in which the Adviser reduced its compensation and/or assumed expenses for the Fund. The Adviser is permitted to seek reimbursement from the Fund, subject to certain limitations, for fees it waived and Fund expenses it paid to the extent the total annual fund operating expenses do not exceed the limits described above or any lesser limits in effect at the time of reimbursement. No recoupment will occur unless the Fund’s expenses are below the Expense Limitation amount. Total returns would be lower had such fees and expenses not been waived and/or reimbursed.
A 2.00% redemption fee applies to shares redeemed within 60 days of purchase. The redemption fee is not reflected in the returns shown above.
The Fund intends to evaluate performance as compared to that of the MSCI Emerging Markets Net Dividend Index. The MSCI Emerging Markets Net Dividend Index is a free float-adjusted market capitalization index that is designed to measure equity market performance of emerging markets. This index is net total return which reinvests dividends after the deduction of withholding taxes using (for international indices) a tax rate applicable to non-resident institutional investors who do not benefit from double taxation treaties. MSCI Emerging Markets Net Dividend Index uses the maximum withholding tax rate applicable to institutional investors. The returns for this index do not include any transaction costs, management fees or other costs. It is impossible to invest directly in an index.
5
DUPONT CAPITAL EMERGING MARKETS DEBT FUND
Annual Investment Adviser’s Report
April 30, 2017
(Unaudited)
Dear Fund Shareholder,
The DuPont Capital Emerging Markets Debt Fund returned +8.45%, net of fees, for the twelve-month period ending April 30, 2017. The J.P. Morgan Emerging Markets Bond Index Global Diversified Index rose +8.62% over the trailing twelve-months ending April 30, 2017, making emerging markets debt (EMD) one of the better performing fixed income asset classes for the period.
Financial markets, including EMD, performed very well over the past twelve months despite global political turmoil highlighted by the surprising results in the Brexit vote in June and the U.S. Presidential election in November. Higher oil prices and generally more stable commodity prices along with an improved outlook on global economic activity led investors to move money into risk assets including equities, high yield and emerging markets debt. In addition, the U.S. election led investors to believe that the new administration would enact tax cuts, increase infrastructure spending and initiate a more business-friendly regulatory environment. The S & P 500 roared ahead with a +17 % return over the past year while high yield and EMD returning +13% and over 8% respectively. Oil prices rose over 7% for the year after falling substantially between mid-2014 and early 2016. The ten-year Treasury rose by 46 basis points over the past twelve months, mostly occurring after the Presidential election in November. The Federal Reserve hiked interest rates 2 times over the past year, both moves by 25 basis points.
The strength in EMD was driven by a combination of attractive valuations, more stable commodity prices, low global inflation, and moderate global economic growth. The strength in EMD was briefly halted after the election in November due to the new President’s tough talk on reducing the trade deficits with Mexico and China. These concerns moved to the back burner early in 2017 as investors focused their attention on better global growth and softer talk on trade from the new President after his inauguration. Investors continued to be attracted to EMD by both valuations and yields relative to other fixed income sectors.
Emerging market U.S. Dollar sovereigns outperformed local-currency EMD. Within U.S. Dollar sovereigns, high yield sovereigns greatly outperformed investment grade sovereigns as investors moved toward higher yields and the possibility of higher returns. The best performing country, by far, was Venezuela with a return of over +50% during the past twelve months. Some of the other high performing countries included Zambia, Iraq and Ghana that all had returns above +30%. Africa was the strongest performing region, bouncing back from a very poor previous year, partly due to the stabilization and increase in oil and other commodity prices. In all of EMD, spreads tightened by 86 basis points during the last twelve months to +303 over Treasuries, while the yield of the index fell 41 bps and closed at 5.30%.
In regards to the performance of the Fund, an overweight to Venezuela, including positions in PDVSA, the state-owned oil company, was the main positive contributor for the past twelve months. The stabilization and increase in oil prices benefitted the performance of Venezuela along with the very high yield that the bonds provide. Other positive contributing factors included overweights to Argentina and Brazil.
6
DUPONT CAPITAL EMERGING MARKETS DEBT FUND
Annual Investment Adviser’s Report (Continued)
April 30, 2017
(Unaudited)
Performance was negatively impacted by the position in PrivatBank, previously the largest private bank in Ukraine. The bank was nationalized by the government in December leading to a substantial fall in their bond prices. Other positions that detracted from returns included an overweight to Mexico including both US Dollar sovereign bonds and local currency bonds. Mexico was a poor performer over the last year, partly due to President Trump’s negative rhetoric about trade between the U.S. and Mexico.
In regards to current positioning, the primary overweight exposures in the Fund include Mexico, Brazil, Ukraine, Venezuela and Israel. In local currency bonds, the main positions are in Mexico and Brazil. The Fund is underweight several higher quality countries that the investment team believes are overvalued including Peru, Philippines, Poland, Panama and Malaysia. The Fund has a large yield advantage when compared to the benchmark, mostly due to the overweight’s to Venezuela, Ukraine and the local currency exposure to Mexico and Brazil.
Investment Environment and Outlook
We continue to maintain a positive long-term outlook for EMD. Overall, our models show that EMD valuations are fairly priced although there is much less value to be realized than last year. Several countries have moved from undervalued to fairly valued or from fairly valued to overvalued. However, global growth has improved over the last year, as have the fundamentals for several countries including Brazil and Russia. In hard currency, we are seeing attractive opportunities in Venezuela, Ukraine, Mexico, Mongolia, and Argentina. The portfolio’s local currency allocation has been increased, and ended the period close to 12%, including larger positions to Mexico and Brazil.
The Trump administration has not yet put forth any new trade policies as their focus has been on healthcare and issues in North Korea and Syria. However, President Trump’s proposed agenda on trade still remains an important macro risk for later in 2017. We will be closely monitoring his statements to get a sense of what actions he will take to improve the trade balance for the U.S. His main targets appear to be China and Mexico. We will adjust the portfolio as warranted by any new policies.
We appreciate your investment in the Fund and look forward to communicating with you in the future.
DuPont Capital Management Corporation
This letter is intended to assist shareholders in understanding how the Fund performed during the fiscal year ended April 30, 2017 and reflects the views of the investment adviser at the time of this writing. These views may change and do not guarantee future performance of the Fund or the markets.
7
DUPONT CAPITAL EMERGING MARKETS DEBT FUND
Annual Investment Adviser’s Report (Concluded)
April 30, 2017
(Unaudited)
Portfolio composition is subject to change. The current and future portfolio holdings of the Fund are subject to investment risks. The investment return and principal value of an investment in the Fund will fluctuate so that an investor’s shares, when redeemed, may be worth more or less than their original cost.
Mutual fund investing involves risks, including possible loss of principal. The Fund invests primarily in markets of emerging countries which are riskier than more developed markets and may be considered speculative. Emerging markets are riskier than more developed markets because they tend to develop unevenly or may never fully develop. Emerging markets are more likely to experience hyperinflation and currency valuations, which adversely affect returns to U.S. investors. In addition, many emerging markets have far lower trading volumes and less liquidity than developed markets. The Fund is non-diversified, which means that a large portion of the Fund’s assets may be invested in one or few companies or sectors. The Fund could fluctuate in value more than a diversified fund. Investing in foreign securities entails special risks, such as fluctuations in currency exchange rates and possible lax regulation of securities markets and accounting practices.
Foreign securities are subject to political, social, and economic risks including instability in the country of the issuer of a security, variation in international trade patterns, the possibility of the imposition of exchange controls, expropriation, confiscatory taxation, limits on movement to currency or other assets and nationalization of assets. The value of debt securities generally falls when interest rates rise. The Fund may invest without limit in below-investment grade debt securities commonly called “high yield” securities or “junk bonds.” Such securities may have greater default risk, less liquidity, and greater price volatility than investment-grade bonds.
8
DUPONT CAPITAL EMERGING MARKETS DEBT FUND
Annual Report
Performance Data
April 30, 2017
(Unaudited)
Comparison of Change in Value of $1,000,000 (investment minimum) Investment in the DuPont Capital Emerging Markets Debt Fund
Class I Shares vs J.P. Morgan EMBI Global Diversified Index
| Average Annual Total Returns for the Periods Ended April 30, 2017 | ||||||
| 1 Year | 3 Year | Since Inception* | ||||
Class I Shares | 8.45% | 7.17% | 7.89% | |||
J.P. Morgan EMBI Global Diversified Index | 8.62% | 6.32% | 7.06%** | |||
| * | The DuPont Capital Emerging Markets Debt Fund (the “Fund”) commenced operations on September 27, 2013. |
| ** | Benchmark performance is from inception date of the Fund only and is not the inception date of the benchmark itself. |
The performance data quoted represents past performance and does not guarantee future results. The investment return and principal value of an investment in the Fund will fluctuate so that an investor’s shares, when redeemed, may be worth more or less than their original cost. The graph and table do not reflect the deduction of taxes that a shareholder would pay on Fund distributions or redemption of Fund shares. Current performance may be lower or higher. Performance data current to the most recent month-end may be obtained by calling (888) 447-0014.
As stated in the current prospectus dated September 1, 2016, the Fund’s “Total Annual Fund Operating Expenses” and “Total Annual Fund Operating Expenses After Fee Waiver and/or Expense Reimbursement” are 3.34% and 0.89%, respectively, of the Fund’s average daily net assets, which may differ from the actual expenses incurred by the Fund for the period covered by this report. DuPont Capital Management Corporation (the “Adviser”) has contractually agreed to reduce its investment advisory fee and/or reimburse certain expenses of the Fund to the extent necessary to ensure that the Fund’s total operating expenses, excluding taxes, “Acquired Fund” fees and expenses, interest, extraordinary items, and brokerage commissions do not exceed 0.89% (on an annual basis) of the Fund’s average
9
DUPONT CAPITAL EMERGING MARKETS DEBT FUND
Annual Report
Performance Data (Concluded)
April 30, 2017
(Unaudited)
daily net assets (the “Expense Limitation”). The Expense Limitation will remain in place until August 31, 2017, unless the Board of Trustees of FundVantage Trust (the “Trust”) approves its earlier termination. The Adviser is entitled to recover, subject to approval by the Board of Trustees, such amounts reduced or reimbursed for a period of up to three (3) years from the year in which the Adviser reduced its compensation and/or assumed expenses for the Fund. The Adviser is permitted to seek reimbursement from the Fund, subject to certain limitations, for fees it waived and Fund expenses it paid to the extent the total annual fund operating expenses do not exceed the limits described above or any lesser limits in effect at the time of reimbursement. No recoupment will occur unless the Fund’s expenses are below the Expense Limitation amount. Total returns would be lower had such fees and expenses not been waived and/or reimbursed.
A 2.00% redemption fee applies to shares redeemed within 60 days of purchase. The redemption fee is not reflected in the returns shown above.
The Fund intends to evaluate performance as compared to that of the J.P. Morgan Emerging Markets Bond Index Global Diversified Index (“EMBI Global”), which currently covers 27 emerging market countries. Included in the EMBI Global are U.S.-dollar-denominated Brady bonds, Eurobonds, traded loans, and local market debt instruments issued by sovereign and quasi-sovereign entities. It is impossible to invest directly in an index.
10
DUPONT CAPITAL FUNDS
Fund Expense Disclosure
April 30, 2017
(Unaudited)
As a shareholder of the Fund(s), you incur two types of costs: (1) transaction costs, including redemption fees; and (2) ongoing costs, including management fees and other Fund expenses. These examples are intended to help you understand your ongoing costs (in dollars) of investing in the Fund and to compare these costs with the ongoing costs of investing in other mutual funds.
These examples are based on an investment of $1,000 invested at the beginning of the period from November 1, 2016 through April 30, 2017 and held for the entire period.
Actual Expenses
The first line for each Fund in the accompanying table provides information about actual account values and actual expenses. You may use the information in this line, together with the amount you invested, to estimate the expenses that you paid over the period. Simply divide your account value by $1,000 (for example, an $8,600 account value divided by $1,000 = 8.6), then multiply the result by the number in the first line under the heading entitled “Expenses Paid During Period” to estimate the expenses you paid on your account during this period.
Hypothetical Example for Comparison Purposes
The second line for each Fund in the accompanying table provides information about hypothetical account values and hypothetical expenses based on each Fund’s actual expense ratio and an assumed rate of return of 5% per year before expenses, which is not your Fund’s actual return. The hypothetical account values and expenses may not be used to estimate the actual ending account balance or expenses you paid for the period. You may use this information to compare the ongoing costs of investing in the Funds and other funds. To do so, compare this 5% hypothetical example with the 5% hypothetical examples that appear in the shareholder reports of other funds.
Please note that the expenses shown in the accompanying table are meant to highlight your ongoing costs only and do not reflect any transactional costs, such as redemption fees. Therefore, the second line of the accompanying table is useful in comparing ongoing costs only and will not help you determine the relative total costs of owning different funds. In addition, if these transactional costs were included, your costs would have been higher.
11
DUPONT CAPITAL FUNDS
Fund Expense Disclosure (Concluded)
April 30, 2017
(Unaudited)
| DuPont Capital Emerging Markets Fund | ||||||||||||
| Beginning Account Value November 1, 2016 | Ending Account Value April 31, 2017 | Expenses Paid During Period* | ||||||||||
Class I | ||||||||||||
Actual | $ | 1,000.00 | $ | 1,104.60 | $ | 6.63 | ||||||
Hypothetical (5% return before expenses) | 1,000.00 | 1,018.50 | 6.36 | |||||||||
| DuPont Capital Emerging Markets Debt Fund | ||||||||||||
| Beginning Account Value November 1, 2016 | Ending Account Value April 31, 2017 | Expenses Paid During Period** | ||||||||||
Class I | ||||||||||||
Actual | $ | 1,000.00 | $ | 1,017.40 | $ | 4.45 | ||||||
Hypothetical (5% return before expenses) | 1,000.00 | 1,020.38 | 4.46 | |||||||||
| * | Expenses are equal to an annualized expense ratio for the six-month period ended April 30, 2017 of 1.27% for Class I Shares of the DuPont Capital Emerging Markets Fund, multiplied by the average account value over the period, multiplied by the number of days in the most recent period (181), then divided by 365 to reflect the period. The DuPont Capital Emerging Markets Fund’s ending account value on the first line in the table is based on the actual total return for the six-month period ended April 30, 2017 for the Fund of 10.46%. |
| ** | Expenses are equal to an annualized expense ratio for the six-month period ended April 30, 2017 of 0.89% for Class I Shares of the DuPont Capital Emerging Markets Debt Fund, multiplied by the average account value over the period, multiplied by the number of days in the most recent period (181), then divided by 365 to reflect the period. The DuPont Capital Emerging Markets Debt Fund’s ending account value on the first line in the table is based on the actual total return for the six-month period for the Fund of 1.74%. |
12
DUPONT CAPITAL EMERGING MARKETS FUND
Portfolio Holdings Summary Table
April 30, 2017
(Unaudited)
The following table presents a summary by industry of the portfolio holdings of the Fund:
| % of Net Assets | Value | |||||||
INDUSTRY CATEGORIES: | ||||||||
Commercial Banks | 21.9 | % | $ | 6,752,662 | ||||
Technology Hardware, Storage & Peripherals | 8.0 | 2,472,666 | ||||||
Oil, Gas & Consumable Fuels | 7.0 | 2,171,155 | ||||||
Internet Software & Services | 6.0 | 1,850,890 | ||||||
Semiconductors & Semiconductor Equipment | 5.3 | 1,631,819 | ||||||
Wireless Telecommunication Services | 5.2 | 1,590,572 | ||||||
Media | 4.3 | 1,327,280 | ||||||
Chemicals | 3.3 | 1,015,654 | ||||||
Real Estate Management & Development. | 3.2 | 972,788 | ||||||
Construction Materials | 3.1 | 948,001 | ||||||
Machinery | 2.6 | 804,310 | ||||||
Electronic Equipment, Instruments & Components | 2.5 | 787,867 | ||||||
Automobiles | 2.3 | 720,062 | ||||||
Metals & Mining. | 2.0 | 604,127 | ||||||
Hotels, Restaurants & Leisure | 1.6 | 502,109 | ||||||
Industrial Conglomerates | 1.5 | 467,379 | ||||||
IT Services | 1.5 | 465,946 | ||||||
Road & Rail | 1.5 | 450,968 | ||||||
Auto Components | 1.4 | 425,730 | ||||||
Airlines | 1.2 | 385,491 | ||||||
Thrifts & Mortgage Finance | 1.2 | 372,684 | ||||||
Diversified Telecommunication Services | 1.1 | 336,192 | ||||||
Paper & Forest Products | 1.1 | 333,455 | ||||||
Food & Staples Retailing | 1.1 | 329,269 | ||||||
Insurance | 1.1 | 327,836 | ||||||
Beverages | 1.0 | 311,232 | ||||||
Air Freight & Logistics | 0.9 | 279,071 | ||||||
Aerospace & Defense | 0.9 | 269,281 | ||||||
Specialty Retail | 0.9 | 264,192 | ||||||
Textiles, Apparel & Luxury Goods. | 0.8 | 243,457 | ||||||
Diversified Consumer Services | 0.8 | 240,865 | ||||||
Electric Utilities | 0.7 | 226,964 | ||||||
Household Durables | 0.6 | 180,156 | ||||||
Electrical Equipment | 0.5 | 162,415 | ||||||
Containers & Packaging | 0.5 | 157,982 | ||||||
Building Products | 0.5 | 144,107 | ||||||
Other Assets in Excess of Liabilities | 0.9 | 289,445 | ||||||
|
|
|
| |||||
NET ASSETS | 100.0 | % | $ | 30,816,079 | ||||
|
|
|
| |||||
Portfolio holdings are subject to change at any time.
The accompanying notes are an integral part of the financial statements.
13
DUPONT CAPITAL EMERGING MARKETS FUND
Portfolio of Investments
April 30, 2017
| Number of Shares | Value | |||||||
COMMON STOCKS — 96.1% |
| |||||||
Argentina — 1.6% |
| |||||||
Banco Macro SA, ADR | 3,810 | $ | 326,593 | |||||
YPF SA, SP ADR | 6,812 | 175,954 | ||||||
|
| |||||||
| 502,547 | ||||||||
|
| |||||||
Brazil — 4.9% |
| |||||||
Ambev SA | 54,100 | 311,232 | ||||||
Embraer SA | 55,900 | 269,281 | ||||||
Even Construtora e Incorporadora SA | 128,500 | 180,156 | ||||||
Iochpe Maxion SA | 71,150 | 371,660 | ||||||
Kroton Educacional SA | 50,900 | 240,865 | ||||||
Multiplus SA | 11,300 | 139,023 | ||||||
|
| |||||||
| 1,512,217 | ||||||||
|
| |||||||
China — 21.4% |
| |||||||
Air China Ltd., Class H | 436,000 | 385,491 | ||||||
Alibaba Group Holding, Ltd., SP ADR* | 2,890 | 333,795 | ||||||
China Construction Bank Corp., Class H | 1,144,000 | 928,543 | ||||||
China Lesso Group Holdings Ltd. | 181,000 | 144,107 | ||||||
China Mobile, Ltd. | 69,668 | 741,729 | ||||||
China Overseas Land & Investment, Ltd. | 172,000 | 498,901 | ||||||
CIMC Enric Holdings, Ltd. | 360,000 | 209,806 | ||||||
CNOOC, Ltd. | 364,000 | 424,642 | ||||||
Dongfeng Motor Group Co., Ltd., Class H | 362,000 | 380,218 | ||||||
Haitian International Holdings, Ltd. | 91,000 | 222,844 | ||||||
Industrial & Commercial Bank of China, Ltd., Class H | 446,000 | 290,732 | ||||||
NetEase, Inc., ADR | 2,328 | 617,828 | ||||||
| Number of Shares | Value | |||||||
COMMON STOCKS — (Continued) |
| |||||||
China — (Continued) |
| |||||||
Shenzhou International | ||||||||
Group Holdings, Ltd. | 37,000 | $ | 243,457 | |||||
Sinotrans, Ltd., Class H | 621,000 | 279,071 | ||||||
Tencent Holdings Ltd. | 28,700 | 899,267 | ||||||
|
| |||||||
| 6,600,431 | ||||||||
|
| |||||||
Czech Republic — 1.6% |
| |||||||
Komercni Banka AS | 12,987 | 503,180 | ||||||
|
| |||||||
Greece — 0.9% |
| |||||||
JUMBO SA | 16,738 | 264,192 | ||||||
|
| |||||||
Hungary — 0.9% |
| |||||||
OTP Bank PLC | 9,669 | 271,857 | ||||||
|
| |||||||
India — 8.0% |
| |||||||
Coal India, Ltd. | 65,501 | 281,670 | ||||||
HCL Technologies, Ltd. | 36,830 | 465,946 | ||||||
ICICI Bank, Ltd., SP ADR | 37,367 | 320,235 | ||||||
Indiabulls Housing Finance Ltd. | 23,598 | 372,684 | ||||||
Oil India, Ltd. | 81,465 | 414,082 | ||||||
Reliance Industries Ltd., | 13,949 | 604,034 | ||||||
|
| |||||||
| 2,458,651 | ||||||||
|
| |||||||
Indonesia — 1.9% |
| |||||||
Bank Mandiri Persero Tbk PT | 246,900 | 216,065 | ||||||
Bank Rakyat Indonesia Persero Tbk PT | 377,500 | 364,628 | ||||||
|
| |||||||
| 580,693 | ||||||||
|
| |||||||
Malaysia — 1.9% |
| |||||||
Genting Bhd | 129,096 | 292,391 | ||||||
Malayan Banking Bhd | 131,630 | 290,342 | ||||||
|
| |||||||
| 582,733 | ||||||||
|
| |||||||
The accompanying notes are an integral part of the financial statements.
14
DUPONT CAPITAL EMERGING MARKETS FUND
Portfolio of Investments (Continued)
April 30, 2017
| Number of Shares | Value | |||||||
COMMON STOCKS — (Continued) |
| |||||||
Mexico — 5.8% |
| |||||||
Cemex SAB de CV, SP ADR* | 61,460 | $ | 566,661 | |||||
Fibra Uno Administracion Sa de CV, REIT | 271,900 | 473,887 | ||||||
Grupo Financiero Inbursa SAB de CV | 216,900 | 365,240 | ||||||
Ternium SA, SP ADR | 14,751 | 373,495 | ||||||
|
| |||||||
| 1,779,283 | ||||||||
|
| |||||||
Pakistan — 1.2% |
| |||||||
Lucky Cement Ltd., GDR | 11,919 | 381,340 | ||||||
|
| |||||||
Poland — 1.4% | ||||||||
Bank Handlowy w Warszawie SA | 7,513 | 145,057 | ||||||
Bank Pekao SA | 8,040 | 291,371 | ||||||
|
| |||||||
| 436,428 | ||||||||
|
| |||||||
Russia — 3.5% |
| |||||||
Globaltrans Investment PLC, SP GDR | 59,573 | 450,968 | ||||||
Magnit PJSC, SP GDR | 9,414 | 329,269 | ||||||
Novolipetsk Steel PJSC, GDR | 12,164 | 230,632 | ||||||
PhosAgro PJSC, GDR | 4,662 | 68,763 | ||||||
|
| |||||||
| 1,079,632 | ||||||||
|
| |||||||
South Africa — 10.6% |
| |||||||
Barclays Africa Group, Ltd. | 28,810 | 316,420 | ||||||
MTN Group, Ltd. | 35,525 | 335,971 | ||||||
Nampak Ltd.* | 117,956 | 157,982 | ||||||
Naspers, Ltd., N Shares | 6,249 | 1,188,257 | ||||||
Reunert, Ltd. | 33,814 | 179,061 | ||||||
Sasol, Ltd. | 17,438 | 534,385 | ||||||
Telkom SA SOC, Ltd. | 60,080 | 336,192 | ||||||
Tsogo Sun Holdings, Ltd. | 111,323 | 209,718 | ||||||
|
| |||||||
| 3,257,986 | ||||||||
|
| |||||||
| Number of Shares | Value | |||||||
COMMON STOCKS — (Continued) |
| |||||||
South Korea — 14.1% |
| |||||||
Hyundai Mobis Co., Ltd. | 2,183 | $ | 425,730 | |||||
Hyundai Motor Co. | 2,687 | 339,844 | ||||||
Korea Electric Power Corp. | 5,694 | 226,964 | ||||||
LG Chem, Ltd. | 1,715 | 412,506 | ||||||
Samsung Electronics Co., Ltd. | 1,074 | 2,105,501 | ||||||
Samsung Life Insurance Co., Ltd. | 3,410 | 327,836 | ||||||
Shinhan Financial Group Co., Ltd. | 12,298 | 513,459 | ||||||
|
| |||||||
| 4,351,840 | ||||||||
|
| |||||||
Taiwan — 11.3% |
| |||||||
Chicony Electronics Co., Ltd. | 139,148 | 367,165 | ||||||
Chipbond Technology Corp. | 81,000 | 120,800 | ||||||
CTBC Financial Holding Co., Ltd. | 839,919 | 524,500 | ||||||
Hon Hai Precision Industry Co., Ltd. | 240,705 | 787,867 | ||||||
Novatek Microelectronics Corp. | 40,692 | 156,373 | ||||||
Taiwan Semiconductor Manufacturing Co., Ltd., SP ADR | 40,963 | 1,354,646 | ||||||
Teco Electric and Machinery Co., Ltd. | 164,000 | 162,415 | ||||||
|
| |||||||
| 3,473,766 | ||||||||
|
| |||||||
Thailand — 3.6% |
| |||||||
Advanced Info Service PCL | 64,600 | 326,533 | ||||||
Bangkok Bank PCL, NVDR | 33,600 | 174,168 | ||||||
Kasikornbank PCL, NVDR | 63,670 | 340,238 | ||||||
The accompanying notes are an integral part of the financial statements.
15
DUPONT CAPITAL EMERGING MARKETS FUND
Portfolio of Investments (Concluded)
April 30, 2017
| Number of Shares | Value | |||||||
COMMON STOCKS — (Continued) |
| |||||||
Thailand — (Continued) | ||||||||
PTT Exploration & Production PCL | 96,500 | $ | 270,773 | |||||
|
| |||||||
| 1,111,712 | ||||||||
|
| |||||||
Turkey — 1.5% | ||||||||
Enka Insaat ve Sanayi As | 187,618 | 288,318 | ||||||
Turkcell Iletisim Hizmetleri As | 53,259 | 186,339 | ||||||
|
| |||||||
| 474,657 | ||||||||
|
| |||||||
TOTAL COMMON STOCKS (Cost $24,880,626) | 29,623,145 | |||||||
|
| |||||||
PREFERRED STOCKS — 3.0% |
| |||||||
Brazil — 3.0% | ||||||||
Itau Unibanco Holding SA | 46,109 | 570,034 | ||||||
Suzano Papel e Celulose SA, Class A | 79,400 | 333,455 | ||||||
|
| |||||||
| 903,489 | ||||||||
|
| |||||||
TOTAL PREFERRED STOCKS (Cost $664,288) | 903,489 | |||||||
|
| |||||||
| Value | ||||||||
TOTAL INVESTMENTS - 99.1% | $ | 30,526,634 | ||||||
OTHER ASSETS IN | 289,445 | |||||||
|
| |||||||
NET ASSETS - 100.0% | $ | 30,816,079 | ||||||
|
| |||||||
| * | Non-income producing. |
| (a) | Security exempt from registration under Rule 144A of the Securities Act of 1933, as amended. This security was purchased in accordance with the guidelines approved by the Fund’s Board of Trustees and may be resold, in transactions exempt from registration, to qualified institutional buyers. At April 30, 2017 this security amounted to $604,034 or 2.0% of net assets. This security has been determined by the Adviser to be a liquid security. |
ADR | American Depository Receipt | |
GDR | Global Depository Receipt | |
NVDR | Non-voting Depository Receipt | |
PCL | Public Company Limited | |
PLC | Public Limited Company | |
REIT | Real Estate Investment Trust | |
SP ADR | Sponsored American Depository Receipt | |
SP GDR | Sponsored Global Depository Receipt |
The accompanying notes are an integral part of the financial statements.
16
DUPONT CAPITAL EMERGING MARKETS DEBT FUND
Portfolio Holdings Summary Table
April 30, 2017
(Unaudited)
The following table presents a summary by security type of the portfolio holdings of the Fund:
| % of Net Assets | Value | |||||||
SECURITY TYPE: | ||||||||
Foreign Government Bonds and Notes | 71.3 | % | $ | 4,382,222 | ||||
Corporate Bonds and Notes | 25.0 | 1,537,291 | ||||||
Common Stocks | 0.0 | 940 | ||||||
Other Assets in Excess of Liabilities | 3.7 | 224,751 | ||||||
|
|
|
| |||||
NET ASSETS | 100.0 | % | $ | 6,145,204 | ||||
|
|
|
| |||||
Portfolio holdings are subject to change at any time.
The accompanying notes are an integral part of the financial statements.
17
DUPONT CAPITAL EMERGING MARKETS DEBT FUND
Portfolio of Investments
April 30, 2017
| Par* Value | Value | |||||||
CORPORATE BONDS AND NOTES — 25.0% |
| |||||||
Austria — 0.0% | ||||||||
OGX Austria GmbH | $ | 200,000 | $ | 20 | ||||
|
| |||||||
Cayman Islands — 3.4% | ||||||||
China Evergrande Group Ltd. | 200,000 | 207,400 | ||||||
|
| |||||||
Israel — 3.8% | ||||||||
Israel Electric Corp., Ltd. | 200,000 | 237,160 | ||||||
|
| |||||||
Netherlands — 6.4% | ||||||||
Majapahit Holding BV | 150,000 | 192,375 | ||||||
Petrobras Global Finance BV | 100,000 | 95,720 | ||||||
Petrobras Global Finance BV | 100,000 | 95,500 | ||||||
Petrobras Global Finance BV | 10,000 | 8,905 | ||||||
|
| |||||||
| 392,500 | ||||||||
|
| |||||||
Russia — 5.8% | ||||||||
Gazprom OAO Via Gaz Capital SA | 150,000 | 198,300 | ||||||
Russian Agricultural Bank OJSC Via RSHB Capital SA | 150,000 | 158,411 | ||||||
|
| |||||||
| 356,711 | ||||||||
|
| |||||||
| Par* Value | Value | |||||||
CORPORATE BONDS AND NOTES — (Continued) |
| |||||||
Venezuela — 5.6% | ||||||||
Petroleos de Venezuela SA | $ | 300,000 | $ | 114,450 | ||||
Petroleos de Venezuela SA | 100,000 | 38,150 | ||||||
Petroleos de Venezuela SA | 350,000 | 133,525 | ||||||
Petroleos de Venezuela SA | 150,000 | 57,375 | ||||||
|
| |||||||
| 343,500 | ||||||||
|
| |||||||
TOTAL CORPORATE BONDS AND NOTES | 1,537,291 | |||||||
|
| |||||||
FOREIGN GOVERNMENT BONDS & NOTES — 71.3% |
| |||||||
Argentina — 6.0% | ||||||||
Argentine Republic Government International Bond | 190,000 | 202,255 | ||||||
Argentine Republic Government International Bond | 160,000 | 169,040 | ||||||
|
| |||||||
| 371,295 | ||||||||
|
| |||||||
The accompanying notes are an integral part of the financial statements.
18
DUPONT CAPITAL EMERGING MARKETS DEBT FUND
Portfolio of Investments (Continued)
April 30, 2017
| Par* Value | Value | |||||||||||
FOREIGN GOVERNMENT BONDS & NOTES — (Continued) |
| |||||||||||
Brazil — 7.2% | ||||||||||||
Brazil Notas Do Tesouro | BRL | 400,000 | $ | 126,402 | ||||||||
Brazil Notas do Tesouro | BRL | 1,000,000 | 315,237 | |||||||||
|
| |||||||||||
| 441,639 | ||||||||||||
|
| |||||||||||
Colombia — 3.7% | ||||||||||||
Colombia Government | 150,000 | 226,500 | ||||||||||
|
| |||||||||||
Costa Rica — 3.2% | ||||||||||||
Costa Rica Government | 200,000 | 194,250 | ||||||||||
|
| |||||||||||
Croatia — 3.6% | ||||||||||||
Croatia Government | 200,000 | 222,640 | ||||||||||
|
| |||||||||||
Dominican Republic — 3.7% |
| |||||||||||
Dominican Republic | 200,000 | 226,750 | ||||||||||
|
| |||||||||||
Egypt — 1.5% | ||||||||||||
Egypt Government | 100,000 | 94,900 | ||||||||||
|
| |||||||||||
Greece — 0.1% | ||||||||||||
Hellenic Republic | EUR | 10,000 | 7,694 | |||||||||
|
| |||||||||||
| Par* Value | Value | |||||||||||
FOREIGN GOVERNMENT BONDS & NOTES — (Continued) |
| |||||||||||
Hungary — 1.2% | ||||||||||||
Hungary Government | $ | 50,000 | $ | 73,887 | ||||||||
|
| |||||||||||
Lebanon — 0.8% | ||||||||||||
Lebanon Government | 50,000 | 51,650 | ||||||||||
|
| |||||||||||
Mexico — 9.4% | ||||||||||||
Mexican Bonos | MXN | 1,200,000 | 74,395 | |||||||||
Mexican Bonos | MXN | 2,000,000 | 132,146 | |||||||||
Petroleos Mexicanos | 125,000 | 125,188 | ||||||||||
Petroleos Mexicanos | 200,000 | 175,500 | ||||||||||
Petroleos Mexicanos | 50,000 | 44,512 | ||||||||||
Petroleos Mexicanos | 25,000 | 25,408 | ||||||||||
|
| |||||||||||
| 577,149 | ||||||||||||
|
| |||||||||||
Mongolia — 3.8% | ||||||||||||
Mongolia Government International Bond | 200,000 | 232,508 | ||||||||||
|
| |||||||||||
Morocco — 3.4% | ||||||||||||
Morocco Government International Bond | 200,000 | 208,032 | ||||||||||
|
| |||||||||||
The accompanying notes are an integral part of the financial statements.
19
DUPONT CAPITAL EMERGING MARKETS DEBT FUND
Portfolio of Investments (Continued)
April 30, 2017
| Par* Value | Value | |||||||||||
FOREIGN GOVERNMENT BONDS & NOTES — (Continued) |
| |||||||||||
Pakistan — 1.7% | ||||||||||||
Pakistan Government | $ | 100,000 | $ | 101,440 | ||||||||
|
| |||||||||||
Poland — 0.8% | ||||||||||||
Republic of Poland | PLN | 200,000 | 50,356 | |||||||||
|
| |||||||||||
Romania — 1.0% | ||||||||||||
Romanian Government | 50,000 | 62,036 | ||||||||||
|
| |||||||||||
Serbia — 0.2% | ||||||||||||
Republic of Serbia | 9,083 | 9,223 | ||||||||||
|
| |||||||||||
South Africa — 3.3% | ||||||||||||
Eskom Holdings SOC Ltd. | 200,000 | 205,541 | ||||||||||
|
| |||||||||||
Sri Lanka — 3.4% | ||||||||||||
Sri Lanka Government | 200,000 | 207,200 | ||||||||||
|
| |||||||||||
Turkey — 5.3% | ||||||||||||
Export Credit Bank of | 200,000 | 208,906 | ||||||||||
Turkey Government | 100,000 | 116,011 | ||||||||||
|
| |||||||||||
| 324,917 | ||||||||||||
|
| |||||||||||
| Par* Value | Value | |||||||
FOREIGN GOVERNMENT BONDS & NOTES — (Continued) |
| |||||||
Ukraine — 8.0% | ||||||||
Privatbank CJSC Via UK | $ | 160,000 | $ | 33,632 | ||||
Ukraine Government | 50,000 | 17,458 | ||||||
Ukreximbank Via Biz | 250,000 | 249,375 | ||||||
Ukreximbank Via Biz | 210,000 | 192,150 | ||||||
|
| |||||||
| 492,615 | ||||||||
|
| |||||||
TOTAL FOREIGN | 4,382,222 | |||||||
|
| |||||||
| Number of Shares | ||||||||
COMMON STOCKS — 0.0% | ||||||||
Brazil — 0.0% | ||||||||
OGX Petroleo e Gas SA, | 3,187 | 940 | ||||||
|
| |||||||
TOTAL COMMON STOCKS | 940 | |||||||
|
| |||||||
TOTAL INVESTMENTS - 96.3% |
| 5,920,453 | ||||||
OTHER ASSETS IN EXCESS OF |
| 224,751 | ||||||
|
| |||||||
NET ASSETS - 100.0% | $ | 6,145,204 | ||||||
|
| |||||||
The accompanying notes are an integral part of the financial statements.
20
DUPONT CAPITAL EMERGING MARKETS DEBT FUND
Portfolio of Investments (Concluded)
April 30, 2017
| * | Par amount denominated in USD unless otherwise noted. |
| ** | Non-income producing. |
| (a) | Investments with a total aggregate value of $33,652 or 0.55% of net assets were in default as of April 30, 2017. |
| (b) | Securities exempt from registration under Rule 144A of the Securities Act of 1933, as amended. |
| These securities were purchased in accordance with the guidelines approved by the Fund’s Board of Trustees and may be resold, in transactions exempt from registration, to qualified institutional buyers. At April 30, 2017 these securities amounted to $1,859,614 or 30.26% of net assets. This security has been determined by the Adviser to be a liquid security. |
| (c) | Multi-Step Coupon. Rate disclosed is as of April 30, 2017. |
| (d) | Floating or variable rate security. Rate disclosed is as of April 30, 2017. |
Forward foreign currency contracts outstanding as of April 30, 2017 were as follows:
Currency Purchased | Currency Sold | Expiration | Counterparty | Unrealized Depreciation | ||||||||||||
PLN | 66,508 | EUR | 62,709 | 06/09/17 | TDB | $(1,949) | ||||||||||
| BRL | Brazilian Real | |
| EUR | Euro | |
| MXN | Mexican Peso | |
| PLN | Polish Zloty | |
| SP ADR | Sponsored American Depository Receipt | |
| TDB | Toronto Dominion Bank | |
| USD | United States Dollar |
The accompanying notes are an integral part of the financial statements.
21
DUPONT CAPITAL FUNDS
Statements of Assets and Liabilities
April 30, 2017
| DuPont Capital Emerging Markets Fund | DuPont Capital Emerging Markets Debt Fund | |||||||||
Assets | ||||||||||
Investments, at value (Cost $25,544,914 and $6,077,058, respectively) | $ | 30,526,634 | $ | 5,920,453 | ||||||
Cash | 198,136 | 72,014 | ||||||||
Foreign Currency (Cost $13 and $120,447, respectively) | 14 | 120,077 | ||||||||
Receivable for investments sold | 31,107 | — | ||||||||
Dividends and interest receivable | 205,188 | 117,702 | ||||||||
Receivable from Investment Adviser | — | 11,612 | ||||||||
Prepaid expenses and other assets | 31,822 | 15,041 | ||||||||
|
|
|
| |||||||
Total assets | 30,992,901 | 6,256,899 | ||||||||
|
|
|
| |||||||
Liabilities | ||||||||||
Payable for investments purchased | — | 50,532 | ||||||||
Payable for custodian fees | 44,604 | 11,106 | ||||||||
Payable for audit fees | 34,490 | 27,850 | ||||||||
Payable to Investment Adviser | 31,633 | — | ||||||||
Payable for administration and accounting fees | 21,467 | 10,886 | ||||||||
Payable for legal fees | 13,332 | 1,566 | ||||||||
Payable for foreign taxes | 11,976 | — | ||||||||
Payable for printing fees | 9,676 | 295 | ||||||||
Payable for transfer agent fees | 8,980 | 6,772 | ||||||||
Forward foreign currency contracts depreciation* | — | 1,949 | ||||||||
Accrued expenses | 664 | 739 | ||||||||
|
|
|
| |||||||
Total liabilities | 176,822 | 111,695 | ||||||||
|
|
|
| |||||||
Net Assets | $ | 30,816,079 | $ | 6,145,204 | ||||||
|
|
|
| |||||||
Net Assets Consisted of: | ||||||||||
Capital stock, $0.01 par value | $ | 38,663 | $ | 6,278 | ||||||
Paid-in capital | 116,516,960 | 6,254,338 | ||||||||
Accumulated net investment income | 59,713 | 125,039 | ||||||||
Accumulated net realized loss from investments and foreign currency transactions | (90,751,001 | ) | (80,677 | ) | ||||||
Net unrealized appreciation/(depreciation) on investments, forward foreign currency contracts and translation of assets and liabilities denominated in foreign currency | 4,951,744 | (159,774 | ) | |||||||
|
|
|
| |||||||
Net Assets | $ | 30,816,079 | $ | 6,145,204 | ||||||
|
|
|
| |||||||
Class I: | ||||||||||
Net asset value, offering and redemption price per share ($30,816,079 / 3,866,295 shares) and ($6,145,204 / 627,798 shares), respectively | $7.97 | $9.79 | ||||||||
|
|
|
| |||||||
| * | Primary risk exposure is foreign currency contracts. |
The accompanying notes are an integral part of the financial statements.
22
DUPONT CAPITAL FUNDS
Statements of Operations
For the Year Ended April 30, 2017
| DuPont Capital Emerging Markets Fund | DuPont Capital Emerging Markets Debt Fund | |||||||||
Investment Income | ||||||||||
Dividends | $ | 1,306,921 | $ | 25 | ||||||
Interest | — | 459,461 | ||||||||
Less: foreign taxes withheld | (167,311 | ) | — | |||||||
|
|
|
| |||||||
Total investment income | 1,139,610 | 459,486 | ||||||||
|
|
|
| |||||||
Expenses | ||||||||||
Advisory fees (Note 2) | 411,906 | 35,645 | ||||||||
Administration and accounting fees | 101,138 | 72,116 | ||||||||
Custodian fees (Note 2) | 55,102 | 19,148 | ||||||||
Printing and shareholder reporting fees | 53,127 | 1,028 | ||||||||
Audit fees | 39,086 | 30,861 | ||||||||
Trustees’ and officers’ fees (Note 2) | 38,034 | 5,987 | ||||||||
Legal fees | 35,440 | 3,718 | ||||||||
Transfer agent fees (Note 2) | 24,098 | 26,899 | ||||||||
Registration and filing fees | 23,493 | 8,791 | ||||||||
Other expenses | 28,385 | 15,876 | ||||||||
|
|
|
| |||||||
Total expenses before waivers and reimbursements | 809,809 | 220,069 | ||||||||
|
|
|
| |||||||
Less: waivers and reimbursements (Note 2) | (263,954 | ) | (167,169 | ) | ||||||
|
|
|
| |||||||
Net expenses after waivers and reimbursements | 545,855 | 52,900 | ||||||||
|
|
|
| |||||||
Net investment income | 593,755 | 406,586 | ||||||||
|
|
|
| |||||||
Net realized and unrealized gain/(loss) from investments | ||||||||||
Net realized gain/(loss) from investments | 515,815 | (24,960 | ) | |||||||
Net realized gain/(loss) from foreign currency transactions | (2,991 | ) | 19,803 | |||||||
Net realized loss from forward currency contracts* | — | (90,777 | ) | |||||||
Net change in unrealized appreciation/(depreciation) on investments(a) | 5,767,281 | 150,280 | ||||||||
Net change in unrealized appreciation/(depreciation) on foreign currency translations | (27,010 | ) | (7,666 | ) | ||||||
Net change in unrealized appreciation/(depreciation) on forward foreign currency contracts* | — | 49,242 | ||||||||
|
|
|
| |||||||
Net realized and unrealized gain on investments | 6,253,095 | 95,922 | ||||||||
|
|
|
| |||||||
Net increase in net assets resulting from operations | $ | 6,846,850 | $ | 502,508 | ||||||
|
|
|
| |||||||
| * | Primary risk exposure is foreign currency contracts. |
| (a) | Change in net unrealized appreciation/(depreciation) on investments for the DuPont Capital Emerging Markets Fund was net of an increase in deferred foreign capital gains tax of $11,101. |
The accompanying notes are an integral part of the financial statements.
23
DUPONT CAPITAL EMERGING MARKETS FUND
Statements of Changes in Net Assets
| For the Year Ended April 30, 2017 | For the Year Ended April 30, 2016 | |||||||
Increase/(Decrease) in net assets from operations: | ||||||||
Net investment income | $ | 593,755 | $ | 1,573,543 | ||||
Net realized gain/(loss) from investments and foreign currency transactions | 512,824 | (14,615,271 | ) | |||||
Net change in unrealized appreciation/(depreciation) on investments and foreign currency translations | 5,740,271 | (14,191,128 | ) | |||||
|
|
|
| |||||
Net increase/(decrease) in net assets resulting from operations | 6,846,850 | (27,232,856 | ) | |||||
|
|
|
| |||||
Less Dividends and Distributions to Shareholders from: | ||||||||
Net investment income: | ||||||||
Class I | (542,388 | ) | (417,312 | ) | ||||
|
|
|
| |||||
Net decrease in net assets from dividends and distributions to shareholders | (542,388 | ) | (417,312 | ) | ||||
|
|
|
| |||||
Decrease in Net Assets Derived from Capital Share Transactions (Note 4) | (29,625,324 | ) | (85,206,627 | ) | ||||
|
|
|
| |||||
Total decrease in net assets | (23,320,862 | ) | (112,856,795 | ) | ||||
|
|
|
| |||||
Net assets | ||||||||
Beginning of year | 54,136,941 | 166,993,736 | ||||||
|
|
|
| |||||
End of year | $ | 30,816,079 | $ | 54,136,941 | ||||
|
|
|
| |||||
Accumulated net investment income, end of year | $ | 59,713 | $ | 5,688 | ||||
|
|
|
| |||||
The accompanying notes are an integral part of the financial statements.
24
DUPONT CAPITAL EMERGING MARKETS DEBT FUND
Statements of Changes in Net Assets
| For the Year Ended April 30, 2017 | For the Year Ended April 30, 2016 | |||||||
Increase/(decrease) in net assets from operations: | ||||||||
Net investment income | $ | 406,586 | $ | 509,563 | ||||
Net realized gain/(loss) from investments, forward foreign currency contracts and foreign currency transactions | (95,934 | ) | 54,208 | |||||
Net change in unrealized appreciation/(depreciation) on investments, forward foreign currency contracts and foreign currency translations | 191,856 | 25,904 | ||||||
|
|
|
| |||||
Net increase in net assets resulting from operations | 502,508 | 589,675 | ||||||
|
|
|
| |||||
Less Dividends and Distributions to Shareholders from: | ||||||||
Net investment income: | ||||||||
Class I | (306,448 | ) | (640,975 | ) | ||||
Net realized capital gains: | ||||||||
Class I | (12,231 | ) | (119,428 | ) | ||||
|
|
|
| |||||
Net decrease in net assets from dividends and distributions to shareholders | (318,679 | ) | (760,403 | ) | ||||
|
|
|
| |||||
Increase/(Decrease) in Net Assets Derived from Capital Share Transactions (Note 4) | 151,148 | (1,445,645 | ) | |||||
|
|
|
| |||||
Total increase/(decrease) in net assets | 334,977 | (1,616,373 | ) | |||||
|
|
|
| |||||
Net assets | ||||||||
Beginning of year | 5,810,227 | 7,426,600 | ||||||
|
|
|
| |||||
End of year | $ | 6,145,204 | $ | 5,810,227 | ||||
|
|
|
| |||||
Accumulated net investment income, end of year | $ | 125,039 | $ | 104,475 | ||||
|
|
|
| |||||
The accompanying notes are an integral part of the financial statements.
25
DUPONT CAPITAL EMERGING MARKETS FUND
Financial Highlights
Contained below is per share operating performance data for Class I shares outstanding, total investment return, ratios to average net assets and other supplemental data for the respective period. The total returns in the table represent the rate that an investor would have earned or lost on an investment in the Fund (assuming reinvestment of all dividends and distributions). This information has been derived from information provided in the financial statements and should be read in conjunction with the financial statements and the notes thereto.
| Class I | ||||||||||||||||||||
| For the Year Ended April 30, 2017 | For the Year Ended April 30, 2016 | For the Year Ended April 30, 2015 | For the Year Ended April 30, 2014 | For the Year Ended April 30, 2013 | ||||||||||||||||
Per Share Operating Performance | ||||||||||||||||||||
Net asset value, beginning of year | $ | 6.64 | $ | 8.28 | $ | 8.79 | $ | 9.23 | $ | 9.26 | ||||||||||
|
|
|
|
|
|
|
|
|
| |||||||||||
Net investment income(1) | 0.11 | 0.13 | 0.17 | 0.11 | 0.11 | |||||||||||||||
Net realized and unrealized gain/(loss) on investments | 1.32 | (1.73 | ) | (0.53 | ) | (0.44 | ) | (0.05 | ) | |||||||||||
|
|
|
|
|
|
|
|
|
| |||||||||||
Net increase/(decrease) in net assets resulting from operations | 1.43 | (1.60 | ) | (0.36 | ) | (0.33 | ) | 0.06 | ||||||||||||
|
|
|
|
|
|
|
|
|
| |||||||||||
Dividends and distributions to shareholders from: | ||||||||||||||||||||
Net investment income | (0.10 | ) | (0.04 | ) | (0.15 | ) | (0.11 | ) | (0.09 | ) | ||||||||||
|
|
|
|
|
|
|
|
|
| |||||||||||
Net asset value, end of year | $ | 7.97 | $ | 6.64 | $ | 8.28 | $ | 8.79 | $ | 9.23 | ||||||||||
|
|
|
|
|
|
|
|
|
| |||||||||||
Total investment return(2) | 21.77 | % | (19.23 | )% | (3.97 | )% | (3.61 | )% | 0.59 | % | ||||||||||
Ratio/Supplemental Data | ||||||||||||||||||||
Net assets, end of year (in thousands) | $ | 30,816 | $ | 54,137 | $ | 166,994 | $ | 492,607 | $ | 467,901 | ||||||||||
Ratio of expenses to average net assets | 1.39 | % | 1.60 | % | 1.35 | % | 1.31 | % | 1.32 | % | ||||||||||
Ratio of expenses to average net assets without waivers and expense reimbursements(3) | 2.06 | % | 1.63 | % | 1.35 | % | 1.31 | % | 1.32 | % | ||||||||||
Ratio of net investment income to average net assets | 1.51 | % | 1.81 | % | 1.95 | % | 1.20 | % | 1.21 | % | ||||||||||
Portfolio turnover rate | 28.3 | % | 53.3 | % | 86.4 | % | 69.9 | % | 118.5 | % | ||||||||||
| (1) | The selected per share data was calculated using the average shares outstanding method for the year. |
| (2) | Total investment return is calculated assuming a purchase of shares on the first day and a sale of shares on the last day of each period reported and includes reinvestment of dividends and distributions, if any. |
| (3) | During the period, certain fees were waived and/or reimbursed. If such fee waivers and/or reimbursements had not occurred, the ratios would have been as indicated (See Note 2). |
The accompanying notes are an integral part of the financial statements.
26
DUPONT CAPITAL EMERGING MARKETS FUND
Financial Highlights
Contained below is per share operating performance data for Class I shares outstanding, total investment return, ratios to average net assets and other supplemental data for the respective period. The total returns in the table represent the rate that an investor would have earned or lost on an investment in the Fund (assuming reinvestment of all dividends and distributions). This information has been derived from information provided in the financial statements and should be read in conjunction with the financial statements and the notes thereto.
| Class I | ||||||||||||||||
| For the Year Ended April 30, 2017 | For the Year Ended April 30, 2016 | For the Year Ended April 30, 2015 | For the Period Ended September 27, 2013* to April 30, 2014 | |||||||||||||
Per Share Operating Performance | ||||||||||||||||
Net asset value, beginning of year | $ | 9.56 | $ | 9.77 | $ | 10.26 | $ | 10.00 | ||||||||
|
|
|
|
|
|
|
| |||||||||
Net investment income(1) | 0.66 | 0.74 | 0.67 | 0.40 | ||||||||||||
Net realized and unrealized gain/(loss) on investments | 0.11 | 0.21 | (0.43 | ) | 0.26 | |||||||||||
|
|
|
|
|
|
|
| |||||||||
Net increase in net assets resulting from operations | 0.77 | 0.95 | 0.24 | 0.66 | ||||||||||||
|
|
|
|
|
|
|
| |||||||||
Dividends and distributions to shareholders from: | ||||||||||||||||
Net investment income | (0.52 | ) | (0.98 | ) | (0.44 | ) | (0.40 | ) | ||||||||
Net realized capital gains | (0.02 | ) | (0.18 | ) | (0.29 | ) | — | |||||||||
|
|
|
|
|
|
|
| |||||||||
Total dividends and distributions to shareholders | (0.54 | ) | (1.16 | ) | (0.73 | ) | (0.40 | ) | ||||||||
|
|
|
|
|
|
|
| |||||||||
Net asset value, end of year | $ | 9.79 | $ | 9.56 | $ | 9.77 | $ | 10.26 | ||||||||
|
|
|
|
|
|
|
| |||||||||
Total investment return(2) | 8.45 | % | 10.82 | % | 2.41 | % | 6.72 | % | ||||||||
Ratio/Supplemental Data | ||||||||||||||||
Net assets, end of year (in thousands) | $ | 6,145 | $ | 5,810 | $ | 7,427 | $ | 7,404 | ||||||||
Ratio of expenses to average net assets | 0.89 | % | 0.89 | % | 0.89 | % | 0.89 | %(3) | ||||||||
Ratio of expenses to average net assets without waivers and expense reimbursements(4) | 3.70 | % | 3.34 | % | 2.25 | % | 4.42 | %(3) | ||||||||
Ratio of net investment income to average net assets | 6.84 | % | 7.93 | % | 6.70 | % | 6.83 | %(3) | ||||||||
Portfolio turnover rate | 17.9 | % | 24.6 | % | 23.7 | % | 21.6 | %(5) | ||||||||
| * | Commencement of operations. |
| (1) | The selected per share data was calculated using the average shares outstanding method for the year. |
| (2) | Total investment return is calculated assuming a purchase of shares on the first day and a sale of shares on the last day of each period reported and includes reinvestment of dividends and distributions, if any. Total return for periods less than one year are not annualized. |
| (3) | Annualized. |
| (4) | During the period, certain fees were waived and/or reimbursed. If such fee waivers and/or reimbursements had not occurred, the ratios would have been as indicated (See Note 2). |
| (5) | Not annualized. |
The accompanying notes are an integral part of the financial statements.
27
DUPONT CAPITAL FUNDS
Notes to Financial Statements
April 30, 2017
1. Organization and Significant Accounting Policies
The DuPont Capital Emerging Markets Fund is a diversified, open-end management investment company registered under the Investment Company Act of 1940, as amended (the “1940 Act”). The DuPont Capital Emerging Markets Debt Fund is a non-diversified, open-end management investment company registered under the 1940 Act (the DuPont Capital Emerging Markets Fund and the DuPont Capital Emerging Markets Debt Fund are each a “Fund”, and together, the “Funds”). The DuPont Capital Emerging Markets Fund commenced operations on December 6, 2010 and the DuPont Capital Emerging Markets Debt Fund commenced operations on September 27, 2013. The Funds are each a separate series of FundVantage Trust (the “Trust”) which was organized as a Delaware statutory trust on August 28, 2006. The Trust is a “series trust” authorized to issue an unlimited number of separate series or classes of shares of beneficial interest. Each series is treated as a separate entity for certain matters under the 1940 Act, and for other purposes, and a shareholder of one series is not deemed to be a shareholder of any other series. The Funds are each authorized to issue and offer Class I Shares.
The Funds are investment companies and follow accounting and reporting guidance in the Financial Accounting Standards Board Accounting Standards Codification Topic 946.
Portfolio Valuation — Each Fund’s net asset value (“NAV”) is calculated once daily at the close of regular trading hours on the New York Stock Exchange (“NYSE”) (typically 4:00 p.m. Eastern time) on each day the NYSE is open. Securities held by each Fund are valued using the closing price or the last sale price on a national securities exchange or the National Association of Securities Dealers Automatic Quotation System (“NASDAQ”) market system where they are primarily traded. Equity securities listed on any national or foreign exchange market system will be valued at the last sale price. Equity securities traded in the over-the-counter market are valued at their closing price. If there were no transactions on that day, securities traded principally on an exchange will be valued at the mean of the last bid and ask prices prior to the market close. Prices for equity securities normally are supplied by an independent pricing service approved by the FundVantage Trust’s Board of Trustees (“Board of Trustees”). Fixed income securities are valued based on market quotations, which are furnished by an independent pricing service approved by the FundVantage Board of Trustees. Fixed income securities having remaining maturities of 60 days or less are generally valued at amortized cost, provided such amounts approximates market value. Debt securities are valued on the basis of broker quotations or valuations provided by a pricing service, which utilizes information with respect to recent sales, market transactions in comparable securities, quotations from dealers, and various relationships between securities in determining value. Due to continued volatility in the current market, valuations developed through pricing techniques may materially vary from the actual amounts realized upon sale of the securities. Any assets held by the Funds that are denominated in foreign currencies are valued daily in U.S. dollars at the foreign currency exchange rates that are prevailing at the time that the Funds determine the daily NAV per share. Foreign securities may trade on weekends or other days when the Funds do not calculate NAV. As a result, the market value of these investments may change on days when you cannot buy or sell shares of the Funds. Foreign securities are valued
28
DUPONT CAPITAL FUNDS
Notes to Financial Statements (Continued)
April 30, 2017
based on prices from the primary market in which they are traded and are translated from the local currency into U.S. dollars using current exchange rates. Forward exchange contracts are valued at the forward rate. Investments in any mutual fund are valued at their respective NAVs as determined by those mutual funds each business day (which may use fair value pricing as disclosed in their prospectuses). Securities that do not have a readily available current market value are valued in accordance with the procedure adopted by the Trust’s Board of Trustees. The Board of Trustees has adopted methods for valuing securities and other assets in circumstances where market quotes are not readily available and has delegated to the Adviser the responsibility for applying the valuation methods. Relying on prices supplied by pricing services or dealers or using fair valuation may result in values that are higher or lower than the values used by other investment companies and investors to price the same investments. In the event that market quotes are not readily available, and the security or asset cannot be valued pursuant to one of the valuation methods, the value of the security or asset will be determined in good faith by the Adviser. The Trust has established a Valuation Committee which performs certain functions including the oversight of the Adviser’s fair valuation determinations.
Fair Value Measurements — The inputs and valuations techniques used to measure fair value of each Fund’s investments are summarized into three levels as described in the hierarchy below:
| • | Level 1 — quoted prices in active markets for identical securities; |
| • | Level 2 — other significant observable inputs (including quoted prices for similar securities, interest rates, prepayment speeds, credit risk, etc.); and |
| • | Level 3 — significant unobservable inputs (including each Fund’s own assumptions in determining the fair value of investments). |
The fair value of each Fund’s bonds is generally based on quotes received from brokers of independent pricing services. Bonds with quotes that are based on actual trades with a sufficient level of activity on or near the measurement date are classified as Level 2 assets.
The inputs or methodology used for valuing securities are not necessarily an indication of the risk associated with investing in those securities. Transfers in and out are recognized at the value at the end of the period.
Significant events (such as movement in the U.S. securities market, or other regional and local developments) may occur between the time that foreign markets close (where the security is principally traded) and the time that each Fund calculates its NAV (generally, the close of the NYSE) that may impact the value of securities traded in these foreign markets. As a result, each Fund fair values foreign securities using an independent pricing service which considers the correlation of the trading patterns of the foreign security to the intraday trading in the U.S. markets for investments such as American Depositary Receipts,
29
DUPONT CAPITAL FUNDS
Notes to Financial Statements (Continued)
April 30, 2017
financial futures, exchange traded funds and certain indexes as well as prices for similar securities. Such fair valuations are categorized as Level 2 in the hierarchy.
Securities listed on a non-U.S. exchange are generally fair valued daily by an independent fair value pricing service approved by the Board of Trustees and categorized as Level 2 investments within the hierarchy. The fair valuations for these securities may not be the same as quoted or published prices of the securities on their primary markets. Securities for which daily fair value prices from the independent fair value pricing service are not available are generally valued at the last quoted sale price at the close of an exchange on which the security is traded and categorized as Level 1 investments within the hierarchy. Values of foreign securities, currencies, and other assets and liabilities denominated in foreign currencies are translated into U.S. dollars at the exchange rate of said currencies against the U.S. dollar, as of Valuation Time, as provided by an independent pricing service approved by the Board of Trustees.
The following is a summary of the inputs used, as of April 30, 2017, in valuing each Fund’s investments carried at fair value:
| DuPont Capital Emerging Markets Fund | ||||||||||||||||
| Total Value at 04/30/2017 | Level 1 Quoted Prices | Level 2 Other Significant Observable Inputs | Level 3 Significant Unobservable Inputs | |||||||||||||
Common Stocks | ||||||||||||||||
Argentina | 502,547 | 502,547 | — | — | ||||||||||||
Brazil | 1,512,217 | 1,512,217 | — | — | ||||||||||||
China | 6,600,431 | 951,623 | 5,648,808 | — | ||||||||||||
Czech Republic | 503,180 | 503,180 | — | — | ||||||||||||
Greece | 264,192 | 264,192 | — | — | ||||||||||||
Hungary | 271,857 | — | 271,857 | — | ||||||||||||
India | 2,458,651 | 320,235 | 2,138,416 | — | ||||||||||||
Indonesia | 580,693 | — | 580,693 | — | ||||||||||||
Malaysia | 582,733 | — | 582,733 | — | ||||||||||||
Mexico | 1,779,283 | 1,779,283 | — | — | ||||||||||||
Pakistan | 381,340 | — | 381,340 | — | ||||||||||||
Poland | 436,428 | — | 436,428 | — | ||||||||||||
Russia | 1,079,632 | 450,968 | 628,664 | — | ||||||||||||
South Africa | 3,257,986 | 336,192 | 2,921,794 | — | ||||||||||||
South Korea | 4,351,840 | — | 4,351,840 | — | ||||||||||||
Taiwan | 3,473,766 | 1,354,646 | 2,119,120 | — | ||||||||||||
Thailand | 1,111,712 | — | 1,111,712 | — | ||||||||||||
Turkey | 474,657 | — | 474,657 | — | ||||||||||||
Preferred Stocks | 903,489 | 903,489 | — | — | ||||||||||||
|
|
|
|
|
|
|
| |||||||||
Total Investments | $ | 30,526,634 | $ | 8,878,572 | $ | 21,648,062 | $ | — | ||||||||
|
|
|
|
|
|
|
| |||||||||
30
DUPONT CAPITAL FUNDS
Notes to Financial Statements (Continued)
April 30, 2017
| DuPont Capital Emerging Markets Debt Fund | ||||||||||||||||
Assets | Total Value at 04/30/17 | Level 1 Quoted Price | Level 2 Other Significant Observable Inputs | Level 3 Significant Unobservable Inputs | ||||||||||||
Corporate Bonds and Notes | $ | 1,537,291 | $ | — | $ | 1,537,291 | $ | — | ||||||||
Foreign Government Bonds and Notes | 4,382,222 | — | 4,382,222 | — | ||||||||||||
Common Stocks | 940 | 940 | — | — | ||||||||||||
|
|
|
|
|
|
|
| |||||||||
Total Assets | $ | 5,920,453 | $ | 940 | $ | 5,919,513 | $ | — | ||||||||
|
|
|
|
|
|
|
| |||||||||
Liabilities | Total Value at 04/30/17 | Level 1 Quoted Price | Level 2 Other Significant Observable Inputs | Level 3 Significant Unobservable Inputs | ||||||||||||
Derivatives: | ||||||||||||||||
Foreign Currency Contracts | ||||||||||||||||
Forward Foreign Currency Contracts | $ | (1,949 | ) | $ | — | $ | (1,949 | ) | $ | — | ||||||
|
|
|
|
|
|
|
| |||||||||
Total Liabilities | $ | (1,949 | ) | $ | — | $ | (1,949 | ) | $ | — | ||||||
|
|
|
|
|
|
|
| |||||||||
At the end of each quarter, management evaluates the classification of Levels 1, 2 and 3 assets and liabilities. Various factors are considered, such as changes in liquidity from the prior reporting period; whether or not a broker is willing to execute at the quoted price; the depth and consistency of prices from third party pricing services; and the existence of contemporaneous, observable trades in the market. Additionally, management evaluates the classification of Level 1 and Level 2 assets and liabilities on a quarterly basis for changes in listings or delistings on national exchanges.
Due to the inherent uncertainty of determining the fair value of investments that do not have readily available market value, the fair value of each Fund’s investments may fluctuate from period to period. Additionally, the fair value of investments may differ significantly from the values that would have been used had a ready market existed for such investments and may differ materially from the values each Fund may ultimately realize. Further, such investments may be subject to legal and other restrictions on resale or otherwise less liquid than publicly traded securities.
For fair valuations using significant unobservable inputs, U.S. generally accepted accounting principles (“U.S. GAAP”) require each Fund to present a reconciliation of the beginning to ending balances for reported market values that presents changes attributable to total realized and unrealized gains or losses,
31
DUPONT CAPITAL FUNDS
Notes to Financial Statements (Continued)
April 30, 2017
purchase and sales, and transfers in and out of Level 3 during the period. Transfers in and out between Levels are based on values at the end of the period. U.S. GAAP also requires each Fund to disclose amounts and reasons for all transfers in and out of Level 1 and Level 2 fair value measurements. A reconciliation of Level 3 investments is presented only when each Fund had an amount of Level 3 investments at the end of the reporting period that was meaningful in relation to its net assets. The amounts and reasons for all transfers in and out of each Level within the three-tier hierarchy are disclosed when each Fund had an amount of total transfers during the reporting period that was meaningful in relation to its net assets as of the end of the reporting period.
For the year ended April 30, 2017, there were transfers from Level 1 to Level 2 of $783,095 and from Level 2 to Level 1 of $839,372 due to foreign fair value adjustments in the DuPont Capital Emerging Markets Fund. The DuPont Capital Emerging Markets Debt Fund had no transfers between Levels 1, 2 and 3.
Use of Estimates — The preparation of financial statements in conformity with U.S. GAAP requires management to make estimates and assumptions that affect the amounts reported in the financial statements and accompanying notes at the date of the financial statements and the reported amounts of revenues and expenses during the period. Actual results could differ from those estimates and those differences could be material.
Investment Transactions, Investment Income and Expenses — Investment transactions are recorded on trade date for financial statement preparation purposes. Realized gains and losses on investments sold are recorded on the identified cost basis. Interest income is recorded on the accrual basis. Accretion of discounts and amortization of premiums are recorded on a daily basis using the effective yield method except for short term securities, which records discounts and premiums on a straight-line basis. Dividends are recorded on the ex-dividend date. General expenses of the Trust are generally allocated to each fund in proportion to its relative daily net assets. Expenses directly attributable to a particular fund in the Trust are charged directly to that fund.
Foreign Currency Translation — Assets and liabilities initially expressed in non-U.S. currencies are translated into U.S. dollars based on the applicable exchange rates at the date of the last business day of the financial statement period. Purchases and sales of securities, interest income, dividends, variation margin received and expenses denominated in foreign currencies are translated into U.S. dollars at the exchange rates in effect on the transaction date.
Each Fund does not separately report the effect of changes in foreign exchange rates from changes in market prices of securities held. Such changes are included with the net realized gain or loss and change in unrealized appreciation or depreciation on investment securities in the Statement of Operations. Other foreign currency transactions resulting in realized and unrealized gain or loss are reported separately
32
DUPONT CAPITAL FUNDS
Notes to Financial Statements (Continued)
April 30, 2017
as net realized gain or loss and change in unrealized appreciation or depreciation on foreign currencies in the Statement of Operations.
Dividends and Distributions to Shareholders — Dividends from net investment income, if any, are declared and paid at least annually to shareholders of the DuPont Capital Emerging Markets Fund and dividends from net investment income are declared daily and paid monthly to shareholders of the DuPont Capital Emerging Markets Debt Fund. Distributions from net realized capital gains, if any, will be declared and paid at least annually to shareholders and recorded on ex-date for both Funds. Income dividends and capital gain distributions are determined in accordance with U.S. federal income tax regulations, which may differ from U.S. GAAP. These differences may include the treatment of non-taxable dividends, expiring capital loss carryforwards and losses deferred due to wash sales and excise tax regulations. Permanent book and tax basis differences relating to shareholder distributions will result in reclassifications within the components of net assets.
U.S. Tax Status — No provision is made for U.S. income taxes as it is each Fund’s intention to continue to qualify for and elect the tax treatment applicable to regulated investment companies under Subchapter M of the Internal Revenue Code of 1986, as amended (the “Internal Revenue Code”), and make the requisite distributions to its shareholders which will be sufficient to relieve it from U.S. income and excise taxes.
Other — In the normal course of business, each Fund may enter into contracts that provide general indemnifications. Each Fund’s maximum exposure under these arrangements is dependent on claims that may be made against each Fund in the future, and, therefore, cannot be estimated; however, based on experience, the risk of material loss for such claims is considered remote.
Forward Foreign Currency Contracts — A forward foreign currency contract (“Forward Contract”) is a commitment to buy or sell a specific amount of a foreign currency at a negotiated price on a specified future date. Forward Contracts can help a fund manage the risk of changes in currency exchange rates. These contracts are marked-to-market daily at the applicable forward currency translation rates. A fund records realized gains or losses at the time the Forward Contract is closed. A Forward Contract is extinguished through a closing transaction or upon delivery of the currency or entering an offsetting contract. The Fund’s maximum risk of loss from counterparty credit risk related to Forward Contracts is the fair value of the contract.
Recent Accounting Pronouncement — In October 2016, the U.S. Securities and Exchange Commission (“SEC”) issued a new rule, Investment Company Reporting Modernization, which, among other provisions, amends Regulation S-X to require standardized, enhanced disclosures, particularly related to derivatives, in investment company financial statements. Compliance with the amendments to Regulation S-X is required for financial statements filed with the SEC on or after August 1, 2017. Management is currently evaluating the impact that the amendments will have on the Funds’ financial statements and related disclosures.
33
DUPONT CAPITAL FUNDS
Notes to Financial Statements (Continued)
April 30, 2017
For the year ended April 30, 2017, the DuPont Capital Emerging Markets Debt Fund’s average monthly volume of forward foreign currency contracts was as follows:
Forward Foreign Currency Contracts - Payable (Value At Trade Date) | Forward Foreign Contracts - Receivable | |
$(70,719) | $70,719 |
Currency Risk — Each Fund invests in securities of foreign issuers, including American Depositary Receipts. These markets are subject to special risks associated with foreign investments not typically associated with investing in U.S. markets. Because the foreign securities in which each Fund may invest generally trade in currencies other than the U.S. dollar, changes in currency exchange rates will affect each Fund’s NAV, the value of dividends and interest earned and gains and losses realized on the sale of securities. Because the NAV for each Fund is determined on the basis of U.S. dollars, each Fund may lose money by investing in a foreign security if the local currency of a foreign market depreciates against the U.S. dollar, even if the local currency value of each Fund’s holdings goes up. Generally, a strong U.S. dollar relative to these other currencies will adversely affect the value of each Fund’s holdings in foreign securities.
Foreign Securities Market Risk — Securities of many non-U.S. companies may be less liquid and their prices more volatile than securities of comparable U.S. companies. Securities of companies traded in many countries outside the U.S., particularly emerging markets countries, may be subject to further risks due to the inexperience of local investment professionals and financial institutions, the possibility of permanent or temporary termination of trading and greater spreads between bid and asked prices of securities. In addition, non-U.S. stock exchanges and investment professionals are subject to less governmental regulation, and commissions may be higher than in the United States. Also, there may be delays in the settlement of non-U.S. stock exchange transactions.
Emerging Markets Risk — The DuPont Capital Emerging Markets Fund and the DuPont Capital Emerging Markets Debt Fund invest in emerging market instruments which are subject to certain credit and market risks. The securities and currency markets of emerging market countries are generally smaller, less developed, less liquid and more volatile than the securities and currency markets of the United States and other developed markets. Disclosure and regulatory standards in many respects are less stringent than in other developed markets. There also may be a lower level of monitoring and regulation of securities markets in emerging market countries and the activities of investors in such markets and enforcement of existing regulations may be extremely limited. Political and economic structures in many of these countries may be in their infancy and developing rapidly, and such countries may lack the social, political and economic stability characteristics of more developed countries.
34
DUPONT CAPITAL FUNDS
Notes to Financial Statements (Continued)
April 30, 2017
Debt Investment Risk — Debt investments are affected primarily by the financial condition of the companies or other entities that have issued them and by changes in interest rates. There is a risk that an issuer of a Fund’s debt investments may not be able to meet its financial obligations (e.g., may not be able to make principal and/or interest payments when they are due or otherwise default on other financial terms) and/or go bankrupt. Securities such as high-yield/high-risk bonds, e.g., bonds with low credit ratings by Moody’s (Ba or lower) or Standard & Poor’s (BB and lower) or if unrated are of comparable quality as determined by the manager, are especially subject to credit risk during periods of economic uncertainty or during economic downturns and are more likely to default on their interest and/or principal payments than higher rated securities. Debt investments may be affected by changes in interest rates. Debt investments with longer durations tend to be more sensitive to changes in interest rates, making them more volatile than debt investments with shorter durations or floating or adjustable interest rates. The value of debt investments may fall when interest rates rise.
2. Transactions with Related Parties and Other Service Providers
DuPont Capital Management Corporation (“DuPont Capital” or the “Adviser”) serves as investment adviser to each Fund pursuant to an investment advisory agreement with the Trust. For its services, the Adviser is paid a monthly fee at the annual rate of 1.05% of the DuPont Capital Emerging Markets Fund’s average daily net assets; and 0.60% of the DuPont Capital Emerging Markets Debt Fund’s average daily net assets. The Adviser has contractually agreed to reduce its investment advisory fee and/or reimburse certain expenses of each Fund to the extent necessary to ensure that the Funds’ total operating expenses, excluding taxes, “Acquired Fund” fees and expenses, interest, extraordinary items, and brokerage commissions, do not exceed 1.27% and 0.89%, respectively, (on an annual basis) of the DuPont Capital Emerging Markets Fund and the DuPont Capital Emerging Markets Debt Fund’s average daily net assets (the “Expense Limitation”), respectively. Effective September 1, 2016, the DuPont Capital Emerging Markets Fund’s Expense Limitation (on an annual basis) was reduced from 1.60% of the Fund’s average daily net assets to its current rate of 1.27%. The Expense Limitations will remain in place until August 31, 2017, unless the Board of Trustees approves its earlier termination. The Adviser is entitled to recover, subject to approval by the Board of Trustees, such amounts reduced or reimbursed for a period of up to three (3) years from the year in which the Adviser reduced its compensation and/or assumed expenses for each Fund. The Adviser is permitted to seek reimbursement from the Funds, subject to certain limitations, for fees it waived and Fund expenses it paid to the extent the total annual fund expenses do not exceed the limits described above or any lesser limits in effect at the time of reimbursement. No recoupment will occur unless each Funds’ expenses are below the Expense Limitation amount.
For the year ended April 30, 2017, the Adviser earned advisory fees of $411,906 and $35,645 for the DuPont Capital Emerging Markets Fund and the DuPont Capital Emerging Markets Debt Fund, respectively. For the year ended April 30, 2017, the Adviser waived fees and reimbursed expenses of $263,954 and
35
DUPONT CAPITAL FUNDS
Notes to Financial Statements (Continued)
April 30, 2017
$167,169 for the DuPont Capital Emerging Markets Fund and the DuPont Capital Emerging Markets Debt Fund, respectively.
As of April 30, 2017, the amount of potential recoupment by the Adviser was as follows:
| Expiration 04/30/2018 | Expiration 04/30/2019 | Expiration 04/30/2020 | Total | |||||||||||||
DuPont Capital Emerging Markets Fund | $ | — | $ | 30,175 | $ | 263,954 | $ | 294,129 | ||||||||
DuPont Capital Emerging Markets Debt Fund | 101,163 | 157,238 | 167,169 | 425,570 | ||||||||||||
Other Service Providers
BNY Mellon Investment Servicing (US) Inc. (“BNY Mellon”) serves as administrator and transfer agent for the Funds. For providing administrative and accounting services, BNY Mellon is entitled to receive a monthly fee equal to an annualized percentage rate of each Funds’ average daily net assets and is subject to certain minimum monthly fees. For providing transfer agent services, BNY Mellon is entitled to receive a monthly fee, subject to certain minimum, and out of pocket expenses.
The Bank of New York Mellon (the “Custodian”) provides certain custodial services to the Funds. The Custodian is entitled to receive a monthly fee, subject to certain minimum, and out of pocket expenses.
Foreside Funds Distributors LLC (the “Underwriter”) provides principal underwriting services to the Funds pursuant to an underwriting agreement between the Trust and the Underwriter.
Trustees and Officers
The Trust is governed by its Board of Trustees. The Trustees of the Trust receive compensation in the form of an annual retainer and per meeting fees for their services to the Trust. The remuneration paid to the Trustees by the Funds during the year ended April 30, 2017 was $16,066. An employee of BNY Mellon serves as the Secretary of the Trust and is not compensated by the Funds or the Trust.
Effective June 1, 2016 and July 1, 2016, JW Fund Management LLC (“JWFM”) provides a Principal Executive Officer and Principal Financial Officer, respectively, to the Trust. JWFM is compensated for the services provided to the Trust. Until May 31, 2016 and June 30, 2016, certain employees of BNY Mellon served as Principal Executive Officer and Principal Financial Officer, respectively, to the Trust. They were not compensated by the Trust or the Funds.
Freeh Group International Solutions, LLC provides the Trust with a Chief Compliance Officer and an Anti-Money Laundering Officer.
36
DUPONT CAPITAL FUNDS
Notes to Financial Statements (Continued)
April 30, 2017
3. Investment in Securities
For the year ended April 30, 2017, aggregate purchases and sales of investment securities (excluding U.S. Government and agency short-term investments and other short-term investments) of the Funds were as follows:
| Purchases | Sales | |||||||
DuPont Capital Emerging Markets Fund | $ | 10,648,149 | $ | 26,844,806 | ||||
DuPont Capital Emerging Markets Debt Fund | 982,670 | 1,009,681 | ||||||
4. Capital Share Transactions
For the years ended April 30, 2017 and 2016, transactions in capital shares (authorized shares unlimited) were as follows:
| DuPont Capital Emerging Markets Fund | ||||||||||||||||
For the Year Ended |
For the Year Ended | |||||||||||||||
Shares |
Amount |
Shares |
Amount | |||||||||||||
Class I | ||||||||||||||||
Sales | 427,269 | $ | 3,012,038 | 584,749 | $ | 3,962,487 | ||||||||||
Reinvestments | 76,004 | 541,146 | 64,398 | 403,779 | ||||||||||||
Redemptions | (4,787,175 | ) | (33,178,508 | ) | (12,662,309 | ) | (89,572,893 | ) | ||||||||
|
|
|
|
|
|
|
| |||||||||
Net decrease | (4,283,902 | ) | $ | (29,625,324 | ) | (12,013,162 | ) | $ | (85,206,627 | ) | ||||||
|
|
|
|
|
|
|
| |||||||||
37
DUPONT CAPITAL FUNDS
Notes to Financial Statements (Continued)
April 30, 2017
| DuPont Capital Emerging Markets Debt Fund | ||||||||||||||||
For the Year Ended |
For the Year Ended | |||||||||||||||
Shares |
Amount |
Shares |
Amount | |||||||||||||
Class I | ||||||||||||||||
Sales | 37,407 | $ | 341,899 | — | $ | — | ||||||||||
Reinvestments | 34,295 | 318,679 | 65,825 | 600,524 | ||||||||||||
Redemptions | (51,817 | ) | (509,430 | ) | (217,761 | ) | (2,046,169 | ) | ||||||||
|
|
|
|
|
|
|
| |||||||||
Net increase/(decrease) | 19,885 | $ | 151,148 | (151,936 | ) | $ | (1,445,645 | ) | ||||||||
|
|
|
|
|
|
|
| |||||||||
5. Federal Tax Information
The Funds have followed the authoritative guidance on accounting for and disclosure of uncertainty in tax positions, which requires the Funds to determine whether a tax position is more likely than not to be sustained upon examination, including resolution of any related appeals or litigation processes, based on the technical merits of the position. Each Fund has determined that there was no effect on the financial statements from following this authoritative guidance. In the normal course of business, the Funds are subject to examination by federal, state and local jurisdictions, where applicable, for tax years for which applicable statutes of limitations have not expired.
Distributions are determined in accordance with federal income tax regulations, which may differ in amount or character from net investment income and realized gains for financial reporting purposes. Accordingly, the character of distributions and composition of net assets for tax purposes may differ from those reflected in the accompanying financial statements. To the extent these differences are permanent, such amounts are reclassified within the components of net assets based on the tax treatment; temporary differences do not require reclassifications. Net investment income, net realized gains and net assets were not affected by these adjustments. The following permanent differences as of April 30, 2017, primarily attributed to the reclassification of (a) gains and losses on foreign currency transactions and (b) gain on the sale of passive foreign investment company securities, were reclassified among the following accounts:
| Increase/(Decrease) Undistributed Net Investment Income | Increase/(Decrease) Accumulated Net Realized Loss | Increase/(Decrease) Additional Paid-In Capital | |||||||||||||
DuPont Capital Emerging Markets Fund | $ 2,658 | $(2,658 | ) | $— | |||||||||||
DuPont Capital Emerging Markets Debt Fund | (79,574 | ) | 79,574 | — | |||||||||||
38
DUPONT CAPITAL FUNDS
Notes to Financial Statements (Continued)
April 30, 2017
For the year ended April 30, 2017, the tax character of distributions paid by the DuPont Capital Emerging Markets Fund and the DuPont Capital Emerging Markets Debt Fund were $542,388 and $318,679 of ordinary income dividends, respectively. For the year ended April 30, 2016, the tax character of distributions paid by the DuPont Capital Emerging Markets Fund was $417,312 of ordinary income dividends and the DuPont Capital Emerging Markets Debt Fund were $743,335 and $17,068 of ordinary income dividends and long-term capital gains, respectively. Distributions from net investment income and short-term capital gains are treated as ordinary income for federal income tax purposes.
As of April 30, 2017, the components of distributable earnings on a tax basis were as follows:
| Capital Loss Carryforward | Undistributed Ordinary Income | Undistributed Long-Term Gain | Unrealized Appreciation/ (Depreciation) | Qualified Late-Year Losses | ||||||||||||||||
DuPont Capital Emerging Markets Fund | $(88,186,959 | ) | $ 70,488 | $— | $2,847,874 | $(470,947 | ) | |||||||||||||
DuPont Capital Emerging Markets Debt Fund | $ — | $135,906 | $— | $ (170,641 | ) | $ (80,677 | ) | |||||||||||||
The differences between the book and tax basis components of distributable earnings relate primarily to the timing and recognition of income and gains for federal income tax purposes.
At April 30, 2017, the federal tax cost, aggregate gross unrealized appreciation and depreciation of securities held by the Funds were as follows:
| Federal Tax Cost | Unrealized Appreciation | Unrealized Depreciation | Net Unrealized Appreciation/ (Depreciation) | |||||||||||||
DuPont Capital Emerging Markets Fund | $27,648,785 | $5,709,020 | $(2,831,171 | ) | $2,877,849 | |||||||||||
DuPont Capital Emerging Markets Debt Fund | 6,090,022 | 197,714 | (367,283 | ) | (169,569 | ) | ||||||||||
Pursuant to federal income tax rules applicable to regulated investment companies, the Funds may elect to treat certain net capital losses between November 1 and April 30 and late year ordinary losses ((i) ordinary losses between January 1 and April 30, and (ii) specified ordinary and currency losses between November 1 and April 30) as occurring on the first day of the following tax year. For the year ended April 30, 2017, any amount of losses elected within the tax return will not be recognized for federal income tax purposes until May 1, 2017. For the year ended April 30, 2017, the DuPont Capital Emerging Markets Fund and the DuPont Capital Emerging Markets Debt Fund had $470,947 and $80,677 of capital loss deferrals, respectively.
39
DUPONT CAPITAL FUNDS
Notes to Financial Statements (Concluded)
April 30, 2017
Accumulated capital losses represent net capital loss carryforwards as of April 30, 2017 that may be available to offset future realized capital gains and thereby reduce future capital gains distributions. As of April 30, 2017, the DuPont Capital Emerging Markets Fund had capital loss carryforwards of $88,186,959, of which $63,187,220 are long-term losses and $24,999,739 are short-term losses and have an unlimited period of capital loss carryforward. As of April 30, 2017, the DuPont Capital Emerging Markets Debt Fund had no capital loss carryforwards. On November 27, 2015, the DuPont Capital Emerging Markets Fund experienced a more than 50% change of ownership as defined by Internal Revenue Code Section 382(g) giving rise to an annual capital loss carryforward limitation on the use of pre-ownership change capital losses. At the time of the change the DuPont Capital Emerging Markets Fund had $83,500,000 of capital loss carryforwards impacted by the ownership change and the use of those losses against capital gains will be limited to $1,618,329 per tax year. The permitted annual capital loss, if not applied to capital gains in the tax year, will accumulate and be available in the next year for use.
6. Subsequent Events
Management has evaluated the impact of all subsequent events on each Fund through the date the financial statements were issued and has determined that there were no subsequent events requiring recognition or disclosure in the financial statements.
40
DUPONT CAPITAL FUNDS
Report of Independent Registered Public Accounting Firm
To the Board of Trustees of FundVantage Trust and Shareholders of the
DuPont Capital Emerging Markets Fund and the DuPont Capital Emerging Markets Debt Fund:
In our opinion, the accompanying statements of assets and liabilities, including the portfolios of investments, and the related statements of operations and of changes in net assets and the financial highlights present fairly, in all material respects, the financial position of the DuPont Capital Emerging Markets Fund and the DuPont Capital Emerging Markets Debt Fund (two of the funds constituting FundVantage Trust, hereafter referred to as the “Funds”) as of April 30, 2017, the results of each of their operations for the year then ended, the changes in each of their net assets for each of the two years in the period then ended and the financial highlights for each of the periods indicated, in conformity with accounting principles generally accepted in the United States of America. These financial statements and financial highlights (hereafter referred to as “financial statements”) are the responsibility of the Funds’ management. Our responsibility is to express an opinion on these financial statements based on our audits. We conducted our audits of these financial statements in accordance with the standards of the Public Company Accounting Oversight Board (United States). Those standards require that we plan and perform the audit to obtain reasonable assurance about whether the financial statements are free of material misstatement. An audit includes examining, on a test basis, evidence supporting the amounts and disclosures in the financial statements, assessing the accounting principles used and significant estimates made by management, and evaluating the overall financial statement presentation. We believe that our audits, which included confirmation of securities as of April 30, 2017 by correspondence with the custodian and brokers, provide a reasonable basis for our opinion.
PricewaterhouseCoopers LLP
Philadelphia, Pennsylvania
June 28, 2017
41
DUPONT CAPITAL FUNDS
Shareholder Tax Information
(Unaudited)
The DuPont Capital Emerging Markets Fund and the DuPont Capital Emerging Markets Debt Fund are required by Subchapter M of the Internal Revenue Code to advise its shareholders of the U.S. federal tax status of distributions received by the Funds’ shareholders in respect of such fiscal year. During the fiscal year ended April 30, 2017, the DuPont Capital Emerging Markets Fund and the DuPont Capital Emerging Markets Debt Fund paid $542,388 and $318,679 of ordinary income dividends, respectively, to their shareholders. The DuPont Capital Emerging Markets Fund and the DuPont Capital Emerging Markets Debt Fund did not pay long-term capital gains dividend, to their shareholders. Dividends from net investment income and short-term capital gains are treated as ordinary income dividends for federal income tax purposes.
The DuPont Capital Emerging Markets Fund and the DuPont Capital Emerging Markets Debt Fund designate 100.00% and 0.00%, respectively, of the ordinary income distribution as qualified dividend income pursuant to the Jobs and Growth Tax Relief Reconciliation Act of 2003.
The percentage of qualified interest income related dividends not subject to withholding tax for non-resident aliens and foreign corporations for the DuPont Capital Emerging Markets Fund and the DuPont Capital Emerging Markets Debt Fund is 0.01% and 0.00%, respectively.
The percentage of ordinary income dividends qualifying for the corporate dividends received deduction for the DuPont Capital Emerging Markets Fund and the DuPont Capital Emerging Markets Debt Fund is 0.03% and 0.00%, respectively.
The DuPont Capital Emerging Markets Debt Fund designates 100.00% of the ordinary income distributions as qualified short-term gain pursuant to the American Jobs Creation Act of 2004. There was no percentage of qualified short-term capital gain for the DuPont Capital Emerging Markets Fund .
The DuPont Capital Emerging Markets Fund paid foreign taxes and recognized foreign source income as follows:
Foreign Taxes Paid | Foreign Source Income | |
| $96,038 | $1,303,675 |
All designations are based on financial information available as of the date of this annual report and, accordingly, are subject to change. For each item, it is the intention of the DuPont Capital Emerging Markets Fund and the DuPont Capital Emerging Markets Debt Fund to designate the maximum amount permitted under the Internal Revenue Code of 1986, as amended, and the regulations thereunder.
Because the Funds’ fiscal year is not the calendar year, another notification will be sent with respect to calendar year 2017. The second notification, which will reflect the amount, if any, to be used by calendar year taxpayers on their U.S. federal income tax returns, will be made in conjunction with Form 1099-DIV and will be mailed in January 2018.
42
DUPONT CAPITAL FUNDS
Shareholder Tax Information
(Unaudited)
Foreign shareholders will generally be subject to U.S. withholding tax on the amount of their ordinary income dividends. They will generally not be entitled to a foreign tax credit or deduction for the withholding taxes paid by the Funds, if any.
In general, dividends received by tax-exempt recipients (e.g., IRAs and Keoghs) need not be reported as taxable income for U.S. federal income tax purposes. However, some retirement trusts (e.g., corporate, Keogh and 403(b)(7) plans) may need this information for their annual information reporting.
Shareholders are advised to consult their own tax advisers with respect to the tax consequences of their investment in the Funds.
43
DUPONT CAPITAL FUNDS
Other Information
(Unaudited)
Proxy Voting
Policies and procedures that the Funds use to determine how to vote proxies relating to portfolio securities as well as information regarding how the Funds voted proxies relating to portfolio securities for the most recent 12-month period ended June 30 are available without charge, upon request, by calling (888) 447-0014 and on the Securities and Exchange Commission’s (“SEC”) website at http:// www.sec.gov.
Quarterly Portfolio Schedules
The Trust files its complete schedule of portfolio holdings with the SEC for the first and third fiscal quarters of each fiscal year (quarters ended July 31 and January 31) on Form N-Q. The Trust’s Forms N-Q are available on the SEC’s website at http://www.sec.gov and may be reviewed and copied at the SEC’s Public Reference Room in Washington, D.C. Information on the operation of the SEC’s Public Reference Room may be obtained by calling 1-800-SEC-0330.
44
DUPONT CAPITAL FUNDS
Privacy Notice
(Unaudited)
The privacy of your personal financial information is extremely important to us. When you open an account with us, we collect a significant amount of information from you in order to properly invest and administer your account. We take very seriously the obligation to keep that information private and confidential, and we want you to know how we protect that important information.
We collect nonpublic personal information about you from applications or other forms you complete and from your transactions with us or our affiliates. We do not disclose information about you, or our former clients, to our affiliates or to service providers or other third parties, except as permitted by law. We share only the information required to properly administer your accounts, which enables us to send transaction confirmations, monthly or quarterly statements, financials and tax forms. Even within FundVantage Trust and its affiliated entities, a limited number of people who actually service accounts will have access to your personal financial information. Further, we do not share information about our current or former clients with any outside marketing groups or sales entities.
To ensure the highest degree of security and confidentiality, FundVantage Trust and its affiliates maintain various physical, electronic and procedural safeguards to protect your personal information. We also apply special measures for authentication of information you request or submit to us on our web site.
If you have questions or comments about our privacy practices, please call us at (888) 447-0014.
45
DUPONT CAPITAL FUNDS
Fund Management
(Unaudited)
FundVantage Trust (the “Trust”) is governed by a Board of Trustees (the “Trustees”). The primary responsibility of the Trustees is to represent the interest of the Trust’s shareholders and to provide oversight management of the Trust.
The following tables present certain information regarding the Board of Trustees and officers of the Trust. None of the Trustees are an “interested person” of the Trust, the Adviser, another investment adviser of a series of the Trust, or Foreside Funds Distributors LLC, the principal underwriter of the Trust (“Underwriter”), within the meaning of the 1940 Act and each Trustee is referred to as an “Independent Trustee” and is listed under such heading below. The address of each Trustee and Officer as it relates to the Trust’s business is 301 Bellevue Parkway, 2nd Floor, Wilmington, DE 19809.
The Statement of Additional Information for each Fund contains additional information about the Trustees and is available, without charge, upon request by calling (888) 447-0014.
| Name and Date of Birth | Position(s) Held with Trust | Term of Office and Length of Time Served | Principal Occupation(s) During Past Five Years |
Number of
| Other Directorships Held by Trustee | |||||
INDEPENDENT TRUSTEES | ||||||||||
ROBERT J. CHRISTIAN Date of Birth: 2/49 | Trustee and Chairman of the Board | Shall serve until death, resignation or removal. Trustee and Chairman since 2007. | Retired since February 2006; Executive Vice President of Wilmington Trust Company from February 1996 to February 2006; President of Rodney Square Management Corporation (“RSMC”) (investment advisory firm) from 1996 to 2005; Vice President of RSMC from 2005 to 2006.
| 42 | Optimum Fund Trust (registered investment company with 6 portfolios). | |||||
IQBAL MANSUR Date of Birth: 6/55 | Trustee | Shall serve until death, resignation or removal. Trustee since 2007.
| University Professor, Widener University. | 42 | None. | |||||
46
DUPONT CAPITAL FUNDS
Fund Management (Continued)
(Unaudited)
Name and Date of Birth | Position(s) Held with Trust | Term of Office and Length of Time Served | Principal Occupation(s) During Past Five Years |
Number of | Other Directorships Held by Trustee | |||||
NICHOLAS M. MARSINI, JR. Date of Birth: 8/55 | Trustee | Shall serve until death, resignation or removal. Trustee since 2016. | Retired since March 2016. President of PNC Bank Delaware from June 2011 to March 2016; Executive Vice President Finance of BNY Mellon from July 2010 to January 2011; Executive Vice President and Chief Financial Officer of PNC Global Investment Servicing from September 1997 to July 2010.
| 42 | Brinker Capital Destinations Trust (registered investment company with 10 portfolios). | |||||
STEPHEN M. WYNNE Date of Birth: 1/55 | Trustee | Shall serve until death, resignation or removal. Trustee since 2009. | Retired since December 2010; Chief Executive Officer of US Funds Services, BNY Mellon Asset Servicing from July 2010 to December 2010; Chief Executive Officer of PNC Global Investment Servicing from March 2008 to July 2010; President, PNC Global Investment Servicing from 2003 to 2008. | 42 | Copeland Trust (registered investment company with 2 portfolios). Context Capital Funds (registered investment company with 1 portfolio).
| |||||
NANCY B. WOLCOTT Date of Birth: 11/54 | Trustee | Shall serve until death, resignation or removal. Trustee since 2011. | Retired since May 2014; EVP, Head of GFI Client Service Delivery, BNY Mellon from January 2012 to May 2014; EVP, Head of US Funds Services, BNY Mellon from July 2010 to January 2012; President of PNC Global Investment Servicing from 2008 to July 2010; Chief Operating Officer of PNC Global Investment Servicing from 2007 to 2008; Executive Vice President of PFPC Worldwide Inc. from 2006 to 2007.
| 42 | None. | |||||
47
DUPONT CAPITAL FUNDS
Fund Management (Concluded)
(Unaudited)
Name and Date of Birth | Position(s) Held with Trust |
Term of Office and Length of Time Served | Principal Occupation(s) During Past Five Years | |||
EXECUTIVE OFFICERS
| ||||||
JOEL L. WEISS Date of Birth: 1/63 | President and Chief Executive Officer | Shall serve until death, resignation or removal. Officer since 2007. | President of JW Fund Management LLC since June 2016; Vice President and Managing Director of BNY Mellon Investment Servicing (US) Inc. and predecessor firms from 1993 to June 2016.
| |||
T. RICHARD KEYES Date of Birth: 1/57 | Treasurer and Chief Financial Officer | Shall serve until death, resignation or removal. Officer since 2016. | President of TRK Fund Consulting since July 2016; Head of Tax — U.S. Fund Services of BNY Mellon Investment Servicing (US) Inc. and predecessor firms from February 2006 to July 2016.
| |||
VINCENZO A. SCARDUZIO Date of Birth: 4/72 | Secretary | Shall serve until death, resignation or removal. Officer since 2012. | Director and Vice President Regulatory Administration of BNY Mellon Investment Servicing (US) Inc. and predecessor firms since 2001.
| |||
DAVID C. LEBISKY Date of Birth: 5/72 | Chief Compliance Officer and Anti-Money Laundering Officer | Shall serve until death, resignation or removal. Officer since 2015. | President of Lebisky Compliance Consulting LLC since October 2015; Senior Consultant, Freeh Group International Solutions, LLC (a global risk management firm) since 2015; Scotia Institutional Investments US, LP, Director of Regulatory Administration from 2010 to 2014.
| |||
48
[THIS PAGE INTENTIONALLY LEFT BLANK.]
[THIS PAGE INTENTIONALLY LEFT BLANK.]
[THIS PAGE INTENTIONALLY LEFT BLANK.]
Investment Adviser
DuPont Capital Management Corporation
One Righter Parkway
Suite 3200
Wilmington, DE 19803
Administrator
BNY Mellon Investment Servicing (US) Inc.
301 Bellevue Parkway
Wilmington, DE 19809
Transfer Agent
BNY Mellon Investment Servicing (US) Inc.
4400 Computer Drive
Westborough, MA 01581
Principal Underwriter
Foreside Funds Distributors LLC
400 Berwyn Park
899 Cassatt Road
Berwyn, PA 19312
Custodian
The Bank of New York Mellon
225 Liberty Street
New York, NY 10286
Independent Registered Public Accounting Firm
PricewaterhouseCoopers LLP
Two Commerce Square, Suite 1800
2001 Market Street
Philadelphia, PA 19103-7042
Legal Counsel
Pepper Hamilton LLP 3000
Two Logan Square
18th and Arch Streets
Philadelphia, PA 19103
DUP-0417
DUPONTCAPITAL EMERGING MARKETS FUND
DUPONT CAPITAL EMERGING MARKETS DEBT FUND
of
FundVantage Trust
Class I
ANNUAL REPORT
April 31, 2017
This report is submitted for the general information of the shareholders of the DuPont Capital Emerging Markets Fund and the DuPont Capital Emerging Markets Debt Fund. It is not authorized for distribution unless preceded or accompanied by a current prospectus for the DuPont Capital Emerging Markets Fund and the DuPont Capital Emerging Markets Debt Fund.

EIC VALUE FUND
Annual Investment Adviser’s Report
April 30, 2017
(Unaudited)
Dear Fellow Shareholder,
Thank you for reviewing our annual report. In it, we discuss our perspective on the market, the EIC Value Fund’s (the “Fund”) performance, and some of our recent purchase and sale activity in the Fund. A listing of the Fund’s investments and other financial information follow our comments.
Perspective on the Market
For the twelve months ended April 30, 2017, the S&P 500® Index gained 17.9%. It has been especially strong since the November election, rising 13.0% in less than six months.
In our view, the market’s advance has been powered by optimism about the future rather than fundamental progress in the present. This seemed to be true even before the election – over the past five years the S&P 500® has nearly doubled, while corporate earnings have made very little real progress, even with a significant boost from financial engineering. Since the election, optimism has gone into overdrive with hopes for regulatory relief, tax reform, and ultimately higher earnings growth. Whether or not such post-election optimism is warranted, stock prices today seem to already reflect much of this potential for improvement.
We have no particular insight into what will happen on the tax or regulatory front. Ours is not a forecasting-based approach. That is, we don’t attempt to forecast macroeconomic factors like tax rates, interest rates, gross domestic product, inflation, currency relationships, employment levels, oil prices, etc. It’s not in our skill set. We don’t believe predictions like these can be made with low enough error rates to justify basing investment decisions on them. Instead, we build portfolios from the bottom up, one stock at a time. While some of the proposals being discussed would be favorable for investors, such as a reduction in corporate tax rates and a decrease in regulation, some of the other proposals are less clear as to their benefits for investors. Regardless of the eventual outcomes, recent market performance suggests to us that investors may have already priced in much of the perceived future benefits. Bottom line: we don’t spend much time trying to predict the future. Instead, as we are fond of saying, we try to protect against it.
With that as backdrop, we find today’s market expensive – one in which it is difficult for us to find attractively priced investment opportunities. Elevated equity prices may result in painful pullbacks, but perhaps a greater, more certain risk of high prices is the imbedding of possible subpar future returns. Therefore, in times of high valuations, it is especially important for us to diligently apply the non-valuation steps in our investment process – seek to avoid companies with value-trap characteristics, critically scrutinize reported earnings and financial conditions so as not to capitalize unrepeatable earnings, and diversify our exposures among companies, industries and sectors so that unexpected developments have limited effect.
Of particular concern for evaluating earnings today are the dual impacts of financial engineering and pro-forma accounting. As we’ve mentioned before, we think the use of financial engineering has been widespread – in particular, companies are taking advantage of low interest rates to increase leverage for “accretive” opportunities, primarily share buy-backs and acquisitions. Normally, earnings accretion suggests an attractive purchase price, but in today’s environment, it suggests a low financing cost, which may or may not persist. We are avoiding the worst offenders – companies who are taking on more leverage than prudent in order to show near-term earnings progress. Similarly, we continue to be skeptical of many of the pro-forma accounting adjustments managements use to present results
1
EIC VALUE FUND
Annual Investment Adviser’s Report (Continued)
April 30, 2017
(Unaudited)
without considering the impact of all its costs. Some adjustments are reasonable, but we believe many of these costs should be factored in rather than excluded, and we often incorporate lower earnings estimates than management (and accommodating Wall Street analysts) in our own valuation work.
Given this market environment, we continue to carry relatively high levels of cash – 18% of the Fund as of April 30, 2017. We harvested a few tax losses late in April in order to reduce the Fund’s tax liability, which temporarily raised cash levels a few percentage points higher than they would otherwise be. Cash is primarily a function of the availability of undervalued stocks. It is a residual of our stock selection process and not a tactical allocation. Rather, as valuations rise and cause us to sell stocks from the Fund, we will leave the proceeds in cash if we aren’t able to find suitable replacements. As has happened in previous periods with fairly high cash levels, we have often worked cash down without large declines in the market. We only need displacements in areas that represent quality and value to us.
Overall, we view this as a difficult time to invest in the stock market. Precisely because it is difficult, however, we believe our work and continued diligence is likely to prove worthwhile for Fund shareholders. Especially in a time like this, we will continue to exercise caution, prioritizing risk management over trying to outpace a strongly advancing market.
Fund Performance
Our investment philosophy is straightforward: we believe the key to long-term investment success is avoiding significant losses. This is partly because of simple math – an investor suffering a 50% loss (as many did when the tech bubble burst in 2001 – 2002 and the credit crisis hit in 2008 – 2009) needs to earn 100% just to get back to breakeven. In contrast, an investor losing, say, 25% “only” needs to make 33% to get back to breakeven. It is also because of psychology – a large loss undermines investor confidence and may result in selling to reduce the pain at the most inopportune time. But practically, it is because for many investors the goal of investing is not to maximize some indefinite, far-into-the-future ending value of their portfolio. Rather, their objective is to maintain a given level of spending to support their lifestyle, while avoiding a loss of principal.
In meeting the Fund’s investment objective of long-term capital appreciation, we seek to achieve strong returns over a full market cycle with lower-than-market volatility. Shorter term, there can be, and often is, considerable noise in performance results. In particular, the Fund often looks and performs quite differently than the market indices and other equity mutual funds. But we don’t pay too much attention to shorter-term performance. Rather, we plan to stick to our investment discipline, investing where value leads, with the goal of producing long-term returns that exhibit less volatility than those of the market indices and our peers.
In addition to the stock market’s volatility, another risk investors often face is their own behavior. Investors tend to buy at market peaks, succumbing to greed and excessive optimism, and sell at market bottoms, capitulating at exactly the wrong time. This so-called “behavior gap” results in returns that are far lower than what could have been achieved otherwise. Numerous studies have confirmed that investors typically earn less than underlying mutual funds and market indices due to poor timing decisions, as allocations increase after good results, only to be reduced following weak results. Minimizing this gap between fund returns and investor returns is critical to achieving long-term investment success.
2
EIC VALUE FUND
Annual Investment Adviser’s Report (Continued)
April 30, 2017
(Unaudited)
We have tried to lessen the gap by reducing volatility in the Fund in order to produce a more stable pattern of returns, rather than focusing on short-term results versus market indices. We believe low volatility is critical because it can reduce the range of outcomes and thereby increase the frequency of earning a targeted long-term return.
In this context, the Fund’s performance has been consistent with our historical pattern of returns – we typically perform relatively well in down markets, do better than expected during market recoveries, and lag late cycle when valuations are stretched. For the year ended April 30, 2017, the Fund’s Institutional Class shares gained 11.4% net of expenses. The Russell 3000® Value Index, the Fund’s primary benchmark, rose 17.3%, while the S&P 500® Index increased 17.9%.
Performance attribution for the twelve-month period follows. Fund results are compared to the Russell 3000® Value Index.
The Fund’s cash position continues to be high, 18% at the end of April, because we find few compelling bargains in today’s market. Given the market’s advance, cash has been the largest factor contributing to the Fund’s shortfall over the last twelve months.
We don’t target sector weightings, either in an absolute sense or relative to market indices; they are instead principally a residual of stock selection. Nevertheless, it is at times instructive to see how sector allocations affected performance. On balance, they were a positive contributor to Fund performance.
All eleven sectors in the Russell 3000® Value Index posted positive returns for the twelve months ended April 30, 2017. Information technology was the top performing sector, gaining 34.6%. Financials were next in line, rising 28.2%, followed by industrials, up 22.8%, and materials, up 20.8%. We were overweight technology but underweight finance (though it was our largest nominal sector allocation), industrials, and materials relative to the index.
In contrast, energy was the worst performing sector, increasing just 1.0%, followed by telecommunication services, up 3.5%, real estate, up 8.6%, and consumer discretionary, up 11.0%. Fortunately, we were underweight all except consumer discretionary. In particular, our significant underweight in energy – the Fund’s average allocation was 6.9%, versus 12.5% for the index – helped performance.
Our security selection in the consumer staples sector was also a plus. The Fund’s holdings gained a combined 16.1%, compared to 12.5% for the index’s consumer staples stocks. Whole Foods, up 27.4%, Wal-Mart Stores, up 15.7%, and PepsiCo, up 13.2%, were the Fund’s standout performers in this sector. Other Fund holdings of note included Taiwan Semiconductor, up 45.5%, Charles Schwab, up 43.5%, Microsoft, up 40.9%, PNC Financial Services, up 39.5%, and SunTrust Banks, up 39.0%.
On the other hand, our security selection in the consumer discretionary sector adversely affected Fund performance. More specifically, a 10.4% increase from Honda was not enough to offset an 8.2% decline from Bed Bath & Beyond,
The performance data quoted represents past performance and does not guarantee future results. The investment return and principal value of an investment in the Fund will fluctuate so that an investor s shares, when redeemed, may be worth more or less than their original cost. Current performance may be lower or higher. Performance data current to the most recent month-end may be obtained by calling (855) 430-6487.
3
EIC VALUE FUND
Annual Investment Adviser’s Report (Continued)
April 30, 2017
(Unaudited)
which we sold in June of 2016 after the company reported disappointing results, and a 27.4% loss from Target, which we continue to hold. Target fell sharply on weak fourth quarter results and lowered 2017 guidance. In response, management is taking steps to compete for market share and restart growth by lowering everyday prices and moving away from promotional activity; accelerating the redesign of current stores; investing in the rollout of multiple proprietary brands, an area where the firm has had prior success; and continued opening of smaller stores in larger cities. While we welcome management’s willingness to address competitive pressures and reset expectations, it will be at least several quarters before we can determine whether Target is on the right track. In the meantime, we continue to maintain a relatively small position in the stock.
Diamond Offshore Drilling has also been a noteworthy contributor to the Fund’s performance shortfall over the twelve-month period. Diamond is a leader in offshore drilling, providing contract drilling services to the energy industry around the globe, with a diversified fleet of rigs including shallow-water jack-ups, mid-water and deep-water semi-submersibles, and deep-water and ultra-deep-water drill ships. The firm has done an admirable job of managing costs amid the decline in oil prices from their 2014 highs. Nevertheless, the stock has declined amid general weakness in the energy sector and on news that one of its clients, Petrobras, the semi-public Brazilian oil company, intends to cancel its contract for one of Diamond’s semi-submersible drilling rigs. Despite the potential loss of an important contract – it’s currently being contested in court – Diamond has maintained its strong financial position. It’s the best capitalized company in its industry, even before considering the financial strength of its majority shareholder, Loews Corporation, and has an ample order backlog. Overall, we’re comfortable with the steps management is taking to strengthen the company’s competitive position, while being mindful of the risks it and its industry still face.
Portfolio Activity
Here’s a recap of some of our recent purchase and sale activity, beginning with purchases.
Within the energy sector, we bought ConocoPhillips in November of 2016, while selling Chevron. This trade represented a reversal of our trade in the fall of 2015, when we sold Conoco and added to Chevron, driven, in part, by our concern that Conoco’s dividend was unsustainable. Since then, Conoco has, in fact, cut its dividend and also reduced capital spending to a level commensurate with its operating cash flow – steps we consider prudent. While Chevron has outperformed Conoco by 50% since our prior trade, we believe the policies followed by Conoco’s management are the more prudent under current circumstances, and relative risks in each investment are a mirror image of what they were in the fall of 2015.
We also bought small new positions in drug wholesaler McKesson and drugstore operator and pharmacy benefit manager CVS Health in November of 2016, while trimming our existing position in pharmacy benefit manager Express Scripts. Both wholesalers and PBMs have been pressured by a number of concerns: 1) negative publicity (and fear of it spreading) related to specialty-pharma abuses and certain generic-drug pricing, 2) a slow-down in pharma price inflation, which pressures margins within these businesses, and 3) uncertainty of how profits will be impacted by changing health care laws and regulations. We believe the resulting stock-price declines have created an attractive entry point and offer good compensation for the risks undertaken today, but that limiting our exposure to company-specific risks via small position sizes is prudent.
4
EIC VALUE FUND
Annual Investment Adviser’s Report (Continued)
April 30, 2017
(Unaudited)
In the first few months of 2017, we added to existing positions in Verizon Communications, ConocoPhillips, McKesson, CVS Health, and GlaxoSmithKline. We sold the rest of our position in Express Scripts at the same time we added to McKesson and CVS Health, the net of which we believe gives us more attractive exposure within the pharmaceutical distribution and procurement space.
We also established a new position in United Parcel Service (UPS) in March of 2017. UPS is a package delivery firm and has considerable leverage from the continuing growth of online retail sales. The company has high quality characteristics, including a mid-teens operating margin, return on capital in excess of 20%, and strong cash flow. UPS reported somewhat softer than expected fourth quarter earnings and full year 2017 guidance, and the stock fell on that announcement to what we viewed as an attractive entry point.
We’ll turn now to sales activity.
We trimmed our financial sector positions in Charles Schwab and PNC Financial in November of 2016. Both stocks rose sharply post-election on expectations of higher interest rates, lower taxes, and reduced regulation. We believe the stock-price increases warranted moderating our exposure.
In February of 2017, we sold the rest of our position in Charles Schwab, which continued to rise and reached our assessment of full value. We held Charles Schwab only a little over a year, having purchased it in February of 2016, and it was a strong performer, increasing more than 50% during that period. In addition, we trimmed several other financial holdings, including American Express, SunTrust, US Bank and Wells Fargo, all of which have put up solid gains, especially post-election.
In the consumer staples sector, we trimmed PepsiCo and Proctor & Gamble, which have performed well, in order to reduce our exposure to price risk. We also trimmed our position in Wal-Mart, which has also performed relatively well but continues to face a difficult retail environment.
Finally, we executed a number of trades late in April in order to reduce the Fund’s tax liability. More specifically, we harvested tax losses from several holdings to offset some of the Fund’s realized capital gains, investing most of the proceeds in a couple of ETFs as temporary substitutes. We plan to reverse the trades after 30 days, in accordance with the Internal Revenue Service’s wash-sale rule.
One of the hallmarks of our approach is the attention we pay to the tax implications of our investment decisions. To that end, we use a full array of tax-management techniques to minimize the Fund’s tax liability, including low turnover, deferral of gain-recognition until long-term when possible, and pro-active tax-loss harvesting throughout the year. Taxes can impact returns more than the typical manager’s alpha or investment management fee. Thus, we consider tax management a valuable yet often under-appreciated skill, one that we believe differentiates us from many of our peers.
This letter is intended to assist shareholders in understanding how the Fund performed during the twelve months ended April 30, 2017 and reflects the views of the investment adviser at the time of this writing. Of course, these views may change and do not guarantee the future performance of the Fund or the markets.
5
EIC VALUE FUND
Annual Investment Adviser’s Report (Concluded)
April 30, 2017
(Unaudited)
The above commentary is for informational purposes only and does not represent an offer, recommendation or solicitation to buy, hold or sell any security. The specific securities identified and described do not represent all of the securities purchased or sold and you should not assume that investments in the securities identified and discussed will be profitable.
Portfolio composition is subject to change. The current and future portfolio holdings of the Fund are subject to investment risk.
6
EIC VALUE FUND
Annual Report
Performance Data
April 30, 2017
(Unaudited)
Comparison of Change in Value of $10,000 Investment in EIC Value Fund’s Class A
vs. Russell 3000® Value Index and S&P 500® Index
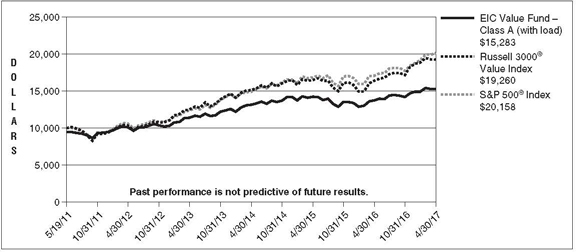
Class A of an assumed $10,000 investment is adjusted for the maximum sales charge of 5.50%. This results in a net investment of $9,450. Performance of Class C will vary from Class A due to differences in class-specific fees.
Average Annual Total Returns for the Periods Ended April 30, 2017 |
| |||||||||||||||
| 1 Year | 3 Years | 5 Years | Since Inception* | |||||||||||||
Class A (with sales charge) | 5.00% | 3.15% | 7.39% | 7.39% | ||||||||||||
Class A (without sales charge) | 11.13% | 5.11% | 8.61% | 8.41% | ||||||||||||
Russell 3000® Value Index | 17.33% | 8.29% | 13.28% | 11.44%** | ||||||||||||
S&P 500® Index | 17.92% | 10.47% | 13.68% | 12.49%** | ||||||||||||
Class C (with CDSC charge) | 9.35% | 4.36% | 7.82% | 8.11% | ||||||||||||
Class C (without CDSC charge) | 10.35% | 4.36% | 7.82% | 8.11% | ||||||||||||
Russell 3000® Value Index | 17.33% | 8.29% | 13.28% | 12.57%** | ||||||||||||
S&P 500® Index
|
| 17.92%
|
|
| 10.47%
|
|
| 13.68%
|
|
| 13.38%**
|
| ||||
| * | Class A and Class C of the EIC Value Fund (the “Fund”) commenced operations on May 19, 2011 and July 18, 2011, respectively. |
| ** | Benchmark performance is from commencement date of the Class only and is not the commencement date of the benchmark itself. |
The performance data quoted represents past performance and does not guarantee future results. The investment return and principal value of an investment in the Fund will fluctuate so that an investor’s shares, when redeemed, may be worth more or less than their original cost. The graph and table do not reflect the deduction of taxes that a shareholder would pay on Fund distributions or redemption of Fund shares. Current performance may be lower or higher. Performance data current to the most recent month-end may be obtained by calling (855) 430-6487.
7
EIC VALUE FUND
Annual Report
Performance Data (Continued)
April 30, 2017
(Unaudited)
Comparison of Change in Value of $100,000 (investment minimum) Investment in
EIC Value Fund’s Institutional Class
vs. Russell 3000® Value Index and S&P 500® Index
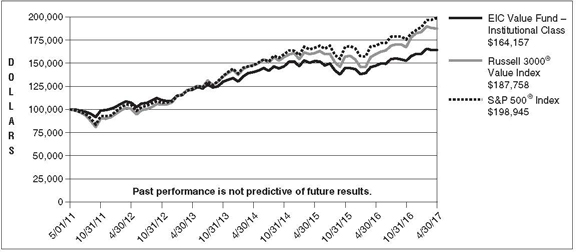
Average Annual Total Returns for the Periods Ended April 30, 2017 |
| |||||||||||||||
| 1 Year | 3 Years | 5 Years | Since Inception* | |||||||||||||
Institutional Class | 11.40% | 5.41% | 8.89% | 8.61% | ||||||||||||
Russell 3000® Value Index | 17.33% | 8.29% | 13.28% | 11.06% | ** | |||||||||||
S&P500® Index
|
| 17.92%
|
|
| 10.47%
|
|
| 13.68%
|
|
| 12.13%
| **
| ||||
| * | Institutional Class shares of the EIC Value Fund (the “Fund”) inception date was April 29, 2011. Operations commenced on May 1, 2011. |
| ** | Benchmark performance is from commencement date of the Class only and is not the commencement date of the benchmark itself. |
The performance data quoted represents past performance and does not guarantee future results. The investment return and principal value of an investment in the Fund will fluctuate so that an investor’s shares, when redeemed, may be worth more or less than their original cost. The graph and table do not reflect the deduction of taxes that a shareholder would pay on Fund distributions or redemption of Fund shares. Current performance may be lower or higher. Performance data current to the most recent month-end may be obtained by calling (855) 430-6487.
8
EIC VALUE FUND
Annual Report
Performance Data (Concluded)
April 30, 2017
(Unaudited)
The returns shown for Class A shares reflect a deduction for the maximum front-end sales charge of 5.50%. The returns shown for Class C shares reflect a maximum deferred sales charge of 1.00%. All of the Fund’s share classes apply a 2.00% fee to the value of shares redeemed within 30 days of purchase. This redemption fee is not reflected in the returns shown above. The Fund’s “Total Annual Fund Operating Expenses” and “Total Annual Fund Operating Expenses after Recoupment”, as stated in the current prospectus dated September 1, 2016, are 1.24% and 1.28% for Class A shares, 1.99% and 2.03% for Class C shares and 0.99% and 1.03% for Institutional Class shares, respectively, of the Fund Class’ average daily net assets. The ratios may differ from the actual expenses incurred by the Fund for the period covered by this report. Equity Investment Corporation (the “Adviser”) has contractually agreed to waive or otherwise reduce its annual compensation received from the Fund to the extent necessary to ensure that the Fund’s “Total Annual Fund Operating Expenses,” excluding taxes, any class-specific fees and expenses (such as Rule 12b-1 distribution fees or shareholder service fees), “Acquired Fund” fees and expenses, interest, extraordinary items and brokerage commissions, do not exceed 1.00% of average daily net assets of the Fund (the “Expense Limitation”). The Expense Limitation will remain in place until August 31, 2017, unless the Board of Trustees of FundVantage Trust (“the Trust”) approves its earlier termination. Subject to approval by the Board of Trustees, the Adviser may recoup any expenses or fees it has reimbursed within a three-year period from the year in which the Adviser reduced its compensation and/or assumed expenses of the Fund. The Adviser is permitted to seek reimbursement from the Fund, subject to certain limitations, for fees it waived and Fund expenses it paid to the extent the total annual fund operating expenses do not exceed the limits described above or any lesser limits in effect at the time of reimbursement. No recoupment will occur unless the Fund’s expenses are below the Expense Limitation amount. Total returns would be lower had such fees and expenses not been waived and/or reimbursed.
Mutual fund investing involves risk, including possible loss of principal. Value investing involves the risk that the Fund’s investing in companies believed to be undervalued will not appreciate as anticipated. The Fund may invest in the stocks of smaller- and medium-sized companies which may be more vulnerable to adverse business or economic events than larger, more established companies.
The Fund intends to evaluate performance as compared to that of the Standard & Poor’s 500 (“S&P 500®”) Index and the Russell 3000® Value Index. The S&P 500® is a widely recognized, unmanaged index of 500 common stocks which are generally representative of the U.S. stock market as a whole. The Russell 3000® Value Index is an unmanaged index that measures the performance of the 3,000 largest U.S. stocks, representing about 98% of the total capitalization of the entire U.S. stock market. It is impossible to invest directly in an index.
9
EIC VALUE FUND
Fund Expense Disclosure
April 30, 2017
(Unaudited)
As a shareholder of the Fund, you incur two types of costs: (1) transaction costs including sales charges (loads) on purchase payments (if any) or redemption fees; and (2) ongoing costs, including management fees, distribution and/or service (Rule 12b-1) fees (if any) and other Fund expenses. These examples are intended to help you understand your ongoing costs (in dollars) of investing in the Fund and to compare these costs with the ongoing costs of investing in other mutual funds.
These examples are based on an investment of $1,000 invested at the beginning of the six-month period from November 1, 2016 through April 30, 2017 and held for the entire period.
Actual Expenses
The first line of each accompanying table provides information about actual account values and actual expenses. You may use the information in this line, together with the amount you invested, to estimate the expenses that you paid over the period. Simply divide your account value by $1,000 (for example, an $8,600 account value divided by $1,000 = 8.6), then multiply the result by the number in the first line under the heading entitled “Expenses Paid During Period” to estimate the expenses you paid on your account during this period.
Hypothetical Examples for Comparison Purposes
The second line of each accompanying table provides information about hypothetical account values and hypothetical expenses based on the Fund’s actual expense ratio and an assumed rate of return of 5% per year before expenses, which is not your Fund’s actual return. The hypothetical account values and expenses may not be used to estimate the actual ending account balance or expenses you paid for the period. You may use this information to compare the ongoing costs of investing in the Fund and other funds. To do so, compare these 5% hypothetical examples with the 5% hypothetical examples that appear in the shareholder reports of other funds.
Please note that the expenses shown in the accompanying tables are meant to highlight your ongoing costs only and do not reflect any transactional costs, such as sales charges (loads) on purchase payments (if any) or redemption fees. Therefore, the second line of each accompanying table is useful in comparing ongoing costs only, and will not help you determine the relative total costs of owning different funds. In addition, if these transactional costs were included, your costs would have been higher.
10
EIC VALUE FUND
Fund Expense Disclosure (Concluded)
April 30, 2017
(Unaudited)
| EIC Value Fund | |||||||||||||||
Beginning Account Value |
Ending Account Value |
Expenses Paid | |||||||||||||
Class A | |||||||||||||||
Actual | $1,000.00 | $1,075.00 | $ 6.23 | ||||||||||||
Hypothetical (5% return before expenses) | 1,000.00 | 1,018.79 | 6.06 | ||||||||||||
Class C | |||||||||||||||
Actual | $1,000.00 | $1,071.80 | $10.07 | ||||||||||||
Hypothetical (5% return before expenses) | 1,000.00 | 1,015.08 | 9.79 | ||||||||||||
Institutional Class | |||||||||||||||
Actual | $1,000.00 | $1,076.90 | $ 4.94 | ||||||||||||
Hypothetical (5% return before expenses) | 1,000.00 | 1,020.03 | 4.81 | ||||||||||||
| * | Expenses are equal to the Fund’s annualized expense ratio for the six-month period ended April 30, 2017 of 1.21%, 1.96%, and 0.96% for Class A, Class C, and Institutional Class shares, respectively, multiplied by the average account value over the period, multiplied by the number of days in the most recent period (181), then divided by 365 to reflect the period. The Fund’s ending account values on the first line in each table are based on the actual six-month total returns for the Fund of 7.50%, 7.18%, and 7.69% for Class A, Class C, and Institutional Class shares, respectively. |
11
EIC VALUE FUND
Portfolio Holdings Summary Table
April 30, 2017
(Unaudited)
The following table presents a summary by sector of the portfolio holdings of the Fund:
| % of Net Assets | Value | |||||||
COMMON STOCKS: | ||||||||
Financial | 21.2 | % | $ | 57,125,483 | ||||
Consumer, Non-cyclical | 17.0 | 45,778,579 | ||||||
Consumer, Cyclical | 9.8 | 26,324,588 | ||||||
Energy | 6.2 | 16,657,642 | ||||||
Communications | 5.9 | 15,899,165 | ||||||
Technology | 5.1 | 13,786,182 | ||||||
Utilities | 3.6 | 9,692,418 | ||||||
Basic Materials | 3.3 | 8,748,756 | ||||||
Industrial | 2.9 | 7,688,763 | ||||||
REITs-Diversified | 1.6 | 4,328,956 | ||||||
REITs-Office Property | 1.1 | 2,997,952 | ||||||
Exchange Traded Funds | 7.3 | 19,509,304 | ||||||
Short-Term Investment | 18.2 | 49,080,307 | ||||||
Liabilities in Excess of Other Assets | (3.2 | ) | (8,597,102 | ) | ||||
|
|
|
| |||||
NET ASSETS | 100.0 | % | $ | 269,020,993 | ||||
|
|
|
| |||||
Portfolio holdings are subject to change at any time.
The accompanying notes are an integral part of the financial statements.
12
EIC VALUE FUND
Portfolio of Investments
April 30, 2017
| Number of Shares | Value | |||||||
COMMON STOCKS — 77.7% |
| |||||||
Basic Materials — 3.3% |
| |||||||
PPG Industries, Inc. | 79,650 | $ | 8,748,756 | |||||
|
| |||||||
Communications — 5.9% |
| |||||||
Cisco Systems, Inc. | 175,930 | 5,993,935 | ||||||
eBay, Inc.* | 296,475 | 9,905,230 | ||||||
|
| |||||||
| 15,899,165 | ||||||||
|
| |||||||
Consumer, Cyclical — 9.8% |
| |||||||
CVS Health Corp. | 93,450 | 7,704,018 | ||||||
Honda Motor Co. Ltd., SP ADR | 45,850 | 1,334,235 | ||||||
Target Corp. | 125,925 | 7,032,911 | ||||||
Wal-mart Stores, Inc. | 136,385 | 10,253,424 | ||||||
|
| |||||||
| 26,324,588 | ||||||||
|
| |||||||
Consumer, Non-cyclical — 17.0% |
| |||||||
GlaxoSmithKline PLC, SP ADR | 235,875 | 9,647,288 | ||||||
Johnson & Johnson | 58,950 | 7,278,556 | ||||||
Medtronic PLC | 105,625 | 8,776,381 | ||||||
Pepsico, Inc. | 75,350 | 8,535,648 | ||||||
Procter & Gamble Co. (The) | 63,115 | 5,511,833 | ||||||
Whole Foods Market, Inc. | 165,765 | 6,028,873 | ||||||
|
| |||||||
| 45,778,579 | ||||||||
|
| |||||||
Energy — 6.2% |
| |||||||
ConocoPhillips | 164,225 | 7,868,020 | ||||||
Exxon Mobil Corp. | 107,650 | 8,789,622 | ||||||
|
| |||||||
| 16,657,642 | ||||||||
|
| |||||||
Financial — 21.2% |
| |||||||
American Express Co. | 113,595 | 9,002,404 | ||||||
Franklin Resources, Inc. | 46,150 | 1,989,526 | ||||||
PNC Financial Services | 75,935 | 9,093,216 | ||||||
SunTrust Banks, Inc. | 102,630 | 5,830,410 | ||||||
| Number of Shares | Value | |||||||
COMMON STOCKS — (Continued) |
| |||||||
Financial — (Continued) | ||||||||
Torchmark Corp. | 72,705 | $ | 5,577,201 | |||||
Travelers Cos, Inc. (The) | 73,665 | 8,962,084 | ||||||
US Bancorp | 163,875 | 8,403,510 | ||||||
Wells Fargo & Co. | 153,550 | 8,267,132 | ||||||
|
| |||||||
| 57,125,483 | ||||||||
|
| |||||||
Industrial — 2.9% |
| |||||||
United Parcel Service, Inc., Class-B | 71,550 | 7,688,763 | ||||||
|
| |||||||
REITs-Diversified — 1.6% |
| |||||||
Annaly Capital | 366,550 | 4,328,956 | ||||||
|
| |||||||
REITs-Office Property — 1.1% |
| |||||||
Mack-Cali Realty Corp. REIT | 110,830 | 2,997,952 | ||||||
|
| |||||||
Technology — 5.1% |
| |||||||
Microsoft Corp. | 109,385 | 7,488,497 | ||||||
Taiwan Semiconductor Manufacturing Co., Ltd., | 190,435 | 6,297,685 | ||||||
|
| |||||||
| 13,786,182 | ||||||||
|
| |||||||
Utilities — 3.6% |
| |||||||
Exelon Corp. | 279,885 | 9,692,418 | ||||||
|
| |||||||
TOTAL COMMON STOCKS (Cost $156,569,833) | 209,028,484 | |||||||
|
| |||||||
EXCHANGE TRADED FUNDS — 7.3% |
| |||||||
Energy Select Sector | 84,400 | 5,725,696 | ||||||
iShares Russell 1000 Value ETF | 120,150 | 13,783,608 | ||||||
|
| |||||||
TOTAL EXCHANGE | 19,509,304 | |||||||
|
| |||||||
The accompanying notes are an integral part of the financial statements.
13
EIC VALUE FUND
Portfolio of Investments (Concluded)
April 30, 2017
| Number of Shares | Value | |||||||
SHORT-TERM INVESTMENT — 18.2% |
| |||||||
Money Market Fund — 18.2% |
| |||||||
Dreyfus Institutional | 49,080,307 | $ | 49,080,307 | |||||
|
| |||||||
TOTAL SHORT-TERM INVESTMENT | 49,080,307 | |||||||
|
| |||||||
TOTAL INVESTMENTS - 103.2% (Cost $225,198,366) | 277,618,095 | |||||||
LIABILITIES IN EXCESS | (8,597,102 | ) | ||||||
|
| |||||||
NET ASSETS - 100.0% |
$ |
269,020,993 |
| |||||
|
| |||||||
| * | Non-income producing. |
| (a) | Rate periodically changes. Rate disclosed is the daily yield on April 30, 2017. |
PLC | Public Limited Company | |
REIT | Real Estate Investment Trust | |
SP ADR | Sponsored American Depository Receipt | |
SPDR | Standard & Poor’s Depository Receipt |
The accompanying notes are an integral part of the financial statements.
14
EIC VALUE FUND
Statement of Assets and Liabilities
April 30, 2017
Assets | ||||
Investments, at value (Cost $225,198,366) | $ | 277,618,095 | ||
Receivable for investments sold | 30,439,481 | |||
Receivable for capital shares sold | 454,666 | |||
Dividends receivable | 269,129 | |||
Prepaid expenses and other assets | 79,678 | |||
|
| |||
Total assets | 308,861,049 | |||
|
| |||
Liabilities | ||||
Payable for investments purchased | 19,548,226 | |||
Payable for capital shares redeemed | 19,947,402 | |||
Payable to Adviser | 177,956 | |||
Payable for transfer agent fees | 41,193 | |||
Payable for distribution fees | 38,977 | |||
Payable for administration and accounting fees | 24,506 | |||
Payable for legal fees | 10,288 | |||
Payable for shareholder servicing fees | 9,350 | |||
Payable for custodian fees | 6,982 | |||
Accrued expenses | 35,176 | |||
|
| |||
Total liabilities | 39,840,056 | |||
|
| |||
Net Assets | $ | 269,020,993 | ||
|
| |||
Net Assets Consisted of: | ||||
Capital stock, $0.01 par value | $ | 189,208 | ||
Paid-in capital | 209,460,807 | |||
Accumulated net investment income | 742,745 | |||
Accumulated net realized gain from investments | 6,208,504 | |||
Net unrealized appreciation on investments | 52,419,729 | |||
|
| |||
Net Assets | $ | 269,020,993 | ||
|
|
Class A: | ||||
Net asset value, redemption price per share | $ | 14.22 | ||
|
| |||
Maximum offering price per share (100/94.5 of $14.22) | $ | 15.05 | ||
|
| |||
Class C: | ||||
Net asset value, offering and redemption price per share | $ | 14.06 | ||
|
| |||
Institutional Class: | ||||
Net asset value, offering and redemption price per share | $ | 14.26 | ||
|
|
The accompanying notes are an integral part of the financial statements.
15
EIC VALUE FUND
Statement of Operations
For the Year Ended April 30, 2017
Investment Income | ||||
Dividends | $ | 6,708,636 | ||
Less: foreign taxes withheld | (83,112 | ) | ||
|
| |||
Total investment income | 6,625,524 | |||
|
| |||
Expenses | ||||
Advisory fees (Note 2) | 2,270,429 | |||
Distribution fees (Class C) (Note 2) | 366,645 | |||
Administration and accounting fees (Note 2) | 174,404 | |||
Distribution fees (Class A) (Note 2) | 145,746 | |||
Transfer agent fees (Note 2) | 144,547 | |||
Shareholder servicing fees (Class C) (Note 2) | 122,215 | |||
Registration and filing fees | 66,131 | |||
Legal fees | 47,969 | |||
Trustees’ and officers’ fees (Note 2) | 45,317 | |||
Printing and shareholder reporting fees | 38,291 | |||
Custodian fees (Note 2) | 31,725 | |||
Audit fees | 29,872 | |||
Other expenses | 42,503 | |||
|
| |||
Total expenses | 3,525,794 | |||
|
| |||
Net investment income | 3,099,730 | |||
|
| |||
Net realized and unrealized gain from investments: | ||||
Net realized gain from investments | 10,832,252 | |||
Net change in unrealized appreciation/(depreciation) on investments | 18,832,954 | |||
|
| |||
Net realized and unrealized gain on investments | 29,665,206 | |||
|
| |||
Net increase in net assets resulting from operations | $ | 32,764,936 | ||
|
|
The accompanying notes are an integral part of the financial statements.
16
EIC VALUE FUND
Statements of Changes in Net Assets
| For the Year Ended April 30, 2017 | For the Year Ended April 30, 2016 | |||||||
Increase/(Decrease) in net assets from operations: | ||||||||
Net investment income | $ | 3,099,730 | $ | 2,706,079 | ||||
Net realized gain/(loss) from investments | 10,832,252 | (486,551 | ) | |||||
Net change in unrealized appreciation/(depreciation) on investments | 18,832,954 | (13,745,752 | ) | |||||
|
|
|
| |||||
Net increase/(decrease) in net assets resulting from operations | 32,764,936 | (11,526,224 | ) | |||||
|
|
|
| |||||
Less Dividends and Distributions to Shareholders from: | ||||||||
Net investment income: | ||||||||
Class A | (441,269 | ) | (732,542 | ) | ||||
Class C | (7,146 | ) | (147,071 | ) | ||||
Institutional Class | (2,061,543 | ) | (2,258,668 | ) | ||||
|
|
|
| |||||
Total net investment income | (2,509,958 | ) | (3,138,281 | ) | ||||
|
|
|
| |||||
Net realized capital gains: | ||||||||
Class A | (561,066 | ) | (1,409,072 | ) | ||||
Class C | (479,439 | ) | (1,111,461 | ) | ||||
Institutional Class | (1,934,616 | ) | (3,416,089 | ) | ||||
|
|
|
| |||||
Total net realized capital gains | (2,975,121 | ) | (5,936,622 | ) | ||||
|
|
|
| |||||
Net decrease in net assets from dividends and distributions to shareholders | (5,485,079 | ) | (9,074,903 | ) | ||||
|
|
|
| |||||
Decrease in Net Assets Derived from Capital Share Transactions (Note 4) | (72,071,384 | ) | (3,478,118 | ) | ||||
|
|
|
| |||||
Total decrease in net assets | (44,791,527 | ) | (24,079,245 | ) | ||||
|
|
|
| |||||
Net assets | ||||||||
Beginning of year | 313,812,520 | 337,891,765 | ||||||
|
|
|
| |||||
End of year | $ | 269,020,993 | $ | 313,812,520 | ||||
|
|
|
| |||||
Accumulated net investment income, end of year | $ | 742,745 | $ | 462,946 | ||||
|
|
|
| |||||
The accompanying notes are an integral part of the financial statements.
17
EIC VALUE FUND
Financial Highlights
Contained below is per share operating performance data for Class A shares outstanding, total investment return, ratios to average net assets and other supplemental data for the respective period. The total returns in the table represent the rate that an investor would have earned or lost on an investment in the Fund (assuming reinvestment of all dividends and distributions). This information has been derived from information provided in the financial statements and should be read in conjunction with the financial statements and the notes thereto.
| Class A | ||||||||||||||||||||
| For the | For the | For the | For the | For the | ||||||||||||||||
| Year | Year | Year | Year | Year | ||||||||||||||||
| Ended | Ended | Ended | Ended | Ended | ||||||||||||||||
| April 30, | April 30, | April 30, | April 30, | April 30, | ||||||||||||||||
| 2017 | 2016 | 2015 | 2014 | 2013 | ||||||||||||||||
Per Share Operating Performance | ||||||||||||||||||||
Net asset value, beginning of year | $ | 13.02 | $ | 13.91 | $ | 13.37 | $ | 11.91 | $ | 10.65 | ||||||||||
|
|
|
|
|
|
|
|
|
| |||||||||||
Net investment income(1) | 0.13 | 0.11 | 0.12 | 0.12 | 0.12 | |||||||||||||||
Net realized and unrealized gain/(loss) on investments | 1.32 | (0.60 | ) | 0.98 | 1.70 | 1.22 | ||||||||||||||
|
|
|
|
|
|
|
|
|
| |||||||||||
Net increase/(decrease) in net assets resulting from operations | 1.45 | (0.49 | ) | 1.10 | 1.82 | 1.34 | ||||||||||||||
|
|
|
|
|
|
|
|
|
| |||||||||||
Dividends and distributions to shareholders from: | ||||||||||||||||||||
Net investment income | (0.11 | ) | (0.14 | ) | (0.10 | ) | (0.11 | ) | (0.08 | ) | ||||||||||
Net realized capital gains | (0.14 | ) | (0.26 | ) | (0.46 | ) | (0.25 | ) | — | (2) | ||||||||||
|
|
|
|
|
|
|
|
|
| |||||||||||
Total dividends and distributions to shareholders | (0.25 | ) | (0.40 | ) | (0.56 | ) | (0.36 | ) | (0.08 | ) | ||||||||||
|
|
|
|
|
|
|
|
|
| |||||||||||
Redemption fees | — | — | (2) | — | (2) | — | (2) | — | (2) | |||||||||||
|
|
|
|
|
|
|
|
|
| |||||||||||
Net asset value, end of year | $ | 14.22 | $ | 13.02 | $ | 13.91 | $ | 13.37 | $ | 11.91 | ||||||||||
|
|
|
|
|
|
|
|
|
| |||||||||||
Total investment return(3) | 11.13 | % | (3.44 | )% | 8.22 | % | 15.46 | % | 12.73 | % | ||||||||||
Ratio/Supplemental Data | ||||||||||||||||||||
Net assets, end of year (in thousands) | $ | 52,845 | $ | 65,882 | $ | 85,653 | $ | 130,805 | $ | 83,932 | ||||||||||
Ratio of expenses to average net assets | 1.20 | % | 1.25 | % | 1.25 | % | 1.25 | % | 1.25 | % | ||||||||||
Ratio of expenses to average net assets without waivers, expense reimbursements and recoupments, if any(4) | 1.20 | % | 1.21 | % | 1.18 | % | 1.24 | % | 1.35 | % | ||||||||||
Ratio of net investment income to average net assets | 0.98 | % | 0.85 | % | 0.90 | % | 0.95 | % | 1.12 | % | ||||||||||
Portfolio turnover rate | 28.92 | % | 34.03 | % | 26.89 | % | 19.08 | % | 12.06 | % | ||||||||||
| (1) | The selected per share data was calculated using the average shares outstanding method for the year. |
| (2) | Amount is less than $0.005 per share. |
| (3) | Total investment return is calculated assuming a purchase of shares on the first day and a sale of shares on the last day of each period reported and includes reinvestment of dividends and distributions, if any. Total investment return does not reflect the impact of the maximum front-end sales load of 5.50%. If reflected, the return would be lower. |
| (4) | During the period, certain fees were waived, reimbursed and/or recouped. If such fee waivers, reimbursements and/or recoupments had not occurred, the ratios would have been as indicated (See Note 2). |
The accompanying notes are an integral part of the financial statements.
18
EIC VALUE FUND
Financial Highlights
Contained below is per share operating performance data for Class C shares outstanding, total investment return, ratios to average net assets and other supplemental data for the respective period. The total returns in the table represent the rate that an investor would have earned or lost on an investment in the Fund (assuming reinvestment of all dividends and distributions). This information has been derived from information provided in the financial statements and should be read in conjunction with the financial statements and the notes thereto. |
| Class C | ||||||||||||||||||||
| For the Year Ended April 30, 2017 | For the Year Ended April 30, 2016 | For the Year Ended April 30, 2015 | For the Year Ended April 30, 2014 | For the Year Ended April 30, 2013 | ||||||||||||||||
Per Share Operating Performance | ||||||||||||||||||||
Net asset value, beginning of year | $ | 12.87 | $ | 13.75 | $ | 13.24 | $ | 11.84 | $ | 10.61 | ||||||||||
|
|
|
|
|
|
|
|
|
| |||||||||||
Net investment income(1) | 0.03 | 0.01 | 0.02 | 0.03 | 0.04 | |||||||||||||||
Net realized and unrealized gain/(loss) on investments | 1.30 | (0.60 | ) | 0.97 | 1.67 | 1.22 | ||||||||||||||
|
|
|
|
|
|
|
|
|
| |||||||||||
Net increase/(decrease) in net assets resulting from operations | 1.33 | (0.59 | ) | 0.99 | 1.70 | 1.26 | ||||||||||||||
|
|
|
|
|
|
|
|
|
| |||||||||||
Dividends and distributions to shareholders from: | ||||||||||||||||||||
Net investment income | — | (2) | (0.03 | ) | (0.02 | ) | (0.05 | ) | (0.03 | ) | ||||||||||
Net realized capital gains | (0.14 | ) | (0.26 | ) | (0.46 | ) | (0.25 | ) | — | (2) | ||||||||||
|
|
|
|
|
|
|
|
|
| |||||||||||
Total dividends and distributions to shareholders | (0.14 | ) | (0.29 | ) | (0.48 | ) | (0.30 | ) | (0.03 | ) | ||||||||||
|
|
|
|
|
|
|
|
|
| |||||||||||
Redemption fees | — | — | (2) | — | (2) | — | (2) | — | (2) | |||||||||||
|
|
|
|
|
|
|
|
|
| |||||||||||
Net asset value, end of year | $ | 14.06 | $ | 12.87 | $ | 13.75 | $ | 13.24 | $ | 11.84 | ||||||||||
|
|
|
|
|
|
|
|
|
| |||||||||||
Total investment return(3) | 10.35 | % | (4.17 | )% | 7.49 | % | 14.52 | % | 11.93 | % | ||||||||||
Ratio/Supplemental Data | ||||||||||||||||||||
Net assets, end of year (in thousands) | $ | 45,071 | $ | 51,146 | $ | 62,378 | $ | 48,016 | $ | 31,129 | ||||||||||
Ratio of expenses to average net assets | 1.95 | % | 2.00 | % | 2.00 | % | 2.00 | % | 2.00 | % | ||||||||||
Ratio of expenses to average net assets without waivers, expense reimbursements and recoupments, if any(4) | 1.95 | % | 1.96 | % | 1.93 | % | 1.99 | % | 2.10 | % | ||||||||||
Ratio of net investment income to average net assets | 0.23 | % | 0.10 | % | 0.15 | % | 0.21 | % | 0.38 | % | ||||||||||
Portfolio turnover rate | 28.92 | % | 34.03 | % | 26.89 | % | 19.08 | % | 12.06 | % | ||||||||||
| (1) | The selected per share data was calculated using the average shares outstanding method for the year. |
| (2) | Amount is less than $0.005 per share. |
| (3) | Total investment return is calculated assuming a purchase of shares on the first day and a sale of shares on the last day of each period reported and includes reinvestment of dividends and distributions, if any. Total investment return does not reflect any applicable sales charge. |
| (4) | During the period, certain fees were waived, reimbursed and/or recouped. If such fee waivers, reimbursements and/or recoupments had not occurred, the ratios would have been as indicated (See Note 2). |
The accompanying notes are an integral part of the financial statements.
19
EIC VALUE FUND
Financial Highlights
Contained below is per share operating performance data for Institutional Class shares outstanding, total investment return, ratios to average net assets and other supplemental data for the respective period. The total returns in the table represent the rate that an investor would have earned or lost on an investment in the Fund (assuming reinvestment of all dividends and distributions). This information has been derived from information provided in the financial statements and should be read in conjunction with the financial statements and the notes thereto. |
| Institutional Class | ||||||||||||||||||||
| For the Year Ended April 30, 2017 | For the Year Ended April 30, 2016 | For the Year Ended April 30, 2015 | For the Year Ended April 30, 2014 | For the Year Ended April 30, 2013 | ||||||||||||||||
Per Share Operating Performance | ||||||||||||||||||||
Net asset value, beginning of year. | $ | 13.06 | $ | 13.95 | $ | 13.41 | $ | 11.94 | $ | 10.67 | ||||||||||
|
|
|
|
|
|
|
|
|
| |||||||||||
Net investment income(1) | 0.17 | 0.14 | 0.16 | 0.15 | 0.15 | |||||||||||||||
Net realized and unrealized gain/(loss) on investments | 1.32 | (0.60 | ) | 0.98 | 1.70 | 1.22 | ||||||||||||||
|
|
|
|
|
|
|
|
|
| |||||||||||
Net increase/(decrease) in net assets resulting from operations | 1.49 | (0.46 | ) | 1.14 | 1.85 | 1.37 | ||||||||||||||
|
|
|
|
|
|
|
|
|
| |||||||||||
Dividends and distributions to shareholders from: | ||||||||||||||||||||
Net investment income | (0.15 | ) | (0.17 | ) | (0.14 | ) | (0.13 | ) | (0.10 | ) | ||||||||||
Net realized capital gains | (0.14 | ) | (0.26 | ) | (0.46 | ) | (0.25 | ) | — | (2) | ||||||||||
|
|
|
|
|
|
|
|
|
| |||||||||||
Total dividends and distributions to shareholders | (0.29 | ) | (0.43 | ) | (0.60 | ) | (0.38 | ) | (0.10 | ) | ||||||||||
|
|
|
|
|
|
|
|
|
| |||||||||||
Redemption fees | — | — | (2) | — | (2) | — | (2) | — | (2) | |||||||||||
|
|
|
|
|
|
|
|
|
| |||||||||||
Net asset value, end of year | $ | 14.26 | $ | 13.06 | $ | 13.95 | $ | 13.41 | $ | 11.94 | ||||||||||
|
|
|
|
|
|
|
|
|
| |||||||||||
Total investment return(3) | 11.40 | % | (3.15 | )% | 8.54 | % | 15.68 | % | 12.99 | % | ||||||||||
Ratio/Supplemental Data | ||||||||||||||||||||
Net assets, end of year (in thousands) | $ | 171,105 | $ | 196,785 | $ | 189,860 | $ | 75,860 | $ | 53,367 | ||||||||||
Ratio of expenses to average net assets | 0.96 | % | 1.00 | % | 1.00 | % | 1.00 | % | 1.00 | % | ||||||||||
Ratio of expenses to average net assets without waivers, expense reimbursements and recoupments, if any(4) | 0.96 | % | 0.96 | % | 0.93 | % | 0.99 | % | 1.10 | % | ||||||||||
Ratio of net investment income to average net assets | 1.23 | % | 1.10 | % | 1.14 | % | 1.21 | % | 1.37 | % | ||||||||||
Portfolio turnover rate | 28.92 | % | 34.03 | % | 26.89 | % | 19.08 | % | 12.06 | % | ||||||||||
| (1) | The selected per share data was calculated using the average shares outstanding method for the year. |
| (2) | Amount is less than $0.005 per share. |
| (3) | Total investment return is calculated assuming a purchase of shares on the first day and a sale of shares on the last day of each period reported and includes reinvestment of dividends and distributions, if any. |
| (4) | During the period, certain fees were waived, reimbursed and/or recouped. If such fee waivers, reimbursements and/or recoupments had not occurred, the ratios would have been as indicated (See Note 2). |
The accompanying notes are an integral part of the financial statements.
20
EIC VALUE FUND
Notes to Financial Statements
April 30, 2017
1. Organization and Significant Accounting Policies
The EIC Value Fund (the “Fund”) is a diversified, open-end management investment company registered under the Investment Company Act of 1940, as amended (the “1940 Act”), which commenced operations on May 1, 2011. The Fund is a separate series of FundVantage Trust (the “Trust”) which was organized as a Delaware statutory trust on August 28, 2006. The Trust is a “series trust” authorized to issue an unlimited number of separate series or classes of shares of beneficial interest. Each series is treated as a separate entity for certain matters under the 1940 Act, and for other purposes, and a shareholder of one series is not deemed to be a shareholder of any other series. The Fund offers separate classes of shares, Class A, Class C, Institutional Class and Retail Class shares. Class A shares are sold subject to a front-end sales charge. Front-end sales charges may be reduced or waived under certain circumstances. A contingent deferred sales charge (“CDSC”) may be applicable to the redemption of Class A shares. A CDSC, as a percentage of the lower of the original purchase price or net asset value at redemption, of up to 1.00% may be imposed on full or partial redemptions of Class A shares made within eighteen months of purchase where $1 million or more of Class A shares were purchased without an initial sales charge and (ii) the Fund’s principal underwriter, Foreside Funds Distributors LLC (the “Underwriter”), paid a commission to the selling broker-dealer for such sale. A CDSC of up to 1.00% is assessed on redemptions of Class C Shares made within eighteen months after a purchase. As of April 30, 2017, the Retail Class Shares have not been issued.
The Fund is an investment company and follows accounting and reporting guidance in the Financial Accounting Standards Board Accounting Standards Codification Topic 946.
Portfolio Valuation — The Fund’s net asset value (“NAV”) is calculated once daily at the close of regular trading hours on the New York Stock Exchange (“NYSE”) (typically 4:00 p.m. Eastern time) on each day the NYSE is open. Securities held by the Fund are valued using the closing price or the last sale price on a national securities exchange or the National Association of Securities Dealers Automatic Quotation System (“NASDAQ”) market system where they are primarily traded. Equity securities traded in the over-the-counter market are valued at their closing prices. If there were no transactions on that day, securities traded principally on an exchange or on NASDAQ will be valued at the mean of the last bid and ask prices prior to the market close. Investments in other open-end investment companies are valued based on the NAV of the investment companies (which may use fair value pricing as discussed in their prospectuses). If market quotations are unavailable or deemed unreliable, securities will be valued in accordance with procedures adopted by the Trust’s Board of Trustees. Relying on prices supplied by pricing services or dealers or using fair valuation may result in values that are higher or lower than the values used by other investment companies and investors to price the same investments. In the event that market quotes are not readily available, and the security or asset cannot be valued pursuant to one of the valuation methods, the value of the security or asset will be determined in good faith by the Adviser. The Trust has established a Valuation Committee which performs certain functions including the oversight of the Adviser’s fair valuation determinations.
21
EIC VALUE FUND
Notes to Financial Statements (Continued)
April 30, 2017
Fair Value Measurements — The inputs and valuation techniques used to measure fair value of the Fund’s investments are summarized into three levels as described in the hierarchy below:
| • Level 1 — | quoted prices in active markets for identical securities; |
| • Level 2 — | other significant observable inputs (including quoted prices for similar securities, interest rates, prepayment speeds, credit risk, etc.); and |
| • Level 3 — | significant unobservable inputs (including the Fund’s own assumptions in determining the fair value of investments). |
The inputs or methodology used for valuing securities are not necessarily an indication of the risk associated with investing in those securities.
The following is a summary of the inputs used, as of April 30, 2017, in valuing the Fund’s investments carried at fair value:
| Total Value at 04/30/17 | Level 1 Quoted Prices | Level 2 Other Significant Observable Inputs | Level 3 Significant Unobservable Inputs | |||||||||||||
Common Stocks* | $ | 209,028,484 | $ | 209,028,484 | $ | — | $ | — | ||||||||
Exchange Traded Funds | 19,509,304 | 19,509,304 | — | — | ||||||||||||
Short-Term Investment | 49,080,307 | 49,080,307 | — | — | ||||||||||||
|
|
|
|
|
|
|
| |||||||||
Total Investments | $ | 277,618,095 | $ | 277,618,095 | $ | — | $ | — | ||||||||
|
|
|
|
|
|
|
| |||||||||
| * | Please refer to Portfolio of Investments for further details on portfolio holdings. |
At the end of each quarter, management evaluates the classification of Levels 1, 2 and 3 assets and liabilities. Various factors are considered, such as changes in liquidity from the prior reporting period; whether or not a broker is willing to execute at the quoted price; the depth and consistency of prices from third party pricing services; and the existence of contemporaneous, observable trades in the market. Additionally, management evaluates the classification of Level 1 and Level 2 assets and liabilities on a quarterly basis for changes in listings or delistings on national exchanges.
Due to the inherent uncertainty of determining the fair value of investments that do not have a readily available market value, the fair value of the Fund’s investments may fluctuate from period to period. Additionally, the fair value of investments may differ significantly from the values that would have been used had a ready market existed for such investments and may differ materially from the values the Fund may ultimately realize. Further, such investments may be subject to legal and other restrictions on resale or are otherwise less liquid than publicly traded securities.
22
EIC VALUE FUND
Notes to Financial Statements (Continued)
April 30, 2017
For fair valuations using significant unobservable inputs, U.S. generally accepted accounting principles (“U.S. GAAP”) require the Fund to present a reconciliation of the beginning to ending balances for reported market values that presents changes attributable to total realized and unrealized gains or losses, purchase and sales, and transfers in and out of Level 3 during the period. Transfers in and out between Levels are based on values at the end of the period. U.S. GAAP also requires the Fund to disclose amounts and reasons for all transfers in and out of Level 1 and Level 2 fair value measurements. A reconciliation of Level 3 investments is presented only when the Fund had an amount of Level 3 investments at the end of the reporting period that was meaningful in relation to its net assets. The amounts and reasons for all transfers in and out of each Level within the three-tier hierarchy are disclosed when the Fund had an amount of total transfers during the reporting period that was meaningful in relation to its net assets as of the end of the reporting period.
For the year ended April 30, 2017, there were no transfers between Levels 1, 2 and 3 for the Fund.
Use of Estimates — The preparation of financial statements in conformity with U.S. GAAP requires management to make estimates and assumptions that affect the amounts reported in the financial statements and accompanying notes at the date of the financial statements and the reported amounts of revenues and expenses during the period. Actual results could differ from those estimates and those differences could be material.
Investment Transactions, Investment Income and Expenses — Investment transactions are recorded on trade date for financial statement preparation purposes. Realized gains and losses on investments sold are recorded on the identified cost basis. Interest income is recorded on the accrual basis. Dividends are recorded on the ex-dividend date. Estimated components of distributions received from real estate investment trusts may be considered income, return of capital distributions or capital gain distributions. Return of capital distributions are recorded as a reduction of cost of the related investments. Distribution (12b-1) fees and shareholder services fees relating to a specific class are charged directly to that class. General expenses of the Trust are generally allocated to each fund in proportion to its relative daily net assets. Expenses directly attributable to a particular fund in the Trust are charged directly to that fund. The Fund’s investment income, expenses (other than class-specific expenses) and unrealized and realized gains and losses are allocated daily to each class of shares based upon the relative proportion of net assets of each class at the beginning of the day.
Dividends and Distributions to Shareholders — Dividends from net investment income and distributions from net realized capital gains, if any, are declared, recorded on ex-date and paid at least annually to shareholders. Income dividends and capital gain distributions are determined in accordance with U.S. federal income tax regulations, which may differ from U.S. GAAP. These differences may include the treatment of non-taxable dividends, expiring capital loss carryforwards and losses deferred due to wash sales and excise tax regulations. Permanent book and tax basis differences relating to shareholder distributions will result in reclassifications within the components of net assets.
23
EIC VALUE FUND
Notes to Financial Statements (Continued)
April 30, 2017
U.S. Tax Status — No provision is made for U.S. income taxes as it is the Fund’s intention to continue to qualify for and elect the tax treatment applicable to regulated investment companies under Subchapter M of the Internal Revenue Code of 1986, as amended (the “Internal Revenue Code”), and make the requisite distributions to its shareholders which will be sufficient to relieve it from U.S. income and excise taxes.
Other — In the normal course of business, the Fund may enter into contracts that provide general indemnifications. The Fund’s maximum exposure under these arrangements is dependent on claims that may be made against the Fund in the future, and therefore, cannot be estimated; however, based on experience, the risk of material loss for such claims is considered remote.
Recent Accounting Pronouncement — In October 2016, the U.S. Securities and Exchange Commission (“SEC”) issued a new rule, Investment Company Reporting Modernization, which, among other provisions, amends Regulation S-X to require standardized, enhanced disclosures, particularly related to derivatives, in investment company financial statements. Compliance with the amendments to Regulation S-X is required for financial statements ending on or after August 1, 2017. Management is currently evaluating the impact that the amendments will have on the Fund’s financial statements and related disclosures.
2. Transactions with Related Parties and Other Service Providers
Equity Investment Corporation (“EIC” or the “Adviser”) serves as investment adviser to the Fund pursuant to an investment advisory agreement with the Trust (the “Advisory Agreement”). For its services, the Adviser is paid a monthly fee at the annual rate of 0.75% of the Fund’s average daily net assets under $500 million; 0.65% of the Fund’s average daily net assets of $500 million or more but less than $1 billion; and 0.50% of the Fund’s average daily net assets of $1 billion and over. Prior to January 11, 2017, the Advisor was paid a monthly fee at the annual rate of 0.75% of average daily net assets. The Adviser has contractually agreed to waive or otherwise reduce its annual compensation received from the Fund to the extent necessary to ensure that the Fund’s “Total Annual Fund Operating Expenses,” excluding taxes, any class-specific fees and expenses (such as Rule 12b-1 distribution fees or shareholder service fees), “Acquired Fund” fees and expenses, interest, extraordinary items and brokerage commissions, do not exceed 1.00% of average daily net assets of the Fund (the “Expense Limitation”). The Expense Limitation will remain in place until August 31, 2017, unless the Board of Trustees approves its earlier termination. Subject to approval by the Board of Trustees, the Adviser may recoup any expenses or fees it has reimbursed within a three-year period from the year in which the Adviser reduced its compensation and/or assumed expenses of the Fund. The Adviser is permitted to seek reimbursement from the Fund, subject to certain limitations, for fees it waived and Fund expenses it paid to the extent the total annual Fund expenses do not exceed the limits described above or any lesser limits in effect at the time of reimbursement. No recoupment will occur unless the Fund’s expenses are below the Expense Limitation amount. As of April 30, 2017, there were no reimbursed expenses or fees waived subject to recoupment.
24
EIC VALUE FUND
Notes to Financial Statements (Continued)
April 30, 2017
For the year ended April 30, 2017, the Adviser earned advisory fees of $2,270,429.
Other Service Providers
BNY Mellon Investment Servicing (US) Inc. (“BNY Mellon”) serves as administrator and transfer agent for the Fund. For providing administrative and accounting services, BNY Mellon is entitled to receive a monthly fee equal to an annual percentage rate of the Fund’s average daily net assets, subject to certain minimum monthly fees. For providing transfer agent services, BNY Mellon is entitled to receive a monthly fee, subject to certain minimum, and out of pocket expenses.
The Bank of New York Mellon (the “Custodian”) provides certain custodial services to the Fund. The Custodian is entitled to receive a monthly fee, subject to certain minimum, and out of pocket expenses.
Foreside Funds Distributors LLC (the “Underwriter”) provides principal underwriting services to the Fund.
The Trust and the Underwriter are parties to an underwriting agreement. The Trust has adopted a distribution plan for Class A and Class C shares in accordance with Rule 12b-1 under the 1940 Act. Pursuant to the Class A and Class C shares plan, the Fund compensates the Underwriter for direct and indirect costs and expenses incurred in connection with advertising, marketing and other distribution services in an amount not to exceed 0.25% and 1.00% (0.75% Rule 12b-1 distribution fee and 0.25% shareholder service fee) on an annualized basis of the average daily net assets of the Fund’s Class A and Class C shares, respectively.
Trustees and Officers
The Trust is governed by its Board of Trustees. The Trustees receive compensation in the form of an annual retainer and per meeting fees for their services to the Trust. The remuneration paid to the Trustees by the Fund during the year ended April 30, 2017 was $29,700. An employee of BNY Mellon serves as the Secretary of the Trust and is not compensated by the Fund or the Trust.
Effective June 1, 2016 and July 1, 2016, JW Fund Management LLC (“JWFM”) provides a Principal Executive Officer and Principal Financial Officer, respectively, to the Trust. JWFM is compensated for the services provided to the Trust. Until May 31, 2016 and June 30, 2016, certain employees of BNY Mellon served as Principal Executive Officer and Principal Financial Officer, respectively, to the Trust. They were not compensated by the Trust or the Fund.
Freeh Group International Solutions, LLC provides the Trust with a Chief Compliance Officer and an Anti-Money Laundering Officer.
25
EIC VALUE FUND
Notes to Financial Statements (Continued)
April 30, 2017
3. Investment in Securities
For the year ended April 30, 2017, aggregate purchases and sales of investment securities (excluding short-term investments) of the Fund were as follows:
| Purchases | Sales | |||||||
Investment Securities | $ | 73,742,913 | $ | 139,778,214 | ||||
4. Capital Share Transactions
For the years ended April 30, 2017 and April 30, 2016, transactions in capital shares (authorized shares unlimited) were as follows:
| For the Year Ended April 30, 2017 | For the Year Ended April 30, 2016 | |||||||||||||||
Shares |
Amount |
Shares |
Amount | |||||||||||||
Class A | ||||||||||||||||
Sales | 304,802 | $ | 4,156,508 | 857,572 | $ | 11,438,619 | ||||||||||
Reinvestments | 61,211 | 855,113 | 147,895 | 1,860,520 | ||||||||||||
Redemption Fees* | — | — | — | 1,173 | ||||||||||||
Redemptions | (1,709,753 | ) | (23,347,918 | ) | (2,103,805 | ) | (27,595,274 | ) | ||||||||
|
|
|
|
|
|
|
| |||||||||
Net decrease | (1,343,740 | ) | $ | (18,336,297 | ) | (1,098,338 | ) | $ | (14,294,962 | ) | ||||||
|
|
|
|
|
|
|
| |||||||||
Class C | ||||||||||||||||
Sales | 208,761 | $ | 2,789,000 | 323,756 | $ | 4,227,322 | ||||||||||
Reinvestments | 32,695 | 452,503 | 93,907 | 1,171,014 | ||||||||||||
Redemption Fees* | — | — | — | 916 | ||||||||||||
Redemptions | (1,008,675 | ) | (13,659,998 | ) | (981,575 | ) | (12,691,541 | ) | ||||||||
|
|
|
|
|
|
|
| |||||||||
Net decrease | (767,219 | ) | $ | (10,418,495 | ) | (563,912 | ) | $ | (7,292,289 | ) | ||||||
|
|
|
|
|
|
|
| |||||||||
Institutional Class | ||||||||||||||||
Sales | 3,889,085 | $ | 52,740,110 | 6,677,541 | $ | 86,642,713 | ||||||||||
Reinvestments | 270,584 | 3,785,470 | 424,318 | 5,346,409 | ||||||||||||
Redemption Fees* | — | — | — | 3,156 | ||||||||||||
Redemptions | (7,230,654 | ) | (99,842,172 | ) | (5,639,081 | ) | (73,883,145 | ) | ||||||||
|
|
|
|
|
|
|
| |||||||||
Net increase/(decrease) | (3,070,985 | ) | $ | (43,316,592 | ) | 1,462,778 | $ | 18,109,133 | ||||||||
|
|
|
|
|
|
|
| |||||||||
Total net decrease | (5,181,944 | ) | $ | (72,071,384 | ) | (199,472 | ) | $ | (3,478,118 | ) | ||||||
|
|
|
|
|
|
|
| |||||||||
| * | There is a 2.00% redemption fee that may be charged on shares redeemed which have been held for 30 days or less. The redemption fees are retained by the Fund for the benefit of the remaining shareholders and recorded as paid-in-capital. |
26
EIC VALUE FUND
Notes to Financial Statements (Continued)
April 30, 2017
5. Federal Tax Information
The Fund has followed the authoritative guidance on accounting for and disclosure of uncertainty in tax positions, which requires the Fund to determine whether a tax position is more likely than not to be sustained upon examination, including resolution of any related appeals or litigation processes, based on the technical merits of the position. The Fund has determined that there was no effect on the financial statements from following this authoritative guidance. In the normal course of business, the Fund is subject to examination by federal, state and local jurisdictions, where applicable, for tax years for which applicable statutes of limitations have not expired.
Distributions are determined in accordance with federal income tax regulations, which may differ in amount or character from net investment income and realized gains for financial reporting purposes. Accordingly, the character of distributions and composition of net assets for tax purposes may differ from those reflected in the accompanying financial statements. To the extent these differences are permanent, such amounts are reclassified within the components of net assets based on the tax treatment; temporary differences do not require reclassifications. For the year ended April 30, 2017, these adjustments were to increase paid-in capital by $1,472,049, decrease undistributed net investment income by $309,973 and decrease accumulated net realized gain/(loss) by $1,162,076. These permanent differences were primarily attributable to the utilization of earnings and profits on shareholder redemptions (a tax accounting practice known as equalization). Net investment income, net realized losses and net assets were not affected by these adjustments.
For the year ended April 30, 2017, the tax character of distributions paid by the Fund was $2,509,958 of ordinary income dividends and $2,975,121 of long-term capital gains dividends. For the year ended April 30, 2016, the tax character of distributions paid by the Fund was $3,138,300 of ordinary income dividends and $5,936,603 of long-term capital gains dividends. Distributions from net investment income and short term gains are treated as ordinary income for federal income tax purposes.
As of April 30, 2017, the components of distributable earnings on a tax basis were as follows:
Capital Loss | Undistributed | Undistributed | Unrealized | Qualified | ||||
$ — | $742,745 | $6,208,504 | $52,419,729 | $— |
As of April 30, 2017, the federal tax cost, aggregate gross unrealized appreciation and depreciation of securities held by the Fund were as follows:
Federal tax cost | $ | 225,198,366 | ||||
|
| |||||
Gross unrealized appreciation | $ | 52,827,631 | ||||
Gross unrealized depreciation | (407,902 | ) | ||||
|
| |||||
Net unrealized appreciation | $ | 52,419,729 | ||||
|
|
27
EIC VALUE FUND
Notes to Financial Statements (Concluded)
April 30, 2017
Pursuant to federal income tax rules applicable to regulated investment companies, the Fund may elect to treat certain capital losses between November 1 and April 30 and late year ordinary losses ((i) ordinary losses between January 1 and April 30, and (ii) specified ordinary and currency losses between November 1 and April 30) as occurring on the first day of the following tax year. For the year ended April 30, 2017, any amount of losses elected within the tax return will not be recognized for federal income tax purposes until May 1, 2017. For the year ended April 30, 2017, the Fund had no loss deferrals.
Accumulated capital losses represent net capital loss carry forwards as of April 30, 2017 that may be available to offset future realized capital gains and thereby reduce future capital gains distributions. As of April 30, 2017, the Fund did not have any capital loss carryforwards.
During the year ended April 30, 2017, the Fund utilized $215,534 of prior year capital loss carryforwards.
6. Subsequent Events
Management has evaluated the impact of all subsequent events on the Fund through the date the financial statements were issued, and has determined that there were no subsequent events requiring recognition or disclosure in the financial statements.
28
EIC VALUE FUND
Report of Independent Registered Public Accounting Firm
To the Board of Trustees of FundVantage Trust and
Shareholders of the EIC Value Fund:
We have audited the accompanying statement of assets and liabilities, including the portfolio of investments, of the EIC Value Fund (one of the series constituting FundVantage Trust) (the “Fund”) as of April 30, 2017, and the related statement of operations for the year then ended, the statements of changes in net assets for each of the two years in the period then ended, and the financial highlights for each of the five years in the period then ended. These financial statements and financial highlights are the responsibility of the Fund’s management. Our responsibility is to express an opinion on these financial statements and financial highlights based on our audits.
We conducted our audits in accordance with the standards of the Public Company Accounting Oversight Board (United States). Those standards require that we plan and perform the audit to obtain reasonable assurance about whether the financial statements and financial highlights are free of material misstatement. We were not engaged to perform an audit of the Fund’s internal control over financial reporting. Our audits included consideration of internal control over financial reporting as a basis for designing audit procedures that are appropriate in the circumstances, but not for the purpose of expressing an opinion on the effectiveness of the Fund’s internal control over financial reporting. Accordingly, we express no such opinion. An audit also includes examining, on a test basis, evidence supporting the amounts and disclosures in the financial statements and financial highlights, assessing the accounting principles used and significant estimates made by management, and evaluating the overall financial statement presentation. Our procedures included confirmation of securities owned as of April 30, 2017, by correspondence with the custodian and brokers or by other appropriate auditing procedures where replies from brokers were not received. We believe that our audits provide a reasonable basis for our opinion.
In our opinion, the financial statements and financial highlights referred to above present fairly, in all material respects, the financial position of the EIC Value Fund (one of the series constituting FundVantage Trust) at April 30, 2017, the results of its operations for the year then ended, the changes in its net assets for each of the two years in the period then ended, and the financial highlights for each of the five years in the period then ended in conformity with U.S. generally accepted accounting principles.

Philadelphia, Pennsylvania
June 29, 2017
29
EIC VALUE FUND
Shareholder Tax Information
(Unaudited)
The Fund is required by Subchapter M of the Internal Revenue Code to advise its shareholders of the U.S. federal tax status of distributions received by the Fund’s shareholders in respect of such fiscal year. During the fiscal year ended April 30, 2017, the Fund paid $2,509,958 of ordinary income dividends and $2,975,121 of long-term capital gain dividends to its shareholders. Dividends from net investment income and short-term capital gains are treated as ordinary income dividends for federal income tax purposes.
The Fund designates 100.00% of the ordinary income distribution as qualified dividend income pursuant to the Jobs and Growth Tax Relief Reconciliation Act of 2003.
The percentage of ordinary income dividends qualifying for the corporate dividends received deduction is 100.00%.
The percentage of qualified interest income related dividends not subject to withholding tax for non-resident aliens and foreign corporations received is 1.28%.
All designations are based on financial information available as of the date of this annual report and, accordingly, are subject to change. For each item, it is the intention of the Fund to designate the maximum amount permitted under the Internal Revenue Code of 1986, as amended, and the regulations thereunder.
Because the Fund’s fiscal year is not the calendar year, another notification will be sent with respect to calendar year 2017. The second notification, which will reflect the amount, if any, to be used by calendar year taxpayers on their U.S. federal income tax returns, will be made in conjunction with Form 1099-DIV and will be mailed in January 2018.
Foreign shareholders will generally be subject to U.S. withholding tax on the amount of their ordinary income dividends. They will generally not be entitled to a foreign tax credit or deduction for the withholding taxes paid by the Fund, if any.
In general, dividends received by tax-exempt recipients (e.g., IRAs and Keoghs) need not be reported as taxable income for U.S. federal income tax purposes. However, some retirement trusts (e.g., corporate, Keogh and 403(b)(7) plans) may need this information for their annual information reporting.
Shareholders are advised to consult their own tax advisers with respect to the tax consequences of their investment in the Fund.
30
EIC VALUE FUND
Other Information
(Unaudited)
Proxy Voting
Policies and procedures that the Fund uses to determine how to vote proxies relating to portfolio securities as well as information regarding how the Fund voted proxies relating to portfolio securities for the most recent 12-month period ended June 30 are available without charge, upon request, by calling (855) 430-6487 and on the Securities and Exchange Commission’s (“SEC”) website at http;// www.sec.gov.
Quarterly Portfolio Schedules
The Trust files its complete schedule of portfolio holdings with the SEC for the first and third fiscal quarters of each fiscal year (quarters ended July 31 and January 31) on Form N-Q. The Trust’s Forms N-Q are available on the SEC’s website at http://www.sec.gov and may be reviewed and copied at the SEC’s Public Reference Room in Washington, D.C. Information on the operation of the SEC’s Public Reference Room may be obtained by calling 1-800-SEC-0330.
Meeting of Shareholders
A Special Meeting of Shareholders (the “Meeting”) of the EIC Value Fund (the “Fund”) was held on January 11, 2017 for the following purposes:
To approve a new investment advisory agreement between the Trust, on behalf of the Fund, and Equity Investment Corporation (“EIC”) (“Advisory Agreement”).
To permit EIC to retain the fees paid by the Fund to EIC for its investment advisory services provided to the Fund from September 30, 2016 until the date that the Advisory Agreement was approved by Shareholders.
All Fund shareholders of record at the close of business on November 3, 2016 were entitled to attend or submit proxies. As of the record date, the Fund had 21,972,054 shares outstanding. At the meeting, shareholders approved the Advisory Agreement and the retention of fees paid by the Fund to EIC. The results of the voting for the proposal were as follows:
Approval of Advisory Agreement:
For Votes | Against Votes | Abstained Votes | Broker Non-Votes | |||
9,341,394 | 68,021 |
133,192 |
2,121,359 |
Retention of fees paid by the Fund to EIC:
For Votes | Against Votes | Abstained Votes | Broker Non-Votes | |||
9,195,824 |
197,683 |
149,100 |
2,121,359 |
31
EIC VALUE FUND
Privacy Notice
(Unaudited)
The privacy of your personal financial information is extremely important to us. When you open an account with us, we collect a significant amount of information from you in order to properly invest and administer your account. We take very seriously the obligation to keep that information private and confidential, and we want you to know how we protect that important information.
We collect nonpublic personal information about you from applications or other forms you complete and from your transactions with us or our affiliates. We do not disclose information about you, or our former clients, to our affiliates or to service providers or other third parties, except as permitted by law. We share only the information required to properly administer your accounts, which enables us to send transaction confirmations, monthly or quarterly statements, financials and tax forms. Even within FundVantage Trust and its affiliated entities, a limited number of people who actually service accounts will have access to your personal financial information. Further, we do not share information about our current or former clients with any outside marketing groups or sales entities.
To ensure the highest degree of security and confidentiality, FundVantage Trust and its affiliates maintain various physical, electronic and procedural safeguards to protect your personal information. We also apply special measures for authentication of information you request or submit to us on our web site.
If you have questions or comments about our privacy practices, please call us at (855) 430-6487.
32
EIC VALUE FUND
Fund Management
(Unaudited)
FundVantage Trust (the “Trust”) is governed by a Board of Trustees (the “Trustees”). The primary responsibility of the Trustees is to represent the interest of the Trust’s shareholders and to provide oversight management of the Trust.
The following tables present certain information regarding the Board of Trustees and officers of the Trust. None of the Trustees are an “interested person” of the Trust, the Adviser, another investment adviser of a series of the Trust, or Foreside Funds Distributors LLC, the principal underwriter of the Trust (“Underwriter”), within the meaning of the 1940 Act and each Trustee is referred to as an “Independent Trustee” and is listed under such heading below. The address of each Trustee and officer as it relates to the Trust’s business is 301 Bellevue Parkway, 2nd Floor, Wilmington, DE 19809.
The Statement of Additional Information for the Fund contains additional information about the Trustees and is available, without charge, upon request, by calling (855) 430-6487.
Name and Date of Birth | Position(s) Held with Trust | Term of Office and Length of Time Served | Principal Occupation(s) During Past Five Years |
Number of Funds in Trust Complex Overseen by Trustee | Other Held by Trustee | |||||
INDEPENDENT TRUSTEES
| ||||||||||
ROBERT J. CHRISTIAN Date of Birth: 2/49 | Trustee and Chairman of the Board | Shall serve until death, resignation or removal. Trustee and Chairman since 2007. | Retired since February 2006; Executive Vice President of Wilmington Trust Company from February 1996 to February 2006; President of Rodney Square Management Corporation (“RSMC”) (investment advisory firm) from 1996 to 2005; Vice President of RSMC from 2005 to 2006.
| 42 | Optimum Fund Trust (registered investment company with 6 portfolios). | |||||
IQBAL MANSUR Date of Birth: 6/55 | Trustee | Shall serve until death, resignation or removal. Trustee since 2007.
| University Professor, Widener University. | 42 | None. | |||||
33
EIC VALUE FUND
Fund Management (Continued)
(Unaudited)
Name and Date of Birth | Position(s) Held with Trust | Term of Office and Length of Time Served | Principal Occupation(s) During Past Five Years |
Number of Funds in Trust Complex Overseen by Trustee | Other Held by Trustee | |||||
NICHOLAS M. MARSINI, JR. Date of Birth: 8/55 | Trustee | Shall serve until death, resignation or removal. Trustee since 2016. | Retired since March 2016. President of PNC Bank Delaware from June 2011 to March 2016; Executive Vice President Finance of BNY Mellon from July 2010 to January 2011; Executive Vice President and Chief Financial Officer of PNC Global Investment Servicing from September 1997 to July 2010.
| 42 | Brinker Capital Destinations Trust (registered investment company with 10 portfolios). | |||||
STEPHEN M. WYNNE Date of Birth: 1/55 | Trustee | Shall serve until death, resignation or removal. Trustee since 2009. | Retired since December 2010; Chief Executive Officer of US Funds Services, BNY Mellon Asset Servicing from July 2010 to December 2010; Chief Executive Officer of PNC Global Investment Servicing from March 2008 to July 2010; President, PNC Global Investment Servicing from 2003 to 2008. | 42 | Copeland Trust (registered investment company with 2 portfolios). Context Capital Funds (registered investment company with 1 portfolio).
| |||||
NANCY B. WOLCOTT Date of Birth: 11/54 | Trustee | Shall serve until death, resignation or removal. Trustee since 2011. | Retired since May 2014; EVP, Head of GFI Client Service Delivery, BNY Mellon from January 2012 to May 2014; EVP, Head of US Funds Services, BNY Mellon from July 2010 to January 2012; President of PNC Global Investment Servicing from 2008 to July 2010; Chief Operating Officer of PNC Global Investment Servicing from 2007 to 2008; Executive Vice President of PFPC Worldwide Inc. from 2006 to 2007.
| 42 | None. | |||||
34
EIC VALUE FUND
Fund Management (Concluded)
(Unaudited)
Name and Date of Birth | Position(s) Held with Trust |
Term of Office and Length of Time Served
| Principal Occupation(s) During Past Five Years | |||
EXECUTIVE OFFICERS
| ||||||
JOEL L. WEISS Date of Birth: 1/63 | President and Chief Executive Officer | Shall serve until death, resignation or removal. Officer since 2007. | President of JW Fund Management LLC since June 2016; Vice President and Managing Director of BNY Mellon Investment Servicing (US) Inc. and predecessor firms from 1993 to June 2016.
| |||
T. RICHARD KEYES Date of Birth: 1/57 | Treasurer and Chief Financial Officer | Shall serve until death, resignation or removal. Officer since 2016. | President of TRK Fund Consulting since July 2016; Head of Tax-U.S. Fund Services of BNY Mellon Investment Servicing (US) Inc. and predecessor firms from February 2006 to July 2016.
| |||
VINCENZO A. SCARDUZIO Date of Birth: 4/72 | Secretary | Shall serve until death, resignation or removal. Officer since 2012. | Director and Vice President Regulatory Administration of BNY Mellon Investment Servicing (US) Inc. and predecessor firms since 2001.
| |||
DAVID C. LEBISKY Date of Birth: 5/72 | Chief Compliance Officer and Anti-Money Laundering Officer | Shall serve until death, resignation or removal. Officer since 2015. | President of Lebisky Compliance Consulting LLC since October 2015; Senior Consultant, Freeh Group International Solutions, LLC (a global risk management firm) since 2015; Scotia Institutional Investments US, LP, Director of Regulatory Administration from 2010 to 2014.
| |||
35
Investment Adviser
Equity Investment Corporation
3007 Piedmont Road, NE
Suite 200
Atlanta, GA 30305
Administrator
BNY Mellon Investment Servicing (US) Inc.
301 Bellevue Parkway
Wilmington, DE 19809
Transfer Agent
BNY Mellon Investment Servicing (US) Inc.
4400 Computer Drive
Westborough, MA 01581
Principal Underwriter
Foreside Funds Distributors LLC
400 Berwyn Park
899 Cassatt Road
Berwyn, PA 19312
Custodian
The Bank of New York Mellon
225 Liberty Street
New York, NY 10286
Independent Registered Public Accounting Firm
Ernst & Young LLP
One Commerce Square
2005 Market Street, Suite 700
Philadelphia, PA 19103-7096
Legal Counsel
Pepper Hamilton LLP
3000 Two Logan Square
18th and Arch Streets
Philadelphia, PA 19103

of
FundVantage Trust
Class A
Class C
Institutional Class
ANNUAL REPORT
April 30, 2017
This report is submitted for the general information of the shareholders of the EIC Value Fund. It is not authorized for distribution unless preceded or accompanied by a current prospectus for the EIC Value Fund.
EIC-0417
ESTABROOK INVESTMENT GRADE FIXED INCOME FUND
Annual Investment Adviser’s Report
April 30, 2017
(Unaudited)
Dear Shareholders,
We are happy to report that for the fiscal year ending April 30, 2017 the Estabrook Investment Grade Fixed Income Fund (the “Fund”) outperformed the Barclays Intermediate Government/Credit Bond Index (the “Barclays Index”). The Fund returned 3.07% for the year compared to the Barclays Index return of 0.78%. Much like previous years, the Fund was well positioned as credit continued to perform well even in the face of political risks. The slow grind to tighter corporate spread levels was very advantageous for the Fund even as Treasury rates fluctuated in response to rising risks.
This fiscal year was awash in political risks that had investors adjusting in real time to results which contradicted inaccurate polling data. During the fiscal year, 10-Year Treasury Rates increased from 1.83% to 2.28%. Yet intra-year rates were volatile as markets responded to events such as Brexit and the US presidential elections. During the year, rates went as low as 1.36% and as high as 2.63%. Overall the portfolio was well positioned as the interest rate exposure continued to be managed at levels below the Barclays Index. In addition to our short duration position, we took advantage weeks before the US presidential election of newly issued TLAC (total loss-absorbing capacity) floating rate securities which were being issued by financial institutions. We believed these to look very attractive and participated in multiple deals from institutions such as Wells Fargo, Morgan Stanley, and Goldman Sachs. With the surprise victory of President Trump and increases in the Federal Reserve target rate, these types of securities boosted our performance. Some of these securities tightened as much as 45 basis points from their initial offering levels.
As we head into the new fiscal year, we continue to be very attentive to moves in interest rates and credit markets. Most recently, the hopes for tax reforms and fiscal expansion has been put on the sidelines as the Trump Administration continues to be plagued by allegations of improprieties related to Russian interference in the 2016 elections. As a result, we have seen demand for the safety of US Treasuries as interest rates have rallied approximately 40 basis points from the 2.63% level seen in March. We have also seen trades which would benefit from increased inflation resulting from a pro-growth agenda come off. Thus, TIPs (treasury inflation protected securities) break-evens have significantly decreased, steepness of the yield curve (difference between 2 year and 10 year treasuries) has drastically flattened, and the US dollar has weakened drastically. All three indicators have hit levels prior to the Trump victory, thus reversing some of the enthusiasm for a pro-growth agenda. Going forward, we continue to be vigilant with our duration positioning. We continue to maintain an overweight position in credit, yet have decreased that level compared to levels we have held in the previous year.
The performance data quoted represents past performance and does not guarantee future results. The investment return and principal value of an investment in the Fund will fluctuate so that an investor’s shares, when redeemed, may be worth more or less than their original cost. Current performance may be lower or higher. Performance would have been lower without fee waivers in effect. Performance data current to the most recent month-end may be obtained by calling
(888) 447-7443.
1
ESTABROOK INVESTMENT GRADE FIXED INCOME FUND
Annual Investment Adviser’s Report (Concluded)
April 30, 2017
(Unaudited)
Thank you for investing in the Estabrook Investment Grade Fixed Income Fund and please contact us if you have any questions or concerns.
Daniel Oh
Portfolio Manager
This letter is intended to assist shareholders in understanding how the Fund performed during the year ended April 30, 2017 and reflects the views of the investment adviser at the time of this writing. Of course, these views may change and do not guarantee the future performance of the Fund or the markets.
Portfolio composition is subject to change. The current and future portfolio holdings of the Fund are subject to investment risk.
2
ESTABROOK INVESTMENT GRADE FIXED INCOME FUND
Annual Report
Performance Data
April 30, 2017
(Unaudited)
Comparison of Change in Value of $100,000 (investment minimum) Investment in
Estabrook Investment Grade Fixed Income Fund Class I
vs. Barclays Intermediate Government/Credit Bond Index
and Barclays U.S. Aggregate Bond Index
| Average Annual Total Returns for the Periods Ended April 30, 2017 | |||||||||||||||||||||||||
| 1 Year | 3 Years | 5 Years | Since Inception* | ||||||||||||||||||||||
Class I | 3.07 | % | 2.10 | % | 3.09 | % | 3.14 | % | |||||||||||||||||
Barclays Intermediate Government/Credit Bond Index | 0.78 | % | 2.05 | % | 1.82 | % | 2.51 | %** | |||||||||||||||||
Barclays U.S. Aggregate Bond Index | 0.83 | % | 2.66 | % | 2.27 | % | 3.10 | %** | |||||||||||||||||
| * | The Estabrook Investment Grade Fixed Income Fund (the “Fund”) commenced operations on July 23, 2010. |
| ** | Benchmark performance is from the inception date of the Fund only and is not the inception date of the benchmark itself. |
The performance data quoted represents past performance and does not guarantee future results. Current performance may be lower or higher. Performance data current to the most recent month-end may be obtained by calling (888) 447-7443. The investment return and principal value of an investment will fluctuate so that shares, when redeemed, may be worth more or less than their original cost. The graph and table do not reflect the deduction of taxes that a shareholder would pay on Fund distributions or the redemption of Fund shares.
The Fund’s “Total Annual Fund Operating Expenses” and “Total Annual Fund Operating Expenses After Fee Waiver and/or Expense Reimbursement” are 1.41% and 0.70%, respectively, for Class I shares of the Fund’s average daily net assets. These ratios are stated in the current prospectus dated September 1, 2016, and may differ from the actual expenses incurred by the Fund for the period covered by this report. Estabrook Capital Management LLC (the “Adviser”) has contractually agreed to reduce its investment advisory fee and/or reimburse certain expenses
3
ESTABROOK INVESTMENT GRADE FIXED INCOME FUND
Annual Report
Performance Data (Concluded)
April 30, 2017
(Unaudited)
of the Fund to the extent necessary to ensure that the Fund’s total operating expenses, excluding taxes, any class-specific fees and expenses (such as Rule 12-b1 distribution fees, shareholder service fees, or transfer agency fees), “Acquired Fund” fees and expenses, interest, extraordinary items, and brokerage commissions, do not exceed 0.70% (on an annual basis) of the average daily net assets of the Fund (the “Expense Limitation”). The Expense Limitation will remain in place until August 31, 2017, unless the Board of Trustees of FundVantage Trust (the “Trust”) approves its earlier termination. The Adviser is entitled to recover, subject to approval by the Board of Trustees, such amounts reduced or reimbursed for a period of up to three (3) years from the year in which the Adviser reduced its compensation and/or assumed expenses for the Fund. The Adviser is permitted to seek reimbursement from the Fund, subject to certain limitations, for fees it waived and Fund expenses it paid to the extent the total annual fund expenses do not exceed the limits described above or any lesser limits in effect at the time of reimbursement. No recoupment will occur unless the Fund’s expenses are below the Expense Limitation amount.
A 1% redemption fee applies to shares redeemed within 90 days of purchase. This redemption fee is not reflected in the returns shown above.
The Fund intends to evaluate performance as compared to that of the Barclays Intermediate Government/Credit Bond Index (“Barclays Int. Gov./Cr. Index”). The Fund uses the Barclays U.S. Aggregate Bond Index as a secondary index. The Barclays Int. Gov./Cr. Index is an unmanaged market index that tracks performance of intermediate term U.S. government and corporate bonds. The Barclays U.S. Aggregate Bond Index is an intermediate term, broad-based index comprised of most U.S. traded investment grade bonds. Barclays U.S. Aggregate Bond Index covers the USD-denominated, investment-grade (rated Baa3 or above by Moody’s), fixed-rate, and taxable areas of the bond market. This is the broadest measure of the taxable U.S. bond market, including most Treasury, agency, corporate, mortgage-backed, asset-backed, and international dollar-denominated issues, all with maturities of 1 year or more. It is impossible to invest directly in an index.
The Fund is subject to the same risks as the underlying bonds in the portfolio such as credit, call and interest rate risk. As interest rates rise the value of bond prices will decline. The Fund may invest in high yield debt (also known as junk bonds) which may cause greater volatility and less liquidity. You may lose money by investing in the Fund.
4
ESTABROOK INVESTMENT GRADE FIXED INCOME FUND
Fund Expense Disclosure
April 30, 2017
(Unaudited)
As a shareholder of the Fund, you incur two types of costs: (1) transaction costs, including redemption fees; and (2) ongoing costs, including management fees and other Fund expenses. This example is intended to help you understand your ongoing costs (in dollars) of investing in the Fund and to compare these costs with the ongoing costs of investing in other mutual funds.
This example is based on an investment of $1,000 invested at the beginning of the six-month period from November 1, 2016 through April 30, 2017 and held for the entire period.
Actual Expenses
The first line of the accompanying table provides information about actual account values and actual expenses. You may use the information in this line, together with the amount you invested, to estimate the expenses that you paid over the period. Simply divide your account value by $1,000 (for example, an $8,600 account value divided by $1,000 = 8.6), then multiply the result by the number in the first line under the heading entitled “Expenses Paid During Period” to estimate the expenses you paid on your account during this period.
Hypothetical Example for Comparison Purposes
The second line of the accompanying table provides information about hypothetical account values and hypothetical expenses based on the Fund’s actual expense ratio and an assumed rate of return of 5% per year before expenses, which is not your Fund’s actual return. The hypothetical account values and expenses may not be used to estimate the actual ending account balance or expenses you paid for the period. You may use this information to compare the ongoing costs of investing in the Fund and other funds. To do so, compare this 5% hypothetical example with the 5% hypothetical examples that appear in the shareholder reports of other funds.
Please note that the expenses shown in the accompanying table are meant to highlight your ongoing costs only and do not reflect any transactional costs, such as redemption fees. Therefore, the second line of the accompanying table is useful in comparing ongoing costs only, and will not help you determine the relative total costs of owning different funds. In addition, if these transactional costs were included, your costs would have been higher.
5
ESTABROOK INVESTMENT GRADE FIXED INCOME FUND
Fund Expense Disclosure (Concluded)
April 30, 2017
(Unaudited)
| Estabrook Investment Grade Fixed Income Fund | ||||||||||||
| Beginning Account Value November 1, 2016 | Ending Account Value April 30, 2017 | Expenses Paid During Period* | ||||||||||
Class I | ||||||||||||
Actual | $1,000.00 | $1,003.10 | $3.48 | |||||||||
Hypothetical (5% return before expenses) | 1,000.00 | 1,021.32 | 3.51 | |||||||||
| * | Expenses are equal to the Fund’s annualized expense ratio for the six-month period ended April 30, 2017 of 0.70% for Class I shares, multiplied by the average account value over the period, multiplied by the number of days in the most recent period (181), then divided by 365 days to reflect the period. The Fund’s ending account value on the first line in the table is based on the actual six-month total return for the Fund of 0.31%. |
6
ESTABROOK INVESTMENT GRADE FIXED INCOME FUND
Portfolio Holdings Summary Table
April 30, 2017
(Unaudited)
The following table presents a summary by security type of the portfolio holdings of the Fund:
| % of Net Assets | Value | |||||||
Corporate Bonds and Notes | 68.9 | % | $ | 22,270,551 | ||||
U.S. Treasury Obligations | 27.3 | 8,813,292 | ||||||
Other Assets in Excess of Liabilities | 3.8 | 1,213,519 | ||||||
|
|
|
| |||||
NET ASSETS | 100.0 | % | $ | 32,297,362 | ||||
|
|
|
| |||||
Portfolio holdings are subject to change at any time.
The accompanying notes are an integral part of the financial statements.
7
ESTABROOK INVESTMENT GRADE FIXED INCOME FUND
Portfolio of Investments
April 30, 2017
| Par Value | Value | |||||||
CORPORATE BONDS AND NOTES — 68.9% |
| |||||||
Applications Software — 3.0% |
| |||||||
Microsoft Corp. | ||||||||
1.850%, 02/06/2020 | $ | 187,000 | $ | 187,710 | ||||
Microsoft Corp. | ||||||||
3.300%, 02/06/2027 | 750,000 | 770,593 | ||||||
|
| |||||||
| 958,303 | ||||||||
|
| |||||||
Auto-Cars/Light Trucks — 9.3% |
| |||||||
Ford Motor Credit Co., LLC | ||||||||
2.021%, 05/03/2019 | 500,000 | 498,656 | ||||||
Ford Motor Credit Co., LLC | ||||||||
3.336%, 03/18/2021 | 500,000 | 506,664 | ||||||
Ford Motor Credit Co., LLC | ||||||||
3.096%, 05/04/2023 | 500,000 | 491,973 | ||||||
General Motors Financial Co., Inc. | ||||||||
2.350%, 10/04/2019 | 500,000 | 499,533 | ||||||
General Motors Financial Co., Inc. | ||||||||
3.200%, 07/06/2021 | 500,000 | 504,428 | ||||||
General Motors Financial Co., Inc. | ||||||||
3.700%, 05/09/2023 | 500,000 | 502,365 | ||||||
|
| |||||||
| 3,003,619 | ||||||||
|
| |||||||
Beverages-Non-alcoholic — 1.5% |
| |||||||
Coca-Cola Co. (The) | ||||||||
1.375%, 05/30/2019 | 500,000 | 498,204 | ||||||
|
| |||||||
Commercial Banks Non-US — 0.8% |
| |||||||
Santander UK PLC | ||||||||
3.050%, 08/23/2018 | 250,000 | 253,589 | ||||||
|
| |||||||
| Par Value | Value | |||||||
CORPORATE BONDS AND NOTES — (Continued) |
| |||||||
Computers — 4.8% |
| |||||||
Apple, Inc. | ||||||||
2.500%, 02/09/2022 | $ | 500,000 | $ | 506,324 | ||||
Apple, Inc. | ||||||||
3.350%, 02/09/2027 | 500,000 | 511,398 | ||||||
Dell International LLC / EMC Corp. | ||||||||
6.020%, 06/15/2026 (a) | 500,000 | 549,164 | ||||||
|
| |||||||
| 1,566,886 | ||||||||
|
| |||||||
Diversified Banking Institutions — 20.4% |
| |||||||
Bank of America Corp. | ||||||||
2.153%, 04/24/2023 (b) | 500,000 | 500,735 | ||||||
Barclays PLC | ||||||||
3.200%, 08/10/2021 | 500,000 | 505,346 | ||||||
Barclays PLC | ||||||||
2.780%, 01/10/2023 (b) | 500,000 | 507,340 | ||||||
Citigroup, Inc. | ||||||||
2.116%, 04/25/2022 (b) | 500,000 | 500,750 | ||||||
Goldman Sachs Group, Inc. (The) | ||||||||
2.922%, 10/28/2027 (b) | 1,000,000 | 1,030,739 | ||||||
The accompanying notes are an integral part of the financial statements.
8
ESTABROOK INVESTMENT GRADE FIXED INCOME FUND
Portfolio of Investments (Continued)
April 30, 2017
| Par Value | Value | |||||||
CORPORATE BONDS AND NOTES — (Continued) |
| |||||||
Diversified Banking Institutions — (Continued) |
| |||||||
Goldman Sachs Group, Inc. | ||||||||
5.375%, 12/29/2049 (b)(c)(d) | $ | 500,000 | $ | 518,375 | ||||
JPMorgan Chase & Co. | ||||||||
2.056%, 04/25/2023 (b) | 500,000 | 500,250 | ||||||
JPMorgan Chase & Co. | ||||||||
2.383%, 10/24/2023 (b) | 500,000 | 508,650 | ||||||
Morgan Stanley | ||||||||
2.373%, 05/08/2024 (b) | 1,000,000 | 1,003,300 | ||||||
Morgan Stanley | ||||||||
5.550%, 12/29/2049 (b)(c)(d) | 500,000 | 523,438 | ||||||
UBS AG | ||||||||
2.350%, 03/26/2020 | 500,000 | 503,272 | ||||||
|
| |||||||
| 6,602,195 | ||||||||
|
| |||||||
Diversified Manufacturing Operations — 1.6% |
| |||||||
General Electric Co. | ||||||||
2.200%, 01/09/2020 | 500,000 | 506,280 | ||||||
|
| |||||||
| Par Value | Value | |||||||
CORPORATE BONDS AND NOTES — (Continued) |
| |||||||
Electric-Integrated — 0.6% |
| |||||||
Exelon Corp. | ||||||||
3.497%, 06/01/2022 | $ | 200,000 | $ | 203,959 | ||||
|
| |||||||
Electronic Components-Semiconductor — 1.6% |
| |||||||
Intel Corp. | ||||||||
2.450%, 07/29/2020 | 250,000 | 255,072 | ||||||
Texas Instruments, Inc. | ||||||||
1.000%, 05/01/2018 | 250,000 | 249,090 | ||||||
|
| |||||||
| 504,162 | ||||||||
|
| |||||||
Finance-Auto Loans — 5.5% |
| |||||||
Ally Financial, Inc. | ||||||||
3.250%, 11/05/2018 | 750,000 | 757,500 | ||||||
Ally Financial, Inc. | ||||||||
3.750%, 11/18/2019 | 500,000 | 508,695 | ||||||
Ally Financial, Inc. | ||||||||
4.250%, 04/15/2021 | 500,000 | 511,250 | ||||||
|
| |||||||
| 1,777,445 | ||||||||
|
| |||||||
Finance-Commercial — 1.3% |
| |||||||
CIT Group, Inc. | ||||||||
5.000%, 08/01/2023 | 400,000 | 430,000 | ||||||
|
| |||||||
Investment Management/Advisory Services — 1.6% |
| |||||||
UBS Group Funding | ||||||||
2.376%, 05/23/2023 (a)(b) | 500,000 | 502,829 | ||||||
|
| |||||||
Life/Health Insurance — 2.2% |
| |||||||
Lincoln National Corp. | ||||||||
3.399%, 05/17/2066 (b) | 500,000 | 444,375 | ||||||
The accompanying notes are an integral part of the financial statements.
9
ESTABROOK INVESTMENT GRADE FIXED INCOME FUND
Portfolio of Investments (Continued)
April 30, 2017
| Par Value | Value | |||||||
CORPORATE BONDS AND NOTES — (Continued) |
| |||||||
Life/Health Insurance — (Continued) |
| |||||||
Prudential Financial, Inc. | ||||||||
1.819%, 08/15/2018 (b) | $ | 250,000 | $ | 251,431 | ||||
|
| |||||||
| 695,806 | ||||||||
|
| |||||||
Multi-line Insurance — 1.5% | ||||||||
Genworth Holdings, Inc. | ||||||||
3.042%, 11/15/2066 (b) | 475,000 | 223,250 | ||||||
MetLife, Inc. | ||||||||
5.250%, 12/29/2049 (b)(c)(d) | 250,000 | 259,625 | ||||||
|
| |||||||
| 482,875 | ||||||||
|
| |||||||
Oil Comp-Integrated — 0.8% | ||||||||
Exxon Mobil Corp. | ||||||||
3.043%, 03/01/2026 | 250,000 | 252,526 | ||||||
|
| |||||||
Pipelines — 2.2% | ||||||||
Enterprise Products | ||||||||
7.034%, 01/15/2068 (b)(d) | 235,000 | 242,638 | ||||||
Phillips 66 Partners LP | ||||||||
3.550%, 10/01/2026 | 500,000 | 485,414 | ||||||
|
| |||||||
| 728,052 | ||||||||
|
| |||||||
| Par Value | Value | |||||||
CORPORATE BONDS AND NOTES — (Continued) |
| |||||||
Real Estate Operations/Development — 1.6% |
| |||||||
Prologis LP | ||||||||
3.350%, 02/01/2021 | $ | 500,000 | $ | 516,644 | ||||
|
| |||||||
REITS-Shopping Centers — 0.8% |
| |||||||
Kimco Realty Corp. | ||||||||
3.200%, 05/01/2021 | 250,000 | 254,367 | ||||||
|
| |||||||
Retail-Discount — 0.8% | ||||||||
Wal-Mart Stores, Inc. | ||||||||
1.125%, 04/11/2018 | 250,000 | 249,665 | ||||||
|
| |||||||
Super-Regional Banks-US — 3.1% |
| |||||||
Wells Fargo & Co. | ||||||||
3.069%, 01/24/2023 | 500,000 | 505,729 | ||||||
Wells Fargo & Co. | ||||||||
2.402%, 10/31/2023 (b) | 500,000 | 508,136 | ||||||
|
| |||||||
| 1,013,865 | ||||||||
|
| |||||||
Telephone-Integrated — 3.9% |
| |||||||
AT&T, Inc. | ||||||||
3.800%, 03/01/2024 | 500,000 | 508,559 | ||||||
AT&T, Inc. | ||||||||
4.250%, 03/01/2027 | 250,000 | 255,265 | ||||||
The accompanying notes are an integral part of the financial statements.
10
ESTABROOK INVESTMENT GRADE FIXED INCOME FUND
Portfolio of Investments (Concluded)
April 30, 2017
| Par Value | Value | |||||||
CORPORATE BONDS AND NOTES — (Continued) |
| |||||||
Telephone-Integrated — (Continued) |
| |||||||
Verizon Communications, Inc. | ||||||||
2.137%, 03/16/2022 (b) | $ | 500,000 | $ | 505,456 | ||||
|
| |||||||
| 1,269,280 | ||||||||
|
| |||||||
TOTAL CORPORATE BONDS AND NOTES (Cost $22,182,359) |
| 22,270,551 | ||||||
|
| |||||||
U.S. TREASURY OBLIGATIONS — 27.3% |
| |||||||
Sovereign — 27.3% | ||||||||
0.680%, 05/25/2017(e) | 750,000 | 749,660 | ||||||
0.955%, 10/26/2017(e) | 750,000 | 746,431 | ||||||
1.000%, 05/31/2018 | 2,500,000 | 2,495,702 | ||||||
1.250%, 04/30/2019 | 1,000,000 | 999,570 | ||||||
2.125%, 06/30/2022 | 475,000 | 481,197 | ||||||
2.000%, 07/31/2022 | 750,000 | 754,717 | ||||||
1.625%, 02/15/2026 | 1,000,000 | 949,492 | ||||||
1.500%, 08/15/2026 | 1,750,000 | 1,636,523 | ||||||
|
| |||||||
| 8,813,292 | ||||||||
|
| |||||||
TOTAL U.S. TREASURY OBLIGATIONS | 8,813,292 | |||||||
|
| |||||||
TOTAL INVESTMENTS - 96.2% |
| 31,083,843 | ||||||
OTHER ASSETS IN EXCESS OF LIABILITIES - 3.8% | 1,213,519 | |||||||
|
| |||||||
NET ASSETS - 100.0% |
| $ | 32,297,362 | |||||
|
| |||||||
| (a) | Securities exempt from registration under Rule 144A of the Securities Act of 1933, as amended. These securities were purchased in accordance with the guidelines approved by the Fund’s Board of Trustees and may be resold, in transactions exempt from registration, to qualified institutional buyers. At April 30, 2017, these securities amounted to $1,051,993 or 3.3% of net assets. These securities have been determined by the Adviser to be liquid securities. |
| (b) | Variable or Floating Rate Security. Rate shown is as of April 30, 2017. |
| (c) | Security is a perpetual bond and has no definite maturity date. |
| (d) | Fix-to Float Security. Rate shown is as of April 30, 2017. |
| (e) | Rate disclosed represents the yield-to-maturity as of April 30, 2017. |
| PLC | Public Limited Company |
| REIT | Real Estate Investment Trust |
Please note that securities are classified according to the Bloomberg Sub-Industry Categories. The Fund’s investment adviser has selected this classification system because they believe that it best reflects the industry and risks associated with each position.
The accompanying notes are an integral part of the financial statements.
11
ESTABROOK INVESTMENT GRADE FIXED INCOME FUND
Statement of Assets and Liabilities
April 30, 2017
Assets | ||||
Investments, at value (Cost $31,077,496) | $ | 31,083,843 | ||
Cash | 2,078,411 | |||
Dividends and interest receivable | 198,936 | |||
Receivable from Investment Adviser | 3,336 | |||
Prepaid expenses and other assets | 21,992 | |||
|
| |||
Total assets | 33,386,518 | |||
|
| |||
Liabilities | ||||
Payable for investments purchased | 999,878 | |||
Payable for audit fees | 27,850 | |||
Payable for capital shares redeemed | 17,404 | |||
Payable for transfer agent fees | 14,435 | |||
Payable for legal fees | 11,557 | |||
Payable for printing fees | 7,428 | |||
Payable for administration and accounting fees | 7,305 | |||
Payable for custodian fees | 2,753 | |||
Accrued expenses | 546 | |||
|
| |||
Total liabilities | 1,089,156 | |||
|
| |||
Net Assets | $ | 32,297,362 | ||
|
| |||
Net Assets Consisted of: | ||||
Capital stock, $0.01 par value | $ | 31,859 | ||
Paid-in capital | 32,400,858 | |||
Accumulated net investment loss | (7,349 | ) | ||
Accumulated net realized loss from investments | (134,353 | ) | ||
Net unrealized appreciation on investments | 6,347 | |||
|
| |||
Net Assets | $ | 32,297,362 | ||
|
| |||
Class I: | ||||
Shares outstanding | 3,185,854 | |||
|
| |||
Net asset value, offering and redemption price per share ($32,297,362 / 3,185,854shares) | $ | 10.14 | ||
|
|
The accompanying notes are an integral part of the financial statements.
12
ESTABROOK INVESTMENT GRADE FIXED INCOME FUND
Statement of Operations
For the Year Ended April 30, 2017
Investment Income | ||||
Interest | $ | 927,287 | ||
|
| |||
Total investment income | 927,287 | |||
|
| |||
Expenses | ||||
Advisory fees (Note 2) | 218,522 | |||
Administration and accounting fees (Note 2) | 67,328 | |||
Transfer agent fees (Note 2) | 43,987 | |||
Audit fees | 29,577 | |||
Legal fees | 28,622 | |||
Trustees’ and officers’ fees (Note 2) | 27,568 | |||
Printing and shareholder reporting fees | 20,236 | |||
Registration and filing fees | 18,694 | |||
Custodian fees (Note 2) | 14,292 | |||
Other expenses | 24,010 | |||
|
| |||
Total expenses before waivers and reimbursements | 492,836 | |||
|
| |||
Less: waivers and reimbursements (Note 2) | (257,454 | ) | ||
|
| |||
Net expenses after waivers and reimbursements | 235,382 | |||
|
| |||
Net investment income | 691,905 | |||
|
| |||
Net realized and unrealized gain from investments: | ||||
Net realized gain from investments | 74,468 | |||
Net change in unrealized appreciation/(depreciation) on investments | 219,652 | |||
|
| |||
Net realized and unrealized gain on investments | 294,120 | |||
|
| |||
Net increase in net assets resulting from operations | $ | 986,025 | ||
|
|
The accompanying notes are an integral part of the financial statements.
13
ESTABROOK INVESTMENT GRADE FIXED INCOME FUND
Statements of Changes in Net Assets
| For the Year Ended April 30, 2017 | For the Year Ended April 30, 2016 | |||||||
Increase in Net Assets From Operations: | ||||||||
Net investment income | $ | 691,905 | $ | 780,258 | ||||
Net realized gain from investments | 74,468 | 153,798 | ||||||
Net change in unrealized appreciation/(depreciation) on investments | 219,652 | (512,074 | ) | |||||
|
|
|
| |||||
Net increase in net assets resulting from operations | 986,025 | 421,982 | ||||||
|
|
|
| |||||
Less Dividends and Distributions to Shareholders from: | ||||||||
Net investment income: | ||||||||
Class I | (690,285 | ) | (774,451 | ) | ||||
Net realized capital gains: | ||||||||
Class I | (298,665 | ) | (103,595 | ) | ||||
|
|
|
| |||||
Net decrease in net assets from dividends and distributions to shareholders | (988,950 | ) | (878,046 | ) | ||||
|
|
|
| |||||
Decrease in Net Assets Derived from Capital Share Transactions (Note 4) | (923,822 | ) | (65,978 | ) | ||||
|
|
|
| |||||
Total decrease in net assets | (926,747 | ) | (522,042 | ) | ||||
|
|
|
| |||||
Net assets | ||||||||
Beginning of year | 33,224,109 | 33,746,151 | ||||||
|
|
|
| |||||
End of year | $ | 32,297,362 | $ | 33,224,109 | ||||
|
|
|
| |||||
Accumulated net investment loss, end of year | $ | (7,349 | ) | $ | (2,124 | ) | ||
|
|
|
| |||||
The accompanying notes are an integral part of the financial statements.
14
ESTABROOK INVESTMENT GRADE FIXED INCOME FUND
Financial Highlights
Contained below is per share operating performance data for Class I shares outstanding, total investment return, ratios to average net assets and other supplemental data for the respective period. The total returns in the table represent the rate that an investor would have earned or lost on an investment in the Fund (assuming reinvestment of all dividends and distributions). This information has been derived from information provided in the financial statements and should be read in conjunction with the financial statements and the notes thereto.
| Class I | ||||||||||||||||||||
| For the Year Ended April 30, 2017 | For the Year Ended April 30, 2016 | For the Year Ended April 30, 2015 | For the Year Ended April 30, 2014 | For the Year Ended April 30, 2013 | ||||||||||||||||
Per Share Operating Performance | ||||||||||||||||||||
Net asset value, beginning of year | $ | 10.13 | $ | 10.26 | $ | 10.37 | $ | 10.66 | $ | 10.09 | ||||||||||
|
|
|
|
|
|
|
|
|
| |||||||||||
Net investment income(1) | 0.21 | 0.24 | 0.24 | 0.26 | 0.32 | |||||||||||||||
Net realized and unrealized gain/(loss) on investments | 0.10 | (0.10 | ) | (0.05 | ) | (0.23 | ) | 0.57 | ||||||||||||
|
|
|
|
|
|
|
|
|
| |||||||||||
Net increase in net assets resulting from operations | 0.31 | 0.14 | 0.19 | 0.03 | 0.89 | |||||||||||||||
|
|
|
|
|
|
|
|
|
| |||||||||||
Dividends and distributions to shareholders from: | ||||||||||||||||||||
Net investment income | (0.21 | ) | (0.24 | ) | (0.24 | ) | (0.26 | ) | (0.32 | ) | ||||||||||
Net realized capital gains | (0.09 | ) | (0.03 | ) | (0.06 | ) | (0.06 | ) | — | |||||||||||
|
|
|
|
|
|
|
|
|
| |||||||||||
Total dividends and distributions to shareholders | (0.30 | ) | (0.27 | ) | (0.30 | ) | (0.32 | ) | (0.32 | ) | ||||||||||
|
|
|
|
|
|
|
|
|
| |||||||||||
Redemption fees | — | (2) | — | — | (2) | — | — | (2) | ||||||||||||
|
|
|
|
|
|
|
|
|
| |||||||||||
Net asset value, end of year | $ | 10.14 | $ | 10.13 | $ | 10.26 | $ | 10.37 | $ | 10.66 | ||||||||||
|
|
|
|
|
|
|
|
|
| |||||||||||
Total investment return(3) | 3.07 | % | 1.39 | % | 1.85 | % | 0.38 | % | 8.99 | % | ||||||||||
Ratio/Supplemental Data | ||||||||||||||||||||
Net assets, end of year (in thousands) | $ | 32,297 | $ | 33,224 | $ | 33,746 | $ | 33,995 | $ | 31,737 | ||||||||||
Ratio of expenses to average net assets | 0.70 | % | 0.70 | % | 0.70 | % | 0.70 | % | 0.70 | % | ||||||||||
Ratio of expenses to average net assets without waivers and expense reimbursements(4) | 1.47 | % | 1.41 | % | 1.34 | % | 1.41 | % | 1.69 | % | ||||||||||
Ratio of net investment income to average net assets | 2.06 | % | 2.36 | % | 2.28 | % | 2.50 | % | 3.07 | % | ||||||||||
Portfolio turnover rate | 98.11 | % | 112.74 | % | 89.75 | % | 132.74 | % | 94.83 | % | ||||||||||
| (1) | The selected per share data was calculated using the average shares outstanding method for the year. |
| (2) | Amount is less than $0.005 per share. |
| (3) | Total investment return is calculated assuming a purchase of shares on the first day and a sale of shares on the last day of each period reported and includes reinvestment of dividends and distributions, if any. |
| (4) | During the period, certain fees were waived and/or reimbursed. If such fee waivers and/or reimbursements had not occurred, the ratios would have been as indicated (See Note 2). |
The accompanying notes are an integral part of the financial statements.
15
ESTABROOK INVESTMENT GRADE FIXED INCOME FUND
Notes to Financial Statements
April 30, 2017
1. Organization and Significant Accounting Policies
Estabrook Investment Grade Fixed Income Fund (the “Fund”) is a diversified, open-end management investment company registered under the Investment Company Act of 1940, as amended (the “1940 Act”), which commenced investment operations on July 23,2010. The Fund is a separate series of FundVantage Trust (the “Trust”) which was organized as a Delaware statutory trust on August 28, 2006. The Trust is a “series trust” authorized to issue an unlimited number of separate series or classes of shares of beneficial interest. Each series is treated as a separate entity for certain matters under the 1940 Act, and for other purposes, and a shareholder of one series is not deemed to be a shareholder of any other series. The Fund offers separate classes of shares: Class A, Class C, Class I and Class R Shares. As of April 30, 2017, Class A, Class C and Class R Shares had not been issued.
The Fund is an investment company and follows accounting and reporting guidance in the Financial Accounting Standards Board Accounting Standards Codification Topic 946.
Portfolio Valuation — The Fund’s net asset value (“NAV”) is calculated once daily at the close of regular trading hours on the New York Stock Exchange (“NYSE”) (typically 4:00 p.m., Eastern time) on each day the NYSE is open. Securities held by the Fund are valued at their last sale price on the NYSE on the day the security is valued. Lacking any sales on such day, the security will be valued at the mean between the last asked price and the last bid price prior to the market close. Securities listed on other exchanges (and not subject to restriction against sale by the Fund on such exchanges) will be similarly valued, using quotations on the exchange on which the security is traded most extensively. Unlisted securities that are quoted on the National Association of Securities Dealers National Market System, for which there have been sales of such securities on such day, shall be valued at the official closing price on such system on the day the security is valued. If there are no such sales on such day, the value shall be the mean between the last asked price and the last bid price prior to market close. The value of such securities quoted on the National Association of Securities Dealers Automatic Quotation System (“NASDAQ”) market system, but not listed on the National Market System, shall be valued at the mean between closing asked price and the closing bid price. Unlisted securities that are not quoted on the NASDAQ and for which over-the-counter market quotations are readily available will be valued at the mean between the current bid and asked prices for such security in the over-the-counter market. Fixed income and preferred securities are valued based on market quotations, which are furnished by an independent pricing service. Fixed income securities having a remaining maturity of 60 days or less are generally valued at amortized cost, provided such amount approximates fair value. Debt securities are valued on the basis of broker quotations or valuations provided by a pricing service, which utilizes information with respect to recent sales, market transactions in comparable securities, quotations from dealers, and various relationships between securities in determining value. Due to continued volatility in the current market, valuations developed through pricing techniques may materially vary from the actual amounts realized upon sale of the securities. Investments in other open-end investment companies are valued based on the NAV of the investment companies (which may use fair value pricing as discussed in their prospectuses).
16
ESTABROOK INVESTMENT GRADE FIXED INCOME FUND
Notes to Financial Statements (Continued)
April 30, 2017
If market quotations are unavailable or deemed unreliable, securities will be valued in accordance with procedures adopted by the FundVantage Trust’s Board of Trustees. Relying on prices supplied by pricing services or dealers or using fair valuation may result in values that are higher or lower than the values used by other investment companies and investors to price the same investments. In the event that market quotes are not readily available, and the security or asset cannot be valued pursuant to one of the valuation methods, the value of the security or asset will be determined in good faith by the Adviser. The Trust has established a Valuation Committee which performs certain functions including the oversight of the Adviser’s fair valuation determinations.
Fair Value Measurements — The inputs and valuation techniques used to measure fair value of the Fund’s investments are summarized into three levels as described in the hierarchy below:
• | Level 1 | — | quoted prices in active markets for identical securities; | |||
• | Level 2 | — | other significant observable inputs (including quoted prices for similar securities, interest rates, prepayment speeds, credit risk, etc.); and | |||
• | Level 3 | — | significant unobservable inputs (including the Fund’s own assumptions in determining the fair value of investments). | |||
The fair value of the Fund’s bonds is generally based on quotes received from brokers of independent pricing services. Bonds with quotes that are based on actual trades with a sufficient level of activity on or near the measurement date are classified as Level 2 assets.
The inputs or methodology used for valuing securities are not necessarily an indication of the risk associated with investing in those securities.
The following is a summary of the inputs used, as of April 30, 2017, in valuing the Fund’s investments carried at fair value:
| Total Value at 04/30/17 | Level 1 Quoted Price | Level 2 Other Significant Observable Inputs | Level 3 Significant Unobservable Inputs | |||||||||||||
Corporate Bonds and Notes | $ | 22,270,551 | $ | — | $ | 22,270,551 | $ | — | ||||||||
U.S. Treasury Obligations | 8,813,292 | — | 8,813,292 | — | ||||||||||||
|
|
|
|
|
|
|
| |||||||||
Total Investments | $ | 31,083,843 | $ | — | $ | 31,083,843 | $ | — | ||||||||
|
|
|
|
|
|
|
| |||||||||
At the end of each quarter, management evaluates the classification of Levels 1, 2 and 3 assets and liabilities. Various factors are considered, such as changes in liquidity from the prior reporting period; whether or not a broker is willing to execute at the quoted price; the depth and consistency of prices
17
ESTABROOK INVESTMENT GRADE FIXED INCOME FUND
Notes to Financial Statements (Continued)
April 30, 2017
from third party pricing services; and the existence of contemporaneous, observable trades in the market. Additionally, management evaluates the classification of Level 1 and Level 2 assets and liabilities on a quarterly basis for changes in listings or delistings on national exchanges.
Due to the inherent uncertainty of determining the fair value of investments that do not have a readily available market value, the fair value of the Fund’s investments may fluctuate from period to period. Additionally, the fair value of investments may differ significantly from the values that would have been used had a ready market existed for such investments and may differ materially from the values the Fund may ultimately realize. Further, such investments may be subject to legal and other restrictions on resale or otherwise less liquid than publicly traded securities.
For fair valuations using significant unobservable inputs, U.S. generally accepted accounting principles (“U.S. GAAP”) require the Fund to present a reconciliation of the beginning to ending balances for reported market values that presents changes attributable to total realized and unrealized gains or losses, purchase and sales, and transfers in and out of Level 3 during the period. Transfers in and out between Levels are based on values at the end of the period. U.S. GAAP also requires the Fund to disclose amounts and reasons for all transfers in and out of Level 1 and Level 2 fair value measurements. A reconciliation of Level 3 investments is presented only when the Fund had an amount of Level 3 investments at the end of the reporting period that was meaningful in relation to its net assets. The amounts and reasons for all transfers in and out of each Level within the three-tier hierarchy are disclosed when the Fund had an amount of total transfers during the reporting period that was meaningful in relation to its net assets as of the end of the reporting period.
For the year ended April 30, 2017, there were no transfers between Levels 1, 2 and 3 for the Fund.
Use of Estimates — The preparation of financial statements in conformity with U.S. GAAP requires management to make estimates and assumptions that affect the amounts reported in the financial statements and accompanying notes at the date of the financial statements and the reported amounts of revenues and expenses during the period. Actual results could differ from those estimates and those differences could be material.
Investment Transactions, Investment Income and Expenses — Investment transactions are recorded on trade date for financial statement preparation purposes. Realized gains and losses on investments sold are recorded on the identified cost basis. Gains and losses on principal paydowns from mortgage backed securities are recorded as interest income on the Statement of Operations. Interest income is recorded on the accrual basis. Accretion of discounts and amortization of premiums are recorded on a daily basis using the effective yield method except for short term securities, which records discounts and premiums on a straight-line basis. Dividends are recorded on the ex-dividend date. General expenses of the Trust are generally allocated to each fund in proportion to its relative daily net assets. Expenses directly attributable to a particular fund in the Trust are charged directly to such fund.
18
ESTABROOK INVESTMENT GRADE FIXED INCOME FUND
Notes to Financial Statements (Continued)
April 30, 2017
Dividends and Distributions to Shareholders — Dividends from net investment income are declared and paid monthly to shareholders. Distributions, if any, of net short-term capital gain and net capital gain (the excess of net long-term capital gain over the short-term capital loss) realized by the Fund, after deducting any available capital loss carryovers are declared and paid to its shareholders annually. Income dividends and capital gain distributions are determined in accordance with U.S. federal income tax regulations, which may differ from U.S. GAAP. These differences may include the treatment of non-taxable dividends, expiring capital loss carryforwards and losses deferred due to wash sales and excise tax regulations. Permanent book and tax basis differences relating to shareholder distributions will result in reclassifications within the components of net assets.
U.S. Tax Status — No provision is made for U.S. income taxes as it is the Fund’s intention to continue to qualify for and elect the tax treatment applicable to regulated investment companies under Subchapter M of the Internal Revenue Code of 1986, as amended (“Internal Revenue Code”), and make the requisite distributions to its shareholders which will be sufficient to relieve it from U.S. income and excise taxes.
Other — In the normal course of business, the Fund may enter into contracts that provide general indemnifications. The Fund’s maximum exposure under these arrangements is dependent on claims that may be made against the Fund in the future, and therefore, cannot be estimated; however, based on experience, the risk of material loss for such claims is considered remote.
Recent Accounting Pronouncement — In October 2016, the U.S. Securities and Exchange Commission (“SEC”) issued a new rule, Investment Company Reporting Modernization, which, among other provisions, amends Regulation S-X to require standardized, enhanced disclosures, particularly related to derivatives, in investment company financial statements. Compliance with the amendments to Regulation S-X is required for financial statements filed with the SEC on or after August 1, 2017. Management is currently evaluating the impact that the amendments will have on the Fund’s financial statements and related disclosures.
2. Transactions with Related Parties and Other Service Providers
Estabrook Capital Management LLC (“Estabrook” or the “Adviser”) serves as investment adviser to the Fund pursuant to an investment advisory agreement with the Trust (the “Advisory Agreement”). For its services, the Adviser is paid a monthly fee at the annual rate of 0.65% of the Fund’s average daily net assets. The Adviser has contractually agreed to reduce its investment advisory fee and/or reimburse certain expenses of the Fund to the extent necessary to ensure that the Fund’s total operating expenses, excluding taxes, any class-specific fees and expenses (such as Rule 12b-1 distribution fees, shareholder service fees, or transfer agency fees), “Acquired Fund” fees and expenses, interest, extraordinary items, and brokerage commissions, do not exceed 0.70% (on an annual basis) of the average daily net assets of the Fund (the “Expense Limitation”). The Expense Limitation will remain in place until August 31, 2017, unless the Board of Trustees of the Trust approves its earlier termination. The Adviser is entitled to recover, subject to approval by the Board of Trustees, such amounts reduced or reimbursed for a period of up
19
ESTABROOK INVESTMENT GRADE FIXED INCOME FUND
Notes to Financial Statements (Continued)
April 30, 2017
to three (3) years from the year in which the Adviser reduced its compensation and/or assumed expenses for the Fund. The Adviser is permitted to seek reimbursement from the Fund, subject to certain limitations, for fees it waived and Fund expenses it paid to the extent the total annual fund expenses do not exceed the limits described above or any lesser limits in effect at the time of reimbursement. No recoupment will occur unless the Fund’s expenses are below the Expense Limitation amount. At April 30, 2017, the amount of potential recovery by the Adviser was as follows:
Expiration | ||||||
April 30, 2018 | April 30, 2019 | April 30, 2020 | Total | |||
$217,797 | $234,709 | $257,454 | $709,960 | |||
For the year ended April 30, 2017, the Adviser earned advisory fees of $218,522 and waived and reimbursed fees of $257,454.
Other Service Providers
BNY Mellon Investment Servicing (US) Inc. (“BNY Mellon”) serves as administrator and transfer agent for the Fund. For providing administrative and accounting services, BNY Mellon is entitled to receive a monthly fee equal to an annual percentage rate of the Fund’s average net assets and is subject to certain minimum monthly fees. For providing transfer agency services, BNY Mellon is entitled to receive a monthly fee, subject to certain minimum, and out of pocket expenses.
The Bank of New York Mellon (the “Custodian”) provides certain custodial services to the Fund. The Custodian is entitled to receive a monthly fee, subject to certain minimum, and out of pocket expenses.
Foreside Funds Distributors LLC (the “Underwriter”) provides principal underwriting services to the Fund pursuant to an underwriting agreement between the Trust and the Underwriter.
Trustees and Officers
The Trust is governed by its board of Trustees. The Trustees receive compensation in the form of an annual retainer and per meeting fees for their services to the Trust. The remuneration paid to the Trustees by the Fund during the year ended April 30, 2017 was $8,842. An employee of BNY Mellon serves as the Secretary of the Trust and is not compensated by the Fund or the Trust.
Effective June 1, 2016 and July 1, 2016, JW Fund Management LLC (“JWFM”) provides a Principal Executive Officer and Principal Financial Officer, respectively, to the Trust. JWFM is compensated for the services provided to the Trust. Until May 31, 2016 and June 30, 2016, certain employees of BNY Mellon served as Principal Executive Officer and Principal Financial Officer, respectively, to the Trust. They were not compensated by the Trust or the Funds.
20
ESTABROOK INVESTMENT GRADE FIXED INCOME FUND
Notes to Financial Statements (Continued)
April 30, 2017
Freeh Group International Solutions, LLC provides the Trust with a Chief Compliance Officer and an Anti-Money Laundering Officer.
3. Investment in Securities
For the year ended April 30, 2017, aggregate purchases and sales of investment securities (excluding short-term investments) of the Fund were as follows:
| Purchases | Sales | |||||||
Investment Securities | $ | 26,139,851 | $ | 29,954,860 | ||||
U.S. Government Securities | 3,779,598 | 3,357,754 | ||||||
4. Capital Share Transactions
For the years ended April 30, 2017 and 2016, transactions in capital shares (authorized shares unlimited) were as follows:
| For the Year Ended April 30, 2017 | For the Year Ended April 30, 2016 | |||||||||||||||
| Shares | Amount | Shares | Amount | |||||||||||||
Class I | ||||||||||||||||
Sales | 132,234 | $ | 1,359,501 | 10,520 | $ | 106,679 | ||||||||||
Reinvestments | 96,321 | 976,655 | 86,730 | 873,763 | ||||||||||||
Redemption Fees* | — | 1,637 | — | — | ||||||||||||
Redemptions | (323,687 | ) | (3,261,615 | ) | (104,216 | ) | (1,046,420 | ) | ||||||||
|
|
|
|
|
|
|
| |||||||||
Net Increase | (95,132 | ) | $ | (923,822 | ) | (6,966 | ) | $ | (65,978 | ) | ||||||
|
|
|
|
|
|
|
| |||||||||
| * | There is a 1.00% redemption fee that may be charged on shares redeemed which have been held for 90 days or less. The redemption fees are retained by the Fund for the benefit of the remaining shareholders and recorded as paid-in capital. |
5. Federal Tax Information
The Fund has followed the authoritative guidance on accounting for and disclosure of uncertainty in tax positions, which requires the Fund to determine whether a tax position is more likely than not to be sustained upon examination, including resolution of any related appeals or litigation processes, based on the technical merits of the position. The Fund has determined that there was no effect on the financial statements from following this authoritative guidance. In the normal course of business, the Fund is subject to examination by federal, state and local jurisdictions, where applicable, for tax years for which applicable statutes of limitations have not expired.
21
ESTABROOK INVESTMENT GRADE FIXED INCOME FUND
Notes to Financial Statements (Continued)
April 30, 2017
Distributions are determined in accordance with federal income tax regulations, which may differ in amount or character from net investment income and realized gains for financial reporting purposes. Accordingly, the character of distributions and composition of net assets for tax purposes may differ from those reflected in the accompanying financial statements. To the extent these differences are permanent, such amounts are reclassified within the components of net assets based on the tax treatment; temporary differences do not require reclassifications. For the year ended April 30, 2017, these adjustments were to decrease undistributed net investment income and increase accumulated net realized gain by $6,845. These permanent differences were primarily attributable to the redesignation of dividends paid.
For the year ended April 30, 2017, the tax character of distributions paid by the Fund was $849,117 of ordinary income dividends and $136,714 of long-term capital gains dividends. For the year ended April 30, 2016, the tax character of distributions paid by the Fund was $777,570 of ordinary income dividends and $103,595 of long-term capital gains dividends. Distributions from net investment income and short-term capital gains were treated as ordinary income for federal income tax purposes.
As of April 30, 2017, components of distributable earnings on a tax basis were as follows:
Capital Loss Carryforward | Undistributed Ordinary Income | Undistributed Long-Term Gain | Unrealized Depreciation | Qualified Late-Year Losses | ||||
$— | $— | $— | $(1,003) | $(134,354) |
The differences between the book and tax basis components of distributable earnings relate primarily to the timing and recognition of income and gains for federal income tax purposes. Short-term capital gains are reported as ordinary income for federal income tax purposes.
As of April 30, 2017, the federal tax cost, aggregate gross unrealized appreciation and depreciation of securities held by the Fund were as follows:
Federal tax cost | $ | 31,084,846 | ||||||
|
| |||||||
Gross unrealized appreciation | $ | 375,111 | ||||||
Gross unrealized depreciation | (376,114 | ) | ||||||
|
| |||||||
Net unrealized depreciation | $ | (1,003 | ) | |||||
|
|
Pursuant to federal income tax rules applicable to regulated investment companies, the Fund may elect to treat certain capital losses between November 1 and April 30 and late year ordinary losses ((i) ordinary losses between January 1 and April 30, and (ii) specified ordinary and currency losses between November 1 and April 30) as occurring on the first day of the following tax year. For the year ended April 30, 2017, any amount of losses elected within the tax return will not be recognized for federal income tax purposes until May 1, 2017. For the year ended April 30, 2017, the Fund had long-term capital loss deferrals of $182 and short-term capital loss deferrals of $134,172.
22
ESTABROOK INVESTMENT GRADE FIXED INCOME FUND
Notes to Financial Statements (Concluded)
April 30, 2017
Accumulated capital losses represent net capital loss carryforwards as of April 30, 2017, that may be available to offset future realized capital gains and thereby reduce future capital gains distributions. As of April 30, 2017, the Fund did not have any capital loss carryforwards.
6. Debt Investment Risk
Debt investments are affected primarily by the financial condition of the companies or other entities that have issued them and by changes in interest rates. There is a risk that an issuer of a Fund’s debt investments may not be able to meet its financial obligations (e.g., may not be able to make principal and/or interest payments when they are due or otherwise default on other financial terms) and/or go bankrupt. Securities such as high-yield/high-risk bonds, e.g., bonds with low credit ratings by Moody’s (Ba or lower) or Standard & Poor’s (BB and lower) or if unrated are of comparable quality as determined by the manager, are especially subject to credit risk during periods of economic uncertainty or during economic downturns and are more likely to default on their interest and/or principal payments than higher rated securities. Debt investments may be affected by changes in interest rates. Debt investments with longer durations tend to be more sensitive to changes in interest rates, making them more volatile than debt investments with shorter durations or floating or adjustable interest rates. The value of debt investments may fall when interest rates rise.
7. Subsequent Events
Management has evaluated the impact of all subsequent events on the Fund through the date the financial statements were issued and has determined that there were no subsequent events requiring recognition or disclosure in the financial statements.
23
ESTABROOK INVESTMENT GRADE FIXED INCOME FUND
Report of Independent Registered Public Accounting Firm
To the Board of Trustees of FundVantage Trust and Shareholders of the
Estabrook Investment Grade Fixed Income Fund:
In our opinion, the accompanying statement of assets and liabilities, including the portfolio of investments, and the related statements of operations and of changes in net assets and the financial highlights present fairly, in all material respects, the financial position of the Estabrook Investment Grade Fixed Income Fund (one of the funds constituting FundVantage Trust, hereafter referred to as the “Fund”) as of April 30, 2017, the results of its operations for the year then ended, the changes in its net assets for each of the two years in the period then ended and the financial highlights for each of the five years in the period then ended, in conformity with accounting principles generally accepted in the United States of America. These financial statements and financial highlights (hereafter referred to as “financial statements”) are the responsibility of the Fund’s management. Our responsibility is to express an opinion on these financial statements based on our audits. We conducted our audits of these financial statements in accordance with the standards of the Public Company Accounting Oversight Board (United States). Those standards require that we plan and perform the audit to obtain reasonable assurance about whether the financial statements are free of material misstatement. An audit includes examining, on a test basis, evidence supporting the amounts and disclosures in the financial statements, assessing the accounting principles used and significant estimates made by management, and evaluating the overall financial statement presentation. We believe that our audits, which included confirmation of securities as of April 30, 2017 by correspondence with the custodian, provide a reasonable basis for our opinion.
PricewaterhouseCoopers LLP
Philadelphia, Pennsylvania
June 28, 2017
24
ESTABROOK INVESTMENT GRADE FIXED INCOME FUND
Shareholder Tax Information
(Unaudited)
The Fund is required by Subchapter M of the Internal Revenue Code to advise its shareholders of the U.S. federal tax status of distributions received by the Fund’s shareholders in respect of such fiscal year. During the fiscal year ended April 30, 2017, the Fund paid $849,117 of ordinary income dividends and $136,714 of long-term capital gains dividends to its shareholders. Dividends from net investment income and short-term capital gains are treated as ordinary income dividends for federal income tax purposes.
The percentage of qualified interest income related dividends not subject to withholding tax for non-resident aliens and foreign corporations is 99.98%.
The Fund designates 100.00% of the ordinary income distributions as qualified short-term gain pursuant to the American Jobs Creation Act of 2004.
A total of 8.14% of the dividends distributed during the fiscal year was derived from interest on U.S. government securities, which is generally exempt from state income tax.
All designations are based on financial information available as of the date of this annual report and, accordingly, are subject to change. For each item, it is the intention of the Fund to designate the maximum amount permitted under the Internal Revenue Code of 1986, as amended, and the regulations thereunder.
Because the Fund’s fiscal year is not the calendar year, another notification will be sent with respect to calendar year 2017. The second notification, which will reflect the amount, if any, to be used by calendar year taxpayers on their U.S. federal income tax returns, will be made in conjunction with Form 1099-DIV and will be mailed in January 2018.
Foreign shareholders will generally be subject to U.S. withholding tax on the amount of their ordinary income dividends. They will generally not be entitled to a foreign tax credit or deduction for the withholding taxes paid by the Fund, if any.
In general, dividends received by tax-exempt recipients (e.g., IRAs and Keoghs) need not be reported as taxable income for U.S. federal income tax purposes. However, some retirement trusts (e.g., corporate, Keogh and 403(b)(7) plans) may need this information for their annual information reporting.
Shareholders are advised to consult their own tax advisers with respect to the tax consequences of their investment in the Fund.
25
ESTABROOK INVESTMENT GRADE FIXED INCOME FUND
Other Information
(Unaudited)
Proxy Voting
Policies and procedures that the Fund uses to determine how to vote proxies relating to portfolio securities as well as information regarding how the Fund voted proxies relating to portfolio securities for the most recent 12-month period ended June 30 are available without charge, upon request, by calling (888) 447-7443 and on the Securities and Exchange Commission’s (“SEC”) website at http://www.sec.gov.
Quarterly Portfolio Schedules
The Trust files its complete schedule of portfolio holdings with the SEC for the first and third fiscal quarters of each fiscal year (quarters ended July 31 and January 31) on Form N-Q. The Trust’s Forms N-Q are available on the SEC’s website at http://www.sec.gov and may be reviewed and copied at the SEC’s Public Reference Room in Washington, D.C. Information on the operation of the SEC’s Public Reference Room may be obtained by calling 1-800-SEC-0330.
26
ESTABROOK INVESTMENT GRADE FIXED INCOME FUND
Privacy Notice
(Unaudited)
The privacy of your personal financial information is extremely important to us. When you open an account with us, we collect a significant amount of information from you in order to properly invest and administer your account. We take very seriously the obligation to keep that information private and confidential, and we want you to know how we protect that important information.
We collect nonpublic personal information about you from applications or other forms you complete and from your transactions with us or our affiliates. We do not disclose information about you, or our former clients, to our affiliates or to service providers or other third parties, except as permitted by law. We share only the information required to properly administer your accounts, which enables us to send transaction confirmations, monthly or quarterly statements, financials and tax forms. Even within FundVantage Trust and its affiliated entities, a limited number of people who actually service accounts will have access to your personal financial information. Further, we do not share information about our current or former clients with any outside marketing groups or sales entities.
To ensure the highest degree of security and confidentiality, FundVantage Trust and its affiliates maintain various physical, electronic and procedural safeguards to protect your personal information. We also apply special measures for authentication of information you request or submit to us on our web site.
If you have questions or comments about our privacy practices, please call us at (888) 447-7443.
27
ESTABROOK INVESTMENT GRADE FIXED INCOME FUND
Fund Management
(Unaudited)
FundVantage Trust (the “Trust”) is governed by a Board of Trustees (the “Trustees”). The primary responsibility of the Trustees is to represent the interest of the Trust’s shareholders and to provide oversight management of the Trust.
The following tables present certain information regarding the Board of Trustees and officers of the Trust. None of the Trustees are an “interested person” of the Trust, the Adviser, another investment adviser of a series of the Trust, or Foreside Funds Distributors LLC, the principal underwriter of the Trust (“Underwriter”), within the meaning of the 1940 Act and each Trustee is referred to as an “Independent Trustee” and is listed under such heading below. The address of each Trustee and Officer as it relates to the Trust’s business is 301 Bellevue Parkway, 2nd Floor, Wilmington, DE 19809.
The Statement of Additional Information for the Fund contains additional information about the Trustees and is available, without charge, upon request by calling (888) 447-7443.
Name and Date of Birth | Position(s) Held with Trust | Term of Office and Length of Time Served | Principal Occupation(s) During Past Five Years | Number of Trust Complex | Other Directorships Held by Trustee | |||||
| INDEPENDENT TRUSTEES | ||||||||||
ROBERT J. CHRISTIAN Date of Birth: 2/49 |
Trustee and Chairman of the Board |
Shall serve until death, resignation or removal. Trustee and Chairman since 2007. |
Retired since February 2006; Executive Vice President of Wilmington Trust Company from February 1996 to February 2006; President of Rodney Square Management Corporation (“RSMC”) (investment advisory firm) from 1996 to 2005; Vice President of RSMC from 2005 to 2006. |
42 |
Optimum Fund Trust (registered investment company with 6 portfolios). | |||||
IQBAL MANSUR Date of Birth: 6/55 |
Trustee |
Shall serve until death, resignation or removal. Trustee since 2007. |
University Professor, Widener University. |
42 |
None. | |||||
28
ESTABROOK INVESTMENT GRADE FIXED INCOME FUND
Fund Management
(Unaudited) (Continued)
Name and Date of Birth | Position(s) Held with Trust | Term of Office and Length of Time Served | Principal Occupation(s) During Past Five Years | Number of Funds in Trust Complex Overseen by Trustee | Other Held by Trustee | |||||
| NICHOLAS M. MARSINI, JR. Date of Birth: 8/55 | Trustee | Shall serve until death, resignation or removal. Trustee since 2016. | Retired since March 2016. President of PNC Bank Delaware from June 2011 to March 2016; Executive Vice President Finance of BNY Mellon from July 2010 to January 2011; Executive Vice President and Chief Financial Officer of PNC Global Investment Servicing from September 1997 to July 2010. | 42 | Brinker Capital Destinations Trust (registered investment company with 10 portfolios). | |||||
STEPHEN M. WYNNE Date of Birth: 1/55 | Trustee | Shall serve until death, resignation or removal. Trustee since 2009. | Retired since December 2010; Chief Executive Officer of US Funds Services, BNY Mellon Asset Servicing from July 2010 to December 2010; Chief Executive Officer of PNC Global Investment Servicing from March 2008 to July 2010; President, PNC Global Investment Servicing from 2003 to 2008. | 42 | Copeland Trust (registered investment company with 2 portfolios). Context Capital Funds (registered investment company with 1 portfolio). | |||||
NANCY B. WOLCOTT Date of Birth: 11/54 | Trustee | Shall serve until death, resignation or removal. Trustee since 2011. | Retired since May 2014; EVP, Head of GFI Client Service Delivery, BNY Mellon from January 2012 to May 2014; EVP, Head of US Funds Services, BNY Mellon from July 2010 to January 2012; President of PNC Global Investment Servicing from 2008 to July 2010; Chief Operating Officer of PNC Global Investment Servicing from 2007 to 2008; Executive Vice President of PFPC Worldwide Inc. from 2006 to 2007. | 42 | None. | |||||
29
ESTABROOK INVESTMENT GRADE FIXED INCOME FUND
Fund Management
(Unaudited) (Concluded)
Name and Date of Birth | Position(s) Held with Trust | Term of Office and Length of Time Served | Principal Occupation(s) During Past Five Years | |||
| EXECUTIVE OFFICERS | ||||||
JOEL L. WEISS Date of Birth: 1/63 | President and Chief Executive Officer | Shall serve until death, resignation or removal. Officer since 2007. | President of JW Fund Management LLC since June 2016; Vice President and Managing Director of BNY Mellon Investment Servicing (US) Inc. and predecessor firms from 1993 to June 2016.
| |||
T. RICHARD KEYES Date of Birth: 1/57 | Treasurer and Chief Financial Officer | Shall serve until death, resignation or removal. Officer since 2016. | President of TRK Fund Consulting since July 2016; Head of Tax — U.S. Fund Services of BNY Mellon Investment Servicing (US) Inc. and predecessor firms from February 2006 to July 2016.
| |||
VINCENZO A. SCARDUZIO Date of Birth: 4/72 | Secretary | Shall serve until death, resignation or removal. Officer since 2012. | Director and Vice President Regulatory Administration of BNY Mellon Investment Servicing (US) Inc. and predecessor firms since 2001.
| |||
DAVID C. LEBISKY Date of Birth: 5/72 | Chief Compliance Officer and Anti-Money Laundering Officer | Shall serve until death, resignation or removal. Officer since 2015. | President of Lebisky Compliance Consulting LLC since October 2015; Senior Consultant, Freeh Group International Solutions, LLC (a global risk management firm) since 2015; Scotia Institutional Investments US, LP, Director of Regulatory Administration from 2010 to 2014.
| |||
30
[THIS PAGE INTENTIONALLY LEFT BLANK.]
Investment Adviser
Estabrook Capital Management LLC
900 Third Avenue, 10th Floor
New York, NY 10022
Administrator
BNY Mellon Investment Servicing (US) Inc.
301 Bellevue Parkway
Wilmington, DE 19809
Transfer Agent
BNY Mellon Investment Servicing (US) Inc.
4400 Computer Drive
Westborough, MA 01581
Principal Underwriter
Foreside Funds Distributors LLC
400 Berwyn Park
899 Cassatt Road
Berwyn, PA 19312
Custodian
The Bank of New York Mellon
225 Liberty Street
New York, NY 10286
Independent Registered Public Accounting Firm
PricewaterhouseCoopers LLP
Two Commerce Square, Suite 1800
2001 Market Street
Philadelphia, PA 19103-7042
Legal Counsel
Pepper Hamilton LLP
3000 Two Logan Square
18th and Arch Streets
Philadelphia, PA 19103

ESTABROOK INVESTMENT
GRADE FIXED INCOME
FUND
of
FundVantage Trust
Class I
ANNUAL REPORT
April 30, 2017
This report is submitted for the general information of the shareholders of the Estabrook Investment Grade Fixed Income Fund. It is not authorized for distribution unless preceded or accompanied by a current prospectus for the Estabrook Investment Grade Fixed Income Fund.
EST-0417

INSIGHT INVESTMENT GRADE BOND FUND
of
FundVantage Trust
Institutional Class
ANNUAL REPORT
April 30, 2017
This report is submitted for the general information of the shareholders of the Insight Investment Grade Bond Fund. It is not authorized for distribution unless preceded or accompanied by a current prospectus for the Insight Investment Grade Bond Fund.

INSIGHT INVESTMENT GRADE BOND FUND
Investment Adviser’s Annual Report
April 30, 2017
(Unaudited)
Dear Shareholder,
Performance
The Insight Investment Grade Bond Fund (“Fund” or “IGBF”) generated a gross return of 4.06% for the twelve months ended April 30, 2017. This exceeded the return for the Bloomberg Barclays US Aggregate Bond Index (the “benchmark”) that had a return of 0.83%. The one-year period, the 3-year, 5-year, and inception-to-date returns also exceed the benchmark. On a net basis, the Fund had a return of 3.19% in the twelve months ended April 30, 2017. The balanced allocation in the portfolio between rate-sensitive securities on the one hand and spread assets on the other, proved to be an appropriate allocation for the volatility experienced in the markets over the twelve month period.
Returns (%)
Annualized | ||||||||||||
April 30, 2017 | 3 mo
| YTD
| 12 mo
| 3 yr
| 5 yr
| ITD
| ||||||
IGBF - Gross | 1.86 | 2.43 | 4.06 | 4.20 | 4.35 | 4.80 | ||||||
IGBF - Net | 1.65 | 2.15 | 3.19 | 3.32 | 3.48 | 3.93 | ||||||
Bloomberg Barclays Agg* | 1.40 | 1.59 | 0.83 | 2.66 | 2.27 | 3.15 | ||||||
The performance data quoted represents past performance and does not guarantee future results. The investment return and principal value of an investment in the Fund will fluctuate so that an investor’s shares, when redeemed, may be worth more or less than their original cost. Current performance may be lower or higher. Performance data current to the most recent month-end may be obtained by calling (866) 678-6242.
Source: * Bloomberg Barclays U.S. Aggregate Bond® Index. Returns for periods greater than one year are per annum. Past performance is not a guide to future returns. Gross performance is in US dollar terms. Results do not reflect the deduction of investment advisory fees. Client’s returns will be reduced by the investment advisory fees and other expenses.
Market Review
At the beginning of this year, we laid out our expectation for US gross domestic product (GDP) growth of 2.4%, supported by continued strength in consumption and improvement in business investment. We also considered the potential for fiscal stimulus in the form of tax cuts and infrastructure spending, though we expect most of the benefit to be felt in 2018. Based on this central economic view, but facing valuations that largely reflect this scenario, we positioned the portfolios with a moderate overweight to the credit sectors and a modest underweight to headline duration, as we believe the economy is strong enough to allow the Federal Reserve (Fed) to raise interest rates two more times this year. Our overweight to the credit sectors was predicated on the expectation that default rates in 2017 are likely to be benign. Indeed earnings growth is expected to be 10% to 12% this year and from a bottom-up perspective, we don’t see major systemic risks to our expectation for default rates. After the quarter end, we continue to believe that this thesis remains on track.
In March, the Federal Open Market Committee (FOMC) increased the Federal Funds target rate corridor by 25bp, to 0.75% to 1.00%, reflecting the ongoing strength of the US economy and also their improved confidence in its ability to withstand external shocks. US growth momentum strengthened in the second half of 2016 on the back of private consumption, and we expect that the economy can maintain this pace with improved investment spending into 2017. Policy support from the Trump administration could provide an additional growth driver, but we have seen limited policy progress to date.
Elsewhere, GDP growth rates in the UK and China are likely to moderate somewhat after a strong result in 2016, though Europe is showing signs of more sustained momentum. The Dutch and French elections produced a victory for the moderates. We expect the European Central Bank to remain accommodative and look past increases in headline inflation where possible, particularly as oil prices have recently moderated. In the United Kingdom, “Brexit” negotiations for leaving the EU have formally begun, but little progress has shown publicly thus far. Improvements in Asian trade have been supported by a return to investment-led growth by China, as it has tilted fiscal spending again towards infrastructure and property developments in lower-tier cities.
1
INSIGHT INVESTMENT GRADE BOND FUND
Investment Adviser’s Annual Report (Continued)
April 30, 2017
(Unaudited)
US Treasury yields rose modestly during the last twelve months amid stability in global growth and two increases in overnight interest rates. Non-treasury fixed income sectors performed well over the period. Investment grade credit added 345bp of excess returns versus treasury securities. The high yield and asset backed Bloomberg Barclays sectors added 1,330bp and 91bp of excess returns respectively. Ironically, and despite the aforementioned stability in treasury yields, the more “rate-sensitive” non-treasury sectors lagged. The agency mortgage-backed sector gave up 4bp during last twelve months.
Important disclosures
Past performance is not a guide to future performance. The value of investments and any income from them will fluctuate and is not guaranteed (this may partly be due to exchange rate changes) and investors may not get back the amount invested. Transactions in foreign securities may be executed and settled in local markets. Performance comparisons will be affected by changes in interest rates. Investment returns fluctuate due to changes in market conditions. Investment involves risk, including the possible loss of principal. No assurance can be given that the performance objectives of a given strategy will be achieved. The information contained herein is for your reference only and is being provided in response to your specific request and has been obtained from sources believed to be reliable; however, no representation is made regarding its accuracy or completeness. This document must not be used for the purpose of an offer or solicitation in any jurisdiction or in any circumstances in which such offer or solicitation is unlawful or otherwise not permitted. This document should not be duplicated, amended or forwarded to a third party without consent from Insight. This is a marketing document intended for professional clients only and should not be made available to or relied upon by retail clients.
Investment advisory services in North America are provided through four different investment advisers registered with the Securities and Exchange Commission (SEC), using the brand Insight Investment: Cutwater Asset Management Corp. (CAMC), Cutwater Investor Services Corp. (CISC), Insight North America LLC (INA) and Pareto Investment Management Limited (PIML). The North American investment advisers are associated with other global investment managers that also (individually and collectively) use the corporate brand Insight Investment and may be referred to as “Insight” or “Insight Investment”.
The investment adviser providing these advisory services is Cutwater Investor Services Corp. (CISC), an investment adviser registered with the SEC, under the Investment Advisers Act of 1940, as amended, and is also registered with the Commodity Futures Trading Commission (CFTC) as a Commodity Trading Advisor and Commodity Pool Operator. Registration with either the SEC or the CFTC does not imply a certain level of skill or training. You may request, without charge, additional information about Insight. Moreover, specific information relating to Insight’s strategies, including investment advisory fees, may be obtained from CISC’s Form ADV Part 2A, which is available without charge upon request or at www.adviserinfo.sec.gov.
Unless otherwise stated, the source of information is Insight. Any forecasts or opinions are Insight’s own at the date of this document (or as otherwise specified) and may change. Material in this publication is for general information only and is not advice, investment advice, or the recommendation of any purchase or sale of any security. Insight makes no implied or expressed recommendations concerning the manner in which an account should or would be handled, as appropriate investment strategies depend upon specific investment guidelines and objectives and should not be construed to be an assurance that any particular security in a strategy will remain in any fund, account, or strategy, or that a previously held security will not be repurchased. It should not be assumed that any of the security transactions or holdings referenced herein have been or will prove to be profitable or that future investment decisions will be profitable or will equal or exceed the past investment performance of the securities listed.
Insight does not provide tax or legal advice to its clients and all investors are strongly urged to consult their tax and legal advisors regarding any potential strategy or investment.
Information about the indices shown here is provided to allow for comparison of the performance of the strategy to that of certain well-known and widely recognized indices. There is no representation that such index is an appropriate benchmark for such comparison. You cannot invest directly in an index and the indices represented do not take into account trading commissions and/or other brokerage or custodial costs. The volatility of the indices may be materially different from that of the strategy. In addition, the strategy’s holdings may differ substantially from the securities that comprise the indices shown.
The Bloomberg Barclays US Aggregate Bond Index is composed of all fixed-rate, publicly placed, dollar-denominated, nonconvertible Investment grade debt issues with at least $250 million par amount outstanding and with at least one year to final maturity.
Insight and MBSC Securities Corporation are subsidiaries of BNY Mellon. MBSC is a registered broker and FINRA member. BNY Mellon is the corporate brand of The Bank of New York Mellon Corporation and may also be used as a generic term to reference the Corporation as a whole or its various subsidiaries generally. Products and services may be provided under various brand names and in various countries by subsidiaries, affiliates and joint ventures of The Bank of New York Mellon Corporation where authorized and
2
INSIGHT INVESTMENT GRADE BOND FUND
Investment Adviser’s Annual Report (Concluded)
April 30, 2017
(Unaudited)
regulated as required within each jurisdiction. Unless you are notified to the contrary, the products and services mentioned are not insured by the FDIC (or by any governmental entity) and are not guaranteed by or obligations of The Bank of New York Mellon Corporation or any of its affiliates. The Bank of New York Mellon Corporation assumes no responsibility for the accuracy or completeness of the above data and disclaims all expressed or implied warranties in connection therewith.
Insight Investment
This letter is intended to assist shareholders in understanding how the Fund performed during the year ended April 30, 2017 and reflects the views of the investment adviser at the time of this writing. Of course, these views may change and do not guarantee the future performance of the Fund or the markets.
Portfolio composition is subject to change. The current and future portfolio holdings of the Fund are subject to investment risks.
3
INSIGHT INVESTMENT GRADE BOND FUND
Annual Report
Performance Data
April 30, 2017
(Unaudited)
Comparison of Change in Value of $100,000 (investment minimum) in Insight Investment Grade Bond Fund’s Institutional Class vs. Bloomberg Barclays U.S. Aggregate Bond Index
| Average Annual Total Returns for the Periods Ended April 30, 2017 | ||||||||||||||||||
| 1 Year | 3 Year | 5 Year | Since Inception* | |||||||||||||||
Institutional Class | 3.19% | 3.32% | 3.48% | 3.93% | ||||||||||||||
Bloomberg Barclays U.S. Aggregate Bond Index | 0.83% | 2.66% | 2.27% | 3.15%** | ||||||||||||||
* The Insight Investment Grade Bond Fund (the “Fund”) commenced operations on December 2, 2010.
** Benchmark performance is from inception date of the Fund only and is not the inception date of the benchmark itself.
The performance data quoted represents past performance and does not guarantee future results. The investment return and principal value of an investment in the Fund will fluctuate so that an investor’s shares, when redeemed, may be worth more or less than their original cost. The graph and table do not reflect the deduction of taxes that a shareholder would pay on Fund distributions or redemption of Fund shares. Current performance may be lower or higher. Performance data current to the most recent month-end may be obtained by calling (866) 678-6242.
As stated in the current prospectus dated September 1, 2016, the Fund’s “Total Annual Fund Operating Expenses” for Institutional Class shares of the Fund, are 1.29% of the Fund’s average daily net assets. These rates may fluctuate and may differ from the actual expenses incurred by the Fund for the period covered by this report. Cutwater Investor Services Corp. (d/b/a Insight Investment and referred to herein as the “Adviser”) has voluntarily agreed to reduce its investment advisory fee and/or reimburse certain expenses of the Fund to the extent necessary to ensure that the Fund’s total operating expenses (excluding any class-specific fees and expenses, interest, extraordinary items and brokerage commissions) do not exceed 0.85% (on an annual basis) of the Fund’s average daily net assets (the “Voluntary Waiver”). This is not reflected in the table above. Such Voluntary Waiver will continue until the Adviser notifies the Fund of a change in the amount of its Voluntary Waiver or its discontinuation. This Voluntary Waiver may be discontinued at any time at the discretion of the Adviser. Total returns would be lower had such fees and/or expenses not been waived and/or reimbursed.
A 1.00% redemption fee applies to shares redeemed within 60 days of purchase. The redemption fee is not reflected in the returns shown above.
The Fund intends to evaluate performance as compared to that of the Bloomberg Barclays U.S. Aggregate Bond Index. The Bloomberg Barclays U.S. Aggregate Bond Index is an unmanaged index which represents the U.S. investment grade bond market. References to an index over a specific period are provided for your information only and should not be considered indicative of an investment in the Insight Investment Grade Bond Fund. Note that an index is unmanaged and the information contained herein does not reflect any investment management fees or transaction costs. It is impossible to invest directly in an index.
All mutual fund investing involves risk, including possible loss of principal. The Fund is subject to the risks of the fixed-income securities in its portfolio such as credit, prepayment and interest rate risk. As interest rates rise, the value of bond prices will decline and an investor may lose money.
4
INSIGHT INVESTMENT GRADE BOND FUND
Fund Expense Disclosure
April 30, 2017
(Unaudited)
As a shareholder of the Fund, you incur two types of costs: (1) transaction costs, including redemption fees; and (2) ongoing costs, including management fees and other Fund expenses. This example is intended to help you understand your ongoing costs (in dollars) of investing in the Fund and to compare these costs with the ongoing costs of investing in other mutual funds.
This example is based on an investment of $1,000 invested at the beginning of the six month period from November 1, 2016 through April 30, 2017 and held for the entire period.
Actual Expenses
The first line of the accompanying table provides information about actual account values and actual expenses. You may use the information in this line, together with the amount you invested, to estimate the expenses that you paid over the period. Simply divide your account value by $1,000 (for example, an $8,600 account value divided by $1,000 = 8.6), then multiply the result by the number in the first line under the heading entitled “Expenses Paid During Period” to estimate the expenses you paid on your account during this period.
Hypothetical Example for Comparison Purposes
The second line of the accompanying table provides information about hypothetical account values and hypothetical expenses based on the Fund’s actual expense ratio and an assumed rate of return of 5% per year before expenses, which is not your Fund’s actual return. The hypothetical account values and expenses may not be used to estimate the actual ending account balance or expenses you paid for the period. You may use this information to compare the ongoing costs of investing in the Fund and other funds. To do so, compare this 5% hypothetical example with the 5% hypothetical examples that appear in the shareholder reports of other funds.
Please note that the expenses shown in the accompanying table are meant to highlight your ongoing costs only and do not reflect any transactional costs, such as redemption fees. Therefore, the second line of the accompanying table is useful in comparing ongoing costs only, and will not help you determine the relative total costs of owning different funds. In addition, if these transactional costs were included, your costs would have been higher.
| Insight Investment Grade Bond Fund | |||||||||||||||
| Beginning Account Value | Ending Account Value | Expenses Paid | |||||||||||||
| November 1, 2016 | April 30, 2017 | During Period* | |||||||||||||
Institutional Class | |||||||||||||||
Actual | $1,000.00 | $1,002.90 | $4.22 | ||||||||||||
Hypothetical (5% return before expenses) | 1,000.00 | 1,020.58 | 4.26 | ||||||||||||
| * | Expenses are equal to an annualized expense ratio for the six-month period ended April 30, 2017 of 0.85% for the Institutional Class of the Fund, multiplied by the average account value over the period, multiplied by the number of days in the most recent period (181), then divided by 365 to reflect the period. The Fund’s ending account value on the first line in the table is based on the actual six-month total returns for the Fund of 0.29%. |
5
INSIGHT INVESTMENT GRADE BOND FUND
Portfolio Holdings Summary Table
April 30, 2017
(Unaudited)
The following table presents a summary by security type of the portfolio holdings of the Fund:
| % of Net | ||||||||||
| Assets | Value | |||||||||
Corporate Bonds and Notes | 49.8 | % | $ | 20,299,742 | ||||||
Asset Backed Securities | 18.0 | 7,360,073 | ||||||||
Registered Investment Company | 15.3 | 6,234,625 | ||||||||
Residential Mortgage-Backed Securities | 13.0 | 5,287,468 | ||||||||
U.S. Treasury Obligations | 11.0 | 4,478,066 | ||||||||
Commercial Mortgage-Backed Securities | 5.3 | 2,188,205 | ||||||||
Preferred Stock | 1.3 | 539,175 | ||||||||
Municipal Bonds | 1.0 | 398,428 | ||||||||
Liabilities in excess of Other assets | (14.7 | ) | (6,011,768 | ) | ||||||
|
|
|
| |||||||
NET ASSETS | 100.0 | % | $ | 40,774,014 | ||||||
|
|
|
| |||||||
Portfolio holdings are subject to change at any time.
The accompanying notes are an integral part of the financial statements.
6
INSIGHT INVESTMENT GRADE BOND FUND
Portfolio of Investments
April 30, 2017
| Moody’s/ Standard & Poor’s Rating(a) | Principal Amount (000’s) | Value | ||||||||
CORPORATE BONDS AND NOTES — 49.8% | ||||||||||
Agriculture — 0.5% | ||||||||||
Reynolds American, Inc., Co. Gty., 4.45%, 06/12/25 (b) | Baa3/BBB | $ | 180 | $ | 191,967 | |||||
|
| |||||||||
Airlines — 1.7% | ||||||||||
American Airlines 2013-2 Class B Pass Through Trust, 5.60%, 01/15/22 144A(c) | NR/BBB- | 317 | 329,083 | |||||||
American Airlines 2017-1 Class AA Pass Through Trust, 3.65%, 08/15/30 | Aa3/NR | 200 | 202,750 | |||||||
British Airways 2013-1 Class B Pass Through Trust, 5.625%, 12/20/21 144A(c) | A3/BBB | 137 | 143,891 | |||||||
|
| |||||||||
| 675,724 | ||||||||||
|
| |||||||||
Beverages — 1.0% | ||||||||||
Anheuser-Busch InBev Finance, Inc., Co. Gty., 3.70%, 02/01/24 | A3/A- | 145 | 151,000 | |||||||
Anheuser-Busch InBev Finance, Inc., Co. Gty., 4.70%, 02/01/36 (b) | A3/A- | 115 | 123,367 | |||||||
Anheuser-Busch InBev Finance, Inc., Co. Gty., 4.90%, 02/01/46 (b) | A3/A- | 138 | 150,758 | |||||||
|
| |||||||||
| 425,125 | ||||||||||
|
| |||||||||
Chemicals — 0.5% | ||||||||||
Solvay Finance America, LLC, Co. Gty., 3.40%, 12/03/20 144A(b) | Baa2/BBB- | 200 | 206,198 | |||||||
|
| |||||||||
Commercial Services — 0.2% | ||||||||||
Hertz Corp. (The), 5.50%, 10/15/24 144A(b) | B2/B | 115 | 99,188 | |||||||
|
| |||||||||
Diversified Financial Services — 15.2% | ||||||||||
Bank of America Corp., Sr. Unsec. Notes, 5.875%, 01/05/21 | Baa1/BBB+ | 320 | 357,178 | |||||||
Bank of America Corp., Sub. Notes, 4.45%, 03/03/26 | Baa3/BBB | 118 | 122,073 | |||||||
Bear Stearns Cos., LLC (The), Sr. Unsec. Notes, 6.40%, 10/02/17 | A3/A- | 267 | 272,544 | |||||||
Citigroup, Inc., Sr. Unsec. Notes, 2.485%, 09/01/23 (b)(d) | Baa1/BBB+ | 203 | 207,922 | |||||||
Citigroup, Inc., Sr. Unsec. Notes, 3.887%, 01/10/28 (b)(d) | Baa1/BBB+ | 200 | 202,937 | |||||||
Citigroup, Inc., Sub. Notes, 4.60%, 03/09/26 | Baa3/BBB | 365 | 378,648 | |||||||
Citigroup, Inc., Sub. Notes, 5.30%, 05/06/44 | Baa3/BBB | 174 | 188,194 | |||||||
GE Capital International Funding Co., Co. Gty., 2.342%, 11/15/20 | A1/AA- | 215 | 216,409 | |||||||
General Electric Capital Corp., Sub. Notes, 5.30%, 02/11/21 | A2/A+ | 75 | 83,303 | |||||||
General Electric Co., Jr. Sub. Notes, 5.00%, 01/21/21 (b)(d)(e) | A3/A | 437 | 460,926 | |||||||
Goldman Sachs Group, Inc. (The), Sr. Unsec. Notes, 3.50%, 11/16/26 (b) | A3/BBB+ | 182 | 179,753 | |||||||
Goldman Sachs Group, Inc. (The), Sr. Unsec. Notes, 2.922%, 10/28/27 (b)(d) | A3/BBB+ | 250 | 257,685 | |||||||
HSBC Capital Funding LP/Jersey Channel Islands, Ltd., Co. Gty., 10.176%, 12/29/49 144A(b)(d)(e) | Baa1/BBB- | 325 | 498,875 | |||||||
ING Bank NV, Sub. Notes, 4.125%, 11/21/23 (b)(d) | Baa2/BBB+ | 350 | 357,000 | |||||||
Intesa Sanpaolo SpA., Co. Gty., 3.875%, 01/15/19 | Baa1/BBB- | 200 | 204,443 | |||||||
Intesa Sanpaolo SpA., Sub. Notes, 5.71%, 01/15/26 144A | Ba1/BB | 225 | 221,600 | |||||||
JPMorgan Chase & Co., Jr. Sub. Notes, 7.90%, 12/29/49 (b)(d)(e) | Baa3/BBB- | 387 | 404,415 | |||||||
JPMorgan Chase & Co., Sr. Unsec. Notes, 2.70%, 05/18/23 (b) | A3/A- | 260 | 256,206 | |||||||
Morgan Stanley, Sr. Unsec. Notes, 5.50%, 07/24/20 | A3/BBB+ | 425 | 464,309 | |||||||
Morgan Stanley, Sr. Unsec. Notes, 4.30%, 01/27/45 | A3/BBB+ | 40 | 39,983 | |||||||
Nasdaq Inc., Sr. Unsec. Notes, 3.85%, 06/30/26 (b) | Baa3/BBB | 238 | 240,025 | |||||||
Royal Bank of Scotland Group PLC, 7.64%, 12/31/49 (b)(d)(e) | B1/B+ | 200 | 187,000 | |||||||
Synchrony Financial, Sr. Unsec. Notes, 2.60%, 01/15/19 (b) | NR/BBB- | 164 | 165,211 | |||||||
Trinity Acquisition PLC, Co. Gty., 4.40%, 03/15/26 (b) | Baa3/BBB | 43 | 44,517 | |||||||
The accompanying notes are an integral part of the financial statements.
7
INSIGHT INVESTMENT GRADE BOND FUND
Portfolio of Investments (Continued)
April 30, 2017
| Moody’s/ Standard & Poor’s Rating(a) | Principal Amount (000’s) | Value | ||||||||
CORPORATE BONDS AND NOTES — (Continued) | ||||||||||
Diversified Financial Services — (Continued) | ||||||||||
Westpac Banking Corp., Sub. Notes, 4.322%, 11/23/31 (b)(d) | A3/BBB+ | $ | 183 | $ | 187,760 | |||||
|
| |||||||||
| 6,198,916 | ||||||||||
|
| |||||||||
Energy — 3.7% | ||||||||||
BG Energy Capital PLC, Co. Gty., 6.50%, 11/30/72 (b)(d) | NR/BBB+ | 300 | 306,898 | |||||||
Cimarex Energy Co., 3.90%, 05/15/27 (b) | Baa3/BBB- | 75 | 75,839 | |||||||
CITGO Petroleum Corp., Sr. Sec. Notes, 6.25%, 08/15/22 144A(b) | B3/B+ | 189 | 192,780 | |||||||
Concho Resources, Inc., Co. Gty., 4.375%, 01/15/25 (b) | Ba2/BB+ | 137 | 138,712 | |||||||
Consumers Energy Co., 3.25%, 08/15/46 (b) | A1/A | 111 | 99,684 | |||||||
Marathon Petroleum Corp., Sr. Unsec. Notes, 4.75%, 09/15/44 (b) | Baa2/BBB | 118 | 109,184 | |||||||
McDermott International, Inc., Sec. Notes, 8.00%, 05/01/21 144A(b) | B2/BB | 127 | 132,144 | |||||||
Petrobras Global Finance BV, Co. Gty., 7.375%, 01/17/27 | B2/B+ | 100 | 107,530 | |||||||
Sunoco LP/Sunoco Finance Corp., Co. Gty., 6.25%, 04/15/21 (b) | B1/B+ | 154 | 162,661 | |||||||
Tesoro Corp., Co. Gty., 4.75%, 12/15/23 144A(b) | Ba2/BB+ | 53 | 55,518 | |||||||
Williams Partners LP, Sr. Unsec. Notes, 4.30%, 03/04/24 (b) | Baa3/BBB- | 80 | 83,098 | |||||||
Williams Partners LP, Sr. Unsec. Notes, 4.00%, 09/15/25 (b) | Baa3/BBB- | 35 | 35,697 | |||||||
|
| |||||||||
| 1,499,745 | ||||||||||
|
| |||||||||
Food — 1.1% | ||||||||||
Kraft Heinz Foods Co., Co. Gty., 5.20%, 07/15/45 (b) | Baa3/BBB- | 45 | 47,567 | |||||||
McDonald’s Corp., Sr. Unsec. Notes, 3.70%, 01/30/26 (b) | Baa1/BBB+ | 26 | 26,811 | |||||||
Smithfield Foods, Inc., Co. Gty., 4.25%, 02/01/27 144A(b) | Ba2/BBB- | 183 | 186,876 | |||||||
Sysco Corp., Co. Gty., 2.60%, 10/01/20 (b) | A3/BBB+ | 175 | 176,696 | |||||||
|
| |||||||||
| 437,950 | ||||||||||
|
| |||||||||
Healthcare — 0.4% | ||||||||||
Actavis Funding SCS, Co. Gty., 4.75%, 03/15/45 (b) | Baa3/BBB | 30 | 30,555 | |||||||
MEDNAX, Inc., Co. Gty., 5.25%, 12/01/23 144A(b) | Ba2/BBB- | 42 | 42,945 | |||||||
Teva Pharmaceutical Finance Netherlands III BV, Co. Gty, 3.15%, 10/01/26 | Baa2/BBB | 68 | 63,315 | |||||||
Teva Pharmaceutical Finance Netherlands III BV, Co. Gty, 4.10%, 10/01/46 | Baa2/BBB | 33 | 28,403 | |||||||
|
| |||||||||
| 165,218 | ||||||||||
|
| |||||||||
Household & Personal Products — 0.3% | ||||||||||
Newell Brands, Inc., Sr. Unsec. Notes, 4.20%, 04/01/26 (b) | Baa3/BBB- | 107 | 112,464 | |||||||
|
| |||||||||
Industrial — 2.6% | ||||||||||
ERAC USA Finance LLC, Co. Gty., 4.50%, 02/15/45 144A(b) | Baa1/BBB+ | 215 | 205,074 | |||||||
Heathrow Funding Ltd., Sr. Sec. Notes, 4.875%, 07/15/23 144A | NR/A- | 100 | 107,445 | |||||||
Norfolk Southern Corp., Sr. Unsec. Notes, 4.65%, 01/15/46 (b) | Baa1/BBB+ | 200 | 216,590 | |||||||
Penske Truck Leasing Co. LP/PTL Finance Corp., Sr. Unsec. Notes, 3.375%, 02/01/22 144A(b) | Baa2/BBB | 201 | 205,509 | |||||||
Penske Truck Leasing Co. LP/PTL Finance Corp., Sr. Unsec. Notes, 3.40%, 11/15/26 144A(b) | Baa2/BBB | 141 | 136,713 | |||||||
Sydney Airport Finance Co. Pty Ltd., Sr. Sec. Notes, 3.375%, 04/30/25 144A(b) | Baa2/BBB | 70 | 69,234 | |||||||
United Technologies Corp., Sr. Unsec. Notes, 1.50%, 11/01/19 | A3/A- | 139 | 138,136 | |||||||
|
| |||||||||
| 1,078,701 | ||||||||||
|
| |||||||||
The accompanying notes are an integral part of the financial statements.
8
INSIGHT INVESTMENT GRADE BOND FUND
Portfolio of Investments (Continued)
April 30, 2017
| Moody’s/ Standard & Poor’s Rating(a) | Principal Amount (000’s) | Value | ||||||||||
CORPORATE BONDS AND NOTES — (Continued) | ||||||||||||
Insurance — 6.8% | ||||||||||||
Allstate Corp. (The), Jr. Sub. Notes, 6.50%, 05/15/67 (b)(d) | Baa1/BBB | $ | 325 | $ | 372,125 | |||||||
American Financial Group, Inc., Sr. Unsec. Notes, 9.875%, 06/15/19 | Baa1/BBB+ | 130 | 150,542 | |||||||||
American International Group, Inc., Jr. Sub. Notes, 8.175%, 05/15/68 (b)(d) | Baa2/BBB- | 325 | 419,250 | |||||||||
Liberty Mutual Group, Inc., Co. Gty., 4.036%, 03/07/67 144A(b)(d) | Baa3/BB+ | 408 | 390,048 | |||||||||
Massachusetts Mutual Life Insurance Co., 4.90%, 04/01/77 144A | A1e/AA- | 179 | 183,735 | |||||||||
MetLife, Inc., 6.40%, 12/15/66 (b) | Baa2/BBB | 216 | 243,000 | |||||||||
Principal Financial Group, Inc., Co. Gty., 3.10%, 11/15/26 (b) | Baa1/BBB+ | 195 | 190,892 | |||||||||
Prudential Financial, Inc., Jr. Sub. Notes, 5.20%, 03/15/44 (b)(d) | Baa2/BBB+ | 400 | 416,000 | |||||||||
SAFG Retirement Services, Inc., Sr. Unsec. Notes, 8.125%, 04/28/23 | Baa1/BBB+ | 145 | 179,138 | |||||||||
Travelers Cos., Inc. (The), Jr. Sub. Notes, 3.346%, 03/15/67 (b)(d) | A3/NR | 244 | 236,070 | |||||||||
|
| |||||||||||
| 2,780,800 | ||||||||||||
|
| |||||||||||
Lodging — 0.5% | ||||||||||||
Wyndham Worldwide Corp., 4.50%, 04/01/27 (b) | Baa3/BBB- | 181 | 184,660 | |||||||||
|
| |||||||||||
Media — 3.1% | ||||||||||||
CCO Holdings LLC / CCO Holdings Capital Corp., Sr. Unsec. Notes, 5.75%, 02/15/26 144A(b) | B1/BB+ | 94 | 99,845 | |||||||||
Charter Communications Operating, LLC / Charter Communications Operating Capital., Sr. Sec. Notes, 4.464%, 07/23/22 (b) | Ba1/BBB- | 220 | 233,645 | |||||||||
Comcast Corp., Co. Gty., 3.30%, 02/01/27 (b) | A3/A- | 203 | 204,152 | |||||||||
Numericable-SFR SAS, Sr. Sec. Notes, 6.25%, 05/15/24 144A(b) | B1/B+ | 250 | 258,750 | |||||||||
VTR Finance BV, Sr. Sec. Notes, 6.875%, 01/15/24 144A(b) | B1/B+ | 425 | 451,562 | |||||||||
|
| |||||||||||
| 1,247,954 | ||||||||||||
|
| |||||||||||
Mining — 1.2% | ||||||||||||
BHP Billiton Finance USA Ltd., Co. Gty., 6.75%, 10/19/75 144A(b)(d) | Baa2/BBB+ | 200 | 226,500 | |||||||||
Teck Resources Ltd., Co. Gty., 5.20%, 03/01/42 (b) | B1/BB | 296 | 282,680 | |||||||||
|
| |||||||||||
| 509,180 | ||||||||||||
|
| |||||||||||
Pipe Lines Ex Natural Gas — 3.9% | ||||||||||||
Columbia Pipeline Group, Inc., Co. Gty, 4.50%, 06/01/25 (b) | Baa2/A- | 70 | 74,113 | |||||||||
Enbridge, Inc., Sr. Unsec. Notes, 4.25%, 12/01/26 (b) | Baa2/BBB+ | 90 | 93,851 | |||||||||
Enbridge, Inc., Sr. Unsec. Notes, 5.50%, 12/01/46 (b) | Baa2/BBB+ | 136 | 149,419 | |||||||||
Enterprise Products Operating LLC, Co. Gty., 7.034%, 01/15/68 (b)(d) | Baa2/BBB- | 211 | 217,858 | |||||||||
IFM US Colonial Pipeline 2 LLC, Sr. Sec. Notes, 6.45%, 05/01/21 144A(b) | NR/BB | 175 | 189,414 | |||||||||
Kinder Morgan Energy Partners LP, Co. Gty., 9.00%, 02/01/19 | Baa3/BBB- | 130 | 144,891 | |||||||||
MPLX LP, 5.20%, 03/01/47 (b) | Baa3/BBB- | 117 | 119,799 | |||||||||
Regency Energy Partners LP/Regency Energy Finance Corp., Co. Gty., 6.50%, 07/15/21 (b) | Baa3/BBB- | 370 | 381,100 | |||||||||
Sabine Pass Liquefaction, LLC, 4.20%, 03/15/28 144A(b) | Ba1/BBB- | 185 | 185,246 | |||||||||
Tesoro Logistics LP / Tesoro Logistics Finance Corp., Co. Gty., 5.25%, 01/15/25 (b) | Ba3/BB+ | 13 | 13,796 | |||||||||
|
| |||||||||||
| 1,569,487 | ||||||||||||
|
| |||||||||||
Technology — 0.5% | ||||||||||||
Microsoft Corp., Sr. Unsec. Notes, 3.95%, 08/08/56 (b) | Aaa/AAA | 203 | 192,100 | |||||||||
|
| |||||||||||
The accompanying notes are an integral part of the financial statements.
9
INSIGHT INVESTMENT GRADE BOND FUND
Portfolio of Investments (Continued)
April 30, 2017
| Moody’s/ Standard & Poor’s Rating(a) | Principal Amount (000’s) | Value | ||||||||||
CORPORATE BONDS AND NOTES — (Continued) | ||||||||||||
Telecommunications — 3.4% | ||||||||||||
AT&T, Inc., Sr. Unsec. Notes, 4.50%, 05/15/35 (b) | Baa1/BBB+ | $ | 300 | $ | 284,130 | |||||||
AT&T, Inc., Sr. Unsec. Notes, 4.75%, 05/15/46 (b) | Baa1/BBB+ | 70 | 65,570 | |||||||||
Bharti Airtel International Netherlands BV, Co. Gty., 5.35%, 05/20/24 144A | Baa3/BBB- | 360 | 382,344 | |||||||||
Frontier Communications Corp., Sr. Unsec. Notes, 8.50%, 04/15/20 | B1/BB- | 325 | 345,719 | |||||||||
Verizon Communications, Inc., Sr. Unsec. Notes, 2.871%, 09/14/18 (d) | Baa1/BBB+ | 195 | 198,981 | |||||||||
Verizon Communications, Inc., Sr. Unsec. Notes, 5.012%, 08/21/54 | Baa1/BBB+ | 60 | 58,225 | |||||||||
Verizon Communications, Inc., Sr. Unsec. Notes, 4.672%, 03/15/55 | Baa1/BBB+ | 72 | 65,732 | |||||||||
|
| |||||||||||
| 1,400,701 | ||||||||||||
|
| |||||||||||
Utilities — 3.2% | ||||||||||||
Black Hills Corp., Sr. Unsec. Notes, 4.25%, 11/30/23 (b) | Baa2/BBB | 100 | 105,797 | |||||||||
Black Hills Corp., Sr. Unsec. Notes, 3.95%, 01/15/26 (b) | Baa2/BBB | 193 | 198,760 | |||||||||
Duquesne Light Holdings, Inc., Sr. Unsec. Notes, 6.40%, 09/15/20 144A | Baa3/BBB- | 163 | 182,286 | |||||||||
Electricite de France SA, Jr. Sub. Notes, 5.25%, 12/29/49 144A(b)(d)(e) | Baa3/BB | 208 | 208,000 | |||||||||
Exelon Corp., Sr. Unsec. Notes, 3.40%, 04/15/26 (b) | Baa2/BBB- | 91 | 90,417 | |||||||||
Great Plains Energy, Inc., 3.90%, 04/01/27 (b) | Baa3/BBB | 234 | 236,383 | |||||||||
Great Plains Energy, Inc., 4.85%, 04/01/47 (b) | Baa3/BBB | 33 | 33,526 | |||||||||
Southern Co. Gas Capital Corp., Co. Gty., 3.95%, 10/01/46 (b) | Baa1/A- | 98 | 91,176 | |||||||||
Southern Power Co., Sr. Unsec. Notes, 5.25%, 07/15/43 | Baa1/BBB+ | 170 | 177,319 | |||||||||
|
| |||||||||||
| 1,323,664 | ||||||||||||
|
| |||||||||||
TOTAL CORPORATE BONDS AND NOTES (Cost $19,741,754) | 20,299,742 | |||||||||||
|
| |||||||||||
ASSET BACKED SECURITIES — 18.0% | ||||||||||||
AmeriCredit Automobile Receivables Trust, Series 2015-4, Class A3, 1.70%, 07/08/20 (b) | NR/AAA | 175 | 175,191 | |||||||||
Antares CLO 2017-1 Ltd., Class B, 0.00%, 07/20/28 144A(b)(c)(d) | NR/AA | 275 | 275,000 | |||||||||
BCC Funding XIII, LLC, Series 2016-1, Class A2, 2.20%, 12/20/21 144A(b)(c) | Aa2/NR | 387 | 385,671 | |||||||||
Carlyle Global Market Strategies CLO Ltd., Series 2014-3A, Class B, 3.32%, 07/27/26 144A(b)(c)(d) | A1/NR | 500 | 503,811 | |||||||||
Chase Issuance Trust, Series 2015-A2, Class A2, 1.59%, 02/18/20 (b) | Aaa/AAA | 715 | 715,883 | |||||||||
CPS Auto Receivables Trust, Series 2015-B, Class A, 1.65%, 11/15/19 144A(b) | NR/AAA | 54 | 54,110 | |||||||||
CPS Auto Receivables Trust, Series 2015-C, Class B, 2.55%, 02/18/20 144A(b) | NR/AAA | 175 | 176,072 | |||||||||
CPS Auto Trust, Series 2016-D, Class B, 2.11%, 03/15/21 144A(b) | NR/AA | 281 | 280,000 | |||||||||
DRB Prime Student Loan Trust 2017-A, Class A2B, 2.85%, 05/27/42 144A(b) | Aaa/NR | 387 | 386,858 | |||||||||
Drive Auto Receivables Trust, Series 2016-CA, Class B, 2.37%, 11/16/20 144A(b) | Aa1/AA | 121 | 121,369 | |||||||||
DT Auto Owner Trust, Series 2016-1A, Class B, 2.79%, 05/15/20 144A(b) | NR/AA | 250 | 250,824 | |||||||||
Flagship Credit Auto Trust, Series 2016-1, Class A, 2.77%, 12/15/20 144A(b) | NR/AA | 138 | 138,749 | |||||||||
Golub Capital Partners CLO 19B-R Ltd., Class A2, 0.00%, 07/26/29 144A(b)(c)(d) | Aa2e/NR | 340 | 340,000 | |||||||||
Greystone Commercial Real Estate Notes 2017-FL1 Ltd., Class A, 2.708%, 03/15/27 144A(b)(c)(d) | Aaa/NR | 100 | 100,100 | |||||||||
IVY Hill Middle Market Credit Fund XII Ltd., Class A2, 0.00%, 07/07/29 144A(b)(c)(d) | Aaa/NR | 340 | 340,000 | |||||||||
Kubota Credit Owner Trust, Series 2016-1A, Class A3, 1.50%, 07/15/20 144A(b)(c) | Aaa/NR | 100 | 99,435 | |||||||||
MVW Owner Trust, Series 2016-1A, Class A, 2.25%, 12/20/33 144A(b) | NR/A+ | 173 | 170,710 | |||||||||
Navistar Financial Dealer Note Master Owner Trust II, Series 2016-1, Class A, 2.341%, 09/27/21 144A(d) | Aaa/NR | 309 | 309,703 | |||||||||
The accompanying notes are an integral part of the financial statements.
10
INSIGHT INVESTMENT GRADE BOND FUND
Portfolio of Investments (Continued)
April 30, 2017
| Moody’s/ Standard & Poor’s Rating(a) | Principal Amount (000’s) | Value | ||||||||||
ASSET BACKED SECURITIES — (Continued) | ||||||||||||
NextGear Floorplan Master Owner Trust, Class A2, 2.54%, 04/18/22 144A(b) | Aaa/AAA | $ | 265 | $ | 264,981 | |||||||
North End CLO, Ltd., Series 2013-1A, Class B, 2.808%, 07/17/25 144A(b)(c)(d) | NR/AA | 1,000 | 983,740 | |||||||||
SMB Private Education Loan Trust, Series 2017-A, Class A2A, 2.88%, 09/15/34 144A(b) | Aaa/AAA | 300 | 300,784 | |||||||||
Spirit Master Funding LLC, Series 2014-2A, Class A, 5.76%, 03/20/42 144A(b)(c) | NR/A+ | 294 | 308,294 | |||||||||
TAL Advantage V LLC, Series 2013-1A, Class A, 2.83%, 02/22/38 144A(b) | NR/A | 246 | 239,040 | |||||||||
TAL Advantage V LLC, Series 2014-2A, Class A1, 1.70%, 05/20/39 144A(b) | NR/A | 26 | 25,421 | |||||||||
Verizon Owner Trust, Series 2016-1A, Class A, 1.42%, 01/20/21 144A(b) | NR/AAA | 122 | 121,414 | |||||||||
VSE VOI Mortgage LLC, Series 2016-A, Class A, 2.54%, 07/20/33 144A(b) | NR/A+ | 294 | 292,913 | |||||||||
|
| |||||||||||
TOTAL ASSET BACKED SECURITIES (Cost $7,376,988) | 7,360,073 | |||||||||||
|
| |||||||||||
COMMERCIAL MORTGAGE-BACKED SECURITIES — 5.3% | ||||||||||||
BLCP Hotel Trust, Series 2014-CLRN, Class B, 2.344%, 08/15/29 144A(b)(d) | NR/AA- | 305 | 305,479 | |||||||||
Citigroup Commercial Mortgage Trust, Series 2013-375P, Class D, 3.635%, 05/10/35 144A(d) | Baa1/NR | 350 | 346,820 | |||||||||
Citigroup Commercial Mortgage Trust, Series 2016-P6, Class C, 4.431%, 12/10/49(b)(d) | NR/NR | 67 | 67,146 | |||||||||
FREMF Mortgage Trust, Series 2015-K44, Class B, 3.811%, 01/25/48 144A(b)(d) | NR/NR | 90 | 89,652 | |||||||||
Latitude Management Real Estate Investors, Inc., Series 2016-CRE2, Class A, 2.677%, 11/24/31 144A(b)(c)(d) | Aaa/NR | 125 | 124,722 | |||||||||
Morgan Stanley Bank of America Merrill Lynch Trust, Series 2012-CKSV, Class C, 4.432%, 10/15/30 144A(d) | NR/A | 540 | 545,124 | |||||||||
Resource Capital Corp. Ltd., Series 2014-CRE2, Class A, 2.044%, 04/15/32 144A(b)(c)(d) | Aaa/NR | 43 | 43,187 | |||||||||
Wells Fargo Commercial Mortgage Trust, Series 2014-TISH, Class SCH2, 4.494%, 01/15/27 144A(c)(d) | NR/BB | 450 | 437,597 | |||||||||
Wells Fargo Commercial Mortgage Trust, Series 2014-TISH, Class WTS2, 4.244%, 02/15/27 144A(c)(d) | NR/BB | 225 | 228,478 | |||||||||
|
| |||||||||||
TOTAL COMMERCIAL MORTGAGE-BACKED SECURITIES (Cost $2,182,210) | �� | 2,188,205 | ||||||||||
|
| |||||||||||
RESIDENTIAL MORTGAGE-BACKED SECURITIES — 13.0% | ||||||||||||
FHLMC Gold Pool TBA, 3.50%, 05/01/47 | Aaa/AA+ | 789 | 811,283 | |||||||||
FNMA Pool TBA, 2.50%, 05/01/32 | Aaa/AA+ | 1,361 | 1,368,815 | |||||||||
FNMA Pool TBA, 4.00%, 05/01/47 | Aaa/AA+ | 1,118 | 1,177,394 | |||||||||
FNMA Pool TBA, 3.00%, 05/01/47 | Aaa/AA+ | 642 | 641,248 | |||||||||
GNMA Pool TBA, 3.50%, 05/20/47 | Aaa/AA+ | 1,240 | 1,288,728 | |||||||||
|
| |||||||||||
TOTAL RESIDENTIAL MORTGAGE-BACKED SECURITIES (Cost $5,268,490) | 5,287,468 | |||||||||||
|
| |||||||||||
MUNICIPAL BONDS — 1.0% | ||||||||||||
State of California, Build America Bonds, GO, 7.55%, 04/01/39 | Aa3/AA- | 270 | 398,428 | |||||||||
|
| |||||||||||
TOTAL MUNICIPAL BONDS (Cost $381,658) | 398,428 | |||||||||||
|
| |||||||||||
U.S. TREASURY OBLIGATIONS — 11.0% | ||||||||||||
United States Treasury Inflation Indexed Bond, 0.75%, 02/15/45 | Aaa/AA+ | 379 | 363,777 | |||||||||
United States Treasury Inflation Indexed Bond, 1.00%, 02/15/46 | Aaa/AA+ | 118 | 121,111 | |||||||||
United States Treasury Note, 1.875%, 02/28/22 | Aaa/AA+ | 88 | 88,292 | |||||||||
United States Treasury Note, 2.125%, 02/29/24 | Aaa/AA+ | 231 | 231,586 | |||||||||
United States Treasury Note, 2.25%, 02/15/27 | Aaa/AA+ | 2,695 | 2,687,203 | |||||||||
United States Treasury Note, 3.00%, 02/15/47 | Aaa/AA+ | 977 | 986,097 | |||||||||
|
| |||||||||||
TOTAL U.S. TREASURY OBLIGATIONS (Cost $4,458,788) | 4,478,066 | |||||||||||
|
| |||||||||||
The accompanying notes are an integral part of the financial statements.
11
INSIGHT INVESTMENT GRADE BOND FUND
Portfolio of Investments (Concluded)
April 30, 2017
| Moody’s/ Standard & Poor’s Rating(a) | Number of shares | Value | ||||||||||
PREFERRED STOCK — 1.3% | ||||||||||||
Diversified Financial Services — 1.3% | ||||||||||||
CoBank ACB, 6.25% | NR/BBB+ | 5,200 | $ | 539,175 | ||||||||
|
| |||||||||||
TOTAL PREFERRED STOCK (Cost $542,100) | 539,175 | |||||||||||
|
| |||||||||||
REGISTERED INVESTMENT COMPANY — 15.3% | ||||||||||||
BlackRock Liquidity Funds Fedfund Portfolio, Institutional Shares, 0.65%(f) | Aaa/AA+ | 6,234,625 | 6,234,625 | |||||||||
|
| |||||||||||
TOTAL REGISTERED INVESTMENT COMPANY (Cost $6,234,625) | 6,234,625 | |||||||||||
|
| |||||||||||
TOTAL INVESTMENTS - 114.7% (Cost $46,186,613) | 46,785,782 | |||||||||||
LIABILITIES IN EXCESS OF OTHER ASSETS - (14.7)% | (6,011,768 | ) | ||||||||||
|
| |||||||||||
NET ASSETS - 100.0% | $ | 40,774,014 | ||||||||||
|
| |||||||||||
| (a) | Ratings for debt securities are unaudited. All ratings are as of April 30, 2017 and may have changed subsequently. |
| (b) | This security is callable. |
| (c) | Security is deemed illiquid at April 30, 2017. |
| (d) | Floating or variable rate security. Rate disclosed is as of April 30, 2017. |
| (e) | Security is perpetual. Date shown is next call date. |
| (f) | Rate periodically changes. Rate disclosed is the daily yield on April 30, 2017. |
144A Securities were purchased pursuant to Rule 144A under the Securities Act of 1933 and may not be resold subject to that rule except to qualified institutional buyers. At April 30, 2017, these securities amounted to $14,180,861 or 34.8% of net assets. These securities have been determined by the Adviser to be liquid securities, unless otherwise noted.
| Legend | ||
| CLO | Collateralized Loan Obligation | |
| Co. Gty. | Company Guaranty | |
| FHLMC | Federal Home Loan Mortgage Corp. | |
| FNMA | Federal National Mortgage Association | |
| FREMF | Federal Home Loan Mortgage Corp. (Multi-Family) | |
| GNMA | Government National Mortgage Association | |
| GO | General Obligations | |
| Jr. | Junior | |
| LLC | Limited Liability Company | |
| LP | Limited Partnership | |
| Ltd. | Limited | |
| NR | Not Rated | |
| PLC | Public Limited Company | |
| Sec. | Secured | |
| Sr. | Senior | |
| Sub. | Subordinated | |
| TBA | To Be Announced | |
| Unsec. | Unsecured |
The accompanying notes are an integral part of the financial statements.
12
INSIGHT INVESTMENT GRADE BOND FUND
Statement of Assets and Liabilities
April 30, 2017
Assets | ||||
Investments, at value (Cost $46,186,613) | $ | 46,785,782 | ||
Receivable for investments sold | 4,172,356 | |||
Dividends and interest receivable | 322,362 | |||
Prepaid expenses and other assets | 7,579 | |||
|
| |||
Total assets | 51,288,079 | |||
|
| |||
Liabilities | ||||
Payable for investments purchased | 10,403,390 | |||
Payable to Investment Adviser | 19,280 | |||
Payable for administration and accounting fees | 13,833 | |||
Payable for transfer agent fees | 13,231 | |||
Payable for legal fees | 1,794 | |||
Accrued expenses | 62,537 | |||
|
| |||
Total liabilities | 10,514,065 | |||
|
| |||
Net Assets | $ | 40,774,014 | ||
|
| |||
Net Assets Consisted of: | ||||
Capital stock, $0.01 par value | $ | 40,548 | ||
Paid-in capital | 40,215,325 | |||
Accumulated net realized loss from investments | (81,028 | ) | ||
Net unrealized appreciation on investments | 599,169 | |||
|
| |||
Net Assets | $ | 40,774,014 | ||
|
| |||
Institutional Class: | ||||
Net asset value, offering and redemption price per share ($40,774,014 / 4,054,796 shares) | $10.06 | |||
The accompanying notes are an integral part of the financial statements.
13
INSIGHT INVESTMENT GRADE BOND FUND
Statement of Operations
For the Year Ended April 30, 2017
Investment Income | ||||
Interest | $ | 1,379,836 | ||
Dividends | 49,400 | |||
|
| |||
Total investment income | 1,429,236 | |||
|
| |||
Expenses | ||||
Advisory fees (Note 2) | 201,106 | |||
Administration and accounting fees (Note 2) | 90,514 | |||
Audit fees | 68,766 | |||
Transfer agent fees (Note 2) | 52,692 | |||
Legal fees | 31,835 | |||
Trustees’ and officers’ fees (Note 2) | 28,206 | |||
Custodian fees (Note 2) | 23,263 | |||
Printing and shareholder reporting fees | 11,193 | |||
Registration and filing fees | 724 | |||
Other expenses | 15,547 | |||
|
| |||
Total expenses before waivers and reimbursements | 523,846 | |||
|
| |||
Less: waivers and reimbursements (Note 2) | (182,518 | ) | ||
|
| |||
Net expenses after waivers and reimbursements | 341,328 | |||
|
| |||
Net investment income | 1,087,908 | |||
|
| |||
Net realized and unrealized gain/(loss) from investments: | ||||
Net realized gain from investments | 254,523 | |||
Net change in unrealized appreciation/(depreciation) on investments | (80,236 | ) | ||
|
| |||
Net realized and unrealized gain on investments | 174,287 | |||
|
| |||
Net increase in net assets resulting from operations | $ | 1,262,195 | ||
|
|
The accompanying notes are an integral part of the financial statements.
14
INSIGHT INVESTMENT GRADE BOND FUND
Statements of Changes in Net Assets
For the Year Ended | For the Year Ended | |||||||||
Increase/(decrease) in net assets from operations: | ||||||||||
Net investment income | $ | 1,087,908 | $ | 1,089,232 | ||||||
Net realized gain from investments | 254,523 | 72,969 | ||||||||
Net change in unrealized appreciation/(depreciation) on investments | (80,236 | ) | (425,684 | ) | ||||||
|
|
|
| |||||||
Net increase in net assets resulting from operations | 1,262,195 | 736,517 | ||||||||
|
|
|
| |||||||
Less Dividends and Distributions to Shareholders from: | ||||||||||
Net investment income: | ||||||||||
Institutional Class | (1,134,014 | ) | (1,149,482 | ) | ||||||
|
|
|
| |||||||
Net realized capital gain: | ||||||||||
Institutional Class | (208,962 | ) | — | |||||||
|
|
|
| |||||||
Return of capital: | ||||||||||
Institutional Class | (38,751 | ) | — | |||||||
|
|
|
| |||||||
Net decrease in net assets from dividends and distributions to shareholders | (1,381,727 | ) | (1,149,482 | ) | ||||||
|
|
|
| |||||||
Increase in Net Assets Derived from Capital Share Transactions (Note 5) | 1,381,727 | 1,149,482 | ||||||||
|
|
|
| |||||||
Total increase in net assets | 1,262,195 | 736,517 | ||||||||
|
|
|
| |||||||
Net assets | ||||||||||
Beginning of year | 39,511,819 | 38,775,302 | ||||||||
|
|
|
| |||||||
End of year | $ | 40,774,014 | $ | 39,511,819 | ||||||
|
|
|
| |||||||
Accumulated net investment income, end of year | $ | — | $ | 28,472 | ||||||
|
|
|
| |||||||
The accompanying notes are an integral part of the financial statements.
15
INSIGHT INVESTMENT GRADE BOND FUND
Financial Highlights
Contained below is per share operating performance data for Institutional Class shares outstanding, total investment return, ratios to average net assets and other supplemental data for the respective period. The total returns in the table represent the rate that an investor would have earned or lost on an investment in the Fund (assuming reinvestment of all dividends and distributions). This information has been derived from information provided in the financial statements and should be read in conjunction with the financial statements and the notes thereto.
| Institutional Class | ||||||||||||||||||||
| For the Year Ended April 30, 2017 | For the Year Ended April 30, 2016 | For the Year Ended April 30, 2015 | For the Year Ended April 30, 2014 | For the Year Ended April 30, 2013 | ||||||||||||||||
Per Share Operating Performance | ||||||||||||||||||||
Net asset value, beginning of period | $ | 10.09 | $ | 10.20 | $ | 10.03 | $ | 10.47 | $ | 10.31 | ||||||||||
|
|
|
|
|
|
|
|
|
| |||||||||||
Net investment income(1) | 0.27 | 0.28 | 0.30 | 0.33 | 0.29 | |||||||||||||||
Net realized and unrealized gain/(loss) on investments | 0.05 | (0.09 | ) | 0.18 | (0.30 | ) | 0.43 | |||||||||||||
|
|
|
|
|
|
|
|
|
| |||||||||||
Net increase in net assets resulting from operations | 0.32 | 0.19 | 0.48 | 0.03 | 0.72 | |||||||||||||||
|
|
|
|
|
|
|
|
|
| |||||||||||
Dividends and distributions to shareholders from: | ||||||||||||||||||||
Net investment income | (0.29 | ) | (0.30 | ) | (0.31 | ) | (0.34 | ) | (0.32 | ) | ||||||||||
Net realized gains | (0.05 | ) | — | — | (0.13 | ) | (0.24 | ) | ||||||||||||
Return of capital | (0.01 | ) | — | — | — | — | ||||||||||||||
|
|
|
|
|
|
|
|
|
| |||||||||||
Total dividends and distributions to shareholders | (0.35 | ) | (0.30 | ) | (0.31 | ) | (0.47 | ) | (0.56 | ) | ||||||||||
|
|
|
|
|
|
|
|
|
| |||||||||||
Net asset value, end of period | $ | 10.06 | $ | 10.09 | $ | 10.20 | $ | 10.03 | $ | 10.47 | ||||||||||
|
|
|
|
|
|
|
|
|
| |||||||||||
Total investment return(2) | 3.19 | % | 1.92 | % | 4.86 | % | 0.37 | % | 7.17 | % | ||||||||||
Ratio/Supplemental Data | ||||||||||||||||||||
Net assets, end of period (in thousands) | $ | 40,774 | $ | 39,512 | $ | 38,775 | $ | 36,981 | $ | 47,339 | ||||||||||
Ratio of expenses to average net assets | 0.85 | % | 0.85 | % | 0.85 | % | 0.85 | % | 0.85 | % | ||||||||||
Ratio of expenses to average net assets without waivers and expense reimbursements(3) | 1.30 | % | 1.28 | % | 1.27 | % | 1.24 | % | 0.93 | % | ||||||||||
Ratio of net investment income to average net assets | 2.70 | % | 2.84 | % | 2.94 | % | 3.26 | % | �� | 2.83 | % | |||||||||
Portfolio turnover rate | 201.40 | % | 46.46 | % | 54.37 | % | 76.18 | % | 154.23 | %(4) | ||||||||||
| (1) | The selected per share data was calculated using the average shares outstanding method for the year. |
| (2) | Total investment return is calculated assuming a purchase of shares on the first day and a sale of shares on the last day of each period reported and includes reinvestment of dividends and distributions, if any. |
| (3) | During the period, certain fees were waived and/or reimbursed. If such fee waivers and/or reimbursements had not occurred, the ratios would have been as indicated (See Note 2). |
| (4) | Portfolio turnover rate excludes securities delivered from processing a redemption-in-kind. |
The accompanying notes are an integral part of the financial statements.
16
INSIGHT INVESTMENT GRADE BOND FUND
Notes to Financial Statements
April 30, 2017
1. Organization and Significant Accounting Policies
The Insight Investment Grade Bond Fund (the “Fund”) is a diversified, open-end management investment company registered under the Investment Company Act of 1940, as amended (the “1940 Act”), which commenced investment operations on December 2, 2010. The Fund is a separate series of FundVantage Trust (the “Trust”) which was organized as a Delaware statutory trust on August 28, 2006. The Trust is a “series trust” authorized to issue an unlimited number of separate series or classes of shares of beneficial interest. Each series is treated as a separate entity for certain matters under the 1940 Act, and for other purposes, and a shareholder of one series is not deemed to be a shareholder of any other series. The Fund offers separate classes of shares, Class A, Class C and Institutional Class. As of April 30, 2017, Class A and Class C shares had not been issued.
The Fund is an investment company and follows accounting and reporting guidance in the Financial Accounting Standards Board Accounting Standards Codification Topic 946.
Portfolio Valuation — The Fund’s net asset value (“NAV”) is calculated once daily at the close of regular trading hours on the New York Stock Exchange (“NYSE”) (typically 4:00 p.m. Eastern time) on each business day the NYSE is open. Securities held by the Fund are valued at their last sale price on the NYSE on the day the security is valued. Lacking any sales on such day, the security will be valued at the mean between the last asked price and the last bid price prior to the market close. Securities listed on other exchanges (and not subject to restriction against sale by the Fund on such exchanges) will be similarly valued, using quotations on the exchange on which the security is traded most extensively. Unlisted securities that are quoted on the National Association of Securities Dealers Market System, for which there have been sales of such securities on such day, shall be valued at the official closing price on such system on the day the security is valued. If there are no such sales on such day, the value shall be the mean between the last asked price and the last bid price prior to market close. The value of such securities quoted on the National Association of Securities Dealers Automatic Quotation System (“NASDAQ”) markets system, but not listed on the National Market System, shall be valued at the mean between closing asked price and the closing bid price. Unlisted securities that are not quoted on the NASDAQ and for which over-the-counter market quotations are readily available will be valued at the mean between the current bid and the asked prices for such security in the over-the-counter market. Fixed income securities are valued based on the market quotations, which are furnished by an independent pricing service. Fixed income securities having a remaining maturity of 60 days or less are generally valued at amortized cost, provided such amount approximates market value. Debt securities are valued on the basis of broker quotations or valuations provided by a pricing service, which utilizes information with respect to recent sales, market transactions in comparable securities, quotations from dealers, and various relationships between securities in determining value. Valuations developed through pricing techniques may materially vary from the actual amounts realized upon sale of the securities. Investments in other open-end investment companies are valued based on the NAV of the investment companies (which may use fair value pricing as discussed in their prospectuses). If market quotations are unavailable or deemed unreliable, securities will be valued in accordance with procedures adopted by the FundVantage Trust’s Board of Trustees. Relying on prices supplied by pricing services or dealers or using fair valuation may result in values that are higher or lower than the values used by other investment companies and investors to price the same investments. In the event that market quotes are not readily available, and the security or asset cannot be valued pursuant to one of the valuation methods, the value of the security or asset will be determined in good faith by the Adviser. The Trust has established a Valuation Committee which performs certain functions including the oversight of the Adviser’s fair valuation determinations.
Fair Value Measurements — The inputs and valuation techniques used to measure fair value of the Fund’s investments are summarized into three levels as described in the hierarchy below:
• Level 1 | — | quoted prices in active markets for identical securities; | ||
• Level 2 | — | other significant observable inputs (including quoted prices for similar securities, interest rates, prepayment speeds, credit risk, etc.); and | ||
• Level 3 | — | significant unobservable inputs (including the Fund’s own assumptions in determining the fair value of investments). | ||
17
INSIGHT INVESTMENT GRADE BOND FUND
Notes to Financial Statements (Continued)
April 30, 2017
The fair value of the Fund’s bonds are generally based on the quotes received from brokers or independent pricing services. Bonds with quotes that are based on actual trades with a sufficient level of activity on or near the measurement date are classified as Level 2 assets.
The inputs or methodology used for valuing securities are not necessarily an indication of the risk associated with investing in those securities.
The following is a summary of the inputs used, as of April 30, 2017, in valuing the Fund’s investments carried at fair value:
| Total Value at 04/30/17 | Level 1 Quoted Prices | Level 2 Other Significant Observable Inputs | Level 3 Significant Unobservable Inputs | |||||||||||||
Corporate Bonds and Notes | $ | 20,299,742 | $ | — | $ | 20,299,742 | $ | — | ||||||||
Asset Backed Securities | 7,360,073 | — | 7,360,073 | — | ||||||||||||
Commercial Mortgage-Backed Securities | 2,188,205 | — | 2,188,205 | — | ||||||||||||
Residential Mortgage-Backed Securities | 5,287,468 | — | 5,287,468 | — | ||||||||||||
Municipal Bonds | 398,428 | — | 398,428 | — | ||||||||||||
U.S. Treasury Obligations | 4,478,066 | — | 4,478,066 | — | ||||||||||||
Preferred Stock | 539,175 | — | 539,175 | — | ||||||||||||
Registered Investment Company | 6,234,625 | 6,234,625 | — | — | ||||||||||||
|
|
|
|
|
|
|
| |||||||||
Total Investments | $ | 46,785,782 | $ | 6,234,625 | $ | 40,551,157 | $ | — | ||||||||
|
|
|
|
|
|
|
| |||||||||
At the end of each quarter, management evaluates the classification of Levels 1, 2 and 3 assets and liabilities. Various factors are considered, such as changes in liquidity from the prior reporting period; whether or not a broker is willing to execute at the quoted price; the depth and consistency of prices from third party pricing services; and the existence of contemporaneous, observable trades in the market. Additionally, management evaluates the classification of Level 1 and Level 2 assets and liabilities on a quarterly basis for changes in listings or delistings on national exchanges.
Due to the inherent uncertainty of determining the fair value of investments that do not have a readily available market value, the fair value of the Fund’s investments may fluctuate from period to period. Additionally, the fair value of investments may differ significantly from the values that would have been used had a ready market existed for such investments and may differ materially from the values the Fund may ultimately realize. Further, such investments may be subject to legal and other restrictions on resale or are otherwise may be less liquid than publicly traded securities.
For fair valuations using significant unobservable inputs, U.S. generally accepted accounting principles (“U.S. GAAP”) require the Fund to present a reconciliation of the beginning to ending balances for reported market values that presents changes attributable to total realized and unrealized gains or losses, purchase and sales and transfers in and out of Level 3 during the period. Transfers in and out between Levels are based on values at the end of the period. U.S. GAAP also requires the Fund to disclose amounts and reasons for all transfers in and out of Level 1 and Level 2 fair value measurements. A reconciliation of Level 3 investments is presented only when the Fund had an amount of Level 3 investments at the end of the reporting period that was meaningful in relation to its net assets. The amounts and reasons for all transfers in and out of each Level within the three-tier hierarchy are disclosed when the Fund had an amount of total transfers during the reporting period that was meaningful in relation to its net assets as of the end of the reporting period.
18
INSIGHT INVESTMENT GRADE BOND FUND
Notes to Financial Statements (Continued)
April 30, 2017
For the year ended April 30, 2017, there was a transfer from Level 1 to Level 2 of $539,175 due to not having an active market for the security.
Use of Estimates — The preparation of financial statements in conformity with U.S. GAAP requires management to make estimates and assumptions that affect the amounts reported in the financial statements and accompanying notes at the date of the financial statements and the reported amounts of revenues and expenses during the period. Actual results could differ from those estimates and those differences could be material.
Investment Transactions, Investment Income and Expenses — Investment transactions are recorded on trade date for financial statement preparation purposes. Realized gains and losses on investments sold are recorded on the identified cost basis. Gains and losses on principal paydowns from mortgage backed securities are recorded as interest income on the Statement of Operations. Interest income is recorded on the accrual basis. Accretion of discounts and amortization of premiums are recorded on a daily basis using the effective yield method except for short term securities, which records discounts and premiums on a straight-line basis. Dividends are recorded on the ex-dividend date. Estimated components of distributions received from real estate investment trusts may be considered income, return of capital distributions or capital gain distributions. Return of capital distributions are recorded as a reduction of costs of the related investments. Distribution (12b-1) fees and shareholder services fees relating to a specific class are charged directly to that class. General expenses of the Trust are generally allocated to each fund in proportion to its relative daily net assets. Expenses directly attributable to a particular fund in the Trust are charged directly to that fund. The Fund’s investment income, expenses (other than class specific expenses) and unrealized and realized gains and losses are allocated daily to each class of shares based upon the relative proportion of net assets of each class at the beginning of the day.
Securities Traded on a To-Be-Announced Basis — The Fund may trade securities on a to-be-announced (“TBA”) basis. In a TBA transaction, the Fund commits to purchasing securities which have not yet been issued by the issuer and for which specific information, such as the face amount, maturity date and underlying pool of investments in U.S. government agency mortgage pass-through securities, is not announced. Securities purchased on a TBA basis are not settled until they are delivered to the Fund. Beginning on the date the Fund enters into a TBA transaction, cash, U.S. government securities or other liquid high-grade debt obligations are segregated in an amount equal in value to the purchase price of the TBA security. These securities are subject to market fluctuations and their current value is determined in the same manner as for other securities.
Dividends and Distributions to Shareholders — Dividends from net investment income are declared daily and paid monthly to shareholders. Distributions from net realized capital gains, if any, are declared and paid annually to shareholders. Income dividends and capital gain distributions are determined in accordance with U.S. federal income tax regulations, which may differ from U.S. GAAP. These differences may include the treatment of non-taxable dividends, expiring capital loss carryforwards and losses deferred due to wash sales and excise tax regulations. Permanent book and tax basis differences relating to shareholder distributions will result in reclassifications within the components of net assets.
U.S. Tax Status — No provision is made for U.S. income taxes as it is the Fund’s intention to continue to qualify for and elect the tax treatment applicable to regulated investment companies under Subchapter M of the Internal Revenue Code of 1986, as amended, (“Internal Revenue Code”) and make the requisite distributions to its shareholders which will be sufficient to relieve it from U.S. income and excise taxes.
Other — In the normal course of business, the Fund may enter into contracts that provide general indemnifications. The Fund’s maximum exposure under these arrangements is dependent on claims that may be made against the Fund in the future, and, therefore, cannot be estimated; however, based on experience, the risk of material loss for such claims is considered remote.
Recent Accounting Pronouncement — In October 2016, the U.S. Securities and Exchange Commission (“SEC”) issued a new rule, Investment Company Reporting Modernization, which, among other provisions, amends Regulation
19
INSIGHT INVESTMENT GRADE BOND FUND
Notes to Financial Statements (Continued)
April 30, 2017
S-X to require standardized, enhanced disclosures, particularly related to derivatives, in investment company financial statements. Compliance with the amendments to Regulation S-X is required for financial statements ending on or after August 1, 2017. Management is currently evaluating the impact that the amendments will have on the Fund’s financial statements and related disclosures.
2. Transactions with Related Parties and Other Service Providers
Cutwater Investor Services Corp., (the “Adviser”), (d/b/a Insight Investment), serves as investment adviser to the Fund pursuant to an investment advisory agreement with the Trust. For its services, the Adviser is paid a monthly fee at the annual rate of 0.50% of the Fund’s average daily net assets. The Adviser has voluntarily agreed to reduce its investment advisory fee and/or reimburse certain expenses of the Fund to the extent necessary to ensure that the Fund’s total operating expenses (excluding any class-specific fees and expenses, interest, extraordinary items and brokerage commissions) do not exceed 0.85% (on an annual basis) of the Fund’s average daily net assets (the “Voluntary Waiver”). Such Voluntary Waiver will continue until the Adviser notifies the Fund of a change in its Voluntary Waiver or its discontinuation. This Voluntary Waiver may be discontinued at any time at the discretion of the Adviser.
For the year ended April 30, 2017, the Adviser earned advisory fees of $201,106 and waived fees of $182,518.
Other Service Providers
BNY Mellon Investment Servicing (US) Inc. (“BNY Mellon”) serves as administrator and transfer agent for the Fund. For providing administrative and accounting services, BNY Mellon is entitled to receive a monthly fee equal to an annual percentage rate of the Fund’s average daily net assets and is subject to certain minimum monthly fees. For providing transfer agent services, BNY Mellon is entitled to receive a monthly fee, subject to certain minimum, and out of pocket expenses.
The Bank of New York Mellon (the “Custodian”) provides certain custodial services to the Fund. The Custodian is entitled to receive a monthly fee, subject to certain minimum, and out of pocket expenses.
Foreside Funds Distributors LLC (the “Underwriter”) provides principal underwriting services to the Fund pursuant to an underwriting agreement between the Trust and the Underwriter.
Trustees and Officers
The Trust is governed by its Board of Trustees. The Trustees receive compensation in the form of an annual retainer and per meeting fees for their services to the Trust. The remuneration paid to the Trustees by the Fund during the year ended April 30, 2017 was $9,332. An employee of BNY Mellon serves as the Secretary of the Trust and is not compensated by the Fund or the Trust.
Effective June 1, 2016 and July 1, 2016, JW Fund Management LLC (“JWFM”) provides a Principal Executive Officer and Principal Financial Officer, respectively, to the Trust. JWFM is compensated for the services provided to the Trust. Until May 31, 2016 and June 30, 2016, certain employees of BNY Mellon served as Principal Executive Officer and Principal Financial Officer, respectively, to the Trust. They were not compensated by the Trust or the Fund.
Freeh Group International Solutions, LLC provides the Trust with a Chief Compliance Officer and an Anti-Money Laundering Officer.
20
INSIGHT INVESTMENT GRADE BOND FUND
Notes to Financial Statements (Continued)
April 30, 2017
3. Investment in Securities
For the year ended April 30, 2017, aggregate purchases and sales of investment securities (excluding short-term investments) of the Fund were as follows:
| Purchases | Sales | |||||||
Investment Securities | $ | 14,937,071 | $ | 12,426,257 | ||||
U.S. Government Securities | 66,483,798 | 66,259,300 | ||||||
4. Restricted Securities
A restricted security is a security which has been purchased through a private offering and cannot be resold to the general public without prior registration under the Securities Act of 1933, as amended (the “1933 Act”), or pursuant to the resale limitations provided by Rule 144 under the 1933 Act, or an exemption from the registration requirements of the 1933 Act. Certain restricted securities may be resold in transactions exempt from registration, normally to qualified institutional buyers, and may be deemed liquid by Insight Investment as applicable, based on policies and procedures established by the Fund’s Board of Trustees. Therefore, not all restricted securities are considered illiquid. The Fund is subject to an investment limitation that immediately after purchase, the value of restricted securities that are considered illiquid can be no more than fifteen percent of the Fund’s net assets.
At April 30, 2017, the following restricted securities were held as illiquid:
| Acquisition Date | Acquisition Cost | Value | % of Net Assets | |||||||||||||||||
Corporate Bonds and Notes: | ||||||||||||||||||||
American Airlines 2013-2 Class B Pass Through Trust | 11/21/13 | $ | 317,701 | $ | 329,083 | 0.8 | % | |||||||||||||
Antares CLO 2017-1 Ltd., Class B | 04/20/17 | 275,000 | 275,000 | 0.7 | ||||||||||||||||
BCC Funding XIII, LLC. Series 2016-1, Class A2 | 09/14/16 | 386,167 | 385,671 | 0.9 | ||||||||||||||||
British Airways 2013-1 Class B Pass Through Trust | 12/13/13 | 140,398 | 143,891 | 0.4 | ||||||||||||||||
Carlyle Global Market Strategies CLO Ltd., Series 2014-3A, Class B | 02/24/17 | 500,000 | 503,811 | 1.2 | ||||||||||||||||
Golub Capital Partners CLO 19B-R Ltd., | 04/27/17 | 340,000 | 340,000 | 0.8 | ||||||||||||||||
Greystone Commercial Real Estate Notes 2017-FL1 Ltd., Class A | 03/03/17 | 100,000 | 100,100 | 0.2 | ||||||||||||||||
IVY Hill Middle Market Credit Fund XII Ltd., Class A2 | 04/28/17 | 340,000 | 340,000 | 0.8 | ||||||||||||||||
Kubota Credit Owner Trust, Series 2016-1A, Class A3 | 07/26/16 | 100,000 | 99,435 | 0.2 | ||||||||||||||||
Latitude Management Real Estate Investors, Inc., Series 2016-CRE2, Class A | 10/21/16 | 125,000 | 124,722 | 0.3 | ||||||||||||||||
North End CLO, Ltd., Series 2013-1A, Class B | 07/19/13 | 996,620 | 983,740 | 2.4 | ||||||||||||||||
Resource Capital Corp. Ltd., Series 2014-CRE2, Class A | 07/10/14 | 43,198 | 43,187 | 0.1 | ||||||||||||||||
21
INSIGHT INVESTMENT GRADE BOND FUND
Notes to Financial Statements (Continued)
April 30, 2017
| Acquisition Date | Acquisition Cost | Value | % of Net Assets | |||||||||||||||||
Spirit Master Funding LLC, Series 2014-2A, Class A | 05/20/14 | $ | 306,085 | $ | 308,294 | 0.8 | % | |||||||||||||
Wells Fargo Commercial Mortgage Trust, Series 2014-TISH, Class SCH2 | 03/21/14 | 450,000 | 437,597 | 1.1 | ||||||||||||||||
Wells Fargo Commercial Mortgage Trust, Series 2014-TISH, Class WTS2 | 03/21/14 | 225,000 | 228,478 | 0.6 | ||||||||||||||||
5. Capital Share Transactions
For the year ended April 30, 2017 and 2016, transactions in capital shares (authorized shares unlimited) were as follows:
| For the Year Ended April 30, 2017 | For the Year Ended April 30, 2016 | |||||||||||||||
| Shares | Amount | Shares | Amount | |||||||||||||
Institutional Class: | ||||||||||||||||
Reinvestments | 137,025 | $ | 1,381,727 | 115,382 | $ | 1,149,482 | ||||||||||
|
|
|
|
|
|
|
| |||||||||
Net increase | 137,025 | $ | 1,381,727 | 115,382 | $ | 1,149,482 | ||||||||||
|
|
|
|
|
|
|
| |||||||||
6. Federal Tax Information
The Fund has followed the authoritative guidance on accounting for and disclosure of uncertainty in tax positions, which requires the Fund to determine whether a tax position is more likely than not to be sustained upon examination, including resolution of any related appeals or litigation processes, based on the technical merits of the position. The Fund has determined that there was no effect on the financial statements from following this authoritative guidance. In the normal course of business, the Fund is subject to examination by federal, state and local jurisdictions, where applicable, for tax years for which applicable statutes of limitations have not expired.
Distributions are determined in accordance with federal income tax regulations, which may differ in amount or character from net investment income and realized gains for financial reporting purposes. Accordingly, the character of distributions and composition of net assets for tax purposes may differ from those reflected in the accompanying financial statements. To the extent these differences are permanent, such amounts are reclassified within the components of net assets based on the tax treatment; temporary differences do not require reclassifications. For the year ended April 30, 2017, these adjustments were to increase accumulated net investment income/loss by $17,634 and increase accumulated net realized loss by $17,634, due to paydown gains/losses and redesignation of distributions paid. Net investment income, net realized gains and net assets were not affected by those adjustments.
For the year ended April 30, 2017, the tax character of distributions paid by the Fund was $1,173,151 of ordinary income dividends, $169,825 of long-term capital gains and $38,751 return of capital distribution. Distributions from net investment income and short-term capital gains are treated as ordinary income for federal income tax purposes. For the year ended April 30, 2016, the tax character of distributions paid by the Fund was $1,149,482 of ordinary income dividends.
As of April 30, 2017, the components of distributable earnings on a tax basis were as follows:
Capital Loss Carryforward | Undistributed Ordinary Income | Undistributed Long-Term Gain | Unrealized Appreciation | Qualified Late-Year Losses | ||||
$ — | $— | $— | $597,569 | $(79,427) |
22
INSIGHT INVESTMENT GRADE BOND FUND
Notes to Financial Statements (Continued)
April 30, 2017
The differences between the book and tax basis components of distributable earnings relate primarily to the timing and recognition of income and gains for federal income tax purposes. Short-term capital gains are reported as ordinary income for federal income tax purposes.
As of April 30, 2017, the federal tax cost, aggregate gross unrealized appreciation and depreciation of securities held by the Fund were as follows:
Federal tax cost | $ | 46,188,213 | ||||
|
| |||||
Gross unrealized appreciation | $ | 804,466 | ||||
Gross unrealized depreciation | (206,897 | ) | ||||
|
| |||||
Net unrealized appreciation | $ | 597,569 | ||||
|
| |||||
Pursuant to federal income tax rules applicable to regulated investment companies, the Fund may elect to treat certain capital losses between November 1 and April 30 and late year ordinary losses ((i) ordinary losses between January 1 and April 30, and (ii) specified ordinary and currency losses between November 1 and April 30) as occurring on the first day of the following tax year. For the year ended April 30, 2017, any amount of losses elected within the tax return will not be recognized for federal income tax purposes until May 1, 2017. For the year ended April 30, 2017, the Fund had capital loss deferrals of $79,427.
Accumulated capital losses represent net capital loss carryforwards as of April 30, 2017 that may be available to offset future realized capital gains and thereby reduce future capital gains distributions. As of April 30, 2017, the Fund did not have any capital loss carryforwards.
During the year ended April 30, 2017, the Fund utilized $99,705 of prior year capital loss carryforwards.
7. Mortgage-Related And Other Asset-Backed Securities Risk
Mortgage-related and asset-backed securities are subject to certain other risks. The value of these securities will be influenced by the factors affecting the housing market and the assets underlying such securities. As a result, during periods of declining asset value, difficult or frozen credit markets, swings in interest rates, or deteriorating economic conditions, mortgage-related and asset-backed securities may decline in value, face valuation difficulties, become more volatile and/or become illiquid.
8. Debt Investment Risk
Debt investments are affected primarily by the financial condition of the companies or other entities that have issued them and by changes in interest rates. There is a risk that an issuer of a debt investment may not be able to meet its financial obligations (e.g., may not be able to make principal and/or interest payments when they are due or otherwise default on other financial terms) and/or go bankrupt. Securities such as high-yield/high-risk bonds, e.g., bonds with low credit ratings by Moody’s (Ba or lower) or Standard & Poor’s (BB and lower) or if unrated are of comparable quality as determined by the manager, are especially subject to credit risk during periods of economic uncertainty or during economic downturns and are more likely to default on their interest and/or principal payments than higher rated securities. Debt investments may be affected by changes in interest rates. Debt investments with longer durations tend to be more sensitive to changes in interest rates, making them more volatile than debt investments with shorter durations or floating or adjustable interest rates. The value of debt investments may fall when interest rates rise.
23
INSIGHT INVESTMENT GRADE BOND FUND
Notes to Financial Statements (Concluded)
April 30, 2017
9. Subsequent Event
Management has evaluated the impact of all subsequent events on the Fund through the date the financial statements were issued, and has determined that there were no subsequent events requiring recognition or disclosure in the financial statements.
24
INSIGHT INVESTMENT GRADE BOND FUND
Report of Independent Registered Public Accounting Firm
To the Board of Trustees of FundVantage Trust and
Shareholders of the Insight Investment Grade Bond Fund:
We have audited the accompanying statement of assets and liabilities, including the portfolio of investments, of the Insight Investment Grade Bond Fund (one of the series constituting FundVantage Trust) (the “Fund”) as of April 30, 2017, and the related statement of operations for the year then ended, the statements of changes in net assets for each of the two years in the period then ended, and the financial highlights for each of the three years in the period then ended. These financial statements and financial highlights are the responsibility of the Fund’s management. Our responsibility is to express an opinion on these financial statements and financial highlights based on our audits. The financial highlights for each of the years presented through April 30, 2014 were audited by other auditors whose report dated June 24, 2014, expressed an unqualified opinion on those financial highlights.
We conducted our audits in accordance with the standards of the Public Company Accounting Oversight Board (United States). Those standards require that we plan and perform the audit to obtain reasonable assurance about whether the financial statements and financial highlights are free of material misstatement. We were not engaged to perform an audit of the Fund’s internal control over financial reporting. Our audits included consideration of internal control over financial reporting as a basis for designing audit procedures that are appropriate in the circumstances, but not for the purpose of expressing an opinion on the effectiveness of the Fund’s internal control over financial reporting. Accordingly, we express no such opinion. An audit also includes examining, on a test basis, evidence supporting the amounts and disclosures in the financial statements and financial highlights, assessing the accounting principles used and significant estimates made by management, and evaluating the overall financial statement presentation. Our procedures included confirmation of securities owned as of April 30, 2017, by correspondence with the custodian and brokers or by other appropriate auditing procedures where replies from brokers were not received. We believe that our audits provide a reasonable basis for our opinion.
In our opinion, the financial statements and financial highlights referred to above present fairly, in all material respects, the financial position of the Insight Investment Grade Bond Fund (one of the series constituting FundVantage Trust) at April 30, 2017, the results of its operations for the year then ended, the changes in its net assets for each of the two years in the period then ended, and the financial highlights for each of the three years in the period then ended in conformity with U.S. generally accepted accounting principles.

Philadelphia, Pennsylvania
June 29, 2017
25
INSIGHT INVESTMENT GRADE BOND FUND
Shareholder Tax Information
(Unaudited)
The Fund is required by Subchapter M of the Internal Revenue Code, to advise its shareholders of the U.S. federal tax status of distributions received by the Fund’s shareholders in respect of such fiscal year. During the year ended April 30, 2017, the Fund paid $1,173,151 ordinary income dividends, $169,825 of long-term capital gain dividends and a return of capital distribution of $38,751 to its shareholders. Dividends from net investment income and short-term capital gains are treated as ordinary income dividends for federal income tax purposes.
The Fund designates 2.84% of the ordinary income distribution as qualified dividend income pursuant to the Jobs and Growth Tax Relief Reconciliation Act of 2003.
The percentage of ordinary income dividends qualifying for corporate dividends received deduction is 2.84%.
The percentage of qualified interest income related dividends not subject to withholding tax for non-resident aliens and foreign corporations is 94.46%.
The percentage of qualified short-term capital gain related dividends not subject to withholding tax for non-resident aliens and foreign corporations is 100.00%.
A total of 7.79% of the dividends distributed during the fiscal year was derived from interest on U.S. government securities, which is generally exempt from state income tax.
All designations are based on financial information available as of the date of this annual report and, accordingly, are subject to change. For each item, it is the intention of the Fund to designate the maximum amount permitted under the Internal Revenue Code of 1986, as amended, and the regulations thereunder.
Because the Fund’s fiscal year is not the calendar year, another notification will be sent with respect to calendar year 2017. The second notification, which will reflect the amount, if any, to be used by calendar year taxpayers on their U.S. federal income tax returns, will be made in conjunction with Form 1099-DIV and will be mailed in January 2018.
Foreign shareholders will generally be subject to U.S. withholding tax on the amount of their ordinary income dividends. They will generally not be entitled to a foreign tax credit or deduction for the withholding taxes paid by the Fund, if any.
In general, dividends received by tax-exempt recipients (e.g., IRAs and Keoghs) need not be reported as taxable income for U.S. federal income tax purposes. However, some retirement trusts (e.g., corporate, Keogh and 403(b)(7) plans) may need this information for their annual information reporting.
Shareholders are advised to consult their own tax advisers with respect to the tax consequences of their investment in the Fund.
26
INSIGHT INVESTMENT GRADE BOND FUND
Other Information
(Unaudited)
Proxy Voting
Policies and procedures that the Fund uses to determine how to vote proxies relating to portfolio securities as well as information regarding how the Fund voted proxies relating to portfolio securities for the most recent 12-month period ended June 30 are available without charge, upon request, by calling (866) 678-6242 and on the Securities and Exchange Commission’s (“SEC”) website at http://www.sec.gov.
Quarterly Portfolio Schedules
The Trust files its complete schedule of portfolio holdings with the SEC for the first and third fiscal quarters of each fiscal year (quarters ended July 31 and January 31) on Form N-Q. The Trust’s Forms N-Q are available on the SEC’s website at http://www.sec.gov and may be reviewed and copied at the SEC’s Public Reference Room in Washington, D.C. Information on the operation of the SEC’s Public Reference Room may be obtained by calling 1-800-SEC-0330.
27
INSIGHT INVESTMENT GRADE BOND FUND
Privacy Notice
(Unaudited)
The privacy of your personal financial information is extremely important to us. When you open an account with us, we collect a significant amount of information from you in order to properly invest and administer your account. We take very seriously the obligation to keep that information private and confidential, and we want you to know how we protect that important information.
We collect nonpublic personal information about you from applications or other forms you complete and from your transactions with us or our affiliates. We do not disclose information about you, or our former clients, to our affiliates or to service providers or other third parties, except as permitted by law. We share only the information required to properly administer your accounts, which enables us to send transaction confirmations, monthly or quarterly statements, financials and tax forms. Even within FundVantage Trust and its affiliated entities, a limited number of people who actually service accounts will have access to your personal financial information. Further, we do not share information about our current or former clients with any outside marketing groups or sales entities.
To ensure the highest degree of security and confidentiality, FundVantage Trust and its affiliates maintain various physical, electronic and procedural safeguards to protect your personal information. We also apply special measures for authentication of information you request or submit to us on our web site.
If you have questions or comments about our privacy practices, please call us at (866) 678-6242.
28
INSIGHT INVESTMENT GRADE BOND FUND
Fund Management
(Unaudited)
FundVantage Trust (the “Trust”) is governed by a Board of Trustees (the “Trustees”). The primary responsibility of the Trustees is to represent the interest of the Trust’s shareholders and to provide oversight management of the Trust.
The following tables present certain information regarding the Board of Trustees and officers of the Trust. None of the Trustees are an “interested person” of the Trust, the Adviser, another investment adviser of a series of the Trust, or Foreside Funds Distributors LLC, the principal underwriter of the Trust (“Underwriter”), within the meaning of the 1940 Act and each Trustee is referred to as an “Independent Trustee” and is listed under such heading below. The address of each Trustee and Officer as it relates to the Trust’s business is 301 Bellevue Parkway, 2nd Floor, Wilmington, DE 19809.
The Statement of Additional Information for the Fund contains additional information about the Trustees and is available, without charge, upon request, by calling (866) 678-6242.
Name and Date of Birth
| Position(s) Held
| Term of Office
| Principal Occupation(s) During Past Five Years
|
Number of
| Other
| |||||||||||||||||
INDEPENDENT TRUSTEES
| ||||||||||||||||||||||
ROBERT J. CHRISTIAN Date of Birth: 2/49 |
Trustee and Chairman of the Board |
Shall serve until death, resignation or removal. Trustee and Chairman since 2007. |
Retired since February 2006; Executive Vice President of Wilmington Trust Company from February 1996 to February 2006; President of Rodney Square Management Corporation (“RSMC”) (investment advisory firm) from 1996 to 2005; Vice President of RSMC from 2005 to 2006. |
42 |
Optimum Fund | |||||||||||||||||
IQBAL MANSUR Date of Birth: 6/55 |
Trustee |
Shall serve until death, resignation or removal. Trustee since 2007. |
University Professor, Widener University. |
42 |
None. | |||||||||||||||||
NICHOLAS M. MARSINI, JR. Date of Birth: 8/55 |
Trustee |
Shall serve until death, resignation or removal. Trustee since 2016. |
Retired since March 2016. President of PNC Bank Delaware from June 2011 to March 2016; Executive Vice President Finance of BNY Mellon from July 2010 to January 2011; Executive Vice President and Chief Financial Officer of PNC Global Investment Servicing from September 1997 to July 2010. |
42 |
Brinker Capital | |||||||||||||||||
STEPHEN M. WYNNE Date of Birth: 1/55 |
Trustee |
Shall serve until death, resignation or removal. Trustee since 2009. |
Retired since December 2010; Chief Executive Officer of US Funds Services, BNY Mellon Asset Servicing from July 2010 to December 2010; Chief Executive Officer of PNC Global Investment Servicing from March 2008 to July 2010; President, PNC Global Investment Servicing from 2003 to 2008. |
42 |
Copeland Trust | |||||||||||||||||
NANCY B. WOLCOTT Date of Birth: 11/54 |
Trustee |
Shall serve until death, resignation or removal. Trustee since 2011. |
Retired since May 2014; EVP, Head of GFI Client Services Delivery, BNY Mellon from January 2012 to May 2014; EVP, Head of US Funds Services, BNY Mellon from July 2010 to January 2012; President of PNC Global Investment Servicing from 2008 to July 2010; Chief Operating Officer of PNC Global Investment Servicing from 2007 to 2008; Executive Vice President of PFPC Worldwide Inc. from 2006 to 2007. |
42 |
None. | |||||||||||||||||
29
INSIGHT INVESTMENT GRADE BOND FUND
Fund Management (Concluded)
(Unaudited)
Name and Date of Birth
| Position(s) Held with Trust
|
Term of Office and Length of Time Served
| Principal Occupation(s) During Past Five Years
| |||||||||||
EXECUTIVE OFFICERS
| ||||||||||||||
JOEL L. WEISS Date of Birth: 1/63 |
President and Chief Executive Officer |
Shall serve until death, resignation or removal. Officer since 2007. |
President of JW Fund Management LLC since June 2016; Vice President and Managing Director of BNY Mellon Investment Servicing (US) Inc. and predecessor firms from 1993 to June 2016. | |||||||||||
T. RICHARD KEYES Date of Birth: 10/60 |
Treasurer and Chief Financial Officer |
Shall serve until death, resignation or removal. Officer since 2016. |
President of TRK Fund Consulting since July 2016; Head of Tax-U.S. Fund Services of BNY Mellon Investment Servicing (US) Inc. and predecessor firms from February 2006 to July 2016. | |||||||||||
VINCENZO A. SCARDUZIO Date of Birth: 1/57 |
Secretary |
Shall serve until death, resignation or removal. Officer since 2012. |
Director and Vice President Regulatory Administration of BNY Mellon Investment Servicing (US) Inc. and predecessor firms since 2001. | |||||||||||
DAVID C. LEBISKY Date of Birth: 5/72 |
Chief Compliance Officer and Anti-Money Laundering Officer |
Shall serve until death, resignation or removal. Officer since 2015. |
President of Lebisky Compliance Consulting LLC since October 2015; Senior Consultant, Freeh Group International Solutions, LLC (a global risk management firm) since 2015; Scotia Institutional Investments US, LP, Director of Regulatory Administration from 2010 to 2014. | |||||||||||
30
Investment Adviser
Cutwater Investor Services Corp. d/b/a Insight Investment
200 Park Avenue, 7th Floor
New York, NY 10166
Administrator
BNY Mellon Investment Servicing (US) Inc.
301 Bellevue Parkway
Wilmington, DE 19809
Transfer Agent
BNY Mellon Investment Servicing (US) Inc.
4400 Computer Drive
Westborough, MA 01581
Principal Underwriter
Foreside Funds Distributors LLC
400 Berwyn Park
899 Cassatt Road
Berwyn, PA 19312
Custodian
The Bank of New York Mellon
225 Liberty Street
New York, NY 10286
Independent Registered Public Accounting Firm
Ernst & Young LLP
One Commerce Square
2005 Market Street, Suite 700
Philadelphia, PA 19103-7096
Legal Counsel
Pepper Hamilton LLP
3000 Two Logan Square
18th and Arch Streets
Philadelphia, PA 19103
INS-0417

LATEEF FUND
Annual Investment Adviser’s Report
April 30, 2017
(Unaudited)
Dear Lateef Fund Shareholder:
We are pleased with our portfolio’s start to the year and believe that our portfolio companies will continue to build on this year’s momentum.
Over the past three years, low interest rates and market risk aversion have led to several periods where investors rotated into high dividend yielding sectors, including 2014 when the S&P 500®’s Utilities Sector returned 29% relative to the S&P 500®’s total return of 14%; and 2016 when the Utilities and Telecom Services Sectors returned 16% and 23%, respectively, against the market’s total return of 12% for the year. Comparing market performance with a yield focused index tells a similar story. In 2016, the S&P 500 Dividend Aristocrats Total Return Index1 outperformed the S&P 500® by 9%, returning 21% during the course of the year.
| S&P 500 Sector | Dividend Yield T12M | Dec-13 Dec-14 | Dec-14 Dec-15 | Weight Dec-15 | Dec-15 Dec-16 | |||||
Information Technology | 1.3% | 20% | 6% | 21% | 14% | |||||
Consumer Discretionary | 1.4% | 10% | 10% | 13% | 6% | |||||
Health Care | 1.7% | 25% | 7% | 15% | -3% | |||||
Financials | 1.7% | 15% | -2% | 16% | 23% | |||||
Materials | 2.0% | 7% | -8% | 3% | 17% | |||||
Industrials | 2.1% | 10% | -3% | 10% | 19% | |||||
Consumer Staples | 2.7% | 16% | 7% | 10% | 5% | |||||
Energy | 2.9% | -8% | -21% | 6% | 27% | |||||
Utilities | 3.3% | 29% | -5% | 3% | 16% | |||||
Real Estate | 3.5% | 26% | 1% | 0% | 1% | |||||
Telecom Services | 5.0% | 3% | 3% | 2% | 23% | |||||
S&P HIGH YLD DIV ARIST | 2.6% | 14% | 0% | 21% | ||||||
S&P 500 INDEX | 2.0% | 14% | 1% | 12% |
Source: Bloomberg. Past performance is no guarantee
of future results. It is not possible to invest directly into
an index.
| 1 | The S&P 500 Dividend Aristocrats Index (SPDAUDT) is designed to measure the performance of S&P 500 Index constituents that have followed a policy of consistently increasing dividends every year for at least 25 consecutive years. |
1
LATEEF FUND
Annual Investment Adviser’s Report (Continued)
April 30, 2017
(Unaudited)
Source: Bloomberg.
While early, we are seeing signs that the market’s risk-off behavior (the tendency to rotate into higher yielding safe havens) may be waning. Fueled by the Trump administration’s potentially more business friendly policies, value and growth have begun to outperform. We are pleased with the Fund’s performance through the first four months of 2017 and believe that equity markets are poised to reward quality companies with strong fundamental performance. Looking at our holdings, we believe they have compelling intrinsic values and trade at attractive discounts to these fair values.
Sometimes, share price performance lags strong underlying performance. For this reason, we remain patient with our holdings, taking a long-term view with respect to our theses and valuations. For instance, Visa (V) and Alphabet (GOOGL) were relatively flat last calendar year with total returns of 1-2%, trailing the S&P 500®; yet, both outperformed the S&P 500® in the first four months of 2017.
We should note that while we pay attention to the Trump rally, our portfolio holdings are not dependent on political policies coming to fruition; instead, we believe regulatory reform and tax policies would represent upside to our estimates of fair value. Recent additions, such as Progressive Corporation (PGR) and Raymond James Financial (RJF), fall under this premise. We discuss these companies in greater detail below, but both should benefit from the more business friendly policies pushed by the Trump administration.
As financials with banking divisions, Northern Trust (NTRS) and RJF would benefit from easing regulations
2
LATEEF FUND
Annual Investment Adviser’s Report (Continued)
April 30, 2017
(Unaudited)
that could slow the pace of spending on regulatory compliance. For instance, banks must conduct both annual and semi-annual Comprehensive Capital Analysis and Reviews (CCAR) for the Federal Reserve (“Fed”). Through our due diligence, we discovered that the Fed places less emphasis on semi-annual reviews and eliminating one such review could free banks to allocate this spending towards projects that may generate growth. PGR, RJF, and NTRS are also high U.S. corporate taxpayers and would reap the benefits of a lower corporate tax rate that could allow more cash to be reinvested for growth or returned to shareholders through dividends and buybacks.
We also monitor how potential trade-related policies would affect our holdings. For instance, a border adjustment tax would negatively impact companies that manufacture and source from outside the U.S. While this would be negative for a holding such as Newell Brands (NWL), which outsources nearly half of its U.S. sales, the company also receives an offsetting competitive advantage in certain categories such as Writing, where it manufactures solely from the U.S. We will continue to keep a close eye on changes in political policies and regulations with respect to our portfolio positions and theses.
Changes to the Portfolio
Over the past twelve months, we started new positions in Newell Brands, Northern Trust, Lam Research, Advance Auto Parts, Visa, Sabre, Canadian Pacific Railway, Progressive, Raymond James, Anthem, and XPO Logistics. We also sold our positions in Madison Square Garden, VipShop Holdings, Wynn Resorts, Lam Research, Stericycle, United Parcel Service, and Hologic.
The first new addition to the Fund was Newell Brands (NWL), which was purchased in May 2016. NWL is a global supplier of consumer and commercial products. NWL’s key segments include Writing, Home Solutions, Tools, Commercial Products, and Baby & Parenting, and its portfolio consists of brands such as Sharpie, Paper Mate, Elmer’s, and Rubbermaid, among others. In mid-April, NWL completed the acquisition of Jarden Corporation, adding ~$10 billion of sales from brands such as Yankee Candle, Crock-Pot, Mr. Coffee, Oster, Coleman, Rawlings, and Marmot to its portfolio. We believe that the Jarden acquisition presents an opportunity for management to deliver cost synergies and economic value to shareholders by investing in the strongest brands and divesting underperforming ones.
CEO Mike Polk implemented such a strategy at Newell Rubbermaid when he joined from Unilever in 2011. Under his direction, NWL transformed from a loose collection of brands and business units into a single operating company with a focused portfolio of products. He achieved this through acquisitions, divestitures, and investments in innovation, advertising, and promotion. Our analysis indicates that the combination of NWL’s strong brands with Jarden’s well-developed go-to-market relationships in sporting goods and international channels will create cross-selling opportunities. Layering in greater scale and bargaining power could lead to materially higher than forecasted revenue synergies with high incremental margins. Management is also targeting $500 million of cost synergies, which we view as conservative
3
LATEEF FUND
Annual Investment Adviser’s Report (Continued)
April 30, 2017
(Unaudited)
against Jarden’s revenue base of $10 billion. While portfolio rationalization in the range of $250-$300 million in annual sales is expected and thus represent a headwind to revenue growth, they will nevertheless be accretive to earnings since many of these to-be-divested brands are unprofitable. We believe these “self-help” initiatives on top of potentially better free cash flow conversion from improving working capital management make NWL an attractive investment in today’s environment.
We began our initial due diligence on Northern Trust (NTRS) towards the end of 2015 and started a position in May 2016. NTRS’s Corporate & Institutional Services (C&IS) provide global custody, fund administration, and other fund-related services to corporate and public retirement funds, foundations, endowments, fund managers, and other institutional investors. Its Wealth Management business provides trust, investment management, custody, and other financial services to high-net-worth families. We see NTRS as an attractive investment given the anticipated faster than market growth in these two business lines.
NTRS’s steady fee business is supported by the growth of Assets under Custody for alternative and traditional investment managers and by the focused growth of its Wealth Management business. Our analysis indicates that NTRS’s C&IS business can grow faster than its peers due to its strong service and technology offerings in risk and analytics, which are driving client wins and market share gains across alternative and institutional managers. Also, the Wealth Management unit’s expansion into specific markets where NTRS does not have a strong historical presence is expected to drive additional fee growth. Separately, we believed the company will materially reduce money market fee waivers post the December 2015 interest rates increase, which has a positive impact on earnings. NTRS also has a well-capitalized balance sheet, which supports future growth and the potential return of excess capital to shareholders through buybacks and the 2.1% dividend yield2. We started a new position, as we feel the company’s current value does not appropriately discount these revenue growth and operating improvement opportunities.
Lam Research (LRCX), purchased in June 2016, is a leading supplier of etch and deposition equipment used by the semiconductor manufacturing industry. As the #1 provider of etch equipment with high-50% share and a leading player in deposition equipment with high-30% share, Lam was well positioned to benefit from the strong upgrade cycle for semiconductor capital equipment driven by the move to 3D memory and more advance chipsets.
The structural trends of mobility and big data are driving demand for leading-edge semiconductor memory which powers the upgrade cycle for new tools and equipment by semi manufacturers. We believed Lam
| 2 | Trailing 12-months as of July 18, 2016 (Bloomberg). The dividend yield of the underlying security in the Fund’s portfolio does not represent or predict the performance of the Fund. |
4
LATEEF FUND
Annual Investment Adviser’s Report (Continued)
April 30, 2017
(Unaudited)
was poised to grow faster than the total spend on semiconductor capital equipment as increasingly advanced chips require greater capital intensity in etch and deposition – Lam’s categories of leadership. Further, the low penetration of solid-state drives, enabled by 3D memory, in servers and mobile devices could provide long-term growth that is underappreciated by the market.
We purchased Advance Auto Parts (AAP) in June 2016. Through its network of stores and branches, AAP provides aftermarket auto parts in North America to Do-it-for-Me (DIFM) and Do-it-Yourself (DIY) customers. As of January 2016, AAP operated 5,170 total stores and 122 branches. We believe AAP is in the nascent stages of a turnaround after underperforming peers on the metrics of revenue growth, store productivity, and profitability despite being the leader in retail commercial aftermarket auto parts, an attractive segment of the market.
We attribute AAP’s underperformance to poor parts availability, weak customer service, and an inefficient supply chain, which were further exacerbated by the acquisition of General Parts International in early 2014. The company’s new CEO, Tom Greco, and the reconstituted Board of Directors bring specific skill sets in managing complex supply chains and running retail businesses with large headcounts. Our analysis suggests that the new leadership team at AAP could drive operating margins higher by 400 basis points over the next three years through supply chain improvements, better inventory management, and more consistent top line growth. Given recent underperformance and the challenges ahead, AAP trades at a discount to O’Reilly and AutoZone. We expect that as the turnaround evolves, the valuation gap will narrow between AAP and its North American competitors.
Visa, Inc. (V) was also purchased in June 2016, and is the largest global payment network. In late June, Visa completed the acquisition of Visa Europe for € 21.2 billion. Visa Europe was previously owned by a consortium of European banks and not run to optimize growth and profits. In the hands of Visa, Inc., Visa Europe has the opportunity to improve revenue growth and profitability by enhancing the overall products offered to banks. When Visa, Inc. and Visa Europe split in 2007, Visa Europe became owned and managed by its European bank customers. We believe that, because of this ownership structure, Visa Europe earns lower revenue yields compared to MasterCard in Europe and has lost market share due to an inferior product offering.
Visa, Inc. has stated that it will focus on improving revenue yields in Europe in-line with global yields, which we believe will also drive an improvement in margin. Visa also benefits from the secular tailwind of cash-to-plastic conversion. Nearly 50% of payments in the U.S. are still settled by cash and check while only 10% of retail spending is conducted online. Outside of the U.S., online spending metrics are even lower, indicating a long runway of growth for electronic payments. High barriers to entry and low capital intensity historically underpin high returns on capital and strong cash flow generation for payment networks including Visa. Management has a strong track record of generating earnings growth and returning capital to shareholders. Given these factors, we see Visa as an attractive holding in today’s uncertain environment.
5
LATEEF FUND
Annual Investment Adviser’s Report (Continued)
April 30, 2017
(Unaudited)
In December 2016, we started a position in Sabre Corporation (SABR), which provides technology solutions to the global airline and hospitality industries. Sabre operates through two business segments: Travel Network and Airline & Hospitality Solutions. In Travel Network, Sabre’s global distribution system (GDS) connects travel agencies and travel management companies to the availability, pricing, and inventory of flights, hotels, and car rentals offered by travel suppliers. Sabre has 55% market share in the U.S. and a leading share in high growth regions such as Asia Pacific (40% share) and Latin America (55% share), which should result in faster than peer growth over the long-term. High barriers to entry also create a strong base of recurring revenues and cash flow.
In Airline & Hospitality Solutions, we believe that Sabre, along with its key competitor Amadeus, will be the key beneficiaries as airlines and hotels increasingly outsource their critical technology needs from outdated legacy IT systems to more modern SaaS-based (Software as a Service) solutions in an effort to maximize revenues and optimize costs. With one of two modern airline reservation systems available to the market, Sabre is well positioned to win a meaningful share of the 650 million passengers boarded that will roll off outdated reservation systems over the next few years (compared to roughly 2 billion passengers boarded currently on Sabre and Amadeus reservation systems). New solutions such as revenue optimization, crew management, and commercial analytics also expand Sabre’s wallet share and create more opportunities for cross-selling within its existing customer base of 225 airlines and 36,000 hotel properties. Given these long-term growth opportunities, along with potential upside from a re-rating towards that of Amadeus and capital allocation optionality, we decided Sabre was an attractive holding for our portfolio.
Canadian Pacific Railway (CP) was also added to the portfolio in December 2016. Canadian Pacific’s business mix includes bulk commodities, merchandise freight and intermodal traffic shipped over a network of approximately 12,500 miles connecting the business centers of Montreal and Vancouver in Canada and the U.S. Northeast and Midwest. Our analysis indicates that Canadian Pacific should be able to grow EPS at a double-digit pace over the next three years through a combination of volume recovery, operating leverage, and share buybacks.
We believe that after two years of volume declines due to record grain volumes in 2013 and 2014, freight volumes are on track to inflect positively in 2017 on a recovery in grain, strong intermodal traffic, and growth in potash and fertilizer. With high operating leverage and 3-4% pricing power, Canadian Pacific should be able to drive continued margin improvement. Following a period of sustained investment to improve the quality of its network and comply with new regulations, Canadian Pacific should have lower capital investment needs over the next three years with lower capital expenditures driving higher free cash flow generation that can be used for share buybacks. Further, the company has an existing land bank with an estimated value of Canadian Dollars (CAD) $1.0 billion, which management plans to develop through partnerships that could increase the value of land to CAD $2.0 billion (or roughly 7% of market cap). We do not believe the value of the land bank is priced into today’s valuation. Given the company’s double-digit earnings growth potential and our confidence in a recovery in freight volumes, we decided to start a position in Canadian Pacific.
6
LATEEF FUND
Annual Investment Adviser’s Report (Continued)
April 30, 2017
(Unaudited)
In February 2017, we purchased Progressive (PGR). Progressive is a leading provider of personal and commercial automobile insurance in the United States, ranking fourth in personal auto premiums written and first in commercial auto premiums written.3 Through the acquisition of American Strategic Insurance in April 2015, Progressive effectively expanded its addressable market to homeowner’s insurance and bundled home and auto insurance. Bundled home and auto insurance and homeowners are each $90 billion markets (by annual premiums written) where Progressive has less than 1% market share.
Given Progressive’s 15% market share in unbundled auto insurance along with its #1 ranking in unaided brand awareness and top-of-mind brand awareness, we believe Progressive can successfully grow its market share in these fragmented markets by leveraging its large base of independent agents, paving way for potentially double-digit premium growth over the next 3 to 5 years.4 Bundled home and auto insurance policies tend to have higher retention rates, which we believe should improve Progressive’s return on equity as this segment grows. Outside of core underwriting, Progressive also has one of the most interest rate-sensitive investment portfolios in the industry. With a portfolio duration of 2.2 years, Progressive should benefit from an increasing interest rate environment. Given the anticipated growth and interest rate upside, we decided that Progressive was an attractive addition to our portfolio.
We started a position in Raymond James Financial (RJF) during March 2017. Raymond James is a diversified financial services firm offering financial planning, securities transactions, investment banking, and asset management services to individuals, corporations, and municipalities. As a leading independent brokerage, Raymond James currently has over $600 billion in client assets under administration, which it serves through its 7,100 financial advisors and 2,900 locations. We believe Raymond James to be a premier independent brokerage firm with an opportunity to grow its assets under administration through a combination of organic growth, increases in advisor productivity, regional expansion, and market appreciation.
With the scope and scale of service that rivals large wirehouses, but a culture and incentive structure more aligned with an independent advisor’s, Raymond James benefits from the long-term trend of financial advisor attrition from the wirehouse channel to the independent and regional broker channel. Further, growth in assets and advisors should be bolstered by geographic expansion as the company expands to the West and Northeast.
| 3 | Source: A.M. Best (via Bloomberg) |
| 4 | Source: PGR Market Research and Brand Tracker (via Progressive Analyst Day slides) |
7
LATEEF FUND
Annual Investment Adviser’s Report (Continued)
April 30, 2017
(Unaudited)
Similar to Progressive, Raymond James should benefit from a rising interest rate environment. Including the December 2016 rate hike, we estimate that a 100 basis point increase in the Fed Funds Rate could translate to $40-$60 million in pretax income per quarter, or roughly a potential 15-20% boost to pretax income. Further, we believe that as Raymond James expands its suite of cash management products, it can grow client cash balances, a high margin activity for the business. Client cash balances only constitute 8% of client assets, below that of wirehouses and online brokerage counterparts based on reported filings. Given these positive attributes and the lack of Wall Street Coverage, we believe Raymond James will be an attractive holding for the long-term.
Anthem (ANTM) was purchased in April 2017. Anthem, as the Blue Cross Blue Shield (“Blues”) licensee in 14 states, can leverage the brand recognition of the Blues to expand individual, government-sponsored, and commercial membership over the long-run. Its regional market share leadership allows the company to negotiate larger discounts from providers, lowering the cost of care and benefiting returns. These contracts with hospital providers also support the company’s commercial self-funded business, where Anthem earns administration fees on nearly 25 million members. As the 3rd largest player in Medicare Advantage and 2nd largest player in Medicaid, Anthem should grow alongside aging baby boomers, Medicaid expansion, and the growing penetration of managed care within these government-sponsored programs as states choose to outsource services in an effort to combat rising healthcare costs and control state budgets.
We believe that three issues currently weigh on Anthem’s shares, all of which should be resolved by year end: (1) its future involvement in public exchanges, (2) its Pharmacy Benefit Management (PBM) contract with Express Scripts, and (3) its proposed merger with Cigna that has been denied by the Department of Justice. Anthem has the opportunity to improve margins by exiting or reducing its exposure to public exchanges and renegotiating/replacing its PBM contract. Management is expected to reveal plans for exchanges in the third quarter of 2017 and provide more clarity on its future PBM contract by year end. Finally, the termination of the proposed Anthem-Cigna merger could pave way for cash to be returned to shareholders through buybacks. The company had suspended all buyback activity following the merger announcement in 2015.
XPO Logistics (XPO), also purchased in April 2017, is a top ten global provider of supply chain solutions, operating as a highly-integrated network of people, technology and physical assets. XPO is the #2 global provider of contract logistics, #2 provider of Less-than-Truckload (LTL) capacity in North America, #1 provider of truck brokerage, and owns the largest truckload/LTL fleet in Europe. After five years of bolt-on and transformational acquisitions, CEO Brad Jacobs has created a vertically-integrated freight services company designed to serve shippers’ demand for end-to-end logistics solutions against the backdrop of strong e-commerce and inflecting industrial shipping trends.
We believe that the company is uniquely positioned as it offers a complete suite of transportation and logistics solutions, which should result in an increase in market share over the long term as XPO converts
8
LATEEF FUND
Annual Investment Adviser’s Report (Continued)
April 30, 2017
(Unaudited)
customers across the supply chain. In a $1 trillion global market for transportation and logistics, XPO has less than 2% market share despite being a leading player in the categories where it participates. XPO also has the opportunity to eliminate $300 million of ongoing expenses by 2018 through leveraging scale, consolidating redundancies, and bringing best-practices to new companies. The extent of the internal opportunities at the company should reduce XPO’s reliance on macro trends to deliver on its EBITDA5 and FCF6 targets. Furthermore, after deleveraging to 3.0x net debt to EBITDA, the company should have significant capacity to pursue M&A to enhance growth or engage in shareholder friendly capital allocation due to its increased profitability.
We sold our position in Madison Square Garden (MSG) in May 2016. MSG, having spun off its regional sports network, is purely focused on sports and entertainment through its ownership of the Knicks, Rangers, Garden Arena, and other sports franchises and entertainment venues. As part of the separation, MSG received a $1.4 billion cash injection of which $935 million was earmarked for future acquisitions to drive growth and the remainder allocated towards stock buybacks. We believed that the gap between public market value and private market value for MSG’s assets would narrow as the company repurchased shares. However, management’s actions have not matched their articulated priorities for capital allocation. A lack of buybacks during periods of share price weakness made us question management’s commitment and ability to unlock value. Further, we question the market for attractive, accretive assets that are available for purchase. Given these changes to our outlook, we decided to sell our position in MSG.
After the U.K. voted for a Brexit, we decided to sell out of our position in VipShop Holdings (VIPS) in June 2016. The heightened environment of uncertainty following the U.K.’s decision to leave the European Union has caused a flight to safety, resulting in a stronger U.S. dollar. VIPS’ revenue is 100% exposed to the Chinese renminbi, which we believe could continue to weaken in the current market environment. We do not expect the currency weakness to be offset by the fundamentals of the business. Further, we originally initiated our position in VIPS under the presumption that discount retailing was a large yet highly fragmented market and that VIPS stood to be the industry consolidator in the greater Chinese market. While this has held true with the company posting double digit revenue growth and EPS growth, this fundamental growth in the business has not translated to share price performance. Given these concerns, we viewed the risk-reward of holding VIPS as less compelling and sold the company.
| 5 | Earnings before Interest Taxes Depreciation and Amortization |
| 6 | Free Cash Flow |
9
LATEEF FUND
Annual Investment Adviser’s Report (Continued)
April 30, 2017
(Unaudited)
Stabilizing gross gaming revenue trends in Macau, Steve Wynn’s personal purchase of shares, and a successful analyst day outlining the next phases of growth helped turn investors’ sentiment, leading to a re-ratingin Wynn Resorts (WYNN) share price off its January lows. The company also opened Wynn Palace, its $4.2 billion casino resort located on the Cotai strip in Macau during August 2016. However, ahead of the opening in early August, the Macau gaming commission granted 150 total tables to Wynn (100 at the open and 25 tables each on January 1, 2017 and January 1, 2018), below the market’s expectation of 200 to 250 tables. While management can reallocate idle and underperforming tables from Wynn Peninsula to reach 350 total gaming tables at the new property, this news altered our thesis and our estimate of fair value. As such, we decided to sell the company in September 2016.
We exited Lam Research (LRCX) in October 2016. We originally purchased LRCX under the thesis that the company’s leading positions in semiconductor etch and deposition equipment would benefit from the current upgrade cycle of capital equipment driven by 3D memory and more advanced foundry/logic chips. We exited our position in Lam as our thesis had been realized. Faster than expected conversions from planar to 3D Memory resulted in installed capacity reaching the high end of management’s original expectation of 350,000-400,000 wafer starts per month at year-end. Given these higher expectations, we see growth in 2017 as largely priced in. Further, on October 5, 2016, Lam and KLA-Tencor terminated their planned combination due to resistance from the Department of Justice and other international regulatory bodies. This decision removed $250 million of targeted cost savings and the potential for longer term revenue synergies. We believed that a more diverse stream of revenues could result in a re-rating of Lam’s multiple, which historically traded at a discount to Applied Material and KLA-Tencor.
During October 2016, we sold Stericycle (SRCL). When we originally initiated our position, we believed that Stericycle had attractive growth prospects due to its ability to cross sell additional services to its existing customer base. With an economically resilient business supported by long-term contracts, we believed that Stericycle would receive a stream of predictable revenues and profits over the long-term. However, pricing pressure in the company’s core small-quantity medical waste business was higher than we anticipated. As small medical practices joined larger hospital groups, Stericycle was forced to renew contracts at steep discounts, which impacted revenues and profitability. Given these headwinds and an increasing loss of confidence in management, we believed that Stericycle’s ability to grow earnings at a double-digit pace was at risk and thus sold our position.
We sold our position in United Parcel Service (UPS) in December 2016, as it had reached our estimate of fair value. UPS generated a total return of 24.1% year-to-date through November 2016, as the company was rewarded for a successful 2015 peak holiday season, strong international shipping volumes, and an optimistic outlook for U.S. economic growth. Given its premium valuation and the potential margin deterioration in its international business as currency hedges roll off, we decided to sell the company.
Finally, we exited out of Hologic (HOLX) during April 2017. We originally purchased Hologic as the company was in the early stages of a culture change driven by CEO Steve MacMillan. By investing to innovate,
10
LATEEF FUND
Annual Investment Adviser’s Report (Continued)
April 30, 2017
(Unaudited)
the company was creating a pathway towards sustainable long-term growth through new product launches in Breast Imaging and Molecular Diagnostics. We exited our position as our thesis had been realized and Hologic’s valuation had adequately priced in future growth expectations. Further, with the company’s 3D Breast Imaging system reaching over 50% penetration of its existing 2D install base, our analysis suggested that organic growth could slow. While international growth remains a future opportunity, we believe that the complicated European regulatory process, delayed start, and lack of clear international go-to-market strategy will push out the returns of international investment. We also view the company’s March 2017 acquisition of Cynosure, Inc., which manufactures and sells medical aesthetic products, as a departure from HOLX’s core competencies.
Conclusion
We are diligently searching for new ideas that satisfy our dual tenants of quality and growth, and aim to add several more positions in the coming months to add diversity into our holdings to help position us for the current market environment. Our returns have been better to start this year and we believe that performance will continue to improve as markets reward quality companies with strong underlying fundamentals. We look forward to sharing more of these ideas with you in upcoming Shareholder Letters.
Thank you for your support and confidence, we look forward to continuing our valued partnership.
Sincerely,

Lateef Investment Management
~ Celebrating 40 Years of Exceptional Results in Investment Management ~
All opinions and data included in this commentary are as of April 30, 2017, unless otherwise noted, and are subject to change without notice. The opinions and views expressed herein are of Lateef Investment Management, L.P. (Lateef) and are not intended to be seen as fact, a forecast of future events, or a guarantee of future results. The information in this publication has been developed internally and/or obtained from sources believed to be reliable, but the accuracy or completeness of this information cannot be guaranteed. This publication is provided for informational purposes only and does not constitute a solicitation, investment advice or recommendation for any particular investment product or strategy. Economic forecasts and estimated data reflect subjective judgments and assumptions and unexpected events may occur. Therefore, there can be no assurance that developments will transpire as may be forecasted in this publication. This information should not be used as the sole basis to make any investment decision. No investment strategy can assure a profit or protect against loss. Past performance is not a guarantee or indication of future performance. Current and future portfolio holdings are subject to change and risk.
11
LATEEF FUND
Annual Investment Adviser’s Report (Continued)
April 30, 2017
(Unaudited)
Lateef Fund Leaders & Laggards from 5/1/2016 through 4/30/2017*
The Lateef Fund’s top contributors to performance were SVB Financial Group, Autodesk, and Alphabet for the period May 1, 2016 through April 30, 2017.
SVB Financial (SIVB) was one of our top performers during the reporting period. Shares rallied following the U.S. Presidential election as investors rotated into banks under the premise of lower regulations and higher interest rate expectations. From November 8 to year-end 2016, shares of SIVB generated a total return of 37.9%. In December, the Federal Reserve raised its target rate by 25 basis points, just the second rate hike in the past 10 years, while also forecasting up to 3 rate hikes in 2017 (a March hike followed). This helped confirm part of our original theses that higher interest rates would expand net interest margins, benefiting profitability and available excess capital. Outside of higher interest rates, SIVB grew its loan book in 2016 at a mid-20% rate, driven by venture capital and private equity capital call lines along with private consumer mortgages. The company also has the opportunity to grow fee income as it expands services offered to its core customer base. Given these factors, we continue to see SIVB as an attractive holding.
Autodesk (ADSK) benefited from the strong momentum generated at the company’s Analyst Day in December. Our original thesis was that the company’s transition from perpetual licenses to subscriptions would increase customer lifetime values and ADSK’s addressable market, both of which should create economic value for the company and shareholders. While headline financial line items such as revenues and earnings have been skewed by the transition, the transition nevertheless has remained on track based on key metrics such as subscriber growth and annual recurring revenues. In early February, ADSK announced that Carl Bass, the company’s longtime CEO, would step down (along with board members associated with an activist investor). The company also reported fourth quarter results in early March that beat street estimates. Also during the announcement, management provided a clear outline for driving conversion of “old model” maintenance contracts to “new model” subscriptions, which further solidified our thesis.
Alphabet (GOOGL) was our final top contributor during this period. Shares of GOOGL outperformed towards the end of July 2016 and April 2017, following strong beats on quarterly results. Specifically, in April 2017, the company reported net revenues of $20.1 billion for the first quarter of 2017, up 22% year-over-year. GOOGL’s strong growth was propelled by mobile advertising, YouTube video advertisements, and growing revenue from Play, Hardware, and Cloud. Despite higher operating costs, GOOGL showed operating leverage in the quarter and reported EPS that beat expectations. These results confirm our thesis that Alphabet will be a key beneficiary of the shift in advertising dollars from traditional outlets to new online and mobile platforms. Further, the company is reinvesting for growth in new verticals such as Play, Hardware, and Cloud. Given these opportunities, we continue to see GOOGL as an attractive holding for our portfolio.
12
LATEEF FUND
Annual Investment Adviser’s Report (Continued)
April 30, 2017
(Unaudited)
The Lateef Fund’s bottom detractors to performance were Advance Auto Parts, Nielsen Holdings, and Stericycle for the period May 1, 2016 through April 30, 2017.
Advance Auto Parts (AAP) declined along with peers on news that Amazon may push more heavily into the do-it-yourself (DIY) after-market auto part market. We do not take the threat of Amazon lightly; however, we note that Amazon was already an established player in after-market auto parts and serves a different need than AAP’s immediately available aftermarket parts for do-it-for-me (DIFM) and commercial customers. In February, AAP reported fourth quarter like-for-like growth of 3.1%, far exceeding consensus expectations of a 0.3% decline. This positive sentiment faded soon after on reports of gross margin compression from inventory drawdowns and weak results from competitors that were negatively impacted by weather and a delay in tax refunds. We view these issues as transitory and remain confident in AAP’s upside as it remains in the early-stages of transforming the business. We believe improvements in the company’s supply chain, inventory availability, and incentive compensation will improve AAP’s go-to-market strategy, potentially leading to faster like-for-like growth, market share gains, and positive returns for shareholders.
Nielsen Holdings (NLSN) was a bottom contributor reporting third quarter results in late October that missed expectations. Buy segment revenues in the U.S. declined 2.5% constant currency due to a structural shift in how multi-national food and beverage companies buy point-of-sales data. Specifically, management blamed a secular shift in client focus away from ad hoc projects towards data that can enable near-term actions. While this trends only impacted 3-4% of NLSN’s revenues, this unexpected news shook investor confidence as the Buy segment was thought of as a source of stable and recurring revenues. Management outlined the launch of new products aimed to provide software-and data-as-a-service, which will be higher margin once adopted. We believe the market has over-penalized NLSN given the limited size of at-risk revenues. Over the long-term, we believe the company remains well positioned as the entrenched provider of key consumer packaged goods data. Further, the company’s investments in the Watch segment have only just begun to bear fruit, positioning NLSN as the de-facto rating system for cross-platform measurement.
Stericycle (SRCL) was our final bottom contributor during the reporting period. Following a resetting of expectations in April 2016, management again lowered guidance for full-year EPS in July. Whereas the original adjustment was the result of softer industrial hazardous waste volumes, the latter adjustment was due to pricing pressure in its core regulated medical waste business. We believe that the industrial hazardous waste business has been adequately ’de-risked’ following the guidance revision; however, pricing pressure in core regulated medical waste business was higher than we anticipated. As small medical practices joined larger hospital groups, SRCL was forced to renew contracts at steep discounts, which impacted revenues and profitability. Given these headwinds and an increasing loss of confidence in management, we believed that SRCL’s ability to grow earnings at a double-digit pace was at risk and thus sold our position.
13
LATEEF FUND
Annual Investment Adviser’s Report (Concluded)
April 30, 2017
(Unaudited)
| * | The list of top three and bottom three holdings should not be considered a recommendation to purchase or sell a particular security, represents only part of the Fund and the securities purchased for advisory clients, and may not remain in the Fund at the time you receive this letter. You should not assume that investments in the securities identified were, or will be, profitable or that decisions we make in the future will be profitable. |
This letter is intended to assist shareholders in understanding how the Fund performed during the fiscal year ended April 30, 2017, and reflects the views of the investment adviser at the time of this writing. Of course, these views may change and do not guarantee the future performance of the Fund, its holdings or the markets. Discussion of particular Fund holdings is not intended as a recommendation to buy, hold or sell those securities. The Fund’s portfolio composition is subject to change. Current and future portfolio holdings are subject to investment risks. Since the Fund is non-diversified and may invest a larger portion of its assets in the securities of a single issuer than a diversified fund, an investment in the Fund could fluctuate in value more than an investment in a diversified fund. Actual events may differ from the earnings projections and other forward looking statements presented herein. Visit www.lateef.com to see the Fund’s most recently published holdings list.
14
LATEEF FUND
Annual Report
Performance Data
April 30, 2017
(Unaudited)
Comparison of Change in Value of $10,000 in Lateef Fund’s Class A and Class C Shares
vs. Russell 3000® Index and S&P 500® Index
Class A Shares growth of an assumed $10,000 investment is adjusted for the maximum sales charge of 5.00%. This results in a net initial investment of $9,500.
Comparison of Change in Value of $1,000,000 (Class I investment minimum) in Lateef Fund’s Class I Shares
vs. Russell 3000® Index and S&P 500® Index
15
LATEEF FUND
Annual Report
Performance Data (Concluded)
April 30, 2017
(Unaudited)
Annual Report Performance Data (Concluded) April 30, 2017 (Unaudited)
Average Annual Total Returns for the Periods Ended April 30, 2017
| 1 Year | 3 Years | 5 Years | Since Inception* | |||||||||||||
Class A Shares (with sales charge) | 6.97 | % | 3.65 | % | 8.17 | % | 5.89 | % | ||||||||
Class A Shares (without sales charge) | 12.64 | % | 5.44 | % | 9.29 | % | 6.46 | % | ||||||||
Class C Shares | 11.71 | % | 4.62 | % | 8.47 | % | 5.63 | % | ||||||||
Class I Shares | 12.86 | % | 5.69 | % | 9.56 | % | 6.73 | % | ||||||||
Russell 3000® Index | 18.58 | % | 10.10 | % | 13.57 | % | 7.50 | %** | ||||||||
S&P 500® Index | 17.92 | % | 10.47 | % | 13.68 | % | 7.37 | %** | ||||||||
| * | The Lateef Fund (the “Fund”) commenced operations on September 6, 2007. |
| ** | Benchmark performance is from inception date of the Fund only and is not the inception date of the benchmark itself. |
The performance data quoted represents past performance and does not guarantee future results. The investment return and principal value of an investment in the Fund will fluctuate so that an investor’s shares, when redeemed, may be worth more or less than their original cost. The graphs and table do not reflect the deduction of taxes that a shareholder would pay on Fund distributions or redemption of Fund shares. Current performance may be lower or higher. Performance data current to the most recent month-end may be obtained by calling (866) 499-2151.
The returns shown for Class A Shares reflect a deduction for the maximum front-end sales charge of 5.00%. All of the Fund’s share classes apply a 2.00% redemption fee to the value of shares redeemed within 30 days of purchase. This redemption fee is not reflected in the returns shown above. As stated in the current prospectus dated September 1, 2016, the Fund’s “Total Annual Fund Operating Expenses” are 1.41%, 2.16% and 1.16%, and the Fund’s “Total Annual Fund Operating Expenses After Fee Waiver and/or Expense Reimbursement” are 1.24%, 1.99% and 0.99% for Class A, Class C and Class I Shares, respectively, of the Fund’s average daily net assets. These rates may fluctuate and may differ from the actual expenses incurred by the Fund for the period covered by this report. Lateef Investment Management, L.P. (“the Adviser”) has contractually agreed to reduce its investment advisory fee and/or reimburse certain expenses of the Fund to the extent necessary to ensure that the Fund’s total operating expenses (excluding taxes, any class-specific fees and expenses, interest, extraordinary items, “Acquired Fund” fees and expenses and brokerage commissions) do not exceed 0.99% (on an annual basis) of the Fund’s average daily net assets (the “Expense Limitation”). The Expense Limitation shall remain in effect until August 31, 2017, unless the Board of Trustees of FundVantage Trust (the “Trust”) approves its earlier termination. Total returns would be lower had such fees and/or expenses not been waived and/or reimbursed.
All mutual fund investing involves risk, including possible loss of principal. The Fund is non-diversified, which means that a portion of the Fund’s assets may be invested in one or few companies or sectors. The Fund could fluctuate in value more than a diversified fund.
The Fund intends to evaluate performance as compared to that of the Standard & Poor’s 500®Index (“S&P 500®”) and the Russell 3000® Index. The S&P 500® is a widely recognized, unmanaged index of 500 common stocks which are generally representative of the U.S. stock market as a whole. The Russell 3000® Index is an unmanaged index that measures the performance of the 3,000 largest U.S. stocks, representing about 98% of the total capitalization of the entire U.S. stock market. It is impossible to invest directly in an index.
16
LATEEF FUND
Fund Expense Disclosure
April 30, 2017
(Unaudited)
As a shareholder of the Fund, you incur two types of costs: (1) transaction costs including sales charges (loads) on purchase payments (if any) or redemption fees; and (2) ongoing costs, including management fees, distribution and/or service (Rule 12b-1) fees (if any) and other Fund expenses. These examples are intended to help you understand your ongoing costs (in dollars) of investing in the Fund and to compare these costs with the ongoing costs of investing in other mutual funds.
These examples are based on an investment of $1,000 invested at the beginning of the six-month period from November 1, 2016 through April 30, 2017 and held for the entire period.
Actual Expenses
The first line of the accompanying table provides information about actual account values and actual expenses. You may use the information in this line, together with the amount you invested, to estimate the expenses that you paid over the period. Simply divide your account value by $1,000 (for example, an $8,600 account value divided by $1,000 = 8.6), then multiply the result by the number in the first line under the heading entitled “Expenses Paid During Period” to estimate the expenses you paid on your account during this period.
Hypothetical Examples for Comparison Purposes
The second line of the accompanying table provides information about hypothetical account values and hypothetical expenses based on the Fund’s actual expense ratio and an assumed rate of return of 5% per year before expenses, which is not your Fund’s actual return. The hypothetical account values and expenses may not be used to estimate the actual ending account balance or expenses you paid for the period. You may use this information to compare the ongoing costs of investing in the Fund and other funds. To do so, compare these 5% hypothetical examples with the 5% hypothetical examples that appear in the shareholder reports of other funds.
Please note that the expenses shown in the accompanying table are meant to highlight your ongoing costs only and do not reflect any transactional costs, such as sales charges (loads) on purchase payments (if any) or redemption fees. Therefore, each hypothetical line of the accompanying table is useful in comparing ongoing costs only and will not help you determine the relative total costs of owning different funds. In addition, if these transactional costs were included, your costs would have been higher.
17
LATEEF FUND
Fund Expense Disclosure (Concluded)
April 30, 2017
(Unaudited)
| Lateef Fund | |||||||||||||||
| Beginning Account Value November 1, 2016 | Ending Account Value April 30, 2017 | Expenses Paid During Period* | |||||||||||||
Class A Shares | |||||||||||||||
Actual | $ | 1,000.00 | $ | 1,113.90 | $ | 6.50 | |||||||||
Hypothetical (5% return before expenses) | 1,000.00 | 1,018.65 | 6.21 | ||||||||||||
Class C Shares | |||||||||||||||
Actual | $ | 1,000.00 | $ | 1,109.30 | $ | 10.41 | |||||||||
Hypothetical (5% return before expenses) | 1,000.00 | 1,014.93 | 9.94 | ||||||||||||
Class I Shares | |||||||||||||||
Actual | $ | 1,000.00 | $ | 1,114.40 | $ | 5.19 | |||||||||
Hypothetical (5% return before expenses) | 1,000.00 | 1,019.89 | 4.96 | ||||||||||||
| * | Expenses are equal to an annualized expense ratio for the six-month period ended April 30, 2017 of 1.24%, 1.99% and 0.99% for Class A, Class C and Class I Shares, respectively, for the Fund, multiplied by the average account value over the period, multiplied by the number of days in the most recent period (181), then divided by 365 to reflect the period. The Fund’s ending account values on the first line in the table are based on the actual six-month total returns for the Fund of 11.39%, 10.93% and 11.44% for Class A, Class C and Class I Shares, respectively. |
18
LATEEF FUND
Portfolio Holdings Summary Table
April 30, 2017
(Unaudited)
The following table presents a summary by sector of the portfolio holdings of the Fund:
| % of Net Assets | Value | |||||||
COMMON STOCKS: | ||||||||
Technology | 28.4 | % | $ | 31,529,828 | ||||
Consumer, Non-cyclical | 25.6 | 28,510,393 | ||||||
Financial | 17.9 | 19,848,187 | ||||||
Consumer, Cyclical | 15.3 | 17,068,914 | ||||||
Industrial | 6.7 | 7,427,401 | ||||||
Energy | 3.9 | 4,315,984 | ||||||
Other Assets in Excess of Liabilities | 2.2 | 2,449,804 | ||||||
|
|
|
| |||||
NET ASSETS | 100.0 | % | $ | 111,150,511 | ||||
|
|
|
| |||||
Portfolio holdings are subject to change at any time.
The accompanying notes are an integral part of the financial statements.
19
LATEEF FUND
Portfolio of Investments
April 30, 2017
| Number of Shares | Value | |||||||
COMMON STOCKS — 97.8% |
| |||||||
Consumer, Cyclical — 15.3% |
| |||||||
Advance Auto Parts, Inc. | 37,508 | $ | 5,331,387 | |||||
Delphi Automotive PLC | 60,622 | 4,874,009 | ||||||
Dollar General Corp. | 32,255 | 2,345,261 | ||||||
Newell Brands, Inc. | 94,643 | 4,518,257 | ||||||
|
| |||||||
| 17,068,914 | ||||||||
|
| |||||||
Consumer, Non-cyclical — 25.6% |
| |||||||
Allergan PLC (Ireland) | 21,964 | 5,356,141 | ||||||
Anthem, Inc. | 19,570 | 3,481,307 | ||||||
Celgene Corp.* | 38,014 | 4,715,637 | ||||||
Danaher Corp. | 75,545 | 6,295,165 | ||||||
Quintiles IMS Holdings, Inc.* | 55,739 | 4,697,683 | ||||||
Sabre Corp. | 169,349 | 3,964,460 | ||||||
|
| |||||||
| 28,510,393 | ||||||||
|
| |||||||
Energy — 3.9% |
| |||||||
Schlumberger Ltd. | 59,457 | 4,315,984 | ||||||
|
| |||||||
Financial — 17.9% | ||||||||
Northern Trust Corp. | 72,144 | 6,492,960 | ||||||
Progressive Corp. (The) | 74,358 | 2,953,500 | ||||||
Raymond James Financial, Inc. | 39,190 | 2,920,439 | ||||||
SVB Financial Group* | 29,596 | 5,207,120 | ||||||
Willis Towers Watson PLC | 17,148 | 2,274,168 | ||||||
|
| |||||||
| 19,848,187 | ||||||||
|
| |||||||
| Number of Shares | Value | |||||||
COMMON STOCKS — (Continued) |
| |||||||
Industrial — 6.7% | ||||||||
Canadian Pacific Railway Ltd. | 33,666 | $ | 5,159,314 | |||||
XPO Logistics, Inc.* | 45,922 | 2,268,087 | ||||||
|
| |||||||
| 7,427,401 | ||||||||
|
| |||||||
Technology — 28.4% | ||||||||
Alphabet, Inc., Class A* | 8,891 | 8,219,907 | ||||||
Autodesk, Inc.* | 74,058 | 6,670,404 | ||||||
Facebook, Inc., Class A* | 55,064 | 8,273,366 | ||||||
Visa, Inc., Class A | 91,714 | 8,366,151 | ||||||
|
| |||||||
| 31,529,828 | ||||||||
|
| |||||||
TOTAL COMMON STOCKS | 108,700,707 | |||||||
|
| |||||||
TOTAL INVESTMENTS - 97.8% | 108,700,707 | |||||||
|
| |||||||
OTHER ASSETS IN EXCESS OF LIABILITIES - 2.2% | 2,449,804 | |||||||
|
| |||||||
NET ASSETS - 100.0% | $ | 111,150,511 | ||||||
|
| |||||||
| * | Non-income producing. |
PLC Public Limited Company
The accompanying notes are an integral part of the financial statements.
20
LATEEF FUND
Statement of Assets and Liabilities
April 30, 2017
Assets | ||||
Investments, at value (Cost $91,210,986) | $ | 108,700,707 | ||
Cash | 2,836,728 | |||
Receivable for capital shares sold | 3,708 | |||
Prepaid expenses and other assets | 47,203 | |||
|
| |||
Total assets | 111,588,346 | |||
|
| |||
Liabilities | ||||
Payable for capital shares redeemed | 174,231 | |||
Payable for transfer agent fees | 97,182 | |||
Payable to Investment Adviser | 84,670 | |||
Payable for audit fees | 26,000 | |||
Payable for distribution fees | 17,187 | |||
Payable for administration and accounting fees | 7,858 | |||
Payable for shareholder service fees | 4,068 | |||
Payable for custodian fees | 2,156 | |||
Accrued expenses | 24,483 | |||
|
| |||
Total liabilities | 437,835 | |||
|
| |||
Net Assets | $ | 111,150,511 | ||
|
| |||
Net Assets Consisted of: | ||||
Capital stock, $0.01 par value | $ | 117,400 | ||
Paid-in capital | 72,027,684 | |||
Accumulated net investment loss | (264,782 | ) | ||
Accumulated net realized gain from investments | 21,780,488 | |||
Net unrealized appreciation on investments | 17,489,721 | |||
|
| |||
Net Assets | $ | 111,150,511 | ||
|
|
Class A Shares: | ||||||||
Net asset value and redemption price per share | $ | 9.54 | ||||||
|
| |||||||
Maximum offering price per share (100/95 of $9.54) | $ | 10.04 | ||||||
|
| |||||||
Class C Shares: | ||||||||
Net asset value, offering and redemption price per share | $ | 8.41 | ||||||
|
| |||||||
Class I Shares: | ||||||||
Net asset value, offering and redemption price per share | $ | 9.80 | ||||||
|
| |||||||
The accompanying notes are an integral part of the financial statements.
21
LATEEF FUND
Statement of Operations
For the Year Ended April 30, 2017
Investment Income | ||||
Dividends | $ | 2,536,000 | ||
Less: foreign taxes withheld | (4,009 | ) | ||
|
| |||
Total investment income | 2,531,991 | |||
|
| |||
Expenses | ||||
Advisory fees (Note 2) | 2,827,970 | |||
Transfer agent fees (Note 2) | 317,853 | |||
Distribution fees (Class C) (Note 2) | 209,445 | |||
Administration and accounting fees (Note 2) | 199,100 | |||
Distribution fees (Class A) (Note 2) | 93,040 | |||
Shareholder services fees | 69,815 | |||
Registration and filing fees | 55,808 | |||
Legal fees | 46,674 | |||
Trustees’ and officers’ fees (Note 2) | 46,528 | |||
Custodian fees (Note 2) | 37,056 | |||
Printing and shareholder reporting fees | 33,902 | |||
Audit fees | 26,074 | |||
Other expenses | 52,154 | |||
|
| |||
Total expenses before waivers and reimbursements | 4,015,419 | |||
|
| |||
Less: waivers and reimbursements (Note 2) | (843,429 | ) | ||
|
| |||
Net expenses after waivers and reimbursements | 3,171,990 | |||
|
| |||
Net investment loss | (639,999 | ) | ||
|
| |||
Net realized and unrealized gain/(loss) from investments: | ||||
Net realized gain from investments | 34,508,010 | |||
Net change in unrealized appreciation/(depreciation) on investments | (5,863,211 | ) | ||
|
| |||
Net realized and unrealized gain on investments | 28,644,799 | |||
|
| |||
Net increase in net assets resulting from operations | $ | 28,004,800 | ||
|
|
The accompanying notes are an integral part of the financial statements.
22
LATEEF FUND
Statements of Changes in Net Assets
| For the Year Ended April 30, 2017 | For the Year Ended April 30, 2016 | |||||||
Increase/(decrease) in net assets from operations: | ||||||||
Net investment loss | $ | (639,999 | ) | $ | (1,376,240 | ) | ||
Net realized gain from investments and written options | 34,508,010 | 67,205,516 | ||||||
Net change in unrealized appreciation/(depreciation) on investments | (5,863,211 | ) | (69,573,953 | ) | ||||
|
|
|
| |||||
Net increase/(decrease) in net assets resulting from operations: | 28,004,800 | (3,744,677 | ) | |||||
|
|
|
| |||||
Less Dividends and Distributions to Shareholders from: | ||||||||
Net investment income: | ||||||||
Class A Shares. | — | (113,506 | ) | |||||
Class I Shares | — | (1,854,554 | ) | |||||
|
|
|
| |||||
Total net investment income | — | (1,968,060 | ) | |||||
|
|
|
| |||||
Net realized capital gains: | ||||||||
Class A Shares. | (7,011,695 | ) | (17,157,207 | ) | ||||
Class C Shares | (6,450,739 | ) | (9,925,957 | ) | ||||
Class I Shares | (27,778,265 | ) | (92,888,623 | ) | ||||
|
|
|
| |||||
Total net realized capital gains | (41,240,699 | ) | (119,971,787 | ) | ||||
|
|
|
| |||||
Net decrease in net assets from dividends and distributions to shareholders | (41,240,699 | ) | (121,939,847 | ) | ||||
|
|
|
| |||||
Decrease in Net Assets Derived from Capital Share Transactions (Note 4) | (326,602,282 | ) | (179,940,949 | ) | ||||
|
|
|
| |||||
Total decrease in net assets | (339,838,181 | ) | (305,625,473 | ) | ||||
|
|
|
| |||||
Net assets | ||||||||
Beginning of year | 450,988,692 | 756,614,165 | ||||||
|
|
|
| |||||
End of year | $ | 111,150,511 | $ | 450,988,692 | ||||
|
|
|
| |||||
Accumulated net investment loss, end of year | $ | (264,782 | ) | $ | (853,593 | ) | ||
|
|
|
| |||||
The accompanying notes are an integral part of the financial statements.
23
LATEEF FUND
Financial Highlights
Contained below is per share operating performance data for Class A Shares outstanding, total investment return, ratios to average net assets and other supplemental data for the respective period. The total returns in the table represent the rate that an investor would have earned or lost on an investment in the Fund (assuming reinvestment of all dividends and distributions). This information has been derived from information provided in the financial statements and should be read in conjunction with the financial statements and the notes thereto.
| Class A Shares | ||||||||||||||||||||
| For the Year Ended April 30, 2017 | For the Year Ended April 30, 2016 | For the Year Ended April 30, 2015 | For the Year Ended April 30, 2014 | For the Year Ended April 30, 2013 | ||||||||||||||||
Per Share Operating Performance | ||||||||||||||||||||
Net asset value, beginning of year | $ | 10.77 | $ | 14.00 | $ | 14.20 | $ | 12.45 | $ | 11.73 | ||||||||||
|
|
|
|
|
|
|
|
|
| |||||||||||
Net investment income/(loss)(1) | (0.04 | ) | (0.05 | ) | 0.01 | 0.04 | — | (2) | ||||||||||||
Net realized and unrealized gain/(loss) on investments | 1.25 | (0.19 | ) | 0.91 | 2.40 | 1.23 | ||||||||||||||
|
|
|
|
|
|
|
|
|
| |||||||||||
Net increase/(decrease) in net assets resulting from operations | 1.21 | (0.24 | ) | 0.92 | 2.44 | 1.23 | ||||||||||||||
|
|
|
|
|
|
|
|
|
| |||||||||||
Dividends and distributions to shareholders from: | ||||||||||||||||||||
Net investment income | — | (0.02 | ) | (0.01 | ) | — | (2) | (0.02 | ) | |||||||||||
Net realized capital gains | (2.44 | ) | (2.97 | ) | (1.11 | ) | (0.69 | ) | (0.49 | ) | ||||||||||
|
|
|
|
|
|
|
|
|
| |||||||||||
Total dividends and distributions to shareholders | (2.44 | ) | (2.99 | ) | (1.12 | ) | (0.69 | ) | (0.51 | ) | ||||||||||
|
|
|
|
|
|
|
|
|
| |||||||||||
Redemption fees | — | — | (2) | — | (2) | — | (2) | — | (2) | |||||||||||
|
|
|
|
|
|
|
|
|
| |||||||||||
Net asset value, end of year | $ | 9.54 | $ | 10.77 | $ | 14.00 | $ | 14.20 | $ | 12.45 | ||||||||||
|
|
|
|
|
|
|
|
|
| |||||||||||
Total investment return(3) | 12.64 | % | (2.31 | )% | 6.54 | % | 19.92 | % | 10.92 | % | ||||||||||
Ratio/Supplemental Data | ||||||||||||||||||||
Net assets, end of year (in thousands) | $ | 24,460 | $ | 56,657 | $ | 86,174 | $ | 148,897 | $ | 120,871 | ||||||||||
Ratio of expenses to average net assets. | 1.24 | % | 1.24 | % | 1.24 | % | 1.24 | % | 1.24 | % | ||||||||||
Ratio of expenses to average net assets without waivers and expense reimbursements(4) | 1.57 | % | 1.42 | % | 1.38 | % | 1.41 | % | 1.45 | % | ||||||||||
Ratio of net investment income/(loss) to average net assets | (0.35 | )% | (0.37 | )% | 0.08 | % | 0.31 | % | 0.04 | % | ||||||||||
Portfolio turnover rate | 41.70 | % | 65.01 | % | 29.22 | % | 40.77 | % | 28.29 | % | ||||||||||
| (1) | The selected per share data was calculated using the average shares outstanding method for the year. |
| (2) | Amount is less than $0.005 per share. |
| (3) | Total investment return is calculated assuming a purchase of shares on the first day and a sale of shares on the last day of each period reported and includes reinvestments of dividends and distributions, if any. Total investment return does not reflect the impact of the maximum front-end sales load of 5.00%. If reflected, the return would be lower. |
| (4) | During the period, certain fees were waived. If such fee waivers had not occurred, the ratios would have been as indicated (See Note 2). |
The accompanying notes are an integral part of the financial statements.
24
LATEEF FUND
Financial Highlights
Contained below is per share operating performance data for Class C Shares outstanding, total investment return, ratios to average net assets and other supplemental data for the respective period. The total returns in the table represent the rate that an investor would have earned or lost on an investment in the Fund (assuming reinvestment of all dividends and distributions). This information has been derived from information provided in the financial statements and should be read in conjunction with the financial statements and the notes thereto.
| Class C Shares | ||||||||||||||||||||
| For the Year Ended April 30, 2017 | For the Year Ended April 30, 2016 | For the Year Ended April 30, 2015 | For the Year Ended April 30, 2014 | For the Year Ended April 30, 2013 | ||||||||||||||||
Per Share Operating Performance | ||||||||||||||||||||
Net asset value, beginning of year | $ | 9.84 | $ | 13.11 | $ | 13.46 | $ | 11.91 | $ | 11.30 | ||||||||||
|
|
|
|
|
|
|
|
|
| |||||||||||
Net investment loss(1) | (0.10 | ) | (0.13 | ) | (0.09 | ) | (0.06 | ) | (0.08 | ) | ||||||||||
Net realized and unrealized gain/(loss) on investments. | 1.11 | (0.17 | ) | 0.85 | 2.30 | 1.18 | ||||||||||||||
|
|
|
|
|
|
|
|
|
| |||||||||||
Net increase/(decrease) in net assets resulting from operations | 1.01 | (0.30 | ) | 0.76 | 2.24 | 1.10 | ||||||||||||||
|
|
|
|
|
|
|
|
|
| |||||||||||
Dividends and distributions to shareholders from: | ||||||||||||||||||||
Net realized capital gains | (2.44 | ) | (2.97 | ) | (1.11 | ) | (0.69 | ) | (0.49 | ) | ||||||||||
Redemption fees | — | — | (2) | — | (2) | — | (2) | — | (2) | |||||||||||
|
|
|
|
|
|
|
|
|
| |||||||||||
Net asset value, end of year | $ | 8.41 | $ | 9.84 | $ | 13.11 | $ | 13.46 | $ | 11.91 | ||||||||||
|
|
|
|
|
|
|
|
|
| |||||||||||
Total investment return(3) | 11.71 | % | (2.98 | )% | 5.65 | % | 19.08 | % | 10.14 | % | ||||||||||
Ratio/Supplemental Data | ||||||||||||||||||||
Net assets, end of year (in thousands) | $ | 19,721 | $ | 35,840 | $ | 46,879 | $ | 50,080 | $ | 39,133 | ||||||||||
Ratio of expenses to average net assets | 1.99 | % | 1.99 | % | 1.99 | % | 1.99 | % | 1.99 | % | ||||||||||
Ratio of expenses to average net assets without waivers and expense reimbursements(4) | 2.33 | % | 2.17 | % | 2.14 | % | 2.16 | % | 2.19 | % | ||||||||||
Ratio of net investment loss to average net assets. | (1.10 | )% | (1.12 | )% | (0.67 | )% | (0.44 | )% | (0.71 | )% | ||||||||||
Portfolio turnover rate. | 41.70 | % | 65.01 | % | 29.22 | % | 40.77 | % | 28.29 | % | ||||||||||
| (1) | The selected per share data was calculated using the average shares outstanding method for the year. |
| (2) | Amount is less than $0.005 per share. |
| (3) | Total investment return is calculated assuming a purchase of shares on the first day and a sale of shares on the last day of each period reported and includes reinvestment of dividends and distributions, if any. |
| (4) | During the period, certain fees were waived. If such fee waivers had not occurred, the ratios would have been as indicated (See Note 2). |
The accompanying notes are an integral part of the financial statements.
25
LATEEF FUND
Financial Highlights
Contained below is per share operating performance data for Class I Shares outstanding, total investment return, ratios to average net assets and other supplemental data for the respective period. The total returns in the table represent the rate that an investor would have earned or lost on an investment in the Fund (assuming reinvestment of all dividends and distributions). This information has been derived from information provided in the financial statements and should be read in conjunction with the financial statements and the notes thereto.
| Class I Shares | ||||||||||||||||||||
| For the Year Ended April 30, 2017 | For the Year Ended April 30, 2016 | For the Year Ended April 30, 2015 | For the Year Ended April 30, 2014 | For the Year Ended April 30, 2013 | ||||||||||||||||
Per Share Operating Performance | ||||||||||||||||||||
Net asset value, beginning of year | $ | 10.98 | $ | 14.22 | $ | 14.41 | $ | 12.61 | $ | 11.87 | ||||||||||
|
|
|
|
|
|
|
|
|
| |||||||||||
Net investment income/(loss)(1) | (0.01 | ) | (0.02 | ) | 0.05 | 0.08 | 0.03 | |||||||||||||
Net realized and unrealized gain/(loss) on investments | 1.27 | (0.19 | ) | 0.92 | 2.43 | 1.25 | ||||||||||||||
|
|
|
|
|
|
|
|
|
| |||||||||||
Net increase/(decrease) in net assets resulting from operations | 1.26 | (0.21 | ) | 0.97 | 2.51 | 1.28 | ||||||||||||||
|
|
|
|
|
|
|
|
|
| |||||||||||
Dividends and distributions to shareholders from: | ||||||||||||||||||||
Net investment income | — | (0.06 | ) | (0.05 | ) | (0.02 | ) | (0.05 | ) | |||||||||||
Net realized capital gains | (2.44 | ) | (2.97 | ) | (1.11 | ) | (0.69 | ) | (0.49 | ) | ||||||||||
|
|
|
|
|
|
|
|
|
| |||||||||||
Total dividends and distributions to shareholders | (2.44 | ) | (3.03 | ) | (1.16 | ) | (0.71 | ) | (0.54 | ) | ||||||||||
|
|
|
|
|
|
|
|
|
| |||||||||||
Redemption fees | — | — | (2) | — | (2) | — | (2) | — | (2) | |||||||||||
|
|
|
|
|
|
|
|
|
| |||||||||||
Net asset value, end of year | $ | 9.80 | $ | 10.98 | $ | 14.22 | $ | 14.41 | $ | 12.61 | ||||||||||
|
|
|
|
|
|
|
|
|
| |||||||||||
Total investment return(3) | 12.86 | % | (2.04 | )% | 6.79 | % | 20.21 | % | 11.22 | % | ||||||||||
Ratio/Supplemental Data | ||||||||||||||||||||
Net assets, end of year (in thousands) | $ | 66,969 | $ | 358,492 | $ | 623,561 | $ | 650,454 | $ | 486,440 | ||||||||||
Ratio of expenses to average net assets | 0.99 | % | 0.99 | % | 0.99 | % | 0.99 | % | 0.99 | % | ||||||||||
Ratio of expenses to average net assets without waivers and expense reimbursements(4) | 1.28 | % | 1.16 | % | 1.14 | % | 1.16 | % | 1.19 | % | ||||||||||
Ratio of net investment income/(loss) to average net assets | (0.09 | )% | (0.12 | )% | 0.33 | % | 0.56 | % | 0.29 | % | ||||||||||
Portfolio turnover rate | 41.70 | % | 65.01 | % | 29.22 | % | 40.77 | % | 28.29 | % | ||||||||||
| (1) | The selected per share data was calculated using the average shares outstanding method for the year. |
| (2) | Amount is less than $0.005 per share. |
| (3) | Total investment return is calculated assuming a purchase of shares on the first day and a sale of shares on the last day of each period reported and includes reinvestment of dividends and distributions, if any. |
| (4) | During the period, certain fees were waived. If such fee waivers had not occurred, the ratios would have been as indicated (See Note 2). |
The accompanying notes are an integral part of the financial statements.
26
LATEEF FUND
Notes to Financial Statements
April 30, 2017
1. Organization and Significant Accounting Policies
The Lateef Fund (the “Fund”) is a non-diversified, open-end management investment company registered under the Investment Company Act of 1940, as amended (the “1940 Act”), which commenced investment operations on September 6, 2007. The Fund is a separate series of FundVantage Trust (the “Trust”) which was organized as a Delaware statutory trust on August 28, 2006. The Trust is a “series trust” authorized to issue an unlimited number of separate series or classes of shares of beneficial interest. Each series is treated as a separate entity for certain matters under the 1940 Act, and for other purposes, and a shareholder of one series is not deemed to be a shareholder of any other series. The Fund offers separate classes of shares, Class A, Class C and Class I Shares. Class A Shares are sold subject to a front-end sales charge. Front-end sales charges may be reduced or waived under certain circumstances. A contingent deferred sales charge (“CDSC”) may be applicable to the purchase of Class A Shares. A CDSC, as a percentage of the lower of the original purchase price or net asset value at redemption, of up to 1.00% may be imposed on full or partial redemptions of Class A Shares made within eighteen months of purchase where: (i) $1 million or more of Class A Shares were purchased without an initial sales charge and (ii) the selling broker-dealer received a commission for such sale.
The Fund is an investment company and follows accounting and reporting guidance in the Financial Accounting Standards Board Accounting Standards Codification Topic 946.
Portfolio Valuation — The Fund’s net asset value (“NAV”) is calculated once daily at the close of regular trading hours on the New York Stock Exchange (“NYSE”) (typically 4:00 p.m. Eastern time) on each day the NYSE is open. Securities held by the Fund are valued using the closing price or the last sale price on a national securities exchange or the National Association of Securities Dealers Automatic Quotation System (“NASDAQ”) market system where they are primarily traded. Equity securities traded in the over-the-counter market are valued at their closing prices. If there were no transactions on that day, securities traded principally on an exchange or on NASDAQ will be valued at the mean of the last bid and ask prices prior to the market close. Fixed income securities having a remaining maturity of greater than 60 days are valued using an independent pricing service. Fixed income securities having a remaining maturity of 60 days or less are generally valued at amortized cost, provided such amount approximates fair value. Foreign securities are valued based on prices from the primary market in which they are traded and are translated from the local currency into U.S. dollars using current exchange rates. Investments in other open-end investment companies are valued based on the NAV of the investment companies (which may use fair value pricing as discussed in their prospectuses). If market quotations are unavailable or deemed unreliable, securities will be valued in accordance with procedures adopted by the FundVantage Trust’s Board of Trustees. Options are valued at last sale price. Relying on prices supplied by pricing services or dealers or using fair valuation may result in values that are higher or lower than the values used by other investment companies and investors to price the same investments. In the event that market quotes are not readily available, and the security or asset cannot be valued pursuant to one of the valuation methods, the value of the security or asset will be determined in good faith by the Adviser. The Trust has established a Valuation Committee which performs certain functions including the oversight of the Adviser’s fair valuation determinations.
27
LATEEF FUND
Notes to Financial Statements (Continued)
April 30, 2017
Fair Value Measurements — The inputs and valuation techniques used to measure fair value of the Fund’s investments are summarized into three levels as described in the hierarchy below:
| • | Level 1 — quoted prices in active markets for identical securities; |
| • | Level 2 — other significant observable inputs (including quoted prices for similar securities, interest rates, prepayment speeds, credit risk, etc.); and |
| • | Level 3 — significant unobservable inputs (including the Fund’s own assumptions in determining the fair value of investments). |
The inputs or methodology used for valuing securities are not necessarily an indication of the risk associated with investing in those securities.
The following is a summary of the inputs used, as of April 30, 2017, in valuing the Fund’s investments carried at fair value:
| Total Value at 04/30/17 | Level 1 Quoted Price | Level 2 Other Significant Observable Inputs | Level 3 Significant Unobservable Inputs | |||||||||||||
Investments in Securities* | $ | 108,700,707 | $ | 108,700,707 | $ | — | $ | — | ||||||||
|
|
|
|
|
|
|
| |||||||||
| * | Please refer to Portfolio of Investments for further details on portfolio holdings. |
At the end of each quarter, management evaluates the classification of Levels 1, 2 and 3 assets and liabilities. Various factors are considered, such as changes in liquidity from the prior reporting period; whether or not a broker is willing to execute at the quoted price; the depth and consistency of prices from third party pricing services; and the existence of contemporaneous, observable trades in the market. Additionally, management evaluates the classification of Level 1 and Level 2 assets and liabilities on a quarterly basis for changes in listings or delistings on national exchanges.
Due to the inherent uncertainty of determining the fair value of investments that do not have a readily available market value, the fair value of the Fund’s investments may fluctuate from period to period. Additionally, the fair value of investments may differ significantly from the values that would have been used had a ready market existed for such investments and may differ materially from the values the Fund may ultimately realize. Further, such investments may be subject to legal and other restrictions on resale or are otherwise less liquid than publicly traded securities.
28
LATEEF FUND
Notes to Financial Statements (Continued)
April 30, 2017
For fair valuations using significant unobservable inputs, U.S. generally accepted accounting principles (“U.S. GAAP”) require the Fund to present a reconciliation of the beginning to ending balances for reported market values that presents changes attributable to total realized and unrealized gains or losses, purchase and sales, and transfers in and out of Level 3 during the period. Transfers in and out between Levels are based on values at the end of the period. U.S. GAAP also requires the Fund to disclose amounts and reasons for all transfers in and out of Level 1 and Level 2 fair value measurements. A reconciliation of Level 3 investments is presented only when the Fund had an amount of Level 3 investments at the end of the reporting period that was meaningful in relation to its net assets. The amounts and reasons for all transfers in and out of each Level within the three-tier hierarchy are disclosed when the Fund had an amount of total transfers during the reporting period that was meaningful in relation to its net assets as of the end of the reporting period.
For the year ended April 30, 2017, there were no transfers between Levels 1, 2 and 3 for the Fund.
Use of Estimates — The preparation of financial statements in conformity with U.S. GAAP requires management to make estimates and assumptions that affect the amounts reported in the financial statements and accompanying notes at the date of the financial statements and the reported amounts of revenues and expenses during the period. Actual results could differ from those estimates and those differences could be material.
Investment Transactions, Investment Income and Expenses — Investment transactions are recorded on trade date for financial statement preparation purposes. Realized gains and losses on investments sold are recorded on the identified cost basis. Interest income is recorded on the accrual basis. Dividends are recorded on the ex-dividend date. Estimated components of distributions received from real estate investment trusts may be considered income, return of capital distributions or capital gain distributions. Return of capital distributions are recorded as a reduction of cost of the related investments. Distribution (12b-1) fees and shareholder services fees relating to a specific class are charged directly to that class. Fund level expenses common to all classes, investment income and realized and unrealized gains and losses on investments are allocated to each class based upon the relative daily net assets of each class. General expenses of the Trust are generally allocated to each fund in proportion to its relative daily net assets. Expenses directly attributable to a particular fund in the Trust are charged directly to that fund. The Fund’s investment income, expenses (other than class-specific expenses) and unrealized and realized gains and losses are allocated daily to each class of shares based upon the relative proportion of net assets of each class at the beginning of the day.
Dividends and Distributions to Shareholders — Dividends from net investment income and distributions from net realized capital gains, if any, are declared, recorded on ex-date and paid at least annually to shareholders. Income dividends and capital gain distributions are determined in accordance with U.S. federal income tax regulations, which may differ from U.S. GAAP. These differences may include the treatment of non-taxable dividends, expiring capital loss carryforwards and losses deferred due to wash sales and excise tax regulations. Permanent book and tax basis differences relating to shareholder distributions will result in reclassifications within the components of net assets.
29
LATEEF FUND
Notes to Financial Statements (Continued)
April 30, 2017
U.S. Tax Status — No provision is made for U.S. income taxes as it is the Fund’s intention to continue to qualify for and elect the tax treatment applicable to regulated investment companies under Subchapter M of the Internal Revenue Code of 1986, as amended (the “Internal Revenue Code”), and make the requisite distributions to its shareholders which will be sufficient to relieve it from U.S. income and excise taxes.
Other — In the normal course of business, the Fund may enter into contracts that provide general indemnifications. The Fund’s maximum exposure under these arrangements is dependent on claims that may be made against the Fund in the future, and therefore, cannot be estimated; however, based on experience, the risk of material loss for such claims is considered remote.
Currency Risk — The Fund invests in securities of foreign issuers, including American Depositary Receipts. These markets are subject to special risks associated with foreign investments not typically associated with investing in U.S. markets. Because the foreign securities in which the Fund may invest generally trade in currencies other than the U.S. dollar, changes in currency exchange rates will affect the Fund’s NAV, the value of dividends and interest earned and gains and losses realized on the sale of securities. Because the NAV for the Fund is determined on the basis of U.S. dollars, the Fund may lose money by investing in a foreign security if the local currency of a foreign market depreciates against the U.S. dollar, even if the local currency value of the Fund’s holdings goes up. Generally, a strong U.S. dollar relative to these other currencies will adversely affect the value of the Fund’s holdings in foreign securities.
Options Written — The Fund is subject to equity and other risk exposure in the normal course of persuing its investment objectives and may enter into options written to hedge against changes in interest rates, foreign exchange rates and values of equities. Such options may relate to particular securities or domestic stock indices, and may or may not be listed on a domestic securities exchange or issued by the Options Clearing Corporation. An option contract is a commitment that gives the purchaser of the contract the right, but not the obligation, to buy or sell an underlying asset at a specific price on or before a specified future date. On the other hand, the writer of an option contract is obligated, upon the exercise of the option, to buy or sell an underlying asset at a specific price on or before a specified future date. The maximum risk of loss associated with writing put options is limited to the exercised fair value of the option contract. The maximum risk of loss associated with writing call options is potentially unlimited. The Fund also has the additional risk of being unable to enter into a closing transaction at an acceptable price if a liquid secondary market does not exist. The Fund also may write over-the-counter options where completing the obligation depends upon the credit standing of the other party. Option contracts also involve the risk that they may result in loss due to unanticipated developments in market conditions or other causes. Written options are initially recorded as liabilities to the extent of premiums received and subsequently
30
LATEEF FUND
Notes to Financial Statements (Continued)
April 30, 2017
marked to market to reflect the current value of the option written. Gains or losses are realized when the option transaction expires or closes. When an option is exercised, the proceeds on sales for a written call option or the purchase cost for a written put option is adjusted by the amount of the premium received. Listed option contracts present minimal counterparty credit risk since they are exchange traded and the exchange’s clearinghouse, as counterparty to all exchange-traded options, guarantees the options against default. The Fund’s maximum risk of loss from counterparty credit risk related to OTC option contracts is limited to the premium paid.
During the year ended April 30, 2017, the Fund did not enter into written option contracts.
Recent Accounting Pronouncement — In October 2016, the U.S. Securities and Exchange Commission (“SEC”) issued a new rule, Investment Company Reporting Modernization, which, among other provisions, amends Regulation S-X to require standardized, enhanced disclosures, particularly related to derivatives, in investment company financial statements. Compliance with the amendments to Regulation S-X is required for financial statements filed with the SEC on or after August 1, 2017. Management is currently evaluating the impact that the amendments will have on the Fund’s financial statements and related disclosures.
2. Transactions with Related Parties and Other Service Providers
Lateef Investment Management, L.P. (“Lateef” or the “Adviser”) serves as investment adviser to the Fund pursuant to an investment advisory agreement with the Trust. For its services, the Adviser is paid a monthly fee at the annual rate of 1.00% of the Fund’s average daily net assets under $500 million; 0.95% of the Fund’s average daily net assets of $500 million or more but less than $1 billion; and 0.90% of the Fund’s average daily net assets of $1 billion and over. The Adviser has contractually agreed to reduce its investment advisory fee and/or reimburse certain expenses of the Fund to the extent necessary to ensure that the Fund’s total operating expenses (excluding taxes, any class-specific fees and expenses, interest, extraordinary items, “Acquired Fund” fees and expenses and brokerage commissions) do not exceed 0.99% (on an annual basis) of the Fund’s average daily net assets (the “Expense Limitation”). The Expense Limitation shall remain in effect until August 31, 2017, unless the Board of Trustees of FundVantage Trust (the “Trust”) approves its earlier termination. Each class of shares of the Fund pays its respective pro-rata portion of the advisory fee payable by the Fund.
For the year ended April 30, 2017, the Adviser earned advisory fees of $2,827,970 and waived fees of $843,429.
Other Service Providers
BNY Mellon Investment Servicing (US) Inc. (“BNY Mellon”) serves as administrator and transfer
31
LATEEF FUND
Notes to Financial Statements (Continued)
April 30, 2017
agent for the Fund. For providing administrative and accounting services, BNY Mellon is entitled to receive a monthly fee equal to an annual percentage rate of the Fund’s average daily net assets and is subject to certain minimum monthly fees. For providing transfer agent services, BNY Mellon is entitled to receive a monthly fee, subject to certain minimum, and out of pocket expenses.
The Bank of New York Mellon (the “Custodian”) provides certain custodial services to the Fund. The Custodian is entitled to receive a monthly fee, subject to certain minimum, and out of pocket expenses.
Foreside Funds Distributors LLC (the “Underwriter”) provides principal underwriting services to the Fund.
The Trust and the Underwriter are parties to an underwriting agreement. The Trust has adopted a distribution plan for Class A and Class C Shares in accordance with Rule 12b-1 under the 1940 Act. Pursuant to the Class A and Class C Shares plan, the Fund compensates the Underwriter for direct and indirect costs and expenses incurred in connection with advertising, marketing and other distribution services in an amount not to exceed 0.25% and 1.00% (0.75% Rule 12b-1 distribution fee and 0.25% shareholder service fee), respectively, on an annualized basis of the average daily net assets of the Fund’s Class A and Class C Shares.
Trustees and Officers
The Trust is governed by its Board of Trustees. The Trustees receive compensation in the form of an annual retainer and per meeting fees for their services to the Trust. The remuneration paid to the Trustees by the Fund during the year ended April 30, 2017 was $29,736. An employee of BNY Mellon serves as the Secretary of the Trust and is not compensated by the Fund or the Trust.
Effective June 1, 2016 and July 1, 2016, JW Fund Management LLC (“JWFM”) provides a Principal Executive Officer and Principal Financial Officer, respectively, to the Trust. JWFM is compensated for the services provided to the Trust. Until May 31, 2016 and June 30, 2016, certain employees of BNY Mellon served as Principal Executive Officer and Principal Financial Officer, respectively, to the Trust. They were not compensated by the Trust or the Funds.
Freeh Group International Solutions, LLC provides the Trust with a Chief Compliance Officer and an Anti-Money Laundering Officer.
32
LATEEF FUND
Notes to Financial Statements (Continued)
April 30, 2017
3. Investment in Securities
For the year ended April 30, 2017, aggregate purchases and sales of investment securities (excluding short-term investments) of the Fund were as follows:
| Purchases | Sales | |||||||
Investment Securities | $ | 116,255,794 | $ | 489,783,945 | ||||
4. Capital Share Transactions
For the years ended April 30, 2017 and 2016, transactions in capital shares (authorized shares unlimited) were as follows:
| For the Year Ended April 30, 2017 | For the Year Ended April 30, 2016 | |||||||||||||||
| Shares | Amount | Shares | Amount | |||||||||||||
Class A Shares | ||||||||||||||||
Sales | 163,870 | $ | 1,595,686 | 817,259 | $ | 9,656,718 | ||||||||||
Reinvestments | 616,375 | 5,541,211 | 1,081,069 | 11,978,249 | ||||||||||||
Redemption Fees* | — | — | — | 2,311 | ||||||||||||
Redemptions | (3,474,900 | ) | (36,494,751 | ) | (2,794,755 | ) | (31,663,849 | ) | ||||||||
|
|
|
|
|
|
|
| |||||||||
Net decrease | (2,694,655 | ) | $ | (29,357,854 | ) | (896,427 | ) | $ | (10,026,571 | ) | ||||||
|
|
|
|
|
|
|
| |||||||||
Class C Shares | ||||||||||||||||
Sales | 189,672 | $ | 1,562,788 | 446,162 | $ | 5,045,385 | ||||||||||
Reinvestments | 608,909 | 4,840,824 | 698,928 | 7,094,122 | ||||||||||||
Redemption Fees* | — | — | — | 1,302 | ||||||||||||
Redemptions | (2,096,716 | ) | (18,994,600 | ) | (1,077,641 | ) | (11,981,917 | ) | ||||||||
|
|
|
|
|
|
|
| |||||||||
Net increase/(decrease) | (1,298,135 | ) | $ | (12,590,988 | ) | 67,449 | $ | 158,892 | ||||||||
|
|
|
|
|
|
|
| |||||||||
Class I Shares | ||||||||||||||||
Sales | 3,242,776 | $ | 33,848,673 | 14,174,529 | $ | 164,698,914 | ||||||||||
Reinvestments | 1,803,204 | 16,639,601 | 5,100,230 | 57,530,591 | ||||||||||||
Redemption Fees* | — | — | — | 14,281 | ||||||||||||
Redemptions | (30,857,275 | ) | (335,141,714 | ) | (30,483,236 | ) | (392,317,056 | ) | ||||||||
|
|
|
|
|
|
|
| |||||||||
Net decrease | (25,811,295 | ) | $ | (284,653,440 | ) | (11,208,477 | ) | $ | (170,073,270 | ) | ||||||
|
|
|
|
|
|
|
| |||||||||
Total Net decrease | (29,804,085 | ) | $ | (326,602,282 | ) | (12,037,455 | ) | $ | (179,940,949 | ) | ||||||
|
|
|
|
|
|
|
| |||||||||
| * | There is a 2.00% redemption fee that may be charged on shares redeemed which have been held 30 days or less. The redemption fees are retained by the Fund for the benefit of the remaining shareholders and recorded as paid-in capital. |
33
LATEEF FUND
Notes to Financial Statements (Continued)
April 30, 2017
5. Federal Tax Information
The Fund has followed the authoritative guidance on accounting for and disclosure of uncertainty in tax positions, which requires the Fund to determine whether a tax position is more likely than not to be sustained upon examination, including resolution of any related appeals or litigation processes, based on the technical merits of the position. The Fund has determined that there was no effect on the financial statements from following this authoritative guidance. In the normal course of business, the Fund is subject to examination by federal, state and local jurisdictions, where applicable, for tax years for which applicable statutes of limitations have not expired.
Distributions are determined in accordance with federal income tax regulations, which may differ in amount or character from net investment income and realized gains for financial reporting purposes. Accordingly, the character of distributions and composition of net assets for tax purposes may differ from those reflected in the accompanying financial statements. To the extent these differences are permanent, such amounts are reclassified within the components of net assets based on the tax treatment; temporary differences do not require reclassifications. For the year ended April 30, 2017, these adjustments were to increase undistributed net investment income by $1,228,810, decrease accumulated net realized gain by $9,578,966 and increase paid-in capital by $8,350,156, primarily attributable to net operating loss write-off. Net assets were not affected by these adjustments.
For the year ended April 30, 2017, the tax character of distributions paid by the Fund was $41,240,699 of long-term capital gains dividends. For the year ended April 30, 2016, the tax character of distributions paid by the Fund was $2,957,189 of ordinary income dividends and $118,982,658 of long-term capital gains dividends.
As of April 30, 2017, the components of distributable earnings on a tax basis were as follows:
Capital Loss Carryforward | Undistributed Ordinary Income | Undistributed Long-Term Gain | Unrealized Appreciation | Qualified Late-Year Losses | ||||
$— | $— | $21,783,961 | $17,486,248 | $(264,782) |
The differences between the book and tax basis components of distributable earnings relate primarily to the timing and recognition of income and gains for federal income tax purposes. Short term capital gains are reported as ordinary income for federal income tax purposes.
As of April 30, 2017, the federal tax cost, aggregate gross unrealized appreciation and depreciation of securities held by the Fund were as follows:
Federal tax cost | $ | 91,214,459 | ||||
|
| |||||
Gross unrealized appreciation | $ | 19,256,859 | ||||
Gross unrealized depreciation | (1,770,611 | ) | ||||
|
| |||||
Net unrealized appreciation | $ | 17,486,248 | ||||
|
|
34
LATEEF FUND
Notes to Financial Statements (Concluded)
April 30, 2017
Pursuant to federal income tax rules applicable to regulated investment companies, the Fund may elect to treat certain capital losses between November 1 and April 30 and late year ordinary losses ((i) ordinary losses between January 1 and April 30, and (ii) specified ordinary and currency losses between November 1 and April 30) as occurring on the first day of the following tax year. For the year ended April 30, 2017 any amount of losses elected within the tax return will not be recognized for federal income tax purposes until May 1, 2017. For the year ended April 30, 2017, the Fund had late-year ordinary loss deferrals of $264,782.
Accumulated capital losses represent net capital loss carry forwards as of April 30, 2017 that may be available to offset future realized capital gains and thereby reduce future capital gains distributions. As of April 30, 2017, the Fund did not have any capital loss carry forwards.
6. Subsequent Events
Management has evaluated the impact of all subsequent events on the Fund through the date the financial statements were issued and has determined that there was the following subsequent event:
Due to a change in control of the adviser, which resulted in a technical assignment and termination of the current investment advisory agreement, on May 5, 2017, the Fund’s Board of Trustees approved an interim advisory agreement under which the Fund will be managed by Lateef until a new agreement is approved by Fund shareholders. The interim agreement is substantially identical to the terminated agreement (with the exception of different effective and termination dates) and will not result in changes in the management of the Fund, its investment objective, fees or services provided. A new investment advisory agreement, also expected to be substantially identical to the terminated agreement, except for a reduction in the maximum annual investment advisory fee payable to Lateef from 1.00% to 0.85% of the Fund’s average daily net assets, will be submitted for shareholder approval at a future special meeting of shareholders.
35
LATEEF FUND
Report of Independent Registered Public Accounting Firm
To the Board of Trustees of FundVantage Trust and Shareholders of the Lateef Fund:
In our opinion, the accompanying statement of assets and liabilities, including the portfolio of investments, and the related statements of operations and of changes in net assets and the financial highlights present fairly, in all material respects, the financial position of the Lateef Fund (one of the funds constituting FundVantage Trust, hereafter referred to as the “Fund”) as of April 30, 2017, the results of its operations for the year then ended, the changes in its net assets for each of the two years in the period then ended and the financial highlights for each of the five years in the period then ended, in conformity with accounting principles generally accepted in the United States of America. These financial statements and financial highlights (hereafter referred to as “financial statements”) are the responsibility of the Fund’s management. Our responsibility is to express an opinion on these financial statements based on our audits. We conducted our audits of these financial statements in accordance with the standards of the Public Company Accounting Oversight Board (United States). Those standards require that we plan and perform the audit to obtain reasonable assurance about whether the financial statements are free of material misstatement. An audit includes examining, on a test basis, evidence supporting the amounts and disclosures in the financial statements, assessing the accounting principles used and significant estimates made by management, and evaluating the overall financial statement presentation. We believe that our audits, which included confirmation of securities as of April 30, 2017 by correspondence with the custodian, provide a reasonable basis for our opinion.
PricewaterhouseCoopers LLP
Philadelphia, Pennsylvania
June 28, 2017
36
LATEEF FUND
Shareholder Tax Information
(Unaudited)
The Fund is required by Subchapter M of the Internal Revenue Code to advise its shareholders of the U.S. federal tax status of distributions received by the Fund’s shareholders in respect of such fiscal year. During the fiscal year ended April 30, 2017, the Fund paid $50,819,665 of long-term capital gain dividends to its shareholders of which $9,578,966 is from the utilization of equalization debits. Dividends from net investment income and short-term capital gains are treated as ordinary income dividends for federal income tax purposes.
All designations are based on financial information available as of the date of this annual report and, accordingly, are subject to change. For each item, it is the intention of the Fund to designate the maximum amount permitted under the Internal Revenue Code of 1986, as amended, and the regulations thereunder.
Because the Fund’s fiscal year is not the calendar year, another notification will be sent with respect to calendar year 2017. The second notification, which will reflect the amount, if any, to be used by calendar year taxpayers on their U.S. federal income tax returns, will be made in conjunction with Form 1099-DIV and will be mailed in January 2018.
Foreign shareholders will generally be subject to U.S. withholding tax on the amount of their ordinary income dividends. They will generally not be entitled to a foreign tax credit or deduction for the withholding taxes paid by the Fund, if any.
In general, dividends received by tax-exempt recipients (e.g., IRAs and Keoghs) need not be reported as taxable income for U.S. federal income tax purposes. However, some retirement trusts (e.g., corporate, Keogh and 403(b)(7) plans) may need this information for their annual information reporting.
Shareholders are advised to consult their own tax advisers with respect to the tax consequences of their investment in the Fund.
37
LATEEF FUND
Other Information
(Unaudited)
Proxy Voting
Policies and procedures that the Fund uses to determine how to vote proxies relating to portfolio securities as well as information regarding how the Fund voted proxies relating to portfolio securities for the most recent 12-month period ended June 30 are available without charge, upon request, by calling (866) 499-2151 and on the Securities and Exchange Commission’s (“SEC”) website at http://www.sec.gov.
Quarterly Portfolio Schedules
The Trust files its complete schedule of portfolio holdings with the SEC for the first and third fiscal quarters of each fiscal year (quarters ended July 31 and January 31) on Form N-Q. The Trust’s Forms N-Q will be available on the SEC’s website at http://www.sec.gov and may be reviewed and copied at the SEC’s Public Reference Room in Washington, D.C. Information on the operation of the SEC’s Public Reference Room may be obtained by calling 1-800-SEC-0330.
Approval of Advisory Agreement
On May 5, 2017, the Lateef Fund’s (the “Fund”) investment adviser Lateef Investment Management, L.P . (“Lateef” or the “Adviser”) completed a transaction to restructure its management and equity ownership led by certain members of the Adviser’s management team (the “Change of Control”). In connection with the Change of Control, and pursuant to Section 15 of the Investment Company Act of 1940 (the “1940 Act”) , the Fund’s advisory agreement with Lateef (“Prior Agreement”) was terminated on May 5, 2017. Accordingly, at an in person meeting held on March 29-30, 2017 (the “March Meeting”), of the Board of Trustees (“Board” or “Trustees”) of FundVantage Trust (the “Trust”), including a majority of the Trustees who are not “interested persons” as defined in the 1940 Act (the “Independent Trustees”), unanimously approved a new advisory agreement between the Trust and Lateef on behalf of the Fund (the “New Agreement”). In order for Lateef to provide uninterrupted services to the Fund, the Board, including the Independent Trustees, also unanimously approved an interim agreement between the Trust and Lateef on behalf of the Fund (the “Interim Agreement”) at the same Board Meeting.
Before considering the Interim Agreement and New Agreement, the Board, including the Trustees who are not “interested persons” (“Independent Trustees”) within the meaning of Section 2(a)(19) of the 1940 Act, requested information about the Change of Control. In determining whether to approve the Interim Agreement and New Agreement, the Trustees considered information provided by Lateef in conjunction with the March Meeting. At the March Meeting, the Board, including a majority of the Trustees who are not “interested persons” as defined in the Investment Company Act of 1940, as amended (“1940 Act”) (the “Independent Trustees”), unanimously approved the Interim Agreement and New Agreement. In determining whether to approve the Interim Agreement and New Agreement, the Trustees considered
38
LATEEF FUND
Other Information (Continued)
(Unaudited)
information provided by the Adviser in accordance with Section 15(c) of the 1940 Act regarding: (i) services performed for the Fund, (ii) the size and qualifications of their portfolio management staff, (iii) any potential or actual material conflicts of interest which may arise in connection with a portfolio manager’s management of the Fund, (iv) investment performance, (v) the capitalization and financial condition of Lateef, (vi) brokerage selection procedures (including soft dollar arrangements, if any), (vii) the procedures for allocating investment opportunities between the Fund and other clients, (viii) results of any regulatory examination, including any recommendations or deficiencies noted, (ix) any litigation, investigation or administrative proceeding which may have a material impact on Lateef’s ability to service the Fund, (x) compliance with the Fund’s investment objectives, policies and practices (including codes of ethics and proxy voting policies) and (xi) compliance with federal securities laws and other regulatory requirements. The Trustees noted the reports and discussions with portfolio managers as provided at Board meetings throughout the year covering matters such as the relative performance of the Fund; compliance with the investment objectives, policies, strategies and limitations for the Fund; the compliance of management personnel with the applicable code of ethics; and the adherence to the Trust’s pricing procedures as established by the Board.
At the March Meeting, representatives from Lateef joined the meeting in person and discussed the Change of Control, including the background of and reasons for the Change of Control. They also discussed Lateef’s history, performance, and investment strategy in connection with the proposed New Agreement. Representatives of Lateef responded to questions from the Board. The Board members also inquired about the plans for, and the new roles and responsibilities of, certain employees and officers of Lateef as a result of the Change of Control. In connection with the Trustees’ review of the Interim Agreement and New Agreement, the representatives from Lateef emphasized that: (i) it expected that there will be no adverse changes as a result of the Change of Control in the nature, quality, or extent of services currently provided to the Fund and its shareholders, including investment management, distribution, or other shareholder services; (ii) no material adverse effects on Lateef’s financial condition; (iii) no material changes in personnel or operations are contemplated; and (iv) Lateef has no present intention to alter the expense limitations and reimbursements currently in effect for the Fund.
In addition to the information provided by Lateef as described above, the Trustees also considered all other factors they believed to be relevant to evaluating the Interim Agreement and New Agreement, including the specific matters discussed below. In their deliberations, the Trustees did not identify any particular information that was controlling, and different Trustees may have attributed different weights to the various factors. However, the Trustees determined that the overall arrangements between the Fund and Lateef, as provided in the Interim Agreement and New Agreement, including the proposed advisory fees, are fair and reasonable in light of the services to be performed, expenses incurred and such other matters as the Trustees considered relevant. Factors evaluated included: (i) the terms and conditions of the Interim Agreement and New Agreement, including that the Fund’s contractual fee under the Interim Agreement and New Agreement will remain the same; (ii) the Board’s full annual review of the Prior Agreement at the in-person meeting on December 8-9, 2016 (the “December Meeting”) as required by the 1940 Act (see “Annual Continuation of Investment Advisory Agreement” below) and their determination
39
LATEEF FUND
Other Information (Continued)
(Unaudited)
at that time that (a) Lateef had the capabilities, resources, and personnel necessary to provide the satisfactory advisory services currently provided to the Fund and (b) the advisory fees paid by the Fund, taking into account any applicable fee limitations, represent reasonable compensation to Lateef in light of the services provided, the costs to Lateef of providing those services, economies of scale, and the fees and other expenses paid by similar funds and such other matters that the Board considered relevant in the exercise of their reasonable judgment; and (iii) the operations of Lateef are not currently expected to change as a result of the Change of Control. Certain of these considerations are discussed in more detail below.
In making their decision relating to the approval of the Interim Agreement and New Agreement, the Trustees gave attention to the information furnished. The following discussion, however, identifies the primary factors taken into account by the Trustees and the conclusions reached in approving the Interim Agreement and New Agreement.
Nature, Extent, and Quality of Services. The Trustees considered the services historically provided by Lateef to the Fund and its shareholders. In reviewing the nature, extent, and quality of services, the Board considered that the Interim Agreement and New Agreement will be substantially similar to the Prior Agreement, and they therefore considered the many reports furnished to them during the year at regular Board meetings covering matters such as the relative performance of the Fund; compliance with the investment objectives, policies, strategies, and limitations for the Fund; the compliance of management personnel with the applicable code of ethics; and the adherence to fair value pricing procedures as established by the Board.
The Trustees considered Lateef’s personnel and the depth of Lateef’s personnel who possess the experience to provide investment management services to the Fund including that Mr. Quoc Tran will remain as Chief Investment Officer of Lateef and the lead portfolio manager of the Fund and that Mr. Tarkenton will no longer serve as a portfolio manager of the Fund. Based on the information provided by Lateef, including that certain changes are expected as a result of the Change of Control in Lateef’s personnel or operations, the Trustees concluded that (i) the scope and quality of services to be provided to the Fund under the Interim Agreement will be at least equivalent to the scope and quality of services provided under the Prior Agreement, (ii) the nature, extent and quality of the services provided by Lateef are appropriate and consistent with the terms of the Interim Agreement and New Agreement, (ii) that the quality of those services has been consistent with industry norms, (iii) the Fund is likely to benefit from the continued provision of those services, (iv) Lateef has sufficient personnel, with the appropriate education and experience, to serve the Fund effectively and has retained qualified personnel, and (v) the satisfactory nature, extent, and quality of services currently provided to the Fund and its shareholders is likely to continue under the Interim Agreement and New Agreement.
Investment Performance. The Trustees reviewed the historical performance charts for each of the Fund’s share classes, as compared to the Lipper Multi-Cap Growth Fund category, the Fund’s Lipper peer group, for the one year, two year, three year, five year and since inception periods ended December
40
LATEEF FUND
Other Information (Continued)
(Unaudited)
31, 2016. The Trustees noted that the Fund’s Class A Shares underperformed the median of the Lipper Multi-Cap Growth Fund Category for the year-to-date (1.47% vs. 3.05%), one-year (1.47% vs. 3.05%), two-year (1.44% vs. 3.07%), three-year (2.65% vs. 5.67%), five-year (11.03% vs. 13.30%) and since inception (5.89% vs. 6.45%) periods ended December 31, 2016. The Trustees noted that the Fund’s Class C Shares underperformed the median of the Lipper Multi-Cap Growth Fund Category for the year-to-date (0.72% vs. 3.05%), one-year (0.72% vs. 3.05%), two-year (0.69% vs. 3.07%), three-year (1.89% vs. 5.67%), five-year (10.20% vs. 13.30%) and since inception (5.08% vs. 6.45%) periods ended December 31, 2016.
The Trustees also received performance information comparing the Fund’s Class I shares to Lateef’s comparable separately managed account composite (gross of fees), for the one year, three year and five year periods ended October 31, 2016, and the S&P 500 Index for the one year, three year, five year and since inception periods ended October 31, 2016, as applicable. The Trustees further noted that the Fund underperformed the S&P 500 Index for the one year (-2.78% vs. 4.51%), the three year (4.43% vs. 8.84%), the five year (10.17% vs. 13.57%) and the since inception (5.85% vs. 6.32%) periods ended October 31, 2016.
The Trustees further noted that the Fund underperformed the S&P 500 Index for each period, outperformed the comparable separately managed account composite (gross of fees) for the one year period, and underperformed the comparable separately managed account composite (gross of fees) for the three year, and five year periods ended October 31, 2016. The Trustees concluded that the performance of the Fund was within an acceptable range of performance relative to other mutual funds with similar investment objectives, strategies and policies based on the information provided at the March Meeting.
Comparative Expenses. The Trustees noted that the representatives of Lateef had provided information regarding its advisory fees and an analysis of these fees in relation to the delivery of services to the Fund and any other ancillary benefit resulting from Lateef’s relationship with the Fund. The Trustees considered the fees that Lateef charges its similarly managed accounts, and evaluated the explanations provided by Lateef as to differences in fees charged to the Fund and such accounts. The Trustees also reviewed a peer comparison of advisory fees and total expenses for the Fund versus other similar funds managed by other investment advisers. The Trustees noted that the net total expenses of the Fund’s Class A shares were lower than the median of the net total expenses of funds with similar share classes in the Lipper Multi-Cap Growth Fund category, the net total expenses of the Fund’s Class C shares were equal to the median of the net total expenses of funds with similar share classes in the same category and the net total expenses of the Fund’s Class I shares were each higher but substantially in line with the median of the net total expenses of funds with similar share classes in the same category. Further, the net advisory fee for the Fund’s Class A shares, Class C shares and Class I shares, were each higher than the median of the net advisory fee for funds in the Lipper Multi-Cap Growth Fund category. The Trustees concluded that the advisory fee and services provided by Lateef are sufficiently consistent with those of other advisers which manage mutual funds with investment objectives, strategies and policies
41
LATEEF FUND
Other Information (Continued)
(Unaudited)
similar to those of the Fund based on the information provided at the March Meeting. The Trustees considered whether the Change of Control would impact the services currently being provided to the Fund. Based on the information provided at the meeting, the Trustees concluded that there would not be any material impact on the expenses of the Fund and services provided to the Fund as a result of the Change of Control.
Management Profitability. The Trustees then reviewed materials regarding the costs of the services provided by Lateef, the compensation and benefits received by Lateef in providing services to the Fund, the Lateef’s rationale for proposing a reduced investment advisory fee and Lateef’s profitability. The Trustees were provided with Lateef’s audited balance sheet as of December 31, 2016 . The Trustees noted that Lateef’s level of profitability is an appropriate factor to consider, and the Trustees should be satisfied that Lateef’s profits are sufficient to continue as a healthy concern generally and as investment adviser of the Fund specifically. The Trustees concluded that Lateef’s contractual advisory fee level was reasonable in relation to the nature and quality of the services provided, taking into account the current size and projected growth of the Fund. The Trustees also concluded that the overall expense ratio of the Fund is reasonable, taking into account the size of the Fund, the quality of services provided by the adviser, the investment performance of the Fund and the expense limitations agreed to by Lateef.
Economies of Scale. The Trustees considered the extent to which economies of scale would be realized relative to fee levels as the Fund grows, and whether the advisory fee levels reflect these economies of scale for the benefit of shareholders. The Board determined that economies of scale for the benefit of Fund shareholders should be achieved as assets of the Fund increase and expenses are spread over a larger asset base. The Trustees noted that, unlike the Prior Agreement, Lateef’s proposed reduction in the investment advisory fee did not provide for breakpoint reductions in the investment advisory fee rate at specific asset levels but that the maximum investment advisory fee of 0.85% under the New Agreement was lower than the lowest fee charged on higher levels in the breakpoint schedule under the Prior Agreement (0.90%).
Conclusion. After consideration of all the factors, taking into consideration the information presented at the meetings and deliberating in executive session, the entire Board, including the Independent Trustees, unanimously approved the Interim Agreement and New Agreement. The Board concluded that the advisory fee rate under the Interim Agreement and New Agreement is reasonable in relation to the services provided and that execution of such agreement is in the best interests of the shareholders of the Fund. The Trustees also concluded that the advisory fees and total expense ratios are at acceptable levels in light of the quality of services provided to the Fund and in comparison to those of the Fund’s respective peer groups; that the investment advisory fee payable to the Lateef would be reduced; that the total expense ratio would not changed materially; and that Lateef had represented that the overall expenses for the Fund are not expected to be adversely affected by the Change of Control. The Trustees also noted that Lateef had no present intention to alter any expense limitation or reimbursement currently in effect for the Fund. On that basis, the Trustees concluded that the total expense ratio and proposed advisory fee for the Fund is acceptable. In arriving at their decision, the Trustees did not identify any single matter as controlling, but made their determination in light of all the circumstances.
42
LATEEF FUND
Other Information (Continued)
(Unaudited)
Annual Continuation of Investment Advisory Agreement
At the in-person December Meeting , the Board, including a majority of the Independent Trustees, unanimously approved the continuation of the advisory agreement (the “Agreement”) between Lateef and the Trust on behalf of the Lateef Fund. In determining whether to continue the Agreement, the Trustees considered information regarding (i) services performed for the Lateef Fund, (ii) the size and qualifications of their portfolio management staff, (iii) any potential or actual material conflicts of interest which may arise in connection with a portfolio manager’s management of the Fund, (iv) investment performance, (v) the capitalization and financial condition of Lateef, (vi) brokerage selection procedures (including soft dollar arrangements, if any), (vii) the procedures for allocating investment opportunities between the Lateef Fund and other clients, (viii) results of any regulatory examination, including any recommendations or deficiencies noted, (ix) any litigation, investigation or administrative proceeding which may have a material impact on Lateef’s ability to service the Lateef Fund, and (x) compliance with the Lateef Fund’s investment objectives, policies and practices (including codes of ethics and proxy voting policies) and (xi) compliance with federal securities laws and other regulatory requirements. The Trustees noted the reports and discussions with portfolio managers as provided at Board meetings throughout the year covering matters such as the relative performance of the Lateef Fund; compliance with the investment objectives, policies, strategies and limitations for the Lateef Fund; the compliance of management personnel with the applicable code of ethics; and the adherence to the Trust’s pricing procedures as established by the Board.
The Trustees considered the investment performance of the Lateef Fund and Lateef. The Trustees reviewed the historical performance charts for each of the Lateef Fund’s share classes, as compared to the Lipper Multi-Cap Growth Fund category, the Fund’s applicable Lipper peer group, for the calendar year-to-date, one year, two year, three year, five year and since inception periods ended September 30, 2016. The Trustees noted that each of the Lateef Fund’s share classes underperformed the Lipper Multi-Cap Growth Index for the calendar year-to-date, one year, two year, three year, five year and since inception periods ended September 30, 2016. The Trustees also received performance information for the Lateef Fund’s Class I shares, the Fund’s comparable separately managed account composite (gross of fees), and the S&P 500 Index, for the one year, three year and five year and since inception periods ended October 31, 2016, as applicable. The Trustees further noted that the Lateef Fund underperformed the S&P 500 Index, for the one year, three year, five year and since inception periods, outperformed the comparable separately managed account composite (gross of fees) for the one year period and underperformed the comparable separately managed account composite (gross of fees) for the three year, five year and since inception periods ended October 31, 2016.
43
LATEEF FUND
Other Information (Continued)
(Unaudited)
The Trustees also considered Lateef’s commentary regarding the performance data and the various factors contributing to the Fund’s shorter- and longer-term performance, as applicable. The Trustees took note of the various periods where the Fund underperformed its Lipper peer group, the S&P 500 Index and the Fund’s comparable separately managed account composite (gross of fees). The Trustees noted that while absolute performance was positive for a certain period ended October 31, 2016, the Fund’s relative performance lagged the median of its Lipper peer group for all periods. The Trustees considered explanations provided by Lateef regarding the various factors contributing to the relative underperformance of the Fund during the applicable periods, including, among other things, differences in the Fund’s investment strategies and portfolio construction in comparison to the peer funds included in its applicable Lipper peer group. The Board discussed with Lateef the reasons behind such results for the Fund. The Trustees considered other factors that supported the continuation of the Lateef Agreement, including that Lateef’s investment decisions, such as security selection and sector allocation, contributing to such underperformance were consistent with the Fund’s investment objective and policies. Taking note of Lateef’s discussion of (i) the various factors contributing to the Fund’s performance and (ii) its continuing commitment to the Fund’s current investment strategy, the Trustees concluded that, although the Fund had underperformed the S&P 500 Index and the median of the Lipper Multi-Cap Growth Fund Index category for certain measurement periods as noted above, the Trustees concluded that the performance of the Lateef Fund was within an acceptable range of performance relative to other mutual funds with similar investment objectives, strategies and policies based on the information provided at the December Meeting.
The Trustees noted that the representatives of Lateef had provided information regarding its advisory fees and an analysis of these fees in relation to the delivery of services to the Lateef Fund and any other ancillary benefit resulting from Lateef’s relationship with the Fund. The Trustees considered the fees that Lateef charges its similarly managed accounts, and evaluated the explanations provided by Lateef as to differences in fees charged to the Lateef Fund and such accounts. The Trustees also reviewed a peer comparison of advisory fees and total expenses for the Lateef Fund versus other similar funds managed by other investment advisers. The Trustees noted that the net total expenses of the Lateef Fund’s Class A shares were lower than the median of the net total expenses of funds with similar share classes in the Lipper Multi-Cap Growth Fund category, the net total expenses of the Fund’s Class C shares were equal to the median of the net total expenses of funds with similar share classes in the same category and the net total expenses of the Fund’s Class I shares were each higher but substantially in line with the median of the net total expenses of funds with similar share classes in the same category. Further, the net advisory fee for the Lateef Fund’s Class A shares, Class C shares and Class I shares, were each higher than the median of the net advisory fee for funds in the Lipper Multi-Cap Growth Fund category. The Trustees concluded that the advisory fee and services provided by Lateef are sufficiently consistent with those of other advisers which manage mutual funds with investment objectives, strategies and policies similar to those of the Lateef Fund based on the information provided at the December Meeting.
44
LATEEF FUND
Other Information (Continued)
(Unaudited)
The Board then considered the level and depth of knowledge of Lateef, including the professional experience and qualifications of senior personnel. In evaluating the quality of services to be provided by Lateef, the Board took into account its familiarity with Lateef’s senior management through Board meetings, discussions and reports during the preceding year. The Board also took into account Lateef’s compliance policies and procedures and reports regarding Lateef’s compliance operations from the Trust’s CCO. The Board also considered any potential conflicts of interest that may arise in a portfolio manager’s management of the Lateef Fund’s investments on the one hand, and the investments of other accounts, on the other. The Trustees reviewed the services provided to the Lateef Fund by Lateef and concluded that the nature, extent and quality of the services provided were appropriate and consistent with the terms of the Lateef Agreement, that the quality of the proposed services appeared to be consistent with industry norms and that the Lateef Fund is likely to benefit from the continued provision of those services. They also concluded that Lateef has sufficient personnel, with the appropriate education and experience, to serve the Lateef Fund effectively and had demonstrated their ability to attract and retain qualified personnel.
The Trustees then reviewed materials regarding the costs of the services provided by Lateef, the compensation and benefits received by Lateef in providing services to the Lateef Fund, as well as Lateef’s profitability. The Trustees were provided with Lateef’s audited balance sheet as of December 31, 2015. The Trustees noted that Lateef’s level of profitability is an appropriate factor to consider, and the Trustees should be satisfied that Lateef’s profits are sufficient to continue as a healthy concern generally and as investment adviser of the Lateef Fund specifically. The Trustees concluded that Lateef’s contractual advisory fee level was reasonable in relation to the nature and quality of the services provided, taking into account the current size and projected growth of the Lateef Fund.
The Trustees considered the extent to which economies of scale would be realized relative to fee levels as the Lateef Fund grows, and whether the advisory fee levels reflect these economies of scale for the benefit of shareholders. The Board determined that economies of scale for the benefit of Lateef Fund shareholders should be achieved as assets of the Lateef Fund increase as a result of breakpoint reductions in the advisory fee rate at specific asset levels which are reflected in the fee schedule of the Lateef Agreement. In addition, the Trustees also considered Lateef’s efforts to grow the Lateef Fund’s assets as economies of scale may be achieved due to the ability of the Fund to spread its fixed costs across a larger asset base.
The Trustees determined to approve the continuation of the Lateef Agreement for an additional one year period. In approving the continuation of the Lateef Agreement, the Board considered all factors it deemed relevant and the information presented to the Board by Lateef. In arriving at its decision, the Board did not identify any single factor as being of paramount importance and each member of the Board gave varying weights to each factor according to his or her own judgment. The Board determined that the continuation of the Lateef Agreement would be in the best interests of the Lateef Fund and their shareholders.
45
LATEEF FUND
Privacy Notice
(Unaudited)
The privacy of your personal financial information is extremely important to us. When you open an account with us, we collect a significant amount of information from you in order to properly invest and administer your account. We take very seriously the obligation to keep that information private and confidential, and we want you to know how we protect that important information.
We collect nonpublic personal information about you from applications or other forms you complete and from your transactions with us or our affiliates. We do not disclose information about you, or our former clients, to our affiliates or to service providers or other third parties, except as permitted by law. We share only the information required to properly administer your accounts, which enables us to send transaction confirmations, monthly or quarterly statements, financials and tax forms. Even within FundVantage Trust and its affiliated entities, a limited number of people who actually service accounts will have access to your personal financial information. Further, we do not share information about our current or former clients with any outside marketing groups or sales entities.
To ensure the highest degree of security and confidentiality, FundVantage Trust and its affiliates maintain various physical, electronic and procedural safeguards to protect your personal information. We also apply special measures for authentication of information you request or submit to us on our web site.
If you have questions or comments about our privacy practices, please call us at (866) 499-2151.
46
LATEEF FUND
Fund Management
(Unaudited)
FundVantage Trust (the “Trust”) is governed by a Board of Trustees (the “Trustees”). The primary responsibility of the Trustees is to represent the interest of the Trust’s shareholders and to provide oversight management of the Trust.
The following tables present certain information regarding the Board of Trustees and officers of the Trust. None of the Trustees are an “interested person” of the Trust, the Adviser, another investment adviser of a series of the Trust, or Foreside Funds Distributors LLC, the principal underwriter of the Trust (“Underwriter”), within the meaning of the 1940 Act and each Trustee is referred to as an “Independent Trustee” and is listed under such heading below. The address of each Trustee and officer as it relates to the Trust’s business is 301 Bellevue Parkway, 2nd Floor, Wilmington, DE 19809.
The Statement of Additional Information for the Fund contains additional information about the Trustees and is available, without charge, upon request, by calling (866) 499-2151.
Name and Date of Birth
| Position(s) Held with Trust
| Term of Office
| Principal Occupation(s) During Past Five Years
|
Number of
| Other Directorships Held by Trustee
| |||||||||||||||
INDEPENDENT TRUSTEES
| ||||||||||||||||||||
ROBERT J. CHRISTIAN Date of Birth: 2/49 |
Trustee and Chairman of the Board |
Shall serve until death, resignation or removal. Trustee and Chairman since 2007. |
Retired since February 2006; Executive Vice President of Wilmington Trust Company from February 1996 to February 2006; President of Rodney Square Management Corporation (“RSMC”) (investment advisory firm) from 1996 to 2005; Vice President of RSMC from 2005 to 2006.
|
42 |
Optimum Fund Trust (registered investment company with 6 portfolios). | |||||||||||||||
IQBAL MANSUR Date of Birth: 6/55 |
Trustee |
Shall serve until death, resignation or removal. Trustee since 2007. |
University Professor, Widener University. |
42 |
None. | |||||||||||||||
47
LATEEF FUND
Fund Management (Continued)
(Unaudited)
Name and Date of Birth
| Position(s) Held with Trust
| Term of Office
| Principal Occupation(s) During Past Five Years
|
Number of
| Other Directorships Held by Trustee
| |||||||||||||||
NICHOLAS M. MARSINI, JR. Date of Birth: 8/55 |
Trustee |
Shall serve until death, resignation or removal. Trustee since 2016. |
Retired since March 2016. President of PNC Bank Delaware from June 2011 to March 2016; Executive Vice President Finance of BNY Mellon from July 2010 to January 2011; Executive Vice President and Chief Financial Officer of PNC Global Investment Servicing from September 1997 to July 2010. |
42 |
Brinker Capital Destinations Trust (registered investment company with 10 portfolios). | |||||||||||||||
STEPHEN M. WYNNE Date of Birth: 1/55 |
Trustee |
Shall serve until death, resignation or removal. Trustee since 2009. |
Retired since December 2010; Chief Executive Officer of US Funds Services, BNY Mellon Asset Servicing from July 2010 to December 2010; Chief Executive Officer of PNC Global Investment Servicing from March 2008 to July 2010; President, PNC Global Investment Servicing from 2003 to 2008. |
42 |
Copeland Trust (registered investment company with 2 portfolios). Context Capital Funds (registered investment company with 1 portfolio). | |||||||||||||||
NANCY B. WOLCOTT Date of Birth: 11/54 |
Trustee |
Shall serve until death, resignation or removal. Trustee since 2011. |
Retired since May 2014; EVP, Head of GFI Client Service Delivery, BNY Mellon from January 2012 to May 2014; EVP, Head of US Funds Services, BNY Mellon from July 2010 to January 2012; President of PNC Global Investment Servicing from 2008 to July 2010; Chief Operating Officer of PNC Global Investment Servicing from 2007 to 2008; Executive Vice President of PFPC Worldwide Inc. from 2006 to 2007. |
42 |
None. |
48
LATEEF FUND
Fund Management (Concluded)
(Unaudited)
Name and Date of Birth
| Position(s) Held with Trust
|
Term of Office and Length of Time Served
| Principal Occupation(s) During Past Five Years
| |||||||
EXECUTIVE OFFICERS
| ||||||||||
JOEL L. WEISS Date of Birth: 1/63 |
President and Chief Executive Officer |
Shall serve until death, resignation or removal. Officer since 2007. |
President of JW Fund Management LLC since June 2016; Vice President and Managing Director of BNY Mellon Investment Servicing (US) Inc. and predecessor firms from 1993 to June 2016. | |||||||
T. RICHARD KEYES Date of Birth: 1/57 |
Treasurer and Chief Financial Officer |
Shall serve until death, resignation or removal. Officer since 2016. |
President of TRK Fund Consulting since July 2016; Head of Tax-U.S. Fund Services of BNY Mellon Investment Servicing (US) Inc. and predecessor firms from February 2006 to July 2016. | |||||||
VINCENZO A. SCARDUZIO Date of Birth: 4/72 |
Secretary |
Shall serve until death, resignation or removal. Officer since 2012. |
Director and Vice President Regulatory Administration of BNY Mellon Investment Servicing (US) Inc. and predecessor firms since 2001. | |||||||
DAVID C. LEBISKY Date of Birth: 5/72 |
Chief Compliance Officer and Anti-Money Laundering Officer |
Shall serve until death, resignation or removal. Officer since 2015. |
President of Lebisky Compliance Consulting LLC since October 2015; Senior Consultant, Freeh Group International Solutions, LLC (a global risk management firm) since 2015; Scotia Institutional Investments US, LP, Director of Regulatory Administration from 2010 to 2014. | |||||||
49
[THIS PAGE INTENTIONALLY LEFT BLANK.]
[THIS PAGE INTENTIONALLY LEFT BLANK.]
Investment Adviser
Lateef Investment Management, L.P.
300 Drakes Landing Road
Suite 210
Greenbrae, CA 94904
Administrator
BNY Mellon Investment Servicing (US) Inc.
301 Bellevue Parkway
Wilmington, DE 19809
Transfer Agent
BNY Mellon Investment Servicing (US) Inc.
4400 Computer Drive
Westborough, MA 01581
Principal Underwriter
Foreside Funds Distributors LLC
400 Berwyn Park
899 Cassatt Road
Berwyn, PA 19312
Custodian
The Bank of New York Mellon
225 Liberty Street
New York, NY 10286
Independent Registered Public Accounting Firm
PricewaterhouseCoopers LLP
Two Commerce Square, Suite 1800
2001 Market Street
Philadelphia, PA 19103-7042
Legal Counsel
Pepper Hamilton LLP
3000 Two Logan Square
18th and Arch Streets
Philadelphia, PA 19103

LATEEF FUND
of
FundVantage Trust
Class A Shares
Class C Shares
Class I Shares
ANNUAL REPORT
April 30, 2017
This report is submitted for the general information of the shareholders of the Lateef Fund. It is not authorized for distribution unless preceded or accompanied by a current prospectus for the Lateef Fund.

MOUNT LUCAS U.S. FOCUSED EQUITY FUND
of
FundVantage Trust
Class I
ANNUAL REPORT
April 30, 2017
This report is submitted for the general information of the shareholders of the Mount Lucas U.S. Focused Equity Fund. It is not authorized for distribution unless preceded or accompanied by a current prospectus for the Mount Lucas U.S. Focused Equity Fund.
MOUNT LUCAS U.S. FOCUSED EQUITY FUND
Annual Investment Adviser’s Report
April 30, 2017
(Unaudited)
Dear Shareholder,
I am pleased to provide you with this annual report for the Mount Lucas U.S. Focused Equity Fund (“Fund”). In this report, you will find important information about the Fund, as well as a discussion of investment performance for the 12-month period ended April 30, 2017.
In the 12-month period ended April 30, 2017, the Fund returned +15.83% compared to +17.92% for the S&P 500® and +16.51% for the Russell 1000® Value Index. By factor, our Value portfolio performed quite well, up 18.97% over the period, while our Momentum portfolio also generated positive returns, up 8.16% over the period.
During this 12-month period, the Fund invested in a total of 62 U.S. equities with 43 holdings generating a positive return over the period. The biggest contributors to the Fund’s return were Best Buy Co (BBY), Unum Group (UNM) and Prudential (PRU). These stocks added 3.00%, 2.92% and 1.96% to the Fund’s overall return during this holding period. Best Buy is a classic example of the profile of value stocks the Fund aims to invest in. While much has been written about the death of brick and mortar retailers, Best Buy has demonstrated that investors shouldn’t paint all brick and mortar retailers with the same brush. In their fiscal FY2017, Best Buy generated the highest earnings per share in the history of the company and in the 12-month period ended April 30, 2017, Best Buy’s stock returned +66.40% compared to +40.24% for the online shopping giant Amazon.com. As Howard Marks, Co-Chairman and Co-Founder of Oaktree Capital Group LLC, has said previously, “investing well is not a matter of buying good things, it’s about buying things well.”
On the negative side, the Fund’s performance over this 12-month period was dragged down by the investment in GameStop (GME), which reduced the Fund’s returns by 1.27%. While GameStop’s financials have been relatively solid over the past couple of years, investors have clearly questioned the ability of the company to generate organic growth going forward. Furthermore, on April 19, 2016, the S&P Dow Jones Indices announced that GameStop was being removed from the S&P 500 index effective April 22, 2016. While this isn’t the first time one of the Fund’s holdings was removed from the S&P 500 while the Fund was invested in it, this sort of event is extremely rare for the Fund. The Fund’s investment criteria is to remain invested in the stock until the next roll date.
As of April 30, 2017, the Fund is invested in 36 U.S. equities. The Fund’s largest sector allocations are in the Financial sector (31.5% portfolio allocation), the Consumer Discretionary sector (21.0% portfolio allocation), the Information Technology sector (16.1% portfolio allocation) and the Energy sector (11.6% portfolio allocation). Stocks in these four sectors represent 80.2% of the Fund’s holdings. By industry, the Fund’s largest allocations are in the accident and health insurers, petroleum refiners, electronic component suppliers and consumer electronics retailers. Stocks in these industries represent over 50% of the Fund’s holdings. On an individual stock basis, Best Buy (BBY), Corning (GLW), Principal Financial Group (PFG), Unum Group (UNM), and Carnival Corp (CCL) are the five largest holdings in the Fund.
The past few years have been challenging for the Fund – it’s never fun to underperform, especially during what appears to be a structural shift in the equity markets as assets move from active investing to passive indexing. However, upon review, over the last 5 years, a period where the Fund underperformed the S&P 500 by 1.62% annualized, the relative underperformance stems from just one year during these past 5 years. In the 12-month period ended April 30, 2016, the Fund underperformed the S&P 500 by 11.30%. This 12-month period ended April 30, 2016 was the worst period of underperformance by the Fund for any 12-month period ending April 30. Prior to this period the average 12-month excess return had been +1.15%. If the Fund had earned a more market like return during this period, the review of the past 5 years would yield very different conversations.
While this is simply telling us what has happened, the key question is the outlook for the next 5 years and beyond. Looking at the S&P 500, equities in general appear fairly valued to overvalued, depending on one’s view of the likelihood of corporate tax reform. Exacerbating the valuation differential between the equity markets and value focused portfolio has been the continued shift of investors towards passive market cap weighted index funds. These passive market cap weighted indices tend to be more momentum biased, as stocks that have gained the most from one period to the next end up with larger weights in the index. Furthermore, the average risk premia earned by a Value investor versus the S&P 500 compared to the average risk premia earned by a Growth investor versus the S&P 500 has flipped in the period before and after the financial crisis. From 1979 to 2008, the average risk premia earned by a Value investor
The performance data quoted represents past performance and is no guarantee of future results. Investment return and principal value will fluctuate so when redeemed may be worth more or less than its original cost. Current performance may be lower or higher than quoted here. The investment return and principal value of an investment in the Fund will fluctuate so that an investor’s shares, when redeemed, may be worth more or less then their original cost. For performance current to the most recent month-end, please call 1-844-261-6483.
1
MOUNT LUCAS U.S. FOCUSED EQUITY FUND
Annual Investment Adviser’s Report (Concluded)
April 30, 2017
(Unaudited)
was 0.8% annualized and the average risk premia earned by a Growth investor was -1.3% annualized. Since 2009, Growth investors have earned 1.9% more per year than the S&P 500 while Value investors have lost 1.4% more per year than the S&P 500. In environments like this, the ex-ante expected return for a value investor looks more promising than for passive market cap weighted indices.
Thank you for your investment in the Fund. We value your ongoing confidence in us, and we look forward to serving your investment needs in the future.
Sincerely,
Timothy Rudderow
CEO and CIO
Mount Lucas Management LP
This letter is intended to assist shareholders in understanding how the Fund performed during the year ended April 30, 2017 and reflects the views of the investment adviser at the time of this writing. Of course, these views may change and do not guarantee the future performance of the Fund or the markets.
Before the Fund commenced operations, all of the assets and liabilities of the Predecessor Fund were transferred to the Fund in a tax-free reorganization (the “Reorganization”). The Reorganization occurred prior to the opening of business on March 24, 2014. As a result of the Reorganization, the Fund assumed the performance and accounting history of the Predecessor Fund prior to the date of the Reorganization.
The S&P 500® Index is a capitalization-weighted index designed to measure the performance of the broad U.S. economy through changes in the aggregate market value of 500 stocks representing all major industries. The index assumes the reinvestment of all dividends. Any Indexes mentioned are unmanaged statistical composites of stock market performance. Investing in an index is not possible.
Portfolio composition is subject to change. The current and future portfolio holdings of the Fund are subject to investment risk.
2
MOUNT LUCAS U.S. FOCUSED EQUITY FUND
Annual Report
Performance Data
April 30, 2017
(Unaudited)
Comparison of Change in Account Value of $10,000 Investment in the Mount Lucas U.S. Focused Equity Fund Class I vs. S&P 500® Index
Average Annual Total Returns for the Periods Ended April 30, 2017
| ||||||||||
| 1 Year | 3 Years | 5 Years | Since Inception | |||||||
Class I* | 15.83% | 4.25% | 12.06% | 5.48% | ||||||
S&P 500® Index
| 17.92%
| 10.47%
| 13.68%
| 7.06%**
| ||||||
| * | Mount Lucas U.S. Focused Equity Fund - Class I (the “Fund”) commenced operations on October 1, 2007. |
| ** | Benchmark performance is from inception date of the Fund only and is not the inception date of the benchmark itself. |
The performance data quoted represents past performance and does not guarantee future results. The investment return and principal value of an investment in the Fund will fluctuate so that an investor’s shares, when redeemed, may be worth more or less than their original cost. The graph and table do not reflect the deduction of taxes that a shareholder would pay on Fund distributions or redemption of Fund shares. Current performance may be lower or higher than the performance quoted. Performance data current to the most recent month-end may be obtained by calling (844) 261-6483.
As stated in the current prospectus dated September 1, 2016, the Fund’s “Total Annual Fund Operating Expenses” and “Total Annual Fund Operating Expenses After Fee Waiver and/or Expense Reimbursement” are 1.31% and 0.95%, respectively, for Class I shares of the Fund’s average daily net assets. Mount Lucas Management LP (the “Adviser”) has contractually agreed to waive fees and/or reimburse expenses in order to limit the Fund’s “Total Annual Fund Operating Expenses” (excluding taxes, “Acquired Fund” fees and expenses, extraordinary items, brokerage commissions and interest) to, as a percentage of average daily net assets, 0.95% with respect to Class I shares (the “Expense Limitation”). The Expense Limitation will remain in place until August 31, 2018, unless the Board of Trustees approves its earlier termination. The Adviser may recoup any expenses or fees it has reimbursed within a three-year period from the year in which the Adviser reduced its compensation and/or assumed expenses of the Fund. The Adviser is permitted to seek reimbursement from the Fund, subject to certain limitations, for fees it waived and Fund expenses it paid to the extent the total annual fund operating expenses do not exceed the limits described above or any lesser limits in effect as the time of reimbursement. No recoupment will occur unless the Fund’s expenses are below the Expense Limitation amount. Total returns would be lower had such fees and/or expenses not been waived and/or reimbursed.
The Fund operated as a series of Scotia Institutional Funds prior to the opening of business on March 24, 2014 (the “Predecessor Fund”), at which time, the Predecessor Fund was reorganized into the Fund. Before the Fund commenced operations, all of the assets and liabilities of the Predecessor Fund were transferred to the Fund in a tax free reorganization (the “Reorganization”). The Reorganization occurred at the opening of business on March 24, 2014. As a result of the Reorganization, the Fund assumed the performance and accounting history of the Predecessor Fund prior to the date of the Reorganization. The Fund has the same investment objective and strategies as the Predecessor Fund. The Performance shown for periods prior to March 24, 2014 represents the performance for the Predecessor Fund.
3
MOUNT LUCAS U.S. FOCUSED EQUITY FUND
Annual Report
Performance Data (Continued)
April 30, 2017
(Unaudited)
The value of the Fund’s investments in equity securities may fluctuate drastically from day-to-day causing volatility and possible loss of principal. The Fund may invest in undervalued securities and is subject to the risk that the securities may not appreciate in value as anticipated.
The Fund is non-diversified and invests in a limited number of securities. As a result, the Fund’s investment performance may be more volatile, as it may be more susceptible to risks associated with a single economic, political, or regulatory event than a fund that invests in a greater number of issuers. The Fund may invest in undervalued securities and is subject to the risk that the securities may not appreciate in value as anticipated.
The Fund intends to evaluate performance as compared to that of the Standard & Poor’s 500® Composite Price Index (“S&P 500®”). The S&P 500® is a widely recognized, unmanaged index of 500 common stocks which are generally representative of the U.S. stock market as a whole. It is impossible to invest directly in an index.
4
MOUNT LUCAS U.S. FOCUSED EQUITY FUND
Fund Expense Disclosure
April 30, 2017
(Unaudited)
As a shareholder of the Fund, you incur two types of costs: (1) transaction costs including sales charges (loads) on purchase payments, if any, or redemption fees; and (2) ongoing costs, including management fees, distribution and/or service (Rule 12b-1) fees, if any, and other Fund expenses. These examples are intended to help you understand your ongoing costs (in dollars) of investing in the Fund and to compare these costs with the ongoing costs of investing in other mutual funds.
This example is based on an investment of $1,000 invested at the beginning of the six-month period from November 1, 2016 through April 30, 2017 and held for the entire period.
Actual Expenses
The first line of the accompanying table provides information about actual account values and actual expenses. You may use the information in this line, together with the amount you invested, to estimate the expenses that you paid over the period. Simply divide your account value by $1,000 (for example, an $8,600 account value divided by $1,000 = 8.6), then multiply the result by the number in the first line under the heading entitled “Expenses Paid During Period” to estimate the expenses you paid on your account during this period.
Hypothetical Examples for Comparison Purposes
The second line of the accompanying table provides information about hypothetical account values and hypothetical expenses based on the Fund’s actual expense ratio and an assumed rate of return of 5% per year before expenses, which is not your Fund’s actual return. The hypothetical account values and expenses may not be used to estimate the actual ending account balance or expenses you paid for the period. You may use this information to compare the ongoing costs of investing in the Fund and other funds. To do so, compare these 5% hypothetical examples with the 5% hypothetical examples that appear in the shareholder reports of other funds.
Please note that the expenses shown in the accompanying table are meant to highlight your ongoing costs only and do not reflect any transactional costs, such as sales charges on purchase payments, if any, or redemption fees. Therefore, the second line of the accompanying table is useful in comparing ongoing costs only, and will not help you determine the relative total costs of owning different funds. In addition, if these transactional costs were included, your costs would have been higher.
| Mount Lucas U.S. Focused Equity Fund | |||||||||||||||
| Beginning Account Value November 1, 2016 | Ending Account Value April 30, 2017 | Expenses Paid During Period* | |||||||||||||
Class I | |||||||||||||||
Actual | $1,000.00 | $1,173.20 | $5.12 | ||||||||||||
Hypothetical (5% return before expenses) | 1,000.00 | 1,020.08 | 4.76 | ||||||||||||
| * | Expenses are equal to the annualized expense ratio for the six-month period ended April 30, 2017 of 0.95% for Class I shares, multiplied by the average account value over the period, multiplied by the number of days in the most recent period (181), then divided by 365 to reflect the period. The Fund’s ending account value on the first line in the table is based on the actual six-month total return for the Fund of 17.32% for Class I shares. |
5
MOUNT LUCAS U.S. FOCUSED EQUITY FUND
Portfolio Holdings Summary Table
April 30, 2017
(Unaudited)
The following table presents a summary by sector of the portfolio holdings of the Fund:
| % of Net Assets | Value | |||||||
COMMON STOCKS: | ||||||||
Financials | 31.5 | % | $ | 5,008,841 | ||||
Consumer Discretionary | 21.0 | 3,343,583 | ||||||
Information Technology | 16.1 | 2,552,244 | ||||||
Energy | 11.6 | 1,841,390 | ||||||
Industrials | 9.0 | 1,422,447 | ||||||
Consumer Staples | 5.4 | 856,210 | ||||||
Telecommunication Services | 3.4 | 547,233 | ||||||
Health Care. | 1.9 | 304,344 | ||||||
Other Assets in Excess of Liabilities | 0.1 | 14,597 | ||||||
|
|
|
| |||||
NET ASSETS | 100.0 | % | $ | 15,890,889 | ||||
|
|
|
| |||||
Portfolio holdings are subject to change at any time.
The accompanying notes are an integral part of the financial statements.
6
MOUNT LUCAS U.S. FOCUSED EQUITY FUND
Portfolio of Investments
April 30, 2017
| Number of Shares | Value | |||||||
COMMON STOCKS — 99.9% | ||||||||
Consumer Discretionary —21.0% | ||||||||
Best Buy Co., Inc. | 29,231 | $ | 1,514,458 | |||||
Carnival Corp. (Panama) | 11,219 | 692,998 | ||||||
General Motors Co. | 18,083 | 626,395 | ||||||
Kohl’s Corp. | 13,060 | 509,732 | ||||||
|
| |||||||
| 3,343,583 | ||||||||
|
| |||||||
Consumer Staples — 5.4% | ||||||||
Procter & Gamble Co. (The) | 1,557 | 135,973 | ||||||
Sysco Corp. | 2,766 | 146,238 | ||||||
Wal-Mart Stores, Inc. | 7,635 | 573,999 | ||||||
|
| |||||||
| 856,210 | ||||||||
|
| |||||||
Energy — 11.6% | ||||||||
Marathon Petroleum Corp. | 12,486 | 636,037 | ||||||
Tesoro Corp | 7,530 | 600,216 | ||||||
Valero Energy Corp. | 9,366 | 605,137 | ||||||
|
| |||||||
| 1,841,390 | ||||||||
|
| |||||||
Financials — 31.5% | ||||||||
Aflac, Inc | 8,239 | 616,936 | ||||||
Arthur J Gallagher & Co. | 2,757 | 153,868 | ||||||
Assurant, Inc. | 5,849 | 562,908 | ||||||
Fifth Third Bancorp | 27,263 | 666,035 | ||||||
Marsh & McLennan Cos, Inc. | 2,063 | 152,930 | ||||||
Principal Financial Group, Inc. | 19,997 | 1,302,405 | ||||||
Torchmark Corp. | 2,006 | 153,880 | ||||||
Unum Group | 27,031 | 1,252,346 | ||||||
US Bancorp | 2,877 | 147,533 | ||||||
|
| |||||||
| 5,008,841 | ||||||||
|
| |||||||
Health Care — 1.9% | ||||||||
Becton Dickinson and Co. | 771 | 144,154 | ||||||
UnitedHealth Group, Inc. | 916 | 160,190 | ||||||
|
| |||||||
| 304,344 | ||||||||
|
| |||||||
| Number of Shares | Value | |||||||
| COMMON STOCKS — (Continued) | ||||||||
| Industrials — 9.0% | ||||||||
| 3M Co. | 776 | $ | 151,964 | |||||
| Boeing Co. (The) | 879 | 162,466 | ||||||
| General Dynamics Corp. | 825 | 159,877 | ||||||
| Illinois Tool Works, Inc. | 2,339 | 322,993 | ||||||
| Northrop Grumman Corp. | 639 | 157,168 | ||||||
| Raytheon Co. | 996 | 154,589 | ||||||
| Republic Services, Inc. | 2,483 | 156,404 | ||||||
| Waste Management, Inc. | 2,157 | 156,986 | ||||||
|
| |||||||
| 1,422,447 | ||||||||
|
| |||||||
Information Technology — 16.1% | ||||||||
| Amphenol Corp., Class A | 2,193 | 158,576 | ||||||
| Corning, Inc | 48,157 | 1,389,329 | ||||||
| DXC Technology Co.* | 2,443 | 184,056 | ||||||
| Hewlett Packard Enterprise Co. | 28,371 | 528,552 | ||||||
| Paychex, Inc. | 2,338 | 138,597 | ||||||
| Texas Instruments, Inc. | 1,934 | 153,134 | ||||||
|
| |||||||
| 2,552,244 | ||||||||
|
| |||||||
Telecommunication Services — 3.4% |
| |||||||
| CenturyLink, Inc. | 21,318 | 547,233 | ||||||
|
| |||||||
TOTAL COMMON STOCKS (Cost $14,607,780) | 15,876,292 | |||||||
|
| |||||||
TOTAL INVESTMENTS - 99.9% | ||||||||
(Cost $14,607,780) | 15,876,292 | |||||||
|
| |||||||
OTHER ASSETS IN EXCESS OF LIABILITIES - 0.1% | 14,597 | |||||||
|
| |||||||
NET ASSETS - 100.0% | $ | 15,890,889 | ||||||
|
| |||||||
| * | Non-income producing. |
The accompanying notes are an integral part of the financial statements.
7
MOUNT LUCAS U.S. FOCUSED EQUITY FUND
Statement of Assets and Liabilities
April 30, 2017
Assets | ||||
Investments, at value (Cost $14,607,780) | $ | 15,876,292 | ||
Cash | 57,455 | |||
Dividends and interest receivable | 9,935 | |||
Prepaid expenses and other assets | 27,024 | |||
|
| |||
Total assets | 15,970,706 | |||
|
| |||
Liabilities | ||||
Payable for investments purchased | 886 | |||
Payable for audit fees | 27,500 | |||
Payable for custodian fees | 21,065 | |||
Payable for administration and accounting fees | 9,304 | |||
Payable for transfer agent fees | 8,027 | |||
Payable for legal fees | 6,406 | |||
Payable for printing fees | 5,525 | |||
Payable to Investment Adviser | 378 | |||
Other accrued expenses | 726 | |||
|
| |||
Total liabilities | 79,817 | |||
|
| |||
Net Assets | $ | 15,890,889 | ||
|
| |||
Net Assets Consisted of: | ||||
Capital stock, $0.01 par value | $ | 16,544 | ||
Paid-in capital | 18,244,302 | |||
Accumulated net investment income | 635,947 | |||
Accumulated net realized loss from investments | (4,274,416 | ) | ||
Net unrealized appreciation on investments | 1,268,512 | |||
|
| |||
Net Assets | $ | 15,890,889 | ||
|
| |||
Class I: | ||||
Net asset value, offering and redemption price per share | $9.61 | |||
The accompanying notes are an integral part of the financial statements.
8
MOUNT LUCAS U.S. FOCUSED EQUITY FUND
Statement of Operations
For the Year Ended April 30, 2017
Investment Income | ||||
Dividends | $ | 915,387 | ||
|
| |||
Total investment income | 915,387 | |||
|
| |||
Expenses | ||||
Advisory fees (Note 2) | 217,924 | |||
Administration and accounting fees (Note 2) | 66,747 | |||
Legal fees | 32,391 | |||
Audit fees | 30,248 | |||
Trustees’ and officers’ fees (Note 2) | 28,392 | |||
Custodian fees (Note 2) | 27,223 | |||
Transfer agent fees (Note 2) | 27,130 | |||
Registration and filing fees | 17,269 | |||
Printing and shareholder reporting fees | 11,534 | |||
Other expenses | 18,110 | |||
|
| |||
Total expenses before waivers | 476,968 | |||
|
| |||
Less: waivers (Note 2) | (200,931 | ) | ||
|
| |||
Net expenses after waivers | 276,037 | |||
|
| |||
Net investment income | 639,350 | |||
|
| |||
Net realized and unrealized gain from investments: | ||||
Net realized gain from investments | 267,393 | |||
Net change in unrealized appreciation/(depreciation) on investments | 1,174,228 | |||
|
| |||
Net realized and unrealized gain on investments | 1,441,621 | |||
|
| |||
Net increase in net assets resulting from operations | $ | 2,080,971 | ||
|
|
The accompanying notes are an integral part of the financial statements.
9
MOUNT LUCAS U.S. FOCUSED EQUITY FUND
Statements of Changes in Net Assets
| For the Year Ended April 30, 2017 | For the Year Ended April 30, 2016 | |||||||
Increase/(Decrease) in net assets from operations: | ||||||||
Net investment income | $ | 639,350 | $ | 782,615 | ||||
Net realized gain/(loss) from investments | 267,393 | (4,296,530 | ) | |||||
Net change in unrealized appreciation/(depreciation) on investments | 1,174,228 | (2,320,114 | ) | |||||
|
|
|
| |||||
Net increase/(decrease) in net assets resulting from operations | 2,080,971 | (5,834,029 | ) | |||||
|
|
|
| |||||
Less Dividends and Distributions to Shareholders from: | ||||||||
Net investment income | ||||||||
Class I | (782,077 | ) | (246,838 | ) | ||||
Net realized capital gains | ||||||||
Class I | — | (1,675,792 | ) | |||||
|
|
|
| |||||
Net decrease in net assets from dividends and distributions to shareholders | (782,077 | ) | (1,922,630 | ) | ||||
|
|
|
| |||||
Decrease in Net Assets Derived from Capital Share | ||||||||
Transactions (Note 4) | (30,229,815 | ) | (6,066,636 | ) | ||||
|
|
|
| |||||
Total decrease in net assets | (28,930,921 | ) | (13,823,295 | ) | ||||
|
|
|
| |||||
Net assets | ||||||||
Beginning of year | 44,821,810 | 58,645,105 | ||||||
|
|
|
| |||||
End of year | $ | 15,890,889 | $ | 44,821,810 | ||||
|
|
|
| |||||
Accumulated net investment income, end of year | $ | 635,947 | $ | 778,674 | ||||
|
|
|
| |||||
The accompanying notes are an integral part of the financial statements.
10
MOUNT LUCAS U.S. FOCUSED EQUITY FUND
Financial Highlights
Contained below is per share operating performance data for Class I shares outstanding, total investment return, ratios to average net assets and other supplemental data for the respective period. The total returns in the table represent the rate that an investor would have earned or lost on an investment in the Fund (assuming reinvestment of all dividends and distributions). This information has been derived from information provided in the financial statements and should be read in conjunction with the financial statements and the notes thereto.
| For the Year Ended April 30, 2017 | For the Year Ended April 30, 2016 | For the Year Ended April 30, 2015 | For the Seven Months Ended April 30, 2014(1)(2) | For the Year Ended September 30, 2013(2) | For the Year Ended September 30, 2012(2) | |||||||||||||||||||||||||
Per Share Operating Performance | ||||||||||||||||||||||||||||||
Net asset value, beginning of period | $ | 8.66 | $ | 10.01 | $ | 11.92 | $ | 11.19 | $ | 8.72 | $ | 7.09 | ||||||||||||||||||
|
|
|
|
|
|
|
|
|
|
|
| |||||||||||||||||||
Net investment income(3) | 0.19 | 0.14 | 0.15 | 0.14 | 0.17 | 0.12 | ||||||||||||||||||||||||
Net realized and unrealized gain/(loss) on investments | 1.17 | (1.15 | ) | 0.79 | 2.08 | 2.43 | 1.66 | |||||||||||||||||||||||
|
|
|
|
|
|
|
|
|
|
|
| |||||||||||||||||||
Net increase/(decrease) in net assets resulting from operations | 1.36 | (1.01 | ) | 0.94 | 2.22 | 2.60 | 1.78 | |||||||||||||||||||||||
|
|
|
|
|
|
|
|
|
|
|
| |||||||||||||||||||
Dividends and distributions to shareholders from: | ||||||||||||||||||||||||||||||
Net investment income | (0.41 | ) | (0.04 | ) | (0.22 | ) | (0.13 | ) | (0.13 | ) | (0.16 | ) | ||||||||||||||||||
Net realized capital gains | — | (0.30 | ) | (2.63 | ) | (1.36 | ) | — | — | |||||||||||||||||||||
|
|
|
|
|
|
|
|
|
|
|
| |||||||||||||||||||
Total dividends and distributions to shareholders | (0.41 | ) | (0.34 | ) | (2.85 | ) | (1.49 | ) | (0.13 | ) | (0.16 | ) | ||||||||||||||||||
|
|
|
|
|
|
|
|
|
|
|
| |||||||||||||||||||
Adviser Contribution. | — | — | — | — | — | 0.01 | ||||||||||||||||||||||||
|
|
|
|
|
|
|
|
|
|
|
| |||||||||||||||||||
Net asset value, end of period | $ | 9.61 | $ | 8.66 | $ | 10.01 | $ | 11.92 | $ | 11.19 | $ | 8.72 | ||||||||||||||||||
|
|
|
|
|
|
|
|
|
|
|
| |||||||||||||||||||
Total investment return(4) | 15.83 | % | (10.09 | )% | 8.81 | % | 20.54 | % | 30.16 | % | 25.38 | %(5) | ||||||||||||||||||
Ratio/Supplemental Data | ||||||||||||||||||||||||||||||
Net assets, end of period (in thousands) | $ | 15,891 | $ | 44,822 | $ | 58,645 | $ | 59,166 | $ | 45,540 | $ | 26,060 | ||||||||||||||||||
Ratio of expenses to average net assets | 0.95 | % | 0.95 | % | 0.95 | % | 0.95 | %(6) | 0.95 | % | 0.95 | % | ||||||||||||||||||
Ratio of expenses to average net assets without waivers and expense reimbursements(7) | 1.64 | % | 1.31 | % | 1.23 | % | 1.18 | %(6) | 1.25 | % | 1.74 | % | ||||||||||||||||||
Ratio of net investment income to average net assets | 2.20 | % | 1.54 | % | 1.31 | % | 2.09 | %(6) | 1.70 | % | 1.50 | % | ||||||||||||||||||
Portfolio turnover rate | 92.10 | % | 95.16 | % | 102.75 | % | 53.87 | %(8) | 103.55 | % | 118.67 | % | ||||||||||||||||||
| (1) | The Fund changed its fiscal year end to April 30. |
| (2) | Effective prior to the opening of business on March 24, 2014, the Fund acquired substantially all of the assets and liabilities of the Mount Lucas U.S. Focused Equity Fund, a series of Scotia Institutional Funds (the “Predecessor Fund”). The financial highlights for the periods prior to that date reflects the performance of the Predecessor Fund. |
| (3) | Calculated based on the average number of shares outstanding during the period. |
| (4) | Total investment return is calculated assuming a purchase of shares on the first day and a sale of shares on the last day of each period reported and includes reinvestment of dividends and distributions, if any. Total return for periods less than one year are not annualized. |
| (5) | Absent a capital contribution between the Predecessor Fund and the investment adviser to the Predecessor Fund, total return would have been 25.23% for the year ended September 30, 2012. |
| (6) | Annualized. |
| (7) | During the period, certain fees were waived and/or reimbursed. If such fee waivers and/or reimbursements had not occurred, the ratios would have been as indicated (See Note 2). |
| (8) | Not annualized. |
The accompanying notes are an integral part of the financial statements.
11
MOUNT LUCAS U.S. FOCUSED EQUITY FUND
Notes to Financial Statements
April 30, 2017
1. Organization and Significant Accounting Policies
The Mount Lucas U.S. Focused Equity Fund (the “Fund”) is a non-diversified, open-end management investment company registered under the Investment Company Act of 1940, as amended (the “1940 Act”). The Fund is a separate series of FundVantage Trust (the “Trust”) which was organized as a Delaware statutory trust on August 28, 2006. The Trust is a “series trust” authorized to issue an unlimited number of separate series or classes of shares of beneficial interest. Each series is treated as a separate entity for certain matters under the 1940 Act, and for other purposes, and a shareholder of one series is not deemed to be a shareholder of any other series. The Fund offers separate classes of shares, Class I shares and Class II shares. As of April 30, 2017, Class II shares have not been issued.
The Fund is an investment company and follows accounting and reporting guidance in the Financial Accounting Standards Board Accounting Standards Codification Topic 946.
Portfolio Valuation — The Fund’s net asset value (“NAV”) is calculated once daily at the close of regular trading hours on the New York Stock Exchange (“NYSE”) (typically 4:00 p.m. Eastern time) on each day the NYSE is open. Securities held by the Fund are valued using the closing price or the last sale price on a national securities exchange or the National Association of Securities Dealers Automatic Quotation System (“NASDAQ”) market system where they are primarily traded. Equity securities traded in the over-the-counter market are valued at their closing prices. If there were no transactions on that day, securities traded principally on an exchange or on NASDAQ will be valued at the mean of the last bid and ask prices prior to the market close. Investments in other open-end investment companies are valued based on the NAV of the investment companies (which may use fair value pricing as discussed in their prospectuses). If market quotations are unavailable or deemed unreliable, securities will be valued in accordance with procedures adopted by the FundVantage Trust’s Board of Trustees. Relying on prices supplied by pricing services or dealers or using fair valuation may result in values that are higher or lower than the values used by other investment companies and investors to price the same investments. In the event that market quotes are not readily available, and the security or asset cannot be valued pursuant to one of the valuation methods, the value of the security or asset will be determined in good faith by the Adviser. The Trust has established a Valuation Committee which performs certain functions including the oversight of the Adviser’s fair valuation determinations.
Fair Value Measurements — The inputs and valuation techniques used to measure fair value of the Fund’s investments are summarized into three levels as described in the hierarchy below:
• Level 1 — | quoted prices in active markets for identical securities; | |
• Level 2 — | other significant observable inputs (including quoted prices for similar securities, interest rates, prepayment speeds, credit risk, etc.); and | |
• Level 3 — | significant unobservable inputs (including the Fund’s own assumptions in determining the fair value of investments). | |
The inputs or methodology used for valuing securities are not necessarily an indication of the risk associated with investing in those securities.
The following is a summary of the inputs used, as of April 30, 2017, in valuing the Fund’s investments carried at fair value:
| Total Value at 04/30/17 | Level 1 Quoted Price | Level 2 Other Significant Observable Inputs | Level 3 Significant Unobservable Inputs | |||||||||||||
Common Stocks* | $ | 15,876,292 | $ | 15,876,292 | $ | — | $ | — | ||||||||
|
|
|
|
|
|
|
| |||||||||
| * | Please refer to Portfolio of Investments for further details on portfolio holdings. |
12
MOUNT LUCAS U.S. FOCUSED EQUITY FUND
Notes to Financial Statements (Continued)
April 30, 2017
At the end of each quarter, management evaluates the classification of Levels 1, 2 and 3 assets and liabilities. Various factors are considered, such as changes in liquidity from the prior reporting period; whether or not a broker is willing to execute at the quoted price; the depth and consistency of prices from third party pricing services; and the existence of contemporaneous, observable trades in the market. Additionally, management evaluates the classification of Level 1 and Level 2 assets and liabilities on a quarterly basis for changes in listings or delistings on national exchanges.
Due to the inherent uncertainty of determining the fair value of investments that do not have a readily available market value, the fair value of the Fund’s investments may fluctuate from period to period. Additionally, the fair value of investments may differ significantly from the values that would have been used had a ready market existed for such investments and may differ materially from the values the Fund may ultimately realize. Further, such investments may be subject to legal and other restrictions on resale or otherwise less liquid than publicly traded securities.
For fair valuations using significant unobservable inputs, U.S. generally accepted accounting principles (“U.S. GAAP”) require the Fund to present a reconciliation of the beginning to ending balances for reported market values that presents changes attributable to total realized and unrealized gains or losses, purchase and sales, and transfers in and out of Level 3 during the period. Transfers in and out between Levels are based on values at the end of the period. U.S. GAAP also requires the Fund to disclose amounts and reasons for all transfers in and out of Level 1 and Level 2 fair value measurements. A reconciliation of Level 3 investments is presented only when the Fund had an amount of Level 3 investments at the end of the reporting period that was meaningful in relation to its net assets. The amounts and reasons for all transfers in and out of each Level within the three-tier hierarchy are disclosed when the Fund had an amount of total transfers during the reporting period that was meaningful in relation to its net assets as of the end of the reporting period.
For the year ended April 30, 2017, there were no transfers between Levels 1, 2 and 3 for the Fund.
Use of Estimates — The preparation of financial statements in conformity with U.S. GAAP requires management to make estimates and assumptions that affect the amounts reported in the financial statements and accompanying notes at the date of the financial statements and the reported amounts of revenues and expenses during the period. Actual results could differ from those estimates and those differences could be material.
Investment Transactions, Investment Income and Expenses — Investment transactions are recorded on trade date for financial statement preparation purposes. Realized gains and losses on investments sold are recorded on the identified cost basis. Interest income is recorded on the accrual basis. Dividends are recorded on the ex-dividend date. Estimated components of distributions received from real estate investment trusts may be considered income, return of capital distributions or capital gain distributions. Return of capital distributions are recorded as a reduction of cost of the related investment. General expenses of the Trust are generally allocated to each fund in proportion to its relative daily net assets. Expenses directly attributable to a particular fund in the Trust are charged directly to that fund.
Dividends and Distributions to Shareholders — Dividends from net investment income and distributions from net realized capital gains, if any, are declared, recorded on ex-date and paid at least annually to shareholders. Income dividends and capital gain distributions are determined in accordance with U.S. federal income tax regulations, which may differ from U.S. GAAP. These differences may include the treatment of non-taxable dividends, expiring capital loss carryforwards and losses deferred due to wash sales and excise tax regulations. Permanent book and tax basis differences relating to shareholder distributions will result in reclassifications within the components of net assets.
U.S. Tax Status — No provision is made for U.S. income taxes as it is the Fund’s intention to continue to qualify for and elect the tax treatment applicable to regulated investment companies under Subchapter M of the Internal Revenue Code of 1986, as amended (the “Internal Revenue Code”), and make the requisite distributions to its shareholders which will be sufficient to relieve it from U.S. income and excise taxes.
13
MOUNT LUCAS U.S. FOCUSED EQUITY FUND
Notes to Financial Statements (Continued)
April 30, 2017
Other — In the normal course of business, the Fund may enter into contracts that provide general indemnifications. The Fund’s maximum exposure under these arrangements is dependent on claims that may be made against the Fund in the future, and therefore, cannot be estimated; however, based on experience, the risk of material loss for such claims is considered remote.
Recent Accounting Pronouncement — In October 2016, the U.S. Securities and Exchange Commission (“SEC”) issued a new rule, Investment Company Reporting Modernization, which, among other provisions, amends Regulation S-X to require standardized, enhanced disclosures, particularly related to derivatives, in investment company financial statements. Compliance with the amendments to Regulation S-X is required for financial statements ending on or after August 1, 2017. Management is currently evaluating the impact that the amendments will have on the Fund’s financial statements and related disclosures.
2. Transactions with Related Parties and Other Service Providers
Mount Lucas Management LP (“Mount Lucas” or the “Adviser”) serves as investment adviser to the Fund pursuant to an investment advisory agreement with the Trust. For its services, the Adviser is entitled to an investment advisory fee of 0.75% (on an annualized basis), which is calculated daily and paid monthly based on the average daily net assets of the Fund. The Adviser has contractually agreed to reduce its investment advisory fee and/or reimburse certain expenses of the Fund to the extent necessary to ensure that the Fund’s total operating expenses (excluding taxes, “Acquired Fund” fees and expenses, extraordinary items, brokerage commissions and interest) do not exceed 0.95% (on an annual basis) of the Fund’s average daily net assets of Class I shares (the “Expense Limitation”). The Expense Limitation shall remain in effect until August 31, 2018, unless the Board of Trustees of the Trust approves its earlier termination. Subject to approval by the Board of Trustees, the Adviser may recoup any expenses or fees it has reimbursed within a three-year period from the year in which the Adviser reduced its compensation and/or assumed expenses of the Fund. The Adviser is permitted to seek reimbursement from the Fund, subject to certain limitations, for fees it waived and Fund expenses it paid to the extent the total annual fund operating expenses do not exceed the limits described above or any lesser limits in effect as the time of reimbursement. No recoupment will occur unless the Fund’s expenses are below the Expense Limitation amount. At April 30, 2017, the amount of potential recovery was as follows:
Expiration | ||||||
April 30, 2018 | April 30, 2019 | April 30, 2020 | Total | |||
$164,223 | $184,461 | $200,931 | $549,615 | |||
For the year ended April 30, 2017, the Adviser earned advisory fees of $217,924 and waived fees of $200,931.
Other Service Providers
BNY Mellon Investment Servicing (US) Inc. (“BNY Mellon”) serves as administrator and transfer agent for the Fund. For providing administrative and accounting services, BNY Mellon is entitled to receive a monthly fee equal to an annual percentage rate of the Fund’s average daily net assets and is subject to certain minimum monthly fees. For providing transfer agency services, BNY Mellon is entitled to receive a monthly fee, subject to certain minimum, and out of pocket expenses.
The Bank of New York Mellon (the “Custodian”) provides certain custodial services to the Fund. The Custodian is entitled to receive a monthly fee, subject to certain minimum, and out of pocket expenses.
Foreside Funds Distributors LLC (the “Underwriter”) provides principal underwriting services to the Fund pursuant to an underwriting agreement between the Trust and the Underwriter.
14
MOUNT LUCAS U.S. FOCUSED EQUITY FUND
Notes to Financial Statements (Continued)
April 30, 2017
Trustees and Officers
The Trust is governed by its Board of Trustees. The Trustees receive compensation in the form of an annual retainer and per meeting fees for their services to the Trust. The remuneration paid to the Trustees by the Fund during the year ended April 30, 2017 was $8,583. An employee of BNY Mellon serves as the Secretary of the Trust and is not compensated by the Fund or the Trust.
Effective June 1, 2016 and July 1, 2016, JW Fund Management LLC (“JWFM”) provides a Principal Executive Officer and Principal Financial Officer, respectively, to the Trust. JWFM is compensated for the services provided to the Trust. Until May 31, 2016 and June 30, 2016, certain employees of BNY Mellon served as Principal Executive Officer and Principal Financial Officer, respectively, to the Trust. They were not compensated by the Trust or the Fund.
Freeh Group International Solutions, LLC provides the Trust with a Chief Compliance Officer and an Anti-Money Laundering Officer.
3. Investment in Securities
For the year ended April 30, 2017, aggregate purchases and sales of investment securities (excluding short-term investments) of the Fund were as follows:
| Purchases | Sales | |||||||
Investment Securities | $ | 27,094,597 | $ | 57,342,346 | ||||
4. Capital Share Transactions
For the years ended April 30, 2017 and 2016, transactions in capital shares (authorized shares unlimited) were as follows:
| For the Year Ended April 30, 2017 | For the Year Ended April 30, 2016 | |||||||||||||||
| Shares | Value | Shares | Value | |||||||||||||
Class I | ||||||||||||||||
Sales | 127,994 | $ | 1,116,433 | 706,223 | $ | 6,538,683 | ||||||||||
Reinvestments | 79,574 | 751,976 | 214,260 | 1,900,489 | ||||||||||||
Redemptions | (3,730,941 | ) | (32,098,224 | ) | (1,599,720 | ) | (14,505,808 | ) | ||||||||
|
|
|
|
|
|
|
| |||||||||
Net Decrease | (3,523,373 | ) | $ | (30,229,815 | ) | (679,237 | ) | $ | (6,066,636 | ) | ||||||
|
|
|
|
|
|
|
| |||||||||
5. Federal Tax Information
The Fund has followed the authoritative guidance on accounting for and disclosure of uncertainty in tax positions, which requires the Fund to determine whether a tax position is more likely than not to be sustained upon examination, including resolution of any related appeals or litigation processes, based on the technical merits of the position. The Fund has determined that there was no effect on the financial statements from following this authoritative guidance. In the normal course of business, the Fund is subject to examination by federal, state and local jurisdictions, where applicable, for tax years for which applicable statutes of limitations have not expired.
Distributions are determined in accordance with federal income tax regulations, which may differ in amount or character from net investment income and realized gains for financial reporting purposes. Accordingly, the character of distributions
15
MOUNT LUCAS U.S. FOCUSED EQUITY FUND
Notes to Financial Statements (Concluded)
April 30, 2017
and composition of net assets for tax purposes may differ from those reflected in the accompanying financial statements. To the extent these differences are permanent, such amounts are reclassified within the components of net assets based on the tax treatment; temporary differences do not require reclassifications. For the year ended April 30, 2017, there are no reclassifications.
For the year ended April 30, 2017, the tax character of distributions paid by the Fund was $782,077 of ordinary income dividends. For the year ended April 30, 2016 the tax character of distributions paid by the Fund was $747,034 of ordinary income dividends and $1,175,596 of long-term capital gains dividends. Distributions from net investment income and short-term capital gains are treated as ordinary income for federal income tax purposes.
As of April 30, 2017, the components of distributable earnings on a tax basis were as follows:
Capital Loss Carryforward | Undistributed | Undistributed | Unrealized Appreciation | Other Book/Tax | ||||
$(4,228,915) | $638,818 | $— | $1,223,011 | $(2,871) |
The differences between the book and tax basis unrealized depreciation are attributable primarily to the tax deferral of losses on wash sales.
As of April 30, 2017, the federal tax cost, aggregate gross unrealized appreciation and depreciation of securities held by the Fund were as follows:
Federal tax cost | $ | 14,653,281 | ||||
|
| |||||
Gross unrealized appreciation | $ | 1,468,150 | ||||
Gross unrealized depreciation | (245,139 | ) | ||||
|
| |||||
Net unrealized appreciation | $ | 1,223,011 | ||||
|
|
Pursuant to federal income tax rules applicable to regulated investment companies, the Fund may elect to treat certain capital losses between November 1 and April 30 and late year ordinary losses ((i) ordinary losses between January 1 and April 30, and (ii) specified ordinary and currency losses between November 1 and April 30) as occurring on the first day of the following tax year. For the year ended April 30, 2017, the Fund had no short-term capital loss deferrals, no long-term capital loss deferrals or ordinary loss deferrals.
Accumulated capital losses represent net capital loss carry forwards as of April 30, 2017 that may be available to offset future realized capital gains and thereby reduce future capital gains distributions. As of April 30, 2017, the Fund had a capital loss carryforward of $4,228,915, of which $3,548,040 are long-term losses and $680,875 are short-term losses and have an unlimited period of capital loss carryforward.
6. Subsequent Events
Management has evaluated the impact of all subsequent events on the Fund through the date the financial statements were issued, and has determined that there were no subsequent events requiring recognition or disclosure in the financial statements.
16
MOUNT LUCAS U.S. FOCUSED EQUITY FUND
Report of Independent Registered Public Accounting Firm
To the Board of Trustees of FundVantage Trust and
Shareholders of the Mount Lucas U.S. Focused Equity Fund
We have audited the accompanying statement of assets and liabilities, including the portfolio of investments, of the Mount Lucas U.S. Focused Equity Fund (one of the series constituting FundVantage Trust) (the “Fund”) as of April 30, 2017, and the related statement of operations for the year then ended, the statements of changes in net assets for each of the two years in the period then ended, and the financial highlights for each of the three years in the period then ended and the period from October 1, 2013 to April 30, 2014. These financial statements and financial highlights are the responsibility of the Fund’s management. Our responsibility is to express an opinion on these financial statements and financial highlights based on our audits. The financial highlights for each of the years presented through September 30, 2013 were audited by other auditors whose report dated November 25, 2013, expressed an unqualified opinion on those financial highlights.
We conducted our audits in accordance with the standards of the Public Company Accounting Oversight Board (United States). Those standards require that we plan and perform the audit to obtain reasonable assurance about whether the financial statements and financial highlights are free of material misstatement. We were not engaged to perform an audit of the Fund’s internal control over financial reporting. Our audits included consideration of internal control over financial reporting as a basis for designing audit procedures that are appropriate in the circumstances, but not for the purpose of expressing an opinion on the effectiveness of the Fund’s internal control over financial reporting. Accordingly, we express no such opinion. An audit also includes examining, on a test basis, evidence supporting the amounts and disclosures in the financial statements and financial highlights, assessing the accounting principles used and significant estimates made by management, and evaluating the overall financial statement presentation. Our procedures included confirmation of securities owned as of April 30, 2017, by correspondence with the custodian and brokers or by other appropriate auditing procedures where replies from brokers were not received. We believe that our audits provide a reasonable basis for our opinion.
In our opinion, the financial statements and financial highlights referred to above present fairly, in all material respects, the financial position of the Mount Lucas U.S. Focused Equity Fund (one of the series constituting FundVantage Trust) at April 30, 2017, the results of its operations for the year then ended, the changes in its net assets for each of the two years in the period then ended, and the financial highlights for each of the three years in the period then ended and the period from October 1, 2013 to April 30, 2014 in conformity with U.S. generally accepted accounting principles.
Philadelphia, Pennsylvania
June 29, 2017
17
MOUNT LUCAS U.S. FOCUSED EQUITY FUND
Shareholder Tax Information
(Unaudited)
The Fund is required by Subchapter M of the Internal Revenue Code to advise its shareholders of the U.S. federal tax status of distributions received by the Fund’s shareholders in respect of such fiscal year. During the fiscal year ended April 30, 2017, the Fund paid $782,077 of ordinary income dividends to its shareholders. Dividends from net investment income and short-term capital gains are treated as ordinary income dividends for federal income tax purposes.
The Fund designates 100.00% of the ordinary income distribution as qualified dividend income pursuant to the Jobs and Growth Tax Relief Reconciliation Act of 2003.
The percentage of ordinary income dividends qualifying for the corporate dividends received deduction is 100.00%.
All designations are based on financial information available as of the date of this annual report and, accordingly, are subject to change. For each item, it is the intention of the Fund to designate the maximum amount permitted under the Internal Revenue Code of 1986, as amended, and the regulations thereunder.
Because the Fund’s fiscal year is not the calendar year, another notification will be sent with respect to calendar year 2017. The second notification, which will reflect the amount, if any, to be used by calendar year taxpayers on their U.S. federal income tax returns, will be made in conjunction with Form 1099-DIV and will be mailed in January 2018.
Foreign shareholders will generally be subject to U.S. withholding tax on the amount of their ordinary income dividends. They will generally not be entitled to a foreign tax credit or deduction for the withholding taxes paid by the Fund, if any.
In general, dividends received by tax-exempt recipients (e.g., IRAs and Keoghs) need not be reported as taxable income for U.S. federal income tax purposes. However, some retirement trusts (e.g., corporate, Keogh and 403(b)(7) plans) may need this information for their annual information reporting.
Shareholders are advised to consult their own tax advisers with respect to the tax consequences of their investment in the Fund.
18
MOUNT LUCAS U.S. FOCUSED EQUITY FUND
Other Information
(Unaudited)
Proxy Voting
Policies and procedures that the Fund uses to determine how to vote proxies relating to portfolio securities as well as information regarding how the Fund voted proxies relating to portfolio securities for the most recent 12-month period ended June 30 are available without charge, upon request, by calling (844) 261-6483 and on the Securities and Exchange Commission’s (“SEC”) website at http://www.sec.gov.
Quarterly Portfolio Schedules
The Trust files its complete schedule of portfolio holdings with the SEC for the first and third fiscal quarters of each fiscal year (quarters ended July 31 and January 31) on Form N-Q. The Trust’s Forms N-Q are available on the SEC’s website at http://www.sec.gov and may be reviewed and copied at the SEC’s Public Reference Room in Washington, D.C. Information on the operation of the SEC’s Public Reference Room may be obtained by calling 1-800-SEC-0330.
Approval of Advisory Agreement
At an in-person meeting held on December 8-9, 2016 (the “Meeting”), the Board of Trustees (the “Board” or “Trustees”) of FundVantage Trust (“Trust”), including a majority of the Trustees who are not “interested persons” as defined in the Investment Company Act of 1940, as amended (“1940 Act”) (the “Independent Trustees”), unanimously approved the continuation of the advisory agreement (the “Agreement”) between Mount Lucas Management LP (“Mount Lucas” or the “Adviser”) and the Trust on behalf of the Mount Lucas U.S. Focused Equity Fund (the “Fund”). In determining whether to continue the Agreement, the Trustees considered information regarding (i) services performed for the Mount Lucas Fund, (ii) the size and qualifications of their portfolio management staff, (iii) any potential or actual material conflicts of interest which may arise in connection with a portfolio manager’s management of the Fund, (iv) investment performance, (v) the capitalization and financial condition of Mount Lucas, (vi) brokerage selection procedures (including soft dollar arrangements, if any), (vii) the procedures for allocating investment opportunities between the Mount Lucas Fund and other clients, (viii) results of any regulatory examination, including any recommendations or deficiencies noted, (ix) any litigation, investigation or administrative proceeding which may have a material impact on Mount Lucas’ ability to service the Mount Lucas Fund, and (x) compliance with the Mount Lucas Fund’s investment objectives, policies and practices (including codes of ethics and proxy voting policies), federal securities laws and other regulatory requirements. The Trustees noted the reports and discussions with portfolio managers as provided at the Board meetings throughout the year covering matters such as the relative performance of the Fund; compliance with the investment objectives, policies, strategies and limitations for the Fund; the compliance of management personnel with the applicable code of ethics; and the adherence to the Trust’s pricing procedures as established by the Board.
The Trustees considered the investment performance of the Fund and the Adviser. The Trustees reviewed the historical performance charts which showed the performance of the Fund as compared to the Lipper Multi-Cap Value Index, the Fund’s applicable Lipper peer group, for the calendar year-to-date, one year, two year, three year, five year and since inception periods ended September 30, 2016. The Trustees also received performance information for the Fund as compared to the S&P 500 Index and a comparable separately managed account composite (gross of fees), for the one year, three year, five year and since inception periods ended October 31, 2016.
The Trustees noted that the Class I shares of the Fund had underperformed the Lipper Multi-Cap Value Index Fund category for the year-to-date, one year, two year, three year, five year and since inception periods ended September 30, 2016. The Trustees noted that the Fund had also underperformed the S&P 500 Index and the comparable separately managed account composite (gross of fees) for the one year, three year, five year and since inception periods ended October 31, 2016. The Trustees considered explanations provided by Mount Lucas regarding the various factors contributing to the relative underperformance of the Fund during the applicable periods, including, among other things, differences
19
MOUNT LUCAS U.S. FOCUSED EQUITY FUND
Other Information
(Unaudited) (Continued)
in the Fund’s investment strategies and portfolio construction in comparison to the funds included in its Lipper peer group and the composite. The Trustees considered other factors that supported the continuation of the Agreement, including that Mount Lucas’ investment decisions, such as security selection and sector allocation, contributing to such underperformance were consistent with the Fund’s investment objective and policies. Taking note of Mount Lucas’ discussion of (i) the various factors contributing to the Fund’s performance and (ii) its continuing commitment to the Fund’s current investment strategy, the Trustees concluded that, although the Fund had underperformed the S&P 500 Index and the median of the Lipper Multi-Cap Value Index Fund category for certain measurement periods as noted above, the Trustees concluded that the performance of the Fund was within an acceptable range of performance relative to other mutual funds with similar investment objectives, strategies and policies based on the information provided at the Meeting.
The Trustees noted that the representatives of the Adviser had provided information regarding its advisory fees and an analysis of these fees in relation to services provided to the Fund and any other ancillary benefit resulting from the Adviser’s relationship with the Fund. The Trustees also reviewed information regarding the fees that Mount Lucas charges to its separately managed accounts, and evaluated the explanations provided by Mount Lucas as to differences in fees charged to the Fund and separately managed accounts and funds. The Trustees also reviewed a peer comparison of advisory fees and total expenses for the Fund versus the universe of funds with similar share classes in the Lipper Multi Cap Value Index Fund category with $250 million or less in assets. The Trustees noted that the contractual advisory fee was higher than the median of contractual advisory fee of the universe of funds in the Lipper Multi-Cap Value Index Fund category with $250 million or less in asset but that the Fund’s net advisory fee (after fee waivers and reimbursements by the Adviser) was lower than the median net advisory of the universe of funds in the Lipper Multi-Cap Value Index Fund category with $250 million or less in assets.
They further noted that the net total expense ratio of the Fund’s Class I shares was equal to the median net total expense ratio of funds with a similar share class in the Lipper Multi-Cap Value Index Fund category with $250 million or less in assets. The Trustees concluded that the advisory fees and services provided by Mount Lucas are consistent with those of other advisers which manage mutual funds with investment objectives, strategies and policies similar to those of the Fund based on the information provided at the Meeting.
The Board then considered the level and depth of knowledge of the Adviser, including the professional experience and qualifications of senior personnel. In evaluating the quality of services to be provided by Mount Lucas, the Board took into account its familiarity with Mount Lucas’ management through Board meetings, discussions and reports during the preceding year. The Board also took into account Mount Lucas’ compliance policies and procedures and reports regarding Mount Lucas’ compliance operations from the Trust’s Chief Compliance Officer. The Board also considered any potential conflicts of interest that may arise in a portfolio manager’s management of the Fund’s investments on the one hand, and the investments of other accounts, on the other. The Trustees reviewed the services provided to the Fund by Mount Lucas and concluded that the nature, extent and quality of the services provided were appropriate and consistent with the terms of the Agreement, that the quality of the services appeared to be consistent with industry norms and that the Fund is likely to benefit from the continued receipt of those services. They also concluded that the Adviser has sufficient personnel, with the appropriate education and experience, to serve the Fund effectively and the Adviser had demonstrated its ability to attract and retain qualified personnel.
The Trustees then reviewed materials regarding the costs of the services provided by Mount Lucas, the compensation and benefits received by Mount Lucas in providing services to the Fund, as well as Mount Lucas’ profitability. The Trustees were provided with Mount Lucas’ audited financial statements for the fiscal year ended December 31, 2015 and unaudited balance sheet as of September 30, 2016. The Trustees noted that Mount Lucas’ level of profitability is an appropriate factor to consider, and the Trustees should be satisfied that Mount Lucas’ profits are sufficient to continue as a healthy concern generally and as investment adviser of the Fund specifically. The Trustees concluded that Mount Lucas’ contractual advisory fee level was reasonable in relation to the nature and quality of the services provided, taking into account the fees charged by other advisers for managing comparable mutual funds with similar strategies. The Trustees also concluded that the overall expense ratio of the Fund was reasonable, taking into account the quality of services provided by Mount Lucas and the current size and projected growth of the Fund during the renewal term.
20
MOUNT LUCAS U.S. FOCUSED EQUITY FUND
Other Information
(Unaudited) (Concluded)
The Trustees considered the extent to which economies of scale would be realized relative to fee levels as the Fund grows, and whether the fee levels reflect these economies of scale for the benefit of shareholders. The Board determined that economies of scale may be achieved at higher asset levels for the Fund for the benefit of Fund shareholders, but that the advisory fee did not currently include breakpoint reductions as asset levels increased.
In voting to approve the continuation of the Agreement, the Board considered all factors it deemed relevant and the information presented to the Board by Mount Lucas. In arriving at its decision, the Board did not identify any single factor as being of paramount importance and each member of the Board gave varying weights to each factor according to his or her own judgment. The Board determined that the continuation of the Agreement would be in the best interests of the Fund ant its shareholders. At this time, the Board, including the Independent Trustees, unanimously approved the continuation of the Agreement for an additional one-year period.
21
MOUNT LUCAS U.S. FOCUSED EQUITY FUND
Privacy Notice
(Unaudited)
The privacy of your personal financial information is extremely important to us. When you open an account with us, we collect a significant amount of information from you in order to properly invest and administer your account. We take very seriously the obligation to keep that information private and confidential, and we want you to know how we protect that important information.
We collect nonpublic personal information about you from applications or other forms you complete and from your transactions with us or our affiliates. We do not disclose information about you, or our former clients, to our affiliates or to service providers or other third parties, except as permitted by law. We share only the information required to properly administer your accounts, which enables us to send transaction confirmations, monthly or quarterly statements, financials and tax forms. Even within FundVantage Trust and its affiliated entities, a limited number of people who actually service accounts will have access to your personal financial information. Further, we do not share information about our current or former clients with any outside marketing groups or sales entities.
To ensure the highest degree of security and confidentiality, FundVantage Trust and its affiliates maintain various physical, electronic and procedural safeguards to protect your personal information. We also apply special measures for authentication of information you request or submit to us on our web site.
If you have questions or comments about our privacy practices, please call us at (844) 261-6483.
22
MOUNT LUCAS U.S. FOCUSED EQUITY FUND
Fund Management
(Unaudited)
FundVantage Trust (the “Trust”) is governed by a Board of Trustees (the “Trustees”). The primary responsibility of the Trustees is to represent the interest of the Trust’s shareholders and to provide oversight management of the Trust.
The following tables present certain information regarding the Board of Trustees and officers of the Trust. None of the Trustees are an “interested person” of the Trust, the Adviser, another investment adviser of a series of the Trust, or Foreside Funds Distributors LLC, the principal underwriter of the Trust (“Underwriter”), within the meaning of the 1940 Act and each Trustee is referred to as an “Independent Trustee” and is listed under such heading below. The address of each Trustee and Officer as it relates to the Trust’s business is 301 Bellevue Parkway, 2nd Floor, Wilmington, DE 19809.
The Statement of Additional Information for the Fund contains additional information about the Trustees and is available, without charge, upon request, by calling (844) 261-6483.
Name and Date of Birth | Position(s) Held with Trust | Term of Office and Length of Time Served | Principal Occupation(s) During Past Five Years | Number of Funds in Trust Complex Overseen by Trustee | Other Directorships Held by Trustee | |||||
INDEPENDENT TRUSTEES
| ||||||||||
ROBERT J. CHRISTIAN Date of Birth: 2/49 |
Trustee and Chairman of the Board |
Shall serve until death, resignation or removal. Trustee and Chairman since 2007. |
Retired since February 2006; Executive Vice President of Wilmington Trust Company from February 1996 to February 2006; President of Rodney Square Management Corporation (“RSMC”) (investment advisory firm) from 1996 to 2005; Vice President of RSMC from 2005 to 2006.
|
42 |
Optimum Fund Trust (registered investment company with 6 portfolios). | |||||
IQBAL MANSUR Date of Birth: 6/55 |
Trustee |
Shall serve until death, resignation or removal. Trustee since 2007.
|
University Professor, Widener University. |
42 |
None. | |||||
NICHOLAS M. MARSINI, JR. Date of Birth: 8/55 |
Trustee |
Shall serve until death, resignation or removal. Trustee since 2016. |
Retired since March 2016. President of PNC Bank Delaware from June 2011 to March 2016; Executive Vice President Finance of BNY Mellon from July 2010 to January 2011; Executive Vice President and Chief Financial Officer of PNC Global Investment Servicing from September 1997 to July 2010.
|
42 |
Brinker Capital Destinations Trust (registered investment company with 10 portfolios). | |||||
STEPHEN M. WYNNE Date of Birth: 1/55 |
Trustee |
Shall serve until death, resignation or removal. Trustee since 2009. |
Retired since December 2010; Chief Executive Officer of US Funds Services, BNY Mellon Asset Servicing from July 2010 to December 2010; Chief Executive Officer of PNC Global Investment Servicing from March 2008 to July 2010; President, PNC Global Investment Servicing from 2003 to 2008. |
42 |
Copeland Trust (registered investment company with 2 portfolios). Context Capital Funds (registered investment company with 1 portfolio).
| |||||
23
MOUNT LUCAS U.S. FOCUSED EQUITY FUND
Fund Management
(Unaudited) (Concluded)
Name and Date of Birth | Position(s) Held with Trust | Term of Office and Length of Time Served | Principal Occupation(s) During Past Five Years | Number of Funds in Trust Complex Overseen by Trustee | Other Directorships Held by Trustee | |||||
INDEPENDENT TRUSTEES (Continued)
| ||||||||||
NANCY B. WOLCOTT Date of Birth: 11/54 |
Trustee |
Shall serve until death, resignation or removal. Trustee since 2011. |
Retired since May 2014; EVP, Head of GFI Client Service Delivery, BNY Mellon from January 2012 to May 2014; EVP, Head of US Funds Services, BNY Mellon from July 2010 to January 2012; President of PNC Global Investment Servicing from 2008 to July 2010; Chief Operating Officer of PNC Global Investment Servicing from 2007 to 2008; Executive Vice President of PFPC Worldwide Inc. from 2006 to 2007.
|
42 |
None. | |||||
Name and Date of Birth | Position(s) Held with Trust | Term of Office and Length of Time Served | Principal Occupation(s) During Past Five Years | |||
EXECUTIVE OFFICERS
| ||||||
JOEL L. WEISS Date of Birth: 1/63 |
President and Chief Executive Officer |
Shall serve until death, resignation or removal. Officer since 2007. |
President of JW Fund Management LLC since June 2016; Vice President and Managing Director of BNY Mellon Investment Servicing (US) Inc. and predecessor firms from 1993 to June 2016.
| |||
T. RICHARD KEYES Date of Birth: 1/57 |
Treasurer and Chief Financial Officer |
Shall serve until death, resignation or removal. Officer since 2016. |
President of TRK Fund Consulting since July 2016; Head of Tax — U.S. Fund Services of BNY Mellon Investment Servicing (US) Inc. and predecessor firms from February 2006 to July 2016.
| |||
VINCENZO A. SCARDUZIO Date of Birth: 4/72 |
Secretary |
Shall serve until death, resignation or removal. Officer since 2012. |
Director and Vice President Regulatory Administration of BNY Mellon Investment Servicing (US) Inc. and predecessor firms since 2001.
| |||
DAVID C. LEBISKY Date of Birth: 5/72 |
Chief Compliance Officer and Anti-Money Laundering Officer |
Shall serve until death, resignation or removal. Officer since 2015. |
President of Lebisky Compliance Consulting LLC since October 2015; Senior Consultant, Freeh Group International Solutions, LLC (a global risk management firm) since 2015; Scotia Institutional Investments US, LP, Director of Regulatory Administration from 2010 to 2014.
| |||
24
[THIS PAGE INTENTIONALLY LEFT BLANK.]
Investment Adviser
Mount Lucas Management LP
405 South State Street
Newtown, PA 18940
Administrator
BNY Mellon Investment Servicing (US) Inc.
301 Bellevue Parkway
Wilmington, DE 19809
Transfer Agent
BNY Mellon Investment Servicing (US) Inc.
4400 Computer Drive
Westborough, MA 01581
Principal Underwriter
Foreside Funds Distributors LLC
400 Berwyn Park
899 Cassatt Road
Berwyn, PA 19312
Custodian
The Bank of New York Mellon
225 Liberty Street
New York, NY 10286
Independent Registered Public Accounting Firm
Ernst & Young LLP
One Commerce Square
2005 Market Street, Suite 700
Philadelphia, PA 19103-7096
Legal Counsel
Pepper Hamilton LLP
3000 Two Logan Square
18th and Arch Streets
Philadelphia, PA 19103
LUC-0417
PACIFIC CAPITAL FUNDS
Pacific Capital Tax-Free Securities Fund
Pacific Capital Tax-Free Short Intermediate Securities Fund
Annual Investment Adviser’s Report
April 30, 2017 (Unaudited)
Dear Shareholder:
U.S. Economy
The U.S. economy ended 2016 on a positive note but did not show signs of robust growth. The U.S economy continues to expand at a modest pace, resulting in real GDP growth of 2.1% for 2016. Improvement in job growth pushed the unemployment rate to a rate of 4.7%. On the inflation front, CPI and PPI year-over-year rose to a two-year high while oil prices reached a high that has not occurred since July 2015. In December 2015, the U.S. Federal Reserve (Fed) began to raise its benchmark interest rate. Since then they have raised it two more times: once in 2016 and another one recently at its March 2017 meeting. Speculation about the Fed’s intentions since then have been a strong influence on markets. We expect U.S. economic growth to continue on a modest path and anticipate the Federal Reserve to increase rates in June and again by the end of 2017.
Hawaii Economy
The Hawaii economy continues to perform well. Tourism continues to trend higher, unemployment is down, and the construction industry continues to be on track. But we remain mindful that there are a few downside risks as we approach new highs on various economic indicators. The Hawaii tourism industry posted another record year in 2016. Last year, Hawaii saw 8.8 million visitors, 3% more than in 2015, but the real visitor spending lagged, declining by nearly 3% on Oahu; on the Neighbor Islands expenditures had stronger gains. The construction industry continued to be near its all-time highs but after a first-quarter surge in 2016, construction employment trended down over the course of the year. Resort and retail-related construction should sustain year-end levels through 2019. Hawaii’s healthy labor market conditions continued throughout 2016. Since the fourth quarter of 2010, Hawaii’s jobs increased for the 25th consecutive quarter and the unemployment rate decreased from 3.2% in the fourth quarter of 2015 to 2.8% in the fourth quarter of 2016.
The Department of Business and Economic Development and Tourism (DBEDT) projects Hawaii’s economy is expected to continue to grow in 2017 and 2018, with some potential downside risks associated with any dramatic policy changes in Washington or potential geopolitical flare ups.
Municipal Market and Fund Performance
Municipals had a strong start in 2016, but after the results of the U.S. Election and high expectations of the newly appointed President Trump, municipals ended up giving back all of their gains the second half of 2016.
Short rates began to trend higher as the Federal Reserve increased the Federal Funds Target Rate, and as a result of market expectations of more Fed rate increases. On the longer end, municipal rates increased with inflation fears of potential fiscal policies, but since November have remained in a trading range with the positive but slow performance in the domestic economy, geopolitical issues and strengthening of the US dollar.
While issuers continue to refund existing debt where they can, investor demand remains strong for municipal bonds as they are still an attractive asset class relative to U.S. Treasury and Government Agency securities on a taxable equivalent basis with strong credit fundamentals.
1
PACIFIC CAPITAL FUNDS
Pacific Capital Tax-Free Securities Fund
Pacific Capital Tax-Free Short Intermediate Securities Fund
Annual Investment Adviser’s Report (Concluded)
April 30, 2017 (Unaudited)
The Pacific Capital Tax-Free Short Intermediate Securities had a total return of 0.24% for the year ended April 30, 2017. The Pacific Capital Tax-Free Securities Fund had a total return of -0.10% from the same period. Total return reflects the market fluctuation of the share price as well as reinvested dividends. Gross of Fee returns were 0.54% for the Pacific Capital Tax-Free Short Intermediate Fund and 0.04% for the Pacific Capital Tax-Free Securities Fund. The Barclays Capital Hawaii 3-year Municipal Bond Index had a total return of 0.71% for the year ended April 30, 2017 and the Barclays Capital Hawaii Municipal Bond Index had a total return of 0.02% for the same period.
Outlook and Strategy
Demand has remained strong for municipal bonds. With global growth slowing, the stock market continuing to hit new highs, and the uncertainty of the implementation of Trump policies, investors have sought the stability of bond investments. We have positioned the funds to take advantage of potential increases in short-term rates by the Federal Reserve and took advantage of the market pull back in November/December after the U.S. Presidential election. We continue to focus on higher quality bonds and look for opportunities to achieve the funds’ objectives of high current income that is exempt from federal and Hawaii income tax.
Additional Disclosure
AMG’s comments reflect the investment advisor’s general views regarding the market and economy and are compiled from AMG research. These comments reflect opinions as of the date written and are subject to change.
This letter is intended to assist shareholders in understanding how the Funds performed during the periodic ended April 30, 2017 and reflects the views of the investment advisor at the time of this writing. Of course, these views may change and do not guarantee the future performance of the Funds or the markets.
Portfolio composition is subject to change. The current and future portfolio holdings of the Funds are subject to investment risk. The investment return and principal value of an investment in the Fund will fluctuate so that an investor’s shares, when redeemed, may be worth more or less than their original cost.
All mutual fund investing involves risk, including possible loss of principal. The Funds are non-diversified, which means that a portion of the Funds’ assets may be invested in one of few companies or sectors. The Funds could fluctuate in value more than a diversified fund.
2
PACIFIC CAPITAL FUNDS
Pacific Capital Tax-Free Securities Fund
Annual Report
Performance Data
April 30, 2017 (Unaudited)
Credit Quality as of April 30, 2017 (as a percentage of total investments)
Credit quality ratings are primarily sourced from Moody’s but in the event that Moody’s has not assigned a rating, the Fund will use S&P or Fitch. If these ratings are in conflict, S&P will be used before Fitch. If none of the major rating agencies have assigned a rating, the Fund will assign a rating of NR (non-rated security). The ratings represent their (Moody’s, S&P, and Fitch) opinions as to the quality of the underlying securities in the Fund, and not the Fund itself. The ratings range from AAA (extremely strong capacity to meet financial commitment) to D (in default). Ratings are relative and subjective and are not absolute standards of quality. A pre-refunded bond is secured by an escrow fund of U.S. government obligations (i.e. Treasury securities) and assumes the superior credit rating of the government obligation. The ratings do not predict performance and are subject to change. | Investment Style
High-quality, intermediate-term, tax-exempt
Investment Objective
The Pacific Capital Tax-Free Securities Fund (the “Fund”) seeks high current income that is exempt from federal and Hawaii income tax by normally investing at least 80% of its net assets in investment grade municipal obligations. The Fund normally invests greater than 50% of its assets in Hawaii municipal obligations — debt securities issued by or on behalf of the State of Hawaii and its political subdivisions, agencies and instrumentalities that pay interest which is exempt from Hawaii income tax as well as federal income tax.
Investment Considerations
Income received from the Fund may be subject to certain state and local taxes and, depending on one’s tax status, to the federal alternative minimum tax. Bonds offer a relatively stable level of income, although bond prices will fluctuate, providing the potential for principal gain or loss. Generally, bond prices and values fall when interest rates rise, and vice versa. The longer the average maturity of the Fund’s portfolio, the greater the fluctuation in value. Since the Fund invests significantly in securities of issuers in Hawaii, it will also be affected by a variety of Hawaii’s economic and political factors. The values of any of the Fund’s investments may also decline in response to events affecting the issuer or its credit rating.
Investment Process
• Top-down macroeconomic analysis of interest rate trends
• Bottom-up credit research to identify high quality bonds
Investment Management
Advised by Asset Management Group of Bank of Hawaii (“AMG”)
• As of April 30, 2017, AMG manages $1.138 million in mutual fund assets. In addition, AMG personnel also manage approximately $2.1 billion in assets on behalf of Bank of Hawaii clients. |
3
PACIFIC CAPITAL FUNDS
Pacific Capital Tax-Free Securities Fund
Annual Report
Performance Data
April 30, 2017 (Unaudited)

| Average Annual Total Returns for the Periods Ended April 30, 2017 | ||||||||||||||||
| 1 Year | 3 Year | 5 Year | 10 Year | |||||||||||||
Class Y | -0.10% | 2.77% | 2.56% | 3.58% | ||||||||||||
Barclays Capital Hawaii Municipal Bond Index | 0.02% | 3.20% | 2.92% | 4.32% | ||||||||||||
Past performance does not guarantee future results. The performance data quoted represents past performance and current returns may be lower or higher. The investment return and principal value will fluctuate so that an investor’s shares, when redeemed, may be worth more or less than the original cost. The graph and table do not reflect the deduction of taxes that a shareholder would pay on Fund distributions or the redemption of Fund shares. To obtain performance information current to the most recent month end, please call (888) 678-6034.
As stated in the current prospectus dated September 1, 2016, the Fund’s “Total Annual Fund Operating Expenses” are 0.30%, and the Fund’s “Total Annual Fund Operating Expenses After Fee Waiver” are 0.10%, of the Fund’s average daily net assets. These rates may fluctuate and may differ from the actual expenses incurred by the Fund for the period covered in this report. The Adviser has agreed to waive its advisory fee (the “Waiver”) until August 31, 2017. The Waiver may not be terminated at any time prior to that date without the consent of the Board of Trustees of FundVantage Trust (the “Trust”). Additional information pertaining to the Fund’s expense ratio for the year ended April 30, 2017 can be found in the financial highlights.
Before the Fund commenced operations, all of the assets of the Tax-Free Securities Fund, a series of Pacific Capital Funds (the “Predecessor Fund”), were transferred to the Fund in a tax-free reorganization (the “Reorganization”). Performance presented prior to June 28, 2010 reflects the performance of the Predecessor Fund.
Total returns reflect the waiver of advisory fees. Had these waivers not been in effect, performance quoted would have been lower.
4
PACIFIC CAPITAL FUNDS
Pacific Capital Tax-Free Securities Fund
Annual Report
Performance Data (Concluded)
April 30, 2017 (Unaudited)
The performance of the Fund is measured against the Barclays Capital Hawaii Municipal Bond Index, a rules-based, market-value weighted index engineered for the long-term tax-exempt Hawaii bond market. The index has four main sectors: general obligation bonds, revenue bonds, insured bonds and prerefunded bonds. The index is unmanaged and does not reflect the deduction of fees associated with a mutual fund, such as investment management and fund accounting fees. The Fund’s performance reflects the deduction of fees for these services. Investors cannot invest directly in an index.
The Fund is distributed by Foreside Funds Distributors LLC. The Asset Management Group of Bank of Hawaii is the investment adviser to the Fund and receives a fee for its services.
All mutual fund investing involves risk, including possible loss of principal. The Fund is non-diversified, which means that a portion of the Fund’s assets may be invested in one or few companies or sectors. The Fund could fluctuate in value more than a diversified fund.
5
PACIFIC CAPITAL FUNDS
Pacific Capital Tax-Free Short Intermediate Securities Fund
Annual Report
Performance Data
April 30, 2017 (Unaudited)
Credit Quality as of April 30, 2017 (as a percentage of total investments)
Credit quality ratings are primarily sourced from Moody’s but in the event that Moody’s has not assigned a rating, the Fund will use S&P or Fitch. If these ratings are in conflict, S&P will be used before Fitch. If none of the major rating agencies have assigned a rating, the Fund will assign a rating of NR (non-rated security). The ratings represent their (Moody’s, S&P, and Fitch) opinions as to the quality of the underlying securities in the Fund, and not the Fund itself. The ratings range from AAA (extremely strong capacity to meet financial commitment) to D (in default). Ratings are relative and subjective and are not absolute standards of quality. A pre-refunded bond is secured by an escrow fund of U.S. government obligations (i.e. Treasury securities) and assumes the superior credit rating of the government obligation. The ratings do not predict performance and are subject to change. | Investment Style
High-quality, short-intermediate term, tax-exempt
Investment Objective
The Pacific Capital Tax-Free Short Intermediate Securities Fund (the “Fund”) seeks high current income that is exempt from federal and Hawaii income tax by normally investing at least 80% of its net assets in investment grade municipal obligations. The Fund normally invests greater than 50% of its assets in Hawaii municipal obligations — debt securities issued by or on behalf of the State of Hawaii and its political subdivisions, agencies and instrumentalities that pay interest which is exempt from Hawaii income tax as well as federal income tax. The Fund seeks to provide greater price stability than a long-term bond fund.
Investment Considerations
Income received from the Fund may be subject to certain state and local taxes and, depending on one’s tax status, to the federal alternative minimum tax. Bonds offer a relatively stable level of income, although bond prices will fluctuate, providing the potential for principal gain or loss. Generally, bond prices and values fall when interest rates rise, and vice versa. Intermediate term, higher-quality bonds generally offer less risk than longer-term bonds and a lower rate of return. Since the Fund invests significantly in securities of issuers in Hawaii, it will also be affected by a variety of Hawaii’s economic and political factors. The values of any of the Fund’s investments may also decline in response to events affecting the issuer or its credit rating.
Investment Process
• Top-down macroeconomic analysis of interest rate trends
• Bottom-up credit research to identify high quality bonds
Investment Management
Advised by Asset Management Group of Bank of Hawaii (“AMG”)
• As of April 30, 2017, AMG manages $1.138 million in mutual fund assets. In addition, AMG personnel also manage approximately $2.1 billion in assets on behalf of Bank of Hawaii clients. |
6
PACIFIC CAPITAL FUNDS
Pacific Capital Tax-Free Short Intermediate Securities Fund
Annual Report
Performance Data (Continued)
April 30, 2017 (Unaudited)
| Average Annual Total Returns for the Periods Ended April 30, 2017 | ||||||||||||||||
| 1 Year | 3 Year | 5 Year | 10 Year | |||||||||||||
Class Y | 0.24% | 1.13% | 0.93% | 1.83% | ||||||||||||
Barclays Capital Hawaii 3-Year Municipal Bond Index | 0.71% | 1.14% | 1.19% | 2.65% | ||||||||||||
Past performance does not guarantee future results. The performance data quoted represents past performance and current returns may be lower or higher. The investment return and principal value will fluctuate so that an investor’s shares, when redeemed, may be worth more or less than the original cost. The graph and table do not reflect the deduction of taxes that a shareholder would pay on Fund distributions or the redemption of Fund shares. To obtain performance information current to the most recent month end, please call (888) 678-6034.
As stated in the current prospectus dated September 1, 2016, the Fund’s “Total Annual Fund Operating Expenses” are 0.35%, and the Fund’s “Total Annual Fund Operating Expense After Fee Waiver” are 0.15%, of the Fund’s average daily net assets. These rates may fluctuate and may differ from the actual expenses incurred by the Fund for the period covered in this report. The Adviser has agreed to waive its advisory fee (the “Waiver”) until August 31, 2017. The Waiver may not be terminated at any time prior to that date without the consent of the Board of Trustees of FundVantage Trust (the “Trust”). Additional information pertaining to the Fund’s expense ratio for the year ended April 30, 2017 can be found in the financial highlights.
Before the Fund commenced operations, all of the assets of the Tax-Free Short Intermediate Securities Fund, a series of Pacific Capital Funds (the “Predecessor Fund”), were transferred to the Fund in a tax-free reorganization (the “Reorganization”). Performance presented prior to June 28, 2010 reflects the performance of the Predecessor Fund.
Total returns reflect the waiver of advisory fees. Had these waivers not been in effect, performance quoted would have been lower.
7
PACIFIC CAPITAL FUNDS
Pacific Capital Tax-Free Short Intermediate Securities Fund
Annual Report
Performance Data (Concluded)
April 30, 2017 (Unaudited)
The performance of the Fund is measured against the Barclays Capital Hawaii 3-Year Municipal Bond Index, which is the 2-4 year component of the Barclays Capital Hawaii Municipal Bond Index and is a rules-based, market-value weighted index engineered for the Hawaii tax-exempt bond market. The index has four main sectors: general obligation bonds, revenue bonds, insured bonds, and prerefunded bonds. The index is unmanaged and does not reflect the deduction of fees associated with a mutual fund, such as investment management and fund accounting fees. The Fund’s performance reflects the deduction of fees for these services. Investors cannot invest directly in an index.
The Fund is distributed by Foreside Funds Distributors LLC. The Asset Management Group of Bank of Hawaii is the investment adviser to the Fund and receives a fee for its services.
All mutual fund investing involves risk, including possible loss of principal. The Fund is non-diversified, which means that a portion of the Fund’s assets may be invested in one or few companies or sectors. The Fund could fluctuate in value more than a diversified fund.
8
PACIFIC CAPITAL FUNDS
Fund Expense Disclosure
April 30, 2017
(Unaudited)
As a shareholder of the Fund(s), you incur two types of costs: (1) transaction costs, and (2) ongoing costs, including management fees and other Fund expenses. These examples are intended to help you understand your ongoing costs (in dollars) of investing in the Fund and to compare these costs with the ongoing costs of investing in other mutual funds.
These examples are based on an investment of $1,000 invested at the beginning of the six-month period from November 1, 2016 through April 30, 2017 and held for the entire period.
Actual Expenses
The first line for each Fund in the accompanying table provides information about actual account values and actual expenses. You may use the information in this line, together with the amount you invested, to estimate the expenses that you paid over the period. Simply divide your account value by $1,000 (for example, an $8,600 account value divided by $1,000 = 8.6), then multiply the result by the number in the first line of the table under the heading entitled “Expenses Paid During Period” to estimate the expenses you paid on your account during this period.
Hypothetical Examples for Comparison Purposes
The second line for each Fund in the accompanying table provides information about hypothetical account values and hypothetical expenses based on each Fund’s actual expense ratio and an assumed rate of return of 5% per year before expenses, which is not the Fund’s actual return. The hypothetical account values and expenses may not be used to estimate the actual ending account balance or expenses you paid for the period. You may use this information to compare the ongoing costs of investing in the Fund(s) and other funds. To do so, compare these 5% hypothetical examples with the 5% hypothetical examples that appear in the shareholder reports of other funds.
Please note that the expenses shown in the table are meant to highlight your ongoing costs only and do not reflect any transactional costs. Therefore, the second line of the accompanying table is useful in comparing ongoing costs only, and will not help you determine the relative total costs of owning different funds. In addition, if these transactional costs were included, your costs would have been higher.
9
PACIFIC CAPITAL FUNDS
Fund Expense Disclosure (Concluded)
April 30, 2017
(Unaudited)
| Beginning Account Value November 1, 2016 | Ending Account Value April 30, 2017 | Expenses Paid During Period* | Expense Ratio During Period** | |||||||||||||||||
Pacific Capital Tax-Free Securities Fund | ||||||||||||||||||||
Actual Fund Return | Class Y | $1,000.00 | $ 994.60 | $0.54 | 0.11% | |||||||||||||||
Hypothetical Fund Return (5% return before expenses) | Class Y | 1,000.00 | 1,024.25 | 0.55 | 0.11% | |||||||||||||||
Pacific Capital Tax-Free Short Intermediate Securities Fund | ||||||||||||||||||||
Actual Fund Return | Class Y | $1,000.00 | $1,001.10 | $1.34 | 0.27% | |||||||||||||||
Hypothetical Fund Return (5% return before expenses) | Class Y | 1,000.00 | 1,023.46 | 1.35 | 0.27% | |||||||||||||||
| * | Expense are equal to an annualized expense ratio for the six-month period ended April 30, 2017, multiplied by average account value over the period, multiplied by the number of days in the most recent period (181), then divided by 365 to reflect the period. The Funds’ ending account values on the first line in each table are based on the actual six-month total returns of (0.54)% for the Pacific Capital Tax-Free Securities Fund and 0.11% for the Pacific Capital Tax-Free Short Intermediate Securities Fund. |
| ** | Annualized. |
10
PACIFIC CAPITAL FUNDS
Pacific Capital Tax-Free Securities Fund
Portfolio of Investments
April 30, 2017
| Principal Amount ($) | Value ($) | |||||||
MUNICIPAL BONDS — 98.3% | ||||||||
Alaska — 0.1% | ||||||||
Matanuska-Susitna AK, Prerefunded 09/01/19 at 100, | ||||||||
6.00%, 09/01/28, (AGC Insured) | 380,000 | 422,670 | ||||||
|
| |||||||
Arizona — 2.0% | ||||||||
Phoenix Civic Improvement Corp., Civic Plaza, Convertible CAB, Series B, | ||||||||
5.50%, 07/01/31, (NATL-RE, FGIC Insured) | 5,000,000 | 6,197,650 | ||||||
|
| |||||||
California — 1.5% | ||||||||
California Health Facilities Financing Authority, Series A, | ||||||||
5.00%, 11/01/27 | 950,000 | 1,171,986 | ||||||
Norwalk-La Mirada Unified School District GO, CAB, Series B, | ||||||||
0.00%, 08/01/27, (AGM-CR, FGIC Insured) | 5,000,000 | 3,637,400 | ||||||
|
| |||||||
| 4,809,386 | ||||||||
|
| |||||||
Florida — 0.5% | ||||||||
Orlando Utilities Commission, Water and Electric Revenue, Series D, ETM, | ||||||||
6.75%, 10/01/17 | 640,000 | 655,373 | ||||||
Tampa Bay Water, Series B, Prerefunded, ETM, | ||||||||
5.00%, 10/01/18 | 1,000,000 | 1,055,610 | ||||||
|
| |||||||
| 1,710,983 | ||||||||
|
| |||||||
| Principal Amount ($) | Value ($) | |||||||
MUNICIPAL BONDS — (Continued) |
| |||||||
Georgia — 0.7% | ||||||||
Metropolitan Atlanta Rapid Transit Authority, Series C, Callable 07/01/26 at 100, | ||||||||
5.00%, 07/01/29 | 1,620,000 | 1,951,193 | ||||||
Municipal Electric Authority Power Revenue, Series W, Unrefunded portion, | ||||||||
6.60%, 01/01/18, (NATL-RE, IBC, BNYM Insured) | 260,000 | 269,425 | ||||||
|
| |||||||
| 2,220,618 | ||||||||
|
| |||||||
Guam — 0.6% | ||||||||
Territory Of Guam, Series A, Prerefunded 11/15/19 at 100, | ||||||||
6.75%, 11/15/29 | 1,775,000 | 2,022,950 | ||||||
|
| |||||||
Hawaii — 84.9% | ||||||||
Hawaii County GO, Anticipation Note, Series D, | ||||||||
1.73%, 06/28/17 | 8,000,000 | 7,999,840 | ||||||
Hawaii County GO, Series A, | ||||||||
5.25%, 07/15/17 | 500,000 | 504,400 | ||||||
Hawaii County GO, Series A, Prerefunded 07/15/18 at 100, | ||||||||
6.00%, 07/15/26 | 1,655,000 | 1,754,466 | ||||||
Hawaii County GO, Series A, Prerefunded 03/01/20 at 100, | ||||||||
4.00%, 03/01/28 | 2,470,000 | 2,664,562 | ||||||
Hawaii County GO, Series A, Callable 09/01/22 at 100, | ||||||||
5.00%, 09/01/29 | 500,000 | 576,530 | ||||||
Hawaii County GO, Series D, | ||||||||
5.00%, 09/01/24 | 1,450,000 | 1,754,993 | ||||||
The accompanying notes are an integral part of the financial statements.
11
PACIFIC CAPITAL FUNDS
Pacific Capital Tax-Free Securities Fund
Portfolio of Investments (Continued)
April 30, 2017
| Principal Amount ($) | Value ($) | |||||||
MUNICIPAL BONDS — (Continued) | ||||||||
Hawaii — (Continued) | ||||||||
Hawaii County GO, Series D, Callable 03/01/26 at 100, | ||||||||
5.00%, 09/01/28 | 1,000,000 | 1,202,170 | ||||||
Hawaii County GO, Series E, | ||||||||
5.00%, 09/01/24 | 1,000,000 | 1,210,340 | ||||||
Hawaii Housing Finance & Development Corp., Multi-Family Housing, Iwilei Apartments, Series A, Callable 01/01/31 at 100, | ||||||||
3.75%, 01/01/31 | 3,120,000 | 3,237,062 | ||||||
Hawaii Housing Finance & Development Corp., Series B, Callable 07/01/21 at 100, | ||||||||
3.88%, 07/01/25, (GNMA/FNMA Insured) | 3,705,000 | 3,896,067 | ||||||
Hawaii State Airports System Revenue, AMT, Callable 08/01/23 at 100, | ||||||||
5.00%, 08/01/28 | 400,000 | 445,468 | ||||||
Hawaii State Airports System Revenue, Series A, Callable 07/01/20 at 100, | ||||||||
5.00%, 07/01/22 | 2,700,000 | 3,005,694 | ||||||
Hawaii State Airports System Revenue, Series A, Callable 07/01/20 at 100, | ||||||||
5.25%, 07/01/28 | 1,010,000 | 1,130,806 | ||||||
Hawaii State Airports System Revenue, AMT, Callable 07/01/21 at 100, | ||||||||
5.00%, 07/01/23 | 3,500,000 | 3,881,640 | ||||||
| Principal Amount ($) | Value ($) | |||||||
MUNICIPAL BONDS — (Continued) | ||||||||
Hawaii — (Continued) | ||||||||
Hawaii State Airports System Revenue, Series A, Callable 07/01/20 at 100, | ||||||||
5.25%, 07/01/23 | 1,000,000 | 1,121,269 | ||||||
Hawaii State Airports System Revenue, Series A, Callable 07/01/20 at 100, | ||||||||
5.25%, 07/01/29 | 2,040,000 | 2,283,331 | ||||||
Hawaii State Airports System Revenue, Series A, | ||||||||
5.25%, 07/01/20 | 1,320,000 | 1,480,512 | ||||||
Hawaii State Airports System Revenue, Series A, Callable 07/01/20 at 100, | ||||||||
5.25%, 07/01/21 | 1,000,000 | 1,121,930 | ||||||
Hawaii State Department of Budget & Finance Revenue, Hawaii Pacific Health Obligation, | ||||||||
4.00%, 07/01/23 | 500,000 | 556,150 | ||||||
Hawaii State Department of Budget & Finance Revenue, Hawaii Pacific Health Obligation, Callable 07/01/23 at 100, | ||||||||
5.00%, 07/01/26 | 1,330,000 | 1,513,846 | ||||||
Hawaii State Department of Budget & Finance Revenue, Hawaiian Electric Company Subsidiary, Callable 07/01/19 at 100, | ||||||||
6.50%, 07/01/39 | 600,000 | 650,820 | ||||||
The accompanying notes are an integral part of the financial statements.
12
PACIFIC CAPITAL FUNDS
Pacific Capital Tax-Free Securities Fund
Portfolio of Investments (Continued)
April 30, 2017
| Principal Amount ($) | Value ($) | |||||||
MUNICIPAL BONDS — (Continued) |
| |||||||
Hawaii — (Continued) |
| |||||||
Hawaii State Department of | ||||||||
5.00%, 11/15/27 | 1,390,000 | 1,502,034 | ||||||
Hawaii State Department of | ||||||||
5.13%, 11/15/32 | 550,000 | 589,171 | ||||||
Hawaii State Department of | ||||||||
5.00%, 07/01/35 | 11,000,000 | 12,386,550 | ||||||
Hawaii State Department of | ||||||||
5.00%, 04/01/18 | 775,000 | 802,970 | ||||||
Hawaii State GO, Series DK, | ||||||||
5.00%, 05/01/17 | 4,000,000 | 4,000,000 | ||||||
Hawaii State GO, Series DK, | ||||||||
5.00%, 05/01/23 | 2,390,000 | 2,487,273 | ||||||
Hawaii State GO, Series DK, | ||||||||
5.00%, 05/01/23 | 710,000 | 738,535 | ||||||
Hawaii State GO, Series DK, | ||||||||
5.00%, 05/01/28 | 3,015,000 | 3,136,173 | ||||||
| Principal Amount ($) | Value ($) | |||||||
MUNICIPAL BONDS — (Continued) |
| |||||||
Hawaii — (Continued) |
| |||||||
Hawaii State GO, Series DK, | ||||||||
5.00%, 05/01/23 | 75,000 | 78,052 | ||||||
Hawaii State GO, Series DK, | ||||||||
5.00%, 05/01/28 | 75,000 | 78,052 | ||||||
Hawaii State GO, Series DQ, | ||||||||
5.00%, 06/01/23 | 1,660,000 | 1,794,045 | ||||||
Hawaii State GO, Series DT, | ||||||||
5.00%, 11/01/19 | 3,000,000 | 3,287,880 | ||||||
Hawaii State GO, Series DZ, | ||||||||
5.00%, 12/01/30 | 1,765,000 | 2,042,387 | ||||||
Hawaii State GO, Series DZ, | ||||||||
5.00%, 12/01/22 | 155,000 | 179,360 | ||||||
Hawaii State GO, Series DZ, | ||||||||
5.00%, 12/01/23 | 875,000 | 1,012,515 | ||||||
Hawaii State GO, Series DZ, | ||||||||
5.00%, 12/01/25 | 885,000 | 1,024,087 | ||||||
Hawaii State GO, Series DZ, | ||||||||
5.00%, 12/01/26 | 1,150,000 | 1,330,734 | ||||||
The accompanying notes are an integral part of the financial statements.
13
PACIFIC CAPITAL FUNDS
Pacific Capital Tax-Free Securities Fund
Portfolio of Investments (Continued)
April 30, 2017
| Principal Amount ($) | Value ($) | |||||||
MUNICIPAL BONDS — (Continued) |
| |||||||
Hawaii — (Continued) |
| |||||||
Hawaii State GO, Series DZ, | ||||||||
5.00%, 12/01/27 | 1,620,000 | 1,874,599 | ||||||
Hawaii State GO, Series DZ, | ||||||||
5.00%, 12/01/27 | 1,155,000 | 1,336,520 | ||||||
Hawaii State GO, Series DZ, | ||||||||
5.00%, 12/01/28 | 935,000 | 1,081,945 | ||||||
Hawaii State GO, Series DZ, | ||||||||
5.00%, 12/01/29 | 1,700,000 | 1,967,172 | ||||||
Hawaii State GO, Series DZ, | ||||||||
5.00%, 12/01/31 | 1,730,000 | 2,001,887 | ||||||
Hawaii State GO, Series DZ, | ||||||||
5.00%, 12/01/27 | 1,725,000 | 1,988,649 | ||||||
Hawaii State GO, Series DZ, | ||||||||
5.00%, 12/01/29 | 300,000 | 344,562 | ||||||
Hawaii State GO, Series DZ, | ||||||||
5.00%, 12/01/30 | 1,235,000 | 1,416,088 | ||||||
Hawaii State GO, Series DZ, | ||||||||
5.00%, 12/01/31 | 1,075,000 | 1,231,101 | ||||||
| Principal Amount ($) | Value ($) | |||||||
MUNICIPAL BONDS — (Continued) |
| |||||||
Hawaii — (Continued) |
| |||||||
Hawaii State GO, Series EA, | ||||||||
5.00%, 12/01/19 | 265,000 | 291,193 | ||||||
Hawaii State GO, Series EA, | ||||||||
5.00%, 12/01/21 | 2,000,000 | 2,316,240 | ||||||
Hawaii State GO, Series EE, | ||||||||
4.00%, 11/01/17 | 450,000 | 457,002 | ||||||
Hawaii State GO, Series EE, | ||||||||
5.00%, 11/01/24 | 1,605,000 | 1,897,431 | ||||||
Hawaii State GO, Series EE, | ||||||||
5.00%, 11/01/26 | 1,450,000 | 1,714,190 | ||||||
Hawaii State GO, Series EE, | ||||||||
5.00%, 11/01/27 | 740,000 | 874,828 | ||||||
Hawaii State GO, Series EE, | ||||||||
5.00%, 11/01/28 | 740,000 | 874,828 | ||||||
Hawaii State GO, Series EE, | ||||||||
5.00%, 11/01/24 | 155,000 | 183,151 | ||||||
Hawaii State GO, Series EE, | ||||||||
5.00%, 11/01/26 | 1,450,000 | 1,705,824 | ||||||
Hawaii State GO, Series EE, | ||||||||
5.00%, 11/01/27 | 435,000 | 510,746 | ||||||
The accompanying notes are an integral part of the financial statements.
14
PACIFIC CAPITAL FUNDS
Pacific Capital Tax-Free Securities Fund
Portfolio of Investments (Continued)
April 30, 2017
| Principal Amount ($) | Value ($) | |||||||
MUNICIPAL BONDS — (Continued) |
| |||||||
Hawaii — (Continued) |
| |||||||
Hawaii State GO, Series EE, | ||||||||
5.00%, 11/01/28 | 360,000 | 421,038 | ||||||
Hawaii State GO, Series EH, | ||||||||
5.00%, 08/01/23 | 455,000 | 543,588 | ||||||
Hawaii State GO, Series EH, | ||||||||
5.00%, 08/01/24 | 1,000,000 | 1,185,580 | ||||||
Hawaii State GO, Series EH, ETM, | ||||||||
5.00%, 08/01/23 | 445,000 | 533,973 | ||||||
Hawaii State GO, Series EL, | ||||||||
5.00%, 08/01/23 | 1,000,000 | 1,194,700 | ||||||
Hawaii State GO, Series EO, | ||||||||
5.00%, 08/01/32 | 1,285,000 | 1,488,313 | ||||||
Hawaii State GO, Series EO, | ||||||||
5.00%, 08/01/26 | 140,000 | 170,509 | ||||||
Hawaii State GO, Series EO, | ||||||||
5.00%, 08/01/26 | 1,560,000 | 1,855,589 | ||||||
Hawaii State GO, Series EP, | ||||||||
5.00%, 08/01/24 | 1,000,000 | 1,210,360 | ||||||
Hawaii State GO, Series ET, | ||||||||
4.00%, 10/01/22 | 1,060,000 | 1,194,281 | ||||||
Hawaii State GO, Series EW, | ||||||||
5.00%, 10/01/18 | 2,000,000 | 2,113,260 | ||||||
Hawaii State GO, Series EY, | ||||||||
5.00%, 10/01/27 | 2,980,000 | 3,592,062 | ||||||
Hawaii State GO, Series EZ, | ||||||||
5.00%, 10/01/21 | 4,000,000 | 4,615,720 | ||||||
Hawaii State GO, Series FB, | ||||||||
5.00%, 04/01/25 | 5,000,000 | 6,067,950 | ||||||
| Principal Amount ($) | Value ($) | |||||||
MUNICIPAL BONDS — (Continued) |
| |||||||
Hawaii — (Continued) |
| |||||||
Hawaii State GO, Series FB, | ||||||||
4.00%, 04/01/29 | 4,000,000 | 4,389,400 | ||||||
Hawaii State GO, Series FG, | ||||||||
5.00%, 10/01/30 | 10,000,000 | 11,955,000 | ||||||
Hawaii State Harbor System | ||||||||
5.00%, 07/01/17 | 185,000 | 186,195 | ||||||
Hawaii State Harbor System | ||||||||
4.75%, 07/01/24 | 220,000 | 239,921 | ||||||
Hawaii State Harbor System | ||||||||
5.63%, 07/01/40 | 3,000,000 | 3,348,060 | ||||||
Hawaii State Highway | ||||||||
4.00%, 01/01/19 | 380,000 | 398,795 | ||||||
Hawaii State Highway | ||||||||
5.00%, 01/01/21 | 1,250,000 | 1,416,250 | ||||||
Hawaii State Highway | ||||||||
5.00%, 01/01/27 | 5,490,000 | 6,365,216 | ||||||
Hawaii State Highway | ||||||||
5.00%, 01/01/28 | 1,120,000 | 1,298,550 | ||||||
Hawaii State Highway | ||||||||
5.00%, 01/01/28 | 875,000 | 1,067,509 | ||||||
The accompanying notes are an integral part of the financial statements.
15
PACIFIC CAPITAL FUNDS
Pacific Capital Tax-Free Securities Fund
Portfolio of Investments (Continued)
April 30, 2017
| Principal Amount ($) | Value ($) | |||||||
MUNICIPAL BONDS — (Continued) |
| |||||||
Hawaii — (Continued) | ||||||||
Hawaii State Highway Revenue, Series B, Callable 07/01/26 at 100, | ||||||||
5.00%, 01/01/29 | 5,000,000 | 6,054,100 | ||||||
Honolulu City & County | ||||||||
5.00%, 07/01/24 | 500,000 | 603,680 | ||||||
Honolulu City & County | ||||||||
5.00%, 07/01/27 | 300,000 | 358,215 | ||||||
Honolulu City & County | ||||||||
5.00%, 07/01/26 | 3,125,000 | 3,624,031 | ||||||
Honolulu City & County | ||||||||
5.00%, 07/01/25 | 1,500,000 | 1,822,230 | ||||||
Honolulu City & County GO, | ||||||||
5.00%, 11/01/18 | 1,015,000 | 1,075,697 | ||||||
Honolulu City & County GO, | ||||||||
5.00%, 07/01/21, (AGM Insured) | 4,000,000 | 4,026,600 | ||||||
| Principal Amount ($) | Value ($) | |||||||
MUNICIPAL BONDS — (Continued) |
| |||||||
Hawaii — (Continued) | ||||||||
Honolulu City & County GO, Series A, | ||||||||
5.00%, 11/01/22 | 2,000,000 | 2,360,920 | ||||||
Honolulu City & County GO, | ||||||||
5.00%, 04/01/24 | 1,110,000 | 1,192,950 | ||||||
Honolulu City & County GO, Series A, Callable | ||||||||
5.00%, 11/01/25 | 4,855,000 | 5,680,933 | ||||||
Honolulu City & County GO, | ||||||||
5.00%, 11/01/26 | 3,365,000 | 3,931,666 | ||||||
Honolulu City & County GO, | ||||||||
5.00%, 10/01/31 | 2,175,000 | 2,579,680 | ||||||
Honolulu City & County GO, | ||||||||
5.00%, 11/01/31 | 450,000 | 520,420 | ||||||
Honolulu City & County GO, | ||||||||
5.00%, 11/01/32 | 1,970,000 | 2,274,956 | ||||||
Honolulu City & County GO, | ||||||||
5.00%, 10/01/35 | 3,000,000 | 3,476,880 | ||||||
Honolulu City & County GO, | ||||||||
5.00%, 10/01/37 | 400,000 | 460,996 | ||||||
The accompanying notes are an integral part of the financial statements.
16
PACIFIC CAPITAL FUNDS
Pacific Capital Tax-Free Securities Fund
Portfolio of Investments (Continued)
April 30, 2017
| Principal Amount ($) | Value ($) | |||||||
MUNICIPAL BONDS — (Continued) |
| |||||||
Hawaii — (Continued) | ||||||||
Honolulu City & County GO, Series A, Callable 10/01/25 at 100, | ||||||||
5.00%, 10/01/38 | 225,000 | 258,228 | ||||||
Honolulu City & County GO, Series A, Callable 10/01/25 at 100, | ||||||||
5.00%, 10/01/39 | 1,000,000 | 1,146,080 | ||||||
Honolulu City & County GO, Series A, Prerefunded, ETM, | ||||||||
5.00%, 04/01/18 | 4,790,000 | 4,965,074 | ||||||
Honolulu City & County GO, Series A, Refunding, | ||||||||
5.00%, 04/01/18 | 210,000 | 217,852 | ||||||
Honolulu City & County GO, Series A, Refunding, | ||||||||
5.00%, 10/01/19 | 1,000,000 | 1,093,040 | ||||||
Honolulu City & County GO, Series A, Refunding, Callable 11/01/22 at 100, | ||||||||
4.00%, 11/01/37 | 1,000,000 | 1,041,550 | ||||||
Honolulu City & County GO, Series B, Callable 11/01/22 at 100, | ||||||||
5.00%, 11/01/23 | 2,050,000 | 2,396,409 | ||||||
Honolulu City & County GO, Series B, Callable 12/01/20 at 100, | ||||||||
5.00%, 12/01/25 | 2,280,000 | 2,572,250 | ||||||
Honolulu City & County GO, Series B, Refunding, | ||||||||
5.00%, 10/01/18 | 1,000,000 | 1,056,630 | ||||||
Honolulu City & County GO, Series B, Refunding, | ||||||||
5.00%, 12/01/18 | 1,000,000 | 1,062,940 | ||||||
| Principal Amount ($) | Value ($) | |||||||
MUNICIPAL BONDS — (Continued) |
| |||||||
Hawaii — (Continued) | ||||||||
Honolulu City & County GO, Series B, Refunding, | ||||||||
5.00%, 08/01/19 | 1,220,000 | 1,326,604 | ||||||
Honolulu City & County GO, Series B, Refunding, | ||||||||
5.00%, 10/01/22 | 1,000,000 | 1,178,960 | ||||||
Honolulu City & County GO, Series B, Refunding, | ||||||||
5.00%, 10/01/25 | 2,300,000 | 2,815,752 | ||||||
Honolulu City & County GO, Series C, Refunding, Callable 10/01/25 at 100, | ||||||||
5.00%, 10/01/27 | 2,000,000 | 2,429,540 | ||||||
Honolulu City & County GO, Series C, Refunding, Callable 10/01/25 at 100, | ||||||||
5.00%, 10/01/29 | 3,500,000 | 4,192,230 | ||||||
Honolulu City & County GO, Series D, Prerefunded 09/01/19 at 100, | ||||||||
4.00%, 09/01/21 | 250,000 | 266,615 | ||||||
Honolulu City & County Waste Water System Revenue, 1st Bond Resolution, Series A, Prerefunded 07/01/17 at 100, | ||||||||
5.00%, 07/01/31, (NATL-RE Insured) | 3,500,000 | 3,523,275 | ||||||
Honolulu City & County Waste Water System Revenue, Junior Series A, Refunding, Callable 07/01/25 at 100, | ||||||||
5.00%, 07/01/30 | 4,000,000 | 4,644,240 | ||||||
The accompanying notes are an integral part of the financial statements.
17
PACIFIC CAPITAL FUNDS
Pacific Capital Tax-Free Securities Fund
Portfolio of Investments (Continued)
April 30, 2017
| Principal Amount ($) | Value ($) | |||||||
MUNICIPAL BONDS — (Continued) |
| |||||||
Hawaii — (Continued) | ||||||||
Honolulu City & County Waste Water System Revenue, Senior 1st Bond Resolution, Refunding, | ||||||||
5.00%, 07/01/20 | 250,000 | 279,708 | ||||||
Honolulu City & County Waste Water System Revenue, Senior 1st Bond Resolution, Refunding, Callable 07/01/25 at 100, | ||||||||
5.00%, 07/01/26 | 3,000,000 | 3,641,790 | ||||||
Honolulu City & County Waste Water System Revenue, Senior 1st Bond Resolution, Refunding, Callable 07/01/25 at 100, | ||||||||
5.00%, 07/01/27 | 2,000,000 | 2,411,220 | ||||||
Honolulu City & County Waste Water System Revenue, Senior 1st Bond Resolution, Series A, Callable 07/01/25 at 100, | ||||||||
5.00%, 07/01/29 | 100,000 | 118,918 | ||||||
Honolulu City & County Waste Water System Revenue, Senior 1st Bond Resolution, Series B, Refunding, | ||||||||
4.00%, 07/01/21 | 1,545,000 | 1,712,756 | ||||||
Honolulu City & County Waste Water System Revenue, Senior, Series B, Refunding, Callable 07/01/26 at 100, | ||||||||
5.00%, 07/01/35 | 125,000 | 144,891 | ||||||
| Principal Amount ($) | Value ($) | |||||||
MUNICIPAL BONDS — (Continued) |
| |||||||
Hawaii — (Continued) | ||||||||
Kauai County GO, Series A, Callable 08/01/21 at 100, | ||||||||
3.25%, 08/01/23 | 1,000,000 | 1,052,690 | ||||||
Kauai County GO, Series A, Refunding, | ||||||||
5.00%, 08/01/19 | 260,000 | 282,355 | ||||||
Kauai County GO, Series A, Refunding, | ||||||||
5.00%, 08/01/22 | 315,000 | 368,837 | ||||||
Kauai County GO, Series A, Callable 08/01/22 at 100, | ||||||||
3.13%, 08/01/27 | 1,295,000 | 1,339,678 | ||||||
Maui County GO, Refunding, | ||||||||
5.00%, 06/01/20 | 3,075,000 | 3,428,994 | ||||||
Maui County GO, Refunding, | ||||||||
5.00%, 06/01/21 | 1,500,000 | 1,718,430 | ||||||
Maui County GO, Refunding, | ||||||||
5.00%, 06/01/23 | 300,000 | 357,315 | ||||||
Maui County GO, Series A, Prerefunded 07/01/17 at 100, | ||||||||
5.00%, 07/01/19 | 1,000,000 | 1,006,650 | ||||||
University of Hawaii Revenue, Series A, Callable 10/01/19 at 100, | ||||||||
5.25%, 10/01/34 | 1,000,000 | 1,092,700 | ||||||
University of Hawaii Revenue, Series A-2, | ||||||||
4.00%, 10/01/19 | 1,170,000 | 1,251,666 | ||||||
University of Hawaii Revenue, Series B, Refunding, | ||||||||
4.00%, 10/01/24 | 665,000 | 762,589 | ||||||
The accompanying notes are an integral part of the financial statements.
18
PACIFIC CAPITAL FUNDS
Pacific Capital Tax-Free Securities Fund
Portfolio of Investments (Continued)
April 30, 2017
| Principal Amount ($) | Value ($) | |||||||
MUNICIPAL BONDS — (Continued) |
| |||||||
Hawaii — (Continued) | ||||||||
University of Hawaii Revenue, Series B, Refunding, Callable 10/01/25 at 100, | ||||||||
5.00%, 10/01/35 | 1,000,000 | 1,152,490 | ||||||
University of Hawaii Revenue, Series B-2, | ||||||||
5.00%, 10/01/18 | 1,310,000 | 1,383,989 | ||||||
University of Hawaii Revenue, Series E, Refunding, | ||||||||
5.00%, 10/01/24 | 4,600,000 | 5,592,036 | ||||||
University of Hawaii Revenue, Series E, Refunding, Callable 10/01/26 at 100, | ||||||||
5.00%, 10/01/29 | 1,000,000 | 1,204,750 | ||||||
University of Hawaii Revenue, Series E, Refunding, Callable 10/01/26 at 100, | ||||||||
5.00%, 11/01/31 | 1,000,000 | 1,188,170 | ||||||
|
| |||||||
| 267,105,334 | ||||||||
|
| |||||||
Illinois — 1.3% | ||||||||
Illinois Municipal Electric Agency Power Supply Revenue, Series C, | ||||||||
5.25%, 02/01/21, (NATL-RE, FGIC Insured) . | 3,665,000 | 4,156,366 | ||||||
|
| |||||||
Maine — 0.4% | ||||||||
Maine State GO, Series B, | ||||||||
5.00%, 06/01/24 | 1,000,000 | 1,213,970 | ||||||
|
| |||||||
Maryland — 0.8% | ||||||||
Maryland State GO, Series B, Callable 08/01/22 at 100, | ||||||||
5.00%, 08/01/23 | 2,000,000 | 2,347,320 | ||||||
|
| |||||||
| Principal Amount ($) | Value ($) | |||||||
MUNICIPAL BONDS — (Continued) |
| |||||||
Massachusetts — 0.9% | ||||||||
Massachusetts State Department of Transportation, Metropolitan Highway System Revenue, Contract Assistance, Series B, Callable 01/01/20 at 100, | ||||||||
5.00%, 01/01/23 | 2,500,000 | 2,743,200 | ||||||
|
| |||||||
New Jersey — 0.1% | ||||||||
Passaic Valley Sewage Commissioner System Revenue Refunding, Series G, | ||||||||
5.75%, 12/01/21 | 300,000 | 352,131 | ||||||
|
| |||||||
Ohio — 0.8% | ||||||||
Ohio Water Development Authority Water Pollution Control Loan Fund, Revenue, Series B, | ||||||||
5.00%, 12/01/22 | 2,000,000 | 2,362,620 | ||||||
|
| |||||||
Texas — 3.7% | ||||||||
Austin Independent School District, Series B, Refunding, | ||||||||
5.00%, 08/01/25, (PSF-GTD Insured) | 2,500,000 | 3,046,125 | ||||||
Galveston County GO, CAB, Series RD, | ||||||||
0.00%, 02/01/24, (NATL-RE Insured) | 2,630,000 | 2,272,215 | ||||||
Houston Water and Sewer System Revenue, Unrefunded Balance CAB, Junior Series A, | ||||||||
0.00%, 12/01/27, (AGM Insured) | 2,000,000 | 1,435,480 | ||||||
The accompanying notes are an integral part of the financial statements.
19
PACIFIC CAPITAL FUNDS
Pacific Capital Tax-Free Securities Fund
Portfolio of Investments (Concluded)
April 30, 2017
| Principal Amount ($) | Value ($) | |||||||
MUNICIPAL BONDS — (Continued) |
| |||||||
Texas — (Continued) | ||||||||
Lewisville Independent School District, GO, Series B, Refunding, | ||||||||
5.00%, 08/15/25 | 3,000,000 | 3,645,480 | ||||||
Texas State Transportation Commission Mobility Fund GO, Callable 04/01/24 at 100, | ||||||||
5.00%, 10/01/27 | 1,000,000 | 1,184,930 | ||||||
|
| |||||||
| 11,584,230 | ||||||||
|
| |||||||
TOTAL MUNICIPAL BONDS | 309,249,428 | |||||||
|
| |||||||
| Shares | ||||||||
REGISTERED INVESTMENT COMPANY — 1.3% |
| |||||||
Dreyfus Government Cash Management Fund, Institutional Shares, 0.69%(a) | 4,230,880 | 4,230,880 | ||||||
|
| |||||||
TOTAL REGISTERED INVESTMENT COMPANY | 4,230,880 | |||||||
|
| |||||||
| Value ($) | ||||
TOTAL INVESTMENTS - 99.6% | 313,480,308 | |||
OTHER ASSETS IN EXCESS OF LIABILITIES - 0.4% | 1,252,590 | |||
|
| |||
NET ASSETS - 100.0% | $ | 314,732,898 | ||
|
| |||
| (a) | Rate periodically changes. Rate disclosed is the daily yield on April 30, 2017. |
Portfolio holdings are subject to change at any time.
AGC | Assured Guaranty Corp. | |
AGM | Assured Guaranty Municipal Corp. | |
AGM-CR | Assured Guaranty Municipal Corp. | |
Custodial Receipts | ||
AMT | Subject to Alternative Minimum Tax | |
BNYM | Bank of New York Mellon | |
CAB | Capital Appreciation Bond | |
ETM | Escrowed to Maturity | |
FGIC | Financial Guaranty Insurance Co. | |
FNMA | Federal National Mortgage Association | |
GNMA | Government National Mortgage | |
Association | ||
GO | General Obligation | |
IBC | Insurance Bond Certificate | |
NATL-RE | National Reinsurance Corp. | |
PSF-GTD | Permanent School Fund Guaranteed |
The accompanying notes are an integral part of the financial statements.
20
PACIFIC CAPITAL FUNDS
Pacific Capital Tax-Free Short Intermediate Securities Fund
Portfolio of Investments
April 30, 2017
| Principal Amount ($) | Value ($) | |||||||
MUNICIPAL BONDS — 97.3% |
| |||||||
Alaska — 0.8% | ||||||||
Alaska State GO, | ||||||||
5.00%, 08/01/18 | 500,000 | 524,795 | ||||||
|
| |||||||
Colorado — 0.8% | ||||||||
Boulder County Sales and | ||||||||
5.00%, 12/15/18, (MAC Insured) | 500,000 | 532,240 | ||||||
|
| |||||||
Florida — 1.0% | ||||||||
JEA Electric System | ||||||||
5.00%, 10/01/18 | 650,000 | 686,146 | ||||||
|
| |||||||
Georgia — 1.5% | ||||||||
Georgia State GO, Series I, | ||||||||
5.00%, 11/01/17 | 1,000,000 | 1,020,530 | ||||||
|
| |||||||
Hawaii — 85.8% | ||||||||
Hawaii County GO, | ||||||||
1.73%, 06/28/17 | 2,000,000 | 1,999,960 | ||||||
Hawaii County GO, Refunding, | ||||||||
4.00%, 09/01/19 | 1,185,000 | 1,264,028 | ||||||
Hawaii County GO, Series A, Callable 07/15/18 at 100, | ||||||||
5.00%, 07/15/21 | 120,000 | 125,784 | ||||||
Hawaii State Airports | ||||||||
5.00%, 08/01/27 | 260,000 | 291,600 | ||||||
| Principal Amount ($) | Value ($) | |||||||
MUNICIPAL BONDS — (Continued) |
| |||||||
Hawaii — (Continued) | ||||||||
Hawaii State Airports | ||||||||
5.00%, 07/01/19 | 135,000 | 145,368 | ||||||
Hawaii State Airports | ||||||||
5.00%, 07/01/21 | 2,000,000 | 2,259,720 | ||||||
Hawaii State Airports | ||||||||
4.13%, 07/01/24 | 500,000 | 535,590 | ||||||
Hawaii State Department | ||||||||
5.00%, 07/01/17 | 680,000 | 684,400 | ||||||
Hawaii State Department | ||||||||
5.00%, 07/01/18 | 830,000 | 867,524 | ||||||
Hawaii State Department | ||||||||
5.00%, 07/01/22 | 120,000 | 138,203 | ||||||
Hawaii State Department | ||||||||
3.00%, 07/01/17 | 2,000,000 | 2,006,540 | ||||||
Hawaii State Department | ||||||||
4.00%, 07/01/18 | 630,000 | 651,237 | ||||||
The accompanying notes are an integral part of the financial statements.
21
PACIFIC CAPITAL FUNDS
Pacific Capital Tax-Free Short Intermediate Securities Fund
Portfolio of Investments (Continued)
April 30, 2017
| Principal Amount ($) | Value ($) | |||||||
MUNICIPAL BONDS — (Continued) |
| |||||||
Hawaii — (Continued) | ||||||||
Hawaii State Department | ||||||||
4.00%, 07/01/19 | 400,000 | 422,144 | ||||||
Hawaii State Department | ||||||||
5.00%, 07/01/22 | 40,000 | 46,388 | ||||||
Hawaii State Department of Budget & Finance, Series B, Pacific Health Obligation, | ||||||||
3.00%, 07/01/19 | 55,000 | 56,700 | ||||||
Hawaii State Department | ||||||||
5.13%, 04/01/21 | 20,000 | 21,408 | ||||||
Hawaii State GO, | ||||||||
5.13%, 08/01/24 | 275,000 | 289,130 | ||||||
Hawaii State GO, | ||||||||
5.00%, 06/01/24 | 185,000 | 199,939 | ||||||
Hawaii State GO, Refunding, | ||||||||
5.00%, 12/01/18 | 500,000 | 531,470 | ||||||
Hawaii State GO, | ||||||||
5.00%, 11/01/24 | 960,000 | 1,134,355 | ||||||
| Principal Amount ($) | Value ($) | |||||||
MUNICIPAL BONDS — (Continued) |
| |||||||
Hawaii — (Continued) | ||||||||
Hawaii State GO, | ||||||||
3.00%, 10/01/20 | 1,000,000 | 1,058,940 | ||||||
Hawaii State GO, | ||||||||
5.00%, 11/01/24 | 70,000 | 82,713 | ||||||
Hawaii State GO, | ||||||||
5.00%, 11/01/17 | 200,000 | 204,096 | ||||||
Hawaii State GO, | ||||||||
5.00%, 11/01/19 | 150,000 | 164,394 | ||||||
Hawaii State GO, | ||||||||
4.00%, 12/01/20 | 1,000,000 | 1,095,920 | ||||||
Hawaii State GO, | ||||||||
5.00%, 12/01/23 | 1,025,000 | 1,183,619 | ||||||
Hawaii State GO, | ||||||||
5.00%, 11/01/17 | 750,000 | 765,360 | ||||||
Hawaii State GO, | ||||||||
3.00%, 08/01/17 | 1,000,000 | 1,005,300 | ||||||
Hawaii State GO, | ||||||||
5.00%, 08/01/19 | 500,000 | 543,690 | ||||||
Hawaii State GO, | ||||||||
5.00%, 08/01/20 | 500,000 | 560,105 | ||||||
Hawaii State GO, | ||||||||
5.00%, 08/01/22 | 1,000,000 | 1,174,210 | ||||||
The accompanying notes are an integral part of the financial statements.
22
PACIFIC CAPITAL FUNDS
Pacific Capital Tax-Free Short Intermediate Securities Fund
Portfolio of Investments (Continued)
April 30, 2017
| Principal Amount ($) | Value ($) | |||||||
MUNICIPAL BONDS — (Continued) |
| |||||||
Hawaii — (Continued) | ||||||||
Hawaii State GO, | ||||||||
5.00%, 05/01/23 | 165,000 | 171,716 | ||||||
Hawaii State GO, | ||||||||
5.00%, 05/01/27 | 20,000 | 20,804 | ||||||
Hawaii State GO, | ||||||||
5.00%, 08/01/20 | 175,000 | 183,722 | ||||||
Hawaii State GO, | ||||||||
5.00%, 08/01/21 | 95,000 | 99,735 | ||||||
Hawaii State GO, | ||||||||
5.00%, 08/01/22 | 105,000 | 110,233 | ||||||
Hawaii State GO, | ||||||||
5.25%, 08/01/25 | 130,000 | 136,881 | ||||||
Hawaii State GO, Series DQ, | ||||||||
5.00%, 06/01/17 | 395,000 | 396,280 | ||||||
Hawaii State GO, Series DQ, ETM, | ||||||||
5.00%, 06/01/18 | 90,000 | 93,909 | ||||||
Hawaii State GO, | ||||||||
5.00%, 06/01/20 | 145,000 | 156,709 | ||||||
| Principal Amount ($) | Value ($) | |||||||
MUNICIPAL BONDS — (Continued) |
| |||||||
Hawaii — (Continued) | ||||||||
Hawaii State GO, | ||||||||
5.00%, 12/01/30 | 735,000 | 850,513 | ||||||
Hawaii State GO, | ||||||||
5.00%, 12/01/22 | 190,000 | 219,860 | ||||||
Hawaii State GO, | ||||||||
5.00%, 12/01/23 | 190,000 | 219,860 | ||||||
Hawaii State GO, Series DZ, Prerefunded, ETM, | ||||||||
5.00%, 12/01/19 | 130,000 | 142,745 | ||||||
Hawaii State GO, Series EE, ETM, | ||||||||
4.00%, 11/01/22 | 1,290,000 | 1,453,675 | ||||||
Hawaii State GO, Series EE, Prerefunded, Callable 11/01/22 at 100, | ||||||||
5.00%, 11/01/24 | 430,000 | 508,346 | ||||||
Hawaii State GO, Series EH, Callable 08/01/23 at 100, | ||||||||
5.00%, 08/01/24 | 1,000,000 | 1,185,580 | ||||||
Hawaii State GO, Series FG, | ||||||||
5.00%, 10/01/22 | 310,000 | 365,301 | ||||||
Hawaii State Harbor System | ||||||||
4.50%, 07/01/22 | 35,000 | 37,935 | ||||||
The accompanying notes are an integral part of the financial statements.
23
PACIFIC CAPITAL FUNDS
Pacific Capital Tax-Free Short Intermediate Securities Fund
Portfolio of Investments (Continued)
April 30, 2017
| Principal Amount ($) | Value ($) | |||||||
MUNICIPAL BONDS — (Continued) |
| |||||||
Hawaii — (Continued) | ||||||||
Hawaii State Harbor System | ||||||||
5.00%, 07/01/24 | 10,000 | 11,018 | ||||||
Hawaii State Highway | ||||||||
5.50%, 01/01/25 | 140,000 | 150,326 | ||||||
Hawaii State Highway | ||||||||
4.00%, 01/01/18 | 750,000 | 765,532 | ||||||
Hawaii State Highway | ||||||||
4.00%, 01/01/18 | 995,000 | 1,015,606 | ||||||
Hawaii State Highway | ||||||||
5.00%, 01/01/20 | 545,000 | 600,584 | ||||||
Hawaii State Highway | ||||||||
5.00%, 01/01/21 | 1,000,000 | 1,133,000 | ||||||
Hawaii State Highway | ||||||||
4.00%, 01/01/21 | 1,000,000 | 1,097,340 | ||||||
Hawaii State Highway | ||||||||
5.25%, 07/01/18, (AGM Insured) | 500,000 | 524,940 | ||||||
Hawaii State Housing | ||||||||
3.00%, 04/01/18 | 115,000 | 116,870 | ||||||
| Principal Amount ($) | Value ($) | |||||||
MUNICIPAL BONDS — (Continued) |
| |||||||
Hawaii — (Continued) | ||||||||
Hawaii State Housing | ||||||||
2.35%, 07/01/17, (GNMA/FNMA/FHLMC Insured) | 525,000 | 525,914 | ||||||
Hawaii State Housing | ||||||||
2.70%, 07/01/18, (GNMA/FNMA/FHLMC Insured) | 535,000 | 542,544 | ||||||
Hawaii State Housing | ||||||||
2.95%, 07/01/19, (GNMA/FNMA/FHLMC Insured) | 35,000 | 36,105 | ||||||
Honolulu City & County GO, | ||||||||
5.00%, 08/01/26 | 700,000 | 804,104 | ||||||
Honolulu City & County | ||||||||
3.00%, 07/01/17 | 300,000 | 301,044 | ||||||
Honolulu City & County Board of Water Supply System Revenue, | ||||||||
5.00%, 07/01/20 | 320,000 | 357,075 | ||||||
The accompanying notes are an integral part of the financial statements.
24
PACIFIC CAPITAL FUNDS
Pacific Capital Tax-Free Short Intermediate Securities Fund
Portfolio of Investments (Continued)
April 30, 2017
| Principal Amount ($) | Value ($) | |||||||
MUNICIPAL BONDS — (Continued) |
| |||||||
Hawaii — (Continued) | ||||||||
Honolulu City & County Board of Water Supply System Revenue, Refunding, Series A, | ||||||||
5.00%, 07/01/22 | 650,000 | 759,044 | ||||||
Honolulu City & County Board of Water Supply System Revenue, Refunding, Series A, | ||||||||
5.00%, 07/01/23 | 515,000 | 612,675 | ||||||
Honolulu City & County Board of Water Supply System Revenue, Refunding, Series A, | ||||||||
3.00%, 07/01/24 | 350,000 | 375,900 | ||||||
Honolulu City & County Board of Water Supply System Revenue, Refunding, Series A, Callable 07/01/24 at 100, | ||||||||
5.00%, 07/01/26 | 15,000 | 18,066 | ||||||
Honolulu City & County GO, | ||||||||
5.00%, 10/01/18 | 1,000,000 | 1,056,630 | ||||||
Honolulu City & County GO, | ||||||||
5.00%, 11/01/18 | 1,500,000 | 1,589,700 | ||||||
Honolulu City & County GO, | ||||||||
3.00%, 11/01/18 | 800,000 | 824,160 | ||||||
Honolulu City & County GO, | ||||||||
3.00%, 10/01/19 | 1,000,000 | 1,045,570 | ||||||
| Principal Amount ($) | Value ($) | |||||||
MUNICIPAL BONDS — (Continued) |
| |||||||
Hawaii — (Continued) | ||||||||
Honolulu City & County GO, Series A, Callable 04/01/19 at 100, | ||||||||
5.00%, 04/01/20 | 90,000 | 96,726 | ||||||
Honolulu City & County GO, Series A, Callable 04/01/19 at 100, | ||||||||
5.00%, 04/01/26 | 60,000 | 64,484 | ||||||
Honolulu City & County GO, Series A, Callable 08/01/21 at 100, | ||||||||
4.00%, 08/01/29 | 20,000 | 22,153 | ||||||
Honolulu City & County GO, Series A, Prerefunded, ETM, | ||||||||
5.00%, 04/01/18 | 175,000 | 181,396 | ||||||
Honolulu City & County GO, Series A, Prerefunded, ETM, | ||||||||
4.00%, 08/01/18 | 35,000 | 36,290 | ||||||
Honolulu City & County GO, Series A, Unrefunded, | ||||||||
5.00%, 04/01/18 | 25,000 | 25,935 | ||||||
Honolulu City & County GO, | ||||||||
5.00%, 11/01/20 | 535,000 | 603,977 | ||||||
Honolulu City & County GO, Series D, Callable 09/01/19 at 100, | ||||||||
5.25%, 09/01/23 | 1,000,000 | 1,095,100 | ||||||
Honolulu City & County GO, Series D, Callable 09/01/19 at 100, | ||||||||
5.25%, 09/01/27 | 150,000 | 164,265 | ||||||
The accompanying notes are an integral part of the financial statements.
25
PACIFIC CAPITAL FUNDS
Pacific Capital Tax-Free Short Intermediate Securities Fund
Portfolio of Investments (Continued)
April 30, 2017
| Principal Amount ($) | Value ($) | |||||||
MUNICIPAL BONDS — (Continued) |
| |||||||
Hawaii — (Continued) | ||||||||
Honolulu City & County Wastewater System Revenue, 1st Bond Resolution, Refunding, Senior Series A, | ||||||||
5.00%, 07/01/19 | 1,000,000 | 1,084,840 | ||||||
Honolulu City & County Wastewater System Revenue, 1st Bond Resolution, Refunding, Senior Series A, | ||||||||
5.00%, 07/01/20 | 1,000,000 | 1,118,830 | ||||||
Honolulu City & County Wastewater System Revenue, 1st Bond Resolution, Refunding, Senior Series A, | ||||||||
5.00%, 07/01/21 | 1,000,000 | 1,148,940 | ||||||
Honolulu City & County Wastewater System Revenue, 1st Bond Resolution, Refunding, Senior Series B, | ||||||||
4.00%, 07/01/19 | 700,000 | 744,471 | ||||||
Honolulu City & County Wastewater System Revenue, 1st Bond Resolution, Refunding, Series B, | ||||||||
4.25%, 07/01/17, (NATL-RE Insured) | 150,000 | 150,822 | ||||||
| Principal Amount ($) | Value ($) | |||||||
MUNICIPAL BONDS — (Continued) |
| |||||||
Hawaii — (Continued) | ||||||||
Honolulu City & County Wastewater System Revenue, 1st Bond Resolution, Senior Series A, | ||||||||
3.00%, 07/01/18 | 90,000 | 92,136 | ||||||
Honolulu City & County Wastewater System Revenue, 1st Bond Resolution, Senior Series A, Callable 07/01/2022 at 100, | ||||||||
5.00%, 07/01/23 | 500,000 | 587,405 | ||||||
Honolulu City & County Wastewater System Revenue, 2nd Bond Resolution, Refunding, Series A, Callable 07/01/18 at 100, | ||||||||
5.00%, 07/01/20, (AGM Insured) | 125,000 | 130,830 | ||||||
Honolulu City & County Wastewater System Revenue, Refunding, Junior Series A, | ||||||||
5.00%, 07/01/19 | 815,000 | 883,052 | ||||||
Honolulu City & County Wastewater System Revenue, Refunding, Senior 1st Bond Resolution, Series B, | ||||||||
5.00%, 07/01/20 | 500,000 | 559,415 | ||||||
The accompanying notes are an integral part of the financial statements.
26
PACIFIC CAPITAL FUNDS
Pacific Capital Tax-Free Short Intermediate Securities Fund
Portfolio of Investments (Continued)
April 30, 2017
| Principal Amount ($) | Value ($) | |||||||
MUNICIPAL BONDS — (Continued) |
| |||||||
Hawaii — (Continued) | ||||||||
Honolulu City & County Wastewater System Revenue, Refunding, Senior 1st Bond Resolution, Series B, | ||||||||
4.00%, 07/01/21 | 500,000 | 554,290 | ||||||
Honolulu City & County Wastewater System Revenue, Refunding, Senior Series B, | ||||||||
5.00%, 07/01/23 | 545,000 | 649,765 | ||||||
Honolulu City & County Wastewater System Revenue, Senior Series A, | ||||||||
4.00%, 07/01/21 | 1,005,000 | 1,114,123 | ||||||
Honolulu City & County Wastewater System Revenue, Senior | ||||||||
5.25%, 07/01/36 | 20,000 | 23,172 | ||||||
Kauai County GO, Refunding, Series A, | ||||||||
2.25%, 08/01/17 | 150,000 | 150,518 | ||||||
Kauai County GO, Refunding, Series A, | ||||||||
3.00%, 08/01/20 | 305,000 | 321,815 | ||||||
Kauai County GO, Refunding, Series A, | ||||||||
3.00%, 08/01/18 | 250,000 | 256,322 | ||||||
Kauai County GO, Refunding, Series A, | ||||||||
4.00%, 08/01/19 | 100,000 | 106,387 | ||||||
| Principal Amount ($) | Value ($) | |||||||
MUNICIPAL BONDS — (Continued) |
| |||||||
Hawaii — (Continued) | ||||||||
Kauai County GO, | ||||||||
4.00%, 08/01/20 | 10,000 | 10,868 | ||||||
Maui County GO, | ||||||||
5.00%, 06/01/18 | 250,000 | 260,912 | ||||||
Maui County GO, | ||||||||
5.00%, 06/01/17 | 1,000,000 | 1,003,240 | ||||||
Maui County GO, | ||||||||
5.00%, 06/01/18 | 300,000 | 313,095 | ||||||
Maui County GO, | ||||||||
5.00%, 06/01/19 | 160,000 | 172,989 | ||||||
Maui County GO, | ||||||||
5.00%, 09/01/19 | 70,000 | 76,290 | ||||||
Maui County GO, | ||||||||
5.00%, 06/01/20 | 660,000 | 735,979 | ||||||
Maui County GO, | ||||||||
5.00%, 06/01/21 | 200,000 | 229,124 | ||||||
Maui County GO, | ||||||||
5.00%, 09/01/21 | 20,000 | 23,013 | ||||||
University of Hawaii Revenue, Refunding, Series A, | ||||||||
2.00%, 10/01/18 | 230,000 | 233,344 | ||||||
University of Hawaii Revenue, Refunding, Series B, | ||||||||
4.00%, 10/01/23 | 500,000 | 570,545 | ||||||
The accompanying notes are an integral part of the financial statements.
27
PACIFIC CAPITAL FUNDS
Pacific Capital Tax-Free Short Intermediate Securities Fund
Portfolio of Investments (Continued)
April 30, 2017
| Principal Amount ($) | Value ($) | |||||||
MUNICIPAL BONDS — (Continued) |
| |||||||
Hawaii — (Continued) | ||||||||
University of Hawaii Revenue, Refunding, Series B, | ||||||||
4.00%, 10/01/24 | 500,000 | 573,375 | ||||||
University of Hawaii Revenue, Series A-2, | ||||||||
4.00%, 10/01/18 | 30,000 | 31,275 | ||||||
University of Hawaii Revenue, Series B-2, | ||||||||
5.00%, 10/01/18 | 75,000 | 79,236 | ||||||
|
| |||||||
| 58,408,130 | ||||||||
|
| |||||||
Idaho — 1.5% | ||||||||
Madison County School District No 321 Rexburg GO, Refunding, Series A, | ||||||||
4.00%, 08/15/18, (ID SLSTAX GTY Insured) | 1,000,000 | 1,038,540 | ||||||
|
| |||||||
Iowa — 0.7% | ||||||||
University of Iowa Facilities Corp. Revenue, Medical Education & Biomed Research Facility, | ||||||||
3.75%, 06/01/18 | 435,000 | 447,789 | ||||||
|
| |||||||
Michigan — 0.1% | ||||||||
Michigan Municipal Bond Authority Revenue, Unrefunded Portion Clean Water Revolving, Callable 03/06/17 at 100, | ||||||||
5.00%, 10/01/18 | 70,000 | 70,220 | ||||||
|
| |||||||
| Principal Amount ($) | Value ($) | |||||||
MUNICIPAL BONDS — (Continued) |
| |||||||
Missouri — 1.5% | ||||||||
Kansas City Special Obligation Refunding & Improvement Revenue, Series B, | ||||||||
5.00%, 08/01/18 | 450,000 | 471,852 | ||||||
St Charles County School District No R-IV Wentzville GO, Refunding, | ||||||||
4.00%, 03/01/19, (ST AID DIR DEP Insured) | 500,000 | 526,720 | ||||||
|
| |||||||
| 998,572 | ||||||||
|
| |||||||
New York — 0.7% | ||||||||
New York City GO, Refunding, Series J, | ||||||||
5.00%, 08/01/18 | 470,000 | 493,307 | ||||||
|
| |||||||
Oklahoma — 1.5% | ||||||||
Cleveland County Educational Facilities Authority Revenue, | ||||||||
5.00%, 07/01/17 | 500,000 | 503,235 | ||||||
Cleveland County Educational Facilities Authority Revenue, | ||||||||
5.00%, 07/01/18 | 500,000 | 521,955 | ||||||
|
| |||||||
| 1,025,190 | ||||||||
|
| |||||||
Texas — 0.7% | ||||||||
University of Texas System (The), Refunding, Series A, | ||||||||
5.00%, 08/15/17 | 500,000 | 505,970 | ||||||
|
| |||||||
The accompanying notes are an integral part of the financial statements.
28
PACIFIC CAPITAL FUNDS
Pacific Capital Tax-Free Short Intermediate Securities Fund
Portfolio of Investments (Concluded)
April 30, 2017
| Principal Amount ($) | Value ($) | |||||||
MUNICIPAL BONDS — (Continued) |
| |||||||
Wisconsin — 0.7% | ||||||||
Milwaukee City GO, Promissory & Corporate Notes, Series N2, | ||||||||
5.00%, 05/01/20 | 400,000 | 443,700 | ||||||
|
| |||||||
TOTAL MUNICIPAL BONDS | 66,195,129 | |||||||
|
| |||||||
| Shares | ||||||||
REGISTERED INVESTMENT COMPANY — 1.5% |
| |||||||
Dreyfus Government Cash Management Fund, Institutional Shares, | ||||||||
0.69%(a) | 1,040,796 | 1,040,796 | ||||||
|
| |||||||
TOTAL REGISTERED INVESTMENT COMPANY (Cost $1,040,796) | 1,040,796 | |||||||
|
| |||||||
TOTAL INVESTMENTS - 98.8% |
| 67,235,925 | ||||||
OTHER ASSETS IN EXCESS OF LIABILITIES - 1.2% | 838,996 | |||||||
|
| |||||||
NET ASSETS - 100.0% | $ | 68,074,921 | ||||||
|
| |||||||
| (a) | Rate periodically changes. Rate disclosed is the daily yield on April 30, 2017. |
Portfolio holdings are subject to change at any time.
| | ||
AGM | Assured Guaranty Municipal Corp. | |
AMT | Alternative Minimum Tax | |
ETM | Escrowed To Maturity | |
FHLMC | Federal Home Loan Mortgage Corp. | |
FNMA | Federal National Mortgage Association | |
GNMA | Government National Mortgage Association | |
GO | General Obligation | |
ID SLSTAX GTY | Idaho Sales Tax Guaranty | |
MAC | Municipal Assurance Corp | |
NATL-RE | National Reinsurance Corp. | |
ST AID DIR DEP | State Aid Direct Deposit | |
The accompanying notes are an integral part of the financial statements.
29
PACIFIC CAPITAL FUNDS
Statements of Assets and Liabilities
April 30, 2017
| Pacific Capital Tax-Free Securities Fund | Pacific Capital Tax-Free Short Intermediate Securities Fund | |||||||
Assets | ||||||||
Investments, at value (Cost $306,892,520 and $66,534,785, respectively) | $ | 313,480,308 | $ | 67,235,925 | ||||
Cash | 458 | — | ||||||
Receivable for capital shares sold | 265,379 | 26,987 | ||||||
Dividends and interest receivable | 3,786,726 | 890,298 | ||||||
Prepaid expenses and other assets | 14,653 | 2,720 | ||||||
|
|
|
| |||||
Total assets | 317,547,524 | 68,155,930 | ||||||
|
|
|
| |||||
Liabilities | ||||||||
Payable for investments purchased | 2,302,165 | — | ||||||
Due to Custodian | 10,121 | 6,642 | ||||||
Payable for capital shares redeemed | 332,476 | 2,254 | ||||||
Payable for distributions to shareholders | 101,431 | 18,919 | ||||||
Payable for administration and accounting fees | 14,249 | 12,098 | ||||||
Payable for transfer agent fees | 6,817 | 7,908 | ||||||
Accrued expenses | 47,367 | 33,188 | ||||||
|
|
|
| |||||
Total liabilities | 2,814,626 | 81,009 | ||||||
|
|
|
| |||||
Net Assets | $ | 314,732,898 | $ | 68,074,921 | ||||
|
|
|
| |||||
Net Assets Consist of: | ||||||||
Capital stock, $0.01 par value | $ | 310,140 | $ | 67,166 | ||||
Paid-in capital | 310,066,264 | 67,350,240 | ||||||
Undistributed net investment income | — | 49 | ||||||
Accumulated net realized loss from investments | (2,231,294 | ) | (43,674 | ) | ||||
Net unrealized appreciation on investments | 6,587,788 | 701,140 | ||||||
|
|
|
| |||||
Net Assets | $ | 314,732,898 | $ | 68,074,921 | ||||
|
|
|
| |||||
Class Y: | ||||||||
Outstanding shares | 31,014,007 | 6,716,593 | ||||||
|
|
|
| |||||
Net asset value, offering and redemption price per share | $ | 10.15 | $ | 10.14 | ||||
|
|
|
| |||||
The accompanying notes are an integral part of the financial statements.
30
PACIFIC CAPITAL FUNDS
Statements of Operations
For the Year Ended April 30, 2017
| Pacific Capital Tax-Free Securities Fund | Pacific Capital Tax-Free Short Intermediate Securities Fund | |||||||
Investment Income | ||||||||
Interest | $ | 7,883,791 | $ | 1,134,243 | ||||
Dividends | 19,867 | 5,734 | ||||||
|
|
|
| |||||
Total investment income | 7,903,658 | 1,139,977 | ||||||
|
|
|
| |||||
Expenses | ||||||||
Advisory fees (Note 2) | 625,153 | 153,223 | ||||||
Administration and accounting fees (Note 2) | 92,872 | 55,836 | ||||||
Trustees’ and officers’ fees (Note 2) | 51,843 | 34,742 | ||||||
Legal fees | 46,880 | 10,060 | ||||||
Audit fees | 27,155 | 30,887 | ||||||
Custodian fees (Note 2) | 25,555 | 16,185 | ||||||
Transfer agent fees (Note 2) | 23,212 | 25,537 | ||||||
Printing and shareholder reporting fees | 13,813 | 1,213 | ||||||
Registration and filing fees | 1,102 | 1,406 | ||||||
Other expenses | 45,072 | 16,854 | ||||||
|
|
|
| |||||
Total expenses before waivers | 952,657 | 345,943 | ||||||
|
|
|
| |||||
Less: waivers (Note 2) | (625,153 | ) | (153,223 | ) | ||||
|
|
|
| |||||
Net expenses after waivers | 327,504 | 192,720 | ||||||
|
|
|
| |||||
Net investment income | 7,576,154 | 947,257 | ||||||
|
|
|
| |||||
Net realized and unrealized gain/(loss) from investments: | ||||||||
Net realized gain/(loss) from investments | (393,568 | ) | 141,608 | |||||
Net change in unrealized depreciation on investments | (8,041,851 | ) | (983,102 | ) | ||||
|
|
|
| |||||
Net realized and unrealized loss on investments | (8,435,419 | ) | (841,494 | ) | ||||
|
|
|
| |||||
Net increase/(decrease) in net assets resulting from operations | $ | (859,265 | ) | $ | 105,763 | |||
|
|
|
| |||||
The accompanying notes are an integral part of the financial statements.
31
PACIFIC CAPITAL FUNDS
Pacific Capital Tax-Free Securities Fund
Statements of Changes in Net Assets
| Year Ended April 30, 2017 | Year Ended April 30, 2016 | |||||||
Increase/(Decrease) in Net Assets from Operations: | ||||||||
Net investment income | $ | 7,576,154 | $ | 6,660,736 | ||||
Net realized loss from investments | (393,568 | ) | (93,995 | ) | ||||
Net change in unrealized appreciation/(depreciation) on investments | (8,041,851 | ) | 4,465,093 | |||||
|
|
|
| |||||
Net increase/(decrease) in net assets resulting from operations | (859,265 | ) | 11,031,834 | |||||
|
|
|
| |||||
Less Dividends and Distributions to Shareholders from: | ||||||||
Net investment income | (7,576,245 | ) | (6,660,645 | ) | ||||
|
|
|
| |||||
Net decrease in net assets from dividends and distributions to shareholders | (7,576,245 | ) | (6,660,645 | ) | ||||
|
|
|
| |||||
Increase in Net Assets Derived from Capital Share Transactions (Note 4) | 22,651,726 | 84,856,578 | ||||||
|
|
|
| |||||
Total increase in net assets | 14,216,216 | 89,227,767 | ||||||
|
|
|
| |||||
Net assets | ||||||||
Beginning of year | 300,516,682 | 211,288,915 | ||||||
|
|
|
| |||||
End of year | $ | 314,732,898 | $ | 300,516,682 | ||||
|
|
|
| |||||
Undistributed net investment income, end of year | $ | — | $ | 91 | ||||
|
|
|
| |||||
The accompanying notes are an integral part of the financial statements.
32
PACIFIC CAPITAL FUNDS
Pacific Capital Tax-Free Short Intermediate Securities Fund
Statements of Changes in Net Assets
| Year Ended April 30, 2017 | Year Ended April 30, 2016 | |||||||
Increase/(Decrease) in Net Assets from Operations: | ||||||||
Net investment income | $ | 947,257 | $ | 1,364,293 | ||||
Net realized gain from investments | 141,608 | 231,043 | ||||||
Net change in unrealized appreciation/(depreciation) on investments | (983,102 | ) | 649,670 | |||||
|
|
|
| |||||
Net increase in net assets resulting from operations | 105,763 | 2,245,006 | ||||||
|
|
|
| |||||
Less Dividends and Distributions to Shareholders from: | ||||||||
Net investment income: | (947,257 | ) | (1,364,293 | ) | ||||
Net realized capital gains: | (198,477 | ) | — | |||||
|
|
|
| |||||
Net decrease in net assets from dividends and distributions to shareholders | (1,145,734 | ) | (1,364,293 | ) | ||||
|
|
|
| |||||
Decrease in Net Assets Derived from Capital Share Transactions (Note 4) | (21,323,423 | ) | (42,936,644 | ) | ||||
|
|
|
| |||||
Total decrease in net assets | (22,363,394 | ) | (42,055,931 | ) | ||||
|
|
|
| |||||
Net assets | ||||||||
Beginning of year | 90,438,315 | 132,494,246 | ||||||
|
|
|
| |||||
End of year | $ | 68,074,921 | $ | 90,438,315 | ||||
|
|
|
| |||||
Undistributed net investment income, end of year | $ | 49 | $ | 49 | ||||
|
|
|
| |||||
The accompanying notes are an integral part of the financial statements.
33
PACIFIC CAPITAL FUNDS
Pacific Capital Tax-Free Securities Fund
Financial Highlights
Contained below is per share operating performance data for Class Y Shares outstanding, total investment return, ratios to average net assets and other supplemental data for the respective periods. The total returns in the table represent the rate that an investor would have earned or lost on an investment in the Fund (assuming reinvestment of all dividends and distributions). This information has been derived from information provided in the financial statements and should be read in conjunction with the financial statements and the notes thereto.
Class Y Shares | For the Year Ended April 30, 2017 | For the Year Ended April 30, 2016 | For the Year Ended April 30, 2015 | For the Year Ended April 30, 2014 | For the Year Ended April 30, 2013 | |||||||||||||||
Per Share Operating Performance | ||||||||||||||||||||
Net asset value, beginning of year | $ | 10.41 | $ | 10.24 | $ | 10.18 | $ | 10.51 | $ | 10.41 | ||||||||||
|
|
|
|
|
|
|
|
|
| |||||||||||
Net investment income | 0.25 | 0.30 | 0.33 | 0.33 | 0.34 | |||||||||||||||
Net realized and unrealized gain/(loss) from investments | (0.26 | ) | 0.17 | 0.06 | (0.33 | ) | 0.11 | |||||||||||||
|
|
|
|
|
|
|
|
|
| |||||||||||
Net increase in net assets resulting from operations | (0.01 | ) | 0.47 | 0.39 | — | 0.45 | ||||||||||||||
|
|
|
|
|
|
|
|
|
| |||||||||||
Dividends and distributions to shareholders from: | ||||||||||||||||||||
Net investment income | (0.25 | ) | (0.30 | ) | (0.33 | ) | (0.33 | ) | (0.35 | ) | ||||||||||
|
|
|
|
|
|
|
|
|
| |||||||||||
Net asset value, end of year | $ | 10.15 | $ | 10.41 | $ | 10.24 | $ | 10.18 | $ | 10.51 | ||||||||||
|
|
|
|
|
|
|
|
|
| |||||||||||
Total investment return(1) | (0.10 | )% | 4.63 | % | 3.87 | % | 0.11 | % | 4.40 | % | ||||||||||
Ratio/Supplemental Data | ||||||||||||||||||||
Net assets, end of year (in thousands) | $ | 314,733 | $ | 300,517 | $ | 211,289 | $ | 218,771 | $ | 303,624 | ||||||||||
Ratio of expenses to average net assets | 0.10 | % | 0.10 | % | 0.12 | % | 0.11 | % | 0.10 | % | ||||||||||
Ratio of expenses to average net assets without waivers(2) | 0.30 | % | 0.30 | % | 0.32 | % | 0.31 | % | 0.30 | % | ||||||||||
Ratio of net investment income to average net assets | 2.42 | % | 2.87 | % | 3.21 | % | 3.30 | % | 3.28 | % | ||||||||||
Portfolio turnover rate | 15.26 | % | 17.57 | % | 16.60 | % | 5.35 | % | 14.78 | % | ||||||||||
| (1) | Total investment return is calculated assuming a purchase of shares on the first day and a sale of shares on the last day of each period reported and includes reinvestment of dividends and distributions, if any. |
| (2) | During the period, certain fees were waived. If such fee waivers had not occurred, the ratios would have been as indicated (See Note 2). |
The accompanying notes are an integral part of the financial statements.
34
PACIFIC CAPITAL FUNDS
Pacific Capital Tax-Free Short Intermediate Securities Fund
Financial Highlights
Contained below is per share operating performance data for Class Y Shares outstanding, total investment return, ratios to average net assets and other supplemental data for the respective periods. The total returns in the table represent the rate that an investor would have earned or lost on an investment in the Fund (assuming reinvestment of all dividends and distributions). This information has been derived from information provided in the financial statements and should be read in conjunction with the financial statements and the notes thereto.
Class Y Shares | For the Year Ended April 30, 2017 | For the Year Ended April 30, 2016 | For the Year Ended April 30, 2015 | For the Year Ended April 30, 2014 | For the Year Ended April 30, 2013 | |||||||||||||||
Per Share Operating Performance | ||||||||||||||||||||
Net asset value, beginning of year | $ | 10.27 | $ | 10.19 | $ | 10.17 | $ | 10.30 | $ | 10.33 | ||||||||||
|
|
|
|
|
|
|
|
|
| |||||||||||
Net investment income | 0.13 | 0.12 | 0.10 | 0.12 | 0.17 | |||||||||||||||
Net realized and unrealized gain/(loss) from investments | (0.10 | ) | 0.08 | 0.02 | (0.13 | ) | (0.03 | ) | ||||||||||||
|
|
|
|
|
|
|
|
|
| |||||||||||
Net increase/(decrease) in net assets resulting from operations | 0.03 | 0.20 | 0.12 | (0.01 | ) | 0.14 | ||||||||||||||
|
|
|
|
|
|
|
|
|
| |||||||||||
Dividends and distributions to shareholders from: | ||||||||||||||||||||
Net investment income | (0.13 | ) | (0.12 | ) | (0.10 | ) | (0.12 | ) | (0.17 | ) | ||||||||||
Net realized gains | (0.03 | ) | — | — | — | — | ||||||||||||||
|
|
|
|
|
|
|
|
|
| |||||||||||
Total dividends and distributions and shareholders | (0.16 | ) | (0.12 | ) | (0.10 | ) | (0.12 | ) | (0.17 | ) | ||||||||||
|
|
|
|
|
|
|
|
|
| |||||||||||
Net asset value, end of year | $ | 10.14 | $ | 10.27 | $ | 10.19 | $ | 10.17 | $ | 10.30 | ||||||||||
|
|
|
|
|
|
|
|
|
| |||||||||||
Total investment return(1) | 0.24 | % | 1.93 | % | 1.23 | % | (0.09 | )% | 1.39 | % | ||||||||||
Ratio/Supplemental Data | ||||||||||||||||||||
Net assets, end of year (in thousands) | $ | 68,075 | $ | 90,438 | $ | 132,494 | $ | 108,671 | $ | 62,564 | ||||||||||
Ratio of expenses to average net assets | 0.25 | % | 0.15 | % | 0.13 | % | 0.19 | % | 0.25 | % | ||||||||||
Ratio of expenses to average net assets without waivers(2) | 0.45 | % | 0.35 | % | 0.33 | % | 0.39 | % | 0.45 | % | ||||||||||
Ratio of net investment income to average net assets | 1.24 | % | 1.12 | % | 1.02 | % | 1.15 | % | 1.62 | % | ||||||||||
Portfolio turnover rate | 18.90 | % | 18.87 | % | 24.07 | % | 26.98 | % | 23.97 | % | ||||||||||
| (1) | Total investment return is calculated assuming a purchase of shares on the first day and a sale of shares on the last day of each period reported and includes reinvestment of dividends and distributions, if any. |
| (2) | During the period, certain fees were waived. If such fee waivers had not occurred, the ratios would have been as indicated (See Note 2). |
The accompanying notes are an integral part of the financial statements.
35
PACIFIC CAPITAL FUNDS
Notes to Financial Statements
April 30, 2017
1. Organization and Significant Accounting Policies
The Pacific Capital Tax-Free Securities Fund and Pacific Capital Tax-Free Short Intermediate Securities Fund (each a “Fund” and together the “Funds”) are non-diversified open-end management investment companies registered under the Investment Company Act of 1940, as amended (the “1940 Act”). The Funds are each a separate series of FundVantage Trust (the “Trust”) which was organized as a Delaware statutory trust on August 28, 2006. The Trust is a “series trust” authorized to issue an unlimited number of separate series or classes of shares of beneficial interest. Each series is treated as a separate entity for certain matters under the 1940 Act, and for other purposes, and a shareholder of one series is not deemed to be a shareholder of any other series. The Funds are each authorized to issue and offer Class Y shares.
The Funds are investment companies and follow accounting and reporting guidance in the Financial Accounting Standards Board Accounting Standards Codification Topic 946.
Portfolio Valuation — Each Fund’s net asset value (“NAV”) is calculated once daily at the close of regular trading hours on the New York Stock Exchange (“NYSE”) (typically 4:00 p.m. Eastern time) on each day the NYSE is open. Securities held by each Fund are valued using the closing price or the last sale price on a national securities exchange or the National Association of Securities Dealers Automatic Quotation System (“NASDAQ”) market system where they are primarily traded. Equity securities traded in the over-the-counter market are valued at their closing prices. If there were no transactions on that day, securities traded principally on an exchange or on NASDAQ will be valued at the mean of the last bid and ask prices prior to the market close. Fixed income securities having a remaining maturity of greater than 60 days are valued using an independent pricing service. Fixed income securities having a remaining maturity of 60 days or less are generally valued at amortized cost, provided such amount approximates fair value. Debt securities are valued on the basis of broker quotations or valuations provided by a pricing service, which utilizes information with respect to recent sales, market transactions in comparable securities, quotations from dealers, and various relationships between securities in determining value. Valuations developed through pricing techniques may materially vary from the actual amounts realized upon sale of the securities. Foreign securities are valued based on prices from the primary market in which they are traded and are translated from the local currency into U.S. dollars using current exchange rates. Investments in other open-end investment companies are valued based on the NAV of such investment companies (which may use fair value pricing as discussed in their prospectuses). If market quotations are unavailable or deemed unreliable, securities will be valued in accordance with procedures adopted by the FundVantage Trust’s Board of Trustees. Relying on prices supplied by pricing services or dealers or using fair valuation may result in values that are higher or lower than the values used by other investment companies and investors to price the same investments. In the event that market quotes are not readily available, and the security or asset cannot be valued pursuant to one of the valuation methods, the value
36
PACIFIC CAPITAL FUNDS
Notes to Financial Statements (Continued)
April 30, 2017
of the security or asset will be determined in good faith by the Adviser. The Trust has established a Valuation Committee which performs certain functions including the oversight of the Adviser’s fair valuation determinations.
Fair Value Measurements — The inputs and valuation techniques used to measure fair value of the Funds’ investments are summarized into three levels as described in the hierarchy below:
• Level 1 — | quoted prices in active markets for identical securities; | |
• Level 2 — | other significant observable inputs (including quoted prices for similar securities, interest rates, prepayment speeds, credit risk, etc.); and | |
• Level 3 — | significant unobservable inputs (including a Fund’s own assumptions in determining the fair value of investments). | |
The fair value of a Fund’s bonds are generally based on quotes received from brokers of independent pricing services. Bonds with quotes that are based on actual trades with a sufficient level of activity on or near the measurement date are classified as Level 2 assets.
The inputs or methodology used for valuing securities are not necessarily an indication of the risk associated with investing in those securities.
The following is a summary of the inputs used, as of April 30, 2017, in valuing the Funds’ investments carried at fair value:
Funds | Total Value at 04/30/17 | Level 1 Quoted Price | Level 2 Other Significant Observable Inputs | Level 3 Unobservable Significant Inputs | ||||||||||||
Pacific Capital Tax-Free Securities Fund | ||||||||||||||||
Municipal Bonds | $ | 309,249,428 | $ | — | $ | 309,249,428 | $ | — | ||||||||
Registered Investment Company | 4,230,880 | 4,230,880 | — | — | ||||||||||||
|
|
|
|
|
|
|
| |||||||||
Total | $ | 313,480,308 | $ | 4,230,880 | $ | 309,249,428 | $ | — | ||||||||
|
|
|
|
|
|
|
| |||||||||
Pacific Capital Tax-Free Short Intermediate Securities Fund | ||||||||||||||||
Municipal Bonds | $ | 66,195,129 | $ | — | $ | 66,195,129 | $ | — | ||||||||
Registered Investment Company | 1,040,796 | 1,040,796 | — | — | ||||||||||||
|
|
|
|
|
|
|
| |||||||||
Total | 67,235,925 | 1,040,796 | 66,195,129 | — | ||||||||||||
|
|
|
|
|
|
|
| |||||||||
37
PACIFIC CAPITAL FUNDS
Notes to Financial Statements (Continued)
April 30, 2017
At the end of each quarter, management evaluates the classification of Levels 1, 2 and 3 assets and liabilities. Various factors are considered, such as changes in liquidity from the prior reporting period; whether or not a broker is willing to execute at the quoted price; the depth and consistency of prices from third party pricing services; and the existence of contemporaneous, observable trades in the market. Additionally, management evaluates the classification of Level 1 and Level 2 assets and liabilities on a quarterly basis for changes in listings or delistings on national exchanges.
Due to the inherent uncertainty of determining the fair value of investments that do not have a readily available market value, the fair value of a Fund’s investments may fluctuate from period to period. Additionally, the fair value of investments may differ significantly from the values that would have been used had a ready market existed for such investments and may differ materially from the values a Fund may ultimately realize. Further, such investments may be subject to legal and other restrictions on resale or otherwise less liquid than publicly traded securities.
For fair valuations using significant unobservable inputs, U.S. generally accepted accounting principles (“U.S. GAAP”) require the Funds to present a reconciliation of the beginning to ending balances for reported market values that presents changes attributable to total realized and unrealized gains or losses, purchase and sales, and transfers in and out of Level 3 during the period. Transfers in and out between Levels are based on values at the end of the period. U.S. GAAP also requires the Funds to disclose amounts and reasons for all transfers in and out of Level 1 and Level 2 fair value measurements. A reconciliation of Level 3 investments is presented only when the Funds have an amount of Level 3 investments at the end of the reporting period that was meaningful in relation to its net assets. The amounts and reasons for all transfers in and out of each Level within the three-tier hierarchy are disclosed when the Funds have an amount of total transfers during the reporting period that was meaningful in relation to its net assets as of the end of the reporting period.
For the year ended April 30, 2017, there were no transfers between Levels 1, 2 and 3.
Use of Estimates — The preparation of financial statements in conformity with U.S. GAAP requires management to make estimates and assumptions that affect the amounts reported in the financial statements and accompanying notes at the date of the financial statements and the reported amounts of revenues and expenses during the period. Actual results could differ from those estimates and those differences could be material.
Investment Transactions, Investment Income and Expenses — Investment transactions are recorded on trade date for financial statement preparation purposes. Realized gains and losses on investments sold are recorded on the identified cost basis. Interest income is recorded on the accrual basis. Accretion of discounts and amortization of premiums are recorded on a daily basis using the effective yield method except for short term securities, which records discounts and premiums on a straight-line basis. Dividends are recorded on the ex-dividend date. General expenses of the Trust are generally allocated to each fund in proportion to its relative daily net assets. Expenses directly attributable to a particular fund in the Trust are charged directly to that fund.
38
PACIFIC CAPITAL FUNDS
Notes to Financial Statements (Continued)
April 30, 2017
Dividends and Distributions to Shareholders — Dividends from net investment income are declared daily and paid monthly to shareholders. Distributions, if any, of net short-term capital gain and net capital gain (the excess of net long-term capital gain over the short-term capital loss) realized by a Fund, after deducting any available capital loss carryovers are declared and paid to its shareholders annually. Income dividends and capital gain distributions are determined in accordance with U.S. federal income tax regulations, which may differ from U.S. GAAP. These differences may include the treatment of non-taxable dividends, expiring capital loss carryforwards and losses deferred due to wash sales and excise tax regulations. Permanent book and tax basis differences relating to shareholder distributions will result in reclassifications within the components of net assets.
U.S. Tax Status — No provision is made for U.S. income taxes as it is each Fund’s intention to continue to qualify for and elect the tax treatment applicable to regulated investment companies under Subchapter M of the Internal Revenue Code of 1986, as amended (“Internal Revenue Code”), and make the requisite distributions to such Fund’s shareholders, which will be sufficient to relieve it from U.S. income and excise taxes.
Other — In the normal course of business, a Fund may enter into contracts that provide general indemnifications. A Fund’s maximum exposure under these arrangements is dependent on claims that may be made against it in the future, and, therefore, cannot be estimated; however, based on experience, the risk of material loss for such claims is considered remote.
Recent Accounting Pronouncement — In October 2016, the U.S. Securities and Exchange Commission (“SEC”) issued a new rule, Investment Company Reporting Modernization, which, among other provisions, amends Regulation S-X to require standardized, enhanced disclosures, particularly related to derivatives, in investment company financial statements. Compliance with the amendments to Regulation S-X is required for financial statements filed with the SEC on or after August 1, 2017. Management is currently evaluating the impact that the amendments will have on the Funds’ financial statements and related disclosures.
2. Transactions with Related Parties and Other Service Providers
Investment advisory services are provided to the Funds by the Asset Management Group of Bank of Hawaii (the “Adviser”). Under terms of an advisory agreement, each Fund is charged an annual fee of 0.20% which is computed daily and paid monthly based upon average daily net assets. The Adviser has agreed to waive its advisory fee (the “Waiver”). The Waiver will remain in effect until August 31, 2017. The Waiver may not be terminated at any time prior to that date without the consent of the Board of Trustees of FundVantage Trust (the “Trust”).
39
PACIFIC CAPITAL FUNDS
Notes to Financial Statements (Continued)
April 30, 2017
Fee rates for the period May 1, 2016 through April 30, 2017, were as follows:
| Maximum Annual Advisory Fee | Net Annual Fees Paid After Contractual Waivers | |||||||||
Pacific Capital Tax-Free Securities Fund | 0.20% | 0.00% | ||||||||
Pacific Capital Tax-Free Short Intermediate Securities Fund | 0.20% | 0.00% | ||||||||
Other Service Providers
BNY Mellon Investment Servicing (US) Inc. (“BNY Mellon”) serves as administrator and transfer agent for the Funds. For providing administrative and accounting services, BNY Mellon is entitled to receive a monthly fee equal to an annual percentage rate of each Fund’s average daily net assets and is subject to certain minimum monthly fees. For providing transfer agency services, BNY Mellon is entitled to receive a monthly fee, subject to certain minimum, and out of pocket expenses.
The Bank of New York Mellon (the “Custodian”) provides certain custodial services to the Funds. The Custodian is entitled to receive a monthly fee, subject to certain minimum, and out of pocket expenses.
Foreside Funds Distributors LLC (the “Underwriter”) provides principal underwriting services to the Funds.
Trustees and Officers
The Trust is governed by its Board of Trustees. The Trustees receive compensation in the form of an annual retainer and per meeting fees for their services to the Trust. The remuneration paid to the Trustees by the Funds during the year ended April 30, 2017 was $32,873 for the Pacific Capital Tax-Free Securities Fund and $9,269 for the Pacific Capital Tax-Free Short Intermediate Securities Fund. An employee of BNY Mellon serves as the Secretary of the Trust and is not compensated by the Fund or the Trust.
Effective June 1, 2016 and July 1, 2016, JW Fund Management LLC (“JWFM”) provides a Principal Executive Officer and Principal Financial Officer, respectively, to the Trust. JWFM is compensated for the services provided to the Trust. Until May 31, 2016 and June 30, 2016, certain employees of BNY Mellon served as Principal Executive Officer and Principal Financial Officer, respectively, to the Trust. They were not compensated by the Trust or the Funds.
Freeh Group International Solutions, LLC provides the Trust with a Chief Compliance Officer and an Anti-Money Laundering Officer.
40
PACIFIC CAPITAL FUNDS
Notes to Financial Statements (Continued)
April 30, 2017
3. Investment in Securities
For the year ended April 30, 2017, aggregate purchases and sales of investment securities (excluding short-term investments) of the Funds were as follows:
| Purchases | Sales | |||||||
Pacific Capital Tax-Free Securities Fund | $ | 77,893,126 | $ | 45,716,424 | ||||
Pacific Capital Tax-Free Short Intermediate Securities Fund | 13,759,666 | 37,108,459 | ||||||
The Funds are permitted to purchase or sell securities from or to certain other affiliated funds under specified conditions outlined in the procedures adopted by the Board of Trustees of the Funds. The procedures have been designed to provide assurances that any purchase or sale of securities by the Funds from or to another fund that is or could be considered an affiliate by virtue of having a common investment adviser (or affiliated investment adviser), common Trustees and/or common officers complies with Rule 17a-7 under the 1940 act. Further, as defined under the procedures, each transaction is effective at the current market price.
For the year ended April 30, 2017, the Funds engaged in security transactions with affiliated funds with proceeds from sales of $6,916,515 and net realized gain from sales of $134,319.
4. Capital Share Transactions
For the year ended April 30, 2017 and 2016, transactions in capital shares (authorized shares unlimited) were as follows:
| For the Year Ended April 30, 2017 | For the Year Ended April 30, 2016 | |||||||||||||||
| Shares | Amount | Shares | Amount | |||||||||||||
Pacific Capital Tax-Free Securities Fund | ||||||||||||||||
Class Y | ||||||||||||||||
Sales | 6,505,452 | $ | 66,973,177 | 11,866,463 | $ | 122,287,522 | ||||||||||
Reinvestments | 6,248 | 64,173 | 8,557 | 87,884 | ||||||||||||
Redemptions | (4,355,799 | ) | (44,385,624 | ) | (3,654,433 | ) | (37,518,828 | ) | ||||||||
|
|
|
|
|
|
|
| |||||||||
Net increase | 2,155,901 | $ | 22,651,726 | 8,220,587 | $ | 84,856,578 | ||||||||||
|
|
|
|
|
|
|
| |||||||||
Pacific Capital Tax-Free Short Intermediate Securities Fund | ||||||||||||||||
Class Y | ||||||||||||||||
Sales | 1,426,326 | $ | 14,517,009 | 1,972,508 | $ | 20,160,254 | ||||||||||
Reinvestments | 637 | 6,464 | 626 | 6,396 | ||||||||||||
Redemptions | (3,516,741 | ) | (35,846,896 | ) | (6,171,817 | ) | (63,103,294 | ) | ||||||||
|
|
|
|
|
|
|
| |||||||||
Net decrease | (2,089,778 | ) | $ | (21,323,423 | ) | (4,198,683 | ) | $ | (42,936,644 | ) | ||||||
|
|
|
|
|
|
|
| |||||||||
41
PACIFIC CAPITAL FUNDS
Notes to Financial Statements (Continued)
April 30, 2017
5. Federal Tax Information
The Funds have followed the authoritative guidance on accounting for and disclosure of uncertainty in tax positions, which requires the Funds to determine whether a tax position is more likely than not to be sustained upon examination, including resolution of any related appeals or litigation processes, based on the technical merits of the position. The Funds have determined that there was no effect on the financial statements from following this authoritative guidance. In the normal course of business, the Funds are subject to examination by federal, state, and local jurisdictions, where applicable, for tax years for which applicable statutes of limitations have not expired.
The tax character of distributions paid during the year ended April 30, 2017, were as follows:
| Net Investment Income | Net Long-Term Capital Gains | Total Taxable Distributions | Tax Exempt Distributions | Total Distributions Paid* | ||||||||||||||||
Pacific Capital Tax-Free Securities Fund | $ | 6,367 | $ | — | $ | 6,367 | $ | 7,530,337 | $ | 7,536,704 | ||||||||||
Pacific Capital Tax-Free Short Intermediate Securities Fund | — | 198,477 | 198,477 | 938,319 | 1,136,796 | |||||||||||||||
| * | Distributions will not tie to Statement of Changes because distributions are recognized when actually paid for tax purposes. |
The tax character of distributions paid during the year ended April 30, 2016, were as follows:
| Net Investment Income | Net Long-Term Capital Gains | Total Taxable Distributions | Tax Exempt Distributions | Total Distributions Paid* | ||||||||||||||||
Pacific Capital Tax-Free Securities Fund | $ | 18,858 | $ | — | $ | 18,858 | $ | 6,636,132 | $ | 6,654,990 | ||||||||||
Pacific Capital Tax-Free Short Intermediate Securities Fund | 163 | — | 163 | 1,365,325 | 1,365,488 | |||||||||||||||
| * | Distributions will not tie to Statement of Changes because distributions are recognized when actually paid for tax purposes. |
Distributions from net investment income and short-term capital gains are treated as ordinary income for federal income tax purposes.
42
PACIFIC CAPITAL FUNDS
Notes to Financial Statements (Continued)
April 30, 2017
As of April 30, 2017, the components of accumulated earnings/(deficit) on a tax basis were as follows:
| Undistributed Tax-Exempt Income | Qualified Late-Year Losses | Undistributed Long-Term Capital Gains | Distributions Payable | Capital Loss Carryforwards | Unrealized Appreciation | |||||||||||||||||||||||||
Pacific Capital Tax-Free Securities Fund | $ | 101,431 | $ | — | $ | — | $ | (101,431 | ) | $ | (2,231,294 | ) | $ | 6,587,788 | ||||||||||||||||
Pacific Capital Tax-Free Short Intermediate Securities Fund | 18,968 | (43,673 | ) | — | (18,920 | ) | — | 701,140 | ||||||||||||||||||||||
The differences between the book and tax basis components of distributable earnings relate primarily to the timing and recognition of income and gains for federal income tax purposes. Short-term capital gain is reported as ordinary income for federal income tax purposes.
The cost for federal income tax purposes, gross unrealized appreciation, gross unrealized depreciation and net unrealized appreciation as of April 30, 2017 is as follows:
| Tax Cost of Securities | Unrealized Appreciation | Unrealized Depreciation | Net Unrealized Appreciation | |||||||||||||
Pacific Capital Tax-Free Securities Fund | $ | 306,892,520 | $ | 8,613,075 | $ | (2,025,287 | ) | $ | 6,587,788 | |||||||
Pacific Capital Tax-Free Short Intermediate Securities Fund | 66,534,785 | 746,854 | (45,714 | ) | 701,140 | |||||||||||
Pursuant to federal income tax rules applicable to regulated investment companies, the Funds may elect to treat certain capital losses between November 1 and April 30 and late year ordinary losses ((i) ordinary losses between January 1 and April 30, and (ii) specified ordinary and currency losses between November 1 and April 30) as occurring on the first day of the following tax year. For the year ended April 30, 2017, any amount of losses elected within the tax return will not be recognized for federal income tax purposes until May 1, 2017. For the year ended April 30, 2017, the Funds deferred to May 1, 2017 the following losses:
| Short-Term Capital Loss Deferral | Long-Term Capital Loss Deferral | |||||||||
Pacific Capital Tax-Free Securities Fund | $ | — | $ | — | ||||||
Pacific Capital Tax-Free Short Intermediate Securities Fund | 43,673 | — | ||||||||
Accumulated capital losses represent net capital loss carryforwards as of April 30, 2017 that may be available to offset future realized capital gains and thereby reduce future capital gains distributions.
43
PACIFIC CAPITAL FUNDS
Notes to Financial Statements (Continued)
April 30, 2017
Under the Regulated Investment Company Modernization Act of 2010, the Funds are permitted to carry forward capital losses incurred in taxable years beginning after December 22, 2010 for an unlimited period. Any losses incurred during those future taxable years will be required to be utilized prior to any losses incurred in pre-enactment taxable years. Additionally, post-enactment capital losses that are carried forward will retain their character as either short-term or long-term capital losses rather than being considered all short-term as under the previous law.
As of April 30, 2017, the Funds had pre-enactment net capital loss carryforwards to offset future net capital gains, if any, to the extent provided by Treasury regulations. To the extent that these carryforwards are used to offset future capital gains, it is probable that the gains that are offset will not be distributed to shareholders.
| Expires April 30, 2018 | |||||
Pacific Capital Tax-Free Securities Fund | $ | 237,475 | |||
Pacific Capital Tax-Free Short Intermediate Securities Fund | — | ||||
As of April 30, 2017, the Funds’ post-enactment capital loss carryforward which were short-term losses and long-term losses and had an unlimited period of capital loss carryover were as follows:
| Post-Enactment Unlimited Period of Net Capital Loss Carryforward | ||||||||
| Short-Term | Long-Term | |||||||
Pacific Capital Tax Free Securities Fund | $ | 1,138,195 | $ | 855,624 | ||||
Pacific Capital Tax Free Short Intermediate Securities Fund | — | — | ||||||
6. Concentration of Credit Risk
The Funds primarily invest in debt obligations issued by the state of Hawaii and its political subdivisions, agencies, and public authorities to obtain funds for various public purposes. The Funds are more susceptible to factors adversely affecting issues of Hawaii municipal securities than is a municipal bond fund that is not concentrated in these issuers to the same extent.
7. Debt Investment Risk
Debt investments are affected primarily by the financial condition of the companies or other entities that have issued them and by changes in interest rates. There is a risk that an issuer of a Fund’s debt investments may not be able to meet its financial obligations (e.g., may not be able to make principal and/or interest payments when they are due or otherwise default on other financial terms) and/or go bankrupt. Securities such as high-yield/high-risk bonds, e.g., bonds with low credit ratings by Moody’s (Ba or lower) or Standard & Poor’s (BB and lower) or if unrated are of comparable quality as determined
44
PACIFIC CAPITAL FUNDS
Notes to Financial Statements (Concluded)
April 30, 2017
by the manager, are especially subject to credit risk during periods of economic uncertainty or during economic downturns and are more likely to default on their interest and/or principal payments than higher rated securities. Debt investments may be affected by changes in interest rates. Debt investments with longer durations tend to be more sensitive to changes in interest rates, making them more volatile than debt investments with shorter durations or floating or adjustable interest rates. The value of debt investments may fall when interest rates rise.
8. Subsequent Events
Management has evaluated the impact of all subsequent events on the Funds through the date that the financial statements were issued, and has determined that there were no following subsequent events requiring recognition or disclosure in the financial statements.
45
PACIFIC CAPITAL FUNDS
Report of Independent Registered Public Accounting Firm
To the Board of Trustees of FundVantage Trust and Shareholders of the
Pacific Capital Tax-Free Securities Fund and the
Pacific Capital Tax-Free Short Intermediate Securities Fund:
In our opinion, the accompanying statements of assets and liabilities, including the portfolios of investments, and the related statements of operations and of changes in net assets and the financial highlights present fairly, in all material respects, the financial position of the Pacific Capital Tax-Free Securities Fund and the Pacific Capital Tax-Free Short Intermediate Securities Fund (two of the funds constituting FundVantage Trust, hereafter referred to as the “Funds”) as of April 30, 2017, the results of each of their operations for the year then ended, the changes in each of their net assets for each of the two years in the period then ended and the financial highlights for each of the five years in the period then ended, in conformity with accounting principles generally accepted in the United States of America. These financial statements and financial highlights (hereafter referred to as “financial statements”) are the responsibility of the Funds’ management. Our responsibility is to express an opinion on these financial statements based on our audits. We conducted our audits of these financial statements in accordance with the standards of the Public Company Accounting Oversight Board (United States). Those standards require that we plan and perform the audit to obtain reasonable assurance about whether the financial statements are free of material misstatement. An audit includes examining, on a test basis, evidence supporting the amounts and disclosures in the financial statements, assessing the accounting principles used and significant estimates made by management, and evaluating the overall financial statement presentation. We believe that our audits, which included confirmation of securities as of April 30, 2017 by correspondence with the custodian, provide a reasonable basis for our opinion.
PricewaterhouseCoopers LLP
Philadelphia, Pennsylvania
June 28, 2017
46
PACIFIC CAPITAL FUNDS
Shareholder Tax Information
(Unaudited)
The Funds are required by Subchapter M of the Internal Revenue Code, to advise their shareholders of the U.S. federal tax status of distributions received by the Funds’ shareholders in respect of such fiscal year.
The tax character of distributions paid during the year ended April 30, 2017 were as follows:
| Net Investment Income | Net Long-Term Capital Gains | Total Taxable Distributions | Tax Exempt Distributions | Total Distributions Paid* | ||||||||||||||||
Pacific Capital Tax-Free Securities Fund | $6,367 | $ — | $ 6,367 | $7,530,337 | $7,536,704 | |||||||||||||||
Pacific Capital Tax-Free Short Intermediate Securities Fund | — | 198,477 | 198,477 | 938,319 | 1,136,796 | |||||||||||||||
| * | Distributions will not tie to Statement of Changes because distributions are recognized when actually paid for tax purposes. |
Dividends from net investment income and short-term capital gains are treated as ordinary income dividends for federal income tax purposes.
The percentage of qualified interest income related dividends not subject to withholding tax for non-resident aliens and foreign corporations for the Pacific Capital Tax-Free Securities Fund and the Pacific Capital Tax-Free Short Intermediate Securities Fund is 100% and 0.00%, respectively.
All designations are based on financial information available as of the date of this annual report and, accordingly, are subject to change. For each item, it is the intention of each Fund to designate the maximum amount permitted under the Internal Revenue Code of 1986, as amended, and the regulations thereunder.
Because the Funds’ fiscal year is not the calendar year, another notification will be sent with respect to calendar year 2017. The second notification, which will reflect the amount, if any, to be used by calendar year taxpayers on their U.S. federal income tax returns, will be made in conjunction with Form 1099-DIV and will be mailed in January 2018.
Foreign shareholders will generally be subject to U.S. withholding tax on the amount of their ordinary income dividends. They will generally not be entitled to a foreign tax credit or deduction for the withholding taxes paid by the Funds, if any.
In general, dividends received by tax-exempt recipients (e.g., IRAs and Keoghs) need not be reported as taxable income for U.S. federal income tax purposes. However, some retirement trusts (e.g., corporate, Keogh and 403(b)(7) plans) may need this information for their annual information reporting.
Shareholders are advised to consult their own tax advisers with respect to the tax consequences of their investment in the Funds.
47
PACIFIC CAPITAL FUNDS
Other Information
(Unaudited)
Proxy Voting
Policies and procedures that the Funds use to determine how to vote proxies relating to portfolio securities as well as information regarding how the Funds voted proxies relating to portfolio securities for the most recent 12-month period ended June 30 are available without charge, upon request, by calling (888) 678-6034 and on the Securities and Exchange Commission’s (“SEC”) website at http://www.sec.gov.
Quarterly Portfolio Schedules
The Trust files its complete schedule of portfolio holdings with the SEC for the first and third fiscal quarters of each fiscal year on Form N-Q. The Trust’s Forms N-Q are available on the SEC’s website at http://www.sec.gov and may be reviewed and copied at the SEC’s Public Reference Room in Washington, D.C. Information on the operation of the SEC’s Public Reference Room may be obtained by calling 1-800-SEC-0330.
Approval of Advisory Agreement
At an in-person meeting held on March 29-30, 2017 (the “Meeting”), the Board of Trustees (“Board” or “Trustees”) of FundVantage Trust (“Trust”), including a majority of the Trustees who are not “interested persons” as defined in the Investment Company Act of 1940, as amended (“1940 Act”) (the “Independent Trustees”), unanimously approved the continuation of the advisory agreement between Asset Management Group of Bank of Hawaii (the “Adviser” or “AMG”) and the Trust on behalf of the Pacific Capital Tax-Free Securities Fund (“Pacific Capital TF Fund”) and the Pacific Capital Tax-Free Short Intermediate Securities Fund (“Pacific Capital TFSI Fund”) (together, the “Funds”) (the “Agreement”). In determining whether to continue the Agreement, the Trustees considered information provided by the Adviser in accordance with Section 15(c) of the 1940 Act.
The Trustees considered information that the Adviser provided regarding (i) services performed for the Funds, (ii) the size and qualifications of their portfolio management staff, (iii) any potential or actual material conflicts of interest which may arise in connection with a portfolio manager’s management of the Funds, (iv) investment performance, (v) the capitalization and financial condition of AMG, (vi) brokerage selection procedures (including soft dollar arrangements, if any), (vii) the procedures for allocating investment opportunities between the Funds and other clients, (viii) results of any regulatory examination, including any recommendations or deficiencies noted, (ix) any litigation, investigation or administrative proceeding which may have a material impact on AMG’s ability to service the Funds, and (x) compliance with the Funds’ investment objectives, policies and practices (including codes of ethics and proxy voting policies), federal securities laws and other regulatory requirements. The Trustees noted the reports provided at Board meetings throughout the year covering matters such as the relative performance of the Funds;
48
PACIFIC CAPITAL FUNDS
Other Information
(Unaudited)
compliance with the investment objectives, policies, strategies and limitations for the Funds; the compliance of management personnel with the applicable code of ethics; and the adherence to fair value pricing procedures as established by the Board.
The Trustees considered the investment performance of the Funds and AMG. The Trustees reviewed the historical performance charts for the one year, three year, five year, ten year and since inception periods ended December 31, 2016 for each of the Funds and the Barclays Capital Hawaii Municipal Bond Index and Barclays Capital Hawaii 3 Year Municipal Bond Index, the benchmarks for the Pacific Capital TF Fund and Pacific Capital TFSI Fund, respectively. The Trustees reviewed the historical performance charts for the Pacific Capital TF Fund as compared to the median of the Lipper “Other States” Intermediate Municipal Debt Funds category, the Lipper peer group for the Pacific Capital TF Fund, for the year-to-date, one year, two year, three year, five year and ten year periods ended December 31, 2016. The Trustees considered the short term and long term performance of the Funds noting that they considered performance reports provided at Board meetings throughout the year. The Trustees took note of the various periods where each Fund outperformed, underperformed or performed in line with its respective benchmark. The Trustees discussed with the Adviser the reasons behind the performance results for each of the Funds. In the case of each Fund with performance that lagged a relevant peer group or benchmark for certain periods (but not necessarily all periods), the Trustees considered other factors that supported the continuation of the Agreement, including the following: (i) that the Adviser’s investment decisions, such as security selection and sector allocation, contributing to such underperformance were consistent with the Fund’s investment objective and policies and (ii) that shorter-term or longer-term performance, as applicable, was competitive when compared to the performance of relevant peer groups or benchmarks. They concluded that the performance of each of the Funds was within an acceptable range of performance relative to other mutual funds with similar investment objectives, strategies and policies based on the information provided at the meeting.
The Adviser provided information regarding its advisory fees and an analysis of these fees in relation to the delivery of services to the Funds and any other ancillary benefit resulting from AMG’s relationship with the Funds. The Trustees considered the fees that AMG charges to other clients, and evaluated the explanations provided by AMG as to differences in fees charged to the Funds as compared to another registered investment company managed by AMG. The Trustees also reviewed a peer comparison of advisory fees and total expenses for the Funds versus the median of other similarly managed funds. The Trustees concluded that the advisory fee and services provided by AMG are consistent with those of other advisers which manage mutual funds with investment objectives, strategies and policies similar to those of the Funds based on the information provided at the Meeting.
49
PACIFIC CAPITAL FUNDS
Other Information
(Unaudited)
The Board considered, among other data, the specific factors and related conclusions set forth below with respect to the Funds:
Pacific Capital Tax-Free Securities Fund. With respect to advisory fees and expenses, the gross advisory fee and net total expense ratio for the Fund were lower than the median of the gross advisory fee and net total expense ratio of funds with a similar share class in the Lipper peer group with $500 million or less in assets. The Trustees also considered that the Adviser was currently voluntarily waiving its entire advisory fee with respect to the Fund. With respect to performance, the Fund outperformed the median of the Lipper peer group for the year-to-date, one year, two year, three year, five year and ten year periods ended December 31, 2016. The Trustees also considered that the Fund underperformed the Barclays Capital Hawaii Municipal Bond Index, the Fund’s benchmark, for the one year, three year, five year and ten year periods ended December 31, 2016. Based upon their review, the Trustees concluded that the Fund’s performance was satisfactory and that the advisory fee was reasonable in light of the high quality of services received by the Fund from the AMG.
Pacific Capital Tax-Free Short Intermediate Securities Fund. With respect to advisory fees and expenses, the gross advisory fee and net total expense ratio for the Fund were lower than the median of the gross advisory fee and net total expense ratio of funds with a similar share class in the Lipper peer group with $250 million or less in assets. The Trustees also considered that the Adviser was currently voluntarily waiving its entire advisory fee with respect to the Fund. With respect to performance, the Fund underperformed the Barclays Capital Hawaii Municipal 3 year Bond Index, the Fund’s benchmark, for the one year, five year and ten year period and outperformed for the three year period ended December 31, 2016. Based upon their review, the Trustees concluded that the Fund’s performance was satisfactory and that the advisory fee was reasonable in light of the high quality of services received by the Fund from the AMG.
The Board then considered the level and depth of knowledge of the Adviser, including the professional experience and qualifications of senior personnel. In evaluating the quality of services to be provided by AMG, the Board took into account its familiarity with AMG’s senior management through Board meetings, discussions and reports during the preceding year. The Board also took into account AMG’s compliance policies and procedures and reports regarding AMG’s compliance operations from the Trust’s CCO. The Board also considered any potential conflicts of interest that may arise in a portfolio manager’s management of the Funds’ investments on the one hand, and the investments of other accounts, on the other. The Trustees reviewed the services provided to the Funds by AMG and concluded that the nature, extent and quality of the services were appropriate and consistent with the terms of the Agreement, that the quality of the proposed services appeared to be consistent with industry norms and that the Funds are likely to benefit from the continued provision of those services. They also concluded that AMG has sufficient personnel, with the appropriate education and experience, to serve the Funds effectively and had demonstrated its ability to attract and retain qualified personnel.
50
PACIFIC CAPITAL FUNDS
Other Information
(Unaudited)
The Trustees then considered the costs of the services provided by AMG, the compensation and benefits received by AMG in providing services to the Funds, as well as AMG’s profitability. The Trustees were provided with a profitability analysis for the Funds and the most recent financial statements for Bank of Hawaii Corporation, the parent company of AMG for the year ended December 31, 2016. The Trustees noted that AMG’s level of profitability is an important factor to consider, and the Trustees should be satisfied that AMG’s profits are sufficient to continue as a healthy concern generally and as investment adviser of the Funds specifically. The Trustees concluded that AMG’s contractual advisory fee level was reasonable in relation to the nature and quality of the services provided, taking into account the fees charged by other advisers for managing comparable mutual funds with similar strategies. The Trustees also concluded that the overall expense ratio of the fund was reasonable, taking into account the quality of services provided by AMG and the current size and projected growth of the Funds during the renewal term.
The Trustees considered the extent to which economies of scale would be realized relative to fee levels as the Funds grow, and whether the advisory fee levels reflect these economies of scale for the benefit of shareholders. The Board noted that economies of scale may be achieved at higher asset levels for each of the Funds for the benefit of the Funds’ shareholders, but that because such economies of scale did not yet exist and were not likely to exist in the near term, it was not appropriate to incorporate a mechanism for sharing the benefit of such economies with the Funds’ shareholders in the advisory fee structure at this time.
In voting to approve the continuation of the Agreement, the Board considered all factors it deemed relevant and the information presented to the Board by the Adviser. In arriving at its decision, the Board did not identify any single factor as being of paramount importance and each member of the Board gave varying weights to each factor according to his or her own judgment. The Board determined that the continuation of the Agreement would be in the best interests of the Funds and their shareholders. As a result, the Board, including a majority of the Independent Trustees, unanimously approved the continuation of the Agreement for an additional one year period.
51
PACIFIC CAPITAL FUNDS
Privacy Notice
(Unaudited)
The privacy of your personal financial information is extremely important to us. When you open an account with us, we collect a significant amount of information from you in order to properly invest and administer your account. We take very seriously the obligation to keep that information private and confidential, and we want you to know how we protect that important information.
We collect nonpublic personal information about you from applications or other forms you complete and from your transactions with us or our affiliates. We do not disclose information about you, or our former clients, to our affiliates or to service providers or other third parties, except as permitted by law. We share only the information required to properly administer your accounts, which enables us to send transaction confirmations, monthly or quarterly statements, financials and tax forms. Even within FundVantage Trust and its affiliated entities, a limited number of people who actually service accounts will have access to your personal financial information. Further, we do not share information about our current or former clients with any outside marketing groups or sales entities.
To ensure the highest degree of security and confidentiality, FundVantage Trust and its affiliates maintain various physical, electronic and procedural safeguards to protect your personal information. We also apply special measures for authentication of information you request or submit to us on our web site.
If you have questions or comments about our privacy practices, please call us at (888) 678-6034.
52
PACIFIC CAPITAL FUNDS
Fund Management
(Unaudited)
FundVantage Trust (the “Trust”) is governed by a Board of Trustees (the “Trustees”). The primary responsibility of the Trustees is to represent the interest of the Trust’s shareholders and to provide oversight management of the Trust.
The following tables present certain information regarding the Board of Trustees and officers of the Trust. None of the Trustees are an “interested person” of the Trust, the Adviser, another investment adviser of a series of the Trust, or Foreside Funds Distributors LLC, the principal underwriter of the Trust (“Underwriter”), within the meaning of the 1940 Act and each Trustee is referred to as an “Independent Trustee” and is listed under such heading below. The address of each Trustee and Officer as it relates to the Trust’s business is 301 Bellevue Parkway, 2nd Floor, Wilmington, DE 19809.
The Statement of Additional Information for the Fund contains additional information about the Trustees and is available, without charge, upon request by calling (888) 678-6034.
Name and Date of Birth | Position(s) Held with Trust | Term of Office and Length of Time Served | Principal Occupation(s) During Past Five Years | Number of Funds in Trust Complex Trustee | Other Directorships Held by Trustee | |||||
INDEPENDENT TRUSTEES
| ||||||||||
ROBERT J. CHRISTIAN Date of Birth: 2/49 |
Trustee and Chairman of the Board |
Shall serve until death, resignation or removal. Trustee and Chairman since 2007. |
Retired since February 2006; Executive Vice President of Wilmington Trust Company from February 1996 to February 2006; President of Rodney Square Management Corporation (“RSMC”) (investment advisory firm) from 1996 to 2005; Vice President of RSMC from 2005 to 2006.
|
42 |
Optimum Fund Trust (registered investment company with 6 portfolios). | |||||
IQBAL MANSUR Date of Birth: 6/55 | Trustee | Shall serve until death, resignation or removal. Trustee since 2007.
| University Professor, Widener University. | 42 | None. | |||||
53
PACIFIC CAPITAL FUNDS
Fund Management (Continued)
(Unaudited)
Name and Date of Birth | Position(s) Held with Trust | Term of Office and Length of Time Served | Principal Occupation(s) During Past Five Years | Number of Trust Complex | Other Directorships Held by Trustee | |||||
NICHOLAS M. MARSINI, JR. Date of Birth: 8/55 |
Trustee |
Shall serve until death, resignation or removal. Trustee since 2016. |
Retired since March 2016. President of PNC Bank Delaware from June 2011 to March 2016; Executive Vice President Finance of BNY Mellon from July 2010 to January 2011; Executive Vice President and Chief Financial Officer of PNC Global Investment Servicing from September 1997 to July 2010.
|
42 |
Brinker Capital Destinations Trust (registered investment company with 10 portfolios). | |||||
STEPHEN M. WYNNE Date of Birth: 1/55 |
Trustee |
Shall serve until death, resignation or removal. Trustee since 2009. |
Retired since December 2010; Chief Executive Officer of US Funds Services, BNY Mellon Asset Servicing from July 2010 to December 2010; Chief Executive Officer of PNC Global Investment Servicing from March 2008 to July 2010; President, PNC Global Investment Servicing from 2003 to 2008. |
42 |
Copeland Trust (registered investment company with 2 portfolios). Context Capital Funds (registered investment company with 1 portfolio).
| |||||
NANCY B. WOLCOTT Date of Birth: 11/54 |
Trustee |
Shall serve until death, resignation or removal. Trustee since 2011. |
Retired since May 2014; EVP, Head of GFI Client Service Delivery, BNY Mellon from January 2012 to May 2014; EVP, Head of US Funds Services, BNY Mellon from July 2010 to January 2012; President of PNC Global Investment Servicing from 2008 to July 2010; Chief Operating Officer of PNC Global Investment Servicing from 2007 to 2008; Executive Vice President of PFPC Worldwide Inc. from 2006 to 2007.
|
42 |
None. |
54
PACIFIC CAPITAL FUNDS
Fund Management (Concluded)
(Unaudited)
Name and Date of Birth | Position(s) Held with Trust | Term of Office and Length of Time Served | Principal Occupation(s) During Past Five Years | |||
EXECUTIVE OFFICERS
| ||||||
JOEL L. WEISS Date of Birth: 1/63 |
President and Chief Executive Officer |
Shall serve until death, resignation or removal. Officer since 2007. |
President of JW Fund Management LLC since June 2016; Vice President and Managing Director of BNY Mellon Investment Servicing (US) Inc. and predecessor firms from 1993 to June 2016. | |||
T. RICHARD KEYES Date of Birth: 1/57 |
Treasurer and Chief Financial Officer |
Shall serve until death, resignation or removal. Officer since 2016. |
President of TRK Fund Consulting since July 2016; Head of Tax — U.S. Fund Services of BNY Mellon Investment Servicing (US) Inc. and predecessor firms from February 2006 to July 2016. | |||
VINCENZO A. SCARDUZIO Date of Birth: 4/72 |
Secretary |
Shall serve until death, resignation or removal. Officer since 2012. |
Director and Vice President Regulatory Administration of BNY Mellon Investment Servicing (US) Inc. and predecessor firms since 2001. | |||
DAVID C. LEBISKY Date of Birth: 5/72 |
Chief Compliance Officer and Anti-Money Laundering Officer |
Shall serve until death, resignation or removal. Officer since 2015. |
President of Lebisky Compliance Consulting LLC since October 2015; Senior Consultant, Freeh Group International Solutions, LLC (a global risk management firm) since 2015; Scotia Institutional Investments US, LP, Director of Regulatory Administration from 2010 to 2014.
| |||
55
Investment Adviser
Asset Management Group of Bank of Hawaii
130 Merchant Street, Suite 370
Honolulu, HI 96813
Administrator
BNY Mellon Investment Servicing (US) Inc.
301 Bellevue Parkway
Wilmington, DE 19809
Transfer Agent
BNY Mellon Investment Servicing (US) Inc.
4400 Computer Drive
Westborough, MA 01581
Principal Underwriter
Foreside Funds Distributors LLC
400 Berwyn Park
899 Cassatt Road
Berwyn, PA 19312
Custodian
The Bank of New York Mellon
225 Liberty Street
New York, NY 10286
Independent Registered Public Accounting Firm
PricewaterhouseCoopers LLP
Two Commerce Square, Suite 1800
2001 Market Street
Philadelphia, PA 19103-7042
Legal Counsel
Pepper Hamilton LLP
3000 Two Logan Square
18th and Arch Streets
Philadelphia, PA 19103
PAC-0417

of
FundVantage Trust
Pacific Capital Tax-Free Securities
Fund
Pacific Capital Tax-Free Short
Intermediate Securities Fund
ANNUAL REPORT
April 30, 2017
This report is submitted for the general information of the shareholders of the Pacific Capital Funds. It is not authorized for distribution unless preceded or accompanied by a current prospectus for the Pacific Capital Funds.
POLEN GROWTH FUND
Annual Investment Adviser’s Report
April 30, 2017
(Unaudited)
Dear Shareholders,
The Polen Growth Fund (the “Fund”) delivered strong returns for the fiscal year ended April 30, 2017. The Fund’s Institutional Class Shares appreciated 15.5% during the fiscal year while the S&P 500 and Russell 1000 Growth indices rose 17.9% and 19.5%, respectively. In our shareholder letter from last year, we explained how economic growth was slowing around the globe, but today the opposite is true. Using the S&P 500 as a proxy for the market, we would characterize market earnings growth as very modest during the past five years (see chart below), but there has been a positive inflection in earnings growth during the last few quarters. Earnings growth turned positive during the third quarter of calendar year 2016, held steady during the fourth quarter, and has accelerated to strong double-digit growth in the first quarter of 2017. While a good bit of the recent acceleration is due to a recovery in the energy sector, which has rebounded and is now growing over very easy comparisons from the prior year, the broader economy does seem to be showing some improvement as well and this dynamic tends to have a powerful impact on market values.
During the first few quarters of calendar year 2016, energy, materials and telecom companies led the market higher. It seemed to us at the time that these stocks were leading because they were the laggards of the prior year and they offered dividend yield in what seemed to be a still challenging environment. We would now add to the list of possible explanations that those anticipating an economic recovery were investing in companies that tend to rebound earlier in an economic cycle. This trend became even more forceful following the election of President Trump, with the strong increase in share prices during the fourth quarter of 2016 led by financials and industrials on the expectation of rising interest rates, less regulation, increased infrastructure spending and emerging economic recovery. While President Trump’s agenda seemed to be the catalyst, the underlying improvements in the economy were likely the stronger and more enduring force. Markets were strong across the board in the first quarter of calendar 2017 as underlying growth improved markedly. Returns have remained strong through April and the first half of May even as President Trump’s ability to implement his agenda has become much less certain amidst setbacks in healthcare reform, little tangible progress on any of his initiatives and increasingly serious and growing distractions.
It seems a little curious to have an “economic recovery” drive share prices higher when we are already eight years into a bull market where values have been rising faster than fundamentals for years now, but that seems to be the dynamic at play recently. Perhaps 2015 and early 2016 were recession periods and the stock market just didn’t get the news. We say that with tongue in cheek. It seems quite likely that stimulative monetary policy across the globe damped the economic cycle and maintained the requisite optimism to keep market values moving higher. In a sense, monetary policy has done its job. It has buoyed asset values and is hopefully starting to stimulate the economic expansion needed to support those higher values. Rather than try to predict the direction of the market or the proper overall value, the way we navigate the environment for the Fund is to stay focused on the fundamentals and to concentrate our investments in only the best businesses. We remain steadfast in the belief that earnings growth drives performance over time and that maintaining a reasonably valued portfolio that is growing earnings
1
POLEN GROWTH FUND
Annual Investment Adviser’s Report
April 30, 2017
(Unaudited)
in the mid-teens will likely produce a solid investment return for our shareholders over the long term. You can see in the chart below that the Fund’s performance over the past five years has been supported by the underlying earnings growth of the holdings while the returns of the S&P 500 have greatly outpaced underlying earnings growth.
EPS or Earnings per share serves as an indicator of a company’s profitability. EPS growth represents the underlying securities in the fund’s portfolio and does not represent the performance of the fund. Past performance is no guarantee of future results.
The Fund’s top five contributors to returns for the year ended April 30, 2017 were Alphabet, Inc., Adobe Systems Incorporated, Facebook, Inc., Priceline Group Inc., and Visa Inc. In the fiscal 2016 annual letter, we talked about a few of the strong secular trends that supported some of our holdings and the continued strong performance of each of these businesses is a testament to that point. Alphabet, Facebook and Visa are repeat leaders from last year, each benefiting from strong execution and ongoing secular tailwinds. The strong performance of Adobe and Priceline also reflect the strong secular move of advertising and commerce, respectively, from offline to online. It certainly helped that each of these companies were among our highest portfolio weights during the year as well.
Alphabet delivered mid-20% growth in overall revenues and operating profits during calendar year 2016. Paid click growth, a good barometer of consumer engagement, accelerated throughout the year. Google websites’ revenue grew even faster than total revenues with strong growth in mobile search and YouTube driving results. U.S. revenue growth accelerated during the year and growth has remained strong in the rest of the world as well. With the shares trading for roughly 21 times our estimate of 2017 earnings per share (without even backing out more than $80 billion of cash on its balance sheet), we think Alphabet’s shares remain attractively valued. While we would not be surprised if its earnings multiple expanded, we think the company’s earnings growth alone should provide a strong investment return over the coming years.
2
POLEN GROWTH FUND
Annual Investment Adviser’s Report
April 30, 2017
(Unaudited)
Facebook dominates display digital advertising globally much like Alphabet’s Google dominates search advertising. During calendar year 2016, Facebook grew ad revenues 58% and EPS 86%. Even with less contribution from increasing ad load starting the second half of 2017, we still expect Facebook’s earnings to grow north of 20% per year for the next five years. Advertisers will certainly experiment with other platforms but there is no other social media platform with the consumer reach/engagement, segmentation ability and return on investment as Facebook’s. Additionally, we think Facebook’s valuation is quite attractive given its growth profile. With a next 12-month price to earnings multiple of about 25x, the company is essentially being valued like a business with less than half of its earnings growth. In fact, it trades at a discount to slow and steady companies like Church & Dwight and Ecolab as well as some highly cyclical, slow growers like Schlumberger.
Visa operates in a global duopoly with MasterCard (another Portfolio holding) and delivered another strong year as well. The long-term move to debit and credit from cash and check has been well in motion for nearly half a century in the United States but it is still much more nascent abroad. Our work indicates that digital payment penetration is only about 30% of what can eventually convert globally, so there is much runway to go. Additionally, Visa’s recent purchase of its European counterpart, Visa Europe, should allow for accelerating earnings growth over the next few years as Visa raises its prices in Europe closer to company average rates, which are nearly 3x higher. These rates were below market when Visa Europe was owned by a consortium of banks that were also its customers. With accretion from the Visa Europe acquisition expected to boost earnings during the next few years, we expect high-teens earnings per share growth from Visa in the coming five years.
Adobe dominates the market for digital creative software and is a market leader in digital marketing, with these businesses posting revenue growth of 38% and 20%, respectively, during Adobe’s fiscal year 2016. The company’s margins also expanded, driving 45% earnings per share growth. The company has elegantly transitioned to a cloud-based subscription revenue model at the same time the world needs more digital content and the tools to measure the effectiveness of that content. Adobe is the only player that offers leading products that addresses both these needs, and the company’s growth indicates that it is distancing itself from the competition. As the explosion in digital content creation drives greater use of digital marketing, which will eventually drive even greater need for digital content, we expect Adobe’s EPS growth to remain well above 20% for years to come.
Priceline had a strong year, as well, with gross bookings set to grow more than 20% over the prior year. Despite a rather lackluster global economy and multiple terrorist attacks in Europe, where Priceline’s Booking.com platform is so dominant, the business maintained a strong and steady growth cadence throughout the year. Given the company’s leadership position, the clear secular shift to online booking, and the still relatively modest global penetration, we expect Priceline to deliver strong growth for years to come. Our only nagging concern is the continued declining return on investment in ad spending, especially for Google AdWords. Even with nearly half of its bookings from customers coming direct to
3
POLEN GROWTH FUND
Annual Investment Adviser’s Report
April 30, 2017
(Unaudited)
a Priceline property, the company has had to continue to pay more and more for online advertising. While this is a clear sign of Google’s strength, it is a margin headwind for Priceline. Our hope is that over time this headwind abates, but for the foreseeable future Priceline’s earnings growth is likely to lag revenue growth. We still feel very positive about the company’s long-term prospects but we trimmed the position near the end of calendar year 2016.
Our largest detractors to performance this past year were Fastenal Company, Dollar General Corporation and NIKE, Inc. Each of these holdings are discussed below. Regeneron Pharmaceuticals, Inc. was also relative detractor with its share price roughly flat during the fiscal year.
While we continue to believe that Fastenal has a competitively advantaged business model and will continue to gain share of the highly fragmented industrial distribution market over time, the business was even more sensitive to the global macro environment than we anticipated and was clearly running into the wind. Both the decline in the price of oil in 2015 and the strengthening of the U.S. dollar had a meaningful impact on Fastenal’s multinational customers. We looked through the near-term impact of those factors during the first year because we thought management was doing the right things for the long-term (investing in selling capacity, increasing wallet share with large national accounts and augmenting its vending and onsite businesses) and because we thought growth would improve as those headwinds abated. Stronger growth was not materializing though, despite easier comparisons. While the price of oil and the strength of the U.S. dollar had become less of an issue on a year-over-year basis, they both remained absolute overhangs. In particular, the company’s multinational customers continue to sell their products abroad at a still relatively expensive price given U.S. dollar strength. This was depressing demand and therefore the need for fasteners and other Fastenal products. At the end of the day, this predominantly U.S. business was simply more impacted by ongoing weakness outside the United States than we expected. We decided that there were easier paths forward and exited the position.
We added a new position in Dollar General during the year, but share price performance has been lackluster thus far. Dollar General is one of the largest discount retailers in the United States with nearly 13,000 stores. It offers customers roughly 10,000 core stock keeping units (much fewer than supermarkets or drug stores), which are mostly everyday consumables like paper and cleaning products, packaged food, snacks, and health and beauty products. They sell these products at everyday low prices that are on par with pricing from mass merchants like Wal-Mart and 20-40% cheaper than drug stores, convenience stores and supermarkets. Most merchandise is from nationally advertised consumer brands like Proctor & Gamble, Pepsi, Coca-Cola, Nestle, etc. as well as Dollar General’s own private label brands. We believe Dollar General has competitive advantages due to its scale (it is a top 10 purchaser from nearly all the largest consumer products companies globally), its low-cost operating structure, and its repeat shopper captivity from its unique combination of best prices and best convenience. During 2016, food cost deflation and the reduction in food stamp benefits presented growth headwinds, but we believe the business will rebound as these headwinds abate.
NIKE experienced a few challenges during the year as well. Key competitor Adidas saw a resurgence in growth in North America as “lifestyle” products were in strong demand during the year. NIKE sells
4
POLEN GROWTH FUND
Annual Investment Adviser’s Report
April 30, 2017
(Unaudited)
some lifestyle products, but its portfolio is much more tilted toward performance-oriented gear. NIKE also experienced lower sell-through on a few key items, most notably two signature styles in basketball, and was cycling very tough comparisons following above-average share gains for several prior years. The net result was slow growth in North America during 2016, leading management to take action to better align inventory levels, which had become elevated. Overall revenue growth remained strong throughout the year, thanks to ongoing strength in Western Europe, emerging markets and China in particular, but resetting the inventory level in North America pressured gross margins and profitability. NIKE’s earnings per share grew about 11% during calendar year 2016, but the stock declined about 6% during the year ended April 30, 2017. NIKE shares were at the high end of their historical valuation range at the beginning of the Fund’s fiscal year, so the multiple compressed more than NIKE’s earnings power. We think the company remains well positioned to deliver mid-teens earnings per share growth over the next several years and is now trading for a much less demanding valuation.
There were a couple of cross currents that weighed on Regeneron’s share price during 2016. Earlier in the year biotech companies came under pressure as rhetoric about possible drug price regulation reached a fever pitch. Some of this was due to normal election year noise, but there were also some bad actors in the pharma space that instituted egregious price hikes on non-innovative drugs, which raised the ire of legislators. The Center for Medicare and Medicaid Services (CMS) also launched a pilot program to examine changing the way Medicare Part B drugs are reimbursed. Regeneron’s Eylea is reimbursed through Part B, so this created a more acute concern about future pricing pressure on the drug. Outside of the possibility of lower drug prices, Regeneron’s revenue growth was also slowing while management was ramping expenses in advance of new products expected to launch in early 2017. While revenue rose almost 20% during calendar year 2016, earnings were down a bit for the year. Given these dynamics, we are not surprised that this was a more challenging year for the stock. We were patient during the year given the number of cross currents, but decided to raise our position in Regeneron near the end of the year once it was becoming clear that the Medicare Part B reimbursement pilot program was not going to progress and the risk to Eylea was minimal. The launch of two new treatments, DUPIXENT and Kevzara, also add new growth drivers that we believe will be substantial over time. DUPIXENT, in particular, has multi-billion-dollar sales potential and is being studied for a wide range of allergic indications.
We feel very good about how the Fund is invested today. The Fund’s underlying holdings have continued to deliver strong earnings growth — collectively above our mid-teens, long-term target recently — and the Fund remains very reasonably valued. If the economy continues to pick up momentum, we believe our portfolio of growth companies will benefit from a better economic environment. We feel equally confident that the Fund holdings can continue to deliver solid underlying earnings growth if the recent economic improvements prove to be more fleeting. We invest with a 5+ year investment horizon, which seeks to produce a strong portfolio for all seasons.
Thank you for your investment in the Polen Growth Fund.
Sincerely,
5
POLEN GROWTH FUND
Annual Investment Adviser’s Report
April 30, 2017
(Unaudited)
Dan Davidowitz
Damon Ficklin
This letter is intended to assist shareholders in understanding how the Fund performed during the fiscal year ended April 30, 2017 and reflects the views of the investment adviser at the time of this writing. Of course, these views may change and do not guarantee the future performance of the Fund or the markets.
Portfolio composition is subject to change. The current and future portfolio holdings of the Fund are subject to investment risk. The investment return and principal value of an investment in the Fund will fluctuate so that an investor’s shares, when redeemed, may be worth more or less than their original cost.
6
POLEN GROWTH FUND
Annual Report
Performance Data
April 30, 2017
(Unaudited)
Comparison of Change in Value of $100,000 (investment minimum) Investment in Polen Growth Fund
Institutional Class Shares
vs Russell 1000® Growth Index and S&P 500® Index
| Average Annual Total Returns for the Periods Ended April 30, 2017 | ||||||||||||||||||
| 1 Year | 3 Years | 5 Years | Since Inception* | |||||||||||||||
Institutional Class | 15.50% | 14.08% | 12.54% | 14.77% | ||||||||||||||
S&P 500® Index | 17.93% | 10.51% | 13.70% | 14.92%** | ||||||||||||||
Russell 1000® | ||||||||||||||||||
Growth Index | 19.51% | 12.14% | 13.89% | 15.94%** | ||||||||||||||
| * | The Polen Growth Fund (the “Fund”) Institutional Class Shares commenced operations on September 15, 2010. |
| ** | Benchmark performance is from the commencement date of the Fund Class only and is not the commencement date of the benchmark itself. |
The performance data quoted represents past performance and does not guarantee future results. Current performance may be lower or higher. Performance data current to the most recent month-end may be obtained by calling (888) 678-6024. The investment return and principal value of an investment will fluctuate so that shares, when redeemed, may be worth more or less than their original cost. The graph and table do not reflect the deduction of taxes that a shareholder would pay on Fund distributions or the redemption of Fund shares.
7
POLEN GROWTH FUND
Annual Report
Performance Data
April 30, 2017
(Unaudited)
Comparison of Change in Value of $10,000 Investment in Polen Growth Fund Investor Class Shares
(formerly Retail Class) vs Russell 1000® Growth Index and S&P 500® Index
| Average Annual Total Returns for the Periods Ended April 30, 2017 | ||||||||||||||||||
| 1 Year | 3 Years | 5 Years | Since Inception* | |||||||||||||||
Investor Class | 15.24% | 13.78% | 12.27% | 12.79% | ||||||||||||||
S&P 500® Index | 17.93% | 10.51% | 13.70% | 12.98%** | ||||||||||||||
Russell 1000® | ||||||||||||||||||
Growth Index | 19.51% | 12.14% | 13.89% | 13.62%** | ||||||||||||||
| * | The Investor Class Shares commenced operations on December 30, 2010. |
| ** | Benchmark performance is from the commencement date of the Fund Class only and is not the commencement date of the benchmark itself. |
The performance data quoted represents past performance and does not guarantee future results. Current performance may be lower or higher. Performance data current to the most recent month-end may be obtained by calling (888) 678-6024. The investment return and principal value of an investment will fluctuate so that shares, when redeemed, may be worth more or less than their original cost. The graph and table do not reflect the deduction of taxes that a shareholder would pay on Fund distributions or the redemption of Fund shares.
8
POLEN GROWTH FUND
Annual Report
Performance Data (Concluded)
April 30, 2017
(Unaudited)
The Fund’s “Total Annual Fund Operating Expenses” and “Total Annual Fund Operating Expenses After Fee Waiver and/or Expense Reimbursement”, as stated in the current prospectus dated September 1, 2016 as supplemented December 27, 2016, are 1.02% and 1.00%, respectively, for the Institutional Class shares and 1.27% and 1.25%, respectively, for the Investor Class shares of the Fund’s average daily net assets, which may differ from the actual expenses incurred by the Fund for the period covered by this report. Polen Capital Management, LLC (“PCM” or the “Adviser”), has contractually agreed to reduce its investment advisory fee and/or reimburse certain expenses of the Fund to the extent necessary to ensure that the Fund’s total operating expenses (excluding taxes, any class-specific fees and expenses, interest, extraordinary items, “Acquired Fund” fees and expenses and brokerage commissions) do not exceed 1.00% (on an annual basis) with respect to the Fund’s average daily net assets (the “Expense Limitation”). The Expense Limitation will remain in place until August 31, 2018 unless the Board of Trustees of FundVantage Trust (the “Trust”) approves its earlier termination. The Adviser is entitled to recover, subject to approval by the Board of Trustees, any fees waived and/or expenses reimbursed by the Adviser on or after January 1, 2017 with respect to the Fund for a three year period following the date of such fee waiver and/or expense reimbursement. The Adviser is permitted to seek reimbursement from the Fund, subject to certain limitations, for fees it waived and Fund expenses it paid to the extent the total annual fund operating expenses do not exceed the limits described above or any lesser limits in effect at the time of reimbursement. No recoupment will occur unless the Fund’s expenses are below the Expense Limitation amount. Total returns would be lower had such fees and expenses not been waived and/or reimbursed.
A 2.00% redemption fee applies to shares redeemed within 60 days of purchase. This redemption fee is not reflected in the returns shown above.
The Fund intends to evaluate performance as compared to that of the Standard & Poor’s 500 (“S&P 500®”) Index and the Russell 1000® Growth Index. The S&P 500® Index is a widely recognized, unmanaged index of 500 common stocks which are generally representative of the U.S. stock market as a whole. The Russell 1000® Growth Index is an unmanaged index that measures the performance of the large-cap growth segment of the U.S. equity universe. It includes those Russell 1000® Growth Index companies with higher price-to-book ratios and higher forecasted growth values. It is impossible to invest directly in an index.
All mutual fund investing involves risk, including possible loss of principal. The Fund is non-diversified, which means that a large portion of the Fund’s assets may be invested in one or few companies or sectors. The Fund could fluctuate in value more than a diversified fund.
9
POLEN GLOBAL GROWTH FUND
Annual Investment Adviser’s Report
April 30, 2017
(Unaudited)
Dear Shareholders,
For the fiscal year ending April 30, 2017, Polen Global Growth Fund’s Institutional Class Shares returned 15.24% compared to 15.13% for the Fund’s benchmark, MSCI All-Country World Index.*
The letter I wrote two years ago, shortly after the Fund was launched, outlined the Fund’s approach of committing our shareholders’ capital to long-term and high-conviction investments in 25-35 leading and high-quality growth businesses around the world. The letter went on to say that we believe the quality of these businesses and their compound earnings growth would be the main drivers of investment performance over the years to come. Last year’s letter talked more about the Fund’s resilience and relative outperformance during a year when global stocks declined. This year, the theme was stronger absolute returns – with investment performance driven by earnings growth.
The Fund returned just over 15% to shareholders, which was similar to the performance of its benchmark. Yet most of the benchmark’s performance came from sectors where the Fund has very low, if any exposure, including energy, financials, industrials and materials. These sectors are less than 10% of the Fund but more than 40% of the benchmark. A combination of low interest rates, generally favorable macroeconomic conditions, and the outcome of elections in the United States seemed to fuel risk appetite. These sectors where we do not find the quality of earnings and the balance sheet strength we are looking for, sectors that are in fact too sensitive to macroeconomic conditions to be represented in the Fund, generated about half the benchmark’s performance.
Meanwhile, Fund investments remain concentrated in sectors where we find more durable earnings growth and financial strength, including consumer discretion, consumer staples, health care and technology. As a result, average U.S. dollar earnings growth has been in the mid-teens (including 14% in calendar year 2015 and 16% in 2016). I think the persistence of earnings in less cyclical sectors explains the Fund’s investment performance to date. The annualized return since December 30, 2014 is 9.31% compared to 4.94% for MSCI ACWI (Net Dividend), a difference of 4.37%.*
* The Fund’s benchmark is MSCI All Country World Index (‘ACWI’) (Net Dividend) net of withholding taxes. The performance of MSCI ACWI (Gross Dividend) gross of withholding taxes was 15.78% for the year ended 30th April, 2017 and 5.53% since the Fund’s inception on 30th December, 2014. The Polen Global Growth Fund changed its benchmark index during the fiscal year ended April 30, 2017 from MSCI ACWI (Gross Dividend) to MSCI ACWI (Net Dividend). The Advisor believes the Net Dividend version of the index, which reinvests dividends after the deduction of withholding taxes (i.e., “net”), is the better comparison index for the Fund as there may be instances whereby dividends earned by the Fund will not be subject to double taxation treaties and dividends will, indeed, be received net of withholding taxes.
Overview of the Fund:
The Fund is invested in 27 leading growth businesses with the competitive advantages we anticipate will sustain above-average earnings growth over a holding period of at least five years. Some holdings compound faster and some more slowly but the entire portfolio is managed for at least low double-digit
10
POLEN GLOBAL GROWTH FUND
Annual Investment Adviser’s Report
April 30, 2017
(Unaudited)
growth in earnings per share. Sixteen of the 27 businesses and 60% of assets are based in the United States, 11 holdings and 33% of assets are based in nine other countries, and the residual 7% of assets are cash. Most holdings are larger capitalization, globally competitive businesses that generate earnings in several countries. Based on revenues generated by each company, the Fund is evenly balanced, with approximately 50% of revenues generated in the United States and 50% generated in the rest of the world. This allocation reflects where we find the highest-quality businesses. The average market capitalization is $159 billion. These seasoned and larger cap businesses are often relatively stable, operating across borders with natural or financial hedges which help prevent country and currency risk becoming a meaningful source of risk or return. Twenty-three of the 27 holdings have been held since inception. As almost all businesses have been performing in-line with or above our expectations, activity has been muted and turnover has been less than 10%.
Performance Attribution:
The strongest contributors to investment performance last year included Tencent Holdings Limited, Alphabet Inc. and ARM Holdings PLC.
Tencent is now a top-five holding. The company has successfully bundled and integrated a range of online services used by approximately 700 million smartphone subscribers in China, services that seem to have become indispensable including messaging, social networking, voice calls, browsing, and gaming ecommerce and payments. The WeChat app might be used to book a hospital appointment or pay a parking ticket. Infants too young to carry a mobile phone may have a cuddly toy that is also a connected device to chat with his or her parents. The app might be better described as an operating system that helps users navigate the day, accounting for about 33% of the time all Chinese mobile phone users spend online. About half of all users have linked their bank accounts to the WeChat app, which is routinely used for a variety of online and offline payments. If all of this sounds hard to imagine, it is because no platform outside China has come close to the usefulness WeChat provides and its relevance to its users’ lives. To most WeChat users, Western apps would look like a step backwards. You might say that to understand the future of the mobile internet, the West should look to China, except even the strongest internet enterprises in the United States will struggle to achieve the integration WeChat has achieved. The strong engagement Tencent enjoys from a very large population and a scalable business model point to a sustainable stream of earnings to come. The share price has been appreciating approximately in line with trend growth in earnings per share of close to 30%. While some growth has been coming from further expansion in the numbers of users, most has been driven by increasing revenue per user across smartphone games, advertising and social networking. At the time of writing, Tencent’s market capitalization of more than $300 billion makes it the most valuable public company based outside the United States.
Alphabet, the largest weighting in the Fund, also contributed to investment performance. The company is best known for Google search but it also has strong engagement and more than one billion active users across each of its largest platforms, including the Android operating system, Chrome browser,
11
POLEN GLOBAL GROWTH FUND
Annual Investment Adviser’s Report
April 30, 2017
(Unaudited)
Google Maps, YouTube, Google Play, and of course Gmail. Advertising on Google websites remains by far the largest source of revenue although content and other sources of revenues are becoming more important. Share price performance has benefited from persistent growth in advertising volumes, revenues, earnings and free cash flow. Revenues (in constant currency) and free cash flow have compounded at a 20% rate over the last five years, although more recently growth has slightly accelerated. The company is now attracting more than 30% of the growth in all media ad spending globally – including both offline and online – well above its current market share of 12%.
Detractors from performance included Novo Nordisk A/S and Baidu, Inc.
Novo is the leading diabetes-care business in the world with a track record of innovation and consistent, profitable growth. Diabetes is both a pandemic that affects about 400 million people and a chronic disease that can lead to increased risk of heart attack, stroke, kidney failure and blindness, among other complications. The diabetes patient population continues to grow as a result of dietary trends, rising incidence of obesity and the rate of urbanization in emerging markets, yet relatively few patients receive the care they need. The primary treatment for diabetes is a range of insulin analogs that do not cure diabetes but effectively and safely control the disease, reducing the risk of complications and even more serious illness (and of course the costly additional burden for health care systems). Still, only about 50 million people, or less than 15% of the patient population, use insulin, which suggests a long runway of growth for the company. Novo’s market share of insulin is about 40% but its shares are higher, in the 50%-60% range, in next generation diabetes products. This market position reflects the company’s commitment to science and innovation over the decades, as well as a $2 billion annual investment in research and development that fuels a healthy product pipeline. The margin of safety around the business is partly the recurring use of insulin to control diabetes and partly its financial strength. Over the last five years the business has generated $20 billion in free cash flow after its investment in research and sales (almost all of which has been returned to shareholders). Other competitive advantages include low cost production and a global sales footprint. In summary, Novo has many of the attributes of a steady and sustainable growth business. However, the stock has become a poster child for the opaque and convoluted way insulin and some drug prices are being set in the United States - an important market for the company which accounts for around 50% of net revenue. For some patients, the cost of insulin is soaring as market power has shifted in a way that benefits intermediaries in the United States. At the time of writing, Novo remains the Fund’s smallest holding.
Changes to the Fund:
The Fund’s activity included additions to a number of existing holdings as well as the addition of a new holding in Align Technology Inc.
Align manufactures small, clear, customized plastic braces used by orthodontists and dentists to straighten teeth. It is also a global market leader driving the development of a product category as clear plastic braces become a better alternative to traditional metal wire orthodontics for many patients. This
12
POLEN GLOBAL GROWTH FUND
Annual Investment Adviser’s Report
April 30, 2017
(Unaudited)
category seems particularly attractive because straight (and white) teeth have become increasingly important and needs based to both adults and teenagers. Demand is still discretionary, but braces are increasingly seen as an investment in personal and professional success. Most sales come from the Invisalign brand, which is well established and often requested by name. Although Invisalign dominates the space with more than 90% share of clear braces and more than 4 million cases to date, the company is still in its early stages, with no more than 10% share of its addressable market. We believe the competitive moat around the business is very strong for a company of this size. Aside from the brand that resonates with consumers, Align has forged strong relationships with the approximately 50,000 orthodontists and dental practices it serves. Would be competitors have been slow to enter the space but, even if they can work around the patents protecting designs unique to Invisalign, they may struggle to match Align’s material science, the science that allows a lightweight, comfortable and removable piece of plastic to safely and effectively move bones in the jaw. The know how required to manufacture customized braces at scale and the digital asset – the accumulation of knowledge and experience over more than 15 years used to design molds before braces are printed – are additional, formidable competitive barriers.
Three holdings were eliminated in the course of the year.
The investment in ARM was sold after a bid for the company. ARM’s engineers design processor chips used in mobile phones and a range of other connected devices. Over the years, ARM has specialized in processors designed to extract more computing power and performance from limited battery life. For example, through continuous improvements in design, an ARM smartphone provides more computing power than the supercomputers of the early 1990s. As rival Intel has struggled to make inroads in smart devices, ARM’s designs have become industry standard and used in more than 90% of all mobile phones. Most of the world’s population – almost 5 billion people – rely on an ARM based mobile phone. Besides mobile phones, ARM’s designs are used in a range of other consumer electronic products. Last year the company earned an average royalty of approximately 5.5 cents on more than 16 billion devices shipped to customers. Looking ahead, ARM is in a strong position to maintain its leadership in mobile computing and extend its technology into less mature markets including networking equipment, server computers, and connected devices that will become the internet of things. We had been looking forward to double digit unit growth, recurring royalty revenues, very high margins and strong generation of free cash flow. However, we parted company with the investment sooner than expected, following an offer made for the company by SoftBank Group Corp. last July. SoftBank’s cash offer of GBP 17 per share represented a premium of 71% to the year to date average price. In effect, the offer compressed the returns from years of compounding into 2016. Given the premium and the lack of a competing offer, ARM was sold shortly before the transaction was completed.
A holding in Baidu Inc. was also eliminated following a change in business strategy that made the business a somewhat less predictable and less compelling investment compared to alternatives. Baidu is by far the leading Chinese language search engine with a commanding share of more than 75% of all search queries and 25% share of all revenues from online advertising in China. The weight was reduced in 2015 after management announced plans to invest significantly in a range of online to offline
13
POLEN GLOBAL GROWTH FUND
Annual Investment Adviser’s Report
April 30, 2017
(Unaudited)
(O2O) services and other capabilities. At the time, I believed a degree of uncertainty had been introduced to the investment case, but the core search business continued to perform well and much as expected, with strong and profitable revenue growth in the range of 25% 30% at more than 50% operating margins. Further, the company had completed a successful transition to mobile and maps based search and innovated in ways that enhanced users’ experiences, including the use of artificial intelligence to answer search queries. O2O investments weighed heavily on earnings in 2015 and 2016 brought further challenges. The run rate of expenses related to strategic but loss making activities remained high, in the order of $3 billion per year, an aggressive level of investment in promising but unproven market opportunities for a company with $10 billion in revenues. New regulations on search based advertising further complicated the picture and temporarily slowed the search business. In summary, Baidu became an attractive but no longer optimal investment for a best of breed global fund. We will continue to monitor Baidu closely and may consider investing in Baidu again in the future when and if we can gain the conviction to invest at a larger weight.
The sale of Abbott Laboratories was completed early in the year. The initial investment was based on the relatively steady health care business with revenues balanced across nutrition products, medical devices, diagnostic equipment and branded generic drugs. Management had refocused the business away from pharmaceuticals in developed markets and toward structural growth from markets with lower levels of health care spending. Capital allocation appeared to be a strength of the management team. I saw Abbott as a business with low policy risk compared to many healthcare peers, with roughly 50% of sales direct-to-consumer. These considerations made the decision by Abbott’s board to pursue an acquisition of St. Jude Medical, Inc. even more surprising. The acquisition seemed to represent a departure from a clearly articulated strategy. It was also a surprising allocation of a large amount of capital away from more promising growth markets to a less attractive category. Further, after repurchasing shares for a few years, Abbott announced it would fund the acquisition with loans that would bring the prospective debt burden above the levels I am comfortable with. The decision was to part ways with a business that seems to have lost focus on internal growth.
Outlook:
The Fund continues to invest in the relatively few leading growth businesses around the world we consider capable of sustaining double digit growth rates in earnings and cash flow. I expect compound growth in earnings and cash flows will remain the main driver of investment performance.
Thank you for your investment in the Polen Global Growth Fund.
Sincerely,
Julian Pick, CFA,
14
POLEN GLOBAL GROWTH FUND
Annual Investment Adviser’s Report
April 30, 2017
(Unaudited)
This letter is intended to assist shareholders in understanding how the Fund performed during the period ended April 30, 2017 and reflects the views of the investment adviser at the time of this writing. Of course, these views may change and do not guarantee the future performance of the Fund or the markets.
Portfolio composition is subject to change. The current and future portfolio holdings of the Fund are subject to investment risk. The investment return and principal value of an investment in the Fund will fluctuate so that an investor’s shares, when redeemed, may be worth more or less than their original cost.
All mutual fund investing involves risk, including possible loss of principal. The Fund is non-diversified, which means that a large portion of the Fund’s assets may be invested in one or few companies or sectors. The Fund could fluctuate in value more than a diversified fund. Investing in foreign securities entails special risks, such as fluctuations in currency exchange rates and possible lax regulation of securities markets and accounting practices.
15
POLEN GLOBAL GROWTH FUND
Annual Report
Performance Data
April 30, 2017
(Unaudited)
Comparison of Change in Value of $100,000 (investment minimum) Investment in Polen Global Growth Fund
Institutional Class Shares
vs MSCI All Country World® Index
| Average Annual Total Returns for the Periods Ended April 30, 2017 | ||||||||||||
| 1 Year | Since Inception* | |||||||||||
Institutional Class | 15.24 | % | 9.31% | |||||||||
MSCI All Country World ® Index (“ACWI”)(Gross Dividend) | 15.78 | % | 5.53%** | |||||||||
MSCI All Country World ® Index (“ACWI”)(Net Dividend)*** | 15.13 | % | 4.94%** | |||||||||
| * | The Polen Global Growth Fund (the “Fund”) Institutional Class Shares commenced operations on December 30, 2014. |
| ** | Benchmark performance is from commencement date of the Fund Class (December 30, 2014) only and is not the commencement date of the benchmark itself. |
| *** | The Advisor believes the Net Dividend version of the index, which reinvests dividends after the deduction of withholding taxes (i.e., “net”), is the better comparison index for the Fund as there may be instances whereby dividends earned by the Fund will not be subject to double taxation treaties and dividends will, indeed, be received net of withholding taxes. |
The performance data quoted represents past performance and does not guarantee future results. Current performance may be lower or higher. Performance data current to the most recent month-end may be obtained by calling (888) 678-6024. The investment return and principal value of an investment will fluctuate so that shares, when redeemed, may be worth more or less than their original cost. The graph and table do not reflect the deduction of taxes that a shareholder would pay on Fund distributions or the redemption of Fund shares.
16
POLEN GLOBAL GROWTH FUND
Annual Report
Performance Data
April 30, 2017
(Unaudited)
Comparison of Change in Value of $10,000 Investment in Polen Global Growth Fund Investor Class Shares
(formerly Retail Class) vs MSCI All Country World® Index
| Average Annual Total Returns for the Periods Ended April 30, 2017 | ||||||||||||
| 1 Year | Since Inception* | |||||||||||
Investor Class | 15.00 | % | 9.83% | |||||||||
MSCI All Country World ® Index (“ACWI”)(Gross Dividend) | 15.78 | % | 5.89%** | |||||||||
MSCI All Country World ® Index (“ACWI”)(Net Dividend)*** | 15.13 | % | 5.30%** | |||||||||
| * | The Polen Global Growth Fund (the “Fund”) Investor Class Shares commenced operations on July 6, 2015. |
| ** | Benchmark performance is from commencement date of the Fund Class (July 6, 2015) only and is not the commencement date of the benchmark itself. |
| *** | The Advisor believes the Net Dividend version of the index, which reinvests dividends after the deduction of withholding taxes (i.e., “net”), is the better comparison index for the Fund as there may be instances whereby dividends earned by the Fund will not be subject to double taxation treaties and dividends will, indeed, be received net of withholding taxes. |
The performance data quoted represents past performance and does not guarantee future results. Current performance may be lower or higher. Performance data current to the most recent month-end may be obtained by calling (888) 678-6024. The investment return and principal value of an investment will fluctuate so that shares, when redeemed, may be worth more or less than their original cost. The graph and table do not reflect the deduction of taxes that a shareholder would pay on Fund distributions or the redemption of Fund shares.
The Fund’s “Total Annual Fund Operating Expenses” and “Total Annual Fund Operating Expenses After Fee Waiver and/or Expense Reimbursement”, as stated in the current prospectus dated September 1, 2016, are 3.63% and 1.10%, respectively, for the Institutional Class shares and 3.51% and 1.35%, respectively, for the Investor Class
17
POLEN GLOBAL GROWTH FUND
Annual Report
Performance Data
April 30, 2017
(Unaudited)
shares of the Fund’s average daily net assets, which may differ from the actual expenses incurred by the Fund for the period covered by this report. Polen Capital Management, LLC (“PCM” or the “Adviser”), has contractually agreed to reduce its investment advisory fee and/or reimburse certain expenses of the Fund to the extent necessary to ensure that the Fund’s total operating expenses (excluding taxes, any class-specific fees and expenses, interest, extraordinary items, “Acquired Fund” fees and expenses and brokerage commissions) do not exceed 1.10% (on an annual basis) with respect to the Fund’s average daily net assets (the “Expense Limitation”). The Expense Limitation will remain in place until August 31, 2018 unless the Board of Trustees of FundVantage Trust (the “Trust”) approves its earlier termination. The Adviser is entitled to recover, subject to approval by the Board of Trustees, such amounts reduced or reimbursed for a period of up to three (3) years from the year in which the Adviser reduced its compensation and/or assumed expenses for the Fund. The Adviser is permitted to seek reimbursement from the Fund, subject to certain limitations, for fees it waived and Fund expenses it paid to the extent the total annual fund expenses do not exceed the limits described above or any lesser limits in effect at the time of reimbursement. No recoupment will occur unless the Fund’s expenses are below the Expense Limitation. Total returns would be lower had such fees and expenses not been waived and/or reimbursed.
A 2.00% redemption fee applies to shares redeemed within 60 days of purchase. This redemption fee is not reflected in the returns shown above.
The Fund intends to evaluate performance as compared to that of the MSCI ACWI Index (Net Dividend), which captures large and mid-cap representation across 23 Developed Markets (DM) and 23 Emerging Markets (EM) countries. With 2,466 constituents, the index covers approximately 85% of the global investable equity opportunity set. Indexes are unmanaged and it is not possible to invest directly in an index.
All mutual fund investing involves risk, including possible loss of principal. The Fund is non-diversified, which means that a large portion of the Fund’s assets may be invested in one or few companies or sectors. The Fund could fluctuate in value more than a diversified fund. Investing in foreign securities entails special risks, such as fluctuations in currency exchange rates and possible lax regulation of securities markets and accounting practices.
The Fund may invest a substantial amount of its assets in issuers located in a limited number of countries. If the Fund concentrates its investments in this manner, it assumes the risk that economic, political and social conditions in those countries will have a significant impact on its investment performance. The Fund’s investment performance may also be more volatile if it concentrates its investments in certain countries, especially emerging market countries.
18
POLEN INTERNATIONAL GROWTH FUND
Annual Investment Adviser’s Report
April 30, 2017
(Unaudited)
Dear Shareholders,
We launched the Polen International Growth Fund at the end of 2016. This submission will explain the International Growth strategy’s approach, discuss why we think we can beat the benchmark in the long run and end with a review of the first four months’ performance.
Our approach to International Investing
We are fortunate to use the Polen Capital investment philosophy, process and discipline – a time-tested formula that for more than 28 years blazed a trail that we’ll now follow with this strategy. Our Focus Growth strategy, which invests mostly in the United States, compounded investor capital at greater than 14% annually since inception, a margin of relative outperformance that grew our original investors’ capital into a 39x return versus just a 14x return on investments made in the passive S&P 500 Index.
In this Fund we apply the same investment strategy to the international sphere (“International Growth”). We view international equity markets through the same high-quality, growth-minded lens used in both our Focus Growth and Global Growth strategies. The Fund holds companies headquartered outside the United States, with latitude to invest in developed, emerging and frontier markets. Our process adds a layer of risk management for country specific and sovereign level risks. We are overweight in developed markets today with a preference for stability. We do not hedge currency exposures as companies held in the Fund’s portfolio of investments may hedge themselves and oftentimes generate revenues in the same currencies in which they bear expenses, providing a natural hedge.
Let’s briefly review the core principles of our philosophy: quality, growth, concentration and a long-term time horizon. Each bears importance to our success.
Core Principles
Quality is our hallmark at Polen Capital. We define quality as high returns on equity achieved by companies with strong balance sheets. When a company clears these hurdles for extended periods there is a decent chance that it enjoys a competitive advantage. Such companies can reinvest their earnings at these high rates to drive compounded growth. Quality also matters because we intend for the Fund to compound for the long term and one key to high compounded rates of return is holding up well when markets falter. We believe quality improves our potential to protect investor capital in weak markets and we’re excited about International Growth’s potential to do just that. Meaningful relative outperformance in down markets since 1989 has contributed to Focus Growth’s long-term performance and that is due in part to quality. One aim of quality investing is to avoid garbage. There are quite a few low-quality companies out there and passive indexes hold their fair share.
Growth fuels returns. If you’ve read commentaries for our other strategies, you know we’re dogmatic in the belief that share prices following earnings growth over time. A simple fact is that Focus Growth’s
19
POLEN INTERNATIONAL GROWTH FUND
Annual Investment Adviser’s Report
April 30, 2017
(Unaudited)
more than 14% annual returns since inception slightly trails the weighted average earnings per share growth of its constituent holdings. We seek companies that can contribute consistent earnings growth to our Fund over time. This is often achieved through reinvestment as discussed in the last section. Our desire for earnings persistence means we’ll usually shy away from cyclical businesses.
Concentration limits risk. We run active strategies that look nothing like their benchmarks. The International Growth Fund holds 26 companies today. We intend to own 25-35 stocks at any point and to remain fully invested across cycles. For comparison to our Fund, the passive ACWI (ex-USA) benchmark holds more than 1,850 stocks. There just aren’t that many great companies out there. By extension of that point, we think adding extra companies to a high-quality fund exposes investors to more lower-quality businesses and that increases risk. Unlike academic definitions of risk, we think of risk as the permanent impairment of capital. This is a simple concept that goes all the way back to the creation of our investment philosophy by David Polen in 1989.
The importance of time. We believe a significant edge within our investment program is a long-term time horizon. This fuels our temperamental edge. We observe that security prices are set by occasionally manic or irrational market participants. We will weather noise and volatility by keeping an eye to the long term. This stance should result in a low-turnover strategy and in the first four months we made no changes to the Fund. Focus Growth again sets the tone here. Since 1989 Focus Growth has held a total of only 107 stocks.
The International Growth strategy will stay true to Polen Capital’s principles as they’re described here. Our aim is to build a portfolio of competitively advantaged businesses delivering double-digit absolute returns over time. The Focus Growth strategy has done that and then some, so we have big shoes to fill with International Growth.
A few thoughts about our benchmark, the MSCI All Country World Index (“ACWI”) (ex-USA)
The future is unknowable so why are we confident about our prospects? We’ve already explained why our concentrated approach to high-quality growth investments can put points on the scoreboard, so let’s consider what we’re up against.
The MSCI ACWI (ex-USA) holds more than 1,850 companies around the world. More than 55% of the benchmark’s holdings fall into sectors that Polen Capital has historically avoided. Those sectors are financials, industrials, materials, energy, real estate and utilities.
These sectors commonly violate our hurdles listed in the core principles section above by either producing low returns on equity, having poor balance sheets or by exhibiting low or inconsistent earnings growth. Lower-quality companies often produce higher variability in earnings, which is a drag. In comparison
20
POLEN INTERNATIONAL GROWTH FUND
Annual Investment Adviser’s Report
April 30, 2017
(Unaudited)
to our investment goal of driving double-digit absolute returns, the benchmark’s earnings growth rate has averaged low- to mid-single digits since the turn of the century. Remember that we believe that share prices follow earnings growth over time.
While you may see us with a few holdings in these sectors from time to time, the average company in any of these six sectors is unlikely to ever appear in our portfolio. More than half of MSCI ACWI (ex-USA) is in these sectors and its exposures across these sectors explains how our performance can vary widely from the benchmark and why we think we can outperform in the long run.
Fund commentary
The Fund consists of 26 competitively advantaged growth businesses that each has an ability to reinvest earnings and compound growth going forward. We tend to find more competitively advantaged businesses that meet our high hurdles in the technology, healthcare and consumer sectors and less so in the cyclical, commodity oriented and financial sectors. Our holdings span a variety of expected growth rates – a theme you’ll see in other Polen funds. Across the Fund we strive for a balance between durable growth businesses and more dynamic growth businesses. The latter contribute growth while the former offer ballast. In total, we expect the Fund to drive above-benchmark growth in earnings and cash flows. Our belief is that a high-quality bias with faster growth in cash earnings offers the potential to achieve benchmark-beating returns.
Since inception, the Fund returned 15.70%, compared to 7.79% for the MSCI ACWI (ex-USA), a difference of 7.91%. Strong earnings reports from many Fund companies drove solid absolute and relative performance. Merger and acquisition activity drove share price improvements in a few holdings (discussed below). All holdings posted positive share price performance in the first four months. Healthcare and consumer staples contributions were among our strongest and we are overweight both sectors.
Anglo-Dutch consumer goods company Unilever PLC saw shares rally in the first four months as it rebuffed an attempted takeover by U.S.-based Kraft/Heinz (KHC). KHC is a disruptive force affecting the whole consumer staples industry. KHC takes an aggressive approach to expense management and would have slashed Unilever’s cost structure, perhaps cutting both fat and muscle. You probably know Unilever’s products like Lipton tea, Dove soap, Degree deodorant, and Breyers and Ben & Jerry’s ice cream to name just a few. Unilever is a massive global franchise with roots going back to the nineteenth century. Unilever management heard KHC’s message that corporate bloat and inertia endemic to many consumer staples companies cannot persist and they wrapped up a thorough review of business lines and balance sheet structures early in April. Planned changes should enable existing shareholders to enjoy some of the improvements KHC would have sought had it succeeded in its bid and we see a clear path for solid earnings growth from here.
21
POLEN INTERNATIONAL GROWTH FUND
Annual Investment Adviser’s Report
April 30, 2017
(Unaudited)
Australian biotech CSL Ltd. is a global leader in the highly regulated market for blood plasma derivatives. CSL’s products include immune deficiency treatments, vaccines and a variety of other drugs. CSL delivered solid first half results and increased its guidance for fiscal year operating profit growth of 18-20%. This came through vibrant market growth and share gains in its core immunoglobulin business. An added boost came from growth in CSL’s higher-margined specialty products business. CSL is one of three global-scaled players in the market for plasma products. An undersupplied immunoglobulin market is driving strong growth across the industry and this condition could persist for a few more quarters because capacity additions are slow to come online. Shares rallied 35% in the first four months. We believe CSL has the potential to compound earnings at a 15% rate for the next five years.
Chinese “social media” company Tencent Holdings Ltd. is actually more of a platform or an operating system that connects nearly 900 million users, most of whom are in China. Tencent’s network effects intensify as more users join. Tencent’s platform offers users a variety of services including social media, messaging, gaming, and content to payments services, ride hailing, and traditional commerce options like buying movie tickets among many other uses. Tencent continues to compound at a steady rate, reporting 48% revenue growth in 2016. Gaming contributes most of Tencent revenues today, but other revenue sources are emerging. The potential to offer advertisers exposure to Tencent’s nearly 900 million users is one striking example. Consumer spending as a percentage of GDP, at less than 40%, is still far below the level of most developed markets. Tencent currently serves one ad per user per day on its Weixin social media platform. For comparison, Facebook currently serves ~10 ads per user per day. This sets up a long-term secular tailwind at a time when Tencent is just getting started in the monetization of its social network. We believe Tencent can grow revenue and earnings greater than 25% rate for many years.
Actelion Ltd. is a unique Swiss pharmaceutical holding and a leader in treatments for Pulmonary Arterial Hypertension, a rare and deadly disease affecting 50,000 patients per year in developed markets. In January, Actelion announced an agreement to be acquired by U.S.-based Johnson & Johnson (JNJ) for $280/share plus a spinout of Actelion’s early stage research and development franchise into a new public company called Idorsia. We believe in the research team’s abilities at Actelion, but will not be able to own Idorsia since it will lack the consistent earnings and cash generation we seek. Rumors of this deal circulated for two months and affected Actelion’s share price prior to the Fund’s launch. This appreciation prompted us to launch the strategy with a lower weighting in Actelion than we had initially planned. Absent JNJ acquiring the company we thought Actelion presented a unique compounder for the next ten years. We’ll be sad to see the business leave the Fund but enjoyed 29% appreciation in shares over the Fund’s first four months.
Our worst performer was Accenture PLC. Accenture’s business has been growing well in recent years and we feel it’s well positioned as a leading player in the technology consulting world. Though it posted a positive return through the first four months of the year, the stock appreciated at a lower rate than the rest of the Fund.
22
POLEN INTERNATIONAL GROWTH FUND
Annual Investment Adviser’s Report
April 30, 2017
(Unaudited)
Small business enterprise software provider Sage Group PLC also had weak performance through four months. Sage Group provides business management software for entrepreneurs to manage their accounting, payments and human resources needs easily. Despite the market’s lack of interest in Sage Group shares, we continue to like the company very much. Sage Group is undergoing a transition in its business model to embrace cloud oriented software that will be easy for customers to adopt. We think the change could soon propel the company to faster revenue growth and higher profits. At 22x 2017 earnings, shares are reasonably valued for a high quality company on the verge of acceleration. We think profit margins could be far higher than today’s levels and sales growth could begin to accelerate within twelve months. We believe Sage Group could grow earnings at a 1215% rate for the next five years.
Another relative underperformer for the fund was Essilor International SA, the leading provider of eye glass lenses globally. During the first four months of 2017 the company announced a major merger-of-equals with Italian eyewear company Luxottica Group SpA to form EssilorLuxottica. Luxottica, a leader in eyeglass frames with a vast distribution network of more than 7,000 stores brings complimentary business lines to Essilor. The combined company will be able to sell Luxottica frames with Essilor lenses through the large store network in addition to existing selling relationships in the wholesale and lenses channels. We believe the merger will pass anti-trust review and close in the next twelve months. Though its shares underperformed in the first four months, Essilor’s business is poised to deliver consistent sales and earnings growth over the long run.
Attribution
The top three contributors (Fund average weight multiplied by return) since inception were Unilever (1.38%), Tencent Holdings (1.36%) and CSL Limited (1.16%). The bottom three contributors were Sage Group (0.30%), Essilor International SA (0.27%) and Accenture (0.22%).
We continually search for new high-quality investment candidates to add to the Fund. Thank you for your investment in the Polen International Growth Fund. Please do not hesitate to reach out to us with your questions or comments.
Sincerely,
J. Todd Morris,
This letter is intended to assist shareholders in understanding how the Fund performed during the period ended April 30, 2017 and reflects the views of the investment adviser at the time of this writing. Of course, these views may change and do not guarantee the future performance of the Fund or the markets.
23
POLEN INTERNATIONAL GROWTH FUND
Annual Investment Adviser’s Report
April 30, 2017
(Unaudited)
Portfolio composition is subject to change. The current and future portfolio holdings of the Fund are subject to investment risk. The investment return and principal value of an investment in the Fund will fluctuate so that an investor’s shares, when redeemed, may be worth more or less than their original cost.
All mutual fund investing involves risk, including possible loss of principal. The Fund is non-diversified, which means that a large portion of the Fund’s assets may be invested in one or few companies or sectors. The Fund could fluctuate in value more than a diversified fund. Investing in foreign securities entails special risks, such as fluctuations in currency exchange rates and possible lax regulation of securities markets and accounting practices.
24
POLEN INTERNATIONAL GROWTH FUND
Annual Report
Performance Data
April 30, 2017
(Unaudited)
Comparison of Change in Value of $100,000 (investment minimum) Investment in Polen International Growth Fund
Institutional Class Shares
vs MSCI All Country World® Index (“ACWI”) (ex-USA)
| Total Returns for the Period Ended April 30, 2017 | ||||
| Since Inception*† | ||||
Institutional Class | 15.70% | |||
MSCI All Country World ® Index (“ACWI”) (ex-USA) | 10.55%** | |||
| † | Not Annualized. |
| * | The Polen International Growth Fund (the “Fund”) Institutional Class Shares commenced operations on December 30, 2016. |
| ** | Benchmark performance is from commencement date of the Fund Class (December 30, 2016) only and is not the commencement date of the benchmark itself. |
The performance data quoted represents past performance and does not guarantee future results. Current performance may be lower or higher. Performance data current to the most recent month-end may be obtained by calling (888) 678-6024. The investment return and principal value of an investment will fluctuate so that shares, when redeemed, may be worth more or less than their original cost. The graph and table do not reflect the deduction of taxes that a shareholder would pay on Fund distributions or the redemption of Fund shares.
25
POLEN INTERNATIONAL GROWTH FUND
Annual Report
Performance Data
April 30, 2017
(Unaudited)
Comparison of Change in Value of $10,000 Investment in Polen International Growth Fund Investor Class Shares (formerly Retail Class) vs MSCI All Country World® Index (“ACWI”) (ex-USA)
| Total Returns for the Period Ended April 30, 2017 | ||||
| Since Inception*† | ||||
Investor Class | 5.96% | |||
MSCI All Country World ® Index (“ACWI”) (ex-USA) | 4.15%** | |||
| † | Not Annualized. |
| * | The Polen International Growth Fund (the “Fund”) Investor Class Shares commenced operations on March 15, 2017. |
| ** | Benchmark performance is from commencement date of the Fund Class (March 15, 2017) only and is not the commencement date of the benchmark itself. |
The performance data quoted represents past performance and does not guarantee future results. Current performance may be lower or higher. Performance data current to the most recent month-end may be obtained by calling (888) 678-6024. The investment return and principal value of an investment will fluctuate so that shares, when redeemed, may be worth more or less than their original cost. The graph and table do not reflect the deduction of taxes that a shareholder would pay on Fund distributions or the redemption of Fund shares.
The Fund’s “Total Annual Fund Operating Expenses” and “Total Annual Fund Operating Expenses After Fee Waiver and/or Expense Reimbursement”, as stated in the current prospectus dated January 1, 2017, are 1.15% and 1.10%, respectively, for the Institutional Class shares and 1.40% and 1.35%, respectively, for the Investor Class shares of the Fund’s average daily net assets, which may differ from the actual expenses incurred by the Fund for the period covered by this report. Polen Capital Management, LLC (“PCM” or the “Adviser”), has contractually agreed to reduce its investment advisory fee and/or reimburse certain expenses of the Fund to the extent necessary to ensure that the Fund’s total operating expenses (excluding taxes, any class-specific fees and expenses (such as Rule 12b-1
26
POLEN INTERNATIONAL GROWTH FUND
Annual Report
Performance Data
April 30, 2017
(Unaudited)
distribution fees), interest, extraordinary items, “Acquired Fund” fees and expenses and brokerage commissions) do not exceed 1.10% (on an annual basis) with respect to the Fund’s average daily net assets (the “Expense Limitation”). The Expense Limitation will remain in place until August 31, 2018 unless the Board of Trustees of FundVantage Trust (the “Trust”) approves its earlier termination. The Adviser is entitled to recover, subject to approval by the Board of Trustees, such amounts reduced or reimbursed for a period of up to three (3) years from the year in which the Adviser reduced its compensation and/or assumed expenses for the Fund. The Adviser is permitted to seek reimbursement from the Fund, subject to certain limitations, for fees it waived and Fund expenses it paid to the extent the total annual fund expenses do not exceed the limits described above or any lesser limits in effect at the time of reimbursement. No recoupment will occur unless the Fund’s expenses are below the Expense Limitation. Total returns would be lower had such fees and expenses not been waived and/or reimbursed.
A 2.00% redemption fee applies to shares redeemed within 60 days of purchase. This redemption fee is not reflected in the returns shown above.
The Fund intends to evaluate performance as compared to that of the MSCI ACWI (ex-USA), which captures large and mid-cap representation across 23 Developed Markets (DM) and 23 Emerging Markets (EM) countries. With 2,466 constituents, the index covers approximately 85% of the global investable equity opportunity set. Indexes are unmanaged and it is not possible to invest directly in an index.
All mutual fund investing involves risk, including possible loss of principal. The Fund is non-diversified, which means that a large portion of the Fund’s assets may be invested in one or few companies or sectors. The Fund could fluctuate in value more than a diversified fund. Investing in foreign securities entails special risks, such as fluctuations in currency exchange rates and possible lax regulation of securities markets and accounting practices.
The Fund may invest a substantial amount of its assets in issuers located in a limited number of countries. If the Fund concentrates its investments in this manner, it assumes the risk that economic, political and social conditions in those countries will have a significant impact on its investment performance. The Fund’s investment performance may also be more volatile if it concentrates its investments in certain countries, especially emerging market countries.
27
POLEN GROWTH FUNDS
Funds Expense Disclosure
April 30, 2017
(Unaudited)
As a shareholder of the Fund(s), you incur two types of costs: (1) transaction costs, including redemption fees; and (2) ongoing costs, including management fees, distribution and/or service (Rule 12b-1) fees (if any) and other Fund expenses. These examples are intended to help you understand your ongoing costs (in dollars) of investing in the Fund(s) and to compare these costs with the ongoing costs of investing in other mutual funds.
These examples are based on an investment of $1,000 invested at the beginning of the six-month period from November 1, 2016 through April 30, 2017 and held for the entire period.
Actual Expenses
The first line of each accompanying table provides information about actual account values and actual expenses. You may use the information in this line, together with the amount you invested, to estimate the expenses that you paid over the period. Simply divide your account value by $1,000 (for example, an $8,600 account value divided by $1,000 = 8.6), then multiply the result by the number in the first line under the heading entitled “Expenses Paid During Period” to estimate the expenses you paid on your account during this period.
Hypothetical Examples for Comparison Purposes
The second line of each accompanying table provides information about hypothetical account values and hypothetical expenses based on a Fund’s actual expense ratio and an assumed rate of return of 5% per year before expenses, which is not your Fund’s actual return. The hypothetical account values and expenses may not be used to estimate the actual ending account balance or expenses you paid for the period. You may use this information to compare the ongoing costs of investing in the Fund(s) and other funds. To do so, compare these 5% hypothetical examples with the 5% hypothetical examples that appear in the shareholder reports of other funds.
Please note that the expenses shown in the accompanying table are meant to highlight your ongoing costs only and do not reflect any transactional costs, such as redemption fees. Therefore, each hypothetical line of the accompanying table is useful in comparing ongoing costs only and will not help you determine the relative total costs of owning different funds. In addition, if these transactional costs were included, your costs would have been higher.
28
POLEN GROWTH FUNDS
Funds Expense Disclosure
April 30, 2017
(Unaudited)
| Polen Growth Fund | |||||||||||||||
| Beginning Account Value November 1, 2016 | Ending Account Value April 30, 2017 | Expenses Paid During Period | |||||||||||||
Institutional Class* | |||||||||||||||
Actual | $1,000.00 | $1,135.20 | $5.29 | ||||||||||||
Hypothetical (5% return before expenses) | 1,000.00 | 1,019.84 | 5.01 | ||||||||||||
Investor Class* | |||||||||||||||
Actual | $1,000.00 | $1,133.60 | $6.61 | ||||||||||||
Hypothetical (5% return before expenses) | 1,000.00 | 1,018.60 | 6.26 | ||||||||||||
| Polen Global Growth Fund | |||||||||||||||
| Beginning Account Value November 1, 2016 | Ending Account Value April 30, 2017 | Expenses Paid During Period | |||||||||||||
Institutional Class** | |||||||||||||||
Actual | $1,000.00 | $1,129.10 | $5.81 | ||||||||||||
Hypothetical (5% return before expenses) | 1,000.00 | 1,019.34 | 5.51 | ||||||||||||
Investor Class** | |||||||||||||||
Actual | $1,000.00 | $1,127.70 | $7.12 | ||||||||||||
Hypothetical (5% return before expenses) | 1,000.00 | 1,018.10 | 6.76 | ||||||||||||
| Polen International Growth Fund | |||||||||||||||
| Beginning Account Value November 1, 2016 | Ending Account Value April 30, 2017 | Expenses Paid During Period | |||||||||||||
Institutional Class*** | |||||||||||||||
Actual | $1,000.00 | $1,157.00 | $3.93 | ||||||||||||
Hypothetical (5% return before expenses) | 1,000.00 | 1,019.34 | 5.51 | ||||||||||||
Investor Class**** | |||||||||||||||
Actual | $1,000.00 | $1,059.60 | $1.75 | ||||||||||||
Hypothetical (5% return before expenses) | 1,000.00 | 1,018.10 | 6.76 | ||||||||||||
| * | Expenses are equal to an annualized expense ratio for the six-month period ended April 30, 2017 of 1.00% for Institutional Class and 1.25% for Investor Class, multiplied by the average account value over the period, multiplied by the number of days in the most recent period (181), then divided by 365 to reflect the period. The Fund’s ending account values on the first line of each table are based on the actual six-month total returns for the Fund of 13.52% and 13.36% for Institutional Class and Investor Class, respectively. |
| ** | Expenses are equal to an annualized expense ratio for the six-month period April 30, 2017 of 1.10% for Institutional Class and 1.35% for Investor Class, multiplied by the average account value over the period, multiplied by the number of days in the most recent period (181), then divided by 365 to reflect the period. The Fund’s ending account values on the first line of each table are based on the actual six-month total returns for the Fund of 12.91% and 12.77% for Institutional Class and Investor Class, respectively. |
29
POLEN GROWTH FUNDS
Funds Expense Disclosure (Concluded)
April 30, 2017
(Unaudited)
| *** | Expenses are equal to the annualized expense ratio for the period beginning December 30, 2016, commencement of operations, to April 30, 2017 of 1.10% for Institutional Class, multiplied by the average account value over the period, multiplied by the number of days in the most recent period (121), then divided by 365 to reflect the period. The Institutional Class ending account values on the first line in the table are based on the actual total returns for the Fund since commencement of operations of 15.70%. For comparative purposes, the Hypothetical expenses are as if the Institutional Class had been in existence from November 1, 2016, and are equal to the Institutional Class annualized expense ratio, multiplied by the average account value over the period, multiplied by the number of days in the most recent six-month period (181), then divided by 365 to reflect the period. |
| **** | Expenses are equal to the annualized expense ratio for the period beginning March 15, 2017, commencement of operations, to April 30, 2017 of 1.35% for Investor Class, multiplied by the average account value over the period, multiplied by the number of days in the most recent period (46), then divided by 365 to reflect the period. The Investor Class ending account values on the first line of the table are based on the actual total returns for the Fund since commencement of operations of 5.96%. For comparative purposes, the Hypothetical expenses are as if the Investor Class had been in existence from November 1, 2016, and are equal to the Investor Class annualized expense ratio, multiplied by the average account value over the period, multiplied by the number of days in the most recent six-month period (181), then divided by 365 to reflect the period. |
30
POLEN GROWTH FUND
Portfolio Holdings Summary Table
April 30, 2017
(Unaudited)
The following table presents a summary by industry of the portfolio holdings of the Fund:
| % of Net Assets | Value | |||||||
COMMON STOCKS: | ||||||||
Internet Content & Information | 18.5 | % | $ | 272,193,391 | ||||
Credit Services | 9.8 | 143,570,666 | ||||||
Biotechnology | 9.7 | 142,832,493 | ||||||
Information Technology Services | 8.3 | 122,881,091 | ||||||
Business Services | 5.7 | 84,168,994 | ||||||
Footwear & Accessories | 5.5 | 81,320,658 | ||||||
Restaurants | 5.5 | 80,690,010 | ||||||
Software Application | 5.4 | 79,763,339 | ||||||
Leisure | 4.8 | 70,956,671 | ||||||
Software Infrastructure | 4.7 | 68,502,135 | ||||||
Specialty Retail | 4.1 | 60,999,241 | ||||||
Packaged Foods | 3.9 | 56,875,619 | ||||||
Medical Devices | 3.7 | 54,015,871 | ||||||
Discount Stores | 2.8 | 40,786,237 | ||||||
Apparel Stores | 2.5 | 36,543,615 | ||||||
Other Assets In Excess of Liabilities | 5.1 | 74,989,383 | ||||||
|
|
|
| |||||
NET ASSETS | 100.0 | % | $ | 1,471,089,414 | ||||
|
|
|
| |||||
Portfolio holdings are subject to change at any time.
The accompanying notes are an integral part of the financial statements.
31
POLEN GROWTH FUND
Portfolio of Investments
April 30, 2017
| Number of Shares | Value | |||||||
COMMON STOCKS — 94.9% |
| |||||||
Apparel Stores — 2.5% |
| |||||||
TJX Cos., Inc. (The) | 464,695 | $ | 36,543,615 | |||||
|
| |||||||
Biotechnology — 9.7% | ||||||||
Celgene Corp.* | 575,531 | 71,394,621 | ||||||
Regeneron Pharmaceuticals, Inc.* | 183,886 | 71,437,872 | ||||||
|
| |||||||
| 142,832,493 | ||||||||
|
| |||||||
Business Services — 5.7% |
| |||||||
Automatic Data Processing, Inc. | 805,522 | 84,168,994 | ||||||
|
| |||||||
Credit Services — 9.8% |
| |||||||
Mastercard, Inc., Class A | 259,107 | 30,139,326 | ||||||
Visa, Inc., Class A | 1,243,492 | 113,431,340 | ||||||
|
| |||||||
| 143,570,666 | ||||||||
|
| |||||||
Discount Stores — 2.8% |
| |||||||
Dollar General Corp. | 560,944 | 40,786,237 | ||||||
|
| |||||||
Footwear & Accessories — 5.5% |
| |||||||
NIKE, Inc., Class B | 1,467,617 | 81,320,658 | ||||||
|
| |||||||
Information Technology Services — 8.3% |
| |||||||
Accenture PLC, Class A | 569,374 | 69,065,066 | ||||||
Gartner, Inc.* | 471,698 | 53,816,025 | ||||||
|
| |||||||
| 122,881,091 | ||||||||
|
| |||||||
Internet Content & Information — 18.5% |
| |||||||
Alphabet, Inc., Class A* | 74,128 | 68,532,819 | ||||||
Alphabet, Inc., Class C* | 109,690 | 99,374,752 | ||||||
Facebook, Inc., Class A* | 694,082 | 104,285,820 | ||||||
|
| |||||||
| 272,193,391 | ||||||||
|
| |||||||
Leisure — 4.8% | ||||||||
Priceline Group, Inc. (The)* | 38,421 | 70,956,671 | ||||||
|
| |||||||
| Number of Shares | Value | |||||||
COMMON STOCKS — (Continued) |
| |||||||
Medical Devices — 3.7% | ||||||||
Align Technology, Inc.* | 401,247 | $ | 54,015,871 | |||||
|
| |||||||
Packaged Foods — 3.9% | ||||||||
Nestle SA, SP ADR | 738,654 | 56,875,619 | ||||||
|
| |||||||
Restaurants — 5.5% | ||||||||
Starbucks Corp | 1,343,490 | 80,690,010 | ||||||
|
| |||||||
Software Application — 5.4% |
| |||||||
Adobe Systems, Inc.* | 596,406 | 79,763,339 | ||||||
|
| |||||||
Software Infrastructure — 4.7% |
| |||||||
Oracle Corp. | 1,523,624 | 68,502,135 | ||||||
|
| |||||||
Specialty Retail — 4.1% | ||||||||
O’Reilly Automotive, Inc.* | 245,816 | 60,999,241 | ||||||
|
| |||||||
TOTAL COMMON STOCKS |
| 1,396,100,031 | ||||||
|
| |||||||
TOTAL INVESTMENTS - 94.9% |
| 1,396,100,031 | ||||||
OTHER ASSETS IN EXCESS OF LIABILITIES - 5.1% | 74,989,383 | |||||||
|
| |||||||
NET ASSETS - 100.0% | $ | 1,471,089,414 | ||||||
|
| |||||||
| * | Non-income producing. |
PLC | Public Limited Corporation | |
SP ADR | Sponsored American Depository Receipt |
The accompanying notes are an integral part of the financial statements.
32
POLEN GLOBAL GROWTH FUND
Portfolio Holdings Summary Table
April 30, 2017
(Unaudited)
The following table presents a summary by industry of the portfolio holdings of the Fund:
| % of Net Assets | Value | |||||||
COMMON STOCKS: | ||||||||
Internet Software & Services | 18.8 | % | $ | 3,686,380 | ||||
Information Technology Services | 16.3 | 3,193,017 | ||||||
Biotechnology | 7.7 | 1,517,849 | ||||||
Software | 7.6 | 1,487,983 | ||||||
Specialty Retail | 7.0 | 1,380,333 | ||||||
Health Care Equipment & Supplies | 6.8 | 1,330,377 | ||||||
Food Products | 4.5 | 879,420 | ||||||
Textiles, Apparel & Luxury Goods | 4.1 | 813,308 | ||||||
Hotels, Restaurants & Leisure | 4.1 | 802,041 | ||||||
Insurance | 3.5 | 692,144 | ||||||
Internet & Direct Marketing Retail | 3.2 | 624,225 | ||||||
Technology Hardware, Storage & Peripherals | 2.5 | 498,322 | ||||||
Household Products | 2.3 | 450,461 | ||||||
Trading Companies & Distributors | 2.1 | 411,860 | ||||||
Professional Services | 2.1 | 403,074 | ||||||
Pharmaceuticals | 1.2 | 225,388 | ||||||
Other Assets In Excess of Liabilities | 6.2 | 1,217,628 | ||||||
|
|
|
| |||||
NET ASSETS | 100.0 | % | $ | 19,613,810 | ||||
|
|
|
| |||||
Portfolio holdings are subject to change at any time.
The accompanying notes are an integral part of the financial statements.
33
POLEN GLOBAL GROWTH FUND
Portfolio of Investments
April 30, 2017
| Number of Shares | Value | |||||||
COMMON STOCKS — 93.8% |
| |||||||
Australia — 2.8% | ||||||||
CSL, Ltd. | 5,459 | $ | 541,315 | |||||
|
| |||||||
Cayman Islands — 7.7% | ||||||||
Alibaba Group Holding, Ltd., SP ADR* | 4,751 | 548,740 | ||||||
Tencent Holdings, Ltd. | 30,500 | 955,667 | ||||||
|
| |||||||
| 1,504,407 | ||||||||
|
| |||||||
Denmark — 1.1% | ||||||||
Novo Nordisk A/S, SP ADR | 5,827 | 225,388 | ||||||
|
| |||||||
France — 2.8% | ||||||||
Essilor International SA | 4,219 | 546,754 | ||||||
|
| |||||||
Hong Kong — 3.5% | ||||||||
AIA Group, Ltd. | 100,000 | 692,144 | ||||||
|
| |||||||
Ireland — 3.8% | ||||||||
Accenture PLC, Class A | 6,084 | 737,989 | ||||||
|
| |||||||
Israel — 2.8% | ||||||||
Check Point Software | ||||||||
Technologies, Ltd.* | 5,223 | 543,244 | ||||||
|
| |||||||
Switzerland — 6.5% | ||||||||
Nestle SA, Registered Shares | 11,418 | 879,420 | ||||||
SGS SA, Registered Shares | 179 | 403,074 | ||||||
|
| |||||||
| 1,282,494 | ||||||||
|
| |||||||
United Kingdom — 2.3% | ||||||||
Reckitt Benckiser Group PLC | 4,889 | 450,461 | ||||||
|
| |||||||
United States — 60.5% | ||||||||
Adobe Systems, Inc.* | 7,064 | 944,739 | ||||||
Align Technology, Inc.* | 5,821 | 783,623 | ||||||
| Number of Shares | Value | |||||||
COMMON STOCKS — (Continued) |
| |||||||
United States — (Continued) | ||||||||
Alphabet, Inc., Class C* | 1,458 | $ | 1,320,890 | |||||
Apple, Inc. | 3,469 | 498,322 | ||||||
Automatic Data Processing, Inc. | 6,180 | 645,748 | ||||||
Celgene Corp.* | 2,758 | 342,130 | ||||||
Facebook, Inc., Class A* | 5,731 | 861,083 | ||||||
Fastenal Co. | 9,218 | 411,860 | ||||||
Mastercard, Inc., Class A | 6,230 | 724,674 | ||||||
NIKE, Inc., Class B | 14,678 | 813,308 | ||||||
O’Reilly Automotive, Inc.* | 3,000 | 744,450 | ||||||
Priceline Group, Inc. (The)* | 338 | 624,225 | ||||||
Regeneron Pharmaceuticals, Inc.* | 1,633 | 634,404 | ||||||
Starbucks Corp | 13,354 | 802,041 | ||||||
TJX Cos, Inc. (The) | 8,086 | 635,883 | ||||||
Visa, Inc., Class A | 11,890 | 1,084,606 | ||||||
|
| |||||||
| 11,871,986 | ||||||||
|
| |||||||
TOTAL COMMON STOCKS | 18,396,182 | |||||||
|
| |||||||
TOTAL INVESTMENTS - 93.8% | 18,396,182 | |||||||
OTHER ASSETS IN EXCESS OF LIABILITIES - 6.2% | 1,217,628 | |||||||
|
| |||||||
NET ASSETS - 100.0% | $ | 19,613,810 | ||||||
|
| |||||||
| * | Non-income producing. |
PLC | Public Limited Corporation | |
SP ADR | Sponsored American Depository Receipt |
The accompanying notes are an integral part of the financial statements.
34
POLEN INTERNATIONAL GROWTH FUND
Portfolio Holdings Summary Table
April 30, 2017
(Unaudited)
The following table presents a summary by industry of the portfolio holdings of the Fund:
| % of Net Assets | Value | |||||||
COMMON STOCKS: | ||||||||
Software | 15.8 | % | $ | 421,289 | ||||
Internet Software & Services | 11.5 | 306,325 | ||||||
Professional Services | 10.9 | 289,690 | ||||||
Information Technology Services | 7.5 | 199,842 | ||||||
Personal Products | 5.4 | 144,724 | ||||||
Health Care Equipment & Supplies | 5.2 | 138,921 | ||||||
Biotechnology | 5.1 | 135,609 | ||||||
Household Products | 4.7 | 123,741 | ||||||
Food Products | 4.6 | 122,386 | ||||||
Life Sciences Tools & Services | 3.9 | 102,655 | ||||||
Hotels Restaurants & Leisure | 3.7 | 99,763 | ||||||
Textiles Apparel & Luxury Goods | 3.2 | 86,010 | ||||||
Chemicals | 3.1 | 83,679 | ||||||
Trading Companies & Distributors | 3.1 | 82,269 | ||||||
Specialty Retail | 2.9 | 76,987 | ||||||
Food & Staples Retailing | 2.2 | 57,472 | ||||||
Other Assets In Excess of Liabilities | 7.2 | 191,197 | ||||||
|
|
|
| |||||
NET ASSETS | 100.0 | % | $ | 2,662,559 | ||||
|
|
|
| |||||
Portfolio holdings are subject to change at any time.
The accompanying notes are an integral part of the financial statements.
35
POLEN INTERNATIONAL GROWTH FUND
Portfolio of Investments
April 30, 2017
| Number of Shares | Value | |||||||
COMMON STOCKS — 92.8% |
| |||||||
Australia — 3.5% | ||||||||
CSL, Ltd. | 950 | $ | 94,202 | |||||
|
| |||||||
Cayman Islands — 8.7% |
| |||||||
Alibaba Group Holding, Ltd., SP ADR* | 776 | 89,628 | ||||||
Tencent Holdings, Ltd. | 4,500 | 141,000 | ||||||
|
| |||||||
| 230,628 | ||||||||
|
| |||||||
China — 2.8% | ||||||||
Baidu, Inc., SP ADR* | 420 | 75,697 | ||||||
|
| |||||||
Denmark — 6.4% | ||||||||
Chr. Hansen Holding A/S | 1,242 | 83,679 | ||||||
Coloplast A/S, Class B | 1,014 | 86,825 | ||||||
|
| |||||||
| 170,504 | ||||||||
|
| |||||||
France — 6.0% | ||||||||
Dassault Systemes SE | 1,196 | 106,708 | ||||||
Essilor International SA | 402 | 52,096 | ||||||
|
| |||||||
| 158,804 | ||||||||
|
| |||||||
Germany — 8.2% | ||||||||
adidas AG | 429 | 86,010 | ||||||
SAP SE | 1,315 | 131,719 | ||||||
|
| |||||||
| 217,729 | ||||||||
|
| |||||||
Ireland — 12.1% | ||||||||
Accenture PLC, Class A | 977 | 118,510 | ||||||
Experian PLC | 4,712 | 101,368 | ||||||
ICON PLC* | 1,215 | 102,655 | ||||||
|
| |||||||
| 322,533 | ||||||||
|
| |||||||
Israel — 3.2% | ||||||||
Check Point Software Technologies, Ltd.* | 813 | 84,560 | ||||||
|
| |||||||
Mexico — 2.2% | ||||||||
Wal-Mart de Mexico SAB de CV | 25,517 | 57,472 | ||||||
|
| |||||||
| Number of Shares | Value | |||||||
COMMON STOCKS — (Continued) |
| |||||||
Netherlands — 3.9% | ||||||||
RELX NV | 5,434 | $ | 105,005 | |||||
|
| |||||||
Spain — 5.9% | ||||||||
Amadeus IT Group SA | 1,507 | 81,332 | ||||||
Industria De Diseno Textil SA | 2,009 | 76,987 | ||||||
|
| |||||||
| 158,319 | ||||||||
|
| |||||||
Switzerland — 9.3% | ||||||||
Actelion, Ltd., Registered Shares* | 155 | 41,407 | ||||||
Nestle SA, Registered Shares | 1,589 | 122,386 | ||||||
SGS SA, Registered Shares | 37 | 83,317 | ||||||
|
| |||||||
| 247,110 | ||||||||
|
| |||||||
United Kingdom — 20.6% |
| |||||||
Bunzl PLC | 2,639 | 82,269 | ||||||
Compass Group PLC | 4,941 | 99,763 | ||||||
Reckitt Benckiser Group PLC | 1,343 | 123,741 | ||||||
Sage Group PLC (The) | 11,325 | 98,302 | ||||||
Unilever PLC | 2,813 | 144,724 | ||||||
|
| |||||||
| 548,799 | ||||||||
|
| |||||||
TOTAL COMMON STOCKS |
| 2,471,362 | ||||||
|
| |||||||
TOTAL INVESTMENTS - 92.8% |
| 2,471,362 | ||||||
OTHER ASSETS IN EXCESS OF LIABILITIES - 7.2% | 191,197 | |||||||
|
| |||||||
NET ASSETS - 100.0% | $ | 2,662,559 | ||||||
|
| |||||||
| * | Non-income producing. |
The accompanying notes are an integral part of the financial statements.
36
POLEN INTERNATIONAL GROWTH FUND
Portfolio of Investments
April 30, 2017
| PLC | Public Limited Corporation |
| SP ADR | Sponsored American Depository Receipt |
The accompanying notes are an integral part of the financial statements.
37
POLEN GROWTH FUNDS
Statements of Assets and Liabilities
April 30, 2017
| Polen Growth Fund | Polen Global Growth Fund | Polen International Growth Fund | ||||||||||
Assets | ||||||||||||
Investments, at value* | $ | 1,396,100,031 | $ | 18,396,182 | $ | 2,471,362 | ||||||
Cash | 73,484,284 | 1,244,386 | 183,864 | |||||||||
Receivable for investments sold | 11,526,649 | — | — | |||||||||
Receivable for capital shares sold | 4,562,801 | 500 | — | |||||||||
Dividends and interest receivable | 2,480,393 | 33,761 | 6,094 | |||||||||
Receivable from investment adviser | — | — | 16,037 | |||||||||
Prepaid expenses and other assets | 131,046 | 34,446 | 21,069 | |||||||||
|
|
|
|
|
| |||||||
Total assets | 1,488,285,204 | 19,709,275 | 2,698,426 | |||||||||
|
|
|
|
|
| |||||||
Liabilities | ||||||||||||
Payable for investments purchased | 13,399,223 | — | — | |||||||||
Payable for capital shares redeemed | 1,897,159 | — | — | |||||||||
Payable to Investment Advisor | 680,389 | 17,853 | — | |||||||||
Payable for transfer agent fees | 166,794 | 20,403 | 7,718 | |||||||||
Payable for administration and accounting fees | 40,093 | 7,201 | 2,473 | |||||||||
Payable for audit fees | 25,850 | 27,001 | 18,500 | |||||||||
Payable for custodian fees | 23,624 | 14,617 | 2,362 | |||||||||
Payable for legal fees | 22,506 | 2,069 | 991 | |||||||||
Payable for distribution fees | 21,485 | 198 | 3 | |||||||||
Payable for printing fees | 5,137 | 1,510 | 2,494 | |||||||||
Payable for Trustees and Officers | — | 3,030 | 1,052 | |||||||||
Accrued expenses | 913,530 | 1,583 | 274 | |||||||||
|
|
|
|
|
| |||||||
Total liabilities | 17,195,790 | 95,465 | 35,867 | |||||||||
|
|
|
|
|
| |||||||
Net Assets | $ | 1,471,089,414 | $ | 19,613,810 | $ | 2,662,559 | ||||||
|
|
|
|
|
| |||||||
Net Assets Consisted of: | ||||||||||||
Capital stock, $0.01 par value | $ | 673,858 | $ | 15,960 | $ | 2,300 | ||||||
Paid-in capital | 1,144,249,483 | 16,735,145 | 2,374,412 | |||||||||
Accumulated net investment income/(loss) | — | — | 20,712 | |||||||||
Accumulated net realized gain/(loss) from investments and foreign currency transactions | 6,523,054 | (120,917 | ) | — | ||||||||
Net unrealized appreciation on investments and translation of assets and liabilities denominated in foreign currency | 319,643,019 | 2,983,622 | 265,135 | |||||||||
|
|
|
|
|
| |||||||
Net Assets | $ | 1,471,089,414 | $ | 19,613,810 | $ | 2,662,559 | ||||||
|
|
|
|
|
| |||||||
Institutional Class: | ||||||||||||
Net assets | $ | 1,363,731,410 | $ | 18,617,985 | $ | 2,648,357 | ||||||
|
|
|
|
|
| |||||||
Shares outstanding | 62,403,717 | 1,514,601 | 228,806 | |||||||||
|
|
|
|
|
| |||||||
Net asset value, offering and redemption price per share | $ | 21.85 | $ | 12.29 | $ | 11.57 | ||||||
|
|
|
|
|
| |||||||
Investor Class: | ||||||||||||
Net assets | $ | 107,358,004 | $ | 995,825 | $ | 14,202 | ||||||
|
|
|
|
|
| |||||||
Shares outstanding | 4,982,052 | 81,431 | 1,229 | |||||||||
|
|
|
|
|
| |||||||
Net asset value, offering and redemption price per share | $ | 21.55 | $ | 12.23 | $ | 11.56 | ||||||
|
|
|
|
|
| |||||||
* Investments, at cost | $ | 1,076,457,012 | $ | 15,412,614 | $ | 2,206,286 | ||||||
The accompanying notes are an integral part of the financial statements.
38
POLEN GROWTH FUNDS
Statements of Operations
For the Year Ended April 30, 2017
| Polen Growth Fund | Polen Global Growth Fund | Polen International Growth Fund* | ||||||||||
Investment Income | ||||||||||||
Dividends | $ | 10,521,070 | $ | 153,832 | $ | 16,361 | ||||||
Less: foreign taxes withheld | (260,453 | ) | (7,232 | ) | (1,526 | ) | ||||||
|
|
|
|
|
| |||||||
Total investment income | 10,260,617 | 146,600 | 14,835 | |||||||||
|
|
|
|
|
| |||||||
Expenses | ||||||||||||
Advisory fees (Note 2) | 11,816,414 | 135,784 | 5,160 | |||||||||
Transfer agent fees (Note 2) | 1,073,611 | 92,808 | 7,718 | |||||||||
Administration and accounting fees | 515,592 | 57,627 | 2,571 | |||||||||
Distribution fees (Investor Shares) (Note 2) | 278,297 | 1,912 | 4 | |||||||||
Custodian fees (Note 2) | 105,301 | 17,944 | 2,362 | |||||||||
Trustees’ and officers’ fees (Note 2) | 100,585 | 2,847 | 1,062 | |||||||||
Legal fees | 98,498 | 174 | 1,000 | |||||||||
Registration and filing fees | 83,271 | 30,323 | 8,056 | |||||||||
Printing and shareholder reporting fees | 69,043 | 5,006 | 2,500 | |||||||||
Audit fees | 26,056 | 28,354 | 18,500 | |||||||||
Other expenses | 132,750 | 12,312 | 11,285 | |||||||||
|
|
|
|
|
| |||||||
Total expenses before waivers and reimbursements | 14,299,418 | 385,091 | 60,218 | |||||||||
|
|
|
|
|
| |||||||
Less: waivers and reimbursements (Note 2) | (1,532,659 | ) | (207,831 | ) | (53,471 | ) | ||||||
|
|
|
|
|
| |||||||
Net expenses after waivers and reimbursements | 12,766,759 | 177,260 | 6,747 | |||||||||
|
|
|
|
|
| |||||||
Net investment income/(loss) | (2,506,142 | ) | (30,660 | ) | 8,088 | |||||||
|
|
|
|
|
| |||||||
Net realized and unrealized gain/(loss) from investments | ||||||||||||
Net realized gain/(loss) from investments | 9,041,210 | (4,887 | ) | — | ||||||||
Net realized gain/(loss) from foreign currency transactions | — | (3,104 | ) | 3,385 | ||||||||
Net change in unrealized appreciation/(depreciation) on investments | 181,991,566 | 2,488,857 | 265,076 | |||||||||
Net change in unrealized appreciation/(depreciation) on foreign currency translations | — | (64 | ) | 59 | ||||||||
|
|
|
|
|
| |||||||
Net realized and unrealized gain on investments | 191,032,776 | 2,480,802 | 268,520 | |||||||||
|
|
|
|
|
| |||||||
Net increase in net assets resulting from operations | $ | 188,526,634 | $ | 2,450,142 | $ | 276,608 | ||||||
|
|
|
|
|
| |||||||
| * | The Polen International Growth Fund commenced operations on December 30, 2016. |
The accompanying notes are an integral part of the financial statements.
39
POLEN GROWTH FUND
Statements of Changes in Net Assets
| For the Year Ended April 30, 2017 | For the Year Ended April 30, 2016 | |||||||
Increase/(Decrease) in Net Assets from Operations: | ||||||||
Net investment income/(loss) | $ | (2,506,142 | ) | $ | 103,366 | |||
Net realized gain from investments | 9,041,210 | 2,970,260 | ||||||
Net change in unrealized appreciation/(depreciation) on investments | 181,991,566 | 31,589,463 | ||||||
|
|
|
| |||||
Net increase in net assets resulting from operations | 188,526,634 | 34,663,089 | ||||||
|
|
|
| |||||
Less Dividends and Distributions to Shareholders from: | ||||||||
Net investment income: | ||||||||
Institutional Class | (103,570 | ) | — | |||||
|
|
|
| |||||
Total net investment income | (103,570 | ) | — | |||||
|
|
|
| |||||
Net realized capital gains: | ||||||||
Institutional Class | — | (27,326,452 | ) | |||||
Investor Class | — | (4,427,516 | ) | |||||
|
|
|
| |||||
Total net realized capital gains | — | (31,753,968 | ) | |||||
|
|
|
| |||||
Net decrease in net assets from dividends and distributions to shareholders | (103,570 | ) | (31,753,968 | ) | ||||
|
|
|
| |||||
Increase in Net Assets Derived from Capital Share Transactions (Note 4) | 172,086,819 | 701,406,937 | ||||||
|
|
|
| |||||
Total increase in net assets | 360,509,883 | 704,316,058 | ||||||
|
|
|
| |||||
Net assets | ||||||||
Beginning of year | 1,110,579,531 | 406,263,473 | ||||||
|
|
|
| |||||
End of year | $ | 1,471,089,414 | $ | 1,110,579,531 | ||||
|
|
|
| |||||
Accumulated net investment loss, end of year | $ | — | $ | — | ||||
|
|
|
| |||||
The accompanying notes are an integral part of the financial statements.
40
POLEN GLOBAL GROWTH FUND
Statements of Changes in Net Assets
| For the Year Ended April 30, 2017 | For the Year Ended April 30, 2016 | |||||||
Increase/(Decrease) in Net Assets from Operations: | ||||||||
Net investment loss | $ | (30,660 | ) | $ | (1,147 | ) | ||
Net realized loss from investments and foreign currency transactions | (7,991 | ) | (111,703 | ) | ||||
Net change in unrealized appreciation/(depreciation) on investments | 2,488,793 | 413,461 | ||||||
|
|
|
| |||||
Net increase in net assets resulting from operations | 2,450,142 | 300,611 | ||||||
|
|
|
| |||||
Less Dividends and Distributions to Shareholders from: | ||||||||
Net investment income: | ||||||||
Institutional Class | — | (8,435 | ) | |||||
Investor Class | — | (64 | ) | |||||
|
|
|
| |||||
Total net investment income | — | (8,499 | ) | |||||
|
|
|
| |||||
Net realized capital gains: | ||||||||
Institutional Class | (6,703 | ) | — | |||||
Investor Class | (408 | ) | — | |||||
|
|
|
| |||||
Total net realized capital gains | (7,111 | ) | — | |||||
|
|
|
| |||||
Net decrease in net assets from dividends and distributions to shareholders | (7,111 | ) | (8,499 | ) | ||||
|
|
|
| |||||
Increase in Net Assets Derived from Capital Share Transactions (Note 4) | 3,165,400 | 10,637,704 | ||||||
|
|
|
| |||||
Total increase in net assets | 5,608,431 | 10,929,816 | ||||||
|
|
|
| |||||
Net assets | ||||||||
Beginning of year | 14,005,379 | 3,075,563 | ||||||
|
|
|
| |||||
End of year | $ | 19,613,810 | $ | 14,005,379 | ||||
|
|
|
| |||||
Accumulated net investment loss, end of year | $ | — | $ | (1,369 | ) | |||
|
|
|
| |||||
The accompanying notes are an integral part of the financial statements.
41
POLEN INTERNATIONAL GROWTH FUND
Statements of Changes in Net Assets
| For the Period Ended April 30, 2017* | ||||
Increase/(Decrease) in Net Assets from Operations: | ||||
Net investment income | $ | 8,088 | ||
Net realized gain from investments and foreign currency transactions | 3,385 | |||
Net change in unrealized appreciation/(depreciation) on investments | 265,135 | |||
|
| |||
Net increase in net assets resulting from operations | 276,608 | |||
|
| |||
Increase in Net Assets Derived from Capital Share Transactions (Note 4) | 2,385,951 | |||
|
| |||
Total increase in net assets | 2,662,559 | |||
|
| |||
Net assets | ||||
Beginning of period | — | |||
|
| |||
End of period | $ | 2,662,559 | ||
|
| |||
Accumulated net investment income, end of period | $ | 20,712 | ||
|
| |||
| * | The Polen International Growth Fund commenced operations on December 30, 2016. |
The accompanying notes are an integral part of the financial statements.
42
POLEN GROWTH FUND
Financial Highlights
Contained below is per share operating performance data for Institutional Class shares outstanding, total investment return, ratios to average net assets and other supplemental data for the respective period. The total returns in the table represent the rate that an investor would have earned or lost on an investment in the Fund (assuming reinvestment of all dividends and distributions). This information has been derived from information provided in the financial statements and should be read in conjunction with the financial statements and the notes thereto.
| Institutional Class | ||||||||||||||||||||
| For the Year Ended April 30, 2017 | For the Year Ended April 30, 2016 | For the Year Ended April 30, 2015 | For the Year Ended April 30, 2014 | For the Year Ended April 30, 2013 | ||||||||||||||||
Per Share Operating Performance | ||||||||||||||||||||
Net asset value, beginning of period | $ | 18.92 | $ | 18.29 | $ | 16.45 | $ | 14.17 | $ | 13.79 | ||||||||||
|
|
|
|
|
|
|
|
|
| |||||||||||
Net investment income/(loss)(1) | (0.04 | ) | 0.01 | 0.02 | 0.03 | 0.03 | ||||||||||||||
Net realized and unrealized gain on investments | 2.97 | 1.45 | 3.09 | 2.48 | 0.40 | |||||||||||||||
|
|
|
|
|
|
|
|
|
| |||||||||||
Net increase in net assets resulting from operations | 2.93 | 1.46 | 3.11 | 2.51 | 0.43 | |||||||||||||||
|
|
|
|
|
|
|
|
|
| |||||||||||
Dividends and distributions to shareholders from: | ||||||||||||||||||||
Net investment income | — | (2) | — | (0.02 | ) | (0.04 | ) | — | ||||||||||||
Net realized capital gains | — | (0.83 | ) | (1.25 | ) | (0.20 | ) | (0.06 | ) | |||||||||||
|
|
|
|
|
|
|
|
|
| |||||||||||
Total dividends and distributions to shareholders | — | (0.83 | ) | (1.27 | ) | (0.24 | ) | (0.06 | ) | |||||||||||
|
|
|
|
|
|
|
|
|
| |||||||||||
Redemption fees | — | (2) | — | (2) | — | (2) | 0.01 | 0.01 | ||||||||||||
|
|
|
|
|
|
|
|
|
| |||||||||||
Net asset value, end of period | $ | 21.85 | $ | 18.92 | $ | 18.29 | $ | 16.45 | $ | 14.17 | ||||||||||
|
|
|
|
|
|
|
|
|
| |||||||||||
Total investment return(3) | 15.50 | % | 7.86 | % | 19.17 | % | 17.84 | % | 3.19 | % | ||||||||||
Ratios/Supplemental Data | ||||||||||||||||||||
Net assets, end of period (in thousands) | $ | 1,363,731 | $ | 959,962 | $ | 376,718 | $ | 252,108 | $ | 294,408 | ||||||||||
Ratio of expenses to average net assets | 1.00 | % | 1.00 | % | 1.00 | % | 1.00 | % | 1.00 | % | ||||||||||
Ratio of expenses to average net assets without waivers and expense reimbursements(4) | 1.12 | % | 1.17 | % | 1.25 | % | 1.27 | % | 1.26 | % | ||||||||||
Ratio of net investment income/(loss) to average net assets | (0.18 | )% | 0.04 | % | 0.10 | % | 0.17 | % | 0.24 | % | ||||||||||
Portfolio turnover rate | 13.61 | % | 9.13 | % | 33.44 | % | 39.52 | % | 51.04 | % | ||||||||||
| (1) | The selected per share data was calculated using the average shares outstanding method for the year. |
| (2) | Amount is less than $0.005 per share. |
| (3) | Total investment return is calculated assuming a purchase of shares on the first day and a sale of shares on the last day of each period reported and includes reinvestment of dividends and distributions, if any. |
| (4) | During the period, certain fees were waived and/or reimbursed. If such fee waivers and/or reimbursements had not occurred, the ratios would have been as indicated (See Note 2). |
The accompanying notes are an integral part of the financial statements.
43
POLEN GROWTH FUND
Financial Highlights
Contained below is per share operating performance data for Investor Class shares outstanding, total investment return, ratios to average net assets and other supplemental data for the respective period. The total returns in the table represent the rate that an investor would have earned or lost on an investment in the Fund (assuming reinvestment of all dividends and distributions). This information has been derived from information provided in the financial statements and should be read in conjunction with the financial statements and the notes thereto.
| Investor Class | ||||||||||||||||||||
| For the Year Ended April 30, 2017 | For the Year Ended April 30, 2016 | For the Year Ended April 30, 2015 | For the Year Ended April 30, 2014 | For the Year Ended April 30, 2013 | ||||||||||||||||
Per Share Operating Performance | ||||||||||||||||||||
Net asset value, beginning of period | $ | 18.70 | $ | 18.14 | $ | 16.35 | $ | 14.09 | $ | 13.74 | ||||||||||
|
|
|
|
|
|
|
|
|
| |||||||||||
Net investment loss(1) | (0.08 | ) | (0.04 | ) | (0.02 | ) | (0.01 | ) | — | (2) | ||||||||||
Net realized and unrealized gain on investments | 2.93 | 1.43 | 3.06 | 2.47 | 0.40 | |||||||||||||||
|
|
|
|
|
|
|
|
|
| |||||||||||
Net increase in net assets resulting from operations | 2.85 | 1.39 | 3.04 | 2.46 | 0.40 | |||||||||||||||
|
|
|
|
|
|
|
|
|
| |||||||||||
Dividends and distributions to shareholders from: | ||||||||||||||||||||
Net investment income | — | — | — | (0.01 | ) | — | ||||||||||||||
Net realized capital gains | — | (0.83 | ) | (1.25 | ) | (0.20 | ) | (0.06 | ) | |||||||||||
|
|
|
|
|
|
|
|
|
| |||||||||||
Total dividends and distributions to shareholders | — | (0.83 | ) | (1.25 | ) | (0.21 | ) | (0.06 | ) | |||||||||||
|
|
|
|
|
|
|
|
|
| |||||||||||
Redemption fees | — | (2) | — | (2) | — | (2) | 0.01 | 0.01 | ||||||||||||
|
|
|
|
|
|
|
|
|
| |||||||||||
Net asset value, end of period | $ | 21.55 | $ | 18.70 | $ | 18.14 | $ | 16.35 | $ | 14.09 | ||||||||||
|
|
|
|
|
|
|
|
|
| |||||||||||
Total investment return(3) | 15.24 | % | 7.54 | % | 18.87 | % | 17.59 | % | 2.98 | % | ||||||||||
Ratios/Supplemental Data | ||||||||||||||||||||
Net assets, end of period (in thousands) | $ | 107,358 | $ | 150,617 | $ | 29,545 | $ | 79,433 | $ | 100,859 | ||||||||||
Ratio of expenses to average net assets | 1.25 | % | 1.25 | % | 1.25 | % | 1.25 | % | 1.25 | % | ||||||||||
Ratio of expenses to average net assets without waivers and expense reimbursements(4) | 1.38 | % | 1.42 | % | 1.50 | % | 1.52 | % | 1.51 | % | ||||||||||
Ratio of net investment loss to average net assets | (0.43 | )% | (0.21 | )% | (0.14 | )% | (0.08 | )% | (0.01 | )% | ||||||||||
Portfolio turnover rate | 13.61 | % | 9.13 | % | 33.44 | % | 39.52 | % | 51.04 | % | ||||||||||
| (1) | The selected per share data was calculated using the average shares outstanding method for the year. |
| (2) | Amount is less than $0.005 per share. |
| (3) | Total investment return is calculated assuming a purchase of shares on the first day and a sale of shares on the last day of each period reported and includes reinvestment of dividends and distributions, if any. |
| (4) | During the period, certain fees were waived and/or reimbursed. If such fee waivers and/or reimbursements had not occurred, the ratios would have been as indicated (See Note 2). |
The accompanying notes are an integral part of the financial statements.
44
POLEN GLOBAL GROWTH FUND
Financial Highlights
Contained below is per share operating performance data for each Institutional Class shares outstanding, total investment return, ratios to average net assets and other supplemental data for the respective period. The total returns in the table represent the rate that an investor would have earned or lost on an investment in the Fund (assuming reinvestment of all dividends and distributions). This information has been derived from information provided in the financial statements and should be read in conjunction with the financial statements and the notes thereto.
| Institutional Class | ||||||||||||
| For the Year Ended April 30, 2017 | For the Year Ended April 30, 2016 | For the Period December 30, 2014* to April 30, 2015 | ||||||||||
Per Share Operating Performance | ||||||||||||
Net asset value, beginning of period | $ | 10.67 | $ | 10.29 | $ | 10.00 | ||||||
|
|
|
|
|
| |||||||
Net investment income/(loss)(1) | (0.02 | ) | — | (2) | 0.02 | |||||||
Net realized and unrealized gain on investments | 1.65 | 0.39 | 0.27 | |||||||||
|
|
|
|
|
| |||||||
Net increase in net assets resulting from operations | 1.63 | 0.39 | 0.29 | |||||||||
|
|
|
|
|
| |||||||
Dividends and distributions to shareholders from: | ||||||||||||
Net investment income | — | (0.01 | ) | — | ||||||||
Net realized capital gains | (0.01 | ) | — | — | ||||||||
|
|
|
|
|
| |||||||
Total dividends and distributions to shareholders | (0.01 | ) | (0.01 | ) | — | |||||||
|
|
|
|
|
| |||||||
Redemption fees | — | (2) | — | (2) | — | |||||||
|
|
|
|
|
| |||||||
Net asset value, end of period | $ | 12.29 | $ | 10.67 | $ | 10.29 | ||||||
|
|
|
|
|
| |||||||
Total investment return(3) | 15.24 | % | 3.78 | % | 2.90 | % | ||||||
Ratio/Supplemental Data | ||||||||||||
Net assets, end of period (in thousands) | $ | 18,618 | $ | 13,483 | $ | 3,076 | ||||||
Ratio of expenses to average net assets | 1.10 | % | 1.10 | % | 1.10 | %(4) | ||||||
Ratio of expenses to average net assets without waivers and expense reimbursements(5) | 2.40 | % | 3.63 | % | 9.78 | %(4) | ||||||
Ratio of net investment income/(loss) to average net assets | (0.18 | )% | (0.01 | )% | 0.47 | %(4) | ||||||
Portfolio turnover rate | 12.13 | % | 6.99 | % | — | |||||||
| * | Commencement of operations. |
| (1) | The selected per share data was calculated using the average shares outstanding method for the period. |
| (2) | Amount is less than $0.005 per share. |
| (3) | Total investment return is calculated assuming a purchase of shares on the first day and a sale of shares on the last day of each period reported and includes reinvestments of dividends and distributions, if any. Total returns for periods less than one year are not annualized. |
| (4) | Annualized. |
| (5) | During the period, certain fees were waived and/or reimbursed. If such fee waivers and/or reimbursements had not occurred, the ratios would have been as indicated (See Note 2). |
The accompanying notes are an integral part of the financial statements.
45
POLEN GLOBAL GROWTH FUND
Financial Highlights
Contained below is per share operating performance data for Investor Class shares outstanding, total investment return, ratios to average net assets and other supplemental data for the respective period. The total returns in the table represent the rate that an investor would have earned or lost on an investment in the Fund (assuming reinvestment of all dividends and distributions). This information has been derived from information provided in the financial statements and should be read in conjunction with the financial statements and the notes thereto.
| Investor Class | ||||||||
| For the Year Ended April 30, 2017 | For the Period July 6, 2015* to April 30, 2016 | |||||||
Per Share Operating Performance | ||||||||
Net asset value, beginning of period | $ | 10.64 | $ | 10.32 | ||||
|
|
|
| |||||
Net investment loss(1) | (0.05 | ) | — | (2) | ||||
Net realized and unrealized gain on investments | 1.65 | 0.32 | ||||||
|
|
|
| |||||
Net increase in net assets resulting from operations | 1.60 | 0.32 | ||||||
|
|
|
| |||||
Dividends and distributions to shareholders from: | ||||||||
Net investment income | — | — | (2) | |||||
Net realized capital gains | (0.01 | ) | — | |||||
|
|
|
| |||||
Total dividends and distributions to shareholders | (0.01 | ) | — | |||||
|
|
|
| |||||
Redemption fees | — | (2) | — | (2) | ||||
|
|
|
| |||||
Net asset value, end of period | $ | 12.23 | $ | 10.64 | ||||
|
|
|
| |||||
Total investment return(3) | 15.00 | % | 3.13 | % | ||||
Ratio/Supplemental Data | ||||||||
Net assets, end of period (in thousands) | $ | 996 | $ | 523 | ||||
Ratio of expenses to average net assets | 1.35 | % | 1.35 | %(4) | ||||
Ratio of expenses to average net assets without waivers and expense reimbursements(5) | 2.61 | % | 3.51 | %(4) | ||||
Ratio of net investment loss to average net assets | (0.43 | )% | (0.06 | )%(4) | ||||
Portfolio turnover rate | 12.13 | % | 6.99 | %(6) | ||||
| * | Commencement of operations. |
| (1) | The selected per share data was calculated using the average shares outstanding method for the period. |
| (2) | Amount is less than $0.005 per share. |
| (3) | Total investment return is calculated assuming a purchase of shares on the first day and a sale of shares on the last day of each period reported and includes reinvestments of dividends and distributions, if any. Total returns for periods less than one year are not annualized. |
| (4) | Annualized. |
| (5) | During the period, certain fees were waived and/or reimbursed. If such fee waivers and/or reimbursements had not occurred, the ratios would have been as indicated (See Note 2). |
| (6) | Reflects portfolio turnover for the Fund for the year ended April 30, 2016. |
The accompanying notes are an integral part of the financial statements.
46
POLEN INTERNATIONAL GROWTH FUND
Financial Highlights
Contained below is per share operating performance data for each Institutional Class shares outstanding, total investment return, ratios to average net assets and other supplemental data for the respective period. The total returns in the table represent the rate that an investor would have earned or lost on an investment in the Fund (assuming reinvestment of all dividends and distributions). This information has been derived from information provided in the financial statements and should be read in conjunction with the financial statements and the notes thereto.
| Institutional Class | ||||
| For the Period December 30, 2016* to April 30, 2017 | ||||
Per Share Operating Performance | ||||
Net asset value, beginning of period | $ | 10.00 | ||
|
| |||
Net investment income(1) | 0.05 | |||
Net realized and unrealized gain on investments | 1.52 | |||
|
| |||
Net increase in net assets resulting from operations | 1.57 | |||
|
| |||
Dividends and distributions to shareholders from: | ||||
Net investment income | — | |||
|
| |||
Redemption fees | — | |||
|
| |||
Net asset value, end of period | $ | 11.57 | ||
|
| |||
Total investment return(2) | 15.70 | % | ||
Ratio/Supplemental Data | ||||
Net assets, end of period (in thousands) | $ | 2,648 | ||
Ratio of expenses to average net assets | 1.10 | %(3) | ||
Ratio of expenses to average net assets without waivers and expense reimbursements(4) | 9.84 | %(3) | ||
Ratio of net investment income to average net assets | 1.32 | %(3) | ||
Portfolio turnover rate | — | |||
| * | Commencement of operations. |
| (1) | The selected per share data was calculated using the average shares outstanding method for the period. |
| (2) | Total investment return is calculated assuming a purchase of shares on the first day and a sale of shares on the last day of each period reported and includes reinvestments of dividends and distributions, if any. Total returns for periods less than one year are not annualized. |
| (3) | Annualized. |
| (4) | During the period, certain fees were waived and/or reimbursed. If such fee waivers and/or reimbursements had not occurred, the ratios would have been as indicated (See Note 2). |
The accompanying notes are an integral part of the financial statements.
47
POLEN INTERNATIONAL GROWTH FUND
Financial Highlights
Contained below is per share operating performance data for Investor Class shares outstanding, total investment return, ratios to average net assets and other supplemental data for the respective period. The total returns in the table represent the rate that an investor would have earned or lost on an investment in the Fund (assuming reinvestment of all dividends and distributions). This information has been derived from information provided in the financial statements and should be read in conjunction with the financial statements and the notes thereto.
| Investor Class | ||||
| For the Period March 15, 2017* to April 30, 2017 | ||||
Per Share Operating Performance | ||||
Net asset value, beginning of period | $ | 10.91 | ||
|
| |||
Net investment income(1) | 0.04 | |||
Net realized and unrealized gain on investments | 0.61 | |||
|
| |||
Net increase in net assets resulting from operations | 0.65 | |||
|
| |||
Dividends and distributions to shareholders from: | ||||
Net investment income | — | |||
|
| |||
Redemption fees | — | |||
|
| |||
Net asset value, end of period | $ | 11.56 | ||
|
| |||
Total investment return(2) | 5.96 | % | ||
Ratio/Supplemental Data | ||||
Net assets, end of period (in thousands) | $ | 14 | ||
Ratio of expenses to average net assets | 1.35 | %(3) | ||
Ratio of expenses to average net assets without waivers and expense reimbursements(4) | 9.47 | %(3) | ||
Ratio of net investment income to average net assets | 2.63 | %(3) | ||
Portfolio turnover rate | — | |||
| * | Commencement of operations. |
| (1) | The selected per share data was calculated using the average shares outstanding method for the period. |
| (2) | Total investment return is calculated assuming a purchase of shares on the first day and a sale of shares on the last day of each period reported and includes reinvestments of dividends and distributions, if any. Total returns for periods less than one year are not annualized. |
| (3) | Annualized. |
| (4) | During the period, certain fees were waived and/or reimbursed. If such fee waivers and/or reimbursements had not occurred, the ratios would have been as indicated (See Note 2). |
The accompanying notes are an integral part of the financial statements.
48
POLEN GROWTH FUNDS
Notes to Financial Statements
April 30, 2017
1. Organization and Significant Accounting Policies
The Polen Growth Fund, Polen Global Growth Fund and Polen International Growth Fund (each a “Fund” and together the “Funds”) are non-diversified, open-end management investment companies registered under the Investment Company Act of 1940, as amended, (the “1940 Act”), which commenced investment operations on September 15, 2010, December 30, 2014 and December 30, 2016, respectively. The Funds are separate series of FundVantage Trust (the “Trust”) which was organized as a Delaware statutory trust on August 28, 2006. The Trust is a “series trust” authorized to issue an unlimited number of separate series or classes of shares of beneficial interest. Each series is treated as a separate entity for certain matters under the 1940 Act, and for other purposes, and a shareholder of one series is not deemed to be a shareholder of any other series. The Funds offer two separate classes of shares, Investor Class (formerly Retail Class) and Institutional Class.
The Funds are investment companies and follow accounting and reporting guidance in the Financial Accounting Standards Board Accounting Standards Codification Topic 946.
Portfolio Valuation — The Funds’ net asset value (“NAV”) is calculated once daily at the close of regular trading hours on the New York Stock Exchange (“NYSE”) (typically 4:00 p.m. Eastern time) on each day the NYSE is open. Securities held by the Funds are valued using the closing price or the last sale price on a national securities exchange or the National Association of Securities Dealers Automatic Quotation System (“NASDAQ”) market system where they are primarily traded. Equity securities traded in the over-the-counter market are valued at their closing prices. If there were no transactions on that day, securities traded principally on an exchange or on NASDAQ will be valued at the mean of the last bid and ask prices prior to the market close. Fixed income securities having a remaining maturity of greater than 60 days are valued using an independent pricing service. Fixed income securities having a remaining maturity of 60 days or less are generally valued at amortized cost, provided such amount approximates fair value. Investments in other open-end investment companies are valued based on the NAV of the investment companies (which may use fair value pricing as discussed in their prospectuses). If market quotations are unavailable or deemed unreliable, securities will be valued in accordance with procedures adopted by the Trust’s Board of Trustees. Relying on prices supplied by pricing services or dealers or using fair valuation may result in values that are higher or lower than the values used by other investment companies and investors to price the same investments. In the event that market quotes are not readily available, and the security or asset cannot be valued pursuant to one of the valuation methods, the value of the security or asset will be determined in good faith by the Adviser. The Trust has established a Valuation Committee which performs certain functions including the oversight of the Adviser’s fair valuation determinations.
49
POLEN GROWTH FUNDS
Notes to Financial Statements
April 30, 2017
Fair Value Measurements — The inputs and valuation techniques used to measure fair value of the Funds’ investments are summarized into three levels as described in the hierarchy below:
• | Level 1 | — | quoted prices in active markets for identical securities; | |||
• | Level 2 | — | other significant observable inputs (including quoted prices for similar securities, interest rates, prepayment speeds, credit risk, etc.); and | |||
• | Level 3 | — | significant unobservable inputs (including the Funds’ own assumptions in determining the fair value of investments). | |||
The inputs or methodology used for valuing securities are not necessarily an indication of the risk associated with investing in those securities.
Significant events (such as movement in the U.S. securities market, or other regional and local developments) may occur between the time that foreign markets close (where the security is principally traded) and the time that each Fund calculates its NAV (generally, the close of the NYSE) that may impact the value of securities traded in these foreign markets. As a result, each Fund fair values foreign securities using an independent pricing service which considers the correlation of the trading patterns of the foreign security to the intraday trading in the U.S. markets for investments such as American Depositary Receipts, financial futures, exchange traded funds and certain indexes as well as prices for similar securities. Such fair valuations are categorized as Level 2 in the hierarchy.
Securities listed on a non-U.S. exchange are generally fair valued daily by an independent fair value pricing service approved by the Board of Trustees and categorized as Level 2 investments within the hierarchy. The fair valuations for these securities may not be the same as quoted or published prices of the securities on their primary markets. Securities for which daily fair value prices from the independent fair value pricing service are not available are generally valued at the last quoted sale price at the close of an exchange on which the security is traded and categorized as Level 1 investments within the hierarchy. Values of foreign securities, currencies, and other assets and liabilities denominated in foreign currencies are translated into U.S. dollars at the exchange rate of said currencies against the U.S. dollar, as of Valuation Time, as provided by an independent pricing service approved by the Board of Trustees.
50
POLEN GROWTH FUNDS
Notes to Financial Statements
April 30, 2017
The following is a summary of the inputs used, as of April 30, 2017, in valuing the Funds’ investments carried at fair value:
| Funds | Total Value at 04/30/17 | Level 1 Quoted Price | Level 2 Other Significant Observable Inputs | Level 3 Significant Unobservable Inputs | ||||||||||||
Polen Growth Fund | ||||||||||||||||
Investments in Securities* | $ | 1,396,100,031 | $ | 1,396,100,031 | $ | — | $ | — | ||||||||
|
|
|
|
|
|
|
| |||||||||
Polen Global Growth Fund | ||||||||||||||||
Australia | $ | 541,315 | $ | — | $ | 541,315 | $ | — | ||||||||
Cayman Islands | 1,504,407 | 548,740 | 955,667 | — | ||||||||||||
Denmark | 225,388 | 225,388 | — | — | ||||||||||||
France | 546,754 | — | 546,754 | — | ||||||||||||
Hong Kong | 692,144 | — | 692,144 | — | ||||||||||||
Ireland | 737,989 | 737,989 | — | — | ||||||||||||
Israel | 543,244 | 543,244 | — | — | ||||||||||||
Switzerland | 1,282,494 | — | 1,282,494 | — | ||||||||||||
United Kingdom | 450,461 | — | 450,461 | — | ||||||||||||
United States | 11,871,986 | 11,871,986 | — | — | ||||||||||||
|
|
|
|
|
|
|
| |||||||||
Total | $ | 18,396,182 | $ | 13,927,347 | $ | 4,468,835 | $ | — | ||||||||
|
|
|
|
|
|
|
| |||||||||
| Total Value at 04/30/17 | Level 1 Quoted Price | Level 2 Other Significant Observable Inputs | Level 3 Significant Unobservable Inputs | |||||||||||||
Polen International Growth Fund |
| |||||||||||||||
Australia | $ | 94,202 | $ | — | $ | 94,202 | $ | — | ||||||||
Cayman Islands | 230,628 | 89,628 | 141,000 | — | ||||||||||||
China | 75,697 | 75,697 | — | — | ||||||||||||
Denmark | 170,504 | — | 170,504 | — | ||||||||||||
France | 158,804 | — | 158,804 | — | ||||||||||||
Germany | 217,729 | — | 217,729 | — | ||||||||||||
Ireland | 322,533 | 221,165 | 101,368 | — | ||||||||||||
Israel | 84,560 | 84,560 | — | — | ||||||||||||
Mexico | 57,472 | 57,472 | — | — | ||||||||||||
Netherlands | 105,005 | — | 105,005 | — | ||||||||||||
Spain | 158,319 | — | 158,319 | — | ||||||||||||
51
POLEN GROWTH FUNDS
Notes to Financial Statements
April 30, 2017
| Total Value at 04/30/17 | Level 1 Quoted Price | Level 2 Other Significant Observable Inputs | Level 3 Significant Unobservable Inputs | |||||||||||||
Switzerland | $ | 247,110 | $ | — | $ | 247,110 | $ | — | ||||||||
United Kingdom | 548,799 | — | 548,799 | — | ||||||||||||
|
|
|
|
|
|
|
| |||||||||
Total | $ | 2,471,362 | $ | 528,522 | $ | 1,942,840 | $ | — | ||||||||
|
|
|
|
|
|
|
| |||||||||
| * | Please refer to Portfolio of Investments for details on portfolio holdings. |
At the end of each quarter, management evaluates the classification of Levels 1, 2 and 3 assets and liabilities. Various factors are considered, such as changes in liquidity from the prior reporting period; whether or not a broker is willing to execute at the quoted price; the depth and consistency of prices from third party pricing services; and the existence of contemporaneous, observable trades in the market. Additionally, management evaluates the classification of Level 1 and Level 2 assets and liabilities on a quarterly basis for changes in listings or delistings on national exchanges.
Due to the inherent uncertainty of determining the fair value of investments that do not have a readily available market value, the fair value of the Funds’ investments may fluctuate from period to period. Additionally, the fair value of investments may differ significantly from the values that would have been used had a ready market existed for such investments and may differ materially from the values the Funds may ultimately realize. Further, such investments may be subject to legal and other restrictions on resale or otherwise less liquid than publicly traded securities.
For fair valuations using significant unobservable inputs, U.S. generally accepted accounting principles (“U.S. GAAP”) require the Funds to present a reconciliation of the beginning to ending balances for reported market values that present changes attributable to total realized and unrealized gains or losses, purchase and sales, and transfers in and out of Level 3 during the period. Transfers in and out between Levels are based on values at the end of the period. U.S. GAAP also requires the Funds to disclose amounts and reasons for all transfers in and out of Level 1 and Level 2 fair value measurements. A reconciliation of Level 3 investments is presented only when the Funds had an amount of Level 3 investments at the end of the reporting period that was meaningful in relation to their net assets. The amounts and reasons for all transfers in and out of each Level within the three-tier hierarchy are disclosed when the Funds had an amount of total transfers during the reporting period that was meaningful in relation to their net assets as of the end of the reporting period.
For the year ended April 30, 2017, there were no transfers between Levels 1, 2 and 3 for any of the Funds.
52
POLEN GROWTH FUNDS
Notes to Financial Statements
April 30, 2017
Use of Estimates — The preparation of financial statements in conformity with U.S. GAAP requires management to make estimates and assumptions that affect the amounts reported in the financial statements and accompanying notes at the date of the financial statements and the reported amounts of revenues and expenses during the period. Actual results could differ from those estimates and those differences could be material.
Investment Transactions, Investment Income and Expenses — Investment transactions are recorded on trade date for financial statement preparation purposes. Realized gains and losses on investments sold are recorded on the identified cost basis. Interest income is recorded on the accrual basis. Dividends are recorded on the ex-dividend date. Estimated components of distributions received from real estate investment trusts may be considered income, return of capital distributions or capital gain distributions. Return of capital distributions are recorded as a reduction of cost of the related investments. Distribution (12b-1) fees relating to a specific class are charged directly to that class. Fund level expenses common to all classes, investment income and realized and unrealized gains and losses on investments are generally allocated to each class of each Fund based upon the relative daily net assets of each class of each Fund. General expenses of the Trust are generally allocated to each Fund in proportion to its relative daily net assets. Expenses directly attributable to a particular Fund in the Trust are charged directly to that Fund. The Funds’ investment income, expenses (other than class-specific expenses) and unrealized and realized gains and losses are allocated daily to each class of shares based upon the relative proportion of net assets of each class at the beginning of the day.
Foreign Currency Translation — Assets and liabilities initially expressed in non-U.S. currencies are translated into U.S. dollars based on the applicable exchange rates at the date of the last business day of the financial statement period. Purchases and sales of securities, interest income, dividends, variation margin received and expenses denominated in foreign currencies are translated into U.S. dollars at the exchange rates in effect on the transaction date. The Funds do not separately report the effect of changes in foreign exchange rates from changes in market prices of securities held. Such changes are included with the net realized gain or loss and change in unrealized appreciation or depreciation on investment securities in the Statement of Operations. Other foreign currency transactions resulting in realized and unrealized gain or loss are reported separately as net realized gain or loss and change in unrealized appreciation or depreciation on foreign currencies in the Statement of Operations.
Dividends and Distributions to Shareholders — Dividends from net investment income and distributions from net realized capital gains, if any, are declared and paid at least annually to shareholders and are recorded on ex-date. Income dividends and capital gain distributions are determined in accordance with U.S. federal income tax regulations, which may differ from U.S. GAAP. These differences may include the treatment of non-taxable dividends, expiring capital loss carryforwards and losses deferred due to wash sales and excise tax regulations. Permanent book and tax basis differences relating to shareholder distributions will result in reclassifications within the components of net assets.
53
POLEN GROWTH FUNDS
Notes to Financial Statements
April 30, 2017
U.S. Tax Status — No provision is made for U.S. income taxes as it is the Funds’ intention to continue to qualify for and elect the tax treatment applicable to regulated investment companies under Subchapter M of the Internal Revenue Code of 1986, as amended (“Internal Revenue Code”), and make the requisite distributions to its shareholders which will be sufficient to relieve it from U.S. income and excise taxes.
Other — In the normal course of business, the Funds may enter into contracts that provide general indemnifications. The Funds’ maximum exposure under these arrangements is dependent on claims that may be made against the Funds in the future, and therefore, cannot be estimated; however, based on experience, the risk of material loss for such claims is considered remote.
Currency Risk — The Funds invest in securities of foreign issuers, including American Depositary Receipts. These markets are subject to special risks associated with foreign investments not typically associated with investing in U.S. markets. Because the foreign securities in which the Funds may invest generally trade in currencies other than the U.S. dollar, changes in currency exchange rates will affect the Funds’ NAV, the value of dividends and interest earned and gains and losses realized on the sale of securities. Because the NAV for the Funds is determined on the basis of U.S. dollars, the Funds may lose money by investing in a foreign security if the local currency of a foreign market depreciates against the U.S. dollar, even if the local currency value of the Funds’ holdings goes up. Generally, a strong U.S. dollar relative to these other currencies will adversely affect the value of the Funds’ holdings in foreign securities.
Foreign Securities Market Risk — Securities of many non-U.S. companies may be less liquid and their prices more volatile than securities of comparable U.S. companies. Securities of companies traded in many countries outside the U.S., particularly emerging markets countries, may be subject to further risks due to the inexperience of local investment professionals and financial institutions, the possibility of permanent or temporary termination of trading and greater spreads between bid and asked prices of securities. In addition, non-U.S. stock exchanges and investment professionals are subject to less governmental regulation, and commissions may be higher than in the United States. Also, there may be delays in the settlement of non-U.S. stock exchange transactions.
Recent Accounting Pronouncement — In October 2016, the U.S. Securities and Exchange Commission (“SEC”) issued a new rule, Investment Company Reporting Modernization, which, among other provisions, amends Regulation S-X to require standardized, enhanced disclosures, particularly related to derivatives, in investment company financial statements. Compliance with the amendments to Regulation S-X is required for financial statements filed with the SEC on or after August 1, 2017. Management is currently evaluating the impact that the amendments will have on the Funds’ financial statements and related disclosures.
54
POLEN GROWTH FUNDS
Notes to Financial Statements
April 30, 2017
2. Transactions with Related Parties and Other Service Providers
Polen Capital Management, LLC (“PCM” or the “Adviser”) serves as investment adviser to the Funds pursuant to an investment advisory agreement with the Trust. For its services, the Adviser is paid a monthly fee at the annual rate of 0.85% of the average daily net assets of the Polen Growth Fund, Polen Global Growth Fund and Polen International Growth Fund. Prior to January 1, 2017, the Adviser was paid a monthly fee at the annual rate of 1.00% of the average daily net assets of the Polen Growth Fund. The Adviser has contractually agreed to reduce its investment advisory fee and/or reimburse certain expenses of the Funds to the extent necessary to ensure that the Funds’ total operating expenses (excluding taxes, any class-specific fees and expenses, interest, extraordinary items, “Acquired Fund” fees and expenses and brokerage commissions) do not exceed (on an annual basis) 1.00% of the Polen Growth Fund’s and 1.10% of the Polen Global Growth Fund and Polen International Growth Fund’s, average daily net assets (the “Expense Limitations”). The Expense Limitations will remain in place until August 31, 2018 with respect to each Fund, unless the Board of Trustees approves its earlier termination. With regard to a Fund, the Adviser is entitled to recover, subject to approval by the Board of Trustees, such amounts reduced or reimbursed for a period of up to three (3) years from the year in which the Adviser reduced its compensation and/or assumed expenses for the Fund. The Adviser is permitted to seek reimbursement from a Fund, subject to certain limitations, for fees it waived and Fund expenses it paid to the extent the total annual fund expenses do not exceed the limits described above or any lesser limits in effect at the time of reimbursement. For the Polen Growth Fund, the Advisor is entitled to recoup only the advisory fees waived or expenses reimbursed beginning January 1, 2017. No recoupment will occur unless the Fund’s expenses are below the Expense Limitation amount.
For the year or period ended April 30, 2017, the Adviser earned advisory fees of $11,816,414, $135,784 and $5,160 for the Polen Growth Fund, Polen Global Growth Fund and Polen International Growth Fund, respectively. For the year or period ended April 30, 2017, the Adviser waived fees and reimbursed expenses of $1,532,659, $207,831 and $53,471 for the Polen Growth Fund, Polen Global Growth Fund and Polen International Growth Fund, respectively.
As of April 30, 2017, the amount of potential recovery was as follows:
Expiration
| ||||||||||||||||
| 04/30/2018 | 04/30/2019 | 04/30/2020 | Total | |||||||||||||
Polen Growth Fund | $ | — | $ | — | $ | 244,947 | $ | 244,947 | ||||||||
Polen Global Growth Fund | $ | 80,469 | $ | 211,741 | $ | 207,831 | $ | 500,041 | ||||||||
Polen International Growth Fund | $ | — | $ | — | $ | 53,471 | $ | 53,471 | ||||||||
55
POLEN GROWTH FUNDS
Notes to Financial Statements
April 30, 2017
Other Service Providers
BNY Mellon Investment Servicing (US) Inc. (“BNY Mellon”) serves as administrator and transfer agent for the Funds. For providing administrative and accounting services, BNY Mellon is entitled to receive a monthly fee equal to an annual percentage rate of the Funds’ average daily net assets and is subject to certain minimum monthly fees. For providing transfer agency services, BNY Mellon is entitled to receive a monthly fee, subject to certain minimum, and out of pocket expenses.
The Bank of New York Mellon (the “Custodian”) provides certain custodial services to the Funds. The Custodian is entitled to receive a monthly fee, subject to certain minimum, and out of pocket expenses.
Foreside Funds Distributors LLC (the “Underwriter”) provides principal underwriting services to the Funds.
The Trust and the Underwriter are parties to an underwriting agreement. The Trust has adopted a distribution plan for Investor Shares in accordance with Rule 12b-1 under the 1940 Act. Pursuant to the Investor Shares plan, the Funds compensate the Underwriter for direct and indirect costs and expenses incurred in connection with advertising, marketing and other distribution services in an amount not to exceed 0.25% on an annualized basis of the average daily net assets of the Funds’ Investor Shares.
Trustees and Officers
The Trust is governed by its Board of Trustees. The Trustees receive compensation in the form of an annual retainer and per meeting fees for their services to the Trust. The remuneration paid to the Trustees by the Funds during the year ended April 30, 2017 was $105,214, $1,334 and $30 for the Polen Growth Fund, Polen Global Growth Fund and Polen International Growth Fund, respectively. An employee of BNY Mellon serves as the Secretary of the Trust and is not compensated by the Funds or the Trust.
Effective June 1, 2016 and July 1, 2016, JW Fund Management LLC (“JWFM”) provides a Principal Executive Officer and Principal Financial Officer, respectively, to the Trust. JWFM is compensated for the services provided to the Trust. Until May 31, 2016 and June 30, 2016, certain employees of BNY Mellon served as Principal Executive Officer and Principal Financial Officer, respectively, to the Trust. They were not compensated by the Trust or the Funds.
Freeh Group International Solutions, LLC provides the Trust with a Chief Compliance Officer and an Anti-Money Laundering Officer.
56
POLEN GROWTH FUNDS
Notes to Financial Statements
April 30, 2017
3. Investment in Securities
For the year ended April 30, 2017, aggregate purchases and sales of investment securities (excluding short-term investments) of the Funds were as follows:
| Purchases | Sales | |||||||
Polen Growth Fund | $ | 306,741,058 | $ | 164,665,284 | ||||
Polen Global Growth Fund | $ | 5,226,116 | $ | 1,770,307 | ||||
Polen International Growth Fund | $ | 2,206,286 | $ | — | ||||
4. Capital Share Transactions
For the year ended April 30, 2017 and the year ended April 30, 2016, transactions in capital shares (authorized shares unlimited) were as follows:
| Polen Growth Fund | ||||||||||||||||
| For Year Ended April 30, 2017 | For the Year Ended April 30, 2016 | |||||||||||||||
| Shares | Amount | Shares | Amount | |||||||||||||
Institutional Class | ||||||||||||||||
Sales | 30,209,162 | $ | 595,828,006 | 37,345,762 | $ | 714,464,173 | ||||||||||
Reinvestments | 4,430 | 87,594 | 1,214,971 | 23,655,483 | ||||||||||||
Redemption Fees* | — | 71,400 | — | 77,109 | ||||||||||||
Redemptions | (18,555,536 | ) | (366,058,856 | ) | (8,408,355 | ) | (159,371,801 | ) | ||||||||
|
|
|
|
|
|
|
| |||||||||
Net increase | 11,658,056 | $ | 229,928,144 | 30,152,378 | $ | 578,824,964 | ||||||||||
|
|
|
|
|
|
|
| |||||||||
Investor Class | ||||||||||||||||
Sales | 2,120,795 | $ | 41,071,753 | 8,079,428 | $ | 153,470,981 | ||||||||||
Reinvestments | — | — | 227,559 | 4,382,791 | ||||||||||||
Redemption Fees* | — | 7,298 | — | 11,271 | ||||||||||||
Redemptions | (5,193,570 | ) | (98,920,376 | ) | (1,881,323 | ) | (35,283,070 | ) | ||||||||
|
|
|
|
|
|
|
| |||||||||
Net increase/(decrease) | (3,072,775 | ) | $ | (57,841,325 | ) | 6,425,664 | $ | 122,581,973 | ||||||||
|
|
|
|
|
|
|
| |||||||||
Total net increase | 8,585,281 | $ | 172,086,819 | 36,578,042 | $ | 701,406,937 | ||||||||||
|
|
|
|
|
|
|
| |||||||||
57
POLEN GROWTH FUNDS
Notes to Financial Statements
April 30, 2017
| Polen Global Growth Fund | ||||||||||||||||
| For Year Ended April 30, 2017 | For the Year Ended April 30, 2016 | |||||||||||||||
| Shares | Amount | Shares | Amount | |||||||||||||
Institutional Class | ||||||||||||||||
Sales | 457,506 | $ | 5,095,096 | 1,000,389 | $ | 10,474,716 | ||||||||||
Reinvestments | 586 | 6,395 | 775 | 8,435 | ||||||||||||
Redemption Fees* | — | 2,893 | — | 814 | ||||||||||||
Redemptions | (207,163 | ) | (2,295,697 | ) | (36,382 | ) | (367,664 | ) | ||||||||
|
|
|
|
|
|
|
| |||||||||
Net increase | 250,929 | $ | 2,808,687 | 964,782 | $ | 10,116,301 | ||||||||||
|
|
|
|
|
|
|
| |||||||||
Investor Class | ||||||||||||||||
Sales | 50,622 | $ | 558,466 | 58,500 | $ | 618,275 | ||||||||||
Reinvestments | 38 | 408 | 6 | 64 | ||||||||||||
Redemption Fees* | — | 127 | — | 23 | ||||||||||||
Redemptions | (18,360 | ) | (202,288 | ) | (9,375 | ) | (96,959 | ) | ||||||||
|
|
|
|
|
|
|
| |||||||||
Net increase | 32,300 | $ | 356,713 | 49,131 | $ | 521,403 | ||||||||||
|
|
|
|
|
|
|
| |||||||||
Total net increase | 283,229 | $ | 3,165,400 | 1,013,913 | $ | 10,637,704 | ||||||||||
|
|
|
|
|
|
|
| |||||||||
| Polen International Growth Fund** | ||||||||||||||||
| For the Period Ended April 30, 2017 | ||||||||||||||||
| Shares | Amount | |||||||||||||||
Institutional Class | ||||||||||||||||
Sales | 228,806 | $ | 2,372,451 | |||||||||||||
Reinvestments | — | — | ||||||||||||||
Redemption Fees* | — | — | ||||||||||||||
Redemptions | — | — | ||||||||||||||
|
|
|
| |||||||||||||
Net increase | 228,806 | $ | 2,372,451 | |||||||||||||
|
|
|
| |||||||||||||
Investor Class | �� | |||||||||||||||
Sales | 1,229 | $ | 13,500 | |||||||||||||
Reinvestments | — | — | ||||||||||||||
Redemption Fees* | — | — | ||||||||||||||
Redemptions | — | — | ||||||||||||||
|
|
|
| |||||||||||||
Net increase | 1,229 | $ | 13,500 | |||||||||||||
|
|
|
| |||||||||||||
Total net increase | 230,035 | $ | 2,385,951 | |||||||||||||
|
|
|
| |||||||||||||
58
POLEN GROWTH FUNDS
Notes to Financial Statements
April 30, 2017
| * | There is a 2.00% redemption fee that may be charged on shares redeemed within the first 60 days of their acquisition. The redemption fees are retained by the Funds for the benefit of the remaining shareholders and recorded as paid-in capital. |
| ** | The Polen International Growth Fund’s Institutional Class commenced operations on December 30, 2016, and the Fund’s Investor Class commenced operations on March 15, 2017. |
5. Federal Tax Information
The Funds have followed the authoritative guidance on accounting for and disclosure of uncertainty in tax positions, which requires the Funds to determine whether a tax position is more likely than not to be sustained upon examination, including resolution of any related appeals or litigation processes, based on the technical merits of the position. The Funds have determined that there was no effect on the financial statements from following this authoritative guidance. In the normal course of business, the Funds are subject to examination by federal, state and local jurisdictions, where applicable, for tax years for which applicable statutes of limitations have not expired.
Distributions are determined in accordance with federal income tax regulations, which may differ in amount or character from net investment income and realized gains for financial reporting purposes. Accordingly, the character of distributions and composition of net assets for tax purposes may differ from those reflected in the accompanying financial statements. To the extent these differences are permanent, such amounts are reclassified within the components of net assets based on the tax treatment; temporary differences do not require reclassifications. Net assets were not affected by these adjustments.
The following permanent differences as of April 30, 2017, primarily attributed to redesignation of distributions, write-off of net operating loss and disallowed offering cost expense, were reclassified among the following accounts:
| Accumulated Net Investment Income | Accumulated Net Realized Gain/(Loss) | Paid-in-Capital | ||||||||||
Polen Growth Fund | $ | 2,609,712 | $ | (103,570 | ) | $ | (2,506,142 | ) | ||||
Polen Global Growth Fund | 32,029 | 3,105 | (35,134 | ) | ||||||||
Polen International Growth Fund | 12,624 | (3,385 | ) | (9,239 | ) | |||||||
For the year ended April 30, 2017, the tax character of distributions paid by the Polen Growth Fund and Polen Global Growth Fund were $103,570 and $7,111 of long-term capital gains, respectively. There were no distributions for the Polen International Growth Fund. For the year ended April 30, 2016, the tax character of distributions paid by the Polen Growth Fund and the Polen Global Growth Fund were $103,365 and $8,499 of ordinary income dividends and $31,650,603 and $0 of long-term capital gains, respectively. Distributions from net investment income and short-term capital gains are treated as ordinary income for federal income tax purposes.
59
POLEN GROWTH FUNDS
Notes to Financial Statements
April 30, 2017
As of April 30, 2017 the components of distributable earnings on a tax basis were as follows:
| Capital Loss Carryforward | Undistributed Ordinary Income | Undistributed Long-Term Gain | Unrealized Appreciation | Qualified Late Year Loss Deferral | |||||||||||||||||||||
Polen Growth Fund | $ | — | $ | — | $ | 10,995,871 | $ | 315,170,201 | $ | — | |||||||||||||||
Polen Global Growth Fund | $ | — | $ | — | $ | — | $ | 2,910,771 | $ | (48,066 | ) | ||||||||||||||
Polen International Growth Fund | $ | — | $ | 20,712 | $ | — | $ | 265,135 | $ | — | |||||||||||||||
The differences between the book and tax basis components of distributable earnings relate primarily to the timing and recognition of income and gains for federal income tax purposes. Foreign currency and short-term capital gains are reported as ordinary income for federal income tax purposes.
As of April 30, 2017, the federal tax cost, aggregate gross unrealized appreciation and depreciation of securities held by each Fund were as follows:
| Federal Tax Cost | Gross Unrealized Appreciation | Gross Unrealized Depreciation | Net Unrealized Appreciation | |||||||||||||
Polen Growth Fund | $ | 1,080,929,830 | $ | 323,953,782 | $ | (8,783,581 | ) | $ | 315,170,201 | |||||||
Polen Global Growth Fund | 15,485,465 | 3,161,537 | (250,820 | ) | 2,910,717 | |||||||||||
Polen International Growth Fund | 2,206,286 | 265,354 | (278 | ) | 265,076 | |||||||||||
Pursuant to federal income tax rules applicable to regulated investment companies, the Funds may elect to treat certain capital losses between November 1 and April 30 and late year ordinary losses ((i) ordinary losses between January 1 and April 30, and (ii) specified ordinary and currency losses between November 1 and April 30) as occurring on the first day of the following tax year. For the year ended April 30, 2017, any amount of losses elected within the tax return will not be recognized for federal income tax purposes until May 1, 2017. For the year ended April 30, 2017, the Funds deferred to May 1, 2017 the following losses:
| Late-Year Ordinary Losses Deferral | Short-Term Capital Loss Deferral | Long-Term Capital Loss Deferral | |||||||||||||
Polen Growth Fund | $ | — | $ | — | $ | — | |||||||||
Polen Global Growth Fund | — | 10,382 | 37,684 | ||||||||||||
Polen International Growth Fund | — | — | — | ||||||||||||
60
POLEN GROWTH FUNDS
Notes to Financial Statements (Concluded)
April 30, 2017
Accumulated capital losses represent net capital loss carryforwards as of April 30, 2017 that may be available to offset future realized capital gains and thereby reduce future capital gains distributions. As of April 30, 2017, the Funds did not have any capital loss carryforwards.
During the year ended April 30, 2017, the Polen Global Growth Fund utilized $54,052 of prior year capital loss carryforward.
6. Subsequent Event
Management has evaluated the impact of all subsequent events on the Funds through the date the financial statements were issued and has determined that there were no subsequent events requiring recognition or disclosure in the financial statements.
61
POLEN GROWTH FUNDS
Report of Independent Registered Public Accounting Firm
To the Board of Trustees of FundVantage Trust and Shareholders of the Polen Growth Fund, the Polen Global Growth Fund, and the Polen International Growth Fund:
In our opinion, the accompanying statements of assets and liabilities, including the portfolios of investments, and the related statements of operations and of changes in net assets and the financial highlights present fairly, in all material respects, the financial position of the Polen Growth Fund, the Polen Global Growth Fund, and the Polen International Growth Fund (three of the funds constituting FundVantage Trust, hereafter referred to as the “Funds”) as of April 30, 2017, the results of each of their operations, the changes in each of their net assets and the financial highlights for each of the periods indicated, in conformity with accounting principles generally accepted in the United States of America. These financial statements and financial highlights (hereafter referred to as “financial statements”) are the responsibility of the Funds’ management. Our responsibility is to express an opinion on these financial statements based on our audits. We conducted our audits of these financial statements in accordance with the standards of the Public Company Accounting Oversight Board (United States). Those standards require that we plan and perform the audit to obtain reasonable assurance about whether the financial statements are free of material misstatement. An audit includes examining, on a test basis, evidence supporting the amounts and disclosures in the financial statements, assessing the accounting principles used and significant estimates made by management, and evaluating the overall financial statement presentation. We believe that our audits, which included confirmation of securities as of April 30, 2017 by correspondence with the custodian, provide a reasonable basis for our opinion.
PricewaterhouseCoopers LLP
Philadelphia, Pennsylvania
June 28, 2017
62
POLEN GROWTH FUNDS
Shareholder Tax Information
(Unaudited)
The Funds are required by Subchapter M of the Internal Revenue Code of 1986, as amended, to advise their shareholders of the U.S. federal tax status of distributions received by the Funds’ shareholders in respect of such fiscal year. During the year ended April 30, 2017, the Polen Growth Fund and Polen Global Growth Fund paid $103,570 and $7,111 of long term capital gain dividends, respectively, to its shareholders. There were no distributions for the Polen International Growth Fund. Preceding information for the Polen Growth Fund, Polen Global Growth Fund and the Polen International Growth Fund dividends from net investment income and short-term capital gains are treated as ordinary income dividends for federal income tax purposes.
The Polen International Growth Fund paid foreign taxes and recognized foreign source income as follows:
Foreign Taxes Paid | Foreign Source Income | |
$1,526 | $15,234 |
All designations are based on financial information available as of the date of this annual report and, accordingly, are subject to change. For each item, it is the intention of the Funds to designate the maximum amount permitted under the Internal Revenue Code of 1986, as amended, and the regulations thereunder.
Because the Funds’ fiscal year is not the calendar year, another notification will be sent with respect to calendar year 2017. The second notification, which will reflect the amount, if any, to be used by calendar year taxpayers on their U.S. federal income tax returns, will be made in conjunction with Form 1099-DIV and will be mailed in January 2018.
Foreign shareholders will generally be subject to U.S. withholding tax on the amount of their ordinary income dividends. They will generally not be entitled to a foreign tax credit or deduction for the withholding taxes paid by the Funds, if any.
In general, dividends received by tax-exempt recipients (e.g., IRAs and Keoghs) need not be reported as taxable income for U.S. federal income tax purposes. However, some retirement trusts (e.g., corporate, Keogh and 403(b)(7) plans) may need this information for their annual information reporting.
Shareholders are advised to consult their own tax advisers with respect to the tax consequences of their investment in the Funds.
63
POLEN GROWTH FUNDS
Other Information
(Unaudited)
Proxy Voting
Policies and procedures that the Funds use to determine how to vote proxies relating to portfolio securities as well as information regarding how the Funds voted proxies relating to portfolio securities for the most recent 12-month period ended June 30 are available without charge, upon request, by calling (888) 678-6024 and on the Securities and Exchange Commission’s (“SEC”) website at http:// www.sec.gov.
Quarterly Portfolio Schedules
The Trust files its complete schedule of portfolio holdings with the SEC for the first and third fiscal quarters of each fiscal year (quarters ended July 31 and January 31) on Form N-Q. The Trust’s Forms N-Q are available on the SEC’s website at http://www.sec.gov, and may be reviewed and copied at the SEC’s Public Reference Room in Washington, D.C. Information on the operation of the SEC’s Public Reference Room may be obtained by calling 1-800-SEC-0330.
Approval of Advisory Agreement
At an in-person meeting held on September 28-29, 2016 (the “Meeting”), the Board of Trustees (the “Board” or “Trustees”) of FundVantage Trust (“Trust”), including a majority of the Trustees who are not “interested persons” as defined in the Investment Company Act of 1940, as amended (“1940 Act”) (the “Independent Trustees”), unanimously approved an investment advisory agreement between Polen Capital Management, LLC (the “Adviser” or “Polen”) and the Trust on behalf of the Polen International Growth Fund (the “International Fund”) for an initial two year period (the “Agreement).
In determining whether to approve the Agreement, the Trustees considered information provided by the Adviser in accordance with Section 15(c) of the 1940 Act. The Trustees considered information that the Adviser provided regarding (i) the services to be performed for the International Fund, (ii) the size and qualifications of the Adviser’s portfolio management staff, (iii) any potential or actual material conflicts of interest which may arise in connection with a portfolio manager’s management of the International Fund, (iv) investment performance of similarly managed funds and accounts, (v) the capitalization and financial condition of the Adviser, (vi) brokerage selection procedures (including soft dollar arrangements, if any), (vii) the procedures for allocating investment opportunities among the International Fund and other clients, (viii) results of any regulatory examination, including any recommendations or deficiencies noted, (ix) any litigation, investigation or administrative proceeding which may have a material impact on the Adviser’s ability to service the Fund, and (x) compliance with the federal securities laws and other regulatory requirements. The Adviser provided its most recent Form ADV for the Trustees’ review and consideration.
64
POLEN GROWTH FUNDS
Other Information (Continued)
(Unaudited)
The Trustees considered that the proposed strategy for the International Fund was new, and therefore did not have historical performance.
The Trustees also noted that Polen had provided information regarding its advisory fees and an analysis of these fees in relation to the delivery of services to the International Fund and any other potential ancillary benefit resulting from Polen’s relationship with the Fund. The Trustees considered the fees that Polen charges to its similarly managed accounts, and evaluated the explanations provided by Polen as to differences in fees charged to the International Fund and similarly managed accounts. The Trustees noted that the proposed advisory fee for the International Fund was the same fee charged by Polen for the Polen Growth Fund and the Polen Global Growth Fund.
The Trustees concluded that the proposed advisory fee and services to be provided by Polen are sufficiently consistent with those of other advisers which manage mutual funds with investment objectives, strategies and policies similar to those of the International Fund.
The Board then considered the level and depth of knowledge of Polen, including the professional experience and qualifications of senior personnel. In evaluating the quality of services to be provided by Polen, the Board took into account its familiarity with Polen’s senior management through Board meetings, discussions and reports during the preceding year. The Board also took into account Polen’s compliance policies and procedures and reports regarding Polen’s compliance operations from the Trust’s CCO. The Board also considered any potential conflicts of interest that may arise in a portfolio manager’s management of the International Fund’s investments on the one hand, and the investments of other accounts, on the other. The Trustees reviewed the proposed services to be provided to the International Fund by Polen and concluded that the nature, extent and quality of the services provided were appropriate and consistent with the terms of the Agreement, that the quality of the proposed services appeared to be consistent with industry norms and that the International Fund is likely to benefit from the provision of those services. They also concluded that Polen has sufficient personnel, with the appropriate education and experience, to serve the International Fund effectively and had demonstrated their ability to attract and retain qualified personnel.
The Trustees then considered the costs of the services to be provided by the Adviser, the compensation and benefits received by the Adviser in providing services to the International Fund, as well as Polen’s projected profitability in the first year of operation of the International Fund. The Trustees were provided with the audited financial statements of Polen for the years ended December 31, 2015 and December 31, 2014. The Trustees noted that Polen’s level of profitability is an appropriate factor to consider, and the Trustees should be satisfied that the Adviser’s profits are sufficient to continue as a healthy concern generally and as investment adviser of the International Fund specifically. The Trustees concluded that Polen’s fees to be derived from their relationship with the International Fund, in light of the International
65
POLEN GROWTH FUNDS
Other Information (Concluded)
(Unaudited)
Fund’s expenses, were reasonable in relation to the nature and quality of the services provided, taking into account the fees charged by other advisers for managing comparable mutual funds with similar strategies.
The Trustees considered the extent to which economies of scale would be realized relative to fee levels as the International Fund grows, and whether the advisory fee levels reflect these economies of scale for the benefit of shareholders. The Board noted that economies of scale may be achieved at higher asset levels for the International Fund for the benefit of fund shareholders but that the advisory fee did not currently include breakpoint reductions as asset levels increase.
In voting to approve the Agreement, the Board considered all factors it deemed relevant and the information presented to the Board by the Adviser. In arriving at its decision, the Board did not identify any single factor as being of paramount importance and each member of the Board gave varying weights to each factor according to his or her own judgment. The Board determined that the approval of the Agreement would be in the best interests of the International Fund and their shareholders. At this time, the Trustees determined to approve the Agreement for an initial two year period.
66
POLEN GROWTH FUNDS
Privacy Notice
(Unaudited)
The privacy of your personal financial information is extremely important to us. When you open an account with us, we collect a significant amount of information from you in order to properly invest and administer your account. We take very seriously the obligation to keep that information private and confidential, and we want you to know how we protect that important information.
We collect nonpublic personal information about you from applications or other forms you complete and from your transactions with us or our affiliates. We do not disclose information about you, or our former clients, to our affiliates or to service providers or other third parties, except as permitted by law. We share only the information required to properly administer your accounts, which enables us to send transaction confirmations, monthly or quarterly statements, financials and tax forms. Even within FundVantage Trust and its affiliated entities, a limited number of people who actually service accounts will have access to your personal financial information. Further, we do not share information about our current or former clients with any outside marketing groups or sales entities.
To ensure the highest degree of security and confidentiality, FundVantage Trust and its affiliates maintain various physical, electronic and procedural safeguards to protect your personal information. We also apply special measures for authentication of information you request or submit to us on our web site.
If you have questions or comments about our privacy practices, please call us at (888) 678-6024.
67
POLEN GROWTH FUNDS
Fund Management
(Unaudited)
FundVantage Trust (the “Trust”) is governed by a Board of Trustees (the “Trustees”). The primary responsibility of the Trustees is to represent the interest of the Trust’s shareholders and to provide oversight management of the Trust.
The following tables present certain information regarding the Board of Trustees and officers of the Trust. None of the Trustees are an “interested person” of the Trust, the Adviser, another investment adviser of a series of the Trust, or Foreside Funds Distributors LLC, the principal underwriter of the Trust (“Underwriter”), within the meaning of the 1940 Act and each Trustee is referred to as an “Independent Trustee” and is listed under such heading below. The address of each Trustee and officer as it relates to the Trust’s business is 301 Bellevue Parkway, 2nd Floor, Wilmington, DE 19809.
The Statement of Additional Information for the Funds contains additional information about the Trustees and is available, without charge, upon request, by calling (888) 678-6024.
Name and Date of Birth | Position(s) Held with Trust | Term of Office and Length of Time Served | Principal Occupation(s) During Past Five Years | Number of
| Other Held by Trustee | |||||
INDEPENDENT TRUSTEES
| ||||||||||
ROBERT J. CHRISTIAN Date of Birth: 2/49 | Trustee and Chairman of the Board | Shall serve until death, resignation or removal. Trustee and Chairman since 2007. | Retired since February 2006; Executive Vice President of Wilmington Trust Company from February 1996 to February 2006; President of Rodney Square Management Corporation (“RSMC”) (investment advisory firm) from 1996 to 2005; Vice President of RSMC from 2005 to 2006.
| 42 | Optimum Fund Trust (registered investment company with 6 portfolios). | |||||
IQBAL MANSUR Date of Birth: 6/55 | Trustee | Shall serve until death, resignation or removal. Trustee since 2007. | University Professor, Widener University. | 42 | None. | |||||
68
POLEN GROWTH FUNDS
Fund Management (Continued)
(Unaudited)
Name and Date of Birth | Position(s) Held with Trust | Term of Office and Length of Time Served | Principal Occupation(s) During Past Five Years | Number of
| Other Held by Trustee | |||||
NICHOLAS M. MARSINI, JR. Date of Birth: 8/55 | Trustee | Shall serve until death, resignation or removal. Trustee since 2016. | Retired since March 2016. President of PNC Bank Delaware from June 2011 to March 2016; Executive Vice President Finance of BNY Mellon from July 2010 to January 2011; Executive Vice President and Chief Financial Officer of PNC Global Investment Servicing from September 1997 to July 2010. | 42 | Brinker Capital Destinations Trust (registered investment company with 10 portfolios). | |||||
STEPHEN M. WYNNE Date of Birth: 1/55 | Trustee | Shall serve until death, resignation or removal. Trustee since 2009. | Retired since December 2010; Chief Executive Officer of US Funds Services, BNY Mellon Asset Servicing from July 2010 to December 2010; Chief Executive Officer of PNC Global Investment Servicing from March 2008 to July 2010; President, PNC Global Investment Servicing from 2003 to 2008. | 42 | Copeland Trust (registered investment company with 2 portfolios). Context Capital Funds (registered investment company with 1 portfolio). | |||||
NANCY B. WOLCOTT Date of Birth: 11/54 | Trustee | Shall serve until death, resignation or removal. Trustee since 2011. | Retired since May 2014; EVP, Head of GFI Client Service Delivery, BNY Mellon from January 2012 to May 2014; EVP, Head of US Funds Services, BNY Mellon from July 2010 to January 2012; President of PNC Global Investment Servicing from 2008 to July 2010; Chief Operating Officer of PNC Global Investment Servicing from 2007 to 2008; Executive Vice President of PFPC Worldwide Inc. from 2006 to 2007. | 42 | None. | |||||
69
POLEN GROWTH FUNDS
Fund Management (Concluded)
(Unaudited)
Name and Date of Birth | Position(s) Held with Trust | Term of Office and Length of Time Served | Principal Occupation(s) During Past Five Years | |||
EXECUTIVE OFFICERS
| ||||||
JOEL L. WEISS Date of Birth: 1/63 | President and Chief Executive Officer | Shall serve until death, resignation or removal. Officer since 2007. | President of JW Fund Management LLC since June 2016; Vice President and Managing Director of BNY Mellon Investment Servicing (US) Inc. and predecessor firms from 1993 to June 2016. | |||
T. RICHARD KEYES Date of Birth: 1/57 | Treasurer and Chief Financial Officer | Shall serve until death, resignation or removal. Officer since 2016. | President of TRK Fund Consulting since July 2016; Head of Tax — U.S. Fund Services of BNY Mellon Investment Servicing (US) Inc. and predecessor firms from February 2006 to July 2016. | |||
VINCENZO A. SCARDUZIO Date of Birth: 4/72 | Secretary | Shall serve until death, resignation or removal. Officer since 2012. | Director and Vice President Regulatory Administration of BNY Mellon Investment Servicing (US) Inc. and predecessor firms since 2001. | |||
DAVID C. LEBISKY Date of Birth: 5/72 | Chief Compliance Officer and Anti-Money Laundering Officer | Shall serve until death, resignation or removal. Officer since 2015. | President of Lebisky Compliance Consulting LLC since October 2015; Senior Consultant, Freeh Group International Solutions, LLC (a global risk management firm) since 2015; Scotia Institutional Investments US, LP, Director of Regulatory Administration from 2010 to 2014. | |||
70
[THIS PAGE INTENTIONALLY LEFT BLANK.]
Investment Adviser
Polen Capital Management, LLC
1825 NW Corporate Blvd.
Suite 300
Boca Raton, FL 33431
Administrator
BNY Mellon Investment Servicing (US) Inc.
301 Bellevue Parkway
Wilmington, DE 19809
Transfer Agent
BNY Mellon Investment Servicing (US) Inc.
4400 Computer Drive
Westborough, MA 01581
Principal Underwriter
Foreside Funds Distributors LLC
400 Berwyn Park
899 Cassatt Road
Berwyn, PA 19312
Custodian
The Bank of New York Mellon
225 Liberty Street
New York, NY 10286
Independent Registered Public Accounting Firm
PricewaterhouseCoopers LLP
Two Commerce Square, Suite 1800
2001 Market Street
Philadelphia, PA 19103-7042
Legal Counsel
Pepper Hamilton LLP
3000 Two Logan Square
18th and Arch Streets
Philadelphia, PA 19103
POL-0417

Polen Growth Fund
Polen Global Growth
Fund
Polen International
Growth Fund
of
FundVantage Trust
Institutional Class
Investor Class
ANNUAL REPORT
April 30, 2017
This report is submitted for the general information of the shareholders of the Polen Growth Fund, the Polen Global Growth Fund and the Polen International Growth Fund. It is not authorized for distribution unless preceded or accompanied by a current prospectus for the Polen Growth Fund, the Polen Global Growth Fund and the Polen International Growth Fund.
PRIVATE CAPITAL MANAGEMENT VALUE FUND
Annual Investment Adviser’s Report
April 30, 2017
(Unaudited)
Dear Fellow Shareholder:
We are pleased to report that the past twelve months have been quite productive for U.S. equities and the Private Capital Management Value Fund (the “Fund”). For the year ended April 30, 2017, the Fund’s Class I shares (VFPIX) returned 21.50%, compared to the S&P 500 Index’s 17.42% gain and the small-cap Russell 2000 Index’s advance of 25.63%. The Fund’s improvement, beginning in June of last year, gained additional momentum in the wake of the Presidential election. Strong performance for the Fund has carried through the first four months of 2017, even as small-cap returns have been more muted.
The market’s journey since the November 8th election has been fascinating to behold. For lack of any better words, Donald Trump continues to strike us – and we use the word in broad terms – as something of an enigma wrapped up in a conundrum. The frenetic pace of activity – purposeful or chaotic – creates a somewhat breathless feel to this administration. Yet for all the noise, the U.S. equity market has shown an upward bias since his election. While we are becoming concerned that too much has come too soon – and too easily – we also believe that the market’s reaction has been directionally rational. Compared to the Obama administration, corporate leaders tell us that it feels like the regulatory foot is being lifted off the throat of American industry.
It is also clear that the Trump administration is a friend to Wall Street (and to the finance industry at large) and is far more willing to prioritize economic growth over regulatory agenda. We have long argued that the prior administration’s continual castigation, vilification and suffocation of our banking sector was counterproductive economically. It is clear that markets and bankers require thoughtful regulation; the financial crisis demonstrated that unfettered greed and the “productization” of complex financial instruments was a toxic brew for both lenders and consumers. However, by driving down the return potential of the financial services industry, regulations drive up the sector’s risk aversion and reduce liquidity to the economy. The result was that much of the potential stimulative impact of the Federal Reserve’s Quantitative Easing policy was blunted by regulatory strictures and the reduction in core earnings upside associated with the Fed’s zero interest rate policy (ZIRP).
For much of the last eight years, we have operated with a bifurcated financial system. Larger, well-capitalized, highly-creditworthy corporations have had unfettered access to an almost unlimited supply of cheap money. Given the overall tepid nature of worldwide economic growth, it was a very rational capital allocation decision for many large companies to use cheap capital to fund acquisitions (“buying” growth) and leverage returns by wringing “synergies” – generally people costs – out of the purchased businesses. Meanwhile, smaller companies not only have had less access to capital – it has been more expensive.
The performance data quoted represents past performance and does not guarantee future results. Current performance may be lower or higher. Performance data current to the most recent month-end may be obtained by calling (888) 568-1267. The investment return and principal value of an investment will fluctuate so that shares, when redeemed, may be worth more or less than their original cost.
1
PRIVATE CAPITAL MANAGEMENT VALUE FUND
Annual Investment Adviser’s Report (Continued)
April 30, 2017
(Unaudited)
Lenders have required (and have been able to extract) a larger interest rate spread ostensibly to compensate for risk, but also because smaller companies generally do not have ready access to the bond market. To some extent this has always been the case, but ZIRP exacerbated the gap in cost of capital even as the financial regulatory framework acted to further constrain capital availability.
Since the Great Recession, small business formation has also been constrained by an increasingly burdensome regulatory regime. We acknowledge that most regulations are created with socially-positive intent: protecting workers from harm; maintaining the environment; insulating the public from unsafe products; and expanding access to affordable healthcare. That said, there comes a tipping point where the societal costs of pursuing worthy goals begin to outweigh the benefits. The empirical results of the last eight years suggest that this line may have been crossed. All of which brings us full circle to the election of Donald Trump and the logic potentially underpinning the market’s strength subsequent to his election.
We believe the dramatic rise in stock prices reflects the market anticipating a virtuous cycle, where an increasingly healthy banking system, under less regulation, increases the capital available to the private sector – spurring the kind of business formation and job creation that is more consistent with a strong economic recovery.
So what about this concerns us? We think it is fair to say that President Trump has found it easier to conceptualize legislation than to pass it. The latest federal budget does not seem too far removed from budgets passed during the Obama administration. The House of Representatives may have voted to repeal Obamacare, but few suggest that we return to the policies that pre-existed its implementation. Said another way, the flavor of the Kool-Aid may change, but there will continue to be Kool-Aid. For the administration, the “repeal” of Obamacare seems likely to be largely a victory in name only. While there has been some progress on regulatory relief, the administration has proven to be somewhat bipolar on the topic – one minute promising to repeal Dodd-Frank and the next suggesting that it might be necessary to break up the big banks.
We think investors are placing much emphasis on the prospect for tax relief as well – both corporate and individual. While we are hopeful regarding both, this optimism needs to be tempered by the absence of missing details. Most significantly, can any of the promises actually be accomplished without ballooning the federal deficit to such a degree that the tax cuts become politically impossible.
By just about any standard, the broad market appears expensive. We are most impressed – in a negative sense – by the S&P 500’s EV-to-EBITDA multiple of 12.8x. This valuation equates to a 7.8% yield on the most optimistic measure of corporate cash flow – earnings before interest, taxes, depreciation and amortization. To our way of thinking, this implies that the broad market, as measured by the S&P 500, is trading at or above the private market (transactional) value of many of its constituent companies. Quite simply, this is a statistical red flag.
2
PRIVATE CAPITAL MANAGEMENT VALUE FUND
Annual Investment Adviser’s Report (Continued)
April 30, 2017
(Unaudited)
That said, we are generally sanguine about the U.S. economy – corporate earnings are strong, unemployment is low, consumer spending is growing, real estate values are rising and the Trump administration has fostered optimism that regulatory relief and tax cuts are on the horizon. This happily constructive backdrop has enabled investors to throw off the yoke of pessimism that lingered following the Great Recession. While we are not ready yet to resurrect Alan Greenspan’s infamous meme regarding “irrational exuberance” – data suggests that we are moving into such territory.
Where we must be realists is that the economic recovery is aging – and not just from a passage-of-time standpoint. Inflation, while still low, is beginning to show itself. Wage growth, while a welcome development for its beneficiaries, is beginning to accelerate. In response, the Federal Reserve is beginning to raise interest rates. Rising housing prices, which have helped to heal consumer balance sheets, appear to be peaking as mortgage rates respond to changes in Fed policy. Auto sales also appear to have peaked and there is legitimate concern that they may decline next year. Simply put, with unemployment now below five percent, much of the slack has been wrung out of the economic recovery. To be clear – we are not at all suggesting that the sky is about to fall – we are saying that the business cycle has not been repealed and the U.S. economy clearly seems closer to a cyclical slowdown or pause than an accelerating upturn.
So, after reading all the above, one might assume that we are bearish – but this would be incorrect. We are explicitly not trying to make a market call. We simply are observing that the financial markets are now juxtaposed from where they were five years ago from both an investor sentiment and valuation standpoint. We think that the average large-cap stock is expensive both relative to historical norms and on an absolute basis.
As a small and mid-cap focused fund, the opportunity for the PCM Value Fund draws upon our experience that high valuations in “large-cap” land frequently lead to a much greater willingness for market participants to seek out and reward undervaluation within the small and mid-capitalization universe where our time and research efforts concentrate.
Since we are stock pickers, the Fund’s portfolio does not remotely resemble the broad market. An exhaustive evaluation of each security’s private market value is central to our investment process and we are highly confident that the Fund is comprised of intrinsically undervalued equities. Moreover, we continue to be disciplined sellers, reducing allocations to investments as they appreciate towards fair value and exiting those that have reached full value altogether.
We appreciate your continued support.
Private Capital Management
3
PRIVATE CAPITAL MANAGEMENT VALUE FUND
Annual Investment Adviser’s Report (Concluded)
April 30, 2017
(Unaudited)
Mutual fund investing involves risk and it is possible to lose money by investing in a fund. The Fund is non-diversified and may invest a larger portion of its assets in the securities of a single issuer than a more diversified fund causing its value to fluctuate more widely. The Fund may engage in strategies that are considered risky or invest in stocks of companies that are undervalued which may cause greater volatility and less liquidity. The above commentary is for informational purposes only and investors should consider the investment objectives, risks, charges, and expenses of the Fund carefully before investing. This report is not authorized for distribution unless preceded or accompanied by a current prospectus for the Private Capital Management Value Fund. The prospectus contains this and other important information about the Fund. Read it carefully before investing.
Shares of the Private Capital Management Value Fund are distributed by Foreside Funds Distributors LLC, not an adviser affiliate. |
This letter is intended to assist shareholders in understanding how the Fund performed during the year ended April 30, 2017 and reflects the views of the investment adviser at the time of this writing. Of course, these views may change and do not guarantee the future performance of the Fund or the markets.
Portfolio composition is subject to change. The current and future portfolio holdings of the Fund are subject to investment risks.
The characteristics shown for the underlying securities do not represent or predict the performance of the Fund.
EV/EBITDA equals a company’s enterprise value divided by earnings before interest, tax, depreciation and amortization.
4
PRIVATE CAPITAL MANAGEMENT VALUE FUND
Annual Report
Performance Data
April 30, 2017
(Unaudited)
Comparison of Change in Value of $10,000 Investment in Class A* of the Private Capital Management Value Fund vs. S&P 500® and Russell 2000® Index
The Fund’s growth of an assumed $10,000 investment is adjusted for the maximum sales charge of 5.00%. This results in a net initial investment of $9,500.
| Average Annual Total Returns for the Periods Ended April 30, 2017 | ||||||||||||||||||||
| 1 Year | 3 Years | 5 Years | 10 Years | |||||||||||||||||
Class A (with sales charge)* | 15.14 | % | 5.65 | % | 9.46 | % | 4.11 | % | ||||||||||||
Class A (without salescharge)* | 21.18 | % | 7.47 | % | 10.60 | % | 4.11 | % | ||||||||||||
S&P 500 Index | 17.92 | % | 10.47 | % | 13.68 | % | 7.15 | % | ||||||||||||
Russell 2000 Index | 25.63 | % | 9.03 | % | 12.95 | % | 7.05 | % | ||||||||||||
*On May 28, 2010, a corporate defined contribution plan account (the “Predecessor Account”) was converted into Class I shares of the Fund. Performance shown for the period from April 30, 2007 to May 28, 2010, is the performance of the Class I shares and represents the performance of the Predecessor Account adjusted to reflect the fees and expenses applicable to Class I shares on May 28, 2010. Performance shown prior to May 28, 2010, has not been adjusted to reflect the fees and expenses of Class A shares. Performance shown for Class A shares for the period from May 28, 2010 to October 6, 2010 (commencement of operations of Class A shares) is the performance of Class I shares adjusted to reflect the fees and expenses applicable to Class A shares. If the Predecessor Account performance was adjusted to reflect the fees and expenses of Class A shares the performance shown would be lower. The Predecessor Account was not registered as a mutual fund under the Investment Company Act of 1940, as amended (“1940 Act”), and therefore was not subject to certain investment restrictions, limitations and diversification requirements imposed by the 1940 Act and Internal Revenue Code of 1986, as amended. If the Predecessor Account had been registered under the 1940 Act its performance may have been different.
Class A shares have a 5.00% maximum sales charge.
5
PRIVATE CAPITAL MANAGEMENT VALUE FUND
Annual Report
Performance Data (Continued)
April 30, 2017
(Unaudited)
Comparison of Change in Value of $750,000 (investment minimum) Investment in Class I* of the Private Capital Management Value Fund vs. S&P 500® and Russell 2000® Indexes
| Average Annual Total Returns for the Periods Ended April 30, 2017 | ||||||||||||||||||
| 1 Year | 3 Years | 5 Years | 10 Years | |||||||||||||||
| Class I * | 21.50 | % | 7.75 | % | 10.87 | % | 4.28% | |||||||||||
| S&P 500 Index | 17.92 | % | 10.47 | % | 13.68 | % | 7.15% | |||||||||||
| Russell 2000 Index | 25.63 | % | 9.03 | % | 12.95 | % | 7.05% | |||||||||||
| * | Performance shown for the period from April 30, 2007 to May 28, 2010 is the performance of a corporate defined contribution plan account (the “Predecessor Account”), which transferred its assets to the Fund in connection with the Fund’s commencement of operations on May 28, 2010. Performance from May 28, 2010 to April 30, 2017 is from the performance of the Class I Shares. The Predecessor Account was not registered as a mutual fund under the Investment Company Act of 1940, as amended (the “1940 Act”), and therefore was not subject to certain investment restrictions, limitations and diversification requirements imposed by the 1940 Act and the Internal Revenue Code of 1986, as amended. If the Predecessor Account had been registered under the 1940 Act, its performance may have been different. |
The performance data quoted represents past performance and does not guarantee future results. Current performance may be lower or higher. Performance data current to the most recent month-end may be obtained by calling (888) 568-1267. The investment return and principal value of an investment will fluctuate so that shares, when redeemed, may be worth more or less than their original cost. The graphs and tables do not reflect the deduction of taxes that a shareholder would pay on Fund distributions or the redemption of Fund shares.
6
PRIVATE CAPITAL MANAGEMENT VALUE FUND
Annual Report
Performance Data (Concluded)
April 30, 2017
(Unaudited)
As stated in the current prospectus dated September 1, 2016, the Fund’s “Total Annual Fund Operating Expenses” are 1.54% and 1.29%, and the Fund’s “Total Annual Fund Operating Expenses After Fee Waiver and/or Expense Reimbursement” are 1.25% and 1.00% for Class A and Class I Shares, respectively, of the Fund’s average daily net assets. These ratios may differ from the actual expenses incurred by the Fund for the period covered by this report. Private Capital Management, LLC, (the “Adviser”) has contractually agreed to reduce its investment advisory fee and/or reimburse certain expenses of the Fund to the extent necessary to ensure that the Fund’s total operating expenses (excluding taxes, any class-specific fees and expenses (such as Rule 12b-1 distribution fees, shareholder service fees, or transfer agency fees), “Acquired Fund” fees and expenses, interest, extraordinary items and brokerage commissions) do not exceed 1.00% (on an annual basis) of the Fund’s average daily net assets (the “Expense Limitation”). This agreement will terminate on August 31, 2017, unless the Board of Trustees of FundVantage Trust (the “Trust”) approves an earlier termination. The Adviser is entitled to recover, subject to approval by the Board of Trustees, such amounts reduced or reimbursed for a period of up to three (3) years from the year in which the Adviser reduced its compensation and/or assumed expenses for the Fund. No recoupment will occur unless the Fund’s expenses are below the Expense Limitation amount. Total returns would be lower had such fees and/or expenses not been waived and/or reimbursed.
A 2.00% redemption fee applies to shares redeemed within 30 days of purchase. This redemption fee is not reflected in the returns shown above.
The Fund intends to evaluate performance as compared to that of Standard & Poor’s 500® Composite Stock Price Index (“S&P 500® Index”) and the Russell 2000® Index. The S&P 500® Index is a widely recognized, unmanaged index of 500 common stocks which are generally representative of the U.S. stock market as a whole. The Russell 2000® Index is an unmanaged index measuring the performance of the 2,000 smallest companies in the Russell 3000® Index, which is made up of 3,000 of the biggest U.S. stocks. It is impossible to invest directly in an index.
Mutual fund investing involves risk, including possible loss of principal. The fund is non-diversified, which means that a portion of the Fund’s assets may be invested in one or fewer companies or sectors. The Fund could fluctuate in value more than a diversified fund.
7
PRIVATE CAPITAL MANAGEMENT VALUE FUND
Fund Expense Disclosure
April 30, 2017
(Unaudited)
As a shareholder of the Fund you incur two types of costs: (1) transaction costs, including sales charges (loads) on purchase payments, if any, and redemption fees; and (2) ongoing costs, including management fees, distribution and/or service (Rule 12b-1) fees, if any, and other Fund expenses. These examples are intended to help you understand your ongoing costs (in dollars) of investing in the Fund and to compare these costs with the ongoing costs of investing in other mutual funds.
These examples are based on an investment of $1,000 invested at the beginning of the six-month period from November 1, 2016, through April 30, 2017 and held for the entire period.
Actual Expenses
The first line of the accompanying table provides information about actual account values and actual expenses. You may use the information in this line, together with the amount you invested, to estimate the expenses that you paid over the period. Simply divide your account value by $1,000 (for example, an $8,600 account value divided by $1,000 = 8.6), then multiply the result by the number in the first line under the heading entitled “Expenses Paid During Period” to estimate the expenses you paid on your account during this period.
Hypothetical Examples for Comparison Purposes
The second line of the accompanying table provides information about hypothetical account values and hypothetical expenses based on the Fund’s actual expense ratio and an assumed rate of return of 5% per year before expenses, which is not your Fund’s actual return. The hypothetical account values and expenses may not be used to estimate the actual ending account balance or expenses you paid for the period. You may use this information to compare the ongoing costs of investing in the Fund and other funds. To do so, compare these 5% hypothetical examples with the 5% hypothetical examples that appear in the shareholder reports of other funds.
Please note that the expenses shown in the accompanying table are meant to highlight your ongoing costs only and do not reflect any transactional costs, such as sales charges (loads), if any, and redemption fees. Therefore, each hypothetical line of the accompanying table is useful in comparing ongoing costs only and will not help you determine the relative total costs of owning different funds. In addition, if these transactional costs were included, your costs would have been higher.
8
PRIVATE CAPITAL MANAGEMENT VALUE FUND
Fund Expense Disclosure (Concluded)
April 30, 2017
(Unaudited)
| Private Capital Management Value Fund | ||||||||||||
| Beginning Account Value November 1, 2016 | Ending Account Value April 30, 2017 | Expenses Paid During Period* | ||||||||||
Class A | ||||||||||||
Actual | $1,000.00 | $1,227.10 | $6.90 | |||||||||
Hypothetical (5% return before expenses) | 1,000.00 | 1,018.60 | 6.26 | |||||||||
Class I | ||||||||||||
Actual | $1,000.00 | $1,228.20 | $5.52 | |||||||||
Hypothetical (5% return before expenses) | 1,000.00 | 1,019.84 | 5.01 | |||||||||
| * | Expenses are equal to an annualized expenses ratio for the six-month period ended April 30, 2017 of 1.25% and 1.00% for Class A and Class I Shares, respectively, for the Fund, multiplied by the average account value over the period, multiplied by the number of days in the most recent period (181), then divided by 365 to reflect the period. The Fund’s ending account values on the first line in each table are based on the actual six-month total return for the Fund of 22.71% and 22.82% for Class A and Class I Shares, respectively. |
9
PRIVATE CAPITAL MANAGEMENT VALUE FUND
Portfolio Holdings Summary Table
April 30, 2017
(Unaudited)
The following table presents a summary by sector of the portfolio holdings of the Fund:
| % of Net Assets | Value | |||||||
COMMON STOCKS: | ||||||||
Financials | 24.5 | % | $ | 18,956,600 | ||||
Consumer Discretionary | 17.9 | 13,854,078 | ||||||
Health Care | 11.5 | 8,839,752 | ||||||
Information Technology | 10.2 | 7,880,997 | ||||||
Materials | 7.3 | 5,595,944 | ||||||
Industrials | 3.9 | 3,025,368 | ||||||
Utilities | 3.3 | 2,562,156 | ||||||
Consumer Staples | 2.9 | 2,223,640 | ||||||
Energy | 0.7 | 543,746 | ||||||
Other Assets in Excess of Liabilities | 17.8 | 13,753,785 | ||||||
|
|
|
| |||||
NET ASSETS | 100.0 | % | $ | 77,236,066 | ||||
|
|
|
| |||||
Portfolio holdings are subject to change at any time.
The accompanying notes are an integral part of the financial statements.
10
PRIVATE CAPITAL MANAGEMENT VALUE FUND
Portfolio of Investments
April 30, 2017
| Number of Shares | Value | |||||||
COMMON STOCKS — 82.2% |
| |||||||
Consumer Discretionary — 17.9% |
| |||||||
Carrols Restaurant Group, Inc.* | 184,300 | $ | 2,580,200 | |||||
Fiesta Restaurant Group, Inc.* | 30,745 | 748,641 | ||||||
Fogo De Chao, Inc.* | 129,585 | 2,196,466 | ||||||
Gildan Activewear, Inc. (Canada) | 61,850 | 1,734,274 | ||||||
Jamba, Inc.* | 105,713 | 900,675 | ||||||
Stoneridge, Inc.* | 125,717 | 2,465,310 | ||||||
Visteon Corp.* | 31,360 | 3,228,512 | ||||||
|
| |||||||
| 13,854,078 | ||||||||
|
| |||||||
Consumer Staples — 2.9% | ||||||||
SpartanNash Co. | 60,425 | 2,223,640 | ||||||
|
| |||||||
Energy — 0.7% | ||||||||
Golar LNG, Ltd. (Bermuda) | 21,315 | 543,746 | ||||||
Financials — 24.5% | ||||||||
Charter Financial Corp. | 90,461 | 1,659,959 | ||||||
INTL FCstone, Inc.* | 61,986 | 2,315,177 | ||||||
KKR & Co. LP | 196,620 | 3,731,848 | ||||||
Northrim Bancorp, Inc. | 26,200 | 838,400 | ||||||
Oceanfirst Financial Corp. | 41,560 | 1,149,134 | ||||||
Old National Bancorp | 42,560 | 715,008 | ||||||
Oppenheimer Holdings, Inc., Class A | 86,434 | 1,495,308 | ||||||
People’s United Financial, Inc. | 30,972 | 541,081 | ||||||
Raymond James Financial, Inc. | 32,600 | 2,429,352 | ||||||
State Bank Financial Corp. | 49,600 | 1,332,256 | ||||||
Synovus Financial Corp. | 37,014 | 1,547,185 | ||||||
Valley National Bancorp | 57,059 | 671,014 | ||||||
| Number of Shares | Value | |||||||
COMMON STOCKS — (Continued) |
| |||||||
Financials — (Continued) |
| |||||||
Willis Towers Watson PLC (Ireland) | 4,003 | $ | 530,878 | |||||
|
| |||||||
| 18,956,600 | ||||||||
|
| |||||||
Health Care — 11.5% | ||||||||
Alere, Inc.*(a) | 45,300 | 2,227,401 | ||||||
Allergan PLC (Ireland) | 13,327 | 3,249,922 | ||||||
Universal Health Services, Inc., Class B | 11,750 | 1,418,930 | ||||||
Valeant Pharmaceuticals International, Inc. (Canada)* | 42,210 | 390,442 | ||||||
Zimmer Holdings, Inc. | 12,980 | 1,553,057 | ||||||
|
| |||||||
| 8,839,752 | ||||||||
|
| |||||||
Industrials — 3.9% | ||||||||
Air Transport Services Group, Inc.* | 110,900 | 2,039,451 | ||||||
Caesarstone Ltd. (Israel)* | 12,800 | 508,160 | ||||||
Triumph Group, Inc. | 18,235 | 477,757 | ||||||
|
| |||||||
| 3,025,368 | ||||||||
|
| |||||||
Information Technology — 10.2% |
| |||||||
Avid Technology, Inc.* | 88,500 | 496,042 | ||||||
CA, Inc. | 43,232 | 1,419,307 | ||||||
Everi Holdings, Inc.* | 350,271 | 2,224,221 | ||||||
Quantum Corp.*(a) | 162,884 | 1,291,670 | ||||||
Quinstreet, Inc.* | 295,112 | 1,322,102 | ||||||
VASCO Data Security International, Inc.* | 83,530 | 1,127,655 | ||||||
|
| |||||||
| 7,880,997 | ||||||||
|
| |||||||
Materials — 7.3% | ||||||||
Celanese Corp., Class A | 13,970 | 1,215,949 | ||||||
Pope Resources LP | 10,600 | 747,300 | ||||||
The accompanying notes are an integral part of the financial statements.
11
PRIVATE CAPITAL MANAGEMENT VALUE FUND
Portfolio of Investments (Concluded)
April 30, 2017
| Number of Shares | Value | |||||||
COMMON STOCKS — (Continued) |
| |||||||
Materials — (Continued) | ||||||||
Tronox Ltd., Class A (Australia) | 220,030 | $ | 3,632,695 | |||||
|
| |||||||
| 5,595,944 | ||||||||
|
| |||||||
Utilities — 3.3% | ||||||||
National Fuel Gas Co. | 46,265 | 2,562,156 | ||||||
|
| |||||||
TOTAL COMMON STOCKS |
| 63,482,281 | ||||||
|
| |||||||
TOTAL INVESTMENTS - 82.2% |
| 63,482,281 | ||||||
OTHER ASSETS IN | 13,753,785 | |||||||
|
| |||||||
NET ASSETS - 100.0% | $ | 77,236,066 | ||||||
|
| |||||||
| * | Non-income producing. |
| (a) | The Fund’s portfolio manager is a member of the company’s board of directors and is subject to limited discretionary trading in company securities during periods proximate to earnings announcements or pending corporate actions. Shares held of Quantum Corp. were subject to the Restricted Period from March 17, 2017 and continuing through the third business day following the company’s public release of its earnings. Due to a pending merger, shares held of Alere, Inc. were subject to a Restricted Period during the year ended April 30, 2017. The value of the securities held by the fund, subject to a Restricted Period, was $3,519,071 at April 30, 2017, which represents 4.6% of the Fund’s net assets. |
PLC Public Limited Company
The accompanying notes are an integral part of the financial statements.
12
PRIVATE CAPITAL MANAGEMENT VALUE FUND
Statement of Assets and Liabilities
April 30, 2017
Assets | ||||
Investments, at value (Cost $40,636,202) | $ | 63,482,281 | ||
Cash | 14,527,434 | |||
Receivable for capital shares sold | 1,570 | |||
Dividends and interest receivable | 11,769 | |||
Prepaid expenses and other assets | 50,356 | |||
|
| |||
Total assets | 78,073,410 | |||
|
| |||
Liabilities | ||||
Payable for capital shares redeemed | 703,910 | |||
Payable to Investment Adviser | 40,822 | |||
Payable for transfer agent fees | 26,607 | |||
Payable for audit fees | 26,200 | |||
Payable for legal fees | 19,796 | |||
Payable for administration and accounting fees | 11,151 | |||
Payable for custodian fees | 3,012 | |||
Accrued expenses | 5,846 | |||
|
| |||
Total liabilities | 837,344 | |||
|
| |||
Net Assets | $ | 77,236,066 | ||
|
| |||
Net Assets Consisted of: | ||||
Capital Stock, $0.01 par value | $ | 46,478 | ||
Paid-in capital | 54,848,417 | |||
Accumulated net investment income | 30,852 | |||
Accumulated net realized loss from investments and written options | (535,760 | ) | ||
Net unrealized appreciation on investments | 22,846,079 | |||
|
| |||
Net Assets | $ | 77,236,066 | ||
|
| |||
Class A: | ||||
Net asset value and redemption price per share ($6,063,387 / 368,716 shares) | $ | 16.44 | ||
|
| |||
Maximum offering price per share (100/95 of $16.44) | $ | 17.31 | ||
|
| |||
Class I: | ||||
Net asset value, offering and redemption price per share ($71,172,679 / 4,279,056 shares) | $ | 16.63 | ||
|
| |||
The accompanying notes are an integral part of the financial statements.
13
PRIVATE CAPITAL MANAGEMENT VALUE FUND
Statement of Operations
For the Year Ended April 30, 2017
Investment Income | ||||
Dividends | $ | (410,764 | )* | |
Less: foreign taxes withheld | (3,226 | ) | ||
Interest | 6,100 | |||
|
| |||
Total investment income | (407,890 | ) | ||
|
| |||
Expenses | ||||
Advisory fees (Note 2) | 698,351 | |||
Transfer agent fees (Note 2) | 82,307 | |||
Administration and accounting fees (Note 2) | 68,781 | |||
Legal fees | 49,448 | |||
Registration and filing fees | 30,653 | |||
Trustees’ and officers’ fees (Note 2) | 30,229 | |||
Audit fees | 26,496 | |||
Printing and shareholder reporting fees | 21,071 | |||
Custodian fees (Note 2) | 17,230 | |||
Distribution fees (Class A) (Note 2) | 15,320 | |||
Other expenses | 18,161 | |||
|
| |||
Total expenses before waivers and reimbursements | 1,058,047 | |||
|
| |||
Less: waivers (Note 2) | (265,948 | ) | ||
|
| |||
Net expenses after waivers | 792,099 | |||
|
| |||
Net investment loss | (1,199,989 | ) | ||
|
| |||
Net realized and unrealized gain from investments: | ||||
Net realized gain from investments | 1,767,737 | |||
Net realized gain from written options | 5,487 | |||
Net change in unrealized appreciation/(depreciation) on investments | 13,776,352 | |||
Net change in unrealized appreciation on written options | 612 | |||
|
| |||
Net realized and unrealized gain on investments | 15,550,188 | |||
|
| |||
Net increase in net assets resulting from operations | $ | 14,350,199 | ||
|
| |||
| * | Includes a return of capital dividend reclassification in the amount of $1,040,081, relating to a prior year dividend which exceeded the aggregate of dividend income earned during the current period. |
The accompanying notes are an integral part of the financial statements.
14
PRIVATE CAPITAL MANAGEMENT VALUE FUND
Statements of Changes in Net Assets
| For the Year Ended April 30, 2017 | For the Year Ended April 30, 2016 | |||||||
Increase/(decrease) in net assets from operations: | ||||||||
Net investment income/(loss) | $ | (1,199,989 | ) | $ | 1,023,487 | |||
Net realized gain/(loss) from investments and written options | 1,773,224 | (917,659 | ) | |||||
Net change in unrealized appreciation/(depreciation) on investments | 13,776,964 | (11,648,924 | ) | |||||
|
|
|
| |||||
Net increase/(decrease) in net assets resulting from operations | 14,350,199 | (11,543,096 | ) | |||||
|
|
|
| |||||
Less Dividends and Distributions to Shareholders from: | ||||||||
Net investment income: | ||||||||
Class A | (66,159 | ) | — | |||||
Class I | (957,395 | ) | — | |||||
|
|
|
| |||||
Total net investment income | (1,023,554 | ) | — | |||||
|
|
|
| |||||
Net realized capital gains: | ||||||||
Class A | — | (530,362 | ) | |||||
Class I | — | (4,267,960 | ) | |||||
|
|
|
| |||||
Total net realized capital gains | — | (4,798,322 | ) | |||||
|
|
|
| |||||
Net decrease in net assets from dividends and distributions to shareholders | (1,023,554 | ) | (4,798,322 | ) | ||||
|
|
|
| |||||
Increase/(decrease) in Net Assets Derived from Capital Share | (22,577,242 | ) | 31,716,200 | |||||
|
|
|
| |||||
Total increase/(decrease) in net assets | (9,250,597 | ) | 15,374,782 | |||||
|
|
|
| |||||
Net assets | ||||||||
Beginning of year | 86,486,663 | 71,111,881 | ||||||
|
|
|
| |||||
End of year | $ | 77,236,066 | $ | 86,486,663 | ||||
|
|
|
| |||||
Accumulated net investment income, end of year | $ | 30,852 | $ | 1,185,102 | ||||
|
|
|
| |||||
The accompanying notes are an integral part of the financial statements.
15
PRIVATE CAPITAL MANAGEMENT VALUE FUND
Financial Highlights
Contained below is per share operating performance data for Class A shares outstanding, total investment return, ratios to average net assets and other supplemental data for the respective period. The total returns in the table represent the rate that an investor would have earned or lost on an investment in the Fund (assuming reinvestment of all dividends and distributions). This information has been derived from information provided in the financial statements and should be read in conjunction with the financial statements and the notes thereto. |
| Class A | ||||||||||||||||||||
| For the Year Ended April 30, 2017 | For the Year Ended April 30, 2016 | For the Year Ended April 30, 2015 | For the Year Ended April 30, 2014 | For the Year Ended April 30, 2013 | ||||||||||||||||
Per Share Operating Performance | ||||||||||||||||||||
Net asset value, beginning of year | $ | 13.72 | $ | 17.07 | $ | 15.16 | $ | 13.60 | $ | 12.12 | ||||||||||
|
|
|
|
|
|
|
|
|
| |||||||||||
Net investment income/(loss)(1) | (0.26 | ) | 0.16 | (0.03 | ) | (0.02 | ) | 0.07 | ||||||||||||
Net realized and unrealized gain/(loss) on investments | 3.15 | (2.55 | ) | 2.88 | 2.45 | 1.48 | ||||||||||||||
|
|
|
|
|
|
|
|
|
| |||||||||||
Net increase/(decrease) in net assets resulting from operations | 2.89 | (2.39 | ) | 2.85 | 2.43 | 1.55 | ||||||||||||||
|
|
|
|
|
|
|
|
|
| |||||||||||
Dividends and distributions to shareholders from: | ||||||||||||||||||||
Net investment income | (0.17 | ) | — | — | — | (0.07 | ) | |||||||||||||
Net realized capital gains | — | (0.96 | ) | (0.94 | ) | (0.87 | ) | — | ||||||||||||
|
|
|
|
|
|
|
|
|
| |||||||||||
Total dividends and distributions to shareholders | (0.17 | ) | (0.96 | ) | (0.94 | ) | (0.87 | ) | (0.07 | ) | ||||||||||
|
|
|
|
|
|
|
|
|
| |||||||||||
Redemption fees | — | (2) | — | (2) | — | — | (2) | — | ||||||||||||
|
|
|
|
|
|
|
|
|
| |||||||||||
Net asset value, end of year | $ | 16.44 | $ | 13.72 | $ | 17.07 | $ | 15.16 | $ | 13.60 | ||||||||||
|
|
|
|
|
|
|
|
|
| |||||||||||
Total investment return(3) | 21.18 | % | (14.00 | )% | 19.11 | % | 18.04 | % | 12.92 | % | ||||||||||
Ratio/Supplemental Data | ||||||||||||||||||||
Net assets, end of year (in thousands) | $ | 6,063 | $ | 7,408 | $ | 8,042 | $ | 7,643 | $ | 4,921 | ||||||||||
Ratio of expenses to average net assets | 1.25 | % | 1.25 | % | 1.25 | % | 1.25 | % | 1.25 | % | ||||||||||
Ratio of expenses to average net assets without waivers and expense reimbursements(4) | 1.59 | % | 1.54 | % | 1.69 | % | 1.74 | % | 1.88 | % | ||||||||||
Ratio of net investment income/(loss) to average net assets | (1.78 | )% | 1.06 | % | (0.20 | )% | (0.15 | )% | 0.62 | % | ||||||||||
Portfolio turnover rate | 11.15 | % | 14.20 | % | 31.11 | % | 19.69 | % | 11.81 | % | ||||||||||
| (1) | The selected per share data was calculated using the average shares outstanding method for the year. |
| (2) | Amount is less than $0.005 per share. |
| (3) | Total investment return is calculated assuming a purchase of shares on the first day and a sale of shares on the last day of each period reported and includes reinvestment of dividends and distributions, if any. |
| (4) | During the period, certain fees were waived. If such fee waivers had not occurred, the ratios would have been as indicated (See Note 2). |
The accompanying notes are an integral part of the financial statements.
16
PRIVATE CAPITAL MANAGEMENT VALUE FUND
Financial Highlights
Contained below is per share operating performance data for Class I shares outstanding, total investment return, ratios to average net assets and other supplemental data for the respective period. The total returns in the table represent the rate that an investor would have earned or lost on an investment in the Fund (assuming reinvestment of all dividends and distributions). This information has been derived from information provided in the financial statements and should be read in conjunction with the financial statements and the notes thereto. |
| Class I | ||||||||||||||||||||
| For the Year Ended April 30, 2017 | For the Year Ended April 30, 2016 | For the Year Ended April 30, 2015 | For the Year Ended April 30, 2014 | For the Year Ended April 30, 2013 | ||||||||||||||||
Per Share Operating Performance | ||||||||||||||||||||
Net asset value, beginning of year | $ | 13.88 | $ | 17.21 | $ | 15.24 | $ | 13.64 | $ | 12.15 | ||||||||||
|
|
|
|
|
|
|
|
|
| |||||||||||
Net investment income/(loss)(1) | (0.22 | ) | 0.20 | 0.01 | 0.02 | 0.10 | ||||||||||||||
Net realized and unrealized gain/(loss) on investments | 3.19 | (2.57 | ) | 2.90 | 2.45 | 1.49 | ||||||||||||||
|
|
|
|
|
|
|
|
|
| |||||||||||
Net increase/(decrease) in net assets resulting from operations | 2.97 | (2.37 | ) | 2.91 | 2.47 | 1.59 | ||||||||||||||
|
|
|
|
|
|
|
|
|
| |||||||||||
Dividends and distributions to shareholders from: | ||||||||||||||||||||
Net investment income | (0.22 | ) | — | — | — | (0.10 | ) | |||||||||||||
Net realized capital gains | — | (0.96 | ) | (0.94 | ) | (0.87 | ) | — | ||||||||||||
|
|
|
|
|
|
|
|
|
| |||||||||||
Total dividends and distributions to shareholders | (0.22 | ) | (0.96 | ) | (0.94 | ) | (0.87 | ) | (0.10 | ) | ||||||||||
|
|
|
|
|
|
|
|
|
| |||||||||||
Redemption fees | — | (2) | — | (2) | — | — | (2) | — | ||||||||||||
|
|
|
|
|
|
|
|
|
| |||||||||||
Net asset value, end of year | $ | 16.63 | $ | 13.88 | $ | 17.21 | $ | 15.24 | $ | 13.64 | ||||||||||
|
|
|
|
|
|
|
|
|
| |||||||||||
Total investment return(3) | 21.50 | % | (13.76 | )% | 19.41 | % | 18.29 | % | 13.21 | % | ||||||||||
Ratio/Supplemental Data | ||||||||||||||||||||
Net assets, end of year (in thousands) | $ | 71,173 | $ | 79,078 | $ | 63,069 | $ | 47,969 | $ | 40,765 | ||||||||||
Ratio of expenses to average net assets | 1.00 | % | 1.00 | % | 1.00 | % | 1.00 | % | 1.00 | % | ||||||||||
Ratio of expenses to average net assets without waivers and expense reimbursements(4) | 1.34 | % | 1.29 | % | 1.45 | % | 1.49 | % | 1.62 | % | ||||||||||
Ratio of net investment income/(loss) to average net assets | (1.53 | )% | 1.30 | % | 0.05 | % | 0.10 | % | 0.86 | % | ||||||||||
Portfolio turnover rate | 11.15 | % | 14.20 | % | 31.11 | % | 19.69 | % | 11.81 | % | ||||||||||
| (1) | The selected per share data was calculated using the average shares outstanding method for the year. |
| (2) | Amount is less than $0.005 per share. |
| (3) | Total investment return is calculated assuming a purchase of shares on the first day and a sale of shares on the last day of each period reported and includes reinvestment of dividends and distributions, if any. |
| (4) | During the period, certain fees were waived. If such fee waivers had not occurred, the ratios would have been as indicated (See Note 2). |
The accompanying notes are an integral part of the financial statements.
17
PRIVATE CAPITAL MANAGEMENT VALUE FUND
Notes to Financial Statements
April 30, 2017
1. Organization and Significant Accounting Policies
The Private Capital Management Value Fund (the “Fund”) is a non-diversified, open-end management investment company registered under the Investment Company Act of 1940, as amended, (the “1940 Act”), which commenced investment operations on May 28, 2010. The Fund is a separate series of FundVantage Trust (the “Trust”) which was organized as a Delaware statutory trust on August 28, 2006. The Trust is a “series trust” authorized to issue an unlimited number of separate series or classes of shares of beneficial interest. Each series is treated as a separate entity for certain matters under the 1940 Act, and for other purposes, and a shareholder of one series is not deemed to be a shareholder of any other series. The Fund offers separate classes of shares, Class A, Class C, Class I and Class R Shares. Class A Shares are sold subject to a front-end sales charge. Front-end sales charges may be reduced or waived under certain circumstances. A 1.00% contingent deferred sales charge (“CDSC”) will be assessed when Class C shares are redeemed within 12 months after initial purchase; however, the CDSC shall not apply to the purchases of Class C shares where the selling broker dealer was not paid a commission at the time of initial purchase. As of April 30, 2017, the Class C shares and the Class R shares have not yet started operations.
The Fund is an investment company and follows accounting and reporting guidance in the Financial Accounting Standards Board Accounting Standards Codification Topic 946.
Portfolio Valuation — The Fund’s net asset value (“NAV”) is calculated once daily as of the close of regular trading hours on the New York Stock Exchange (“NYSE”) (typically 4:00 p.m. Eastern time) on each day the NYSE is open. Securities held by the Fund are valued using the closing price or the last sale price on a national securities exchange or the National Association of Securities Dealers Automatic Quotation System (“NASDAQ”) market system where they are primarily traded. Equity securities traded in the over-the-counter market are valued at their closing prices. If there were no transactions on that day, securities traded principally on an exchange or on NASDAQ will be valued at the mean of the last bid and ask prices prior to the market close. Fixed income securities having a remaining maturity of greater than 60 days are valued using an independent pricing service. Fixed income securities having a remaining maturity of 60 days or less are generally valued at amortized cost, provided such amount approximates fair value. Foreign securities are valued based on prices from the primary market in which they are traded and are translated from the local currency into U.S. dollars using current exchange rates. Investments in other open-end investment companies are valued based on the NAV of the investment companies (which may use fair value pricing as discussed in their prospectuses). If market quotations are unavailable or deemed unreliable, securities will be valued in accordance with procedures adopted by the FundVantage Trust’s Board of Trustees. Relying on prices supplied by pricing services or dealers or using fair valuation may result in values that are higher or lower than the values used by other investment companies and investors to price the same investments. In the event that market quotes are not readily available, and the security or asset cannot be valued pursuant to one of the valuation methods, the value of the security
18
PRIVATE CAPITAL MANAGEMENT VALUE FUND
Notes to Financial Statements (Continued)
April 30, 2017
or asset will be determined in good faith by the Adviser. The Trust has established a Valuation Committee which performs certain functions including the oversight of the Adviser’s fair valuation determinations.
Fair Value Measurements — The inputs and valuation techniques used to measure fair value of the Fund’s investments are summarized into three levels as described in the hierarchy below:
• Level 1 | — | quoted prices in active markets for identical securities; | ||||
• Level 2 | — | other significant observable inputs (including quoted prices for similar securities, interest rates, prepayment speeds, credit risk, etc.); and | ||||
• Level 3 | — | significant unobservable inputs (including the Fund’s own assumptions in determining the fair value of investments). | ||||
The inputs or methodology used for valuing securities are not necessarily an indication of the risk associated with investing in those securities.
The following is a summary of the inputs used, as of April 30, 2017, in valuing the Fund’s investments carried at fair value:
| Total Value at 04/30/17 | Level 1 Quoted Price | Level 2 Other Significant Observable Inputs | Level 3 Significant Unobservable Inputs | |||||||||||||
Assets: | ||||||||||||||||
Investments in Securities* | $ | 63,482,281 | $ | 63,482,281 | $ | — | $ | — | ||||||||
|
|
|
|
|
|
|
| |||||||||
| * | Please refer to Portfolio of Investments for further details on portfolio holdings. |
At the end of each quarter, management evaluates the classification of Levels 1, 2 and 3 assets and liabilities. Various factors are considered, such as changes in liquidity from the prior reporting period; whether or not a broker is willing to execute at the quoted price; the depth and consistency of prices from third party pricing services; and the existence of contemporaneous, observable trades in the market. Additionally, management evaluates the classification of Level 1 and Level 2 assets and liabilities on a quarterly basis for changes in listings or delistings on national exchanges.
Due to the inherent uncertainty of determining the fair value of investments that do not have a readily available market value, the fair value of the Fund’s investments may fluctuate from period to period. Additionally, the fair value of investments may differ significantly from the values that would have been used had a ready market existed for such investments and may differ materially from the values the Fund may ultimately realize. Further, such investments may be subject to legal and other restrictions on resale or otherwise less liquid than publicly traded securities.
19
PRIVATE CAPITAL MANAGEMENT VALUE FUND
Notes to Financial Statements (Continued)
April 30, 2017
For fair valuations using significant unobservable inputs, U.S. generally accepted accounting principles (“U.S. GAAP”) require the Fund to present a reconciliation of the beginning to ending balances for reported market values that presents changes attributable to total realized and unrealized gains or losses, purchase and sales, and transfers in and out of Level 3 during the period. Transfers in and out between Levels are based on values at the end of the period. U.S. GAAP also requires the Fund to disclose amounts and reasons for all transfers in and out of Level 1 and Level 2 fair value measurements. A reconciliation of Level 3 investments is presented only when the Fund had an amount of Level 3 investments at the end of the reporting period that was meaningful in relation to its net assets. The amounts and reasons for all transfers in and out of each Level within the three-tier hierarchy are disclosed when the Fund had an amount of total transfers during the reporting period that was meaningful in relation to its net assets as of the end of the reporting period.
For the year ended April 30, 2017, there were no transfers between Levels 1, 2 and 3.
Disclosures About Derivative Instruments and Hedging Activities
The following tables provide quantitative disclosures about fair value amounts of, and gains and losses on, the Fund’s derivative instruments as of April 30, 2017.
The following table lists the amounts of change in unrealized appreciation/(depreciation) included in net increase in net assets resulting from operations for the year ended April 30, 2017, grouped by contract type and risk exposure.
| Derivative Type | Statement of Operations Location | Equity Contracts | Total | |||||||
| Change in appreciation/(depreciation) | ||||||||||
Purchased Options | Net change in unrealized appreciation on investments | $2,211 | $2,211 | |||||||
Written Options | Net change in unrealized appreciation on written options | 612 | 612 | |||||||
Total change in appreciation/(depreciation) | $2,823 | $2,823 | ||||||||
The following table lists the amounts of change in realized appreciation/(depreciation) included in net increase in net assets resulting from operations for the year ended April 30, 2017, grouped by contract
type and risk exposure.
| Derivative Type | Statement of Operations Location | Equity Contracts | Total | |||||||
| Realized Gain/(Loss) | ||||||||||
Purchased Options | Net realized loss from investments | $ | (1,574 | ) | $ | (1,574 | ) | |||
Written Options | Net realized gain from written options | $ | 5,487 | $ | 5,487 | |||||
Total Realized Gain | $ | 3,913 | $ | 3,913 | ||||||
20
PRIVATE CAPITAL MANAGEMENT VALUE FUND
Notes to Financial Statements (Continued)
April 30, 2017
Use of Estimates — The preparation of financial statements in conformity with U.S. GAAP requires management to make estimates and assumptions that affect the amounts reported in the financial statements and accompanying notes at the date of the financial statements and the reported amounts of revenues and expenses during the period. Actual results could differ from those estimates and those differences could be material.
Investment Transactions, Investment Income and Expenses — Investment transactions are recorded on trade date for financial statement preparation purposes. Realized gains and losses on investments sold are recorded on the identified cost basis. Interest income is recorded on the accrual basis. Dividends are recorded on the ex-dividend date. Estimated components of distributions received from real estate investment trusts may be considered income, return of capital distributions or capital gain distributions. Return of capital distributions are recorded as a reduction of cost of the related investments. Distribution (12b-1) fees relating to a specific class are charged directly to that class. Fund level expenses common to all classes, investment income and realized and unrealized gains and losses on investments are generally allocated to each class based upon the relative daily net assets of each class. General expenses of the Trust are generally allocated to each fund in proportion to its relative daily net assets. Expenses directly attributable to a particular fund in the Trust are charged directly to that fund. The Fund’s investment income, expenses (other than class-specific expenses) and unrealized and realized gains and losses are allocated daily to each class of shares based upon the relative proportion of net assets of each class at the beginning of the day.
Dividends and Distributions to Shareholders — Dividends from net investment income and distributions from net realized capital gains, if any, are declared, recorded on ex-date and paid at least annually to shareholders. Income dividends and capital gain distributions are determined in accordance with U.S. federal income tax regulations, which may differ from U.S. GAAP. These differences may include the treatment of non-taxable dividends, expiring capital loss carryforwards and losses deferred due to wash sales and excise tax regulations. Permanent book and tax basis differences relating to shareholder distributions will result in reclassifications within the components of net assets.
U.S. Tax Status — No provision is made for U.S. income taxes as it is the Fund’s intention to continue to qualify for and elect the tax treatment applicable to regulated investment companies under Subchapter M of the Internal Revenue Code of 1986, as amended (“Internal Revenue Code”), and make the requisite distributions to its shareholders which will be sufficient to relieve it from U.S. income and excise taxes.
Other — In the normal course of business, the Fund may enter into contracts that provide general indemnifications. The Fund’s maximum exposure under these arrangements is dependent on claims that may be made against the Fund in the future, and therefore, cannot be estimated; however, based on experience, the risk of material loss for such claims is considered remote.
21
PRIVATE CAPITAL MANAGEMENT VALUE FUND
Notes to Financial Statements (Continued)
April 30, 2017
Currency Risk — The Fund invests in securities of foreign issuers, including American Depositary Receipts. These markets are subject to special risks associated with foreign investments not typically associated with investing in U.S. markets. Because the foreign securities in which the Fund may invest generally trade in currencies other than the U.S. dollar, changes in currency exchange rates will affect the Fund’s NAV, the value of dividends and interest earned and gains and losses realized on the sale of securities. Because the NAV for the Fund is determined on the basis of U.S. dollars, the Fund may lose money by investing in a foreign security if the local currency of a foreign market depreciates against the U.S. dollar, even if the local currency value of the Fund’s holdings goes up. Generally, a strong U.S. dollar relative to these other currencies will adversely affect the value of the Fund’s holdings in foreign securities.
Purchased Options — The Fund is subject to equity and other risk exposure in the normal course of pursuing its investment objectives. The Fund purchases option contracts. This transaction is used to hedge against the values of equities. The risk associated with purchasing an option is that the Fund pays a premium whether or not the option is exercised. Additionally, the Fund bears the risk of loss of premium and change in market value should the counterparty not perform under the contract. Put and call options are accounted for in the same manner as other securities owned. The cost of securities acquired through the exercise of call options is increased by the premiums paid. The proceeds from securities sold through the exercise of put options are decreased by the premiums paid. As of April 30, 2017, the Fund had no purchased options.
Options Written — The Fund is subject to equity and other risk exposure in the normal course of pursuing its investment objectives and may enter into options written to hedge the values of equities. Such options may relate to particular securities or domestic stock indices, and may or may not be listed on a domestic securities exchange or issued by the Options Clearing Corporation. An option contract is a commitment that gives the purchaser of the contract the right, but not the obligation, to buy or sell an underlying asset at a specific price on or before a specified future date. On the other hand, the writer of an option contract is obligated, upon the exercise of the option, to buy or sell an underlying asset at a specific price on or before a specified future date. The maximum risk of loss associated with writing put options is limited to the exercised fair value of the option contract. The maximum risk of loss associated with writing call options is potentially unlimited. The Fund also has the additional risk of being unable to enter into a closing transaction at an acceptable price if a liquid secondary market does not exist. The Fund also may write over-the-counter options where completing the obligation depends upon the credit standing of the other party. Option contracts also involve the risk that they may result in loss due to unanticipated developments in market conditions or other causes. Written options are initially recorded as liabilities to the extent of premiums received and subsequently marked to market to reflect the current value of the option written. Gains or losses are realized when the option transaction expires or closes. When an option is exercised, the proceeds on sales for a written call option or the purchase cost for a written put option is adjusted by the amount of the premium received. Listed option contracts present minimal counterparty credit risk since they are exchange traded and the exchange’s clearinghouse, as counterparty to all
22
PRIVATE CAPITAL MANAGEMENT VALUE FUND
Notes to Financial Statements (Continued)
April 30, 2017
exchange-traded options, guarantees the options against default. A Fund’s maximum risk of loss from counterparty credit risk related to OTC option contracts is limited to the premium paid. As of April 30, 2017, the Fund had no written options.
The Fund had transactions in options written during the year ended April 30, 2017 as follows:
| Number of Contracts | Premium | |||||||||
Outstanding, April 30, 2016 | 300 | $ | 5,487 | |||||||
Call Options Written | — | — | ||||||||
Put Options Written | — | — | ||||||||
Call Options Closed | — | — | ||||||||
Put Options Closed | — | — | ||||||||
Put Options Expired | (300 | ) | (5,487 | ) | ||||||
Put Options Exercised | — | — | ||||||||
|
|
|
| |||||||
Outstanding, April 30, 2017 | — | $ | — | |||||||
|
|
|
| |||||||
For the year ended April 30, 2017, the Fund’s quarterly average volume of derivatives is as follows:
Purchased | Written | |
| $2,100 | $1,220 |
Recent Accounting Pronouncement — In October 2016, the U.S. Securities and Exchange Commission (“SEC”) issued a new rule, Investment Company Reporting Modernization, which, among other provisions, amends Regulation S-X to require standardized, enhanced disclosures, particularly related to derivatives, in investment company financial statements. Compliance with the amendments to Regulation S-X is required for financial statements filed with the SEC on or after August 1, 2017. Management is currently evaluating the impact that the amendments will have on the Fund’s financial statements and related disclosures.
2. Transactions with Related Parties and Other Service Providers
Private Capital Management, LLC (the “Adviser”) serves as the investment adviser to the Fund pursuant to an investment advisory agreement with the Trust (the “Advisory Agreement”). For its services, the Adviser is paid a monthly fee at the annual rate of 0.90% of the Fund’s average daily net assets. The Adviser has contractually agreed to reduce its investment advisory fee and/or reimburse certain expenses of the Fund to the extent necessary to ensure that the Fund’s total operating expenses (excluding taxes, any class-specific fees and expenses (such as Rule 12b-1 distribution fees, shareholder service fees, or transfer agency fees), “Acquired Fund” fees and expenses, interest, extraordinary items and brokerage commissions) do not exceed 1.00% (on an annual basis) of the Fund’s average daily net assets (the “Expense Limitation”). The Expense Limitation will remain in place until August 31, 2017, unless the
23
PRIVATE CAPITAL MANAGEMENT VALUE FUND
Notes to Financial Statements (Continued)
April 30, 2017
Board of Trustees approves its earlier termination. The Adviser is entitled to recover, subject to approval by the Board of Trustees, such amounts reduced or reimbursed for a period of up to three (3) years from the year in which the Adviser reduced its compensation and/or assumed expenses for the Fund. The Adviser is permitted to seek reimbursement from the Fund, subject to certain limitations, for fees it waived and Fund expenses it paid to the extent the total annual Fund expenses do not exceed the limits described above or any lesser limits in effect at the time of reimbursement. No recoupment will occur unless the Fund’s expenses are below the Expense Limitation amount.
As of April 30, 2017, the amount of potential recovery was as follows:
| Expiration | ||||||
| 4/30/2018 | 4/30/2019 | 4/30/2020 | Total | |||
$273,334 | $233,659 | $265,948 | $772,941 | |||
For the year ended April 30, 2017, the Adviser earned fees of $698,351, and waived fees of $265,948. As of April 30, 2017, investment advisory fees payable to the Adviser were $40,822.
Other Service Providers
BNY Mellon Investment Servicing (US) Inc. (“BNY Mellon”) serves as administrator and transfer agent for the Fund. For providing administrative and accounting services, BNY Mellon is entitled to receive a monthly fee equal to an annual percentage rate of the Fund’s average daily net assets and is subject to certain minimum monthly fees. For providing transfer agency services, BNY Mellon is entitled to receive a monthly fee, subject to certain minimum, and out of pocket expenses.
The Bank of New York Mellon (the “Custodian”) provides certain custodial services to the Fund. The Custodian is entitled to receive a monthly fee, subject to certain minimum, and out of pocket expenses.
Foreside Funds Distributors LLC (the “Underwriter”) provides principal underwriting services to the Fund.
The Trust and the Underwriter are parties to an underwriting agreement. The Trust has adopted a distribution plan for Class A Shares in accordance with Rule 12b-1 under the 1940 Act. Pursuant to the Class A Shares plan, the Fund compensates the Underwriter for direct and indirect costs and expenses incurred in connection with advertising, marketing and other distribution services in an amount not to exceed 0.25% on an annualized basis of the average daily net assets of the Fund’s Class A Shares.
24
PRIVATE CAPITAL MANAGEMENT VALUE FUND
Notes to Financial Statements (Continued)
April 30, 2017
Trustees and Officers
The Trust is governed by its Board of Trustees. The Trustees receive compensation in the form of an annual retainer and per meeting fees for their services to the Trust. The remuneration paid to the Trustees by the Fund during the year ended April 30, 2017 was $12,309. An employee of BNY Mellon serves as the Secretary of the Trust and is not compensated by the Fund or the Trust.
Effective June 1, 2016 and July 1, 2016, JW Fund Management LLC (“JWFM”) provides a Principal Executive Officer and Principal Financial Officer, respectively, to the Trust. JWFM is compensated for the services provided to the Trust. Until May 31, 2016 and June 30, 2016, certain employees of BNY Mellon served as Principal Executive Officer and Principal Financial Officer, respectively, to the Trust. They were not compensated by the Trust or the Funds.
Freeh Group International Solutions, LLC provides the Trust with a Chief Compliance Officer and an Anti-Money Laundering Officer.
3. Investment in Securities
For the year ended April 30, 2017, aggregate purchases and sales of investment securities (excluding short-term investments) of the Fund were as follows:
| Purchases | Sales | |||||||
Investment Securities | $ | 7,615,270 | $ | 30,663,023 | ||||
4. Capital Share Transactions
For the Years ended April 30, 2017 and April 30, 2016, transactions in capital shares (authorized shares unlimited) were as follows:
| For the Year Ended April 30, 2017 | For the Year Ended April 30, 2016 | |||||||||||||||
| Shares | Amount | Shares | Amount | |||||||||||||
Class A | ||||||||||||||||
Sales | 45,530 | $ | 673,658 | 121,088 | $ | 1,972,275 | ||||||||||
Reinvestments | 4,260 | 65,263 | 38,187 | 523,919 | ||||||||||||
Redemption Fees* | — | 269 | — | 131 | ||||||||||||
Redemptions | (220,946 | ) | (3,109,496 | ) | (90,591 | ) | (1,281,421 | ) | ||||||||
|
|
|
|
|
|
|
| |||||||||
Net increase/(decrease) | (171,156 | ) | $ | (2,370,306 | ) | 68,684 | $ | 1,214,904 | ||||||||
|
|
|
|
|
|
|
| |||||||||
25
PRIVATE CAPITAL MANAGEMENT VALUE FUND
Notes to Financial Statements (Continued)
April 30, 2017
| For the Year Ended April 30, 2017 | For the Year Ended April 30, 2016 | |||||||||||||||||
| Shares | Amount | Shares | Amount | |||||||||||||||
Class I | ||||||||||||||||||
Sales | 763,486 | $ | 11,209,300 | 2,706,690 | $ | 40,259,973 | ||||||||||||
Reinvestments | 39,175 | 606,431 | 279,485 | 3,876,459 | ||||||||||||||
Redemption Fees* | — | 25 | — | 1,030 | ||||||||||||||
Redemptions | (2,219,939 | ) | (32,022,692 | ) | (954,043 | ) | (13,636,166 | ) | ||||||||||
|
|
|
|
|
|
|
| |||||||||||
Net increase | (1,417,278 | ) | $ | (20,206,936 | ) | 2,032,132 | $ | 30,501,296 | ||||||||||
|
|
|
|
|
|
|
| |||||||||||
Total net increase | (1,588,434 | ) | $ | (22,577,242 | ) | 2,100,816 | $ | 31,716,200 | ||||||||||
|
|
|
|
|
|
|
| |||||||||||
| * | There is a 2.00% redemption fee that may be charged on shares redeemed within the first 30 days of their acquisition. The redemption fees are retained by the Fund for the benefit of the remaining shareholders and recorded as paid-in capital. |
5. Federal Tax Information
The Fund has followed the authoritative guidance on accounting for and disclosure of uncertainty in tax positions, which requires the Fund to determine whether a tax position is more likely than not to be sustained upon examination, including resolution of any related appeals or litigation processes, based on the technical merits of the position. The Fund has determined that there was no effect on the financial statements from following this authoritative guidance. In the normal course of business, the Fund is subject to examination by federal, state and local jurisdictions, where applicable, for tax years for which applicable statutes of limitations have not expired.
Distributions are determined in accordance with federal income tax regulations, which may differ in amount or character from net investment income and realized gains for financial reporting purposes. Accordingly, the character of distributions and composition of net assets for tax purposes may differ from those reflected in the accompanying financial statements. To the extent these differences are permanent, such amounts are reclassified within the components of net assets based on the tax treatment; temporary differences do not require reclassifications. For the year ended April 30, 2017, these adjustments were to increase undistributed net investment income by $1,069,293, decrease accumulated net realized gain/(loss) by $1,015,177 and decrease paid-in capital by $54,116. These permanent differences were primarily attributable to redesignation of dividends paid, disposition of partnerships, and write-off of current year net operating loss. Net investment income, net realized losses and net assets were not affected by these adjustments.
26
PRIVATE CAPITAL MANAGEMENT VALUE FUND
Notes to Financial Statements (Continued)
April 30, 2017
For the year ended April 30, 2017, the tax character of distributions paid by the Fund was $24,463 of ordinary income and $999,091 of long-term capital gains dividends. For the year ended April 30, 2016, the tax character of distributions paid by the Fund was $14,175 of ordinary income and $4,784,147 of long-term capital gains dividends. Distributions from net investment income and short-term capital gains are treated as ordinary income for federal income tax purposes.
As of April 30, 2017, the components of distributable earnings on a tax basis were as follows:
Capital Loss | Undistributed Ordinary Income | Undistributed Long-Term Gain | Unrealized Appreciation | Qualified Late-Year Losses | ||||
| $— | $— | $— | $22,505,397 | $(164,226) |
The differences between the book and tax basis components of distributable earnings relate primarily to the timing and recognition of income and gains for federal income tax purposes.
At April 30, 2017, the federal tax cost, aggregate gross unrealized appreciation and depreciation of securities held by the Fund were as follows:
Federal tax cost | $ | 40,976,884 | ||||||
|
| |||||||
Gross unrealized appreciation | $ | 25,361,681 | ||||||
Gross unrealized depreciation | (2,856,284 | ) | ||||||
|
| |||||||
Net unrealized appreciation | $ | 22,505,397 | ||||||
|
|
Pursuant to federal income tax rules applicable to regulated investment companies, the Fund may elect to treat certain capital losses between November 1 and April 30 and late year ordinary losses ((i) ordinary losses between January 1 and April 30, and (ii) specified ordinary and currency losses between November 1 and April 30) as occurring on the first day of the following tax year. For the year ended April 30, 2017, any amount of losses elected within the tax return will not be recognized for federal income tax purposes until May 1, 2017. For the year ended April 30, 2017, the Fund had late-year ordinary loss deferrals of $84,938 and short-term capital loss deferrals of $79,288.
Accumulated capital losses represent net capital loss carry forwards as of April 30, 2017 that may be available to offset future realized capital gains and thereby reduce future capital gains distributions. As of April 30, 2017, the Fund had no capital losses.
During the year ended April 30, 2017, the Fund utilized $913,239 of prior year capital loss carryforward.
27
PRIVATE CAPITAL MANAGEMENT VALUE FUND
Notes to Financial Statements (Concluded)
April 30, 2017
6. Subsequent Events
Management has evaluated the impact of all subsequent events on the Fund through the date the financial statements were issued, and has determined that there were no subsequent events requiring recognition or disclosure in the financial statements.
28
PRIVATE CAPITAL MANAGEMENT VALUE FUND
Report of Independent Registered Public Accounting Firm
To the Board of Trustees of FundVantage Trust and Shareholders of the
Private Capital Management Value Fund:
In our opinion, the accompanying statement of assets and liabilities, including the portfolio of investments, and the related statements of operations and of changes in net assets and the financial highlights present fairly, in all material respects, the financial position of the Private Capital Management Value Fund (one of the funds constituting FundVantage Trust, hereafter referred to as the “Fund”) as of April 30, 2017, the results of its operations for the year then ended, the changes in its net assets for each of the two years in the period then ended and the financial highlights for each of the five years in the period then ended, in conformity with accounting principles generally accepted in the United States of America. These financial statements and financial highlights (hereafter referred to as “financial statements”) are the responsibility of the Fund’s management. Our responsibility is to express an opinion on these financial statements based on our audits. We conducted our audits of these financial statements in accordance with the standards of the Public Company Accounting Oversight Board (United States). Those standards require that we plan and perform the audit to obtain reasonable assurance about whether the financial statements are free of material misstatement. An audit includes examining, on a test basis, evidence supporting the amounts and disclosures in the financial statements, assessing the accounting principles used and significant estimates made by management, and evaluating the overall financial statement presentation. We believe that our audits, which included confirmation of securities as of April 30, 2017 by correspondence with the custodian, provide a reasonable basis for our opinion.
PricewaterhouseCoopers LLP
Philadelphia, Pennsylvania
June 28, 2017
29
PRIVATE CAPITAL MANAGEMENT VALUE FUND
Shareholder Tax Information
(Unaudited)
The Fund is required by Subchapter M of the Internal Revenue Code, to advise its shareholders of the U.S. federal tax status of distributions received by the Fund’s shareholders in respect of such fiscal year. During the year ended April 30, 2017, the Fund paid $24,463 of ordinary income and $999,091 of long-term capital gain dividends to its shareholders. Dividends from net investment income and short-term capital gains are treated as ordinary income dividends for federal income tax purposes.
All designations are based on financial information available as of the date of this annual report and, accordingly, are subject to change. For each item, it is the intention of the Fund to designate the maximum amount permitted under the Internal Revenue Code of 1986, as amended, and the regulations thereunder.
Because the Fund’s fiscal year is not the calendar year, another notification will be sent with respect to calendar year 2017. The second notification, which will reflect the amount, if any, to be used by calendar year taxpayers on their U.S. federal income tax returns, will be made in conjunction with Form 1099-DIV and will be mailed in January 2018.
Foreign shareholders will generally be subject to U.S. withholding tax on the amount of their ordinary income dividends. They will generally not be entitled to a foreign tax credit or deduction for the withholding taxes paid by the Fund, if any.
In general, dividends received by tax-exempt recipients (e.g., IRAs and Keoghs) need not be reported as taxable income for U.S. federal income tax purposes. However, some retirement trusts (e.g., corporate, Keogh and 403(b)(7) plans) may need this information for their annual information reporting.
Shareholders are advised to consult their own tax advisers with respect to the tax consequences of their investment in the Fund.
30
PRIVATE CAPITAL MANAGEMENT VALUE FUND
Other Information
(Unaudited)
Proxy Voting
Policies and procedures that the Fund uses to determine how to vote proxies relating to portfolio securities as well as information regarding how the Fund voted proxies relating to portfolio securities for the most recent 12-month period ended June 30 are available without charge, upon request, by calling (888) 568-1267 and on the Securities and Exchange Commission’s (“SEC”) website at http:// www.sec.gov.
Quarterly Portfolio Schedules
The Trust files its complete schedule of portfolio holdings with the SEC for the first and third fiscal quarters of each fiscal year (quarters ended July 31 and January 31) on Form N-Q. The Trust’s Forms N-Q are available on the SEC’s website at http://www.sec.gov and may be reviewed and copied at the SEC’s Public Reference Room in Washington, D.C. Information on the operation of the SEC’s Public Reference Room may be obtained by calling 1-800-SEC-0330.
31
PRIVATE CAPITAL MANAGEMENT VALUE FUND
Privacy Notice
(Unaudited)
The privacy of your personal financial information is extremely important to us. When you open an account with us, we collect a significant amount of information from you in order to properly invest and administer your account. We take very seriously the obligation to keep that information private and confidential, and we want you to know how we protect that important information.
We collect nonpublic personal information about you from applications or other forms you complete and from your transactions with us or our affiliates. We do not disclose information about you, or our former clients, to our affiliates or to service providers or other third parties, except as permitted by law. We share only the information required to properly administer your accounts, which enables us to send transaction confirmations, monthly or quarterly statements, financials and tax forms. Even within FundVantage Trust and its affiliated entities, a limited number of people who actually service accounts will have access to your personal financial information. Further, we do not share information about our current or former clients with any outside marketing groups or sales entities.
To ensure the highest degree of security and confidentiality, FundVantage Trust and its affiliates maintain various physical, electronic and procedural safeguards to protect your personal information. We also apply special measures for authentication of information you request or submit to us on our web site.
If you have questions or comments about our privacy practices, please call us at (888) 568-1267.
32
PRIVATE CAPITAL MANAGEMENT VALUE FUND
Fund Management
(Unaudited)
FundVantage Trust (the “Trust”) is governed by a Board of Trustees (the “Trustees”). The primary responsibility of the Trustees is to represent the interest of the Trust’s shareholders and to provide oversight management of the Trust.
The following tables present certain information regarding the Board of Trustees and officers of the Trust. None of the Trustees are an “interested person” of the Trust, the Adviser, another investment adviser of a series of the Trust, or Foreside Funds Distributors LLC, the principal underwriter of the Trust (“Underwriter”), within the meaning of the 1940 Act and each Trustee is referred to as an “Independent Trustee” and is listed under such heading below. The address of each Trustee and officer as it relates to the Trust’s business is 301 Bellevue Parkway, 2nd Floor, Wilmington, DE 19809.
The Statement of Additional information for the Fund contains additional information about the Trustees and is available, without charge, upon request, by calling (888) 568-1267.
Name and Date of Birth | Position(s) Held with Trust | Term of Office Time Served | Principal Occupation(s) During Past Five Years |
Number of Funds in
| Other Directorships Held by Trustee | |||||
INDEPENDENT TRUSTEES
| ||||||||||
ROBERT J. CHRISTIAN Date of Birth: 2/49 |
Trustee and Chairman of the Board |
Shall serve until death, resignation or removal. Trustee and Chairman since 2007. |
Retired since February 2006; Executive Vice President of Wilmington Trust Company from February 1996 to February 2006; President of Rodney Square Management Corporation (“RSMC”) (investment advisory firm) from 1996 to 2005; Vice President of RSMC from 2005 to 2006.
|
42 |
Optimum Fund Trust (registered investment company with 6 portfolios). | |||||
IQBAL MANSUR Date of Birth: 6/55 |
Trustee |
Shall serve until death, resignation or removal. Trustee since 2007.
|
University Professor, Widener University. |
42 |
None. | |||||
33
PRIVATE CAPITAL MANAGEMENT VALUE FUND
Fund Management (Continued)
(Unaudited)
Name and Date of Birth | Position(s) Held with Trust | Term of Office Time Served | Principal Occupation(s) During Past Five Years |
Number of Funds in
| Other Directorships Held by Trustee | |||||
NICHOLAS M. MARSINI, JR. Date of Birth: 8/55 |
Trustee |
Shall serve until death, resignation or removal. Trustee since 2016. |
Retired since March 2016. President of PNC Bank Delaware from June 2011 to March 2016; Executive Vice President Finance of BNY Mellon from July 2010 to January 2011; Executive Vice President and Chief Financial Officer of PNC Global Investment Servicing from September 1997 to July 2010.
|
42 |
Brinker Capital Destinations Trust (registered investment company with 10 portfolios). | |||||
STEPHEN M. WYNNE Date of Birth: 1/55 |
Trustee |
Shall serve until death, resignation or removal. Trustee since 2009. |
Retired since December 2010; Chief Executive Officer of US Funds Services, BNY Mellon Asset Servicing from July 2010 to December 2010; Chief Executive Officer of PNC Global Investment Servicing from March 2008 to July 2010; President, PNC Global Investment Servicing from 2003 to 2008.
|
42 |
Copeland Trust (registered investment company with 2 portfolios). Context Capital Funds (registered investment company with 1 portfolio).
| |||||
NANCY B. WOLCOTT Date of Birth: 11/54 |
Trustee |
Shall serve until death, resignation or removal. Trustee since 2011. |
Retired since May 2014; EVP, Head of GFI Client Service Delivery, BNY Mellon from January 2012 to May 2014; EVP, Head of US Funds Services, BNY Mellon from July 2010 to January 2012; President of PNC Global Investment Servicing from 2008 to July 2010; Chief Operating Officer of PNC Global Investment Servicing from 2007 to 2008; Executive Vice President of PFPC Worldwide Inc. from 2006 to 2007.
|
42 |
None. |
34
PRIVATE CAPITAL MANAGEMENT VALUE FUND
Fund Management (Concluded)
(Unaudited)
Name and Date of Birth | Position(s) Held with Trust |
Term of Office and Length of Time Served
| Principal Occupation(s) During Past Five Years | |||
EXECUTIVE OFFICERS
| ||||||
JOEL L. WEISS Date of Birth: 1/63 |
President and Chief Executive Officer |
Shall serve until death, resignation or removal. Officer since 2007. |
President of JW Fund Management LLC since June 2016; Vice President and Managing Director of BNY Mellon Investment Servicing (US) Inc. and predecessor firms from 1993 to June 2016.
| |||
T. RICHARD KEYES
Date of Birth: 1/57 |
Treasurer and Chief Financial Officer |
Shall serve until death, resignation or removal. Officer since 2016. |
President of TRK Fund Consulting since July 2016; Head of Tax-U.S. Fund Services of BNY Mellon Investment Servicing (US) Inc. and predecessor firms from February 2006 to July 2016.
| |||
VINCENZO A. SCARDUZIO Date of Birth: 4/72 |
Secretary |
Shall serve until death, resignation or removal. Officer since 2012. |
Director and Vice President Regulatory Administration of BNY Mellon Investment Servicing (US) Inc. and predecessor firms since 2001.
| |||
DAVID C. LEBISKY Date of Birth: 5/72 |
Chief Compliance Officer and Anti-Money Laundering Officer |
Shall serve until death, resignation or removal. Officer since 2015. |
President of Lebisky Compliance Consulting LLC since October 2015; Senior Consultant, Freeh Group International Solutions, LLC (a global risk management firm) since 2015; Scotia Institutional Investments US, LP, Director of Regulatory Administration from 2010 to 2014.
| |||
35
Investment Adviser
Private Capital Management, LLC
8889 Pelican Bay Boulevard
Suite 500
Naples, FL 34108
Administrator
BNY Mellon Investment Servicing (US) Inc.
301 Bellevue Parkway
Wilmington, DE 19809
Transfer Agent
BNY Mellon Investment Servicing (US) Inc.
4400 Computer Drive
Westborough, MA 01581
Principal Underwriter
Foreside Funds Distributors LLC
400 Berwyn Park
899 Cassatt Road
Berwyn, PA 19312
Custodian
The Bank of New York Mellon
225 Liberty Street
New York, NY 10286
Independent Registered Public Accounting Firm
PricewaterhouseCoopers LLP
Two Commerce Square, Suite 1800
2001 Market Street
Philadelphia, PA 19103-7042
Legal Counsel
Pepper Hamilton LLP
3000 Two Logan Square
18th and Arch Streets
Philadelphia, PA 19103
PRI-0417
PRIVATE CAPITAL
MANAGEMENT VALUE
FUND
of
FundVantage Trust
Class A
Class I
ANNUAL REPORT
April 30, 2017
This report is submitted for the general information of the shareholders of the Private Capital Management Value Fund. It is not authorized for distribution unless preceded or accompanied by a current prospectus for the Private Capital Management Value Fund.
QUALITY DIVIDEND FUND
Annual Investment Adviser’s Report
April 30, 2017
(Unaudited)
Dear Shareholder,
During the fiscal year ended April 30, 2017, the Quality Dividend Fund (the “Fund”) Class A shares (without the sales charge) were up 12.82%, compared to a 16.55% gain for the Russell 1000® Value Index (“Russell 1000”) and an increase of 17.92% for the Standard & Poor’s 500® Index (“S&P 500”). Since inception on September 30, 2013, the Fund’s Class A shares (without the sales charge) have risen at an annualized rate of 8.77% versus 10.98% for the Russell 1000 and 12.58% for the S&P 500. The Fund, due to its focus on higher yielding stocks, has higher exposure to sectors such as Consumer Staples, Real Estate, Telecommunication Services and Utilities, which lagged the market, and lower exposure to the Information Technology sector, which was up 33.2%. The Fund still achieved solid double-digit returns, and each of the Fund’s holdings raised its dividend during the fiscal year, with average dividend growth of 8%. The average yield of the Fund’s holdings was 3.8% as of April 30, 2017 while the Fund’s 30-day current yield was 2.84%.1
The performance data quoted represents past performance and does not guarantee future results. The investment return and principal value of an investment in the Fund will fluctuate so that an investor’s shares, when redeemed, may be worth more or less than their original cost. Current performance may be lower or higher. Performance data current to the most recent month end may be obtained by calling (888) 201-5799.
Changes
We removed 7 positions from the Fund and made 9 replacements over the last fiscal year. Stocks were removed for reasons including strong performance reducing current yield, and concerns about the potential for dividend reductions, concerns regarding management commitment to future dividend growth. During the year purchases included International Paper (IP), Spectra Energy Co. (SE), Flowers Foods Inc. (FLO), Buckeye Partners LP (BPL), Kimberly-Clark Corp. (KMB), TEVA Pharmaceuticals Industries Ltd (TEVA), General Electric Co. (GE), Qualcomm Inc. (QCOM), and Valero Energy Corp. (VLO). Flowers Foods (FLO) was removed during the year, and Spectra Energy Co. (SE) was purchased by Enbridge Inc. (ENB), which we retained as a holding. We had also removed Kimberly-Clark Corp. (KMB) in June 2016 prior to repurchasing it in October 2016. Other stocks removed during the fiscal year included Kohls Corp. (KSS), Consolidated Edison Inc. (ED), Archer Daniels Midland (ADM), Welltower Inc. (HCN), and Target Corp. (TGT).
Distributions
The Fund has had four distributions during the fiscal year. Class A shares distributed $0.079351 per share on 7/1/2016, $0.060683 per share on 10/3/2016, $0.07532 per share on 1/03/2016, and $0.024707 per share on 4/3/2017. Class C shares distributed $0.065485 per share on 7/1/2016, $0.024799 per share on 09/30/2016, $0.053828 per share on 1/03/2017, and $0.002107 per share on 4/3/2017. Institutional Class shares, which began trading 10/05/2016, distributed $0.083155 on 1/03/17 and $0.032129 on 4/03/2017.
Outlook
We feel the Fund is solidly positioned to continue to pursue its objectives. On average, portfolio constituents are paying out 60% of their earnings in dividends, providing ample cushion for maintaining current dividends. Annualized
1
QUALITY DIVIDEND FUND
Annual Investment Adviser’s Report (Concluded)
April 30, 2017
(Unaudited)
earnings growth of 7.3% is expected for constituents over the next 5 years, which is above our projected 3-year dividend growth of 6.5% for portfolio holdings. The average P/E of stocks in the portfolio is 16.4x versus 17.7x for the S&P 500. We feel the portfolio’s low relative valuation, manageable dividend payout, and solid earnings growth align well with the Fund’s objectives of achieving current income and providing long-term growth of capital.
Sincerely,
Larry Baker, CFA
Portfolio Manager
Richard E. Cripps, CFA
Portfolio Manager
Michael S. Scherer
Portfolio Manager
| ¹ | The quoted 30-day current yield is for the Fund’s Class A shares with waivers. The current yields for Class A shares without waivers was 2.65%. The SEC Yield for Class C shares with and without waivers were 2.44% and 2.27%, respectively. For the Institutional Class shares, the SEC Yield was 1.85% with waivers and 1.66% without. The current yield is calculated by dividing the Fund’s net investment income earned per share for the 30 day period ending April 30, 2017 by the Fund’s maximum offering price per share on the same date. Current yield does not measure actual distributions of net investment income to the Fund’s shareholders. Past performance does not guarantee future results. |
Investments cannot be made directly in an Index. Unmanaged index returns assume reinvestment of any and all distributions and do not reflect fees, expenses, or sales charges.
This letter is intended to assist shareholders in understanding how the Fund performed during the fiscal year ended April 30, 2017 and reflects the views of the investment adviser at the time of this writing. Of course, these views may change and do not guarantee the future performance of the Fund or the markets.
The above commentary is for informational purposes only and does not represent an offer, recommendation or solicitation to buy, hold or sell any security. The specific securities identified and described do not represent all of the securities purchased or sold and you should not assume that investments in the securities identified and discussed will be profitable.
Portfolio composition is subject to change. The current and future portfolio holdings of the Fund are subject to investment risk.
2
QUALITY DIVIDEND FUND
Annual Report
Performance Data
April 30, 2017
(Unaudited)
Comparison of Change in Value of $10,000 Investment in Quality Dividend Fund
Class A shares vs. Russell 1000® Value Index and S&P 500® Index
Class A shares of an assumed $10,000 investment is adjusted for the maximum sales charge of 5.75%. This results in a net investment of $9,425. Performance of Class C shares will vary from Class A shares due to difference in class specific fees.
Comparison of Change in Value of $1,000,000 (investment minimum) Investment in Quality Dividend Fund
Institutional Class shares vs. Russell 1000® Value Index and S&P 500® Index
3
QUALITY DIVIDEND FUND
Annual Report
Performance Data (Continued)
April 30, 2017
(Unaudited)
Average Annual Total Returns for the Periods Ended April 30, 2017† |
| ||||||||||||||
| 1 Year | 3 Years | Since Inception | |||||||||||||
Class A (with sales charge) | 6.36% | 4.61% | 6.98% | ||||||||||||
Class A (without sales charge) | 12.82% | 6.68% | 8.77% | ||||||||||||
Russell 1000® Value Index | 16.55% | 8.26% | 10.98% | * | |||||||||||
S&P 500® Index | 17.92% | 10.47% | 12.58% | * | |||||||||||
Class C (with CDSC charge) | 11.07% | 5.91% | 8.00% | ||||||||||||
Class C (without CDSC charge) | 12.07% | 5.91% | 8.00% | ||||||||||||
Russell 1000® Value Index | 16.55% | 8.26% | 10.74% | ** | |||||||||||
S&P 500® Index | 17.92% | 10.47% | 12.34% | ** | |||||||||||
Institutional Class | N/A | N/A | 8.72% | ||||||||||||
Russell 1000® Value Index | N/A | N/A | 10.98% | *** | |||||||||||
S&P 500® Index
|
| N/A
|
|
| N/A
|
|
| 12.15%
| ***
| ||||||
| † | The Quality Dividend Fund (“the Fund”) Class A shares commenced operations on September 30, 2013; Class C shares commenced operations on October 1, 2013; Institutional Class shares commenced operations on October 4, 2016. |
| * | Benchmark performance is from the inception date of Class A shares of the Fund (September 30, 2013) only and is not the inception date of the benchmark itself. |
| ** | Benchmark performance is from the inception date of Class C shares of the Fund (October 1, 2013) only and is not the inception date of the benchmark itself. |
| *** | Benchmark performance is from the inception date of Institutional Class shares of the Fund (October 4, 2016) only and is not the inception date of the benchmark itself. |
The performance data quoted represents past performance and does not guarantee future results. The investment return and principal value of an investment in the Fund will fluctuate so that an investor’s shares, when redeemed, may be worth more or less than their original cost. The graphs and table do not reflect the deduction of taxes that a shareholder would pay on Fund distributions or redemption of Fund shares. Current performance may be lower or higher. Performance data current to the most recent month end may be obtained by calling (888) 201-5799.
The returns of Class A shares reflect a deduction for the maximum front end sales charge of 5.75%.
The Fund’s “Total Annual Fund Operating Expenses” and “Total Annual Fund Operating Expenses After Fee Waiver and/or Expense Reimbursement”, as stated in the current prospectus dated September 1, 2016, are 1.38% and 1.25%, respectively, for Class A shares, 2.13% and 2.00%, respectively, for Class C shares and 1.13% and 1.00%, for Institutional Class shares of the Fund’s average daily net assets. These rates may fluctuate and may differ from the actual expenses incurred by the Fund for the period covered by this report. Choice Financial Partners, Inc., d/b/a EquityCompass Strategies (“EquityCompass” or the “Adviser”) has contractually agreed to reduce its investment advisory fee and/or reimburse certain expenses of the Fund to the extent necessary to ensure that the Fund’s total operating expenses (excluding taxes, any class-specific fees and expenses, “Acquired Fund” fees and expenses, interest, extraordinary items and brokerage commissions) do not exceed 0.99% of average daily net assets of the Fund (the “Expense Limitation”). The Expense Limitation will remain in effect until September 30, 2017, unless the Board of Trustees of FundVantage Trust (the “Trust”) approves its earlier termination. The Adviser is entitled to
4
QUALITY DIVIDEND FUND
Annual Report
Performance Data (Concluded)
April 30, 2017
(Unaudited)
recover, subject to approval by the Board of Trustees, such amounts reduced or reimbursed for a period of up to three (3) years from the year in which the Adviser reduced its compensation and/or assumed expenses for the Fund. The Adviser is permitted to seek reimbursement from the Fund, subject to certain limitations, for fees it waived and Fund expenses it paid to the extent the total annual fund expenses do not exceed the limits described above or any lesser limits in effect at the time of reimbursement. No recoupment will occur unless the Fund’s expenses are below the Expense Limitation amount. Total fees would be higher had such fees and expenses not been waived and/or reimbursed.
A 1.00% redemption fee applies to shares redeemed within 60 days of purchase. The redemption fee is not reflected in the returns shown above.
The Fund intends to evaluate performance as compared to those of the Russell 1000® Value Index and the Standard & Poor’s 500 (“S&P 500®”) Index. The Russell 1000® Value Index is an unmanaged index that measures the performance of the highest-ranking 1,000 stocks in the Russell 3000® Index, which represents about 90% of the total market capitalization of all listed U.S. stocks. The S&P 500® Index is a widely recognized, unmanaged index of 500 common stocks which are generally representative of the U.S. stock market as a whole. It is impossible to invest directly in an index.
Mutual fund investing involves risk, including possible loss of principal. The Fund’s dividend income and distributions will fluctuate, and at times the Fund may underperform other funds that invest more broadly or that have different investment styles. Some of the assets in which the Fund may invest entail special risks. Foreign stocks may be affected by currency fluctuations, social and political instability, and lax regulatory and financial reporting standards. Master Limited Partnerships (“MLPs”) may fluctuate abruptly in value and be difficult to liquidate. Real Estate Investment Trusts (“REITs”) entail risks related to real estate, such as tenant defaults, declining occupancy rates, and falling property values due to deteriorating economic conditions. Listed REIT stocks may fluctuate erratically in market price while non-listed REITs may be illiquid.
5
QUALITY DIVIDEND FUND
Fund Expense Disclosure
April 30, 2017
(Unaudited)
As a shareholder of the Fund, you incur two types of costs: (1) transaction costs, including sales charges (loads) on purchase payments, if any, and redemption fees; and (2) ongoing costs, including management fees, distribution and/or service (Rule 12b-1) fees, if any, and other Fund expenses. These examples are intended to help you understand your ongoing costs (in dollars) of investing in the Fund and to compare these costs with the ongoing costs of investing in other mutual funds.
These examples are based on an investment of $1,000 invested at the beginning of the six-month period from November 1, 2016 through April 30, 2017 and held for the entire period.
Actual Expenses
The first line of each accompanying table provides information about actual account values and actual expenses. You may use the information in this line, together with the amount you invested, to estimate the expenses that you paid over the period. Simply divide your account value by $1,000 (for example, an $8,600 account value divided by $1,000 = 8.6), then multiply the result by the number in the first line under the heading entitled “Expenses Paid During Period” to estimate the expenses you paid on your account during this period.
Hypothetical Examples for Comparison Purposes
The second line of each accompanying table provides information about hypothetical account values and hypothetical expenses based on the Fund’s actual expense ratio and an assumed rate of return of 5% per year before expenses, which is not your Fund’s actual return. The hypothetical account values and expenses may not be used to estimate the actual ending account balance or expenses you paid for the period. You may use this information to compare the ongoing costs of investing in the Fund and other funds. To do so, compare these 5% hypothetical examples with the 5% hypothetical examples that appear in the shareholder reports of other funds.
Please note that the expenses shown in the accompanying table are meant to highlight your ongoing costs only and do not reflect any transactional costs, such as sales charges (loads), if any, or redemption fees. Therefore, the second line of the accompanying table is useful in comparing ongoing costs only, and will not help you determine the relative total costs of owning different funds. In addition, if these transactional costs were included, your costs would have been higher.
6
QUALITY DIVIDEND FUND
Fund Expense Disclosure (Concluded)
April 30, 2017
(Unaudited)
| Quality Dividend Fund | |||||||||||||||
| Beginning Account Value November 1, 2016 | Ending Account Value April 30, 2017 | Expenses Paid During Period* | |||||||||||||
Class A | |||||||||||||||
Actual | $1,000.00 | $1,094.60 | $ 6.44 | ||||||||||||
Hypothetical (5% return before expenses) | 1,000.00 | 1,018.65 | 6.21 | ||||||||||||
Class C | |||||||||||||||
Actual | $1,000.00 | $1,091.20 | $10.32 | ||||||||||||
Hypothetical (5% return before expenses) | 1,000.00 | 1,014.93 | 9.94 | ||||||||||||
Institutional Class | |||||||||||||||
Actual | $1,000.00 | $1,096.90 | $ 5.15 | ||||||||||||
Hypothetical (5% return before expenses) | 1,000.00 | 1,019.89 | 4.96 | ||||||||||||
| * | Expenses are equal to an annualized expense ratio for the six-month period ended April 30, 2017 of 1.24%, 1.99% and 0.99% for Class A, Class C and Institutional Class shares, respectively, for the Fund, multiplied by the average account value over the period, multiplied by the number of days in the most recent period (181), then divided by 365 to reflect the period. The Fund’s ending account values on the first line in the table are based on the actual six-month total returns for the Fund of 9.46%, 9.12% and 9.69% for Class A, Class C and Institutional Class shares, respectively. |
7
QUALITY DIVIDEND FUND
Portfolio Holdings Summary Table
April 30, 2017
(Unaudited)
The following table presents a summary by sector of the portfolio holdings of the Fund:
| % of Net Assets | Value | |||||||
COMMON STOCKS: | ||||||||
Oil, Gas & Consumable Fuels | 10.4 | % | $ | 7,428,058 | ||||
Pharmaceuticals | 9.8 | 7,029,953 | ||||||
Commercial Banks | 7.8 | 5,590,091 | ||||||
REITs | 7.3 | 5,225,361 | ||||||
Household Products | 7.1 | 5,125,015 | ||||||
Electric Utilities | 7.1 | 5,080,646 | ||||||
Diversified Telecommunication Services | 6.5 | 4,673,070 | ||||||
Aerospace & Defense | 4.5 | 3,244,691 | ||||||
Hotels, Restaurants & Leisure | 4.1 | 2,950,844 | ||||||
Chemicals | 4.1 | 2,941,866 | ||||||
Software | 4.0 | 2,834,860 | ||||||
Tobacco | 3.9 | 2,804,141 | ||||||
Containers & Packaging | 3.9 | 2,786,471 | ||||||
Communications Equipment | 3.8 | 2,732,448 | ||||||
Biotechnology | 3.6 | 2,546,207 | ||||||
Beverages | 3.5 | 2,534,415 | ||||||
Semiconductors & Semiconductor Equipment | 3.4 | 2,449,093 | ||||||
Industrial Conglomerates | 3.4 | 2,424,782 | ||||||
Exchange Traded Fund | 0.2 | 181,132 | ||||||
Other Assets in Excess of Liabilities | 1.6 | 1,126,590 | ||||||
|
|
|
| |||||
NET ASSETS | 100.0 | % | $ | 71,709,734 | ||||
|
|
|
| |||||
Portfolio holdings are subject to change at any time.
The accompanying notes are an integral part of the financial statements.
8
QUALITY DIVIDEND FUND
Portfolio of Investments
April 30, 2017
| Number of Shares | Value | |||||||
COMMON STOCKS — 98.2% |
| |||||||
Aerospace & Defense — 4.5% |
| |||||||
Boeing Co. (The) | 17,555 | $ | 3,244,691 | |||||
|
| |||||||
Beverages — 3.5% | ||||||||
Coca-Cola Co. (The) | 58,735 | 2,534,415 | ||||||
|
| |||||||
Biotechnology — 3.6% | ||||||||
Abbvie, Inc. | 38,614 | 2,546,207 | ||||||
|
| |||||||
Chemicals — 4.1% | ||||||||
Dow Chemical Co. (The) | 46,845 | 2,941,866 | ||||||
|
| |||||||
Commercial Banks — 7.8% | ||||||||
JPMorgan Chase & Co. | 33,325 | 2,899,275 | ||||||
Wells Fargo & Co. | 49,978 | 2,690,816 | ||||||
|
| |||||||
| 5,590,091 | ||||||||
|
| |||||||
Communications Equipment ��� 3.8% |
| |||||||
Cisco Systems, Inc. | 80,201 | 2,732,448 | ||||||
|
| |||||||
Containers & Packaging — 3.9% |
| |||||||
International Paper Co. | 51,630 | 2,786,471 | ||||||
|
| |||||||
Diversified Telecommunication Services — 6.5% |
| |||||||
AT&T, Inc. | 61,857 | 2,451,393 | ||||||
Verizon Communications, Inc. | 48,392 | 2,221,677 | ||||||
|
| |||||||
| 4,673,070 | ||||||||
|
| |||||||
Electric Utilities — 7.1% | ||||||||
Duke Energy Corp. | 31,607 | 2,607,578 | ||||||
Southern Co. (The) | 49,660 | 2,473,068 | ||||||
|
| |||||||
| 5,080,646 | ||||||||
|
| |||||||
Hotels, Restaurants & Leisure — 4.1% |
| |||||||
McDonald’s Corp. | 21,088 | 2,950,844 | ||||||
|
| |||||||
Household Products — 7.1% | ||||||||
Kimberly-Clark Corp. | 20,053 | 2,601,877 | ||||||
Procter & Gamble Co. (The) | 28,892 | 2,523,138 | ||||||
|
| |||||||
| 5,125,015 | ||||||||
|
| |||||||
| Number of Shares | Value | |||||||
COMMON STOCKS — (Continued) |
| |||||||
Industrial Conglomerates — 3.4% |
| |||||||
General Electric Co. | 83,642 | $ | 2,424,782 | |||||
|
| |||||||
Oil, Gas & Consumable Fuels — 10.4% |
| |||||||
Buckeye Partners L.P.† | 36,216 | 2,505,423 | ||||||
Enbridge, Inc. (Canada) | 59,516 | 2,466,938 | ||||||
Valero Energy Corp. | 38,008 | 2,455,697 | ||||||
|
| |||||||
| 7,428,058 | ||||||||
|
| |||||||
Pharmaceuticals — 9.8% |
| |||||||
Johnson & Johnson | 21,173 | 2,614,230 | ||||||
Pfizer, Inc. | 72,507 | 2,459,437 | ||||||
Teva Pharmaceutical Industries Ltd. SP ADR (Israel) | 61,947 | 1,956,286 | ||||||
|
| |||||||
| 7,029,953 | ||||||||
|
| |||||||
REITs — 7.3% | ||||||||
Digital Realty Trust, Inc. | 25,536 | 2,932,554 | ||||||
Omega Healthcare Investors, Inc. | 69,479 | 2,292,807 | ||||||
|
| |||||||
| 5,225,361 | ||||||||
|
| |||||||
Semiconductors & Semiconductor Equipment — 3.4% |
| |||||||
QUALCOMM, Inc. | 45,573 | 2,449,093 | ||||||
|
| |||||||
Software — 4.0% | ||||||||
Microsoft Corp. | 41,409 | 2,834,860 | ||||||
|
| |||||||
Tobacco — 3.9% | ||||||||
Philip Morris International, Inc. | 25,299 | 2,804,141 | ||||||
|
| |||||||
TOTAL COMMON STOCKS (Cost $60,112,290) |
| 70,402,012 | ||||||
|
| |||||||
The accompanying notes are an integral part of the financial statements.
9
QUALITY DIVIDEND FUND
Portfolio of Investments (Concluded)
April 30, 2017
| Number of Shares | Value | |||||||
EXCHANGE TRADED FUND — 0.2% |
| |||||||
SPDR S&P Dividend ETF | 2,043 | $ | 181,132 | |||||
|
| |||||||
TOTAL EXCHANGE TRADED FUND | 181,132 | |||||||
|
| |||||||
TOTAL INVESTMENTS - 98.4% |
| 70,583,144 | ||||||
|
| |||||||
OTHER ASSETS IN EXCESS OF LIABILITIES - 1.6% | 1,126,590 | |||||||
|
| |||||||
NET ASSETS - 100.0% | $ | 71,709,734 | ||||||
|
| |||||||
L.P. | Limited Partnership | |
REIT | Real Estate Investment Trust | |
SP ADR | Sponsored American Depository Receipt | |
SPDR | Standard & Poor’s Depository Receipt | |
† | Master Limited Partnership |
The accompanying notes are an integral part of the financial statements.
10
QUALITY DIVIDEND FUND
Statement of Assets and Liabilities
April 30, 2017
Assets | ||||
Investments, at value (Cost $60,256,825) | $ | 70,583,144 | ||
Cash | 647,461 | |||
Receivable for capital shares sold | 451,466 | |||
Dividends and interest receivable | 163,159 | |||
Prepaid expenses and other assets | 51,483 | |||
|
| |||
Total assets | 71,896,713 | |||
|
| |||
Liabilities | ||||
Payable for capital shares redeemed | 39,898 | |||
Payable for transfer agent fees | 31,638 | |||
Payable for audit fees | 25,601 | |||
Payable to Investment Adviser | 24,139 | |||
Payable for distribution fees | 23,467 | |||
Payable for legal fees | 11,805 | |||
Payable for administration and accounting fees | 10,151 | |||
Payable for printing fees | 8,312 | |||
Payable for shareholder servicing fees | 5,342 | |||
Payable for custodian fees | 2,829 | |||
Accrued expenses | 3,797 | |||
|
| |||
Total liabilities | 186,979 | |||
|
| |||
Net Assets | $ | 71,709,734 | ||
|
| |||
Net Assets Consisted of: | ||||
Capital stock, $0.01 par value | $ | 58,726 | ||
Paid-in capital | 64,558,404 | |||
Accumulated net investment income | 358,204 | |||
Accumulated net realized loss from investments | (3,591,919 | ) | ||
Net unrealized appreciation on investments | 10,326,319 | |||
|
| |||
Net Assets | $ | 71,709,734 | ||
|
|
Class A: | ||||
Net asset value and redemption price per share ($36,731,111 / 3,012,118 shares) | $12.19 | |||
|
| |||
Maximum offering price per share (100/94.25 of $12.19) | $12.93 | |||
|
| |||
Class C: | ||||
Net asset value, offering and redemption price per share ($26,247,189 / 2,144,845 shares) | $12.24 | |||
|
| |||
Institutional Class: | ||||
Net asset value, offering and redemption price per share ($8,731,434 / 715,676 shares) | $12.20 | |||
|
| |||
The accompanying notes are an integral part of the financial statements.
11
QUALITY DIVIDEND FUND
Statement of Operations
For the Year Ended April 30, 2017
Investment Income | ||||
Dividends | $ | 2,343,761 | ||
Less: foreign taxes withheld | (6,085 | ) | ||
|
| |||
Total investment income | 2,337,676 | |||
|
| |||
Expenses | ||||
Advisory fees (Note 2) | 393,374 | |||
Distribution fees (Class C) (Note 2) | 187,198 | |||
Distribution fees (Class A) (Note 2) | 92,598 | |||
Transfer agent fees (Note 2) | 73,318 | |||
Administration and accounting fees (Note 2) | 67,410 | |||
Shareholder servicing fees (Class C) | 62,400 | |||
Legal fees | 34,635 | |||
Registration and filing fees | 29,580 | |||
Trustees’ and officers’ fees (Note 2) | 29,200 | |||
Printing and shareholder reporting fees | 28,307 | |||
Audit fees | 26,505 | |||
Custodian fees (Note 2) | 18,817 | |||
Other expenses | 22,638 | |||
|
| |||
Total expenses before waivers and reimbursements | 1,065,980 | |||
|
| |||
Less: waivers (Note 2) | (74,701 | ) | ||
|
| |||
Net expenses after waivers and reimbursements | 991,279 | |||
|
| |||
Net investment income | 1,346,397 | |||
|
| |||
Net realized and unrealized gain from investments: | ||||
Net realized gain from investments | 2,178,275 | |||
Net change in unrealized appreciation/(depreciation) on investments | 4,141,133 | |||
|
| |||
Net realized and unrealized gain on investments | 6,319,408 | |||
|
| |||
Net increase in net assets resulting from operations | $ | 7,665,805 | ||
|
|
The accompanying notes are an integral part of the financial statements.
12
QUALITY DIVIDEND FUND
Statements of Changes in Net Assets
| For the Year Ended April 30, 2017 | For the Year Ended April 30, 2016 | |||||||
Increase/(decrease) in net assets from operations: | ||||||||
Net investment income | $ | 1,346,397 | $ | 1,186,023 | ||||
Net realized gain/(loss) from investments | 2,178,275 | (5,676,467 | ) | |||||
Net change in unrealized appreciation/(depreciation) on investments | 4,141,133 | 3,239,055 | ||||||
|
|
|
| |||||
Net increase/(decrease) in net assets resulting from operations | 7,665,805 | (1,251,389 | ) | |||||
|
|
|
| |||||
Less Dividends and Distributions to Shareholders from: | ||||||||
Net investment income: | ||||||||
Class A | (774,146 | ) | (812,392 | ) | ||||
Class C | (312,026 | ) | (411,363 | ) | ||||
Institutional Class | (70,873 | ) | — | |||||
|
|
|
| |||||
Total net investment income | (1,157,045 | ) | (1,223,755 | ) | ||||
|
|
|
| |||||
Net realized capital gains: | ||||||||
Class A | — | (459,203 | ) | |||||
Class C | — | (285,545 | ) | |||||
|
|
|
| |||||
Total net realized capital gains | — | (744,748 | ) | |||||
|
|
|
| |||||
Net decrease in net assets from dividends and distributions to shareholders | (1,157,045 | ) | (1,968,503 | ) | ||||
|
|
|
| |||||
Increase in Net Assets Derived from Capital Share Transactions (Note 4) | 6,377,427 | 5,594,857 | ||||||
|
|
|
| |||||
Total increase in net assets | 12,886,187 | 2,374,965 | ||||||
|
|
|
| |||||
Net assets | ||||||||
Beginning of year | 58,823,547 | 56,448,582 | ||||||
|
|
|
| |||||
End of year | $ | 71,709,734 | $ | 58,823,547 | ||||
|
|
|
| |||||
Accumulated net investment income, end of year | $ | 358,204 | $ | 167,696 | ||||
|
|
|
| |||||
The accompanying notes are an integral part of the financial statements.
13
QUALITY DIVIDEND FUND
Financial Highlights
Contained below is per share operating performance data for each Class A share outstanding, total investment return, ratios to average net assets and other supplemental data for the respective period. The total returns in the table represent the rate that an investor would have earned or lost on an investment in the Fund (assuming reinvestment of all dividends and distributions). This information has been derived from information provided in the financial statements and should be read in conjunction with the financial statements and the notes thereto. |
| Class A | ||||||||||||||||||||
| For the Year Ended April 30, 2017 | For the Year Ended April 30, 2016 | For the Year Ended April 30, 2015 | For the Period September 30, 2013* to April 30, 2014 | |||||||||||||||||
Per Share Operating Performance | ||||||||||||||||||||
Net asset value, beginning of period | $ 11.03 | $ 11.66 | $ 11.02 | $ 10.00 | ||||||||||||||||
|
|
|
|
|
|
|
| |||||||||||||
Net investment income(1) | 0.27 | 0.26 | 0.27 | 0.16 | ||||||||||||||||
Net realized and unrealized gain/(loss) on investments | 1.13 | (0.49 | ) | 0.79 | 0.96 | |||||||||||||||
|
|
|
|
|
|
|
| |||||||||||||
Net increase/(decrease) in net assets resulting from operations | 1.40 | (0.23 | ) | 1.06 | 1.12 | |||||||||||||||
|
|
|
|
|
|
|
| |||||||||||||
Dividends and distributions to shareholders from: | ||||||||||||||||||||
Net investment income | (0.24 | ) | (0.26 | ) | (0.28 | ) | (0.10 | ) | ||||||||||||
Net realized capital gains | — | (0.14 | ) | (0.14 | ) | — | ||||||||||||||
|
|
|
|
|
|
|
| |||||||||||||
Total dividends and distributions to shareholders | (0.24 | ) | (0.40 | ) | (0.42 | ) | (0.10 | ) | ||||||||||||
|
|
|
|
|
|
|
| |||||||||||||
Redemption fees | — | (2) | — | (2) | — | (2) | — | (2) | ||||||||||||
|
|
|
|
|
|
|
| |||||||||||||
Net asset value, end of period | $ 12.19 | $ 11.03 | $ 11.66 | $ 11.02 | ||||||||||||||||
|
|
|
|
|
|
|
| |||||||||||||
Total investment return(3) | 12.82 | % | (1.84 | )% | 9.65 | % | 11.27 | % | ||||||||||||
Ratio/Supplemental Data | ||||||||||||||||||||
Net assets, end of period (in thousands) | $36,731 | $35,607 | $35,629 | $20,745 | ||||||||||||||||
Ratio of expenses to average net assets | 1.24 | % | 1.24 | % | 1.24 | % | 1.24 | %(4) | ||||||||||||
Ratio of expenses to average net assets without waivers and expense reimbursements(5) | 1.35 | % | 1.37 | % | 1.62 | % | 2.97 | %(4) | ||||||||||||
Ratio of net investment income to average net assets | 2.35 | % | 2.40 | % | 2.33 | % | 2.65 | %(4) | ||||||||||||
Portfolio turnover rate | 43.59 | % | 62.74 | % | 67.56 | % | 10.71 | %(6) | ||||||||||||
| * | Commencement of operations. |
| (1) | The selected per share data was calculated using the average shares outstanding method for the period. |
| (2) | Amount is less than $0.005 per share. |
| (3) | Total investment return is calculated assuming a purchase of shares on the first day and a sale of shares on the last day of each period reported and includes reinvestment of dividends and distributions, if any. Total returns for periods less than one year are not annualized. Total investment return does not reflect the impact of the maximum front-end sales load of 5.75%. If reflected, the return would be lower. |
| (4) | Annualized. |
| (5) | During the period, certain fees were waived and/or reimbursed. If such fee waivers and/or reimbursements had not occurred, the ratios would have been as indicated (See Note 2). |
| (6) | Not annualized. |
The accompanying notes are an integral part of the financial statements.
14
QUALITY DIVIDEND FUND
Financial Highlights (Continued)
Contained below is per share operating performance data for each Class C share outstanding, total investment return, ratios to average net assets and other supplemental data for the respective period. The total returns in the table represent the rate that an investor would have earned or lost on an investment in the Fund (assuming reinvestment of all dividends and distributions). This information has been derived from information provided in the financial statements and should be read in conjunction with the financial statements and the notes thereto. |
| Class C | ||||||||||||||||
| For the Year Ended April 30, 2017 | For the Year Ended April 30, 2016 | For the Year Ended April 30, 2015 | For the Period October 1, 2013* to April 30, 2014 | |||||||||||||
Per Share Operating Performance | ||||||||||||||||
Net asset value, beginning of period | $ 11.06 | $ 11.73 | $ 11.02 | $10.00 | ||||||||||||
|
|
|
|
|
|
|
| |||||||||
Net investment income(1) | 0.18 | 0.18 | 0.18 | 0.12 | ||||||||||||
Net realized and unrealized gain/(loss) on investments | 1.15 | (0.51 | ) | 0.80 | 0.96 | |||||||||||
|
|
|
|
|
|
|
| |||||||||
Net increase/(decrease) in net assets resulting from operations | 1.33 | (0.33 | ) | 0.98 | 1.08 | |||||||||||
|
|
|
|
|
|
|
| |||||||||
Dividends and distributions to shareholders from: | ||||||||||||||||
Net investment income | (0.15 | ) | (0.20 | ) | (0.13 | ) | (0.06 | ) | ||||||||
Net realized capital gains | — | (0.14 | ) | (0.14 | ) | — | ||||||||||
|
|
|
|
|
|
|
| |||||||||
Total dividends and distributions to shareholders | (0.15 | ) | (0.34 | ) | (0.27 | ) | (0.06 | ) | ||||||||
|
|
|
|
|
|
|
| |||||||||
Redemption fees | — | (2) | — | (2) | — | (2) | — | (2) | ||||||||
|
|
|
|
|
|
|
| |||||||||
Net asset value, end of period | $ 12.24 | $ 11.06 | $ 11.73 | $11.02 | ||||||||||||
|
|
|
|
|
|
|
| |||||||||
Total investment return(3) | 12.07 | % | (2.65 | )% | 8.91 | % | 10.84 | % | ||||||||
Ratio/Supplemental Data | ||||||||||||||||
Net assets, end of period (in thousands) | $26,247 | $23,217 | $20,820 | $8,089 | ||||||||||||
Ratio of expenses to average net assets | 1.99 | % | 1.99 | % | 1.99 | % | 1.99 | %(4) | ||||||||
Ratio of expenses to average net assets without waivers and expense reimbursements(5) | 2.10 | % | 2.12 | % | 2.35 | % | 3.72 | %(4) | ||||||||
Ratio of net investment income to average net assets | 1.58 | % | 1.65 | % | 1.58 | % | 1.46 | %(4) | ||||||||
Portfolio turnover rate | 43.59 | % | 62.74 | % | 67.56 | % | 10.71 | %(6) | ||||||||
| * | Commencement of operations. |
| (1) | The selected per share data was calculated using the average shares outstanding method for the period. |
| (2) | Amount is less than $0.005 per share. |
| (3) | Total investment return is calculated assuming a purchase of shares on the first day and a sale of shares on the last day of each period reported and includes reinvestment of dividends and distributions, if any. Total returns for periods less than one year are not annualized. |
| (4) | Annualized. |
| (5) | During the period, certain fees were waived and/or reimbursed. If such fee waivers and/or reimbursements had not occurred, the ratios would have been as indicated (See Note 2). |
| (6) | Not annualized. |
The accompanying notes are an integral part of the financial statements.
15
QUALITY DIVIDEND FUND
Financial Highlights (Concluded)
Contained below is per share operating performance data for each Institutional Class share outstanding, total investment return, ratios to average net assets and other supplemental data for the respective period. The total returns in the table represent the rate that an investor would have earned or lost on an investment in the Fund (assuming reinvestment of all dividends and distributions). This information has been derived from information provided in the financial statements and should be read in conjunction with the financial statements and the notes thereto. |
| Institutional Class | ||||
| For the Period October 4, 2016* to April 30, 2017 | ||||
Per Share Operating Performance | ||||
Net asset value, beginning of period | $ | 11.33 | ||
|
| |||
Net investment income(1) | 0.16 | |||
Net realized and unrealized gain on investments | 0.83 | |||
|
| |||
Net increase in net assets resulting from operations | 0.99 | |||
|
| |||
Dividends and distributions to shareholders from: | ||||
Net investment income | (0.12 | ) | ||
|
| |||
Total dividends and distributions to shareholders | (0.12 | ) | ||
|
| |||
Redemption fees | — | (2) | ||
|
| |||
Net asset value, end of period | $ | 12.20 | ||
|
| |||
Total investment return(3) | 8.72 | % | ||
Ratio/Supplemental Data | ||||
Net assets, end of period (in thousands) | $ | 8,731 | ||
Ratio of expenses to average net assets | 0.99 | %(4) | ||
Ratio of expenses to average net assets without waivers and expense reimbursements(5) | 1.12 | %(4) | ||
Ratio of net investment income to average net assets | 2.29 | %(4) | ||
Portfolio turnover rate | 43.59 | %(6) | ||
| * | Commencement of operations. |
| (1) | The selected per share data was calculated using the average shares outstanding method for the period. |
| (2) | Amount is less than $0.005 per share. |
| (3) | Total investment return is calculated assuming a purchase of shares on the first day and a sale of shares on the last day of each period reported and includes reinvestment of dividends and distributions, if any. Total returns for periods less than one year are not annualized. |
| (4) | Annualized. |
| (5) | During the period, certain fees were waived and/or reimbursed. If such fee waivers and/or reimbursements had not occurred, the ratios would have been as indicated (See Note 2). |
| (6) | Reflects portfolio turnover of the Fund for the year ended April 30, 2017. |
The accompanying notes are an integral part of the financial statements.
16
QUALITY DIVIDEND FUND
Notes to Financial Statements
April 30, 2017
1. Organization and Significant Accounting Policies
The Quality Dividend Fund (the “Fund”) is a diversified, open-end management investment company registered under the Investment Company Act of 1940, as amended, (the “1940 Act”), which commenced investment operations on September 30, 2013. The Fund is a separate series of FundVantage Trust (the “Trust”) which was organized as a Delaware statutory trust on August 28, 2006. The Trust is a “series trust” authorized to issue an unlimited number of separate series or classes of shares of beneficial interest. Each series is treated as a separate entity for certain matters under the 1940 Act, and for other purposes, and a shareholder of one series is not deemed to be a shareholder of any other series. The Fund offers separate classes of shares; Class A, Class C and Institutional Class shares. Class A shares are subject to a front end sales charge. Front-end sales charges may be reduced or waived under certain circumstances. A contingent deferred sales charge (“CDSC”), as a percentage of the lower of the original purchase price or net asset value at redemption, of 1.00% may be imposed on full or partial redemptions of Class A shares made within twelve months of purchase where (i) $1 million or more of Class A shares was purchased without an initial sales charge and (ii) the selling broker-dealer received a commission for such sale. A CDSC of 1% may apply to Class C shares when shares are redeemed within 12 months after initial purchase.
The Fund is an investment company and follows accounting and reporting guidance in the Financial Accounting Standards Board Accounting Standards Codification Topic 946.
Portfolio Valuation — The Fund’s net asset value (“NAV”) is calculated once daily at the close of regular trading hours on the New York Stock Exchange (“NYSE”) (typically 4:00 p.m. Eastern time) on each day the NYSE is open. Securities held by the Fund are valued using the closing price or the last sale price on a national securities exchange or the National Association of Securities Dealers Automatic Quotation System (“NASDAQ”) market system where they are primarily traded. Equity securities traded in the over-the-counter (“OTC”) market are valued at their closing prices. If there were no transactions on that day, securities traded principally on an exchange or on NASDAQ will be valued at the mean of the last bid and ask prices prior to the market close. Investments in other open-end investment companies are valued based on the NAV of the investment companies (which may use fair value pricing as discussed in their prospectuses). If market quotations are unavailable or deemed unreliable, securities will be valued in accordance with procedures adopted by the FundVantage Trust’s Board of Trustees. Relying on prices supplied by pricing services or dealers or using fair valuation may result in values that are higher or lower than the values used by other investment companies and investors to price the same investments. In the event that market quotes are not readily available, and the security or asset cannot be valued pursuant to one of the valuation methods, the value of the security or asset will be determined in good faith by the Adviser. The Trust has established a Valuation Committee which performs certain functions including the oversight of the Adviser’s fair valuation determinations.
17
QUALITY DIVIDEND FUND
Notes to Financial Statements (Continued)
April 30, 2017
Fair Value Measurements — The inputs and valuation techniques used to measure fair value of the Fund’s investments are summarized into three levels as described in the hierarchy below:
| • | Level 1 — quoted prices in active markets for identical securities; |
| • | Level 2 — other significant observable inputs (including quoted prices for similar securities, interest rates, prepayment speeds, credit risk, etc.); and |
| • | Level 3 — significant unobservable inputs (including the Fund’s own assumptions in determining the fair value of investments). |
The inputs or methodology used for valuing securities are not necessarily an indication of the risk associated with investing in those securities.
The following is a summary of the inputs used, as of April 30, 2017, in valuing the Fund’s investments carried at fair value:
| Total Value at 04/30/17 | Level 1 Quoted Price | Level 2 Other Significant Observable Inputs | Level 3 Significant Unobservable Inputs | |||||||||||||
Common Stocks* | $ | 70,402,012 | $ | 70,402,012 | $ | — | $ | — | ||||||||
Exchange Traded Fund | 181,132 | 181,132 | — | — | ||||||||||||
|
|
|
|
|
|
|
| |||||||||
Total Investments | $ | 70,583,144 | $ | 70,583,144 | $ | — | $ | — | ||||||||
|
|
|
|
|
|
|
| |||||||||
| * | Please refer to Portfolio of Investments for further details on portfolio holdings. |
At the end of each quarter, management evaluates the classification of Levels 1, 2 and 3 assets and liabilities. Various factors are considered, such as changes in liquidity from the prior reporting period; whether or not a broker is willing to execute at the quoted price; the depth and consistency of prices from third party pricing services; and the existence of contemporaneous, observable trades in the market. Additionally, management evaluates the classification of Level 1 and Level 2 assets and liabilities on a quarterly basis for changes in listings or delistings on national exchanges.
Due to the inherent uncertainty of determining the fair value of investments that do not have a readily available market value, the fair value of the Fund’s investments may fluctuate from period to period. Additionally, the fair value of investments may differ significantly from the values that would have been used had a ready market existed for such investments and may differ materially from the values the Fund may ultimately realize. Further, such investments may be subject to legal and other restrictions on resale or otherwise less liquid than publicly traded securities.
18
QUALITY DIVIDEND FUND
Notes to Financial Statements (Continued)
April 30, 2017
For fair valuations using significant unobservable inputs, U.S. generally accepted accounting principles (“U.S. GAAP”) require the Fund to present a reconciliation of the beginning to ending balances for reported market values that presents changes attributable to total realized and unrealized gains or losses, purchase and sales, and transfers in and out of Level 3 during the period. Transfers in and out between Levels are based on values at the end of the period. U.S. GAAP also requires the Fund to disclose amounts and reasons for all transfers in and out of Level 1 and Level 2 fair value measurements. A reconciliation of Level 3 investments is presented only when the Fund had an amount of Level 3 investments at the end of the reporting period that was meaningful in relation to its net assets. The amounts and reasons for all transfers in and out of each Level within the three-tier hierarchy are disclosed when the Fund had an amount of total transfers during the reporting period that was meaningful in relation to its net assets as of the end of the reporting period.
For the year ended April 30, 2017, there were no transfers between Levels 1, 2 and 3 for the Fund.
Use of Estimates — The preparation of financial statements in conformity with U.S. GAAP requires management to make estimates and assumptions that affect the amounts reported in the financial statements and accompanying notes at the date of the financial statements and the reported amounts of revenues and expenses during the period. Actual results could differ from those estimates and those differences could be material.
Investment Transactions, Investment Income and Expenses — Investment transactions are recorded on trade date for financial statement preparation purposes. Realized gains and losses on investments sold are recorded on the identified cost basis. Interest income is recorded on the accrual basis. Dividends are recorded on the ex-dividend date. Estimated components of distributions received from real estate investment trusts may be considered income, return of capital distributions or capital gain distributions. Return of capital distributions are recorded as a reduction of cost of the related investments. Distribution (12b-1) fees and shareholder services fees relating to a specific class are charged directly to that class. General expenses of the Trust are generally allocated to each fund in proportion to its relative daily net assets. Expenses directly attributable to a particular fund in the Trust are charged directly to that fund. The Fund’s investment income, expenses (other than class-specific expenses) and unrealized and realized gains and losses are allocated daily to each class of shares based upon the relative proportion of net assets of each class at the beginning of the day.
MLP Common Units — Master Limited Partnership (“MLP”) common units represent limited partnership interests in the MLP. Common units are generally listed and traded on the U.S. securities exchanges or OTC with their value fluctuating predominantly based on the success of the MLP. Unlike owners of common stock of a corporation, owners of MLP common units have limited voting rights and have no ability to annually elect directors. MLPs generally distribute all available cash flow (cash flow from operations less maintenance capital expenditures) in the form of quarterly distributions. Common unit holders have first priority to receive quarterly cash distributions up to the minimum quarterly distribution and have arrearage
19
QUALITY DIVIDEND FUND
Notes to Financial Statements (Continued)
April 30, 2017
rights. In the event of liquidation, common unit holders have preference over subordinated units, but not debt holders or preferred unit holders, to remaining assets of the MLP.
Dividends and Distributions to Shareholders — Dividends from net investment income are declared and paid quarterly to shareholders. Distributions, if any, of net short-term capital gain and net capital gain (the excess of net long-term capital gain over the short-term capital loss) realized by the Fund, after deducting any available capital loss carryovers are declared and paid to its shareholders annually. Income dividends and capital gain distributions are determined in accordance with U.S. federal income tax regulations, which may differ from U.S. GAAP. These differences may include the treatment of non-taxable dividends, expiring capital loss carryforwards and losses deferred due to wash sales and excise tax regulations. Permanent book and tax basis differences relating to shareholder distributions will result in reclassifications within the components of net assets.
U.S. Tax Status — No provision is made for U.S. income taxes as it is the Fund’s intention to continue to qualify for and elect the tax treatment applicable to regulated investment companies under Subchapter M of the Internal Revenue Code of 1986, as amended (the “Internal Revenue Code”), and make the requisite distributions to its shareholders which will be sufficient to relieve it from U.S. income and excise taxes.
Other — In the normal course of business, the Fund may enter into contracts that provide general indemnifications. The Fund’s maximum exposure under these arrangements is dependent on claims that may be made against the Fund in the future, and therefore, cannot be estimated; however, based on experience, the risk of material loss for such claims is considered remote.
Recent Accounting Pronouncement — In October 2016, the U.S. Securities and Exchange Commission (“SEC”) issued a new rule, Investment Company Reporting Modernization, which, among other provisions, amends Regulation S-X to require standardized, enhanced disclosures, particularly related to derivatives, in investment company financial statements. Compliance with the amendments to Regulation S-X is required for financial statements ending on or after August 1, 2017. Management is currently evaluating the impact that the amendments will have on the Fund’s financial statements and related disclosures.
2. Transactions with Related Parties and Other Service Providers
Choice Financial Partners, Inc., doing business as EquityCompass Strategies (“EquityCompass” or the “Adviser”), serves as investment adviser to the Fund pursuant to an investment advisory agreement with the Trust. For its services, the Adviser is paid a monthly fee at the annual rate of 0.60% of the Fund’s average daily net assets. The Adviser has contractually agreed to reduce its investment advisory fee and/or reimburse certain expenses of the Fund to the extent necessary to ensure that the Fund’s total operating expenses (excluding taxes, any class-specific fees and expenses, “Acquired Fund” fees and expenses, interest, extraordinary items and brokerage commissions) do not exceed 0.99% of average
20
QUALITY DIVIDEND FUND
Notes to Financial Statements (Continued)
April 30, 2017
daily net assets of the Fund (the “Expense Limitation”). The Expense Limitation will remain in effect until September 30, 2017 unless the Board of Trustees approves its earlier termination. The Adviser is entitled to recover, subject to approval by the Board of Trustees, such amounts reduced or reimbursed for a period of up to three (3) years from the year in which the Adviser reduced its compensation and/or assumed expenses for the Fund. The Adviser is permitted to seek reimbursement from the Fund, subject to certain limitations, for fees it waived and Fund expenses it paid to the extent the total annual fund expenses do not exceed the limits described above or any lesser limits in effect at the time of reimbursement. No recoupment will occur unless the Fund’s expenses are below the Expense Limitation amount.
At April 30, 2017, the amount of potential recovery was as follows:
| Expiration | ||||||
April 30, 2018 | April 30, 2019 | April 30, 2020 | Total | |||
$153,735 | $72,020 | $74,701 | $300,456 | |||
For the year ended April 30, 2017, the Adviser earned advisory fees of $393,374 and waived fees of $74,701.
Other Service Providers
BNY Mellon Investment Servicing (US) Inc. (“BNY Mellon”) serves as administrator and transfer agent for the Fund. For providing administrative and accounting services, BNY Mellon is entitled to receive a monthly fee equal to an annual percentage rate of the Fund’s average daily net assets, subject to certain minimum monthly fees. For providing transfer agent services, BNY Mellon is entitled to receive a monthly fee, subject to certain minimum, and out of pocket expenses.
The Bank of New York Mellon (the “Custodian”) provides certain custodial services to the Fund. The Custodian is entitled to receive a monthly fee, subject to certain minimum, and out of pocket expenses.
Foreside Funds Distributors LLC (the “Underwriter”) provides principal underwriting services to the Fund.
The Trust and the Underwriter are parties to an underwriting agreement. The Trust has adopted a distribution plan for Class A and Class C shares in accordance with Rule 12b-1 under the 1940 Act. Pursuant to the Class A and Class C shares plan, the Fund compensates the Underwriter for direct and indirect costs and expenses incurred in connection with advertising, marketing and other distribution services in an amount not to exceed 0.25% and 1.00% (0.75% Rule 12b-1 distribution fee and 0.25% shareholder service fee), respectively, on an annualized basis of the average daily net assets of the Fund’s Class A and Class C shares.
21
QUALITY DIVIDEND FUND
Notes to Financial Statements (Continued)
April 30, 2017
Trustees and Officers
The Trust is governed by its Board of Trustees. The Trustees receive compensation in the form of an annual retainer and per meeting fees for their services to the Trust. The remuneration paid to the Trustees by the Fund during the year ended April 30, 2017 was $11,194. An employee of BNY Mellon serves as the Secretary of the Trust and is not compensated by the Fund or the Trust.
Effective June 1, 2016 and July 1, 2016, JW Fund Management LLC (“JWFM”) provides a Principal Executive Officer and Principal Financial Officer, respectively, to the Trust. JWFM is compensated for the services provided to the Trust. Until May 31, 2016 and June 30, 2016, certain employees of BNY Mellon served as Principal Executive Officer and Principal Financial Officer, respectively, to the Trust. They were not compensated by the Trust or the Fund.
Freeh Group International Solutions, LLC provides the Trust with a Chief Compliance Officer and an Anti-Money Laundering Officer.
3. Investment in Securities
For the year ended April 30, 2017, aggregate purchases and sales of investment securities (excluding short-term investments) of the Fund were as follows:
| Purchases | Sales | |||||||
Investment Securities | $ | 34,448,194 | $ | 28,311,934 | ||||
4. Capital Share Transactions
For the years ended April 30, 2017 and 2016, transactions in capital shares (authorized shares unlimited) were as follows:
| For the Year Ended April 30, 2017 | For the Year Ended April 30, 2016 | |||||||||||||||
| Shares | Amount | Shares | Amount | |||||||||||||
Class A | ||||||||||||||||
Sales | 769,608 | $ | 8,921,476 | 610,113 | $ | 6,694,354 | ||||||||||
Reinvestments | 47,963 | 555,415 | 90,760 | 982,542 | ||||||||||||
Redemption Fees* | — | 636 | — | 1,511 | ||||||||||||
Redemptions | (1,034,323 | ) | (11,877,878 | ) | (526,706 | ) | (5,700,490 | ) | ||||||||
|
|
|
|
|
|
|
| |||||||||
Net increase/(decrease) | (216,752 | ) | $ | (2,400,351 | ) | 174,167 | $ | 1,977,917 | ||||||||
|
|
|
|
|
|
|
| |||||||||
22
QUALITY DIVIDEND FUND
Notes to Financial Statements (Continued)
April 30, 2017
| For the Year Ended April 30, 2017 | For the Year Ended April 30, 2016 | |||||||||||||||
| Shares | Amount | Shares | Amount | |||||||||||||
Class C | ||||||||||||||||
Sales | 452,997 | $ | 5,283,198 | 569,179 | $ | 6,292,787 | ||||||||||
Reinvestments | 21,581 | 250,228 | 52,434 | 570,954 | ||||||||||||
Redemption Fees* | — | 451 | — | 947 | ||||||||||||
Redemptions | (428,881 | ) | (4,991,200 | ) | (297,865 | ) | (3,247,748 | ) | ||||||||
|
|
|
|
|
|
|
| |||||||||
Net increase | 45,697 | $ | 542,677 | 323,748 | $ | 3,616,940 | ||||||||||
|
|
|
|
|
|
|
| |||||||||
Institutional Class** | ||||||||||||||||
Sales | 758,552 | $ | 8,748,719 | — | $ | — | ||||||||||
Reinvestments | 4,931 | 58,781 | — | — | ||||||||||||
Redemption Fees* | — | 108 | — | — | ||||||||||||
Redemptions | (47,807 | ) | (572,507 | ) | — | — | ||||||||||
|
|
|
|
|
|
|
| |||||||||
Net increase | 715,676 | $ | 8,235,101 | — | $ | — | ||||||||||
|
|
|
|
|
|
|
| |||||||||
Total Net Increase | 544,621 | $ | 6,377,427 | 497,915 | $ | 5,594,857 | ||||||||||
|
|
|
|
|
|
|
| |||||||||
| * | There is a 1.00% redemption fee that may be charged on shares redeemed which have been held for 60 days or less. The redemption fees are retained by the Fund for the benefit of the remaining shareholders and recorded as paid-in capital. |
| ** | Institutional Class commenced operations on October 4, 2016. |
5. Federal Tax Information
The Fund has followed the authoritative guidance on accounting for and disclosure of uncertainty in tax positions, which requires the Fund to determine whether a tax position is more likely than not to be sustained upon examination, including resolution of any related appeals or litigation processes, based on the technical merits of the position. Tax positions not deemed to meet the more-likely-than-not threshold would be recorded as tax benefit or expense in the current year. The Fund has determined that there was no effect on the financial statements from following this authoritative guidance. In the normal course of business, the Fund is subject to examination by federal, state and local jurisdictions, where applicable, for tax years for which applicable statutes of limitations have not expired.
Distributions are determined in accordance with federal income tax regulations, which may differ in amount or character from net investment income and realized gains for financial reporting purposes. Accordingly, the character of distributions and composition of net assets for tax purposes may differ from those reflected in the accompanying financial statements. To the extent these differences are permanent, such amounts are reclassified within the components of net assets based on the tax treatment; temporary
23
QUALITY DIVIDEND FUND
Notes to Financial Statements (Continued)
April 30, 2017
differences do not require reclassifications. For the year ended April 30, 2017, these adjustments were to increase accumulated net investment income by $1,156, increase accumulated net realized loss by $954 and to decrease paid-in capital by $202. These adjustments are primarily attributable to disallowed expenses and disposition of partnership. Net investment income, net realized gains and net assets were not affected by these adjustments.
For the year ended April 30, 2017, the tax character of distributions paid by the Fund was $1,157,045 of ordinary income dividends. For the year ended April 30, 2016, the tax character of distributions paid by the Fund was $1,241,301 of ordinary income dividends and $727,202 of long-term capital gains dividends. Distributions from short-term capital gains are treated as ordinary income for federal income tax purposes.
As of April 30, 2017, the components of distributable earnings on a tax basis were as follows:
| Capital Loss Carryforward | Undistributed Ordinary Income | Undistributed Long-Term Gain | Unrealized Appreciation | Qualified Late-Year Losses | Other Book/Tax Differences | |||||
| $(3,521,111) | $367,740 | $— | $10,254,018 | $— | $(8,043) |
The differences between the book and tax basis components of distributable earnings relate primarily to the timing and recognition of income and gains for federal income tax purposes. Short-term capital gains are reported as ordinary income for federal income tax purposes.
As of April 30, 2017, the federal tax cost, aggregate gross unrealized appreciation and depreciation of securities held by the Fund were as follows:
Federal tax cost | $ | 60,329,126 | ||||||
|
| |||||||
Gross unrealized appreciation | $ | 11,151,994 | ||||||
Gross unrealized depreciation | (897,976 | ) | ||||||
|
| |||||||
Net unrealized appreciation | $ | 10,254,018 | ||||||
|
|
Pursuant to federal income tax rules applicable to regulated investment companies, the Fund may elect to treat certain capital losses between November 1 and April 30 and late year ordinary losses ((i) ordinary losses between January 1 and April 30, and (ii) specified ordinary and currency losses between November 1 and April 30) as occurring on the first day of the following tax year. For the year ended April 30, 2017, the Fund had no short-term capital loss deferrals, no long-term capital loss deferrals or ordinary loss deferrals.
Accumulated capital losses represent net capital loss carryforwards as of April 30, 2017 that may be available to offset future realized capital gains and thereby reduce future capital gains distributions. As of April 30, 2017, the Fund’s capital loss carryforwards were $3,521,111, of which $1,380,809 were
24
QUALITY DIVIDEND FUND
Notes to Financial Statements (Concluded)
April 30, 2017
short-term losses and $2,140,302 were long-term losses. All losses will be carried forward indefinitely and will retain their character as short-term and long-term capital losses.
6. Subsequent Events
Management has evaluated the impact of all subsequent events on the Fund through the date the financial statements were issued and has determined that there were no subsequent events requiring recognition or disclosure in the financial statements.
25
QUALITY DIVIDEND FUND
Report of Independent Registered Public Accounting Firm
To the Board of Trustees of FundVantage Trust and
Shareholders of the Quality Dividend Fund
We have audited the accompanying statement of assets and liabilities, including the portfolio of investments, of the Quality Dividend Fund (one of the series constituting FundVantage Trust) (the “Fund”) as of April 30, 2017, and the related statement of operations for the year then ended, the statements of changes in net assets for each of the two years in the period then ended, and the financial highlights for each of the periods indicated therein. These financial statements and financial highlights are the responsibility of the Fund’s management. Our responsibility is to express an opinion on these financial statements and financial highlights based on our audits.
We conducted our audits in accordance with the standards of the Public Company Accounting Oversight Board (United States). Those standards require that we plan and perform the audit to obtain reasonable assurance about whether the financial statements and financial highlights are free of material misstatement. We were not engaged to perform an audit of the Fund’s internal control over financial reporting. Our audits included consideration of internal control over financial reporting as a basis for designing audit procedures that are appropriate in the circumstances, but not for the purpose of expressing an opinion on the effectiveness of the Fund’s internal control over financial reporting. Accordingly, we express no such opinion. An audit also includes examining, on a test basis, evidence supporting the amounts and disclosures in the financial statements and financial highlights, assessing the accounting principles used and significant estimates made by management, and evaluating the overall financial statement presentation. Our procedures included confirmation of securities owned as of April 30, 2017, by correspondence with the custodian. We believe that our audits provide a reasonable basis for our opinion.
In our opinion, the financial statements and financial highlights referred to above present fairly, in all material respects, the financial position of the Quality Dividend Fund (one of the series constituting FundVantage Trust) at April 30, 2017, the results of its operations for the year then ended, the changes in its net assets for each of the two years in the period then ended, and the financial highlights for each of the periods indicated therein in conformity with U.S. generally accepted accounting principles.
Philadelphia, Pennsylvania
June 29, 2017
26
QUALITY DIVIDEND FUND
Shareholder Tax Information
(Unaudited)
The Fund is required by Subchapter M of the Internal Revenue Code to advise its shareholders of the U.S. federal tax status of distributions received by the Fund’s shareholders in respect of such fiscal year. During the fiscal year ended April 30, 2017, the Fund paid $1,157,045 of ordinary income dividends to its shareholders. Dividends from short-term capital gains are treated as ordinary income dividends for federal income tax purposes.
The Fund designates 100.00% of the ordinary income distribution as qualified dividend income pursuant to the Jobs and Growth Tax Relief Reconciliation Act of 2003.
The percentage of ordinary income dividends qualifying for the corporate dividends received deduction is 100.00%.
The percentage of qualified interest income related dividends not subject to withholding tax for non-resident aliens and foreign corporations is 0.00%.
All designations are based on financial information available as of the date of this annual report and, accordingly, are subject to change. For each item, it is the intention of the Fund to designate the maximum amount permitted under the Internal Revenue Code of 1986, as amended, and the regulations thereunder.
Because the Fund’s fiscal year is not the calendar year, another notification will be sent with respect to calendar year 2017. The second notification, which will reflect the amount, if any, to be used by calendar year taxpayers on their U.S. federal income tax returns, will be made in conjunction with Form 1099-DIV and will be mailed in January 2018.
Foreign shareholders will generally be subject to U.S. withholding tax on the amount of their ordinary income dividends. They will generally not be entitled to a foreign tax credit or deduction for the withholding taxes paid by the Fund, if any.
In general, dividends received by tax-exempt recipients (e.g., IRAs and Keoghs) need not be reported as taxable income for U.S. federal income tax purposes. However, some retirement trusts (e.g., corporate, Keogh and 403(b)(7) plans) may need this information for their annual information reporting.
Shareholders are advised to consult their own tax advisers with respect to the tax consequences of their investment in the Fund.
27
QUALITY DIVIDEND FUND
Other Information
(Unaudited)
Proxy Voting
Policies and procedures that the Fund uses to determine how to vote proxies relating to portfolio securities as well as information regarding how the Fund voted proxies relating to portfolio securities for the most recent 12-month period ended June 30 are available without charge, upon request, by calling (888) 201-5799 and on the Securities and Exchange Commission’s (“SEC”) website at http:// www.sec.gov.
Quarterly Portfolio Schedules
The Trust files its complete schedule of portfolio holdings with the SEC for the first and third fiscal quarters of each fiscal year (quarters ended July 31 and January 31) on Form N-Q. The Trust’s Forms N-Q are available on the SEC’s website at http://www.sec.gov and may be reviewed and copied at the SEC’s Public Reference Room in Washington, D.C. Information on the operation of the SEC’s Public Reference Room may be obtained by calling 1-800-SEC-0330.
28
QUALITY DIVIDEND FUND
Privacy Notice
(Unaudited)
The privacy of your personal financial information is extremely important to us. When you open an account with us, we collect a significant amount of information from you in order to properly invest and administer your account. We take very seriously the obligation to keep that information private and confidential, and we want you to know how we protect that important information.
We collect nonpublic personal information about you from applications or other forms you complete and from your transactions with us or our affiliates. We do not disclose information about you, or our former clients, to our affiliates or to service providers or other third parties, except as permitted by law. We share only the information required to properly administer your accounts, which enables us to send transaction confirmations, monthly or quarterly statements, financials and tax forms. Even within FundVantage Trust and its affiliated entities, a limited number of people who actually service accounts will have access to your personal financial information. Further, we do not share information about our current or former clients with any outside marketing groups or sales entities.
To ensure the highest degree of security and confidentiality, FundVantage Trust and its affiliates maintain various physical, electronic and procedural safeguards to protect your personal information. We also apply special measures for authentication of information you request or submit to us on our web site.
If you have questions or comments about our privacy practices, please call us at (888) 201-5799.
29
QUALITY DIVIDEND FUND
Fund Management
(Unaudited)
FundVantage Trust (the “Trust”) is governed by a Board of Trustees (the “Trustees”). The primary responsibility of the Trustees is to represent the interest of the Trust’s shareholders and to provide oversight management of the Trust.
The following tables present certain information regarding the Board of Trustees and officers of the Trust. None of the Trustees are an “interested person” of the Trust, the Adviser, another investment adviser of a series of the Trust, or Foreside Funds Distributors LLC, the principal underwriter of the Trust (“Underwriter”), within the meaning of the 1940 Act and each Trustee is referred to as an “Independent Trustee” and is listed under such heading below. The address of each Trustee and Officer as it relates to the Trust’s business is 301 Bellevue Parkway, 2nd Floor, Wilmington, DE 19809.
The Statement of Additional Information for the Fund contains additional information about the Trustees and is available, without charge, upon request by calling (888) 201-5799.
Name and Date of Birth | Position(s) Held with Trust | Term of Office and Length of Time Served | Principal Occupation(s) During Past Five Years | Number of Trust Complex Trustee | Other Directorships Held by Trustee | |||||
INDEPENDENT TRUSTEES
| ||||||||||
ROBERT J. CHRISTIAN Date of Birth: 2/49 |
Trustee and Chairman of the Board |
Shall serve until death, resignation or removal. Trustee and Chairman since 2007. |
Retired since February 2006; Executive Vice President of Wilmington Trust Company from February 1996 to February 2006; President of Rodney Square Management Corporation (“RSMC”) (investment advisory firm) from 1996 to 2005; Vice President of RSMC from 2005 to 2006.
|
42 |
Optimum Fund Trust (registered investment company with 6 portfolios). | |||||
IQBAL MANSUR Date of Birth: 6/55 |
Trustee |
Shall serve until death, resignation or removal. Trustee since 2007.
|
University Professor, Widener University. |
42 |
None. | |||||
30
QUALITY DIVIDEND FUND
Fund Management (Continued)
(Unaudited)
Name and Date of Birth | Position(s) Held with Trust | Term of Office and Length of Time Served | Principal Occupation(s) During Past Five Years | Number of Funds in Trust Complex Trustee | Other Directorships Held by Trustee | |||||
NICHOLAS M. MARSINI, JR. Date of Birth: 8/55 |
Trustee |
Shall serve until death, resignation or removal. Trustee since 2016. |
Retired since March 2016. President of PNC Bank Delaware from June 2011 to March 2016; Executive Vice President Finance of BNY Mellon from July 2010 to January 2011; Executive Vice President and Chief Financial Officer of PNC Global Investment Servicing from September 1997 to July 2010.
|
42 |
Brinker Capital Destinations Trust (registered investment company with 10 portfolios). | |||||
STEPHEN M. WYNNE Date of Birth: 1/55 |
Trustee |
Shall serve until death, resignation or removal. Trustee since 2009. |
Retired since December 2010; Chief Executive Officer of US Funds Services, BNY Mellon Asset Servicing from July 2010 to December 2010; Chief Executive Officer of PNC Global Investment Servicing from March 2008 to July 2010; President, PNC Global Investment Servicing from 2003 to 2008. | 42 |
Copeland Trust (registered investment company with 2 portfolios). Context Capital Funds (registered investment company with 1 portfolio).
| |||||
NANCY B. WOLCOTT Date of Birth: 11/54 |
Trustee |
Shall serve until death, resignation or removal. Trustee since 2011. |
Retired since May 2014; EVP, Head of GFI Client Service Delivery, BNY Mellon from January 2012 to May 2014; EVP, Head of US Funds Services, BNY Mellon from July 2010 to January 2012; President of PNC Global Investment Servicing from 2008 to July 2010; Chief Operating Officer of PNC Global Investment Servicing from 2007 to 2008; Executive Vice President of PFPC Worldwide Inc. from 2006 to 2007. | 42 | None. |
31
QUALITY DIVIDEND FUND
Fund Management (Concluded)
(Unaudited)
Name and Date of Birth | Position(s) Held with Trust |
Term of Office and Length of Time Served
| Principal Occupation(s) During Past Five Years | |||
EXECUTIVE OFFICERS
| ||||||
JOEL L. WEISS Date of Birth: 1/63 |
President and Chief Executive Officer |
Shall serve until death, resignation or removal. Officer since 2007. |
President of JW Fund Management LLC since June 2016; Vice President and Managing Director of BNY Mellon Investment Servicing (US) Inc. and predecessor firms from 1993 to June 2016.
| |||
T. RICHARD KEYES Date of Birth: 1/57 |
Treasurer and Chief Financial Officer |
Shall serve until death, resignation or removal. Officer since 2016. |
President of TRK Fund Consulting since July 2016; Head of Tax — U.S. Fund Services of BNY Mellon Investment Servicing (US) Inc. and predecessor firms from February 2006 to July 2016.
| |||
VINCENZO A. SCARDUZIO Date of Birth: 4/72 |
Secretary |
Shall serve until death, resignation or removal. Officer since 2012. |
Director and Vice President Regulatory Administration of BNY Mellon Investment Servicing (US) Inc. and predecessor firms since 2001.
| |||
DAVID C. LEBISKY Date of Birth: 5/72 |
Chief Compliance Officer and Anti-Money Laundering Officer |
Shall serve until death, resignation or removal. Officer since 2015. |
President of Lebisky Compliance Consulting LLC since October 2015; Senior Consultant, Freeh Group International Solutions, LLC (a global risk management firm) since 2015; Scotia Institutional Investments US, LP, Director of Regulatory Administration from 2010 to 2014.
| |||
32
[THIS PAGE INTENTIONALLY LEFT BLANK.]
[THIS PAGE INTENTIONALLY LEFT BLANK.]
[THIS PAGE INTENTIONALLY LEFT BLANK.]
Investment Adviser
Choice Financial Partners, Inc.
d/b/a EquityCompass Strategies
501 North Broadway
St. Louis, MO 63102
Administrator
BNY Mellon Investment Servicing (US) Inc.
301 Bellevue Parkway
Wilmington, DE 19809
Transfer Agent
BNY Mellon Investment Servicing (US) Inc.
4400 Computer Drive
Westborough, MA 01581
Principal Underwriter
Foreside Funds Distributors LLC
400 Berwyn Park
899 Cassatt Road
Berwyn, PA 19312
Custodian
The Bank of New York Mellon
225 Liberty Street
New York, NY 10286
Independent Registered Public Accounting Firm
Ernst & Young LLP
One Commerce Square
2005 Market Street, Suite 700
Philadelphia, PA 19103-7096
Legal Counsel
Pepper Hamilton LLP
3000 Two Logan Square
18th and Arch Streets
Philadelphia, PA 19103
QUA-0417

QUALITY DIVIDEND
FUND
of
FundVantage Trust
Class A (QDVAX)
Class C (QDVCX)
Institutional Class (QDVIX)
ANNUAL REPORT
April 30, 2017
This report is submitted for the general information of the shareholders of the Quality Dividend Fund. It is not authorized for distribution unless preceded or accompanied by a current prospectus for the Quality Dividend Fund.
SHELTON INTERNATIONAL SELECT EQUITY FUND
(formerly WHV International Equity Fund)
Annual Investment Adviser’s Report
April 30, 2017
(Unaudited)
Dear Shelton International Select Equity Fund Shareholder,
Since 2009, the team has been investing together using rigorous, bottom-up, fundamental stock selection to deliver attractive risk-adjusted returns for our investors, and now we are excited to announce the successful completion of our first full-year as the managers of the Shelton International Select Equity Fund (the “Fund”).
Our investment philosophy is centered around the concept of the competitive corporate life cycle. Our framework establishes a level global playing field from which to assess a company’s ability to create value for shareholders. We recognize that companies evolve over time, and that the risks they face and the opportunities they capitalize on will differ at the various stages of their development. We directly measure this relationship between a company’s competitive opportunities and challenges, its economic performance, and its valuation in the equity market as it travels along the corporate life cycle. And, in doing so, we believe we have established a solid framework from which to generate more consistent excess returns for our investors over time.
Market Overview
The twelve month period ending April 30, 2017 was a strong one for international equity investors, with the benchmark MSCI All Country World Index (“ACWI”) Ex USA rising 12.63%.
For the first time in several years, global emerging markets outperformed developed international equity markets. In terms of regions, Asia Pacific, excluding Japan, led all areas higher, followed closely by Latin America. The strongest returns by sector were in Information Technology, Materials, and Financials.
Broadly speaking, the overall performance of international equity markets and a return to higher risk assets over the period can best be explained by a handful of macroeconomic or policy-related events. In recent years, following the financial crisis, investors have become increasingly concerned by persistently low (or even negative) interest rates, and a general lack of inflation across developed economies, despite a long period of accommodative monetary policy. On the other hand, in most emerging economies, policymakers had come under increasing pressure to maintain higher than otherwise necessary interest rates in order to contain inflation and protect their more fragile economies from capital outflows as a result of a strengthening US dollar. As a response to these concerns and in response to signs of somewhat weaker US economic growth, the Federal Reserve slowed the pace of interest rate hikes. This subtle change in policy, combined with the decisions by the European Central Bank (ECB) and the Bank of Japan (BOJ) to extend their current programs of quantitative easing, with only modest adjustments, set the stage for a potential peak in the US dollar and a possible return to global synchronized economic growth.
Additionally, over the course of the year, shorter term market performance was somewhat dictated by a series of election outcomes; some expected and some very unexpected. Without a doubt, the outcome of the UK referendum in June was the most important event of the second quarter. Shocking investors, politicians, and pundits alike, through a closely watched and hotly debated vote, the UK turned its back on Europe and chose to exit (or Brexit, as it commonly became known) the European Union. The result left market participants stunned. And, although it is too early for specifics given the actual exit negotiation and withdrawal process will drag on for another two years or more, the broader political and economic ramifications of this decision will be far-reaching for both the UK and Europe. But, what should be expected is that barriers to trade and mobility will rise, while the pound sterling is likely to fall given the uncertainty surrounding the direction of the economy and the size of the UK current account deficit. The final
1
SHELTON INTERNATIONAL SELECT EQUITY FUND
(formerly WHV International Equity Fund)
Annual Investment Adviser’s Report (Continued)
April 30, 2017
(Unaudited)
quarter of 2016 also witnessed a significant and unexpected political event, with the surprise election of Donald Trump as President of the United States. Given the candidate’s unpredictable nature and populist election platform, the implications of this major repudiation of the political establishment are also likely to be deep and far-reaching. Although there remains a general uneasiness around the globe with President Trump and his rhetoric, investors have concluded that, despite his perceived flaws by many and protectionist tendencies, President Trump’s policies of increased infrastructure investment, decreased regulation, and lower corporate taxes are pro-growth and equity investor-friendly, if he is able to enact them. Perhaps most interesting will be their long term implications for inflation and bond yields. On the other hand, following these two significant surprises, the subsequent elections in the Netherlands, Austria, and even France (where right-wing candidate Marie Le Pen made it through to the 2nd round, but eventually lost to newcomer, Emmanuel Macron) resulted as expected.
Also, after a significant recovery in the price of oil throughout the year, more recently the Energy sector has come under considerable pressure as rising shale oil production and swelling inventories have begun to weigh heavily on Energy shares. We anticipate these pressures to continue, and despite recent announcements by OPEC to maintain prior production cuts, we remain skeptical of their likelihood of success.
Lastly, overall corporate earnings have remained remarkably resilient and the environment for economic growth outside the US remains supportive. We continue to see further opportunity for international equity performance.
Performance Review
The Shelton International Select Equity Fund returned +14.89% (Class I Shares–no load), +14.55% (Class A Shares–without load) for the fiscal year ended April 30, 2017, strongly outperforming the Fund’s benchmark, the MSCI ACWI Ex USA, which returned +12.63% during this period.
Shelton International Select Equity Fund Top Contributors and Detractors1
Largest Contributors | Total Return (%) | Contribution (%) |
| |||||||||
KGHM Polska Miedz S.A. | 59.42 | 1.43 | ||||||||||
NetEase, Inc., ADR | 91.42 | 1.14 | ||||||||||
Tencent Holdings Ltd. | 53.23 | 0.92 | ||||||||||
Start Today Co., Ltd. | 49.23 | 0.89 | ||||||||||
ArcelorMittal | 39.63 | 0.82 | ||||||||||
Largest Detractors | Total Return (%) | Contribution (%) | ||||||||||
Mitsubishi UFJ Financial Group, Inc. | 3.35 | -0.40 | ||||||||||
Vestas Wind Systems A/S | -12.95 | -0.44 | ||||||||||
IWG PLC | -23.72 | -0.54 | ||||||||||
Electrolux AB, Class B | -9.53 | -0.60 | ||||||||||
Novo Nordisk A/S, Class B | -24.43 | -0.95 | ||||||||||
The leading contributors to performance can be broadly classified into two sectors, Materials and Technology. The top contributor overall, KGHM, is a Polish-based copper and precious metals mining company. The company suffers from limited production growth and a high cost structure, and as a result it is highly leveraged to changes in the
2
SHELTON INTERNATIONAL SELECT EQUITY FUND
(formerly WHV International Equity Fund)
Annual Investment Adviser’s Report (Continued)
April 30, 2017
(Unaudited)
underlying commodity prices. With the strong recovery in the price of copper over the course of the year, combined with the potential for a loosening of the government’s onerous mineral tax regime, KGHM shares responded very positively. Similarly, ArcelorMittal, the world’s largest steel producer, rallied sharply throughout the year as a result of the combined benefits of rising hot-rolled coil (HRC) steel prices and recent US and EU government actions to raise tariffs on imported steel, most notably from China, and an expected surge in the demand for steel from increased infrastructure spending in the US and Europe.
In terms of Technology, Japan’s leading online fashion retailer, Start Today, has continued to develop the size and scale of its online platform, Zozotown, with further rapid growth in the number of brands, users, and gross merchandise value. The two other big winners in the sector, NetEase and Tencent, are each benefiting from the fast growth of the Chinese internet gaming industry. Tencent, with its popular QQ messaging service, QQ.com portal business, and Weichat (or Weibao) mobile chat service, is already one of China’s largest internet companies and now also the leading online and mobile gaming company. NetEase, its smaller competitor, has risen to be amongst the leaders in the industry through a string of hit releases and heavy investment in in-house content over the last couple of years.
Amongst the largest detractors to performance was Novo Nordisk, the world’s leader in diabetes care. The company, like much of the pharmaceutical industry, had become heavily reliant on price increases to support its growth, profitability, and innovation. Over the course of the year, with the heightened scrutiny of the U.S election, Novo Nordisk succumbed to these political pressures and lowered expectations for future price increases on both existing drugs and new drugs under development. Naturally, this resetting of long term sales and earnings growth weighed heavily on the shares. In addition, IWG PLC and Vestas Wind Systems both performed poorly following the results of the UK referendum and the US Presidential election, respectively, as they were initially perceived to be negatively impacted as a result of the outcome.
We thank you for your investment in the Fund and for your continued support of our firm.
Sincerely,
Shelton Capital Management
| 1 | The holdings identified above may not be representative of the Fund’s current or future investments and are subject to risk. Holdings are provided for informational purposes only and should not be construed as a recommendation to buy or sell the securities mentioned. Direct investors please call 888.948.4685 to obtain the methodology for calculating the top and bottom performance contributing holdings, and a list showing every holding’s contribution to the overall Fund’s performance during the quarter. Past performance does not guarantee future results. |
Nothing presented herein is intended to constitute investment advice and no investment decision should be made based on any information provided herein. Information provided reflects the views of the Fund’s portfolio management team as of a particular time. Such views are subject to change without notice. Any information regarding holdings, sector allocations and other characteristics are for illustrative purposes only and may not be representative of any current or future investments or allocations. Nothing contained herein should be construed as a recommendation to purchase or sell a particular security or follow any strategy or allocation. Any forward looking statements or forecasts are based on assumptions and actual results may vary from any such statements or forecasts. No reliance should
3
SHELTON INTERNATIONAL SELECT EQUITY FUND
(formerly WHV International Equity Fund)
Annual Investment Adviser’s Report (Concluded)
April 30, 2017
(Unaudited)
be placed on any such statements or forecasts when making any investment decision. While the Fund’s portfolio management team has used reasonable efforts to obtain information from reliable sources, we make no representations or warranties as to the accuracy, reliability or completeness of third party information presented herein.
Portfolio composition is subject to change. The current and future portfolio holdings of the Fund are subject to investment risks. The investment return and principal value of an investment in the Fund will fluctuate so that an investor’s shares, when redeemed, may be worth more or less than their original cost.
This letter is intended to assist shareholders in understanding how the Fund performed during the year ended April 30, 2017 and reflects the views of the investment adviser at the time of this writing. Of course, these views may change and do not guarantee the future performance of the Fund or the markets.
4
SHELTON INTERNATIONAL SELECT EQUITY FUND
(formerly WHV International Equity Fund)
Annual Report
Performance Data
April 30, 2017
(Unaudited)
Comparison of Change in Value of $10,000 in Shelton International Select Equity Fund’s
Class A vs. MSCI All Country World Index (“ACWI”) Ex USA
Class A Shares growth of an assumed $10,000 investment is adjusted for the maximum sales charge of 5.75%. This results in a net initial investment of $9,425. Performance of Class C shares, which closed on April 15, 2016, will vary from Class A shares due to difference in class-specific fees.
| Average Annual Total Returns for the Periods Ended April 30, 2017 | ||||||||||||||||||
| 1 Year | 3 Years | 5 Years | Since Inception | |||||||||||||||
Class A Shares (with sales charge)* | 7.96% | -8.74% | -1.43% | 2.20% | ||||||||||||||
Class A Shares (without sales charge)* | 14.55% | -6.93% | -0.25% | 2.98% | ||||||||||||||
MSCI EAFE (Gross) Index | 11.83% | 1.33% | 7.27% | 6.71%** | ||||||||||||||
MSCI ACWI Ex USA*** | 12.63% | 0.83% | 5.14% | 5.60%** | ||||||||||||||
| * | Class A Shares of the Shelton International Select Equity Fund (the “Fund”) commenced operations on July 31, 2009. |
| ** | Benchmark performance is from the inception date of Class A Shares of the Fund (July 31, 2009) only and is not the inception date of the benchmark itself. |
| *** | On Feb 15, 2016, the benchmark for the strategy was changed to the MSCI ACWI Ex USA (from the MSCI EAFE (Gross) Index) to provide a broader reflection of the total international equity universe as MSCI ACWI Ex USA includes both developed and emerging market equities, and MSCI EAFE (Gross) Index is developed markets only. |
The performance data quoted represents past performance and does not guarantee future results. Current performance may be lower or higher. Performance data current to the most recent month-end may be obtained by calling (888) 948-4685. The investment return and principal value of an investment will fluctuate so that shares, when redeemed, may be worth more or less than their original cost. The graph and table do not reflect the deduction of taxes that a shareholder would pay on Fund distributions or the redemption of Fund shares.
5
SHELTON INTERNATIONAL SELECT EQUITY FUND
(formerly WHV International Equity Fund)
Annual Report
Performance Data (Continued)
April 30, 2017
(Unaudited)
Comparison of Change in Value of $500,000 (investment minimum) in Shelton International Select Equity Fund’s
Class I Shares vs. MSCI All Country World Index (“ACWI”) Ex USA
| Average Annual Total Returns for the Periods Ended April 30, 2017 | ||||||||||||||||||
| 1 Year | 3 Years | 5 Years | Since | |||||||||||||||
Class I Shares* | 14.89% | -6.70% | 0.00% | 8.29% | ||||||||||||||
MSCI EAFE (Gross) Index | 11.83% | 1.33% | 7.27% | 8.44%** | ||||||||||||||
MSCI ACWI Ex USA*** | 12.63% | 0.83% | 5.14% | 8.10%** | ||||||||||||||
| * | Class I Shares of the Fund commenced operations on December 19, 2008. |
| ** | Benchmark performance is from the inception date of Class I Shares of the Fund (December 19, 2008) only and is not the inception date of the benchmark itself. |
| *** | On Feb 15, 2016, the benchmark for the strategy was changed to the MSCI ACWI Ex USA (from the MSCI EAFE (Gross) Index) to provide a broader reflection of the total international equity universe as MSCI ACWI Ex USA includes both developed and emerging market equities, and MSCI EAFE (Gross) Index is developed markets only. |
The performance data quoted represents past performance and does not guarantee future results. Current performance may be lower or higher. Performance data current to the most recent month-end may be obtained by calling (888) 948-4685. The investment return and principal value of an investment will fluctuate so that shares, when redeemed, may be worth more or less than their original cost. The graph and table do not reflect the deduction of taxes that a shareholder would pay on Fund distributions or the redemption of Fund shares.
6
SHELTON INTERNATIONAL SELECT EQUITY FUND
(formerly WHV International Equity Fund)
Annual Report
Performance Data (Concluded)
April 30, 2017
(Unaudited)
As stated in the current prospectus dated September 1, 2016 the Fund’s gross “Total Annual Fund Operating Expenses” are 1.27% and 1.02% and the Fund’s “Total Annual Fund Operating Expenses After Fee Waiver and/or Expense Reimbursement” are 1.24% and 0.99% for Class A shares and Class I shares, respectively. These ratios may differ from the actual expenses incurred by the Fund for the period covered by this report. Shelton Capital Management (“Shelton” or the “Adviser”) has contractually agreed to reduce its investment advisory fee and/or reimburse certain expenses of the Fund to the extent necessary to ensure that the Fund’s total operating expenses (excluding taxes, interest, extraordinary items, “Acquired Fund” fees and expenses and brokerage commissions) do not exceed (on an annual basis) 1.24% with respect to Class A shares and 0.99% with respect to Class I shares of average daily net assets of the Fund (the “Expense Limitation”). The Expense Limitation will remain in place until August 31, 2017, unless the Board of Trustees of FundVantage Trust (the “Trust”) approves its earlier termination. Prior to February 15, 2016, the Expense Limitation was (on an annual basis) 1.50% with respect to Class A shares and 1.25% with respect to Class I shares. The Adviser is entitled to recover, subject to approval by the Board of Trustees, such amounts reduced or reimbursed for a period of up to three (3) years from the year in which the Adviser reduced its compensation and/or assumed expenses for the Fund. The Adviser is permitted to seek reimbursement from the Fund, subject to certain limitations, for fees it waived and Fund expenses it paid to the extent the total annual fund operating expenses do not exceed the limits described above or any lesser limits in effect at the time of reimbursement. No recoupment will occur unless the Fund’s expenses are below the Expense Limitation amount that was in effect at the time of the Expense Limitation amount. Total returns would be lower had such fees and/or expenses not been waived and/or reimbursed.
The Fund evaluates its performance as compared to that of the MSCI All Country World Index (“ACWI”) Ex USA, which is a free float-adjusted market capitalization weighted index comprised of over 1,800 large and mid-cap stocks representing 22 of 23 developed market countries (excluding the US) and 23 emerging market countries — approximately 85% of the global equity opportunity set outside the US. It is impossible to invest directly in an index. As of April 30, 2017, the MSCI ACWI Ex USA Index consisted of the following 45 country indexes comprising 22 developed and 23 emerging market country indexes. The developed market country indexes included are: Australia, Austria, Belgium, Canada, Denmark, Finland, France, Germany, Hong Kong, Ireland, Israel, Italy, Japan, Netherlands, New Zealand, Norway, Portugal, Singapore, Spain, Sweden, Switzerland, and the United Kingdom. The emerging market country indexes included are: Brazil, Chile, China, Colombia, Czech Republic, Egypt, Greece, Hungary, India, Indonesia, Korea, Malaysia, Mexico, Peru, Philippines, Poland, Qatar, Russia, South Africa, Taiwan, Thailand, Turkey, and United Arab Emirates. Gross total return indexes do not include any tax credits.
All mutual fund investing involves risk, including possible loss of principal. Investing in foreign securities entails special risks, such as fluctuations in currency exchange rates and possible lax regulation of securities markets and accounting practices.
7
SHELTON INTERNATIONAL SELECT EQUITY FUND
(formerly WHV International Equity Fund)
Fund Expense Disclosure
April 30, 2017
(Unaudited)
As a shareholder of the Fund, you incur two types of costs: (1) transaction costs, including sales charges (loads) on purchase payments, if any, and redemption fees; and (2) ongoing costs, including management fees, distribution and/or service (12b-1) fees, if any, and other Fund expenses. These examples are intended to help you understand your ongoing costs (in dollars) of investing in the Fund and to compare these costs with the ongoing costs of investing in other mutual funds.
These examples are based on an investment of $1,000 invested at the beginning of the six-month period from November 1, 2016 through April 30, 2017 and held for the entire period.
Actual Expenses
The first line of each accompanying table provides information about actual account values and actual expenses. You may use the information in this line, together with the amount you invested, to estimate the expenses that you paid over the period. Simply divide your account value by $1,000 (for example, an $8,600 account value divided by $1,000 = 8.6), then multiply the result by the number in the first line under the heading entitled “Expenses Paid During Period” to estimate the expenses you paid on your account during this period.
Hypothetical Examples for Comparison Purposes
The second line of each accompanying table provides information about hypothetical account values and hypothetical expenses based on the Fund’s actual expense ratio and an assumed rate of return of 5% per year before expenses, which is not your Fund’s actual return. The hypothetical account values and expenses may not be used to estimate the actual ending account balance or expenses you paid for the period. You may use this information to compare the ongoing costs of investing in the Fund and other funds. To do so, compare these 5% hypothetical examples with the 5% hypothetical examples that appear in the shareholder reports of other funds.
Please note that the expenses shown in the accompanying tables are meant to highlight your ongoing costs only and do not reflect any transactional costs, such as sales charges (loads), if any, or redemption fees. Therefore, the second line of each accompanying table is useful in comparing ongoing costs only, and will not help you determine the relative total costs of owning different funds. In addition, if these transactional costs were included, your costs would have been higher.
8
SHELTON INTERNATIONAL SELECT EQUITY FUND
(formerly WHV International Equity Fund)
Fund Expense Disclosure (Concluded)
April 30, 2017
(Unaudited)
| Shelton International Select Equity Fund | ||||||||||||
| Beginning Account Value November 1, 2016 | Ending Account Value April 30, 2017 | Expenses Paid During Period* | ||||||||||
Class A Shares | ||||||||||||
Actual | $1,000.00 | $1,091.90 | $6.43 | |||||||||
Hypothetical (5% return before expenses) | 1,000.00 | 1,018.65 | 6.21 | |||||||||
Class I Shares | ||||||||||||
Actual | $1,000.00 | $1,093.20 | $5.14 | |||||||||
Hypothetical (5% return before expenses) | 1,000.00 | 1,019.89 | 4.96 | |||||||||
| * | Expenses are equal to an annualized expense ratio for the six-month period ended April 30, 2017 of 1.24% and 0.99% for Class A and Class I shares, respectively, for the Fund, multiplied by the average account value over the period, multiplied by the number of days in the most recent period (181), then divided by 365 to reflect the period. The Fund’s ending account values on the first line in the table are based on the actual six-month total returns for the Fund of 9.19% and 9.32% for Class A and Class I shares, respectively. |
9
SHELTON INTERNATIONAL SELECT EQUITY FUND
(formerly WHV International Equity Fund)
Portfolio Holdings Summary Table
April 30, 2017
(Unaudited)
The following table presents a summary by sector of the portfolio holdings of the Fund:
| % of Net Assets | Value | |||||||
COMMON STOCKS: | ||||||||
Commercial Banks | 22.2 | % | $ | 9,580,469 | ||||
Metals & Mining | 8.9 | 3,869,484 | ||||||
Personal Products | 6.6 | 2,875,358 | ||||||
Internet Software & Services | 5.7 | 2,445,724 | ||||||
Machinery | 5.1 | 2,226,728 | ||||||
Internet & Catalog Retail | 4.9 | 2,124,365 | ||||||
Building Products | 4.3 | 1,838,780 | ||||||
Insurance | 3.6 | 1,545,556 | ||||||
Aerospace & Defense | 3.2 | 1,387,407 | ||||||
Professional Services | 3.1 | 1,355,258 | ||||||
Oil, Gas & Consumable Fuels | 3.0 | 1,312,592 | ||||||
Chemicals | 2.9 | 1,252,363 | ||||||
Construction Materials | 2.9 | 1,242,609 | ||||||
Media | 2.9 | 1,239,686 | ||||||
Semiconductors & Semiconductor Equipment | 2.9 | 1,236,818 | ||||||
Food Products | 2.7 | 1,170,385 | ||||||
Trading Companies & Distributors | 2.7 | 1,154,639 | ||||||
Software | 2.5 | 1,085,945 | ||||||
Food & Staples Retailing | 2.4 | 1,057,793 | ||||||
Electronic Equipment, Instruments & Components | 2.1 | 913,414 | ||||||
Diversified Telecommunication Services | 1.4 | 589,828 | ||||||
Other Assets in Excess of Liabilities | 4.0 | 1,719,540 | ||||||
|
|
|
| |||||
NET ASSETS | 100.0 | % | $ | 43,224,741 | ||||
|
|
|
| |||||
Portfolio holdings are subject to change at any time.
The accompanying notes are an integral part of the financial statements.
10
SHELTON INTERNATIONAL SELECT EQUITY FUND
(formerly WHV International Equity Fund)
Portfolio of Investments
April 30, 2017
| Number of Shares | Value | |||||||
COMMON STOCKS — 96.0% |
| |||||||
Australia — 2.3% | ||||||||
BHP Billiton, Ltd. | 55,450 | $ | 987,229 | |||||
|
| |||||||
Belgium — 2.9% | ||||||||
KBC Group NV | 17,445 | 1,260,698 | ||||||
|
| |||||||
Brazil — 2.4% | ||||||||
Banco Bradesco SA, ADR | 100,250 | 1,057,638 | ||||||
|
| |||||||
Canada — 2.4% | ||||||||
Alimentation Couche-Tard, Inc., Class B | 23,000 | 1,057,793 | ||||||
|
| |||||||
China — 5.6% | ||||||||
NetEase, Inc., ADR | 3,820 | 1,013,790 | ||||||
Tencent Holdings Ltd. | 45,700 | 1,431,934 | ||||||
|
| |||||||
| 2,445,724 | ||||||||
|
| |||||||
France — 10.8% | ||||||||
BNP Paribas SA | 18,200 | 1,284,506 | ||||||
L’Oreal SA | 3,430 | 683,084 | ||||||
Thales SA | 13,200 | 1,387,407 | ||||||
TOTAL SA | 25,570 | 1,312,592 | ||||||
|
| |||||||
| 4,667,589 | ||||||||
|
| |||||||
Germany — 1.6% | ||||||||
Beiersdorf AG | 6,800 | 676,269 | ||||||
|
| |||||||
Hong Kong — 3.6% | ||||||||
AIA Group Ltd. | 223,300 | 1,545,556 | ||||||
|
| |||||||
Indonesia — 2.8% | ||||||||
Bank Rakyat Indonesia | ||||||||
Persero Tbk PT | 625,900 | 604,557 | ||||||
Telekomunikasi Indonesia Persero Tbk PT, SP ADR | 18,010 | 589,828 | ||||||
| �� |
|
| ||||||
| 1,194,385 | ||||||||
|
| |||||||
Ireland — 2.9% | ||||||||
CRH PLC | 34,115 | 1,242,609 | ||||||
|
| |||||||
| Number of Shares | Value | |||||||
COMMON STOCKS — (Continued) |
| |||||||
Israel — 2.5% | ||||||||
Nice Ltd., SP ADR | 16,100 | $ | 1,085,945 | |||||
|
| |||||||
Japan — 18.0% | ||||||||
CyberAgent, Inc. | 39,900 | 1,239,686 | ||||||
Daikin Industries Ltd. | 10,100 | 981,958 | ||||||
ITOCHU Corp. | 81,600 | 1,154,639 | ||||||
Komatsu Ltd. | 43,500 | 1,162,387 | ||||||
Mitsubishi UFJ Financial Group, Inc. | 177,100 | 1,122,211 | ||||||
Murata Manufacturing Co., Ltd. | 6,800 | 913,414 | ||||||
Start Today Co., Ltd. | 56,500 | 1,205,613 | ||||||
|
| |||||||
| 7,779,908 | ||||||||
|
| |||||||
Luxembourg — 2.7% | ||||||||
ArcelorMittal* | 148,885 | 1,169,991 | ||||||
|
| |||||||
Netherlands — 6.2% | ||||||||
ING Groep NV | 70,600 | 1,150,748 | ||||||
Unilever NV | 29,020 | 1,516,005 | ||||||
|
| |||||||
| 2,666,753 | ||||||||
|
| |||||||
Norway — 1.6% | ||||||||
Norsk Hydro ASA | 124,000 | 706,632 | ||||||
|
| |||||||
Singapore — 2.5% | ||||||||
DBS Group Holdings Ltd. | 78,950 | 1,090,331 | ||||||
|
| |||||||
Sweden — 2.5% | ||||||||
SKF AB, Class B | 48,500 | 1,064,341 | ||||||
|
| |||||||
Switzerland — 9.9% | ||||||||
dormakaba Holding AG | 1,000 | 856,822 | ||||||
Givaudan SA | 650 | 1,252,363 | ||||||
Glencore PLC | 255,876 | 1,005,632 | ||||||
Nestle SA, SP ADR | 15,200 | 1,170,385 | ||||||
|
| |||||||
| 4,285,202 | ||||||||
|
| |||||||
The accompanying notes are an integral part of the financial statements.
11
SHELTON INTERNATIONAL SELECT EQUITY FUND
(formerly WHV International Equity Fund)
Portfolio of Investments (Concluded)
April 30, 2017
| Number of Shares | Value | |||||||
COMMON STOCKS — (Continued) |
| |||||||
Taiwan — 2.9% |
| |||||||
Taiwan Semiconductor Manufacturing Co., Ltd., SP ADR | 37,400 | $ | 1,236,818 | |||||
|
| |||||||
Thailand — 2.8% |
| |||||||
Bangkok Bank PCL | 221,500 | 1,196,608 | ||||||
|
| |||||||
United Kingdom — 7.1% |
| |||||||
ASOS PLC* | 12,190 | 918,752 | ||||||
Barclays PLC | 296,950 | 813,172 | ||||||
Intertek Group PLC | 25,750 | 1,355,258 | ||||||
|
| |||||||
| 3,087,182 | ||||||||
|
| |||||||
TOTAL COMMON STOCKS | 41,505,201 | |||||||
|
| |||||||
TOTAL INVESTMENTS - 96.0% | 41,505,201 | |||||||
OTHER ASSETS IN EXCESS OF LIABILITIES - 4.0% | 1,719,540 | |||||||
|
| |||||||
NET ASSETS - 100.0% | $ | 43,224,741 | ||||||
|
| |||||||
| * | Non-income producing. |
ADR | American Depository Receipt | |
PLC | Public Limited Company | |
SP ADR | Sponsored American Depository Receipt |
The accompanying notes are an integral part of the financial statements.
12
SHELTON INTERNATIONAL SELECT EQUITY FUND
(formerly WHV International Equity Fund)
Statement of Assets and Liabilities
April 30, 2017
Assets | ||||
Investments, at value (Cost $33,166,254) | $ | 41,505,201 | ||
Cash | 908,528 | |||
Foreign Currency (Cost $631) | 634 | |||
Receivable for investments sold | 149,326 | |||
Receivable for capital shares sold | 299,940 | |||
Dividends and interest receivable | 415,860 | |||
Receivable from Investment Adviser | 17,701 | |||
Prepaid expenses and other assets | 16,672 | |||
|
| |||
Total assets | 43,313,862 | |||
|
| |||
Liabilities | ||||
Payable for administration and accounting fees | 19,830 | |||
Payable for transfer agent fees | 19,000 | |||
Payable for capital shares redeemed | 16,113 | |||
Payable for audit fees | 16,000 | |||
Payable for legal fees | 8,500 | |||
Payable for printing fees | 5,000 | |||
Payable for custodian fees | 2,865 | |||
Accrued expenses | 1,813 | |||
|
| |||
Total liabilities | 89,121 | |||
|
| |||
Net Assets | $ | 43,224,741 | ||
|
| |||
Net Assets Consisted of: | ||||
Capital stock, $0.01 par value | $ | 23,977 | ||
Paid-in capital | 97,320,666 | |||
Accumulated net investment income | 672,089 | |||
Accumulated net realized loss from investments and foreign currency transactions | (63,130,189 | ) | ||
Net unrealized appreciation on investments and assets and liabilities denominated in foreign currency | 8,338,198 | |||
|
| |||
Net Assets | $ | 43,224,741 | ||
|
|
Class A Shares: | ||||
Net asset value and redemption price per share ($4,487,871 / 249,080 shares) | $ | 18.02 | ||
|
| |||
Maximum offering price per share (100/94.25 of $18.02) | $ | 19.12 | ||
|
| |||
Class I Shares: | ||||
Net asset value, offering and redemption price per share ($38,736,870 / 2,148,642 shares) | $ | 18.03 | ||
|
| |||
The accompanying notes are an integral part of the financial statements.
13
SHELTON INTERNATIONAL SELECT EQUITY FUND
(formerly WHV International Equity Fund)
Statement of Operations
For the Year Ended April 30, 2017
Investment Income | ||||
Dividends | $ | 1,156,688 | ||
Less: foreign taxes withheld | (110,604 | ) | ||
|
| |||
Total investment income | 1,046,084 | |||
|
| |||
Expenses | ||||
Advisory fees (Note 2) | 335,314 | |||
Administration and accounting fees (Note 2) | 106,542 | |||
Registration and filing fees | 91,612 | |||
Transfer agent fees (Note 2) | 62,226 | |||
Legal fees | 53,593 | |||
Printing and shareholder reporting fees | 35,187 | |||
Custodian fees (Note 2) | 33,123 | |||
Trustees’ and officers’ fees (Note 2) | 23,486 | |||
Audit fees | 20,280 | |||
Distribution fees (Class A) (Note 2) | 15,348 | |||
Other expenses | 36,000 | |||
|
| |||
Total expenses before waivers and reimbursements | 812,711 | |||
|
| |||
Less: waivers and reimbursements (Note 2) | (348,768 | ) | ||
|
| |||
Net expenses after waivers and reimbursements | 463,943 | |||
|
| |||
Net investment income | 582,141 | |||
|
| |||
Net realized and unrealized gain/(loss) from investments: | ||||
Net realized gain from investments | 1,801,946 | |||
Net realized gain from foreign currency transactions | 14,141 | |||
Net change in unrealized appreciation/(depreciation) on investments | 3,540,364 | |||
Net change in unrealized appreciation/(depreciation) on foreign currency transactions | (40,594 | ) | ||
|
| |||
Net realized and unrealized gain on investments | 5,315,857 | |||
|
| |||
Net increase in net assets resulting from operations | $ | 5,897,998 | ||
|
|
The accompanying notes are an integral part of the financial statements.
14
SHELTON INTERNATIONAL SELECT EQUITY FUND
(formerly WHV International Equity Fund)
Statements of Changes in Net Assets
| For the Year Ended April 30, 2017 | For the Year Ended April 30, 2016 | |||||||
Increase/(decrease) in net assets from operations: | ||||||||
Net investment income | $ | 582,141 | $ | 2,810,425 | ||||
Net realized gain/(loss) from investments | 1,816,087 | (54,124,589 | ) | |||||
Net change in unrealized appreciation/(depreciation) on investments | 3,499,770 | (39,681,193 | ) | |||||
|
|
|
| |||||
Net increase/(decrease) in net assets resulting from operations | 5,897,998 | (90,995,357 | ) | |||||
|
|
|
| |||||
Less Dividends and Distributions to Shareholders from: | ||||||||
Net investment income: | ||||||||
Class A Shares | (52,217 | ) | (525,377 | ) | ||||
Class C Shares | — | (3,396 | ) | |||||
Class I Shares | (505,743 | ) | (5,081,580 | ) | ||||
|
|
|
| |||||
Total net investment income | (557,960 | ) | (5,610,353 | ) | ||||
|
|
|
| |||||
Net decrease in net assets from dividends and distributions to shareholders | (557,960 | ) | (5,610,353 | ) | ||||
|
|
|
| |||||
Decrease in Net Assets Derived from Capital Share Transactions (Note 4) | (14,737,108 | ) | (252,136,993 | ) | ||||
|
|
|
| |||||
Total decrease in net assets | (9,397,070 | ) | (348,742,703 | ) | ||||
|
|
|
| |||||
Net assets | ||||||||
Beginning of year | 52,621,811 | 401,364,514 | ||||||
|
|
|
| |||||
End of year | $ | 43,224,741 | $ | 52,621,811 | ||||
|
|
|
| |||||
Accumulated net investment income, end of year | $ | 672,089 | $ | 406,734 | ||||
|
|
|
| |||||
The accompanying notes are an integral part of the financial statements.
15
SHELTON INTERNATIONAL SELECT EQUITY FUND
(formerly WHV International Equity Fund)
Financial Highlights
Contained below is per share operating performance data for Class A Shares outstanding, total investment return, ratios to average net assets and other supplemental data for the respective periods. The total returns in the table represent the rate that an investor would have earned or lost on an investment in the Fund (assuming reinvestment of all dividends and distributions). This information has been derived from information provided in the financial statements and should be read in conjunction with the financial statements and the notes thereto.
| Class A Shares | ||||||||||||||||||||
| For the Year Ended April 30, 2017 | For the Year Ended April 30, 2016 | For the Year Ended April 30, 2015 | For the Year Ended April 30, 2014 | For the Year Ended April 30, 2013 | ||||||||||||||||
Per Share Operating Performance | ||||||||||||||||||||
Net asset value, beginning of year | $ | 15.88 | $ | 21.16 | $ | 23.48 | $ | 20.54 | $ | 19.30 | ||||||||||
|
|
|
|
|
|
|
|
|
| |||||||||||
Net investment income(1) | 0.17 | 0.19 | 0.17 | 0.14 | 0.05 | |||||||||||||||
Net realized and unrealized gain/(loss) on investments | 2.13 | (4.97 | ) | (2.34 | ) | 2.92 | 1.22 | |||||||||||||
|
|
|
|
|
|
|
|
|
| |||||||||||
Net increase/(decrease) in net assets resulting from operations | 2.30 | (4.78 | ) | (2.17 | ) | 3.06 | 1.27 | |||||||||||||
|
|
|
|
|
|
|
|
|
| |||||||||||
Dividends and distributions to shareholders from: | ||||||||||||||||||||
Net investment income | (0.16 | ) | (0.50 | ) | (0.15 | ) | (0.09 | ) | (0.03 | ) | ||||||||||
Net realized capital gains | — | — | — | (0.03 | ) | — | ||||||||||||||
|
|
|
|
|
|
|
|
|
| |||||||||||
Total dividends and distributions to shareholders | (0.16 | ) | (0.50 | ) | (0.15 | ) | (0.12 | ) | (0.03 | ) | ||||||||||
|
|
|
|
|
|
|
|
|
| |||||||||||
Redemption fees | — | — | — | (2) | — | (2) | — | (2) | ||||||||||||
|
|
|
|
|
|
|
|
|
| |||||||||||
Net asset value, end of year | $ | 18.02 | $ | 15.88 | $ | 21.16 | $ | 23.48 | $ | 20.54 | ||||||||||
|
|
|
|
|
|
|
|
|
| |||||||||||
Total investment return(3) | 14.55 | % | (22.51 | )% | (9.18 | )% | 14.90 | % | 6.61 | % | ||||||||||
Ratio/Supplemental Data | ||||||||||||||||||||
Net assets, end of year (in thousands) | $ | 4,488 | $ | 8,488 | $ | 31,583 | $ | 46,435 | $ | 53,447 | ||||||||||
Ratio of expenses to average net assets | 1.24 | % | 1.48 | % | 1.45 | % | 1.49 | % | 1.50 | % | ||||||||||
Ratio of expenses to average net assets without waivers, expense reimbursements and/or recoupment, if any(4) | 2.02 | % | 1.53 | % | 1.45 | % | 1.45 | % | 1.46 | % | ||||||||||
Ratio of net investment income to average net assets | 1.06 | % | 1.11 | % | 0.75 | % | 0.67 | % | 0.27 | % | ||||||||||
Portfolio turnover rate | 40.51 | % | 40.06 | % | 7.76 | % | 5.65 | % | 5.21 | % | ||||||||||
| (1) | The selected per share data was calculated using the average shares outstanding method for the year. |
| (2) | Amount is less than $0.005 per share. |
| (3) | Total investment return is calculated assuming a purchase of shares on the first day and a sale of shares on the last day of each period reported and includes reinvestment of dividends and distributions, if any. Total investment return does not reflect the impact of the maximum front-end sales load of 5.75%. If reflected, the return would be lower. |
| (4) | During the period, certain fees were waived and/or reimbursed; or recouped, if any. If such fee waivers and/or reimbursements or recoupments had not occurred, the ratios would have been as indicated (See Note 2). |
The accompanying notes are an integral part of the financial statements.
16
SHELTON INTERNATIONAL SELECT EQUITY FUND
(formerly WHV International Equity Fund)
Financial Highlights (Concluded)
Contained below is per share operating performance data for Class I Shares outstanding, total investment return, ratios to average net assets and other supplemental data for the respective periods. The total returns in the table represent the rate that an investor would have earned or lost on an investment in the Fund (assuming reinvestment of all dividends and distributions). This information has been derived from information provided in the financial statements and should be read in conjunction with the financial statements and the notes thereto.
| Class I Shares | ||||||||||||||||||||
| For the Year Ended April 30, 2017 | For the Year Ended April 30, 2016 | For the Year Ended April 30, 2015 | For the Year Ended April 30, 2014 | For the Year Ended April 30, 2013 | ||||||||||||||||
Per Share Operating Performance | ||||||||||||||||||||
Net asset value, beginning of year | $ | 15.90 | $ | 21.20 | $ | 23.53 | $ | 20.59 | $ | 19.35 | ||||||||||
|
|
|
|
|
|
|
|
|
| |||||||||||
Net investment income(1) | 0.22 | 0.25 | 0.24 | 0.20 | 0.11 | |||||||||||||||
Net realized and unrealized gain/(loss) on investments | 2.13 | (5.01 | ) | (2.36 | ) | 2.92 | 1.22 | |||||||||||||
|
|
|
|
|
|
|
|
|
| |||||||||||
Net increase/(decrease) in net assets resulting from operations | 2.35 | (4.76 | ) | (2.12 | ) | 3.12 | 1.33 | |||||||||||||
|
|
|
|
|
|
|
|
|
| |||||||||||
Dividends and distributions to shareholders from: | ||||||||||||||||||||
Net investment income | (0.22 | ) | (0.54 | ) | (0.21 | ) | (0.15 | ) | (0.09 | ) | ||||||||||
Net realized capital gains | — | — | — | (0.03 | ) | — | ||||||||||||||
|
|
|
|
|
|
|
|
|
| |||||||||||
Total dividends and distributions to shareholders | (0.22 | ) | (0.54 | ) | (0.21 | ) | (0.18 | ) | (0.09 | ) | ||||||||||
|
|
|
|
|
|
|
|
|
| |||||||||||
Redemption fees | — | — | — | (2) | — | (2) | — | (2) | ||||||||||||
|
|
|
|
|
|
|
|
|
| |||||||||||
Net asset value, end of year | $ | 18.03 | $ | 15.90 | $ | 21.20 | $ | 23.53 | $ | 20.59 | ||||||||||
|
|
|
|
|
|
|
|
|
| |||||||||||
Total investment return(3) | 14.89 | % | (22.36 | )% | (8.94 | )% | 15.18 | % | 6.88 | % | ||||||||||
Ratio/Supplemental Data | ||||||||||||||||||||
Net assets, end of year (in thousands) | $ | 38,737 | $ | 44,133 | $ | 369,610 | $ | 347,791 | $ | 320,190 | ||||||||||
Ratio of expenses to average net assets | 0.99 | % | 1.23 | % | 1.20 | % | 1.24 | % | 1.25 | % | ||||||||||
Ratio of expenses to average net assets without waivers, expense reimbursements and/or recoupment, if any(4) | 1.76 | % | 1.28 | % | 1.20 | % | 1.20 | % | 1.21 | % | ||||||||||
Ratio of net investment income to average net assets | 1.32 | % | 1.36 | % | 1.11 | % | 0.92 | % | 0.58 | % | ||||||||||
Portfolio turnover rate | 40.51 | % | 40.06 | % | 7.76 | % | 5.65 | % | 5.21 | % | ||||||||||
| (1) | The selected per share data was calculated using the average shares outstanding method for the year. |
| (2) | Amount is less than $0.005 per share. |
| (3) | Total investment return is calculated assuming a purchase of shares on the first day and a sale of shares on the last day of each period reported and includes reinvestment of dividends and distributions, if any. |
| (4) | During the period, certain fees were waived and/or reimbursed; or recouped, if any. If such fee waivers and/or reimbursements or recoupments had not occurred, the ratios would have been as indicated (See Note 2). |
The accompanying notes are an integral part of the financial statements.
17
SHELTON INTERNATIONAL SELECT EQUITY FUND
(formerly WHV International Equity Fund)
Notes to Financial Statements
April 30, 2017
1. Organization and Significant Accounting Policies
The Shelton International Select Equity Fund, (formerly WHV International Equity Fund), (the “Fund”) is a diversified, open-end management investment company registered under the Investment Company Act of 1940, as amended, (the “1940 Act”), and commenced investment operations on December 19, 2008. The Fund is a separate series of FundVantage Trust (the “Trust”) which was organized as a Delaware statutory trust on August 28, 2006. The Trust is a “series trust” authorized to issue an unlimited number of separate series or classes of shares of beneficial interest. Each series is treated as a separate entity for certain matters under the 1940 Act, and for other purposes, and a shareholder of one series is not deemed to be a shareholder of any other series. The Fund offers separate classes of shares: Class A and Class I Shares. Class A Shares are sold subject to a front-end sales charge. Front-end sales charges may be reduced or waived under certain circumstances. A contingent deferred sales charge (“CDSC”) of up to 1.00% may apply for investments of $1 million or more of Class A Shares of each Fund (and therefore no initial sales charge was paid) and shares are redeemed within 18 months after initial purchase. The CDSC shall not apply to those purchases of Class A Shares of $1 million or more where the selling broker-dealer did not receive a commission. Class C Shares closed on April 15, 2016.
WHV Investments, Inc. (“WHV”), the Fund’s former investment adviser, determined to exit the mutual fund investment advisory business. On June 23, 2016, Shelton Capital Management (“Shelton”) announced an agreement pursuant to which WHV’s in-house Rivington portfolio management team would become employees of Shelton and continue to manage the Fund. Effective July 18, 2016, Shelton succeeded WHV as the investment adviser to the Fund.
At a meeting of the Board of Trustees (the “Board”) of the Trust held on September 29, 2016, the Board approved, upon the recommendation of its current investment adviser, Shelton, an Agreement and Plan of Reorganization between the Trust, on behalf of the Fund, into a newly-created series of the SCM Trust, a Massachusetts business trust. A special meeting of shareholders of the Fund is scheduled for July 14, 2017 to approve the Agreement and Plan of Reorganization.
The Fund is an investment company and follows accounting and reporting guidance in the Financial Accounting Standards Board Accounting Standards Codification Topic 946.
Portfolio Valuation — The Fund’s net asset value (“NAV”) is calculated once daily at the close of regular trading hours on the New York Stock Exchange (“NYSE”) (typically 4:00 p.m. Eastern time) on each day the NYSE is open. Securities held by the Fund are valued using the closing price or the last sale price on national securities exchange or the National Association of Securities Dealers Automatic Quotation System (“NASDAQ”) market system where they are primarily traded. The Fund’s equity securities listed on any national or foreign exchange market system will be valued at the last sale price. Equity securities traded in the over-the-counter market are valued at their closing sale or official closing price. If there were no transactions on that day, securities traded principally on an exchange will be valued at
18
SHELTON INTERNATIONAL SELECT EQUITY FUND
(formerly WHV International Equity Fund)
Notes to Financial Statements (Continued)
April 30, 2017
the mean of the last bid and ask prices prior to the market close. Prices for equity securities normally are supplied by an independent pricing service approved by the Trust’s Board of Trustees. Fixed income securities are valued based on market quotations, which are furnished by an independent pricing service. Fixed income securities having remaining maturities of 60 days or less are generally valued at amortized cost, provided such amount approximates fair value. Any assets held by the Fund that are denominated in foreign currencies are valued daily in U.S. dollars at the foreign currency exchange rates that are prevailing at the time that the Fund determines the daily NAV per share. Foreign securities may trade on weekends or other days when the Fund does not calculate NAV. As a result, the market value of these investments may change on days when you cannot buy or sell shares of the Fund. Investments in other open-end investment companies are valued based on the NAV of such investment companies (which may use fair value pricing as disclosed in their prospectuses). Securities that do not have a readily available current market value are valued in accordance with procedures adopted by the Trust’s Board of Trustees. The Board of Trustees has adopted methods for valuing securities and other assets in circumstances where market quotes are not readily available and has delegated to Shelton Capital Management (“Shelton” or the “Adviser”) the responsibility for applying the valuation methods. Relying on prices supplied by pricing services or dealers or using fair valuation may result in values that are higher or lower than the values used by other investment companies and investors to price the same investments. In the event that market quotes are not readily available, and the security or asset cannot be valued pursuant to one of the valuation methods, the value of the security or asset will be determined in good faith by the Adviser. The Trust has established a Valuation Committee which performs certain functions including the oversight of the Adviser’s fair valuation determinations.
Fair Value Measurements — The inputs and valuation techniques used to measure fair value of the Fund’s investments are summarized into three levels as described in the hierarchy below:
• | Level 1 | — | quoted prices in active markets for identical securities; | |||
• | Level 2 | — | other significant observable inputs (including quoted prices for similar securities, interest rates, prepayment speeds, credit risk, etc.); and | |||
• | Level 3 | — | significant unobservable inputs (including the Fund’s own assumptions in determining the fair value of investments). | |||
The inputs or methodology used for valuing securities are not necessarily an indication of the risk associated with investing in those securities.
Securities listed on a non-U.S. exchange are generally fair valued daily by an independent fair value pricing service approved by the Board of Trustees and categorized as Level 2 investments within the hierarchy. The fair valuations for these securities may not be the same as quoted or published prices of the securities on their primary markets. Securities for which daily fair value prices from the independent
19
SHELTON INTERNATIONAL SELECT EQUITY FUND
(formerly WHV International Equity Fund)
Notes to Financial Statements (Continued)
April 30, 2017
fair value pricing service are not available are generally valued at the last quoted sale price at the close of an exchange on which the security is traded and categorized as Level 1 investments within the hierarchy. Values of foreign securities, currencies, and other assets and liabilities denominated in foreign currencies are translated into U.S. dollars at the exchange rate of said currencies against the U.S. dollar, as of Valuation Time, as provided by an independent pricing service approved by the Board of Trustees.
The following is a summary of the inputs used, as of April 30, 2017, in valuing the Fund’s investments carried at fair value:
| Total Value at 04/30/17 | Level 1 Quoted Price | Level 2 Other Significant Observable Inputs | Level 3 Significant Unobservable Inputs | |||||||||||||
Common Stocks: | ||||||||||||||||
Australia | $ | 987,229 | $ | — | $ | 987,229 | $ | — | ||||||||
Belgium | 1,260,698 | — | 1,260,698 | — | ||||||||||||
Brazil | 1,057,638 | 1,057,638 | — | — | ||||||||||||
Canada | 1,057,793 | 1,057,793 | — | — | ||||||||||||
China | 2,445,724 | 1,013,790 | 1,431,934 | — | ||||||||||||
France | 4,667,589 | — | 4,667,589 | — | ||||||||||||
Germany | 676,269 | — | 676,269 | — | ||||||||||||
Hong Kong | 1,545,556 | — | 1,545,556 | — | ||||||||||||
Indonesia | 1,194,385 | 589,828 | 604,557 | — | ||||||||||||
Ireland | 1,242,609 | — | 1,242,609 | — | ||||||||||||
Israel | 1,085,945 | 1,085,945 | — | — | ||||||||||||
Japan | 7,779,908 | — | 7,779,908 | — | ||||||||||||
Luxembourg | 1,169,991 | — | 1,169,991 | — | ||||||||||||
Netherlands | 2,666,753 | 1,516,005 | 1,150,748 | — | ||||||||||||
Norway | 706,632 | — | 706,632 | — | ||||||||||||
Singapore | 1,090,331 | — | 1,090,331 | — | ||||||||||||
Sweden | 1,064,341 | — | 1,064,341 | — | ||||||||||||
Switzerland | 4,285,202 | 1,170,385 | 3,114,817 | — | ||||||||||||
Taiwan | 1,236,818 | 1,236,818 | — | — | ||||||||||||
Thailand | 1,196,608 | — | 1,196,608 | — | ||||||||||||
United Kingdom | 3,087,182 | — | 3,087,182 | — | ||||||||||||
|
|
|
|
|
|
|
| |||||||||
Total Investments | $ | 41,505,201 | $ | 8,728,202 | $ | 32,776,999 | $ | — | ||||||||
|
|
|
|
|
|
|
| |||||||||
At the end of each quarter, management evaluates the classification of Levels 1, 2 and 3 assets and liabilities. Various factors are considered such as changes in liquidity from the prior reporting period;
20
SHELTON INTERNATIONAL SELECT EQUITY FUND
(formerly WHV International Equity Fund)
Notes to Financial Statements (Continued)
April 30, 2017
whether or not a broker is willing to execute at the quoted price; the depth and consistency of prices from third party pricing services; and the existence of contemporaneous, observable trades in the market. Additionally, management evaluates the classification of Level 1 and Level 2 assets and liabilities on a quarterly basis for changes in listings or delistings on national exchanges.
Due to the inherent uncertainty of determining the fair value of investments that do not have a readily available market value, the fair value of the Fund’s investments may fluctuate from period to period. Additionally, the fair value of investments may differ significantly from the values that would have been used had a ready market existed for such investments and may differ materially from the values the Fund may ultimately realize. Further, such investments may be subject to legal and other restrictions on resale or otherwise less liquid than publicly traded securities.
For fair valuations using significant unobservable inputs, U.S. generally accepted accounting principles (“U.S. GAAP”) require the Fund to present a reconciliation of the beginning to ending balances for reported market values that presents changes attributable to total realized and unrealized gains or losses, purchase and sales, and transfers in and out of Level 3 during the period. Transfers in and out between Levels are based on values at the end of the period. U.S. GAAP also requires the Fund to disclose amounts and reasons for all transfers in and out of Level 1 and Level 2 fair value measurements. A reconciliation of Level 3 investments is presented only when the Fund had an amount of Level 3 investments at the end of the reporting period that was meaningful in relation to its net assets. The amounts and reasons for all transfers in and out of each Level within the three-tier hierarchy are disclosed when the Fund had an amount of total transfers during the reporting period that was meaningful in relation to its net assets as of the end of the reporting period.
For the year ended April 30, 2017, there were no transfers between Levels 1, 2 and 3 for the Fund.
Use of Estimates — The preparation of financial statements in conformity with U.S. GAAP requires management to make estimates and assumptions that affect the amounts reported in the financial statements and accompanying notes at the date of the financial statements and the reported amounts of revenues and expenses during the period. Actual results could differ from those estimates and those differences could be material.
Investment Transactions, Investment Income and Expenses — Investment transactions are recorded on trade date for financial statement preparation purposes. Realized gains and losses on investments sold are recorded on the identified cost basis. Interest income is recorded on the accrual basis. Dividends are recorded on the ex-dividend date. Distribution (12b-1) fees and shareholder services fees relating to a specific class are charged directly to that class. Fund level expenses common to all classes, investment income and realized and unrealized gains and losses on investments are allocated to each class based upon the relative daily net assets of each class. General expenses of the Trust are generally allocated to each fund in proportion to its relative daily net assets. Expenses directly attributable to a particular
21
SHELTON INTERNATIONAL SELECT EQUITY FUND
(formerly WHV International Equity Fund)
Notes to Financial Statements (Continued)
April 30, 2017
fund in the Trust are charged directly to that fund. The Fund’s investment income, expenses (other than class specific expenses) and unrealized and realized gains and losses are allocated daily to each class of shares based upon the relative proportion of net assets of each class at the beginning of the day.
Foreign Currency Translation — Assets and liabilities initially expressed in non-U.S. currencies are translated into U.S. dollars based on the applicable exchange rates at the date of the last business day of the financial statement period. Purchases and sales of securities, interest income, dividends, variation margin received and expenses denominated in foreign currencies are translated into U.S. dollars at the exchange rates in effect on the transaction date.
The Fund does not separately report the effect of changes in foreign exchange rates from changes in market prices of securities held. Such changes are included with the net realized gain or loss and change in unrealized appreciation or depreciation on investment securities in the Statement of Operations. Other foreign currency transactions resulting in realized and unrealized gain or loss are reported separately as net realized gain or loss and change in unrealized appreciation or depreciation on foreign currencies in the Statement of Operations.
Dividends and Distributions to Shareholders — Dividends from net investment income and distributions from net realized capital gains, if any, are declared and paid at least annually to shareholders and are recorded on ex-date. Income dividends and capital gain distributions are determined in accordance with U.S. federal income tax regulations, which may differ from U.S. GAAP. These differences may include the treatment of non-taxable dividends, expiring capital loss carryforwards and losses deferred due to wash sales and excise tax regulations. Permanent book and tax basis differences relating to shareholder distributions will result in reclassifications within the components of net assets.
U.S. Tax Status — No provision is made for U.S. income taxes as it is the Fund’s intention to continue to qualify for and elect the tax treatment applicable to regulated investment companies under Subchapter M of the Internal Revenue Code of 1986, as amended (the “Internal Revenue Code”), and make the requisite distributions to its shareholders which will be sufficient to relieve it from U.S. income and excise taxes.
Other — In the normal course of business, the Fund may enter into contracts that provide general indemnifications. The Fund’s maximum exposure under these arrangements is dependent on claims that may be made against the Fund in the future, and, therefore, cannot be estimated; however, based on experience, the risk of material loss for such claims is considered remote.
Currency Risk — The Fund invests in securities of foreign issuers, including American Depositary Receipts. These markets are subject to special risks associated with foreign investments not typically associated with investing in U.S. markets. Because the foreign securities in which the Fund may invest generally trade in currencies other than the U.S. dollar, changes in currency exchange rates will affect
22
SHELTON INTERNATIONAL SELECT EQUITY FUND
(formerly WHV International Equity Fund)
Notes to Financial Statements (Continued)
April 30, 2017
the Fund’s NAV, the value of dividends and interest earned and gains and losses realized on the sale of securities. Because the NAV for the Fund is determined on the basis of U.S. dollars, the Fund may lose money by investing in a foreign security if the local currency of a foreign market depreciates against the U.S. dollar, even if the local currency value of the Fund’s holdings goes up. Generally, a strong U.S. dollar relative to these other currencies will adversely affect the value of the Fund’s holdings in foreign securities.
Foreign Securities Market Risk — Securities of many non-U.S. companies may be less liquid and their prices more volatile than securities of comparable U.S. companies. Securities of companies traded in many countries outside the U.S., particularly emerging markets countries, may be subject to further risks due to the inexperience of local investment professionals and financial institutions, the possibility of permanent or temporary termination of trading and greater spreads between bid and asked prices of securities. In addition, non-U.S. stock exchanges and investment professionals are subject to less governmental regulation, and commissions may be higher than in the United States. Also, there may be delays in the settlement of non-U.S. stock exchange transactions.
Recent Accounting Pronouncement — In October 2016, the U.S. Securities and Exchange Commission (“SEC”) issued a new rule, Investment Company Reporting Modernization, which, among other provisions, amends Regulation S-X to require standardized, enhanced disclosures, particularly related to derivatives, in investment company financial statements. Compliance with the amendments to Regulation S-X is required for financial statements filed with the SEC on or after August 1, 2017. Management is currently evaluating the impact that the amendments will have on the Fund’s financial statements and related disclosures.
2. Transactions with Related Parties and Other Service Providers
For its services, the Adviser is entitled to an investment advisory fee of 0.74% (on an annualized basis), which is calculated daily and paid monthly based on the average daily net assets of the Fund. Prior to July 18, 2016, WHV served as the investment adviser to the Fund. After July 18, 2016, Shelton became the investment adviser to the Fund. WHV, prior to July 18, 2016, and Shelton, after July 18, 2016, contractually agreed to reduce its investment advisory fee and/or reimburse certain expenses of the Fund to the extent necessary to ensure that the Fund’s total operating expenses (excluding taxes, interest, extraordinary items, “Acquired Fund” fees and expenses and brokerage commissions) do not exceed (on an annual basis) 1.24% with respect to Class A shares and 0.99% with respect to Class I shares of average daily net assets of the Fund (the “Expense Limitation”). The Expense Limitation will remain in place until August 31, 2017, unless the Board of Trustees of FundVantage Trust (the “Trust”) approves its earlier termination. Prior to February 15, 2016, the Management Fee was 1.00% (on an annual basis) of the Fund’s average daily net assets and the Expense Limitation was (on an annual basis) 1.50% with respect to Class A shares and 1.25% with respect to Class I shares. Shelton is entitled to recover, subject to approval by the Board of Trustees, such amounts reduced or reimbursed for a period of up to three
23
SHELTON INTERNATIONAL SELECT EQUITY FUND
(formerly WHV International Equity Fund)
Notes to Financial Statements (Continued)
April 30, 2017
(3) years from the year in which the Adviser reduced its compensation and/or assumed expenses for the Fund. Shelton is permitted to seek reimbursement from the Fund, subject to certain limitations, for fees it waived and Fund expenses it paid to the extent the total annual fund operating expenses do not exceed the limits described above or any lesser limits in effect at the time of reimbursement. No recoupment will occur unless the Fund’s expenses are below the Expense Limitation amount that was in effect at the time of the Expense Limitation amount. For the period from May 1, 2016 through July 17, 2016, WHV earned fees of $76,464 and waived fees of $76,083. For the period from July 18, 2016 through April 30, 2017, Shelton earned fees of $258,850, waived fees of $258,850 and reimbursed fees of $13,835. WHV is no longer eligible to recover any amounts previously waived or reimbursed.
As of April 30, 2017, the amount of potential recovery by Shelton was $272,685 which expires on April 30, 2020.
Other Service Providers
BNY Mellon Investment Servicing (US) Inc. (“BNY Mellon”) serves as administrator and transfer agent for the Fund. For providing administrative and accounting services, BNY Mellon is entitled to receive a monthly fee equal to an annual percentage rate of the Fund’s average daily net assets and is subject to certain minimum monthly fees. For providing transfer agency services, BNY Mellon is entitled to receive a monthly fee, subject to certain minimum, and out of pocket expenses.
The Bank of New York Mellon (the “Custodian”) provides certain custodial services to the Fund. The Custodian is entitled to receive a monthly fee, subject to certain minimum, and out of pocket expenses.
Foreside Funds Distributors LLC (“the Underwriter”) provides principal underwriting services to the Fund.
The Trust and the Underwriter are parties to an underwriting agreement. The Trust has adopted a distribution plan for Class A Shares in accordance with Rule 12b-1 under the 1940 Act. Pursuant to the Class A Shares plan, the Fund compensates the Underwriter for direct and indirect costs and expenses incurred in connection with advertising, marketing and other distribution services in an amount not to exceed 0.25% on an annualized basis of the average daily net assets of the Fund’s Class A shares.
Trustees and Officers
The Trust is governed by its Board of Trustees. The Trustees receive compensation in the form of an annual retainer and per meeting fees for their services to the Trust. The remuneration paid to the
24
SHELTON INTERNATIONAL SELECT EQUITY FUND
(formerly WHV International Equity Fund)
Notes to Financial Statements (Continued)
April 30, 2017
Trustees by the Fund during the year ended April 30, 2017, was $8,034. An employee of BNY Mellon serves as the Secretary of the Trust and is not compensated by the Fund or the Trust.
Effective June 1, 2016 and July 1, 2016, JW Fund Management LLC (“JWFM”) provides a Principal Executive Officer and Principal Financial Officer, respectively, to the Trust. JWFM is compensated for the services provided to the Trust. Until May 31, 2016 and June 30, 2016, certain employees of BNY Mellon served as Principal Executive Officer and Principal Financial Officer, respectively, to the Trust. They were not compensated by the Trust or the Funds.
Freeh Group International Solutions, LLC provides the Trust with a Chief Compliance Officer and an Anti-Money Laundering Officer.
3. Investment in Securities
For the year ended April 30, 2017, aggregate purchases and sales of investment securities (excluding U.S. Government and agency short-term investments and other short-term investments) of the Fund were as follows:
| Purchases | Sales | |||
Investment Securities | $17,989,603 | $31,587,237 |
4. Capital Share Transactions
For the years ended April 30, 2017 and 2016, transactions in capital shares (authorized shares unlimited) were as follows:
| For the Year Ended April 30, 2017 | For the Year Ended April 30, 2016* | |||||||||||||||
| Shares | Amount | Shares | Amount | |||||||||||||
Class A Shares | ||||||||||||||||
Sales | 3,796 | $ | 61,537 | 197,720 | $ | 3,715,891 | ||||||||||
Reinvestments | 2,648 | 43,243 | 23,922 | 369,356 | ||||||||||||
Redemptions | (292,063 | ) | (4,797,158 | ) | (1,179,575 | ) | (19,406,293 | ) | ||||||||
|
|
|
|
|
|
|
| |||||||||
Net decrease | (285,619 | ) | $ | (4,692,378 | ) | (957,933 | ) | $ | (15,321,046 | ) | ||||||
|
|
|
|
|
|
|
| |||||||||
25
SHELTON INTERNATIONAL SELECT EQUITY FUND
(formerly WHV International Equity Fund)
Notes to Financial Statements (Continued)
April 30, 2017
| For the Year Ended April 30, 2017 | For the Year Ended April 30, 2016* | |||||||||||||||
| Shares | Amount | Shares | Amount | |||||||||||||
Class C Shares | ||||||||||||||||
Sales | — | $ | — | 343 | $ | 5,000 | ||||||||||
Reinvestments | — | — | 220 | 3,396 | ||||||||||||
Redemptions | — | — | (8,653 | ) | (125,185 | ) | ||||||||||
|
|
|
|
|
|
|
| |||||||||
Net decrease | — | $ | — | (8,090 | ) | $ | (116,789 | ) | ||||||||
|
|
|
|
|
|
|
| |||||||||
Class I Shares | ||||||||||||||||
Sales | 340,283 | $ | 5,634,219 | 6,133,764 | $ | 106,747,498 | ||||||||||
Reinvestments | 28,733 | 468,912 | 240,629 | 3,717,717 | ||||||||||||
Redemptions | (995,347 | ) | (16,147,861 | ) | (21,036,904 | ) | (347,164,373 | ) | ||||||||
|
|
|
|
|
|
|
| |||||||||
Net decrease | (626,331 | ) | $ | (10,044,730 | ) | (14,662,511 | ) | $ | (236,699,158 | ) | ||||||
|
|
|
|
|
|
|
| |||||||||
Total Net Decrease | (911,950 | ) | $ | (14,737,108 | ) | (15,628,534 | ) | $ | (252,136,993 | ) | ||||||
|
|
|
|
|
|
|
| |||||||||
| * | Class C Shares closed on April 15, 2016. |
5. Federal Tax Information
The Fund has followed the authoritative guidance on accounting for and disclosure of uncertainty in tax positions, which requires the Fund to determine whether a tax position is more likely than not to be sustained upon examination, including resolution of any related appeals or litigation processes, based on the technical merits of the position. The Fund has determined that there was no effect on the financial statements from following this authoritative guidance. In the normal course of business, the Fund is subject to examination by federal, state and local jurisdictions, where applicable, for tax years for which applicable statutes of limitations have not expired.
Distributions are determined in accordance with federal income tax regulations, which may differ in amount or character from net investment income and realized gains for financial reporting purposes. Accordingly, the character of distributions and composition of net assets for tax purposes may differ from those reflected in the accompanying financial statements. To the extent these differences are permanent, such amounts are reclassified within the components of net assets based on the tax treatment; temporary differences do not require reclassifications. For the year ended April 30, 2017, these adjustments were to increase accumulated net investment income by $241,174 and increase accumulated net realized loss by $241,174. These adjustments are attributable to the reclassifications of currency gain/loss and Passive Foreign Investment Company sales gain. Net investment income, net realized gains and net assets were not affected by those adjustments.
26
SHELTON INTERNATIONAL SELECT EQUITY FUND
(formerly WHV International Equity Fund)
Notes to Financial Statements (Continued)
April 30, 2017
For the year ended April 30, 2017, the tax character of distributions paid by the Fund was $557,960 of ordinary income dividends. For the year ended April 30, 2016, the tax character of distributions paid by the Fund was $5,610,353 of ordinary income dividends. Distributions from net investment income and short-term capital gains are treated as ordinary income for federal income tax purposes.
As of April 30, 2017, the components of distributable earnings on a tax basis were as follows:
| Capital Loss Carryforward | Undistributed Ordinary Income | Undistributed Long-Term Gain | Unrealized Appreciation | Qualified Late-Year Losses | ||||
| $(63,120,184) | $672,089 | $— | $8,328,193 | $— |
The differences between the book and tax basis components of distributable earnings relate primarily to the timing and recognition of income and gains for federal income tax purposes. Short-term capital gains are reported as ordinary income for federal income tax purposes.
As of April 30, 2017, the federal tax cost, aggregate gross unrealized appreciation and depreciation of securities held by the Fund were as follows:
Federal tax cost | $ | 33,176,259 | ||||||
|
| |||||||
Gross unrealized appreciation | $ | 8,486,239 | ||||||
Gross unrealized depreciation | (157,297 | ) | ||||||
|
| |||||||
Net unrealized appreciation | $ | 8,328,942 | ||||||
|
|
Pursuant to federal income tax rules applicable to regulated investment companies, the Fund may elect to treat certain capital losses between November 1 and April 30 and late year ordinary losses ((i) ordinary losses between January 1 and April 30, and (ii) specified ordinary and currency losses between November 1 and April 30) as occurring on the first day of the following tax year. For the year ended April 30, 2017, any amount of losses elected within the tax return will not be recognized for federal income tax purposes until May 1, 2017. For the year ended April 30, 2017, the Fund had no capital loss deferrals.
Accumulated capital losses represent net capital loss carryforwards as of April 30, 2017, that may be available to offset future realized capital gains and thereby reduce future capital gains distributions. As of April 30, 2017, the Fund’s capital loss carryforwards were $63,120,184, of which $4,973,686 were short-term losses and $58,146,498 were long-term losses. All losses will be carried forward indefinitely and will retain their character as short-term and long-term capital losses.
27
SHELTON INTERNATIONAL SELECT EQUITY FUND
(formerly WHV International Equity Fund)
Notes to Financial Statements (Concluded)
April 30, 2017
6. Subsequent Events
Management has evaluated the impact of all subsequent events on the Fund through the date the financial statements were issued and has determined that there were no subsequent events requiring recognition or disclosure in the financial statements.
28
SHELTON INTERNATIONAL SELECT EQUITY FUND
(formerly WHV International Equity Fund)
Report of Independent Registered Public Accounting Firm
To the Board of Trustees of FundVantage Trust and Shareholders of the
Shelton International Select Equity Fund
We have audited the accompanying statement of assets and liabilities, including the schedule of investments, of the Shelton International Select Equity Fund (formerly WHV International Equity Fund), a series of FundVantage Trust as of April 30, 2017, and the related statement of operations, the statement of changes in net assets and the financial highlights for the year then ended. These financial statements and financial highlights are the responsibility of the Funds’ management. Our responsibility is to express an opinion on these financial statements and financial highlights based on our audit. The statements of operation and changes in net assets for the year ended April 30, 2016 and the financial highlights for each of the four years in the period ended April 30, 2016 were audited by other independent registered public accountants whose report thereon, dated June 28, 2016, expressed an unqualified opinion on those statements.
We conducted our audit in accordance with standards of the Public Company Accounting Oversight Board (United States). Those standards require that we plan and perform the audit to obtain reasonable assurance about whether the financial statements and financial highlights are free of material misstatement. The Fund is not required to have, nor were we engaged to perform, an audit of the Fund’s internal control over financial reporting. Our audit included consideration of internal control over financial reporting as a basis for designing audit procedures that are appropriate in the circumstances, but not for the purposes of expressing an opinion on the effectiveness of the Fund’s internal control over financial reporting. Accordingly, we express no such opinion. An audit includes examining, on a test basis, evidence supporting the amounts and disclosures in the financial statements. Our procedures included confirmation of securities owned as of April 30, 2017, by correspondence with the custodian. An audit also includes assessing the accounting principles used and significant estimates made by management, as well as evaluating the overall financial statement presentation. We believe that our audit provides a reasonable basis for our opinion.
In our opinion, the financial statements and financial highlights referred to above present fairly, in all material respects, the financial position of the Shelton International Select Equity Fund, as of April 30, 2017, the results of its operations, the changes in its net assets, and the financial highlights for the year then ended, in conformity with accounting principles generally accepted in the United States of America.
TAIT, WELLER & BAKER LLP
Philadelphia, Pennsylvania
June 26, 2017
29
SHELTON INTERNATIONAL SELECT EQUITY FUND
(formerly WHV International Equity Fund)
Shareholder Tax Information
(Unaudited)
The Fund is required by Subchapter M of the Internal Revenue Code to advise its shareholders of the U.S. federal tax status of distributions received by the Fund’s shareholders in respect of such fiscal year. During the fiscal year ended April 30, 2017, the Fund paid $557,960 of ordinary income dividends to its shareholders. Dividends from net investment income and short-term capital gains are treated as ordinary income dividends for federal income tax purposes.
The Fund designates 100.00% of the ordinary income distribution as qualified dividend income pursuant to the Jobs and Growth Tax Relief Reconciliation Act of 2003.
The percentage of qualified interest income related to dividends not subject to withholding tax for non-resident aliens and foreign corporations is 0.02%.
The Fund intends to pass through a foreign tax credit to the shareholders. For the year ended April 30, 2017, the total amount of foreign source income for the Fund is $1,242,403. The total amount of foreign taxes to be passed through to shareholders by the Fund is $62,584. Your allocable share of foreign tax credit will be reported on Form 1099-DIV.
All designations are based on financial information available as of the date of this annual report and, accordingly, are subject to change. For each item, it is the intention of the Fund to designate the maximum amount permitted under the Internal Revenue Code of 1986, as amended, and the regulations thereunder.
Because the Fund’s fiscal year is not the calendar year, another notification will be sent with respect to calendar year 2017. The second notification, which will reflect the amount, if any, to be used by calendar year taxpayers on their U.S. federal income tax returns, will be made in conjunction with Form 1099-DIV and will be mailed in January 2018.
Foreign shareholders will generally be subject to U.S. withholding tax on the amount of their ordinary income dividends. They will generally not be entitled to a foreign tax credit or deduction for the withholding taxes paid by the Fund, if any.
In general, dividends received by tax-exempt recipients (e.g., IRAs and Keoghs) need not be reported as taxable income for U.S. federal income tax purposes. However, some retirement trusts (e.g., corporate, Keogh and 403(b)(7) plans) may need this information for their annual information reporting.
Shareholders are advised to consult their own tax advisers with respect to the tax consequences of their investment in the Fund.
30
SHELTON INTERNATIONAL SELECT EQUITY FUND
(formerly WHV International Equity Fund)
Other Information
(Unaudited)
Change In Independent Registered Public Accounting Firm
Due to independence matters under the Securities and Exchange Commission’s auditor independence rules resulting from the change in the investment adviser to the Shelton International Select Equity Fund (the “Fund”) from WHV Investments, Inc. to Shelton Capital Management, PricewaterhouseCoopers LLP (“PwC”) resigned as the independent registered public accounting firm for the Fund effective April 21, 2017. Effective April 25, 2017, the Board of Trustees of FundVantage Trust (the “Trust”), upon recommendation of the Audit Committee, selected Tait, Weller & Baker LLP (“TWB”) to serve as the independent registered public accounting firm for the Fund for the fiscal year ending April 30, 2017.
PwC’s reports on the Fund’s financial statements for the Fund’s two most recently completed fiscal years ended April 30, 2016 and April 30, 2015 did not contain any adverse opinion or disclaimer of opinion, and were not qualified or modified as to uncertainty, audit scope, or accounting principles. During the fiscal years ended April 30, 2016 and April 30, 2015 and the subsequent interim period through April 21, 2017, (i) there were no disagreements between the Fund and PwC on any matter of accounting principles or practices, financial statement disclosure, or auditing scope or procedure, which disagreements, if not resolved to the satisfaction of PwC, would have caused it to make reference to the subject matter of the disagreements in connection with its reports; and (ii) there were no “reportable events” within the meaning of Item 304, paragraph (a)(1)(v), of Regulation S-K under the Securities Exchange Act of 1934, as amended (“Regulation S-K”).
As indicated above, the Trust has appointed TWB as the independent registered public accounting firm to audit the Fund’s financial statements for the fiscal year ending April 30, 2017. During the Fund’s fiscal years ended April 30, 2016 and April 30, 2015, and the subsequent interim period through April 21, 2017, neither the Trust nor anyone on its behalf has consulted TWB on items which: (i) concerned the application of accounting principles to a specified transaction, either completed or proposed, or the type of audit opinion that might be rendered on the Fund’s financial statements; or (ii) concerned the subject of a disagreement (as defined in paragraph (a)(1)(iv) of Item 304 of Regulation S-K) or reportable events (as described in paragraph (a)(1)(v) of said Item 304).
Proxy Voting
Policies and procedures that the Fund uses to determine how to vote proxies relating to portfolio securities as well as information regarding how the Fund voted proxies relating to portfolio securities for the most recent 12-month period ended June 30 are available without charge, upon request, by calling (888) 948-4685 and on the Securities and Exchange Commission’s (“SEC”) website at http:// www.sec.gov.
31
SHELTON INTERNATIONAL SELECT EQUITY FUND
(formerly WHV International Equity Fund)
Other Information
(Unaudited) (Concluded)
Quarterly Portfolio Schedules
The Trust files its complete schedule of portfolio holdings with the SEC for the first and third fiscal quarters of each fiscal year (quarters ended July 31 and January 31) on Form N-Q. The Trust’s Forms N-Q are available on the SEC’s website at http://www.sec.gov and may be reviewed and copied at the SEC’s Public Reference Room in Washington, D.C. Information on the operation of the SEC’s Public Reference Room may be obtained by calling 1-800-SEC-0330.
32
SHELTON INTERNATIONAL SELECT EQUITY FUND
(formerly WHV International Equity Fund)
Privacy Notice
(Unaudited)
The privacy of your personal financial information is extremely important to us. When you open an account with us, we collect a significant amount of information from you in order to properly invest and administer your account. We take very seriously the obligation to keep that information private and confidential, and we want you to know how we protect that important information.
We collect nonpublic personal information about you from applications or other forms you complete and from your transactions with us or our affiliates. We do not disclose information about you, or our former clients, to our affiliates or to service providers or other third parties, except as permitted by law. We share only the information required to properly administer your accounts, which enables us to send transaction confirmations, monthly or quarterly statements, financials and tax forms. Even within FundVantage Trust and its affiliated entities, a limited number of people who actually service accounts will have access to your personal financial information. Further, we do not share information about our current or former clients with any outside marketing groups or sales entities.
To ensure the highest degree of security and confidentiality, FundVantage Trust and its affiliates maintain various physical, electronic and procedural safeguards to protect your personal information. We also apply special measures for authentication of information you request or submit to us on our web site.
If you have questions or comments about our privacy practices, please call us at (888) 948-4685.
33
SHELTON INTERNATIONAL SELECT EQUITY FUND
(formerly WHV International Equity Fund)
Fund Management
(Unaudited)
FundVantage Trust (the “Trust”) is governed by a Board of Trustees (the “Trustees”). The primary responsibility of the Trustees is to represent the interest of the Trust’s shareholders and to provide oversight management of the Trust.
The following tables present certain information regarding the Board of Trustees and officers of the Trust. None of the Trustees are an “interested person” of the Trust, the Adviser, another investment adviser of a series of the Trust, or Foreside Funds Distributors LLC, the principal underwriter of the Trust (“Underwriter”), within the meaning of the 1940 Act and each Trustee is referred to as an “Independent Trustee” and is listed under such heading below. The address of each Trustee and Officer as it relates to the Trust’s business is 301 Bellevue Parkway, 2nd Floor, Wilmington, DE 19809.
The Statement of Additional Information for each Fund contains additional information about the Trustees and is available, without charge, upon request, by calling (888) 948-4685.
Name and Date of Birth | Position(s) Held with Trust | Term of Office and Length of Time Served | Principal Occupation(s) During Past Five Years | Number of Funds in Trust Complex | Other Directorships Held by Trustee | |||||
| INDEPENDENT TRUSTEES | ||||||||||
ROBERT J. CHRISTIAN Date of Birth: 2/49 | Trustee and Chairman of the Board | Shall serve until death, resignation or removal. Trustee and Chairman since 2007. | Retired since February 2006; Executive Vice President of Wilmington Trust Company from February 1996 to February 2006; President of Rodney Square Management Corporation (“RSMC”) (investment advisory firm) from 1996 to 2005; Vice President of RSMC from 2005 to 2006. | 42 | Optimum Fund Trust (registered investment company with 6 portfolios). | |||||
IQBAL MANSUR Date of Birth: 6/55 | Trustee | Shall serve until death, resignation or removal. Trustee since 2007. | University Professor, Widener University. | 42 | None. | |||||
34
SHELTON INTERNATIONAL SELECT EQUITY FUND
(formerly WHV International Equity Fund)
Fund Management
(Unaudited) (Continued)
Name and Date of Birth | Position(s) Held with Trust | Term of Office and Length of Time Served | Principal Occupation(s) During Past Five Years | Number of Funds in Trust Complex | Other Directorships Held by Trustee | |||||
NICHOLAS M. MARSINI, JR. Date of Birth: 8/55 | Trustee | Shall serve until death, resignation or removal. Trustee since 2016. | Retired since March 2016. President of PNC Bank Delaware from June 2011 to March 2016; Executive Vice President Finance of BNY Mellon from July 2010 to January 2011; Executive Vice President and Chief Financial Officer of PNC Global Investment Servicing from September 1997 to July 2010. | 42 | Brinker Capital Destinations Trust (registered investment company with 10 portfolios). | |||||
STEPHEN M. WYNNE Date of Birth: 1/55 | Trustee | Shall serve until death, resignation or removal. Trustee since 2009. | Retired since December 2010; Chief Executive Officer of US Funds Services, BNY Mellon Asset Servicing from July 2010 to December 2010; Chief Executive Officer of PNC Global Investment Servicing from March 2008 to July 2010; President, PNC Global Investment Servicing from 2003 to 2008. | 42 | Copeland Trust (registered investment company with 2 portfolios). Context Capital Funds (registered investment company with 1 portfolio). | |||||
NANCY B. WOLCOTT Date of Birth: 11/54 | Trustee | Shall serve until death, resignation or removal. Trustee since 2011. | Retired since May 2014; EVP, Head of GFI Client Service Delivery, BNY Mellon from January 2012 to May 2014; EVP, Head of US Funds Services, BNY Mellon from July 2010 to January 2012; President of PNC Global Investment Servicing from 2008 to July 2010; Chief Operating Officer of PNC Global Investment Servicing from 2007 to 2008; Executive Vice President of PFPC Worldwide Inc. from 2006 to 2007. | 42 | None. | |||||
35
SHELTON INTERNATIONAL SELECT EQUITY FUND
(formerly WHV International Equity Fund)
Fund Management
(Unaudited) (Concluded)
Name and Date of Birth | Position(s) Held with Trust | Term of Office and Length of Time Served | Principal Occupation(s) During Past Five Years | |||
| EXECUTIVE OFFICERS | ||||||
JOEL L. WEISS Date of Birth: 1/63 |
President and Chief Executive Officer |
Shall serve until death, resignation or removal. Officer since 2007. |
President of JW Fund Management LLC since June 2016; Vice President and Managing Director of BNY Mellon Investment Servicing (US) Inc. and predecessor firms from 1993 to June 2016. | |||
T. RICHARD KEYES Date of Birth: 1/57 |
Treasurer and Chief Financial Officer |
Shall serve until death, resignation or removal. Officer since 2016. |
President of TRK Fund Consulting since July 2016; Head of Tax — U.S. Fund Services of BNY Mellon Investment Servicing (US) Inc. and predecessor firms from February 2006 to July 2016. | |||
VINCENZO A. SCARDUZIO Date of Birth: 4/72 |
Secretary |
Shall serve until death, resignation or removal. Officer since 2012. |
Director and Vice President Regulatory Administration of BNY Mellon Investment Servicing (US) Inc. and predecessor firms since 2001. | |||
DAVID C. LEBISKY Date of Birth: 5/72 |
Chief Compliance Officer and Anti-Money Laundering Officer |
Shall serve until death, resignation or removal. Officer since 2015. |
President of Lebisky Compliance Consulting LLC since October 2015; Senior Consultant, Freeh Group International Solutions, LLC (a global risk management firm) since 2015; Scotia Institutional Investments US, LP, Director of Regulatory Administration from 2010 to 2014. | |||
36
[THIS PAGE INTENTIONALLY LEFT BLANK.]
[THIS PAGE INTENTIONALLY LEFT BLANK.]
[THIS PAGE INTENTIONALLY LEFT BLANK.]
Investment Adviser
Shelton Capital Management
1050 17th Street
Suite 1710
Denver, CO 80265
Administrator
BNY Mellon Investment Servicing (US) Inc.
301 Bellevue Parkway
Wilmington, DE 19809
Transfer Agent
BNY Mellon Investment Servicing (US) Inc.
4400 Computer Drive
Westborough, MA 01581
Principal Underwriter
Foreside Funds Distributors LLC
400 Berwyn Park
899 Cassatt Road
Berwyn, PA 19312
Custodian
The Bank of New York Mellon
225 Liberty Street
New York, NY 10286
Independent Registered Public Accounting Firm
Tait, Weller & Baker LLP
1818 Market Street, Suite 2400
Philadelphia, PA 19103
Legal Counsel
Pepper Hamilton LLP
3000 Two Logan Square
18th and Arch Streets
Philadelphia, PA 19103

SHELTON
INTERNATIONAL
SELECT EQUITY FUND
(formerly WHV
International Equity Fund)
of
FundVantage Trust
Class A Shares
Class I Shares
ANNUAL REPORT
April 30, 2017
This report is submitted for the general information of the shareholders of the Shelton International Select Equity Fund. It is not authorized for distribution unless preceded or accompanied by a current prospectus for the Shelton International Select Equity Fund.
SIS-0417
SKYBRIDGE DIVIDEND VALUE FUND
Annual Investment Adviser’s Report
April 30, 2017
(Unaudited)
Dear Fellow Shareholder,
We are excited to be in our fourth year of fund operations.
The S&P 500 Index was up 17.92% for the year ended April 30, 2017. During the same time period, our SkyBridge Dividend Value Fund’s Class I (Institutional Shares, SKYIX) was up 5.57%; Class A Shares (SKYAX) were up 5.35% (without sales charge); and Class C Shares (SKYCX) were up 4.61%, in each case net of any relevant fees and expenses. Overweighting the energy sector hurt relative performance, as did the lack of exposure to financial companies pursuant to the Fund’s investment mandate.
The top three performing companies over the time period were Western Digital Corporation, Nu Skin Enterprises, Inc., and Best Buy Co., Inc. The bottom three performing companies were Gannett Co., Inc., Pitney Bowes Inc., and R.R. Donnelley & Sons Company.
The Fund invests primarily in dividend yielding equity securities for which there is no guarantee that a company will increase or continue to pay dividends over time. The fund is subject to overall market risks which will cause its value to fluctuate over time as well as the Adviser’s ability to select securities to meet its objective.
Our rules-based process allows us to take a long view, and the goal of our strategy is to outperform the S&P 500 Index over longer periods of time (net of fees and expenses). The repeatable investment process seeks to identify profitable, attractively valued securities with appealing dividends and favors long term gains.
We believe the current low interest rate environment generally favors equities over bonds, especially considering the tax advantages of equity dividends over bond income. As always, we thank you for your support.
Sincerely,
Brendan Voege
Portfolio Manager
Current and future portfolio holdings are subject to change and risk.
The performance data quoted represents past performance and does not guarantee future results. Current performance may be lower or higher. Performance data current to the most recent month-end may be obtained by calling (888) 919-6885. The investment return and principal value of an investment will fluctuate so that shares, when redeemed, may be worth more or less than their original cost.
1
SKYBRIDGE DIVIDEND VALUE FUND
Annual Report
Performance Data
April 30, 2017
(Unaudited)
Comparison of Change in Value of $10,000 Investment in SkyBridge Dividend Value Fund’s
Class A Shares vs. S&P 500® Index
Class A Shares of an assumed $10,000 investment is adjusted for the maximum sales charge of 5.75%. This results in a net investment of $9,425. Performance of Class C Shares will vary from Class A Shares due to differences in class specific fees.
Comparison of Change in Value of $50,000 (investment minimum) Investment in SkyBridge Dividend Value Fund’s
Class I Shares vs. S&P 500® Index
2
SKYBRIDGE DIVIDEND VALUE FUND
Annual Report
Performance Data (Continued)
April 30, 2017
(Unaudited)
Average Annual Total Returns for Periods Ended April 30, 2017 | |||||||||||||||||
| 1 Year | 3 Year | Since Inception | |||||||||||||||
Class A Shares (with sales charge)* | -0.62 | % | N/A | 4.73 | % | ||||||||||||
Class A Shares (without sales charge)* | 5.35 | % | N/A | 6.88 | % | ||||||||||||
S&P 500® Index | 17.92 | % | N/A | 9.77 | %(a) | ||||||||||||
Class C Shares* | 4.61 | % | N/A | 8.95 | % | ||||||||||||
S&P 500® Index | 17.92 | % | N/A | 12.02 | %(a) | ||||||||||||
Class I Shares* | 5.57 | % | 7.71 | % | 8.31 | % | |||||||||||
S&P 500® Index | 17.92 | % | 10.47 | % | 11.04 | %(a) | |||||||||||
| * | Class A Shares, Class C Shares and Class I Shares of the SkyBridge Dividend Value Fund (the “Fund”) commenced operations on June 13, 2014, October 17, 2014 and April 7, 2014, respectively. |
| (a) | Benchmark performance is from inception date of the Class only and is not the inception date of the benchmark itself. |
The performance data quoted represents past performance and does not guarantee future results. The investment return and principal value of an investment in the Fund will fluctuate so that an investor’s shares, when redeemed, may be worth more or less than their original cost. The graphs and table do not reflect the deduction of taxes that a shareholder would pay on Fund distributions or redemption of Fund shares. Current performance may be lower or higher. Performance data current to the most recent month-end may be obtained by calling (888) 919-6885.
The returns shown for Class A Shares reflect a deduction for the maximum front-end sales charge of 5.75%. As stated in the current prospectus dated September 1, 2016, the Fund’s “Total Annual Fund Operating Expenses” are 1.28%, 2.03% and 1.03%, and the Fund’s “Total Annual Fund Operating Expenses After Fee Waiver and/or Expense Reimbursement” are 1.25%, 2.00% and 1.00% for Class A Shares, Class C Shares and Class I Shares, respectively, of the Fund’s average daily net assets. These ratios may differ from the actual expenses incurred by the Fund for the period covered by this report. SkyBridge Capital II, LLC (“SkyBridge” or the “Adviser”) has contractually agreed to reduce its management fee and/or reimburse certain expenses of the Fund to the extent necessary to ensure that the Fund’s total operating expenses (excluding taxes, “Acquired Fund” fees and expenses, interest, extraordinary items and brokerage commissions) do not exceed (on an annual basis) 1.25% with respect to Class A shares, 2.00% with respect to Class C shares and 1.00% with respect to Class I shares of average daily net assets of the Fund (the “Expense Limitation”). The Expense Limitation will remain in place until August 31, 2018, unless the Board of Trustees of FundVantage Trust (the “Trust”) approves its earlier termination. Total returns would be lower had such fees and/or expenses not been waived and/or reimbursed. The Adviser is entitled to recover, subject to approval by the Board of Trustees, such amounts reduced or reimbursed for a period of up to three (3) years from the year in which the Adviser reduced its compensation and/or assumed expenses for the Fund. No recoupment will occur unless the Fund’s expenses are below the Expense Limitation amount.
Mutual fund investing involves risk including the possible loss of principal. The Fund’s long term “buy and hold” strategy under certain market conditions may cause it to be more susceptible to general market declines. The Fund seeks to invest in securities with dividend yield potential with both growth and value characteristics. Value investing involves the risk that companies believed to be undervalued may not appreciate as anticipated. There are no guarantees
3
SKYBRIDGE DIVIDEND VALUE FUND
Annual Report
Performance Data (Concluded)
April 30, 2017
(Unaudited)
a company will continue to pay or increase its dividend. The Fund may invest in small to mid-capitalization companies which may be more volatile and less liquid than stocks of larger companies.
The Fund intends to evaluate performance as compared to that of the Standard & Poor’s 500 (“S&P 500®”) Index. The S&P 500® Index is a widely recognized, unmanaged index of 500 common stocks which are generally representative of the U.S. stock market as a whole. It is not possible to invest in an index.
4
SKYBRIDGE DIVIDEND VALUE FUND
Fund Expense Disclosure
April 30, 2017
(Unaudited)
As a shareholder of the Fund, you incur two types of costs: (1) transaction costs including sales charges (loads) on purchase payments (if any) or redemption fees; and (2) ongoing costs, including management fees, distribution and/or service (Rule 12b-1) fees (if any) and other Fund expenses. These examples are intended to help you understand your ongoing costs (in dollars) of investing in the Fund and to compare these costs with the ongoing costs of investing in other mutual funds.
These examples are based on an investment of $1,000 invested at the beginning of the six-month period from November 1, 2016 through April 30, 2017 and held for the entire period.
Actual Expenses
The first line of the accompanying table provides information about actual account values and actual expenses. You may use the information in this line, together with the amount you invested, to estimate the expenses that you paid over the period. Simply divide your account value by $1,000 (for example, an $8,600 account value divided by $1,000 = 8.6), then multiply the result by the number in the first line under the heading entitled “Expenses Paid During Period” to estimate the expenses you paid on your account during this period.
Hypothetical Examples for Comparison Purposes
The second line of the accompanying table provides information about hypothetical account values and hypothetical expenses based on the Fund’s actual expense ratio and an assumed rate of return of 5% per year before expenses, which is not your Fund’s actual return. The hypothetical account values and expenses may not be used to estimate the actual ending account balance or expenses you paid for the period. You may use this information to compare the ongoing costs of investing in the Fund and other funds. To do so, compare these 5% hypothetical examples with the 5% hypothetical examples that appear in the shareholder reports of other funds.
Please note that the expenses shown in the accompanying table are meant to highlight your ongoing costs only and do not reflect any transactional costs, such as sales charges (loads) on purchase payments (if any) or redemption fees. Therefore, the second line of the accompanying table is useful in comparing ongoing costs only, and will not help you determine the relative total costs of owning different funds. In addition, if these transactional costs were included, your costs would have been higher.
5
SKYBRIDGE DIVIDEND VALUE FUND
Fund Expense Disclosure (Concluded)
April 30, 2017
(Unaudited)
| SkyBridge Dividend Value Fund | |||||||||||||||
| Beginning Account Value November 1, 2016 | Ending Account Value April 30, 2017 | Expenses Paid During Period* | |||||||||||||
Class A Shares | |||||||||||||||
Actual | $ | 1,000.00 | $ | 1,054.80 | $ | 6.37 | |||||||||
Hypothetical (5% return before expenses) | 1,000.00 | 1,018.60 | 6.26 | ||||||||||||
Class C Shares | |||||||||||||||
Actual | $ | 1,000.00 | $ | 1,051.60 | $ | 10.17 | |||||||||
Hypothetical (5% return before expenses) | 1,000.00 | 1,014.88 | 9.99 | ||||||||||||
Class I Shares | |||||||||||||||
Actual | $ | 1,000.00 | $ | 1,055.60 | $ | 5.10 | |||||||||
Hypothetical (5% return before expenses) | 1,000.00 | 1,019.84 | 5.01 | ||||||||||||
| * | Expenses are equal to an annualized expense ratio for the six-month period ended April 30, 2017 of 1.25%, 2.00% and 1.00% for Class A, Class C and Class I Shares, respectively, for the Fund, multiplied by the average account value over the period, multiplied by the number of days in the most recent period (181), then divided by 365 to reflect the period. The Fund’s ending account values on the first line in the table are based on the actual six-month total returns for the Fund of 5.48%, 5.16% and 5.56% for Class A, Class C and Class I Shares, respectively. |
6
SKYBRIDGE DIVIDEND VALUE FUND
Portfolio Holdings Summary Table
April 30, 2017
(Unaudited)
The following table presents a summary by sector of the portfolio holdings of the Fund:
| % of Net Assets | Value | |||||||
COMMON STOCKS: | ||||||||
Consumer Discretionary | 40.4 | % | $ | 178,402,136 | ||||
Information Technology | 19.6 | 86,482,591 | ||||||
Industrials | 17.0 | 75,123,597 | ||||||
Health Care | 10.1 | 44,590,326 | ||||||
Energy | 6.5 | 28,940,801 | ||||||
Consumer Staples | 3.3 | 14,694,517 | ||||||
Telecommunication Services | 3.1 | 13,727,136 | ||||||
Other Assets in Excess of Liabilities | 0.0 | 180,019 | ||||||
|
|
|
| |||||
NET ASSETS | 100.0 | % | $ | 442,141,123 | ||||
|
|
|
| |||||
Portfolio holdings are subject to change at any time.
The accompanying notes are an integral part of the financial statements.
7
SKYBRIDGE DIVIDEND VALUE FUND
Portfolio of Investments
April 30, 2017
| Number of Shares | Value | |||||||
COMMON STOCKS — 100.0% |
| |||||||
Consumer Discretionary — 40.4% |
| |||||||
Best Buy Co., Inc. | 301,750 | $ | 15,633,668 | |||||
Coach, Inc. | 365,558 | 14,399,330 | ||||||
GameStop Corp., Class A | 660,383 | 14,984,090 | ||||||
Interpublic Group of Cos, Inc. (The) | 593,446 | 13,987,522 | ||||||
Kohl’s Corp. | 367,766 | 14,353,907 | ||||||
L Brands, Inc. | 308,505 | 16,292,149 | ||||||
Macy’s, Inc. | 499,750 | 14,602,695 | ||||||
Mattel, Inc. | 579,211 | 12,985,911 | ||||||
Nordstrom, Inc. | 314,482 | 15,180,046 | ||||||
Staples, Inc. | 1,523,221 | 14,881,869 | ||||||
Tupperware Brands Corp. | 226,933 | 16,296,059 | ||||||
Williams-Sonoma, Inc. | 273,911 | 14,804,890 | ||||||
|
| |||||||
| 178,402,136 | ||||||||
|
| |||||||
Consumer Staples — 3.3% |
| |||||||
Coca-Cola Co. (The) | 340,545 | 14,694,517 | ||||||
|
| |||||||
Energy — 6.5% |
| |||||||
Chevron Corp. | 135,495 | 14,457,316 | ||||||
Exxon Mobil Corp. | 177,385 | 14,483,485 | ||||||
|
| |||||||
| 28,940,801 | ||||||||
|
| |||||||
Health Care — 10.1% |
| |||||||
Abbvie, Inc. | 226,230 | 14,917,606 | ||||||
Gilead Sciences, Inc. | 219,830 | 15,069,346 | ||||||
Pfizer, Inc. | 430,524 | 14,603,374 | ||||||
|
| |||||||
| 44,590,326 | ||||||||
|
| |||||||
Industrials — 17.0% |
| |||||||
Boeing Co. (The) | 82,829 | 15,309,284 | ||||||
| Number of Shares | Value | |||||||
COMMON STOCKS — (Continued) |
| |||||||
Industrials — (Continued) |
| |||||||
Caterpillar, Inc. | 155,253 | $ | 15,876,172 | |||||
General Electric Co. | 491,345 | 14,244,092 | ||||||
Pitney Bowes, Inc. | 1,137,290 | 15,114,584 | ||||||
RR Donnelley & Sons Co. | 1,159,862 | 14,579,465 | ||||||
|
| |||||||
| 75,123,597 | ||||||||
|
| |||||||
Information Technology — 19.6% |
| |||||||
CA, Inc. | 457,921 | 15,033,546 | ||||||
Cisco Systems, Inc. | 445,289 | 15,170,996 | ||||||
HP, Inc. | 802,400 | 15,101,168 | ||||||
International Business Machines Corp. | 85,500 | 13,704,795 | ||||||
QUALCOMM, Inc. | 274,400 | 14,746,256 | ||||||
Seagate Technology PLC | 302,061 | 12,725,830 | ||||||
|
| |||||||
| 86,482,591 | ||||||||
|
| |||||||
Telecommunication Services — 3.1% |
| |||||||
Verizon Communications, Inc. | 299,001 | 13,727,136 | ||||||
|
| |||||||
TOTAL COMMON STOCKS | 441,961,104 | |||||||
|
| |||||||
TOTAL INVESTMENTS - 100.0% | 441,961,104 | |||||||
OTHER ASSETS IN EXCESS OF LIABILITIES - 0.0% | 180,019 | |||||||
|
| |||||||
NET ASSETS - 100.0% | $ | 442,141,123 | ||||||
|
| |||||||
The accompanying notes are an integral part of the financial statements.
8
SKYBRIDGE DIVIDEND VALUE FUND
Statement of Assets and Liabilities
April 30, 2017
Assets | ||||
Investments, at value (Cost $437,391,306) | $ | 441,961,104 | ||
Receivable for investments sold | 4,544,086 | |||
Receivable for capital shares sold | 1,068,947 | |||
Dividends receivable | 562,302 | |||
Prepaid expenses and other assets | 199,346 | |||
|
| |||
Total assets | 448,335,785 | |||
|
| |||
Liabilities | ||||
Payable for capital shares redeemed | 2,378,971 | |||
Due to Custodian | 3,275,474 | |||
Payable to Investment Adviser | 277,108 | |||
Payable for transfer agent fees | 72,408 | |||
Payable for distribution fees | 61,619 | |||
Payable for administration and accounting fees | 39,167 | |||
Payable for custodian fees | 29,322 | |||
Accrued expenses | 60,593 | |||
|
| |||
Total liabilities | 6,194,662 | |||
|
| |||
Net Assets | $ | 442,141,123 | ||
|
| |||
Net Assets Consisted of: | ||||
Capital stock, $0.01 par value | $ | 393,589 | ||
Paid-in capital | 426,755,983 | |||
Accumulated net investment income | 673,599 | |||
Accumulated net realized gain from investments | 9,748,154 | |||
Net unrealized appreciation on investments | 4,569,798 | |||
|
| |||
Net Assets | $ | 442,141,123 | ||
|
| |||
Class A Shares: | ||||
Net asset value, redemption price per share | ||||
($126,802,437 / 11,278,384 shares) | $11.24 | |||
|
| |||
Maximum offering price per share (100/94.25 of $11.24) | $11.93 | |||
|
| |||
Class C Shares: | ||||
Net asset value, offering and redemption price per share | ||||
($55,709,786 / 4,984,581 shares) | $11.18 | |||
|
| |||
Class I Shares: | ||||
Net asset value, offering and redemption price per share | ||||
($259,628,900 / 23,095,938 shares) | $11.24 | |||
|
| |||
The accompanying notes are an integral part of the financial statements.
9
SKYBRIDGE DIVIDEND VALUE FUND
Statement of Operations
For the Year Ended April 30, 2017
Investment Income | ||||
Dividends | $ | 17,011,160 | ||
|
| |||
Total investment income | 17,011,160 | |||
|
| |||
Expenses | ||||
Advisory fees (Note 2) | 3,261,945 | |||
Distribution fees (Class C Shares) (Note 2) | 410,890 | |||
Distribution fees (Class A Shares) (Note 2) | 309,893 | |||
Administration and accounting fees (Note 2) | 258,160 | |||
Transfer agent fees (Note 2) | 229,283 | |||
Shareholder servicing fees (Class C Shares) (Note 2) | 136,963 | |||
Registration and filing fees | 73,162 | |||
Custodian fees (Note 2) | 50,980 | |||
Trustees’ and officers’ fees (Note 2) | 48,627 | |||
Legal fees | 44,076 | |||
Printing and shareholder reporting fees | 31,796 | |||
Audit fees | 29,354 | |||
Other expenses | 75,193 | |||
|
| |||
Total expenses before waivers reimbursements or recoupment | 4,960,322 | |||
|
| |||
Plus: Net expenses recouped (Note 2) | 246,020 | |||
|
| |||
Net expenses after recoupment | 5,206,342 | |||
|
| |||
Net investment income | 11,804,818 | |||
|
| |||
Net realized and unrealized gain/(loss) from investments: | ||||
Net realized gain from investments | 15,003,234 | |||
Net change in unrealized appreciation/(depreciation) on investments | (826,659 | ) | ||
|
| |||
Net realized and unrealized gain on investments | 14,176,575 | |||
|
| |||
Net increase in net assets resulting from operations | $ | 25,981,393 | ||
|
| |||
The accompanying notes are an integral part of the financial statements.
10
SKYBRIDGE DIVIDEND VALUE FUND
Statements of Changes in Net Assets
| For the Year Ended April 30, 2017 | For the Year Ended April 30, 2016 | |||||||
Increase in net assets from operations: | ||||||||
Net investment income | $ | 11,804,818 | $ | 4,670,342 | ||||
Net realized gain from investments | 15,003,234 | 11,208,969 | ||||||
Net change in unrealized appreciation/(depreciation) on investments | (826,659 | ) | 3,007,199 | |||||
|
|
|
| |||||
Net increase in net assets resulting from operations | 25,981,393 | 18,886,510 | ||||||
|
|
|
| |||||
Less Dividends and Distributions to Shareholders from: | ||||||||
Net investment income: | ||||||||
Class A Shares | (3,212,939 | ) | (976,558 | ) | ||||
Class C Shares | (1,066,516 | ) | (378,987 | ) | ||||
Class I Shares | (7,045,406 | ) | (3,152,726 | ) | ||||
|
|
|
| |||||
Total net investment income | (11,324,861 | ) | (4,508,271 | ) | ||||
|
|
|
| |||||
Net realized capital gains: | ||||||||
Class A Shares | (4,270,004 | ) | (956,102 | ) | ||||
Class C Shares | (1,925,551 | ) | (533,725 | ) | ||||
Class I Shares | (9,003,741 | ) | (2,831,906 | ) | ||||
|
|
|
| |||||
Total net realized capital gains | (15,199,296 | ) | (4,321,733 | ) | ||||
|
|
|
| |||||
Net decrease in net assets from dividends and distributions to shareholders | (26,524,157 | ) | (8,830,004 | ) | ||||
|
|
|
| |||||
Increase in Net Assets Derived from Capital Share Transactions (Note 4) | 118,461,438 | 213,696,680 | ||||||
|
|
|
| |||||
Total increase in net assets | 117,918,674 | 223,753,186 | ||||||
|
|
|
| |||||
Net assets | ||||||||
Beginning of year | 324,222,449 | 100,469,263 | ||||||
|
|
|
| |||||
End of year | $ | 442,141,123 | $ | 324,222,449 | ||||
|
|
|
| |||||
Accumulated net investment income, end of year | $ | 673,599 | $ | 193,642 | ||||
|
|
|
| |||||
The accompanying notes are an integral part of the financial statements.
11
SKYBRIDGE DIVIDEND VALUE FUND
Financial Highlights
Contained below is per share operating performance data for Class A Shares outstanding, total investment return, ratios to average net assets and other supplemental data for the respective period. The total returns in the table represent the rate that an investor would have earned or lost on an investment in the Fund (assuming reinvestment of all dividends and distributions). This information has been derived from information provided in the financial statements and should be read in conjunction with the financial statements and the notes thereto.
| Class A Shares | |||||||||||||||
| For the Year Ended April 30, 2017 | For the Year Ended April 30, 2016 | For the Period June 13, 2014* to April 30, 2015 | |||||||||||||
Per Share Operating Performance | |||||||||||||||
Net asset value, beginning of period | $ | 11.31 | $ | 11.27 | $ | 10.47 | |||||||||
|
|
|
|
|
| ||||||||||
Net investment income(1) | 0.30 | 0.26 | 0.23 | ||||||||||||
Net realized and unrealized gain on investments | 0.30 | 0.24 | 0.78 | ||||||||||||
|
|
|
|
|
| ||||||||||
Net increase in net assets resulting from operations | 0.60 | 0.50 | 1.01 | ||||||||||||
|
|
|
|
|
| ||||||||||
Dividends and distributions to shareholders from: | |||||||||||||||
Net investment income | (0.29 | ) | (0.24 | ) | (0.19 | ) | |||||||||
Net realized capital gains | (0.38 | ) | (0.22 | ) | (0.02 | ) | |||||||||
|
|
|
|
|
| ||||||||||
Total dividends and distributions to shareholders | (0.67 | ) | (0.46 | ) | (0.21 | ) | |||||||||
|
|
|
|
|
| ||||||||||
Net asset value, end of period | $ | 11.24 | $ | 11.31 | $ | 11.27 | |||||||||
|
|
|
|
|
| ||||||||||
Total investment return(2) | 5.35 | % | 4.76 | % | 9.74 | % | |||||||||
Ratio/Supplemental Data | |||||||||||||||
Net assets, end of period (in thousands) | $ | 126,802 | $ | 57,175 | $ | 37,732 | |||||||||
Ratio of expenses to average net assets | 1.25 | % | 1.25 | % | 1.25 | %(3) | |||||||||
Ratio of expenses to average net assets without waivers and expense reimbursements(4) | 1.19 | % | 1.28 | % | 1.76 | %(3) | |||||||||
Ratio of net investment income to average net assets | 2.66 | % | 2.39 | % | 2.48 | %(3) | |||||||||
Portfolio turnover rate | 72.84 | % | 103.97 | % | 122.00 | %(5) | |||||||||
| * | Commencement of operations. |
| (1) | The selected per share data was calculated using the average shares outstanding method for the year. |
| (2) | Total investment return is calculated assuming a purchase of shares on the first day and a sale of shares on the last day of each period reported and includes reinvestment of dividends and distributions, if any. Total returns for periods less than one year are not annualized. Total investment return does not reflect the impact of the maximum front-end sales load of 5.75%. If reflected, the return would be lower. |
| (3) | Annualized. |
| (4) | During the period, certain fees were waived and/or reimbursed; or recouped, if any. If such fee waivers and/or reimbursements or recoupments had not occurred, the ratios would have been as indicated (See Note 2). |
| (5) | Reflects portfolio turnover of the Fund for the year ended April 30, 2015. |
The accompanying notes are an integral part of the financial statements.
12
SKYBRIDGE DIVIDEND VALUE FUND
Financial Highlights (Continued)
Contained below is per share operating performance data for Class C Shares outstanding, total investment return, ratios to average net assets and other supplemental data for the respective period. The total returns in the table represent the rate that an investor would have earned or lost on an investment in the Fund (assuming reinvestment of all dividends and distributions). This information has been derived from information provided in the financial statements and should be read in conjunction with the financial statements and the notes thereto.
| Class C Shares | |||||||||||||||
| For the Year Ended April 30, 2017 | For the Year Ended April 30, 2016 | For the Period October 17, 2014* to April 30, 2015 | |||||||||||||
Per Share Operating Performance | |||||||||||||||
Net asset value, beginning of period | $ | 11.26 | $ | 11.25 | $ | 9.95 | |||||||||
|
|
|
|
|
| ||||||||||
Net investment income(1) | 0.22 | 0.18 | 0.08 | ||||||||||||
Net realized and unrealized gain on investments | 0.30 | 0.23 | 1.33 | ||||||||||||
|
|
|
|
|
| ||||||||||
Net increase in net assets resulting from operations | 0.52 | 0.41 | 1.41 | ||||||||||||
|
|
|
|
|
| ||||||||||
Dividends and distributions to shareholders from: | |||||||||||||||
Net investment income | (0.22 | ) | (0.18 | ) | (0.09 | ) | |||||||||
Net realized capital gains | (0.38 | ) | (0.22 | ) | (0.02 | ) | |||||||||
|
|
|
|
|
| ||||||||||
Total dividends and distributions to shareholders | (0.60 | ) | (0.40 | ) | (0.11 | ) | |||||||||
|
|
|
|
|
| ||||||||||
Net asset value, end of period | $ | 11.18 | $ | 11.26 | $ | 11.25 | |||||||||
|
|
|
|
|
| ||||||||||
Total investment return(2) | 4.61 | % | 3.95 | % | 14.26 | % | |||||||||
Ratio/Supplemental Data | |||||||||||||||
Net assets, end of period (in thousands) | $ | 55,710 | $ | 43,537 | $ | 6,819 | |||||||||
Ratio of expenses to average net assets | 2.00 | % | 2.00 | % | 2.00 | %(3) | |||||||||
Ratio of expenses to average net assets without waivers and expense reimbursements(4) | 1.94 | % | 2.03 | % | 2.32 | %(3) | |||||||||
Ratio of net investment income to average net assets | 1.91 | % | 1.65 | % | 1.46 | %(3) | |||||||||
Portfolio turnover rate | 72.84 | % | 103.97 | % | 122.00 | %(5) | |||||||||
| * | Commencement of operations. |
| (1) | The selected per share data was calculated using the average shares outstanding method for the year. |
| (2) | Total investment return is calculated assuming a purchase of shares on the first day and a sale of shares on the last day of each period reported and includes reinvestment of dividends and distributions, if any. Total returns for periods less than one year are not annualized. Total return does not reflect any applicable sales charge. |
| (3) | Annualized. |
| (4) | During the period, certain fees were waived and/or reimbursed; or recouped, if any. If such fee waivers and/or reimbursements or recoupments had not occurred, the ratios would have been as indicated (See Note 2). |
| (5) | Reflects portfolio turnover of the Fund for the year ended April 30, 2015. |
The accompanying notes are an integral part of the financial statements.
13
SKYBRIDGE DIVIDEND VALUE FUND
Financial Highlights (Concluded)
Contained below is per share operating performance data for Class I Shares outstanding, total investment return, ratios to average net assets and other supplemental data for the respective period. The total returns in the table represent the rate that an investor would have earned or lost on an investment in the Fund (assuming reinvestment of all dividends and distributions). This information has been derived from information provided in the financial statements and should be read in conjunction with the financial statements and the notes thereto.
| Class I Shares | ||||||||||||||||||||
| For the Year Ended April 30, 2017 | For the Year Ended April 30, 2016 | For the Year Ended April 30, 2015 | For the Period April 7, 2014* to April 30, 2014 | |||||||||||||||||
Per Share Operating Performance | ||||||||||||||||||||
Net asset value, beginning of period | $ | 11.31 | $ | 11.26 | $ | 10.23 | $ | 10.00 | ||||||||||||
|
|
|
|
|
|
|
| |||||||||||||
Net investment income(1) | 0.33 | 0.28 | 0.29 | — | (2) | |||||||||||||||
Net realized and unrealized gain on investments | 0.29 | 0.25 | 0.98 | 0.23 | ||||||||||||||||
|
|
|
|
|
|
|
| |||||||||||||
Net increase in net assets resulting from operations | 0.62 | 0.53 | 1.27 | 0.23 | ||||||||||||||||
|
|
|
|
|
|
|
| |||||||||||||
Dividends and distributions to shareholders from: | ||||||||||||||||||||
Net investment income | (0.31 | ) | (0.26 | ) | (0.22 | ) | — | |||||||||||||
Net realized capital gains | (0.38 | ) | (0.22 | ) | (0.02 | ) | — | |||||||||||||
|
|
|
|
|
|
|
| |||||||||||||
Total dividends and distributions to shareholders | (0.69 | ) | (0.48 | ) | (0.24 | ) | — | |||||||||||||
|
|
|
|
|
|
|
| |||||||||||||
Net asset value, end of period | $ | 11.24 | $ | 11.31 | $ | 11.26 | $ | 10.23 | ||||||||||||
|
|
|
|
|
|
|
| |||||||||||||
Total investment return(3) | 5.57 | % | 5.09 | % | 12.54 | % | 2.30 | % | ||||||||||||
Ratio/Supplemental Data | ||||||||||||||||||||
Net assets, end of period (in thousands) | $ | 259,629 | $ | 223,510 | $ | 55,918 | $ | 117 | ||||||||||||
Ratio of expenses to average net assets | 1.00 | % | 1.00 | % | 1.00 | % | 1.00 | %(4) | ||||||||||||
Ratio of expenses to average net assets without waivers and expense reimbursements(5) | 0.94 | % | 1.03 | % | 1.63 | % | 646.65 | %(4) | ||||||||||||
Ratio of net investment income to average net assets | 2.91 | % | 2.64 | % | 2.70 | % | 0.79 | %(4) | ||||||||||||
Portfolio turnover rate | 72.84 | % | 103.97 | % | 122.00 | % | 1.98 | %(6) | ||||||||||||
| * | Commencement of operations. |
| (1) | The selected per share data was calculated using the average shares outstanding method for the year. |
| (2) | Amount is less than $0.005 per share. |
| (3) | Total investment return is calculated assuming a purchase of shares on the first day and a sale of shares on the last day of each period reported and includes reinvestment of dividends and distributions, if any. |
| (4) | Annualized. |
| (5) | During the period, certain fees were waived and/or reimbursed; or recouped, if any. If such fee waivers and/or reimbursements or recoupments had not occurred, the ratios would have been as indicated (See Note 2). |
| (6) | Not annualized. |
The accompanying notes are an integral part of the financial statements.
14
SKYBRIDGE DIVIDEND VALUE FUND
Notes to Financial Statements
April 30, 2017
1. Organization and Significant Accounting Policies
The SkyBridge Dividend Value Fund (the “Fund”) is a diversified, open-end management investment company registered under the Investment Company Act of 1940, as amended (the “1940 Act”), which commenced operations on April 7, 2014. The Fund is a separate series of FundVantage Trust (the “Trust”) which was organized as a Delaware statutory trust on August 28, 2006. The Trust is a “series trust” authorized to issue an unlimited number of separate series or classes of shares of beneficial interest. Each series is treated as a separate entity for certain matters under the 1940 Act, and for other purposes, and a shareholder of one series is not deemed to be a shareholder of any other series. The Fund offers Class A, Class C and Class I Shares. Class A Shares are sold subject to a front-end sales charge. Front-end sales charges may be reduced or waived under certain circumstances. A contingent deferred sales charge (“CDSC”) may be applicable to the purchase of Class A Shares. A CDSC, as a percentage of the lower of the original purchase price or net asset value at redemption, of up to 1.00% may be imposed on full or partial redemptions of Class A Shares made within eighteen months of purchase where: (i) $1 million or more of Class A Shares were purchased without an initial sales charge and (ii) the selling broker-dealer received a commission for such sale.
The Fund is an investment company and follows accounting and reporting guidance in the Financial Accounting Standards Board Accounting Standards Codification Topic 946.
Portfolio Valuation — The Fund’s net asset value (“NAV”) is calculated once daily at the close of regular trading hours on the New York Stock Exchange (“NYSE”) (typically 4:00 p.m. Eastern time) on each day the NYSE is open. Securities held by the Fund are valued using the closing price or the last sale price on a national securities exchange or the National Association of Securities Dealers Automatic Quotation System (“NASDAQ”) market system where they are primarily traded. Equity securities traded in the over-the-counter market are valued at their closing prices. If there were no transactions on that day, securities traded principally on an exchange or on NASDAQ will be valued at the mean of the last bid and ask prices prior to the market close. Fixed income securities having a remaining maturity of greater than 60 days are valued using an independent pricing service. Fixed income securities having a remaining maturity of 60 days or less are generally valued at amortized cost, provided such amount approximates fair value. Investments in other open-end investment companies are valued based on the NAV of the investment companies (which may use fair value pricing as discussed in their prospectuses). If market quotations are unavailable or deemed unreliable, securities will be valued in accordance with procedures adopted by the FundVantage Trust’s Board of Trustees. Relying on prices supplied by pricing services or dealers or using fair valuation may result in values that are higher or lower than the values used by other investment companies and investors to price the same investments. In the event that market quotes are not readily available, and the security or asset cannot be valued pursuant to one of the valuation methods, the value of the security or asset will be determined in good faith by the Adviser. The Trust has established a Valuation Committee which performs certain functions including the oversight of the Adviser’s fair valuation determinations.
15
SKYBRIDGE DIVIDEND VALUE FUND
Notes to Financial Statements (Continued)
April 30, 2017
Fair Value Measurements — The inputs and valuation techniques used to measure fair value of the Fund’s investments are summarized into three levels as described in the hierarchy below:
| • Level 1 — | quoted prices in active markets for identical securities; |
| • Level 2 — | other significant observable inputs (including quoted prices for similar securities, interest rates, prepayment speeds, credit risk, etc.); and |
| • Level 3 — | significant unobservable inputs (including the Fund’s own assumptions in determining the fair value of investments). |
The inputs or methodology used for valuing securities are not necessarily an indication of the risk associated with investing in those securities.
The following is a summary of the inputs used, as of April 30, 2017, in valuing the Fund’s investments carried at fair value:
| Total Value at 04/30/17 | Level 1 Quoted Prices | Level 2 Other Significant Observable Inputs | Level 3 Significant Unobservable Inputs | |||||||||||||
Investment in Securities* | $ | 441,961,104 | $ | 441,961,104 | $ | — | $ | — | ||||||||
|
|
|
|
|
|
|
| |||||||||
| * | Please refer to Portfolio of Investments for further details on portfolio holdings. |
At the end of each quarter, management evaluates the classification of Levels 1, 2 and 3 assets and liabilities. Various factors are considered, such as changes in liquidity from the prior reporting period; whether or not a broker is willing to execute at the quoted price; the depth and consistency of prices from third party pricing services; and the existence of contemporaneous, observable trades in the market. Additionally, management evaluates the classification of Level 1 and Level 2 assets and liabilities on a quarterly basis for changes in listings or delistings on national exchanges.
Due to the inherent uncertainty of determining the fair value of investments that do not have a readily available market value, the fair value of the Fund’s investments may fluctuate from period to period. Additionally, the fair value of investments may differ significantly from the values that would have been used had a ready market existed for such investments and may differ materially from the values the Fund may ultimately realize. Further, such investments may be subject to legal and other restrictions on resale or otherwise less liquid than publicly traded securities.
For fair valuations using significant unobservable inputs, U.S. generally accepted accounting principles (“U.S. GAAP”) require the Fund to present a reconciliation of the beginning to ending balances for reported market values that presents changes attributable to total realized and unrealized gains or losses, purchase
16
SKYBRIDGE DIVIDEND VALUE FUND
Notes to Financial Statements (Continued)
April 30, 2017
and sales, and transfers in and out of Level 3 during the period. Transfers in and out between Levels are based on values at the end of the period. U.S. GAAP also requires the Fund to disclose amounts and reasons for all transfers in and out of Level 1 and Level 2 fair value measurements. A reconciliation of Level 3 investments is presented only when the Fund had an amount of Level 3 investments at the end of the reporting period that was meaningful in relation to its net assets. The amounts and reasons for all transfers in and out of each Level within the three-tier hierarchy are disclosed when the Fund had an amount of total transfers during the reporting period that was meaningful in relation to its net assets as of the end of the reporting period.
For the year ended April 30, 2017, there were no transfers between Levels 1, 2 and 3 for the Fund.
Use of Estimates — The preparation of financial statements in conformity with U.S. GAAP requires management to make estimates and assumptions that affect the amounts reported in the financial statements and accompanying notes at the date of the financial statements and the reported amounts of revenues and expenses during the period. Actual results could differ from those estimates and those differences could be material.
Investment Transactions, Investment Income and Expenses — Investment transactions are recorded on trade date for financial statement preparation purposes. Realized gains and losses on investments sold are recorded on the identified cost basis. Interest income is recorded on the accrual basis. Dividends are recorded on the ex-dividend date. Distribution (12b-1) fees and shareholder services fees relating to a specific class are charged directly to that class. General expenses of the Trust are generally allocated to each fund in proportion to its relative daily net assets. Expenses directly attributable to a particular fund in the Trust are charged directly to that fund. The Fund’s investment income, expenses (other than class-specific expenses) and unrealized and realized gains and losses are allocated daily to each class of shares based upon the relative proportion of net assets of each class at the beginning of the day.
Dividends and Distributions to Shareholders — Dividends from net investment income are declared and paid quarterly to shareholders. Distributions, if any, of net short-term capital gain and net capital gain (the excess of net long-term capital gain over the short-term capital loss) realized by the Fund, after deducting any available capital loss carryovers, are declared and paid to its shareholders annually. Income dividends and capital gain distributions are determined in accordance with U.S. federal income tax regulations, which may differ from U.S. GAAP. These differences may include the treatment of non-taxable dividends, expiring capital loss carryforwards and losses deferred due to wash sales and excise tax regulations. Permanent book and tax basis differences relating to shareholder distributions will result in reclassifications within the components of net assets.
17
SKYBRIDGE DIVIDEND VALUE FUND
Notes to Financial Statements (Continued)
April 30, 2017
U.S. Tax Status — No provision is made for U.S. income taxes as it is the Fund’s intention to continue to qualify for and elect the tax treatment applicable to regulated investment companies under Subchapter M of the Internal Revenue Code of 1986, as amended (the “Internal Revenue Code”), and make the requisite distributions to its shareholders which will be sufficient to relieve it from U.S. income and excise taxes.
Other — In the normal course of business, the Fund may enter into contracts that provide general indemnifications. The Fund’s maximum exposure under these arrangements is dependent on claims that may be made against the Fund in the future, and therefore, cannot be estimated; however, based on experience, the risk of material loss for such claims is considered remote.
Recent Accounting Pronouncement — In October 2016, the U.S. Securities and Exchange Commission (“SEC”) issued a new rule, Investment Company Reporting Modernization, which, among other provisions, amends Regulation S-X to require standardized, enhanced disclosures, particularly related to derivatives, in investment company financial statements. Compliance with the amendments to Regulation S-X is required for financial statements filed with the SEC on or after August 1, 2017. Management is currently evaluating the impact that the amendments will have on the Fund’s financial statements and related disclosures.
2. Transactions with Related Parties and Other Service Providers
SkyBridge Capital II, LLC (“SkyBridge” or the “Adviser”) serves as investment adviser to the Fund pursuant to an investment advisory agreement with the Trust (the “Advisory Agreement”). For its services, the Adviser is paid a monthly fee at the annual rate of 0.75% of the Fund’s average daily net assets. The Adviser has contractually agreed to reduce its management fee and/or reimburse certain expenses of the Fund to the extent necessary to ensure that the Fund’s total operating expenses (excluding taxes, “Acquired Fund” fees and expenses, interest, extraordinary items and brokerage commissions) do not exceed (on an annual basis) 1.25% with respect to Class A shares, 2.00% with respect to Class C shares and 1.00% with respect to Class I shares of average daily net assets of the Fund (the “Expense Limitation”). The Expense Limitation will remain in place until August 31, 2018, unless the Board of Trustees of FundVantage Trust (the “Trust”) approves its earlier termination. The Adviser is entitled to recover, subject to approval by the Board of Trustees, such amounts reduced or reimbursed for a period of up to three (3) years from the year in which the Adviser reduced its compensation and/or assumed expenses for the Fund. The Adviser is permitted to seek reimbursement from the Fund, subject to certain limitations, for fees it waived and Fund expenses it paid to the extent the total annual fund expenses do not exceed the limits described above or any lesser limits in effect at the time of reimbursement. No recoupment will occur unless the Fund’s expenses are below the Expense Limitation amount. As of April 30, 2017, the amount of potential recovery was as follows:
| Expiration | ||||
| ||||
| April 30, 2018 | April 30, 2019 | Total | ||
|
|
| ||
| $29,981 | $70,108 | $100,089 | ||
18
SKYBRIDGE DIVIDEND VALUE FUND
Notes to Financial Statements (Continued)
April 30, 2017
For the year ended April 30, 2017, the Adviser earned advisory fees of $3,261,945 and recouped fees of $246,020 waived in prior periods.
Other Service Providers
BNY Mellon Investment Servicing (US) Inc. (“BNY Mellon”) serves as administrator and transfer agent for the Fund. For providing administrative and accounting services, BNY Mellon is entitled to receive a monthly fee equal to an annual percentage rate of the Fund’s average daily net assets, subject to certain minimum monthly fees. For providing transfer agency services, BNY Mellon is entitled to receive a monthly fee, subject to certain minimum, and out of pocket expenses.
The Bank of New York Mellon (the “Custodian”) provides certain custodial services to the Fund. The Custodian is entitled to receive a monthly fee, subject to certain minimum, and out of pocket expenses.
Foreside Funds Distributors LLC (the “Underwriter”) provides principal underwriting services to the Fund.
The Trust and the Underwriter are parties to an underwriting agreement. The Trust has adopted a distribution plan for Class A and Class C Shares in accordance with Rule 12b-1 under the 1940 Act. Pursuant to the Class A and Class C Shares plan, the Fund compensates the Underwriter for direct and indirect costs and expenses incurred in connection with advertising, marketing and other distribution services in an amount not to exceed 0.25% and 1.00% (0.75% Rule 12b-1 distribution fee and 0.25% shareholder service fee), respectively, on an annualized basis of the average daily net assets of the Fund’s Class A and Class C Shares.
Trustees and Officers
The Trust is governed by its Board of Trustees. The Trustees receive compensation in the form of an annual retainer and per meeting fees for their services to the Trust. The remuneration paid to the Trustees by the Fund during the year ended April 30, 2017 was $38,304. An employee of BNY Mellon serves as the Secretary of the Trust and is not compensated by the Fund or the Trust.
Effective June 1, 2016 and July 1, 2016, JW Fund Management LLC (“JWFM”) provides a Principal Executive Officer and Principal Financial Officer, respectively, to the Trust. JWFM is compensated for the services provided to the Trust. Until May 31, 2016 and June 30, 2016, certain employees of BNY Mellon served as Principal Executive Officer and Principal Financial Officer, respectively, to the Trust. They were not compensated by the Trust or the Funds.
19
SKYBRIDGE DIVIDEND VALUE FUND
Notes to Financial Statements (Continued)
April 30, 2017
Freeh Group International Solutions, LLC provides the Trust with a Chief Compliance Officer and an Anti-Money Laundering Officer.
3. Investment in Securities
For the year ended April 30, 2017, aggregate purchases and sales of investment securities (excluding short-term investments) of the Fund were as follows:
| Purchases | Sales | |||||||
Investment Securities | $ | 418,964,500 | $ | 313,672,817 | ||||
4. Capital Share Transactions
For the years ended April 30, 2017 and 2016, transactions in capital shares (authorized shares unlimited) were as follows:
| For the Year Ended April 30, 2017 | For the Year Ended April 30, 2016 | |||||||||||||||
| Shares | Amount | Shares | Amount | |||||||||||||
Class A Shares | ||||||||||||||||
Sales | 7,970,106 | $ | 86,387,541 | 2,375,219 | $ | 25,416,434 | ||||||||||
Reinvestments | 555,865 | 6,331,928 | 147,829 | 1,565,873 | ||||||||||||
Redemptions | (2,303,120 | ) | (26,136,355 | ) | (815,613 | ) | (8,746,244 | ) | ||||||||
|
|
|
|
|
|
|
| |||||||||
Net increase | 6,222,851 | $ | 66,583,114 | 1,707,435 | $ | 18,236,063 | ||||||||||
|
|
|
|
|
|
|
| |||||||||
Class C Shares | ||||||||||||||||
Sales | 2,451,816 | $ | 27,626,953 | 3,411,488 | $ | 36,649,725 | ||||||||||
Reinvestments | 111,394 | 1,264,111 | 41,827 | 442,128 | ||||||||||||
Redemptions | (1,445,109 | ) | (16,207,123 | ) | (193,153 | ) | (2,074,568 | ) | ||||||||
|
|
|
|
|
|
|
| |||||||||
Net increase | 1,118,101 | $ | 12,683,941 | 3,260,162 | $ | 35,017,285 | ||||||||||
|
|
|
|
|
|
|
| |||||||||
Class I Shares | ||||||||||||||||
Sales | 13,024,377 | $ | 148,223,386 | 16,956,162 | $ | 183,385,867 | ||||||||||
Reinvestments | 924,852 | 10,539,213 | 360,370 | 3,826,400 | ||||||||||||
Redemptions | (10,623,460 | ) | (119,568,216 | ) | (2,510,749 | ) | (26,768,935 | ) | ||||||||
|
|
|
|
|
|
|
| |||||||||
Net increase | 3,325,769 | $ | 39,194,383 | 14,805,783 | $ | 160,443,332 | ||||||||||
|
|
|
|
|
|
|
| |||||||||
Total Net Increase | 10,666,721 | $ | 118,461,438 | 19,773,380 | $ | 213,696,680 | ||||||||||
|
|
|
|
|
|
|
| |||||||||
20
SKYBRIDGE DIVIDEND VALUE FUND
Notes to Financial Statements (Continued)
April 30, 2017
5. Federal Tax Information
The Fund has followed the authoritative guidance on accounting for and disclosure of uncertainty in tax positions, which requires the Fund to determine whether a tax position is more likely than not to be sustained upon examination, including resolution of any related appeals or litigation processes, based on the technical merits of the position. The Fund has determined that there was no effect on the financial statements from following this authoritative guidance. In the normal course of business, the Fund is subject to examination by federal, state and local jurisdictions, where applicable, for tax years for which applicable statutes of limitations have not expired.
Distributions are determined in accordance with federal income tax regulations, which may differ in amount or character from net investment income and realized gains for financial reporting purposes. Accordingly, the character of distributions and composition of net assets for tax purposes may differ from those reflected in the accompanying financial statements. To the extent these differences are permanent, such amounts are reclassified within the components of net assets based on the tax treatment; temporary differences do not require reclassifications. For the year ended April 30, 2017, there are no reclassifications.
For the year ended April 30, 2017, the tax character of distributions paid by the Fund was $20,570,952 of ordinary income dividends and $5,953,205 of long-term capital gains dividends. For the year ended April 30, 2016, the tax character of distribution paid by the Fund was $8,824,556 of ordinary income and $5,448 of long-term capital gains dividends. Distributions from short-term capital gains are treated as ordinary income for federal income tax purposes.
As of April 30, 2017, the components of distributable earnings on a tax basis were as follows:
Capital Loss Carryforward | Undistributed Ordinary Income | Undistributed Long-Term Gain | Unrealized Appreciation | |||
| $ — | $8,775,866 | $4,280,405 | $1,935,280 |
The differences between the book and tax basis components of distributable earnings relate primarily to the timing and recognition of income and gains for federal income tax purposes. Short-term capital gains are reported as ordinary income for federal income tax purposes.
As of April 30, 2017, the federal tax cost, aggregate gross unrealized appreciation and depreciation of securities held by the Fund were as follows:
Federal tax cost | $ | 440,025,824 | ||||
|
| |||||
Gross unrealized appreciation | $ | 30,095,566 | ||||
Gross unrealized depreciation | (28,160,286 | ) | ||||
|
| |||||
Net unrealized appreciation | $ | 1,935,280 | ||||
|
| |||||
21
SKYBRIDGE DIVIDEND VALUE FUND
Notes to Financial Statements (Concluded)
April 30, 2017
Pursuant to the federal income tax rules applicable to regulated investment companies, the Fund may elect to treat certain capital losses between November 1 and April 30 and late year ordinary losses ((i) ordinary losses between January 1 and April 30, and (ii) specified ordinary and currency losses between November 1 and April 30) as occurring on the first day of the following tax year. For the year ended April 30, 2017, the Fund had no short-term capital loss deferrals and no long-term capital loss deferrals.
Accumulated capital losses represent net capital loss carryforwards as of April 30, 2017 that may be available to offset future realized capital gains and thereby reduce future capital gains distributions. As of April 30, 2017, the Fund did not have any capital loss carryforwards.
6. Subsequent Events
Management has evaluated the impact of all subsequent events on the Fund through the date the financial statements were issued and has determined that there was the following subsequent event:
On January 17, 2017, current owners of SkyBridge Capital II, LLC, the Adviser to the Fund, (“SkyBridge” or the “Adviser”) agreed to sell a majority ownership interest in SkyBridge to HNA Capital (U.S.) Holding (“HNA”) and RON Transatlantic EG (“RON Transatlantic”). RON Transatlantic is a current minority owner of SkyBridge. The transaction is not expected to result in any change in the investment personnel, investment objectives, policies or processes of the Fund.
The closing of the transaction will result in the automatic termination of the current investment advisory agreement between the Trust, on behalf of the Fund, and SkyBridge (“Current Agreement”). At an in-person meeting held on March 29 and 30, 2017, the Board of Trustees of the Trust (“Board”) unanimously approved a new investment advisory agreement (“New Agreement”) between the Trust on behalf of the Fund, and SkyBridge, under which SkyBridge will serve as investment adviser to the Fund, subject to the New Agreement’s approval by the Fund’s shareholders. The New Agreement, which is identical to the Current Agreement in all material respects, is expected to take effect immediately upon the closing of the Transaction after approval by the Fund’s shareholders.
The New Agreement was approved at a Special Meeting of the Fund’s Shareholders on June 15, 2017.
The transaction is expected to close in the third quarter of 2017. There can be no assurance that the transaction will be consummated as contemplated.
22
SKYBRIDGE DIVIDEND VALUE FUND
Report of Independent Registered Public Accounting Firm
To the Board of Trustees of the FundVantage Trust
and Shareholders of the SkyBridge Dividend Value Fund:
In our opinion, the accompanying statement of assets and liabilities, including the portfolio of investments, and the related statements of operations and of changes in net assets and the financial highlights present fairly, in all material respects, the financial position of the SkyBridge Dividend Value Fund (one of the funds constituting FundVantage Trust and hereafter referred to as the “Fund”) as of April 30, 2017, the results of its operations, the changes in its net assets and its financial highlights for the year then ended, in conformity with accounting principles generally accepted in the United States of America. These financial statements and financial highlights (hereafter referred to as “financial statements”) are the responsibility of the Fund’s management. Our responsibility is to express an opinion on these financial statements based on our audit. We conducted our audit of these financial statements in accordance with the standards of the Public Company Accounting Oversight Board (United States). Those standards require that we plan and perform the audit to obtain reasonable assurance about whether the financial statements are free of material misstatement. An audit includes examining, on a test basis, evidence supporting the amounts and disclosures in the financial statements, assessing the accounting principles used and significant estimates made by management, and evaluating the overall financial statement presentation. We believe that our audit, which included confirmation of securities as of April 30, 2017 by correspondence with the custodian, provides a reasonable basis for our opinion. The financial statements of the Fund as of and for the year ended April 30, 2016 (not presented herein, other than the statement of changes in net assets) and the financial highlights for each of the periods ended on or prior to April 30, 2016 were audited by other auditors whose report, dated June 27, 2016, expressed an unqualified opinion on those financial statements and financial highlights.
PricewaterhouseCoopers LLP
Philadelphia, Pennsylvania
June 28, 2017
23
SKYBRIDGE DIVIDEND VALUE FUND
Shareholder Tax Information
(Unaudited)
The Fund is required by Subchapter M of the Internal Revenue Code, to advise its shareholders of the U.S. federal tax status of distributions received by the Fund’s shareholders in respect of such fiscal year. During the fiscal year ended April 30, 2017, the Fund paid $20,570,952 of ordinary income dividends and $5,953,205 of long-term capital gain dividends to its shareholders. Dividends from net investment income and short-term capital gains are treated as ordinary income dividends for federal income tax purposes.
The Fund designates 67.29% of the ordinary income distribution as qualified dividend income pursuant to the Jobs and Growth Tax Relief Reconciliation Act of 2003.
The percentage of ordinary income dividends qualifying for the corporate dividends received deduction is 65.24%.
The Fund designates 100.00% of the ordinary income distributions as qualified short-term gain pursuant to the American Jobs Creation Act of 2004.
All designations are based on financial information available as of the date of this annual report and, accordingly, are subject to change. For each item, it is the intention of the Fund to designate the maximum amount permitted under the Internal Revenue Code of 1986, as amended, and the regulations thereunder.
Because the Fund’s fiscal year is not the calendar year, another notification will be sent with respect to calendar year 2017. The second notification, which will reflect the amount, if any, to be used by calendar year taxpayers on their U.S. federal income tax returns, will be made in conjunction with Form 1099-DIV and will be mailed in January 2018.
Foreign shareholders will generally be subject to U.S. withholding tax on the amount of their ordinary income dividends. They will generally not be entitled to a foreign tax credit or deduction for the withholding taxes paid by the Fund, if any.
In general, dividends received by tax-exempt recipients (e.g., IRAs and Keoghs) need not be reported as taxable income for U.S. federal income tax purposes. However, some retirement trusts (e.g., corporate, Keogh and 403(b)(7) plans) may need this information for their annual information reporting.
Shareholders are advised to consult their own tax advisers with respect to the tax consequences of their investment in the Fund.
24
SKYBRIDGE DIVIDEND VALUE FUND
Other Information
(Unaudited)
Change in Independent Registered Public Accounting Firm
As a result of the anticipated change of control of the investment adviser to the SkyBridge Dividend Value Fund (the “Fund”), Ernst & Young LLP (“EY”) has resigned as the independent registered public accounting firm for the Fund effective March 29, 2017. Effective March 29, 2017, the Board of Trustees of FundVantage Trust (the “Trust”), upon recommendation of the Audit Committee, selected PricewaterhouseCoopers LLP (“PwC”) to serve as the independent registered public accounting firm for the Fund for the fiscal year ending April 30, 2017.
EY’s reports on the Fund’s financial statements for the Fund’s two most recently completed fiscal years ended April 30, 2016 and April 30, 2015 did not contain any adverse opinion or disclaimer of opinion, and were not qualified or modified as to uncertainty, audit scope, or accounting principles. During each fiscal year end referred to above, and for the period May 1, 2016 through EY’s resignation on March 29, 2017: (i) there were no disagreements between the Fund and EY on any matter of accounting principles or practices, financial statement disclosure, or auditing scope or procedure, which disagreements, if not resolved to the satisfaction of EY, would have caused it to make reference to the subject matter of the disagreements in connection with its reports; and (ii) there were no “reportable events” within the meaning of Item 304, paragraph (a)(1)(v), of Regulation S-K under the Securities Exchange Act of 1934, as amended (“Regulation S-K”).
As indicated above, the Trust has appointed PwC as the independent registered public accounting firm to audit the Fund’s financial statements for the fiscal year ending April 30, 2017. During the Fund’s fiscal years ended April 30, 2016 and April 30, 2015, and for the period from May 1, 2016 through March 29, 2017, neither the Trust nor anyone on its behalf has consulted PwC on items which: (i) concerned the application of accounting principles to a specified transaction, either completed or proposed, or the type of audit opinion that might be rendered on the Fund’s financial statements; or (ii) concerned the subject of a disagreement (as defined in paragraph (a)(1)(iv) of Item 304 of Regulation S-K) or reportable events (as described in paragraph (a)(1)(v) of said Item 304).
Proxy Voting
Policies and procedures that the Fund uses to determine how to vote proxies relating to portfolio securities as well as information regarding how the Fund voted proxies relating to portfolio securities for the most recent 12-month period ended June 30 are available without charge, upon request, by calling (888) 919-6885 and on the Securities and Exchange Commission’s (“SEC”) website at http:// www.sec.gov.
25
SKYBRIDGE DIVIDEND VALUE FUND
Other Information (Continued)
(Unaudited)
Quarterly Portfolio Schedules
The Trust files its complete schedule of portfolio holdings with the SEC for the first and third fiscal quarters of each fiscal year (quarters ended July 31 and January 31) on Form N-Q. The Trust’s Forms N-Q are available on the SEC’s website at http://www.sec.gov and may be reviewed and copied at the SEC’s Public Reference Room in Washington, D.C. Information on the operation of the SEC’s Public Reference Room may be obtained by calling 1-800-SEC-0330.
Approval of Advisory Agreement:
At an in-person meeting held on March 29-30, 2017 (the “Meeting”), the Board of Trustees (the “Board” or “Trustees”) of FundVantage Trust (“Trust”), including a majority of the Trustees who are not “interested persons” as defined in the Investment Company Act of 1940, as amended (“1940 Act”) (the “Independent Trustees”), unanimously approved an investment advisory agreement between SkyBridge Capital II, LLC (the “Adviser” or “SkyBridge”) and the Trust on behalf of the SkyBridge Dividend Value Fund (the “Fund”) for an additional one-year period (the “Current Agreement”). Also, the Board, including a majority of the Independent Trustees, unanimously approved an interim investment advisory agreement (the “Interim Agreement”) and a new investment advisory agreement (the “New Agreement” and with the Current Agreement and the Interim Agreement, the “Agreements”), each between the Trust, on behalf of the Fund, and SkyBridge. The Interim Agreement and New Agreement were approved by the Board in anticipation of a transaction whereby the majority owners of SkyBridge agreed to sell all or substantially all of their membership interests in SkyBridge to HNA Capital (U.S.) Holding LLC and TFH Acquisition I LLC. This transaction (the “Transaction”) will result in a change of control of the Fund’s Adviser (the “Change of Control”) and the automatic termination of the Current Agreement.
The New Agreement was subject to shareholder approval, which was obtained on June 15, 2017, will become effective upon the closing of the Transaction. In order for SkyBridge to provide uninterrupted services to the Fund in the event the Transaction closed before shareholder approval of the New Agreement is obtained, the Board, including a majority of the independent Trustees, approved the Interim Agreement.
Before considering the Agreements, the Board including the Independent Trustees, requested information about the Transaction and considered information provided by the Adviser in accordance with Section 15(c) of the 1940 Act. The Trustees considered information that the Adviser provided regarding (i) the services performed for the Fund, (ii) the size and qualifications of the Adviser’s portfolio management staff, (iii) any potential or actual material conflicts of interest which may arise in connection with a portfolio manager’s management of the Fund, (iv) investment performance, (v) the capitalization and financial condition of the Adviser, (vi) investment performance information, (vii) brokerage selection procedures (including soft dollar arrangements, if any), (viii) the procedures for allocating investment opportunities between the Fund and other clients, (ix) results of any independent audit or regulatory examination,
26
SKYBRIDGE DIVIDEND VALUE FUND
Other Information (Continued)
(Unaudited)
including any recommendations or deficiencies noted, (x) any litigation, investigation or administrative proceeding which may have a material impact on the Adviser’s ability to service the Fund, (xi) compliance with the Fund’s investment objective, policies and practices (including codes of ethics and proxy voting policies), federal securities laws and other regulatory requirements, and (xii) the Change of Control and its impact on the services provided by SkyBridge to the Fund. The Trustees noted the reports provided at Board meetings throughout the year covering matters such as the relative performance of the Fund; compliance with the investment objective, policies, strategies and limitations for the Fund; the compliance of management personnel with the applicable code of ethics; and the adherence to pricing procedures as established by the Board. The Trustees also received and reviewed a memorandum from legal counsel regarding the legal standard applicable to their review of Agreements.
At the Board Meeting, representatives from SkyBridge joined the meeting in-person and via teleconference and discussed the Change of Control, including the background of and reasons for the Change of Control. They also discussed SkyBridge’s history, performance, investment strategy, and compliance program in connection with the approval of the Agreements. Representatives of SkyBridge responded to questions from the Board. The Trustees inquired about the plans for, and the new roles and responsibilities of, certain employees and officers of SkyBridge as a result of the Change of Control. In connection with the Trustees’ review of the Interim Agreement and the New Agreement, the representatives from SkyBridge emphasized that: (i) it is expected that there will be no adverse changes as a result of the Change of Control in the nature, quality, or extent of services currently provided to the Fund and its shareholders, including investment management, distribution, or other shareholder services; (ii) it is expected that there will be no material adverse effects on SkyBridge’s financial condition; (iii) it is expected that there will be no material changes in personnel or operations as they relate to the services provided to the Fund; and (iv) SkyBridge has no present intention to alter the expense limitations and reimbursements currently in effect for the Fund.
In addition to the information provided by SkyBridge as described above, the Trustees also considered all other factors they believed to be relevant to evaluating the Agreements, including the specific matters discussed below. In their deliberations, the Trustees did not identify any particular information that was controlling, and different Trustees may have attributed different weights to the various factors. However, the Trustees determined that the overall arrangements between the Fund and SkyBridge, as provided in the Agreements, including the proposed advisory fees, are fair and reasonable in light of the services to be performed, expenses incurred and such other matters as the Trustees considered relevant. Factors evaluated included: (i) the terms and conditions of the Agreements, including that the Fund’s contractual fee under the Interim Agreement and the New Agreement will remain the same as the fee under the Current Agreement; (ii) the Board’s determination that (a) SkyBridge has the capabilities, resources, and personnel necessary to provide the satisfactory advisory services currently provided to the Fund and (b) the advisory fees paid by the Fund, taking into account any applicable fee limitations, represent reasonable compensation to SkyBridge in light of the services provided, the costs to SkyBridge of providing those services, economies of scale, and the fees and other expenses paid by similar funds and such other
27
SKYBRIDGE DIVIDEND VALUE FUND
Other Information (Continued)
(Unaudited)
matters that the Board considered relevant in the exercise of their reasonable judgment; and (iii) the expectation that the operations of SkyBridge will not change as a result of the Change of Control. Certain of these considerations are discussed in more detail below.
In making their decision to approve the Agreements, the Trustees gave attention to the information furnished. The following discussion, however, identifies the primary factors taken into account by the Trustees and the conclusions reached in approving the Agreements.
Nature, Extent, and Quality of Services. The Trustees considered the services historically provided by SkyBridge to the Fund and its shareholders. In reviewing the nature, extent, and quality of services, the Board considered that the Interim Agreement and New Agreement will be substantially similar to the Current Agreement, and they considered the many reports furnished to them during the year at regular Board meetings covering matters such as the relative performance of the Fund; compliance with the investment objectives, policies, strategies, and limitations for the Fund; the compliance of management personnel with the applicable code of ethics; and the adherence to pricing procedures as established by the Board. The Trustees considered SkyBridge’s personnel and the depth of SkyBridge’s personnel who possess the experience to provide investment management services to the Fund. Based on the information provided by SkyBridge, including that no material changes are expected as a result of the Change of Control in SkyBridge’s personnel or operations as they relate to services provided by the Fund, the Trustees concluded that (i) the nature, extent and quality of the services provided by SkyBridge are appropriate and consistent with the terms of the Agreements, (ii) that the quality of those services has been consistent with industry norms, (iii) the Fund is likely to benefit from the continued provision of those services, (iv) SkyBridge has sufficient personnel, with the appropriate education and experience, to serve the Fund effectively and has demonstrated its continuing ability to attract and retain qualified personnel, and (v) the satisfactory nature, extent, and quality of services currently provided to the Fund and its shareholders is likely to continue under the Interim Agreement and the New Agreement.
Investment Performance. The Trustees considered the investment performance for the Fund and the Adviser. The Trustees reviewed historical performance charts prepared by a third-party, which showed the performance of the Fund as compared to the Lipper Equity Income category, the Fund’s Lipper peer group, for the one year, two year and since inception periods ended December 31, 2016. The Trustees noted that the Class A, Class C and Class I shares of the Fund had each (i) underperformed the Lipper Equity Income Index and the median of the Lipper Equity Income category for one year period ended December 31, 2016, and (ii) outperformed the Lipper Equity Income Index and the median of the Lipper Equity Income category for the two year and since inception periods ended December 31, 2016. The Trustees also received performance information for the Fund as compared to the S&P 500 Index for the one year period (for all classes) and the since inception period (Class I only). The Trustees noted that the Class A, Class C and Class I shares of the Fund had outperformed the S&P 500 Index for the one year period ended December 31, 2016 and that the Class I shares of the Fund had underperformed the S&P 500 Index for the since inception period ended December 31, 2016. The Trustees concluded that
28
SKYBRIDGE DIVIDEND VALUE FUND
Other Information (Continued)
(Unaudited)
the performance of the Fund was within an acceptable range of performance relative to other mutual funds with similar investment objectives, strategies and policies based on the information provided at the Meeting. The Board also concluded that neither the Change of Control nor the Interim Agreement and the New Agreement would likely have an adverse effect on the investment performance of the Fund because (i) SkyBridge does not currently expect the Change of Control to cause any change to the Fund’s portfolio manager responsible for investment performance and (ii) the Fund’s expenses are not expected to increase as a result of the Change of Control.
Comparative Expenses. The Trustees also noted that the Adviser had provided information regarding its advisory fees and an analysis of these fees in relation to the delivery of services to the Fund and any other ancillary benefit resulting from the Adviser’s relationship with the Fund. The Trustees considered the fees that the Adviser charges to certain other clients advised by SkyBridge, and evaluated the explanations provided by the Adviser as to differences in fees charged to the Fund and such accounts including that the Adviser did not manage other accounts in a comparable manner as the Fund. The Trustees also reviewed a peer comparison of advisory fees and total expenses for the Fund versus a universe of funds in the Lipper Equity Income category with $500 million or less in assets (the “Expense Universe”). The Trustees noted that the contractual advisory fee of the Fund’s Class A and Class I shares was equal to the median of the contractual advisory fee of Expense Universe and that the contractual advisory fee of the Fund’s Class C shares was higher than the median of the contractual advisory fee of the Expense Universe. The Trustees further noted that the net total expense ratios of the Fund’s Class A and Class I shares were slightly lower than the Expense Universe and that the net total expense ratio of the Fund’s Class C shares was higher than the median net total expense ratio of the Expense Universe. The Trustees concluded that the advisory fee and services provided by the Adviser are sufficiently consistent with those of other advisers that manage mutual funds with investment objectives, strategies and policies similar to those of the Fund based on the information provided at the Board Meeting. The Trustees considered whether the Change of Control would impact the services currently being provided to the Fund. Based on the information provided at the Board Meeting, the Trustees concluded that there would not be any material impact on the expenses of the Fund and services provided to the Fund as a result of the Change of Control.
Management Profitability. The Trustees considered the costs of the services provided by SkyBridge, the compensation and benefits received by SkyBridge in providing services to the Fund, and its profitability. The Trustees were provided with the Adviser’s unaudited balance sheet and statement of operations for the fiscal year ended December 31, 2016. In addition, the Trustees considered any direct or indirect revenues received by affiliates of SkyBridge. The Trustees noted that the level of profitability of SkyBridge in providing services to the Fund is an appropriate factor to consider, and the Trustees should be satisfied that SkyBridge’s profits are sufficient to continue as a healthy concern generally and an investment adviser of the Fund specifically. Based on the information provided, the Trustees concluded that SkyBridge’s fees and profits (if any) derived from its relationship with the Trust in light of the Fund’s expenses are reasonable in relation to the nature and quality of the services provided, taking into account the fees
29
SKYBRIDGE DIVIDEND VALUE FUND
Other Information (Continued)
(Unaudited)
charged by other advisers for managing comparable mutual funds with similar strategies. The Trustees also concluded that the overall expense ratio of the Fund is reasonable, taking into account the size of the Fund, the quality of services provided by the adviser, the investment performance of the Fund and the expense limitations agreed to by SkyBridge.
Economies of Scale. The Trustees considered the extent to which economies of scale would be realized relative to fee levels as the Fund grows, and whether the advisory fee levels reflect these economies of scale for the benefit of shareholders. The Trustees considered and determined that economies of scale for the benefit of Fund shareholders should be achieved if assets of the Fund increase because fixed expenses will be spread across a larger asset base; however, the Trustees noted that the advisory fee does not include “breakpoint” reductions in the advisory fee rate at specific asset levels.
Additional Board Considerations. Trustees also considered that the Transaction is expected to conform with the provisions of Section 15(f) of the 1940 Act, which, in pertinent part, provides a safe harbor for the receipt by an investment adviser or any of its affiliated persons of any amount or benefit in connection with certain transactions, such as the Transaction, involving an assignment of an investment management services agreement as long as two conditions are satisfied.
The first condition requires that no “unfair burden” be imposed on the investment company as a result of the Transaction, or as a result of any express or implied terms, conditions or understandings applicable to the Transaction. The term “unfair burden,” as defined in the 1940 Act, includes any arrangement during the two-year period after the change in control whereby the investment adviser (or predecessor or successor investment advisor), or any interested person of any such investment advisor, receives or is entitled to receive any compensation, directly or indirectly, from such investment company or its security holders (other than fees for bona fide investment advisory or other services) or from any person in connection with the purchase or sale of securities or other property to, from or on behalf of such investment company (other than bona fide ordinary fees for principal underwriting services). No such compensation arrangements are contemplated in the Transaction.
The second condition requires that, during the three-year period immediately following the closing of such transactions, at least 75% of the investment company’s board of directors or trustees not be “interested persons” (as defined in Section 2(a)(19) of the 1940 Act) of the investment adviser or predecessor investment advisor. The Fund’s Board currently complies with such requirement and will continue to comply with such condition for the three-year period following the close of the Transaction.
Conclusion. After consideration of all the factors, taking into consideration the information presented at the Board Meeting and deliberating in executive session, the entire Board, including the Independent Trustees, unanimously approved the Agreements. The Board concluded that the advisory fee rate under the Agreements is reasonable in relation to the services provided and that execution of the Interim Agreement and New Agreement are in the best interests of the shareholders of the Fund. The Trustees also concluded
30
SKYBRIDGE DIVIDEND VALUE FUND
Other Information (Concluded)
(Unaudited)
that the advisory fees and total expense ratios are at acceptable levels in light of the quality of services provided to the Fund and in comparison to those of the Fund’s respective peer groups; that the advisory fee schedule would not be increased for the Fund and economies of scale may be achieved at higher asset levels for the Fund for the benefit of fund shareholders; that the total expense ratio had not changed materially; and that SkyBridge had represented that the overall expenses for the Fund are not expected to be adversely affected by the Change of Control. The Trustees also noted that SkyBridge had no present intention to alter any expense limitation or reimbursement currently in effect for the Fund. On that basis, the Trustees concluded that the total expense ratio and proposed advisory fee for the Fund is acceptable. In arriving at their decision, the Trustees did not identify any single matter as controlling, but made their determination in light of all the circumstances.
31
SKYBRIDGE DIVIDEND VALUE FUND
Privacy Notice
(Unaudited)
The privacy of your personal financial information is extremely important to us. When you open an account with us, we collect a significant amount of information from you in order to properly invest and administer your account. We take very seriously the obligation to keep that information private and confidential, and we want you to know how we protect that important information.
We collect nonpublic personal information about you from applications or other forms you complete and from your transactions with us or our affiliates. We do not disclose information about you, or our former clients, to our affiliates or to service providers or other third parties, except as permitted by law. We share only the information required to properly administer your accounts, which enables us to send transaction confirmations, monthly or quarterly statements, financials and tax forms. Even within FundVantage Trust and its affiliated entities, a limited number of people who actually service accounts will have access to your personal financial information. Further, we do not share information about our current or former clients with any outside marketing groups or sales entities.
To ensure the highest degree of security and confidentiality, FundVantage Trust and its affiliates maintain various physical, electronic and procedural safeguards to protect your personal information. We also apply special measures for authentication of information you request or submit to us on our web site.
If you have questions or comments about our privacy practices, please call us at (888) 919-6885.
32
SKYBRIDGE DIVIDEND VALUE FUND
Fund Management
(Unaudited)
FundVantage Trust (the “Trust”) is governed by a Board of Trustees (the “Trustees”). The primary responsibility of the Trustees is to represent the interest of the Trust’s shareholders and to provide oversight management of the Trust.
The following tables present certain information regarding the Board of Trustees and officers of the Trust. None of the Trustees are an “interested person” of the Trust, the Adviser, another investment adviser of a series of the Trust, or Foreside Funds Distributors LLC, the principal underwriter of the Trust (“Underwriter”), within the meaning of the 1940 Act and each Trustee is referred to as an “Independent Trustee” and is listed under such heading below. The address of each Trustee and Officer as it relates to the Trust’s business is 301 Bellevue Parkway, 2nd Floor, Wilmington, DE 19809.
The Statement of Additional Information for the Fund contains additional information about the Trustees and is available, without charge, upon request, by calling (888) 919-6885.
Name and Date of Birth | Position(s) Held with Trust | Term of Office and Length of | Principal Occupation(s) During Past Five Years |
Number of
| Other Directorships Held by Trustee | |||||
INDEPENDENT TRUSTEES
| ||||||||||
ROBERT J. CHRISTIAN Date of Birth: 2/49 | Trustee and Chairman of the Board | Shall serve until death, resignation or removal. Trustee and Chairman since 2007. | Retired since February 2006; Executive Vice President of Wilmington Trust Company from February 1996 to February 2006; President of Rodney Square Management Corporation (“RSMC”) (investment advisory firm) from 1996 to 2005; Vice President of RSMC from 2005 to 2006.
| 42 | Optimum Fund Trust (registered investment company with 6 portfolios). | |||||
IQBAL MANSUR Date of Birth: 6/55 | Trustee | Shall serve until death, resignation or removal. Trustee since 2007.
| University Professor, Widener University. | 42 | None. | |||||
33
SKYBRIDGE DIVIDEND VALUE FUND
Fund Management (Continued)
(Unaudited)
Name and Date of Birth | Position(s) Held | Term of Office and Length of | Principal Occupation(s) |
Number of Funds in Trust Complex
| Other Directorships Held by Trustee | |||||
NICHOLAS M. MARSINI, JR. Date of Birth: 8/55 | Trustee | Shall serve until death, resignation or removal. Trustee since 2016. | Retired since March 2016. President of PNC Bank Delaware from June 2011 to March 2016; Executive Vice President Finance of BNY Mellon from July 2010 to January 2011; Executive Vice President and Chief Financial Officer of PNC Global Investment Servicing from September 1997 to July 2010.
| 42 | Brinker Capital Destinations Trust (registered investment company with 10 portfolios). | |||||
STEPHEN M. WYNNE Date of Birth: 1/55 | Trustee | Shall serve until death, resignation or removal. Trustee since 2009. | Retired since December 2010; Chief Executive Officer of US Funds Services, BNY Mellon Asset Servicing from July 2010 to December 2010; Chief Executive Officer of PNC Global Investment Servicing from March 2008 to July 2010; President, PNC Global Investment Servicing from 2003 to 2008. | 42 | Copeland Trust (registered investment company with 2 portfolios). Context Capital Funds (registered investment company with 1 portfolio).
| |||||
NANCY B. WOLCOTT Date of Birth: 11/54 | Trustee | Shall serve until death, resignation or removal. Trustee since 2011. | Retired since May 2014; EVP, Head of GFI Client Service Delivery, BNY Mellon from January 2012 to May 2014; EVP, Head of US Funds Services, BNY Mellon from July 2010 to January 2012; President of PNC Global Investment Servicing from 2008 to July 2010; Chief Operating Officer of PNC Global Investment Servicing from 2007 to 2008; Executive Vice President of PFPC Worldwide Inc. from 2006 to 2007.
| 42 | None. | |||||
34
SKYBRIDGE DIVIDEND VALUE FUND
Fund Management (Concluded)
(Unaudited)
Name and Date of Birth | Position(s) Held with Trust | Term of Office and Length of Time Served | Principal Occupation(s) During Past Five Years | |||
EXECUTIVE OFFICERS
| ||||||
JOEL L. WEISS Date of Birth: 1/63 | President and Chief Executive Officer | Shall serve until death, resignation or removal. Officer since 2007. | President of JW Fund Management LLC since June 2016; Vice President and Managing Director of BNY Mellon Investment Servicing (US) Inc. and predecessor firms from 1993 to June 2016.
| |||
T. RICHARD KEYES Date of Birth: 1/57 | Treasurer and Chief Financial Officer | Shall serve until death, resignation or removal. Officer since 2016. | President of TRK Fund Consulting since July 2016; Head of Tax-U.S. Fund Services of BNY Mellon Investment Servicing (US) Inc. and predecessor firms from February 2006 to July 2016.
| |||
VINCENZO A. SCARDUZIO Date of Birth: 4/72 | Secretary | Shall serve until death, resignation or removal. Officer since 2012. | Director and Vice President Regulatory Administration of BNY Mellon Investment Servicing (US) Inc. and predecessor firms since 2001.
| |||
DAVID C. LEBISKY Date of Birth: 5/72 | Chief Compliance Officer and Anti-Money Laundering Officer | Shall serve until death, resignation or removal. Officer since 2015. | President of Lebisky Compliance Consulting LLC since October 2015; Senior Consultant, Freeh Group International Solutions, LLC (a global risk management firm) since 2015; Scotia Institutional Investments US, LP, Director of Regulatory Administration from 2010 to 2014.
| |||
35
Investment Adviser
SkyBridge Capital II, LLC
527 Madison Avenue, 16th Floor
New York, New York 10022
Administrator
BNY Mellon Investment Servicing (US) Inc.
301 Bellevue Parkway
Wilmington, DE 19809
Transfer Agent
BNY Mellon Investment Servicing (US) Inc.
4400 Computer Drive
Westborough, MA 01581
Principal Underwriter
Foreside Funds Distributors LLC
400 Berwyn Park
899 Cassatt Road
Berwyn, PA 19312
Custodian
The Bank of New York Mellon
225 Liberty Street
New York, NY 10286
Independent Registered Public Accounting Firm
PricewaterhouseCoopers LLP
Two Commerce Square, Suite 1800
2001 Market Street
Philadelphia, PA 19103-7042
Legal Counsel
Pepper Hamilton LLP
3000 Two Logan Square
2001 Market Street
Philadelphia, PA 19103-7042

SkyBridge Dividend
Value Fund
of
FundVantage Trust
Class A Shares
Class C Shares
Class I Shares
ANNUAL REPORT
April 30, 2017
This report is submitted for the general information of the shareholders of the SkyBridge Dividend Value Fund. It is not authorized for distribution unless preceded or accompanied by a current prospectus for the SkyBridge Dividend Value Fund.
SKY-0417
Item 2. Code of Ethics.
| (a) | The registrant, as of the end of the period covered by this report, has adopted a code of ethics that applies to the Registrant’s principal executive officer, principal financial officer, principal accounting officer or controller, or persons performing similar functions, regardless of whether these individuals are employed by the Registrant or a third party. |
| (c) | There have been no amendments, during the period covered by this report, to a provision of the code of ethics that applies to the Registrant’s principal executive officer, principal financial officer, principal accounting officer or controller, or persons performing similar functions, regardless of whether these individuals are employed by the Registrant or a third party, and that relates to any element of the code of ethics description. |
| (d) | The registrant has not granted any waivers, including an implicit waiver, from a provision of the code of ethics that applies to the Registrant’s principal executive officer, principal financial officer, principal accounting officer or controller, or persons performing similar functions, regardless of whether these individuals are employed by the Registrant or a third party, that relates to one or more of the items set forth in paragraph (b) of this item’s instructions. |
Item 3. Audit Committee Financial Expert.
The Audit Committee of the Board of Trustees currently is comprised of Nicholas Marsini, Iqbal Mansur and Stephen M. Wynne, each of whom is considered “independent” within the meaning set forth under Item 3 of Form N-CSR. The Board of Trustees has determined that each of Messrs. Mansur, Marsini and Wynne is an “audit committee financial expert” as such term is defined by Item 3 of Form N-CSR.
The Registrant’s Board of Trustees has determined that Dr. Mansur acquired the attributes necessary to be considered an audit committee financial expert through his experience as a university professor of finance and because he has authored over 25 finance-related articles in peer reviewed publications.
The Registrant’s Board of Trustees has determined that Mr. Wynne acquired the attributes necessary to be considered an audit committee financial expert through his experience as a chief executive officer (and other senior-level accounting and/or financial positions) of several large financial institutions and because he has co-authored a text book on mutual fund accounting.
The Registrant’s Board of Trustees has determined that Mr. Marsini acquired the attributes necessary to be considered an audit committee financial expert through his experience as a chief executive officer (and other senior-level positions) of several large financial institutions.
Item 4. Principal Accountant Fees and Services.
Audit Fees
| (a) | The aggregate fees billed for each of the last two fiscal years for professional services rendered by the principal accountant for the audit of the registrant’s annual financial statements or services that are normally provided by the accountant in connection with statutory and regulatory filings or engagements for those fiscal years were: |
Fiscal Year 2016
| Fiscal Year 2017 | |||
| Pricewaterhouse Coopers LLP | $313,650
| $283,275 | ||
| Ernst & Young LLP | $157,175
| $134,410 | ||
| Tait Weller & Baker, LLP | $31,000
| $46,500 | ||
| Aggregate Fees | $501,825
| $464,185 |
Audit-Related Fees
| (b) | The aggregate fees billed in each of the last two fiscal years for assurance and related services by the principal accountant that are reasonably related to the performance of the audit of the registrant’s financial statements and are not reported under paragraph (a) of this Item are $0 for 2016 and $0 for 2017. |
Tax Fees
| (c) | The aggregate fees billed in each of the last two fiscal years for professional services rendered by the principal accountant for tax compliance, tax advice, and tax planning were: |
Fiscal Year 2016
| Fiscal Year 2017 | |||
| Pricewaterhouse Coopers LLP | $10,400
| $0 | ||
| Ernst & Young LLP | $13,657
| $11,608 | ||
| Tait Weller & Baker | $0
| $0 | ||
| Aggregate Fees | $24,057
| $11,608 |
E&Y fees were for the Passive Foreign Investment Company (PFIC) analysis. PricewaterhouseCoopers fees related to the analysis of foreign securities transactions.
All Other Fees
| (d) | The aggregate fees billed in each of the last two fiscal years for products and services provided by the principal accountant, other than the services reported in paragraphs (a) through (c) of this Item are $0 for 2016 and $0 for 2017. |
| (e)(1) | Disclose the audit committee’s pre-approval policies and procedures described in paragraph (c)(7) of Rule 2-01 of Regulation S-X. |
The Registrant’s Audit Committee Charter requires the Audit Committee to (i) (a) approve prior to appointment the engagement of independent registered public accounting firm to annually audit and provide their opinion on the Registrant’s financial statements, (b) recommend to the Independent Trustees the selection, retention or termination of the Registrant’s independent registered public accounting firm and, (c) in connection therewith, to review and evaluate matters potentially affecting the independence and capabilities of the independent registered public accounting firm; and (ii) to approve prior to appointment the engagement of the independent registered public accounting firm to provide other audit services to the Registrant, or to provide non-audit services to the Registrant, its series, an investment adviser to its series or any entity controlling, controlled by, or under common control with an investment adviser to its series (“adviser-affiliate”) that provides ongoing services to the Registrant if the engagement relates directly to the operations and financial reporting of the Registrant. The Audit Committee will not approve non-audit services that the Audit Committee believes may impair the independence of the Registrant’s independent registered public accountant. The Audit Committee may delegate, to the extent permitted by law, pre-approved responsibilities to one or more members of the Audit Committee who shall report to the full Audit Committee.
| (e)(2) | Not applicable. |
| (f) | Not applicable. |
| (g) | The aggregate non-audit fees billed by the registrant’s accountant for services rendered to the registrant, and rendered to the registrant’s investment adviser (not including any sub-adviser whose role is primarily portfolio management and is subcontracted with or overseen by another investment adviser), and any entity controlling, controlled by, or under common control with the adviser that provides ongoing services to the registrant for each of the last two fiscal years of the registrant were $13,900,754 for 2016 and $20,311,246 for 2017. |
| (h) | Not applicable. |
Item 5. Audit Committee of Listed Registrants.
Not applicable.
Item 6. Investments.
| (a) | Schedule of Investments in securities of unaffiliated issuers as of the close of the reporting period is included as part of the report to shareholders filed under Item 1 of this form. |
| (b) | Not applicable. |
| Item 7. | Disclosure of Proxy Voting Policies and Procedures for Closed-End Management Investment Companies. |
Not applicable.
Item 8. Portfolio Managers of Closed-End Management Investment Companies.
Not applicable.
| Item 9. | Purchases of Equity Securities by Closed-End Management Investment Company and Affiliated Purchasers. |
Not applicable.
Item 10. Submission of Matters to a Vote of Security Holders.
There have been no material changes to the procedures by which the shareholders may recommend nominees to the registrant’s board of trustees, where those changes were implemented after the registrant last provided disclosure in response to the requirements of Item 407(c)(2)(iv) of Regulation S-K (17 CFR 229.407) (as required by Item 22(b)(15) of Schedule 14A (17 CFR 240.14a-101)), or this Item.
Item 11. Controls and Procedures.
| (a) | The registrant’s principal executive and principal financial officers, or persons performing similar functions, have concluded that the registrant’s disclosure controls and procedures (as defined in Rule 30a-3(c) under the Investment Company Act of 1940, as amended (the “1940 Act”) (17 CFR 270.30a-3(c))) are effective, as of a date within 90 days of the filing date of the report that includes the disclosure required by this paragraph, based on their evaluation of these controls and procedures required by Rule 30a-3(b) under the 1940 Act (17 CFR 270.30a-3(b)) and Rules 13a-15(b) or 15d-15(b) under the Securities Exchange Act of 1934, as amended (17 CFR 240.13a-15(b) or 240.15d-15(b)). |
| (b) | There were no changes in the registrant’s internal control over financial reporting (as defined in Rule 30a-3(d) under the 1940 Act (17 CFR 270.30a-3(d))) that occurred during the registrant’s second fiscal quarter of the period covered by this report that has materially affected, or is reasonably likely to materially affect, the registrant’s internal control over financial reporting. |
Item 12. Exhibits.
| (a)(1) | Code of ethics, or any amendment thereto, that is the subject of disclosure required by Item 2 is attached hereto. |
| (a)(2) | Certifications pursuant to Rule 30a-2(a) under the 1940 Act and Section 302 of the Sarbanes-Oxley Act of 2002 are attached hereto. |
| (a)(3) | Not applicable. |
| (b) | Certifications pursuant to Rule 30a-2(b) under the 1940 Act and Section 906 of the Sarbanes-Oxley Act of 2002 are attached hereto. |
(12.other) Not applicable.
SIGNATURES
Pursuant to the requirements of the Securities Exchange Act of 1934 and the Investment Company Act of 1940, the registrant has duly caused this report to be signed on its behalf by the undersigned, thereunto duly authorized.
(Registrant) FundVantage Trust
| By (Signature and Title)* | /s/ Joel L. Weiss | |
| Joel L. Weiss, President and | ||
| Chief Executive Officer | ||
| (principal executive officer) |
Date July 12, 2017
Pursuant to the requirements of the Securities Exchange Act of 1934 and the Investment Company Act of 1940, this report has been signed below by the following persons on behalf of the registrant and in the capacities and on the dates indicated.
| By (Signature and Title)* | /s/ Joel L. Weiss | |
| Joel L. Weiss, President and | ||
| Chief Executive Officer | ||
| (principal executive officer) |
Date July 12, 2017
| By (Signature and Title)* | /s/ T. Richard Keyes | |
| T. Richard Keyes, Treasurer and | ||
| Chief Financial Officer | ||
| (principal financial officer) |
Date July 12, 2017
* Print the name and title of each signing officer under his or her signature.