UNITED STATES
SECURITIES AND EXCHANGE COMMISSION
Washington, D.C. 20549
FORM N-CSR
CERTIFIED SHAREHOLDER REPORT OF REGISTERED MANAGEMENT
INVESTMENT COMPANIES
Investment Company Act file number 811-22027
FundVantage Trust
(Exact name of registrant as specified in charter)
301 Bellevue Parkway
Wilmington, DE 19809
(Address of principal executive offices) (Zip code)
Joel L. Weiss
JW Fund Management LLC
100 Springdale Rd., Suite A3-416
Cherry Hill, NJ 08003
(Name and address of agent for service)
Registrant’s telephone number, including area code: 856-528-3500
Date of fiscal year end: April 30
Date of reporting period: October 31, 2017
Form N-CSR is to be used by management investment companies to file reports with the Commission not later than 10 days after the transmission to stockholders of any report that is required to be transmitted to stockholders under Rule 30e-1 under the Investment Company Act of 1940 (17 CFR 270.30e-1). The Commission may use the information provided on Form N-CSR in its regulatory, disclosure review, inspection, and policymaking roles.
A registrant is required to disclose the information specified by Form N-CSR, and the Commission will make this information public. A registrant is not required to respond to the collection of information contained in Form N-CSR unless the Form displays a currently valid Office of Management and Budget (“OMB”) control number. Please direct comments concerning the accuracy of the information collection burden estimate and any suggestions for reducing the burden to Secretary, Securities and Exchange Commission, 450 Fifth Street, NW, Washington, DC 20549-0609. The OMB has reviewed this collection of information under the clearance requirements of 44 U.S.C. § 3507.
Item 1. Reports to Stockholders.
The Report to Shareholders is attached herewith.
DUPONT CAPITAL EMERGING MARKETS FUND
Semi-Annual Investment Adviser’s Report
October 31, 2017
(Unaudited)
Dear Fund Shareholder,
The DuPont Capital Emerging Markets Fund (“Fund”) generated a return of +15.68% for the six-month period ending October 31, 2017. The broader index posted a gain of 16.14% on a commensurate (net of fees) basis.
The low volatility environment that has characterized many financial markets this calendar year has permeated equity markets globally and provided a favorable backdrop for Emerging Markets equities. Investor risk appetites have been whetted by signs that the components of global GDP growth are becoming both broader and stronger; meanwhile an array of familiar or intensifying geopolitical tensions have not yet manifested themselves as severe economic or cyclical headwinds. Emerging Markets returns for the period of greater than 15% compare favorably to those for Developed regions which, themselves, mustered a respectable return of close to 10%. Within the Emerging Markets universe, the Technology sector dominated returns, posting a 30% gain. The only other sector to outperform the broader index was Real Estate, which was primarily a China phenomenon. Defensive sectors, such as Telecom, Consumer Staples and Utilities were the laggards, rising by only low-to-mid single digit percentages.
The key determinants of the recent unabated upswing in EM equities have included indications that global economic growth is more in synch than has been the case in the last several years, and perceptions that the Chinese economy has become less likely to experience a deflationary hard-landing any time soon. Furthermore, in the commodities sphere the supply-demand outlook for many industrial metals has improved, with potential new end markets and applications opening up. At the same time, leading Emerging Market companies are demonstrating their willingness and ability to both enable and embrace high-Tech thematic trends. Asian-based semiconductor makers continue to push the frontiers of smaller and more complex chip architectures, and excitement over internet-based commercial opportunities is just as strong in Shanghai as it is in Silicon Valley. That the US dollar has experienced a sustained weakening trend since topping out during the first quarter of the year has proved generally supportive to Emerging Markets.
Viewed by economic sector, the Fund’s relative performance stemmed primarily from strong stock-specific contributions within Financials, Materials and Consumer Discretionary categories. An exposure to locally-dominant banks in both Argentina and Hungary drove the favorable returns in Financials. Both of these two countries’ domestic economies have seen improved lending conditions; the former due to the central government’s structural reform agenda, the latter in response to less onerous credit conditions. Materials were buoyed by holdings in Korean battery names with established technological advantages in lithium-ion chemistry, with pulp and steel names in Brazil also enjoying solid returns. A diverse group of names held in the portfolio of the Fund underpinned returns within Consumer Discretionary, most saliently South African media, Chinese vehicle manufacturing and Latin American private education holdings. The most detrimental sector was Technology, where the Fund’s underweight positions in large Chinese internet and e-commerce platforms represented a significant, anti-momentum position. This was partially offset by strong returns from Taiwanese and Korean semiconductor bellwethers.
1
DUPONT CAPITAL EMERGING MARKETS FUND
Semi-Annual Investment Adviser’s Report (Continued)
October 31, 2017
(Unaudited)
From a geographic perspective, aggregate positioning was a net detractor to returns, while stock-picking within countries provided a larger positive counterweight. China represented the nexus of the Fund’s weakest returns. An index-relative under-allocation to that country proved unfavorable, additionally much of the underweight was predicated on side-stepping state-sponsored lenders and enterprises or expensive internet software groups – both categories saw strong returns in the prevailing risk-on and momentum environment. Returns within Latin America were healthy, due to pro-cyclical exposures in Brazil and Mexico, while Russian exposures played a similar role in the European sleeve of the Fund, with commodity and infrastructure holdings being leveraged to the economic recovery that is taking hold in Russia following a prolonged domestic recession. Being overweight South Africa weighed on relative returns, as political events dampened the scope for valuation multiples in that market to expand.
Investment Environment and Outlook
China continues to hold outsized influences over the broader asset class, both directly – due its underlying weight within the MSCI index – and indirectly, via derived demand and its ambitions to become more competitive in higher value-add manufacturing and export categories. Moves in recent months to crack down on shadow banking and informal lending channels and to consolidate financial regulation more unilaterally within the remit of the central People’s Bank of China have bolstered investor confidence that the systemic risks related to excessive or non-creditworthy debt levels are being addressed. Consensus expectations for Chinese GDP in the near to medium term have stabilized within the 6.5%-7.0% range and the risks of a severe undershoot appear to have been curtailed, as exemplified by the recent upward tweak of the IMF’s growth projections.
Overall the Fund retains a pro-cyclical tilt, as evidenced by over-allocations to Consumer Discretionary and Industrial sectors and Brazilian and Korean market versus the index. Our preference for undemandingly-valued and under-appreciated investments explains our highly selective, and bottom — up driven, net overweight positions in Financials and Energy. That said, we remain highly cognizant of the current risk-reward balance in markets. A resurgent mean-reversion in equity market volatility levels from historically benign levels appears to us to be a reasonable assumption, albeit with uncertain timing. In addition - given the aforementioned monetary tightening initiatives, and parallel environmental policy moves, in China – we would not be surprised to see some lagged industry-specific effects as these corrective measures bite. Hence, we feel the Fund’s cyclical tilt has been diversified and risk-adjusted accordingly. We believe the Fund is positioned for moderate rises in interest rates globally, as western central banks embark on monetary policy normalization. In particular, we believe care has been taken to position the Fund so that country and company level portfolio exposures are less vulnerable to dollarized repercussions, at sovereign or corporate levels, of further steady tightening moves in the US.
2
DUPONT CAPITAL EMERGING MARKETS FUND
Semi-Annual Investment Adviser’s Report (Concluded)
October 31, 2017
(Unaudited)
We appreciate your investment in the Fund and look forward to communicating with you further in future periods.
DuPont Capital Management Corporation
This letter is intended to assist shareholders in understanding how the Fund performed during the fiscal year ended October 31, 2017 and reflects the views of the investment adviser at the time of this writing. These views may change and do not guarantee future performance of the Fund or the markets.
Portfolio composition is subject to change. The current and future portfolio holdings of the Fund are subject to investment risks. The investment return and principal value of an investment in the Fund will fluctuate so that an investor’s shares, when redeemed, may be worth more or less than their original cost.
Mutual fund investing involves risks, including possible loss of principal. The Fund invests primarily in markets of emerging countries which are riskier than more developed markets and may be considered speculative. Emerging markets are riskier than more developed markets because they tend to develop unevenly or may never fully develop. Emerging markets are more likely to experience hyperinflation and currency valuations, which adversely affect returns to U.S. investors. In addition, many emerging markets have far lower trading volumes and less liquidity than developed markets.
Foreign securities are subject to political, social, and economic risks including instability in the country of the issuer of a security, variation in international trade patterns, the possibility of the imposition of exchange controls, expropriation, confiscatory taxation, limits on movement to currency or other assets and nationalization of assets.
3
DUPONT CAPITAL EMERGING MARKETS FUND
Semi-Annual Report
Performance Data
October 31, 2017
(Unaudited)
| Average Annual Total Returns for the Periods Ended October 31, 2017 | ||||||||||
| Six Months† | 1 Year | 3 Year | 5 Year | Since Inception* | ||||||
Class I Shares | 15.68% | 27.78% | 4.69% | 1.56% | -0.17% | |||||
MSCI Emerging | ||||||||||
Markets Net | ||||||||||
Dividend Index | 16.14% | 26.45% | 5.70% | 4.83% | -0.11%** | |||||
| † | Not Annualized. |
| * | The DuPont Capital Emerging Markets Fund (the “Fund”) commenced operations on December 6, 2010. |
| ** | Benchmark performance is from inception date of the Fund only and is not the inception date of the benchmark itself. |
The performance data quoted represents past performance and does not guarantee future results. The investment return and principal value of an investment in the Fund will fluctuate so that an investor’s shares, when redeemed, may be worth more or less than their original cost. The table does not reflect the deduction of taxes that a shareholder would pay on Fund distributions or redemption of Fund shares. Current performance may be lower or higher. Performance data current to the most recent month-end may be obtained by calling (888) 447-0014.
As stated in the current prospectus dated September 1, 2017, the Fund’s “Total Annual Fund Operating Expenses” and “Total Annual Fund Operating Expenses After Fee Waiver and/or Expense Reimbursement” are 2.08% and 1.29%, respectively of the Fund’s average daily net assets, which may differ from the actual expenses incurred by the Fund for the period covered by this report. DuPont Capital Management Corporation (the “Adviser”) has contractually agreed to reduce its investment advisory fee and/or reimburse certain expenses of the Fund to the extent necessary to ensure that the Fund’s total operating expenses, excluding taxes, “Acquired Fund Fees and Expenses”, interest, extraordinary items, and brokerage commissions do not exceed 1.27% (on an annual basis) of the Fund’s average daily net assets (the “Expense Limitation”). The Expense Limitation will remain in place until August 31, 2018, unless the Board of Trustees (“Board of Trustees”) of FundVantage Trust (the “Trust”) approves its earlier termination. Effective September 1, 2016, the Fund’s Expense Limitation (on an annual basis) was reduced from 1.60% of the Fund’s average daily net assets to its current rate of 1.27%. The Adviser is entitled to recover, subject to approval by the Board of Trustees, such amounts reduced or reimbursed for a period of up to three (3) years from the date on which the Adviser reduced its compensation and/or assumed expenses for the Fund. The Adviser is permitted to seek reimbursement from the Fund, subject to certain limitations, for fees it waived and Fund expenses it paid to the extent the total annual fund operating expenses do not exceed the limits described above or any lesser limits in effect at the time of reimbursement. No recoupment will occur unless the Fund’s expenses are below the Expense Limitation amount. Total returns would be lower had such fees and expenses not been waived and/or reimbursed.
A 2.00% redemption fee applies to shares redeemed within 60 days of purchase. The redemption fee is not reflected in the returns shown above.
The Fund intends to evaluate performance as compared to that of the MSCI Emerging Markets Net Dividend Index. The MSCI Emerging Markets Net Dividend Index is a float-adjusted market capitalization index consisting of 21 emerging economies. This index is net total return which reinvests dividends after the deduction of withholding taxes using (for international indices) a tax rate applicable to non-resident institutional investors who do not benefit from double taxation treaties. MSCI Emerging Markets Net Dividend Index uses the maximum withholding tax rate applicable to institutional investors. The returns for this index do not include any transaction costs, management fees or other costs. It is impossible to invest directly in an index.
4
DUPONT CAPITAL EMERGING MARKETS DEBT FUND
Semi-Annual Investment Adviser’s Report
October 31, 2017
(Unaudited)
Dear Fund Shareholder,
The DuPont Capital Emerging Markets Debt Fund (the “Fund”) returned +3.91% net of fees, for the six-month period ending October 31, 2017. The JP Morgan Emerging Markets Bond Index Global Diversified (EMBI Global Diversified) rose +3.78% over the trailing six-months ending October 31, 2017, so the fund outperformed the benchmark by 13 basis points for the period.
Emerging Markets Debt (“EMD”) and most fixed income sectors performed well over the past six months as low inflation, moderate economic growth and ample central bank liquidity in the form of bond buying combined to keep rates low and investor demand high. Commodity prices were mostly higher over the six-month period and less volatile, leading some of the energy and other commodity-focused countries and sectors to gains.
Both U.S. dollar and local currency EMD posted attractive returns over the six-month period, outpacing most fixed income asset classes. Higher and more stable commodity prices, moderate growth in many regions of the world and the search for yield led investors to move toward the EMD asset class, both for hard and local currency. U.S. treasury yields rose for shorter and intermediate maturities over the period partly due to the Fed rate hikes. For the six-months, the yield of the ten-year Treasury rose by just 9 basis point to 2.38% while the two-year Treasury rose by 32 basis points to 1.60%. Investors continued to be attracted to EMD by both valuations and yields relative to other fixed income sectors.
EM U.S. Dollar sovereigns outperformed local-currency EMD. Within U.S. Dollar sovereigns, non-investment grade countries outperformed higher quality, investment grade sovereigns. Some of the best performing countries included El Salvador, Ecuador, Ghana and Iraq. Most countries had positive returns, but the countries with the worst returns were Venezuela, Belarus, Lebanon and Oman. In local currency bonds, it was a tale of two markets as local currency performed very well early in the period, but experienced declines over the last three months. Turkey and South Africa posted the worst returns. Spreads tightened by 19 basis points during the last six months to 284 over Treasuries, while the yield of the index decreased by 8 basis points and closed at 5.23%. In the Fund, our overweight and positioning to Ukraine, Brazil, Mexico and Argentina added to relative returns over the period. In addition, our allocation to Brazil local currency bonds benefitted returns. However, an overweight to Venezuela, including holdings in both the sovereign bonds and Petroleos de Venezuela, was the major position that detracted from relative returns. This is a position that had performed very well in 2016 and we reduced the Fund’s overweight earlier in the year. In addition, a few underweights to higher quality countries also detracted from returns.
The primary overweight exposures in the Fund include Mexico, Brazil, Israel, Ukraine, Argentina and Mongolia. In local currency bonds, the main positions are in Brazil, Mexico and Poland. The Fund has a yield advantage when compared to the benchmark, mostly due to the overweights to Ukraine, Venezuela, and the local currency exposure to Mexico and Brazil.
5
DUPONT CAPITAL EMERGING MARKETS DEBT FUND
Semi-Annual Investment Adviser’s Report (Continued)
October 31, 2017
(Unaudited)
Investment Environment and Outlook
Emerging Markets Debt performed extremely well in 2016 and so far in 2017. As a result, several countries have moved in our models to have less value than earlier in the year. Overall, our models show that EMD is close to fair value. We continue to have a positive long-term outlook because we feel that EMD fundamentals for several countries have improved, and we expect the asset class will continue to develop and mature over the next several years. In addition, yields in developed countries remain at very low levels and we believe EMD could attract additional investor flows. However, the financial markets could experience a quick downturn if global economic growth reversed and showed signs of deceleration or weakness. In addition, the market is pricing in a very gradual pace of Fed rate hikes over the next year. This could change if U.S. growth picks up further next year or if inflation moves higher, leading to higher U.S. interest rates. We are slightly optimistic overall, but remain cautious and have endeavored to reduce risk in the portfolio over the last several months. We have increased our exposure to local currency as we feel certain countries could provide more attractive returns. In hard currency, the risk-adjusted returns for Ukraine, Brazil, Mexico and Argentina remain attractive.
We appreciate your investment in the Fund and look forward to communicating with you in the future.
DuPont Capital Management Corporation
This letter is intended to assist shareholders in understanding how the Fund performed during the fiscal year ended October 31, 2017 and reflects the views of the investment adviser at the time of this writing. These views may change and do not guarantee future performance of the Fund or the markets.
Portfolio composition is subject to change. The current and future portfolio holdings of the Fund are subject to investment risks. The investment return and principal value of an investment in the Fund will fluctuate so that an investor’s shares, when redeemed, may be worth more or less than their original cost.
Mutual fund investing involves risks, including possible loss of principal. The Fund invests primarily in markets of emerging countries which are riskier than more developed markets and may be considered speculative. Emerging markets are riskier than more developed markets because they tend to develop unevenly or may never fully develop. Emerging markets are more likely to experience hyperinflation and currency valuations, which adversely affect returns to U.S. investors. In addition, many emerging markets have far lower trading volumes and less liquidity than developed markets. The Fund is non-diversified, which means that a large portion of the Fund’s assets may be invested in one or few companies or sectors. The Fund could fluctuate in value more than a diversified fund. Investing in foreign securities entails special risks, such as fluctuations in currency exchange rates and possible lax regulation of securities markets and accounting practices.
6
DUPONT CAPITAL EMERGING MARKETS DEBT FUND
Semi-Annual Investment Adviser’s Report (Concluded)
October 31, 2017
(Unaudited)
Foreign securities are subject to political, social, and economic risks including instability in the country of the issuer of a security, variation in international trade patterns, the possibility of the imposition of exchange controls, expropriation, confiscatory taxation, limits on movement to currency or other assets and nationalization of assets. The value of debt securities generally falls when interest rates rise. The Fund may invest without limit in below-investment grade debt securities commonly called “high yield” securities or “junk bonds.” Such securities may have greater default risk, less liquidity, and greater price volatility than investment-grade bonds.
7
DUPONT CAPITAL EMERGING MARKETS DEBT FUND
Semi-Annual Report
Performance Data
October 31, 2017
(Unaudited)
| Average Annual Total Returns for the Periods Ended October 31, 2017 | ||||||||||||
| Six Months† | 1 Year | 3 Year | Since Inception* | |||||||||
Class I Shares | 3.91% | 5.72% | 7.49% | 7.90% | ||||||||
JP Morgan Emerging Markets Bond | ||||||||||||
Index Global Diversified | 3.78% | 6.32% | 6.03% | 7.13%** | ||||||||
| † | Not Annualized. |
| * | The DuPont Capital Emerging Markets Debt Fund (the “Fund”) commenced operations on September 27, 2013. |
| ** | Benchmark performance is from inception date of the Fund only and is not the inception date of the benchmark itself. |
The performance data quoted represents past performance and does not guarantee future results. The investment return and principal value of an investment in the Fund will fluctuate so that an investor’s shares, when redeemed, may be worth more or less than their original cost. The table does not reflect the deduction of taxes that a shareholder would pay on Fund distributions or redemption of Fund shares. Current performance may be lower or higher. Performance data current to the most recent month-end may be obtained by calling (888) 447-0014.
As stated in the current prospectus dated September 1, 2017, the Fund’s “Total Annual Fund Operating Expenses” and “Total Annual Fund Operating Expenses After Fee Waiver and/or Expense Reimbursement” are 3.70% and 0.89%, respectively, of the Fund’s average daily net assets, which may differ from the actual expenses incurred by the Fund for the period covered by this report. DuPont Capital Management Corporation (the “Adviser”) has contractually agreed to reduce its investment advisory fee and/or reimburse certain expenses of the Fund to the extent necessary to ensure that the Fund’s total operating expenses, excluding taxes, “Acquired Fund Fees and Expenses”, interest, extraordinary items, and brokerage commissions do not exceed 0.89% (on an annual basis) of the Fund’s average daily net assets (the “Expense Limitation”). The Expense Limitation will remain in place until August 31, 2018, unless the Board of Trustees (“Board of Trustees”) of FundVantage Trust (the “Trust”) approves its earlier termination. The Adviser is entitled to recover, subject to approval by the Board of Trustees, such amounts reduced or reimbursed for a period of up to three (3) years from the date on which the Adviser reduced its compensation and/or assumed expenses for the Fund. The Adviser is permitted to seek reimbursement from the Fund, subject to certain limitations, for fees it waived and Fund expenses it paid to the extent the total annual fund operating expenses do not exceed the limits described above or any lesser limits in effect at the time of reimbursement. No recoupment will occur unless the Fund’s expenses are below the Expense Limitation amount. Total returns would be lower had such fees and expenses not been waived and/or reimbursed.
A 2.00% redemption fee applies to shares redeemed within 60 days of purchase. The redemption fee is not reflected in the returns shown above.
The Fund intends to evaluate performance as compared to that of the JP Morgan Emerging Markets Bond Index Global Diversified (EMBI Global Diversified), currently covers 27 emerging market countries. Included in the EMBI Global Diversified are U.S.-dollar-denominated Brady bonds, Eurobonds, traded loans, and local market debt instruments issued by sovereign and quasi-sovereign entities. It is impossible to invest directly in an index.
8
DUPONT CAPITAL FUNDS
Fund Expense Disclosure
October 31, 2017
(Unaudited)
As a shareholder of the Fund(s), you incur two types of costs: (1) transaction costs, including redemption fees; and (2) ongoing costs, including management fees and other Fund expenses. These examples are intended to help you understand your ongoing costs (in dollars) of investing in the Fund and to compare these costs with the ongoing costs of investing in other mutual funds.
These examples are based on an investment of $1,000 invested at the beginning of the period from May 1, 2017 through October 31, 2017 and held for the entire period.
Actual Expenses
The first line for each Fund in the accompanying table provides information about actual account values and actual expenses. You may use the information in this line, together with the amount you invested, to estimate the expenses that you paid over the period. Simply divide your account value by $1,000 (for example, an $8,600 account value divided by $1,000 = 8.6), then multiply the result by the number in the first line under the heading entitled “Expenses Paid During Period” to estimate the expenses you paid on your account during this period.
Hypothetical Example for Comparison Purposes
The second line for each Fund in the accompanying table provides information about hypothetical account values and hypothetical expenses based on each Fund’s actual expense ratio and an assumed rate of return of 5% per year before expenses, which is not your Fund’s actual return. The hypothetical account values and expenses may not be used to estimate the actual ending account balance or expenses you paid for the period. You may use this information to compare the ongoing costs of investing in the Funds and other funds. To do so, compare this 5% hypothetical example with the 5% hypothetical examples that appear in the shareholder reports of other funds.
Please note that the expenses shown in the accompanying table are meant to highlight your ongoing costs only and do not reflect any transactional costs, such as redemption fees. Therefore, the second line of the accompanying table is useful in comparing ongoing costs only and will not help you determine the relative total costs of owning different funds. In addition, if these transactional costs were included, your costs would have been higher.
9
DUPONT CAPITAL FUNDS
Fund Expense Disclosure (Concluded)
October 31, 2017
(Unaudited)
| DuPont Capital Emerging Markets Fund | |||||||||||||||
| Beginning Account Value May 1, 2017 | Ending Account Value October 31, 2017 | Expenses Paid During Period* | |||||||||||||
Class I | |||||||||||||||
Actual | $1,000.00 | $1,156.80 | $6.90 | ||||||||||||
Hypothetical (5% return before expenses) | 1,000.00 | 1,018.80 | 6.46 | ||||||||||||
| DuPont Capital Emerging Markets Debt Fund | |||||||||||||||
| Beginning Account Value May 1, 2017 | Ending Account Value October 31, 2017 | Expenses Paid During Period** | |||||||||||||
Class I | |||||||||||||||
Actual | $1,000.00 | $1,039.10 | $4.57 | ||||||||||||
Hypothetical (5% return before expenses) | 1,000.00 | 1,020.72 | 4.53 | ||||||||||||
| * | Expenses are equal to an annualized expense ratio for the six-month period ended October 31, 2017 of 1.27% for Class I Shares of the DuPont Capital Emerging Markets Fund, multiplied by the average account value over the period, multiplied by the number of days in the most recent period (184), then divided by 365 to reflect the period. The DuPont Capital Emerging Markets Fund’s ending account value on the first line in the table is based on the actual total return for the six-month period ended October 31, 2017 for the Fund of 15.68%. |
| ** | Expenses are equal to an annualized expense ratio for the six-month period ended October 31, 2017 of 0.89% for Class I Shares of the DuPont Capital Emerging Markets Debt Fund, multiplied by the average account value over the period, multiplied by the number of days in the most recent period (184), then divided by 365 to reflect the period. The DuPont Capital Emerging Markets Debt Fund’s ending account value on the first line in the table is based on the actual total return for the six-month period ended October 31, 2017 for the Fund of 3.91%. |
10
DUPONT CAPITAL EMERGING MARKETS FUND
Portfolio Holdings Summary Table
October 31, 2017
(Unaudited)
The following table presents a summary by industry of the portfolio holdings of the Fund:
| % of Net Assets | Value | |||||||||
INDUSTRY CATEGORIES: | ||||||||||
Commercial Banks | 21.8 | % | $ | 7,501,148 | ||||||
Oil, Gas & Consumable Fuels | 8.7 | 2,995,087 | ||||||||
Internet Software & Services | 8.7 | 2,994,764 | ||||||||
Technology Hardware, Storage & Peripherals | 8.3 | 2,876,830 | ||||||||
Semiconductors & Semiconductor Equipment | 6.1 | 2,095,058 | ||||||||
Media | 4.3 | 1,476,170 | ||||||||
Wireless Telecommunication Services | 2.8 | 965,518 | ||||||||
Electronic Equipment, Instruments & Components | 2.5 | 868,668 | ||||||||
Metals & Mining | 2.4 | 825,773 | ||||||||
Chemicals | 2.2 | 764,462 | ||||||||
Automobiles | 2.2 | 744,891 | ||||||||
Household Durables | 1.9 | 669,606 | ||||||||
Hotels, Restaurants & Leisure | 1.9 | 662,492 | ||||||||
Food Products | 1.9 | 656,381 | ||||||||
Diversified Telecommunication Services | 1.9 | 650,958 | ||||||||
Real Estate Management & Development | 1.6 | 539,005 | ||||||||
Thrifts & Mortgage Finance | 1.5 | 523,710 | ||||||||
Auto Components | 1.5 | 503,575 | ||||||||
IT Services | 1.3 | 462,021 | ||||||||
Machinery | 1.3 | 457,864 | ||||||||
Road & Rail | 1.3 | 434,677 | ||||||||
Insurance | 1.2 | 398,707 | ||||||||
Air Freight & Logistics | 1.1 | 398,022 | ||||||||
Airlines | 1.0 | 343,261 | ||||||||
Diversified Consumer Services | 1.0 | 342,693 | ||||||||
Industrial Conglomerates | 1.0 | 342,389 | ||||||||
Aerospace & Defense | 1.0 | 337,075 | ||||||||
Beverages | 0.9 | 299,762 | ||||||||
Electric Utilities | 0.8 | 272,974 | ||||||||
Paper & Forest Products | 0.8 | 266,310 | ||||||||
Specialty Retail | 0.8 | 265,686 | ||||||||
Equity Real Estate Investment Trusts (REITs) | 0.6 | 218,244 | ||||||||
Containers & Packaging | 0.4 | 150,465 | ||||||||
Electrical Equipment | 0.4 | 148,502 | ||||||||
Exchange Traded Funds | 0.4 | 138,979 | ||||||||
Building Products | 0.3 | 117,613 | ||||||||
Other Assets in Excess of Liabilities | 2.2 | 760,942 | ||||||||
|
|
|
| |||||||
NET ASSETS | 100.0 | % | $ | 34,470,282 | ||||||
|
|
|
| |||||||
Portfolio holdings are subject to change at any time.
The accompanying notes are an integral part of the financial statements.
11
DUPONT CAPITAL EMERGING MARKETS FUND
Portfolio of Investments
October 31, 2017
(Unaudited)
| Number of Shares | Value | |||||||
RIGHTS — 0.0% | ||||||||
China — 0.0% | ||||||||
New China Literature Ltd., Expires 11/03/2017 Exercise price HKD 55.55* | 22 | $ | — | |||||
|
| |||||||
Taiwan — 0.0% | ||||||||
CTBC Financial Holdings Co., Expires 12/15/2017 Exercise price TWD 60.00* | 11,161 | — | ||||||
|
| |||||||
TOTAL RIGHTS (Cost $ — ) | — | |||||||
|
| |||||||
COMMON STOCKS — 92.9% |
| |||||||
Argentina — 1.1% | ||||||||
Banco Macro SA, ADR | 2,858 | 359,879 | ||||||
|
| |||||||
Brazil — 5.0% | ||||||||
Embraer SA | 70,100 | 337,075 | ||||||
Even Construtora e Incorporadora SA* | 185,900 | 305,732 | ||||||
Iochpe Maxion SA | 39,350 | 269,206 | ||||||
Kroton Educacional SA | 61,800 | 342,693 | ||||||
Minerva SA | 134,200 | 470,129 | ||||||
|
| |||||||
| 1,724,835 | ||||||||
|
| |||||||
China — 25.0% | ||||||||
Air China Ltd., Class H | 360,000 | 343,261 | ||||||
Alibaba Group Holding, Ltd., SP ADR* | 4,663 | 862,142 | ||||||
China Communications Services Corp., Ltd., Class H | 590,000 | 358,060 | ||||||
China Construction Bank Corp., Class H | 1,109,000 | 991,131 | ||||||
China Lesso Group Holdings Ltd. | 176,000 | 117,613 | ||||||
| Number of Shares | Value | |||||||
COMMON STOCKS — (Continued) |
| |||||||
China — (Continued) | ||||||||
China Mobile, Ltd. | 67,668 | $ | 680,630 | |||||
China Overseas Land & Investment, Ltd. | 166,000 | 539,005 | ||||||
CNOOC, Ltd. | 263,000 | 359,098 | ||||||
Dongfeng Motor Group Co., Ltd., Class H | 402,000 | 551,822 | ||||||
Haier Electronics Group Co. Ltd.* | 138,000 | 363,874 | ||||||
Haitian International Holdings, Ltd. | 63,000 | 188,658 | ||||||
Industrial & Commercial Bank of China, Ltd., Class H | 546,000 | 434,433 | ||||||
Jiangsu Yanghe Brewery Joint-Stock Co. Ltd., Class A | 18,000 | 299,762 | ||||||
NetEase, Inc., ADR | 2,257 | 636,293 | ||||||
Sinotrans, Ltd., Class H | 828,000 | 398,022 | ||||||
Tencent Holdings Ltd. | 27,800 | 1,249,474 | ||||||
YY, Inc., ADR* | 2,731 | 246,855 | ||||||
|
| |||||||
| 8,620,133 | ||||||||
|
| |||||||
Czech Republic — 1.6% | ||||||||
Komercni Banka AS | 12,593 | 541,357 | ||||||
|
| |||||||
Greece — 0.8% | ||||||||
JUMBO SA | 16,528 | 265,686 | ||||||
|
| |||||||
Hungary — 1.1% | ||||||||
OTP Bank PLC | 9,376 | 378,000 | ||||||
|
| |||||||
India — 6.7% | ||||||||
HCL Technologies, Ltd. | 34,961 | 462,021 | ||||||
ICICI Bank, Ltd., SP ADR | 39,856 | 364,682 | ||||||
Indiabulls Housing Finance Ltd. | 27,240 | 523,710 | ||||||
Oil India, Ltd. | 78,992 | 450,539 | ||||||
The accompanying notes are an integral part of the financial statements.
12
DUPONT CAPITAL EMERGING MARKETS FUND
Portfolio of Investments (Continued)
October 31, 2017
(Unaudited)
| Number of Shares | Value | |||||||
COMMON STOCKS — (Continued) |
| |||||||
India — (Continued) | ||||||||
Reliance Industries Ltd., SP GDR(a) | 17,107 | $ | 491,063 | |||||
|
| |||||||
| 2,292,015 | ||||||||
|
| |||||||
Indonesia — 1.9% | ||||||||
Bank Rakyat Indonesia Persero Tbk PT | 581,300 | 668,786 | ||||||
|
| |||||||
Malaysia — 2.1% | ||||||||
Genting Bhd | 179,396 | 383,474 | ||||||
Malayan Banking Bhd | 154,972 | 338,614 | ||||||
|
| |||||||
| 722,088 | ||||||||
|
| |||||||
Mexico — 2.9% | ||||||||
Fibra Uno Administracion Sa de CV, REIT | 139,100 | 218,244 | ||||||
Grupo Financiero Inbursa SAB de CV, Class O | 113,900 | 195,935 | ||||||
Ternium SA, SP ADR | 19,060 | 591,051 | ||||||
|
| |||||||
| 1,005,230 | ||||||||
|
| |||||||
Poland — 0.9% | ||||||||
Bank Handlowy w Warszawie SA | 15,580 | 318,602 | ||||||
|
| |||||||
Russia — 3.7% | ||||||||
Globaltrans Investment PLC, SP GDR | 47,043 | 434,677 | ||||||
Novolipetsk Steel PJSC, GDR | 10,181 | 234,722 | ||||||
Ros Agro PLC, GDR | 15,521 | 186,252 | ||||||
Tatneft PJSC, SP ADR | 9,315 | 419,320 | ||||||
|
| |||||||
| 1,274,971 | ||||||||
|
| |||||||
South Africa — 9.6% | ||||||||
Barclays Africa Group, Ltd. | 54,896 | 543,803 | ||||||
Nampak Ltd.* | 114,376 | 150,465 | ||||||
Naspers, Ltd., N Shares | 6,059 | 1,476,170 | ||||||
| Number of Shares | Value | |||||||
COMMON STOCKS — (Continued) |
| |||||||
South Africa — (Continued) |
| |||||||
Reunert, Ltd. | 13,452 | $ | 66,162 | |||||
Sasol, Ltd. | 16,909 | 494,044 | ||||||
Telkom SA SOC, Ltd. | 78,195 | 292,898 | ||||||
Tsogo Sun Holdings, Ltd. | 190,027 | 279,018 | ||||||
|
| |||||||
| 3,302,560 | ||||||||
|
| |||||||
South Korea — 15.7% | ||||||||
Hyundai Mobis Co., Ltd. | 2,117 | 503,575 | ||||||
Hyundai Motor Co. | 1,342 | 193,069 | ||||||
Korea Electric Power Corp. | 7,786 | 272,974 | ||||||
LG Chem, Ltd. | 750 | 270,418 | ||||||
Samsung Electronics Co., Ltd. | 1,029 | 2,536,594 | ||||||
Samsung Life Insurance Co., Ltd. | 3,307 | 398,707 | ||||||
Shinhan Financial Group Co., Ltd. | 14,859 | 667,439 | ||||||
SK Innovation Co., Ltd. | 3,163 | 580,224 | ||||||
|
| |||||||
| 5,423,000 | ||||||||
|
| |||||||
Taiwan — 11.5% | ||||||||
Chicony Electronics Co., Ltd. | 135,844 | 340,236 | ||||||
CTBC Financial Holding Co., Ltd. | 814,918 | 521,761 | ||||||
Hon Hai Precision Industry Co., Ltd. | 233,705 | 868,668 | ||||||
Novatek Microelectronics Corp. | 111,692 | 413,710 | ||||||
Taiwan Semiconductor Manufacturing Co., Ltd., SP ADR | 39,720 | 1,681,348 | ||||||
Teco Electric and Machinery Co., Ltd. | 159,000 | 148,502 | ||||||
|
| |||||||
| 3,974,225 | ||||||||
|
| |||||||
The accompanying notes are an integral part of the financial statements.
13
DUPONT CAPITAL EMERGING MARKETS FUND
Portfolio of Investments (Concluded)
October 31, 2017
(Unaudited)
| Number of Shares | Value | |||||||
COMMON STOCKS — (Continued) |
| |||||||
Thailand — 1.7% | ||||||||
Bangkok Bank PCL, NVDR | 32,600 | $ | 189,395 | |||||
Kasikornbank PCL, NVDR | 61,970 | 410,445 | ||||||
|
| |||||||
| 599,840 | ||||||||
|
| |||||||
Turkey — 1.6% | ||||||||
Enka Insaat ve Sanayi As | 181,925 | 276,227 | ||||||
Turkcell Iletisim Hizmetleri As | 76,026 | 284,888 | ||||||
|
| |||||||
| 561,115 | ||||||||
|
| |||||||
TOTAL COMMON STOCKS (Cost $24,013,369) |
| 32,032,322 | ||||||
|
| |||||||
PREFERRED STOCKS — 4.5% |
| |||||||
Brazil — 4.5% | ||||||||
Itau Unibanco Holding SA | 44,709 | 576,886 | ||||||
Petroleo Brasileiro SA* | 135,300 | 694,843 | ||||||
Suzano Papel e Celulose SA, Class A | 43,000 | 266,310 | ||||||
|
| |||||||
| 1,538,039 | ||||||||
|
| |||||||
TOTAL PREFERRED STOCKS (Cost $1,123,143) |
| 1,538,039 | ||||||
|
| |||||||
EXCHANGE TRADED FUNDS — 0.4% |
| |||||||
iShares MSCI Emerging Market Index Fund | 3,003 | 138,979 | ||||||
|
| |||||||
TOTAL EXCHANGE TRADED FUNDS (Cost $138,290) |
| 138,979 | ||||||
|
| |||||||
| Value | ||||
TOTAL INVESTMENTS - 97.8% | $ | 33,709,340 | ||
OTHER ASSETS IN EXCESS OF | 760,942 | |||
|
| |||
NET ASSETS - 100.0% | $ | 34,470,282 | ||
|
| |||
| * | Non-income producing. |
| (a) | Security exempt from registration under Rule 144A of the Securities Act of 1933, as amended. This security was purchased in accordance with the guidelines approved by the Fund’s Board of Trustees and may be resold, in transactions exempt from registration, to qualified institutional buyers. At October 31, 2017 this security amounted to $491,063 or 1.4% of net assets. This security has been determined by the Adviser to be a liquid security. |
ADR | American Depository Receipt | |
GDR | Global Depository Receipt | |
NVDR | Non-voting Depository Receipt | |
PCL | Public Company Limited | |
PLC | Public Limited Company | |
REIT | Real Estate Investment Trust | |
SP ADR | Sponsored American Depository Receipt | |
SP GDR | Sponsored Global Depository Receipt |
The accompanying notes are an integral part of the financial statements.
14
DUPONT CAPITAL EMERGING MARKETS DEBT FUND
Portfolio Holdings Summary Table
October 31, 2017
(Unaudited)
The following table presents a summary by security type of the portfolio holdings of the Fund:
| % of Net Assets | Value | |||||||||
SECURITY TYPE: | ||||||||||
Foreign Government Bonds and Notes | 68.2 | % | $ | 4,455,664 | ||||||
Corporate Bonds and Notes | 22.6 | 1,475,764 | ||||||||
U.S. Treasury Obligations | 3.0 | 197,797 | ||||||||
Common Stocks | 0.0 | 956 | ||||||||
Other Assets in Excess of Liabilities | 6.2 | 404,143 | ||||||||
|
|
|
| |||||||
NET ASSETS | 100.0 | % | $ | 6,534,324 | ||||||
|
|
|
| |||||||
Portfolio holdings are subject to change at any time.
The accompanying notes are an integral part of the financial statements.
15
DUPONT CAPITAL EMERGING MARKETS DEBT FUND
Portfolio of Investments
October 31, 2017
(Unaudited)
| Par* Value | Value | |||||||
CORPORATE BONDS AND NOTES — 22.6% |
| |||||||
Austria — 0.0% | ||||||||
OGX Austria GmbH | $ | 200,000 | $ | 20 | ||||
|
| |||||||
China — 4.0% | ||||||||
China Evergrande Group 8.75%, 06/28/2025 | 250,000 | 259,494 | ||||||
|
| |||||||
Israel — 3.6% | ||||||||
Israel Electric Corp., Ltd. | 200,000 | 233,347 | ||||||
|
| |||||||
Netherlands — 6.3% | ||||||||
Majapahit Holding BV | 150,000 | 203,445 | ||||||
Petrobras Global Finance BV | 100,000 | 99,400 | ||||||
Petrobras Global Finance BV | 100,000 | 101,875 | ||||||
Petrobras Global Finance BV | 10,000 | 9,575 | ||||||
|
| |||||||
| 414,295 | ||||||||
|
| |||||||
Russia — 5.5% | ||||||||
Gazprom OAO Via Gaz | 150,000 | 202,408 | ||||||
Russian Agricultural Bank OJSC Via RSHB Capital SA | 150,000 | 154,050 | ||||||
|
| |||||||
| 356,458 | ||||||||
|
| |||||||
| Par* Value | Value | |||||||||
CORPORATE BONDS AND NOTES — (Continued) |
| |||||||||
Venezuela — 3.2% | ||||||||||
Petroleos de Venezuela SA 6.00%, 11/15/2026(b) | $ | 300,000 | $ | 83,250 | ||||||
Petroleos de Venezuela SA 6.00%, 11/15/2026 | 100,000 | 27,750 | ||||||||
Petroleos de Venezuela SA 5.38%, 04/12/2027 | 350,000 | 101,150 | ||||||||
|
| |||||||||
| 212,150 | ||||||||||
|
| |||||||||
TOTAL CORPORATE | 1,475,764 | |||||||||
|
| |||||||||
FOREIGN GOVERNMENT BONDS & NOTES — 68.2% |
| |||||||||
Argentina — 5.9% | ||||||||||
Argentine Republic Government International Bond | 190,000 | 212,800 | ||||||||
Argentine Republic Government International Bond | 160,000 | 174,400 | ||||||||
|
| |||||||||
| 387,200 | ||||||||||
|
| |||||||||
Brazil — 6.7% | ||||||||||
Brazil Notas Do Tesouro Nacional Serie F | BRL | 400,000 | 122,739 | |||||||
Brazil Notas do Tesouro Nacional Serie F | BRL | 1,000,000 | 313,642 | |||||||
|
| |||||||||
| 436,381 | ||||||||||
|
| |||||||||
The accompanying notes are an integral part of the financial statements.
16
DUPONT CAPITAL EMERGING MARKETS DEBT FUND
Portfolio of Investments (Continued)
October 31, 2017
(Unaudited)
| Par* Value | Value | |||||||||
FOREIGN GOVERNMENT BONDS & NOTES — (Continued) |
| |||||||||
Colombia — 3.6% | ||||||||||
Colombia Government International Bond 10.38%, 01/28/2033 | $ | 150,000 | $ | 233,250 | ||||||
|
| |||||||||
Costa Rica — 3.0% | ||||||||||
Costa Rica Government International Bond | 200,000 | 197,750 | ||||||||
|
| |||||||||
Croatia — 3.5% | ||||||||||
Croatia Government International Bond | 200,000 | 227,750 | ||||||||
|
| |||||||||
Dominican Republic — 3.6% |
| |||||||||
Dominican Republic International Bond | 200,000 | 237,500 | ||||||||
|
| |||||||||
Egypt — 1.5% | ||||||||||
Egypt Government International Bond | 100,000 | 99,433 | ||||||||
|
| |||||||||
Greece — 0.1% | ||||||||||
Hellenic Republic Government Bond | EUR | 10,000 | 8,926 | |||||||
|
| |||||||||
Hungary — 1.2% | ||||||||||
Hungary Government International Bond | 50,000 | 77,100 | ||||||||
|
| |||||||||
Lebanon — 0.8% | ||||||||||
Lebanon Government International Bond | 50,000 | 50,780 | ||||||||
|
| |||||||||
| Par* Value | Value | |||||||||
FOREIGN GOVERNMENT BONDS & NOTES — (Continued) |
| |||||||||
Malaysia — 0.6% | ||||||||||
Malaysia Government Bond 3.65%, 10/31/2019 | MYR | 150,000 | $ | 35,666 | ||||||
|
| |||||||||
Mexico — 8.9% | ||||||||||
Mexican Bonos | MXN | 1,200,000 | 72,592 | |||||||
Mexican Bonos | MXN | 2,000,000 | 130,700 | |||||||
Petroleos Mexicanos | 125,000 | 126,562 | ||||||||
Petroleos Mexicanos | 200,000 | 180,680 | ||||||||
Petroleos Mexicanos | 50,000 | 45,332 | ||||||||
Petroleos Mexicanos | 25,000 | 25,768 | ||||||||
|
| |||||||||
| 581,634 | ||||||||||
|
| |||||||||
Morocco — 3.2% | ||||||||||
Morocco Government | 200,000 | 209,916 | ||||||||
|
| |||||||||
Pakistan — 1.6% | ||||||||||
Pakistan Government | 100,000 | 105,681 | ||||||||
|
| |||||||||
Poland — 2.9% | ||||||||||
Republic of Poland | PLN | 700,000 | 190,541 | |||||||
|
| |||||||||
The accompanying notes are an integral part of the financial statements.
17
DUPONT CAPITAL EMERGING MARKETS DEBT FUND
Portfolio of Investments (Continued)
October 31, 2017
(Unaudited)
| Par* Value | Value | |||||||
FOREIGN GOVERNMENT BONDS & NOTES — (Continued) |
| |||||||
Romania — 1.0% | ||||||||
Romanian Government | $ | 50,000 | $ | 63,420 | ||||
|
| |||||||
Serbia — 0.1% | ||||||||
Republic of Serbia | 8,516 | 8,665 | ||||||
|
| |||||||
South Africa — 3.1% | ||||||||
Eskom Holdings SOC Ltd. | 200,000 | 204,500 | ||||||
|
| |||||||
Sri Lanka — 3.2% | ||||||||
Sri Lanka Government | 200,000 | 206,246 | ||||||
|
| |||||||
Turkey — 4.9% | ||||||||
Export Credit Bank of Turkey | 200,000 | 206,026 | ||||||
Turkey Government | 100,000 | 114,638 | ||||||
|
| |||||||
| 320,664 | ||||||||
|
| |||||||
Ukraine — 8.3% | ||||||||
Privatbank CJSC Via UK SPV Credit Finance PLC | 160,000 | 30,400 | ||||||
Ukraine Government International Bond | 50,000 | 28,511 | ||||||
Ukreximbank Via Biz Finance PLC | 250,000 | 272,625 | ||||||
| Par* Value | Value | |||||||
FOREIGN GOVERNMENT BONDS & NOTES — (Continued) |
| |||||||
Ukraine — (Continued) | ||||||||
Ukreximbank Via Biz | $ | 210,000 | $ | 210,000 | ||||
|
| |||||||
| 541,536 | ||||||||
|
| |||||||
Venezuela — 0.5% | ||||||||
Venezuela Government | 50,000 | 31,125 | ||||||
|
| |||||||
TOTAL FOREIGN | 4,455,664 | |||||||
|
| |||||||
U.S. TREASURY OBLIGATIONS — 3.0% |
| |||||||
United States Treasury Note — 3.0% |
| |||||||
2.25%, 08/15/2027 | 200,000 | 197,797 | ||||||
|
| |||||||
TOTAL U.S. | 197,797 | |||||||
|
| |||||||
| Number of Shares | ||||||||
COMMON STOCKS — 0.0% | ||||||||
Brazil — 0.0% | ||||||||
Dommo Energia SA, SP ADR** | 3,187 | 956 | ||||||
|
| |||||||
TOTAL COMMON STOCKS | 956 | |||||||
|
| |||||||
The accompanying notes are an integral part of the financial statements.
18
DUPONT CAPITAL EMERGING MARKETS DEBT FUND
Portfolio of Investments (Concluded)
October 31, 2017
(Unaudited)
| Value | ||||
TOTAL INVESTMENTS - 93.8% | $ | 6,130,181 | ||
OTHER ASSETS IN EXCESS OF | 404,143 | |||
|
| |||
NET ASSETS - 100.0% | $ | 6,534,324 | ||
|
| |||
| * | Par amount denominated in USD unless otherwise noted. |
| ** | Non-income producing. |
| (a) | Investments with a total aggregate value of $30,420 or 0.47% of net assets were in default as of October 31, 2017. |
| (b) | Securities exempt from registration under Rule 144A of the Securities Act of 1933, as amended. These securities were purchased in accordance with the guidelines approved by the Fund’s Board |
of Trustees and may be resold, in transactions exempt from registration, to qualified institutional buyers. At October 31, 2017 these securities amounted to $1,653,366 or 25.30% of net assets. These securities have been determined by the Adviser to be liquid securities. |
| (c) | Multi-Step Coupon. Rate disclosed is as of October 31, 2017. |
| (d) | Variable rate investments. The rate shown is based on the latest available information as of October 31, 2017. Certain variable rate securities are not based on a published reference rate and spread but are determined by the issuer or agent and are based on current market conditions. These securities do not indicate a reference rate or spread in their description. |
Forward foreign currency contracts outstanding as of October 31, 2017 were as follows:
Currency Purchased | Currency Sold | Expiration | Counterparty | Unrealized | ||||||||||||||||
USD | 75,092 | EUR | 62,709 | 12/08/17 | SSB | $1,888 | ||||||||||||||
| BRL | Brazilian Real | |
| EUR | Euro | |
| LIBOR | London Interbank Offered Rate | |
| MXN | Mexican Peso | |
| MYR | Malaysian Ringgit | |
| PLC | Public Limited Company | |
| PLN | Polish Zloty | |
| SP ADR | Sponsored American Depository Receipt | |
| SSB | State Street Bank | |
| USD | United States Dollar | |
| 6-M | Six Months |
The accompanying notes are an integral part of the financial statements.
19
DUPONT CAPITAL FUNDS
Statements of Assets and Liabilities
October 31, 2017
(Unaudited)
| DuPont Capital Emerging Markets Fund | DuPont Capital Emerging Markets Debt Fund | |||||||||
Assets | ||||||||||
Investments, at value (Cost $25,274,802 and $6,255,684, respectively) | $ | 33,709,340 | $ | 6,130,181 | ||||||
Cash | 628,305 | 241,440 | ||||||||
Foreign Currency (Cost $237,521 and $68,377, respectively) | 238,301 | 66,110 | ||||||||
Forward foreign currency contracts appreciation* | — | 1,888 | ||||||||
Receivable for investments sold | 166,200 | — | ||||||||
Dividends and interest receivable | 28,088 | 108,611 | ||||||||
Receivable from Investment Adviser | — | 10,453 | ||||||||
Prepaid expenses and other assets | 39,184 | 27,282 | ||||||||
|
|
|
| |||||||
Total assets | 34,809,418 | 6,585,965 | ||||||||
|
|
|
| |||||||
Liabilities | ||||||||||
Payable for investments purchased | 180,146 | — | ||||||||
Payable for administration and accounting fees | 42,191 | 23,637 | ||||||||
Payable for printing fees | 30,917 | 1,460 | ||||||||
Payable for foreign taxes | 24,913 | — | ||||||||
Payable for custodian fees | 20,279 | 5,018 | ||||||||
Payable for audit fees | 19,425 | 14,253 | ||||||||
Payable for transfer agent fees | 8,809 | 5,014 | ||||||||
Payable to Investment Adviser | 6,016 | — | ||||||||
Payable for legal fees | 4,888 | 820 | ||||||||
Accrued expenses | 1,552 | 1,439 | ||||||||
|
|
|
| |||||||
Total liabilities | 339,136 | 51,641 | ||||||||
|
|
|
| |||||||
Net Assets | $ | 34,470,282 | $ | 6,534,324 | ||||||
|
|
|
| |||||||
Net Assets consisted of: | ||||||||||
Capital stock, $0.01 par value | $ | 37,362 | $ | 6,640 | ||||||
Paid-in capital | 115,321,980 | 6,604,265 | ||||||||
Accumulated net investment income | 439,390 | 119,684 | ||||||||
Accumulated net realized loss from investments and foreign currency transactions | (89,738,816 | ) | (68,902 | ) | ||||||
Net unrealized appreciation/(depreciation) on investments, forward foreign currency contracts and translation of assets and liabilities denominated in foreign currency | 8,410,366 | (127,363 | ) | |||||||
|
|
|
| |||||||
Net Assets | $ | 34,470,282 | $ | 6,534,324 | ||||||
|
|
|
| |||||||
Class I: | ||||||||||
Net asset value, offering and redemption price per share ($34,470,282 / 3,736,218 shares) and ($6,534,324 / 663,970 shares), respectively | $ | 9.23 | $ | 9.84 | ||||||
|
|
|
| |||||||
| * | Primary risk exposure is foreign currency contracts. |
The accompanying notes are an integral part of the financial statements.
20
DUPONT CAPITAL FUNDS
Statements of Operations
For the Six Months Ended October 31, 2017
(Unaudited)
| DuPont Capital Emerging Markets Fund | DuPont Capital Emerging Markets Debt Fund | |||||||||
Investment income | ||||||||||
Dividends | $ | 673,615 | $ | 80 | ||||||
Interest | — | 225,761 | ||||||||
Less: foreign taxes withheld | (80,909 | ) | — | |||||||
|
|
|
| |||||||
Total investment income | 592,706 | 225,841 | ||||||||
|
|
|
| |||||||
Expenses | ||||||||||
Advisory fees (Note 2) | 176,127 | 19,119 | ||||||||
Administration and accounting fees | 49,350 | 32,723 | ||||||||
Printing and shareholder reporting fees | 22,639 | 1,348 | ||||||||
Custodian fees (Note 2) | 20,865 | 9,439 | ||||||||
Trustees’ and officers’ fees (Note 2) | 19,279 | 7,461 | ||||||||
Transfer agent fees (Note 2) | 19,149 | 14,517 | ||||||||
Audit fees | 16,068 | 14,292 | ||||||||
Registration and filing fees | 15,338 | 9,713 | ||||||||
Legal fees | 14,966 | 2,268 | ||||||||
Other expenses | 7,154 | 2,491 | ||||||||
|
|
|
| |||||||
Total expenses before waivers and reimbursements | 360,935 | 113,371 | ||||||||
|
|
|
| |||||||
Less: waivers and reimbursements (Note 2) | (147,906 | ) | (85,012 | ) | ||||||
|
|
|
| |||||||
Net expenses after waivers and reimbursements | 213,029 | 28,359 | ||||||||
|
|
|
| |||||||
Net investment income | 379,677 | 197,482 | ||||||||
|
|
|
| |||||||
Net realized and unrealized gain/(loss) from investments | ||||||||||
Net realized gain from investments | 1,042,571 | 16,387 | ||||||||
Net realized gain/(loss) from foreign currency transactions | (30,386 | ) | 3,498 | |||||||
Net realized loss from forward currency contracts* | — | (8,110 | ) | |||||||
Net change in unrealized appreciation/(depreciation) on investments(a) | 3,452,818 | 31,102 | ||||||||
Net change in unrealized appreciation/(depreciation) on foreign currency translations | 5,804 | (2,528 | ) | |||||||
Net change in unrealized appreciation/(depreciation) on forward foreign currency contracts* | — | 3,837 | ||||||||
|
|
|
| |||||||
Net realized and unrealized gain on investments | 4,470,807 | 44,186 | ||||||||
|
|
|
| |||||||
Net increase in net assets resulting from operations | $ | 4,850,484 | $ | 241,668 | ||||||
|
|
|
| |||||||
| * | Primary risk exposure is foreign currency contracts. |
| (a) | Change in net unrealized appreciation/(depreciation) on investments for the DuPont Capital Emerging Markets Fund was net of an increase in deferred foreign capital gains tax of $12,937. |
The accompanying notes are an integral part of the financial statements.
21
DUPONT CAPITAL EMERGING MARKETS FUND
Statements of Changes in Net Assets
| For the Six Months Ended October 31, 2017 (Unaudited) | For the Year Ended April 30, 2017 | |||||||||
Increase in net assets from operations: | ||||||||||
Net investment income | $ | 379,677 | $ | 593,755 | ||||||
Net realized gain from investments and foreign currency transactions | 1,012,185 | 512,824 | ||||||||
Net change in unrealized appreciation on investments and foreign currency translations | 3,458,622 | 5,740,271 | ||||||||
|
|
|
| |||||||
Net increase in net assets resulting from operations | 4,850,484 | 6,846,850 | ||||||||
|
|
|
| |||||||
Less dividends and distributions to shareholders from: | ||||||||||
Net investment income: | ||||||||||
Class I | — | (542,388 | ) | |||||||
|
|
|
| |||||||
Net decrease in net assets from dividends and distributions to shareholders | — | (542,388 | ) | |||||||
|
|
|
| |||||||
Decrease in net assets derived from capital share transactions (Note 4) | (1,196,281 | ) | (29,625,324 | ) | ||||||
|
|
|
| |||||||
Total increase/(decrease) in net assets | 3,654,203 | (23,320,862 | ) | |||||||
|
|
|
| |||||||
Net assets | ||||||||||
Beginning of period | 30,816,079 | 54,136,941 | ||||||||
|
|
|
| |||||||
End of period | $ | 34,470,282 | $ | 30,816,079 | ||||||
|
|
|
| |||||||
Accumulated net investment income, end of period | $ | 439,390 | $ | 59,713 | ||||||
|
|
|
| |||||||
The accompanying notes are an integral part of the financial statements.
22
DUPONT CAPITAL EMERGING MARKETS DEBT FUND
Statements of Changes in Net Assets
| For the Six Months Ended October 31, 2017 (Unaudited) | For the Year Ended April 30, 2017 | |||||||||
Increase/(decrease) in net assets from operations: | ||||||||||
Net investment income | $ | 197,482 | $ | 406,586 | ||||||
Net realized gain/(loss) from investments, forward foreign currency contracts and foreign currency transactions | 11,775 | (95,934 | ) | |||||||
Net change in unrealized appreciation on investments, forward foreign currency contracts and foreign currency translations | 32,411 | 191,856 | ||||||||
|
|
|
| |||||||
Net increase in net assets resulting from operations | 241,668 | 502,508 | ||||||||
|
|
|
| |||||||
Less dividends and distributions to shareholders from: | ||||||||||
Net investment income: | ||||||||||
Class I | (202,837 | ) | (306,448 | ) | ||||||
Net realized capital gains: | ||||||||||
Class I | — | (12,231 | ) | |||||||
|
|
|
| |||||||
Net decrease in net assets from dividends and distributions to shareholders | (202,837 | ) | (318,679 | ) | ||||||
|
|
|
| |||||||
Increase in net assets derived from capital share transactions (Note 4) | 350,289 | 151,148 | ||||||||
|
|
|
| |||||||
Total increase in net assets | 389,120 | 334,977 | ||||||||
|
|
|
| |||||||
Net Assets | ||||||||||
Beginning of period | 6,145,204 | 5,810,227 | ||||||||
|
|
|
| |||||||
End of period | $ | 6,534,324 | $ | 6,145,204 | ||||||
|
|
|
| |||||||
Accumulated net investment income, end of period | $ | 119,684 | $ | 125,039 | ||||||
|
|
|
| |||||||
The accompanying notes are an integral part of the financial statements.
23
DUPONT CAPITAL EMERGING MARKETS FUND
Financial Highlights
Contained below is per share operating performance data for Class I shares outstanding, total investment return, ratios to average net assets and other supplemental data for the respective period. The total returns in the table represent the rate that an investor would have earned or lost on an investment in the Fund (assuming reinvestment of all dividends and distributions). This information has been derived from information provided in the financial statements and should be read in conjunction with the financial statements and the notes thereto.
| Class I | ||||||||||||||||||||||||||||||
| For the Six Months Ended October 31, 2017 (Unaudited) | For the Year Ended April 30, 2017 | For the Year Ended April 30, 2016 | For the Year Ended April 30, 2015 | For the Year Ended April 30, 2014 | For the Year Ended April 30, 2013 | |||||||||||||||||||||||||
Per Share Operating Performance | ||||||||||||||||||||||||||||||
Net asset value, beginning of period | $ | 7.97 | $ | 6.64 | $ | 8.28 | $ | 8.79 | $ | 9.23 | $ | 9.26 | ||||||||||||||||||
|
|
|
|
|
|
|
|
|
|
|
| |||||||||||||||||||
Net investment income(1) | 0.10 | 0.11 | 0.13 | 0.17 | 0.11 | 0.11 | ||||||||||||||||||||||||
Net realized and unrealized gain/(loss) on investments | 1.16 | 1.32 | (1.73 | ) | (0.53 | ) | (0.44 | ) | (0.05 | ) | ||||||||||||||||||||
|
|
|
|
|
|
|
|
|
|
|
| |||||||||||||||||||
Net increase/(decrease) in net assets resulting from operations | 1.26 | 1.43 | (1.60 | ) | (0.36 | ) | (0.33 | ) | 0.06 | |||||||||||||||||||||
|
|
|
|
|
|
|
|
|
|
|
| |||||||||||||||||||
Dividends and distributions to shareholders from: | ||||||||||||||||||||||||||||||
Net investment income | — | (0.10 | ) | (0.04 | ) | (0.15 | ) | (0.11 | ) | (0.09 | ) | |||||||||||||||||||
|
|
|
|
|
|
|
|
|
|
|
| |||||||||||||||||||
Net asset value, end of period | $ | 9.23 | $ | 7.97 | $ | 6.64 | $ | 8.28 | $ | 8.79 | $ | 9.23 | ||||||||||||||||||
|
|
|
|
|
|
|
|
|
|
|
| |||||||||||||||||||
Total investment return(2) | 15.68 | % | 21.77 | % | (19.23 | )% | (3.97 | )% | (3.61 | )% | 0.59 | % | ||||||||||||||||||
Ratios/Supplemental Data | ||||||||||||||||||||||||||||||
Net assets, end of period (in thousands) | $ | 34,470 | $ | 30,816 | $ | 54,137 | $ | 166,994 | $ | 492,607 | $ | 467,901 | ||||||||||||||||||
Ratio of expenses to average net assets | 1.27 | %(3) | 1.39 | % | 1.60 | % | 1.35 | % | 1.31 | % | 1.32 | % | ||||||||||||||||||
Ratio of expenses to average net assets without waivers and expense reimbursements(4) | 2.15 | %(3) | 2.06 | % | 1.63 | % | 1.35 | % | 1.31 | % | 1.32 | % | ||||||||||||||||||
Ratio of net investment income to average net assets | 2.26 | %(3) | 1.51 | % | 1.81 | % | 1.95 | % | 1.20 | % | 1.21 | % | ||||||||||||||||||
Portfolio turnover rate | 21.1 | %(5) | 28.3 | % | 53.3 | % | 86.4 | % | 69.9 | % | 118.5 | % | ||||||||||||||||||
| (1) | The selected per share data was calculated using the average shares outstanding method for the period. |
| (2) | Total investment return is calculated assuming a purchase of shares on the first day and a sale of shares on the last day of each period reported and includes reinvestment of dividends and distributions, if any. Total return for periods less than one year are not annualized. |
| (3) | Annualized. |
| (4) | During the period, certain fees were waived and/or reimbursed. If such fee waivers and/or reimbursements had not occurred, the ratios would have been as indicated (See Note 2). |
| (5) | Not annualized. |
The accompanying notes are an integral part of the financial statements.
24
DUPONT CAPITAL EMERGING MARKETS DEBT FUND
Financial Highlights
Contained below is per share operating performance data for Class I shares outstanding, total investment return, ratios to average net assets and other supplemental data for the respective period. The total returns in the table represent the rate that an investor would have earned or lost on an investment in the Fund (assuming reinvestment of all dividends and distributions). This information has been derived from information provided in the financial statements and should be read in conjunction with the financial statements and the notes thereto.
| Class I | |||||||||||||||||||||||||
| For the Six Months Ended October 31, 2017 (Unaudited) | For the Year Ended April 30, 2017 | For the Year Ended April 30, 2016 | For the Year Ended April 30, 2015 | For the Period Ended September 27, 2013* to April 30, 2014 | |||||||||||||||||||||
Per Share Operating Performance | |||||||||||||||||||||||||
Net asset value, beginning of period | $ | 9.79 | $ | 9.56 | $ | 9.77 | $ | 10.26 | $ | 10.00 | |||||||||||||||
|
|
|
|
|
|
|
|
|
| ||||||||||||||||
Net investment income(1) | 0.31 | 0.66 | 0.74 | 0.67 | 0.40 | ||||||||||||||||||||
Net realized and unrealized gain/(loss) on investments | 0.06 | 0.11 | 0.21 | (0.43 | ) | 0.26 | |||||||||||||||||||
|
|
|
|
|
|
|
|
|
| ||||||||||||||||
Net increase in net assets resulting from operations | 0.37 | 0.77 | 0.95 | 0.24 | 0.66 | ||||||||||||||||||||
|
|
|
|
|
|
|
|
|
| ||||||||||||||||
Dividends and distributions to shareholders from: | |||||||||||||||||||||||||
Net investment income | (0.32 | ) | (0.52 | ) | (0.98 | ) | (0.44 | ) | (0.40 | ) | |||||||||||||||
Net realized capital gains | — | (0.02 | ) | (0.18 | ) | (0.29 | ) | — | |||||||||||||||||
|
|
|
|
|
|
|
|
|
| ||||||||||||||||
Total dividends and distributions to shareholders | (0.32 | ) | (0.54 | ) | (1.16 | ) | (0.73 | ) | (0.40 | ) | |||||||||||||||
|
|
|
|
|
|
|
|
|
| ||||||||||||||||
Net asset value, end of period | $ | 9.84 | $ | 9.79 | $ | 9.56 | $ | 9.77 | $ | 10.26 | |||||||||||||||
|
|
|
|
|
|
|
|
|
| ||||||||||||||||
Total investment return(2) | 3.91 | % | 8.45 | % | 10.82 | % | 2.41 | % | 6.72 | % | |||||||||||||||
Ratios/Supplemental Data | |||||||||||||||||||||||||
Net assets, end of period (in thousands) | $ | 6,534 | $ | 6,145 | $ | 5,810 | $ | 7,427 | $ | 7,404 | |||||||||||||||
Ratio of expenses to average net assets | 0.89 | %(3) | 0.89 | % | 0.89 | % | 0.89 | % | 0.89 | %(3) | |||||||||||||||
Ratio of expenses to average net assets without waivers and expense | 3.56 | %(3) | 3.70 | % | 3.34 | % | 2.25 | % | 4.42 | %(3) | |||||||||||||||
Ratio of net investment income to average net assets | 6.19 | %(3) | 6.84 | % | 7.93 | % | 6.70 | % | 6.83 | %(3) | |||||||||||||||
Portfolio turnover rate | 8.6 | %(5) | 17.9 | % | 24.6 | % | 23.7 | % | 21.6 | %(5) | |||||||||||||||
| * | Commencement of operations. |
| (1) | The selected per share data was calculated using the average shares outstanding method for the period. |
| (2) | Total investment return is calculated assuming a purchase of shares on the first day and a sale of shares on the last day of each period reported and includes reinvestment of dividends and distributions, if any. Total return for periods less than one year are not annualized. |
| (3) | Annualized. |
| (4) | During the period, certain fees were waived and/or reimbursed. If such fee waivers and/or reimbursements had not occurred, the ratios would have been as indicated (See Note 2). |
| (5) | Not annualized. |
The accompanying notes are an integral part of the financial statements.
25
DUPONT CAPITAL FUNDS
Notes to Financial Statements
October 31, 2017
(Unaudited)
1. Organization and Significant Accounting Policies
The DuPont Capital Emerging Markets Fund is a diversified, open-end management investment company registered under the Investment Company Act of 1940, as amended (the “1940 Act”). The DuPont Capital Emerging Markets Debt Fund is a non-diversified, open-end management investment company registered under the 1940 Act (the DuPont Capital Emerging Markets Fund and the DuPont Capital Emerging Markets Debt Fund are each a “Fund”, and together, the “Funds”). The DuPont Capital Emerging Markets Fund commenced operations on December 6, 2010 and the DuPont Capital Emerging Markets Debt Fund commenced operations on September 27, 2013. The Funds are each a separate series of FundVantage Trust (the “Trust”) which was organized as a Delaware statutory trust on August 28, 2006. The Trust is a “series trust” authorized to issue an unlimited number of separate series or classes of shares of beneficial interest. Each series is treated as a separate entity for certain matters under the 1940 Act, and for other purposes, and a shareholder of one series is not deemed to be a shareholder of any other series. The Funds are each authorized to issue and offer Class I Shares.
The Funds are investment companies and follow accounting and reporting guidance in the Financial Accounting Standards Board Accounting Standards Codification Topic 946.
Portfolio Valuation — Each Fund’s net asset value (“NAV”) is calculated once daily at the close of regular trading hours on the New York Stock Exchange (“NYSE”) (typically 4:00 p.m. Eastern time) on each day the NYSE is open. Securities held by each Fund are valued using the closing price or the last sale price on a national securities exchange or the National Association of Securities Dealers Automatic Quotation System (“NASDAQ”) market system where they are primarily traded. Equity securities listed on any national or foreign exchange market system will be valued at the last sale price. Equity securities traded in the over-the-counter market are valued at their closing price. If there were no transactions on that day, securities traded principally on an exchange will be valued at the mean of the last bid and ask prices prior to the market close. Prices for equity securities normally are supplied by an independent pricing service approved by the Trust’s Board of Trustees (“Board of Trustees”). Fixed income securities are valued based on market quotations, which are furnished by an independent pricing service approved by the FundVantage Board of Trustees. Fixed income securities having remaining maturities of 60 days or less are generally valued at amortized cost, provided such amounts approximates market value. Debt securities are valued on the basis of broker quotations or valuations provided by a pricing service, which utilizes information with respect to recent sales, market transactions in comparable securities, quotations from dealers, and various relationships between securities in determining value. Due to continued volatility in the current market, valuations developed through pricing techniques may materially vary from the actual amounts realized upon sale of the securities. Any assets held by the Funds that are denominated in foreign currencies are valued daily in U.S. dollars at the foreign currency exchange rates that are prevailing at the time that the Funds determine the daily NAV per share. Foreign securities may trade on weekends or other days when the Funds do not calculate NAV. As a result, the market value of these investments may change on days when you cannot buy or sell shares of the Funds. Foreign securities are valued
26
DUPONT CAPITAL FUNDS
Notes to Financial Statements (Continued)
October 31, 2017
(Unaudited)
based on prices from the primary market in which they are traded and are translated from the local currency into U.S. dollars using current exchange rates. Forward exchange contracts are valued at the forward rate. Investments in any mutual fund are valued at their respective NAVs as determined by those mutual funds each business day (which may use fair value pricing as disclosed in their prospectuses). Securities that do not have a readily available current market value are valued in accordance with the procedures adopted by the Board of Trustees. The Board of Trustees has adopted methods for valuing securities and other assets in circumstances where market quotes are not readily available and has delegated to the Adviser the responsibility for applying the valuation methods. Relying on prices supplied by pricing services or dealers or using fair valuation may result in values that are higher or lower than the values used by other investment companies and investors to price the same investments. In the event that market quotes are not readily available, and the security or asset cannot be valued pursuant to one of the valuation methods, the value of the security or asset will be determined in good faith by the Adviser. The Trust has established a Valuation Committee which performs certain functions including the oversight of the Adviser’s fair valuation determinations.
Fair Value Measurements — The inputs and valuations techniques used to measure fair value of each Fund’s investments are summarized into three levels as described in the hierarchy below:
• Level 1 — | quoted prices in active markets for identical securities; | |
• Level 2 — | other significant observable inputs (including quoted prices for similar securities, interest rates, prepayment speeds, credit risk, etc.); and | |
• Level 3 — | significant unobservable inputs (including each Fund’s own assumptions in determining the fair value of investments). | |
The fair value of each Fund’s bonds is generally based on quotes received from brokers of independent pricing services. Bonds with quotes that are based on actual trades with a sufficient level of activity on or near the measurement date are classified as Level 2 assets.
The inputs or methodology used for valuing securities are not necessarily an indication of the risk associated with investing in those securities. Transfers in and out are recognized at the value at the end of the period.
Significant events (such as movement in the U.S. securities market, or other regional and local developments) may occur between the time that foreign markets close (where the security is principally traded) and the time that each Fund calculates its NAV (generally, the close of the NYSE) that may impact the value of securities traded in these foreign markets. As a result, each Fund fair values foreign securities using an independent pricing service which considers the correlation of the trading patterns of the foreign security to the intraday trading in the U.S. markets for investments such as American Depositary Receipts, financial futures, exchange traded funds and certain indexes as well as prices for similar securities. Such fair valuations are categorized as Level 2 in the hierarchy.
27
DUPONT CAPITAL FUNDS
Notes to Financial Statements (Continued)
October 31, 2017
(Unaudited)
Securities listed on a non-U.S. exchange are generally fair valued daily by an independent fair value pricing service approved by the Board of Trustees and categorized as Level 2 investments within the hierarchy. The fair valuations for these securities may not be the same as quoted or published prices of the securities on their primary markets. Securities for which daily fair value prices from the independent fair value pricing service are not available are generally valued at the last quoted sale price at the close of an exchange on which the security is traded and categorized as Level 1 investments within the hierarchy. Values of foreign securities, currencies, and other assets and liabilities denominated in foreign currencies are translated into U.S. dollars at the exchange rate of said currencies against the U.S. dollar, as of Valuation Time, as provided by an independent pricing service approved by the Board of Trustees.
The following is a summary of the inputs used, as of October 31, 2017, in valuing each Fund’s investments carried at fair value:
| DuPont Capital Emerging Markets Fund | ||||||||||||||||
| Total Value at 10/31/17 | Level 1 Quoted Prices | Level 2 Other Significant Observable Inputs | Level 3 Significant Unobservable Inputs | |||||||||||||
Common Stocks | ||||||||||||||||
Argentina | $ | 359,879 | $ | 359,879 | $ | — | $ | — | ||||||||
Brazil | 1,724,835 | 1,724,835 | — | — | ||||||||||||
China | 8,620,133 | 1,745,290 | 6,874,843 | — | ||||||||||||
Czech Republic | 541,357 | 541,357 | — | — | ||||||||||||
Greece | 265,686 | 265,686 | — | — | ||||||||||||
Hungary | 378,000 | — | 378,000 | — | ||||||||||||
India | 2,292,015 | 855,745 | 1,436,270 | — | ||||||||||||
Indonesia | 668,786 | — | 668,786 | — | ||||||||||||
Malaysia | 722,088 | — | 722,088 | — | ||||||||||||
Mexico | 1,005,230 | 1,005,230 | — | — | ||||||||||||
Poland | 318,602 | 318,602 | — | — | ||||||||||||
Russia | 1,274,971 | 620,929 | 654,042 | — | ||||||||||||
South Africa | 3,302,560 | 359,060 | 2,943,500 | — | ||||||||||||
South Korea | 5,423,000 | — | 5,423,000 | — | ||||||||||||
Taiwan | 3,974,225 | 1,681,348 | 2,292,877 | — | ||||||||||||
Thailand | 599,840 | — | 599,840 | — | ||||||||||||
Turkey | 561,115 | — | 561,115 | — | ||||||||||||
Preferred Stocks | 1,538,039 | 1,538,039 | — | — | ||||||||||||
Exchange Traded Funds | 138,979 | 138,979 | — | — | ||||||||||||
|
|
|
|
|
|
|
| |||||||||
Total Investments | $ | 33,709,340 | $ | 11,154,979 | $ | 22,554,361 | $ | — | ||||||||
|
|
|
|
|
|
|
| |||||||||
28
DUPONT CAPITAL FUNDS
Notes to Financial Statements (Continued)
October 31, 2017
(Unaudited)
| DuPont Capital Emerging Markets Debt Fund | ||||||||||||||||
Assets | Total Value at 10/31/17 | Level 1 Quoted Prices | Level 2 Other Significant Observable Inputs | Level 3 Significant Unobservable Inputs | ||||||||||||
Corporate Bonds and Notes | $ | 1,475,764 | $ | — | $ | 1,475,764 | $ | — | ||||||||
Foreign Government Bonds and Notes | 4,455,664 | — | 4,455,664 | — | ||||||||||||
U.S. Treasury Obligations | 197,797 | — | 197,797 | — | ||||||||||||
Common Stocks | 956 | 956 | — | — | ||||||||||||
Derivatives: | ||||||||||||||||
Foreign Currency Contracts | ||||||||||||||||
Forward Foreign Currency Contracts | 1,888 | — | 1,888 | — | ||||||||||||
|
|
|
|
|
|
|
| |||||||||
Total Assets | $ | 6,132,069 | $ | 956 | $ | 6,131,113 | $ | — | ||||||||
|
|
|
|
|
|
|
| |||||||||
At the end of each quarter, management evaluates the classification of Levels 1, 2 and 3 assets and liabilities. Various factors are considered, such as changes in liquidity from the prior reporting period; whether or not a broker is willing to execute at the quoted price; the depth and consistency of prices from third party pricing services; and the existence of contemporaneous, observable trades in the market. Additionally, management evaluates the classification of Level 1 and Level 2 assets and liabilities on a quarterly basis for changes in listings or delistings on national exchanges.
Due to the inherent uncertainty of determining the fair value of investments that do not have readily available market value, the fair value of each Fund’s investments may fluctuate from period to period. Additionally, the fair value of investments may differ significantly from the values that would have been used had a ready market existed for such investments and may differ materially from the values each Fund may ultimately realize. Further, such investments may be subject to legal and other restrictions on resale or otherwise less liquid than publicly traded securities.
For fair valuations using significant unobservable inputs, U.S. generally accepted accounting principles (“U.S. GAAP”) require each Fund to present a reconciliation of the beginning to ending balances for reported market values that presents changes attributable to total realized and unrealized gains or losses, purchase and sales, and transfers in and out of Level 3 during the period. Transfers in and out between Levels are based on values at the end of the period. U.S. GAAP also requires each Fund to disclose amounts and reasons for all transfers in and out of Level 1 and Level 2 fair value measurements. A reconciliation of Level 3 investments is presented only when each Fund had an amount of Level 3 investments at the end of the reporting period that was meaningful in relation to its net assets. The amounts and
29
DUPONT CAPITAL FUNDS
Notes to Financial Statements (Continued)
October 31, 2017
(Unaudited)
reasons for all transfers in and out of each Level within the three-tier hierarchy are disclosed when each Fund had an amount of total transfers during the reporting period that was meaningful in relation to its net assets as of the end of the reporting period.
For the six months ended October 31, 2017, there were transfers from Level 2 to Level 1 of $999,221 due to foreign fair value adjustments in the DuPont Capital Emerging Markets Fund. The DuPont Capital Emerging Markets Debt Fund had no transfers between Levels 1, 2 and 3.
Use of Estimates — The preparation of financial statements in conformity with U.S. GAAP requires management to make estimates and assumptions that affect the amounts reported in the financial statements and accompanying notes at the date of the financial statements and the reported amounts of revenues and expenses during the period. Actual results could differ from those estimates and those differences could be material.
Investment Transactions, Investment Income and Expenses — Investment transactions are recorded on trade date for financial statement preparation purposes. Realized gains and losses on investments sold are recorded on the identified cost basis. Interest income is recorded on the accrual basis. Accretion of discounts and amortization of premiums are recorded on a daily basis using the effective yield method except for short term securities, which records discounts and premiums on a straight-line basis. Dividends are recorded on the ex-dividend date. General expenses of the Trust are generally allocated to each fund in proportion to its relative daily net assets. Expenses directly attributable to a particular fund in the Trust are charged directly to that fund.
Foreign Currency Translation — Assets and liabilities initially expressed in non-U.S. currencies are translated into U.S. dollars based on the applicable exchange rates at the date of the last business day of the financial statement period. Purchases and sales of securities, interest income, dividends, variation margin received and expenses denominated in foreign currencies are translated into U.S. dollars at the exchange rates in effect on the transaction date.
Each Fund does not separately report the effect of changes in foreign exchange rates from changes in market prices of securities held. Such changes are included with the net realized gain or loss and change in unrealized appreciation or depreciation on investment securities in the Statement of Operations. Other foreign currency transactions resulting in realized and unrealized gain or loss are reported separately as net realized gain or loss and change in unrealized appreciation or depreciation on foreign currencies in the Statement of Operations.
Dividends and Distributions to Shareholders — Dividends from net investment income, if any, are declared and paid at least annually to shareholders of the DuPont Capital Emerging Markets Fund and dividends from net investment income are declared daily and paid monthly to shareholders of the DuPont Capital Emerging Markets Debt Fund. Distributions from net realized capital gains, if any, will
30
DUPONT CAPITAL FUNDS
Notes to Financial Statements (Continued)
October 31, 2017
(Unaudited)
be declared and paid at least annually to shareholders and recorded on ex-date for both Funds. Income dividends and capital gain distributions are determined in accordance with U.S. federal income tax regulations, which may differ from U.S. GAAP. These differences may include the treatment of non-taxable dividends, expiring capital loss carryforwards and losses deferred due to wash sales and excise tax regulations. Permanent book and tax basis differences relating to shareholder distributions will result in reclassifications within the components of net assets.
U.S. Tax Status — No provision is made for U.S. income taxes as it is each Fund’s intention to continue to qualify for and elect the tax treatment applicable to regulated investment companies under Subchapter M of the Internal Revenue Code of 1986, as amended (the “Internal Revenue Code”), and make the requisite distributions to its shareholders which will be sufficient to relieve it from U.S. income and excise taxes.
Other — In the normal course of business, each Fund may enter into contracts that provide general indemnifications. Each Fund’s maximum exposure under these arrangements is dependent on claims that may be made against each Fund in the future, and, therefore, cannot be estimated; however, based on experience, the risk of material loss for such claims is considered remote.
Forward Foreign Currency Contracts — A forward foreign currency contract (“Forward Contract”) is a commitment to buy or sell a specific amount of a foreign currency at a negotiated price on a specified future date. Forward Contracts can help a fund manage the risk of changes in currency exchange rates. These contracts are marked-to-market daily at the applicable forward currency translation rates. A fund records realized gains or losses at the time the Forward Contract is closed. A Forward Contract is extinguished through a closing transaction or upon delivery of the currency or entering an offsetting contract. The Fund’s maximum risk of loss from counterparty credit risk related to Forward Contracts is the fair value of the contract.
For the six months ended October 31, 2017, the DuPont Capital Emerging Markets Debt Fund’s average monthly volume of forward foreign currency contracts was as follows:
Forward Foreign Currency Contracts - Payable (Value At Trade Date) | Forward Foreign Currency Contracts - Receivable (Value At Trade Date) | |
$(25,031) | $25,031 |
Recent Accounting Pronouncement — On August 1, 2017, the Funds implemented changes due to amendments to Regulation S-X, issued by the Securities and Exchange Commission, which require standardized, enhanced disclosures, particularly related to derivatives, in investment company financial statements. Adoption of the amendments had no effect on the Funds’ net assets or results of operations.
31
DUPONT CAPITAL FUNDS
Notes to Financial Statements (Continued)
October 31, 2017
(Unaudited)
Currency Risk — Each Fund invests in securities of foreign issuers, including American Depositary Receipts. These markets are subject to special risks associated with foreign investments not typically associated with investing in U.S. markets. Because the foreign securities in which each Fund may invest generally trade in currencies other than the U.S. dollar, changes in currency exchange rates will affect each Fund’s NAV, the value of dividends and interest earned and gains and losses realized on the sale of securities. Because the NAV for each Fund is determined on the basis of U.S. dollars, each Fund may lose money by investing in a foreign security if the local currency of a foreign market depreciates against the U.S. dollar, even if the local currency value of each Fund’s holdings goes up. Generally, a strong U.S. dollar relative to these other currencies will adversely affect the value of each Fund’s holdings in foreign securities.
Foreign Securities Market Risk — Securities of many non-U.S. companies may be less liquid and their prices more volatile than securities of comparable U.S. companies. Securities of companies traded in many countries outside the U.S., particularly emerging markets countries, may be subject to further risks due to the inexperience of local investment professionals and financial institutions, the possibility of permanent or temporary termination of trading and greater spreads between bid and asked prices of securities. In addition, non-U.S. stock exchanges and investment professionals are subject to less governmental regulation, and commissions may be higher than in the United States. Also, there may be delays in the settlement of non-U.S. stock exchange transactions.
Emerging Markets Risk — The DuPont Capital Emerging Markets Fund and the DuPont Capital Emerging Markets Debt Fund invest in emerging market instruments which are subject to certain credit and market risks. The securities and currency markets of emerging market countries are generally smaller, less developed, less liquid and more volatile than the securities and currency markets of the United States and other developed markets. Disclosure and regulatory standards in many respects are less stringent than in other developed markets. There also may be a lower level of monitoring and regulation of securities markets in emerging market countries and the activities of investors in such markets and enforcement of existing regulations may be extremely limited. Political and economic structures in many of these countries may be in their infancy and developing rapidly, and such countries may lack the social, political and economic stability characteristics of more developed countries.
Debt Investment Risk — Debt investments are affected primarily by the financial condition of the companies or other entities that have issued them and by changes in interest rates. There is a risk that an issuer of a Fund’s debt investments may not be able to meet its financial obligations (e.g., may not be able to make principal and/or interest payments when they are due or otherwise default on other financial terms) and/or go bankrupt. Securities such as high-yield/high-risk bonds, e.g., bonds with low credit ratings by Moody’s (Ba or lower) or Standard & Poor’s (BB and lower) or if unrated are of comparable quality as determined by the manager, are especially subject to credit risk during periods of economic uncertainty or during economic downturns and are more likely to default on their interest and/or principal payments than higher rated securities. Debt investments may be affected by changes in interest rates.
32
DUPONT CAPITAL FUNDS
Notes to Financial Statements (Continued)
October 31, 2017
(Unaudited)
Debt investments with longer durations tend to be more sensitive to changes in interest rates, making them more volatile than debt investments with shorter durations or floating or adjustable interest rates. The value of debt investments may fall when interest rates rise.
2. Transactions with Related Parties and Other Service Providers
DuPont Capital Management Corporation (“DuPont Capital” or the “Adviser”) serves as investment adviser to each Fund pursuant to an investment advisory agreement with the Trust. For its services, the Adviser is paid a monthly fee at the annual rate of 1.05% of the DuPont Capital Emerging Markets Fund’s average daily net assets; and 0.60% of the DuPont Capital Emerging Markets Debt Fund’s average daily net assets. The Adviser has contractually agreed to reduce its investment advisory fee and/or reimburse certain expenses of each Fund to the extent necessary to ensure that the Funds’ total operating expenses, excluding taxes, “Acquired Fund Fees and Expenses”, interest, extraordinary items, and brokerage commissions, do not exceed 1.27% and 0.89%, respectively, (on an annual basis) of the DuPont Capital Emerging Markets Fund and the DuPont Capital Emerging Markets Debt Fund’s average daily net assets (the “Expense Limitation”), respectively. The Expense Limitations will remain in place until August 31, 2018, unless the Board of Trustees approves its earlier termination. The Adviser is entitled to recover, subject to approval by the Board of Trustees, such amounts reduced or reimbursed for a period of up to three (3) years from the date on which the Adviser reduced its compensation and/or assumed expenses for each Fund. The Adviser is permitted to seek reimbursement from the Funds, subject to certain limitations, for fees it waived and Fund expenses it paid to the extent the total annual fund expenses do not exceed the limits described above or any lesser limits in effect at the time of reimbursement. No recoupment will occur unless each Funds’ expenses are below the Expense Limitation amount.
For the six months ended October 31, 2017, the Adviser earned advisory fees of $176,127 and $19,119 for the DuPont Capital Emerging Markets Fund and the DuPont Capital Emerging Markets Debt Fund, respectively. For the six months ended October 31, 2017, the Adviser waived fees and reimbursed expenses of $147,906 and $85,012 for the DuPont Capital Emerging Markets Fund and the DuPont Capital Emerging Markets Debt Fund, respectively.
As of October 31, 2017, the amount of potential recoupment by the Adviser was as follows:
| Expiration 04/30/2018 | Expiration 04/30/2019 | Expiration 04/30/2020 | Expiration 10/31/2020 | Total | ||||||||||||||||
DuPont Capital Emerging Markets Fund | $ | — | $ | 30,175 | $ | 263,954 | $ | 147,906 | $ | 442,035 | ||||||||||
DuPont Capital Emerging Markets Debt Fund | 101,163 | 157,238 | 167,169 | 85,012 | 510,582 | |||||||||||||||
33
DUPONT CAPITAL FUNDS
Notes to Financial Statements (Continued)
October 31, 2017
(Unaudited)
Other Service Providers
BNY Mellon Investment Servicing (US) Inc. (“BNY Mellon”) serves as administrator and transfer agent for the Funds. For providing administrative and accounting services, BNY Mellon is entitled to receive a monthly fee equal to an annualized percentage rate of each Funds’ average daily net assets and is subject to certain minimum monthly fees. For providing transfer agent services, BNY Mellon is entitled to receive a monthly fee, subject to certain minimum, and out of pocket expenses.
The Bank of New York Mellon (the “Custodian”) provides certain custodial services to the Funds. The Custodian is entitled to receive a monthly fee, subject to certain minimum, and out of pocket expenses.
Foreside Funds Distributors LLC (the “Underwriter”) provides principal underwriting services to the Funds pursuant to an underwriting agreement between the Trust and the Underwriter.
Trustees and Officers
The Trust is governed by its Board of Trustees. The Trustees of the Trust receive compensation in the form of an annual retainer and per meeting fees for their services to the Trust. The remuneration paid to the Trustees by the Funds during the six months ended October 31, 2017 was $6,100. An employee of BNY Mellon serves as the Secretary of the Trust and is not compensated by the Funds or the Trust.
JW Fund Management LLC (“JWFM”) provides a Principal Executive Officer and Principal Financial Officer, respectively, to the Trust. JWFM is compensated for the services provided to the Trust.
Freeh Group International Solutions, LLC provides the Trust with a Chief Compliance Officer and an Anti-Money Laundering Officer.
3. Investment in Securities
For the six months ended October 31, 2017, aggregate purchases and sales of investment securities (excluding U.S. Government and agency short-term investments and other short-term investments) of the Funds were as follows:
| Purchases | Sales | |||||||
DuPont Capital Emerging Markets Fund | ||||||||
Investment Securities | $ | 6,851,598 | $ | 8,152,305 | ||||
DuPont Capital Emerging Markets Debt Fund | ||||||||
Investment Securities | $ | 447,215 | $ | 498,393 | ||||
U.S. Government Securities | 198,539 | — | ||||||
34
DUPONT CAPITAL FUNDS
Notes to Financial Statements (Continued)
October 31, 2017
(Unaudited)
4. Capital Share Transactions
For the six months ended October 31, 2017 and the year ended April 30, 2017, transactions in capital shares (authorized shares unlimited) were as follows:
| DuPont Capital Emerging Markets Fund | ||||||||||||||||
| For the Six Months Ended October 31, 2017 (Unaudited) | For the Year Ended April 30, 2017 | |||||||||||||||
| Shares | Amount | Shares | Amount | |||||||||||||
Class I | ||||||||||||||||
Sales | 17,997 | $ | 149,014 | 427,269 | $ | 3,012,038 | ||||||||||
Reinvestments | — | — | 76,004 | 541,146 | ||||||||||||
Redemptions | (148,074 | ) | (1,345,295 | ) | (4,787,175 | ) | (33,178,508 | ) | ||||||||
|
|
|
|
|
|
|
| |||||||||
Net decrease | (130,077 | ) | $ | (1,196,281 | ) | (4,283,902 | ) | $ | (29,625,324 | ) | ||||||
|
|
|
|
|
|
|
| |||||||||
| DuPont Capital Emerging Markets Debt Fund | ||||||||||||||||
| For the Six Months Ended October 31, 2017 (Unaudited) | For the Year Ended April 30, 2017 | |||||||||||||||
| Shares | Amount | Shares | Amount | |||||||||||||
Class I | ||||||||||||||||
Sales | 14,955 | $ | 147,452 | 37,407 | $ | 341,899 | ||||||||||
Reinvestments | 21,217 | 202,837 | 34,295 | 318,679 | ||||||||||||
Redemptions | — | — | (51,817 | ) | (509,430 | ) | ||||||||||
|
|
|
|
|
|
|
| |||||||||
Net increase | 36,172 | $ | 350,289 | 19,885 | $ | 151,148 | ||||||||||
|
|
|
|
|
|
|
| |||||||||
5. Federal Tax Information
The Funds have followed the authoritative guidance on accounting for and disclosure of uncertainty in tax positions, which requires the Funds to determine whether a tax position is more likely than not to be sustained upon examination, including resolution of any related appeals or litigation processes, based on the technical merits of the position. Each Fund has determined that there was no effect on the financial statements from following this authoritative guidance. In the normal course of business, the Funds are subject to examination by federal, state and local jurisdictions, where applicable, for tax years for which applicable statutes of limitations have not expired.
For the year ended April 30, 2017, the tax character of distributions paid by the DuPont Capital Emerging Markets Fund and the DuPont Capital Emerging Markets Debt Fund were $542,388 and $318,679 of ordinary income dividends, respectively. Distributions from net investment income and short-term capital gains are treated as ordinary income for federal income tax purposes.
35
DUPONT CAPITAL FUNDS
Notes to Financial Statements (Continued)
October 31, 2017
(Unaudited)
As of April 30, 2017, the components of distributable earnings on a tax basis were as follows:
| Capital Loss Carryforward | Undistributed Ordinary Income | Undistributed Long-Term Gain | Unrealized Appreciation/ (Depreciation) | Qualified Late-Year Losses | ||||||||||||||
DuPont Capital | $ | (88,186,959 | ) | $ | 70,488 | $— | $ | 2,847,874 | $ | (470,947 | ) | |||||||
DuPont Capital | $ | — | $ | 135,906 | $— | $ | (170,641 | ) | $ | (80,677 | ) | |||||||
The differences between the book and tax basis components of distributable earnings relate primarily to the timing and recognition of income and gains for federal income tax purposes.
At October 31, 2017, the federal tax cost, aggregate gross unrealized appreciation and depreciation of securities held by the Funds were as follows:
| Federal Tax Cost* | Unrealized Appreciation | Unrealized Depreciation | Net Unrealized Appreciation/ (Depreciation) | |||||||||||||
DuPont Capital Emerging Markets Fund | $ | 25,274,802 | $ | 8,977,373 | $ | (542,835 | ) | $ | 8,434,538 | |||||||
DuPont Capital Emerging Markets Debt Fund | 6,255,684 | 505,320 | (630,823 | ) | (125,503 | ) | ||||||||||
| * | Because tax adjustments are calculated annually at the end of the Fund’s fiscal year, the above table does not reflect tax adjustments for the current fiscal year. For the previous year’s federal income tax information, please refer to the Notes to Financial Statements section in the Fund’s most recent annual report. |
Pursuant to federal income tax rules applicable to regulated investment companies, the Funds may elect to treat certain net capital losses between November 1 and April 30 and late year ordinary losses ((i) ordinary losses between January 1 and April 30, and (ii) specified ordinary and currency losses between November 1 and April 30) as occurring on the first day of the following tax year. For the year ended April 30, 2017, any amount of losses elected within the tax return will not be recognized for federal income tax purposes until May 1, 2017. For the year ended April 30, 2017, the DuPont Capital Emerging Markets Fund and the DuPont Capital Emerging Markets Debt Fund had $470,947 and $80,677 of capital loss deferrals, respectively.
Accumulated capital losses represent net capital loss carryforwards as of April 30, 2017 that may be available to offset future realized capital gains and thereby reduce future capital gains distributions.
36
DUPONT CAPITAL FUNDS
Notes to Financial Statements (Concluded)
October 31, 2017
(Unaudited)
As of April 30, 2017, the DuPont Capital Emerging Markets Fund had capital loss carryforwards of $88,186,959, of which $63,187,220 are long-term losses and $24,999,739 are short-term losses and have an unlimited period of capital loss carryforward. As of April 30, 2017, the DuPont Capital Emerging Markets Debt Fund had no capital loss carryforwards. On November 27, 2015, the DuPont Capital Emerging Markets Fund experienced a more than 50% change of ownership as defined by Internal Revenue Code Section 382(g) giving rise to an annual capital loss carryforward limitation on the use of pre-ownership change capital losses. At the time of the change the DuPont Capital Emerging Markets Fund had $83,500,000 of capital loss carryforwards impacted by the ownership change and the use of those losses against capital gains will be limited to $1,618,329 per tax year. The permitted annual capital loss, if not applied to capital gains in the tax year, will accumulate and be available in the next year for use.
6. Subsequent Events
Management has evaluated the impact of all subsequent events on each Fund through the date the financial statements were issued and has determined that there were no subsequent events requiring recognition or disclosure in the financial statements.
37
DUPONT CAPITAL FUNDS
Other Information
(Unaudited)
Proxy Voting
Policies and procedures that the Funds use to determine how to vote proxies relating to portfolio securities as well as information regarding how the Funds voted proxies relating to portfolio securities for the most recent 12-month period ended June 30 are available without charge, upon request, by calling (888) 447-0014 and on the Securities and Exchange Commission’s (“SEC”) website at http:// www.sec.gov.
Quarterly Portfolio Schedules
The Trust files its complete schedule of portfolio holdings with the SEC for the first and third fiscal quarters of each fiscal year (quarters ended July 31 and January 31) on Form N-Q. The Trust’s Forms N-Q are available on the SEC’s website at http://www.sec.gov and may be reviewed and copied at the SEC’s Public Reference Room in Washington, D.C. Information on the operation of the SEC’s Public Reference Room may be obtained by calling 1-800-SEC-0330.
Board Consideration of Investment Advisory Agreement
At a meeting held on June 26-27, 2017 (the “Meeting”), the Board of Trustees (the “Board” or the “Trustees”) of FundVantage Trust (the “Trust”), including a majority of the Trustees who are not “interested persons” within the meaning of Section 2(a)(19) of the Investment Company Act of 1940, as amended (the “1940 Act”) (the “Independent Trustees”), unanimously approved the continuation of the advisory agreement between DuPont Capital Management Corporation (“DuPont Capital” or the “Adviser”) and the Trust (the “Agreement”) on behalf of DuPont Capital Emerging Markets Fund (the “EM Fund”) and DuPont Capital Emerging Markets Debt Fund (the “EM Debt Fund,” and together with the EM Fund, the “Funds”). At the Meeting, the Board considered the continuation of the Agreement with respect to the Funds for an additional one year period.
In determining whether to approve the Agreement, the Trustees considered information provided by the Advisor in accordance with Section 15(c) of the 1940 Act regarding: (i) services performed for the Funds, (ii) the size and qualifications of their portfolio management staff, (iii) any potential or actual material conflicts of interest which may arise in connection with a portfolio manager’s management of the Funds, (iv) investment performance, (v) the capitalization and financial condition of the Advisor, (vi) brokerage selection procedures (including soft dollar arrangements, if any), (vii) the procedures for allocating investment opportunities between the Funds and other clients, (viii) results of any regulatory examination, including any recommendations or deficiencies noted, (ix) any litigation, investigation or administrative proceeding which may have a material impact on the Advisor’s ability to service the Funds, (x) compliance with the Funds’ investment objectives, policies and practices (including codes of ethics and proxy voting policies) and (xi) compliance with federal securities laws and other regulatory requirements. The Trustees
38
DUPONT CAPITAL FUNDS
Other Information
(Unaudited)
noted the reports and discussions with portfolio managers as provided at the Board meetings throughout the year covering matters such as the relative performance of the Funds; compliance with the investment objectives, policies, strategies and limitations for the Funds; the compliance of management personnel with the applicable code of ethics; and the adherence to the Trust’s pricing procedures as established by the Board.
Representatives from the Advisor attended the Meeting in person. The representatives discussed the firm’s history, performance and investment strategies in connection with the proposed approval of the Agreement and answered questions from the Board.
Investment Performance. The Trustees considered the investment performance for the DuPont EM Fund and DuPont. The Trustees reviewed the historical performance charts for the one year, three year, five year and since inception periods ended April 30, 2017 for (i) the DuPont EM Fund; (ii) the MSCI Emerging Markets Index; and (iii) a comparable separately managed account composite (gross of fees). Additionally, the Trustees reviewed the historical performance charts for the year-to-date, one year, two year, three year, five year and since inception periods ended March 31, 2017 for the DuPont EM Fund and the Lipper Emerging Markets Fund Index, the DuPont EM Fund’s applicable Lipper peer index.
The Trustees noted that the DuPont EM Fund outperformed the MSCI Emerging Markets Index and the comparable separately managed account composite for the one year period ended April 30, 2017. The Trustees also noted that the DuPont EM Fund underperformed the MSCI Emerging Markets Index for the three year, five year and since inception periods ended April 30, 2017 and underperformed the separately managed account composite for the since inception period ended April 30, 2017. Additionally, the Trustees noted that the DuPont EM Fund outperformed the comparable separately managed account composite account for the three year and five year periods ended April 30, 2017. The Trustees further noted that the DuPont EM Fund underperformed the Lipper Emerging Markets Fund Index for the year-to-date, two year, three year, five year and since inception periods ended March 31, 2017 and outperformed the Lipper Emerging Markets Fund Index for the one year period ended March 31, 2017. The Trustees concluded that, although the DuPont EM Fund had underperformed the MSCI Emerging Markets Index, a comparable separately managed account composite (gross of fees) and the Lipper Emerging Markets Fund Index, the DuPont EM Fund’s applicable Lipper peer index during certain periods, the performance of the DuPont EM Fund was within an acceptable range of performance relative to other mutual funds with similar investment objectives, strategies and policies based on the information provided at the Meeting.
The Trustees also considered the investment performance for the DuPont EM Debt Fund. The Trustees reviewed the historical performance charts for the one year and since inception periods ended April 30, 2017 for (i) the DuPont EM Debt Fund; (ii) the JPM EMBI Global Diversified Index; and (iii) a comparable separately managed account composite (gross of fees). Additionally, the Trustees reviewed the historical performance charts for the year-to-date, one year, two year, three year and since inception periods ended March 31, 2017 for the DuPont EM Debt Fund and the Lipper Emerging Markets Hard Currency Debt Fund Index, the DuPont EM Debt Fund’s applicable Lipper index.
39
DUPONT CAPITAL FUNDS
Other Information
(Unaudited)
The Trustees noted that the DuPont EM Debt Fund outperformed the JPM EMBI Global Diversified Index for the three year and since inception periods ended April 30, 2017, and underperformed the JPM EMBI Global Diversified Index for the one year period ended April 30, 2017. The Trustees also noted that the DuPont EM Debt Fund outperformed the comparable separately managed account composite for the one year and three year periods ended April 30, 2017, and underperformed the comparable separately managed account composite for the since inception period, ended April 30, 2017. Additionally, the Trustees noted that the DuPont EM Debt Fund outperformed the Lipper Emerging Markets Hard Currency Debt Fund Index for the year to date, two year, three year and since inception periods ended March 31, 2017 and underperformed the Lipper Emerging Markets Hard Currency Debt Fund Index for the one year period ended March 31, 2017. The Trustees concluded that the performance of the DuPont EM Debt Fund was within an acceptable range of performance relative to other mutual funds with similar investment objectives, strategies and policies based on the information provided at the Meeting.
Fees. The Trustees noted that the representatives of DuPont had provided information regarding its advisory fees and an analysis of these fees in relation to the delivery of services to the Funds and any other ancillary benefit resulting from DuPont’s relationship with the Funds. The Trustees considered the fees that DuPont charges to its separately managed accounts, and evaluated the explanations provided by DuPont as to differences in fees charged to the Funds and separately managed accounts. The Trustees also reviewed a peer comparison of advisory fees and total expenses for the Funds versus other similarly managed funds.
The Trustees noted that the DuPont EM Fund’s gross advisory fee was higher than with the median gross advisory fee of funds in the applicable Lipper category and that the Fund’s net total expense ratio was higher than the median net total expense ratio of Funds in the applicable Lipper category. The Trustees concluded that the advisory fees and services provided by DuPont are consistent with those of other advisers and sub-advisers which manage mutual funds with investment objectives, strategies and policies similar to those of the DuPont EM Fund based on the information provided at the Meeting.
The Trustees noted that the DuPont EM Debt Fund’s gross advisory fee and net total expense ratio were each lower than the median net total expense ratio of the applicable Lipper category. The Trustees concluded that the advisory fees and services provided by DuPont are consistent with those of other advisers that manage mutual funds with investment objectives, strategies and policies similar to those of the DuPont EM Debt Fund based on the information provided at the Meeting.
Knowledge, experience, and qualifications. The Board considered the level and depth of knowledge of DuPont, including the professional experience and qualifications of senior personnel. In evaluating the quality of services to be provided by DuPont, the Board took into account its familiarity with DuPont’s
40
DUPONT CAPITAL FUNDS
Other Information
(Unaudited) (Concluded)
senior management through Board meetings, discussions and reports during the preceding year. The Board also took into account DuPont’s compliance policies and procedures and reports regarding DuPont’s compliance operations from the Trust’s Chief Compliance Officer. The Board also considered any potential conflicts of interest that may arise in a portfolio manager’s management of the Funds’ investments on the one hand, and the investments of other accounts, on the other. The Trustees reviewed the services provided to the Funds by DuPont and concluded that the nature, extent and quality of the services provided were appropriate and consistent with the terms of the Agreement, that the quality of the proposed services appeared to be consistent with industry norms and that the Funds are likely to benefit from the continued receipt of those services. They also concluded that DuPont has sufficient personnel, with the appropriate education and experience, to serve the Funds effectively and had demonstrated their ability to attract and retain qualified personnel.
Cost of Services. The Trustees considered the costs of the services provided by DuPont, the compensation and benefits received by DuPont in providing services to the Funds, as well as DuPont’s profitability. The Trustees were provided with the most recent Item 6 of Form 10-K of DuPont’s parent company for its most recent fiscal year ended December 31, 2015. The Trustees noted that DuPont’s level of profitability is an important factor to consider, and the Trustees should be satisfied that DuPont’s profits are sufficient to continue as a healthy concern generally and as investment adviser of the Funds specifically. The Trustees concluded that DuPont’s advisory fee level was reasonable in relation to the nature and quality of the services provided, taking into account the current size and projected growth of the Funds.
Economies of Scale. The Trustees considered the extent to which economies of scale would be realized relative to fee levels as the Funds grow, and whether the advisory fee levels reflect these economies of scale for the benefit of shareholders. The Board noted that economies of scale may be achieved at higher asset levels for the Funds for the benefit of fund shareholders, but that the advisory fee did not currently include breakpoint reductions as asset levels increased.
At the Meeting, the Trustees unanimously approved the Agreement for an additional one year period. In voting to approve the continuation of the Agreement, the Board considered all factors it deemed relevant and the information presented to the Board by DuPont. In arriving at its decision, the Board did not identify any single factor as being of paramount importance and each member of the Board gave varying weights to each factor according to his or her own judgment. The Board determined that the continuation of the Agreement would be in the best interests of the Funds and their shareholders.
41
[THIS PAGE INTENTIONALLY LEFT BLANK.]
[THIS PAGE INTENTIONALLY LEFT BLANK.]
Investment Adviser DuPont Capital Management Corporation One Righter Parkway Suite 3200 Wilmington, DE 19803
Administrator BNY Mellon Investment Servicing (US) Inc. 301 Bellevue Parkway Wilmington, DE 19809
Transfer Agent BNY Mellon Investment Servicing (US) Inc. 4400 Computer Drive Westborough, MA 01581
Principal Underwriter Foreside Funds Distributors LLC 400 Berwyn Park 899 Cassatt Road Berwyn, PA 19312
Custodian The Bank of New York Mellon 225 Liberty Street New York, NY 10286
Independent Registered Public Accounting Firm PricewaterhouseCoopers LLP Two Commerce Square, Suite 1800 2001 Market Street Philadelphia, PA 19103-7042
Legal Counsel Pepper Hamilton LLP 3000 Two Logan Square 18th and Arch Streets Philadelphia, PA 19103 | DUPONT CAPITAL EMERGING MARKETS FUND
DUPONT CAPITAL EMERGING MARKETS DEBT FUND
of FundVantage Trust
Class I
SEMI-ANNUAL REPORT
October 31, 2017 (Unaudited)
This report is submitted for the general information of the shareholders of the DuPont Capital Emerging Markets Fund and the DuPont Capital Emerging Markets Debt Fund. It is not authorized for distribution unless preceded or accompanied by a current prospectus for the DuPont Capital Emerging Markets Fund and the DuPont Capital Emerging Markets Debt Fund. |
DUP-1017

EIC VALUE FUND
Semi-Annual Investment Adviser’s Report
October 31, 2017
(Unaudited)
Dear Fellow Shareholder,
Thank you for reviewing our semi-annual report. In it, we discuss our perspective on the market, the EIC Value Fund’s (the “Fund”) performance, and some of our recent purchase and sale activity in the Fund. A listing of the Fund’s investments and other financial information follow our comments.
Perspective on the Market
Recent economic data has been positive: employment levels have climbed, Gross Domestic Product (GDP) has strengthened and earnings per share have grown. Through the lens of our value discipline, however, these improvements (and more) are already priced into shares, which makes for a difficult opportunity set. At today’s levels, the S&P 500 trades at approximately 22x trailing pro-forma earnings, 24x trailing Generally Accepted Accounting Principles (GAAP) earnings, and 20x forward earnings estimates.1 While not the most expensive market in history, it is among the priciest, especially considering the relatively sluggish earnings environment. Earnings per share are growing this year, but until the second quarter, S&P 500 Index earnings had not eclipsed the highs last reached in 2014. Much of that softness was due to declines in the energy sector, but in most other sectors stock price gains have outpaced earnings growth, as shown in the following chart.
Cumulative Gains for S&P 500 & Select Sectors: 12/13/14 - 10/31/17
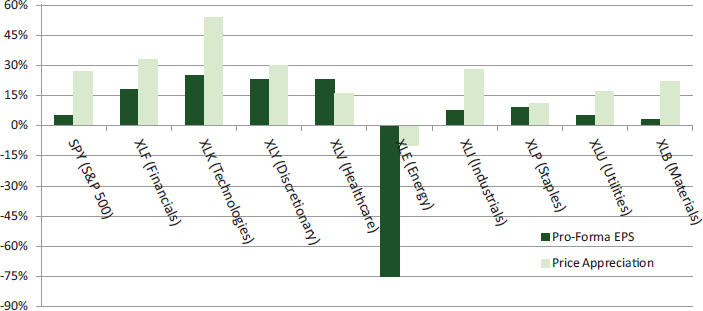
Source: Standard & Poors; S&P and sector earnings data through most recent reported quarter; ETF prices from Yahoo! Finance.
1Source: Standard & Poor’s. Trailing-twelve-month earnings as of September 30, 2017; forward earnings estimates for calendar-year 2017. Prices as of October 31, 2017, from Yahoo! Finance.
Securities in the Fund do not match those in the indices and performance of the Fund will differ. Indices are unmanaged, do not incur management fees, cost and expenses, and cannot be invested in directly.
1
EIC VALUE FUND
Semi-Annual Investment Adviser’s Report (Continued)
October 31, 2017
(Unaudited)
Since S&P 500 earnings last peaked in 2014, they have grown a total of 5%, but stock prices are 27% higher. Referring to our year-end 2014 investment commentary, we already saw the market as challenging at that time:
“While we do not know what the future holds, we do know low interest rates have created a complex investment environment both by lifting prices (so there are fewer attractively priced opportunities), and by making the determination of economic value more difficult.”
This is now the second longest bull market on record, and a period of unusually muted stock volatility. In fact, we haven’t seen so much as a 5% correction in the stock market in over 18 months. Among other factors, we believe that the prolonged state of low interest rates is having a significant, though likely temporary, effect on the psychology of the markets and valuations. Rational investors are seeking alternatives to “risk-free” Treasuries yielding from 1-3%, and in doing so, they are becoming more comfortable bidding all manner of riskier assets higher. If Treasury bonds yield 2%, then equities at a 4-5% earnings yield priced at 20-24x earnings make sense, at least theoretically. What this comparison assumes, though, as it does for buying any other long-term risk asset, is that interest rates won’t change. To quote Warren Buffett, “If we knew interest rates were going to be zero from here to judgement day, we could pay a lot of money for any other asset.”
Unfortunately, the future is, as always, uncertain. Higher interest rates would directly affect the discount rates used to value long-term assets like equities, and, all else equal, reduce their values. However, it has been so long without meaningfully higher rates, or stock price volatility, a recession, credit cycle, etc., that we think many investors have forgotten the eventual certainty of at least some of those outcomes. Most investors’ memories are short, and consider that the financial crisis was nine years ago, in 2008, which means there is a new generation of clients, advisors, analysts and portfolio managers whose sole adult investing experience is one buoyed by low rates and relatively calm, upwardly moving markets, where every dip is an immediate buying opportunity. This is a market where, in the short run, memory and experience tends to be a liability. We think the ability to manage through adverse environments will prove beneficial once again.
We continue to view our role as managing Fund assets through any scenario the market throws at us – protecting against what may happen, rather than predicting what will happen. By focusing on earnings sustainability and quality, and sticking to our valuation discipline, we seek to produce reasonable absolute returns when risks are being ignored (like today), suffer less when those risks are realized (which they invariably will be), and in doing so come out ahead versus the markets over the long term (which we have done historically).
Fund Performance
For the six months ending October 31, 2017, the Fund’s Institutional Class shares rose 6.19% net of expenses. The Russell 3000® Value Index gained 5.46%, while the S&P 500® Index increased 9.10%.
The performance data quoted represents past performance and does not guarantee future results. The investment return and principal value of an investment in the Fund will fluctuate so that an investor s shares, when redeemed, may be worth more or less than their original cost. Current performance may be lower or higher. Performance data current to the most recent month-end may be obtained by calling (855) 430-6487.
2
EIC VALUE FUND
Semi-Annual Investment Adviser’s Report (Continued)
October 31, 2017
(Unaudited)
Performance attribution for the six-month period follows. Fund results are compared to the Russell 3000® Value Index unless otherwise noted.
The Fund’s outperformance relative to its benchmark was primarily attributable to our stock selection.
We don’t target sector weightings, either in an absolute sense or relative to market indices; they are instead principally a residual of stock selection. Nevertheless, it is at times instructive to see how sector allocations affected performance. On balance, they were a positive contributor to Fund performance.
Nine of the eleven sectors in the Russell 3000® Value Index posted positive returns for the six months ended October 31, 2017. Financials and materials were the top performing sectors, each gaining 12.4%. Information technology was next in line, rising 10.7%, followed by utilities, up 8.7%. We were overweight materials and technology but underweight financials (though it was our largest nominal sector allocation) and utilities relative to the index.
In contrast, telecommunication services and consumer staples were the two sectors posting negative returns, declining 8.7% and 3.0%, respectively. Real estate, which increased just 0.4%, and energy, which gained 1.5%, were also relatively weak performers. Fortunately, we were underweight all except consumer staples.
Our stock selection in consumer staples more than offset our overweight to one of the market’s poorer performing sectors. The Fund’s holdings gained a combined 2.4%, compared to a 3.0% decrease for the index’s consumer staples stocks. Wal-Mart Stores, up 17.6%, and Whole Foods Market, which rose 16.3% before we sold it in June, were the Fund’s standout performers in this sector.
Our stock selection in the energy sector also helped. The index’s energy stocks gained only 1.5%, while the Fund’s holdings increased a collective 14.4%. In particular, Diamond Offshore Drilling hit its 52-week low in early July but has since climbed 63.7%.
On the other hand, our security selection in the financials sector adversely affected Fund performance. Our holdings were up sharply, advancing a combined 9.9%, but trailed the index’s finance stocks, which rose 12.4%. More specifically, strong showings from American Express, up 21.4%, and PNC Financial Services, up 15.5%, were partially offset by a 1.4% decline from Franklin Resources and a relatively small 1.9% gain from Annaly Capital Management.
Given the market’s advance, cash has been the largest drag on Fund performance over the last six months. The Fund’s cash position continues to be high, 16.1% at the end of October, because we find few compelling bargains in today’s market.
Portfolio Activity
Our turnover was relatively low during the six-month period, as is typical for us during times of elevated stock prices and lower market volatility. Consistent with our history, we expect turnover to increase when volatility and more attractive investment opportunities return.
Here’s a recap of some of our recent purchase and sale activity.
In May, we added modestly to our position in Diamond Offshore Drilling. Diamond has been a poor performer over our full holding period (though it has performed well of late) on continued commodity weakness and concerns about uncertain offshore drilling activity. Nonetheless, Diamond is prudently capitalized, conservatively managed, and free cash flow positive. While it faces ongoing risk, potential upside is considerable, and we believe it merits a small weighting in the Fund.
3
EIC VALUE FUND
Semi-Annual Investment Adviser’s Report (Concluded)
October 31, 2017
(Unaudited)
During June, we exited our position in Whole Foods Markets after the announcement that Amazon would acquire it. Whole Foods’ stock rose to the agreed price, slightly above our own assessment of the firm’s value, where we sold. Shortly thereafter, we purchased a small position in Kroger, which has seen its shares slump in recent years on increasing grocery competition and fell farther with the Amazon/Whole Foods announcement in anticipation of even greater challenges to come. While Amazon’s entry into grocery is likely to intensify an already difficult environment, Kroger is accustomed to the hyper-competitive grocery business, is a well-managed operator with nationwide scale, and was available to us at what we view as an attractive price.
In August, we established a new position in Lowe’s Companies. Lowe’s is the second largest home improvement retailer in the United States and also operates stores in Canada and Mexico as well as online. Lowe’s recent performance has been strong yet has trailed growth at its larger competitor, Home Depot. We believe the performance differences are likely to prove temporary; yet, Lowe’s trades at a significantly lower price, creating an attractive entry point for us.
Finally, we trimmed two positions during the six-month period: Johnson & Johnson, and Microsoft. Both companies have been strong performers and prices are near our assessment of full value, prompting us to reduce exposure in order to manage price risk.
There can be no guarantee that any strategy (risk management or otherwise) will be successful. All investing involves risk, including potential loss of principal.
This letter is intended to assist shareholders in understanding how the Fund performed during the six-months ended October 31, 2017 and reflects the views of the investment adviser at the time of this writing. Of course, these views may change and do not guarantee the future performance of the Fund or the markets.
The above commentary is for informational purposes only and does not represent an offer, recommendation or solicitation to buy, hold or sell any security. The specific securities identified and described do not represent all of the securities purchased or sold and you should not assume that investments in the securities identified and discussed will be profitable.
Portfolio composition is subject to change. The current and future portfolio holdings of the Fund are subject to investment risk.
4
EIC VALUE FUND
Semi-Annual Report
Performance Data
October 31, 2017
(Unaudited)
| Average Annual Total Returns for the Periods Ended October 31, 2017 | ||||||||||||||||||||
| Six Months† | 1 Year | 3 Years | 5 Years | Since Inception* | ||||||||||||||||
Class A (with sales charge) | 0.23% | 7.79 | % | 3.73 | % | 8.12 | % | 7.78 | % | |||||||||||
Class A (without sales charge) | 6.08% | 14.04 | % | 5.70 | % | 9.36 | % | 8.72 | % | |||||||||||
Russell 3000® Value Index | 5.46% | 18.30 | % | 8.11 | % | 13.48 | % | 11.41 | %** | |||||||||||
S&P 500® Index | 9.10% | 23.63 | % | 10.77 | % | 15.18 | % | 12.98 | %** | |||||||||||
Class C (with CDSC charge) | 4.64% | 12.22 | % | 4.91 | % | 8.54 | % | 8.38 | % | |||||||||||
Class C (without CDSC charge) | 5.64% | 13.22 | % | 4.91 | % | 8.54 | % | 8.38 | % | |||||||||||
Russell 3000® Value Index | 5.46% | 18.30 | % | 8.11 | % | 13.48 | % | 12.46 | %** | |||||||||||
S&P 500® Index | 9.10% | 23.63 | % | 10.77 | % | 15.18 | % | 13.81 | %** | |||||||||||
Institutional Class | 6.19% | 14.36 | % | 5.95 | % | 9.61 | % | 8.92 | % | |||||||||||
Russell 3000® Value Index | 5.46% | 18.30 | % | 8.11 | % | 13.48 | % | 11.07 | % | |||||||||||
S&P 500® Index | 9.10% | 23.63 | % | 10.77 | % | 15.18 | % | 12.64 | %** | |||||||||||
| † | Not Annualized. |
| * | Class A, Class C and Institutional Class shares of the EIC Value Fund (the “Fund”) commenced operations on May 19, 2011, July 18, 2011 and May 1, 2011, respectively. |
| ** | Benchmark performance is from commencement date of the class only and is not the commencement date of the benchmark itself. |
The performance data quoted represents past performance and does not guarantee future results. The investment return and principal value of an investment in the Fund will fluctuate so that an investor’s shares, when redeemed, may be worth more or less than their original cost. The table does not reflect the deduction of taxes that a shareholder would pay on Fund distributions or redemption of Fund shares. Current performance may be lower or higher. Performance data current to the most recent month-end may be obtained by calling (855) 430-6487.
The returns shown for Class A shares reflect a deduction for the maximum front-end sales charge of 5.50%. The returns shown for Class C shares reflect a maximum deferred sales charge of 1.00%. All of the Fund’s share classes apply a 2.00% fee to the value of shares redeemed within 30 days of purchase. This redemption fee is not reflected in the returns shown above. The Fund’s “Total Annual Fund Operating Expenses,” as stated in the current prospectus dated September 1, 2017, are 1.25% for Class A shares, 2.00% for Class C shares and 1.00% for Institutional Class shares, respectively, of the Class’ average daily net assets. The ratios may differ from the actual expenses incurred by the Fund for the period covered by this report. Equity Investment Corporation (the “Adviser”) has contractually agreed to waive or otherwise reduce its annual compensation received from the Fund to the extent necessary to ensure that the Fund’s total operating expenses, excluding taxes, any class-specific fees and expenses (such as Rule 12b-1 distribution fees, shareholder service fees or transfer agency fees), “Acquired Fund Fees and Expenses,” interest, extraordinary items and brokerage commissions, do not exceed 1.00% of average daily net assets of the Fund (the “Expense Limitation”). The Expense Limitation will remain in place until August 31, 2018, unless the Board of Trustees (“Board of Trustees”) of FundVantage Trust (“the Trust”) approves its earlier termination. Subject to approval by the Board of Trustees, the Adviser may recoup any expenses or fees it has reimbursed within a three-year period from the date on which the Adviser reduced its compensation and/or assumed expenses of the Fund. The
5
EIC VALUE FUND
Semi-Annual Report
Performance Data (Concluded)
October 31, 2017
(Unaudited)
Adviser is permitted to seek reimbursement from the Fund, subject to certain limitations, for fees it waived and Fund expenses it paid to the extent the total annual fund operating expenses do not exceed the limits described above or any lesser limits in effect at the time of reimbursement. No recoupment will occur unless the Fund’s expenses are below the Expense Limitation amount. Total returns would be lower had such fees and expenses not been waived and/or reimbursed.
Mutual fund investing involves risk, including possible loss of principal. Value investing involves the risk that the Fund’s investing in companies believed to be undervalued will not appreciate as anticipated. The Fund may invest in the stocks of smaller- and medium-sized companies which may be more vulnerable to adverse business or economic events than larger, more established companies.
The Fund intends to evaluate performance as compared to that of the S&P 500® Index and the Russell 3000® Value Index. The S&P 500® is a widely recognized, unmanaged index of 500 common stocks which are generally representative of the U.S. stock market as a whole. The Russell 3000® Value Index is an unmanaged index that measures the performance of the 3,000 largest U.S. stocks, representing about 98% of the total capitalization of the entire U.S. stock market. It is impossible to invest directly in an index.
6
EIC VALUE FUND
Fund Expense Disclosure
October 31, 2017
(Unaudited)
As a shareholder of the Fund, you incur two types of costs: (1) transaction costs including sales charges (loads) on purchase payments (if any) or redemption fees; and (2) ongoing costs, including management fees, distribution and/or service (Rule 12b-1) fees (if any) and other Fund expenses. These examples are intended to help you understand your ongoing costs (in dollars) of investing in the Fund and to compare these costs with the ongoing costs of investing in other mutual funds.
These examples are based on an investment of $1,000 invested at the beginning of the six-month period from May 1, 2017 through October 31, 2017 and held for the entire period.
Actual Expenses
The first line of each accompanying table provides information about actual account values and actual expenses. You may use the information in this line, together with the amount you invested, to estimate the expenses that you paid over the period. Simply divide your account value by $1,000 (for example, an $8,600 account value divided by $1,000 = 8.6), then multiply the result by the number in the first line under the heading entitled “Expenses Paid During Period” to estimate the expenses you paid on your account during this period.
Hypothetical Examples for Comparison Purposes
The second line of each accompanying table provides information about hypothetical account values and hypothetical expenses based on the Fund’s actual expense ratio and an assumed rate of return of 5% per year before expenses, which is not your Fund’s actual return. The hypothetical account values and expenses may not be used to estimate the actual ending account balance or expenses you paid for the period. You may use this information to compare the ongoing costs of investing in the Fund and other funds. To do so, compare these 5% hypothetical examples with the 5% hypothetical examples that appear in the shareholder reports of other funds.
Please note that the expenses shown in the accompanying tables are meant to highlight your ongoing costs only and do not reflect any transactional costs, such as sales charges (loads) on purchase payments (if any) or redemption fees. Therefore, the second line of each accompanying table is useful in comparing ongoing costs only, and will not help you determine the relative total costs of owning different funds. In addition, if these transactional costs were included, your costs would have been higher.
7
EIC VALUE FUND
Fund Expense Disclosure (Concluded)
October 31, 2017
(Unaudited)
| EIC Value Fund | |||||||||||||||
| Beginning Account Value May 1, 2017 | Ending Account Value October 31, 2017 | Expenses Paid During Period* | |||||||||||||
Class A | |||||||||||||||
Actual | $1,000.00 | $1,060.80 | $6.39 | ||||||||||||
Hypothetical (5% return before expenses) | 1,000.00 | 1,019.00 | 6.26 | ||||||||||||
Class C | |||||||||||||||
Actual | $1,000.00 | $1,056.40 | $10.26 | ||||||||||||
Hypothetical (5% return before expenses) | 1,000.00 | 1,015.22 | 10.06 | ||||||||||||
Institutional Class | |||||||||||||||
Actual | $1,000.00 | $1,061.90 | $5.09 | ||||||||||||
Hypothetical (5% return before expenses) | 1,000.00 | 1,020.27 | 4.99 | ||||||||||||
| * | Expenses are equal to the Fund’s annualized expense ratio for the six-month period ended October 31, 2017 of 1.23%, 1.98%, and 0.98% for Class A, Class C, and Institutional Class shares, respectively, multiplied by the average account value over the period, multiplied by the number of days in the most recent period (184), then divided by 365 to reflect the period. The Fund’s ending account values on the first line in each table are based on the actual six-month total returns for the Fund of 6.08%, 5.64%, and 6.19% for Class A, Class C, and Institutional Class shares, respectively. |
8
EIC VALUE FUND
Portfolio Holdings Summary Table
October 31, 2017
(Unaudited)
The following table presents a summary by sector of the portfolio holdings of the Fund:
| % of Net Assets | Value | |||||||
COMMON STOCKS: | ||||||||
Financial | 21.1 | % | $ | 52,943,440 | ||||
Consumer, Non-cyclical | 17.0 | 42,430,168 | ||||||
Consumer, Cyclical | 11.5 | 28,677,594 | ||||||
Energy | 9.0 | 22,563,783 | ||||||
Communications | 7.9 | 19,763,961 | ||||||
Technology | 3.8 | 9,487,218 | ||||||
Utilities | 3.8 | 9,484,936 | ||||||
Basic Materials | 2.8 | 7,049,956 | ||||||
Industrial | 2.7 | 6,763,852 | ||||||
REITs-Diversified | 1.4 | 3,513,063 | ||||||
REITs-Office Property | 1.0 | 2,523,599 | ||||||
Short-Term Investment | 14.0 | 35,010,046 | ||||||
Other Assets in Excess of Liabilities | 4.0 | 10,118,811 | ||||||
|
|
|
| |||||
NET ASSETS | 100.0 | % | $ | 250,330,427 | ||||
|
|
|
| |||||
Portfolio holdings are subject to change at any time.
The accompanying notes are an integral part of the financial statements.
9
EIC VALUE FUND
Portfolio of Investments
October 31, 2017
(Unaudited)
| Number of Shares | Value | |||||||
COMMON STOCKS — 82.0% |
| |||||||
Basic Materials — 2.8% | ||||||||
PPG Industries, Inc. | 60,650 | $ | 7,049,956 | |||||
|
| |||||||
Communications — 7.9% | ||||||||
Cisco Systems, Inc. | 147,930 | 5,051,810 | ||||||
eBay, Inc.* | 245,150 | 9,227,446 | ||||||
Verizon Communications, Inc. | 114,575 | 5,484,705 | ||||||
|
| |||||||
| 19,763,961 | ||||||||
|
| |||||||
Consumer, Cyclical — 11.5% |
| |||||||
CVS Health Corp. | 82,625 | 5,662,291 | ||||||
Honda Motor Co. Ltd., SP ADR | 45,850 | 1,425,476 | ||||||
Lowe’s Cos, Inc. | 70,300 | 5,620,485 | ||||||
Target Corp. | 120,375 | 7,106,940 | ||||||
Wal-mart Stores, Inc. | 101,505 | 8,862,402 | ||||||
|
| |||||||
| 28,677,594 | ||||||||
|
| |||||||
Consumer, Non-cyclical — 17.0% |
| |||||||
GlaxoSmithKline PLC, SP ADR | 197,275 | 7,186,728 | ||||||
Johnson & Johnson | 45,775 | 6,381,493 | ||||||
Kroger Co. (The) | 240,925 | 4,987,148 | ||||||
McKesson Corp. | 32,925 | 4,539,699 | ||||||
Medtronic PLC | 93,175 | 7,502,451 | ||||||
Pepsico, Inc. | 65,350 | 7,203,530 | ||||||
Procter & Gamble Co. (The) | 53,615 | 4,629,119 | ||||||
|
| |||||||
| 42,430,168 | ||||||||
|
| |||||||
Energy — 9.0% | ||||||||
ConocoPhillips | 152,875 | 7,819,556 | ||||||
Diamond Offshore Drilling, Inc.* | 344,985 | 5,771,599 | ||||||
Exxon Mobil Corp. | 107,650 | 8,972,628 | ||||||
|
| |||||||
| 22,563,783 | ||||||||
|
| |||||||
| Number of Shares | Value | |||||||
COMMON STOCKS — (Continued) |
| |||||||
Financial — 21.1% | ||||||||
American Express Co. | 91,695 | $ | 8,758,706 | |||||
Franklin Resources, Inc. | 76,860 | 3,238,113 | ||||||
PNC Financial Services Group, Inc. (The) | 54,950 | 7,516,610 | ||||||
SunTrust Banks, Inc. | 81,630 | 4,914,942 | ||||||
Torchmark Corp. | 61,357 | 5,161,964 | ||||||
Travelers Cos, Inc. (The) | 54,980 | 7,282,101 | ||||||
US Bancorp | 151,465 | 8,236,667 | ||||||
Wells Fargo & Co. | 139,550 | 7,834,337 | ||||||
|
| |||||||
| 52,943,440 | ||||||||
|
| |||||||
Industrial — 2.7% | ||||||||
United Parcel Service, Inc., Class-B | 57,550 | 6,763,852 | ||||||
|
| |||||||
REITs-Diversified — 1.4% | ||||||||
Annaly Capital Management, Inc. REIT | 306,550 | 3,513,063 | ||||||
|
| |||||||
REITs-Office Property — 1.0% |
| |||||||
Mack-Cali Realty Corp. REIT | 110,830 | 2,523,599 | ||||||
|
| |||||||
Technology — 3.8% | ||||||||
Microsoft Corp. | 47,500 | 3,951,050 | ||||||
QUALCOMM, Inc. | 34,800 | 1,775,148 | ||||||
Taiwan Semiconductor Manufacturing Co., Ltd., SP ADR | 88,850 | 3,761,020 | ||||||
|
| |||||||
| 9,487,218 | ||||||||
|
| |||||||
Utilities — 3.8% | ||||||||
Exelon Corp. | 235,885 | 9,484,936 | ||||||
|
| |||||||
TOTAL COMMON STOCKS |
| 205,201,570 | ||||||
|
| |||||||
The accompanying notes are an integral part of the financial statements.
10
EIC VALUE FUND
Portfolio of Investments (Concluded)
October 31, 2017
(Unaudited)
| Number of Shares | Value | |||||||
SHORT-TERM INVESTMENT — 14.0% |
| |||||||
Money Market Fund — 14.0% |
| |||||||
Dreyfus Institutional Treasury Securities Advantage Fund, Premier Shares 0.59%(a) | 35,010,046 | $ | 35,010,046 | |||||
|
| |||||||
TOTAL SHORT-TERM INVESTMENT (Cost $35,010,046) | 35,010,046 | |||||||
|
| |||||||
TOTAL INVESTMENTS - 96.0% |
| |||||||
(Cost $187,470,042) | 240,211,616 | |||||||
OTHER ASSETS IN EXCESS OF LIABILITIES - 4.0% | 10,118,811 | |||||||
|
| |||||||
NET ASSETS - 100.0% | $ | 250,330,427 | ||||||
|
| |||||||
| * | Non-income producing. |
| (a) | Rate periodically changes. Rate disclosed is the daily yield on October 31, 2017. |
| PLC | Public Limited Company |
| REIT | Real Estate Investment Trust |
| SP ADR | Sponsored American Depository Receipt |
The accompanying notes are an integral part of the financial statements.
11
EIC VALUE FUND
Statement of Assets and Liabilities
October 31, 2017
(Unaudited)
Assets | ||||
Investments, at value (Cost $187,470,042) | $ | 240,211,616 | ||
Receivable for investments sold | 10,338,923 | |||
Receivable for capital shares sold | 215,114 | |||
Dividends receivable | 310,825 | |||
Prepaid expenses and other assets | 62,065 | |||
|
| |||
Total assets | 251,138,543 | |||
|
| |||
Liabilities | ||||
Payable for capital shares redeemed | 464,322 | |||
Payable to Adviser | 161,002 | |||
Payable for administration and accounting fees | 53,084 | |||
Payable for distribution fees | 36,821 | |||
Payable for transfer agent fees | 30,924 | |||
Payable for shareholder servicing fees | 8,513 | |||
Payable for legal fees | 5,383 | |||
Payable for custodian fees | 4,983 | |||
Accrued expenses | 43,084 | |||
|
| |||
Total liabilities | 808,116 | |||
|
| |||
Net Assets | $ | 250,330,427 | ||
|
| |||
Net Assets consisted of: | ||||
Capital stock, $0.01 par value | $ | 170,210 | ||
Paid-in capital | 182,373,719 | |||
Accumulated net investment income | 2,040,891 | |||
Accumulated net realized gain from investments | 13,004,033 | |||
Net unrealized appreciation on investments | 52,741,574 | |||
|
| |||
Net Assets | $ | 250,330,427 | ||
|
|
Class A: | ||||
Net asset value, redemption price per share | $ | 14.72 | ||
|
| |||
Maximum offering price per share (100/94.5 of $14.72) | $ | 15.58 | ||
|
| |||
Class C: | ||||
Net asset value, offering and redemption price per share | $ | 14.50 | ||
|
| |||
Institutional Class: | ||||
Net asset value, offering and redemption price per share | $ | 14.76 | ||
|
|
The accompanying notes are an integral part of the financial statements.
12
EIC VALUE FUND
Statement of Operations
For the Six Months Ended October 31, 2017
(Unaudited)
Investment income | ||||
Dividends | $ | 3,275,661 | ||
Less: foreign taxes withheld | (50,924 | ) | ||
|
| |||
Total investment income | 3,224,737 | |||
|
| |||
Expenses | ||||
Advisory fees (Note 2) | 980,289 | |||
Distribution fees (Class C) (Note 2) | 159,346 | |||
Administration and accounting fees (Note 2) | 72,868 | |||
Transfer agent fees (Note 2) | 70,642 | |||
Distribution fees (Class A) (Note 2) | 66,322 | |||
Shareholder servicing fees (Class C) (Note 2) | 53,116 | |||
Registration and filing fees | 35,554 | |||
Trustees’ and officers’ fees (Note 2) | 35,359 | |||
Printing and shareholder reporting fees | 27,648 | |||
Legal fees | 18,859 | |||
Audit fees | 14,762 | |||
Custodian fees (Note 2) | 14,210 | |||
Other expenses | 15,469 | |||
|
| |||
Total expenses | 1,564,444 | |||
|
| |||
Net investment income | 1,660,293 | |||
|
| |||
Net realized and unrealized gain from investments: | ||||
Net realized gain from investments | 13,121,225 | |||
Net change in unrealized appreciation on investments | 321,845 | |||
|
| |||
Net realized and unrealized gain on investments | 13,443,070 | |||
|
| |||
Net increase in net assets resulting from operations | $ | 15,103,363 | ||
|
|
The accompanying notes are an integral part of the financial statements.
13
EIC VALUE FUND
Statements of Changes in Net Assets
| For the Six Months Ended October 31, 2017 (Unaudited) | For the Year Ended April 30, 2017 | |||||||||
Increase in net assets from operations: | ||||||||||
Net investment income | $ | 1,660,293 | $ | 3,099,730 | ||||||
Net realized gain from investments | 13,121,225 | 10,832,252 | ||||||||
Net change in unrealized appreciation on investments | 321,845 | 18,832,954 | ||||||||
|
|
|
| |||||||
Net increase in net assets resulting from operations | 15,103,363 | 32,764,936 | ||||||||
|
|
|
| |||||||
Less dividends and distributions to shareholders from: | ||||||||||
Net investment income: | ||||||||||
Class A | (39,872 | ) | (441,269 | ) | ||||||
Class C | — | (7,146 | ) | |||||||
Institutional Class | (322,275 | ) | (2,061,543 | ) | ||||||
|
|
|
| |||||||
Total net investment income | (362,147 | ) | (2,509,958 | ) | ||||||
|
|
|
| |||||||
Net realized capital gains: | ||||||||||
Class A | (1,256,812 | ) | (561,066 | ) | ||||||
Class C | (1,059,675 | ) | (479,439 | ) | ||||||
Institutional Class | (4,009,209 | ) | (1,934,616 | ) | ||||||
|
|
|
| |||||||
Total net realized capital gains | (6,325,696 | ) | (2,975,121 | ) | ||||||
|
|
|
| |||||||
Net decrease in net assets from dividends and distributions to shareholders | (6,687,843 | ) | (5,485,079 | ) | ||||||
|
|
|
| |||||||
Decrease in net assets derived from capital share transactions (Note 4) | (27,106,086 | ) | (72,071,384 | ) | ||||||
|
|
|
| |||||||
Total decrease in net assets | (18,690,566 | ) | (44,791,527 | ) | ||||||
|
|
|
| |||||||
Net assets | ||||||||||
Beginning of period | 269,020,993 | 313,812,520 | ||||||||
|
|
|
| |||||||
End of period | $ | 250,330,427 | $ | 269,020,993 | ||||||
|
|
|
| |||||||
Accumulated net investment income, end of period | $ | 2,040,891 | $ | 742,745 | ||||||
|
|
|
| |||||||
The accompanying notes are an integral part of the financial statements.
14
EIC VALUE FUND
Financial Highlights
Contained below is per share operating performance data for Class A shares outstanding, total investment return, ratios to average net assets and other supplemental data for the respective period. The total returns in the table represent the rate that an investor would have earned or lost on an investment in the Fund (assuming reinvestment of all dividends and distributions). This information has been derived from information provided in the financial statements and should be read in conjunction with the financial statements and the notes thereto.
| Class A | ||||||||||||||||||||||||||||||
| For the Six Months Ended October 31, 2017 (Unaudited) | For the Year Ended April 30, 2017 | For the Year Ended April 30, 2016 | For the Year Ended April 30, 2015 | For the Year Ended April 30, 2014 | For the Year Ended April 30, 2013 | |||||||||||||||||||||||||
Per Share Operating Performance | ||||||||||||||||||||||||||||||
Net asset value, beginning of period | $ | 14.22 | $ | 13.02 | $ | 13.91 | $ | 13.37 | $ | 11.91 | $ | 10.65 | ||||||||||||||||||
|
|
|
|
|
|
|
|
|
|
|
| |||||||||||||||||||
Net investment income(1) | 0.09 | 0.13 | 0.11 | 0.12 | 0.12 | 0.12 | ||||||||||||||||||||||||
Net realized and unrealized gain/(loss) on investments | 0.76 | 1.32 | (0.60 | ) | 0.98 | 1.70 | 1.22 | |||||||||||||||||||||||
|
|
|
|
|
|
|
|
|
|
|
| |||||||||||||||||||
Net increase/(decrease) in net assets resulting from operations | 0.85 | 1.45 | (0.49 | ) | 1.10 | 1.82 | 1.34 | |||||||||||||||||||||||
|
|
|
|
|
|
|
|
|
|
|
| |||||||||||||||||||
Dividends and distributions to shareholders from: | ||||||||||||||||||||||||||||||
Net investment income | (0.01 | ) | (0.11 | ) | (0.14 | ) | (0.10 | ) | (0.11 | ) | (0.08 | ) | ||||||||||||||||||
Net realized capital gains | (0.34 | ) | (0.14 | ) | (0.26 | ) | (0.46 | ) | (0.25 | ) | — | (2) | ||||||||||||||||||
|
|
|
|
|
|
|
|
|
|
|
| |||||||||||||||||||
Total dividends and distributions to shareholders | (0.35 | ) | (0.25 | ) | (0.40 | ) | (0.56 | ) | (0.36 | ) | (0.08 | ) | ||||||||||||||||||
|
|
|
|
|
|
|
|
|
|
|
| |||||||||||||||||||
Redemption fees | — | (2) | — | — | (2) | — | (2) | — | (2) | — | (2) | |||||||||||||||||||
|
|
|
|
|
|
|
|
|
|
|
| |||||||||||||||||||
Net asset value, end of period | $ | 14.72 | $ | 14.22 | $ | 13.02 | $ | 13.91 | $ | 13.37 | $ | 11.91 | ||||||||||||||||||
|
|
|
|
|
|
|
|
|
|
|
| |||||||||||||||||||
Total investment return(3) | 6.08 | % | 11.13 | % | (3.44 | )% | 8.22 | % | 15.46 | % | 12.73 | % | ||||||||||||||||||
Ratios/Supplemental Data | ||||||||||||||||||||||||||||||
Net assets, end of year (in thousands) | $ | 52,598 | $ | 52,845 | $ | 65,882 | $ | 85,653 | $ | 130,805 | $ | 83,932 | ||||||||||||||||||
Ratio of expenses to average net assets | 1.23 | %(4) | 1.20 | % | 1.25 | % | 1.25 | % | 1.25 | % | 1.25 | % | ||||||||||||||||||
Ratio of expenses to average net assets without waivers, expense reimbursements and recoupments, if any(5) | 1.23 | %(4) | 1.20 | % | 1.21 | % | 1.18 | % | 1.24 | % | 1.35 | % | ||||||||||||||||||
Ratio of net investment income to average net assets | 1.23 | %(4) | 0.98 | % | 0.85 | % | 0.90 | % | 0.95 | % | 1.12 | % | ||||||||||||||||||
Portfolio turnover rate | 13.15 | %(6) | 28.92 | % | 34.03 | % | 26.89 | % | 19.08 | % | 12.06 | % | ||||||||||||||||||
| (1) | The selected per share data was calculated using the average shares outstanding method for the period. |
| (2) | Amount is less than $0.005 per share. |
| (3) | Total investment return is calculated assuming a purchase of shares on the first day and a sale of shares on the last day of each period reported and includes reinvestment of dividends and distributions, if any. Total return for periods less than one year are not annualized. Total investment return does not reflect the impact of the maximum front-end sales load of 5.50%. If reflected, the return would be lower. |
| (4) | Annualized. |
| (5) | During the period, certain fees were waived, reimbursed and/or recouped. If such fee waivers, reimbursements and/or recoupments had not occurred, the ratios would have been as indicated (See Note 2). |
| (6) | Not annualized. |
The accompanying notes are an integral part of the financial statements.
15
EIC VALUE FUND
Financial Highlights
��
Contained below is per share operating performance data for Class C shares outstanding, total investment return, ratios to average net assets and other supplemental data for the respective period. The total returns in the table represent the rate that an investor would have earned or lost on an investment in the Fund (assuming reinvestment of all dividends and distributions). This information has been derived from information provided in the financial statements and should be read in conjunction with the financial statements and the notes thereto.
| Class C | ||||||||||||||||||||||||||||||
| For the Six Months Ended October 31, 2017 (Unaudited) | For the Year Ended April 30, 2017 | For the Year Ended April 30, 2016 | For the Year Ended April 30, 2015 | For the Year Ended April 30, 2014 | For the Year Ended April 30, 2013 | |||||||||||||||||||||||||
Per Share Operating Performance | ||||||||||||||||||||||||||||||
Net asset value, beginning of period | $ | 14.06 | $ | 12.87 | $ | 13.75 | $ | 13.24 | $ | 11.84 | $ | 10.61 | ||||||||||||||||||
|
|
|
|
|
|
|
|
|
|
|
| |||||||||||||||||||
Net investment income(1) | 0.03 | 0.03 | 0.01 | 0.02 | 0.03 | 0.04 | ||||||||||||||||||||||||
Net realized and unrealized gain/(loss) on investments | 0.75 | 1.30 | (0.60 | ) | 0.97 | 1.67 | 1.22 | |||||||||||||||||||||||
|
|
|
|
|
|
|
|
|
|
|
| |||||||||||||||||||
Net increase/(decrease) in net assets resulting from operations | 0.78 | 1.33 | (0.59 | ) | 0.99 | 1.70 | 1.26 | |||||||||||||||||||||||
|
|
|
|
|
|
|
|
|
|
|
| |||||||||||||||||||
Dividends and distributions to shareholders from: | ||||||||||||||||||||||||||||||
Net investment income | — | — | (2) | (0.03 | ) | (0.02 | ) | (0.05 | ) | (0.03 | ) | |||||||||||||||||||
Net realized capital gains | (0.34 | ) | (0.14 | ) | (0.26 | ) | (0.46 | ) | (0.25 | ) | — | (2) | ||||||||||||||||||
|
|
|
|
|
|
|
|
|
|
|
| |||||||||||||||||||
Total dividends and distributions to shareholders | (0.34 | ) | (0.14 | ) | (0.29 | ) | (0.48 | ) | (0.30 | ) | (0.03 | ) | ||||||||||||||||||
|
|
|
|
|
|
|
|
|
|
|
| |||||||||||||||||||
Redemption fees | — | (2) | — | — | (2) | — | (2) | — | (2) | — | (2) | |||||||||||||||||||
|
|
|
|
|
|
|
|
|
|
|
| |||||||||||||||||||
Net asset value, end of period | $ | 14.50 | $ | 14.06 | $ | 12.87 | $ | 13.75 | $ | 13.24 | $ | 11.84 | ||||||||||||||||||
|
|
|
|
|
|
|
|
|
|
|
| |||||||||||||||||||
Total investment return(3) | 5.64 | % | 10.35 | % | (4.17 | )% | 7.49 | % | 14.52 | % | 11.93 | % | ||||||||||||||||||
Ratios/Supplemental Data | ||||||||||||||||||||||||||||||
Net assets, end of year (in thousands) | $ | 39,729 | $ | 45,071 | $ | 51,146 | $ | 62,378 | $ | 48,016 | $ | 31,129 | ||||||||||||||||||
Ratio of expenses to average net assets | 1.98 | %(4) | 1.95 | % | 2.00 | % | 2.00 | % | 2.00 | % | 2.00 | % | ||||||||||||||||||
Ratio of expenses to average net assets without waivers, expense reimbursements and recoupments, if any(5) | 1.98 | %(4) | 1.95 | % | 1.96 | % | 1.93 | % | 1.99 | % | 2.10 | % | ||||||||||||||||||
Ratio of net investment income to average net assets | 0.48 | %(4) | 0.23 | % | 0.10 | % | 0.15 | % | 0.21 | % | 0.38 | % | ||||||||||||||||||
Portfolio turnover rate | 13.15 | %(6) | 28.92 | % | 34.03 | % | 26.89 | % | 19.08 | % | 12.06 | % | ||||||||||||||||||
| (1) | The selected per share data was calculated using the average shares outstanding method for the period. |
| (2) | Amount is less than $0.005 per share. |
| (3) | Total investment return is calculated assuming a purchase of shares on the first day and a sale of shares on the last day of each period reported and includes reinvestment of dividends and distributions, if any. Total return for periods less than one year are not annualized. Total investment return does not reflect any applicable sales charge. |
| (4) | Annualized. |
| (5) | During the period, certain fees were waived, reimbursed and/or recouped. If such fee waivers, reimbursements and/or recoupments had not occurred, the ratios would have been as indicated (See Note 2). |
| (6) | Not annualized. |
The accompanying notes are an integral part of the financial statements.
16
EIC VALUE FUND
Financial Highlights
Contained below is per share operating performance data for Institutional Class shares outstanding, total investment return, ratios to average net assets and other supplemental data for the respective period. The total returns in the table represent the rate that an investor would have earned or lost on an investment in the Fund (assuming reinvestment of all dividends and distributions). This information has been derived from information provided in the financial statements and should be read in conjunction with the financial statements and the notes thereto.
| Institutional Class | ||||||||||||||||||||||||||||||
| For the Six Months Ended October 31, 2017 (Unaudited) | For the Year Ended April 30, 2017 | For the Year Ended April 30, 2016 | For the Year Ended April 30, 2015 | For the Year Ended April 30, 2014 | For the Year Ended April 30, 2013 | |||||||||||||||||||||||||
Per Share Operating Performance | ||||||||||||||||||||||||||||||
Net asset value, beginning of period | $ | 14.26 | $ | 13.06 | $ | 13.95 | $ | 13.41 | $ | 11.94 | $ | 10.67 | ||||||||||||||||||
|
|
|
|
|
|
|
|
|
|
|
| |||||||||||||||||||
Net investment income(1) | 0.11 | 0.17 | 0.14 | 0.16 | 0.15 | 0.15 | ||||||||||||||||||||||||
Net realized and unrealized gain/(loss) on investments | 0.76 | 1.32 | (0.60 | ) | 0.98 | 1.70 | 1.22 | |||||||||||||||||||||||
|
|
|
|
|
|
|
|
|
|
|
| |||||||||||||||||||
Net increase/(decrease) in net assets resulting from operations | 0.87 | 1.49 | (0.46 | ) | 1.14 | 1.85 | 1.37 | |||||||||||||||||||||||
|
|
|
|
|
|
|
|
|
|
|
| |||||||||||||||||||
Dividends and distributions to shareholders from: | ||||||||||||||||||||||||||||||
Net investment income | (0.03 | ) | (0.15 | ) | (0.17 | ) | (0.14 | ) | (0.13 | ) | (0.10 | ) | ||||||||||||||||||
Net realized capital gains | (0.34 | ) | (0.14 | ) | (0.26 | ) | (0.46 | ) | (0.25 | ) | — | (2) | ||||||||||||||||||
|
|
|
|
|
|
|
|
|
|
|
| |||||||||||||||||||
Total dividends and distributions to shareholders | (0.37 | ) | (0.29 | ) | (0.43 | ) | (0.60 | ) | (0.38 | ) | (0.10 | ) | ||||||||||||||||||
|
|
|
|
|
|
|
|
|
|
|
| |||||||||||||||||||
Redemption fees | — | (2) | — | — | (2) | — | (2) | — | (2) | — | (2) | |||||||||||||||||||
|
|
|
|
|
|
|
|
|
|
|
| |||||||||||||||||||
Net asset value, end of period | $ | 14.76 | $ | 14.26 | $ | 13.06 | $ | 13.95 | $ | 13.41 | $ | 11.94 | ||||||||||||||||||
|
|
|
|
|
|
|
|
|
|
|
| |||||||||||||||||||
Total investment return(3) | 6.19 | % | 11.40 | % | (3.15 | )% | 8.54 | % | 15.68 | % | 12.99 | % | ||||||||||||||||||
Ratios/Supplemental Data | ||||||||||||||||||||||||||||||
Net assets, end of year (in thousands) | $ | 158,004 | $ | 171,105 | $ | 196,785 | $ | 189,860 | $ | 75,860 | $ | 53,367 | ||||||||||||||||||
Ratio of expenses to average net assets | 0.98 | %(4) | 0.96 | % | 1.00 | % | 1.00 | % | 1.00 | % | 1.00 | % | ||||||||||||||||||
Ratio of expenses to average net assets without waivers, expense reimbursements and recoupments, if any(5) | 0.98 | %(4) | 0.96 | % | 0.96 | % | 0.93 | % | 0.99 | % | 1.10 | % | ||||||||||||||||||
Ratio of net investment income to average net assets | 1.48 | %(4) | 1.23 | % | 1.10 | % | 1.14 | % | 1.21 | % | 1.37 | % | ||||||||||||||||||
Portfolio turnover rate | 13.15 | %(6) | 28.92 | % | 34.03 | % | 26.89 | % | 19.08 | % | 12.06 | % | ||||||||||||||||||
| (1) | The selected per share data was calculated using the average shares outstanding method for the period. |
| (2) | Amount is less than $0.005 per share. |
| (3) | Total investment return is calculated assuming a purchase of shares on the first day and a sale of shares on the last day of each period reported and includes reinvestment of dividends and distributions, if any. Total return for periods less than one year are not annualized. |
| (4) | Annualized. |
| (5) | During the period, certain fees were waived, reimbursed and/or recouped. If such fee waivers, reimbursements and/or recoupments had not occurred, the ratios would have been as indicated (See Note 2). |
| (6) | Not annualized. |
The accompanying notes are an integral part of the financial statements.
17
EIC VALUE FUND
Notes to Financial Statements
October 31, 2017
(Unaudited)
1. Organization and Significant Accounting Policies
The EIC Value Fund (the “Fund”) is a diversified, open-end management investment company registered under the Investment Company Act of 1940, as amended (the “1940 Act”), which commenced operations on May 1, 2011. The Fund is a separate series of FundVantage Trust (the “Trust”) which was organized as a Delaware statutory trust on August 28, 2006. The Trust is a “series trust” authorized to issue an unlimited number of separate series or classes of shares of beneficial interest. Each series is treated as a separate entity for certain matters under the 1940 Act, and for other purposes, and a shareholder of one series is not deemed to be a shareholder of any other series. The Fund offers separate classes of shares, Class A, Class C, Institutional Class and Retail Class shares. Class A shares are sold subject to a front-end sales charge. Front-end sales charges may be reduced or waived under certain circumstances. A contingent deferred sales charge (“CDSC”) may be applicable to the redemption of Class A shares. A CDSC, as a percentage of the lower of the original purchase price or net asset value at redemption, of up to 1.00% may be imposed on full or partial redemptions of Class A shares made within eighteen months of purchase where: (i) $1 million or more of Class A shares were purchased without an initial sales charge, and (ii) the Fund’s principal underwriter, Foreside Funds Distributors LLC (the “Underwriter”), paid a commission to the selling broker-dealer for such sale. A CDSC of up to 1.00% is assessed on redemptions of Class C Shares made within eighteen months after a purchase where the broker-dealer was paid a commission for such sale. As of October 31, 2017, the Retail Class Shares have not been issued.
The Fund is an investment company and follows accounting and reporting guidance in the Financial Accounting Standards Board Accounting Standards Codification Topic 946.
Portfolio Valuation — The Fund’s net asset value (“NAV”) is calculated once daily at the close of regular trading hours on the New York Stock Exchange (“NYSE”) (typically 4:00 p.m. Eastern time) on each day the NYSE is open. Securities held by the Fund are valued using the closing price or the last sale price on a national securities exchange or the National Association of Securities Dealers Automatic Quotation System (“NASDAQ”) market system where they are primarily traded. Equity securities traded in the over-the-counter market are valued at their closing prices. If there were no transactions on that day, securities traded principally on an exchange or on NASDAQ will be valued at the mean of the last bid and ask prices prior to the market close. Investments in other open-end investment companies are valued based on the NAV of the investment companies (which may use fair value pricing as discussed in their prospectuses). If market quotations are unavailable or deemed unreliable, securities will be valued in accordance with procedures adopted by the Trust’s Board of Trustees (“Board of Trustees”). Relying on prices supplied by pricing services or dealers or using fair valuation may result in values that are higher or lower than the values used by other investment companies and investors to price the same investments. In the event that market quotes are not readily available, and the security or asset cannot be valued pursuant to one of the valuation methods, the value of the security or asset will be determined in good faith by the Adviser. The Trust has established a Valuation Committee which performs certain functions including the oversight of the Adviser’s fair valuation determinations.
18
EIC VALUE FUND
Notes to Financial Statements (Continued)
October 31, 2017
(Unaudited)
Fair Value Measurements — The inputs and valuation techniques used to measure fair value of the Fund’s investments are summarized into three levels as described in the hierarchy below:
| • | Level 1 — quoted prices in active markets for identical securities; |
| • | Level 2 — other significant observable inputs (including quoted prices for similar securities, interest rates, prepayment speeds, credit risk, etc.); and |
| • | Level 3 — significant unobservable inputs (including the Fund’s own assumptions in determining the fair value of investments). |
The inputs or methodology used for valuing securities are not necessarily an indication of the risk associated with investing in those securities.
The following is a summary of the inputs used, as of October 31, 2017, in valuing the Fund’s investments carried at fair value:
| Total Value at 10/31/17 | Level 1 Quoted Prices | Level 2 Other Significant Observable Inputs | Level 3 Significant Unobservable Inputs | |||||||||||||
Common Stocks* | $ | 205,201,570 | $ | 205,201,570 | $ | — | $ | — | ||||||||
Short-Term Investment | 35,010,046 | 35,010,046 | — | — | ||||||||||||
|
|
|
|
|
|
|
| |||||||||
Total Investments | $ | 240,211,616 | $ | 240,211,616 | $ | — | $ | — | ||||||||
|
|
|
|
|
|
|
| |||||||||
| * | Please refer to Portfolio of Investments for further details on portfolio holdings. |
At the end of each quarter, management evaluates the classification of Levels 1, 2 and 3 assets and liabilities. Various factors are considered, such as changes in liquidity from the prior reporting period; whether or not a broker is willing to execute at the quoted price; the depth and consistency of prices from third party pricing services; and the existence of contemporaneous, observable trades in the market. Additionally, management evaluates the classification of Level 1 and Level 2 assets and liabilities on a quarterly basis for changes in listings or delistings on national exchanges.
Due to the inherent uncertainty of determining the fair value of investments that do not have a readily available market value, the fair value of the Fund’s investments may fluctuate from period to period. Additionally, the fair value of investments may differ significantly from the values that would have been used had a ready market existed for such investments and may differ materially from the values the Fund may ultimately realize. Further, such investments may be subject to legal and other restrictions on resale or are otherwise less liquid than publicly traded securities.
19
EIC VALUE FUND
Notes to Financial Statements (Continued)
October 31, 2017
(Unaudited)
For fair valuations using significant unobservable inputs, U.S. generally accepted accounting principles (“U.S. GAAP”) require the Fund to present a reconciliation of the beginning to ending balances for reported market values that presents changes attributable to total realized and unrealized gains or losses, purchase and sales, and transfers in and out of Level 3 during the period. Transfers in and out between Levels are based on values at the end of the period. U.S. GAAP also requires the Fund to disclose amounts and reasons for all transfers in and out of Level 1 and Level 2 fair value measurements. A reconciliation of Level 3 investments is presented only when the Fund had an amount of Level 3 investments at the end of the reporting period that was meaningful in relation to its net assets. The amounts and reasons for all transfers in and out of each Level within the three-tier hierarchy are disclosed when the Fund had an amount of total transfers during the reporting period that was meaningful in relation to its net assets as of the end of the reporting period.
For the period ended October 31, 2017, there were no transfers between Levels 1, 2 and 3 for the Fund.
Use of Estimates — The preparation of financial statements in conformity with U.S. GAAP requires management to make estimates and assumptions that affect the amounts reported in the financial statements and accompanying notes at the date of the financial statements and the reported amounts of revenues and expenses during the period. Actual results could differ from those estimates and those differences could be material.
Investment Transactions, Investment Income and Expenses — Investment transactions are recorded on trade date for financial statement preparation purposes. Realized gains and losses on investments sold are recorded on the identified cost basis. Interest income is recorded on the accrual basis. Dividends are recorded on the ex-dividend date. Estimated components of distributions received from real estate investment trusts may be considered income, return of capital distributions or capital gain distributions. Return of capital distributions are recorded as a reduction of cost of the related investments. Distribution (12b-1) fees and shareholder services fees relating to a specific class are charged directly to that class. General expenses of the Trust are generally allocated to each fund in proportion to its relative daily net assets. Expenses directly attributable to a particular fund in the Trust are charged directly to that fund. The Fund’s investment income, expenses (other than class-specific expenses) and unrealized and realized gains and losses are allocated daily to each class of shares based upon the relative proportion of net assets of each class at the beginning of the day.
Dividends and Distributions to Shareholders — Dividends from net investment income and distributions from net realized capital gains, if any, are declared, recorded on ex-date and paid at least annually to shareholders. Income dividends and capital gain distributions are determined in accordance with U.S.
20
EIC VALUE FUND
Notes to Financial Statements (Continued)
October 31, 2017
(Unaudited)
federal income tax regulations, which may differ from U.S. GAAP. These differences may include the treatment of non-taxable dividends, expiring capital loss carryforwards and losses deferred due to wash sales and excise tax regulations. Permanent book and tax basis differences relating to shareholder distributions will result in reclassifications within the components of net assets.
U.S. Tax Status — No provision is made for U.S. income taxes as it is the Fund’s intention to continue to qualify for and elect the tax treatment applicable to regulated investment companies under Subchapter M of the Internal Revenue Code of 1986, as amended (the “Internal Revenue Code”), and make the requisite distributions to its shareholders which will be sufficient to relieve it from U.S. income and excise taxes.
Other — In the normal course of business, the Fund may enter into contracts that provide general indemnifications. The Fund’s maximum exposure under these arrangements is dependent on claims that may be made against the Fund in the future, and therefore, cannot be estimated; however, based on experience, the risk of material loss for such claims is considered remote.
Recent Accounting Pronouncement — On August 1, 2017, the Fund implemented changes to amendments to Regulation S-X, issued by the Securities and Exchange Commission, which require standardized, enhanced disclosures, particularly related to derivatives, in investment company financial statements. Adoption of the amendments had no effect on the Fund’s net assets or results of operations.
2. Transactions with Related Parties and Other Service Providers
Equity Investment Corporation (“EIC” or the “Adviser”) serves as investment adviser to the Fund pursuant to an investment advisory agreement with the Trust (the “Advisory Agreement”). For its services, the Adviser is paid a monthly fee at the annual rate of 0.75% of the Fund’s average daily net assets under $500 million; 0.65% of the Fund’s average daily net assets of $500 million or more but less than $1 billion; and 0.50% of the Fund’s average daily net assets of $1 billion and over. The Adviser has contractually agreed to waive or otherwise reduce its annual compensation received from the Fund to the extent necessary to ensure that the Fund’s total operating expenses, excluding taxes, any class-specific fees and expenses (such as Rule 12b-1 distribution fees, shareholder service fees or transfer agency fees), “Acquired Fund Fees and Expenses,” interest, extraordinary items and brokerage commissions, do not exceed 1.00% of average daily net assets of the Fund (the “Expense Limitation”). The Expense Limitation will remain in place until August 31, 2018, unless the Board of Trustees approves its earlier termination. Subject to approval by the Board of Trustees, the Adviser may recoup any expenses or fees it has reimbursed within a three-year period from the date on which the Adviser reduced its compensation and/or assumed expenses of the Fund. The Adviser is permitted to seek reimbursement from the Fund, subject to certain limitations, for fees it waived and Fund expenses it paid to the extent the total annual Fund expenses do not exceed the limits described above or any lesser limits in effect at the time of
21
EIC VALUE FUND
Notes to Financial Statements (Continued)
October 31, 2017
(Unaudited)
reimbursement. No recoupment will occur unless the Fund’s expenses are below the Expense Limitation amount. As of October 31, 2017, there were no reimbursed expenses or fees waived subject to recoupment.
For the period ended October 31, 2017, the Adviser earned advisory fees of $980,289.
Other Service Providers
BNY Mellon Investment Servicing (US) Inc. (“BNY Mellon”) serves as administrator and transfer agent for the Fund. For providing administrative and accounting services, BNY Mellon is entitled to receive a monthly fee equal to an annual percentage rate of the Fund’s average daily net assets, subject to certain minimum monthly fees. For providing transfer agent services, BNY Mellon is entitled to receive a monthly fee, subject to certain minimum, and out of pocket expenses.
The Bank of New York Mellon (the “Custodian”) provides certain custodial services to the Fund. The Custodian is entitled to receive a monthly fee, subject to certain minimum, and out of pocket expenses.
Foreside Funds Distributors LLC (the “Underwriter”) provides principal underwriting services to the Fund.
The Trust and the Underwriter are parties to an underwriting agreement. The Trust has adopted a distribution plan for Class A and Class C shares in accordance with Rule 12b-1 under the 1940 Act. Pursuant to the Class A and Class C shares plan, the Fund compensates the Underwriter for direct and indirect costs and expenses incurred in connection with advertising, marketing and other distribution services in an amount not to exceed 0.25% and 1.00% (0.75% Rule 12b-1 distribution fee and 0.25% shareholder service fee) on an annualized basis of the average daily net assets of the Fund’s Class A and Class C shares, respectively.
Trustees and Officers
The Trust is governed by its Board of Trustees. The Trustees receive compensation in the form of an annual retainer and per meeting fees for their services to the Trust. The remuneration paid to the Trustees by the Fund during the six months ended October 31, 2017 was $9,890. An employee of BNY Mellon serves as the Secretary of the Trust and is not compensated by the Fund or the Trust.
JW Fund Management LLC (“JWFM”) provides a Principal Executive Officer and Principal Financial Officer, respectively, to the Trust. JWFM is compensated for the services provided to the Trust.
22
EIC VALUE FUND
Notes to Financial Statements (Continued)
October 31, 2017
(Unaudited)
Freeh Group International Solutions, LLC provides the Trust with a Chief Compliance Officer and an Anti-Money Laundering Officer.
3. Investment in Securities
For the period ended October 31, 2017, aggregate purchases and sales of investment securities (excluding short-term investments) of the Fund were as follows:
| Purchases | Sales | |||||||
Investment Securities | $ | 28,473,390 | $ | 65,206,955 | ||||
4. Capital Share Transactions
For the six months ended October 31, 2017 and the year ended April 30, 2017, transactions in capital shares (authorized shares unlimited) were as follows:
| For the Six Months Ended October 31, 2017 | For the Year Ended April 30, 2017 | |||||||||||||||
| Shares | Amount | Shares | Amount | |||||||||||||
Class A | ||||||||||||||||
Sales | 165,804 | $ | 2,369,586 | 304,802 | $ | 4,156,508 | ||||||||||
Reinvestments | 80,327 | 1,138,231 | 61,211 | 855,113 | ||||||||||||
Redemption Fees* | — | 395 | — | — | ||||||||||||
Redemptions | (387,695 | ) | (5,554,659 | ) | (1,709,753 | ) | (23,347,918 | ) | ||||||||
|
|
|
|
|
|
|
| |||||||||
Net decrease | (141,564 | ) | $ | (2,046,447 | ) | (1,343,740 | ) | $ | (18,336,297 | ) | ||||||
|
|
|
|
|
|
|
| |||||||||
Class C | ||||||||||||||||
Sales | 39,598 | $ | 557,305 | 208,761 | $ | 2,789,000 | ||||||||||
Reinvestments | 69,828 | 977,596 | 32,695 | 452,503 | ||||||||||||
Redemption Fees* | — | 329 | — | — | ||||||||||||
Redemptions | (575,273 | ) | (8,104,463 | ) | (1,008,675 | ) | (13,659,998 | ) | ||||||||
|
|
|
|
|
|
|
| |||||||||
Net decrease | (465,847 | ) | $ | (6,569,233 | ) | (767,219 | ) | $ | (10,418,495 | ) | ||||||
|
|
|
|
|
|
|
| |||||||||
Institutional Class | ||||||||||||||||
Sales | 591,492 | $ | 8,478,410 | 3,889,085 | $ | 52,740,110 | ||||||||||
Reinvestments | 290,443 | 4,121,151 | 270,584 | 3,785,470 | ||||||||||||
Redemption Fees* | — | 1,264 | — | — | ||||||||||||
Redemptions | (2,174,352 | ) | (31,091,231 | ) | (7,230,654 | ) | (99,842,172 | ) | ||||||||
|
|
|
|
|
|
|
| |||||||||
Net increase/(decrease) | (1,292,417 | ) | $ | (18,490,406 | ) | (3,070,985 | ) | $ | (43,316,592 | ) | ||||||
|
|
|
|
|
|
|
| |||||||||
Total net decrease | (1,899,828 | ) | $ | (27,106,086 | ) | (5,181,944 | ) | $ | (72,071,384 | ) | ||||||
|
|
|
|
|
|
|
| |||||||||
23
EIC VALUE FUND
Notes to Financial Statements (Continued)
October 31, 2017
(Unaudited)
| * | There is a 2.00% redemption fee that may be charged on shares redeemed which have been held for 30 days or less. The redemption fees are retained by the Fund for the benefit of the remaining shareholders and recorded as paid-in-capital. |
5. Federal Tax Information
The Fund has followed the authoritative guidance on accounting for and disclosure of uncertainty in tax positions, which requires the Fund to determine whether a tax position is more likely than not to be sustained upon examination, including resolution of any related appeals or litigation processes, based on the technical merits of the position. The Fund has determined that there was no effect on the financial statements from following this authoritative guidance. In the normal course of business, the Fund is subject to examination by federal, state and local jurisdictions, where applicable, for tax years for which applicable statutes of limitations have not expired.
For the year ended April 30, 2017, the tax character of distributions paid by the Fund was $2,509,958 of ordinary income dividends and $2,975,121 of long-term capital gains dividends. Distributions from net investment income and short term gains are treated as ordinary income for federal income tax purposes.
As of April 30, 2017, the components of distributable earnings on a tax basis were as follows:
Capital Loss Carryforward | Undistributed Ordinary Income | Undistributed Long-Term Gain | Unrealized Appreciation | Qualified Late-Year Losses | ||||
$— | $742,745 | $6,208,504 | $52,419,729 | $— |
As of October 31, 2017, the federal tax cost, aggregate gross unrealized appreciation and depreciation of securities held by the Fund were as follows:
Federal tax cost* | $ | 187,470,042 | ||||
|
| |||||
Gross unrealized appreciation | $ | 56,035,172 | ||||
Gross unrealized depreciation | (3,293,598 | ) | ||||
|
| |||||
Net unrealized appreciation | $ | 52,741,574 | ||||
|
| |||||
| * | Because tax adjustments are calculated annually at the end of the Fund’s fiscal year, the above table does not reflect tax adjustments for the current fiscal year. For the previous year’s federal income tax information, please refer to the Notes to Financial Statements section in the Fund’s most recent annual report. |
Pursuant to federal income tax rules applicable to regulated investment companies, the Fund may elect to treat certain capital losses between November 1 and April 30 and late year ordinary losses ((i) ordinary losses between January 1 and April 30, and (ii) specified ordinary and currency losses between November 1 and April 30) as occurring on the first day of the following tax year. For the year ended April 30, 2017, any amount of losses elected within the tax return will not be recognized for federal income tax purposes until May 1, 2017. For the year ended April 30, 2017, the Fund had no loss deferrals.
24
EIC VALUE FUND
Notes to Financial Statements (Concluded)
October 31, 2017
(Unaudited)
Accumulated capital losses represent net capital loss carry forwards as of April 30, 2017 that may be available to offset future realized capital gains and thereby reduce future capital gains distributions. As of April 30, 2017, the Fund did not have any capital loss carryforwards.
6. Subsequent Events
Management has evaluated the impact of all subsequent events on the Fund through the date the financial statements were issued, and has determined that there were no subsequent events requiring recognition or disclosure in the financial statements.
25
EIC VALUE FUND
Other Information
(Unaudited)
Proxy Voting
Policies and procedures that the Fund uses to determine how to vote proxies relating to portfolio securities as well as information regarding how the Fund voted proxies relating to portfolio securities for the most recent 12-month period ended June 30 are available without charge, upon request, by calling (855) 430-6487 and on the Securities and Exchange Commission’s (“SEC”) website at http;//www.sec.gov.
Quarterly Portfolio Schedules
The Trust files its complete schedule of portfolio holdings with the SEC for the first and third fiscal quarters of each fiscal year (quarters ended July 31 and January 31) on Form N-Q. The Trust’s Forms N-Q are available on the SEC’s website at http://www.sec.gov and may be reviewed and copied at the SEC’s Public Reference Room in Washington, D.C. Information on the operation of the SEC’s Public Reference Room may be obtained by calling 1-800-SEC-0330.
26
[THIS PAGE INTENTIONALLY LEFT BLANK.]
Investment Adviser
Equity Investment Corporation
1776 Peachtree Street, NW
Suite 600S
Atlanta, GA 30309
Administrator
BNY Mellon Investment Servicing (US) Inc.
301 Bellevue Parkway
Wilmington, DE 19809
Transfer Agent
BNY Mellon Investment Servicing (US) Inc.
4400 Computer Drive
Westborough, MA 01581
Principal Underwriter
Foreside Funds Distributors LLC
400 Berwyn Park
899 Cassatt Road
Berwyn, PA 19312
Custodian
The Bank of New York Mellon
225 Liberty Street
New York, NY 10286
Independent Registered Public Accounting Firm
Ernst & Young LLP
One Commerce Square
2005 Market Street, Suite 700
Philadelphia, PA 19103-7096
Legal Counsel
Pepper Hamilton LLP
3000 Two Logan Square
18th and Arch Streets
Philadelphia, PA 19103
EIC-1017

of
FundVantage Trust
Class A
Class C
Institutional Class
SEMI-ANNUAL
REPORT
October 31, 2017
(Unaudited)
This report is submitted for the general information of the shareholders of the EIC Value Fund. It is not authorized for distribution unless preceded or accompanied by a current prospectus for the EIC Value Fund.
ESTABROOK INVESTMENT GRADE FIXED INCOME FUND
Semi-Annual Report
Performance Data
October 31, 2017
(Unaudited)
| Average Annual Total Returns for the Periods Ended October 31, 2017 | ||||||||||||
| Six Months† | 1 Year | 3 Years | 5 Years | Since Inception* | ||||||||
Class I | 1.37% | 1.68% | 2.17% | 2.15% | 3.11% | |||||||
Barclays Intermediate Government/Credit Bond Index | 0.91% | 0.64% | 1.89% | 1.58% | 2.46%** | |||||||
Barclays U.S. Aggregate Bond Index | 1.58% | 0.90% | 2.40% | 2.04% | 3.10%** | |||||||
| † | Not Annualized. |
| * | The Estabrook Investment Grade Fixed Income Fund (the “Fund”) commenced operations on July 23, 2010. |
| ** | Benchmark performance is from the inception date of the Fund only and is not the inception date of the benchmark itself. |
The performance data quoted represents past performance and does not guarantee future results. Current performance may be lower or higher. Performance data current to the most recent month-end may be obtained by calling (888) 447-7443. The investment return and principal value of an investment will fluctuate so that shares, when redeemed, may be worth more or less than their original cost. The table does not reflect the deduction of taxes that a shareholder would pay on Fund distributions or the redemption of Fund shares.
The Fund’s “Total Annual Fund Operating Expenses” and “Total Annual Fund Operating Expenses After Fee Waiver and/or Expense Reimbursement” are 1.47% and 0.70%, respectively, for Class I shares of the Fund’s average daily net assets. These ratios are stated in the current prospectus dated September 1, 2017, and may differ from the actual expenses incurred by the Fund for the period covered by this report. Estabrook Capital Management LLC (the “Adviser”) has contractually agreed to reduce its investment advisory fee and/or reimburse certain expenses of the Fund to the extent necessary to ensure that the Fund’s total operating expenses, excluding taxes, any class-specific fees and expenses (such as Rule 12b-1 distribution fees, shareholder service fees, or transfer agency fees), “Acquired Fund Fees and Expenses,” interest, extraordinary items, and brokerage commissions, do not exceed 0.70% (on an annual basis) of the average daily net assets of the Fund (the “Expense Limitation”). The Expense Limitation will remain in place until August 31, 2018, unless the Board of Trustees (“Board of Trustees”) of FundVantage Trust (the “Trust”) approves its earlier termination. The Adviser is entitled to recover, subject to approval by the Board of Trustees, such amounts reduced or reimbursed for a period of up to three (3) years from the date on which the Adviser reduced its compensation and/or assumed expenses for the Fund. The Adviser is permitted to seek reimbursement from the Fund, subject to certain limitations, for fees it waived and Fund expenses it paid to the extent the total annual fund operating expenses do not exceed the limits described above or any lesser limits in effect at the time of reimbursement. No recoupment will occur unless the Fund’s expenses are below the Expense Limitation amount. Total returns would be lower had such fees and expenses not been waived or reimbursed.
A 1% redemption fee applies to shares redeemed within 90 days of purchase. This redemption fee is not reflected in the returns shown above.
The Fund intends to evaluate performance as compared to that of the Barclays Intermediate Government/Credit Bond Index (“Barclays Int. Gov./Cr. Index”). The Fund uses the Barclays U.S. Aggregate Bond Index (“Barclays U.S. Aggregate Bond Index”) as a secondary index. The Barclays Int. Gov./Cr. Index is an unmanaged market index that
1
ESTABROOK INVESTMENT GRADE FIXED INCOME FUND
Semi-Annual Report
Performance Data (Concluded)
October 31, 2017
(Unaudited)
tracks performance of intermediate term U.S. government and corporate bonds. The Barclays U.S. Aggregate Bond Index is an intermediate term, broad-based index comprised of most U.S traded investment grade bonds. Barclays U.S. Aggregate Bond Index covers the USD-denominated, investment-grade (rated Baa3 or above by Moody’s), fixed-rate, and taxable areas of the bond market. This is the broadest measure of the taxable U.S. bond market, including most Treasury, agency, corporate, mortgage-backed, asset-backed, and international dollar-denominated issues, all with maturities of 1 year or more. It is impossible to invest directly in an index.
Mutual fund investing involves risk. The Fund is subject to the same risks as the underlying bonds in the portfolio such as credit, call and interest rate risk. As interest rates rise the value of bond prices will decline. The Fund may invest in high yield debt (also known as junk bonds) which may cause greater volatility and less liquidity. You may lose money by investing in the Fund.
2
ESTABROOK INVESTMENT GRADE FIXED INCOME FUND
Fund Expense Disclosure
October 31, 2017
(Unaudited)
As a shareholder of the Fund, you incur two types of costs: (1) transaction costs, including redemption fees; and (2) ongoing costs, including management fees and other Fund expenses. This example is intended to help you understand your ongoing costs (in dollars) of investing in the Fund and to compare these costs with the ongoing costs of investing in other mutual funds.
This example is based on an investment of $1,000 invested at the beginning of the six-month period from May 1, 2017 through October 31, 2017 and held for the entire period.
Actual Expenses
The first line of the accompanying table provides information about actual account values and actual expenses. You may use the information in this line, together with the amount you invested, to estimate the expenses that you paid over the period. Simply divide your account value by $1,000 (for example, an $8,600 account value divided by $1,000 = 8.6), then multiply the result by the number in the first line under the heading entitled “Expenses Paid During Period” to estimate the expenses you paid on your account during this period.
Hypothetical Example for Comparison Purposes
The second line of the accompanying table provides information about hypothetical account values and hypothetical expenses based on the Fund’s actual expense ratio and an assumed rate of return of 5% per year before expenses, which is not your Fund’s actual return. The hypothetical account values and expenses may not be used to estimate the actual ending account balance or expenses you paid for the period. You may use this information to compare the ongoing costs of investing in the Fund and other funds. To do so, compare this 5% hypothetical example with the 5% hypothetical examples that appear in the shareholder reports of other funds.
Please note that the expenses shown in the accompanying table are meant to highlight your ongoing costs only and do not reflect any transactional costs, such as redemption fees. Therefore, the second line of the accompanying table is useful in comparing ongoing costs only, and will not help you determine the relative total costs of owning different funds. In addition, if these transactional costs were included, your costs would have been higher.
3
ESTABROOK INVESTMENT GRADE FIXED INCOME FUND
Fund Expense Disclosure (Concluded)
October 31, 2017
(Unaudited)
| Estabrook Investment Grade Fixed Income Fund | |||||||||||||||
| Beginning Account Value May 1, 2017 | Ending Account Value October 31, 2017 | Expenses Paid During Period* | |||||||||||||
Class I | |||||||||||||||
Actual | $1,000.00 | $1,013.70 | $3.55 | ||||||||||||
Hypothetical (5% return before expenses) | 1,000.00 | 1,021.68 | 3.57 | ||||||||||||
| * | Expenses are equal to the Fund’s annualized expense ratio for the six-month period ended October 31, 2017 of 0.70% for Class I shares, multiplied by the average account value over the period, multiplied by the number of days in the most recent period (184), then divided by 365 days to reflect the period. The Fund’s ending account value on the first line in the table is based on the actual six-month total return for the Fund of 1.37%. |
4
ESTABROOK INVESTMENT GRADE FIXED INCOME FUND
Portfolio Holdings Summary Table
October 31, 2017
(Unaudited)
The following table presents a summary by security type of the portfolio holdings of the Fund:
| % of Net Assets | Value | |||||||
Corporate Bonds and Notes | 73.1 | % | $22,732,777 | |||||
U.S. Treasury Obligations | 23.1 | 7,166,116 | ||||||
Other Assets in Excess of Liabilities | 3.8 | 1,174,616 | ||||||
|
|
|
| |||||
NET ASSETS | 100.0 | % | $31,073,509 | |||||
|
|
|
| |||||
Portfolio holdings are subject to change at any time.
The accompanying notes are an integral part of the financial statements.
5
ESTABROOK INVESTMENT GRADE FIXED INCOME FUND
Portfolio of Investments
October 31, 2017
(Unaudited)
| Par Value | Value | |||||||
CORPORATE BONDS AND NOTES — 73.1% |
| |||||||
Applications Software — 3.1% |
| |||||||
Microsoft Corp. | $ | 187,000 | $ | 187,111 | ||||
Microsoft Corp. | 750,000 | 776,054 | ||||||
|
| |||||||
| 963,165 | ||||||||
|
| |||||||
Auto-Cars/Light Trucks — 8.2% |
| |||||||
Ford Motor Credit Co., LLC | 500,000 | 499,646 | ||||||
Ford Motor Credit Co., LLC | 500,000 | 513,345 | ||||||
General Motors Financial Co., Inc. | 500,000 | 501,869 | ||||||
General Motors Financial Co., Inc. | 500,000 | 510,189 | ||||||
General Motors Financial Co., Inc. | 500,000 | 512,445 | ||||||
|
| |||||||
| 2,537,494 | ||||||||
|
| |||||||
Beverages-Non-alcoholic — 3.2% |
| |||||||
Coca-Cola Co. (The) | 500,000 | 498,063 | ||||||
PepsiCo, Inc. | 500,000 | 498,649 | ||||||
|
| |||||||
| 996,712 | ||||||||
|
| |||||||
| Par Value | Value | |||||||
CORPORATE BONDS AND NOTES — (Continued) |
| |||||||
Cable/Satellite TV — 2.4% |
| |||||||
Charter Communications Operating LLC | $ | 750,000 | $ | 742,319 | ||||
|
| |||||||
Commercial Banks Non-US — 0.8% |
| |||||||
Santander UK PLC | 250,000 | 252,633 | ||||||
|
| |||||||
Commercial Banks-Eastern US — 1.4% |
| |||||||
CIT Group, Inc. | 400,000 | 432,680 | ||||||
|
| |||||||
Commercial Banks-Western US — 1.6% |
| |||||||
Synchrony Bank | 500,000 | 499,093 | ||||||
|
| |||||||
Computers — 5.0% |
| |||||||
Apple, Inc. | 500,000 | 494,555 | ||||||
Apple, Inc. | 500,000 | 496,392 | ||||||
Dell International LLC / EMC Corp. | 500,000 | 557,187 | ||||||
|
| |||||||
| 1,548,134 | ||||||||
|
| |||||||
The accompanying notes are an integral part of the financial statements.
6
ESTABROOK INVESTMENT GRADE FIXED INCOME FUND
Portfolio of Investments (Continued)
October 31, 2017
(Unaudited)
| Par Value | Value | |||||||
CORPORATE BONDS AND NOTES — (Continued) |
| |||||||
Diversified Banking Institutions — 23.0% |
| |||||||
Bank of America Corp. | $ | 500,000 | $ | 506,924 | ||||
Barclays PLC | 500,000 | 506,510 | ||||||
Barclays PLC | 500,000 | 513,428 | ||||||
Citigroup, Inc. | 500,000 | 504,750 | ||||||
Goldman Sachs Group, Inc. (The) | 500,000 | 500,625 | ||||||
Goldman Sachs Group, Inc. (The) | 1,000,000 | 1,054,610 | ||||||
JPMorgan Chase & Co. | 1,000,000 | 991,025 | ||||||
| Par Value | Value | |||||||
CORPORATE BONDS AND NOTES — (Continued) |
| |||||||
Diversified Banking Institutions — (Continued) |
| |||||||
JPMorgan Chase & Co. | $ | 500,000 | $ | 513,400 | ||||
Morgan Stanley | 500,000 | 525,000 | ||||||
Morgan Stanley | 1,000,000 | 1,016,780 | ||||||
UBS Group Funding Switzerland AG | 500,000 | 501,620 | ||||||
|
| |||||||
| 7,134,672 | ||||||||
|
| |||||||
Diversified Manufacturing Operations — 1.6% |
| |||||||
General Electric Co. | 500,000 | 502,543 | ||||||
|
| |||||||
E-Commerce/Products — 0.8% |
| |||||||
eBay, Inc. | 250,000 | 250,073 | ||||||
|
| |||||||
The accompanying notes are an integral part of the financial statements.
7
ESTABROOK INVESTMENT GRADE FIXED INCOME FUND
Portfolio of Investments (Continued)
October 31, 2017
(Unaudited)
| Par Value | Value | |||||||
CORPORATE BONDS AND NOTES — (Continued) |
| |||||||
Electric-Integrated — 0.7% |
| |||||||
Exelon Corp. | $ | 200,000 | $ | 205,840 | ||||
|
| |||||||
Electronic Components-Semiconductor — 1.6% |
| |||||||
Intel Corp. | 250,000 | 253,658 | ||||||
Texas Instruments, Inc. | 250,000 | 249,273 | ||||||
|
| |||||||
| 502,931 | ||||||||
|
| |||||||
Finance-Auto Loans — 5.7% |
| |||||||
Ally Financial, Inc. | 750,000 | 755,663 | ||||||
Ally Financial, Inc. | 500,000 | 510,000 | ||||||
Ally Financial, Inc. | 500,000 | 520,000 | ||||||
|
| |||||||
| 1,785,663 | ||||||||
|
| |||||||
Food-Retail — 2.8% |
| |||||||
Whole Foods Market, Inc. | 750,000 | 861,293 | ||||||
|
| |||||||
Life/Health Insurance — 1.5% |
| |||||||
Lincoln National Corp. | 500,000 | 470,625 | ||||||
|
| |||||||
| Par Value | Value | |||||||
CORPORATE BONDS AND NOTES — (Continued) |
| |||||||
Multi-line Insurance — 0.8% |
| |||||||
MetLife, Inc. | $ | 250,000 | $ | 261,250 | ||||
|
| |||||||
Office Automation & Equipment — 0.8% |
| |||||||
Pitney Bowes, Inc. | 250,000 | 244,251 | ||||||
|
| |||||||
Oil Comp-Integrated — 0.8% |
| |||||||
Exxon Mobil Corp. | 250,000 | 255,316 | ||||||
|
| |||||||
Pipelines — 0.8% |
| |||||||
Enterprise Products Operating LLC | 235,000 | 235,000 | ||||||
|
| |||||||
REITs-Shopping Centers — 0.8% |
| |||||||
Kimco Realty Corp. | 250,000 | 255,673 | ||||||
|
| |||||||
Retail-Discount — 0.8% |
| |||||||
Wal-Mart Stores, Inc. | 250,000 | 249,692 | ||||||
|
| |||||||
Retail-Mail Order — 1.7% |
| |||||||
QVC, Inc. | 500,000 | 520,879 | ||||||
|
| |||||||
The accompanying notes are an integral part of the financial statements.
8
ESTABROOK INVESTMENT GRADE FIXED INCOME FUND
Portfolio of Investments (Concluded)
October 31, 2017
(Unaudited)
| Par Value | Value | |||||||
CORPORATE BONDS AND NOTES — (Continued) |
| |||||||
Super-Regional Banks-US — 1.6% |
| |||||||
Wells Fargo & Co. | $ | 500,000 | $ | 514,426 | ||||
|
| |||||||
Telephone-Integrated — 1.6% |
| |||||||
Verizon Communications, Inc. | 500,000 | 510,420 | ||||||
|
| |||||||
TOTAL CORPORATE BONDS AND NOTES |
| 22,732,777 | ||||||
|
| |||||||
U.S. TREASURY OBLIGATIONS — 23.1% |
| |||||||
1.027%, 12/28/2017(e) | 1,000,000 | 998,378 | ||||||
1.000%, 05/31/2018 | 2,500,000 | 2,495,312 | ||||||
1.250%, 04/30/2019 | 1,000,000 | 995,625 | ||||||
1.875%, 07/31/2022 | 1,250,000 | 1,242,774 | ||||||
2.250%, 08/15/2027 | 1,450,000 | 1,434,027 | ||||||
|
| |||||||
| 7,166,116 | ||||||||
|
| |||||||
TOTAL U.S. TREASURY OBLIGATIONS | 7,166,116 | |||||||
|
| |||||||
TOTAL INVESTMENTS - 96.2% |
| 29,898,893 | ||||||
OTHER ASSETS IN EXCESS OF LIABILITIES - 3.8% |
| 1,174,616 | ||||||
|
| |||||||
NET ASSETS - 100.0% | $ | 31,073,509 | ||||||
|
| |||||||
| (a) | Securities exempt from registration under Rule 144A of the Securities Act of 1933, as amended. These securities were purchased in accordance with the guidelines approved by the Fund’s Board of Trustees and may be resold, in transactions exempt from registration, to qualified institutional buyers. At October 31, 2017, these securities amounted to $1,801,126 or 5.8% of net assets. These securities have been determined by the Adviser to be liquid securities. |
| (b) | Variable or Floating Rate Security. The rate shown is based on the latest available information as of October 31, 2017. |
| (c) | Security is a perpetual bond and has no definite maturity date. Disclosed maturity date is next call date. |
| (d) | Fix-to Float Security. Rate shown is as of October 31, 2017. |
| (e) | Rate disclosed represents the yield-to-maturity as of October 31, 2017. |
3-M | 3-Months | |
LIBOR | London Interbank Offered Rate | |
PLC | Public Limited Company | |
REIT | Real Estate Investment Trust |
Please note that securities are classified according to the Bloomberg Sub-Industry Categories. The Fund’s investment adviser has selected this classification system because they believe that it best reflects the industry and risks associated with each position.
The accompanying notes are an integral part of the financial statements.
9
ESTABROOK INVESTMENT GRADE FIXED INCOME FUND
Statement of Assets and Liabilities
October 31, 2017
(Unaudited)
Assets | ||||
Investments, at value (Cost $29,587,136) | $ | 29,898,893 | ||
Cash | 1,525,173 | |||
Dividends and interest receivable | 196,798 | |||
Receivable from Investment Adviser | 3,997 | |||
Prepaid expenses and other assets | 28,065 | |||
|
| |||
Total assets | 31,652,926 | |||
|
| |||
Liabilities | ||||
Payable for investments purchased | 500,000 | |||
Payable for administration and accounting fees | 20,397 | |||
Payable for capital shares redeemed | 15,858 | |||
Payable for audit fees | 15,718 | |||
Payable for transfer agent fees | 10,903 | |||
Payable for printing fees | 10,550 | |||
Payable for custodian fees | 2,256 | |||
Payable for legal fees | 1,583 | |||
Payable for distributions to shareholders | 46 | |||
Accrued expenses | 2,106 | |||
|
| |||
Total liabilities | 579,417 | |||
|
| |||
Net Assets | $ | 31,073,509 | ||
|
| |||
Net Assets consisted of: | ||||
Capital stock, $0.01 par value | $ | 30,513 | ||
Paid-in capital | 31,032,872 | |||
Accumulated net investment loss | (7,305 | ) | ||
Accumulated net realized loss from investments | (294,328 | ) | ||
Net unrealized appreciation on investments | 311,757 | |||
|
| |||
Net Assets | $ | 31,073,509 | ||
|
| |||
Class I: | ||||
Shares outstanding | 3,051,337 | |||
|
| |||
Net asset value, offering and redemption price per share ($31,073,509 / 3,051,337 shares) | $ | 10.18 | ||
|
| |||
The accompanying notes are an integral part of the financial statements.
10
ESTABROOK INVESTMENT GRADE FIXED INCOME FUND
Statement of Operations
For the Six Months Ended October 31, 2017
(Unaudited)
Investment income | ||||
Interest | $ | 420,923 | ||
|
| |||
Total investment income | 420,923 | |||
|
| |||
Expenses | ||||
Advisory fees (Note 2) | 104,070 | |||
Administration and accounting fees (Note 2) | 32,456 | |||
Transfer agent fees (Note 2) | 21,852 | |||
Trustees’ and officers’ fees (Note 2) | 17,610 | |||
Registration and filing fees | 16,285 | |||
Legal fees | 14,836 | |||
Audit fees | 13,643 | |||
Printing and shareholder reporting fees | 10,121 | |||
Custodian fees (Note 2) | 6,932 | |||
Other expenses | 5,266 | |||
|
| |||
Total expenses before waivers and reimbursements | 243,071 | |||
|
| |||
Less: waivers and reimbursements (Note 2) | (130,995 | ) | ||
|
| |||
Net expenses after waivers and reimbursements | 112,076 | |||
|
| |||
Net investment income | 308,847 | |||
|
| |||
Net realized and unrealized gain (loss) from investments: | ||||
Net realized loss from investments | (159,975 | ) | ||
Net change in unrealized appreciation/(depreciation) on investments | 305,410 | |||
|
| |||
Net realized and unrealized gain on investments | 145,435 | |||
|
| |||
Net increase in net assets resulting from operations | $ | 454,282 | ||
|
|
The accompanying notes are an integral part of the financial statements.
11
ESTABROOK INVESTMENT GRADE FIXED INCOME FUND
Statements of Changes in Net Assets
| For the Six Months Ended October 31, 2017 (Unaudited) | For the Year Ended April 30, 2017 | |||||||||
Increase in net assets from operations: | ||||||||||
Net investment income | $ | 308,847 | $ | 691,905 | ||||||
Net realized gain/(loss) from investments | (159,975 | ) | 74,468 | |||||||
Net change in unrealized appreciation/(depreciation) on investments | 305,410 | 219,652 | ||||||||
|
|
|
| |||||||
Net increase in net assets resulting from operations | 454,282 | 986,025 | ||||||||
|
|
|
| |||||||
Less dividends and distributions to shareholders from: | ||||||||||
Net investment income: | ||||||||||
Class I | (308,803 | ) | (690,285 | ) | ||||||
Net realized capital gains: | ||||||||||
Class I | — | (298,665 | ) | |||||||
|
|
|
| |||||||
Net decrease in net assets from dividends and distributions to shareholders | (308,803 | ) | (988,950 | ) | ||||||
|
|
|
| |||||||
Decrease in net assets derived from capital share transactions (Note 4) | (1,369,332 | ) | (923,822 | ) | ||||||
|
|
|
| |||||||
Total decrease in net assets | (1,223,853 | ) | (926,747 | ) | ||||||
|
|
|
| |||||||
Net assets | ||||||||||
Beginning of period | 32,297,362 | 33,224,109 | ||||||||
|
|
|
| |||||||
End of period | $ | 31,073,509 | $ | 32,297,362 | ||||||
|
|
|
| |||||||
Accumulated net investment loss, end of period | $ | (7,305 | ) | $ | (7,349 | ) | ||||
|
|
|
| |||||||
The accompanying notes are an integral part of the financial statements.
12
ESTABROOK INVESTMENT GRADE FIXED INCOME FUND
Financial Highlights
Contained below is per share operating performance data for Class I shares outstanding, total investment return, ratios to average net assets and other supplemental data for the respective period. The total returns in the table represent the rate that an investor would have earned or lost on an investment in the Fund (assuming reinvestment of all dividends and distributions). This information has been derived from information provided in the financial statements and should be read in conjunction with the financial statements and the notes thereto.
| Class I | ||||||||||||||||||||||||||||||
| For the Six Months Ended October 31, 2017 (Unaudited) | For the Year Ended April 30, 2017 | For the Year Ended April 30, 2016 | For the Year Ended April 30, 2015 | For the Year Ended April 30, 2014 | For the Year Ended April 30, 2013 | |||||||||||||||||||||||||
Per Share Operating Performance | ||||||||||||||||||||||||||||||
Net asset value, beginning of period | $ | 10.14 | $ | 10.13 | $ | 10.26 | $ | 10.37 | $ | 10.66 | $ | 10.09 | ||||||||||||||||||
|
|
|
|
|
|
|
|
|
|
|
| |||||||||||||||||||
Net investment income(1) | 0.10 | 0.21 | 0.24 | 0.24 | 0.26 | 0.32 | ||||||||||||||||||||||||
Net realized and unrealized gain/(loss) on investments | 0.04 | 0.10 | (0.10 | ) | (0.05 | ) | (0.23 | ) | 0.57 | |||||||||||||||||||||
|
|
|
|
|
|
|
|
|
|
|
| |||||||||||||||||||
Net increase in net assets resulting from operations | 0.14 | 0.31 | 0.14 | 0.19 | 0.03 | 0.89 | ||||||||||||||||||||||||
|
| �� |
|
|
|
|
|
|
|
|
|
| ||||||||||||||||||
Dividends and distributions to shareholders from: | ||||||||||||||||||||||||||||||
Net investment income | (0.10 | ) | (0.21 | ) | (0.24 | ) | (0.24 | ) | (0.26 | ) | (0.32 | ) | ||||||||||||||||||
Net realized capital gains | — | (0.09 | ) | (0.03 | ) | (0.06 | ) | (0.06 | ) | — | ||||||||||||||||||||
|
|
|
|
|
|
|
|
|
|
|
| |||||||||||||||||||
Total dividends and distributions to shareholders | (0.10 | ) | (0.30 | ) | (0.27 | ) | (0.30 | ) | (0.32 | ) | (0.32 | ) | ||||||||||||||||||
|
|
|
|
|
|
|
|
|
|
|
| |||||||||||||||||||
Redemption fees | — | (2) | — | (2) | — | — | (2) | — | — | (2) | ||||||||||||||||||||
|
|
|
|
|
|
|
|
|
|
|
| |||||||||||||||||||
Net asset value, end of period | $ | 10.18 | $ | 10.14 | $ | 10.13 | $ | 10.26 | $ | 10.37 | $ | 10.66 | ||||||||||||||||||
|
|
|
|
|
|
|
|
|
|
|
| |||||||||||||||||||
Total investment return(3) | 1.37 | % | 3.07 | % | 1.39 | % | 1.85 | % | 0.38 | % | 8.99 | % | ||||||||||||||||||
Ratios/Supplemental Data | ||||||||||||||||||||||||||||||
Net assets, end of year (in thousands) | $ | 31,074 | $ | 32,297 | $ | 33,224 | $ | 33,746 | $ | 33,995 | $ | 31,737 | ||||||||||||||||||
Ratio of expenses to average net assets | 0.70 | %(4) | 0.70 | % | 0.70 | % | 0.70 | % | 0.70 | % | 0.70 | % | ||||||||||||||||||
Ratio of expenses to average net assets without waivers and expense reimbursements(5) | 1.52 | %(4) | 1.47 | % | 1.41 | % | 1.34 | % | 1.41 | % | 1.69 | % | ||||||||||||||||||
Ratio of net investment income to average net assets | 1.93 | %(4) | 2.06 | % | 2.36 | % | 2.28 | % | 2.50 | % | 3.07 | % | ||||||||||||||||||
Portfolio turnover rate | 43.27 | %(6) | 98.11 | % | 112.74 | % | 89.75 | % | 132.74 | % | 94.83 | % | ||||||||||||||||||
| (1) | The selected per share data was calculated using the average shares outstanding method for the period. |
| (2) | Amount is less than $0.005 per share. |
| (3) | Total investment return is calculated assuming a purchase of shares on the first day and a sale of shares on the last day of each period reported and includes reinvestment of dividends and distributions, if any. Total return for periods less than one year are not annualized. |
| (4) | Annualized. |
| (5) | During the period, certain fees were waived and/or reimbursed. If such fee waivers and/or reimbursements had not occurred, the ratios would have been as indicated (See Note 2). |
| (6) | Not annualized. |
The accompanying notes are an integral part of the financial statements.
13
ESTABROOK INVESTMENT GRADE FIXED INCOME FUND
Notes to Financial Statements
October 31, 2017
(Unaudited)
1. Organization and Significant Accounting Policies
The Estabrook Investment Grade Fixed Income Fund (the “Fund”) is a diversified, open-end management investment company registered under the Investment Company Act of 1940, as amended (the “1940 Act”), which commenced investment operations on July 23, 2010. The Fund is a separate series of FundVantage Trust (the “Trust”) which was organized as a Delaware statutory trust on August 28, 2006. The Trust is a “series trust” authorized to issue an unlimited number of separate series or classes of shares of beneficial interest. Each series is treated as a separate entity for certain matters under the 1940 Act, and for other purposes, and a shareholder of one series is not deemed to be a shareholder of any other series. The Fund offers separate classes of shares: Class A, Class C, Class I and Class R Shares. As of October 31, 2017, Class A, Class C and Class R Shares had not been issued.
The Fund is an investment company and follows accounting and reporting guidance in the Financial Accounting Standards Board Accounting Standards Codification Topic 946.
Portfolio Valuation — The Fund’s net asset value (“NAV”) is calculated once daily at the close of regular trading hours on the New York Stock Exchange (“NYSE”) (typically 4:00 p.m. Eastern time) on each day the NYSE is open. Securities held by the Fund are valued at their last sale price on the NYSE on the day the security is valued. Lacking any sales on such day, the security will be valued at the mean between the last asked price and the last bid price prior to the market close. Securities listed on other exchanges (and not subject to restriction against sale by the Fund on such exchanges) will be similarly valued, using quotations on the exchange on which the security is traded most extensively. Unlisted securities that are quoted on the National Association of Securities Dealers National Market System, for which there have been sales of such securities on such day, shall be valued at the official closing price on such system on the day the security is valued. If there are no such sales on such day, the value shall be the mean between the last asked price and the last bid price prior to market close. The value of such securities quoted on the National Association of Securities Dealers Automatic Quotation System (“NASDAQ”) market system, but not listed on the National Market System, shall be valued at the mean between closing asked price and the closing bid price. Unlisted securities that are not quoted on the NASDAQ and for which over-the-counter (“OTC”) market quotations are readily available will be valued at the mean between the current bid and asked prices for such security in the over-the-counter market. Fixed income and preferred securities are valued based on market quotations, which are furnished by an independent pricing service. Fixed income securities having a remaining maturity of 60 days or less are generally valued at amortized cost, provided such amount approximates fair value. Debt securities are valued on the basis of broker quotations or valuations provided by a pricing service, which utilizes information with respect to recent sales, market transactions in comparable securities, quotations from dealers, and various relationships between securities in determining value. Due to continued volatility in the current market, valuations developed through pricing techniques may materially vary from the actual amounts realized upon sale of the securities. Investments in other open-end investment companies are valued based on the NAV of the investment companies (which may use fair value pricing as discussed
14
ESTABROOK INVESTMENT GRADE FIXED INCOME FUND
Notes to Financial Statements (Continued)
October 31, 2017
(Unaudited)
in their prospectuses). If market quotations are unavailable or deemed unreliable, securities will be valued in accordance with procedures adopted by the Trust’s Board of Trustees (“Board of Trustees”). Relying on prices supplied by pricing services or dealers or using fair valuation may result in values that are higher or lower than the values used by other investment companies and investors to price the same investments. In the event that market quotes are not readily available, and the security or asset cannot be valued pursuant to one of the valuation methods, the value of the security or asset will be determined in good faith by the Adviser. The Trust has established a Valuation Committee which performs certain functions including the oversight of the Adviser’s fair valuation determinations.
Fair Value Measurements — The inputs and valuation techniques used to measure fair value of the Fund’s investments are summarized into three levels as described in the hierarchy below:
• Level 1 — | quoted prices in active markets for identical securities; | |
• Level 2 — | other significant observable inputs (including quoted prices for similar securities, interest rates, prepayment speeds, credit risk, etc.); and | |
• Level 3 — | significant unobservable inputs (including the Fund’s own assumptions in determining the fair value of investments). | |
The fair value of the Fund’s bonds is generally based on quotes received from brokers of independent pricing services. Bonds with quotes that are based on actual trades with a sufficient level of activity on or near the measurement date are classified as Level 2 assets.
The inputs or methodology used for valuing securities are not necessarily an indication of the risk associated with investing in those securities.
The following is a summary of the inputs used, as of October 31, 2017, in valuing the Fund’s investments carried at fair value:
| Total Value at 10/31/17 | Level 1 Quoted Price | Level 2 Other Significant Observable Inputs | Level 3 Significant Unobservable Inputs | |||||||||||||
Corporate Bonds and Notes | $ | 22,732,777 | $ | — | $ | 22,732,777 | $ | — | ||||||||
U.S. Treasury Obligations | 7,166,116 | — | 7,166,116 | — | ||||||||||||
|
|
|
|
|
|
|
| |||||||||
Total Investments | $ | 29,898,893 | $ | — | $ | 29,898,893 | $ | — | ||||||||
|
|
|
|
|
|
|
| |||||||||
At the end of each quarter, management evaluates the classification of Levels 1, 2 and 3 assets and liabilities. Various factors are considered, such as changes in liquidity from the prior reporting period;
15
ESTABROOK INVESTMENT GRADE FIXED INCOME FUND
Notes to Financial Statements (Continued)
October 31, 2017
(Unaudited)
whether or not a broker is willing to execute at the quoted price; the depth and consistency of prices from third party pricing services; and the existence of contemporaneous, observable trades in the market. Additionally, management evaluates the classification of Level 1 and Level 2 assets and liabilities on a quarterly basis for changes in listings or delistings on national exchanges.
Due to the inherent uncertainty of determining the fair value of investments that do not have a readily available market value, the fair value of the Fund’s investments may fluctuate from period to period. Additionally, the fair value of investments may differ significantly from the values that would have been used had a ready market existed for such investments and may differ materially from the values the Fund may ultimately realize. Further, such investments may be subject to legal and other restrictions on resale or otherwise less liquid than publicly traded securities.
For fair valuations using significant unobservable inputs, U.S. generally accepted accounting principles (“U.S. GAAP”) require the Fund to present a reconciliation of the beginning to ending balances for reported market values that presents changes attributable to total realized and unrealized gains or losses, purchase and sales, and transfers in and out of Level 3 during the period. Transfers in and out between Levels are based on values at the end of the period. U.S. GAAP also requires the Fund to disclose amounts and reasons for all transfers in and out of Level 1 and Level 2 fair value measurements. A reconciliation of Level 3 investments is presented only when the Fund had an amount of Level 3 investments at the end of the reporting period that was meaningful in relation to its net assets. The amounts and reasons for all transfers in and out of each Level within the three-tier hierarchy are disclosed when the Fund had an amount of total transfers during the reporting period that was meaningful in relation to its net assets as of the end of the reporting period.
For the six months ended October 31, 2017, there were no transfers between Levels 1, 2 and 3 for the Fund.
Use of Estimates — The preparation of financial statements in conformity with U.S. GAAP requires management to make estimates and assumptions that affect the amounts reported in the financial statements and accompanying notes at the date of the financial statements and the reported amounts of revenues and expenses during the period. Actual results could differ from those estimates and those differences could be material.
Investment Transactions, Investment Income and Expenses — Investment transactions are recorded on trade date for financial statement preparation purposes. Realized gains and losses on investments sold are recorded on the identified cost basis. Gains and losses on principal paydowns from mortgage backed securities are recorded as interest income on the Statement of Operations. Interest income is recorded on the accrual basis. Accretion of discounts and amortization of premiums are recorded on a daily basis using the effective yield method except for short term securities, which records discounts and premiums on a straight-line basis. Dividends are recorded on the ex-dividend date. General expenses of the Trust are generally allocated to each fund in proportion to its relative daily net assets. Expenses directly attributable to a particular fund in the Trust are charged directly to such fund.
16
ESTABROOK INVESTMENT GRADE FIXED INCOME FUND
Notes to Financial Statements (Continued)
October 31, 2017
(Unaudited)
Dividends and Distributions to Shareholders �� Dividends from net investment income are declared and paid monthly to shareholders. Distributions, if any, of net short-term capital gain and net capital gain (the excess of net long-term capital gain over the short-term capital loss) realized by the Fund, after deducting any available capital loss carryovers are declared and paid to its shareholders annually. Income dividends and capital gain distributions are determined in accordance with U.S. federal income tax regulations, which may differ from U.S. GAAP. These differences may include the treatment of non-taxable dividends, expiring capital loss carryforwards and losses deferred due to wash sales and excise tax regulations. Permanent book and tax basis differences relating to shareholder distributions will result in reclassifications within the components of net assets.
U.S. Tax Status — No provision is made for U.S. income taxes as it is the Fund’s intention to continue to qualify for and elect the tax treatment applicable to regulated investment companies under Subchapter M of the Internal Revenue Code of 1986, as amended (“Internal Revenue Code”), and make the requisite distributions to its shareholders which will be sufficient to relieve it from U.S. income and excise taxes.
Other — In the normal course of business, the Fund may enter into contracts that provide general indemnifications. The Fund’s maximum exposure under these arrangements is dependent on claims that may be made against the Fund in the future, and therefore, cannot be estimated; however, based on experience, the risk of material loss for such claims is considered remote.
Recent Accounting Pronouncement — On August 1, 2017, the Fund implemented changes due to amendments to Regulation S-X, issued by the Securities and Exchange Commission, which require standardized, enhanced disclosures, particularly related to derivatives, in investment company financial statements. Adoption of the amendment had no effect on the Fund’s net assets or results of operations.
2. Transactions with Related Parties and Other Service Providers
Estabrook Capital Management LLC (“Estabrook” or the “Adviser”) serves as investment adviser to the Fund pursuant to an investment advisory agreement with the Trust (the “Advisory Agreement”). For its services, the Adviser is paid a monthly fee at the annual rate of 0.65% of the Fund’s average daily net assets. The Adviser has contractually agreed to reduce its investment advisory fee and/or reimburse certain expenses of the Fund to the extent necessary to ensure that the Fund’s total operating expenses, excluding taxes, any class-specific fees and expenses (such as Rule 12b-1 distribution fees, shareholder service fees, or transfer agency fees), “Acquired Fund Fees and Expenses,” interest, extraordinary items, and brokerage commissions, do not exceed 0.70% (on an annual basis) of the average daily net assets of the Fund (the “Expense Limitation”). The Expense Limitation will remain in place until August 31, 2018, unless the Board of Trustees approves its earlier termination. The Adviser is entitled to recover, subject
17
ESTABROOK INVESTMENT GRADE FIXED INCOME FUND
Notes to Financial Statements (Continued)
October 31, 2017
(Unaudited)
to approval by the Board of Trustees, such amounts reduced or reimbursed for a period of up to three (3) years from the date on which the Adviser reduced its compensation and/or assumed expenses for the Fund. The Adviser is permitted to seek reimbursement from the Fund, subject to certain limitations, for fees it waived and Fund expenses it paid to the extent the total annual fund expenses do not exceed the limits described above or any lesser limits in effect at the time of reimbursement. No recoupment will occur unless the Fund’s expenses are below the Expense Limitation amount. At October 31, 2017, the amount of potential recovery by the Adviser was as follows:
Expiration | ||||||||
April 30, 2018 | April 30, 2019 | April 30, 2020 | October 31, 2020 | Total | ||||
$217,797 | $234,709 | $257,454 | $130,995 | $840,955 | ||||
For the six months ended October 31, 2017, the Adviser earned advisory fees of $104,070 and waived and reimbursed fees of $130,995.
Other Service Providers
BNY Mellon Investment Servicing (US) Inc. (“BNY Mellon”) serves as administrator and transfer agent for the Fund. For providing administrative and accounting services, BNY Mellon is entitled to receive a monthly fee equal to an annual percentage rate of the Fund’s average net assets and is subject to certain minimum monthly fees. For providing transfer agency services, BNY Mellon is entitled to receive a monthly fee, subject to certain minimum, and out of pocket expenses.
The Bank of New York Mellon (the “Custodian”) provides certain custodial services to the Fund. The Custodian is entitled to receive a monthly fee, subject to certain minimum, and out of pocket expenses.
Foreside Funds Distributors LLC (the “Underwriter”) provides principal underwriting services to the Fund pursuant to an underwriting agreement between the Trust and the Underwriter.
Trustees and Officers
The Trust is governed by its Board of Trustees. The Trustees receive compensation in the form of an annual retainer and per meeting fees for their services to the Trust. The remuneration paid to the Trustees by the Fund during the six months ended October 31, 2017 was $3,402. An employee of BNY Mellon serves as the Secretary of the Trust and is not compensated by the Fund or the Trust.
JW Fund Management LLC (“JWFM”) provides a Principal Executive Officer and Principal Financial Officer, respectively, to the Trust. JWFM is compensated for the services provided to the Trust.
18
ESTABROOK INVESTMENT GRADE FIXED INCOME FUND
Notes to Financial Statements (Continued)
October 31, 2017
(Unaudited)
Freeh Group International Solutions, LLC provides the Trust with a Chief Compliance Officer and an Anti-Money Laundering Officer.
3. Investment in Securities
For the six months ended October 31, 2017, aggregate purchases and sales of investment securities (excluding short-term investments) of the Fund were as follows:
| Purchases | Sales | |||||||
Investment Securities | $ | 8,616,870 | $ | 8,300,043 | ||||
U.S. Government Securities | 4,024,863 | 5,166,341 | ||||||
4. Capital Share Transactions
For the six months ended October 31, 2017 and the year ended April 30, 2017, transactions in capital shares (authorized shares unlimited) were as follows:
| For the Six Months Ended October 31, 2017 (Unaudited) | For the Year Ended April 30, 2017 | |||||||||||||||
| Shares | Amount | Shares | Amount | |||||||||||||
Class I | ||||||||||||||||
Sales | 53,050 | $ | 538,769 | 132,234 | $ | 1,359,501 | ||||||||||
Reinvestments | 30,337 | 308,729 | 96,321 | 976,655 | ||||||||||||
Redemption Fees* | — | — | — | 1,637 | ||||||||||||
Redemptions | (217,904 | ) | (2,216,830 | ) | (323,687 | ) | (3,261,615 | ) | ||||||||
|
|
|
|
|
|
|
| |||||||||
Net Decrease | (134,517 | ) | $ | (1,369,332 | ) | (95,132 | ) | $ | (923,822 | ) | ||||||
|
|
|
|
|
|
|
| |||||||||
| * | There is a 1.00% redemption fee that may be charged on shares redeemed which have been held for 90 days or less. The redemption fees are retained by the Fund for the benefit of the remaining shareholders and recorded as paid-in capital. |
5. Federal Tax Information
The Fund has followed the authoritative guidance on accounting for and disclosure of uncertainty in tax positions, which requires the Fund to determine whether a tax position is more likely than not to be sustained upon examination, including resolution of any related appeals or litigation processes, based on the technical merits of the position. The Fund has determined that there was no effect on the financial statements from following this authoritative guidance. In the normal course of business, the Fund is subject to examination by federal, state and local jurisdictions, where applicable, for tax years for which applicable statutes of limitations have not expired.
19
ESTABROOK INVESTMENT GRADE FIXED INCOME FUND
Notes to Financial Statements (Continued)
October 31, 2017
(Unaudited)
For the year ended April 30, 2017, the tax character of distributions paid by the Fund was $849,117 of ordinary income dividends and $136,714 of long-term capital gains dividends. Distributions from net investment income and short-term capital gains were treated as ordinary income for federal income tax purposes.
As of April 30, 2017, components of distributable earnings on a tax basis were as follows:
| Capital Loss Carryforward | Undistributed Ordinary Income | Undistributed Long-Term Gain | Unrealized Depreciation | Qualified Late-Year Losses | ||||
| $— | $— | $— | $(1,003) | $(134,354) |
The differences between the book and tax basis components of distributable earnings relate primarily to the timing and recognition of income and gains for federal income tax purposes. Short-term capital gains are reported as ordinary income for federal income tax purposes.
As of October 31, 2017, the federal tax cost, aggregate gross unrealized appreciation and depreciation of securities held by the Fund were as follows:
Federal tax cost* | $ | 29,587,136 | ||||
|
| |||||
Gross unrealized appreciation | $ | 420,801 | ||||
Gross unrealized depreciation | (109,044 | ) | ||||
|
| |||||
Net unrealized appreciation | $ | 311,757 | ||||
|
| |||||
| * | Because tax adjustments are calculated annually at the end of the Fund’s fiscal year, the above table does not reflect tax adjustments for the current fiscal year. For the previous year’s federal income tax information, please refer to the Notes to Financial Statements section in the Fund’s most recent annual report. |
Pursuant to federal income tax rules applicable to regulated investment companies, the Fund may elect to treat certain capital losses between November 1 and April 30 and late year ordinary losses ((i) ordinary losses between January 1 and April 30, and (ii) specified ordinary and currency losses between November 1 and April 30) as occurring on the first day of the following tax year. For the year ended April 30, 2017, any amount of losses elected within the tax return will not be recognized for federal income tax purposes until May 1, 2017. For the year ended April 30, 2017, the Fund had long-term capital loss deferrals of $182 and short-term capital loss deferrals of $134,172.
Accumulated capital losses represent net capital loss carryforwards as of April 30, 2017, that may be available to offset future realized capital gains and thereby reduce future capital gains distributions. As of April 30, 2017, the Fund did not have any capital loss carryforwards.
20
ESTABROOK INVESTMENT GRADE FIXED INCOME FUND
Notes to Financial Statements (Continued)
October 31, 2017
(Unaudited)
6. Debt Investment Risk
Debt investments are affected primarily by the financial condition of the companies or other entities that have issued them and by changes in interest rates. There is a risk that an issuer of a Fund’s debt investments may not be able to meet its financial obligations (e.g., may not be able to make principal and/or interest payments when they are due or otherwise default on other financial terms) and/or go bankrupt. Securities such as high-yield/high-risk bonds, e.g., bonds with low credit ratings by Moody’s (Ba or lower) or Standard & Poor’s (BB and lower) or if unrated are of comparable quality as determined by the manager, are especially subject to credit risk during periods of economic uncertainty or during economic downturns and are more likely to default on their interest and/or principal payments than higher rated securities. Debt investments may be affected by changes in interest rates. Debt investments with longer durations tend to be more sensitive to changes in interest rates, making them more volatile than debt investments with shorter durations or floating or adjustable interest rates. The value of debt investments may fall when interest rates rise.
7. Subsequent Events
Management has evaluated the impact of all subsequent events on the Fund through the date the financial statements were issued and has determined that there was the following subsequent event:
The Board of Trustees of FundVantage Trust (the “Trust”) has approved a plan to liquidate and terminate the Fund. The plan of liquidation provides that the Fund will cease its business, liquidate its assets and distribute its liquidation proceeds to all of the Fund’s shareholders of record. Final liquidation of the Fund will occur on or about January 31, 2018.
The Funds will cease accepting purchase orders and will be closed to all new and existing investors on December 18, 2017.
Shareholders of the Fund may redeem their shares at any time prior to the liquidation date. If a shareholder has not redeemed his or her shares by the liquidation date, the shareholder’s shares automatically will be redeemed and proceeds will be sent to the shareholder of record. Liquidation proceeds will be paid in cash at the Fund’s applicable net asset value per share.
As the liquidation of the Fund approaches, the Fund’s investment adviser is expected to increase the portion of the Fund’s assets held in cash and similar investments and reduce maturities of non-cash investments in order to prepare for an orderly liquidation and to meet anticipated redemption requests. This may adversely affect a Fund’s yield. The impending liquidation of the Fund may result in large redemptions, which could adversely affect a Fund’s expense ratio, although existing contractual fee waivers will be maintained. Also, as the Fund’s liquidation approaches, the Fund will cease to pursue its investment objectives.
21
ESTABROOK INVESTMENT GRADE FIXED INCOME FUND
Notes to Financial Statements (Concluded)
October 31, 2017
(Unaudited)
The redemption of shares held by a shareholder as part of the liquidation generally will be considered a taxable event. Prior to final liquidation, the Fund may make distributions of income and capital gains. These distributions will have the tax and other consequences described in the Fund’s prospectus and statement of additional information. A shareholder should consult with the shareholder’s tax advisor to discuss the Fund’s liquidation and the tax consequences to the shareholder.
22
ESTABROOK INVESTMENT GRADE FIXED INCOME FUND
Other Information
(Unaudited)
Proxy Voting
Policies and procedures that the Fund uses to determine how to vote proxies relating to portfolio securities as well as information regarding how the Fund voted proxies relating to portfolio securities for the most recent 12-month period ended June 30 are available without charge, upon request, by calling (888) 447-7443 and on the Securities and Exchange Commission’s (“SEC”) website at http://www.sec.gov.
Quarterly Portfolio Schedules
The Trust files its complete schedule of portfolio holdings with the SEC for the first and third fiscal quarters of each fiscal year (quarters ended July 31 and January 31) on Form N-Q. The Trust’s Forms N-Q are available on the SEC’s website at http://www.sec.gov and may be reviewed and copied at the SEC’s Public Reference Room in Washington, D.C. Information on the operation of the SEC’s Public Reference Room may be obtained by calling 1-800-SEC-0330.
Board Consideration of Investment Advisory Agreement
At a meeting held on June 26-27, 2017 (the “Meeting”), the Board of Trustees (the “Board” or the “Trustees”) of FundVantage Trust (the “Trust”), including a majority of the Trustees who are not “interested persons” within the meaning of Section 2(a)(19) of the Investment Company Act of 1940, as amended (the “1940 Act”) (the “Independent Trustees”), unanimously approved the proposed continuation of the investment Advisory agreement between Estabrook Capital Management, LLC (“Estabrook” or the “Adviser”) and the Trust (the “Agreement”) on behalf of the Estabrook Investment Grade Fixed Income Fund (the “Fund”) for an additional one year period.
In determining whether to approve the Agreement, the Trustees considered information provided by the Adviser in accordance with Section 15(c) of the 1940 Act regarding: (i) services performed for the Fund, (ii) the size and qualifications of their portfolio management staff, (iii) any potential or actual material conflicts of interest which may arise in connection with a portfolio manager’s management of the Fund, (iv) investment performance, (v) the capitalization and financial condition of Estabrook, (vi) brokerage selection procedures (including soft dollar arrangements, if any), (vii) the procedures for allocating investment opportunities between the Fund and other clients, (viii) results of any regulatory examination, including any recommendations or deficiencies noted, (ix) any litigation, investigation or administrative proceeding which may have a material impact on Estabrook’s ability to service the Fund, (x) compliance with the Fund’s investment objectives, policies and practices (including codes of ethics and proxy voting policies) and (xi) compliance with federal securities laws and other regulatory requirements. The Trustees noted the reports and discussions with portfolio managers as provided at the Board meetings throughout the year covering matters such as the relative performance of the Fund; compliance with the investment
23
ESTABROOK INVESTMENT GRADE FIXED INCOME FUND
Other Information (Continued)
(Unaudited)
objectives, policies, strategies and limitations for the Fund; the compliance of management personnel with the applicable code of ethics; and the adherence to the Trust’s pricing procedures as established by the Board.
Representatives from Estabrook attended the Meeting both in person and via teleconference. The representatives discussed the firm’s history, performance and investment strategies in connection with the proposed approval of the Agreement and answered questions from the Board.
Investment Performance. At the Meeting, the Trustees considered the investment performance for the Fund and Estabrook. The Trustees reviewed the historical performance charts for the Fund, the Barclays Intermediate U.S. Government/Credit Treasury Index and the Lipper Core Bond Fund Index, respectively, for the year-to-date, one year, two year, three year, five year and since inception periods ended March 31, 2017. The Trustees noted that the Fund outperformed the Barclays Intermediate U.S. Government/Credit Treasury Index and the Lipper Core Bond Fund Index for the year-to-date, one year, two year, and five year periods ended March 31, 2017. The Trustees noted that the Fund outperformed the Barclays Intermediate U.S. Government/Credit Treasury Index and underperformed the Lipper Core Bond Fund Index for the three year and since inception periods ended March 31, 2017. The Trustees concluded that, although the Fund underperformed the Lipper Core Bond Fund Index for certain periods, the performance of the Fund was within an acceptable range of performance relative to other mutual funds with similar investment objectives, strategies and policies based on the information provided at the Meeting.
Fees. The Trustees noted that Estabrook provided information regarding their advisory fees and an analysis of these fees in relation to the delivery of services to the Fund and any other ancillary benefit resulting from Estabrook’s relationship with the Fund. The Trustees reviewed a peer comparison of advisory fees and total expenses for the Fund versus other similarly managed funds with $250 million or less in assets. The Trustees noted that the Fund’s net expense ratio and gross advisory fee were higher than the median of the net expense ratio and gross advisory fee of the universe of funds in the Lipper Core Bond Fund Index. They further noted that the Fund’s net advisory fee was lower than the median of the net advisory fee of the universe of funds in the Lipper Core Bond Fund Index. The Trustees concluded that the advisory fee and services provided by Estabrook are sufficiently consistent with those of other advisers which manage mutual funds with investment objectives, strategies and policies similar to those of the Estabrook Fixed Income Fund based on the information provided at the Meeting.
Knowledge, experience, and qualifications. The Board considered the level and depth of knowledge of Estabrook, including the professional experience and qualifications of senior personnel. In evaluating the quality of services to be provided by Estabrook, the Board took into account its familiarity with Estabrook’s senior management through Board meetings, discussions and reports during the preceding year. The Board also took into account Estabrook’s compliance policies and procedures and reports on Estabrook’s compliance operations from the Trust’s Chief Compliance Officer. The Board also considered any potential conflicts of interest that may arise in a portfolio manager’s management of the Fund’s investments on
24
ESTABROOK INVESTMENT GRADE FIXED INCOME FUND
Other Information (Concluded)
(Unaudited)
the one hand, and the investments of other accounts, on the other. The Trustees reviewed the services provided to the Fund by Estabrook and concluded that the nature, extent and quality of the services provided were appropriate and consistent with the terms of the Agreement, that the quality of the proposed services appeared to be consistent with industry norms and that the Fund is likely to benefit from the continued receipt of those services. They also concluded that Estabrook has sufficient personnel, with the appropriate education and experience, to serve the Fund effectively and had demonstrated their ability to attract and retain qualified personnel.
Cost of Services. The Trustees then reviewed materials regarding the costs of the services provided by Estabrook, the compensation and benefits received by Estabrook in providing services to the Fund, as well as Estabrook’s profitability. The Trustees were provided with Estabrook’s balance sheet and income statement as of December 31, 2016. It was noted that Estabrook’s level of profitability is an important factor to consider, and the Trustees should be satisfied that Estabrook’s profits are sufficient to continue as a healthy concern generally and as investment adviser of the Fund specifically. The Trustees noted that Estabrook was currently waiving the entire Advisory fee from the Fund and was also contractually obligated to reimburse expenses. The Trustees noted that the fees charged by Estabrook were reasonable in relation to the nature and quality of the services provided, taking into account the fees charged by other advisers for managing comparable mutual funds with similar strategies. The Trustees also concluded that the overall expense ratios of the Fund were reasonable, taking into account projected growth and size of the Fund and the quality of services provided by the Adviser.
Economies of Scale. The Trustees considered the extent to which economies of scale would be realized relative to fee levels as the Fund grows, and whether the Advisory fee levels reflect these economies of scale for the benefit of shareholders. The Board noted that economies of scale may be achieved at higher asset levels for the Fund for the benefit of fund shareholders, but that the Advisory fee did not currently include breakpoint reductions as asset levels increased.
At the Meeting, the Trustees determined to approve the continuation of the Agreement for an additional one year period. In approving the continuation of the Agreement, the Board considered all factors it deemed relevant and the information presented to the Board by Estabrook. In arriving at its decision, the Board did not identify any single factor as being of paramount importance and each member of the Board gave varying weights to each factor according to his or her own judgment. The Board determined that the continuation of the Agreement for an additional one year period would be in the best interests of the Fund and its shareholders.
25
[THIS PAGE INTENTIONALLY LEFT BLANK.]
[THIS PAGE INTENTIONALLY LEFT BLANK.]
Investment Adviser
Estabrook Capital Management LLC
900 Third Avenue, 10th Floor
New York, NY 10022
Administrator
BNY Mellon Investment Servicing (US) Inc.
301 Bellevue Parkway
Wilmington, DE 19809
Transfer Agent
BNY Mellon Investment Servicing (US) Inc.
4400 Computer Drive
Westborough, MA 01581
Principal Underwriter
Foreside Funds Distributors LLC
400 Berwyn Park
899 Cassatt Road
Berwyn, PA 19312
Custodian
The Bank of New York Mellon
225 Liberty Street
New York, NY 10286
Independent Registered Public Accounting Firm
PricewaterhouseCoopers LLP
Two Commerce Square, Suite 1800
2001 Market Street
Philadelphia, PA 19103-7042
Legal Counsel
Pepper Hamilton LLP
3000 Two Logan Square
18th and Arch Streets
Philadelphia, PA 19103

ESTABROOK INVESTMENT GRADE FIXED INCOME
FUND
of
FundVantage Trust
Class I
SEMI-ANNUAL
REPORT
October 31, 2017
(Unaudited)
This report is submitted for the general information of the shareholders of the Estabrook Investment Grade Fixed Income Fund. It is not authorized for distribution unless preceded or accompanied by a current prospectus for the Estabrook Investment Grade Fixed Income Fund.
EST-1017

INSIGHT INVESTMENT GRADE BOND FUND
of
FundVantage Trust
Institutional Class
SEMI-ANNUAL REPORT
October 31, 2017
(Unaudited)
This report is submitted for the general information of the shareholders of the Insight Investment Grade Bond Fund. It is not authorized for distribution unless preceded or accompanied by a current prospectus for the Insight Investment Grade Bond Fund.

INSIGHT INVESTMENT GRADE BOND FUND
Semi-Annual Report
Performance Data
October 31, 2017
(Unaudited)
| Average Annual Total Returns for the Periods Ended October 31, 2017 | |||||||||||||||||||||||||
Six Months† | 1 Year | 3 Year | 5 Year | Since Inception* | |||||||||||||||||||||
Institutional Class | 2.42 | % | 2.72 | % | 3.19 | % | 3.07 | % | 3.99 | % | |||||||||||||||
Bloomberg Barclays U.S. Aggregate Bond® Index | 1.58 | % | 0.90 | % | 2.40 | % | 2.04 | % | 3.14 | %** | |||||||||||||||
| † | Not Annualized. |
| * | The Insight Investment Grade Bond Fund (the “Fund”) commenced operations on December 2, 2010. |
| ** | Benchmark performance is from inception date of the Fund only and is not the inception date of the benchmark itself. |
The performance data quoted represents past performance and does not guarantee future results. The investment return and principal value of an investment in the Fund will fluctuate so that an investor’s shares, when redeemed, may be worth more or less than their original cost. The table does not reflect the deduction of taxes that a shareholder would pay on Fund distributions or redemption of Fund shares. Current performance may be lower or higher. Performance data current to the most recent month-end may be obtained by calling (866) 678-6242.
As stated in the current prospectus dated September 1, 2017, the Fund’s “Total Annual Fund Operating Expenses” for Institutional Class shares of the Fund is 1.31% of the Fund’s average daily net assets. This rate may fluctuate and may differ from the actual expenses incurred by the Fund for the period covered by this report. Cutwater Investor Services Corp. (d/b/a Insight Investment and referred to herein as “Insight Investment” or the “Adviser”) has voluntarily agreed to reduce its investment advisory fee and/or reimburse certain expenses of the Fund to the extent necessary to ensure that the Fund’s total operating expenses (excluding any class-specific fees and expenses, “Acquired Fund Fees and Expenses”, interest, extraordinary items and brokerage commissions) do not exceed 0.85% (on an annual basis) of the Fund’s average daily net assets (the “Voluntary Waiver”). Such Voluntary Waiver will continue until the Adviser notifies the Fund of a change in the amount of its Voluntary Waiver or its discontinuation. This Voluntary Waiver may be discontinued at any time at the discretion of the Adviser. Total returns would be lower had such fees and/or expenses not been waived and/or reimbursed.
A 1.00% redemption fee applies to shares redeemed within 60 days of purchase. The redemption fee is not reflected in the returns shown above.
The Fund intends to evaluate performance as compared to that of the Bloomberg Barclays U.S. Aggregate Bond® Index. The Bloomberg Barclays U.S. Aggregate Bond® Index is an unmanaged index which represents the U.S. investment grade bond market. References to an index over a specific period are provided for your information only and should not be considered indicative of an investment in the Insight Investment Grade Bond Fund. Note that an index is unmanaged and the information contained herein does not reflect any investment management fees or transaction costs. It is impossible to invest directly in an index.
All mutual fund investing involves risk, including possible loss of principal. The Fund is subject to the risks of the fixed-income securities in its portfolio such as credit, prepayment and interest rate risk. As interest rates rise, the value of bond prices will decline and an investor may lose money.
2
INSIGHT INVESTMENT GRADE BOND FUND
Fund Expense Disclosure
October 31, 2017
(Unaudited)
As a shareholder of the Fund, you incur two types of costs: (1) transaction costs, including redemption fees; and (2) ongoing costs, including management fees and other Fund expenses. This example is intended to help you understand your ongoing costs (in dollars) of investing in the Fund and to compare these costs with the ongoing costs of investing in other mutual funds.
This example is based on an investment of $1,000 invested at the beginning of the six month period from May 1, 2017 through October 31, 2017 and held for the entire period.
Actual Expenses
The first line of the accompanying table provides information about actual account values and actual expenses. You may use the information in this line, together with the amount you invested, to estimate the expenses that you paid over the period. Simply divide your account value by $1,000 (for example, an $8,600 account value divided by $1,000 = 8.6), then multiply the result by the number in the first line under the heading entitled “Expenses Paid During Period” to estimate the expenses you paid on your account during this period.
Hypothetical Example for Comparison Purposes
The second line of the accompanying table provides information about hypothetical account values and hypothetical expenses based on the Fund’s actual expense ratio and an assumed rate of return of 5% per year before expenses, which is not your Fund��s actual return. The hypothetical account values and expenses may not be used to estimate the actual ending account balance or expenses you paid for the period. You may use this information to compare the ongoing costs of investing in the Fund and other funds. To do so, compare this 5% hypothetical example with the 5% hypothetical examples that appear in the shareholder reports of other funds.
Please note that the expenses shown in the accompanying table are meant to highlight your ongoing costs only and do not reflect any transactional costs, such as redemption fees. Therefore, the second line of the accompanying table is useful in comparing ongoing costs only, and will not help you determine the relative total costs of owning different funds. In addition, if these transactional costs were included, your costs would have been higher.
| Insight Investment Grade Bond Fund | |||||||||||||||
| Beginning Account Value May 1, 2017 | Ending Account Value October 31, 2017 | Expenses Paid During Period* | |||||||||||||
Institutional Class | |||||||||||||||
Actual | $ | 1,000.00 | $ | 1,024.20 | $ | 4.34 | |||||||||
Hypothetical (5% return before expenses) | 1,000.00 | 1,020.92 | 4.33 | ||||||||||||
| * | Expenses are equal to an annualized expense ratio for the six-month period ended October 31, 2017 of 0.85% for the Institutional Class of the Fund, multiplied by the average account value over the period, multiplied by the number of days in the most recent period (184), then divided by 365 to reflect the period. The Fund’s ending account value on the first line in the table is based on the actual six-month total returns for the Fund of 2.42%. |
3
INSIGHT INVESTMENT GRADE BOND FUND
Portfolio Holdings Summary Table
October 31, 2017
(Unaudited)
The following table presents a summary by security type of the portfolio holdings of the Fund:
| % of Net Assets | Value | |||||||||
Corporate Bonds and Notes | 47.1 | % | $ | 19,672,949 | ||||||
Asset Backed Securities | 18.4 | 7,691,813 | ||||||||
Registered Investment Company | 16.2 | 6,769,367 | ||||||||
Residential Mortgage-Backed Securities | 12.8 | 5,347,057 | ||||||||
U.S. Treasury Obligations | 12.5 | 5,209,959 | ||||||||
Commercial Mortgage-Backed Securities | 4.6 | 1,939,186 | ||||||||
Preferred Stock | 1.3 | 561,600 | ||||||||
Municipal Bonds | 1.0 | 416,227 | ||||||||
Liabilities in excess of Other assets | (13.9 | ) | (5,816,500 | ) | ||||||
|
|
|
| |||||||
NET ASSETS | 100.0 | % | $ | 41,791,658 | ||||||
|
|
|
| |||||||
Portfolio holdings are subject to change at any time.
The accompanying notes are an integral part of the financial statements.
4
INSIGHT INVESTMENT GRADE BOND FUND
Portfolio of Investments
October 31, 2017
(Unaudited)
| Moody’s/ Standard & Poor’s Rating(a) | Principal Amount (000’s) | Value | ||||||||||
CORPORATE BONDS AND NOTES — 47.1% | ||||||||||||
Agriculture — 0.5% | ||||||||||||
Reynolds American, Inc., Co. Gty., 4.45%, 06/12/25 (b) | Baa2/BBB+ | $ | 180 | $ | 193,747 | |||||||
|
| |||||||||||
Airlines — 2.2% | ||||||||||||
American Airlines 2013-2 Class B Pass Through Trust, 5.60%, 01/15/22 144A(c) | NR/BBB- | 301 | 314,758 | |||||||||
American Airlines 2017-1 Class AA Pass Through Trust, 3.65%, 08/15/30 | Aa3/NR | 200 | 206,500 | |||||||||
American Airlines 2017-2 Class AA Pass Through Trust, 3.35%, 04/15/31 | Aa3/NR | 288 | 289,440 | |||||||||
British Airways 2013-1 Class B Pass Through Trust, 5.625%, 12/20/21 144A(c) | A3/BBB+ | 116 | 120,476 | |||||||||
|
| |||||||||||
| 931,174 | ||||||||||||
|
| |||||||||||
Automobiles & Components — 0.7% | ||||||||||||
Ford Motor Credit Co., LLC, Sr. Unsec. Notes, 2.343%, 11/02/20 | Baa2/BBB | 313 | 312,782 | |||||||||
|
| |||||||||||
Beverages — 1.0% | ||||||||||||
Anheuser-Busch InBev Finance, Inc., Co. Gty., 3.70%, 02/01/24 | A3/A- | 145 | 151,812 | |||||||||
Anheuser-Busch InBev Finance, Inc., Co. Gty., 4.70%, 02/01/36 (b) | A3/A- | 115 | 125,909 | |||||||||
Anheuser-Busch InBev Finance, Inc., Co. Gty., 4.90%, 02/01/46 (b) | A3/A- | 138 | 155,196 | |||||||||
|
| |||||||||||
| 432,917 | ||||||||||||
|
| |||||||||||
Diversified Financial Services — 12.7% | ||||||||||||
Bank of America Corp., Sr. Unsec. Notes, 5.875%, 01/05/21 | Baa1/BBB+ | 320 | 353,481 | |||||||||
Bank of America Corp., Sub. Notes, 4.45%, 03/03/26 | Baa3/BBB | 118 | 125,461 | |||||||||
Bank of Nova Scotia (The), Jr. Sub. Notes, 3-M LIBOR + 2.648%, 4.65%, 10/12/22 (b)(d)(e) | Baa3/BBB- | 106 | 106,530 | |||||||||
Barclays PLC, Sub. Notes, 4.836%, 05/09/28 (b) | Baa3/BB+ | 305 | 318,166 | |||||||||
Citigroup, Inc., Sr. Unsec. Notes, 3-M LIBOR + 1.43%, 2.746%, 09/01/23 (b)(d) | Baa1/BBB+ | 203 | 208,464 | |||||||||
Citigroup, Inc., Sr. Unsec. Notes, 3-M LIBOR + 1.563%, 3.887%, 01/10/28 (b)(d) | Baa1/BBB+ | 200 | 206,142 | |||||||||
Citigroup, Inc., Sub. Notes, 4.60%, 03/09/26 | Baa3/BBB | 181 | 192,919 | |||||||||
Citigroup, Inc., Sub. Notes, 5.30%, 05/06/44 | Baa3/BBB | 174 | 204,055 | |||||||||
GE Capital International Funding Co., Co. Gty., 2.342%, 11/15/20 | A1/AA- | 215 | 216,064 | |||||||||
Goldman Sachs Group, Inc. (The), Sr. Unsec. Notes, 3.50%, 11/16/26 (b) | A3/BBB+ | 182 | 182,256 | |||||||||
Goldman Sachs Group, Inc. (The), Sr. Unsec. Notes, 3-M LIBOR + 1.75%, 3.128%, 10/28/27 (b)(d) | A3/BBB+ | 250 | 263,652 | |||||||||
HSBC Capital Funding LP/Jersey Channel Islands, Ltd., Co. Gty., 3-M LIBOR + 4.98%, 10.176%, 06/30/30 144A(b)(d)(e) | Baa2/BBB- | 325 | 519,389 | |||||||||
Intesa Sanpaolo SpA., Co. Gty., 3.875%, 01/15/19 | Baa1/BBB | 200 | 203,911 | |||||||||
JPMorgan Chase & Co., Jr. Sub. Notes, 3-M LIBOR + 2.58%, 4.625%, 11/01/22 (b)(d)(e) | Baa3/NR | 211 | 209,106 | |||||||||
JPMorgan Chase & Co., Jr. Sub. Notes, 3-M LIBOR + 3.47%, 7.90%, 04/30/18 (b)(d)(e) | Baa3/BBB- | 387 | 396,868 | |||||||||
JPMorgan Chase & Co., Sr. Unsec. Notes, 2.70%, 05/18/23 (b) | A3/A- | 260 | 259,545 | |||||||||
Morgan Stanley, Sr. Unsec. Notes, 5.50%, 07/24/20 | A3/BBB+ | 425 | 461,165 | |||||||||
Morgan Stanley, Sr. Unsec. Notes, 4.30%, 01/27/45 | A3/BBB+ | 40 | 42,179 | |||||||||
Nasdaq Inc., Sr. Unsec. Notes, 3.85%, 06/30/26 (b) | Baa2/BBB | 238 | 245,792 | |||||||||
SAFG Retirement Services, Inc., Sr. Unsec. Notes, 8.125%, 04/28/23 | Baa1/BBB+ | 145 | 178,133 | |||||||||
Santander UK PLC, Sr. Unsec. Notes, 3-M LIBOR + 0.30%, 1.685%, 11/03/20 (d) | Aa3/A | 216 | 215,904 | |||||||||
Synchrony Financial, Sr. Unsec. Notes, 2.60%, 01/15/19 (b) | NR/BBB- | 164 | 164,915 | |||||||||
Trinity Acquisition PLC, Co. Gty., 4.40%, 03/15/26 (b) | Baa3/BBB | 43 | 45,882 | |||||||||
|
| |||||||||||
| 5,319,979 | ||||||||||||
|
| |||||||||||
The accompanying notes are an integral part of the financial statements.
5
INSIGHT INVESTMENT GRADE BOND FUND
Portfolio of Investments (Continued)
October 31, 2017
(Unaudited)
| Moody’s/ Standard & Poor’s Rating(a) | Principal Amount (000’s) | Value | ||||||||
CORPORATE BONDS AND NOTES — (Continued) | ||||||||||
Energy — 3.6% | ||||||||||
Andeavor, Co. Gty., 4.75%, 12/15/23 144A(b) | Baa3/BBB- | $ | 53 | $ | 57,324 | |||||
BG Energy Capital PLC, Co. Gty., USSW5 + 5.439%, 6.50%, 11/30/72 (b)(d) | NR/A- | 300 | 300,941 | |||||||
Cimarex Energy Co., 3.90%, 05/15/27 (b) | Baa3/BBB- | 75 | 77,290 | |||||||
CITGO Petroleum Corp., Sr. Sec. Notes, 6.25%, 08/15/22 144A(b) | B3/B+ | 204 | 209,610 | |||||||
EnLink Midstream Partners LP, Jr. Sub. Notes, 3-M LIBOR + 4.11%, 6.00%, | Ba3/BB | 79 | 79,610 | |||||||
Marathon Petroleum Corp., Sr. Unsec. Notes, 4.75%, 09/15/44 (b) | Baa2/BBB | 118 | 119,951 | |||||||
McDermott International, Inc., Sec. Notes, 8.00%, 05/01/21 144A(b) | B2/BB- | 127 | 131,128 | |||||||
Petrobras Global Finance BV, Co. Gty., 7.375%, 01/17/27 | Ba3/BB- | 50 | 55,525 | |||||||
Petroleos Mexicanos, Co. Gty., 6.75%, 09/21/47 144A | NR/BBB+ | 205 | 211,294 | |||||||
Rice Energy, Inc., Co. Gty., 7.25%, 05/01/23 (b) | B3/BB- | 122 | 131,328 | |||||||
Williams Partners LP, Sr. Unsec. Notes, 4.30%, 03/04/24 (b) | Baa3/BBB | 80 | 84,724 | |||||||
Williams Partners LP, Sr. Unsec. Notes, 4.00%, 09/15/25 (b) | Baa3/BBB | 35 | 36,148 | |||||||
|
| |||||||||
| 1,494,873 | ||||||||||
|
| |||||||||
Food — 1.0% | ||||||||||
Kroger Co. (The), Sr. Unsec. Notes, 3.70%, 08/01/27 (b) | Baa1/BBB | 184 | 182,882 | |||||||
McDonald’s Corp., Sr. Unsec. Notes, 3.70%, 01/30/26 (b) | Baa1/BBB+ | 26 | 27,177 | |||||||
Rite Aid Corp., Co. Gty., 6.125%, 04/01/18 144A(b) | B3/B- | 215 | 199,950 | |||||||
|
| |||||||||
| 410,009 | ||||||||||
|
| |||||||||
Healthcare — 0.3% | ||||||||||
Allergan Funding SCS, Co. Gty., 4.75%, 03/15/45 (b) | Baa3/BBB | 11 | 11,604 | |||||||
Mylan NV, Co. Gty., 3.95%, 06/15/26 (b) | Baa3/BBB- | 69 | 68,919 | |||||||
Mylan NV, Co. Gty., 5.25%, 06/15/46 (b) | Baa3/BBB- | 30 | 31,493 | |||||||
Valeant Pharmaceuticals International, Inc., Sr. Sec. Notes, 5.50%, 11/01/20 144A(b) | Ba3/BB- | 17 | 17,382 | |||||||
|
| |||||||||
| 129,398 | ||||||||||
|
| |||||||||
Industrial — 2.6% | ||||||||||
ERAC USA Finance LLC, Co. Gty., 4.50%, 02/15/45 144A(b) | Baa1/BBB+ | 215 | 215,546 | |||||||
General Electric Capital Corp., Sub. Notes, 5.30%, 02/11/21 | A2/A+ | 75 | 82,177 | |||||||
General Electric Co., Jr. Sub. Notes, 3-M LIBOR + 3.33%, 5.00%, 01/21/21 (b)(d)(e) | A3/A | 437 | 456,119 | |||||||
Heathrow Funding Ltd., Sr. Sec. Notes, 4.875%, 07/15/21 144A | NR/A- | 100 | 107,401 | |||||||
Sydney Airport Finance Co. Pty Ltd., Sr. Sec. Notes, 3.375%, 04/30/25 144A(b) | Baa2/BBB | 70 | 70,298 | |||||||
United Technologies Corp., Sr. Unsec. Notes, 1.50%, 11/01/19 | A3/A- | 139 | 137,969 | |||||||
|
| |||||||||
| 1,069,510 | ||||||||||
|
| |||||||||
Insurance — 7.2% | ||||||||||
Allstate Corp. (The), Jr. Sub. Notes, 3-M LIBOR + 2.12%, 6.50%, 05/15/57 (b)(d) | Baa1/BBB | 325 | 388,375 | |||||||
American Financial Group, Inc., Sr. Unsec. Notes, 9.875%, 06/15/19 | Baa1/BBB+ | 130 | 145,284 | |||||||
American International Group, Inc., Jr. Sub. Notes, 3-M LIBOR + 4.195%, 8.175%, 05/15/58 (b)(d) | Baa2/BBB- | 325 | 443,625 | |||||||
Brighthouse Financial, Inc., Co. Gty., 4.70%, 06/22/47 144A(b) | Baa3/BBB+ | 192 | 190,090 | |||||||
Chubb Corp. (The), Co. Gty., 3-M LIBOR + 2.25%, 3.609%, 03/29/67 (b)(d) | Baa1/BBB+ | 208 | 206,960 | |||||||
Liberty Mutual Group, Inc., Co. Gty., 3-M LIBOR + 2.905%, 4.225%, 03/15/37 144A(b)(d) | Baa3/BB+ | 421 | 412,580 | |||||||
Massachusetts Mutual Life Insurance Co., 4.90%, 04/01/77 144A | NR/AA- | 179 | 197,670 | |||||||
The accompanying notes are an integral part of the financial statements.
6
INSIGHT INVESTMENT GRADE BOND FUND
Portfolio of Investments (Continued)
October 31, 2017
(Unaudited)
| Moody’s/ Standard & Poor’s Rating(a) | Principal Amount (000’s) | Value | ||||||||
CORPORATE BONDS AND NOTES — (Continued) | ||||||||||
Insurance — (Continued) | ||||||||||
MetLife, Inc., 6.40%, 12/15/66 (b) | Baa2/BBB | $ | 216 | $ | 249,210 | |||||
Pricoa Global Funding I, Sec. Notes, 2.45%, 09/21/22 144A | A1/AA- | 150 | 149,614 | |||||||
Principal Financial Group, Inc., Co. Gty., 3.10%, 11/15/26 (b) | Baa1/BBB+ | 195 | 194,250 | |||||||
Prudential Financial, Inc., Jr. Sub. Notes, 3-M LIBOR + 3.04%, 5.20%, 03/15/44 (b)(d) | Baa2/BBB+ | 400 | 426,520 | |||||||
|
| |||||||||
| 3,004,178 | ||||||||||
|
| |||||||||
Lodging — 0.4% | ||||||||||
Wyndham Worldwide Corp., 4.50%, 04/01/27 (b) | Baa3/BBB- | 181 | 184,885 | |||||||
|
| |||||||||
Media — 3.9% | ||||||||||
CCO Holdings LLC / CCO Holdings Capital Corp., Sr. Unsec. Notes, | B1/BB | 94 | 98,277 | |||||||
Charter Communications Operating, LLC / Charter Communications Operating Capital., Sr. Sec. Notes, 4.464%, 07/23/22 (b) | Ba1/BBB- | 220 | 232,336 | |||||||
Comcast Corp., Co. Gty., 3.30%, 02/01/27 (b) | A3/A- | 203 | 205,680 | |||||||
Discovery Communications, LLC, Co. Gty., 5.00%, 09/20/37 (b) | Baa3/BBB- | 68 | 70,105 | |||||||
Grupo Televisa SAB, Sr. Unsec. Notes, 5.00%, 05/13/45 (b) | Baa1/BBB+ | 200 | 199,604 | |||||||
Numericable-SFR SAS, Sr. Sec. Notes, 6.25%, 05/15/24 144A(b) | B1/B+ | 250 | 261,875 | |||||||
Sirius XM Radio, Inc., Co. Gty., 5.00%, 08/01/27 144A(b) | Ba3/BB | 94 | 94,822 | |||||||
VTR Finance BV, Sr. Sec. Notes, 6.875%, 01/15/24 144A(b) | B1/B+ | 425 | 450,606 | |||||||
|
| |||||||||
| 1,613,305 | ||||||||||
|
| |||||||||
Mining — 1.8% | ||||||||||
BHP Billiton Finance USA Ltd., Co. Gty., USSW5 + 5.093%, 6.75%, 10/19/75 144A(b)(d) | Baa2/BBB+ | 200 | 235,500 | |||||||
First Quantum Minerals Ltd., Co. Gty., 7.25%, 04/01/23 144A(b) | B3/B- | 200 | 211,500 | |||||||
FMG Resources August 2006 Pty Ltd., Co. Gty., 4.75%, 05/15/22 144A(b) | Ba2/BB | 20 | 20,400 | |||||||
Steel Dynamics, Inc., Co. Gty., 4.125%, 09/15/25 144A(b) | Ba1/BB+ | 3 | 3,008 | |||||||
Teck Resources Ltd., Co. Gty., 5.20%, 03/01/42 (b) | Ba3/BB+ | 296 | 296,740 | |||||||
|
| |||||||||
| 767,148 | ||||||||||
|
| |||||||||
Pipe Lines Ex Natural Gas — 2.2% | ||||||||||
Enbridge, Inc., Sr. Unsec. Notes, 5.50%, 12/01/46 (b) | Baa2/BBB+ | 136 | 160,114 | |||||||
Enterprise Products Operating LLC, Co. Gty., 3-M LIBOR + 2.68%, 7.034%, 01/15/68 (b)(d) | Baa2/BBB- | 211 | 211,000 | |||||||
IFM US Colonial Pipeline 2 LLC, Sr. Sec. Notes, 6.45%, 05/01/21 144A(b) | NR/BB+ | 175 | 192,467 | |||||||
Kinder Morgan Energy Partners LP, Co. Gty., 9.00%, 02/01/19 | Baa3/BBB- | 130 | 140,905 | |||||||
MPLX LP, 5.20%, 03/01/47 (b) | Baa3/BBB- | 117 | 125,266 | |||||||
Spectra Energy Partners LP, Sr. Unsec. Notes, 3.375%, 10/15/26 (b) | Baa2/BBB+ | 97 | 96,542 | |||||||
|
| |||||||||
| 926,294 | ||||||||||
|
| |||||||||
Technology — 1.4% | ||||||||||
j2 Cloud Services, LLC / j2 Global Co-Obligor, Inc., Co. Gty., 6.00%, 07/15/25 144A(b) | Ba3/BB | 100 | 105,250 | |||||||
NXP BV / NXP Funding, LLC, Sr. Unsec. Notes, 3.875%, 09/01/22 144A | Ba1/BBB- | 448 | 465,360 | |||||||
|
| |||||||||
| 570,610 | ||||||||||
|
| |||||||||
Telecommunications — 1.2% | ||||||||||
AT&T, Inc., Sr. Unsec. Notes, 4.50%, 05/15/35 (b) | Baa1/BBB+ | 300 | 292,419 | |||||||
AT&T, Inc., Sr. Unsec. Notes, 4.75%, 05/15/46 (b) | Baa1/BBB+ | 70 | 66,029 | |||||||
The accompanying notes are an integral part of the financial statements.
7
INSIGHT INVESTMENT GRADE BOND FUND
Portfolio of Investments (Continued)
October 31, 2017
(Unaudited)
| Moody’s/ Standard & Poor’s Rating(a) | Principal Amount (000’s) | Value | ||||||||
CORPORATE BONDS AND NOTES — (Continued) | ||||||||||
Telecommunications — (Continued) | ||||||||||
Verizon Communications, Inc., Sr. Unsec. Notes, 5.012%, 08/21/54 | Baa1/BBB+ | $ | 60 | $ | 59,959 | |||||
Verizon Communications, Inc., Sr. Unsec. Notes, 4.672%, 03/15/55 | Baa1/BBB+ | 72 | 68,424 | |||||||
|
| |||||||||
| 486,831 | ||||||||||
|
| |||||||||
Utilities — 4.4% | ||||||||||
Black Hills Corp., Sr. Unsec. Notes, 4.25%, 11/30/23 (b) | Baa2/BBB | 100 | 106,660 | |||||||
Black Hills Corp., Sr. Unsec. Notes, 3.95%, 01/15/26 (b) | Baa2/BBB | 193 | 201,109 | |||||||
Cleveland Electric Illuminating Co. (The), Sr. Unsec. Notes, 3.50%, 01/01/28 144A(b) | Baa3/BBB- | 150 | 150,371 | |||||||
Duquesne Light Holdings, Inc., Sr. Unsec. Notes, 6.40%, 09/15/20 144A | Baa3/BBB- | 163 | 180,261 | |||||||
Electricite de France SA, Jr. Sub. Notes, USSW10 + 3.709%, | Baa3/BB | 208 | 216,580 | |||||||
Enel Finance International NV, Co. Gty., 2.75%, 04/06/23 144A | Baa2/BBB | 200 | 198,567 | |||||||
Exelon Corp., Sr. Unsec. Notes, 3.40%, 04/15/26 (b) | Baa2/BBB- | 91 | 91,629 | |||||||
FirstEnergy Corp., Sr. Unsec. Notes, 4.85%, 07/15/47 (b) | Baa3/BB+ | 79 | 85,166 | |||||||
IPALCO Enterprises, Inc., Sr. Sec. Notes, 3.70%, 09/01/24 144A(b) | Baa3/BB+ | 103 | 103,266 | |||||||
Kansas City Power & Light Co., Sr. Unsec. Notes, 4.20%, 06/15/47 (b) | Baa1/BBB+ | 167 | 174,252 | |||||||
Southern Co. Gas Capital Corp., Co. Gty., 3.95%, 10/01/46 (b) | Baa1/A- | 98 | 95,838 | |||||||
Southern Co. Gas Capital Corp., Co. Gty., 4.40%, 05/30/47 (b) | Baa1/A- | 211 | 221,610 | |||||||
|
| |||||||||
| 1,825,309 | ||||||||||
|
| |||||||||
TOTAL CORPORATE BONDS AND NOTES (Cost $18,909,267) | 19,672,949 | |||||||||
|
| |||||||||
ASSET BACKED SECURITIES — 18.4% | ||||||||||
AmeriCredit Automobile Receivables Trust, Series 2015-4, Class A3, | NR/AAA | 141 | 141,161 | |||||||
Antares CLO 2017-1 Ltd., Class B, 3-M LIBOR + 2.40%, 3.636%, 07/20/28 144A(b)(c)(d) | NR/AA | 275 | 277,082 | |||||||
Arbor Realty Commercial Real Estate Notes Ltd., Series 2017-FL2, Class A, 1-M LIBOR + 0.99%, 2.349%, 08/15/27 144A(b)(d) | Aaa/NR | 213 | 212,932 | |||||||
BCC Funding XIII, LLC, Series 2016-1, Class A2, 2.20%, 12/20/21 144A(b)(c) | Aa2/NR | 296 | 295,428 | |||||||
Carlyle Global Market Strategies CLO Ltd., Series 2014-3A, Class B, 3-M LIBOR + 2.15%, 3.524%, 07/27/26 144A(b)(c)(d) | A1/NR | 500 | 504,500 | |||||||
Chase Issuance Trust, Series 2015-A2, Class A2, 1.59%, 02/18/20 (b) | Aaa/AAA | 440 | 440,212 | |||||||
CPS Auto Receivables Trust, Series 2015-B, Class A, 1.65%, 11/15/19 144A(b) | NR/AAA | 28 | 28,378 | |||||||
CPS Auto Receivables Trust, Series 2015-C, Class B, 2.55%, 02/18/20 144A(b) | NR/AAA | 175 | 175,448 | |||||||
CPS Auto Trust, Series 2016-D, Class B, 2.11%, 03/15/21 144A(b) | NR/AA | 281 | 280,234 | |||||||
DB Master Finance, LLC, Series 2017-1A, Class A2I, 3.629%, 11/20/47 144A(b) | NR/BBB | 62 | 62,329 | |||||||
DRB Prime Student Loan Trust 2016-B, Class A2, 2.89%, 06/25/40 144A(b) | Aaa/NR | 83 | 82,784 | |||||||
DRB Prime Student Loan Trust 2017-A, Class A2B, 2.85%, 05/27/42 144A(b) | Aaa/NR | 387 | 386,468 | |||||||
Drive Auto Receivables Trust, Series 2016-CA, Class B, 2.37%, 11/16/20 144A(b) | Aaa/AA | 121 | 121,367 | |||||||
DT Auto Owner Trust, Series 2016-1A, Class B, 2.79%, 05/15/20 144A(b) | NR/AA | 74 | 73,963 | |||||||
DT Auto Owner Trust, Series 2017-3A, Class B, 2.40%, 05/17/21 144A(b) | NR/AA | 120 | 119,984 | |||||||
Flagship Credit Auto Trust, Series 2016-1, Class A, 2.77%, 12/15/20 144A(b) | NR/AAA | 95 | 95,388 | |||||||
Golub Capital Partners CLO 19B-R Ltd., Class A2, 3-M LIBOR + 1.80%, 3.171%, 07/26/29 144A(b)(c)(d) | Aa2/NR | 340 | 339,657 | |||||||
Greystone Commercial Real Estate Notes 2017-FL1 Ltd., Class A, 1-M LIBOR + 1.55%, 2.789%, 03/15/27 144A(b)(c)(d) | Aaa/NR | 100 | 100,794 | |||||||
The accompanying notes are an integral part of the financial statements.
8
INSIGHT INVESTMENT GRADE BOND FUND
Portfolio of Investments (Continued)
October 31, 2017
(Unaudited)
| Moody’s/ Standard & Poor’s Rating(a) | Principal Amount (000’s) | Value | ||||||||||
ASSET BACKED SECURITIES — (Continued) | ||||||||||||
IVY Hill Middle Market Credit Fund XII Ltd., Class A2, 3-M LIBOR + 2.25%, 3.563%, 07/20/29 144A(b)(c)(d) | Aa2/NR | $ | 340 | $ | 342,744 | |||||||
MVW Owner Trust, Series 2016-1A, Class A, 2.25%, 12/20/33 144A(b) | NR/A+ | 144 | 141,844 | |||||||||
Navistar Financial Dealer Note Master Owner Trust II, Series 2016-1, Class A, 1-M LIBOR + 1.35%, 2.588%, 09/27/21 144A(d) | Aaa/NR | 309 | 311,186 | |||||||||
NextGear Floorplan Master Owner Trust, Class A2, 2.54%, 04/18/22 144A(b) | Aaa/AAA | 265 | 264,829 | |||||||||
North End CLO, Ltd., Series 2013-1A, Class B, 3-M LIBOR + 1.65%, 3.003%, 07/17/25 144A(b)(c)(d) | NR/AA | 1,000 | 990,430 | |||||||||
SMB Private Education Loan Trust, Series 2017-A, Class A2A, 2.88%, 09/15/34 144A(b) | Aaa/AAA | 300 | 301,446 | |||||||||
SMB Private Education Loan Trust, Series 2017-B, Class A2B, 1-M LIBOR + 0.75%, 2.101%, 10/15/35 144A(b)(d) | Aaa/AAA | 154 | 154,000 | |||||||||
Sofi Consumer Loan Program LLC, Series 2017-3, Class A, 2.77%, 05/25/26 144A(b) | NR/AA | 294 | 294,698 | |||||||||
Sofi Professional Loan Program LLC, Series 2017-C, Class B, 3.56%, 07/25/40 144A(b)(d) | NR/A+ | 201 | 199,918 | |||||||||
Spirit Master Funding LLC, Series 2014-2A, Class A, 5.76%, 03/20/41 144A(b)(c) | NR/A+ | 292 | 307,423 | |||||||||
TAL Advantage V LLC, Series 2013-1A, Class A, 2.83%, 02/22/38 144A(b) | NR/A | 225 | 222,991 | |||||||||
TAL Advantage V LLC, Series 2014-2A, Class A1, 1.70%, 05/20/39 144A(b) | NR/A | 13 | 12,771 | |||||||||
Textainer Marine Containers V Ltd., Series 2017-1A, Class A, 3.72%, 05/20/42 144A(b) | NR/A | 123 | 124,548 | |||||||||
Triton Container Finance IV, LLC, Series 2017-2A, Class A, 3.62%, 08/20/42 144A(b) | NR/A | 40 | 40,891 | |||||||||
VSE VOI Mortgage LLC, Series 2016-A, Class A, 2.54%, 07/20/33 144A(b) | NR/A+ | 245 | 243,985 | |||||||||
|
| |||||||||||
TOTAL ASSET BACKED SECURITIES (Cost $7,686,319) | 7,691,813 | |||||||||||
|
| |||||||||||
COMMERCIAL MORTGAGE-BACKED SECURITIES — 4.6% | ||||||||||||
CGMS Commercial Mortgage Trust, Series 2017-MDRB, Class A, 1-M LIBOR + 1.10% 2.339%, 07/15/30 144A(d) | NR/AAA | 50 | 49,867 | |||||||||
Citigroup Commercial Mortgage Trust, Series 2013-375P, Class D, 3.518%, 05/10/35 144A(d) | Baa1/NR | 350 | 353,019 | |||||||||
Citigroup Commercial Mortgage Trust, Series 2016-P6, Class C, 4.287%, 12/10/49(b)(d) | NR/NR | 67 | 68,196 | |||||||||
FREMF Mortgage Trust, Series 2015-K44, Class B, 3.684%, 01/25/48 144A(b)(d) | NR/NR | 90 | 91,140 | |||||||||
Latitude Management Real Estate Investors, Inc., Series 2016-CRE2, Class A, 1-M LIBOR + 1.70%, 2.939%, 11/24/31 144A(b)(c)(d) | Aaa/NR | 125 | 125,762 | |||||||||
Morgan Stanley Bank of America Merrill Lynch Trust, Series 2012-CKSV, Class C, 4.288%, 10/15/30 144A(d) | NR/A | 540 | 544,499 | |||||||||
MSDB Trust, Series 2017-712F, Class C, 3.628%, 07/11/39 144A(d) | NR/A- | 31 | 31,273 | |||||||||
Wells Fargo Commercial Mortgage Trust, Series 2014-TISH, Class SCH2, 1-M LIBOR + 3.50%, 4.739%, 01/15/27 144A(c)(d) | NR/BB | 450 | 450,283 | |||||||||
Wells Fargo Commercial Mortgage Trust, Series 2014-TISH, Class WTS2, 1-M LIBOR + 3.25%, 4.489%, 02/15/27 144A(c)(d) | NR/BB | 225 | 225,147 | |||||||||
|
| |||||||||||
TOTAL COMMERCIAL MORTGAGE-BACKED SECURITIES (Cost $1,915,681) | 1,939,186 | |||||||||||
|
| |||||||||||
RESIDENTIAL MORTGAGE-BACKED SECURITIES — 12.8% | ||||||||||||
FHLMC Gold Pool TBA, 3.50%, 08/01/47 | Aaa/AA+ | 550 | 565,404 | |||||||||
FNMA Pool TBA, 2.50%, 04/25/29 | Aaa/AA+ | 1,430 | 1,436,480 | |||||||||
FNMA Pool TBA, 4.00%, 08/01/47 | Aaa/AA+ | 1,310 | 1,374,988 | |||||||||
FNMA Pool TBA, 3.00%, 08/01/47 | Aaa/AA+ | 870 | 870,476 | |||||||||
GNMA Pool TBA, 3.50%, 12/20/44 | Aaa/AA+ | 1,060 | 1,099,709 | |||||||||
|
| |||||||||||
TOTAL RESIDENTIAL MORTGAGE-BACKED SECURITIES (Cost $5,351,406) | 5,347,057 | |||||||||||
|
| |||||||||||
The accompanying notes are an integral part of the financial statements.
9
INSIGHT INVESTMENT GRADE BOND FUND
Portfolio of Investments (Continued)
October 31, 2017
(Unaudited)
| Moody’s/ Standard & Poor’s Rating(a) | Principal Amount (000’s) | Value | ||||||||||
MUNICIPAL BONDS — 1.0% | ||||||||||||
State of California, Build America Bonds, GO, 7.55%, 04/01/39 | Aa3/AA- | $ | 270 | $ | 416,227 | |||||||
|
| |||||||||||
TOTAL MUNICIPAL BONDS (Cost $380,141) | 416,227 | |||||||||||
|
| |||||||||||
U.S. TREASURY OBLIGATIONS — 12.5% | ||||||||||||
United States Treasury Inflation Indexed Bond, 0.75%, 02/15/45 | Aaa/AA+ | 382 | 364,819 | |||||||||
United States Treasury Inflation Indexed Bond, 1.00%, 02/15/46 | Aaa/AA+ | 119 | 121,141 | |||||||||
United States Treasury Note, 1.625%, 08/31/22 | Aaa/AA+ | 271 | 266,377 | |||||||||
United States Treasury Note, 1.875%, 09/30/22 | Aaa/AA+ | 74 | 73,815 | |||||||||
United States Treasury Note, 1.875%, 08/31/24 | Aaa/AA+ | 526 | 515,070 | |||||||||
United States Treasury Note, 2.125%, 09/30/24 | Aaa/AA+ | 710 | 706,004 | |||||||||
United States Treasury Note, 2.25%, 08/15/27 | Aaa/AA+ | 2,391 | 2,364,662 | |||||||||
United States Treasury Note, 2.75%, 08/15/47 | Aaa/AA+ | 819 | 798,071 | |||||||||
|
| |||||||||||
TOTAL U.S. TREASURY OBLIGATIONS (Cost $5,238,989) | 5,209,959 | |||||||||||
|
| |||||||||||
Number of Shares | ||||||||||||
PREFERRED STOCK — 1.3% | ||||||||||||
Diversified Financial Services — 1.3% | ||||||||||||
CoBank ACB, 6.25%(b)(d)(e) | NR/BBB+ | 5,200 | 561,600 | |||||||||
|
| |||||||||||
TOTAL PREFERRED STOCK (Cost $542,100) | 561,600 | |||||||||||
|
| |||||||||||
REGISTERED INVESTMENT COMPANY — 16.2% | ||||||||||||
BlackRock Liquidity Funds Fedfund Portfolio, Institutional Shares, 0.94%(f) | Aaa/AA+ | 6,769,367 | 6,769,367 | |||||||||
|
| |||||||||||
TOTAL REGISTERED INVESTMENT COMPANY (Cost $6,769,367) | 6,769,367 | |||||||||||
|
| |||||||||||
TOTAL INVESTMENTS - 113.9% (Cost $46,793,270) | 47,608,158 | |||||||||||
LIABILITIES IN EXCESS OF OTHER ASSETS - (13.9)% | (5,816,500 | ) | ||||||||||
|
| |||||||||||
NET ASSETS - 100.0% | $ | 41,791,658 | ||||||||||
|
| |||||||||||
| (a) | Ratings for debt securities are unaudited. All ratings are as of October 31, 2017 and may have changed subsequently. |
| (b) | This security is callable. |
| (c) | Security is deemed illiquid at October 31, 2017. |
| (d) | Floating or variable rate security. Rate disclosed is as of October 31, 2017. Certain variable rate securities are not based on a published reference rate and spread but are determined by the issuer or agent and are based on current market conditions. These securities do not indicate a reference rate and spread in their description. |
| (e) | Security is perpetual. Date shown is next call date. |
| (f) | Rate periodically changes. Rate disclosed is the daily yield on October 31, 2017. |
144A Securities were purchased pursuant to Rule 144A under the Securities Act of 1933 and may not be resold subject to that rule except to qualified institutional buyers. At October 31, 2017, these securities amounted to $15,094,050 or 36.1% of net assets. These securities have been determined by the Adviser to be liquid securities, unless otherwise noted.
The accompanying notes are an integral part of the financial statements.
10
INSIGHT INVESTMENT GRADE BOND FUND
Portfolio of Investments (Concluded)
October 31, 2017
(Unaudited)
Legend | ||
CLO | Collateralized Loan Obligation | |
Co. Gty. | Company Guaranty | |
FHLMC | Federal Home Loan Mortgage Corp. | |
FNMA | Federal National Mortgage Association | |
FREMF | Federal Home Loan Mortgage Corp. (Multi-Family) | |
GNMA | Government National Mortgage Association | |
GO | General Obligations | |
Jr. | Junior | |
LIBOR | London Interbank Offered Rate | |
LLC | Limited Liability Company | |
LP | Limited Partnership | |
Ltd. | Limited | |
NR | Not Rated | |
PLC | Public Limited Company | |
Sec. | Secured | |
Sr. | Senior | |
Sub. | Subordinated | |
TBA | To Be Announced | |
Unsec. | Unsecured | |
USSW5 | USD Swap Semi 30/360 5 Year | |
USSW10 | USD Swap Semi 30/360 10 Year | |
1-M | One Month | |
3-M | Three Months |
The accompanying notes are an integral part of the financial statements.
11
INSIGHT INVESTMENT GRADE BOND FUND
Statement of Assets and Liabilities
October 31, 2017
(Unaudited)
Assets | ||||
Investments, at value (Cost $46,793,270) | $ | 47,608,158 | ||
Receivable for investments sold | 619,200 | |||
Dividends and interest receivable | 301,609 | |||
Prepaid expenses and other assets | 10,494 | |||
|
| |||
Total assets | 48,539,461 | |||
|
| |||
Liabilities | ||||
Payable for investments purchased | 6,650,975 | |||
Payable for administration and accounting fees | 38,349 | |||
Payable for transfer agent fees | 8,798 | |||
Payable for custodian fees | 3,248 | |||
Payable to Investment Adviser | 2,909 | |||
Payable for legal fees | 2,040 | |||
Accrued expenses | 41,484 | |||
|
| |||
Total liabilities | 6,747,803 | |||
|
| |||
Net Assets | $ | 41,791,658 | ||
|
| |||
Net Assets consisted of: | ||||
Capital stock, $0.01 par value | $ | 41,080 | ||
Paid-in capital | 40,755,253 | |||
Accumulated net realized gain from investments | 180,437 | |||
Net unrealized appreciation on investments | 814,888 | |||
|
| |||
Net Assets | $ | 41,791,658 | ||
|
|
Institutional Class: | ||||
Net asset value, offering and redemption price per share ($41,791,658 / 4,108,000 shares) | $10.17 | |||
|
| |||
The accompanying notes are an integral part of the financial statements.
12
INSIGHT INVESTMENT GRADE BOND FUND
Statement of Operations
For the Six Months Ended October 31, 2017
(Unaudited)
Investment income | ||||
Interest | $ | 701,452 | ||
Dividends | 16,250 | |||
|
| |||
Total investment income | 717,702 | |||
|
| |||
Expenses | ||||
Advisory fees (Note 2) | 104,248 | |||
Administration and accounting fees (Note 2) | 47,337 | |||
Audit fees | 29,714 | |||
Transfer agent fees (Note 2) | 26,480 | |||
Legal fees | 16,005 | |||
Trustees’ and officers’ fees (Note 2) | 15,152 | |||
Custodian fees (Note 2) | 14,027 | |||
Printing and shareholder reporting fees | 9,462 | |||
Registration and filing fees | 630 | |||
Other expenses | 5,292 | |||
|
| |||
Total expenses before waivers and reimbursements | 268,347 | |||
|
| |||
Less: waivers and reimbursements (Note 2) | (91,105) | |||
|
| |||
Net expenses after waivers and reimbursements | 177,242 | |||
|
| |||
Net investment income | 540,460 | |||
|
| |||
Net realized and unrealized gain/(loss) from investments: | ||||
Net realized gain from investments | 261,465 | |||
Net change in unrealized appreciation/(depreciation) on investments | 215,719 | |||
|
| |||
Net realized and unrealized gain on investments | 477,184 | |||
|
| |||
Net increase in net assets resulting from operations | $ | 1,017,644 | ||
|
|
The accompanying notes are an integral part of the financial statements.
13
INSIGHT INVESTMENT GRADE BOND FUND
Statements of Changes in Net Assets
| For the Six Months Ended October 31, 2017 (Unaudited) | For the Year Ended April 30, 2017 | |||||||||
Increase/(decrease) in net assets from operations: | ||||||||||
Net investment income | $ | 540,460 | $ | 1,087,908 | ||||||
Net realized gain from investments | 261,465 | 254,523 | ||||||||
Net change in unrealized appreciation/(depreciation) on investments | 215,719 | (80,236 | ) | |||||||
|
|
|
| |||||||
Net increase in net assets resulting from operations | 1,017,644 | 1,262,195 | ||||||||
|
|
|
| |||||||
Less dividends and distributions to shareholders from: | ||||||||||
Net investment income: | ||||||||||
Institutional Class | (540,460 | ) | (1,134,014 | ) | ||||||
|
|
|
| |||||||
Net realized capital gain: | ||||||||||
Institutional Class | — | (208,962 | ) | |||||||
|
|
|
| |||||||
Return of capital: | ||||||||||
Institutional Class | — | (38,751 | ) | |||||||
|
|
|
| |||||||
Net decrease in net assets from dividends and distributions to shareholders | (540,460 | ) | (1,381,727 | ) | ||||||
|
|
|
| |||||||
Increase in net assets derived from capital share transactions (Note 4) | 540,460 | 1,381,727 | ||||||||
|
|
|
| |||||||
Total increase in net assets | 1,017,644 | 1,262,195 | ||||||||
|
|
|
| |||||||
Net assets | ||||||||||
Beginning of period | 40,774,014 | 39,511,819 | ||||||||
|
|
|
| |||||||
End of period | $ | 41,791,658 | $ | 40,774,014 | ||||||
|
|
|
| |||||||
Accumulated net investment income, end of period | $ | — | $ | — | ||||||
|
|
|
| |||||||
The accompanying notes are an integral part of the financial statements.
14
INSIGHT INVESTMENT GRADE BOND FUND
Financial Highlights
Contained below is per share operating performance data for Institutional Class shares outstanding, total investment return, ratios to average net assets and other supplemental data for the respective period. The total returns in the table represent the rate that an investor would have earned or lost on an investment in the Fund (assuming reinvestment of all dividends and distributions). This information has been derived from information provided in the financial statements and should be read in conjunction with the financial statements and the notes thereto.
| Institutional Class | ||||||||||||||||||||||||
| For the Six Months Ended October 31, 2017 (Unaudited) | For the Year Ended April 30, 2017 | For the Year Ended April 30, 2016 | For the Year Ended April 30, 2015 | For the Year Ended April 30, 2014 | For the Year Ended April 30, 2013 | |||||||||||||||||||
Per Share Operating Performance | ||||||||||||||||||||||||
Net asset value, beginning of period | $ | 10.06 | $ | 10.09 | $ | 10.20 | $ | 10.03 | $ | 10.47 | $ | 10.31 | ||||||||||||
|
|
|
|
|
|
|
|
|
|
|
| |||||||||||||
Net investment income(1) | 0.13 | 0.27 | 0.28 | 0.30 | 0.33 | 0.29 | ||||||||||||||||||
Net realized and unrealized gain/(loss) on investments | 0.11 | 0.05 | (0.09 | ) | 0.18 | (0.30 | ) | 0.43 | ||||||||||||||||
|
|
|
|
|
|
|
|
|
|
|
| |||||||||||||
Net increase in net assets resulting from operations | 0.24 | 0.32 | 0.19 | 0.48 | 0.03 | 0.72 | ||||||||||||||||||
|
|
|
|
|
|
|
|
|
|
|
| |||||||||||||
Dividends and distributions to shareholders from: | ||||||||||||||||||||||||
Net investment income | (0.13 | ) | (0.29 | ) | (0.30 | ) | (0.31 | ) | (0.34 | ) | (0.32 | ) | ||||||||||||
Net realized gains | — | (0.05 | ) | — | — | (0.13 | ) | (0.24 | ) | |||||||||||||||
Return of capital | — | (0.01 | ) | — | — | — | — | |||||||||||||||||
|
|
|
|
|
|
|
|
|
|
|
| |||||||||||||
Total dividends and distributions to shareholders | (0.13 | ) | (0.35 | ) | (0.30 | ) | (0.31 | ) | (0.47 | ) | (0.56 | ) | ||||||||||||
|
|
|
|
|
|
|
|
|
|
|
| |||||||||||||
Net asset value, end of period | $ | 10.17 | $ | 10.06 | $ | 10.09 | $ | 10.20 | $ | 10.03 | $ | 10.47 | ||||||||||||
|
|
|
|
|
|
|
|
|
|
|
| |||||||||||||
Total investment return(2) | 2.42 | % | 3.19 | % | 1.92 | % | 4.86 | % | 0.37 | % | 7.17 | % | ||||||||||||
Ratios/Supplemental Data | ||||||||||||||||||||||||
Net assets, end of period (in thousands) | $ | 41,792 | $ | 40,774 | $ | 39,512 | $ | 38,775 | $ | 36,981 | $ | 47,339 | ||||||||||||
Ratio of expenses to average net assets | 0.85 | %(3) | 0.85 | % | 0.85 | % | 0.85 | % | 0.85 | % | 0.85 | % | ||||||||||||
Ratio of expenses to average net assets without waivers and expense reimbursements(4) | 1.29 | %(3) | 1.30 | % | 1.28 | % | 1.27 | % | 1.24 | % | 0.93 | % | ||||||||||||
Ratio of net investment income to average net assets | 2.59 | %(3) | 2.70 | % | 2.84 | % | 2.94 | % | 3.26 | % | 2.83 | % | ||||||||||||
Portfolio turnover rate | 159.03 | %(5) | 201.40 | % | 46.46 | % | 54.37 | % | 76.18 | % | 154.23 | %(6) | ||||||||||||
| (1) | The selected per share data was calculated using the average shares outstanding method for the period. |
| (2) | Total investment return is calculated assuming a purchase of shares on the first day and a sale of shares on the last day of each period reported and includes reinvestment of dividends and distributions, if any. Total returns for periods less than one year are not annualized. |
| (3) | Annualized. |
| (4) | During the period, certain fees were waived and/or reimbursed. If such fee waivers and/or reimbursements had not occurred, the ratios would have been as indicated (See Note 2). |
| (5) | Not annualized. |
| (6) | Portfolio turnover rate excludes securities delivered from processing a redemption-in-kind. |
The accompanying notes are an integral part of the financial statements.
15
INSIGHT INVESTMENT GRADE BOND FUND
Notes to Financial Statements
October 31, 2017
(Unaudited)
1. Organization and Significant Accounting Policies
The Insight Investment Grade Bond Fund (the “Fund”) is a diversified, open-end management investment company registered under the Investment Company Act of 1940, as amended (the “1940 Act”), which commenced investment operations on December 2, 2010. The Fund is a separate series of FundVantage Trust (the “Trust”) which was organized as a Delaware statutory trust on August 28, 2006. The Trust is a “series trust” authorized to issue an unlimited number of separate series or classes of shares of beneficial interest. Each series is treated as a separate entity for certain matters under the 1940 Act, and for other purposes, and a shareholder of one series is not deemed to be a shareholder of any other series. The Fund offers separate classes of shares, Class A, Class C and Institutional Class. As of October 31, 2017, Class A and Class C shares had not been issued.
At a meeting of the Trust’s Board of Trustees (“Board of Trustees”) of the Trust held on October 16, 2017, the Board of Trustees approved an Agreement and Plan of Reorganization between the Trust, on behalf of the Fund, into a newly-created series of the BNY Mellon Absolute Insight Funds, Inc., a Maryland corporation. The Board of Trustee’s decision to reorganize the Fund is subject to shareholder approval. If approved by shareholders, the reorganization is anticipated to close in or about February 2018.
The Fund is an investment company and follows accounting and reporting guidance in the Financial Accounting Standards Board Accounting Standards Codification Topic 946.
Portfolio Valuation — The Fund’s net asset value (“NAV”) is calculated once daily at the close of regular trading hours on the New York Stock Exchange (“NYSE”) (typically 4:00 p.m. Eastern time) on each business day the NYSE is open. Securities held by the Fund are valued at their last sale price on the NYSE on the day the security is valued. Lacking any sales on such day, the security will be valued at the mean between the last asked price and the last bid price prior to the market close. Securities listed on other exchanges (and not subject to restriction against sale by the Fund on such exchanges) will be similarly valued, using quotations on the exchange on which the security is traded most extensively. Unlisted securities that are quoted on the National Association of Securities Dealers National Market System, for which there have been sales of such securities on such day, shall be valued at the official closing price on such system on the day the security is valued. If there are no such sales on such day, the value shall be the mean between the last asked price and the last bid price prior to market close. The value of such securities quoted on the National Association of Securities Dealers Automatic Quotation System (“NASDAQ”) markets system, but not listed on the National Market System, shall be valued at the mean between closing asked price and the closing bid price. Unlisted securities that are not quoted on the NASDAQ and for which over-the-counter market quotations are readily available will be valued at the mean between the current bid and the asked prices for such security in the over-the-counter market. Fixed income securities are valued based on the market quotations, which are furnished by an independent pricing service. Fixed income securities having a remaining maturity of 60 days or less are generally valued at amortized cost, provided such amount approximates market value. Debt securities are valued on the basis of broker quotations or valuations provided by a pricing service, which utilizes information with respect to recent sales, market transactions in comparable securities, quotations from dealers, and various relationships between securities in determining value. Valuations developed through pricing techniques may materially vary from the actual amounts realized upon sale of the securities. Investments in other open-end investment companies are valued based on the NAV of the investment companies (which may use fair value pricing as discussed in their prospectuses). If market quotations are unavailable or deemed unreliable, securities will be valued in accordance with procedures adopted by the Board of Trustees. Relying on prices supplied by pricing services or dealers or using fair valuation may result in values that are higher or lower than the values used by other investment companies and investors to price the same investments. In the event that market quotes are not readily available, and the security or asset cannot be valued pursuant to one of the valuation methods, the value of the security or asset will be determined in good faith by the Adviser. The Trust has established a Valuation Committee which performs certain functions including the oversight of the Adviser’s fair valuation determinations.
16
INSIGHT INVESTMENT GRADE BOND FUND
Notes to Financial Statements (Continued)
October 31, 2017
(Unaudited)
Fair Value Measurements — The inputs and valuation techniques used to measure fair value of the Fund’s investments are summarized into three levels as described in the hierarchy below:
• Level 1 — | quoted prices in active markets for identical securities; | |
• Level 2 — | other significant observable inputs (including quoted prices for similar securities, interest rates, prepayment speeds, credit risk, etc.); and | |
• Level 3 — | significant unobservable inputs (including the Fund’s own assumptions in determining the fair value of investments). | |
The fair value of the Fund’s bonds are generally based on the quotes received from brokers or independent pricing services. Bonds with quotes that are based on actual trades with a sufficient level of activity on or near the measurement date are classified as Level 2 assets.
The inputs or methodology used for valuing securities are not necessarily an indication of the risk associated with investing in those securities.
The following is a summary of the inputs used, as of October 31, 2017, in valuing the Fund’s investments carried at fair value:
| Total Value at 10/31/17 | Level 1 Quoted Prices | Level 2 Other Significant Observable Inputs | Level 3 Significant Unobservable Inputs | |||||||||||||
Corporate Bonds and Notes | $ | 19,672,949 | $ | — | $ | 19,672,949 | $ | — | ||||||||
Asset Backed Securities | 7,691,813 | — | 7,691,813 | — | ||||||||||||
Commercial Mortgage-Backed Securities | 1,939,186 | — | 1,939,186 | — | ||||||||||||
Residential Mortgage-Backed Securities | 5,347,057 | — | 5,347,057 | — | ||||||||||||
Municipal Bonds | 416,227 | — | 416,227 | — | ||||||||||||
U.S. Treasury Obligations | 5,209,959 | — | 5,209,959 | — | ||||||||||||
Preferred Stock. | 561,600 | 561,600 | — | — | ||||||||||||
Registered Investment Company | 6,769,367 | 6,769,367 | — | — | ||||||||||||
|
|
|
|
|
|
|
| |||||||||
Total Investments | $ | 47,608,158 | $ | 7,330,967 | $ | 40,277,191 | $ | — | ||||||||
|
|
|
|
|
|
|
| |||||||||
At the end of each quarter, management evaluates the classification of Levels 1, 2 and 3 assets and liabilities. Various factors are considered, such as changes in liquidity from the prior reporting period; whether or not a broker is willing to execute at the quoted price; the depth and consistency of prices from third party pricing services; and the existence of contemporaneous, observable trades in the market. Additionally, management evaluates the classification of Level 1 and Level 2 assets and liabilities on a quarterly basis for changes in listings or delistings on national exchanges.
Due to the inherent uncertainty of determining the fair value of investments that do not have a readily available market value, the fair value of the Fund’s investments may fluctuate from period to period. Additionally, the fair value of investments may differ significantly from the values that would have been used had a ready market existed for such investments and may differ materially from the values the Fund may ultimately realize. Further, such investments may be subject to legal and other restrictions on resale or are otherwise may be less liquid than publicly traded securities.
For fair valuations using significant unobservable inputs, U.S. generally accepted accounting principles (“U.S. GAAP”) require the Fund to present a reconciliation of the beginning to ending balances for reported market values that presents
17
INSIGHT INVESTMENT GRADE BOND FUND
Notes to Financial Statements (Continued)
October 31, 2017
(Unaudited)
changes attributable to total realized and unrealized gains or losses, purchase and sales and transfers in and out of Level 3 during the period. Transfers in and out between Levels are based on values at the end of the period. U.S. GAAP also requires the Fund to disclose amounts and reasons for all transfers in and out of Level 1 and Level 2 fair value measurements. A reconciliation of Level 3 investments is presented only when the Fund had an amount of Level 3 investments at the end of the reporting period that was meaningful in relation to its net assets. The amounts and reasons for all transfers in and out of each Level within the three-tier hierarchy are disclosed when the Fund had an amount of total transfers during the reporting period that was meaningful in relation to its net assets as of the end of the reporting period.
For the six months ended October 31, 2017, there was a transfer from Level 2 to Level 1 of $561,600 due to having an active market for the security.
Use of Estimates — The preparation of financial statements in conformity with U.S. GAAP requires management to make estimates and assumptions that affect the amounts reported in the financial statements and accompanying notes at the date of the financial statements and the reported amounts of revenues and expenses during the period. Actual results could differ from those estimates and those differences could be material.
Investment Transactions, Investment Income and Expenses — Investment transactions are recorded on trade date for financial statement preparation purposes. Realized gains and losses on investments sold are recorded on the identified cost basis. Gains and losses on principal paydowns from mortgage backed securities are recorded as interest income on the Statement of Operations. Interest income is recorded on the accrual basis. Accretion of discounts and amortization of premiums are recorded on a daily basis using the effective yield method except for short term securities, which records discounts and premiums on a straight-line basis. Dividends are recorded on the ex-dividend date. Estimated components of distributions received from real estate investment trusts may be considered income, return of capital distributions or capital gain distributions. Return of capital distributions are recorded as a reduction of costs of the related investments. Distribution (12b-1) fees and shareholder services fees relating to a specific class are charged directly to that class. General expenses of the Trust are generally allocated to each fund in proportion to its relative daily net assets. Expenses directly attributable to a particular fund in the Trust are charged directly to that fund. The Fund’s investment income, expenses (other than class specific expenses) and unrealized and realized gains and losses are allocated daily to each class of shares based upon the relative proportion of net assets of each class at the beginning of the day.
Securities Traded on a To-Be-Announced Basis — The Fund may trade securities on a to-be-announced (“TBA”) basis. In a TBA transaction, the Fund commits to purchasing securities which have not yet been issued by the issuer and for which specific information, such as the face amount, maturity date and underlying pool of investments in U.S. government agency mortgage pass-through securities, is not announced. Securities purchased on a TBA basis are not settled until they are delivered to the Fund. Beginning on the date the Fund enters into a TBA transaction, cash, U.S. government securities or other liquid high-grade debt obligations are segregated in an amount equal in value to the purchase price of the TBA security. These securities are subject to market fluctuations and their current value is determined in the same manner as for other securities.
Dividends and Distributions to Shareholders — Dividends from net investment income are declared daily and paid monthly to shareholders. Distributions from net realized capital gains, if any, are declared and paid annually to shareholders. Income dividends and capital gain distributions are determined in accordance with U.S. federal income tax regulations, which may differ from U.S. GAAP. These differences may include the treatment of non-taxable dividends, expiring capital loss carryforwards and losses deferred due to wash sales and excise tax regulations. Permanent book and tax basis differences relating to shareholder distributions will result in reclassifications within the components of net assets.
U.S. Tax Status — No provision is made for U.S. income taxes as it is the Fund’s intention to continue to qualify for and elect the tax treatment applicable to regulated investment companies under Subchapter M of the Internal Revenue Code of 1986, as amended, (“Internal Revenue Code”) and make the requisite distributions to its shareholders which will be sufficient to relieve it from U.S. income and excise taxes.
18
INSIGHT INVESTMENT GRADE BOND FUND
Notes to Financial Statements (Continued)
October 31, 2017
(Unaudited)
Other — In the normal course of business, the Fund may enter into contracts that provide general indemnifications. The Fund’s maximum exposure under these arrangements is dependent on claims that may be made against the Fund in the future, and, therefore, cannot be estimated; however, based on experience, the risk of material loss for such claims is considered remote.
Recent Accounting Pronouncement — On August 1, 2017, the Fund implemented changes due to amendments to Regulation S-X, issued by the Securities and Exchange Commission, which require standardized, enhanced disclosures, particularly related to derivatives, in investment company financial statements. Adoption of the amendments had no effect on the Fund’s net assets or results of operations.
2. Transactions with Related Parties and Other Service Providers
Cutwater Investor Services Corp. (the “Adviser”) (d/b/a Insight Investment), serves as investment adviser to the Fund pursuant to an investment advisory agreement with the Trust. For its services, the Adviser is paid a monthly fee at the annual rate of 0.50% of the Fund’s average daily net assets. The Adviser has voluntarily agreed to reduce its investment advisory fee and/or reimburse certain expenses of the Fund to the extent necessary to ensure that the Fund’s total operating expenses (excluding any class-specific fees and expenses, “Acquired Fund Fees and Expenses”, interest, extraordinary items and brokerage commissions) do not exceed 0.85% (on an annual basis) of the Fund’s average daily net assets (the “Voluntary Waiver”). Such Voluntary Waiver will continue until the Adviser notifies the Fund of a change in the amount of the Voluntary Waiver or its discontinuation. This Voluntary Waiver may be discontinued at any time at the discretion of the Adviser.
For the six months ended October 31, 2017, the Adviser earned advisory fees of $104,248 and waived fees of $91,105.
Other Service Providers
BNY Mellon Investment Servicing (US) Inc. (“BNY Mellon”) serves as administrator and transfer agent for the Fund. For providing administrative and accounting services, BNY Mellon is entitled to receive a monthly fee equal to an annual percentage rate of the Fund’s average daily net assets and is subject to certain minimum monthly fees. For providing transfer agent services, BNY Mellon is entitled to receive a monthly fee, subject to certain minimum, and out of pocket expenses.
The Bank of New York Mellon (the “Custodian”) provides certain custodial services to the Fund. The Custodian is entitled to receive a monthly fee, subject to certain minimum, and out of pocket expenses.
Foreside Funds Distributors LLC (the “Underwriter”) provides principal underwriting services to the Fund pursuant to an underwriting agreement between the Trust and the Underwriter.
Trustees and Officers
The Trust is governed by its Board of Trustees. The Trustees receive compensation in the form of an annual retainer and per meeting fees for their services to the Trust. The remuneration paid to the Trustees by the Fund during the six months ended October 31, 2017 was $3,662. An employee of BNY Mellon serves as the Secretary of the Trust and is not compensated by the Fund or the Trust.
JW Fund Management LLC (“JWFM”) provides a Principal Executive Officer and Principal Financial Officer, respectively, to the Trust. JWFM is compensated for the services provided to the Trust.
19
INSIGHT INVESTMENT GRADE BOND FUND
Notes to Financial Statements (Continued)
October 31, 2017
(Unaudited)
Freeh Group International Solutions, LLC provides the Trust with a Chief Compliance Officer and an Anti-Money Laundering Officer.
3. Investment in Securities
For the six months ended October 31, 2017, aggregate purchases and sales of investment securities (excluding short-term investments) of the Fund were as follows:
| Purchases | Sales | |||||||
Investment Securities | $ | 9,029,748 | $ | 9,941,573 | ||||
U.S. Government Securities | 55,640,224 | 54,886,594 | ||||||
4. Restricted Securities
A restricted security is a security which has been purchased through a private offering and cannot be resold to the general public without prior registration under the Securities Act of 1933, as amended (the “1933 Act”), or pursuant to the resale limitations provided by Rule 144 under the 1933 Act, or an exemption from the registration requirements of the 1933 Act. Certain restricted securities may be resold in transactions exempt from registration, normally to qualified institutional buyers, and may be deemed liquid by Insight Investment as applicable, based on policies and procedures established by the Fund’s Board of Trustees. Therefore, not all restricted securities are considered illiquid. The Fund is subject to an investment limitation that immediately after purchase, the value of restricted securities that are considered illiquid can be no more than fifteen percent of the Fund’s net assets.
At October 31, 2017, the following restricted securities were held as illiquid:
| Acquisition Date | Acquisition Cost | Value | % of Net Assets | |||||||||||||||||
Corporate Bonds and Notes: | ||||||||||||||||||||
American Airlines 2013-2 Class B Pass Through Trust | 11/21/13 | $ | 301,506 | $ | 314,758 | 0.8% | ||||||||||||||
Antares CLO 2017-1 Ltd., Class B | 04/20/17 | 275,000 | 277,082 | 0.7 | ||||||||||||||||
BCC Funding XIII, LLC. Series 2016-1, Class A2 | 09/14/16 | 295,351 | 295,428 | 0.7 | ||||||||||||||||
British Airways 2013-1 Class B Pass Through Trust | 12/13/13 | 118,324 | 120,476 | 0.3 | ||||||||||||||||
Carlyle Global Market Strategies CLO Ltd., Series 2014-3A, Class B | 02/24/17 | 500,000 | 504,500 | 1.2 | ||||||||||||||||
Golub Capital Partners CLO 19B-R Ltd., Class A2 | 04/27/17 | 340,000 | 339,657 | 0.8 | ||||||||||||||||
Greystone Commercial Real Estate Notes 2017-FL1 Ltd., Class A | 03/03/17 | 100,000 | 100,794 | 0.2 | ||||||||||||||||
IVY Hill Middle Market Credit Fund XII Ltd., Class A2 | 04/28/17 | 340,000 | 342,744 | 0.8 | ||||||||||||||||
Latitude Management Real Estate Investors, Inc., Series 2016-CRE2, Class A | 10/21/16 | 125,000 | 125,762 | 0.3 | ||||||||||||||||
North End CLO, Ltd., Series 2013-1A, Class B | 07/19/13 | 996,979 | 990,430 | 2.4 | ||||||||||||||||
Spirit Master Funding LLC, Series 2014-2A, Class A | 05/20/14 | 303,317 | 307,423 | 0.7 | ||||||||||||||||
20
INSIGHT INVESTMENT GRADE BOND FUND
Notes to Financial Statements (Continued)
October 31, 2017
(Unaudited)
| Acquisition Date | Acquisition Cost | Value | % of Net Assets | |||||||||||||||||
Wells Fargo Commercial Mortgage Trust, Series 2014-TISH, Class SCH2 | 03/21/14 | $ | 450,000 | $ | 450,283 | 1.1 | ||||||||||||||
Wells Fargo Commercial Mortgage Trust, Series 2014-TISH, Class WTS2 | 03/21/14 | 225,000 | 225,147 | 0.5 | % | |||||||||||||||
5. Capital Share Transactions
For the six months ended October 31, 2017 and the year ended April 30, 2017, transactions in capital shares (authorized shares unlimited) were as follows:
| For the Six Months Ended October 31, 2017 (Unaudited) | For the Year Ended April 30, 2017 | |||||||||||||||
| Shares | Amount | Shares | Amount | |||||||||||||
Institutional Class: | ||||||||||||||||
Reinvestments | 53,204 | $ | 540,460 | 137,025 | $ | 1,381,727 | ||||||||||
|
|
|
|
|
|
|
| |||||||||
Net increase | 53,204 | $ | 540,460 | 137,025 | $ | 1,381,727 | ||||||||||
|
|
|
|
|
|
|
| |||||||||
6. Federal Tax Information
The Fund has followed the authoritative guidance on accounting for and disclosure of uncertainty in tax positions, which requires the Fund to determine whether a tax position is more likely than not to be sustained upon examination, including resolution of any related appeals or litigation processes, based on the technical merits of the position. The Fund has determined that there was no effect on the financial statements from following this authoritative guidance. In the normal course of business, the Fund is subject to examination by federal, state and local jurisdictions, where applicable, for tax years for which applicable statutes of limitations have not expired.
For the year ended April 30, 2017, the tax character of distributions paid by the Fund was $1,173,151 of ordinary income dividends, $169,825 of long-term capital gains and $38,751 return of capital distribution. Distributions from net investment income and short-term capital gains are treated as ordinary income for federal income tax purposes.
As of April 30, 2017, the components of distributable earnings on a tax basis were as follows:
| Capital Loss Carryforward | Undistributed Ordinary Income | Undistributed Long-Term Gain | Unrealized Appreciation | Qualified Late-Year Losses | ||||
| $— | $— | $— | $597,569 | $(79,427) |
The differences between the book and tax basis components of distributable earnings relate primarily to the timing and recognition of income and gains for federal income tax purposes. Short-term capital gains are reported as ordinary income for federal income tax purposes.
21
INSIGHT INVESTMENT GRADE BOND FUND
Notes to Financial Statements (Concluded)
October 31, 2017
(Unaudited)
As of October 31, 2017, the federal tax cost, aggregate gross unrealized appreciation and depreciation of securities held by the Fund were as follows:
Federal tax cost* | $ | 46,793,270 | ||
|
| |||
Gross unrealized appreciation | $ | 956,690 | ||
Gross unrealized depreciation | (141,802 | ) | ||
|
| |||
Net unrealized appreciation | $ | 814,888 | ||
|
|
| * | Because tax adjustments are calculated annually at the end of the Fund’s fiscal year, the above table does not reflect tax adjustments for the current fiscal year. For the previous year’s federal income tax information, please refer to the Notes to Financial Statements section in the Fund’s most recent annual report. |
Pursuant to federal income tax rules applicable to regulated investment companies, the Fund may elect to treat certain capital losses between November 1 and April 30 and late year ordinary losses ((i) ordinary losses between January 1 and April 30, and (ii) specified ordinary and currency losses between November 1 and April 30) as occurring on the first day of the following tax year. For the year ended April 30, 2017, any amount of losses elected within the tax return will not be recognized for federal income tax purposes until May 1, 2017. For the year ended April 30, 2017, the Fund had capital loss deferrals of $79,427.
Accumulated capital losses represent net capital loss carryforwards as of April 30, 2017 that may be available to offset future realized capital gains and thereby reduce future capital gains distributions. As of April 30, 2017, the Fund did not have any capital loss carryforwards.
7. Mortgage-Related and Other Asset-Backed Securities Risk
Mortgage-related and asset-backed securities are subject to certain other risks. The value of these securities will be influenced by the factors affecting the housing market and the assets underlying such securities. As a result, during periods of declining asset value, difficult or frozen credit markets, swings in interest rates, or deteriorating economic conditions, mortgage-related and asset-backed securities may decline in value, face valuation difficulties, become more volatile and/or become illiquid.
8. Debt Investment Risk
Debt investments are affected primarily by the financial condition of the companies or other entities that have issued them and by changes in interest rates. There is a risk that an issuer of a debt investment may not be able to meet its financial obligations (e.g., may not be able to make principal and/or interest payments when they are due or otherwise default on other financial terms) and/or go bankrupt. Securities such as high-yield/high-risk bonds, e.g., bonds with low credit ratings by Moody’s (Ba or lower) or Standard & Poor’s (BB and lower) or if unrated are of comparable quality as determined by the manager, are especially subject to credit risk during periods of economic uncertainty or during economic downturns and are more likely to default on their interest and/or principal payments than higher rated securities. Debt investments may be affected by changes in interest rates. Debt investments with longer durations tend to be more sensitive to changes in interest rates, making them more volatile than debt investments with shorter durations or floating or adjustable interest rates. The value of debt investments may fall when interest rates rise.
9. Subsequent Events
Management has evaluated the impact of all subsequent events on the Fund through the date the financial statements were issued, and has determined that there were no subsequent events requiring recognition or disclosure in the financial statements.
22
INSIGHT INVESTMENT GRADE BOND FUND
Other Information
(Unaudited)
Proxy Voting
Policies and procedures that the Fund uses to determine how to vote proxies relating to portfolio securities as well as information regarding how the Fund voted proxies relating to portfolio securities for the most recent 12-month period ended June 30 are available without charge, upon request, by calling (866) 678-6242 and on the Securities and Exchange Commission’s (“SEC”) website at http://www.sec.gov.
Quarterly Portfolio Schedules
The Trust files its complete schedule of portfolio holdings with the SEC for the first and third fiscal quarters of each fiscal year (quarters ended July 31 and January 31) on Form N-Q. The Trust’s Forms N-Q are available on the SEC’s website at http://www.sec.gov and may be reviewed and copied at the SEC’s Public Reference Room in Washington, D.C. Information on the operation of the SEC’s Public Reference Room may be obtained by calling 1-800-SEC-0330.
Board Consideration of Investment Advisory Agreement
At a meeting held on September 27-28, 2017 (the “Meeting”), the Board of Trustees (the “Board” or the “Trustees”) of FundVantage Trust (the “Trust”), including a majority of the Trustees who are not “interested persons” within the meaning of Section 2(a)(19) of the Investment Company Act of 1940, as amended (the “1940 Act”) (the “Independent Trustees”), unanimously approved the continuation of the advisory agreement between Cutwater Investor Services Corp. doing business as Insight Investment (“Insight” or the “Adviser”) and the Trust (the “Agreement”) on behalf of Insight Investment Grade Bond Fund (the “Fund”). At the Meeting, the Board considered the continuation of the Agreement with respect to the Fund for an additional one year period.
In determining whether to approve the Agreement, the Trustees considered information provided by the Adviser in accordance with Section 15(c) of the 1940 Act regarding: (i) services performed for the Fund, (ii) the size and qualifications of their portfolio management staff, (iii) any potential or actual material conflicts of interest which may arise in connection with a portfolio manager’s management of the Fund, (iv) investment performance, (v) the capitalization and financial condition of the Adviser, (vi) brokerage selection procedures (including soft dollar arrangements, if any), (vii) the procedures for allocating investment opportunities between the Fund and other clients, (viii) results of any regulatory examination, including any recommendations or deficiencies noted, (ix) any litigation, investigation or administrative proceeding which may have a material impact on Insight’s ability to service the Fund, (x) compliance with the Fund’s investment objectives, policies and practices (including codes of ethics and proxy voting policies) and (xi) compliance with federal securities laws and other regulatory requirements. The Trustees noted the reports and discussions with portfolio managers as provided at the Board meetings throughout the year covering matters such as the relative performance of the Fund; compliance with the investment objectives, policies, strategies and limitations for the Fund; the compliance of management personnel with the applicable code of ethics; and the adherence to the Trust’s pricing procedures as established by the Board.
Representatives from the Adviser attended the Meeting both in person and via teleconference. The representatives discussed the firm’s history, performance and investment strategies in connection with the proposed approval of the Agreement and answered questions from the Board.
Investment Performance. The Trustees considered the investment performance for the Fund and Insight. The Trustees reviewed the historical performance charts which showed the performance of the Fund as compared to the Lipper Core Bond Fund Index, the Fund’s applicable Lipper index and the Barclays U.S. Aggregate Total Return Index for the year-to-date, one year, two year, three year, five year and since inception periods ended June 30, 2017, as applicable. The Trustees also reviewed historical performance charts which showed the performance of the Fund as compared to the Barclays Capital U.S. Aggregate Bond Index and the Fund’s comparable separately managed account composite (gross of fees) for the one year, three year, five year and since inception periods ended July 31, 2017. The Trustees considered the short term and long term performance of the Fund, as applicable. The Trustees noted that they considered performance reports provided at Board meetings throughout the year.
23
INSIGHT INVESTMENT GRADE BOND FUND
Other Information
(Unaudited) (Continued)
The Trustees noted that the Fund had outperformed Lipper Core Bond Fund Index and Barclays U.S. Aggregate Total Return Index for the year-to-date, one year, two year, three year, five year and since inception periods ended June 30, 2017. The Trustees also noted that the Fund outperformed the Barclays Capital U.S. Aggregate Bond Index for the one year, three year, five year and since inception periods and underperformed the Fund’s comparable separately managed account composite (gross of fees) for the one year, three year, five year and since inception periods ended July 31, 2017. The Trustees concluded that the performance of the Fund was within an acceptable range of performance relative to other mutual funds with similar investment objectives, strategies and policies based on the information provided at the Meeting.
Fees. The Trustees noted that the representatives of Insight had provided information regarding its advisory fees and an analysis of these fees in relation to the services provided to the Fund and any other ancillary benefit resulting from Insight’s relationship with the Fund. The Trustees also reviewed information regarding the fees that Insight charges to its separately managed accounts, and evaluated the explanations provided by Insight as to differences in fees charged to the Fund and separately managed accounts. The Trustees also reviewed a peer comparison of advisory fees and total expenses for the Fund versus the universe of funds with similar share classes in the Lipper Core Bond Fund category with $250 million or less in assets. The Trustees noted that the gross advisory fee and net total expense ratio of the Fund’s Institutional Class shares were each higher than the median of the gross advisory fee and net total expense ratio of the funds with a similar share class in the Lipper Core Bond Fund category with $250 million or less in assets. The Trustees concluded that the advisory fees and services provided by Insight are consistent with those of other advisers which manage mutual funds with investment objectives, strategies and policies similar to those of the Fund based on the information provided at the Meeting.
Knowledge, experience, and qualifications. At the Meeting, the Board considered the level and depth of knowledge of Insight, including the professional experience and qualifications of senior personnel. In evaluating the quality of services to be provided by Insight, the Board took into account its familiarity with Insight’s senior management through Board meetings, discussions and reports during the preceding year. The Board also took into account Insight’s compliance policies and procedures and reports regarding Insight’s compliance operations from the Trust’s Chief Compliance Officer. The Board considered any potential conflicts of interest that may arise in a portfolio manager’s management of the Fund’s investments on the one hand, and the investments of other accounts, on the other. The Trustees reviewed the services provided to the Fund by Insight and concluded that the nature, extent and quality of the services provided were appropriate and consistent with the terms of the Agreement, that the quality of the proposed services appeared to be consistent with industry norms and that the Fund is likely to benefit from the continued provision of those services. They also concluded that Insight has sufficient personnel, with the appropriate education and experience, to serve the Insight effectively and had demonstrated their ability to attract and retain qualified personnel.
Cost of Services. The Trustees then considered the costs of the services provided by Insight, the compensation and benefits received by Insight in providing services to the Fund, as well as Insight’s profitability. The Trustees were provided the financial statements for Insight’s parent company, BNY Mellon, as of April 30, 2017. It was noted that Insight does not publish stand-alone financial statements. The Trustees noted that Insight’s level of profitability is an important factor to consider, and the Trustees should be satisfied that Insight’s profits are sufficient to continue as a healthy concern generally and as investment adviser of the Insight specifically. The Trustees concluded that Insight’s advisory fee level was reasonable in relation to the nature and quality of the services provided, taking into account the current size and projected growth of the Fund.
Economies of Scale. At the Meeting, the Trustees considered the extent to which economies of scale would be realized relative to fee levels as the Fund grows, and whether the advisory fee levels reflect those economies of scale
24
INSIGHT INVESTMENT GRADE BOND FUND
Other Information
(Unaudited) (Concluded)
for the benefit of shareholders. The Board noted that economies of scale may be achieved at higher asset levels for the Fund for the benefit of fund shareholders, but that the advisory fee did not currently include breakpoint reductions as asset levels increased.
At the Meeting, the Trustees determined to approve the continuation of the Agreement for an additional one year period. In approving the continuation of the Agreement, the Board considered all factors it deemed relevant and the information presented to the Board by Insight. In arriving at its decision, the Board did not identify any single factor as being of paramount importance and each member of the Board gave varying weights to each factor according to his or her own judgment. The Board determined that the continuation of the Agreement for an additional one year period would be in the best interests of the Fund and its shareholders.
25
[THIS PAGE INTENTIONALLY LEFT BLANK.]
[THIS PAGE INTENTIONALLY LEFT BLANK.]
Investment Adviser
Cutwater Investor Services Corp. d/b/a Insight Investment
200 Park Avenue, 7th Floor
New York, NY 10166
Administrator
BNY Mellon Investment Servicing (US) Inc.
301 Bellevue Parkway
Wilmington, DE 19809
Transfer Agent
BNY Mellon Investment Servicing (US) Inc.
4400 Computer Drive
Westborough, MA 01581
Principal Underwriter
Foreside Funds Distributors LLC
400 Berwyn Park
899 Cassatt Road
Berwyn, PA 19312
Custodian
The Bank of New York Mellon
225 Liberty Street
New York, NY 10286
Independent Registered Public Accounting Firm
Ernst & Young LLP
One Commerce Square
2005 Market Street, Suite 700
Philadelphia, PA 19103-7096
Legal Counsel
Pepper Hamilton LLP
3000 Two Logan Square
18th and Arch Streets
Philadelphia, PA 19103
INS-1017

LATEEF FOCUSED GROWTH FUND
(formerly Lateef Fund)
Semi-Annual Report
Performance Data
October 31, 2017
(Unaudited)
| Average Annual Total Returns for the Periods Ended October 31, 2017 | |||||||||||||||||||||||||||
| Six Months† | 1 Year | 3 Years | 5 Years | 10 Years | |||||||||||||||||||||||
Class A Shares (with sales charge) | 3.89% | 15.73% | 5.66% | 10.08% | 6.02% | ||||||||||||||||||||||
Class A Shares (without sales charge) | 9.33% | 21.79% | 7.47% | 11.22% | 6.57% | ||||||||||||||||||||||
Class C Shares | 8.92% | 20.82% | 6.65% | 10.38% | 5.75% | ||||||||||||||||||||||
Class I Shares | 9.49% | 22.02% | 7.73% | 11.49% | 6.84% | ||||||||||||||||||||||
Russell 3000® Index | 8.92% | 24.00% | 10.53% | 15.12% | 7.61% | ||||||||||||||||||||||
S&P 500® Index | 9.10% | 23.63% | 10.77% | 15.18% | 7.51% | ||||||||||||||||||||||
| † | Not Annualized. |
The Lateef Focused Growth Fund (the “Fund”) commenced operations on September 6, 2007.
The performance data quoted represents past performance and does not guarantee future results. The investment return and principal value of an investment in the Fund will fluctuate so that an investor’s shares, when redeemed, may be worth more or less than their original cost. The table does not reflect the deduction of taxes that a shareholder would pay on Fund distributions or redemption of Fund shares. Current performance may be lower or higher. Performance data current to the most recent month-end may be obtained by calling (866) 499-2151.
The returns shown for Class A shares reflect a deduction for the maximum front-end sales charge of 5.00%. All of the Fund’s share classes apply a 2.00% redemption fee to the value of shares redeemed within 30 days of purchase. This redemption fee is not reflected in the returns shown above. As stated in the current prospectus dated September 15, 2017, the Fund’s “Total Annual Fund Operating Expenses” are 1.42%, 2.17% and 1.17%, and the Fund’s “Total Annual Fund Operating Expenses After Fee Waiver and/or Reimbursement” are 1.10%, 1.85% and 0.85% for Class A, Class C and Class I shares, respectively, of the Fund’s average daily net assets. These rates may fluctuate and may differ from the actual expenses incurred by the Fund for the period covered by this report. Lateef Investment Management, L.P. (“the Adviser”) has contractually agreed to reduce its investment advisory fee and/or reimburse certain expenses of the Fund to the extent necessary to ensure that the Fund’s total operating expenses (excluding any class-specific fees and expenses, interest, extraordinary items, “Acquired Fund Fees and Expenses” and brokerage commissions) do not exceed 0.85% (on an annual basis) of the Fund’s average daily net assets (the “Expense Limitation”). Prior to August 3, 2017, the Expense Limitation was 0.99%. The Expense Limitation shall remain in effect until August 31, 2018, unless the Board of Trustees (“Board of Trustees”) of FundVantage Trust (the “Trust”) approves its earlier termination. Total returns would be lower had such fees and/or expenses not been waived and/or reimbursed.
All mutual fund investing involves risk, including possible loss of principal. The Fund is non-diversified, which means that a portion of the Fund’s assets may be invested in one or few companies or sectors. The Fund could fluctuate in value more than a diversified fund. The Fund may invest in undervalued securities and is subject to the risk that the securities may not appreciate in value as anticipated.
The Fund intends to evaluate performance as compared to that of the Standard & Poor’s 500® Composite Price Index (“S&P 500®”) and the Russell 3000® Index. The S&P 500® is a widely recognized, unmanaged index of 500 common stocks which are generally representative of the U.S. stock market as a whole. The Russell 3000® Index is an unmanaged index that measures the performance of the 3,000 largest U.S. stocks, representing about 98% of the total capitalization of the entire U.S. stock market. It is impossible to invest directly in an index.
1
LATEEF FOCUSED GROWTH FUND
(formerly Lateef Fund)
Fund Expense Disclosure
October 31, 2017
(Unaudited)
As a shareholder of the Fund, you incur two types of costs: (1) transaction costs including sales charges (loads) on purchase payments (if any) or redemption fees; and (2) ongoing costs, including management fees, distribution and/or service (Rule 12b-1) fees (if any) and other Fund expenses. These examples are intended to help you understand your ongoing costs (in dollars) of investing in the Fund and to compare these costs with the ongoing costs of investing in other mutual funds.
These examples are based on an investment of $1,000 invested at the beginning of the six-month period from May 1, 2017 through October 31, 2017 and held for the entire period.
Actual Expenses
The first line of the accompanying table provides information about actual account values and actual expenses. You may use the information in this line, together with the amount you invested, to estimate the expenses that you paid over the period. Simply divide your account value by $1,000 (for example, an $8,600 account value divided by $1,000 = 8.6), then multiply the result by the number in the first line under the heading entitled “Expenses Paid During Period” to estimate the expenses you paid on your account during this period.
Hypothetical Examples for Comparison Purposes
The second line of the accompanying table provides information about hypothetical account values and hypothetical expenses based on the Fund’s actual expense ratio and an assumed rate of return of 5% per year before expenses, which is not your Fund’s actual return. The hypothetical account values and expenses may not be used to estimate the actual ending account balance or expenses you paid for the period. You may use this information to compare the ongoing costs of investing in the Fund and other funds. To do so, compare these 5% hypothetical examples with the 5% hypothetical examples that appear in the shareholder reports of other funds.
Please note that the expenses shown in the accompanying table are meant to highlight your ongoing costs only and do not reflect any transactional costs, such as sales charges (loads) on purchase payments (if any) or redemption fees. Therefore, each hypothetical line of the accompanying table is useful in comparing ongoing costs only and will not help you determine the relative total costs of owning different funds. In addition, if these transactional costs were included, your costs would have been higher.
2
LATEEF FOCUSED GROWTH FUND
(formerly Lateef Fund)
Fund Expense Disclosure (Concluded)
October 31, 2017
(Unaudited)
| Lateef Fund | |||||||||||||||
| Beginning Account Value May 1, 2017 | Ending Account Value October 31, 2017 | Expenses Paid During Period* | |||||||||||||
Class A | |||||||||||||||
Actual | $ | 1,000.00 | $ | 1,093.30 | $ | 6.17 | |||||||||
Hypothetical (5% return before expenses) | 1,000.00 | 1,019.31 | 5.96 | ||||||||||||
Class C | |||||||||||||||
Actual | $ | 1,000.00 | $ | 1,089.20 | $ | 10.11 | |||||||||
Hypothetical (5% return before expenses) | 1,000.00 | 1,015.53 | 9.75 | ||||||||||||
Class I | |||||||||||||||
Actual | $ | 1,000.00 | $ | 1,094.90 | $ | 4.86 | |||||||||
Hypothetical (5% return before expenses) | 1,000.00 | 1,020.57 | 4.69 | ||||||||||||
| * | Expenses are equal to an annualized expense ratio for the six-month period ended October 31, 2017 of 1.17%, 1.92% and 0.92% for Class A, Class C and Class I shares, respectively, for the Fund, multiplied by the average account value over the period, multiplied by the number of days in the most recent period (184), then divided by 365 to reflect the period. The Fund’s ending account values on the first line in the table are based on the actual six-month total returns for the Fund of 9.33%, 8.92% and 9.49% for Class A, Class C and Class I shares, respectively. |
3
LATEEF FOCUSED GROWTH FUND
(formerly Lateef Fund)
Portfolio Holdings Summary Table
October 31, 2017
(Unaudited)
The following table presents a summary by sector of the portfolio holdings of the Fund:
| % of Net Assets | Value | |||||||
COMMON STOCKS: | ||||||||
Technology | 33.8 | % | $ | 34,429,111 | ||||
Consumer, Non-cyclical | 22.0 | 22,418,035 | ||||||
Financial | 16.1 | 16,410,831 | ||||||
Industrial | 15.4 | 15,666,282 | ||||||
Consumer, Cyclical | 10.7 | 10,887,596 | ||||||
Energy | 0.9 | 940,800 | ||||||
Options Written | (0.1 | ) | (114,400 | ) | ||||
Other Assets in Excess of Liabilities (excluding written options) | 1.2 | 1,225,861 | ||||||
|
|
|
| |||||
NET ASSETS | 100.0 | % | $ | 101,864,116 | ||||
|
|
|
| |||||
Portfolio holdings are subject to change at any time.
4
LATEEF FOCUSED GROWTH FUND
(formerly Lateef Fund)
Portfolio of Investments
October 31, 2017
(Unaudited)
| Number of Shares | Value | |||||||
COMMON STOCKS — 98.9% |
| |||||||
Consumer, Cyclical — 10.7% |
| |||||||
Delphi Automotive PLC | 60,622 | $ | 6,024,614 | |||||
Dollar General Corp. | 35,388 | 2,860,766 | ||||||
Newell Brands, Inc. | 49,098 | 2,002,216 | ||||||
|
| |||||||
| 10,887,596 | ||||||||
|
| |||||||
Consumer, Non-cyclical — 22.0% |
| |||||||
Allergan PLC (Ireland) | 19,725 | 3,495,862 | ||||||
Anthem, Inc. | 19,570 | 4,094,240 | ||||||
Celgene Corp.* | 30,510 | 3,080,595 | ||||||
Danaher Corp. | 66,763 | 6,160,222 | ||||||
Nielsen Holdings PLC | 25,655 | 951,031 | ||||||
Quintiles IMS Holdings, Inc.* | 42,887 | 4,636,085 | ||||||
|
| |||||||
| 22,418,035 | ||||||||
|
| |||||||
Energy — 0.9% | ||||||||
Schlumberger Ltd. | 14,700 | 940,800 | ||||||
|
| |||||||
Financial — 16.1% | ||||||||
Northern Trust Corp. | 17,267 | 1,614,810 | ||||||
Progressive Corp. (The) | 74,358 | 3,617,517 | ||||||
Raymond James Financial, Inc. | 39,190 | 3,322,528 | ||||||
SVB Financial Group* | 20,767 | 4,553,788 | ||||||
Synchrony Financial | 101,232 | 3,302,188 | ||||||
|
| |||||||
| 16,410,831 | ||||||||
|
| |||||||
Industrial — 15.4% | ||||||||
Canadian Pacific Railway Ltd. | 28,291 | 4,906,791 | ||||||
Keysight Technologies, Inc.* | 113,976 | 5,091,308 | ||||||
XPO Logistics, Inc.* | 81,733 | 5,668,183 | ||||||
|
| |||||||
| 15,666,282 | ||||||||
|
| |||||||
Technology — 33.8% | ||||||||
Alphabet, Inc., Class A* | 7,331 | 7,573,216 | ||||||
| Number of Shares | Value | |||||||
COMMON STOCKS — (Continued) |
| |||||||
Technology — (Continued) | ||||||||
Autodesk, Inc.* | 52,085 | $ | 6,508,541 | |||||
DXC Technology Co. | 40,617 | 3,717,268 | ||||||
Facebook, Inc., Class A* | 36,340 | 6,543,380 | ||||||
Visa, Inc., Class A | 91,714 | 10,086,706 | ||||||
|
| |||||||
| 34,429,111 | ||||||||
|
| |||||||
TOTAL COMMON STOCKS | 100,752,655 | |||||||
|
| |||||||
TOTAL INVESTMENTS - 98.9% | 100,752,655 | |||||||
|
| |||||||
OTHER ASSETS IN EXCESS OF LIABILITIES - 1.1% | 1,111,461 | |||||||
|
| |||||||
NET ASSETS - 100.0% | $ | 101,864,116 | ||||||
|
| |||||||
| Contracts | ||||||||
OPTIONS WRITTEN — (0.1)% | ||||||||
Call Options — (0.1)% | ||||||||
Visa, Inc. | (200 | ) | (114,400 | ) | ||||
|
| |||||||
TOTAL OPTIONS WRITTEN (Premium received $68,390) | $ | (114,400 | ) | |||||
|
| |||||||
| * | Non-income producing. |
| (a) | Primary risk exposure is equity price risk. |
CME Chicago Mercantile Exchange
PLC Public Limited Company
The accompanying notes are an integral part of the financial statements.
5
LATEEF FOCUSED GROWTH FUND
(formerly Lateef Fund)
Statement of Assets and Liabilities
October 31, 2017
(Unaudited)
Assets | ||||
Investments, at value (Cost $75,180,124) | $ | 100,752,655 | ||
Cash | 851,279 | |||
Receivable for investments sold | 528,334 | |||
Receivable for capital shares sold | 115,891 | |||
Prepaid expenses and other assets | 61,528 | |||
|
| |||
Total assets | 102,309,687 | |||
|
| |||
Liabilities | ||||
Options written, at value (premiums received $68,390) | 114,400 | |||
Payable for transfer agent fees | 112,040 | |||
Payable for capital shares redeemed | 77,662 | |||
Payable to Investment Adviser | 37,356 | |||
Payable for administration and accounting fees | 29,962 | |||
Payable for distribution fees | 16,249 | |||
Payable for audit fees | 13,476 | |||
Payable for custodian fees | 6,431 | |||
Payable for shareholder service fees | 3,697 | |||
Accrued expenses | 34,298 | |||
|
| |||
Total liabilities | 445,571 | |||
|
| |||
Net Assets | $ | 101,864,116 | ||
|
| |||
Net Assets consisted of: | ||||
Capital stock, $0.01 par value | $ | 98,337 | ||
Paid-in capital | 53,311,602 | |||
Accumulated net investment loss | (482,619 | ) | ||
Accumulated net realized gain from investments | 23,410,275 | |||
Net unrealized appreciation on investments and written options | 25,526,521 | |||
|
| |||
Net Assets | $ | 101,864,116 | ||
|
|
Class A Shares: | ||||
Net asset value and redemption price per share | $ | 10.43 | ||
|
| |||
Maximum offering price per share (100/95 of $10.43) | $ | 10.98 | ||
|
| |||
Class C Shares: | ||||
Net asset value, offering and redemption price per share | $ | 9.16 | ||
|
| |||
Class I Shares: | ||||
Net asset value, offering and redemption price per share | $ | 10.73 | ||
|
| |||
The accompanying notes are an integral part of the financial statements.
6
LATEEF FOCUSED GROWTH FUND
(formerly Lateef Fund)
Statement of Operations
For the Six Months Ended October 31, 2017
(Unaudited)
Investment income | ||||
Dividends | $ | 397,799 | ||
Less: foreign taxes withheld | (3,654 | ) | ||
|
| |||
Total investment income | 394,145 | |||
|
| |||
Expenses | ||||
Advisory fees (Note 2) | 491,680 | |||
Transfer agent fees (Note 2) | 117,114 | |||
Distribution fees (Class C) (Note 2) | 69,311 | |||
Administration and accounting fees (Note 2) | 40,318 | |||
Distribution fees (Class A) (Note 2) | 30,679 | |||
Registration and filing fees | 29,692 | |||
Legal fees | 23,794 | |||
Shareholder services fees | 23,104 | |||
Trustees’ and officers’ fees (Note 2) | 19,959 | |||
Printing and shareholder reporting fees | 17,951 | |||
Custodian fees (Note 2) | 14,656 | |||
Audit fees | 13,657 | |||
Other expenses | 10,390 | |||
|
| |||
Total expenses before waivers and reimbursements | 902,305 | |||
|
| |||
Less: waivers and reimbursements (Note 2) | (290,323 | ) | ||
|
| |||
Net expenses after waivers and reimbursements | 611,982 | |||
|
| |||
Net investment loss | (217,837 | ) | ||
|
| |||
Net realized and unrealized gain/(loss) from investments: | ||||
Net realized gain from investments | 1,629,787 | |||
Net change in unrealized appreciation/(depreciation) on investments | 8,082,810 | |||
Net change in unrealized appreciation/(depreciation) on written options | (46,010 | ) | ||
|
| |||
Net realized and unrealized gain on investments | 9,666,587 | |||
|
| |||
Net increase in net assets resulting from operations | $ | 9,448,750 | ||
|
|
The accompanying notes are an integral part of the financial statements.
7
LATEEF FOCUSED GROWTH FUND
(formerly Lateef Fund)
Statements of Changes in Net Assets
| For the Six Months Ended October 31, 2017 (Unaudited) | For the Year Ended April 30, 2017 | |||||||||
Increase/(decrease) in net assets from operations: | ||||||||||
Net investment loss | $ | (217,837 | ) | $ | (639,999 | ) | ||||
Net realized gain from investments and written options | 1,629,787 | 34,508,010 | ||||||||
Net change in unrealized appreciation/(depreciation) on investments | 8,036,800 | (5,863,211 | ) | |||||||
|
|
|
| |||||||
Net increase in net assets resulting from operations: | 9,448,750 | 28,004,800 | ||||||||
|
|
|
| |||||||
Less dividends and distributions to shareholders from: | ||||||||||
Net realized capital gains: | ||||||||||
Class A | — | (7,011,695 | ) | |||||||
Class C | — | (6,450,739 | ) | |||||||
Class I | — | (27,778,265 | ) | |||||||
|
|
|
| |||||||
Total net realized capital gains | — | (41,240,699 | ) | |||||||
|
|
|
| |||||||
Net decrease in net assets from dividends and distributions to shareholders | — | (41,240,699 | ) | |||||||
|
|
|
| |||||||
Decrease in net assets derived from capital share transactions (Note 4) | (18,735,145 | ) | (326,602,282 | ) | ||||||
|
|
|
| |||||||
Total decrease in net assets | (9,286,395 | ) | (339,838,181 | ) | ||||||
|
|
|
| |||||||
Net assets | ||||||||||
Beginning of period | 111,150,511 | 450,988,692 | ||||||||
|
|
|
| |||||||
End of period | $ | 101,864,116 | $ | 111,150,511 | ||||||
|
|
|
| |||||||
Accumulated net investment loss, end of period | $ | (482,619 | ) | $ | (264,782 | ) | ||||
|
|
|
| |||||||
The accompanying notes are an integral part of the financial statements.
8
LATEEF FOCUSED GROWTH FUND
(formerly Lateef Fund)
Financial Highlights
Contained below is per share operating performance data for Class A shares outstanding, total investment return, ratios to average net assets and other supplemental data for the respective period. The total returns in the table represent the rate that an investor would have earned or lost on an investment in the Fund (assuming reinvestment of all dividends and distributions). This information has been derived from information provided in the financial statements and should be read in conjunction with the financial statements and the notes thereto.
| Class A Shares | ||||||||||||||||||||||||||||||
| For the Six Months Ended October 31, 2017 (Unaudited) | For the Year Ended April 30, 2017 | For the Year Ended April 30, 2016 | For the Year Ended April 30, 2015 | For the Year Ended April 30, 2014 | For the Year Ended April 30, 2013 | |||||||||||||||||||||||||
Per Share Operating Performance | ||||||||||||||||||||||||||||||
Net asset value, beginning of period | $ | 9.54 | $ | 10.77 | $ | 14.00 | $ | 14.20 | $ | 12.45 | $ | 11.73 | ||||||||||||||||||
|
|
|
|
|
|
|
|
|
|
|
| |||||||||||||||||||
Net investment income/(loss)(1) | (0.02 | ) | (0.04 | ) | (0.05 | ) | 0.01 | 0.04 | — | (2) | ||||||||||||||||||||
Net realized and unrealized gain/(loss) on investments | 0.91 | 1.25 | (0.19 | ) | 0.91 | 2.40 | 1.23 | |||||||||||||||||||||||
|
|
|
|
|
|
|
|
|
|
|
| |||||||||||||||||||
Net increase/(decrease) in net assets resulting from operations | 0.89 | 1.21 | (0.24 | ) | 0.92 | 2.44 | 1.23 | |||||||||||||||||||||||
|
|
|
|
|
|
|
|
|
|
|
| |||||||||||||||||||
Dividends and distributions to shareholders from: | ||||||||||||||||||||||||||||||
Net investment income | — | — | (0.02 | ) | (0.01 | ) | — | (2) | (0.02 | ) | ||||||||||||||||||||
Net realized capital gains | — | (2.44 | ) | (2.97 | ) | (1.11 | ) | (0.69 | ) | (0.49 | ) | |||||||||||||||||||
Total dividends and distributions to shareholders | — | (2.44 | ) | (2.99 | ) | (1.12 | ) | (0.69 | ) | (0.51 | ) | |||||||||||||||||||
|
|
|
|
|
|
|
|
|
|
|
| |||||||||||||||||||
Redemption fees | — | — | — | (2) | — | (2) | — | (2) | — | (2) | ||||||||||||||||||||
|
|
|
|
|
|
|
|
|
|
|
| |||||||||||||||||||
Net asset value, end of period | $ | 10.43 | $ | 9.54 | $ | 10.77 | $ | 14.00 | $ | 14.20 | $ | 12.45 | ||||||||||||||||||
|
|
|
|
|
|
|
|
|
|
|
| |||||||||||||||||||
Total investment return(3) | 9.33 | % | 12.64 | % | (2.31 | )% | 6.54 | % | 19.92 | % | 10.92 | % | ||||||||||||||||||
Ratios/Supplemental Data | ||||||||||||||||||||||||||||||
Net assets, end of period (in thousands) | $ | 24,470 | $ | 24,460 | $ | 56,657 | $ | 86,174 | $ | 148,897 | $ | 120,871 | ||||||||||||||||||
Ratio of expenses to average net assets | 1.17 | %(4) | 1.24 | % | 1.24 | % | 1.24 | % | 1.24 | % | 1.24 | % | ||||||||||||||||||
Ratio of expenses to average net assets without waivers and expense reimbursements(5) | 1.72 | %(4) | 1.57 | % | 1.42 | % | 1.38 | % | 1.41 | % | 1.45 | % | ||||||||||||||||||
Ratio of net investment income/(loss) to average net assets | (0.43 | )%(4) | (0.35 | )% | (0.37 | )% | 0.08 | % | 0.31 | % | 0.04 | % | ||||||||||||||||||
Portfolio turnover rate | 18.61 | %(6) | 41.70 | % | 65.01 | % | 29.22 | % | 40.77 | % | 28.29 | % | ||||||||||||||||||
| (1) | The selected per share data was calculated using the average shares outstanding method for the period. |
| (2) | Amount is less than $0.005 per share. |
| (3) | Total investment return is calculated assuming a purchase of shares on the first day and a sale of shares on the last day of each period reported and includes reinvestment of dividends and distributions, if any. Total investment return does not reflect the impact of the maximum front-end sales load of 5.00%. If reflected, the return would be lower. Total returns for periods less than one year are not annualized. |
| (4) | Annualized. |
| (5) | During the period, certain fees were waived. If such fee waivers had not occurred, the ratios would have been as indicated (See Note 2). |
| (6) | Not annualized. |
The accompanying notes are an integral part of the financial statements.
9
LATEEF FOCUSED GROWTH FUND
(formerly Lateef Fund)
Financial Highlights
Contained below is per share operating performance data for Class C shares outstanding, total investment return, ratios to average net assets and other supplemental data for the respective period. The total returns in the table represent the rate that an investor would have earned or lost on an investment in the Fund (assuming reinvestment of all dividends and distributions). This information has been derived from information provided in the financial statements and should be read in conjunction with the financial statements and the notes thereto.
| Class C Shares | ||||||||||||||||||||||||||||||
| For the Six Months Ended October 31, 2017 (Unaudited) | For the Year Ended April 30, 2017 | For the Year Ended April 30, 2016 | For the Year Ended April 30, 2015 | For the Year Ended April 30, 2014 | For the Year Ended April 30, 2013 | |||||||||||||||||||||||||
Per Share Operating Performance | ||||||||||||||||||||||||||||||
Net asset value, beginning of period | $ | 8.41 | $ | 9.84 | $ | 13.11 | $ | 13.46 | $ | 11.91 | $ | 11.30 | ||||||||||||||||||
|
|
|
|
|
|
|
|
|
|
|
| |||||||||||||||||||
Net investment loss(1) | (0.05 | ) | (0.10 | ) | (0.13 | ) | (0.09 | ) | (0.06 | ) | (0.08 | ) | ||||||||||||||||||
Net realized and unrealized gain/(loss) on investments | 0.80 | 1.11 | (0.17 | ) | 0.85 | 2.30 | 1.18 | |||||||||||||||||||||||
|
|
|
|
|
|
|
|
|
|
|
| |||||||||||||||||||
Net increase/(decrease) in net assets resulting from operations | 0.75 | 1.01 | (0.30 | ) | 0.76 | 2.24 | 1.10 | |||||||||||||||||||||||
|
|
|
|
|
|
|
|
|
|
|
| |||||||||||||||||||
Dividends and distributions to shareholders from: | ||||||||||||||||||||||||||||||
Net realized capital gains | — | (2.44 | ) | (2.97 | ) | (1.11 | ) | (0.69 | ) | (0.49 | ) | |||||||||||||||||||
Redemption fees | — | — | — | (2) | — | (2) | — | (2) | — | (2) | ||||||||||||||||||||
|
|
|
|
|
|
|
|
|
|
|
| |||||||||||||||||||
Net asset value, end of period | $ | 9.16 | $ | 8.41 | $ | 9.84 | $ | 13.11 | $ | 13.46 | $ | 11.91 | ||||||||||||||||||
|
|
|
|
|
|
|
|
|
|
|
| |||||||||||||||||||
Total investment return(3) | 8.92 | % | 11.71 | % | (2.98 | )% | 5.65 | % | 19.08 | % | 10.14 | % | ||||||||||||||||||
Ratios/Supplemental Data | ||||||||||||||||||||||||||||||
Net assets, end of period (in thousands) | $ | 17,324 | $ | 19,721 | $ | 35,840 | $ | 46,879 | $ | 50,080 | $ | 39,133 | ||||||||||||||||||
Ratio of expenses to average net assets | 1.92 | %(4) | 1.99 | % | 1.99 | % | 1.99 | % | 1.99 | % | 1.99 | % | ||||||||||||||||||
Ratio of expenses to average net assets without waivers and expense reimbursements(5) | 2.47 | %(4) | 2.33 | % | 2.17 | % | 2.14 | % | 2.16 | % | 2.19 | % | ||||||||||||||||||
Ratio of net investment loss to average net assets | (1.18 | )%(4) | (1.10 | )% | (1.12 | )% | (0.67 | )% | (0.44 | )% | (0.71 | )% | ||||||||||||||||||
Portfolio turnover rate | 18.61 | %(6) | 41.70 | % | 65.01 | % | 29.22 | % | 40.77 | % | 28.29 | % | ||||||||||||||||||
| (1) | The selected per share data was calculated using the average shares outstanding method for the period. |
| (2) | Amount is less than $0.005 per share. |
| (3) | Total investment return is calculated assuming a purchase of shares on the first day and a sale of shares on the last day of each period reported and includes reinvestment of dividends and distributions, if any. Total return for periods less than one year are not annualized. |
| (4) | Annualized. |
| (5) | During the period, certain fees were waived. If such fee waivers had not occurred, the ratios would have been as indicated (See Note 2). |
| (6) | Not annualized. |
The accompanying notes are an integral part of the financial statements.
10
LATEEF FOCUSED GROWTH FUND
(formerly Lateef Fund)
Financial Highlights
Contained below is per share operating performance data for Class I shares outstanding, total investment return, ratios to average net assets and other supplemental data for the respective period. The total returns in the table represent the rate that an investor would have earned or lost on an investment in the Fund (assuming reinvestment of all dividends and distributions). This information has been derived from information provided in the financial statements and should be read in conjunction with the financial statements and the notes thereto.
| Class I Shares | ||||||||||||||||||||||||||||||
| For the Six Months Ended October 31, 2017 (Unaudited) | For the Year Ended April 30, 2017 | For the Year Ended April 30, 2016 | For the Year Ended April 30, 2015 | For the Year Ended April 30, 2014 | For the Year Ended April 30, 2013 | |||||||||||||||||||||||||
Per Share Operating Performance | ||||||||||||||||||||||||||||||
Net asset value, beginning of period | $ | 9.80 | $ | 10.98 | $ | 14.22 | $ | 14.41 | $ | 12.61 | $ | 11.87 | ||||||||||||||||||
|
|
|
|
|
|
|
|
|
|
|
| |||||||||||||||||||
Net investment income/(loss)(1) | (0.01 | ) | (0.01 | ) | (0.02 | ) | 0.05 | 0.08 | 0.03 | |||||||||||||||||||||
Net realized and unrealized gain/(loss) on investments | 0.94 | 1.27 | (0.19 | ) | 0.92 | 2.43 | 1.25 | |||||||||||||||||||||||
|
|
|
|
|
|
|
|
|
|
|
| |||||||||||||||||||
Net increase/(decrease) in net assets resulting from operations | 0.93 | 1.26 | (0.21 | ) | 0.97 | 2.51 | 1.28 | |||||||||||||||||||||||
|
|
|
|
|
|
|
|
|
|
|
| |||||||||||||||||||
Dividends and distributions to shareholders from: | ||||||||||||||||||||||||||||||
Net investment income | — | — | (0.06 | ) | (0.05 | ) | (0.02 | ) | (0.05 | ) | ||||||||||||||||||||
Net realized capital gains | — | (2.44 | ) | (2.97 | ) | (1.11 | ) | (0.69 | ) | (0.49 | ) | |||||||||||||||||||
|
|
|
|
|
|
|
|
|
|
|
| |||||||||||||||||||
Total dividends and distributions to shareholders | — | (2.44 | ) | (3.03 | ) | (1.16 | ) | (0.71 | ) | (0.54 | ) | |||||||||||||||||||
|
|
|
|
|
|
|
|
|
|
|
| |||||||||||||||||||
Redemption fees | — | — | — | (2) | — | (2) | — | (2) | — | (2) | ||||||||||||||||||||
|
|
|
|
|
|
|
|
|
|
|
| |||||||||||||||||||
Net asset value, end of period | $ | 10.73 | $ | 9.80 | $ | 10.98 | $ | 14.22 | $ | 14.41 | $ | 12.61 | ||||||||||||||||||
|
|
|
|
|
|
|
|
|
|
|
| |||||||||||||||||||
Total investment return(3) | 9.49 | % | 12.86 | % | (2.04 | )% | 6.79 | % | 20.21 | % | 11.22 | % | ||||||||||||||||||
Ratios/Supplemental Data | ||||||||||||||||||||||||||||||
Net assets, end of period (in thousands) | $ | 60,071 | $ | 66,969 | $ | 358,492 | $ | 623,561 | $ | 650,454 | $ | 486,440 | ||||||||||||||||||
Ratio of expenses to average net assets | 0.92 | %(4) | 0.99 | % | 0.99 | % | 0.99 | % | 0.99 | % | 0.99 | % | ||||||||||||||||||
Ratio of expenses to average net assets without waivers and expense reimbursements(5) | 1.47 | %(4) | 1.28 | % | 1.16 | % | 1.14 | % | 1.16 | % | 1.19 | % | ||||||||||||||||||
Ratio of net investment income/(loss) to average net assets | (0.18 | )%(4) | (0.09 | )% | (0.12 | )% | 0.33 | % | 0.56 | % | 0.29 | % | ||||||||||||||||||
Portfolio turnover rate | 18.61 | %(6) | 41.70 | % | 65.01 | % | 29.22 | % | 40.77 | % | 28.29 | % | ||||||||||||||||||
| (1) | The selected per share data was calculated using the average shares outstanding method for the period. |
| (2) | Amount is less than $0.005 per share. |
| (3) | Total investment return is calculated assuming a purchase of shares on the first day and a sale of shares on the last day of each period reported and includes reinvestment of dividends and distributions, if any. Total return for periods less than one year are not annualized. |
| (4) | Annualized. |
| (5) | During the period, certain fees were waived. If such fee waivers had not occurred, the ratios would have been as indicated (See Note 2). |
| (6) | Not annualized. |
The accompanying notes are an integral part of the financial statements.
11
LATEEF FOCUSED GROWTH FUND
(formerly Lateef Fund)
Notes to Financial Statements
October 31, 2017
(Unaudited)
1. Organization and Significant Accounting Policies
The Lateef Focused Growth Fund (the “Fund”) is a non-diversified, open-end management investment company registered under the Investment Company Act of 1940, as amended (the “1940 Act”), which commenced investment operations on September 6, 2007. The Fund is a separate series of FundVantage Trust (the “Trust”) which was organized as a Delaware statutory trust on August 28, 2006. The Trust is a “series trust” authorized to issue an unlimited number of separate series or classes of shares of beneficial interest. Each series is treated as a separate entity for certain matters under the 1940 Act, and for other purposes, and a shareholder of one series is not deemed to be a shareholder of any other series. The Fund offers separate classes of shares, Class A, Class C and Class I shares. Class A shares are sold subject to a front-end sales charge. Front-end sales charges may be reduced or waived under certain circumstances. A contingent deferred sales charge (“CDSC”) may be applicable to the purchase of Class A shares. A CDSC, as a percentage of the lower of the original purchase price or net asset value at redemption, of up to 1.00% may be imposed on full or partial redemptions of Class A shares made within eighteen months of purchase where: (i) $1 million or more of Class A shares were purchased without an initial sales charge and (ii) the selling broker-dealer received a commission for such sale.
The Fund is an investment company and follows accounting and reporting guidance in the Financial Accounting Standards Board Accounting Standards Codification Topic 946.
Portfolio Valuation — The Fund’s net asset value (“NAV”) is calculated once daily at the close of regular trading hours on the New York Stock Exchange (“NYSE”) (typically 4:00 p.m. Eastern time) on each day the NYSE is open. Securities held by the Fund are valued using the closing price or the last sale price on a national securities exchange or the National Association of Securities Dealers Automatic Quotation System (“NASDAQ”) market system where they are primarily traded. Equity securities traded in the over-the-counter market are valued at their closing prices. If there were no transactions on that day, securities traded principally on an exchange or on NASDAQ will be valued at the mean of the last bid and ask prices prior to the market close. Fixed income securities having a remaining maturity of greater than 60 days are valued using an independent pricing service. Fixed income securities having a remaining maturity of 60 days or less are generally valued at amortized cost, provided such amount approximates fair value. Foreign securities are valued based on prices from the primary market in which they are traded and are translated from the local currency into U.S. dollars using current exchange rates. Investments in other open-end investment companies are valued based on the NAV of the investment companies (which may use fair value pricing as discussed in their prospectuses). If market quotations are unavailable or deemed unreliable, securities will be valued in accordance with procedures adopted by the Trust’s Board of Trustees (“Board of Trustees”). Options are valued at last sale price. Relying on prices supplied by pricing services or dealers or using fair valuation may result in values that are higher or lower than the values used by other investment companies and investors to price the same investments. In the event that market quotes are not readily available, and the security or asset cannot be valued pursuant to one of the valuation methods, the value of the security or asset will be determined in good faith by the Adviser.
12
LATEEF FOCUSED GROWTH FUND
(formerly Lateef Fund)
Notes to Financial Statements (Continued)
October 31, 2017
(Unaudited)
The Trust has established a Valuation Committee which performs certain functions including the oversight of the Adviser’s fair valuation determinations.
Fair Value Measurements — The inputs and valuation techniques used to measure fair value of the Fund’s investments are summarized into three levels as described in the hierarchy below:
• Level 1 — | quoted prices in active markets for identical securities; | |
• Level 2 — | other significant observable inputs (including quoted prices for similar securities, interest rates, prepayment speeds, credit risk, etc.); and | |
• Level 3 — | significant unobservable inputs (including the Fund’s own assumptions in determining the fair value of investments). | |
The inputs or methodology used for valuing securities are not necessarily an indication of the risk associated with investing in those securities.
The following is a summary of the inputs used, as of October 31, 2017, in valuing the Fund’s investments carried at fair value:
| Total Value at 10/31/17 | Level 1 Quoted Price | Level 2 Other Significant Observable Inputs | Level 3 Significant Unobservable Inputs | |||||||||||||
Assets: | ||||||||||||||||
Investments in Securities* | $ | 100,752,655 | $ | 100,752,655 | $ | — | $ | — | ||||||||
|
|
|
|
|
|
|
| |||||||||
Liabilities: | ||||||||||||||||
Written Option on Equity Contracts | $ | (114,400 | ) | $ | (114,400 | ) | $ | — | $ | — | ||||||
|
|
|
|
|
|
|
| |||||||||
| * | Please refer to Portfolio of Investments for further details on portfolio holdings. |
At the end of each quarter, management evaluates the classification of Levels 1, 2 and 3 assets and liabilities. Various factors are considered, such as changes in liquidity from the prior reporting period; whether or not a broker is willing to execute at the quoted price; the depth and consistency of prices from third party pricing services; and the existence of contemporaneous, observable trades in the market. Additionally, management evaluates the classification of Level 1 and Level 2 assets and liabilities on a quarterly basis for changes in listings or delistings on national exchanges.
Due to the inherent uncertainty of determining the fair value of investments that do not have a readily available market value, the fair value of the Fund’s investments may fluctuate from period to period. Additionally, the fair value of investments may differ significantly from the values that would have been used had a ready market existed for such investments and may differ materially from the values the Fund may ultimately realize. Further, such investments may be subject to legal and other restrictions on resale or are otherwise less liquid than publicly traded securities.
13
LATEEF FOCUSED GROWTH FUND
(formerly Lateef Fund)
Notes to Financial Statements (Continued)
October 31, 2017
(Unaudited)
For fair valuations using significant unobservable inputs, U.S. generally accepted accounting principles (“U.S. GAAP”) require the Fund to present a reconciliation of the beginning to ending balances for reported market values that presents changes attributable to total realized and unrealized gains or losses, purchase and sales, and transfers in and out of Level 3 during the period.
Transfers in and out between Levels are based on values at the end of the period. U.S. GAAP also requires the Fund to disclose amounts and reasons for all transfers in and out of Level 1 and Level 2 fair value measurements. A reconciliation of Level 3 investments is presented only when the Fund had an amount of Level 3 investments at the end of the reporting period that was meaningful in relation to its net assets. The amounts and reasons for all transfers in and out of each Level within the three-tier hierarchy are disclosed when the Fund had an amount of total transfers during the reporting period that was meaningful in relation to its net assets as of the end of the reporting period.
For the six months ended October 31, 2017, there were no transfers between Levels 1, 2 and 3 for the Fund.
Disclosures About Derivative Instruments and Hedging Activities
The following tables provide quantitative disclosures about fair value amounts of, and gains and losses on, the Fund’s derivative instruments as of October 31, 2017.
The following tables lists the fair values of the Fund’s derivative holdings as of October 31, 2017 grouped by contract type and risk exposure category.
| Derivative Type | Balance Sheet Location | Equity Contracts | Total | |||||||||
Liability Derivatives | ||||||||||||
Written Options | Option written, at value | $ | (114,400 | ) | $ | (114,400 | ) | |||||
Total Value - Liabilities | $ | (114,400 | ) | $ | (114,400 | ) | ||||||
The following table lists the amounts of change in unrealized appreciation/(depreciation) included in net increase in net assets resulting from operations for the six months ended October 31, 2017, grouped by contract type and risk exposure.
14
LATEEF FOCUSED GROWTH FUND
(formerly Lateef Fund)
Notes to Financial Statements (Continued)
October 31, 2017
(Unaudited)
| Derivative Type | Statement of Operations Location | Equity Contracts | Total | |||||||
| Change in appreciation/(depreciation) | ||||||||||
Written Options | Net change in unrealized appreciation/(depreciation) on written options | (46,010 | ) | (46,010 | ) | |||||
Total change in appreciation/(depreciation) | $ | (46,010 | ) | $ | (46,010 | ) | ||||
Use of Estimates — The preparation of financial statements in conformity with U.S. GAAP requires management to make estimates and assumptions that affect the amounts reported in the financial statements and accompanying notes at the date of the financial statements and the reported amounts of revenues and expenses during the period. Actual results could differ from those estimates and those differences could be material.
Investment Transactions, Investment Income and Expenses — Investment transactions are recorded on trade date for financial statement preparation purposes. Realized gains and losses on investments sold are recorded on the identified cost basis. Interest income is recorded on the accrual basis. Dividends are recorded on the ex-dividend date. Estimated components of distributions received from real estate investment trusts may be considered income, return of capital distributions or capital gain distributions. Return of capital distributions are recorded as a reduction of cost of the related investments. Distribution (12b-1) fees and shareholder services fees relating to a specific class are charged directly to that class. Fund level expenses common to all classes, investment income and realized and unrealized gains and losses on investments are allocated to each class based upon the relative daily net assets of each class. General expenses of the Trust are generally allocated to each fund in proportion to its relative daily net assets. Expenses directly attributable to a particular fund in the Trust are charged directly to that fund. The Fund’s investment income, expenses (other than class-specific expenses) and unrealized and realized gains and losses are allocated daily to each class of shares based upon the relative proportion of net assets of each class at the beginning of the day.
Dividends and Distributions to Shareholders — Dividends from net investment income and distributions from net realized capital gains, if any, are declared, recorded on ex-date and paid at least annually to shareholders. Income dividends and capital gain distributions are determined in accordance with U.S. federal income tax regulations, which may differ from U.S. GAAP. These differences may include the treatment of non-taxable dividends, expiring capital loss carryforwards and losses deferred due to wash sales and excise tax regulations. Permanent book and tax basis differences relating to shareholder distributions will result in reclassifications within the components of net assets.
U.S. Tax Status — No provision is made for U.S. income taxes as it is the Fund’s intention to continue to qualify for and elect the tax treatment applicable to regulated investment companies under Subchapter
15
LATEEF FOCUSED GROWTH FUND
(formerly Lateef Fund)
Notes to Financial Statements (Continued)
October 31, 2017
(Unaudited)
M of the Internal Revenue Code of 1986, as amended (the “Internal Revenue Code”), and make the requisite distributions to its shareholders which will be sufficient to relieve it from U.S. income and excise taxes.
Other — In the normal course of business, the Fund may enter into contracts that provide general indemnifications. The Fund’s maximum exposure under these arrangements is dependent on claims that may be made against the Fund in the future, and therefore, cannot be estimated; however, based on experience, the risk of material loss for such claims is considered remote.
Currency Risk — The Fund invests in securities of foreign issuers, including American Depositary Receipts. These markets are subject to special risks associated with foreign investments not typically associated with investing in U.S. markets. Because the foreign securities in which the Fund may invest generally trade in currencies other than the U.S. dollar, changes in currency exchange rates will affect the Fund’s NAV, the value of dividends and interest earned and gains and losses realized on the sale of securities. Because the NAV for the Fund is determined on the basis of U.S. dollars, the Fund may lose money by investing in a foreign security if the local currency of a foreign market depreciates against the U.S. dollar, even if the local currency value of the Fund’s holdings goes up. Generally, a strong U.S. dollar relative to these other currencies will adversely affect the value of the Fund’s holdings in foreign securities.
Written Options — The Fund is subject to equity and other risk exposure in the normal course of pursuing its investment objectives and may enter into options written to hedge against changes in interest rates, foreign exchange rates and values of equities. Such options may relate to particular securities or domestic stock indices, and may or may not be listed on a domestic securities exchange or issued by the Options Clearing Corporation. An option contract is a commitment that gives the purchaser of the contract the right, but not the obligation, to buy or sell an underlying asset at a specific price on or before a specified future date. On the other hand, the writer of an option contract is obligated, upon the exercise of the option, to buy or sell an underlying asset at a specific price on or before a specified future date. The maximum risk of loss associated with writing put options is limited to the exercised fair value of the option contract. The maximum risk of loss associated with writing call options is potentially unlimited. The Fund also has the additional risk of being unable to enter into a closing transaction at an acceptable price if a liquid secondary market does not exist. The Fund also may write over-the-counter options where completing the obligation depends upon the credit standing of the other party. Option contracts also involve the risk that they may result in loss due to unanticipated developments in market conditions or other causes. Written options are initially recorded as liabilities to the extent of premiums received and subsequently marked to market to reflect the current value of the option written. Gains or losses are realized when the option transaction expires or closes. When an option is exercised, the proceeds on sales for a written call option or the purchase cost for a written put option is adjusted by the amount of the premium received. Listed option contracts present minimal counterparty credit risk since they are exchange traded and the exchange’s clearinghouse, as counterparty to all exchange-traded options, guarantees the options against
16
LATEEF FOCUSED GROWTH FUND
(formerly Lateef Fund)
Notes to Financial Statements (Continued)
October 31, 2017
(Unaudited)
default. The Fund’s maximum risk of loss from counterparty credit risk related to OTC option contracts is limited to the premium paid. As of October 31, 2017, all of the Fund’s written options were exchange-traded options.
The Fund had transactions in written options during the six months ended October 31, 2017, as follows:
| Number of Contracts | Premium | |||||||||
Outstanding, April 30, 2017 | — | $ | — | |||||||
Call Options Written | 200 | 68,390 | ||||||||
Call Options Closed | — | — | ||||||||
Call Options Exercised | — | — | ||||||||
|
|
|
| |||||||
Outstanding, October 31, 2017 | 200 | $ | 68,390 | |||||||
|
|
|
| |||||||
For the six months ended October 31, 2017, the Fund’s quarterly average volume of derivatives is as follows:
Written Options (Proceeds) |
| $22,797 |
Recent Accounting Pronouncement — On August 1, 2017, the Fund implemented changes to amendments to Regulation S-X, issued by the Securities and Exchange Commission, which require standardized, enhanced disclosures, particularly related to derivatives, in investment company financial statements. Adoption of the amendments had no effect on the Fund’s net assets or results of operations.
2. Transactions with Related Parties and Other Service Providers
Lateef Investment Management, L.P. (“Lateef” or the “Adviser”) serves as investment adviser to the Fund pursuant to an investment advisory agreement with the Trust. For its services, the Advisor is entitled to receive an annual investment advisory fee, paid monthly, comprising 0.85% of the average daily net assets of the Fund. Prior to August 3, 2017, the Adviser received an annual investment advisory fee, paid monthly, comprising 1.00% of the average daily net assets of the Fund up to $500 million, 0.95% of average daily net assets of $500 million or more but less than $1 billion and 0.90% of average daily net assets of $1 billion and over. Each class of shares of the Fund bears its respective pro-rata portion of the advisory fee payable by the Fund. The Adviser has contractually agreed to reduce its investment advisory fee and/or reimburse certain expenses of the Fund to the extent necessary to ensure that the Fund’s total operating expenses (excluding any class-specific fees and expenses, interest, extraordinary items, “Acquired Fund Fees and Expenses” and brokerage commissions) do not exceed 0.85% (on an annual basis) of the Fund’s average daily net assets (the “Expense Limitation”). Prior to August 3, 2017
17
LATEEF FOCUSED GROWTH FUND
(formerly Lateef Fund)
Notes to Financial Statements (Continued)
October 31, 2017
(Unaudited)
the Expense Limitation was 0.99%. The Expense Limitation shall remain in effect until August 31, 2018, unless the Board of Trustees of FundVantage Trust (the “Trust”) approves its earlier termination. Each class of shares of the Fund pays its respective pro-rata portion of the advisory fee payable by the Fund.
For the six months ended October 31, 2017, the Adviser earned advisory fees of $491,680 and waived fees of $290,323.
Other Service Providers
BNY Mellon Investment Servicing (US) Inc. (“BNY Mellon”) serves as administrator and transfer agent for the Fund. For providing administrative and accounting services, BNY Mellon is entitled to receive a monthly fee equal to an annual percentage rate of the Fund’s average daily net assets and is subject to certain minimum monthly fees. For providing transfer agent services, BNY Mellon is entitled to receive a monthly fee, subject to certain minimum, and out of pocket expenses.
The Bank of New York Mellon (the “Custodian”) provides certain custodial services to the Fund. The Custodian is entitled to receive a monthly fee, subject to certain minimum, and out of pocket expenses.
Foreside Funds Distributors LLC (the “Underwriter”) provides principal underwriting services to the Fund.
The Trust and the Underwriter are parties to an underwriting agreement. The Trust has adopted a distribution plan for Class A and Class C Shares in accordance with Rule 12b-1 under the 1940 Act. Pursuant to the Class A and Class C Shares plan, the Fund compensates the Underwriter for direct and indirect costs and expenses incurred in connection with advertising, marketing and other distribution services in an amount not to exceed 0.25% and 1.00% (0.75% Rule 12b-1 distribution fee and 0.25% shareholder service fee), respectively, on an annualized basis of the average daily net assets of the Fund’s Class A and Class C Shares.
Trustees and Officers
The Trust is governed by its Board of Trustees. The Trustees receive compensation in the form of an annual retainer and per meeting fees for their services to the Trust. The remuneration paid to the Trustees by the Fund during the six months ended October 31, 2017 was $5,506. An employee of BNY Mellon serves as the Secretary of the Trust and is not compensated by the Fund or the Trust.
JW Fund Management LLC (“JWFM”) provides a Principal Executive Officer and Principal Financial Officer, respectively, to the Trust. JWFM is compensated for the services provided to the Trust.
18
LATEEF FOCUSED GROWTH FUND
(formerly Lateef Fund)
Notes to Financial Statements (Continued)
October 31, 2017
(Unaudited)
Freeh Group International Solutions, LLC provides the Trust with a Chief Compliance Officer and an Anti-Money Laundering Officer.
3. Investment in Securities
For the six months ended October 31, 2017, aggregate purchases and sales of investment securities (excluding short-term investments) of the Fund were as follows:
| Purchases | Sales | |||||||
Investment Securities | $ | 19,363,815 | $ | 37,024,464 | ||||
4. Capital Share Transactions
For the six months ended October 31, 2017 and the year ended April 30, 2017, transactions in capital shares (authorized shares unlimited) were as follows:
| For the Six Months Ended October 31, 2017 (Unaudited) | For the Year Ended April 30, 2017 | |||||||||||||||
| Shares | Amount | Shares | Amount | |||||||||||||
Class A | ||||||||||||||||
Sales | 247,651 | $ | 2,431,885 | 163,870 | $ | 1,595,686 | ||||||||||
Reinvestments | — | — | 616,375 | 5,541,211 | ||||||||||||
Redemptions | (466,021 | ) | (4,606,977 | ) | (3,474,900 | ) | (36,494,751 | ) | ||||||||
|
|
|
|
|
|
|
| |||||||||
Net decrease | (218,370 | ) | $ | (2,175,092 | ) | (2,694,655 | ) | $ | (29,357,854 | ) | ||||||
|
|
|
|
|
|
|
| |||||||||
Class C | ||||||||||||||||
Sales | 6,928 | $ | 60,184 | 189,672 | $ | 1,562,788 | ||||||||||
Reinvestments | — | — | 608,909 | 4,840,824 | ||||||||||||
Redemptions | (460,812 | ) | (4,029,766 | ) | (2,096,716 | ) | (18,994,600 | ) | ||||||||
|
|
|
|
|
|
|
| |||||||||
Net decrease | (453,884 | ) | $ | (3,969,582 | ) | (1,298,135 | ) | $ | (12,590,988 | ) | ||||||
|
|
|
|
|
|
|
| |||||||||
Class I | ||||||||||||||||
Sales | 337,465 | $ | 3,462,905 | 3,242,776 | $ | 33,848,673 | ||||||||||
Reinvestments | — | — | 1,803,204 | 16,639,601 | ||||||||||||
Redemptions | (1,571,501 | ) | (16,053,376 | ) | (30,857,275 | ) | (335,141,714 | ) | ||||||||
|
|
|
|
|
|
|
| |||||||||
Net decrease | (1,234,036 | ) | $ | (12,590,471 | ) | (25,811,295 | ) | $ | (284,653,440 | ) | ||||||
|
|
|
|
|
|
|
| |||||||||
Total Net decrease | (1,906,290 | ) | $ | (18,735,145 | ) | (29,804,085 | ) | $ | (326,602,282 | ) | ||||||
|
|
|
|
|
|
|
| |||||||||
19
LATEEF FOCUSED GROWTH FUND
(formerly Lateef Fund)
Notes to Financial Statements (Continued)
October 31, 2017
(Unaudited)
5. Federal Tax Information
The Fund has followed the authoritative guidance on accounting for and disclosure of uncertainty in tax positions, which requires the Fund to determine whether a tax position is more likely than not to be sustained upon examination, including resolution of any related appeals or litigation processes, based on the technical merits of the position. The Fund has determined that there was no effect on the financial statements from following this authoritative guidance. In the normal course of business, the Fund is subject to examination by federal, state and local jurisdictions, where applicable, for tax years for which applicable statutes of limitations have not expired.
For the year ended April 30, 2017, the tax character of distributions paid by the Fund was $41,240,699 of long-term capital gains dividends.
As of April 30, 2017, the components of distributable earnings on a tax basis were as follows:
Capital Loss | Undistributed | Undistributed | Unrealized | Qualified | ||||
$ — | $— | $21,783,961 | $17,486,248 | $(264,782) |
The differences between the book and tax basis components of distributable earnings relate primarily to the timing and recognition of income and gains for federal income tax purposes. Short term capital gains are reported as ordinary income for federal income tax purposes.
As of October 31, 2017, the federal tax cost, aggregate gross unrealized appreciation and depreciation of securities held by the Fund were as follows:
Federal tax cost | $ | 75,180,124 | ||||
|
| |||||
Gross unrealized appreciation | $ | 26,360,793 | ||||
| Gross unrealized depreciation | (788,262 | ) | |||
Net Unrealized depreciation on written options | (46,010 | ) | ||||
|
| |||||
Net unrealized appreciation | $ | 25,526,521 | ||||
|
|
| * | Because tax adjustments are calculated annually at the end of the Fund’s fiscal year, the above table does not reflect tax adjustments for the current fiscal year. For the previous year’s federal income tax information, please refer to the Notes to Financial Statements section in the Fund’s most recent annual report. |
Pursuant to federal income tax rules applicable to regulated investment companies, the Fund may elect to treat certain capital losses between November 1 and April 30 and late year ordinary losses ((i) ordinary losses between January 1 and April 30, and (ii) specified ordinary and currency losses between November 1 and April 30) as occurring on the first day of the following tax year. For the year ended April 30, 2017 any amount of losses elected within the tax return will not be recognized for federal income tax purposes until May 1, 2017. For the year ended April 30, 2017, the Fund had late-year ordinary loss deferrals of $264,782.
20
LATEEF FOCUSED GROWTH FUND
(formerly Lateef Fund)
Notes to Financial Statements (Concluded)
October 31, 2017
(Unaudited)
Accumulated capital losses represent net capital loss carry forwards as of April 30, 2017 that may be available to offset future realized capital gains and thereby reduce future capital gains distributions. As of April 30, 2017, the Fund did not have any capital loss carry forwards.
6. Subsequent Events
Management has evaluated the impact of all subsequent events on the Fund through the date the financial statements were issued, and has determined that there were no subsequent events requiring recognition or disclosure in the financial statements.
21
LATEEF FOCUSED GROWTH FUND
(formerly Lateef Fund)
Other Information
(Unaudited)
Proxy Voting
Policies and procedures that the Fund uses to determine how to vote proxies relating to portfolio securities as well as information regarding how the Fund voted proxies relating to portfolio securities for the most recent 12-month period ended June 30 are available without charge, upon request, by calling (866) 499-2151 and on the Securities and Exchange Commission’s (“SEC”) website at http:// www.sec.gov.
Quarterly Portfolio Schedules
The Trust files its complete schedule of portfolio holdings with the SEC for the first and third fiscal quarters of each fiscal year (quarters ended July 31 and January 31) on Form N-Q. The Trust’s Forms N-Q will be available on the SEC’s website at http://www.sec.gov and may be reviewed and copied at the SEC’s Public Reference Room in Washington, D.C. Information on the operation of the SEC’s Public Reference Room may be obtained by calling 1-800-SEC-0330.
Meeting of Shareholders
A special meeting of shareholders (the “Meeting”) of the Fund was held on August 3, 2017 for the following purpose:
To approve a new investment advisory agreement between the Trust, on behalf of the Fund, and Lateef Investment Management, L.P.
All Fund shareholders of record at the close of business on May 23, 2017 were entitled to attend or submit proxies. As of the record date, the Fund had 11,509,371 shares outstanding. At the Meeting, shareholders approved the new advisory agreement. The results of the voting for the proposal were as follows:
For Votes | Against Votes | Abstained Votes | Broker Non-Votes | |||
4,587,825 | 42,406 | 63,305 | 1,224,354 |
22
[THIS PAGE INTENTIONALLY LEFT BLANK.]
Investment Adviser
Lateef Investment Management, L.P.
300 Drakes Landing Road
Suite 210
Greenbrae, CA 94904
Administrator
BNY Mellon Investment Servicing (US) Inc.
301 Bellevue Parkway
Wilmington, DE 19809
Transfer Agent
BNY Mellon Investment Servicing (US) Inc.
4400 Computer Drive
Westborough, MA 01581
Principal Underwriter
Foreside Funds Distributors LLC
400 Berwyn Park
899 Cassatt Road
Berwyn, PA 19312
Custodian
The Bank of New York Mellon
225 Liberty Street
New York, NY 10286
Independent Registered Public Accounting Firm
PricewaterhouseCoopers LLP
Two Commerce Square, Suite 1800
2001 Market Street
Philadelphia, PA 19103-7042
Legal Counsel
Pepper Hamilton LLP
3000 Two Logan Square
18th and Arch Streets
Philadelphia, PA 19103
LAT-1017
LATEEF FOCUSED
GROWTH FUND
(formerly Lateef Fund)
of
FundVantage Trust
Class A Shares
Class C Shares
Class I Shares
SEMI-ANNUAL REPORT
October 31, 2017
(Unaudited)
This report is submitted for the general information of the shareholders of the Lateef Fund. It is not authorized for distribution unless preceded or accompanied by a current prospectus for the Lateef Fund.

MOUNT LUCAS U.S. FOCUSED EQUITY FUND
of
FundVantage Trust
Class I
SEMI-ANNUAL REPORT
October 31, 2017
(Unaudited)
This report is submitted for the general information of the shareholders of the Mount Lucas U.S. Focused Equity Fund. It is not authorized for distribution unless preceded or accompanied by a current prospectus for the Mount Lucas U.S. Focused Equity Fund.
MOUNT LUCAS U.S. FOCUSED EQUITY FUND
Semi-Annual Report
Performance Data
October 31, 2017
(Unaudited)
| Average Annual Total Returns for the Periods Ended October 31, 2017 | ||||||||||||
| Six Months† | 1 Year | 3 Years | 5 Years | 10 years | ||||||||
Class I* | 9.05% | 27.94% | 6.05% | 13.79% | 6.32% | |||||||
S&P 500® Index | 9.10% | 23.63% | 10.77% | 15.18% | 7.51% | |||||||
| † | Not annualized. |
| * | Mount Lucas U.S. Focused Equity Fund - Class I (the “Fund”) commenced operations on October 1, 2007. |
The performance data quoted represents past performance and does not guarantee future results. The investment return and principal value of an investment in the Fund will fluctuate so that an investor’s shares, when redeemed, may be worth more or less than their original cost. The table does not reflect the deduction of taxes that a shareholder would pay on Fund distributions or redemption of Fund shares. Current performance may be lower or higher than the performance quoted. Performance data current to the most recent month-end may be obtained by calling (844) 261-6483.
As stated in the current prospectus dated September 1, 2017, the Fund’s “Total Annual Fund Operating Expenses” and “Total Annual Fund Operating Expenses After Fee Waiver and/or Expense Reimbursement” are 1.64% and 0.95%, respectively, for Class I shares of the Fund’s average daily net assets. These rates may fluctuate and may differ from the actual expenses incurred by the Fund for the period covered by this report. Mount Lucas Management LP (the “Adviser”) has contractually agreed to waive fees and/or reimburse expenses in order to limit the Fund’s “Total Annual Fund Operating Expenses” (excluding taxes, any class-specific fees and expenses (such as Rule 12b-1 distribution fees, shareholder service fees, or transfer agency fees), “Acquired Fund Fees and Expenses,” extraordinary items, brokerage commissions and interest) to, as a percentage of average daily net assets, 0.95% with respect to Class I shares (the “Expense Limitation”). The Expense Limitation will remain in place until August 31, 2018, unless the Board of Trustees (“Board of Trustees”) of FundVantage Trust (the “Trust”) approves its earlier termination. The Adviser may recoup any expenses or fees it has reimbursed within a three-year period from the year in which the Adviser reduced its compensation and/or assumed expenses of the Fund. The Adviser is permitted to seek reimbursement from the Fund, subject to certain limitations, for fees it waived and Fund expenses it paid to the extent the total annual fund operating expenses do not exceed the limits described above or any lesser limits in effect as the time of reimbursement. No recoupment will occur unless the Fund’s expenses are below the Expense Limitation amount. Total returns would be lower had such fees and/or expenses not been waived and/or reimbursed.
The Fund operated as a series of Scotia Institutional Funds prior to the opening of business on March 24, 2014 (the “Predecessor Fund”), at which time, the Predecessor Fund was reorganized into the Fund. Before the Fund commenced operations, all of the assets and liabilities of the Predecessor Fund were transferred to the Fund in a tax free reorganization (the “Reorganization”). The Reorganization occurred at the opening of business on March 24, 2014. As a result of the Reorganization, the Fund assumed the performance and accounting history of the Predecessor Fund prior to the date of the Reorganization. The Fund has the same investment objective and strategies as the Predecessor Fund. The Performance shown for periods prior to March 24, 2014 represents the performance for the Predecessor Fund.
Mutual fund investing involves risk. The value of the Fund’s investments in equity securities may fluctuate drastically from day-to-day causing volatility and possible loss of principal. The Fund may invest in undervalued securities and is subject to the risk that the securities may not appreciate in value as anticipated.
The Fund is non-diversified and invests in a limited number of securities. As a result, the Fund’s investment performance may be more volatile, as it may be more susceptible to risks associated with a single economic, political, or regulatory event than a fund that invests in a greater number of issuers.
The Fund intends to evaluate performance as compared to that of the Standard & Poor’s 500® Composite Price Index (“S&P 500®”). The S&P 500® is a widely recognized, unmanaged index of 500 common stocks which are generally representative of the U.S. stock market as a whole. It is impossible to invest directly in an index.
2
MOUNT LUCAS U.S. FOCUSED EQUITY FUND
Fund Expense Disclosure
October 31, 2017
(Unaudited)
As a shareholder of the Fund, you incur two types of costs: (1) transaction costs including sales charges (loads) on purchase payments, if any, or redemption fees; and (2) ongoing costs, including management fees, distribution and/or service (Rule 12b-1) fees, if any, and other Fund expenses. These examples are intended to help you understand your ongoing costs (in dollars) of investing in the Fund and to compare these costs with the ongoing costs of investing in other mutual funds.
This example is based on an investment of $1,000 invested at the beginning of the six-month period from May 1, 2017 through October 31, 2017 and held for the entire period.
Actual Expenses
The first line of the accompanying table provides information about actual account values and actual expenses. You may use the information in this line, together with the amount you invested, to estimate the expenses that you paid over the period. Simply divide your account value by $1,000 (for example, an $8,600 account value divided by $1,000 = 8.6), then multiply the result by the number in the first line under the heading entitled “Expenses Paid During Period” to estimate the expenses you paid on your account during this period.
Hypothetical Examples for Comparison Purposes
The second line of the accompanying table provides information about hypothetical account values and hypothetical expenses based on the Fund’s actual expense ratio and an assumed rate of return of 5% per year before expenses, which is not your Fund’s actual return. The hypothetical account values and expenses may not be used to estimate the actual ending account balance or expenses you paid for the period. You may use this information to compare the ongoing costs of investing in the Fund and other funds. To do so, compare these 5% hypothetical examples with the 5% hypothetical examples that appear in the shareholder reports of other funds.
Please note that the expenses shown in the accompanying table are meant to highlight your ongoing costs only and do not reflect any transactional costs, such as sales charges on purchase payments, if any, or redemption fees. Therefore, the second line of the accompanying table is useful in comparing ongoing costs only, and will not help you determine the relative total costs of owning different funds. In addition, if these transactional costs were included, your costs would have been higher.
| Mount Lucas U.S. Focused Equity Fund | |||||||||||||||
| Beginning Account Value May 1, 2017 | Ending Account Value October 31, 2017 | Expenses Paid During Period* | |||||||||||||
Class I | |||||||||||||||
Actual | $ | 1,000.00 | $ | 1,090.50 | $ | 5.01 | |||||||||
Hypothetical (5% return before expenses) | 1,000.00 | 1,020.42 | 4.84 | ||||||||||||
| * | Expenses are equal to the annualized expense ratio for the six-month period ended October 31, 2017 of 0.95% for Class I shares, multiplied by the average account value over the period, multiplied by the number of days in the most recent period (184), then divided by 365 to reflect the period. The Fund’s ending account value on the first line in the table is based on the actual six-month total return for the Fund of 9.05% for Class I shares. |
3
MOUNT LUCAS U.S. FOCUSED EQUITY FUND
Portfolio Holdings Summary Table
October 31, 2017
(Unaudited)
The following table presents a summary by sector of the portfolio holdings of the Fund:
| % of Net Assets | Value | |||||||||
COMMON STOCKS: | ||||||||||
Financials | 35.8 | % | $ | 3,776,951 | ||||||
Consumer Discretionary | 28.1 | 2,969,583 | ||||||||
Information Technology | 13.6 | 1,432,027 | ||||||||
Energy | 13.0 | 1,367,258 | ||||||||
Industrials | 7.1 | 753,006 | ||||||||
Health Care | 2.1 | 224,095 | ||||||||
Other Assets in Excess of Liabilities | 0.3 | 31,873 | ||||||||
|
|
|
| |||||||
NET ASSETS | 100.0 | % | $ | 10,554,793 | ||||||
|
|
|
| |||||||
Portfolio holdings are subject to change at any time.
The accompanying notes are an integral part of the financial statements.
4
MOUNT LUCAS U.S. FOCUSED EQUITY FUND
Portfolio of Investments
October 31, 2017
(Unaudited)
| Number of Shares | Value | |||||||
COMMON STOCKS — 99.7% | ||||||||
Consumer Discretionary — 28.1% |
| |||||||
Best Buy Co., Inc. | 16,095 | $ | 900,998 | |||||
Carnival Corp. (Panama) | 6,688 | 444,016 | ||||||
Ford Motor Co. | 34,406 | 422,162 | ||||||
Gap, Inc. (The) | 14,410 | 374,516 | ||||||
Kohl’s Corp. | 8,863 | 370,119 | ||||||
Macy’s, Inc. | 18,823 | 353,119 | ||||||
McDonald’s Corp. | 627 | 104,653 | ||||||
|
| |||||||
| 2,969,583 | ||||||||
|
| |||||||
Energy — 13.0% | ||||||||
Andeavor | 4,492 | 477,230 | ||||||
Marathon Petroleum Corp. | 7,461 | 445,720 | ||||||
Valero Energy Corp. | 5,632 | 444,308 | ||||||
|
| |||||||
| 1,367,258 | ||||||||
|
| |||||||
Financials — 35.8% | ||||||||
Aflac, Inc. | 5,298 | 444,449 | ||||||
Allstate Corp. (The) | 1,097 | 102,964 | ||||||
Arthur J Gallagher & Co. | 1,684 | 106,648 | ||||||
Everest Re Group, Ltd. (Bermuda) | 1,752 | 416,012 | ||||||
Lincoln National Corp. | 5,528 | 418,912 | ||||||
Navient Corp. | 28,390 | 353,739 | ||||||
Principal Financial Group, Inc. | 6,025 | 396,746 | ||||||
Progressive Corp. (The) | 2,089 | 101,630 | ||||||
Torchmark Corp. | 1,213 | 102,050 | ||||||
Unum Group | 15,972 | 831,183 | ||||||
US Bancorp | 1,753 | 95,328 | ||||||
XL Group, Ltd. (Bermuda) | 10,064 | 407,290 | ||||||
|
| |||||||
| 3,776,951 | ||||||||
|
| |||||||
Health Care — 2.1% | ||||||||
UnitedHealth Group, Inc. | 1,066 | 224,095 | ||||||
|
| |||||||
| Number of Shares | Value | |||||||
COMMON STOCKS — (Continued) |
| |||||||
Industrials — 7.1% | ||||||||
Boeing Co. (The) | 926 | $ | 238,889 | |||||
General Dynamics Corp. | 501 | 101,693 | ||||||
Illinois Tool Works, Inc. | 711 | 111,286 | ||||||
Republic Services, Inc. | 3,025 | 196,837 | ||||||
Roper Technologies, Inc. | 404 | 104,301 | ||||||
|
| |||||||
| 753,006 | ||||||||
|
| |||||||
Information Technology — 13.6% |
| |||||||
Amphenol Corp., Class A | 2,524 | 219,588 | ||||||
Corning, Inc. | 14,067 | 440,438 | ||||||
DXC Technology Co. | 1,444 | 132,155 | ||||||
Harris Corp. | 760 | 105,884 | ||||||
Hewlett Packard Enterprise Co. | 16,858 | 234,663 | ||||||
Mastercard, Inc., Class A | 704 | 104,734 | ||||||
Micro Focus International PLC, SP ADR* | 2,301 | 80,374 | ||||||
Texas Instruments, Inc. | 1,181 | 114,191 | ||||||
|
| |||||||
| 1,432,027 | ||||||||
|
| |||||||
TOTAL COMMON STOCKS | 10,522,920 | |||||||
|
| |||||||
TOTAL INVESTMENTS - 99.7% | 10,522,920 | |||||||
|
| |||||||
OTHER ASSETS IN EXCESS OF | 31,873 | |||||||
|
| |||||||
NET ASSETS - 100.0% | $ | 10,554,793 | ||||||
|
| |||||||
| * | Non-income producing. |
PLC Public Limited Company
SP ADR Sponsored American Depository Receipt
The accompanying notes are an integral part of the financial statements.
5
MOUNT LUCAS U.S. FOCUSED EQUITY FUND
Statement of Assets and Liabilities
October 31, 2017
(Unaudited)
Assets | ||||
Investments, at value (Cost $9,538,076) | $ | 10,522,920 | ||
Cash | 17,949 | |||
Receivable for investments sold | 69,660 | |||
Dividends and interest receivable | 12,060 | |||
Receivable from Investment Adviser | 13,563 | |||
Prepaid expenses and other assets | 33,589 | |||
|
| |||
Total assets | 10,669,741 | |||
|
| |||
Liabilities | ||||
Payable for capital shares redeemed | 38,046 | |||
Payable for administration and accounting fees | 23,773 | |||
Payable for custodian fees | 16,543 | |||
Payable for audit fees | 14,514 | |||
Payable for printing fees | 12,672 | |||
Payable for transfer agent fees | 5,727 | |||
Payable for legal fees | 1,024 | |||
Payable for investments purchased | 678 | |||
Other accrued expenses | 1,971 | |||
|
| |||
Total liabilities | 114,948 | |||
|
| |||
Net Assets | $ | 10,554,793 | ||
|
| |||
Net Assets consisted of: | ||||
Capital stock, $0.01 par value | $ | 10,074 | ||
Paid-in capital | 11,726,070 | |||
Accumulated net investment income | 759,249 | |||
Accumulated net realized loss from investments | (2,925,444 | ) | ||
Net unrealized appreciation on investments | 984,844 | |||
|
| |||
Net Assets | $ | 10,554,793 | ||
|
|
Class I: | ||||
Net asset value, offering and redemption price per share | $ | 10.48 | ||
|
|
The accompanying notes are an integral part of the financial statements.
6
MOUNT LUCAS U.S. FOCUSED EQUITY FUND
Statement of Operations
For the Six Months Ended October 31, 2017
(Unaudited)
Investment income | ||||
Dividends | $ | 187,959 | ||
|
| |||
Total investment income | 187,959 | |||
|
| |||
Expenses | ||||
Advisory fees (Note 2) | 51,044 | |||
Administration and accounting fees (Note 2) | 33,512 | |||
Custodian fees (Note 2) | 16,606 | |||
Legal fees | 16,439 | |||
Trustees’ and officers’ fees (Note 2) | 15,172 | |||
Audit fees | 14,549 | |||
Transfer agent fees (Note 2) | 13,699 | |||
Registration and filing fees | 11,659 | |||
Printing and shareholder reporting fees | 8,536 | |||
Other expenses | 7,120 | |||
|
| |||
Total expenses before waivers and reimbursements | 188,336 | |||
|
| |||
Less: waivers and reimbursements (Note 2) | (123,679 | ) | ||
|
| |||
Net expenses after waivers and reimbursements | 64,657 | |||
|
| |||
Net investment income | 123,302 | |||
|
| |||
Net realized and unrealized gain from investments: | ||||
Net realized gain from investments | 1,348,972 | |||
Net change in unrealized appreciation/(depreciation) on investments | (283,668 | ) | ||
|
| |||
Net realized and unrealized gain on investments | 1,065,304 | |||
|
| |||
Net increase in net assets resulting from operations | $ | 1,188,606 | ||
|
|
The accompanying notes are an integral part of the financial statements.
7
MOUNT LUCAS U.S. FOCUSED EQUITY FUND
Statements of Changes in Net Assets
| For the Six Months Ended October 31, 2017 (Unaudited) | For the Year Ended April 30, 2017 | |||||||||
Increase/(decrease) in net assets from operations: | ||||||||||
Net investment income | $ | 123,302 | $ | 639,350 | ||||||
Net realized gain from investments | 1,348,972 | 267,393 | ||||||||
Net change in unrealized appreciation/(depreciation) on investments | (283,668 | ) | 1,174,228 | |||||||
|
|
|
| |||||||
Net increase in net assets resulting from operations | 1,188,606 | 2,080,971 | ||||||||
|
|
|
| |||||||
Less dividends and distributions to shareholders from: | ||||||||||
Net investment income | ||||||||||
Class I | — | (782,077 | ) | |||||||
|
|
|
| |||||||
Net decrease in net assets from dividends and distributions to shareholders | — | (782,077 | ) | |||||||
|
|
|
| |||||||
Decrease in net assets derived from capital share transactions (Note 4) | (6,524,702 | ) | (30,229,815 | ) | ||||||
|
|
|
| |||||||
Total decrease in net assets | (5,336,096 | ) | (28,930,921 | ) | ||||||
|
|
|
| |||||||
Net assets | ||||||||||
Beginning of period | 15,890,889 | 44,821,810 | ||||||||
|
|
|
| |||||||
End of period | $ | 10,554,793 | $ | 15,890,889 | ||||||
|
|
|
| |||||||
Accumulated net investment income, end of period | $ | 759,249 | $ | 635,947 | ||||||
|
|
|
| |||||||
The accompanying notes are an integral part of the financial statements.
8
MOUNT LUCAS U.S. FOCUSED EQUITY FUND
Financial Highlights
Contained below is per share operating performance data for Class I shares outstanding, total investment return, ratios to average net assets and other supplemental data for the respective period. The total returns in the table represent the rate that an investor would have earned or lost on an investment in the Fund (assuming reinvestment of all dividends and distributions). This information has been derived from information provided in the financial statements and should be read in conjunction with the financial statements and the notes thereto.
| For the Six Months Ended October 31, 2017 (Unaudited) | For the Year Ended April 30, 2017 | For the Year Ended April 30, 2016 | For the Year Ended April 30, 2015 | For the Seven Months Ended April 30, 2014(1)(2) | For the Year Ended September 30, 2013(2) | For the Year Ended September 30, 2012(2) | |||||||||||||||||||||||||||||
Per Share Operating Performance | |||||||||||||||||||||||||||||||||||
Net asset value, beginning of period | $ | 9.61 | $ | 8.66 | $ | 10.01 | $ | 11.92 | $ | 11.19 | $ | 8.72 | $ | 7.09 | |||||||||||||||||||||
|
|
|
|
|
|
|
|
|
|
|
|
|
| ||||||||||||||||||||||
Net investment income(3) | 0.09 | 0.19 | 0.14 | 0.15 | 0.14 | 0.17 | 0.12 | ||||||||||||||||||||||||||||
Net realized and unrealized gain/(loss) on investments | 0.78 | 1.17 | (1.15 | ) | 0.79 | 2.08 | 2.43 | 1.66 | |||||||||||||||||||||||||||
|
|
|
|
|
|
|
|
|
|
|
|
|
| ||||||||||||||||||||||
Net increase/(decrease) in net assets resulting from operations | 0.87 | 1.36 | (1.01 | ) | 0.94 | 2.22 | 2.60 | 1.78 | |||||||||||||||||||||||||||
|
|
|
|
|
|
|
|
|
|
|
|
|
| ||||||||||||||||||||||
Dividends and distributions to shareholders from: | |||||||||||||||||||||||||||||||||||
Net investment income | — | (0.41 | ) | (0.04 | ) | (0.22 | ) | (0.13 | ) | (0.13 | ) | (0.16 | ) | ||||||||||||||||||||||
Net realized capital gains | — | — | (0.30 | ) | (2.63 | ) | (1.36 | ) | — | — | |||||||||||||||||||||||||
|
|
|
|
|
|
|
|
|
|
|
|
|
| ||||||||||||||||||||||
Total dividends and distributions to shareholders | — | (0.41 | ) | (0.34 | ) | (2.85 | ) | (1.49 | ) | (0.13 | ) | (0.16 | ) | ||||||||||||||||||||||
|
|
|
|
|
|
|
|
|
|
|
|
|
| ||||||||||||||||||||||
Adviser Contribution | — | — | — | — | — | — | 0.01 | ||||||||||||||||||||||||||||
|
|
|
|
|
|
|
|
|
|
|
|
|
| ||||||||||||||||||||||
Net asset value, end of period | $ | 10.48 | $ | 9.61 | $ | 8.66 | $ | 10.01 | $ | 11.92 | $ | 11.19 | $ | 8.72 | |||||||||||||||||||||
|
|
|
|
|
|
|
|
|
|
|
|
|
| ||||||||||||||||||||||
Total investment return(4) | 9.05 | % | 15.83 | % | (10.09 | )% | 8.81 | % | 20.54 | % | 30.16 | % | 25.38 | %(5) | |||||||||||||||||||||
Ratios/Supplemental Data | |||||||||||||||||||||||||||||||||||
Net assets, end of period (in thousands) | $ | 10,555 | $ | 15,891 | $ | 44,822 | $ | 58,645 | $ | 59,166 | $ | 45,540 | $ | 26,060 | |||||||||||||||||||||
Ratio of expenses to average net assets | 0.95 | %(6) | 0.95 | % | 0.95 | % | 0.95 | % | 0.95 | %(6) | 0.95 | % | 0.95 | % | |||||||||||||||||||||
Ratio of expenses to average net assets without waivers and expense reimbursements(7) | 2.77 | %(6) | 1.64 | % | 1.31 | % | 1.23 | % | 1.18 | %(6) | 1.25 | % | 1.74 | % | |||||||||||||||||||||
Ratio of net investment income to average net assets | 1.81 | %(6) | 2.20 | % | 1.54 | % | 1.31 | % | 2.09 | %(6) | 1.70 | % | 1.50 | % | |||||||||||||||||||||
Portfolio turnover rate | 31.72 | %(8) | 92.10 | % | 95.16 | % | 102.75 | % | 53.87 | %(8) | 103.55 | % | 118.67 | % | |||||||||||||||||||||
| (1) | The Fund changed its fiscal year end to April 30. |
| (2) | Effective prior to the opening of business on March 24, 2014, the Fund acquired substantially all of the assets and liabilities of the Mount Lucas U.S. Focused Equity Fund, a series of Scotia Institutional Funds (the “Predecessor Fund”). The financial highlights for the periods prior to that date reflects the performance of the Predecessor Fund. |
| (3) | Calculated based on the average number of shares outstanding during the period. |
| (4) | Total investment return is calculated assuming a purchase of shares on the first day and a sale of shares on the last day of each period reported and includes reinvestment of dividends and distributions, if any. Total return for periods less than one year are not annualized. |
| (5) | Absent a capital contribution between the Predecessor Fund and the investment adviser to the Predecessor Fund, total return would have been 25.23% for the year ended September 30, 2012. |
| (6) | Annualized. |
| (7) | During the period, certain fees were waived and/or reimbursed. If such fee waivers and/or reimbursements had not occurred, the ratios would have been as indicated (See Note 2). |
| (8) | Not annualized. |
The accompanying notes are an integral part of the financial statements.
9
MOUNT LUCAS U.S. FOCUSED EQUITY FUND
Notes to Financial Statements
October 31, 2017
(Unaudited)
1. Organization and Significant Accounting Policies
The Mount Lucas U.S. Focused Equity Fund (the “Fund”) is a non-diversified, open-end management investment company registered under the Investment Company Act of 1940, as amended (the “1940 Act”). The Fund is a separate series of FundVantage Trust (the “Trust”) which was organized as a Delaware statutory trust on August 28, 2006. The Trust is a “series trust” authorized to issue an unlimited number of separate series or classes of shares of beneficial interest. Each series is treated as a separate entity for certain matters under the 1940 Act, and for other purposes, and a shareholder of one series is not deemed to be a shareholder of any other series. The Fund offers separate classes of shares, Class I shares and Class II shares. As of October 31, 2017, Class II shares have not been issued.
The Fund is an investment company and follows accounting and reporting guidance in the Financial Accounting Standards Board Accounting Standards Codification Topic 946.
Portfolio Valuation — The Fund’s net asset value (“NAV”) is calculated once daily at the close of regular trading hours on the New York Stock Exchange (“NYSE”) (typically 4:00 p.m. Eastern time) on each day the NYSE is open. Securities held by the Fund are valued using the closing price or the last sale price on a national securities exchange or the National Association of Securities Dealers Automatic Quotation System (“NASDAQ”) market system where they are primarily traded. Equity securities traded in the over-the-counter market are valued at their closing prices. If there were no transactions on that day, securities traded principally on an exchange or on NASDAQ will be valued at the mean of the last bid and ask prices prior to the market close. Investments in other open-end investment companies are valued based on the NAV of the investment companies (which may use fair value pricing as discussed in their prospectuses). If market quotations are unavailable or deemed unreliable, securities will be valued in accordance with procedures adopted by the Trust’s Board of Trustees (“Board of Trustees”). Relying on prices supplied by pricing services or dealers or using fair valuation may result in values that are higher or lower than the values used by other investment companies and investors to price the same investments. In the event that market quotes are not readily available, and the security or asset cannot be valued pursuant to one of the valuation methods, the value of the security or asset will be determined in good faith by the Adviser. The Trust has established a Valuation Committee which performs certain functions including the oversight of the Adviser’s fair valuation determinations.
Fair Value Measurements — The inputs and valuation techniques used to measure fair value of the Fund’s investments are summarized into three levels as described in the hierarchy below:
• Level 1 — | quoted prices in active markets for identical securities; | |
• Level 2 — | other significant observable inputs (including quoted prices for similar securities, interest rates, prepayment speeds, credit risk, etc.); and | |
• Level 3 — | significant unobservable inputs (including the Fund’s own assumptions in determining the fair value of investments). | |
The inputs or methodology used for valuing securities are not necessarily an indication of the risk associated with investing in those securities.
The following is a summary of the inputs used, as of October 31, 2017, in valuing the Fund’s investments carried at fair value:
| Total Value at 10/31/17 | Level 1 Quoted Price | Level 2 Other Significant Observable Inputs | Level 3 Significant Unobservable Inputs | |||||||||||||
Common Stocks* | $ | 10,522,920 | $ | 10,522,920 | $ | — | $ | — | ||||||||
|
|
|
|
|
|
|
| |||||||||
| * | Please refer to Portfolio of Investments for further details on portfolio holdings. |
10
MOUNT LUCAS U.S. FOCUSED EQUITY FUND
Notes to Financial Statements (Continued)
October 31, 2017
(Unaudited)
At the end of each quarter, management evaluates the classification of Levels 1, 2 and 3 assets and liabilities. Various factors are considered, such as changes in liquidity from the prior reporting period; whether or not a broker is willing to execute at the quoted price; the depth and consistency of prices from third party pricing services; and the existence of contemporaneous, observable trades in the market. Additionally, management evaluates the classification of Level 1 and Level 2 assets and liabilities on a quarterly basis for changes in listings or delistings on national exchanges.
Due to the inherent uncertainty of determining the fair value of investments that do not have a readily available market value, the fair value of the Fund’s investments may fluctuate from period to period. Additionally, the fair value of investments may differ significantly from the values that would have been used had a ready market existed for such investments and may differ materially from the values the Fund may ultimately realize. Further, such investments may be subject to legal and other restrictions on resale or otherwise less liquid than publicly traded securities.
For fair valuations using significant unobservable inputs, U.S. generally accepted accounting principles (“U.S. GAAP”) require the Fund to present a reconciliation of the beginning to ending balances for reported market values that presents changes attributable to total realized and unrealized gains or losses, purchase and sales, and transfers in and out of Level 3 during the period. Transfers in and out between Levels are based on values at the end of the period. U.S. GAAP also requires the Fund to disclose amounts and reasons for all transfers in and out of Level 1 and Level 2 fair value measurements. A reconciliation of Level 3 investments is presented only when the Fund had an amount of Level 3 investments at the end of the reporting period that was meaningful in relation to its net assets. The amounts and reasons for all transfers in and out of each Level within the three-tier hierarchy are disclosed when the Fund had an amount of total transfers during the reporting period that was meaningful in relation to its net assets as of the end of the reporting period.
For the six months ended October 31, 2017, there were no transfers between Levels 1, 2 and 3 for the Fund.
Use of Estimates — The preparation of financial statements in conformity with U.S. GAAP requires management to make estimates and assumptions that affect the amounts reported in the financial statements and accompanying notes at the date of the financial statements and the reported amounts of revenues and expenses during the period. Actual results could differ from those estimates and those differences could be material.
Investment Transactions, Investment Income and Expenses — Investment transactions are recorded on trade date for financial statement preparation purposes. Realized gains and losses on investments sold are recorded on the identified cost basis. Interest income is recorded on the accrual basis. Dividends are recorded on the ex-dividend date. Estimated components of distributions received from real estate investment trusts may be considered income, return of capital distributions or capital gain distributions. Return of capital distributions are recorded as a reduction of cost of the related investment. General expenses of the Trust are generally allocated to each fund in proportion to its relative daily net assets. Expenses directly attributable to a particular fund in the Trust are charged directly to that fund.
Dividends and Distributions to Shareholders — Dividends from net investment income and distributions from net realized capital gains, if any, are declared, recorded on ex-date and paid at least annually to shareholders. Income dividends and capital gain distributions are determined in accordance with U.S. federal income tax regulations, which may differ from U.S. GAAP. These differences may include the treatment of non-taxable dividends, expiring capital loss carryforwards and losses deferred due to wash sales and excise tax regulations. Permanent book and tax basis differences relating to shareholder distributions will result in reclassifications within the components of net assets.
U.S. Tax Status — No provision is made for U.S. income taxes as it is the Fund’s intention to continue to qualify for and elect the tax treatment applicable to regulated investment companies under Subchapter M of the Internal Revenue Code of 1986, as amended (the “Internal Revenue Code”), and make the requisite distributions to its shareholders which will be sufficient to relieve it from U.S. income and excise taxes.
11
MOUNT LUCAS U.S. FOCUSED EQUITY FUND
Notes to Financial Statements (Continued)
October 31, 2017
(Unaudited)
Other — In the normal course of business, the Fund may enter into contracts that provide general indemnifications. The Fund’s maximum exposure under these arrangements is dependent on claims that may be made against the Fund in the future, and therefore, cannot be estimated; however, based on experience, the risk of material loss for such claims is considered remote.
Recent Accounting Pronouncement — On August 1, 2017, the Fund implemented changes due to amendments to Regulation S-X, issued by the Securities and Exchange Commission, which require standardized, enhanced disclosures, particularly related to derivatives, in investment company financial statements. Adoption of the amendments had no effect on the Fund’s net assets or results of operations.
2. Transactions with Related Parties and Other Service Providers
Mount Lucas Management LP (“Mount Lucas” or the “Adviser”) serves as investment adviser to the Fund pursuant to an investment advisory agreement with the Trust. For its services, the Adviser is entitled to an investment advisory fee of 0.75% (on an annualized basis), which is calculated daily and paid monthly based on the average daily net assets of the Fund. The Adviser has contractually agreed to reduce its investment advisory fee and/or reimburse certain expenses of the Fund to the extent necessary to ensure that the Fund’s total operating expenses (excluding taxes, “Acquired Fund Fees and Expenses,” extraordinary items, brokerage commissions and interest) do not exceed 0.95% (on an annual basis) of the Fund’s average daily net assets of Class I shares (the “Expense Limitation”). The Expense Limitation shall remain in effect until August 31, 2018, unless the Board of Trustees approves its earlier termination. Subject to approval by the Board of Trustees, the Adviser may recoup any expenses or fees it has reimbursed within a three-year period from the year in which the Adviser reduced its compensation and/or assumed expenses of the Fund. The Adviser is permitted to seek reimbursement from the Fund, subject to certain limitations, for fees it waived and Fund expenses it paid to the extent the total annual fund operating expenses do not exceed the limits described above or any lesser limits in effect as the time of reimbursement. No recoupment will occur unless the Fund’s expenses are below the Expense Limitation amount. At October 31, 2017, the amount of potential recovery was as follows:
| Expiration | ||||||||
April 30, 2018 | April 30, 2019 | April 30, 2020 | April 30, 2021 | Total | ||||
$164,223 | $184,461 | $200,931 | $123,679 | $673,294 |
For the six months ended October 31, 2017, the Adviser earned advisory fees of $51,044 and waived and reimbursed fees of $123,679.
Other Service Providers
BNY Mellon Investment Servicing (US) Inc. (“BNY Mellon”) serves as administrator and transfer agent for the Fund. For providing administrative and accounting services, BNY Mellon is entitled to receive a monthly fee equal to an annual percentage rate of the Fund’s average daily net assets and is subject to certain minimum monthly fees. For providing transfer agency services, BNY Mellon is entitled to receive a monthly fee, subject to certain minimum, and out of pocket expenses.
The Bank of New York Mellon (the “Custodian”) provides certain custodial services to the Fund. The Custodian is entitled to receive a monthly fee, subject to certain minimum, and out of pocket expenses.
Foreside Funds Distributors LLC (the “Underwriter”) provides principal underwriting services to the Fund pursuant to an underwriting agreement between the Trust and the Underwriter.
12
MOUNT LUCAS U.S. FOCUSED EQUITY FUND
Notes to Financial Statements (Continued)
October 31, 2017
(Unaudited)
Trustees and Officers
The Trust is governed by its Board of Trustees. The Trustees receive compensation in the form of an annual retainer and per meeting fees for their services to the Trust. The remuneration paid to the Trustees by the Fund during the six months ended October 31, 2017 was $2,909. An employee of BNY Mellon serves as the Secretary of the Trust and is not compensated by the Fund or the Trust.
JW Fund Management LLC (“JWFM”) provides a Principal Executive Officer and Principal Financial Officer, respectively, to the Trust. JWFM is compensated for the services provided to the Trust.
Freeh Group International Solutions, LLC provides the Trust with a Chief Compliance Officer and an Anti-Money Laundering Officer.
3. Investment in Securities
For the six months ended October 31, 2017, aggregate purchases and sales of investment securities (excluding short-term investments) of the Fund were as follows:
| Purchases | Sales | |||||||
Investment Securities | $ | 4,219,534 | $ | 10,638,210 | ||||
4. Capital Share Transactions
For the six months ended October 31, 2017 and the year ended April 30, 2017, transactions in capital shares (authorized shares unlimited) were as follows:
| For the Six Months Ended October 31, 2017 (Unaudited) | For the Year Ended April 30, 2017 | |||||||||||||||
| Shares | Value | Shares | Value | |||||||||||||
Class I | ||||||||||||||||
Sales | 10,951 | $ | 109,047 | 127,994 | $ | 1,116,433 | ||||||||||
Reinvestments | — | — | 79,574 | 751,976 | ||||||||||||
Redemptions | (657,942 | ) | (6,633,749 | ) | (3,730,941 | ) | (32,098,224 | ) | ||||||||
|
|
|
|
|
|
|
| |||||||||
Net Decrease | (646,991 | ) | $ | (6,524,702 | ) | (3,523,373 | ) | $ | (30,229,815 | ) | ||||||
|
|
|
|
|
|
|
| |||||||||
5. Federal Tax Information
The Fund has followed the authoritative guidance on accounting for and disclosure of uncertainty in tax positions, which requires the Fund to determine whether a tax position is more likely than not to be sustained upon examination, including resolution of any related appeals or litigation processes, based on the technical merits of the position. The Fund has determined that there was no effect on the financial statements from following this authoritative guidance. In the normal course of business, the Fund is subject to examination by federal, state and local jurisdictions, where applicable, for tax years for which applicable statutes of limitations have not expired.
For the year ended April 30, 2017, the tax character of distributions paid by the Fund was $782,077 of ordinary income dividends. Distributions from net investment income and short-term capital gains are treated as ordinary income for federal income tax purposes.
13
MOUNT LUCAS U.S. FOCUSED EQUITY FUND
Notes to Financial Statements (Concluded)
October 31, 2017
(Unaudited)
As of April 30, 2017, the components of distributable earnings on a tax basis were as follows:
Capital Loss Carryforward | Undistributed Ordinary | Undistributed | Unrealized Appreciation | Other Book/Tax | ||||
$(4,228,915) | $638,818 | $— | $1,223,011 | $(2,871) |
The differences between the book and tax basis unrealized depreciation are attributable primarily to the tax deferral of losses on wash sales.
As of October 31, 2017, the federal tax cost, aggregate gross unrealized appreciation and depreciation of securities held by the Fund were as follows:
Federal tax cost* | $ | 9,538,076 | ||||
|
| |||||
Gross unrealized appreciation | $ | 1,152,302 | ||||
Gross unrealized depreciation | (167,458 | ) | ||||
|
| |||||
Net unrealized appreciation | $ | 984,844 | ||||
|
|
| * | Because tax adjustments are calculated annually at the end of the Fund’s fiscal year, the above table does not reflect tax adjustments for the current fiscal year. For the previous year’s federal income tax information, please refer to the Notes to Financial Statements section in the Fund’s most recent annual report. |
Pursuant to federal income tax rules applicable to regulated investment companies, the Fund may elect to treat certain capital losses between November 1 and April 30 and late year ordinary losses ((i) ordinary losses between January 1 and April 30, and (ii) specified ordinary and currency losses between November 1 and April 30) as occurring on the first day of the following tax year. For the year ended April 30, 2017, the Fund had no short-term capital loss deferrals, no long-term capital loss deferrals or ordinary loss deferrals.
Accumulated capital losses represent net capital loss carry forwards as of April 30, 2017 that may be available to offset future realized capital gains and thereby reduce future capital gains distributions. As of April 30, 2017, the Fund had a capital loss carryforward of $4,228,915, of which $3,548,040 are long-term losses and $680,875 are short-term losses and have an unlimited period of capital loss carryforward.
6. Subsequent Events
Management has evaluated the impact of all subsequent events on the Fund through the date the financial statements were issued, and has determined that there were no subsequent events requiring recognition or disclosure in the financial statements.
14
MOUNT LUCAS U.S. FOCUSED EQUITY FUND
Other Information
(Unaudited)
Proxy Voting
Policies and procedures that the Fund uses to determine how to vote proxies relating to portfolio securities as well as information regarding how the Fund voted proxies relating to portfolio securities for the most recent 12-month period ended June 30 are available without charge, upon request, by calling (844) 261-6483 and on the Securities and Exchange Commission’s (“SEC”) website at http://www.sec.gov.
Quarterly Portfolio Schedules
The Trust files its complete schedule of portfolio holdings with the SEC for the first and third fiscal quarters of each fiscal year (quarters ended July 31 and January 31) on Form N-Q. The Trust’s Forms N-Q are available on the SEC’s website at http://www.sec.gov and may be reviewed and copied at the SEC’s Public Reference Room in Washington, D.C. Information on the operation of the SEC’s Public Reference Room may be obtained by calling 1-800-SEC-0330.
15
Investment Adviser
Mount Lucas Management LP
405 South State Street
Newtown, PA 18940
Administrator
BNY Mellon Investment Servicing (US) Inc.
301 Bellevue Parkway
Wilmington, DE 19809
Transfer Agent
BNY Mellon Investment Servicing (US) Inc.
4400 Computer Drive
Westborough, MA 01581
Principal Underwriter
Foreside Funds Distributors LLC
400 Berwyn Park
899 Cassatt Road
Berwyn, PA 19312
Custodian
The Bank of New York Mellon
225 Liberty Street
New York, NY 10286
Independent Registered Public Accounting Firm
Ernst & Young LLP
One Commerce Square
2005 Market Street, Suite 700
Philadelphia, PA 19103-7096
Legal Counsel
Pepper Hamilton LLP
3000 Two Logan Square
18th and Arch Streets
Philadelphia, PA 19103
LUC-1017
PACIFIC CAPITAL FUNDS
Pacific Capital Tax-Free Securities Fund
Semi-Annual Report
Performance Data
October 31, 2017 (Unaudited)
Credit Quality as of October 31, 2017 (as a percentage of total investments)
Credit quality ratings are primarily sourced |
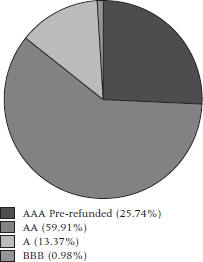
Investment Style
High-quality, intermediate-term, tax-exempt
Investment Objective
The Pacific Capital Tax-Free Securities Fund (the “Fund��) seeks high current income that is exempt from federal and Hawaii income tax by normally investing at least 80% of its net assets in investment grade municipal obligations. The Fund normally invests greater than 50% of its assets in Hawaii municipal obligations — debt securities issued by or on behalf of the State of Hawaii and its political subdivisions, agencies and instrumentalities that pay interest which is exempt from Hawaii income tax as well as federal income tax.
Investment Considerations
Income received from the Fund may be subject to certain state and local taxes and, depending on one’s tax status, to the federal alternative minimum tax. Bonds offer a relatively stable level of income, although bond prices will fluctuate, providing the potential for principal gain or loss. Generally, bond prices and values fall when interest rates rise, and vice versa. The longer the average maturity of the Fund’s portfolio, the greater the fluctuation in value. Since the Fund invests significantly in securities of issuers in Hawaii, it will also be affected by a variety of Hawaii’s economic and political factors. The values of any of the Fund’s investments may also decline in response to events affecting the issuer or its credit rating.
Investment Process
| ● | Top-down macroeconomic analysis of interest rate trends |
| ● | Bottom-up credit research to identify high quality bonds |
Investment Management
Advised by Asset Management Group of Bank of Hawaii (“AMG”)
| ● | As of October 31, 2017, AMG manages $1.113 billion in mutual fund assets. In addition, AMG personnel also manage approximately $2.3 billion in assets on behalf of Bank of Hawaii clients. |
1
PACIFIC CAPITAL FUNDS
Pacific Capital Tax-Free Securities Fund
Semi-Annual Report
Performance Data (Concluded)
October 31, 2017 (Unaudited)
| Average Annual Total Returns for the Periods Ended October 31, 2017 | ||||||||||||||||||
| Six Months* | 1 Year | 3 Year | 5 Year | 10 Year | ||||||||||||||
Class Y | 1.91% | 1.36% | 2.33% | 2.37% | 3.65% | |||||||||||||
Barclays Capital Hawaii | 2.00% | 1.79% | 2.76% | 2.73% | 4.35% | |||||||||||||
*Not Annualized
Past performance does not guarantee future results. The performance data quoted represents past performance and current returns may be lower or higher. The investment return and principal value will fluctuate so that an investor’s shares, when redeemed, may be worth more or less than the original cost. The table does not reflect the deduction of taxes that a shareholder would pay on Fund distributions or the redemption of Fund shares. To obtain performance information current to the most recent month end, please call (888) 678-6034.
As stated in the current prospectus dated September 18, 2017, the Fund’s “Total Annual Fund Operating Expenses” are 0.30%, and the Fund’s “Total Annual Fund Operating Expenses After Fee Waiver” are 0.10%, of the Fund’s average daily net assets. These rates may fluctuate and may differ from the actual expenses incurred by the Fund for the period covered in this report. The Adviser has agreed to waive its advisory fee (the “Waiver”) until August 31, 2019. The Waiver may not be terminated at any time prior to that date without the consent of the Board of Trustees (“Board of Trustees”) of FundVantage Trust (the “Trust”). Additional information pertaining to the Fund’s expense ratio for the period ended October 31, 2017 can be found in the financial highlights.
Before the Fund commenced operations, all of the assets of the Tax-Free Securities Fund, a series of Pacific Capital Funds (the “Predecessor Fund”), were transferred to the Fund in a tax-free reorganization (the “Reorganization”). Performance presented prior to June 28, 2010 reflects the performance of the Predecessor Fund.
Total returns reflect the waiver of advisory fees. Had these waivers not been in effect, performance quoted would have been lower.
The performance of the Fund is measured against the Barclays Capital Hawaii Municipal Bond Index, a rules-based, market-value weighted index engineered for the long-term tax-exempt Hawaii bond market. The index has four main sectors: general obligation bonds, revenue bonds, insured bonds and prerefunded bonds. The index is unmanaged and does not reflect the deduction of fees associated with a mutual fund, such as investment management and fund accounting fees. The Fund’s performance reflects the deduction of fees for these services. Investors cannot invest directly in an index.
The Fund is distributed by Foreside Funds Distributors LLC. The Asset Management Group of Bank of Hawaii is the investment adviser to the Fund and receives a fee for its services.
All mutual fund investing involves risk, including possible loss of principal. The Fund is non-diversified, which means that a portion of the Fund’s assets may be invested in one or few companies or sectors. The Fund could fluctuate in value more than a diversified fund.
2
PACIFIC CAPITAL FUNDS
Pacific Capital Tax-Free Short Intermediate Securities Fund
Semi-Annual Report
Performance Data
October 31, 2017 (Unaudited)
Credit Quality as of October 31, 2017 (as a percentage of total investments)
Credit quality ratings are primarily sourced |
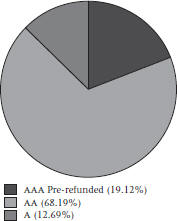
Investment Style
High-quality, short-intermediate term, tax-exempt
Investment Objective
The Pacific Capital Tax-Free Short Intermediate Securities Fund (the “Fund”) seeks high current income that is exempt from federal and Hawaii income tax by normally investing at least 80% of its net assets in investment grade municipal obligations. The Fund normally invests greater than 50% of its assets in Hawaii municipal obligations — debt securities issued by or on behalf of the State of Hawaii and its political subdivisions, agencies and instrumentalities that pay interest which is exempt from Hawaii income tax as well as federal income tax. The Fund seeks to provide greater price stability than a long-term bond fund.
Investment Considerations
Income received from the Fund may be subject to certain state and local taxes and, depending on one’s tax status, to the federal alternative minimum tax. Bonds offer a relatively stable level of income, although bond prices will fluctuate, providing the potential for principal gain or loss. Generally, bond prices and values fall when interest rates rise, and vice versa. Intermediate term, higher-quality bonds generally offer less risk than longer-term bonds and a lower rate of return. Since the Fund invests significantly in securities of issuers in Hawaii, it will also be affected by a variety of Hawaii’s economic and political factors. The values of any of the Fund’s investments may also decline in response to events affecting the issuer or its credit rating.
Investment Process
| ● | Top-down macroeconomic analysis of interest rate trends |
| ● | Bottom-up credit research to identify high quality bonds |
Investment Management
Advised by Asset Management Group of Bank of Hawaii (“AMG”)
| ● | As of October 31, 2017, AMG manages $1.113 billion in mutual fund assets. In addition, AMG personnel also manage approximately $2.3 billion in assets on behalf of Bank of Hawaii clients. |
3
PACIFIC CAPITAL FUNDS
Pacific Capital Tax-Free Short Intermediate Securities Fund
Semi-Annual Report
Performance Data (Concluded)
October 31, 2017 (Unaudited)
| Average Annual Total Returns for the Periods Ended October 31, 2017 | ||||||||||||||||||
| Six Months* | 1 Year | 3 Year | 5 Year | 10 Year | ||||||||||||||
Class Y | 0.46% | 0.57% | 0.94% | 0.88% | 1.71% | |||||||||||||
Barclays Capital Hawaii | 0.42% | 1.07% | 1.03% | 1.11% | 2.44% | |||||||||||||
*Not Annualized
Past performance does not guarantee future results. The performance data quoted represents past performance and current returns may be lower or higher. The investment return and principal value will fluctuate so that an investor’s shares, when redeemed, may be worth more or less than the original cost. The table does not reflect the deduction of taxes that a shareholder would pay on Fund distributions or the redemption of Fund shares. To obtain performance information current to the most recent month end, please call (888) 678-6034.
As stated in the current prospectus dated September 18, 2017, the Fund’s “Total Annual Fund Operating Expenses” are 0.45%, and the Fund’s “Total Annual Fund Operating Expense After Fee Waiver” are 0.25%, of the Fund’s average daily net assets. These rates may fluctuate and may differ from the actual expenses incurred by the Fund for the period covered in this report. The Adviser has agreed to waive its advisory fee (the “Waiver”) until August 31, 2019. The Waiver may not be terminated at any time prior to that date without the consent of the Board of Trustees (“Board of Trustees”) of FundVantage Trust (the “Trust”). Additional information pertaining to the Fund’s expense ratio for the period ended October 31, 2017 can be found in the financial highlights.
Before the Fund commenced operations, all of the assets of the Tax-Free Short Intermediate Securities Fund, a series of Pacific Capital Funds (the “Predecessor Fund”), were transferred to the Fund in a tax-free reorganization (the “Reorganization”). Performance presented prior to June 28, 2010 reflects the performance of the Predecessor Fund.
Total returns reflect the waiver of advisory fees. Had these waivers not been in effect, performance quoted would have been lower.
The performance of the Fund is measured against the Barclays Capital Hawaii 3-Year Municipal Bond Index, which is the 2-4 year component of the Barclays Capital Hawaii Municipal Bond Index and is a rules-based, market-value weighted index engineered for the Hawaii tax-exempt bond market. The index has four main sectors: general obligation bonds, revenue bonds, insured bonds, and prerefunded bonds. The index is unmanaged and does not reflect the deduction of fees associated with a mutual fund, such as investment management and fund accounting fees. The Fund’s performance reflects the deduction of fees for these services. Investors cannot invest directly in an index.
The Fund is distributed by Foreside Funds Distributors LLC. The Asset Management Group of Bank of Hawaii is the investment adviser to the Fund and receives a fee for its services.
All mutual fund investing involves risk, including possible loss of principal. The Fund is non-diversified, which means that a portion of the Fund’s assets may be invested in one or few companies or sectors. The Fund could fluctuate in value more than a diversified fund.
4
PACIFIC CAPITAL FUNDS
Fund Expense Disclosure
October 31, 2017
(Unaudited)
As a shareholder of the Fund(s), you incur two types of costs: (1) transaction costs, and (2) ongoing costs, including management fees and other Fund expenses. These examples are intended to help you understand your ongoing costs (in dollars) of investing in the Fund and to compare these costs with the ongoing costs of investing in other mutual funds.
These examples are based on an investment of $1,000 invested at the beginning of the six-month period from May 1, 2017 through October 31, 2017 and held for the entire period.
Actual Expenses
The first line for each Fund in the accompanying table provides information about actual account values and actual expenses. You may use the information in this line, together with the amount you invested, to estimate the expenses that you paid over the period. Simply divide your account value by $1,000 (for example, an $8,600 account value divided by $1,000 = 8.6), then multiply the result by the number in the first line of the table under the heading entitled “Expenses Paid During Period” to estimate the expenses you paid on your account during this period.
Hypothetical Examples for Comparison Purposes
The second line for each Fund in the accompanying table provides information about hypothetical account values and hypothetical expenses based on each Fund’s actual expense ratio and an assumed rate of return of 5% per year before expenses, which is not the Fund’s actual return. The hypothetical account values and expenses may not be used to estimate the actual ending account balance or expenses you paid for the period. You may use this information to compare the ongoing costs of investing in the Fund(s) and other funds. To do so, compare these 5% hypothetical examples with the 5% hypothetical examples that appear in the shareholder reports of other funds.
Please note that the expenses shown in the table are meant to highlight your ongoing costs only and do not reflect any transactional costs. Therefore, the second line of the accompanying table is useful in comparing ongoing costs only, and will not help you determine the relative total costs of owning different funds. In addition, if these transactional costs were included, your costs would have been higher.
5
PACIFIC CAPITAL FUNDS
Fund Expense Disclosure (Concluded)
October 31, 2017
(Unaudited)
| Beginning Account Value May 1, 2017 | Ending Account Value October 31, 2017 | Expenses Paid During Period* | Expense Ratio During Period** | ||||||||||||||||||||||
Pacific Capital Tax-Free | |||||||||||||||||||||||||
Actual Fund Return | Class Y | $1,000.00 | $1,019.10 | $0.51 | 0.10% | ||||||||||||||||||||
Hypothetical Fund Return (5%return before expenses) | Class Y | 1,000.00 | 1,024.70 | 0.51 | 0.10% | ||||||||||||||||||||
Pacific Capital Tax-Free Short | |||||||||||||||||||||||||
Actual Fund Return | Class Y | $1,000.00 | $1,004.60 | $1.31 | 0.26% | ||||||||||||||||||||
Hypothetical Fund Return (5%return before expenses) | Class Y | 1,000.00 | 1,023.89 | 1.33 | 0.26% | ||||||||||||||||||||
| * | Expense are equal to an annualized expense ratio for the six-month period ended October 31, 2017, multiplied by average account value over the period, multiplied by the number of days in the most recent period (184), then divided by 365 to reflect the period. The Funds’ ending account values on the first line in each table are based on the actual six-month total returns of 1.91% for the Pacific Capital Tax-Free Securities Fund and 0.46% for the Pacific Capital Tax-Free Short Intermediate Securities Fund. |
| ** | Annualized. |
6
PACIFIC CAPITAL FUNDS
Pacific Capital Tax-Free Securities Fund
Portfolio of Investments
October 31, 2017
(Unaudited)
| Principal Amount ($) | Value ($) | |||||||
MUNICIPAL BONDS — 98.0% |
| |||||||
Alaska — 0.1% | ||||||||
Matanuska-Susitna AK, Prerefunded 09/01/19 at 100, | 380,000 | 413,356 | ||||||
|
| |||||||
Arizona — 2.1% | ||||||||
Phoenix Civic Improvement Corp., Civic Plaza, Convertible CAB, Series B, | 5,000,000 | 6,341,000 | ||||||
|
| |||||||
California — 1.6% | ||||||||
California Health Facilities Financing Authority, Series A, | 950,000 | 1,199,033 | ||||||
Norwalk-La Mirada Unified School District GO, CAB, Series B, | 5,000,000 | 3,887,000 | ||||||
|
| |||||||
| 5,086,033 | ||||||||
|
| |||||||
Georgia — 0.1% | ||||||||
Municipal Electric Authority Power Revenue, Series W, Unrefunded portion, | 260,000 | 262,324 | ||||||
|
| |||||||
Guam — 0.6% | ||||||||
Territory Of Guam, Series A, Prerefunded 11/15/19 at 100, | 1,775,000 | 1,971,794 | ||||||
|
| |||||||
| Principal Amount ($) | Value ($) | |||||||
MUNICIPAL BONDS — (Continued) |
| |||||||
Hawaii — 87.4% | ||||||||
Hawaii County GO, Series A, Prerefunded 07/15/18 at 100, | 1,655,000 | 1,712,296 | ||||||
Hawaii County GO, Series A, Prerefunded 03/01/20 at 100, | 1,470,000 | 1,565,344 | ||||||
Hawaii County GO, Series A, Callable 09/01/22 at 100, | 500,000 | 582,255 | ||||||
Hawaii County GO, Series A, Callable 03/01/27 at 100, | 5,045,000 | 6,088,659 | ||||||
Hawaii County GO, Series A, Callable 03/01/27 at 100, | 5,775,000 | 6,863,876 | ||||||
Hawaii Housing Finance & Development Corp., Multi-Family Housing, Iwilei Apartments, Series A, Callable 07/01/22 at 100, | 3,120,000 | 3,194,599 | ||||||
Hawaii Housing Finance & Development Corp., Series B, Callable 07/01/21 at 100, | 3,570,000 | 3,716,584 | ||||||
Hawaii State Airports System Revenue, AMT, Callable 08/01/23 at 100, | 400,000 | 444,604 | ||||||
The accompanying notes are an integral part of the financial statements.
7
PACIFIC CAPITAL FUNDS
Pacific Capital Tax-Free Securities Fund
Portfolio of Investments (Continued)
October 31, 2017
(Unaudited)
| Principal Amount ($) | Value ($) | |||||||
MUNICIPAL BONDS — (Continued) |
| |||||||
Hawaii — (Continued) | ||||||||
Hawaii State Airports System Revenue, Series A, Callable 07/01/20 at 100, | 2,700,000 | 2,964,411 | ||||||
Hawaii State Airports System Revenue, Series A, Callable 07/01/20 at 100, | 1,010,000 | 1,114,384 | ||||||
Hawaii State Airports System Revenue, AMT, Callable 07/01/21 at 100, | 3,500,000 | 3,925,740 | ||||||
Hawaii State Airports System Revenue, Series A, Callable 07/01/20 at 100, | 1,000,000 | 1,105,020 | ||||||
Hawaii State Airports System Revenue, Series A, Callable 07/01/20 at 100, | 2,040,000 | 2,249,141 | ||||||
Hawaii State Airports System Revenue, Series A, | 1,320,000 | 1,453,861 | ||||||
Hawaii State Airports System Revenue, Series A, Callable 07/01/20 at 100, | 1,000,000 | 1,105,570 | ||||||
| Principal Amount ($) | Value ($) | |||||||
MUNICIPAL BONDS — (Continued) |
| |||||||
Hawaii — (Continued) | ||||||||
Hawaii State Department of Budget & Finance Revenue, Hawaii Pacific Health Obligation, | 500,000 | 557,400 | ||||||
Hawaii State Department of Budget & Finance Revenue, Hawaii Pacific Health Obligation, Callable 07/01/23 at 100, | 1,330,000 | 1,530,404 | ||||||
Hawaii State Department of Budget & Finance Revenue, Hawaiian Electric Company Subsidiary, Callable 07/01/19 at 100, | 600,000 | 648,990 | ||||||
Hawaii State Department of Budget & Finance Revenue, Hawaiian Electric Company, AMT, MWC, 3.10%, 05/01/26 | 2,350,000 | 2,392,276 | ||||||
Hawaii State Department of Budget & Finance, Special Purpose Revenue, Kahala Nui, Callable 11/15/22 at 100, | 1,790,000 | 2,013,141 | ||||||
Hawaii State Department of Budget & Finance, Special Purpose Revenue, Kahala Nui, Callable 11/15/22 at 100, | 550,000 | 609,125 | ||||||
The accompanying notes are an integral part of the financial statements.
8
PACIFIC CAPITAL FUNDS
Pacific Capital Tax-Free Securities Fund
Portfolio of Investments (Continued)
October 31, 2017
(Unaudited)
| Principal Amount ($) | Value ($) | |||||||
MUNICIPAL BONDS — (Continued) |
| |||||||
Hawaii — (Continued) | ||||||||
Hawaii State Department of Budget & Finance, Series A, Queens Health System, Callable 07/01/25 at 100, | 11,000,000 | 12,579,270 | ||||||
Hawaii State Department of Hawaiian Home Lands Revenue, 5.00%, 04/01/21 | 1,370,000 | 1,537,250 | ||||||
Hawaii State Department of Hawaiian Home Lands Revenue, Callable 04/01/27 at 100, | 850,000 | 1,034,416 | ||||||
Hawaii State Department of Hawaiian Home Lands Revenue, Callable 04/01/27 at 100, | 335,000 | 397,136 | ||||||
Hawaii State Department of Hawaiian Home Lands Revenue, ETM, | 775,000 | 787,733 | ||||||
Hawaii State Department of Hawaiian Home Lands, Kapolei Office Facility, Series A, Callable 11/01/27 at 100, | 1,170,000 | 1,437,790 | ||||||
Hawaii State Department of Hawaiian Home Lands, Kapolei Office Facility, Series A, Callable 11/01/27 at 100, | 800,000 | 966,504 | ||||||
| Principal Amount ($) | Value ($) | |||||||
MUNICIPAL BONDS — (Continued) |
| |||||||
Hawaii — (Continued) | ||||||||
Hawaii State Department of Hawaiian Home Lands, Kapolei Office Facility, Series A, Callable 11/01/27 at 100, | 815,000 | 980,657 | ||||||
Hawaii State GO, Series DK, Prerefunded 05/01/18 at 100, | 2,390,000 | 2,436,462 | ||||||
Hawaii State GO, Series DK, Prerefunded 05/01/18 at 100, | 710,000 | 723,802 | ||||||
Hawaii State GO, Series DK, Prerefunded 05/01/18 at 100, | 3,015,000 | 3,073,612 | ||||||
Hawaii State GO, Series DK, Unrefunded portion, Callable 05/01/18 at 100, | 75,000 | 76,496 | ||||||
Hawaii State GO, Series DK, Unrefunded portion, Callable 05/01/18 at 100, | 75,000 | 76,496 | ||||||
Hawaii State GO, Series DQ, Prerefunded 06/01/19 at 100, | 1,660,000 | 1,759,268 | ||||||
Hawaii State GO, Series DT, | 3,000,000 | 3,229,260 | ||||||
Hawaii State GO, Series DZ, Prerefunded 12/01/21 at 100, | 1,765,000 | 2,014,624 | ||||||
The accompanying notes are an integral part of the financial statements.
9
PACIFIC CAPITAL FUNDS
Pacific Capital Tax-Free Securities Fund
Portfolio of Investments (Continued)
October 31, 2017
(Unaudited)
| Principal Amount ($) | Value ($) | |||||||
MUNICIPAL BONDS — (Continued) | ||||||||
Hawaii — (Continued) | ||||||||
Hawaii State GO, Series DZ, Prerefunded 12/01/21 at 100, | 155,000 | 176,922 | ||||||
Hawaii State GO, Series DZ, Prerefunded 12/01/21 at 100, | 1,790,000 | 2,043,160 | ||||||
Hawaii State GO, Series DZ, Prerefunded 12/01/21 at 100, | 885,000 | 1,010,166 | ||||||
Hawaii State GO, Series DZ, Prerefunded 12/01/21 at 100, | 1,150,000 | 1,312,644 | ||||||
Hawaii State GO, Series DZ, Prerefunded 12/01/21 at 100, | 1,620,000 | 1,849,117 | ||||||
Hawaii State GO, Series DZ, Prerefunded 12/01/21 at 100, | 1,155,000 | 1,318,352 | ||||||
Hawaii State GO, Series DZ, Prerefunded 12/01/21 at 100, | 1,700,000 | 1,940,431 | ||||||
Hawaii State GO, Series DZ, Prerefunded 12/01/21 at 100, | 1,730,000 | 1,974,674 | ||||||
Hawaii State GO, Series DZ, Unrefunded portion, Callable 12/01/21 at 100, | 1,725,000 | 1,972,658 | ||||||
| Principal Amount ($) | Value ($) | |||||||
MUNICIPAL BONDS — (Continued) | ||||||||
Hawaii — (Continued) | ||||||||
Hawaii State GO, Series DZ, Unrefunded portion, Callable 12/01/21 at 100, | 300,000 | 343,071 | ||||||
Hawaii State GO, Series DZ, Unrefunded portion, Callable 12/01/21 at 100, | 1,235,000 | 1,412,309 | ||||||
Hawaii State GO, Series DZ, Unrefunded portion, Callable 12/01/21 at 100, | 1,095,000 | 1,252,209 | ||||||
Hawaii State GO, Series EA, | 265,000 | 286,083 | ||||||
Hawaii State GO, Series EA, | 2,000,000 | 2,286,280 | ||||||
Hawaii State GO, Series EE, | 450,000 | 450,000 | ||||||
Hawaii State GO, Series EE, Prerefunded 11/01/22 at 100, | 55,000 | 64,119 | ||||||
Hawaii State GO, Series EE, Prerefunded 11/01/22 at 100, | 1,450,000 | 1,690,410 | ||||||
Hawaii State GO, Series EE, Prerefunded 11/01/22 at 100, | 85,000 | 99,093 | ||||||
Hawaii State GO, Series EE, Prerefunded 11/01/22 at 100, | 740,000 | 862,692 | ||||||
The accompanying notes are an integral part of the financial statements.
10
PACIFIC CAPITAL FUNDS
Pacific Capital Tax-Free Securities Fund
Portfolio of Investments (Continued)
October 31, 2017
(Unaudited)
| Principal Amount ($) | Value ($) | |||||||
MUNICIPAL BONDS — (Continued) |
| |||||||
Hawaii — (Continued) | ||||||||
Hawaii State GO, Series EE, Prerefunded 11/01/22 at 100, | 90,000 | 104,922 | ||||||
Hawaii State GO, Series EE, Prerefunded 11/01/22 at 100, | 740,000 | 862,692 | ||||||
Hawaii State GO, Series EE, Prerefunded 11/01/22 at 100, | 20,000 | 23,316 | ||||||
Hawaii State GO, Series EE, Unrefunded portion, Callable 11/01/22 at 100, | 100,000 | 117,106 | ||||||
Hawaii State GO, Series EE, Unrefunded portion, Callable 11/01/22 at 100, | 1,365,000 | 1,589,174 | ||||||
Hawaii State GO, Series EE, Unrefunded portion, Callable 11/01/22 at 100, | 345,000 | 400,759 | ||||||
Hawaii State GO, Series EE, Unrefunded portion, Callable 11/01/22 at 100, | 340,000 | 394,067 | ||||||
Hawaii State GO, Series EH, Callable 08/01/23 at 100, | 1,000,000 | 1,187,770 | ||||||
Hawaii State GO, Series EH, Prerefunded, ETM, | 445,000 | 526,675 | ||||||
Hawaii State GO, Series EH, Prerefunded, ETM, | 110,000 | 130,189 | ||||||
| Principal Amount ($) | Value ($) | |||||||
MUNICIPAL BONDS — (Continued) |
| |||||||
Hawaii — (Continued) | ||||||||
Hawaii State GO, Series EH, Unrefunded portion, | 345,000 | 408,946 | ||||||
Hawaii State GO, Series EL, | 1,000,000 | 1,185,350 | ||||||
Hawaii State GO, Series EO, Callable 08/01/24 at 100, | 1,285,000 | 1,513,833 | ||||||
Hawaii State GO, Series EO, Prerefunded 08/01/24 at 100, | 140,000 | 168,735 | ||||||
Hawaii State GO, Series EO, Unrefunded portion, Callable 08/01/24 at 100, | 1,560,000 | 1,875,791 | ||||||
Hawaii State GO, Series EP, | 1,000,000 | 1,205,960 | ||||||
Hawaii State GO, Series ET, | 1,060,000 | 1,185,610 | ||||||
Hawaii State GO, Series EW, | 2,000,000 | 2,071,840 | ||||||
Hawaii State GO, Series EY, Callable 10/01/25 at 100, | 2,980,000 | 3,621,564 | ||||||
Hawaii State GO, Series EZ, | 4,000,000 | 4,554,720 | ||||||
Hawaii State GO, Series FB, | 5,000,000 | 6,086,400 | ||||||
Hawaii State GO, Series FB, Callable 04/01/26 at 100, | 2,000,000 | 2,237,600 | ||||||
Hawaii State GO, Series FG, Callable 10/01/26 at 100, | 10,000,000 | 12,101,900 | ||||||
Hawaii State GO, Series FK, | 2,000,000 | 2,222,180 | ||||||
The accompanying notes are an integral part of the financial statements.
11
PACIFIC CAPITAL FUNDS
Pacific Capital Tax-Free Securities Fund
Portfolio of Investments (Continued)
October 31, 2017
(Unaudited)
| Principal Amount ($) | Value ($) | |||||||
MUNICIPAL BONDS — (Continued) |
| |||||||
Hawaii — (Continued) | ||||||||
Hawaii State GO, Series FK, Callable 05/01/27 at 100, | 2,500,000 | 3,016,075 | ||||||
Hawaii State GO, Series FN, | 5,000,000 | 6,196,000 | ||||||
Hawaii State Harbor System Revenue, Series A, Callable 07/01/20 at 100, | 220,000 | 235,910 | ||||||
Hawaii State Harbor System Revenue, Series A, Callable 07/01/20 at 100, | 3,125,000 | 3,423,344 | ||||||
Hawaii State Highway Fund Revenue, Series A, | 380,000 | 392,840 | ||||||
Hawaii State Highway Fund Revenue, Series A, | 1,250,000 | 1,395,362 | ||||||
Hawaii State Highway Fund Revenue, Series A, Prerefunded 01/01/22 at 100, | 5,490,000 | 6,296,205 | ||||||
Hawaii State Highway Fund Revenue, Series A, Prerefunded 01/01/22 at 100, | 1,120,000 | 1,284,472 | ||||||
Hawaii State Highway Fund Revenue, Series B, Callable 07/01/26 at 100, | 875,000 | 1,068,821 | ||||||
Hawaii State Highway Fund Revenue, Series B, Callable 07/01/26 at 100, | 5,000,000 | 6,059,200 | ||||||
| Principal Amount ($) | Value ($) | |||||||
MUNICIPAL BONDS — (Continued) |
| |||||||
Hawaii — (Continued) | ||||||||
Honolulu City & County Board of Water Supply System Revenue, Series A, | 510,000 | 613,464 | ||||||
Honolulu City & County Board of Water Supply System Revenue, Series A, Callable 07/01/24 at 100, | 300,000 | 356,292 | ||||||
Honolulu City & County Board of Water Supply System Revenue, Series A, Callable 07/01/22 at 100, | 3,125,000 | 3,600,594 | ||||||
Honolulu City & County Board of Water Supply, System Revenue, Series A, Callable 07/01/24 at 100, | 1,500,000 | 1,812,690 | ||||||
Honolulu City & County GO, Series A, | 1,015,000 | 1,054,666 | ||||||
Honolulu City & County GO, Series A, Prerefunded 04/01/19 at 100, | 1,110,000 | 1,169,596 | ||||||
Honolulu City & County GO, Series A, Callable 11/01/22 at 100, | 4,855,000 | 5,672,728 | ||||||
The accompanying notes are an integral part of the financial statements.
12
PACIFIC CAPITAL FUNDS
Pacific Capital Tax-Free Securities Fund
Portfolio of Investments (Continued)
October 31, 2017
(Unaudited)
| Principal Amount ($) | Value ($) | |||||||
MUNICIPAL BONDS — (Continued) |
| |||||||
Hawaii — (Continued) | ||||||||
Honolulu City & County GO, Series A, Callable 11/01/22 at 100, | 3,365,000 | 3,931,767 | ||||||
Honolulu City & County GO, Series A, Callable 10/01/25 at 100, | 2,175,000 | 2,583,791 | ||||||
Honolulu City & County GO, Series A, Callable 11/01/22 at 100, | 450,000 | 525,794 | ||||||
Honolulu City & County GO, Series A, Callable 11/01/22 at 100, | 1,970,000 | 2,301,807 | ||||||
Honolulu City & County GO, Series A, Callable 10/01/25 at 100, | 3,000,000 | 3,507,270 | ||||||
Honolulu City & County GO, Series A, Callable 10/01/25 at 100, | 400,000 | 465,460 | ||||||
Honolulu City & County GO, Series A, Callable 10/01/25 at 100, | 225,000 | 261,299 | ||||||
Honolulu City & County GO, Series A, Callable 10/01/25 at 100, | 1,000,000 | 1,159,020 | ||||||
Honolulu City & County GO, Series A, ETM, | 2,000,000 | 2,336,860 | ||||||
| Principal Amount ($) | Value ($) | |||||||
MUNICIPAL BONDS — (Continued) |
| |||||||
Hawaii — (Continued) | ||||||||
Honolulu City & County GO, Series A, Prerefunded, ETM, | 4,790,000 | 4,867,694 | ||||||
Honolulu City & County GO, | 210,000 | 213,459 | ||||||
Honolulu City & County GO, Series A, Refunding, | 1,000,000 | 1,071,280 | ||||||
Honolulu City & County GO, Series A, Refunding, Callable 11/01/22 at 100, | 1,000,000 | 1,065,690 | ||||||
Honolulu City & County GO, Series B, Callable 11/01/22 at 100, | 2,050,000 | 2,408,238 | ||||||
Honolulu City & County GO, Series B, Callable 12/01/20 at 100, | 2,280,000 | 2,528,794 | ||||||
Honolulu City & County GO, Series B, Refunding, | 1,000,000 | 1,035,920 | ||||||
Honolulu City & County GO, Series B, Refunding, | 1,000,000 | 1,042,320 | ||||||
Honolulu City & County GO, Series B, Refunding, | 1,220,000 | 1,299,678 | ||||||
Honolulu City & County GO, Series B, Refunding, | 1,000,000 | 1,163,130 | ||||||
Honolulu City & County GO, Series B, Refunding, | 2,300,000 | 2,815,867 | ||||||
The accompanying notes are an integral part of the financial statements.
13
PACIFIC CAPITAL FUNDS
Pacific Capital Tax-Free Securities Fund
Portfolio of Investments (Continued)
October 31, 2017
(Unaudited)
| Principal Amount ($) | Value ($) | |||||||
MUNICIPAL BONDS — (Continued) |
| |||||||
Hawaii — (Continued) | ||||||||
Honolulu City & County GO, Series C, Refunding, | 2,000,000 | 2,427,320 | ||||||
Honolulu City & County GO, Series C, Refunding, | 3,500,000 | 4,196,920 | ||||||
Honolulu City & County GO, Series D, Prerefunded | 250,000 | 262,680 | ||||||
Honolulu City & County GO, Series E, Refunding, | 1,500,000 | 1,838,190 | ||||||
Honolulu City & County GO, Variable Honolulu Rail Transit Project, | 1,500,000 | 1,500,210 | ||||||
Honolulu City & County Waste Water System Revenue, Refunding, Junior Series A, Callable 07/01/25 at 100, | 4,000,000 | 4,751,680 | ||||||
Honolulu City & County Waste Water System Revenue, Senior 1st Bond Resolution, Refunding, | 250,000 | 274,622 | ||||||
| Principal Amount ($) | Value ($) | |||||||
MUNICIPAL BONDS — (Continued) |
| |||||||
Hawaii — (Continued) | ||||||||
Honolulu City & County Waste Water System Revenue, Senior 1st Bond Resolution, Refunding, | 3,000,000 | 3,645,960 | ||||||
Honolulu City & County Waste Water System Revenue, Senior 1st Bond Resolution, Refunding, | 2,000,000 | 2,421,140 | ||||||
Honolulu City & County Waste Water System Revenue, Senior 1st Bond Resolution, Series A, | 100,000 | 119,334 | ||||||
Honolulu City & County Waste Water System Revenue, Senior 1st Bond Resolution, Series B, Refunding, | 545,000 | 596,655 | ||||||
Honolulu City & County Waste Water System Revenue, Senior, Series B, Refunding, Callable | 125,000 | 146,862 | ||||||
Kauai County GO, | 300,000 | 354,912 | ||||||
Kauai County GO, | 250,000 | 312,250 | ||||||
Kauai County GO, | 250,000 | 304,160 | ||||||
The accompanying notes are an integral part of the financial statements.
14
PACIFIC CAPITAL FUNDS
Pacific Capital Tax-Free Securities Fund
Portfolio of Investments (Continued)
October 31, 2017
(Unaudited)
| Principal Amount ($) | Value ($) | |||||||
MUNICIPAL BONDS — (Continued) |
| |||||||
Hawaii — (Continued) | ||||||||
Kauai County GO, | 270,000 | 295,253 | ||||||
Kauai County GO, | 775,000 | 910,647 | ||||||
Kauai County GO, | 1,000,000 | 1,058,270 | ||||||
Kauai County GO, | 260,000 | 277,402 | ||||||
Kauai County GO, | 315,000 | 365,328 | ||||||
Kauai County GO, | 1,295,000 | 1,342,760 | ||||||
Maui County GO, Refunding, | 500,000 | 530,465 | ||||||
Maui County GO, Refunding, | 3,075,000 | 3,372,660 | ||||||
Maui County GO, Refunding, | 1,500,000 | 1,694,100 | ||||||
Maui County GO, Refunding, | 300,000 | 354,771 | ||||||
University of Hawaii | 1,000,000 | 1,070,080 | ||||||
University of Hawaii | 1,170,000 | 1,233,391 | ||||||
| Principal Amount ($) | Value ($) | |||||||
MUNICIPAL BONDS — (Continued) |
| |||||||
Hawaii — (Continued) | ||||||||
University of Hawaii | 665,000 | 754,150 | ||||||
University of Hawaii | 1,000,000 | 1,164,430 | ||||||
University of Hawaii | 4,600,000 | 5,552,844 | ||||||
University of Hawaii | 1,000,000 | 1,196,870 | ||||||
|
| |||||||
| 271,629,658 | ||||||||
|
| |||||||
Illinois — 1.3% | ||||||||
Illinois Municipal Electric | 3,665,000 | 4,093,988 | ||||||
|
| |||||||
Massachusetts — 0.9% | ||||||||
Massachusetts Transportation Trust Fund Metropolitan Highway System Revenue, Contract Assistance, Series B, Refunding, Callable 01/01/20 at | 2,500,000 | 2,701,175 | ||||||
|
| |||||||
The accompanying notes are an integral part of the financial statements.
15
PACIFIC CAPITAL FUNDS
Pacific Capital Tax-Free Securities Fund
Portfolio of Investments (Continued)
October 31, 2017
(Unaudited)
| Principal Amount ($) | Value ($) | |||||||
MUNICIPAL BONDS — (Continued) |
| |||||||
New Jersey — 0.1% | ||||||||
Passaic Valley Sewage Commission Revenue, | 300,000 | 346,929 | ||||||
|
| |||||||
Texas — 3.8% | ||||||||
Austin Independent School | 2,500,000 | 3,065,875 | ||||||
Galveston County GO, CAB, | 2,630,000 | 2,303,933 | ||||||
Houston Combined Utility System Revenue, Unrefunded Balance CAB, Junior Series A, | 2,000,000 | 1,532,300 | ||||||
Lewisville Independent | 3,000,000 | 3,653,100 | ||||||
Texas State Transportation Commission Mobility Fund | 1,000,000 | 1,185,020 | ||||||
|
| |||||||
| 11,740,228 | ||||||||
|
| |||||||
TOTAL MUNICIPAL | 304,586,485 | |||||||
|
| |||||||
| Shares | Value ($) | |||||||
REGISTERED INVESTMENT COMPANY — 0.4% |
| |||||||
Dreyfus Government Cash Management Fund, Institutional Shares, | 1,125,905 | 1,125,905 | ||||||
|
| |||||||
TOTAL REGISTERED INVESTMENT | 1,125,905 | |||||||
|
| |||||||
TOTAL INVESTMENTS - 98.4% (Cost $297,026,898) | 305,712,390 | |||||||
OTHER ASSETS IN EXCESS OF LIABILITIES - 1.6% | 5,088,299 | |||||||
|
| |||||||
NET ASSETS - 100.0% | $ | 310,800,689 | ||||||
|
| |||||||
| (a) | Variable rate investments. The rate shown is based on the latest available information as of October 31, 2017. Certain variable rate securities are not based on a published reference rate and spread but are determined by the issuer or agent and are based on current market conditions. These securities do not indicate a reference rate and spread in their description. |
| (b) | Rate periodically changes. Rate disclosed is the daily yield on October 31, 2017. |
Portfolio holdings are subject to change at any time.
The accompanying notes are an integral part of the financial statements.
16
PACIFIC CAPITAL FUNDS
Pacific Capital Tax-Free Securities Fund
Portfolio of Investments (Concluded)
October 31, 2017
(Unaudited)
| AGC | Assured Guaranty Corp. | |
| AGM | Assured Guaranty Municipal Corp. | |
| AGM-CR | Assured Guaranty Municipal Corp. | |
| Custodial Receipts | ||
| AMT | Subject to Alternative Minimum Tax | |
| BNYM | Bank of New York Mellon | |
| CAB | Capital Appreciation Bond | |
| ETM | Escrowed to Maturity | |
| FGIC | Financial Guaranty Insurance Co. | |
| FHLMC | Federal Home Loan Mortgage Corp. | |
| FNMA | Federal National Mortgage Association | |
| GNMA | Government National Mortgage | |
| Association | ||
| GO | General Obligation | |
| IBC | Insurance Bond Certificate | |
| MWC | Make Whole Callable | |
| NATL-RE | National Reinsurance Corp. | |
| PSF-GTD | Permanent School Fund Guaranteed |
The accompanying notes are an integral part of the financial statements.
17
PACIFIC CAPITAL FUNDS
Pacific Capital Tax-Free Short Intermediate Securities Fund
Portfolio of Investments
October 31, 2017
(Unaudited)
| Principal Amount ($) | Value ($) | |||||||
MUNICIPAL BONDS — 98.0% | ||||||||
Alaska — 0.8% | ||||||||
Alaska State GO, Series A, | 500,000 | 514,275 | ||||||
|
| |||||||
Colorado — 0.8% | ||||||||
Boulder County Sales and Use Tax Revenue, Open Space, | 500,000 | 521,915 | ||||||
|
| |||||||
Florida — 1.1% | ||||||||
JEA Electric System Revenue, Sub-Series A, | 650,000 | 673,283 | ||||||
|
| |||||||
Georgia — 1.6% | ||||||||
Georgia State GO, Series I, | 1,000,000 | 1,000,000 | ||||||
|
| |||||||
Hawaii — 87.8% | ||||||||
Hawaii County GO, Refunding, | 1,185,000 | 1,246,430 | ||||||
Hawaii County GO, Series A, | 1,000,000 | 1,105,130 | ||||||
Hawaii County GO, Series A, Callable 07/15/18 at 100, | 120,000 | 123,317 | ||||||
Hawaii State Airports System Revenue, AMT, Callable 08/01/2023 at 100, | 260,000 | 290,454 | ||||||
| Principal Amount ($) | Value ($) | |||||||
MUNICIPAL BONDS — (Continued) |
| |||||||
Hawaii — (Continued) | ||||||||
Hawaii State Airports System Revenue, Refunding, AMT, | 135,000 | 143,539 | ||||||
Hawaii State Airports System Revenue, Refunding, AMT, | 2,000,000 | 2,252,420 | ||||||
Hawaii State Airports System Revenue, Refunding, AMT, Callable 07/01/21 at 100, | 500,000 | 532,235 | ||||||
Hawaii State Department of Budget & Finance, Pacific Health Obligation, | 830,000 | 850,949 | ||||||
Hawaii State Department of Budget & Finance, Pacific Health Obligation, | 185,000 | 213,105 | ||||||
Hawaii State Department of Budget & Finance, Series A, Queens Health System, | 1,355,000 | 1,380,271 | ||||||
Hawaii State Department of Budget & Finance, Series A, Queens Health System, | 400,000 | 417,512 | ||||||
Hawaii State Department of Budget & Finance, Series A, Queens Health System, | 40,000 | 46,233 | ||||||
The accompanying notes are an integral part of the financial statements.
18
PACIFIC CAPITAL FUNDS
Pacific Capital Tax-Free Short Intermediate Securities Fund
Portfolio of Investments (Continued)
October 31, 2017
(Unaudited)
| Principal Amount ($) | Value ($) | |||||||
MUNICIPAL BONDS — (Continued) | ||||||||
Hawaii — (Continued) | ||||||||
Hawaii State Department of Budget & Finance, Series A, Queens Health System, | 495,000 | 590,461 | ||||||
Hawaii State Department of Budget & Finance, Series B, Pacific Health Obligation, | 55,000 | 56,506 | ||||||
Hawaii State Department of Hawaiian Home Lands, Callable 04/01/19 at 100, | 20,000 | 21,123 | ||||||
Hawaii State Department of Hawaiian Home Lands, Callable 04/01/19 at 100, | 125,000 | 132,676 | ||||||
Hawaii State Department of Hawaiian Home Lands, Refunding, | 1,555,000 | 1,657,894 | ||||||
Hawaii State GO, Prerefunded Series DQ, Callable 06/01/19 at 100, | 185,000 | 196,063 | ||||||
Hawaii State GO, Refunding, Series EA, | 500,000 | 521,160 | ||||||
Hawaii State GO, Refunding, Series EF, Callable 11/01/22 at 100, | 960,000 | 1,122,701 | ||||||
| Principal Amount ($) | Value ($) | |||||||
MUNICIPAL BONDS — (Continued) | ||||||||
Hawaii — (Continued) | ||||||||
Hawaii State GO, Series FG, | 1,000,000 | 1,049,920 | ||||||
Hawaii State GO, Refunding, Series DT, | 200,000 | 200,000 | ||||||
Hawaii State GO, Refunding, Series DT, | 150,000 | 161,463 | ||||||
Hawaii State GO, Refunding, Series EA, | 1,025,000 | 1,109,593 | ||||||
Hawaii State GO, Refunding, Series EA, Callable 12/01/21 at 100, | 1,025,000 | 1,169,535 | ||||||
Hawaii State GO, Refunding, Series EP, | 500,000 | 533,555 | ||||||
Hawaii State GO, Refunding, Series EP, | 500,000 | 550,615 | ||||||
Hawaii State GO, Refunding, Series EP, | 1,000,000 | 1,161,270 | ||||||
Hawaii State GO, Series DK, Prerefunded 05/01/18 at 100, | 165,000 | 168,208 | ||||||
Hawaii State GO, Series DK, Prerefunded 05/01/18 at 100, | 20,000 | 20,389 | ||||||
The accompanying notes are an integral part of the financial statements.
19
PACIFIC CAPITAL FUNDS
Pacific Capital Tax-Free Short Intermediate Securities Fund
Portfolio of Investments (Continued)
October 31, 2017
(Unaudited)
| Principal Amount ($) | Value ($) | |||||||
MUNICIPAL BONDS — (Continued) |
| |||||||
Hawaii — (Continued) |
| |||||||
Hawaii State GO, Series DN, Prerefunded, Callable 08/01/18 at 100, | 210,000 | 216,075 | ||||||
Hawaii State GO, Series DN, Prerefunded, Callable 08/01/18 at 100, | 95,000 | 97,748 | ||||||
Hawaii State GO, Series DN, Prerefunded, Callable 08/01/18 at 100, | 105,000 | 108,038 | ||||||
Hawaii State GO, Series DN, Prerefunded, Callable 08/01/18 at 100, | 130,000 | 134,001 | ||||||
Hawaii State GO, Series DQ, ETM, | 90,000 | 92,089 | ||||||
Hawaii State GO, Series DQ, Prerefunded, Callable 06/01/19 at 100, | 145,000 | 153,671 | ||||||
Hawaii State GO, Series DZ, Prerefunded, Callable 12/01/21 at 100, | 935,000 | 1,067,237 | ||||||
Hawaii State GO, Series DZ, Prerefunded 12/01/21 at 100, | 190,000 | 216,872 | ||||||
Hawaii State GO, Series DZ, Prerefunded 12/01/21 at 100, | 190,000 | 216,872 | ||||||
| Principal Amount ($) | Value ($) | |||||||
MUNICIPAL BONDS — (Continued) | ||||||||
Hawaii — (Continued) | ||||||||
Hawaii State GO, Series DZ, Prerefunded, ETM, | 130,000 | 140,119 | ||||||
Hawaii State GO, Series DZ, Refunding, ETM, | 255,000 | 283,478 | ||||||
Hawaii State GO, Series EE, ETM, | 1,290,000 | 1,445,368 | ||||||
Hawaii State GO, Series EE, Prerefunded, Callable 11/01/22 at 100, | 45,000 | 52,461 | ||||||
Hawaii State GO, Series EE, Unrefunded, Callable 11/01/22 at 100, | 25,000 | 29,276 | ||||||
Hawaii State GO, Series EH, Callable 08/01/23 at 100, | 1,000,000 | 1,187,770 | ||||||
Hawaii State GO, Series EH, Callable 08/01/23 at 100, | 500,000 | 591,770 | ||||||
Hawaii State GO, Series FG, | 310,000 | 361,370 | ||||||
Hawaii State GO, Series FK, | 500,000 | 534,215 | ||||||
Hawaii State GO, Series FK, | 500,000 | 563,470 | ||||||
The accompanying notes are an integral part of the financial statements.
20
PACIFIC CAPITAL FUNDS
Pacific Capital Tax-Free Short Intermediate Securities Fund
Portfolio of Investments (Continued)
October 31, 2017
(Unaudited)
| Principal Amount ($) | Value ($) | |||||||
MUNICIPAL BONDS — (Continued) | ||||||||
Hawaii — (Continued) | ||||||||
Hawaii State Harbor System Revenue, Series A, Callable 07/01/20 at 100, | 35,000 | 37,494 | ||||||
Hawaii State Harbor System Revenue, Series A, Callable 07/01/20 at 100, | 10,000 | 10,831 | ||||||
Hawaii State Highway Fund Revenue, Callable 01/01/19 at 100, | 140,000 | 147,119 | ||||||
Hawaii State Highway Fund Revenue, Refunding, Series B, | 500,000 | 513,885 | ||||||
Hawaii State Highway Fund Revenue, Series A, | 545,000 | 589,706 | ||||||
Hawaii State Highway Fund Revenue, Series A, | 1,000,000 | 1,116,290 | ||||||
Hawaii State Highway Fund Revenue, Series A, | 1,000,000 | 1,085,360 | ||||||
Hawaii State Housing Finance & Development Corp., HSG-Kuhio PK Terrace, Series A, | 115,000 | 115,757 | ||||||
| Principal Amount ($) | Value ($) | |||||||
MUNICIPAL BONDS — (Continued) | ||||||||
Hawaii — (Continued) | ||||||||
Hawaii State Housing Finance & Development Corp., Refunding, Series A, | 515,000 | 519,352 | ||||||
Hawaii State Housing Finance & Development Corp., Series B, | 35,000 | 35,677 | ||||||
Honolulu City & County GO, Series A, Callable 08/01/21 at 100, | 700,000 | 793,863 | ||||||
Honolulu City & County Board of Water Supply System Revenue, Refunding, Series A, | 320,000 | 351,958 | ||||||
Honolulu City & County Board of Water Supply System Revenue, Refunding, Series A, | 650,000 | 752,096 | ||||||
Honolulu City & County Board of Water Supply System Revenue, Refunding, Series A, | 515,000 | 607,911 | ||||||
The accompanying notes are an integral part of the financial statements.
21
PACIFIC CAPITAL FUNDS
Pacific Capital Tax-Free Short Intermediate Securities Fund
Portfolio of Investments (Continued)
October 31, 2017
(Unaudited)
| Principal Amount ($) | Value ($) | |||||||
MUNICIPAL BONDS — (Continued) |
| |||||||
Hawaii — (Continued) | ||||||||
Honolulu City & County Board of Water Supply System Revenue, Refunding, Series A, | 350,000 | 376,943 | ||||||
Honolulu City & County Board of Water Supply System Revenue, Refunding, Series A, Callable 07/01/24 at 100, | 105,000 | 124,991 | ||||||
Honolulu City & County GO, Series A, | 1,500,000 | 1,558,620 | ||||||
Honolulu City & County GO, Series A, | 1,000,000 | 1,033,560 | ||||||
Honolulu City & County GO, Series A, | 90,000 | 94,832 | ||||||
Honolulu City & County GO, Series A, Callable 04/01/19 at 100, | 60,000 | 63,221 | ||||||
Honolulu City & County GO, Series A, Callable 08/01/21 at 100, | 20,000 | 21,953 | ||||||
Honolulu City & County GO, Series A, Prerefunded, ETM, | 175,000 | 177,838 | ||||||
| Principal Amount ($) | Value ($) | |||||||
MUNICIPAL BONDS — (Continued) |
| |||||||
Hawaii — (Continued) | ||||||||
Honolulu City & County GO, Series A, Prerefunded, ETM, | 35,000 | 35,753 | ||||||
Honolulu City & County GO, Series A, Unrefunded, | 25,000 | 25,412 | ||||||
Honolulu City & County GO, Series B, | 1,000,000 | 1,105,430 | ||||||
Honolulu City & County GO, Series B, | 535,000 | 593,839 | ||||||
Honolulu City & County GO, Series D, Callable 09/01/19 at 100, | 1,000,000 | 1,073,280 | ||||||
Honolulu City & County GO, Series D, Callable 09/01/19 at 100, | 150,000 | 160,992 | ||||||
Honolulu City & County GO, Series D, ETM, | 115,000 | 122,909 | ||||||
Honolulu City & County GO, Variable Honolulu Rail Transit Project, Callable 09/01/18 at 100, | 500,000 | 500,070 | ||||||
The accompanying notes are an integral part of the financial statements.
22
PACIFIC CAPITAL FUNDS
Pacific Capital Tax-Free Short Intermediate Securities Fund
Portfolio of Investments (Continued)
October 31, 2017
(Unaudited)
| Principal Amount ($) | Value ($) | |||||||
MUNICIPAL BONDS — (Continued) |
| |||||||
Hawaii — (Continued) | ||||||||
Honolulu City & County Wastewater System Revenue, 1st Bond Resolution, Refunding, Senior Series A, | 1,000,000 | 1,063,770 | ||||||
Honolulu City & County Wastewater System Revenue, 1st Bond Resolution, Refunding, Senior Series A, | 1,000,000 | 1,098,490 | ||||||
Honolulu City & County Wastewater System Revenue, 1st Bond Resolution, Refunding, Senior Series A, | 1,000,000 | 1,130,420 | ||||||
Honolulu City & County Wastewater System Revenue, 1st Bond Resolution, Senior Series A, | 90,000 | 91,164 | ||||||
Honolulu City & County Wastewater System Revenue, 1st Bond Resolution, Senior Series A, Callable 07/01/2022 at 100, | 500,000 | 580,005 | ||||||
| Principal Amount ($) | Value ($) | |||||||
MUNICIPAL BONDS — (Continued) |
| |||||||
Hawaii — (Continued) | ||||||||
Honolulu City & County Wastewater System Revenue, 2nd Bond Resolution, Refunding, Series A, Callable 07/01/18 at 100, | 125,000 | 128,265 | ||||||
Honolulu City & County Wastewater System Revenue, Refunding, Junior Series A, | 815,000 | 866,549 | ||||||
Honolulu City & County Wastewater System Revenue, Refunding, Senior 1st Bond Resolution, Series B, | 500,000 | 549,245 | ||||||
Honolulu City & County Wastewater System Revenue, Refunding, Senior 1st Bond Resolution, Series B, | 500,000 | 547,390 | ||||||
Honolulu City & County Wastewater System Revenue, Senior Series A, | 1,005,000 | 1,100,254 | ||||||
Honolulu City & County Wastewater System Revenue, Senior Series A, Callable 07/01/21 at 100, | 35,000 | 39,917 | ||||||
The accompanying notes are an integral part of the financial statements.
23
PACIFIC CAPITAL FUNDS
Pacific Capital Tax-Free Short Intermediate Securities Fund
Portfolio of Investments (Continued)
October 31, 2017
(Unaudited)
| Principal Amount ($) | Value ($) | |||||||
MUNICIPAL BONDS — (Continued) |
| |||||||
Hawaii — (Continued) | ||||||||
Kauai Country GO, | 200,000 | 203,006 | ||||||
Kauai Country GO, | 305,000 | 319,533 | ||||||
Kauai County GO, | 35,000 | 37,343 | ||||||
Kauai County GO, | 345,000 | 361,539 | ||||||
Kauai County GO, | 250,000 | 253,635 | ||||||
Kauai County GO, | 150,000 | 157,452 | ||||||
Kauai County GO, | 10,000 | 10,749 | ||||||
Maui County GO, | 250,000 | 255,742 | ||||||
Maui County GO, | 475,000 | 485,911 | ||||||
Maui County GO, | 185,000 | 196,272 | ||||||
Maui County GO, | 320,000 | 342,429 | ||||||
Maui County GO, | 670,000 | 734,856 | ||||||
| Principal Amount ($) | Value ($) | |||||||
MUNICIPAL BONDS — (Continued) |
| |||||||
Hawaii — (Continued) | ||||||||
Maui County GO, | 225,000 | 254,115 | ||||||
Maui County GO, | 20,000 | 22,740 | ||||||
University of Hawaii | 230,000 | 231,980 | ||||||
University of Hawaii | 525,000 | 589,512 | ||||||
University of Hawaii | 500,000 | 567,030 | ||||||
University of Hawaii | 30,000 | 30,802 | ||||||
University of Hawaii | 1,385,000 | 1,434,611 | ||||||
|
| |||||||
| 53,948,295 | ||||||||
|
| |||||||
Idaho — 1.7% | ||||||||
Madison County School | 1,000,000 | 1,022,860 | ||||||
|
| |||||||
The accompanying notes are an integral part of the financial statements.
24
PACIFIC CAPITAL FUNDS
Pacific Capital Tax-Free Short Intermediate Securities Fund
Portfolio of Investments (Continued)
October 31, 2017
(Unaudited)
| Principal Amount ($) | Value ($) | |||||||
MUNICIPAL BONDS — (Continued) |
| |||||||
Iowa — 0.7% | ||||||||
University of Iowa Facilities | 435,000 | 441,856 | ||||||
|
| |||||||
Michigan — 0.1% | ||||||||
Michigan Municipal Bond | 70,000 | 70,230 | ||||||
|
| |||||||
Missouri — 0.8% | ||||||||
Kansas City Special | 450,000 | 462,847 | ||||||
|
| |||||||
New York — 0.8% | ||||||||
New York City GO, | 470,000 | 483,700 | ||||||
|
| |||||||
Oklahoma — 0.8% | ||||||||
Cleveland County | 500,000 | 512,550 | ||||||
|
| |||||||
Texas — 1.0% | ||||||||
Austin City GO, | 500,000 | 604,180 | ||||||
|
| |||||||
TOTAL MUNICIPAL | 60,255,991 | |||||||
|
| |||||||
| Shares | Value ($) | |||||||
REGISTERED INVESTMENT COMPANY — 2.0% |
| |||||||
Dreyfus Government Cash Management Fund, | 1,198,239 | 1,198,239 | ||||||
|
| |||||||
TOTAL REGISTERED INVESTMENT | 1,198,239 | |||||||
|
| |||||||
TOTAL INVESTMENTS - 100.0% (Cost $60,821,328) | 61,454,230 | |||||||
OTHER ASSETS IN EXCESS OF | 21,413 | |||||||
|
| |||||||
NET ASSETS - 100.0% | $ | 61,475,643 | ||||||
|
| |||||||
| (a) | Variable rate investments. The rate shown is based on the latest available information as of October 31, 2017. Certain variable rate securities are not based on a published reference rate and spread but are determined by the issuer or agent and are based on current market conditions. These securities do not indicate a reference rate and spread in their description. |
| (b) | Rate periodically changes. Rate disclosed is the daily yield on October 31, 2017. |
Portfolio holdings are subject to change at any time.
The accompanying notes are an integral part of the financial statements.
25
PACIFIC CAPITAL FUNDS
Pacific Capital Tax-Free Short Intermediate Securities Fund
Portfolio of Investments (Concluded)
October 31, 2017
(Unaudited)
| AGM | Assured Guaranty Municipal Corp. | |
| AMT | Alternative Minimum Tax | |
| ETM | Escrowed To Maturity | |
| FHLMC | Federal Home Loan Mortgage Corp. | |
| FNMA | Federal National Mortgage | |
| Association | ||
| GNMA | Government National Mortgage | |
| Association | ||
| GO | General Obligation | |
| ID SLSTAX GTY | Idaho Sales Tax Guaranty | |
| MAC | Municipal Assurance Corp |
The accompanying notes are an integral part of the financial statements.
26
PACIFIC CAPITAL FUNDS
Statements of Assets and Liabilities
October 31, 2017
(Unaudited)
| Pacific Capital Tax-Free Securities Fund | Pacific Capital Tax-Free Short Intermediate Securities Fund | |||||||||
Assets | ||||||||||
Investments, at value (Cost $297,026,898 and $60,821,328, respectively) | $ | 305,712,390 | $ | 61,454,230 | ||||||
Receivable for investments sold | 3,788,828 | — | ||||||||
Receivable for capital shares sold | 300,000 | — | ||||||||
Dividends and interest receivable | 3,575,932 | 763,423 | ||||||||
Prepaid expenses and other assets | 18,477 | 1,131 | ||||||||
|
|
|
| |||||||
Total assets | 313,395,627 | 62,218,784 | ||||||||
|
|
|
| |||||||
Liabilities | ||||||||||
Payable for investments purchased | 2,197,255 | 523,642 | ||||||||
Payable for capital shares redeemed | 197,972 | 153,329 | ||||||||
Payable for distributions to shareholders | 122,294 | 13,648 | ||||||||
Payable for administration and accounting fees | 34,717 | 21,953 | ||||||||
Payable for transfer agent fees | 4,413 | 8,021 | ||||||||
Payable to custodian | 1,229 | 2,302 | ||||||||
Accrued expenses | 37,058 | 20,246 | ||||||||
|
|
|
| |||||||
Total liabilities | 2,594,938 | 743,141 | ||||||||
|
|
|
| |||||||
Net Assets | $ | 310,800,689 | $ | 61,475,643 | ||||||
|
|
|
| |||||||
Net Assets consist of: | ||||||||||
Capital stock, $0.01 par value | $ | 304,261 | $ | 60,727 | ||||||
Paid-in capital | 304,020,802 | 60,811,237 | ||||||||
Undistributed net investment income | — | 49 | ||||||||
Accumulated net realized loss from investments | (2,209,866 | ) | (29,272 | ) | ||||||
Net unrealized appreciation on investments | 8,685,492 | 632,902 | ||||||||
|
|
|
| |||||||
Net Assets | $ | 310,800,689 | $ | 61,475,643 | ||||||
|
|
|
| |||||||
Class Y: | ||||||||||
Outstanding shares | 30,426,097 | 6,072,664 | ||||||||
|
|
|
| |||||||
Net asset value, offering and redemption price per share | $ | 10.21 | $ | 10.12 | ||||||
|
|
|
| |||||||
The accompanying notes are an integral part of the financial statements.
27
PACIFIC CAPITAL FUNDS
Statements of Operations
For the Six Months Ended October 31, 2017
(Unaudited)
| Pacific Capital Tax-Free Securities Fund | Pacific Capital Tax-Free Short Intermediate Securities Fund | |||||||||
Investment income | ||||||||||
Interest | $ | 3,939,437 | $ | 506,078 | ||||||
Dividends | 20,395 | 7,667 | ||||||||
|
|
|
| |||||||
Total investment income | 3,959,832 | 513,745 | ||||||||
|
|
|
| |||||||
Expenses | ||||||||||
Advisory fees (Note 2) | 318,764 | 65,699 | ||||||||
Trustees’ and officers’ fees (Note 2) | 42,295 | 12,141 | ||||||||
Administration and accounting fees (Note 2) | 41,712 | 25,813 | ||||||||
Legal fees | 19,825 | 4,158 | ||||||||
Audit fees | 13,919 | 14,649 | ||||||||
Custodian fees (Note 2) | 13,364 | 9,639 | ||||||||
Transfer agent fees (Note 2) | 12,139 | 14,482 | ||||||||
Printing and shareholder reporting fees | 11,453 | 2,005 | ||||||||
Registration and filing fees | 262 | 437 | ||||||||
Other expenses | 10,281 | 2,918 | ||||||||
|
|
|
| |||||||
Total expenses before waivers | 484,014 | 151,941 | ||||||||
|
|
|
| |||||||
Less: waivers (Note 2) | (318,764 | ) | (65,699 | ) | ||||||
|
|
|
| |||||||
Net expenses after waivers | 165,250 | 86,242 | ||||||||
|
|
|
| |||||||
Net investment income | 3,794,582 | 427,503 | ||||||||
|
|
|
| |||||||
Net realized and unrealized gain/(loss) from investments: | ||||||||||
Net realized gain from investments | 21,428 | 14,402 | ||||||||
Net change in unrealized appreciation/(depreciation) on investments | 2,097,704 | (68,238 | ) | |||||||
|
|
|
| |||||||
Net realized and unrealized gain/(loss) on investments | 2,119,132 | (53,836 | ) | |||||||
|
|
|
| |||||||
Net increase in net assets resulting from operations | $ | 5,913,714 | $ | 373,667 | ||||||
|
|
|
| |||||||
The accompanying notes are an integral part of the financial statements.
28
PACIFIC CAPITAL FUNDS
Pacific Capital Tax-Free Securities Fund
Statements of Changes in Net Assets
| Six Months Ended October 31, 2017 (Unaudited) | Year Ended April 30, 2017 | |||||||||
Increase/(decrease) in net assets from operations: | ||||||||||
Net investment income | $ | 3,794,582 | $ | 7,576,154 | ||||||
Net realized gain/(loss) from investments | 21,428 | (393,568 | ) | |||||||
Net change in unrealized appreciation/(depreciation) on investments | 2,097,704 | (8,041,851 | ) | |||||||
|
|
|
| |||||||
Net increase/(decrease) in net assets resulting from operations | 5,913,714 | (859,265 | ) | |||||||
|
|
|
| |||||||
Less dividends and distributions to shareholders from: | ||||||||||
Net investment income | (3,794,582 | ) | (7,576,245 | ) | ||||||
|
|
|
| |||||||
Net decrease in net assets from dividends and distributions to shareholders | (3,794,582 | ) | (7,576,245 | ) | ||||||
|
|
|
| |||||||
Increase/decrease in net assets derived from capital share transactions (Note 4) | (6,051,341 | ) | 22,651,726 | |||||||
|
|
|
| |||||||
Total increase/(decrease) in net assets | (3,932,209 | ) | 14,216,216 | |||||||
|
|
|
| |||||||
Net assets | ||||||||||
Beginning of period | 314,732,898 | 300,516,682 | ||||||||
|
|
|
| |||||||
End of period | $ | 310,800,689 | $ | 314,732,898 | ||||||
|
|
|
| |||||||
Undistributed net investment income/(loss), end of period | $ | — | $ | — | ||||||
|
|
|
| |||||||
The accompanying notes are an integral part of the financial statements.
29
PACIFIC CAPITAL FUNDS
Pacific Capital Tax-Free Short Intermediate Securities Fund
Statements of Changes in Net Assets
| Six Months Ended October 31, 2017 (Unaudited) | Year Ended April 30, 2017 | |||||||
Increase/(decrease) in net assets from operations: | ||||||||
Net investment income | $ | 427,503 | $ | 947,257 | ||||
Net realized gain from investments | 14,402 | 141,608 | ||||||
Net change in unrealized depreciation on investments | (68,238 | ) | (983,102 | ) | ||||
|
|
|
| |||||
Net increase in net assets resulting from operations | 373,667 | 105,763 | ||||||
|
|
|
| |||||
Less dividends and distributions to shareholders from: | ||||||||
Net investment income: | ||||||||
Class Y | (427,503 | ) | (947,257 | ) | ||||
Net realized capital gains: | ||||||||
Class Y | — | (198,477 | ) | |||||
|
|
|
| |||||
Net decrease in net assets from dividends and distributions to shareholders | (427,503 | ) | (1,145,734 | ) | ||||
|
|
|
| |||||
Decrease in net assets derived from capital share transactions (Note 4) | (6,545,442 | ) | (21,323,423 | ) | ||||
|
|
|
| |||||
Total decrease in net assets | (6,599,278 | ) | (22,363,394 | ) | ||||
|
|
|
| |||||
Net assets | ||||||||
Beginning of period | 68,074,921 | 90,438,315 | ||||||
|
|
|
| |||||
End of period | $ | 61,475,643 | $ | 68,074,921 | ||||
|
|
|
| |||||
Undistributed net investment income, end of period | $ | 49 | $ | 49 | ||||
|
|
|
| |||||
The accompanying notes are an integral part of the financial statements.
30
PACIFIC CAPITAL FUNDS
Pacific Capital Tax-Free Securities Fund
Financial Highlights
Contained below is per share operating performance data for Class Y Shares outstanding, total investment return, ratios to average net assets and other supplemental data for the respective periods. The total returns in the table represent the rate that an investor would have earned or lost on an investment in the Fund (assuming reinvestment of all dividends and distributions). This information has been derived from information provided in the financial statements and should be read in conjunction with the financial statements and the notes thereto.
Class Y Shares | For the Six Months Ended October 31, 2017 (Unaudited) | For the Year Ended April 30, 2017 | For the Year Ended April 30, 2016 | For the Year Ended April 30, 2015 | For the Year Ended April 30, 2014 | For the Year Ended April 30, 2013 | ||||||||||||||||||
Per Share Operating Performance | ||||||||||||||||||||||||
Net asset value, beginning of period | $ | 10.15 | $ | 10.41 | $ | 10.24 | $ | 10.18 | $ | 10.51 | $ | 10.41 | ||||||||||||
|
|
|
|
|
|
|
|
|
|
|
| |||||||||||||
Net investment income | 0.12 | 0.25 | 0.30 | 0.33 | 0.33 | 0.34 | ||||||||||||||||||
Net realized and unrealized gain/(loss) from investments | 0.06 | (0.26 | ) | 0.17 | 0.06 | (0.33 | ) | 0.11 | ||||||||||||||||
|
|
|
|
|
|
|
|
|
|
|
| |||||||||||||
Net increase in net assets resulting from operations | 0.18 | (0.01 | ) | 0.47 | 0.39 | — | 0.45 | |||||||||||||||||
|
|
|
|
|
|
|
|
|
|
|
| |||||||||||||
Dividends and distributions to shareholders from: | ||||||||||||||||||||||||
Net investment income | (0.12 | ) | (0.25 | ) | (0.30 | ) | (0.33 | ) | (0.33 | ) | (0.35 | ) | ||||||||||||
|
|
|
|
|
|
|
|
|
|
|
| |||||||||||||
Net asset value, end of period | $ | 10.21 | $ | 10.15 | $ | 10.41 | $ | 10.24 | $ | 10.18 | $ | 10.51 | ||||||||||||
|
|
|
|
|
|
|
|
|
|
|
| |||||||||||||
Total investment return(1) | 1.91 | % | (0.10 | )% | 4.63 | % | 3.87 | % | 0.11 | % | 4.40 | % | ||||||||||||
Ratios/Supplemental Data | ||||||||||||||||||||||||
Net assets, end of period (in thousands) | $ | 310,801 | $ | 314,733 | $ | 300,517 | $ | 211,289 | $ | 218,771 | $ | 303,624 | ||||||||||||
Ratio of expenses to average net assets | 0.10 | %* | 0.10 | % | 0.10 | % | 0.12 | % | 0.11 | % | 0.10 | % | ||||||||||||
Ratio of expenses to average net assets without waivers(2) | 0.30 | %* | 0.30 | % | 0.30 | % | 0.32 | % | 0.31 | % | 0.30 | % | ||||||||||||
Ratio of net investment income to average net assets | 2.38 | %* | 2.42 | % | 2.87 | % | 3.21 | % | 3.30 | % | 3.28 | % | ||||||||||||
Portfolio turnover rate | 12.45 | %** | 15.26 | % | 17.57 | % | 16.60 | % | 5.35 | % | 14.78 | % | ||||||||||||
| * | Annualized. |
| ** | Not Annualized. |
| (1) | Total investment return is calculated assuming a purchase of shares on the first day and a sale of shares on the last day of each period reported and includes reinvestment of dividends and distributions, if any. Total return for periods less than one year are not annualized. |
| (2) | During the period, certain fees were waived. If such fee waivers had not occurred, the ratios would have been as indicated (See Note 2). |
The accompanying notes are an integral part of the financial statements.
31
PACIFIC CAPITAL FUNDS
Pacific Capital Tax-Free Short Intermediate Securities Fund
Financial Highlights
Contained below is per share operating performance data for Class Y Shares outstanding, total investment return, ratios to average net assets and other supplemental data for the respective periods. The total returns in the table represent the rate that an investor would have earned or lost on an investment in the Fund (assuming reinvestment of all dividends and distributions). This information has been derived from information provided in the financial statements and should be read in conjunction with the financial statements and the notes thereto.
Class Y Shares | For the Six Months Ended October 31, 2017 (Unaudited) | For the Year Ended April 30, 2017 | For the Year Ended April 30, 2016 | For the Year Ended April 30, 2015 | For the Year Ended April 30, 2014 | For the Year Ended April 30, 2013 | ||||||||||||||||||
Per Share Operating Performance | ||||||||||||||||||||||||
Net asset value, beginning of period | $ | 10.14 | $ | 10.27 | $ | 10.19 | $ | 10.17 | $ | 10.30 | $ | 10.33 | ||||||||||||
|
|
|
|
|
|
|
|
|
|
|
| |||||||||||||
Net investment income | 0.07 | 0.13 | 0.12 | 0.10 | 0.12 | 0.17 | ||||||||||||||||||
Net realized and unrealized gain/(loss) from investments | (0.02 | ) | (0.10 | ) | 0.08 | 0.02 | (0.13 | ) | (0.03 | ) | ||||||||||||||
|
|
|
|
|
|
|
|
|
|
|
| |||||||||||||
Net increase/(decrease) in net assets resulting from operations | 0.05 | 0.03 | 0.20 | 0.12 | (0.01 | ) | 0.14 | |||||||||||||||||
|
|
|
|
|
|
|
|
|
|
|
| |||||||||||||
Dividends and distributions to shareholders from: | ||||||||||||||||||||||||
Net investment income | (0.07 | ) | (0.13 | ) | (0.12 | ) | (0.10 | ) | (0.12 | ) | (0.17 | ) | ||||||||||||
Net realized gains | — | (0.03 | ) | — | — | — | — | |||||||||||||||||
|
|
|
|
|
|
|
|
|
|
|
| |||||||||||||
Total dividends and distributions and shareholders | (0.07 | ) | (0.16 | ) | (0.12 | ) | (0.10 | ) | (0.12 | ) | (0.17 | ) | ||||||||||||
|
|
|
|
|
|
|
|
|
|
|
| |||||||||||||
Net asset value, end of period | $ | 10.12 | $ | 10.14 | $ | 10.27 | $ | 10.19 | $ | 10.17 | $ | 10.30 | ||||||||||||
|
|
|
|
|
|
|
|
|
|
|
| |||||||||||||
Total investment return(1) | 0.46 | % | 0.24 | % | 1.93 | % | 1.23 | % | (0.09 | )% | 1.39 | % | ||||||||||||
Ratios/Supplemental Data | ||||||||||||||||||||||||
Net assets, end of period (in thousands) | $ | 61,476 | $ | 68,075 | $ | 90,438 | $ | 132,494 | $ | 108,671 | $ | 62,564 | ||||||||||||
Ratio of expenses to average net assets | 0.26 | %* | 0.25 | % | 0.15 | % | 0.13 | % | 0.19 | % | 0.25 | % | ||||||||||||
Ratio of expenses to average net assets without waivers(2) | 0.46 | %* | 0.45 | % | 0.35 | % | 0.33 | % | 0.39 | % | 0.45 | % | ||||||||||||
Ratio of net investment income to average net assets | 1.30 | %* | 1.24 | % | 1.12 | % | 1.02 | % | 1.15 | % | 1.62 | % | ||||||||||||
Portfolio turnover rate | 17.77 | %** | 18.90 | % | 18.87 | % | 24.07 | % | 26.98 | % | 23.97 | % | ||||||||||||
| * | Annualized. |
| ** | Not Annualized. |
| (1) | Total investment return is calculated assuming a purchase of shares on the first day and a sale of shares on the last day of each period reported and includes reinvestment of dividends and distributions, if any. Total return for periods less than one year are not annualized. |
| (2) | During the period, certain fees were waived. If such fee waivers had not occurred, the ratios would have been as indicated (See Note 2). |
The accompanying notes are an integral part of the financial statements.
32
PACIFIC CAPITAL FUNDS
Notes to Financial Statements
October 31, 2017
(Unaudited)
1. Organization and Significant Accounting Policies
The Pacific Capital Tax-Free Securities Fund and Pacific Capital Tax-Free Short Intermediate Securities Fund (each a “Fund” and together the “Funds”) are non-diversified open-end management investment companies registered under the Investment Company Act of 1940, as amended (the “1940 Act”). The Funds are each a separate series of FundVantage Trust (the “Trust”) which was organized as a Delaware statutory trust on August 28, 2006. The Trust is a “series trust” authorized to issue an unlimited number of separate series or classes of shares of beneficial interest. Each series is treated as a separate entity for certain matters under the 1940 Act, and for other purposes, and a shareholder of one series is not deemed to be a shareholder of any other series. The Funds are each authorized to issue and offer Class Y shares.
The Funds are investment companies and follow accounting and reporting guidance in the Financial Accounting Standards Board Accounting Standards Codification Topic 946.
Portfolio Valuation — Each Fund’s net asset value (“NAV”) is calculated once daily at the close of regular trading hours on the New York Stock Exchange (“NYSE”) (typically 4:00 p.m. Eastern time) on each day the NYSE is open. Securities held by each Fund are valued using the closing price or the last sale price on a national securities exchange or the National Association of Securities Dealers Automatic Quotation System (“NASDAQ”) market system where they are primarily traded. Equity securities traded in the over-the-counter market are valued at their closing prices. If there were no transactions on that day, securities traded principally on an exchange or on NASDAQ will be valued at the mean of the last bid and ask prices prior to the market close. Fixed income securities having a remaining maturity of greater than 60 days are valued using an independent pricing service. Fixed income securities having a remaining maturity of 60 days or less are generally valued at amortized cost, provided such amount approximates fair value. Debt securities are valued on the basis of broker quotations or valuations provided by a pricing service, which utilizes information with respect to recent sales, market transactions in comparable securities, quotations from dealers, and various relationships between securities in determining value. Valuations developed through pricing techniques may materially vary from the actual amounts realized upon sale of the securities. Foreign securities are valued based on prices from the primary market in which they are traded and are translated from the local currency into U.S. dollars using current exchange rates. Investments in other open-end investment companies are valued based on the NAV of such investment companies (which may use fair value pricing as discussed in their prospectuses). If market quotations are unavailable or deemed unreliable, securities will be valued in accordance with procedures adopted by the Trust’s Board of Trustees (“Board of Trustees”). Relying on prices supplied by pricing services or dealers or using fair valuation may result in values that are higher or lower than the values used by other investment companies and investors to price the same investments. In the event that market quotes are not readily available, and the security or asset cannot be valued pursuant to one of the valuation methods,
33
PACIFIC CAPITAL FUNDS
Notes to Financial Statements (Continued)
October 31, 2017
(Unaudited)
the value of the security or asset will be determined in good faith by the Adviser. The Trust has established a Valuation Committee which performs certain functions including the oversight of the Adviser’s fair valuation determinations.
Fair Value Measurements — The inputs and valuation techniques used to measure fair value of the Funds’ investments are summarized into three levels as described in the hierarchy below:
• Level 1 — | quoted prices in active markets for identical securities; | |
• Level 2 — | other significant observable inputs (including quoted prices for similar securities, interest rates, prepayment speeds, credit risk, etc.); and | |
• Level 3 — | significant unobservable inputs (including a Fund’s own assumptions in determining the fair value of investments). | |
The fair value of a Fund’s bonds are generally based on quotes received from brokers of independent pricing services. Bonds with quotes that are based on actual trades with a sufficient level of activity on or near the measurement date are classified as Level 2 assets.
The inputs or methodology used for valuing securities are not necessarily an indication of the risk associated with investing in those securities.
The following is a summary of the inputs used, as of October 31, 2017, in valuing the Funds’ investments carried at fair value:
Funds | Total Value at 10/31/17 | Level 1 Quoted Price | Level 2 Other Significant Observable Inputs | Level 3 Significant Unobservable Inputs | ||||||||||||
Pacific Capital Tax-Free Securities Fund | ||||||||||||||||
Municipal Bonds | $ | 304,586,485 | $ | — | $ | 304,586,485 | $ | — | ||||||||
Registered Investment Company | 1,125,905 | 1,125,905 | — | — | ||||||||||||
|
|
|
|
|
|
|
| |||||||||
Total | $ | 305,712,390 | $ | 1,125,905 | $ | 304,586,485 | $ | — | ||||||||
|
|
|
|
|
|
|
| |||||||||
Pacific Capital Tax-Free Short Intermediate Securities Fund | ||||||||||||||||
Municipal Bonds | $ | 60,255,991 | $ | — | $ | 60,255,991 | $ | — | ||||||||
Registered Investment Company | 1,198,239 | 1,198,239 | — | — | ||||||||||||
|
|
|
|
|
|
|
| |||||||||
Total | $ | 61,454,230 | $ | 1,198,239 | $ | 60,255,991 | $ | — | ||||||||
|
|
|
|
|
|
|
| |||||||||
34
PACIFIC CAPITAL FUNDS
Notes to Financial Statements (Continued)
October 31, 2017
(Unaudited)
At the end of each quarter, management evaluates the classification of Levels 1, 2 and 3 assets and liabilities. Various factors are considered, such as changes in liquidity from the prior reporting period; whether or not a broker is willing to execute at the quoted price; the depth and consistency of prices from third party pricing services; and the existence of contemporaneous, observable trades in the market. Additionally, management evaluates the classification of Level 1 and Level 2 assets and liabilities on a quarterly basis for changes in listings or delistings on national exchanges.
Due to the inherent uncertainty of determining the fair value of investments that do not have a readily available market value, the fair value of a Fund’s investments may fluctuate from period to period. Additionally, the fair value of investments may differ significantly from the values that would have been used had a ready market existed for such investments and may differ materially from the values a Fund may ultimately realize. Further, such investments may be subject to legal and other restrictions on resale or otherwise less liquid than publicly traded securities.
For fair valuations using significant unobservable inputs, U.S. generally accepted accounting principles (“U.S. GAAP”) require the Funds to present a reconciliation of the beginning to ending balances for reported market values that presents changes attributable to total realized and unrealized gains or losses, purchase and sales, and transfers in and out of Level 3 during the period. Transfers in and out between Levels are based on values at the end of the period. U.S. GAAP also requires the Funds to disclose amounts and reasons for all transfers in and out of Level 1 and Level 2 fair value measurements. A reconciliation of Level 3 investments is presented only when the Funds have an amount of Level 3 investments at the end of the reporting period that was meaningful in relation to its net assets. The amounts and reasons for all transfers in and out of each Level within the three-tier hierarchy are disclosed when the Funds have an amount of total transfers during the reporting period that was meaningful in relation to its net assets as of the end of the reporting period.
For the six months ended October 31, 2017, there were no transfers between Levels 1, 2 and 3.
Use of Estimates — The preparation of financial statements in conformity with U.S. GAAP requires management to make estimates and assumptions that affect the amounts reported in the financial statements and accompanying notes at the date of the financial statements and the reported amounts of revenues and expenses during the period. Actual results could differ from those estimates and those differences could be material.
Investment Transactions, Investment Income and Expenses — Investment transactions are recorded on trade date for financial statement preparation purposes. Realized gains and losses on investments sold are recorded on the identified cost basis. Interest income is recorded on the accrual basis. Accretion of discounts and amortization of premiums are recorded on a daily basis using the effective yield method except for short term securities, which records discounts and premiums on a straight-line basis. Dividends are recorded on the ex-dividend date. General expenses of the Trust are generally allocated to each fund in proportion to its relative daily net assets. Expenses directly attributable to a particular fund in the Trust are charged directly to that fund.
35
PACIFIC CAPITAL FUNDS
Notes to Financial Statements (Continued)
October 31, 2017
(Unaudited)
Dividends and Distributions to Shareholders — Dividends from net investment income are declared daily and paid monthly to shareholders. Distributions, if any, of net short-term capital gain and net capital gain (the excess of net long-term capital gain over the short-term capital loss) realized by a Fund, after deducting any available capital loss carryovers are declared and paid to its shareholders annually. Income dividends and capital gain distributions are determined in accordance with U.S. federal income tax regulations, which may differ from U.S. GAAP. These differences may include the treatment of non-taxable dividends, expiring capital loss carryforwards and losses deferred due to wash sales and excise tax regulations. Permanent book and tax basis differences relating to shareholder distributions will result in reclassifications within the components of net assets.
U.S. Tax Status — No provision is made for U.S. income taxes as it is each Fund’s intention to continue to qualify for and elect the tax treatment applicable to regulated investment companies under Subchapter M of the Internal Revenue Code of 1986, as amended (“Internal Revenue Code”), and make the requisite distributions to such Fund’s shareholders, which will be sufficient to relieve it from U.S. income and excise taxes.
Other — In the normal course of business, a Fund may enter into contracts that provide general indemnifications. A Fund’s maximum exposure under these arrangements is dependent on claims that may be made against it in the future, and, therefore, cannot be estimated; however, based on experience, the risk of material loss for such claims is considered remote.
Recent Accounting Pronouncement — On August 1, 2017, the Funds implemented changes due to amendments to Regulation S-X, issued by the Securities and Exchange Commission, which require standardized, enhanced disclosures, particularly related to derivatives, in investment company financial statements. Adoption of the amendments had no effect on the Funds’ net assets or results of operations.
2. Transactions with Related Parties and Other Service Providers
Investment advisory services are provided to the Funds by the Asset Management Group of Bank of Hawaii (the “Adviser”). Under terms of an advisory agreement, each Fund is charged an annual fee of 0.20% which is computed daily and paid monthly based upon average daily net assets. The Adviser has agreed to waive its advisory fee (the “Waiver”). The Waiver will remain in effect until August 31, 2019. The Waiver may not be terminated at any time prior to that date without the consent of the Board of Trustees of FundVantage Trust (the “Trust”).
36
PACIFIC CAPITAL FUNDS
Notes to Financial Statements (Continued)
October 31, 2017
(Unaudited)
Fee rates for the period May 1, 2017 through October 31, 2017, were as follows:
| Maximum Annual Advisory Fee | Net Annual Fees Paid After Contractual Waivers | |||
Pacific Capital Tax-Free Securities Fund | 0.20% | 0.00% | ||
Pacific Capital Tax-Free Short Intermediate Securities Fund | 0.20% | 0.00% |
Other Service Providers
BNY Mellon Investment Servicing (US) Inc. (“BNY Mellon”) serves as administrator and transfer agent for the Funds. For providing administrative and accounting services, BNY Mellon is entitled to receive a monthly fee equal to an annual percentage rate of each Fund’s average daily net assets and is subject to certain minimum monthly fees. For providing transfer agency services, BNY Mellon is entitled to receive a monthly fee, subject to certain minimum, and out of pocket expenses.
The Bank of New York Mellon (the “Custodian”) provides certain custodial services to the Funds. The Custodian is entitled to receive a monthly fee, subject to certain minimum, and out of pocket expenses.
Foreside Funds Distributors LLC (the “Underwriter”) provides principal underwriting services to the Funds.
Trustees and Officers
The Trust is governed by its Board of Trustees. The Trustees receive compensation in the form of an annual retainer and per meeting fees for their services to the Trust. The remuneration paid to the Trustees by the Funds during the six months ended October 31, 2017 was $13,079 for the Pacific Capital Tax-Free Securities Fund and $2,737 for the Pacific Capital Tax-Free Short Intermediate Securities Fund. An employee of BNY Mellon serves as the Secretary of the Trust and is not compensated by the Fund or the Trust.
JW Fund Management LLC (“JWFM”) provides a Principal Executive Officer and Principal Financial Officer, respectively, to the Trust. JWFM is compensated for the services provided to the Trust.
Freeh Group International Solutions, LLC provides the Trust with a Chief Compliance Officer and an Anti-Money Laundering Officer.
37
PACIFIC CAPITAL FUNDS
Notes to Financial Statements (Continued)
October 31, 2017
(Unaudited)
3. Investment in Securities
For the six months ended October 31, 2017, aggregate purchases and sales of investment securities (excluding short-term investments) of the Funds were as follows:
| Purchases | Sales | |||||||
Pacific Capital Tax-Free Securities Fund | $ | 42,225,310 | $ | 38,503,369 | ||||
Pacific Capital Tax-Free Short Intermediate Securities Fund | 11,008,497 | 12,939,165 | ||||||
The Funds are permitted to purchase or sell securities from or to certain other affiliated funds under specified conditions outlined in the procedures adopted by the Board of Trustees of the Funds. The procedures have been designed to provide assurances that any purchase or sale of securities by the Funds from or to another fund that is or could be considered an affiliate by virtue of having a common investment adviser (or affiliated investment adviser), common Trustees and/or common officers complies with Rule 17a-7 under the 1940 act. Further, as defined under the procedures, each transaction is effective at the current market price.
For the six months ended October 31, 2017, the Funds engaged in security transactions with affiliated funds with proceeds from sales of $1,933,294 and net realized gain from sales of $22,918.
4. Capital Share Transactions
For the six months ended October 31, 2017 and the year ended April 30, 2017, transactions in capital shares (authorized shares unlimited) were as follows:
| For the Six Months Ended October 31, 2017 (Unaudited) | For the Year Ended April 30, 2017 | |||||||||||||||
| Shares | Amount | Shares | Amount | |||||||||||||
Pacific Capital Tax-Free Securities Fund | ||||||||||||||||
Class Y | ||||||||||||||||
Sales | 1,626,639 | $ | 16,659,326 | 6,505,452 | $ | 66,973,177 | ||||||||||
Reinvestments | 2,894 | 29,687 | 6,248 | 64,173 | ||||||||||||
Redemptions | (2,217,443 | ) | (22,740,354 | ) | (4,355,799 | ) | (44,385,624 | ) | ||||||||
|
|
|
|
|
|
|
| |||||||||
Net increase/decrease | (587,910 | ) | $ | (6,051,341 | ) | 2,155,901 | $ | 22,651,726 | ||||||||
|
|
|
|
|
|
|
| |||||||||
38
PACIFIC CAPITAL FUNDS
Notes to Financial Statements (Continued)
October 31, 2017
(Unaudited)
| For the Six Months Ended October 31, 2017 (Unaudited) | For the Year Ended April 30, 2017 | |||||||||||||||
| Shares | Amount | Shares | Amount | |||||||||||||
Pacific Capital Tax-Free Short Intermediate Securities Fund | ||||||||||||||||
Class Y | ||||||||||||||||
Sales | 385,439 | $ | 3,915,943 | 1,426,326 | $ | 14,517,009 | ||||||||||
Reinvestments | 225 | 2,287 | 637 | 6,464 | ||||||||||||
Redemptions | (1,029,593 | ) | (10,463,672 | ) | (3,516,741 | ) | (35,846,896 | ) | ||||||||
|
|
|
|
|
|
|
| |||||||||
Net decrease | (643,929 | ) | $ | (6,545,442 | ) | (2,089,778 | ) | $ | (21,323,423 | ) | ||||||
|
|
|
|
|
|
|
| |||||||||
5. Federal Tax Information
The Funds have followed the authoritative guidance on accounting for and disclosure of uncertainty in tax positions, which requires the Funds to determine whether a tax position is more likely than not to be sustained upon examination, including resolution of any related appeals or litigation processes, based on the technical merits of the position. The Funds have determined that there was no effect on the financial statements from following this authoritative guidance. In the normal course of business, the Funds are subject to examination by federal, state, and local jurisdictions, where applicable, for tax years for which applicable statutes of limitations have not expired.
The tax character of distributions paid during the year ended April 30, 2017, were as follows:
| Net Investment Income | Net Long-Term Capital Gains | Total Taxable Distributions | Tax Exempt Distributions | Total Distributions Paid* | ||||||||||||||||
Pacific Capital Tax-Free Securities Fund | $ | 6,367 | $ | — | $ | 6,367 | $ | 7,530,337 | $ | 7,536,704 | ||||||||||
Pacific Capital Tax-Free Short Intermediate Securities Fund | — | 198,477 | 198,477 | 938,319 | 1,136,796 | |||||||||||||||
| * | Distributions will not tie to Statement of Changes because distributions are recognized when actually paid for tax purposes. |
Distributions from net investment income and short-term capital gains are treated as ordinary income for federal income tax purposes.
39
PACIFIC CAPITAL FUNDS
Notes to Financial Statements (Continued)
October 31, 2017
(Unaudited)
As of April 30, 2017, the components of accumulated earnings/(deficit) on a tax basis were as follows:
| Undistributed Tax-Exempt Income | Qualified Late-Year Losses | Undistributed Long-Term Capital Gains | Distributions Payable | Capital Loss Carryforwards | Unrealized Appreciation | |||||||||||||||||||
Pacific Capital Tax-Free Securities Fund | $ | 101,431 | $ | — | $ | — | $ | (101,431 | ) | $ | (2,231,294 | ) | $ | 6,587,788 | ||||||||||
Pacific Capital Tax-Free Short Intermediate Securities Fund | 18,968 | (43,673 | ) | — | (18,920 | ) | — | 701,140 | ||||||||||||||||
The differences between the book and tax basis components of distributable earnings relate primarily to the timing and recognition of income and gains for federal income tax purposes. Short-term capital gain is reported as ordinary income for federal income tax purposes.
The cost for federal income tax purposes, gross unrealized appreciation, gross unrealized depreciation and net unrealized appreciation as of October 31, 2017 is as follows:
| Tax Cost of Securities* | Unrealized Appreciation | Unrealized Depreciation | Net Unrealized Appreciation | |||||||||||||
Pacific Capital Tax-Free Securities Fund | $ | 297,026,898 | $ | 9,594,214 | $ | (908,722 | ) | $ | 8,685,492 | |||||||
Pacific Capital Tax-Free Short Intermediate Securities Fund | 60,821,328 | 668,460 | (35,558 | ) | 632,902 | |||||||||||
| * | Because tax adjustments are calculated annually at the end of the Fund’s fiscal year, the above table does not reflect tax adjustments for the current fiscal year. For the previous year’s federal income tax information, please refer to the Notes to Financial Statements section in the Fund’s most recent annual report. |
Pursuant to federal income tax rules applicable to regulated investment companies, the Funds may elect to treat certain capital losses between November 1 and April 30 and late year ordinary losses ((i) ordinary losses between January 1 and April 30, and (ii) specified ordinary and currency losses between November 1 and April 30) as occurring on the first day of the following tax year. For the year ended April 30, 2017, any amount of losses elected within the tax return will not be recognized for federal income tax purposes until May 1, 2017. For the year ended April 30, 2017, the Funds deferred to May 1, 2017 the following losses:
| Short-Term Capital Loss Deferral | Long-Term Capital Loss Deferral | |||
Pacific Capital Tax-Free Securities Fund | $ — | $— | ||
Pacific Capital Tax-Free Short Intermediate Securities Fund | 43,673 | — |
40
PACIFIC CAPITAL FUNDS
Notes to Financial Statements (Continued)
October 31, 2017
(Unaudited)
Accumulated capital losses represent net capital loss carryforwards as of April 30, 2017 that may be available to offset future realized capital gains and thereby reduce future capital gains distributions. Under the Regulated Investment Company Modernization Act of 2010, the Funds are permitted to carry forward capital losses incurred in taxable years beginning after December 22, 2010 for an unlimited period. Any losses incurred during those future taxable years will be required to be utilized prior to any losses incurred in pre-enactment taxable years. Additionally, post-enactment capital losses that are carried forward will retain their character as either short-term or long-term capital losses rather than being considered all short-term as under the previous law.
As of April 30, 2017, the Funds had pre-enactment net capital loss carryforwards to offset future net capital gains, if any, to the extent provided by Treasury regulations. To the extent that these carryforwards are used to offset future capital gains, it is probable that the gains that are offset will not be distributed to shareholders.
| Expires April 30, 2018 | ||
Pacific Capital Tax-Free Securities Fund | $237,475 | |
Pacific Capital Tax-Free Short Intermediate Securities Fund | — |
As of April 30, 2017, the Funds’ post-enactment capital loss carryforward which were short-term losses and long-term losses and had an unlimited period of capital loss carryover were as follows:
| Post-Enactment Unlimited Period of Net Capital Loss Carryforward | ||||||||
| Short-Term | Long-Term | |||||||
Pacific Capital Tax Free Securities Fund | $ | 1,138,195 | $ | 855,624 | ||||
Pacific Capital Tax Free Short Intermediate Securities Fund | — | — | ||||||
6. Concentration of Credit Risk
The Funds primarily invest in debt obligations issued by the state of Hawaii and its political subdivisions, agencies, and public authorities to obtain funds for various public purposes. The Funds are more susceptible to factors adversely affecting issues of Hawaii municipal securities than is a municipal bond fund that is not concentrated in these issuers to the same extent.
7. Debt Investment Risk
Debt investments are affected primarily by the financial condition of the companies or other entities that have issued them and by changes in interest rates. There is a risk that an issuer of a Fund’s debt investments may not be able to meet its financial obligations (e.g., may not be able to make principal and/or interest payments when they are due or otherwise default on other financial terms) and/or go
41
PACIFIC CAPITAL FUNDS
Notes to Financial Statements (Concluded)
October 31, 2017
(Unaudited)
bankrupt. Securities such as high-yield/high-risk bonds, e.g., bonds with low credit ratings by Moody’s (Ba or lower) or Standard & Poor’s (BB and lower) or if unrated are of comparable quality as determined by the manager, are especially subject to credit risk during periods of economic uncertainty or during economic downturns and are more likely to default on their interest and/or principal payments than higher rated securities. Debt investments may be affected by changes in interest rates. Debt investments with longer durations tend to be more sensitive to changes in interest rates, making them more volatile than debt investments with shorter durations or floating or adjustable interest rates. The value of debt investments may fall when interest rates rise.
8. Subsequent Events
Management has evaluated the impact of all subsequent events on the Funds through the date that the financial statements were issued, and has determined that there were no following subsequent events requiring recognition or disclosure in the financial statements.
42
PACIFIC CAPITAL FUNDS
Other Information
(Unaudited)
Proxy Voting
Policies and procedures that the Funds use to determine how to vote proxies relating to portfolio securities as well as information regarding how the Funds voted proxies relating to portfolio securities for the most recent 12-month period ended June 30 are available without charge, upon request, by calling (888) 678-6034 and on the Securities and Exchange Commission’s (“SEC”) website at http://www.sec.gov.
Quarterly Portfolio Schedules
The Trust files its complete schedule of portfolio holdings with the SEC for the first and third fiscal quarters of each fiscal year on Form N-Q. The Trust’s Forms N-Q are available on the SEC’s website at http://www.sec.gov and may be reviewed and copied at the SEC’s Public Reference Room in Washington, D.C. Information on the operation of the SEC’s Public Reference Room may be obtained by calling 1-800-SEC-0330.
43
Investment Adviser
Asset Management Group of Bank of Hawaii
130 Merchant Street, Suite 370
Honolulu, HI 96813
Administrator
BNY Mellon Investment Servicing (US) Inc.
301 Bellevue Parkway
Wilmington, DE 19809
Transfer Agent
BNY Mellon Investment Servicing (US) Inc.
4400 Computer Drive
Westborough, MA 01581
Principal Underwriter
Foreside Funds Distributors LLC
400 Berwyn Park
899 Cassatt Road
Berwyn, PA 19312
Custodian
The Bank of New York Mellon
225 Liberty Street
New York, NY 10286
Independent Registered Public Accounting Firm
PricewaterhouseCoopers LLP
Two Commerce Square, Suite 1800
2001 Market Street
Philadelphia, PA 19103-7042
Legal Counsel
Pepper Hamilton LLP
3000 Two Logan Square
18th and Arch Streets
Philadelphia, PA 19103
PAC-1017

of
FundVantage Trust
Pacific Capital Tax-Free Securities
Fund
Pacific Capital Tax-Free Short
Intermediate Securities Fund
SEMI-ANNUAL REPORT
October 31, 2017
(Unaudited)
This report is submitted for the general information of the shareholders of the Pacific Capital Funds. It is not authorized for distribution unless preceded or accompanied by a current prospectus for the Pacific Capital Funds.
POLEN GROWTH FUND
Semi-Annual Report
Performance Data
October 31, 2017
(Unaudited)
| Average Annual Total Returns for the Periods Ended October 31, 2017 | ||||||||||
| Six Months† | 1 Year | 3 Year | 5 Year | Since Inception* | ||||||
Institutional Class | 11.03% | 26.04% | 14.63% | 15.82% | 15.34% | |||||
S&P 500® Index | 9.10% | 23.63% | 10.79% | 15.20% | 14.77%*** | |||||
Russell 1000® Growth Index | 12.56% | 29.72% | 13.15% | 16.84% | 16.24%*** | |||||
| Six Months† | 1 Year | 3 Year | 5 Year | Since Inception** | ||||||
Investor Class | 10.86% | 25.67% | 14.34% | 15.53% | 13.49% | |||||
S&P 500® Index | 9.10% | 23.63% | 10.79% | 15.20% | 13.40%*** | |||||
Russell 1000® Growth Index | 12.56% | 29.72% | 13.15% | 16.84% | 14.51%*** | |||||
| † | Not Annualized. |
| * | The Polen Growth Fund (the “Fund”) Institutional Class shares commenced operations on September 15, 2010. |
| ** | The Fund’s Investor Class shares commenced operations on December 30, 2010. |
| *** | Benchmark performance is from the commencement date of the Fund Class only and is not the commencement date of the benchmark itself. |
The performance data quoted represents past performance and does not guarantee future results. Current performance may be lower or higher. Performance data current to the most recent month-end may be obtained by calling (888) 678-6024. The investment return and principal value of an investment will fluctuate so that shares, when redeemed, may be worth more or less than their original cost. The table does not reflect the deduction of taxes that a shareholder would pay on Fund distributions or the redemption of Fund shares.
The Fund’s “Total Annual Fund Operating Expenses” and “Total Annual Fund Operating Expenses After Fee Waiver and/or Expense Reimbursement”, as stated in the current prospectus dated September 1, 2017, are 1.02% and 1.00%, respectively, for the Institutional Class shares and 1.27% and 1.25%, respectively, for the Investor Class shares of the Fund’s average daily net assets, which may differ from the actual expenses incurred by the Fund for the period covered by this report. Polen Capital Management, LLC (“PCM” or the “Adviser”) has contractually agreed to reduce its investment advisory fee and/or reimburse certain expenses of the Fund to the extent necessary to ensure that the Fund’s total operating expenses (excluding taxes, any class-specific fees and expenses, interest, extraordinary items, “Acquired Fund Fees and Expenses” and brokerage commissions) do not exceed 1.00% (on an annual basis) with respect to the Fund’s average daily net assets (the “Expense Limitation”). The Expense Limitation will remain in place until August 31, 2018 unless the Board of Trustees (“Board of Trustees”) of FundVantage Trust (the “Trust”) approves its earlier termination. The Adviser is entitled to recover, subject to approval by the Board of Trustees, any fees waived and/or expenses reimbursed by the Adviser on or after January 1, 2017 with respect to the Fund for a three (3) year period following the date of such fee waiver and/or expense reimbursement. The Adviser is permitted to seek reimbursement from the Fund, subject to certain limitations, for fees it waived and Fund expenses it paid to the extent the total annual fund operating expenses do not exceed the limits described above or any lesser limits in effect at the time of reimbursement. No recoupment will occur unless the Fund’s expenses are below the Expense Limitation amount. Total returns would be lower had such fees and expenses not been waived and/or reimbursed.
1
POLEN GROWTH FUND
Semi-Annual Report
Performance Data
October 31, 2017
(Unaudited)
A 2.00% redemption fee applies to shares redeemed within 60 days of purchase. This redemption fee is not reflected in the returns shown above.
The Fund intends to evaluate performance as compared to that of the Standard & Poor’s 500 (“S&P 500®”) Index and the Russell 1000® Growth Index. The S&P 500® Index is a widely recognized, unmanaged index of 500 common stocks which are generally representative of the U.S. stock market as a whole. The Russell 1000® Growth Index is an unmanaged index that measures the performance of the large-cap growth segment of the U.S. equity universe. It includes those Russell 1000® Growth Index companies with higher price-to-book ratios and higher forecasted growth values. It is impossible to invest directly in an index.
All mutual fund investing involves risk, including possible loss of principal. The Fund is non-diversified, which means that a large portion of the Fund’s assets may be invested in one or few companies or sectors. The Fund could fluctuate in value more than a diversified fund.
2
POLEN GLOBAL GROWTH FUND
Semi-Annual Report
Performance Data
October 31, 2017
(Unaudited)
| Average Annual Total Returns for the Periods Ended October 31, 2017 | |||||||||||||||
| Six Months† | 1 Year | Since Inception* | |||||||||||||
Institutional Class | 13.59 | % | 28.25 | % | 12.54 | % | |||||||||
MSCI All Country World ® Index (“ACWI”)(Gross Dividend) | 10.49 | % | 23.87 | % | 8.33 | %*** | |||||||||
MSCI All Country World ® Index (“ACWI”)(Net Dividend)**** | 10.28 | % | 23.19 | % | 7.67 | %*** | |||||||||
| Six Months† | 1 Year | Since Inception** | |||||||||||||
Investor Class | 13.41 | % | 27.90 | % | 13.62 | % | |||||||||
MSCI All Country World ® Index (“ACWI”)(Gross Dividend) | 10.49 | % | 23.87 | % | 9.44 | %*** | |||||||||
MSCI All Country World ® Index (“ACWI”)(Net Dividend)**** | 10.28 | % | 23.19 | % | 8.82 | %*** | |||||||||
| † | Not Annualized. |
| * | The Polen Global Growth Fund (the “Fund”) Institutional Class shares commenced operations on December 30, 2014. |
| ** | The Fund’s Investor Class shares commenced operations on July 6, 2015. |
| *** | Benchmark performance is from the commencement date of the Fund Class only and is not the commencement date of the benchmark itself. |
| **** | The Advisor believes the Net Dividend version of the index, which reinvests dividends after the deduction of withholding taxes (i.e., “net”), is the better comparison index for the Fund as there may be instances whereby dividends earned by the Fund will not be subject to double taxation treaties and dividends will, indeed, be received net of withholding taxes. |
The performance data quoted represents past performance and does not guarantee future results. Current performance may be lower or higher. Performance data current to the most recent month-end may be obtained by calling (888) 678-6024. The investment return and principal value of an investment will fluctuate so that shares, when redeemed, may be worth more or less than their original cost. The table does not reflect the deduction of taxes that a shareholder would pay on Fund distributions or the redemption of Fund shares.
The Fund’s “Total Annual Fund Operating Expenses” and “Total Annual Fund Operating Expenses After Fee Waiver and/or Expense Reimbursement”, as stated in the current prospectus dated September 1, 2017 as supplemented November 13, 2017, are 2.40% and 1.10%, respectively, for the Institutional Class shares and 2.65% and 1.35%, respectively, for the Investor Class shares of the Fund’s average daily net assets, which may differ from the actual expenses incurred by the Fund for the period covered by this report. Polen Capital Management, LLC (“PCM” or the “Adviser”) has contractually agreed to reduce its investment advisory fee and/or reimburse certain expenses of the Fund to the extent necessary to ensure that the Fund’s total operating expenses (excluding taxes, any class-specific fees and expenses, interest, extraordinary items, “Acquired Fund Fees and Expenses” and brokerage commissions) do not exceed 1.10% (on an annual basis) with respect to the Fund’s average daily net assets (the “Expense Limitation”).
3
POLEN GLOBAL GROWTH FUND
Semi-Annual Report
Performance Data
October 31, 2017
(Unaudited)
The Expense Limitation will remain in place until August 31, 2018 unless the Board of Trustees (“Board of Trustees”) of FundVantage Trust (the “Trust”) approves its earlier termination. The Adviser is entitled to recover, subject to approval by the Board of Trustees, such amounts reduced or reimbursed for a period of up to three (3) years from the year in which the Adviser reduced its compensation and/or assumed expenses for the Fund. The Adviser is permitted to seek reimbursement from the Fund, subject to certain limitations, for fees it waived and Fund expenses it paid to the extent the total annual fund operating expenses do not exceed the limits described above or any lesser limits in effect at the time of reimbursement. No recoupment will occur unless the Fund’s expenses are below the Expense Limitation amount. Total returns would be lower had such fees and expenses not been waived and/or reimbursed.
A 2.00% redemption fee applies to shares redeemed within 60 days of purchase. This redemption fee is not reflected in the returns shown above.
The Fund intends to evaluate performance as compared to that of the MSCI ACWI Index (Net Dividend), which captures large and mid-cap representation across 23 Developed Markets (DM) and 23 Emerging Markets (EM) countries. With 2,466 constituents, the index covers approximately 85% of the global investable equity opportunity set. Indexes are unmanaged and it is not possible to invest directly in an index.
All mutual fund investing involves risk, including possible loss of principal. The Fund is non-diversified, which means that a large portion of the Fund’s assets may be invested in one or few companies or sectors. The Fund could fluctuate in value more than a diversified fund. Investing in foreign securities entails special risks, such as fluctuations in currency exchange rates and possible lax regulation of securities markets and accounting practices.
The Fund may invest a substantial amount of its assets in issuers located in a limited number of countries. If the Fund concentrates its investments in this manner, it assumes the risk that economic, political and social conditions in those countries will have a significant impact on its investment performance. The Fund’s investment performance may also be more volatile if it concentrates its investments in certain countries, especially emerging market countries.
4
POLEN INTERNATIONAL GROWTH FUND
Semi-Annual Report
Performance Data
October 31, 2017
(Unaudited)
| Total Returns for the Periods Ended October 31, 2017 | ||||
| Six Months† | Since Inception* | |||
Institutional Class | 14.87% | 32.90% | ||
MSCI All Country World ® Index (“ACWI”)(ex-USA) | 12.01% | 22.60%*** | ||
| Six Months† | Since Inception** | |||
Investor Class | 14.62% | 21.45% | ||
MSCI All Country World ® Index (“ACWI”)(ex-USA) | 12.01% | 16.33%*** | ||
| † | Not Annualized. |
| * | The Polen International Growth Fund (the “Fund”) Institutional Class shares commenced operations on December 30, 2016. |
| ** | The Fund’s Investor Class shares commenced operations on March 15, 2017. |
| *** | Benchmark performance is from the commencement date of the Fund Class only and is not the commencement date of the benchmark itself. |
The performance data quoted represents past performance and does not guarantee future results. Current performance may be lower or higher. Performance data current to the most recent month-end may be obtained by calling (888) 678-6024. The investment return and principal value of an investment will fluctuate so that shares, when redeemed, may be worth more or less than their original cost. The table does not reflect the deduction of taxes that a shareholder would pay on Fund distributions or the redemption of Fund shares.
The Fund’s “Total Annual Fund Operating Expenses” and “Total Annual Fund Operating Expenses After Fee Waiver and/or Expense Reimbursement”, as stated in the current prospectus dated September 1, 2017, are 9.84% and 1.10%, respectively, for the Institutional Class shares and 10.09% and 1.35%, respectively, for the Investor Class shares of the Fund’s average daily net assets, which may differ from the actual expenses incurred by the Fund for the period covered by this report. Polen Capital Management, LLC (“PCM” or the “Adviser”) has contractually agreed to reduce its investment advisory fee and/or reimburse certain expenses of the Fund to the extent necessary to ensure that the Fund’s total operating expenses (excluding taxes, any class-specific fees and expenses (such as Rule 12b1 distribution fees), interest, extraordinary items, “Acquired Fund Fees and Expenses” and brokerage commissions) do not exceed 1.10% (on an annual basis) with respect to the Fund’s average daily net assets (the “Expense Limitation”). The Expense Limitation will remain in place until August 31, 2018 unless the Board of Trustees (“Board of Trustees”) of FundVantage Trust (the “Trust”) approves its earlier termination. The Adviser is entitled to recover, subject to approval by the Board of Trustees, any fees waived and/or expenses reimbursed for a three (3) year period following the date of such fee waiver and/or expense reimbursement. The Adviser is permitted to seek reimbursement from the Fund, subject to certain limitations, for fees it waived and Fund expenses it paid to the extent the total annual fund operating expenses do not exceed the limits described above or any lesser limits in effect at the time of reimbursement. No recoupment will occur unless the Fund’s expenses are below the Expense Limitation amount. Total returns would be lower had such fees and expenses not been waived and/or reimbursed.
5
POLEN INTERNATIONAL GROWTH FUND
Semi-Annual Report
Performance Data
October 31, 2017
(Unaudited)
A 2.00% redemption fee applies to shares redeemed within 60 days of purchase. This redemption fee is not reflected in the returns shown above.
The Fund intends to evaluate performance as compared to that of the MSCI ACWI (ex-USA), which captures large and mid-cap representation across 23 Developed Markets (DM) and 23 Emerging Markets (EM) countries. With 2,466 constituents, the index covers approximately 85% of the global investable equity opportunity set. Indexes are unmanaged and it is not possible to invest directly in an index.
All mutual fund investing involves risk, including possible loss of principal. The Fund is non-diversified, which means that a large portion of the Fund’s assets may be invested in one or few companies or sectors. The Fund could fluctuate in value more than a diversified fund. Investing in foreign securities entails special risks, such as fluctuations in currency exchange rates and possible lax regulation of securities markets and accounting practices.
The Fund may invest a substantial amount of its assets in issuers located in a limited number of countries. If the Fund concentrates its investments in this manner, it assumes the risk that economic, political and social conditions in those countries will have a significant impact on its investment performance. The Fund’s investment performance may also be more volatile if it concentrates its investments in certain countries, especially emerging market countries.
6
POLEN GROWTH FUNDS
Funds Expense Disclosure
October 31, 2017
(Unaudited)
As a shareholder of the Fund(s), you incur two types of costs: (1) transaction costs, including redemption fees; and (2) ongoing costs, including management fees, distribution and/or service (Rule 12b-1) fees (if any) and other Fund expenses. These examples are intended to help you understand your ongoing costs (in dollars) of investing in the Fund(s) and to compare these costs with the ongoing costs of investing in other mutual funds.
These examples are based on an investment of $1,000 invested at the beginning of the six-month period from May 1, 2017 through October 31, 2017 and held for the entire period.
Actual Expenses
The first line of each accompanying table provides information about actual account values and actual expenses. You may use the information in this line, together with the amount you invested, to estimate the expenses that you paid over the period. Simply divide your account value by $1,000 (for example, an $8,600 account value divided by $1,000 = 8.6), then multiply the result by the number in the first line under the heading entitled “Expenses Paid During Period” to estimate the expenses you paid on your account during this period.
Hypothetical Examples for Comparison Purposes
The second line of each accompanying table provides information about hypothetical account values and hypothetical expenses based on a Fund’s actual expense ratio and an assumed rate of return of 5% per year before expenses, which is not your Fund’s actual return. The hypothetical account values and expenses may not be used to estimate the actual ending account balance or expenses you paid for the period. You may use this information to compare the ongoing costs of investing in the Fund(s) and other funds. To do so, compare these 5% hypothetical examples with the 5% hypothetical examples that appear in the shareholder reports of other funds.
Please note that the expenses shown in the accompanying table are meant to highlight your ongoing costs only and do not reflect any transactional costs, such as redemption fees. Therefore, each hypothetical line of the accompanying table is useful in comparing ongoing costs only and will not help you determine the relative total costs of owning different funds. In addition, if these transactional costs were included, your costs would have been higher.
7
POLEN GROWTH FUNDS
Funds Expense Disclosure
October 31, 2017
(Unaudited)
| Polen Growth Fund | |||||||||||||||
| Beginning Account Value May 1, 2017 | Ending Account Value October 31, 2017 | Expenses Paid During Period | |||||||||||||
Institutional Class* | |||||||||||||||
Actual | $ | 1,000.00 | $ | 1,110.30 | $ | 5.32 | |||||||||
Hypothetical (5% return before expenses) | 1,000.00 | 1,020.16 | 5.09 | ||||||||||||
Investor Class* | |||||||||||||||
Actual | $ | 1,000.00 | $ | 1,108.60 | $ | 6.64 | |||||||||
Hypothetical (5% return before expenses) | 1,000.00 | 1,018.90 | 6.36 | ||||||||||||
| Polen Global Growth Fund | |||||||||||||||
| Beginning Account Value May 1, 2017 | Ending Account Value October 31, 2017 | Expenses Paid During Period | |||||||||||||
Institutional Class** | |||||||||||||||
Actual | $ | 1,000.00 | $ | 1,135.90 | $ | 5.92 | |||||||||
Hypothetical (5% return before expenses) | 1,000.00 | 1,019.66 | 5.60 | ||||||||||||
Investor Class** | |||||||||||||||
Actual | $ | 1,000.00 | $ | 1,134.10 | $ | 7.26 | |||||||||
Hypothetical (5% return before expenses) | 1,000.00 | 1,018.40 | 6.87 | ||||||||||||
| Polen International Growth Fund | |||||||||||||||
| Beginning Account Value May 1, 2017 | Ending Account Value October 31, 2017 | Expenses Paid During Period | |||||||||||||
Institutional Class*** | |||||||||||||||
Actual | $ | 1,000.00 | $ | 1,148.70 | $ | 5.96 | |||||||||
Hypothetical (5% return before expenses) | 1,000.00 | 1,019.66 | 5.60 | ||||||||||||
Investor Class*** | |||||||||||||||
Actual | $ | 1,000.00 | $ | 1,146.20 | $ | 7.30 | |||||||||
Hypothetical (5% return before expenses) | 1,000.00 | 1,018.40 | 6.87 | ||||||||||||
| * | Expenses are equal to an annualized expense ratio for the six-month period ended October 31, 2017 of 1.00% for Institutional Class and 1.25% for Investor Class, multiplied by the average account value over the period, multiplied by the number of days in the most recent period (184), then divided by 365 to reflect the period. The Fund’s ending account values on the first line of each table are based on the actual six-month total returns for the Fund of 11.03% and 10.86% for Institutional Class and Investor Class, respectively. |
| ** | Expenses are equal to an annualized expense ratio for the six-month period ended October 31, 2017 of 1.10% for Institutional Class and 1.35% for Investor Class, multiplied by the average account value over the period, multiplied by the number of days in the most recent period (184), then divided by 365 to reflect the period. The |
8
POLEN GROWTH FUNDS
Funds Expense Disclosure (Concluded)
October 31, 2017
(Unaudited)
Fund’s ending account values on the first line of each table are based on the actual six-month total returns for the Fund of 13.59% and 13.41% for Institutional Class and Investor Class, respectively.
| *** | Expenses are equal to an annualized expense ratio for the six-month period ended October 31, 2017 of 1.10% for Institutional Class and 1.35% for Investor Class, multiplied by the average account value over the period, multiplied by the number of days in the most recent period (184), then divided by 365 to reflect the period. The Fund’s ending account values on the first line of each table are based on the actual six-month total returns for the Fund of 14.87% and 14.62% for Institutional Class and Investor Class, respectively. |
9
POLEN GROWTH FUND
Portfolio Holdings Summary Table
October 31, 2017
(Unaudited)
The following table presents a summary by industry of the portfolio holdings of the Fund:
| % of Net Assets | Value | |||||||
COMMON STOCKS: | ||||||||
Internet Content & Information | 17.4 | % | $ | 299,015,492 | ||||
Software Infrastructure | 10.1 | 174,624,153 | ||||||
Credit Services | 8.8 | 151,522,452 | ||||||
Information Technology Services | 8.7 | 149,157,723 | ||||||
Software Application | 8.0 | 138,475,016 | ||||||
Biotechnology | 7.8 | 133,964,899 | ||||||
Business Services | 5.8 | 99,662,025 | ||||||
Footwear & Accessories | 4.8 | 83,142,460 | ||||||
Leisure | 4.7 | 80,916,059 | ||||||
Restaurants | 4.5 | 78,413,851 | ||||||
Medical Devices | 4.4 | 75,529,868 | ||||||
Specialty Retail | 4.1 | 70,202,472 | ||||||
Packaged Foods | 3.8 | 66,211,771 | ||||||
Discount Stores | 2.8 | 48,254,043 | ||||||
Other Assets In Excess of Liabilities | 4.3 | 73,670,909 | ||||||
|
|
|
| |||||
NET ASSETS | 100.0 | % | $ | 1,722,763,193 | ||||
|
|
|
| |||||
Portfolio holdings are subject to change at any time.
The accompanying notes are an integral part of the financial statements.
10
POLEN GROWTH FUND
Portfolio of Investments
October 31, 2017
(Unaudited)
| Number of Shares | Value | |||||||
COMMON STOCKS — 95.7% |
| |||||||
Biotechnology — 7.8% |
| |||||||
Celgene Corp.* | 646,871 | $ | 65,314,565 | |||||
Regeneron Pharmaceuticals, Inc.* | 170,509 | 68,650,334 | ||||||
|
| |||||||
| 133,964,899 | ||||||||
|
| |||||||
Business Services — 5.8% |
| |||||||
Automatic Data Processing, Inc. | 857,234 | 99,662,025 | ||||||
|
| |||||||
Credit Services — 8.8% |
| |||||||
Mastercard, Inc., Class A | 275,742 | 41,022,137 | ||||||
Visa, Inc., Class A | 1,004,731 | 110,500,315 | ||||||
|
| |||||||
| 151,522,452 | ||||||||
|
| |||||||
Discount Stores — 2.8% |
| |||||||
Dollar General Corp. | 596,908 | 48,254,043 | ||||||
|
| |||||||
Footwear & Accessories — 4.8% |
| |||||||
NIKE, Inc., Class B | 1,511,956 | 83,142,460 | ||||||
|
| |||||||
Information Technology Services — 8.7% |
| |||||||
Accenture PLC, Class A | 605,867 | 86,251,226 | ||||||
Gartner, Inc.* | 502,007 | 62,906,497 | ||||||
|
| |||||||
| 149,157,723 | ||||||||
|
| |||||||
Internet Content & Information — 17.4% |
| |||||||
Alphabet, Inc., Class A* | 45,877 | 47,392,776 | ||||||
Alphabet, Inc., Class C* | 116,674 | 118,615,455 | ||||||
Facebook, Inc., Class A* | 738,683 | 133,007,261 | ||||||
|
| |||||||
| 299,015,492 | ||||||||
|
| |||||||
Leisure — 4.7% | ||||||||
Priceline Group, Inc. (The)* | 42,321 | 80,916,059 | ||||||
|
| |||||||
| Number of Shares | Value | |||||||
COMMON STOCKS — (Continued) |
| |||||||
Medical Devices — 4.4% |
| |||||||
Align Technology, Inc.* | 316,051 | $ | 75,529,868 | |||||
|
| |||||||
Packaged Foods — 3.8% |
| |||||||
Nestle SA, SP ADR | 786,083 | 66,211,771 | ||||||
|
| |||||||
Restaurants — 4.5% |
| |||||||
Starbucks Corp. | 1,429,866 | 78,413,851 | ||||||
|
| |||||||
Software Application — 8.0% |
| |||||||
Adobe Systems, Inc.* | 790,563 | 138,475,016 | ||||||
|
| |||||||
Software Infrastructure — 10.1% |
| |||||||
Microsoft Corp. | 899,558 | 74,825,234 | ||||||
Oracle Corp. | 1,960,686 | 99,798,919 | ||||||
|
| |||||||
| 174,624,153 | ||||||||
|
| |||||||
Specialty Retail — 4.1% |
| |||||||
O’Reilly Automotive, Inc.* | 332,792 | 70,202,472 | ||||||
|
| |||||||
TOTAL COMMON STOCKS |
| 1,649,092,284 | ||||||
|
| |||||||
TOTAL INVESTMENTS - 95.7% |
| 1,649,092,284 | ||||||
OTHER ASSETS IN EXCESS OF LIABILITIES - 4.3% | 73,670,909 | |||||||
|
| |||||||
NET ASSETS - 100.0% |
| $ | 1,722,763,193 | |||||
|
| |||||||
| * | Non-income producing. |
PLC | Public Limited Corporation | |
SP ADR | Sponsored American Depository Receipt |
The accompanying notes are an integral part of the financial statements.
11
POLEN GLOBAL GROWTH FUND
Portfolio Holdings Summary Table
October 31, 2017
(Unaudited)
The following table presents a summary by industry of the portfolio holdings of the Fund:
| % of Net Assets | Value | |||||||
COMMON STOCKS: | ||||||||
Internet Software & Services | 20.7 | % | $ | 4,763,423 | ||||
Information Technology Services | 16.6 | 3,819,104 | ||||||
Health Care Equipment & Supplies | 10.3 | 2,374,307 | ||||||
Software | 8.1 | 1,852,129 | ||||||
Biotechnology | 7.1 | 1,635,617 | ||||||
Textiles, Apparel & Luxury Goods | 5.6 | 1,284,269 | ||||||
Food Products | 4.3 | 996,116 | ||||||
Insurance | 3.3 | 753,548 | ||||||
Hotels, Restaurants & Leisure | 3.2 | 732,333 | ||||||
Internet & Direct Marketing Retail | 2.8 | 646,243 | ||||||
Specialty Retail | 2.8 | 632,850 | ||||||
Technology Hardware, Storage & Peripherals | 2.6 | 586,400 | ||||||
Professional Services | 2.4 | 540,830 | ||||||
Household Products | 2.3 | 535,098 | ||||||
Pharmaceuticals | 1.3 | 290,126 | ||||||
Other Assets In Excess of Liabilities | 6.6 | 1,526,954 | ||||||
|
|
|
| |||||
NET ASSETS | 100.0 | % | $ | 22,969,347 | ||||
|
|
|
| |||||
Portfolio holdings are subject to change at any time.
The accompanying notes are an integral part of the financial statements.
12
POLEN GLOBAL GROWTH FUND
Portfolio of Investments
October 31, 2017
(Unaudited)
| Number of Shares | Value | |||||||
RIGHTS — 0.0% | ||||||||
China — 0.0% | ||||||||
New China Literature Ltd., | 24 | $ | — | |||||
|
| |||||||
TOTAL RIGHTS (Cost $ — ) | — | |||||||
|
| |||||||
COMMON STOCKS — 93.4% | ||||||||
Australia — 3.0% | ||||||||
CSL, Ltd. | 6,572 | 699,663 | ||||||
|
| |||||||
Cayman Islands — 9.8% | ||||||||
Alibaba Group Holding, Ltd., SP ADR* | 4,751 | 878,412 | ||||||
Tencent Holdings, Ltd. | 30,500 | 1,370,826 | ||||||
|
| |||||||
| 2,249,238 | ||||||||
|
| |||||||
Denmark — 3.2% | ||||||||
Coloplast A/S, Class B | 5,102 | 449,067 | ||||||
Novo Nordisk A/S, SP ADR | 5,827 | 290,126 | ||||||
|
| |||||||
| 739,193 | ||||||||
|
| |||||||
France — 2.3% | ||||||||
Essilor International SA | 4,219 | 534,137 | ||||||
|
| |||||||
Germany — 2.8% | ||||||||
adidas AG | 2,842 | 632,582 | ||||||
|
| |||||||
Hong Kong — 3.3% | ||||||||
AIA Group, Ltd. | 100,000 | 753,548 | ||||||
|
| |||||||
Ireland — 3.8% | ||||||||
Accenture PLC, Class A | 6,084 | 866,118 | ||||||
|
| |||||||
Israel — 2.7% | ||||||||
Check Point Software | 5,223 | 614,799 | ||||||
|
| |||||||
Switzerland — 6.7% | ||||||||
Nestle SA, Registered Shares | 11,839 | 996,116 | ||||||
| Number of Shares | Value | |||||||
COMMON STOCKS — (Continued) |
| |||||||
Switzerland — (Continued) | ||||||||
SGS SA, Registered Shares | 219 | $ | 540,830 | |||||
|
| |||||||
| 1,536,946 | ||||||||
|
| |||||||
United Kingdom — 2.3% | ||||||||
Reckitt Benckiser Group PLC | 5,981 | 535,098 | ||||||
|
| |||||||
United States — 53.5% | ||||||||
Adobe Systems, Inc.* | 7,064 | 1,237,330 | ||||||
Align Technology, Inc.* | 5,821 | 1,391,103 | ||||||
Alphabet, Inc., Class C* | 1,458 | 1,482,261 | ||||||
Apple, Inc. | 3,469 | 586,400 | ||||||
Automatic Data Processing, Inc. | 6,180 | 718,487 | ||||||
Celgene Corp.* | 2,758 | 278,475 | ||||||
Facebook, Inc., Class A* | 5,731 | 1,031,924 | ||||||
Mastercard, Inc., Class A | 6,230 | 926,837 | ||||||
NIKE, Inc., Class B | 11,851 | 651,687 | ||||||
O’Reilly Automotive, Inc.* | 3,000 | 632,850 | ||||||
Priceline Group, Inc. (The)* | 338 | 646,243 | ||||||
Regeneron Pharmaceuticals, Inc.* | 1,633 | 657,479 | ||||||
Starbucks Corp. | 13,354 | 732,333 | ||||||
Visa, Inc., Class A | 11,890 | 1,307,662 | ||||||
|
| |||||||
| 12,281,071 | ||||||||
|
| |||||||
TOTAL COMMON STOCKS | 21,442,393 | |||||||
|
| |||||||
TOTAL INVESTMENTS - 93.4% (Cost $15,672,713) | 21,442,393 | |||||||
OTHER ASSETS IN EXCESS OF LIABILITIES - 6.6% | 1,526,954 | |||||||
|
| |||||||
NET ASSETS - 100.0% | $ | 22,969,347 | ||||||
|
| |||||||
The accompanying notes are an integral part of the financial statements.
13
POLEN GLOBAL GROWTH FUND
Portfolio of Investments
October 31, 2017
(Unaudited)
| * | Non-income producing. |
PLC | Public Limited Corporation | |
SP ADR | Sponsored American Depository | |
Receipt |
The accompanying notes are an integral part of the financial statements.
14
POLEN INTERNATIONAL GROWTH FUND
Portfolio Holdings Summary Table
October 31, 2017
(Unaudited)
The following table presents a summary by industry of the portfolio holdings of the Fund:
| % of Net Assets | Value | |||||||
COMMON STOCKS: | ||||||||
Software | 16.8 | % | $ | 659,269 | ||||
Internet Software & Services | 15.5 | 608,635 | ||||||
Professional Services | 10.2 | 400,372 | ||||||
Information Technology Services | 7.8 | 309,183 | ||||||
Life Sciences Tools & Services | 5.8 | 226,666 | ||||||
Personal Products | 5.2 | 204,196 | ||||||
Health Care Equipment & Supplies | 4.6 | 179,447 | ||||||
Food Products | 4.3 | 171,222 | ||||||
Household Products | 3.9 | 153,882 | ||||||
Chemicals | 3.5 | 139,228 | ||||||
Hotels, Restaurants & Leisure | 3.4 | 133,548 | ||||||
Biotechnology | 3.3 | 129,563 | ||||||
Textiles, Apparel & Luxury Goods | 3.1 | 122,421 | ||||||
Trading Companies & Distributors | 2.7 | 105,319 | ||||||
Specialty Retail | 2.4 | 96,211 | ||||||
Food & Staples Retailing | 1.9 | 73,172 | ||||||
Other Assets In Excess of Liabilities | 5.6 | 221,161 | ||||||
|
|
|
| |||||
NET ASSETS | 100.0 | % | $ | 3,933,495 | ||||
|
|
|
| |||||
Portfolio holdings are subject to change at any time.
The accompanying notes are an integral part of the financial statements.
15
POLEN INTERNATIONAL GROWTH FUND
Portfolio of Investments
October 31, 2017
(Unaudited)
| Number of Shares | Value | |||||||
RIGHTS — 0.0% | ||||||||
China — 0.0% | ||||||||
New China Literature Ltd., | 4 | $ | — | |||||
|
| |||||||
TOTAL RIGHTS (Cost $ — ) | — | |||||||
|
| |||||||
COMMON STOCKS — 94.4% | ||||||||
Australia — 3.3% | ||||||||
CSL, Ltd. | 1,217 | 129,563 | ||||||
|
| |||||||
Cayman Islands — 11.3% | ||||||||
Alibaba Group Holding, Ltd., SP ADR* | 994 | 183,781 | ||||||
Tencent Holdings, Ltd. | 5,800 | 260,682 | ||||||
|
| |||||||
| 444,463 | ||||||||
|
| |||||||
China — 4.2% | ||||||||
Baidu, Inc., SP ADR* | 673 | 164,172 | ||||||
|
| |||||||
Denmark — 6.4% | ||||||||
Chr. Hansen Holding A/S | 1,591 | 139,228 | ||||||
Coloplast A/S, Class B | 1,298 | 114,247 | ||||||
|
| |||||||
| 253,475 | ||||||||
|
| |||||||
France — 5.8% | ||||||||
Dassault Systemes SE | 1,532 | 162,631 | ||||||
Essilor International SA | 515 | 65,200 | ||||||
|
| |||||||
| 227,831 | ||||||||
|
| |||||||
Germany — 8.0% | ||||||||
adidas AG | 550 | 122,421 | ||||||
SAP SE | 1,685 | 192,532 | ||||||
|
| |||||||
| 314,953 | ||||||||
|
| |||||||
Ireland — 13.5% | ||||||||
Accenture PLC, Class A | 1,252 | 178,235 | ||||||
Experian PLC | 6,036 | 127,168 | ||||||
| Number of Shares | Value | |||||||
COMMON STOCKS — (Continued) |
| |||||||
Ireland — (Continued) | ||||||||
ICON PLC* | 1,907 | $ | 226,666 | |||||
|
| |||||||
| 532,069 | ||||||||
|
| |||||||
Israel — 3.1% | ||||||||
Check Point Software Technologies, Ltd.* | 1,041 | 122,536 | ||||||
|
| |||||||
Mexico — 1.9% | ||||||||
Wal-Mart de Mexico SAB de CV | 32,685 | 73,172 | ||||||
|
| |||||||
Netherlands — 4.0% | ||||||||
RELX NV | 6,960 | 157,135 | ||||||
|
| |||||||
Spain — 5.8% | ||||||||
Amadeus IT Group SA | 1,930 | 130,948 | ||||||
Industria De Diseno Textil SA | 2,574 | 96,211 | ||||||
|
| |||||||
| 227,159 | ||||||||
|
| |||||||
Switzerland — 7.3% | ||||||||
Nestle SA, Registered Shares | 2,035 | 171,222 | ||||||
SGS SA, Registered Shares | 47 | 116,069 | ||||||
|
| |||||||
| 287,291 | ||||||||
|
| |||||||
United Kingdom — 19.8% | ||||||||
Bunzl PLC | 3,381 | 105,319 | ||||||
Compass Group PLC | 6,083 | 133,548 | ||||||
Reckitt Benckiser Group PLC | 1,720 | 153,882 | ||||||
Sage Group PLC (The) | 18,343 | 181,570 | ||||||
Unilever PLC | 3,603 | 204,196 | ||||||
|
| |||||||
| 778,515 | ||||||||
|
| |||||||
TOTAL COMMON STOCKS | 3,712,334 | |||||||
|
| |||||||
The accompanying notes are an integral part of the financial statements.
16
POLEN INTERNATIONAL GROWTH FUND
Portfolio of Investments (Concluded)
October 31, 2017
(Unaudited)
| Value | ||||
TOTAL INVESTMENTS - 94.4% | $ | 3,712,334 | ||
OTHER ASSETS IN EXCESS OF | 221,161 | |||
|
| |||
NET ASSETS - 100.0% | $ | 3,933,495 | ||
|
| |||
| * | Non-income producing. |
PLC | Public Limited Corporation | |
| SP ADR | Sponsored American Depository Receipt |
The accompanying notes are an integral part of the financial statements.
17
POLEN GROWTH FUNDS
Statements of Assets and Liabilities
October 31, 2017
(Unaudited)
| Polen Growth Fund | Polen Global Growth Fund | Polen International Growth Fund | ||||||||||
Assets | ||||||||||||
Investments, at value* | $ | 1,649,092,284 | $ | 21,442,393 | $ | 3,712,334 | ||||||
Cash | 71,179,098 | 1,504,900 | 231,304 | |||||||||
Foreign currency (Cost $0, $0 and $41, respectively) | — | — | 41 | |||||||||
Receivable for capital shares sold | 2,910,460 | 46,125 | 4,870 | |||||||||
Receivable for investments sold | 2,758,941 | — | — | |||||||||
Dividends and interest receivable | 1,143,538 | 26,923 | 4,281 | |||||||||
Receivable from investment adviser | — | — | 5,253 | |||||||||
Prepaid expenses and other assets | 178,772 | 24,533 | 9,389 | |||||||||
|
|
|
|
|
| |||||||
Total assets | 1,727,263,093 | 23,044,874 | 3,967,472 | |||||||||
|
|
|
|
|
| |||||||
Liabilities | ||||||||||||
Payable for capital shares redeemed | 2,372,139 | 1,600 | — | |||||||||
Payable to Investment Advisor | 1,245,765 | 7,745 | — | |||||||||
Payable for administration and accounting fees | 135,561 | 12,818 | 2,186 | |||||||||
Payable for transfer agent fees | 100,596 | 17,050 | 798 | |||||||||
Payable for printing fees | 18,698 | 4,261 | 4,115 | |||||||||
Payable for distribution fees | 15,020 | 270 | 29 | |||||||||
Payable for custodian fees | 13,947 | 12,205 | 1,055 | |||||||||
Payable for audit fees | 11,649 | 13,620 | 18,540 | |||||||||
Payable for legal fees | 8,151 | 1,736 | 1,911 | |||||||||
Payable for Trustees and Officers | — | 1,773 | 4,170 | |||||||||
Accrued expenses | 578,374 | 2,449 | 1,173 | |||||||||
|
|
|
|
|
| |||||||
Total liabilities | 4,499,900 | 75,527 | 33,977 | |||||||||
|
|
|
|
|
| |||||||
Net Assets | $ | 1,722,763,193 | $ | 22,969,347 | $ | 3,933,495 | ||||||
|
|
|
|
|
| |||||||
Net Assets consisted of: | ||||||||||||
Capital stock, $0.01 par value | $ | 710,659 | $ | 16,455 | $ | 2,961 | ||||||
Paid-in capital | 1,229,244,418 | 17,407,031 | 3,192,527 | |||||||||
Accumulated net investment income/(loss) | (3,378,824 | ) | (42,476 | ) | 24,848 | |||||||
Accumulated net realized gain/(loss) from investments and foreign currency transactions | 30,872,914 | (181,156 | ) | 6,346 | ||||||||
Net unrealized appreciation on investments and translation of assets and liabilities denominated in foreign currency | 465,314,026 | 5,769,493 | 706,813 | |||||||||
|
|
|
|
|
| |||||||
Net Assets | $ | 1,722,763,193 | $ | 22,969,347 | $ | 3,933,495 | ||||||
|
|
|
|
|
| |||||||
Institutional Class: | ||||||||||||
Net assets | $ | 1,652,244,548 | $ | 21,636,996 | $ | 3,794,143 | ||||||
|
|
|
|
|
| |||||||
Shares outstanding | 68,113,900 | 1,549,470 | 285,576 | |||||||||
|
|
|
|
|
| |||||||
Net asset value, offering and redemption price per share | $ | 24.26 | $ | 13.96 | $ | 13.29 | ||||||
|
|
|
|
|
| |||||||
Investor Class: | ||||||||||||
Net assets | $ | 70,518,645 | $ | 1,332,351 | $ | 139,352 | ||||||
|
|
|
|
|
| |||||||
Shares outstanding | 2,952,027 | 96,027 | 10,514 | |||||||||
|
|
|
|
|
| |||||||
Net asset value, offering and redemption price per share | $ | 23.89 | $ | 13.87 | $ | 13.25 | ||||||
|
|
|
|
|
| |||||||
* Investments, at cost | $ | 1,183,778,258 | $ | 15,672,713 | $ | 3,005,557 | ||||||
The accompanying notes are an integral part of the financial statements.
18
POLEN GROWTH FUNDS
Statements of Operations
For the Six Months Ended October 31, 2017
(Unaudited)
| Polen Growth Fund | Polen Global Growth Fund | Polen International Growth Fund | ||||||||||
Investment income | ||||||||||||
Dividends | $ | 4,794,853 | $ | 77,071 | $ | 24,455 | ||||||
Less: foreign taxes withheld | — | (1,466 | ) | (1,396 | ) | |||||||
|
|
|
|
|
| |||||||
Total investment income | 4,794,853 | 75,605 | 23,059 | |||||||||
|
|
|
|
|
| |||||||
Expenses | ||||||||||||
Advisory fees (Note 2) | 6,845,039 | 90,120 | 14,550 | |||||||||
Transfer agent fees (Note 2) | 514,699 | 28,349 | 10,470 | |||||||||
Administration and accounting fees | 171,616 | 10,234 | 2,323 | |||||||||
Distribution fees (Investor Shares) (Note 2) | 121,598 | 1,454 | 93 | |||||||||
Trustees’ and officers’ fees (Note 2) | 117,046 | 1,125 | 2,752 | |||||||||
Custodian fees (Note 2) | 53,660 | 1,512 | 2,194 | |||||||||
Registration and filing fees | 52,458 | 19,468 | 19,014 | |||||||||
Printing and shareholder reporting fees | 46,519 | 3,506 | 1,786 | |||||||||
Legal fees | 32,218 | 390 | 995 | |||||||||
Audit fees | 13,119 | 13,615 | 18,043 | |||||||||
Other expenses | 35,808 | 2,593 | 2,413 | |||||||||
|
|
|
|
|
| |||||||
Total expenses before waivers and reimbursements and/or recoupment | 8,003,780 | 172,366 | 74,633 | |||||||||
|
|
|
|
|
| |||||||
Less: (waivers) and (reimbursements) and/or recoupment (Note 2) | 169,897 | (54,285 | ) | (55,710 | ) | |||||||
|
|
|
|
|
| |||||||
Net expenses after waivers and reimbursements and/or recoupment | 8,173,677 | 118,081 | 18,923 | |||||||||
|
|
|
|
|
| |||||||
Net investment income/(loss) | (3,378,824 | ) | (42,476 | ) | 4,136 | |||||||
|
|
|
|
|
| |||||||
Net realized and unrealized gain/(loss) from investments | ||||||||||||
Net realized gain/(loss) from investments | 24,349,860 | (55,785 | ) | 6,765 | ||||||||
Net realized gain/(loss) from foreign currency transactions | — | (4,454 | ) | (419 | ) | |||||||
Net change in unrealized appreciation/(depreciation) on investments | 145,671,007 | 2,786,112 | 441,701 | |||||||||
Net change in unrealized appreciation/(depreciation) on foreign currency translations | — | (241 | ) | (23 | ) | |||||||
|
|
|
|
|
| |||||||
Net realized and unrealized gain on investments | 170,020,867 | 2,725,632 | 448,024 | |||||||||
|
|
|
|
|
| |||||||
Net increase in net assets resulting from operations | $ | 166,642,043 | $ | 2,683,156 | $ | 452,160 | ||||||
|
|
|
|
|
| |||||||
The accompanying notes are an integral part of the financial statements.
19
POLEN GROWTH FUND
Statements of Changes in Net Assets
| For the Six Months Ended October 31, 2017 (Unaudited) | For the Year Ended April 30, 2017 | |||||||
Increase/(decrease) in net assets from operations: | ||||||||
Net investment loss | $ | (3,378,824 | ) | $ | (2,506,142 | ) | ||
Net realized gain from investments | 24,349,860 | 9,041,210 | ||||||
Net change in unrealized appreciation/(depreciation) on investments | 145,671,007 | 181,991,566 | ||||||
|
|
|
| |||||
Net increase in net assets resulting from operations | 166,642,043 | 188,526,634 | ||||||
|
|
|
| |||||
Less dividends and distributions to shareholders from: | ||||||||
Net investment income: | ||||||||
Institutional Class | — | (103,570 | ) | |||||
|
|
|
| |||||
Total net investment income | — | (103,570 | ) | |||||
|
|
|
| |||||
Net decrease in net assets from dividends and distributions to shareholders | — | (103,570 | ) | |||||
|
|
|
| |||||
Increase in net assets derived from capital share transactions (Note 4) | 85,031,736 | 172,086,819 | ||||||
|
|
|
| |||||
Total increase in net assets | 251,673,779 | 360,509,883 | ||||||
|
|
|
| |||||
Net assets | ||||||||
Beginning of period | 1,471,089,414 | 1,110,579,531 | ||||||
|
|
|
| |||||
End of period | $ | 1,722,763,193 | $ | 1,471,089,414 | ||||
|
|
|
| |||||
Accumulated net investment loss, end of period | $ | (3,378,824 | ) | $ | — | |||
|
|
|
| |||||
The accompanying notes are an integral part of the financial statements.
20
POLEN GLOBAL GROWTH FUND
Statements of Changes in Net Assets
| For the Six Months Ended October 31, 2017 (Unaudited) | For the Year Ended April 30, 2017 | |||||||
Increase/(decrease) in net assets from operations: | ||||||||
Net investment loss | $ | (42,476 | ) | $ | (30,660 | ) | ||
Net realized loss from investments and foreign currency transactions | (60,239 | ) | (7,991 | ) | ||||
Net change in unrealized appreciation/(depreciation) on investments | 2,785,871 | 2,488,793 | ||||||
|
|
|
| |||||
Net increase in net assets resulting from operations | 2,683,156 | 2,450,142 | ||||||
|
|
|
| |||||
Less dividends and distributions to shareholders from: | ||||||||
Net realized capital gains: | ||||||||
Institutional Class | — | (6,703 | ) | |||||
Investor Class | — | (408 | ) | |||||
|
|
|
| |||||
Total net realized capital gains | — | (7,111 | ) | |||||
|
|
|
| |||||
Net decrease in net assets from dividends and distributions to shareholders | — | (7,111 | ) | |||||
|
|
|
| |||||
Increase in net assets derived from capital share transactions (Note 4) | 672,381 | 3,165,400 | ||||||
|
|
|
| |||||
Total increase in net assets | 3,355,537 | 5,608,431 | ||||||
|
|
|
| |||||
Net assets | ||||||||
Beginning of period | 19,613,810 | 14,005,379 | ||||||
|
|
|
| |||||
End of period | $ | 22,969,347 | $ | 19,613,810 | ||||
|
|
|
| |||||
Accumulated net investment loss, end of period | $ | (42,476 | ) | $ | — | |||
|
|
|
| |||||
The accompanying notes are an integral part of the financial statements.
21
POLEN INTERNATIONAL GROWTH FUND
Statements of Changes in Net Assets
| For the Six Months Ended October 31, 2017 (Unaudited) | For the Period Ended April 30, 2017* | |||||||
Increase/(decrease) in net assets from operations: | ||||||||
Net investment income | $ | 4,136 | $ | 8,088 | ||||
Net realized gain from investments and foreign currency transactions | 6,346 | 3,385 | ||||||
Net change in unrealized appreciation/(depreciation) on investments | 441,678 | 265,135 | ||||||
|
|
|
| |||||
Net increase in net assets resulting from operations | 452,160 | 276,608 | ||||||
|
|
|
| |||||
Increase in net assets derived from capital share transactions (Note 4) | 818,776 | 2,385,951 | ||||||
|
|
|
| |||||
Total increase in net assets | 1,270,936 | 2,662,559 | ||||||
|
|
|
| |||||
Net assets | ||||||||
Beginning of period | 2,662,559 | — | ||||||
|
|
|
| |||||
End of period | $ | 3,933,495 | $ | 2,662,559 | ||||
|
|
|
| |||||
Accumulated net investment income, end of period | $ | 24,848 | $ | 20,712 | ||||
|
|
|
| |||||
| * | The Polen International Growth Fund commenced operations on December 30, 2016. |
The accompanying notes are an integral part of the financial statements.
22
POLEN GROWTH FUND
Financial Highlights
Contained below is per share operating performance data for Institutional Class shares outstanding, total investment return, ratios to average net assets and other supplemental data for the respective period. The total returns in the table represent the rate that an investor would have earned or lost on an investment in the Fund (assuming reinvestment of all dividends and distributions). This information has been derived from information provided in the financial statements and should be read in conjunction with the financial statements and the notes thereto.
| Institutional Class | ||||||||||||||||||||||||||||||
| For the Six Months Ended October 31, 2017 (Unaudited) | For the Year Ended April 30, 2017 | For the Year Ended April 30, 2016 | For the Year Ended April 30, 2015 | For the Year Ended April 30, 2014 | For the Year Ended April 30, 2013 | |||||||||||||||||||||||||
Per Share Operating Performance | ||||||||||||||||||||||||||||||
Net asset value, beginning of period | $ | 21.85 | $ | 18.92 | $ | 18.29 | $ | 16.45 | $ | 14.17 | $ | 13.79 | ||||||||||||||||||
|
|
|
|
|
|
|
|
|
|
|
| |||||||||||||||||||
Net investment income/(loss)(1) | (0.05 | ) | (0.04 | ) | 0.01 | 0.02 | 0.03 | 0.03 | ||||||||||||||||||||||
Net realized and unrealized gain on investments | 2.46 | 2.97 | 1.45 | 3.09 | 2.48 | 0.40 | ||||||||||||||||||||||||
|
|
|
|
|
|
|
|
|
|
|
| |||||||||||||||||||
Net increase in net assets resulting from operations | 2.41 | 2.93 | 1.46 | 3.11 | 2.51 | 0.43 | ||||||||||||||||||||||||
|
|
|
|
|
|
|
|
|
|
|
| |||||||||||||||||||
Dividends and distributions to shareholders from: | ||||||||||||||||||||||||||||||
Net investment income | — | — | (2) | — | (0.02 | ) | (0.04 | ) | — | |||||||||||||||||||||
Net realized capital gains | — | — | (0.83 | ) | (1.25 | ) | (0.20 | ) | (0.06 | ) | ||||||||||||||||||||
|
|
|
|
|
|
|
|
|
|
|
| |||||||||||||||||||
Total dividends and distributions to shareholders | — | — | (0.83 | ) | (1.27 | ) | (0.24 | ) | (0.06 | ) | ||||||||||||||||||||
|
|
|
|
|
|
|
|
|
|
|
| |||||||||||||||||||
Redemption fees | — | (2) | — | (2) | — | (2) | — | (2) | 0.01 | 0.01 | ||||||||||||||||||||
|
|
|
|
|
|
|
|
|
|
|
| |||||||||||||||||||
Net asset value, end of period | $ | 24.26 | $ | 21.85 | $ | 18.92 | $ | 18.29 | $ | 16.45 | $ | 14.17 | ||||||||||||||||||
|
|
|
|
|
|
|
|
|
|
|
| |||||||||||||||||||
Total investment return(3) | 11.03 | % | 15.50 | % | 7.86 | % | 19.17 | % | 17.84 | % | 3.19 | % | ||||||||||||||||||
Ratios/Supplemental Data | ||||||||||||||||||||||||||||||
Net assets, end of period (in thousands) | $ | 1,652,245 | $ | 1,363,731 | $ | 959,962 | $ | 376,718 | $ | 252,108 | $ | 294,408 | ||||||||||||||||||
Ratio of expenses to average net assets | 1.00 | %(4) | 1.00 | % | 1.00 | % | 1.00 | % | 1.00 | % | 1.00 | % | ||||||||||||||||||
Ratio of expenses to average net assets without waivers, expense reimbursements and/or recoupment, if any(5) | 0.98 | %(4) | 1.12 | % | 1.17 | % | 1.25 | % | 1.27 | % | 1.26 | % | ||||||||||||||||||
Ratio of net investment income/(loss) to average net assets | (0.40 | )%(4) | (0.18 | )% | 0.04 | % | 0.10 | % | 0.17 | % | 0.24 | % | ||||||||||||||||||
Portfolio turnover rate | 10.72 | %(6) | 13.61 | % | 9.13 | % | 33.44 | % | 39.52 | % | 51.04 | % | ||||||||||||||||||
| (1) | The selected per share data was calculated using the average shares outstanding method for the period. |
| (2) | Amount is less than $0.005 per share. |
| (3) | Total investment return is calculated assuming a purchase of shares on the first day and a sale of shares on the last day of each period reported and includes reinvestment of dividends and distributions, if any. Total return for periods less than one year are not annualized. |
| (4) | Annualized. |
| (5) | During the period, certain fees were waived and/or reimbursed; or recouped, if any. If such fee waivers and/or reimbursements or recoupments had not occurred, the ratios would have been as indicated (See Note 2). |
| (6) | Not annualized. |
The accompanying notes are an integral part of the financial statements.
23
POLEN GROWTH FUND
Financial Highlights
Contained below is per share operating performance data for Investor Class shares outstanding, total investment return, ratios to average net assets and other supplemental data for the respective period. The total returns in the table represent the rate that an investor would have earned or lost on an investment in the Fund (assuming reinvestment of all dividends and distributions). This information has been derived from information provided in the financial statements and should be read in conjunction with the financial statements and the notes thereto.
| Investor Class | ||||||||||||||||||||||||||||||
| For the Six Months Ended October 31, 2017 (Unaudited) | For the Year Ended April 30, 2017 | For the Year Ended April 30, 2016 | For the Year Ended April 30, 2015 | For the Year Ended April 30, 2014 | For the Year Ended April 30, 2013 | |||||||||||||||||||||||||
Per Share Operating Performance | ||||||||||||||||||||||||||||||
Net asset value, beginning of period | $ | 21.55 | $ | 18.70 | $ | 18.14 | $ | 16.35 | $ | 14.09 | $ | 13.74 | ||||||||||||||||||
|
|
|
|
|
|
|
|
|
|
|
| |||||||||||||||||||
Net investment loss(1) | (0.07 | ) | (0.08 | ) | (0.04 | ) | (0.02 | ) | (0.01 | ) | — | (2) | ||||||||||||||||||
Net realized and unrealized gain on investments | 2.41 | 2.93 | 1.43 | 3.06 | 2.47 | 0.40 | ||||||||||||||||||||||||
|
|
|
|
|
|
|
|
|
|
|
| |||||||||||||||||||
Net increase in net assets resulting from operations | 2.34 | 2.85 | 1.39 | 3.04 | 2.46 | 0.40 | ||||||||||||||||||||||||
|
|
|
|
|
|
|
|
|
|
|
| |||||||||||||||||||
Dividends and distributions to shareholders from: | ||||||||||||||||||||||||||||||
Net investment income | — | — | — | — | (0.01 | ) | — | |||||||||||||||||||||||
Net realized capital gains | — | — | (0.83 | ) | (1.25 | ) | (0.20 | ) | (0.06 | ) | ||||||||||||||||||||
|
|
|
|
|
|
|
|
|
|
|
| |||||||||||||||||||
Total dividends and distributions to shareholders | — | — | (0.83 | ) | (1.25 | ) | (0.21 | ) | (0.06 | ) | ||||||||||||||||||||
|
|
|
|
|
|
|
|
|
|
|
| |||||||||||||||||||
Redemption fees | — | (2) | — | (2) | — | (2) | — | (2) | 0.01 | 0.01 | ||||||||||||||||||||
|
|
|
|
|
|
|
|
|
|
|
| |||||||||||||||||||
Net asset value, end of period | $ | 23.89 | $ | 21.55 | $ | 18.70 | $ | 18.14 | $ | 16.35 | $ | 14.09 | ||||||||||||||||||
|
|
|
|
|
|
|
|
|
|
|
| |||||||||||||||||||
Total investment return(3) | 10.86 | % | 15.24 | % | 7.54 | % | 18.87 | % | 17.59 | % | 2.98 | % | ||||||||||||||||||
Ratios/Supplemental Data | ||||||||||||||||||||||||||||||
Net assets, end of period (in thousands) | $ | 70,519 | $ | 107,358 | $ | 150,617 | $ | 29,545 | $ | 79,433 | $ | 100,859 | ||||||||||||||||||
Ratio of expenses to average net assets | 1.25 | %(4) | 1.25 | % | 1.25 | % | 1.25 | % | 1.25 | % | 1.25 | % | ||||||||||||||||||
Ratio of expenses to average net assets without waivers, expense reimbursements and/or recoupment, if any(5) | 1.22 | %(4) | 1.38 | % | 1.42 | % | 1.50 | % | 1.52 | % | 1.51 | % | ||||||||||||||||||
Ratio of net investment loss to average net assets | (0.65 | )%(4) | (0.43 | )% | (0.21 | )% | (0.14 | )% | (0.08 | )% | (0.01 | )% | ||||||||||||||||||
Portfolio turnover rate | 10.72 | %(6) | 13.61 | % | 9.13 | % | 33.44 | % | 39.52 | % | 51.04 | % | ||||||||||||||||||
| (1) | The selected per share data was calculated using the average shares outstanding method for the period. |
| (2) | Amount is less than $0.005 per share. |
| (3) | Total investment return is calculated assuming a purchase of shares on the first day and a sale of shares on the last day of each period reported and includes reinvestment of dividends and distributions, if any. Total return for periods less than one year are not annualized. |
| (4) | Annualized. |
| (5) | During the period, certain fees were waived and/or reimbursed; or recouped, if any. If such fee waivers and/or reimbursements or recoupments had not occurred, the ratios would have been as indicated (See Note 2). |
| (6) | Not annualized. |
The accompanying notes are an integral part of the financial statements.
24
POLEN GLOBAL GROWTH FUND
Financial Highlights
Contained below is per share operating performance data for each Institutional Class shares outstanding, total investment return, ratios to average net assets and other supplemental data for the respective period. The total returns in the table represent the rate that an investor would have earned or lost on an investment in the Fund (assuming reinvestment of all dividends and distributions). This information has been derived from information provided in the financial statements and should be read in conjunction with the financial statements and the notes thereto.
| Institutional Class | ||||||||||||||||||||
| For the Six Months Ended October 31, 2017 (Unaudited) | For the Year Ended April 30, 2017 | For the Year Ended April 30, 2016 | For the Period December 30, 2014* to April 30, 2015 | |||||||||||||||||
Per Share Operating Performance | ||||||||||||||||||||
Net asset value, beginning of period | $ | 12.29 | $ | 10.67 | $ | 10.29 | $ | 10.00 | ||||||||||||
|
|
|
|
|
|
|
| |||||||||||||
Net investment income/(loss)(1) | (0.03 | ) | (0.02 | ) | — | (2) | 0.02 | |||||||||||||
Net realized and unrealized gain on investments | 1.70 | 1.65 | 0.39 | 0.27 | ||||||||||||||||
|
|
|
|
|
|
|
| |||||||||||||
Net increase in net assets resulting from operations | 1.67 | 1.63 | 0.39 | 0.29 | ||||||||||||||||
|
|
|
|
|
|
|
| |||||||||||||
Dividends and distributions to shareholders from: | ||||||||||||||||||||
Net investment income | — | — | (0.01 | ) | — | |||||||||||||||
Net realized capital gains | — | (0.01 | ) | — | — | |||||||||||||||
|
|
|
|
|
|
|
| |||||||||||||
Total dividends and distributions to shareholders | — | (0.01 | ) | (0.01 | ) | — | ||||||||||||||
|
|
|
|
|
|
|
| |||||||||||||
Redemption fees | — | — | (2) | — | (2) | — | ||||||||||||||
|
|
|
|
|
|
|
| |||||||||||||
Net asset value, end of period | $ | 13.96 | $ | 12.29 | $ | 10.67 | $ | 10.29 | ||||||||||||
|
|
|
|
|
|
|
| |||||||||||||
Total investment return(3) | 13.59 | % | 15.24 | % | 3.78 | % | 2.90 | % | ||||||||||||
Ratios/Supplemental Data | ||||||||||||||||||||
Net assets, end of period (in thousands) | $ | 21,637 | $ | 18,618 | $ | 13,483 | $ | 3,076 | ||||||||||||
Ratio of expenses to average net assets | 1.10 | %(4) | 1.10 | % | 1.10 | % | 1.10 | %(4) | ||||||||||||
Ratio of expenses to average net assets without waivers and expense reimbursements(5) | 1.61 | %(4) | 2.40 | % | 3.63 | % | 9.78 | %(4) | ||||||||||||
Ratio of net investment income/(loss) to average net assets | (0.39 | )%(4) | (0.18 | )% | (0.01 | )% | 0.47 | %(4) | ||||||||||||
Portfolio turnover rate | 5.53 | %(6) | 12.13 | % | 6.99 | % | — | |||||||||||||
| * | Commencement of operations. |
| (1) | The selected per share data was calculated using the average shares outstanding method for the period. |
| (2) | Amount is less than $0.005 per share. |
| (3) | Total investment return is calculated assuming a purchase of shares on the first day and a sale of shares on the last day of each period reported and includes reinvestments of dividends and distributions, if any. Total returns for periods less than one year are not annualized. |
| (4) | Annualized. |
| (5) | During the period, certain fees were waived and/or reimbursed. If such fee waivers and/or reimbursements had not occurred, the ratios would have been as indicated (See Note 2). |
| (6) | Not annualized. |
The accompanying notes are an integral part of the financial statements.
25
POLEN GLOBAL GROWTH FUND
Financial Highlights
Contained below is per share operating performance data for Investor Class shares outstanding, total investment return, ratios to average net assets and other supplemental data for the respective period. The total returns in the table represent the rate that an investor would have earned or lost on an investment in the Fund (assuming reinvestment of all dividends and distributions). This information has been derived from information provided in the financial statements and should be read in conjunction with the financial statements and the notes thereto.
| Investor Class | |||||||||||||||
| For the Six Months Ended October 31, 2017 (Unaudited) | For the Year Ended April 30, 2017 | For the Period July 6, 2015* to April 30, 2016 | |||||||||||||
Per Share Operating Performance | |||||||||||||||
Net asset value, beginning of period | $ | 12.23 | $ | 10.64 | $ | 10.32 | |||||||||
|
|
|
|
|
| ||||||||||
Net investment loss(1) | (0.04 | ) | (0.05 | ) | — | (2) | |||||||||
Net realized and unrealized gain on investments | 1.68 | 1.65 | 0.32 | ||||||||||||
|
|
|
|
|
| ||||||||||
Net increase in net assets resulting from operations | 1.64 | 1.60 | 0.32 | ||||||||||||
|
|
|
|
|
| ||||||||||
Dividends and distributions to shareholders from: | |||||||||||||||
Net investment income | — | — | — | (2) | |||||||||||
Net realized capital gains | — | (0.01 | ) | — | |||||||||||
|
|
|
|
|
| ||||||||||
Total dividends and distributions to shareholders | — | (0.01 | ) | — | |||||||||||
|
|
|
|
|
| ||||||||||
Redemption fees | — | — | (2) | — | (2) | ||||||||||
|
|
|
|
|
| ||||||||||
Net asset value, end of period | $ | 13.87 | $ | 12.23 | $ | 10.64 | |||||||||
|
|
|
|
|
| ||||||||||
Total investment return(3) | 13.41 | % | 15.00 | % | 3.13 | % | |||||||||
Ratios/Supplemental Data | |||||||||||||||
Net assets, end of period (in thousands) | $ | 1,332 | $ | 996 | $ | 523 | |||||||||
Ratio of expenses to average net assets | 1.35 | %(4) | 1.35 | % | 1.35 | %(4) | |||||||||
Ratio of expenses to average net assets without waivers and expense reimbursements(5) | 1.86 | %(4) | 2.61 | % | 3.51 | %(4) | |||||||||
Ratio of net investment loss to average net assets | (0.64 | )%(4) | (0.43 | )% | (0.06 | )%(4) | |||||||||
Portfolio turnover rate | 5.53 | %(6) | 12.13 | % | 6.99 | %(7) | |||||||||
| * | Commencement of operations. |
| (1) | The selected per share data was calculated using the average shares outstanding method for the period. |
| (2) | Amount is less than $0.005 per share. |
| (3) | Total investment return is calculated assuming a purchase of shares on the first day and a sale of shares on the last day of each period reported and includes reinvestments of dividends and distributions, if any. Total returns for periods less than one year are not annualized. |
| (4) | Annualized. |
| (5) | During the period, certain fees were waived and/or reimbursed. If such fee waivers and/or reimbursements had not occurred, the ratios would have been as indicated (See Note 2). |
| (6) | Not annualized. |
| (7) | Reflects portfolio turnover for the Fund for the year ended April 30, 2016. |
The accompanying notes are an integral part of the financial statements.
26
POLEN INTERNATIONAL GROWTH FUND
Financial Highlights
Contained below is per share operating performance data for each Institutional Class shares outstanding, total investment return, ratios to average net assets and other supplemental data for the respective period. The total returns in the table represent the rate that an investor would have earned or lost on an investment in the Fund (assuming reinvestment of all dividends and distributions). This information has been derived from information provided in the financial statements and should be read in conjunction with the financial statements and the notes thereto.
| Institutional Class | ||||||||||
| For the Six Months Ended October 31, 2017 (Unaudited) | For the Period December 30, 2016* to April 30, 2017 | |||||||||
Per Share Operating Performance | ||||||||||
Net asset value, beginning of period | $11.57 | $10.00 | ||||||||
|
|
|
| |||||||
Net investment income(1) | 0.02 | 0.05 | ||||||||
Net realized and unrealized gain on investments | 1.70 | 1.52 | ||||||||
|
|
|
| |||||||
Net increase in net assets resulting from operations | 1.72 | 1.57 | ||||||||
|
|
|
| |||||||
Net asset value, end of period | $13.29 | $11.57 | ||||||||
|
|
|
| |||||||
Total investment return(2) | 14.87 | % | 15.70 | % | ||||||
Ratios/Supplemental Data | ||||||||||
Net assets, end of period (in thousands) | $3,794 | $2,648 | ||||||||
Ratio of expenses to average net assets | 1.10 | %(3) | 1.10 | %(3) | ||||||
Ratio of expenses to average net assets without waivers and expense reimbursements(4) | 4.36 | %(3) | 9.84 | %(3) | ||||||
Ratio of net investment income to average net assets | 0.25 | %(3) | 1.32 | %(3) | ||||||
Portfolio turnover rate | 1.38 | %(5) | — | |||||||
| * | Commencement of operations. |
| (1) | The selected per share data was calculated using the average shares outstanding method for the period. |
| (2) | Total investment return is calculated assuming a purchase of shares on the first day and a sale of shares on the last day of each period reported and includes reinvestments of dividends and distributions, if any. Total returns for periods less than one year are not annualized. |
| (3) | Annualized. |
| (4) | During the period, certain fees were waived and/or reimbursed. If such fee waivers and/or reimbursements had not occurred, the ratios would have been as indicated (See Note 2). |
| (5) | Not annualized. |
The accompanying notes are an integral part of the financial statements.
27
POLEN INTERNATIONAL GROWTH FUND
Financial Highlights
Contained below is per share operating performance data for Investor Class shares outstanding, total investment return, ratios to average net assets and other supplemental data for the respective period. The total returns in the table represent the rate that an investor would have earned or lost on an investment in the Fund (assuming reinvestment of all dividends and distributions). This information has been derived from information provided in the financial statements and should be read in conjunction with the financial statements and the notes thereto.
| Investor Class | ||||||||||
| For the Six Months Ended October 31, 2017 (Unaudited) | For the Period March 15, 2017* to April 30, 2017 | |||||||||
Per Share Operating Performance | ||||||||||
Net asset value, beginning of period | $ | 11.56 | $ | 10.91 | ||||||
|
|
|
| |||||||
Net investment income(1) | (0.02 | ) | 0.04 | |||||||
Net realized and unrealized gain on investments | 1.71 | 0.61 | ||||||||
|
|
|
| |||||||
Net increase in net assets resulting from operations | 1.69 | 0.65 | ||||||||
|
|
|
| |||||||
Net asset value, end of period | $ | 13.25 | $ | 11.56 | ||||||
|
|
|
| |||||||
Total investment return(2) | 14.62 | % | 5.96 | % | ||||||
Ratios/Supplemental Data | ||||||||||
Net assets, end of period (in thousands) | $ | 139 | $ | 14 | ||||||
Ratio of expenses to average net assets | 1.35 | %(3) | 1.35 | %(3) | ||||||
Ratio of expenses to average net assets without waivers and expense reimbursements(4) | 4.23 | %(3) | 9.47 | %(3) | ||||||
Ratio of net investment income to average net assets | (0.34 | )%(3) | 2.63 | %(3) | ||||||
Portfolio turnover rate | 1.38 | %(5) | — | |||||||
| * | Commencement of operations. |
| (1) | The selected per share data was calculated using the average shares outstanding method for the period. |
| (2) | Total investment return is calculated assuming a purchase of shares on the first day and a sale of shares on the last day of each period reported and includes reinvestments of dividends and distributions, if any. Total returns for periods less than one year are not annualized. |
| (3) | Annualized. |
| (4) | During the period, certain fees were waived and/or reimbursed. If such fee waivers and/or reimbursements had not occurred, the ratios would have been as indicated (See Note 2). |
| (5) | Not annualized. |
The accompanying notes are an integral part of the financial statements.
28
POLEN GROWTH FUNDS
Notes to Financial Statements
October 31, 2017
(Unaudited)
1. Organization and Significant Accounting Policies
The Polen Growth Fund, Polen Global Growth Fund and Polen International Growth Fund (each a “Fund” and together the “Funds”) are non-diversified, open-end management investment companies registered under the Investment Company Act of 1940, as amended, (the “1940 Act”), which commenced investment operations on September 15, 2010, December 30, 2014 and December 30, 2016, respectively. The Funds are separate series of FundVantage Trust (the “Trust”) which was organized as a Delaware statutory trust on August 28, 2006. The Trust is a “series trust” authorized to issue an unlimited number of separate series or classes of shares of beneficial interest. Each series is treated as a separate entity for certain matters under the 1940 Act, and for other purposes, and a shareholder of one series is not deemed to be a shareholder of any other series. The Funds offer two separate classes of shares, Investor Class (formerly Retail Class) and Institutional Class.
The Funds are investment companies and follow accounting and reporting guidance in the Financial Accounting Standards Board Accounting Standards Codification Topic 946.
Portfolio Valuation — The Funds’ net asset value (“NAV”) is calculated once daily at the close of regular trading hours on the New York Stock Exchange (“NYSE”) (typically 4:00 p.m. Eastern time) on each day the NYSE is open. Securities held by the Funds are valued using the closing price or the last sale price on a national securities exchange or the National Association of Securities Dealers Automatic Quotation System (“NASDAQ”) market system where they are primarily traded. Equity securities traded in the over-the-counter market are valued at their closing prices. If there were no transactions on that day, securities traded principally on an exchange or on NASDAQ will be valued at the mean of the last bid and ask prices prior to the market close. Fixed income securities having a remaining maturity of greater than 60 days are valued using an independent pricing service. Fixed income securities having a remaining maturity of 60 days or less are generally valued at amortized cost, provided such amount approximates fair value. Investments in other open-end investment companies are valued based on the NAV of the investment companies (which may use fair value pricing as discussed in their prospectuses). If market quotations are unavailable or deemed unreliable, securities will be valued in accordance with procedures adopted by the Trust’s Board of Trustees (“Board of Trustees”). Relying on prices supplied by pricing services or dealers or using fair valuation may result in values that are higher or lower than the values used by other investment companies and investors to price the same investments. In the event that market quotes are not readily available, and the security or asset cannot be valued pursuant to one of the valuation methods, the value of the security or asset will be determined in good faith by the Adviser. The Trust has established a Valuation Committee which performs certain functions including the oversight of the Adviser’s fair valuation determinations.
29
POLEN GROWTH FUNDS
Notes to Financial Statements
October 31, 2017
(Unaudited)
Fair Value Measurements — The inputs and valuation techniques used to measure fair value of the Funds’ investments are summarized into three levels as described in the hierarchy below:
• Level 1 — | quoted prices in active markets for identical securities; | |
• Level 2 — | other significant observable inputs (including quoted prices for similar securities, interest rates, prepayment speeds, credit risk, etc.); and | |
• Level 3 — | significant unobservable inputs (including the Funds’ own assumptions in determining the fair value of investments). | |
The inputs or methodology used for valuing securities are not necessarily an indication of the risk associated with investing in those securities.
Significant events (such as movement in the U.S. securities market, or other regional and local developments) may occur between the time that foreign markets close (where the security is principally traded) and the time that each Fund calculates its NAV (generally, the close of the NYSE) that may impact the value of securities traded in these foreign markets. As a result, each Fund fair values foreign securities using an independent pricing service which considers the correlation of the trading patterns of the foreign security to the intraday trading in the U.S. markets for investments such as American Depositary Receipts, financial futures, exchange traded funds and certain indexes as well as prices for similar securities. Such fair valuations are categorized as Level 2 in the hierarchy.
Securities listed on a non-U.S. exchange are generally fair valued daily by an independent fair value pricing service approved by the Board of Trustees and categorized as Level 2 investments within the hierarchy. The fair valuations for these securities may not be the same as quoted or published prices of the securities on their primary markets. Securities for which daily fair value prices from the independent fair value pricing service are not available are generally valued at the last quoted sale price at the close of an exchange on which the security is traded and categorized as Level 1 investments within the hierarchy. Values of foreign securities, currencies, and other assets and liabilities denominated in foreign currencies are translated into U.S. dollars at the exchange rate of said currencies against the U.S. dollar, as of Valuation Time, as provided by an independent pricing service approved by the Board of Trustees.
30
POLEN GROWTH FUNDS
Notes to Financial Statements
October 31, 2017
(Unaudited)
The following is a summary of the inputs used, as of October 31, 2017, in valuing the Funds’ investments carried at fair value:
| Funds | Total Value at 10/31/17 | Level 1 Quoted Price | Level 2 Other Significant Observable Inputs | Level 3 Significant Unobservable Inputs | ||||||||||||
Polen Growth Fund | ||||||||||||||||
Investments in Securities* | $ | 1,649,092,284 | $ | 1,649,092,284 | $ | — | $ | — | ||||||||
|
|
|
|
|
|
|
| |||||||||
Polen Global Growth Fund | ||||||||||||||||
Australia | $ | 699,663 | $ | — | $ | 699,663 | $ | — | ||||||||
Cayman Islands | 2,249,238 | 878,412 | 1,370,826 | — | ||||||||||||
Denmark | 739,193 | 290,126 | 449,067 | — | ||||||||||||
France | 534,137 | — | 534,137 | — | ||||||||||||
Germany | 632,582 | — | 632,582 | — | ||||||||||||
Hong Kong | 753,548 | — | 753,548 | — | ||||||||||||
Ireland | 866,118 | 866,118 | — | — | ||||||||||||
Israel | 614,799 | 614,799 | — | — | ||||||||||||
Switzerland | 1,536,946 | — | 1,536,946 | — | ||||||||||||
United Kingdom | 535,098 | — | 535,098 | — | ||||||||||||
United States | 12,281,071 | 12,281,071 | — | — | ||||||||||||
|
|
|
|
|
|
|
| |||||||||
Total | $ | 21,442,393 | $ | 14,930,526 | $ | 6,511,867 | $ | — | ||||||||
|
|
|
|
|
|
|
| |||||||||
| Total Value at 10/31/17 | Level 1 Quoted Price | Level 2 Other Significant Observable Inputs | Level 3 Significant Unobservable Inputs | |||||||||||||
Polen International Growth Fund |
| |||||||||||||||
Australia | $ | 129,563 | $ | — | $ | 129,563 | $ | — | ||||||||
Cayman Islands | 444,463 | 183,781 | 260,682 | — | ||||||||||||
China | 164,172 | 164,172 | — | — | ||||||||||||
Denmark | 253,475 | — | 253,475 | — | ||||||||||||
France | 227,831 | — | 227,831 | — | ||||||||||||
Germany | 314,953 | — | 314,953 | — | ||||||||||||
Ireland | 532,069 | 404,901 | 127,168 | — | ||||||||||||
Israel | 122,536 | 122,536 | — | — | ||||||||||||
Mexico | 73,172 | 73,172 | — | — | ||||||||||||
Netherlands | 157,135 | — | 157,135 | — | ||||||||||||
31
POLEN GROWTH FUNDS
Notes to Financial Statements
October 31, 2017
(Unaudited)
| Total Value at 10/31/17 | Level 1 Quoted Price | Level 2 Other Significant Observable Inputs | Level 3 Significant Unobservable Inputs | |||||||||||||
Spain | $ | 227,159 | $ | — | $ | 227,159 | $ | — | ||||||||
Switzerland | 287,291 | — | 287,291 | — | ||||||||||||
United Kingdom | 778,515 | — | 778,515 | — | ||||||||||||
|
|
|
|
|
|
|
| |||||||||
Total | $ | 3,712,334 | $ | 948,562 | $ | 2,763,772 | $ | — | ||||||||
|
|
|
|
|
|
|
| |||||||||
| ||||||||||||||||
* Please refer to Portfolio of Investments for details on portfolio holdings. | ||||||||||||||||
At the end of each quarter, management evaluates the classification of Levels 1, 2 and 3 assets and liabilities. Various factors are considered, such as changes in liquidity from the prior reporting period; whether or not a broker is willing to execute at the quoted price; the depth and consistency of prices from third party pricing services; and the existence of contemporaneous, observable trades in the market. Additionally, management evaluates the classification of Level 1 and Level 2 assets and liabilities on a quarterly basis for changes in listings or delistings on national exchanges.
Due to the inherent uncertainty of determining the fair value of investments that do not have a readily available market value, the fair value of the Funds’ investments may fluctuate from period to period. Additionally, the fair value of investments may differ significantly from the values that would have been used had a ready market existed for such investments and may differ materially from the values the Funds may ultimately realize. Further, such investments may be subject to legal and other restrictions on resale or otherwise less liquid than publicly traded securities.
For fair valuations using significant unobservable inputs, U.S. generally accepted accounting principles (“U.S. GAAP”) require the Funds to present a reconciliation of the beginning to ending balances for reported market values that present changes attributable to total realized and unrealized gains or losses, purchase and sales, and transfers in and out of Level 3 during the period. Transfers in and out between Levels are based on values at the end of the period. U.S. GAAP also requires the Funds to disclose amounts and reasons for all transfers in and out of Level 1 and Level 2 fair value measurements. A reconciliation of Level 3 investments is presented only when the Funds had an amount of Level 3 investments at the end of the reporting period that was meaningful in relation to their net assets. The amounts and reasons for all transfers in and out of each Level within the three-tier hierarchy are disclosed when the Funds had an amount of total transfers during the reporting period that was meaningful in relation to their net assets as of the end of the reporting period.
For the six months ended October 31, 2017, there were no transfers between Levels 1, 2 and 3 for any of the Funds.
32
POLEN GROWTH FUNDS
Notes to Financial Statements
October 31, 2017
(Unaudited)
Use of Estimates — The preparation of financial statements in conformity with U.S. GAAP requires management to make estimates and assumptions that affect the amounts reported in the financial statements and accompanying notes at the date of the financial statements and the reported amounts of revenues and expenses during the period. Actual results could differ from those estimates and those differences could be material.
Investment Transactions, Investment Income and Expenses — Investment transactions are recorded on trade date for financial statement preparation purposes. Realized gains and losses on investments sold are recorded on the identified cost basis. Interest income is recorded on the accrual basis. Dividends are recorded on the ex-dividend date. Estimated components of distributions received from real estate investment trusts may be considered income, return of capital distributions or capital gain distributions. Return of capital distributions are recorded as a reduction of cost of the related investments. Distribution (12b-1) fees relating to a specific class are charged directly to that class. Fund level expenses common to all classes, investment income and realized and unrealized gains and losses on investments are generally allocated to each class of each Fund based upon the relative daily net assets of each class of each Fund. General expenses of the Trust are generally allocated to each Fund in proportion to its relative daily net assets. Expenses directly attributable to a particular Fund in the Trust are charged directly to that Fund. The Funds’ investment income, expenses (other than class-specific expenses) and unrealized and realized gains and losses are allocated daily to each class of shares based upon the relative proportion of net assets of each class at the beginning of the day.
Foreign Currency Translation — Assets and liabilities initially expressed in non-U.S. currencies are translated into U.S. dollars based on the applicable exchange rates at the date of the last business day of the financial statement period. Purchases and sales of securities, interest income, dividends, variation margin received and expenses denominated in foreign currencies are translated into U.S. dollars at the exchange rates in effect on the transaction date. The Funds do not separately report the effect of changes in foreign exchange rates from changes in market prices of securities held. Such changes are included with the net realized gain or loss and change in unrealized appreciation or depreciation on investment securities in the Statement of Operations. Other foreign currency transactions resulting in realized and unrealized gain or loss are reported separately as net realized gain or loss and change in unrealized appreciation or depreciation on foreign currencies in the Statement of Operations.
Dividends and Distributions to Shareholders — Dividends from net investment income and distributions from net realized capital gains, if any, are declared and paid at least annually to shareholders and are recorded on ex-date. Income dividends and capital gain distributions are determined in accordance with U.S. federal income tax regulations, which may differ from U.S. GAAP. These differences may include the treatment of non-taxable dividends, expiring capital loss carryforwards and losses deferred due to wash sales and excise tax regulations. Permanent book and tax basis differences relating to shareholder distributions will result in reclassifications within the components of net assets.
33
POLEN GROWTH FUNDS
Notes to Financial Statements
October 31, 2017
(Unaudited)
U.S. Tax Status — No provision is made for U.S. income taxes as it is the Funds’ intention to continue to qualify for and elect the tax treatment applicable to regulated investment companies under Subchapter M of the Internal Revenue Code of 1986, as amended (“Internal Revenue Code”), and make the requisite distributions to its shareholders which will be sufficient to relieve it from U.S. income and excise taxes.
Other — In the normal course of business, the Funds may enter into contracts that provide general indemnifications. The Funds’ maximum exposure under these arrangements is dependent on claims that may be made against the Funds in the future, and therefore, cannot be estimated; however, based on experience, the risk of material loss for such claims is considered remote.
Currency Risk — The Funds invest in securities of foreign issuers, including American Depositary Receipts. These markets are subject to special risks associated with foreign investments not typically associated with investing in U.S. markets. Because the foreign securities in which the Funds may invest generally trade in currencies other than the U.S. dollar, changes in currency exchange rates will affect the Funds’ NAV, the value of dividends and interest earned and gains and losses realized on the sale of securities. Because the NAV for the Funds is determined on the basis of U.S. dollars, the Funds may lose money by investing in a foreign security if the local currency of a foreign market depreciates against the U.S. dollar, even if the local currency value of the Funds’ holdings goes up. Generally, a strong U.S. dollar relative to these other currencies will adversely affect the value of the Funds’ holdings in foreign securities.
Foreign Securities Market Risk — Securities of many non-U.S. companies may be less liquid and their prices more volatile than securities of comparable U.S. companies. Securities of companies traded in many countries outside the U.S., particularly emerging markets countries, may be subject to further risks due to the inexperience of local investment professionals and financial institutions, the possibility of permanent or temporary termination of trading and greater spreads between bid and asked prices of securities. In addition, non-U.S. stock exchanges and investment professionals are subject to less governmental regulation, and commissions may be higher than in the United States. Also, there may be delays in the settlement of non-U.S. stock exchange transactions.
Recent Accounting Pronouncement — On August 1, 2017, the Funds implemented changes due to amendments to Regulation S-X, issued by the Securities and Exchange Commission, which require standardized, enhanced disclosures, particularly related to derivatives, in investment company financial statements. Adoption of the amendments had no effect on the Funds’ net assets or results of operations.
2. Transactions with Related Parties and Other Service Providers
Polen Capital Management, LLC (“PCM” or the “Adviser”) serves as investment adviser to the Funds pursuant to an investment advisory agreement with the Trust. For its services, the Adviser is paid a monthly fee at the annual rate of 0.85% of the average daily net assets of the Polen Growth Fund, Polen Global
34
POLEN GROWTH FUNDS
Notes to Financial Statements
October 31, 2017
(Unaudited)
Growth Fund and Polen International Growth Fund. The Adviser has contractually agreed to reduce its investment advisory fee and/or reimburse certain expenses of the Funds to the extent necessary to ensure that the Funds’ total operating expenses (excluding taxes, any class-specific fees and expenses, interest, extraordinary items, “Acquired Fund Fees and Expenses” and brokerage commissions) do not exceed (on an annual basis) 1.00% of the Polen Growth Fund’s and 1.10% of the Polen Global Growth Fund’s and Polen International Growth Fund’s, average daily net assets (the “Expense Limitations”). The Expense Limitations will remain in place until August 31, 2018 with respect to each Fund, unless the Board of Trustees approves its earlier termination. With regard to each of the Polen Growth Fund and the Polen International Growth Fund, the Adviser is entitled to recover, subject to approval by the Board of Trustees, such amounts reduced or reimbursed for a period of up to three (3) years from the date on which the Adviser reduced its compensation and/or assumed expenses for such Fund. With regard to the Polen Global Growth Fund, the Adviser is entitled to recover, subject to approval by the Board of Trustees, such amounts reduced or reimbursed for a period of up to three (3) years from the year in which the Adviser reduced its compensation and/or assumed expenses for the Fund. The Adviser is permitted to seek reimbursement from a Fund, subject to certain limitations, for fees it waived and Fund expenses it paid to the extent the total annual fund expenses do not exceed the limits described above or any lesser limits in effect at the time of reimbursement. For the Polen Growth Fund, the Advisor is entitled to recoup only the advisory fees waived or expenses reimbursed beginning January 1, 2017. No recoupment will occur unless the Fund’s expenses are below the Expense Limitation amount.
For the six months ended October 31, 2017, the Adviser earned advisory fees of $6,845,039, $90,120 and $14,550 for the Polen Growth Fund, Polen Global Growth Fund and Polen International Growth Fund, respectively. For the six months ended October 31, 2017, the Adviser recouped fees of $169,897 waived in prior periods for the Polen Growth Fund, and waived fees and reimbursed expenses of $54,285 and $55,710 for the Polen Global Growth Fund and Polen International Growth Fund, respectively.
As of October 31, 2017, the amount of potential recovery was as follows:
| Expiration | ||||||||||||||||||||||||
| 04/30/2018 | 04/30/2019 | 04/30/2020 | 10/31/2020 | 04/30/2021 | Total | |||||||||||||||||||
Polen Growth Fund | $ | — | $ | — | $ | 75,050 | $ | — | $ | — | $ | 75,050 | ||||||||||||
Polen Global Growth Fund | $ | 80,469 | $ | 211,741 | $ | 207,831 | $ | — | $ | 54,285 | $ | 554,326 | ||||||||||||
Polen International Growth Fund | $ | — | $ | — | $ | 53,471 | $ | 55,710 | $ | — | $ | 109,181 | ||||||||||||
35
POLEN GROWTH FUNDS
Notes to Financial Statements
October 31, 2017
(Unaudited)
Other Service Providers
BNY Mellon Investment Servicing (US) Inc. (“BNY Mellon”) serves as administrator and transfer agent for the Funds. For providing administrative and accounting services, BNY Mellon is entitled to receive a monthly fee equal to an annual percentage rate of the Funds’ average daily net assets and is subject to certain minimum monthly fees. For providing transfer agency services, BNY Mellon is entitled to receive a monthly fee, subject to certain minimum, and out of pocket expenses.
The Bank of New York Mellon (the “Custodian”) provides certain custodial services to the Funds. The Custodian is entitled to receive a monthly fee, subject to certain minimum, and out of pocket expenses.
Foreside Funds Distributors LLC (the “Underwriter”) provides principal underwriting services to the Funds.
The Trust and the Underwriter are parties to an underwriting agreement. The Trust has adopted a distribution plan for Investor Shares in accordance with Rule 12b-1 under the 1940 Act. Pursuant to the Investor Shares plan, the Funds compensate the Underwriter for direct and indirect costs and expenses incurred in connection with advertising, marketing and other distribution services in an amount not to exceed 0.25% on an annualized basis of the average daily net assets of the Funds’ Investor Shares.
Trustees and Officers
The Trust is governed by its Board of Trustees. The Trustees receive compensation in the form of an annual retainer and per meeting fees for their services to the Trust. The remuneration paid to the Trustees by the Funds during the six months ended October 31, 2017 was $51,347, $678 and $105 for the Polen Growth Fund, Polen Global Growth Fund and Polen International Growth Fund, respectively. An employee of BNY Mellon serves as the Secretary of the Trust and is not compensated by the Funds or the Trust.
JW Fund Management LLC (“JWFM”) provides a Principal Executive Officer and Principal Financial Officer, respectively, to the Trust. JWFM is compensated for the services provided to the Trust.
Freeh Group International Solutions, LLC provides the Trust with a Chief Compliance Officer and an Anti-Money Laundering Officer.
36
POLEN GROWTH FUNDS
Notes to Financial Statements
October 31, 2017
(Unaudited)
3. Investment in Securities
For the six months ended October 31, 2017, aggregate purchases and sales of investment securities (excluding short-term investments) of the Funds were as follows:
| Purchases | Sales | |||||||
Polen Growth Fund | $ | 246,955,695 | $ | 163,984,309 | ||||
Polen Global Growth Fund | $ | 1,416,234 | $ | 1,100,350 | ||||
Polen International Growth Fund | $ | 836,322 | $ | 43,816 | ||||
4. Capital Share Transactions
For the six months ended October 31, 2017 and the year ended April 30, 2017, transactions in capital shares (authorized shares unlimited) were as follows:
| Polen Growth Fund | ||||||||||||||||
| Six Months Ended October 31, 2017 (Unaudited) | For the Year Ended April 30, 2017 | |||||||||||||||
| Shares | Amount | Shares | Amount | |||||||||||||
Institutional Class | ||||||||||||||||
Sales | 11,749,269 | $ | 271,246,080 | 30,209,162 | $ | 595,828,006 | ||||||||||
Reinvestments | — | — | 4,430 | 87,594 | ||||||||||||
Redemption Fees* | — | 11,052 | — | 71,400 | ||||||||||||
Redemptions | (6,039,086 | ) | (139,365,997 | ) | (18,555,536 | ) | (366,058,856 | ) | ||||||||
|
|
|
|
|
|
|
| |||||||||
Net increase | 5,710,183 | $ | 131,891,135 | 11,658,056 | $ | 229,928,144 | ||||||||||
|
|
|
|
|
|
|
| |||||||||
Investor Class | ||||||||||||||||
Sales | 529,497 | $ | 11,998,579 | 2,120,795 | $ | 41,071,753 | ||||||||||
Redemption Fees* | — | 765 | — | 7,298 | ||||||||||||
Redemptions | (2,559,522 | ) | (58,858,743 | ) | (5,193,570 | ) | (98,920,376 | ) | ||||||||
|
|
|
|
|
|
|
| |||||||||
Net decrease | (2,030,025 | ) | $ | (46,859,399 | ) | (3,072,775 | ) | $ | (57,841,325 | ) | ||||||
|
|
|
|
|
|
|
| |||||||||
Total net increase | 3,680,158 | $ | 85,031,736 | 8,585,281 | $ | 172,086,819 | ||||||||||
|
|
|
|
|
|
|
| |||||||||
37
POLEN GROWTH FUNDS
Notes to Financial Statements
October 31, 2017
(Unaudited)
| Polen Global Growth Fund | ||||||||||||||||
| Six Months Ended October 31, 2017 (Unaudited) | For the Year Ended April 30, 2017 | |||||||||||||||
| Shares | Amount | Shares | Amount | |||||||||||||
Institutional Class | ||||||||||||||||
Sales | 100,355 | $ | 1,326,824 | 457,506 | $ | 5,095,096 | ||||||||||
Reinvestments | — | — | 586 | 6,395 | ||||||||||||
Redemption Fees* | — | — | — | 2,893 | ||||||||||||
Redemptions | (65,486 | ) | (844,852 | ) | (207,163 | ) | (2,295,697 | ) | ||||||||
|
|
|
|
|
|
|
| |||||||||
Net increase | 34,869 | $ | 481,972 | 250,929 | $ | 2,808,687 | ||||||||||
|
|
|
|
|
|
|
| |||||||||
Investor Class | ||||||||||||||||
Sales | 17,189 | $ | 224,283 | 50,622 | $ | 558,466 | ||||||||||
Reinvestments | — | — | 38 | 408 | ||||||||||||
Redemption Fees* | — | — | — | 127 | ||||||||||||
Redemptions | (2,593 | ) | (33,874 | ) | (18,360 | ) | (202,288 | ) | ||||||||
|
|
|
|
|
|
|
| |||||||||
Net increase | 14,596 | $ | 190,409 | 32,300 | $ | 356,713 | ||||||||||
|
|
|
|
|
|
|
| |||||||||
Total net increase | 49,465 | $ | 672,381 | 283,229 | $ | 3,165,400 | ||||||||||
|
|
|
|
|
|
|
| |||||||||
| Polen International Growth Fund** | ||||||||||||||||
| Six Months Ended October 31, 2017 (Unaudited) | For the Period Ended April 30, 2017 | |||||||||||||||
| Shares | Amount | Shares | Amount | |||||||||||||
Institutional Class | ||||||||||||||||
Sales | 64,887 | $ | 804,409 | 228,806 | $ | 2,372,451 | ||||||||||
Reinvestments | — | — | — | — | ||||||||||||
Redemption Fees* | — | — | — | — | ||||||||||||
Redemptions | (8,117 | ) | (101,948 | ) | — | — | ||||||||||
|
|
|
|
|
|
|
| |||||||||
Net increase | 56,770 | $ | 702,461 | 228,806 | $ | 2,372,451 | ||||||||||
|
|
|
|
|
|
|
| |||||||||
Investor Class | ||||||||||||||||
Sales | 9,858 | $ | 123,630 | 1,229 | $ | 13,500 | ||||||||||
Reinvestments | — | — | — | — | ||||||||||||
Redemption Fees* | — | — | — | — | ||||||||||||
Redemptions | (573 | ) | (7,315 | ) | — | — | ||||||||||
|
|
|
|
|
|
|
| |||||||||
Net increase | 9,285 | $ | 116,315 | 1,229 | $ | 13,500 | ||||||||||
|
|
|
|
|
|
|
| |||||||||
38
POLEN GROWTH FUNDS
Notes to Financial Statements
October 31, 2017
(Unaudited)
| Polen International Growth Fund** | ||||||||||||||||
| Six Months Ended October 31, 2017 (Unaudited) | For the Period Ended April 30, 2017 | |||||||||||||||
| Shares | Amount | Shares | Amount | |||||||||||||
Total net increase | 66,055 | $ | 818,776 | 230,035 | $ | 2,385,951 | ||||||||||
|
|
|
|
|
|
|
| |||||||||
| * | There is a 2.00% redemption fee that may be charged on shares redeemed within the first 60 days of their acquisition. The redemption fees are retained by the Funds for the benefit of the remaining shareholders and recorded as paid-in capital. |
| ** | The Polen International Growth Fund’s Institutional Class commenced operations on December 30, 2016, and the Fund’s Investor Class commenced operations on March 15, 2017. |
5. Federal Tax Information
The Funds have followed the authoritative guidance on accounting for and disclosure of uncertainty in tax positions, which requires the Funds to determine whether a tax position is more likely than not to be sustained upon examination, including resolution of any related appeals or litigation processes, based on the technical merits of the position. The Funds have determined that there was no effect on the financial statements from following this authoritative guidance. In the normal course of business, the Funds are subject to examination by federal, state and local jurisdictions, where applicable, for tax years for which applicable statutes of limitations have not expired.
For the year ended April 30, 2017, the tax character of distributions paid by the Polen Growth Fund and Polen Global Growth Fund were $103,570 and $7,111 of long-term capital gains, respectively. There were no distributions for the Polen International Growth Fund. Distributions from net investment income and short-term capital gains are treated as ordinary income for federal income tax purposes.
As of April 30, 2017 the components of distributable earnings on a tax basis were as follows:
| Capital Loss Carryforward | Undistributed Ordinary Income | Undistributed Long-Term Gain | Unrealized Appreciation | Qualified Late Year Loss Deferral | ||||||||||||||||
Polen Growth Fund | $ | — | $ | — | $ | 10,995,871 | $ | 315,170,201 | $ | — | ||||||||||
Polen Global Growth Fund | $ | — | $ | — | $ | — | $ | 2,910,771 | $ | (48,066 | ) | |||||||||
Polen International Growth Fund | $ | — | $ | 20,712 | $ | — | $ | 265,135 | $ | — | ||||||||||
39
POLEN GROWTH FUNDS
Notes to Financial Statements
October 31, 2017
(Unaudited)
The differences between the book and tax basis components of distributable earnings relate primarily to the timing and recognition of income and gains for federal income tax purposes. Foreign currency and short-term capital gains are reported as ordinary income for federal income tax purposes.
As of October 31, 2017, the federal tax cost, aggregate gross unrealized appreciation and depreciation of securities held by each Fund were as follows:
| Federal Tax Cost* | Gross Unrealized Appreciation | Gross Unrealized Depreciation | Net Unrealized Appreciation | |||||||||||||
Polen Growth Fund | $ | 1,183,778,258 | $ | 475,680,637 | $ | (10,366,611 | ) | $ | 465,314,026 | |||||||
Polen Global Growth Fund | 15,672,713 | 6,003,724 | (234,044 | ) | 5,769,680 | |||||||||||
Polen International Growth Fund | 3,005,557 | 709,075 | (2,298 | ) | 706,777 | |||||||||||
| * | Because tax adjustments are calculated annually at the end of the Fund’s fiscal year, the above table does not reflect tax adjustments for the current fiscal year. For the previous year’s federal income tax information, please refer to the Notes to Financial Statements section in the Fund’s most recent annual report. |
Pursuant to federal income tax rules applicable to regulated investment companies, the Funds may elect to treat certain capital losses between November 1 and April 30 and late year ordinary losses ((i) ordinary losses between January 1 and April 30, and (ii) specified ordinary and currency losses between November 1 and April 30) as occurring on the first day of the following tax year. For the year ended April 30, 2017, any amount of losses elected within the tax return will not be recognized for federal income tax purposes until May 1, 2017. For the year ended April 30, 2017, the Funds deferred to May 1, 2017 the following losses:
| Late-Year Ordinary Losses Deferral | Short-Term Capital Loss Deferral | Long-Term Capital Loss Deferral | ||||||||||
Polen Growth Fund | $ | — | $ | — | $ | — | ||||||
Polen Global Growth Fund | — | 10,382 | 37,684 | |||||||||
Polen International Growth Fund | — | — | — | |||||||||
Accumulated capital losses represent net capital loss carryforwards as of April 30, 2017 that may be available to offset future realized capital gains and thereby reduce future capital gains distributions. As of April 30, 2017, the Funds did not have any capital loss carryforwards.
During the year ended April 30, 2017, the Polen Global Growth Fund utilized $54,052 of prior year capital loss carryforward.
40
POLEN GROWTH FUNDS
Notes to Financial Statements (Concluded)
October 31, 2017
(Unaudited)
6. Subsequent Events
Management has evaluated the impact of all subsequent events on the Fund through the date the financial statements were issued, and has determined that there were no subsequent events requiring recognition or disclosure in the financial statements.
41
POLEN GROWTH FUNDS
Other Information
(Unaudited)
Proxy Voting
Policies and procedures that the Funds use to determine how to vote proxies relating to portfolio securities as well as information regarding how the Funds voted proxies relating to portfolio securities for the most recent 12-month period ended June 30 are available without charge, upon request, by calling (888) 678-6024 and on the Securities and Exchange Commission’s (“SEC”) website at http://www.sec.gov.
Quarterly Portfolio Schedules
The Trust files its complete schedule of portfolio holdings with the SEC for the first and third fiscal quarters of each fiscal year (quarters ended July 31 and January 31) on Form N-Q. The Trust’s Forms N-Q are available on the SEC’s website at http://www.sec.gov, and may be reviewed and copied at the SEC’s Public Reference Room in Washington, D.C. Information on the operation of the SEC’s Public Reference Room may be obtained by calling 1-800-SEC-0330.
Board Consideration of Investment Advisory Agreement
At a meeting held on September 27-28, 2017 (the “Meeting”), the Board of Trustees (the “Board” or the “Trustees”) of FundVantage Trust (the “Trust”), including a majority of the Trustees who are not “interested persons” within the meaning of Section 2(a)(19) of the Investment Company Act of 1940, as amended (the “1940 Act”) (the “Independent Trustees”), unanimously approved the continuation of the Investment Advisory Agreement between Polen Capital Management, LLC (“Polen” or the “Adviser”) and the Trust (the “Existing Agreement”) on behalf of the Polen Growth Fund, Polen Global Growth Fund and Polen International Growth Fund and the approval of a new Investment Advisory Agreement between Polen and the Trust (the “New Agreement” and together with the Existing Agreement, the “Agreements”) on behalf of the Polen U.S. Small Company Growth Fund (together with the Polen Growth Fund, Polen Global Growth Fund and Polen International Growth Fund, the “Polen Funds”).
In determining whether to approve the Agreements, the Trustees considered information provided by the Advisor in accordance with Section 15(c) of the 1940 Act regarding: (i) services performed or to be performed for the Polen Funds, (ii) the size and qualifications of their portfolio management staff, (iii) any potential or actual material conflicts of interest which may arise in connection with a portfolio manager’s management of the Polen Funds, (iv) investment performance, (v) the capitalization and financial condition of Polen, (vi) brokerage selection procedures (including soft dollar arrangements, if any), (vii) the procedures for allocating investment opportunities between the Polen Funds and other clients, (viii) results of any regulatory examination, including any recommendations or deficiencies noted, (ix) any litigation, investigation or administrative proceeding which may have a material impact on Polen’s ability to service the Polen
42
POLEN GROWTH FUNDS
Other Information (Continued)
(Unaudited)
Funds, (x) compliance with the Polen Funds’ investment objectives, policies and practices (including codes of ethics and proxy voting policies) and (xi) compliance with federal securities laws and other regulatory requirements. The Trustees noted the reports and discussions with portfolio managers as provided at the Board meetings throughout the year covering matters such as the relative performance of the Polen Funds; compliance with the investment objectives, policies, strategies and limitations for the Polen Funds; the compliance of management personnel with the code of ethics; and the adherence to the Trust’s pricing procedures as established by the Board.
Representatives from Polen attended the Meeting both in person and via teleconference. The representatives discussed the firm’s history, performance and investment strategies in connection with the proposed approval of the Agreements and answered questions from the Board.
Investment Performance. The Trustees considered the investment performance for the Polen Growth Fund. The Trustees reviewed the historical performance charts for the year to date, one year, two year, three year, five year and since inception periods ended June 30, 2017 for (i) the Investor Class and Institutional Class shares of the Polen Growth Fund; (ii) the Russell 1000 Growth Total Return Index; (iii) the S&P 500 Daily Reinvested Index and (iv) the Lipper Large Cap Growth Fund Index, the Polen Growth Fund’s applicable Lipper index. The Trustees also received performance information for the Polen Growth Fund as compared to the Fund’s comparable separately managed account composite (gross of fees) for the one year, three year, five year and since inception periods ended July 31, 2017.
The Trustees noted that the Institutional Class shares of the Polen Growth Fund outperformed the Russell 1000 Growth Total Return Index and the S&P 500 Daily Reinvested Index for the one year, two year, three year, and year to date periods ended June 30, 2017. The Trustees noted that the Institutional Class shares of the Polen Growth Fund had underperformed the Russell 1000 Growth Total Return Index and the S&P 500 Daily Reinvested Index for the five year period ended June 30, 2017. The Trustees noted that the Institutional Class shares of the Polen Growth Fund had underperformed the Russell 1000 Growth Total Return Index for the since inception period ended June 30, 2017 and outperformed the S&P 500 Daily Reinvested Index for the since inception period ended June 30, 2017. The Trustees noted that the Institutional Class shares of the Polen Growth Fund had underperformed the Lipper Large Cap Growth Fund Index for the one year and year to date periods ended June 30, 2017, and outperformed the Lipper Large Cap Growth Fund Index for the two year, three year, five year, and since inception periods ended June 30, 2017.
With respect to the Fund’s comparable separately managed account composite, the Trustees noted that the Fund’s Institutional Class shares underperformed the separately managed account composite for the one year, three year and five year periods ended July 31, 2017, and outperformed the separately managed account composite for the since inception period ended July 31, 2017. The Trustees concluded that the performance of the Polen Growth Fund was within an acceptable range of performance relative to other mutual funds with similar investment objectives, strategies and policies based on the information provided at the Meeting.
43
POLEN GROWTH FUNDS
Other Information (Continued)
(Unaudited)
With respect to the Polen Global Growth Fund, the Trustees noted that the fund outperformed the Lipper Global Large Cap Growth Index and the MSCI All-Cap World ND Index for the one year, two year, since inception, and year to date periods ended June 30, 2017. The Trustees noted that the Polen Global Growth Fund outperformed the MSCI ACWI Index for the since inception period ended July 31, 2017. With respect to the Fund’s comparable separately managed account composite, the Trustees noted that the Polen Global Growth Fund underperformed for the one year and since inception periods ended July 31, 2017. The Trustees concluded that the performance of the Polen Global Growth Fund was within an acceptable range of performance relative to other mutual funds with similar investment objectives, strategies and policies based on the information provided at the Meeting.
With respect to the Polen International Growth Fund, the Trustees noted that the fund outperformed the Lipper International Large Cap Growth Index and the MSCI AC World ex-US ND Index for the year to date and since inception periods ended June 30, 2017. The Trustees noted that the Polen International Growth Fund outperformed the MSCI ACWI ex-US Index for the since inception period ended July 31, 2017. With respect to the Fund’s comparable separately managed account composite, the Trustees noted that the Polen International Growth Fund underperformed for the since inception period ended July 31, 2017. The Trustees concluded that the performance of the Polen International Growth Fund was within an acceptable range of performance relative to other mutual funds with similar investment objectives, strategies and policies based on the information provided at the Meeting.
The Trustees considered that the proposed strategy for the Polen US Small Company Growth Fund was new, and therefore did not have historical performance. The Trustees noted that they received performance information for the other series of the Trust advised by Polen and the separately managed account composite, which were representative of the Adviser’s performance in implementing certain types of strategies to be employed for the Polen US Small Company Growth Fund. The Trustees concluded that the performance information relating to the comparable funds and separately managed account composite was acceptable for purposes of its consideration of the New Agreement.
Fees. The Trustees also noted that Polen had provided information regarding its advisory fees and an analysis of these fees in relation to the delivery of services to the Polen Funds and any other ancillary benefit resulting from Polen’s relationship with the Funds. The Trustees considered the fees that Polen charges to its similarly managed accounts, and evaluated the explanations provided by Polen as to differences in fees charged to the Polen Funds and similarly managed accounts. The Trustees also reviewed a peer comparison of advisory fees and total expenses for the Polen Funds versus other similarly managed funds.
44
POLEN GROWTH FUNDS
Other Information (Continued)
(Unaudited)
The Trustees noted that the net total expense ratio of the Polen Growth Fund’s Institutional Class was higher than the median of the net total expense ratio of funds with similar share classes in the applicable Lipper category. They further noted that the gross advisory fee for the Polen Growth Fund was higher than the median of the gross advisory fees for funds in the Lipper Large Cap Growth Index category.
The Trustees noted that the net total expense ratio of the Polen Global Growth Fund’s Institutional Class shares were equal to the median of the net total expense ratio of funds with similar share classes in the applicable Lipper category. They further noted that the gross advisory fee for the Polen Global Growth Fund was equal to the median of the gross advisory fees for funds in the Lipper Large Cap Growth Index category.
The Trustees noted that the net total expense ratio of the Polen International Growth Fund’s Institutional Class shares were higher than the median of the net total expense ratio of funds with similar share classes in the applicable Lipper category. They further noted that the gross advisory fee for the Polen International Growth Fund was higher than the median of the gross advisory fees for funds in the Lipper Large Cap Growth Index category.
The Trustees considered explanations provided by Polen as to differences in fees proposed to be charged to the Polen U.S. Small Company Growth Fund and other similarly managed accounts or Polen Funds. The Trustees evaluated explanations provided by Polen regarding its belief that the proposed advisory fee is within the normal range of fees and expenses for funds of similar size, composition and type of investment product. The Trustees concluded that the advisory fee and services proposed to be provided by Polen are sufficiently consistent with those of other advisers which manage mutual funds with investment objectives, strategies and policies similar to those of the New Fund.
Knowledge, experience, and qualifications. The Board considered the level and depth of knowledge of Polen, including the professional experience and qualifications of senior personnel. In evaluating the quality of services to be provided by Polen, the Board took into account its familiarity with Polen’s senior management through Board meetings, discussions and reports during the preceding year. The Board also took into account Polen’s compliance policies and procedures and reports regarding Polen’s compliance operations from the Trust’s Chief Compliance Officer. The Board also considered any potential conflicts of interest that may arise in a portfolio manager’s management of the Polen Funds’ investments on the one hand, and the investments of other accounts, on the other. The Trustees reviewed the services provided to the Polen Funds by Polen and concluded that the nature, extent and quality of the services provided were appropriate and consistent with the terms of the Agreements, that the quality of the proposed services appeared to be consistent with industry norms and that the Polen Funds are likely to benefit from the continued provision of those services. They also concluded that Polen has sufficient personnel, with the appropriate education and experience, to serve the Polen Funds effectively and had demonstrated their ability to attract and retain qualified personnel.
45
POLEN GROWTH FUNDS
Other Information (Concluded)
(Unaudited)
Cost of Services. The Trustees considered the costs of the services provided by Polen, the compensation and benefits received by, or to be received by, Polen in providing services to the Polen Funds, as well as Polen’s profitability. The Trustees were provided with the audited financial statements of Polen for the years ended December 31, 2016 and December 31, 2015. The Trustees noted that Polen’s level of profitability is an appropriate factor to consider, and the Trustees should be satisfied that Polen’s profits are sufficient to continue as a healthy concern generally and as investment adviser of the Polen Funds specifically. The Trustees concluded that Polen’s fees derived from their relationship with the Trust, in light of the Polen Funds’ expenses, were reasonable in relation to the nature and quality of the services provided, taking into account the fees charged by other advisers for managing comparable mutual funds with similar strategies. The Trustees also concluded that the overall expense ratios of the Polen Funds were reasonable, taking into account the projected growth and size of the Fund and the quality of services provided by Polen.
Economies of Scale. The Trustees considered the extent to which economies of scale would be realized relative to fee levels as the Polen Funds grow or are expected to grow, and whether the advisory fee levels reflect these economies of scale for the benefit of shareholders. The Board noted that economies of scale may be achieved at higher asset levels for the Polen Funds for the benefit of fund shareholders but that, despite the existence of separate share classes, the advisory fee did not currently include breakpoint reductions as asset levels increase.
At the Meeting, the Trustees unanimously approved the Existing Agreement for an additional one year period and the New Agreement for an initial two year period. In voting to approve the New Agreement and the continuation of the Existing Agreement, the Board considered all factors it deemed relevant and the information presented to the Board by Polen. In arriving at its decision, the Board did not identify any single factor as being of paramount importance and each member of the Board gave varying weights to each factor according to his or her own judgment. The Board determined that the continuation of the Agreement and New Agreement would be in the best interests of the Polen Funds and their shareholders.
46
[THIS PAGE INTENTIONALLY LEFT BLANK.]
Investment Adviser
Polen Capital Management, LLC
1825 NW Corporate Blvd.
Suite 300
Boca Raton, FL 33431
Administrator
BNY Mellon Investment Servicing (US) Inc.
301 Bellevue Parkway
Wilmington, DE 19809
Transfer Agent
BNY Mellon Investment Servicing (US) Inc.
4400 Computer Drive
Westborough, MA 01581
Principal Underwriter
Foreside Funds Distributors LLC
400 Berwyn Park
899 Cassatt Road
Berwyn, PA 19312
Custodian
The Bank of New York Mellon
225 Liberty Street
New York, NY 10286
Independent Registered Public Accounting Firm
PricewaterhouseCoopers LLP
Two Commerce Square, Suite 1800
2001 Market Street
Philadelphia, PA 19103-7042
Legal Counsel
Pepper Hamilton LLP
3000 Two Logan Square
18th and Arch Streets
Philadelphia, PA 19103

Polen Growth Fund
Polen Global Growth
Fund
Polen International
Growth Fund
of
FundVantage Trust
Institutional Class
Investor Class
SEMI-ANNUAL
REPORT
October 31, 2017
(Unaudited)
This report is submitted for the general information of the shareholders of the Polen Growth Fund, the Polen Global Growth Fund and the Polen International Growth Fund. It is not authorized for distribution unless preceded or accompanied by a current prospectus for the Polen Growth Fund, the Polen Global Growth Fund and the Polen International Growth Fund.
POL-1017
PRIVATE CAPITAL MANAGEMENT VALUE FUND
Semi-Annual Investment Adviser’s Report
October 31, 2017
(Unaudited)
Dear Fellow Shareholder:
U.S. equity markets have continued to climb at a brisk pace over the past six months. Over this period, the Private Capital Management Value Fund Class I shares (the “Fund”) returned 5.65%, compared to the S&P 500 Index’s 9.10% and the small-cap Russell 2000 Index’s advance of 8.01%. After returning 21.50% for the twelve months prior to the period covered by this report, and the severe underperformance of value stocks in 2017 compared to growth stocks, we are not overly surprised that the Fund produced a more moderate return over the past six months.
Throughout 2017 the Fund has been holding above-average levels of cash, as the investment team has trimmed and/or exited appreciated positions faster than we have redeployed capital. Without benefit of a “crystal ball”, we see a comparatively expensive market that has resolutely continued to ignore a number of objectively concerning developments - from malfunctions within the Trump administration and escalating saber rattling by and with North Korea, to tightening labor markets and erratic economic indicators. We can quantify mathematically that the broad market valuation levels appear to be statistically expensive versus historical parameters. However, because we do not “own” the overall market, its broad valuation level in-and-of-itself does not inform any specific action for the Fund’s portfolio.
At the start of each day, the research team’s first objective is to ensure that we are on top of both internal and external developments that influence the economic opportunity and fundamental outlook of the investments held in the Fund’s portfolio. This process is necessarily recursive; our focus centers on the factors that drive or impede value creation for each company. This process requires that we adjust our valuation parameters and then decide whether to add to or reduce allocation levels. As long-term value investors, we often find ourselves within a zone of investment “stasis” – call it the valuation range between a company trading at 65% to 85% of our fair value estimate. These investments still offer compelling upside, but are not quite trading to a level where we are motivated to buy more. Within this framework, market volatility is often welcome because it can drive wide swaths of the portfolio to price points where we can accelerate our pace of cash deployment.
What has slowed our redeployment efforts in 2017 is the market’s steady upward climb, which has resulted in much of our research pipeline being priced modestly above the level that we consider ideal to initiate new positions. As such, we remain reluctant to compromise on the price we pay for new positions. To make all of this discussion less abstract, a little more math is in order.
We typically look to acquire good companies, with understandable businesses and relatively predictable cash flows, for somewhere between seven times and ten times free cash flow, a measure of cash flow that deducts anticipated maintenance capital expenditures, which equates to a double-digit cash-on-cash yield. This is the proverbial “gold in the street” that may require significant analytical digging, but is nevertheless available to the diligent investor. From our perspective, for an investor looking to double his investment over a five year window, a seven multiple to free cash flow is pretty close to nirvana because it corresponds
1
PRIVATE CAPITAL MANAGEMENT VALUE FUND
Semi-Annual Investment Adviser’s Report (Continued)
October 31, 2017
(Unaudited)
to the business producing after-tax cash that is roughly equivalent to its current market capitalization over the same time period. Mathematically this should result in a doubling of the stock price (and often more) if management does a reasonable job of capital allocation.
Admittedly seven multiples to free cash flow businesses have always been relatively scarce, and are more often than not associated with businesses that are cyclical or otherwise under duress. But complexity is the friend of a diligent investor, and we have been able to find such cash flow streams – within the maintenance stream of a software company – the portfolio of an aircraft leasing company – or the net present value of a committed client fee stream for a private equity firm – so forth and so on.
Our challenge today is that with the broad market trading somewhere between fifteen times and twenty times free cash flow (equivalent to a 5% to 7% cash-on-cash yield) the rising valuation tide has lifted most boats, leaving new ideas that meet our criteria more scarce than we would like. An extended period of steady economic growth and low interest rates has buoyed investor confidence (seen through the prism of minimal volatility).
Furthermore, central banks worldwide have shown a willingness (even a determination) to intervene to support the bull market at the first whiff of distress. It seems perfectly rational for investors faced with an after-tax risk-free rate of 1.0% to view equities as very attractive at current multiples as long as current circumstances persist.
However, the collective wisdom of knowledgeable investors is not always prudent. Back in 2009, many “rational” investors abandoned equities because the financial crisis destroyed confidence and they could not stomach the market’s volatility. It was a perfectly rational choice; it was also a terrible investment decision. The error was one of timing; by the time confidence recovered, so had the price of equities. Today investors are very sanguine. Given the still yawning gap between the risk-free return on cash and current market multiples, we see no mathematical reason why the market cannot continue to trade at these levels (or move still higher) in tandem with corporate earnings growth. That is why pundits attempting to call a market top are simply guessing.
So – to again be perfectly clear – we are not calling a market top, just recognizing that our process will be empirically driven and the Fund’s capital will not be blindly forced into the market. We believe that for a value strategy to deliver on its objective it must be built on securities acquired at a meaningful discount to intrinsic value. As always, we are committed to remaining focused on exactly that task.
We appreciate your continued support.
Private Capital Management
2
PRIVATE CAPITAL MANAGEMENT VALUE FUND
Semi-Annual Investment Adviser’s Report (Concluded)
October 31, 2017
(Unaudited)
Mutual fund investing involves risk and it is possible to lose money by investing in a fund. The Fund is non-diversified and may invest a larger portion of its assets in the securities of a single issuer than a more diversified fund causing its value to fluctuate more widely. The Fund may engage in strategies that are considered risky or invest in stocks of companies that are undervalued which may cause greater volatility and less liquidity. The above commentary is for informational purposes only and investors should consider the investment objectives, risks, charges, and expenses of the Fund carefully before investing. This report is not authorized for distribution unless preceded or accompanied by a current prospectus for the Private Capital Management Value Fund. The prospectus contains this and other important information about the Fund. Read it carefully before investing.
Shares of the Private Capital Management Value Fund are distributed by Foreside Funds Distributors LLC, not an adviser affiliate. |
This letter is intended to assist shareholders in understanding how the Fund performed during the six months ended October 31, 2017 and reflects the views of the investment adviser at the time of this writing. Of course, these views may change and do not guarantee the future performance of the Fund or the markets.
Portfolio composition is subject to change. The current and future portfolio holdings of the Fund are subject to investment risks.
3
PRIVATE CAPITAL MANAGEMENT VALUE FUND
Semi-Annual Investment Adviser’s Report
Performance Data
October 31, 2017
(Unaudited)
| Average Annual Total Returns for the Periods Ended October 31, 2017 | |||||||||||||||||||||||||||
| Six Months† | 1 Year | 3 Years | 5 Years | 10 Years | |||||||||||||||||||||||
Class A (with sales charge)* | 0.23 | % | 23.05 | % | 4.07 | % | 11.74 | % | 4.53 | % | |||||||||||||||||
Class A (without sales charge) | 5.54 | % | 29.50 | % | 5.86 | % | 12.90 | % | 4.53 | % | |||||||||||||||||
S&P 500® Index* | 9.10 | % | 23.63 | % | 10.77 | % | 15.18 | % | 7.51 | % | |||||||||||||||||
Russell 2000® Index | 8.01 | % | 27.85 | % | 10.12 | % | 14.49 | % | 7.63 | % | |||||||||||||||||
† Not Annualized.
*On May 28, 2010, a corporate defined contribution plan account (the “Predecessor Account”) was converted into Class I shares of the Fund. Performance shown for the periods prior to May 28, 2010, is the performance of the Class I shares and represents the performance of the Predecessor Account adjusted to reflect the fees and expenses applicable to Class I shares on May 28, 2010. Performance shown prior to May 28, 2010, has not been adjusted to reflect the fees and expenses of Class A shares. Performance shown for Class A shares for the period from May 28, 2010 to October 6, 2010 (commencement of operations of Class A shares) is the performance of Class I shares adjusted to reflect the fees and expenses applicable to Class A shares. If the Predecessor Account performance was adjusted to reflect the fees and expenses of Class A shares the performance shown would be lower. The Predecessor Account was not registered as a mutual fund under the Investment Company Act of 1940, as amended (“1940 Act”), and therefore was not subject to certain investment restrictions, limitations and diversification requirements imposed by the 1940 Act and Internal Revenue Code of 1986, as amended. If the Predecessor Account had been registered under the 1940 Act its performance may have been different.
Class A shares of the Fund have a 5.00% maximum sales charge.
The performance data quoted represents past performance and does not guarantee future results. Current performance may be lower or higher. Performance data current to the most recent month-end may be obtained by calling (888) 568-1267. The investment return and principal value of an investment will fluctuate so that shares, when redeemed, may be worth more or less than their original cost. The table does not reflect the deduction of taxes that a shareholder would pay on Fund distributions or the redemption of Fund shares.
Class A shares “Total Annual Fund Operating Expenses” and “Total Fund Operating Expenses After Fee and Waivers and/or Expense Reimbursement” are 1.59% and 1.35%, respectively, of the Fund’s average daily net assets. These ratios are stated in the current prospectus dated September 1, 2017, and may differ from the actual expenses incurred by the Fund for the period covered by this report. Private Capital Management, LLC (the “Adviser”), has contractually agreed to reduce its investment advisory fee and/or reimburse certain expenses of the Fund to the extent necessary to ensure that the Fund’s total operating expenses excluding taxes, any class-specific fees and expenses (such as Rule 12b-1 distribution fees, shareholder service fees, or transfer agency fees), “Acquired Fund Fees and Expenses,” interest, extraordinary items and brokerage commissions do not exceed 1.10% (on an annual basis) of the Fund’s average daily net assets (the “Expense Limitation”). The Expense Limitation will remain in place until August 31, 2018, unless the Board of Trustees (“Board of Trustees”) of FundVantage Trust (the “Trust”) approves its early termination. Prior to August 31, 2017, the Fund’s Expense Limitation was 1.00%. The Adviser is entitled to recover, subject to approval by the Board of Trustees, such amounts reduced or reimbursed for a period of up to three (3) years from the date on which the Adviser reduced its compensation and/or assumed expenses for the Fund. The Adviser is permitted to seek reimbursement from the Fund, subject to certain limitations, for fees it waived and Fund expenses
4
PRIVATE CAPITAL MANAGEMENT VALUE FUND
Semi-Annual Investment Adviser’s Report
Performance Data (Continued)
October 31, 2017
(Unaudited)
it paid to the extent the total annual Fund expenses do not exceed the limits described above or any lesser limits in effect at the time of reimbursement. No recoupment will occur unless the Fund’s expenses are below the Expense Limitation amount. Total returns would be lower had such fees and expenses not been waived and/or reimbursed.
A 2.00% redemption fee applies to shares redeemed within 30 days of purchase. This redemption fee is not reflected in the returns shown above.
The Fund intends to evaluate performance as compared to that of Standard & Poor’s 500® Composite Stock Price Index (“S&P 500® Index”) and the Russell 2000® Index. The S&P 500® Index is a widely recognized, unmanaged index of 500 common stocks which are generally representative of the U.S. stock market as a whole. The Russell 2000® Index is an unmanaged index measuring the performance of the 2,000 smallest companies in the Russell 3000® Index, which is made up of 3,000 of the biggest U.S. stocks. It is impossible to invest directly in an index.
5
PRIVATE CAPITAL MANAGEMENT VALUE FUND
Semi-Annual Investment Adviser’s Report
Performance Data (Continued)
October 31, 2017
(Unaudited)
| Average Annual Total Returns for the Periods Ended October 31, 2017 | |||||||||||||||||||||||||||
| Six Months† | 1 Year | 3 Years | 5 Years | 10 Years | |||||||||||||||||||||||
Class I* | 5.65 | % | 29.77 | % | 6.13 | % | 13.18 | % | 4.72 | % | |||||||||||||||||
S&P 500® Index | 9.10 | % | 23.63 | % | 10.77 | % | 15.18 | % | 7.51 | % | |||||||||||||||||
Russell 2000® Index | 8.01 | % | 27.85 | % | 10.12 | % | 14.49 | % | 7.63 | % | |||||||||||||||||
| † | Not Annualized. |
| * | Performance shown for the period from October 31, 2007 to May 28, 2010 is the performance of a corporate defined contribution plan account (the “Predecessor Account”), which transferred its assets to the Fund in connection with the Fund’s commencement of operations on May 28, 2010. Performance from May 28, 2010 to October 31, 2017 is from the performance of the Class I Shares. The Predecessor Account was not registered as a mutual fund under the Investment Company Act of 1940, as amended (the “1940 Act”), and therefore was not subject to certain investment restrictions, limitations and diversification requirements imposed by the 1940 Act and the Internal Revenue Code of 1986, as amended. If the Predecessor Account had been registered under the 1940 Act, its performance may have been different. |
The performance data quoted represents past performance and does not guarantee future results. Current performance may be lower or higher. Performance data current to the most recent month-end may be obtained by calling (888) 568-1267. The investment return and principal value of an investment will fluctuate so that shares, when redeemed, may be worth more or less than their original cost. The table does not reflect the deduction of taxes that a shareholder would pay on Fund distributions or the redemption of Fund shares.
Class I shares “Total Annual Fund Operating Expenses” and “Total Fund Operating Expenses After Fee and Waivers and/or Expense Reimbursement”are 1.34% and 1.10%, respectively, of the Fund’s average daily net assets. These ratios are stated in the current prospectus dated September 1, 2017, and may differ from the actual expenses incurred by the Fund for the period covered by this report. Private Capital Management, LLC (the “Adviser”), has contractually agreed to reduce its investment advisory fee and/or reimburse certain expenses of the Fund to the extent necessary to ensure that the Fund’s total operating expenses excluding taxes, any class-specific fees and expenses (such as Rule 12b-1 distribution fees, shareholder service fees, or transfer agency fees), “Acquired Fund Fees and Expenses,” interest, extraordinary items and brokerage commissions) do not exceed 1.10% (on an annual basis) of the Fund’s average daily net assets (the “Expense Limitation”). The Expense Limitation will remain in place until August 31, 2018, unless the Board of Trustees approves its early termination. Prior to August 31, 2017, the Fund’s Expense Limitation was 1.00%. The Adviser is entitled to recover, subject to approval by the Board of Trustees, such amounts reduced or reimbursed for a period of up to three (3) years from the date on which the Adviser reduced its compensation and/or assumed expenses for the Fund. The Adviser is permitted to seek reimbursement from the Fund, subject to certain limitations, for fees it waived and Fund expenses it paid to the extent the total annual Fund expenses do not exceed the limits described above or any lesser limits in effect at the time of reimbursement. No recoupment will occur unless the Fund’s expenses are below the Expense Limitation amount. Total return would be lower had such fees and expenses not been waived and/or reimbursed.
A 2.00% redemption fee applies to shares redeemed within 30 days of purchase. This redemption fee is not reflected in the returns shown above.
6
PRIVATE CAPITAL MANAGEMENT VALUE FUND
Semi-Annual Investment Adviser’s Report
Performance Data (Concluded)
October 31, 2017
(Unaudited)
The Fund intends to evaluate performance as compared to that of Standard & Poor’s 500® Composite Stock Price Index (“S&P 500® Index”) and the Russell 2000® Index. The S&P 500® Index is a widely recognized, unmanaged index of 500 common stocks which are generally representative of the U.S. stock market as a whole. The Russell 2000® Index is an unmanaged index measuring the performance of the 2,000 smallest companies in the Russell 3000® Index, which is made up of 3,000 of the biggest U.S. stocks. It is impossible to invest directly in an index.
7
PRIVATE CAPITAL MANAGEMENT VALUE FUND
Fund Expense Disclosure
October 31, 2017
(Unaudited)
As a shareholder of the Fund you incur two types of costs: (1) transaction costs, including sales charges (loads) on purchase payments, if any, and redemption fees; and (2) ongoing costs, including management fees, distribution and/or service (Rule 12b-1) fees, if any, and other Fund expenses. These examples are intended to help you understand your ongoing costs (in dollars) of investing in the Fund and to compare these costs with the ongoing costs of investing in other mutual funds.
These examples are based on an investment of $1,000 invested at the beginning of the six-month period from May 1, 2017, through October 31, 2017 and held for the entire period.
Actual Expenses
The first line of the accompanying table provides information about actual account values and actual expenses. You may use the information in this line, together with the amount you invested, to estimate the expenses that you paid over the period. Simply divide your account value by $1,000 (for example, an $8,600 account value divided by $1,000 = 8.6), then multiply the result by the number in the first line under the heading entitled “Expenses Paid During Period” to estimate the expenses you paid on your account during this period.
Hypothetical Examples for Comparison Purposes
The second line of the accompanying table provides information about hypothetical account values and hypothetical expenses based on the Fund’s actual expense ratio and an assumed rate of return of 5% per year before expenses, which is not your Fund’s actual return. The hypothetical account values and expenses may not be used to estimate the actual ending account balance or expenses you paid for the period. You may use this information to compare the ongoing costs of investing in the Fund and other funds. To do so, compare these 5% hypothetical examples with the 5% hypothetical examples that appear in the shareholder reports of other funds.
Please note that the expenses shown in the accompanying table are meant to highlight your ongoing costs only and do not reflect any transactional costs, such as sales charges (loads), if any, and redemption fees. Therefore, each hypothetical line of the accompanying table is useful in comparing ongoing costs only and will not help you determine the relative total costs of owning different funds. In addition, if these transactional costs were included, your costs would have been higher.
8
PRIVATE CAPITAL MANAGEMENT VALUE FUND
Fund Expense Disclosure (Concluded)
October 31, 2017
(Unaudited)
| Private Capital Management Value Fund | |||||||||||||||
Beginning Account Value | Ending Account Value October 31, 2017 | Expenses Paid During Period* | |||||||||||||
Class A | |||||||||||||||
Actual | $1,000.00 | $1,055.40 | $6.63 | ||||||||||||
Hypothetical (5% return before expenses) | 1,000.00 | 1,018.75 | 6.51 | ||||||||||||
Class I | |||||||||||||||
Actual | $1,000.00 | $1,056.50 | $5.35 | ||||||||||||
Hypothetical (5% return before expenses) | 1,000.00 | 1,020.01 | 5.24 | ||||||||||||
| * | Expenses are equal to an annualized expenses ratio for the six-month period ended October 31, 2017 of 1.28% and 1.03% for Class A and Class I shares, respectively, for the Fund, multiplied by the average account value over the period, multiplied by the number of days in the most recent period (184), then divided by 365 to reflect the period. The Fund’s ending account values on the first line in each table are based on the actual six-month total return for the Fund of 5.54% and 5.65% for Class A and Class I shares, respectively. |
9
PRIVATE CAPITAL MANAGEMENT VALUE FUND
Portfolio Holdings Summary Table
October 31, 2017
(Unaudited)
The following table presents a summary by sector of the portfolio holdings of the Fund:
| % of Net Assets | Value | |||||||
COMMON STOCKS: | ||||||||
Financials | 26.4 | % | $ | 20,074,715 | ||||
Consumer Discretionary | 18.6 | 14,142,502 | ||||||
Materials | 10.6 | 8,026,055 | ||||||
Information Technology | 10.4 | 7,922,477 | ||||||
Health Care | 7.4 | 5,608,095 | ||||||
Industrials | 6.8 | 5,204,009 | ||||||
Utilities | 3.5 | 2,685,683 | ||||||
Consumer Staples | 3.0 | 2,276,250 | ||||||
Energy | 0.6 | 450,386 | ||||||
U.S. Treasury Obligations | 9.8 | 7,414,872 | ||||||
Options Written | (0.5 | ) | (391,950 | ) | ||||
Other Assets in Excess of Liabilities (excluding written options) | 3.4 | 2,632,016 | ||||||
|
|
|
| |||||
NET ASSETS | 100.0 | % | $ | 76,045,110 | ||||
|
|
|
| |||||
Portfolio holdings are subject to change at any time.
The accompanying notes are an integral part of the financial statements.
10
PRIVATE CAPITAL MANAGEMENT VALUE FUND
Portfolio of Investments
October 31, 2017
(Unaudited)
| Number of Shares | Value | |||||||
COMMON STOCKS — 87.3% |
| |||||||
Consumer Discretionary — 18.6% |
| |||||||
Carrols Restaurant Group, Inc.* | 184,300 | $ | 2,073,375 | |||||
Fiesta Restaurant Group, Inc.* | 106,360 | 1,760,258 | ||||||
Fogo De Chao, Inc.* | 129,585 | 1,431,914 | ||||||
Gildan Activewear, Inc. (Canada) | 61,850 | 1,892,610 | ||||||
Stoneridge, Inc.* | 125,717 | 2,858,805 | ||||||
Vista Outdoor, Inc.* | 8,270 | 172,926 | ||||||
Visteon Corp.* | 31,360 | 3,952,614 | ||||||
|
| |||||||
| 14,142,502 | ||||||||
|
| |||||||
Consumer Staples — 3.0% | ||||||||
SpartanNash Co. | 92,719 | 2,276,250 | ||||||
|
| |||||||
Energy — 0.6% | ||||||||
Golar LNG, Ltd. (Bermuda) | 21,315 | 450,386 | ||||||
|
| |||||||
Financials — 26.4% | ||||||||
Charter Financial Corp. | 90,461 | 1,734,137 | ||||||
INTL FCstone, Inc.* | 61,986 | 2,573,039 | ||||||
KKR & Co. LP | 196,620 | 3,942,231 | ||||||
Northrim BanCorp, Inc. | 26,200 | 851,500 | ||||||
OceanFirst Financial Corp. | 41,560 | 1,153,290 | ||||||
Old National Bancorp | 42,560 | 774,592 | ||||||
Oppenheimer Holdings, Inc., Class A | 86,434 | 1,879,940 | ||||||
People’s United Financial, Inc. | 30,972 | 577,938 | ||||||
Raymond James Financial, Inc. | 32,600 | 2,763,828 | ||||||
State Bank Financial Corp. | 49,600 | 1,433,936 | ||||||
Synovus Financial Corp. | 37,014 | 1,734,106 | ||||||
Valley National Bancorp | 57,059 | 656,178 | ||||||
|
| |||||||
| 20,074,715 | ||||||||
|
| |||||||
| Number of Shares | Value | |||||||
COMMON STOCKS — (Continued) |
| |||||||
Health Care — 7.4% | ||||||||
Allergan PLC (Ireland) | 15,927 | $ | 2,822,742 | |||||
Universal Health Services, Inc., Class B | 11,750 | 1,206,725 | ||||||
Zimmer Holdings, Inc. | 12,980 | 1,578,628 | ||||||
|
| |||||||
| 5,608,095 | ||||||||
|
| |||||||
Industrials — 6.8% | ||||||||
Air Transport Services Group, Inc.* | 110,900 | 2,683,780 | ||||||
Caesarstone Ltd. (Israel)* | 25,790 | 729,857 | ||||||
DIRTT Environmental Solutions (Canada)* | 365,300 | 1,790,372 | ||||||
|
| |||||||
| 5,204,009 | ||||||||
|
| |||||||
Information Technology — 10.4% |
| |||||||
Avid Technology, Inc.* | 88,500 | 392,940 | ||||||
Everi Holdings, Inc.* | 350,271 | 2,903,747 | ||||||
Quantum Corp.*(a) | 162,884 | 863,285 | ||||||
QuinStreet, Inc.* | 295,112 | 2,626,497 | ||||||
VASCO Data Security International, Inc.* | 83,530 | 1,136,008 | ||||||
|
| |||||||
| 7,922,477 | ||||||||
|
| |||||||
Materials — 10.6% | ||||||||
Celanese Corp., Class A | 13,970 | 1,457,211 | ||||||
Pope Resources LP | 10,600 | 744,650 | ||||||
Tronox Ltd., Class A (Australia) | 220,030 | 5,824,194 | ||||||
|
| |||||||
| 8,026,055 | ||||||||
|
| |||||||
Utilities — 3.5% | ||||||||
National Fuel Gas Co. | 46,265 | 2,685,683 | ||||||
|
| |||||||
TOTAL COMMON STOCKS |
| 66,390,172 | ||||||
|
| |||||||
The accompanying notes are an integral part of the financial statements.
11
PRIVATE CAPITAL MANAGEMENT VALUE FUND
Portfolio of Investments (Concluded)
October 31, 2017
(Unaudited)
| Par Value | Value | |||||||
U.S. TREASURY OBLIGATIONS — 9.8% |
| |||||||
United States Treasury Bill, 1.00%, 12/21/17(b) | $ | 1,600,000 | $ | 1,597,778 | ||||
United States Treasury Bill, 1.02%, 11/09/17(b) | $ | 2,225,000 | 2,224,496 | |||||
United States Treasury Bill, 1.05%, 01/11/18(b) | $ | 3,600,000 | 3,592,598 | |||||
|
| |||||||
| 7,414,872 | ||||||||
|
| |||||||
TOTAL U.S. TREASURY OBLIGATIONS | 7,414,872 | |||||||
|
| |||||||
TOTAL INVESTMENTS - 97.1% |
| |||||||
(Cost $47,565,521) | 73,805,044 | |||||||
OTHER ASSETS IN EXCESS OF LIABILITIES - 2.9% | 2,240,066 | |||||||
|
| |||||||
NET ASSETS - 100.0% | $ | 76,045,110 | ||||||
|
| |||||||
Contracts | Value | |||||||
OPTIONS WRITTEN — (0.5)% | ||||||||
Call Options — (0.5)% | ||||||||
Tronox Ltd. | (390 | ) | $ | (212,550 | ) | |||
Tronox Ltd. | (390 | ) | (179,400 | ) | ||||
|
| |||||||
| (391,950 | ) | |||||||
|
| |||||||
TOTAL OPTIONS WRITTEN (Premium $103,326) | $ | (391,950 | ) | |||||
|
| |||||||
| * | Non-income producing. |
| (a) | The Fund’s portfolio manager was a member of the company’s board of directors through August 9, 2017. The Advisor was subject to trading restrictions with respect to the company’s securities, including those shares held by the Fund, through November 9, 2017. At October 31, 2017, the value of securities subject to the limited discretionary trading was $863,285, which represents 1.1% of the Fund’s net assets. |
| (b) | Rate disclosed represents the yield-to-maturity as of October 31, 2017. |
CME | Chicago Mercantile Exchange | |
PLC | Public Limited Company |
The accompanying notes are an integral part of the financial statements.
272
PRIVATE CAPITAL MANAGEMENT VALUE FUND
Statement of Assets and Liabilities
October 31, 2017
(Unaudited)
Assets | ||||
Investments, at value (Cost $47,565,521) | $ | 73,805,044 | ||
Cash | 2,333,970 | |||
Receivable for investments sold | 470,140 | |||
Dividends and interest receivable | 12,089 | |||
Prepaid expenses and other assets | 37,743 | |||
|
| |||
Total assets | 76,658,986 | |||
|
| |||
Liabilities | ||||
Options written, at value (premiums received $103,326) | 391,950 | |||
Payable for capital shares redeemed | 84,484 | |||
Payable to Investment Adviser | 41,170 | |||
Payable for administration and accounting fees | 24,852 | |||
Payable for transfer agent fees | 19,543 | |||
Payable for printing fees | 14,957 | |||
Payable for audit fees | 13,563 | |||
Payable for legal fees | 12,640 | |||
Payable for custodian fees | 7,256 | |||
Payable for distribution fees | 1,352 | |||
Accrued expenses | 2,109 | |||
|
| |||
Total liabilities | 613,876 | |||
|
| |||
Net Assets | $ | 76,045,110 | ||
|
| |||
Net Assets consisted of: | ||||
Capital Stock, $0.01 par value | $ | 43,337 | ||
Paid-in capital | 49,610,046 | |||
Accumulated net investment loss | (61,329 | ) | ||
Accumulated net realized gain from investments | 502,157 | |||
Net unrealized appreciation on investments and written options | 25,950,899 | |||
|
| |||
Net Assets | $ | 76,045,110 | ||
|
| |||
Class A: | ||||||
Net asset value and redemption price per share ($6,342,696 / 365,671 shares) | $ | 17.35 | ||||
|
| |||||
Maximum offering price per share (100/95 of $17.35) | $ | 18.26 | ||||
|
| |||||
Class I: | ||||||
Net asset value, offering and redemption price per share ($69,702,414 / 3,968,055 shares) | $ | 17.57 | ||||
|
| |||||
The accompanying notes are an integral part of the financial statements.
13
PRIVATE CAPITAL MANAGEMENT VALUE FUND
Statement of Operations
For the Six Months Ended October 31, 2017
(Unaudited)
Investment income | ||||
Dividends | $ | 283,612 | ||
Less: foreign taxes withheld | (1,735 | ) | ||
Interest | 28,517 | |||
|
| |||
Total investment income | 310,394 | |||
|
| |||
Expenses | ||||
Advisory fees (Note 2) | 344,020 | |||
Transfer agent fees (Note 2) | 42,289 | |||
Administration and accounting fees (Note 2) | 33,325 | |||
Registration and filing fees | 21,455 | |||
Trustees’ and officers’ fees (Note 2) | 18,955 | |||
Legal fees | 18,173 | |||
Audit fees | 13,464 | |||
Printing and shareholder reporting fees | 13,176 | |||
Custodian fees (Note 2) | 8,496 | |||
Distribution fees (Class A) (Note 2) | 7,740 | |||
Other expenses | 9,957 | |||
|
| |||
Total expenses before waivers and reimbursements | 531,050 | |||
|
| |||
Less: waivers and reimbursements (Note 2) | (128,475 | ) | ||
|
| |||
Net expenses after waivers and reimbursements | 402,575 | |||
|
| |||
Net investment loss | (92,181 | ) | ||
|
| |||
Net realized and unrealized gain from investments: | ||||
Net realized gain from investments | 1,037,917 | |||
Net change in unrealized appreciation/(depreciation) on investments | 3,393,444 | |||
Net change in unrealized depreciation on written options | (288,624 | ) | ||
|
| |||
Net realized and unrealized gain on investments | 4,142,737 | |||
|
| |||
Net increase in net assets resulting from operations | $ | 4,050,556 | ||
|
|
The accompanying notes are an integral part of the financial statements.
14
PRIVATE CAPITAL MANAGEMENT VALUE FUND
Statements of Changes in Net Assets
| For the Six Months Ended October 31, 2017 (Unaudited) | For the Year Ended April 30, 2017 | |||||||||||||||||||
Increase in net assets from operations: | ||||||||||||||||||||
Net investment loss | $ | (92,181 | ) | $ | (1,199,989 | ) | ||||||||||||||
Net realized gain from investments | 1,037,917 | 1,773,224 | ||||||||||||||||||
Net change in unrealized appreciation/(depreciation) on investments and written options | 3,104,820 | 13,776,964 | ||||||||||||||||||
|
|
|
| |||||||||||||||||
Net increase in net assets resulting from operations | 4,050,556 | 14,350,199 | ||||||||||||||||||
|
|
|
| |||||||||||||||||
Less dividends and distributions to shareholders from: | ||||||||||||||||||||
Class A | — | (66,159 | ) | |||||||||||||||||
Class I | — | (957,395 | ) | |||||||||||||||||
|
|
|
| |||||||||||||||||
Total net investment income | — | (1,023,554 | ) | |||||||||||||||||
|
|
|
| |||||||||||||||||
Net realized capital gains: | ||||||||||||||||||||
Net decrease in net assets from dividends and distributions to shareholders | — | (1,023,554 | ) | |||||||||||||||||
|
|
|
| |||||||||||||||||
Decrease in net assets derived from capital share transactions (Note 4) | (5,241,512 | ) | (22,577,242 | ) | ||||||||||||||||
|
|
|
| |||||||||||||||||
Total decrease in net assets | (1,190,956 | ) | (9,250,597 | ) | ||||||||||||||||
|
|
|
| |||||||||||||||||
Net assets | ||||||||||||||||||||
Beginning of period | 77,236,066 | 86,486,663 | ||||||||||||||||||
|
|
|
| |||||||||||||||||
End of period | $ | 76,045,110 | $ | 77,236,066 | ||||||||||||||||
|
|
|
| |||||||||||||||||
Accumulated net investment income/(loss), end of period | $ | (61,329 | ) | $ | 30,852 | |||||||||||||||
|
|
|
| |||||||||||||||||
The accompanying notes are an integral part of the financial statements.
15
PRIVATE CAPITAL MANAGEMENT VALUE FUND
Financial Highlights
Contained below is per share operating performance data for Class A shares outstanding, total investment return, ratios to average net assets and other supplemental data for the respective period. The total returns in the table represent the rate that an investor would have earned or lost on an investment in the Fund (assuming reinvestment of all dividends and distributions). This information has been derived from information provided in the financial statements and should be read in conjunction with the financial statements and the notes thereto.
| Class A | ||||||||||||||||||||||||||||||
| For the Six Months Ended October 31, 2017 (Unaudited) | For the Year Ended April 30, 2017 | For the Year Ended April 30, 2016 | For the Year Ended April 30, 2015 | For the Year Ended April 30, 2014 | For the Year Ended April 30, 2013 | |||||||||||||||||||||||||
Per Share Operating Performance | ||||||||||||||||||||||||||||||
Net asset value, beginning of period | $ | 16.44 | $ | 13.72 | $ | 17.07 | $ | 15.16 | $ | 13.60 | $ | 12.12 | ||||||||||||||||||
|
|
|
|
|
|
|
|
|
|
|
| |||||||||||||||||||
Net investment income/(loss)(1) | (0.04 | ) | (0.26 | ) | 0.16 | (0.03 | ) | (0.02 | ) | 0.07 | ||||||||||||||||||||
Net realized and unrealized gain/(loss) on investments | 0.95 | 3.15 | (2.55 | ) | 2.88 | 2.45 | 1.48 | |||||||||||||||||||||||
|
|
|
|
|
|
|
|
|
|
|
| |||||||||||||||||||
Net increase/(decrease) in net assets resulting from operations | 0.91 | 2.89 | (2.39 | ) | 2.85 | 2.43 | 1.55 | |||||||||||||||||||||||
|
|
|
|
|
|
|
|
|
|
|
| |||||||||||||||||||
Dividends and distributions to shareholders from: | ||||||||||||||||||||||||||||||
Net investment income | — | (0.17 | ) | — | — | — | (0.07 | ) | ||||||||||||||||||||||
Net realized capital gains | — | — | (0.96 | ) | (0.94 | ) | (0.87 | ) | — | |||||||||||||||||||||
|
|
|
|
|
|
|
|
|
|
|
| |||||||||||||||||||
Total dividends and distributions to shareholders | — | (0.17 | ) | (0.96 | ) | (0.94 | ) | (0.87 | ) | (0.07 | ) | |||||||||||||||||||
|
|
|
|
|
|
|
|
|
|
|
| |||||||||||||||||||
Redemption fees | — | — | (2) | — | (2) | — | — | (2) | — | |||||||||||||||||||||
|
|
|
|
|
|
|
|
|
|
|
| |||||||||||||||||||
Net asset value, end of period | $ | 17.35 | $ | 16.44 | $ | 13.72 | $ | 17.07 | $ | 15.16 | $ | 13.60 | ||||||||||||||||||
|
|
|
|
|
|
|
|
|
|
|
| |||||||||||||||||||
Total investment return(3) | 5.54 | % | 21.18 | % | (14.00 | )% | 19.11 | % | 18.04 | % | 12.92 | % | ||||||||||||||||||
Ratios/Supplemental Data | ||||||||||||||||||||||||||||||
Net assets, end of period (in thousands) | $ | 6,343 | $ | 6,063 | $ | 7,408 | $ | 8,042 | $ | 7,643 | $ | 4,921 | ||||||||||||||||||
Ratio of expenses to average net assets | | 1.28 | %(4) | 1.25 | % | 1.25 | % | 1.25 | % | 1.25 | % | 1.25 | % | |||||||||||||||||
Ratio of expenses to average net assets without waivers and expense reimbursements(5) | | 1.62 | %(4) | 1.59 | % | 1.54 | % | 1.69 | % | 1.74 | % | 1.88 | % | |||||||||||||||||
Ratio of net investment income/(loss) to average net assets | (0.47 | )%(4) | (1.78 | )% | 1.06 | % | (0.20 | )% | (0.15 | )% | 0.62 | % | ||||||||||||||||||
Portfolio turnover rate | | 8.52 | %(6) | 11.15 | % | 14.20 | % | 31.11 | % | 19.69 | % | 11.81 | % | |||||||||||||||||
| (1) | The selected per share data was calculated using the average shares outstanding method for the period. |
| (2) | Amount is less than $0.005 per share. |
| (3) | Total investment return is calculated assuming a purchase of shares on the first day and a sale of shares on the last day of each period reported and includes reinvestment of dividends and distributions, if any. Total return for periods less than one year are not annualized. Total investment return does not reflect the impact of the maximum front-end sales load of 5.00%. If reflected, the return would be lower. |
| (4) | Annualized. |
| (5) | During the period, certain fees were waived. If such fee waivers had not occurred, the ratios would have been as indicated (See Note 2). |
| (6) | Not annualized. |
The accompanying notes are an integral part of the financial statements.
16
PRIVATE CAPITAL MANAGEMENT VALUE FUND
Financial Highlights
Contained below is per share operating performance data for Class I shares outstanding, total investment return, ratios to average net assets and other supplemental data for the respective period. The total returns in the table represent the rate that an investor would have earned or lost on an investment in the Fund (assuming reinvestment of all dividends and distributions). This information has been derived from information provided in the financial statements and should be read in conjunction with the financial statements and the notes thereto.
| Class I | ||||||||||||||||||||||||||||||
| For the Six Months Ended October 31, 2017 (Unaudited) | For the Year Ended April 30, 2017 | For the Year Ended April 30, 2016 | For the Year Ended April 30, 2015 | For the Year Ended April 30, 2014 | For the Year Ended April 30, 2013 | |||||||||||||||||||||||||
Per Share Operating Performance | ||||||||||||||||||||||||||||||
Net asset value, beginning of period | $ | 16.63 | $ | 13.88 | $ | 17.21 | $ | 15.24 | $ | 13.64 | $ | 12.15 | ||||||||||||||||||
|
|
|
|
|
|
|
|
|
|
|
| |||||||||||||||||||
Net investment income/(loss)(1) | (0.02 | ) | (0.22 | ) | 0.20 | 0.01 | 0.02 | 0.10 | ||||||||||||||||||||||
Net realized and unrealized gain/(loss) on investments | 0.96 | 3.19 | (2.57 | ) | 2.90 | 2.45 | 1.49 | |||||||||||||||||||||||
|
|
|
|
|
|
|
|
|
|
|
| |||||||||||||||||||
Net increase/(decrease) in net assets resulting from operations | 0.94 | 2.97 | (2.37 | ) | 2.91 | 2.47 | 1.59 | |||||||||||||||||||||||
|
|
|
|
|
|
|
|
|
|
|
| |||||||||||||||||||
Dividends and distributions to shareholders from: | ||||||||||||||||||||||||||||||
Net investment income | — | (0.22 | ) | — | — | — | (0.10 | ) | ||||||||||||||||||||||
Net realized capital gains | — | — | (0.96 | ) | (0.94 | ) | (0.87 | ) | — | |||||||||||||||||||||
|
|
|
|
|
|
|
|
|
|
|
| |||||||||||||||||||
Total dividends and distributions to shareholders | — | (0.22 | ) | (0.96 | ) | (0.94 | ) | (0.87 | ) | (0.10 | ) | |||||||||||||||||||
|
|
|
|
|
|
|
|
|
|
|
| |||||||||||||||||||
Redemption fees | — | — | (2) | — | (2) | — | — | (2) | — | |||||||||||||||||||||
|
|
|
|
|
|
|
|
|
|
|
| |||||||||||||||||||
Net asset value, end of period | $ | 17.57 | $ | 16.63 | $ | 13.88 | $ | 17.21 | $ | 15.24 | $ | 13.64 | ||||||||||||||||||
|
|
|
|
|
|
|
|
|
|
|
| |||||||||||||||||||
Total investment return(3) | 5.65 | % | 21.50 | % | (13.76 | )% | 19.41 | % | 18.29 | % | 13.21 | % | ||||||||||||||||||
Ratios/Supplemental Data | ||||||||||||||||||||||||||||||
Net assets, end of period (in thousands) | $ | 69,702 | $ | 71,173 | $ | 79,078 | $ | 63,069 | $ | 47,969 | $ | 40,765 | ||||||||||||||||||
Ratio of expenses to average net assets | 1.03 | %(4) | 1.00 | % | 1.00 | % | 1.00 | % | 1.00 | % | 1.00 | % | ||||||||||||||||||
Ratio of expenses to average net assets without waivers and expense reimbursements(5) | 1.37 | %(4) | 1.34 | % | 1.29 | % | 1.45 | % | 1.49 | % | 1.62 | % | ||||||||||||||||||
Ratio of net investment income/(loss) to average net assets | (0.22 | )%(4) | (1.53 | )% | 1.30 | % | 0.05 | % | 0.10 | % | 0.86 | % | ||||||||||||||||||
Portfolio turnover rate | 8.52 | %(6) | 11.15 | % | 14.20 | % | 31.11 | % | 19.69 | % | 11.81 | % | ||||||||||||||||||
| (1) | The selected per share data was calculated using the average shares outstanding method for the period. |
| (2) | Amount is less than $0.005 per share. |
| (3) | Total investment return is calculated assuming a purchase of shares on the first day and a sale of shares on the last day of each period reported and includes reinvestment of dividends and distributions, if any. Total return for periods less than one year are not annualized. |
| (4) | Annualized. |
| (5) | During the period, certain fees were waived. If such fee waivers had not occurred, the ratios would have been as indicated (See Note 2). |
| (6) | Not annualized. |
The accompanying notes are an integral part of the financial statements.
17
PRIVATE CAPITAL MANAGEMENT VALUE FUND
Notes to Financial Statements
October 31, 2017
(Unaudited)
1. Organization and Significant Accounting Policies
The Private Capital Management Value Fund (the “Fund”) is a non-diversified, open-end management investment company registered under the Investment Company Act of 1940, as amended, (the “1940 Act”), which commenced investment operations on May 28, 2010. The Fund is a separate series of FundVantage Trust (the “Trust”) which was organized as a Delaware statutory trust on August 28, 2006. The Trust is a “series trust” authorized to issue an unlimited number of separate series or classes of shares of beneficial interest. Each series is treated as a separate entity for certain matters under the 1940 Act, and for other purposes, and a shareholder of one series is not deemed to be a shareholder of any other series. The Fund offers separate classes of shares, Class A, Class C, Class I and Class R Shares. Class A Shares are sold subject to a front-end sales charge. Front-end sales charges may be reduced or waived under certain circumstances. A 1.00% contingent deferred sales charge (“CDSC”) will be assessed when Class C shares are redeemed within 12 months after initial purchase; however, the CDSC shall not apply to the purchases of Class C shares where the selling broker dealer was not paid a commission at the time of initial purchase. As of October 31, 2017, the Class C shares and the Class R shares have not yet started operations.
The Fund is an investment company and follows accounting and reporting guidance in the Financial Accounting Standards Board Accounting Standards Codification Topic 946.
Portfolio Valuation — The Fund’s net asset value (“NAV”) is calculated once daily as of the close of regular trading hours on the New York Stock Exchange (“NYSE”) (typically 4:00 p.m. Eastern time) on each day the NYSE is open. Securities held by the Fund are valued using the closing price or the last sale price on a national securities exchange or the National Association of Securities Dealers Automatic Quotation System (“NASDAQ”) market system where they are primarily traded. Equity securities traded in the over-the-counter market are valued at their closing prices. If there were no transactions on that day, securities traded principally on an exchange or on NASDAQ will be valued at the mean of the last bid and ask prices prior to the market close. Fixed income securities having a remaining maturity of greater than 60 days are valued using an independent pricing service. Fixed income securities having a remaining maturity of 60 days or less are generally valued at amortized cost, provided such amount approximates fair value. Foreign securities are valued based on prices from the primary market in which they are traded and are translated from the local currency into U.S. dollars using current exchange rates. Investments in other open-end investment companies are valued based on the NAV of the investment companies (which may use fair value pricing as discussed in their prospectuses). If market quotations are unavailable or deemed unreliable, securities will be valued in accordance with procedures adopted by the Trust’s Board of Trustees (“Board of Trustees”). Relying on prices supplied by pricing services or dealers or using fair valuation may result in values that are higher or lower than the values used by other investment companies and investors to price the same investments. In the event that market quotes are not readily available, and the security or asset cannot be valued pursuant to one of the valuation methods, the value
18
PRIVATE CAPITAL MANAGEMENT VALUE FUND
Notes to Financial Statements (Continued)
October 31, 2017
(Unaudited)
of the security or asset will be determined in good faith by the Adviser. The Trust has established a Valuation Committee which performs certain functions including the oversight of the Adviser’s fair valuation determinations.
Fair Value Measurements — The inputs and valuation techniques used to measure fair value of the Fund’s investments are summarized into three levels as described in the hierarchy below:
• Level 1 — | quoted prices in active markets for identical securities; | |
• Level 2 — | other significant observable inputs (including quoted prices for similar securities, interest rates, prepayment speeds, credit risk, etc.); and | |
• Level 3 — | significant unobservable inputs (including the Fund’s own assumptions in determining the fair value of investments). | |
The inputs or methodology used for valuing securities are not necessarily an indication of the risk associated with investing in those securities.
The following is a summary of the inputs used, as of October 31, 2017, in valuing the Fund’s investments carried at fair value:
| Total Value at 10/31/17 | Level 1 Quoted Price | Level 2 Other Significant Observable Inputs | Level 3 Significant Unobservable Inputs | |||||||||||||
Assets: | ||||||||||||||||
Common Stocks* | $ | 66,390,172 | $ | 66,390,172 | $ | — | $ | — | ||||||||
U.S. Treasury Obligations | 7,414,872 | — | 7,414,872 | — | ||||||||||||
|
|
|
|
|
|
|
| |||||||||
Total Assets | $ | 73,805,044 | $ | 66,390,172 | $ | 7,414,872 | $ | — | ||||||||
|
|
|
|
|
|
|
| |||||||||
Liabilities: | ||||||||||||||||
Derivatives: | ||||||||||||||||
Equity Contracts | ||||||||||||||||
Written Options | $ | (391,950 | ) | $ | (391,950 | ) | $ | — | $ | — | ||||||
|
|
|
|
|
|
|
| |||||||||
Total Liabilities | $ | (391,950 | ) | $ | (391,950 | ) | $ | — | $ | — | ||||||
|
|
|
|
|
|
|
| |||||||||
* Please refer to Portfolio of Investments for further details on portfolio holdings.
At the end of each quarter, management evaluates the classification of Levels 1, 2 and 3 assets and liabilities. Various factors are considered, such as changes in liquidity from the prior reporting period; whether or not a broker is willing to execute at the quoted price; the depth and consistency of prices from third party pricing services; and the existence of contemporaneous, observable trades in the market.
19
PRIVATE CAPITAL MANAGEMENT VALUE FUND
Notes to Financial Statements (Continued)
October 31, 2017
(Unaudited)
Additionally, management evaluates the classification of Level 1 and Level 2 assets and liabilities on a quarterly basis for changes in listings or delistings on national exchanges.
Due to the inherent uncertainty of determining the fair value of investments that do not have a readily available market value, the fair value of the Fund’s investments may fluctuate from period to period. Additionally, the fair value of investments may differ significantly from the values that would have been used had a ready market existed for such investments and may differ materially from the values the Fund may ultimately realize. Further, such investments may be subject to legal and other restrictions on resale or otherwise less liquid than publicly traded securities.
For fair valuations using significant unobservable inputs, U.S. generally accepted accounting principles (“U.S. GAAP”) require the Fund to present a reconciliation of the beginning to ending balances for reported market values that presents changes attributable to total realized and unrealized gains or losses, purchase and sales, and transfers in and out of Level 3 during the period. Transfers in and out between Levels are based on values at the end of the period. U.S. GAAP also requires the Fund to disclose amounts and reasons for all transfers in and out of Level 1 and Level 2 fair value measurements. A reconciliation of Level 3 investments is presented only when the Fund had an amount of Level 3 investments at the end of the reporting period that was meaningful in relation to its net assets. The amounts and reasons for all transfers in and out of each Level within the three-tier hierarchy are disclosed when the Fund had an amount of total transfers during the reporting period that was meaningful in relation to its net assets as of the end of the reporting period.
For the six months ended October 31, 2017, there were no transfers between Levels 1, 2 and 3.
Disclosures About Derivative Instruments and Hedging Activities
The following tables provide quantitative disclosures about fair value amounts of, and gains and losses on, the Fund’s derivative instruments as of October 31, 2017.
The following table lists the fair values of the Fund’s derivative holdings as of October 31, 2017 grouped by contract type and risk exposure category.
| Derivative Type | Balance Sheet Location | Equity Contracts | Total | |||||||||
| Liability Derivatives | ||||||||||||
Written Options | Option written, at value | $ | (391,950 | ) | $ | (391,950 | ) | |||||
Total Value - Liabilities | $ | (391,950 | ) | $ | (391,950 | ) | ||||||
The following table lists the amounts of change in unrealized appreciation/(depreciation) included in net increase in net assets resulting from operations for the six months ended October 31, 2017, grouped by contract type and risk exposure.
20
PRIVATE CAPITAL MANAGEMENT VALUE FUND
Notes to Financial Statements (Continued)
October 31, 2017
(Unaudited)
| Derivative Type | Statement of Operations Location | Equity Contracts | Total | |||||||
| Change in appreciation/(depreciation) | ||||||||||
Written Options | Net change in unrealized depreciation on written options | $(288,624) | $(288,624) | |||||||
Total change in appreciation/(depreciation) | $(288,624) | $(288,624) | ||||||||
Use of Estimates — The preparation of financial statements in conformity with U.S. GAAP requires management to make estimates and assumptions that affect the amounts reported in the financial statements and accompanying notes at the date of the financial statements and the reported amounts of revenues and expenses during the period. Actual results could differ from those estimates and those differences could be material.
Investment Transactions, Investment Income and Expenses — Investment transactions are recorded on trade date for financial statement preparation purposes. Realized gains and losses on investments sold are recorded on the identified cost basis. Interest income is recorded on the accrual basis. Dividends are recorded on the ex-dividend date. Estimated components of distributions received from real estate investment trusts may be considered income, return of capital distributions or capital gain distributions. Return of capital distributions are recorded as a reduction of cost of the related investments. Distribution (12b-1) fees relating to a specific class are charged directly to that class. Fund level expenses common to all classes, investment income and realized and unrealized gains and losses on investments are generally allocated to each class based upon the relative daily net assets of each class. General expenses of the Trust are generally allocated to each fund in proportion to its relative daily net assets. Expenses directly attributable to a particular fund in the Trust are charged directly to that fund. The Fund’s investment income, expenses (other than class-specific expenses) and unrealized and realized gains and losses are allocated daily to each class of shares based upon the relative proportion of net assets of each class at the beginning of the day.
Dividends and Distributions to Shareholders — Dividends from net investment income and distributions from net realized capital gains, if any, are declared, recorded on ex-date and paid at least annually to shareholders. Income dividends and capital gain distributions are determined in accordance with U.S. federal income tax regulations, which may differ from U.S. GAAP. These differences may include the treatment of non-taxable dividends, expiring capital loss carryforwards and losses deferred due to wash sales and excise tax regulations. Permanent book and tax basis differences relating to shareholder distributions will result in reclassifications within the components of net assets.
U.S. Tax Status — No provision is made for U.S. income taxes as it is the Fund’s intention to continue to qualify for and elect the tax treatment applicable to regulated investment companies under Subchapter M of the Internal Revenue Code of 1986, as amended (“Internal Revenue Code”), and make the requisite distributions to its shareholders which will be sufficient to relieve it from U.S. income and excise taxes.
21
PRIVATE CAPITAL MANAGEMENT VALUE FUND
Notes to Financial Statements (Continued)
October 31, 2017
(Unaudited)
Other — In the normal course of business, the Fund may enter into contracts that provide general indemnifications. The Fund’s maximum exposure under these arrangements is dependent on claims that may be made against the Fund in the future, and therefore, cannot be estimated; however, based on experience, the risk of material loss for such claims is considered remote.
Currency Risk — The Fund invests in securities of foreign issuers, including American Depositary Receipts. These markets are subject to special risks associated with foreign investments not typically associated with investing in U.S. markets. Because the foreign securities in which the Fund may invest generally trade in currencies other than the U.S. dollar, changes in currency exchange rates will affect the Fund’s NAV, the value of dividends and interest earned and gains and losses realized on the sale of securities. Because the NAV for the Fund is determined on the basis of U.S. dollars, the Fund may lose money by investing in a foreign security if the local currency of a foreign market depreciates against the U.S. dollar, even if the local currency value of the Fund’s holdings goes up. Generally, a strong U.S. dollar relative to these other currencies will adversely affect the value of the Fund’s holdings in foreign securities.
Purchased Options — The Fund is subject to equity and other risk exposure in the normal course of pursuing its investment objectives. The Fund purchases option contracts. This transaction is used to hedge against the values of equities. The risk associated with purchasing an option is that the Fund pays a premium whether or not the option is exercised. Additionally, the Fund bears the risk of loss of premium and change in market value should the counterparty not perform under the contract. Put and call options are accounted for in the same manner as other securities owned. The cost of securities acquired through the exercise of call options is increased by the premiums paid. The proceeds from securities sold through the exercise of put options are decreased by the premiums paid. As of October 31, 2017, the Fund had no purchased options.
Written Options — The Fund is subject to equity and other risk exposure in the normal course of pursuing its investment objectives and may enter into written options to hedge the values of equities. Such options may relate to particular securities or domestic stock indices, and may or may not be listed on a domestic securities exchange or issued by the Options Clearing Corporation. An option contract is a commitment that gives the purchaser of the contract the right, but not the obligation, to buy or sell an underlying asset at a specific price on or before a specified future date. On the other hand, the writer of an option contract is obligated, upon the exercise of the option, to buy or sell an underlying asset at a specific price on or before a specified future date. The maximum risk of loss associated with writing put options is limited to the exercised fair value of the option contract. The maximum risk of loss associated with writing call options is potentially unlimited. The Fund also has the additional risk of being unable to enter into a closing transaction at an acceptable price if a liquid secondary market does not exist. The Fund also may write over-the-counter options where completing the obligation depends upon the credit standing of the other party. Option contracts also involve the risk that they may result in loss due to unanticipated developments in market conditions or other causes. Written options are initially recorded as liabilities to
22
PRIVATE CAPITAL MANAGEMENT VALUE FUND
Notes to Financial Statements (Continued)
October 31, 2017
(Unaudited)
the extent of premiums received and subsequently marked to market to reflect the current value of the option written. Gains or losses are realized when the option transaction expires or closes. When an option is exercised, the proceeds on sales for a written call option or the purchase cost for a written put option is adjusted by the amount of the premium received. Listed option contracts present minimal counterparty credit risk since they are exchange traded and the exchange’s clearinghouse, as counterparty to all exchange-traded options, guarantees the options against default. A Fund’s maximum risk of loss from counterparty credit risk related to OTC option contracts is limited to the premium paid. As of October 31, 2017, all of the Fund’s written options were exchange-traded options.
The Fund had transactions in options written during the six months ended October 31, 2017 as follows:
| Number of Contracts | Premium | |||||||||
Outstanding, April 30, 2017 | — | $ | — | |||||||
Call Options Written | 780 | 103,326 | ||||||||
Put Options Written | — | — | ||||||||
Call Options Closed | — | — | ||||||||
Put Options Closed | — | — | ||||||||
Put Options Expired | — | — | ||||||||
Put Options Exercised | — | — | ||||||||
|
|
|
| |||||||
Outstanding, October 31, 2017 | 780 | $ | 103,326 | |||||||
|
|
|
| |||||||
For the six months ended October 31, 2017, the Fund’s quarterly average volume of derivatives is as follows:
Written Options (Proceeds) |
$34,442 |
Recent Accounting Pronouncement — On August 1, 2017, the Fund implemented changes to amendments to Regulation S-X, issued by the Securities and Exchange Commission, which require standardized, enhanced disclosures, particularly related to derivatives, in investment company financial statements. Adoption of the amendments had no effect on the Fund’s net assets or results of operations.
2. Transactions with Related Parties and Other Service Providers
Private Capital Management, LLC (the “Adviser”) serves as the investment adviser to the Fund pursuant to an investment advisory agreement with the Trust (the “Advisory Agreement”). For its services, the Adviser is paid a monthly fee at the annual rate of 0.90% of the Fund’s average daily net assets. Effective August 31, 2017, the Adviser has contractually agreed to reduce its investment advisory fee and/or reimburse
23
PRIVATE CAPITAL MANAGEMENT VALUE FUND
Notes to Financial Statements (Continued)
October 31, 2017
(Unaudited)
certain expenses of the Fund to the extent necessary to ensure that the Fund’s total operating expenses excluding taxes, any class-specific fees and expenses (such as Rule 12b-1 distribution fees, shareholder service fees, or transfer agency fees), “Acquired Fund Fees and Expenses,” interest, extraordinary items and brokerage commissions do not exceed 1.10% (on an annual basis) of the Fund’s average daily net assets (the “Expense Limitation”). The Expense Limitation will remain in place until August 31, 2018, unless the Board of Trustees approves its earlier termination. Prior to August 31, 2017, the Fund’s Expense Limitation was 1.00%. The Adviser is entitled to recover, subject to approval by the Board of Trustees, such amounts reduced or reimbursed for a period of up to three (3) years from the date on which the Adviser reduced its compensation and/or assumed expenses for the Fund. The Adviser is permitted to seek reimbursement from the Fund, subject to certain limitations, for fees it waived and Fund expenses it paid to the extent the total annual Fund expenses do not exceed the limits described above or any lesser limits in effect at the time of reimbursement. No recoupment will occur unless the Fund’s expenses are below the Expense Limitation amount.
As of October 31, 2017, the amount of potential recovery was as follows:
| Expiration | ||||||||
| 4/30/2018 | 4/30/2019 | 4/30/2020 | 10/31/2020 | Total | ||||
$273,334 | $233,659 | $265,948 | $128,475 | $901,416 | ||||
For the six months ended October 31, 2017, the Adviser earned fees of $344,020, and waived fees of $128,475.
Other Service Providers
BNY Mellon Investment Servicing (US) Inc. (“BNY Mellon”) serves as administrator and transfer agent for the Fund. For providing administrative and accounting services, BNY Mellon is entitled to receive a monthly fee equal to an annual percentage rate of the Fund’s average daily net assets and is subject to certain minimum monthly fees. For providing transfer agency services, BNY Mellon is entitled to receive a monthly fee, subject to certain minimum, and out of pocket expenses.
The Bank of New York Mellon (the “Custodian”) provides certain custodial services to the Fund. The Custodian is entitled to receive a monthly fee, subject to certain minimum, and out of pocket expenses.
Foreside Funds Distributors LLC (the “Underwriter”) provides principal underwriting services to the Fund.
The Trust and the Underwriter are parties to an underwriting agreement. The Trust has adopted a distribution plan for Class A Shares in accordance with Rule 12b-1 under the 1940 Act. Pursuant to the Class A Shares plan, the Fund compensates the Underwriter for direct and indirect costs and expenses incurred in connection with advertising, marketing and other distribution services in an amount not to exceed 0.25% on an annualized basis of the average daily net assets of the Fund’s Class A Shares.
24
PRIVATE CAPITAL MANAGEMENT VALUE FUND
Notes to Financial Statements (Continued)
October 31, 2017
(Unaudited)
Trustees and Officers
The Trust is governed by its Board of Trustees. The Trustees receive compensation in the form of an annual retainer and per meeting fees for their services to the Trust. The remuneration paid to the Trustees by the Fund during the six months ended October 31, 2017 was $4,644. An employee of BNY Mellon serves as the Secretary of the Trust and is not compensated by the Fund or the Trust.
JW Fund Management LLC (“JWFM”) provides a Principal Executive Officer and Principal Financial Officer, respectively, to the Trust. JWFM is compensated for the services provided to the Trust.
Freeh Group International Solutions, LLC provides the Trust with a Chief Compliance Officer and an Anti-Money Laundering Officer.
3. Investment in Securities
For the six months ended October 31, 2017, aggregate purchases and sales of investment securities (excluding short-term investments) of the Fund were as follows:
| Purchases | Sales | |||||||
Investment Securities | $ | 5,431,168 | $ | 6,878,569 | ||||
25
PRIVATE CAPITAL MANAGEMENT VALUE FUND
Notes to Financial Statements (Continued)
October 31, 2017
(Unaudited)
4. Capital Share Transactions
For the six months ended October 31, 2017 and the year ended April 30, 2017, transactions in capital shares (authorized shares unlimited) were as follows:
| For the Six Months Ended October 31, 2017 (Unaudited) | For the Year Ended April 30, 2017 | |||||||||||||||
| Shares | Amount | Shares | Amount | |||||||||||||
Class A | ||||||||||||||||
Sales | 19,156 | $ | 313,745 | 45,530 | $ | 673,658 | ||||||||||
Reinvestments | — | — | 4,260 | 65,263 | ||||||||||||
Redemption Fees* | — | — | — | 269 | ||||||||||||
Redemptions | (22,201 | ) | (369,086 | ) | (220,946 | ) | (3,109,496 | ) | ||||||||
|
|
|
|
|
|
|
| |||||||||
Net decrease | (3,045 | ) | $ | (55,341 | ) | (171,156 | ) | $ | (2,370,306 | ) | ||||||
|
|
|
|
|
|
|
| |||||||||
Class I | ||||||||||||||||
Sales | 147,197 | $ | 2,459,314 | 763,486 | $ | 11,209,300 | ||||||||||
Reinvestments | — | — | 39,175 | 606,431 | ||||||||||||
Redemption Fees* | — | — | — | 25 | ||||||||||||
Redemptions | (458,198 | ) | (7,645,485 | ) | (2,219,939 | ) | (32,022,692 | ) | ||||||||
|
|
|
|
|
|
|
| |||||||||
Net decrease | (311,001 | ) | $ | (5,186,171 | ) | (1,417,278 | ) | $ | (20,206,936 | ) | ||||||
|
|
|
|
|
|
|
| |||||||||
Total Net Decrease | (314,046 | ) | $ | (5,241,512 | ) | (1,588,434 | ) | $ | (22,577,242 | ) | ||||||
|
|
|
|
|
|
|
| |||||||||
| * | There is a 2.00% redemption fee that may be charged on shares redeemed within the first 30 days of their acquisition. The redemption fees are retained by the Fund for the benefit of the remaining shareholders and recorded as paid-in capital. |
5. Federal Tax Information
The Fund has followed the authoritative guidance on accounting for and disclosure of uncertainty in tax positions, which requires the Fund to determine whether a tax position is more likely than not to be sustained upon examination, including resolution of any related appeals or litigation processes, based on the technical merits of the position. The Fund has determined that there was no effect on the financial statements from following this authoritative guidance. In the normal course of business, the Fund is subject to examination by federal, state and local jurisdictions, where applicable, for tax years for which applicable statutes of limitations have not expired.
26
PRIVATE CAPITAL MANAGEMENT VALUE FUND
Notes to Financial Statements (Continued)
October 31, 2017
(Unaudited)
For the year ended April 30, 2017, the tax character of distributions paid by the Fund was $24,463 of ordinary income and $999,091 of long-term capital gains dividends. Distributions from net investment income and short-term capital gains are treated as ordinary income for federal income tax purposes.
As of April 30, 2017, the components of distributable earnings on a tax basis were as follows:
Capital Loss Carryforward | Undistributed | Undistributed | Unrealized Appreciation | Qualified Late-Year | ||||
$— | $— | $— | $22,505,397 | $(164,226) |
The differences between the book and tax basis components of distributable earnings relate primarily to the timing and recognition of income and gains for federal income tax purposes.
At October 31, 2017, the federal tax cost, aggregate gross unrealized appreciation and depreciation of securities held by the Fund were as follows:
Federal tax cost* | $ | 47,565,521 | ||||
|
| |||||
Gross unrealized appreciation on investments | $ | 27,831,876 | ||||
Gross unrealized depreciation on investments | (1,592,353 | ) | ||||
Net unrealized depreciation on written options | (288,624 | ) | ||||
|
| |||||
Net unrealized appreciation on investments | $ | 25,950,899 | ||||
|
|
| * | Because tax adjustments are calculated annually at the end of the Fund’s fiscal year, the above table does not reflect tax adjustments for the current fiscal year. For the previous year’s federal income tax information, please refer to the Notes to Financial Statements section in the Fund’s most recent annual report. |
Pursuant to federal income tax rules applicable to regulated investment companies, the Fund may elect to treat certain capital losses between November 1 and April 30 and late year ordinary losses ((i) ordinary losses between January 1 and April 30, and (ii) specified ordinary and currency losses between November 1 and April 30) as occurring on the first day of the following tax year. For the year ended April 30, 2017, any amount of losses elected within the tax return will not be recognized for federal income tax purposes until May 1, 2017. For the year ended April 30, 2017, the Fund had late-year ordinary loss deferrals of $84,938 and short-term capital loss deferrals of $79,288.
Accumulated capital losses represent net capital loss carry forwards as of April 30, 2017 that may be available to offset future realized capital gains and thereby reduce future capital gains distributions. As of October 31, 2017, the Fund had no capital losses.
27
PRIVATE CAPITAL MANAGEMENT VALUE FUND
Notes to Financial Statements (Concluded)
October 31, 2017
(Unaudited)
6. Subsequent Events
Management has evaluated the impact of all subsequent events on the Fund through the date the financial statements were issued, and has determined that there were no subsequent events requiring recognition or disclosure in the financial statements.
28
PRIVATE CAPITAL MANAGEMENT VALUE FUND
Other Information
(Unaudited)
Proxy Voting
Policies and procedures that the Fund uses to determine how to vote proxies relating to portfolio securities as well as information regarding how the Fund voted proxies relating to portfolio securities for the most recent 12-month period ended June 30 are available without charge, upon request, by calling (888) 568-1267 and on the Securities and Exchange Commission’s (“SEC”) website at http:// www.sec.gov.
Quarterly Portfolio Schedules
The Trust files its complete schedule of portfolio holdings with the SEC for the first and third fiscal quarters of each fiscal year (quarters ended July 31 and January 31) on Form N-Q. The Trust’s Forms N-Q are available on the SEC’s website at http://www.sec.gov and may be reviewed and copied at the SEC’s Public Reference Room in Washington, D.C. Information on the operation of the SEC’s Public Reference Room may be obtained by calling 1-800-SEC-0330.
Board Consideration of Investment Advisory Agreement
At a meeting held on June 26, 2017 (the “Meeting”), the Board of Trustees (the “Board” or the “Trustees”) of FundVantage Trust (the “Trust”), including a majority of the Trustees who are not “interested persons” within the meaning of Section 2(a)(19) of the Investment Company Act of 1940, as amended (the “1940 Act”) (the “Independent Trustees”), unanimously approved the continuation of the Advisory agreement between Private Capital Management, LLC (“PCM” or the “Adviser”) and the Trust (the “Agreement”) on behalf of the Private Capital Management Value Fund (the “Fund”). At the Meeting, the Board considered the continuation of the Agreement with respect to the Fund for an additional one year period.
In determining whether to approve the Agreement, the Trustees considered information provided by the Adviser in accordance with Section 15(c) of the 1940 Act regarding: (i) services performed for the Fund, (ii) the size and qualifications of their portfolio management staff, (iii) any potential or actual material conflicts of interest which may arise in connection with a portfolio manager’s management of the Fund, (iv) investment performance, (v) the capitalization and financial condition of PCM, (vi) brokerage selection procedures (including soft dollar arrangements, if any), (vii) the procedures for allocating investment opportunities between the Fund and other clients, (viii) results of any regulatory examination, including any recommendations or deficiencies noted, (ix) any litigation, investigation or administrative proceeding which may have a material impact on PCM’s ability to service the Fund, (x) compliance with the Fund’s investment objectives, policies and practices (including codes of ethics and proxy voting policies) and (xi) compliance with federal securities laws and other regulatory requirements. The Trustees noted the reports and discussions with the Adviser as provided at the Board meetings throughout the year covering matters such as the relative performance of the Fund; compliance with the investment objectives, policies, strategies and limitations for the Fund; the compliance of management personnel with the applicable code of ethics; and the adherence to the Trust’s pricing procedures as established by the Board.
29
PRIVATE CAPITAL MANAGEMENT VALUE FUND
Other Information (Continued)
(Unaudited)
Representatives from PCM attended the Meeting in person. The representatives discussed the firm’s history, performance and investment strategies in connection with the proposed approval of the Agreement and answered questions from the Board.
Performance. The Trustees considered the investment performance for the Fund and PCM. The Trustees reviewed the historical performance charts for the Fund’s Class A shares and Class I shares as compared to the Russell 2000 Total Return Index, the S&P 500 Daily Reinvested Index and the Lipper Mid-Cap Core Fund Index, the Fund’s applicable Lipper index comprised of funds with assets of $250 million or less, for the year-to-date, one year, two year, three year, five year and since inception periods ended March 31, 2017. The Trustees noted that they considered performance reports provided at Board meetings throughout the year.
The Trustees noted that the Fund’s Class A and Class I shares outperformed each of the S&P 500 Daily Reinvested Index, Russell 2000 Total Return Index, and Lipper Mid-Cap Core Fund Index for the year to date period ended March 31, 2017. The Trustees noted further that the Fund’s Class A shares outperformed the S&P 500 Daily Reinvested Index for the one year period ended March 31, 2017, and underperformed the Lipper Mid-Cap Core Fund Index and the Russell 2000 Total Return Index for the one year period ended March 31, 2017. The Trustees noted that the Fund’s Class I shares outperformed the Lipper Mid-Cap Core Fund Index and the S&P 500 Daily Reinvested Index for the one year period ended March 31, 2017 and underperformed the Russell 2000 Total Return Index for the one year period ended March 31, 2017. The Trustees noted that the Fund’s Class A and Class I shares underperformed each of the S&P 500 Daily Reinvested Index, Russell 2000 Total Return Index, and Lipper Mid-Cap Core Fund Index for the two year, three year, five year and since inception periods ended March 31, 2017.
Fees. The Trustees also noted that the representatives of PCM had provided information regarding its Advisory fees and an analysis of these fees in relation to the services provided to the Fund and any other ancillary benefit resulting from the PCM’s relationship with the Fund. The Trustees also reviewed information regarding the fees PCM charges to other clients and evaluated explanations provided by PCM as to differences in fees charged to the Fund and other similarly managed accounts. The Trustees reviewed fees charged by other advisers that manage comparable mutual funds with similar strategies. The Trustees concluded that the Advisory fees and services provided by PCM are consistent with those of other advisers which manage mutual funds with investment objectives, strategies and policies similar to those of the Fund as measured by the information provided by PCM.
The Board considered the fees that PCM charges to each comparable account and/or Investment Company advised by PCM, and evaluated the explanations provided by PCM as to differences in fees charged to the Fund and such accounts. The Trustees also reviewed a peer comparison of Advisory
30
PRIVATE CAPITAL MANAGEMENT VALUE FUND
Other Information (Continued)
(Unaudited)
fees and total expenses for the Fund versus other similarly managed funds. The Trustees noted that the gross Advisory fee of the Fund’s Class A shares and Class I shares were each higher than the median of the gross Advisory fees and that the net total expense ratio of the Fund’s Class A shares and Class I shares were each lower than the median of the net total expenses of fund’s with similar share classes in the Lipper Mid-Cap Core category with $250 million or less in assets. The Trustees concluded that the Advisory fee and services provided by PCM are sufficiently consistent with those of other advisers which manage mutual funds with investment objectives, strategies and policies similar to those of the PCM Value Fund based on the information provided at the Meeting.
Knowledge, experience, and qualifications. The Board considered the level and depth of knowledge of PCM, including the professional experience and qualifications of senior personnel. In evaluating the quality of services provided by PCM, the Board took into account its familiarity with PCM’s senior management through Board meetings, discussions and reports during the preceding year. The Board also took into account PCM’s compliance policies and procedures and reports regarding PCM’s compliance operations from the Trust’s Chief Compliance Officer. The Board also considered any potential conflicts of interest that may arise in a portfolio manager’s management of the Fund’s investments on the one hand, and the investments of other accounts, on the other. The Trustees reviewed the services provided to the Fund by PCM and concluded that the nature, extent and quality of the services provided were appropriate and consistent with the terms of the PCM Agreement, that the quality of the services appeared to be consistent with industry norms and that the Fund is likely to benefit from the continued receipt of those services. They also concluded that PCM has sufficient personnel, with the appropriate education and experience, to serve the Fund effectively and had demonstrated their ability to attract and retain qualified personnel.
Costs. The Trustees reviewed materials regarding the costs of the services provided by PCM, the compensation and benefits received by PCM in providing services to the Fund, as well as PCM’s profitability. The Trustees were provided with PCM’s most recent balance sheet and statement of operations and changes in member equity for the years ended December 31, 2016 and December 31, 2015. The Trustees noted that PCM’s level of profitability is an appropriate factor to consider, and the Trustees should be satisfied that PCM’s profits are sufficient to continue as a healthy concern generally and as investment adviser of the Fund specifically. The Trustees concluded that PCM’s Advisory fee level was reasonable in relation to the nature and quality of the services provided, taking into account the current size and projected growth of the Fund.
Economies of Scale. The Trustees considered the extent to which economies of scale would be realized relative to fee levels as the PCM grows, and whether the Advisory fee levels reflect these economies of scale for the benefit of shareholders. The Board noted that economies of scale may be achieved at higher asset levels for the Fund for the benefit of fund shareholders but that the Advisory fee did not currently include breakpoint reductions as asset levels increase.
31
PRIVATE CAPITAL MANAGEMENT VALUE FUND
Other Information (Concluded)
(Unaudited)
At the Meeting, the Trustees unanimously approved the PCM Agreement for an additional one year period. In voting to approve the continuation of the PCM Agreement, the Board considered all factors it deemed relevant and the information presented to the Board by PCM. In arriving at its decision, the Board did not identify any single factor as being of paramount importance and each member of the Board gave varying weights to each factor according to his or her own judgment. The Board determined that the continuation of the PCM Agreement would be in the best interests of the Fund and its shareholders. As a result, the Board, including a majority of the Independent Trustees, unanimously approved the Agreement with respect to the Fund.
32
[THIS PAGE INTENTIONALLY LEFT BLANK.]
[THIS PAGE INTENTIONALLY LEFT BLANK.]
[THIS PAGE INTENTIONALLY LEFT BLANK.]
Investment Adviser
Private Capital Management, LLC
8889 Pelican Bay Boulevard
Suite 500
Naples, FL 34108
Administrator
BNY Mellon Investment Servicing (US) Inc.
301 Bellevue Parkway
Wilmington, DE 19809
Transfer Agent
BNY Mellon Investment Servicing (US) Inc.
4400 Computer Drive
Westborough, MA 01581
Principal Underwriter
Foreside Funds Distributors LLC
400 Berwyn Park
899 Cassatt Road
Berwyn, PA 19312
Custodian
The Bank of New York Mellon
225 Liberty Street
New York, NY 10286
Independent Registered Public Accounting Firm
PricewaterhouseCoopers LLP
Two Commerce Square, Suite 1800
2001 Market Street
Philadelphia, PA 19103-7042
Legal Counsel
Pepper Hamilton LLP
3000 Two Logan Square
18th and Arch Streets
Philadelphia, PA 19103
PRIVATE CAPITAL MANAGEMENT VALUE FUND
of
FundVantage Trust
Class A
Class I
SEMI-ANNUAL
REPORT
October 31, 2017
(Unaudited)
This report is submitted for the general information of the shareholders of the Private Capital Management Value Fund. It is not authorized for distribution unless preceded or accompanied by a current prospectus for the Private Capital Management Value Fund.
PRI-1017
QUALITY DIVIDEND FUND
Semi-Annual Report
Performance Data
October 31, 2017
(Unaudited)
| Average Annual Total Returns for the Periods Ended October 31, 2017† | |||||||||||||||||||||||||
| Six Months†† | 1 Year | 3 Years | Since Inception | ||||||||||||||||||||||
Class A (with sales charge) | -1.28% | 7.99 | % | 4.26 | % | 7.30 | % | ||||||||||||||||||
Class A (without sales charge) | 4.71% | 14.62 | % | 6.33 | % | 8.86 | % | ||||||||||||||||||
Russell 1000® Value Index††† | 5.46% | 17.78 | % | 7.99 | % | 10.98 | %* | ||||||||||||||||||
S&P 500® Index | 9.10% | 23.63 | % | 10.77 | % | 13.32 | %* | ||||||||||||||||||
Class C (with CDSC charge) | 3.29% | 12.81 | % | 5.55 | % | 8.08 | % | ||||||||||||||||||
Class C (without CDSC charge) | 4.29% | 13.81 | % | 5.55 | % | 8.08 | % | ||||||||||||||||||
Russell 1000® Value Index††† | 5.46% | 17.78 | % | 7.99 | % | 10.78 | %** | ||||||||||||||||||
S&P 500® Index | 9.10% | 23.63 | % | 10.77 | % | 13.11 | %** | ||||||||||||||||||
Institutional Class | 4.84% | 15.00 | % | N/A | 12.96 | % | |||||||||||||||||||
Russell 1000® Value Index††† | 5.46% | 17.78 | % | N/A | 15.77 | %*** | |||||||||||||||||||
S&P 500® Index | 9.10% | 23.63 | % | N/A | 20.67 | %*** | |||||||||||||||||||
| † | The Quality Dividend Fund (“the Fund”) Class A shares commenced operations on September 30, 2013; Class C shares commenced operations on October 1, 2013; Institutional Class shares commenced operations on October 4, 2016. |
| †† | Not annualized. |
| ††† | The Quality Dividend Fund has changed its benchmark index from the S&P 500® Index to the Russell 1000® Value Index because the Russell 1000® Value Index more appropriately reflects the types of securities held in the Fund’s portfolio and provides better comparative performance information. |
| * | Benchmark performance is from the inception date of Class A shares of the Fund (September 30, 2013) only and is not the inception date of the benchmark itself. |
| ** | Benchmark performance is from the inception date of Class C shares of the Fund (October 1, 2013) only and is not the inception date of the benchmark itself. |
| *** | Benchmark performance is from the inception date of Institutional Class shares of the Fund (October 4, 2016) only and is not the inception date of the benchmark itself. |
The performance data quoted represents past performance and does not guarantee future results. The investment return and principal value of an investment in the Fund will fluctuate so that an investor’s shares, when redeemed, may be worth more or less than their original cost. The table does not reflect the deduction of taxes that a shareholder would pay on Fund distributions or redemption of Fund shares. Current performance may be lower or higher. Performance data current to the most recent month end may be obtained by calling (888) 201-5799.
The returns of Class A shares reflect a deduction for the maximum front end sales charge of 5.75%. The returns shown for Class C shares reflect a maximum deferred sales charge of 1.00%.
The Fund’s total annual gross and net operating expenses, as stated in the current prospectus dated September 1, 2017, are 1.37% and 1.24%, respectively, for Class A shares, 2.12% and 1.99%, respectively, for Class C shares and 1.12% and 0.99%, for Institutional Class shares of the Fund’s average daily net assets. These rates may fluctuate and may differ from the actual expenses incurred by the Fund for the period covered by this report. Choice Financial Partners, Inc., d/b/a EquityCompass Strategies (“EquityCompass” or the “Adviser”) has contractually agreed to reduce
1
QUALITY DIVIDEND FUND
Semi-Annual Report
Performance Data (Concluded)
October 31, 2017
(Unaudited)
its investment advisory fee and/or reimburse certain expenses of the Fund to the extent necessary to ensure that the Fund’s total operating expenses (excluding taxes, any class-specific fees and expenses, “Acquired Fund Fees and Expenses,” interest, extraordinary items and brokerage commissions) do not exceed 0.99% of average daily net assets of the Fund (the “Expense Limitation”). The Expense Limitation will remain in effect until August 31, 2018, unless the Board of Trustees (“Board of Trustees”) of FundVantage Trust (the “Trust”) approves its earlier termination. The Adviser is entitled to recover, subject to approval by the Board of Trustees, such amounts reduced or reimbursed for a period of up to three (3) years from the date on which the Adviser reduced its compensation and/or assumed expenses for the Fund. The Adviser is permitted to seek reimbursement from the Fund, subject to certain limitations, for fees it waived and Fund expenses it paid to the extent the total annual fund operating expenses do not exceed the limits described above or any lesser limits in effect at the time of reimbursement. No recoupment will occur unless the Fund’s expenses are below the Expense Limitation amount. Total fees would be higher had such fees and expenses not been waived and/or reimbursed.
A 1.00% redemption fee applies to shares redeemed within 60 days of purchase. The redemption fee is not reflected in the returns shown above.
The Fund intends to evaluate performance as compared to those of the Russell 1000® Value Index and the S&P 500® Index. The Russell 1000® Value Index is an unmanaged index that measures the performance of the highest-ranking 1,000 stocks in the Russell 3000® Index, which represents about 90% of the total market capitalization of all listed U.S. stocks. The S&P 500® Index is a widely recognized, unmanaged index of 500 common stocks which are generally representative of the U.S. stock market as a whole. It is impossible to invest directly in an index.
Mutual fund investing involves risk, including possible loss of principal. The Fund’s dividend income and distributions will fluctuate, and at times the Fund may underperform other funds that invest more broadly or that have different investment styles. Some of the assets in which the Fund may invest entail special risks. Foreign stocks may be affected by currency fluctuations, social and political instability, and lax regulatory and financial reporting standards. Master Limited Partnerships (“MLPs”) may fluctuate abruptly in value and be difficult to liquidate. Real Estate Investment Trusts (“REITs”) entail risks related to real estate, such as tenant defaults, declining occupancy rates, and falling property values due to deteriorating economic conditions. Listed REIT stocks may fluctuate erratically in market price while non-listed REITs may be illiquid.
2
QUALITY DIVIDEND FUND
Fund Expense Disclosure
October 31, 2017
(Unaudited)
As a shareholder of the Fund, you incur two types of costs: (1) transaction costs, including sales charges (loads) on purchase payments, if any, and redemption fees; and (2) ongoing costs, including management fees, distribution and/or service (Rule 12b-1) fees, if any, and other Fund expenses. These examples are intended to help you understand your ongoing costs (in dollars) of investing in the Fund and to compare these costs with the ongoing costs of investing in other mutual funds.
These examples are based on an investment of $1,000 invested at the beginning of the six-month period from May 1, 2017 through October 31, 2017 and held for the entire period.
Actual Expenses
The first line of each accompanying table provides information about actual account values and actual expenses. You may use the information in this line, together with the amount you invested, to estimate the expenses that you paid over the period. Simply divide your account value by $1,000 (for example, an $8,600 account value divided by $1,000 = 8.6), then multiply the result by the number in the first line under the heading entitled “Expenses Paid During Period” to estimate the expenses you paid on your account during this period.
Hypothetical Examples for Comparison Purposes
The second line of each accompanying table provides information about hypothetical account values and hypothetical expenses based on the Fund’s actual expense ratio and an assumed rate of return of 5% per year before expenses, which is not your Fund’s actual return. The hypothetical account values and expenses may not be used to estimate the actual ending account balance or expenses you paid for the period. You may use this information to compare the ongoing costs of investing in the Fund and other funds. To do so, compare these 5% hypothetical examples with the 5% hypothetical examples that appear in the shareholder reports of other funds.
Please note that the expenses shown in the accompanying table are meant to highlight your ongoing costs only and do not reflect any transactional costs, such as sales charges (loads), if any, or redemption fees. Therefore, the second line of the accompanying table is useful in comparing ongoing costs only, and will not help you determine the relative total costs of owning different funds. In addition, if these transactional costs were included, your costs would have been higher.
3
QUALITY DIVIDEND FUND
Fund Expense Disclosure (Concluded)
October 31, 2017
(Unaudited)
| Quality Dividend Fund | |||||||||||||||
| Beginning Account Value May 1, 2017 | Ending Account Value October 31, 2017 | Expenses Paid During Period* | |||||||||||||
Class A | |||||||||||||||
Actual | $ | 1,000.00 | $ | 1,047.10 | $ | 6.40 | |||||||||
Hypothetical (5% return before expenses) | 1,000.00 | 1,018.95 | 6.31 | ||||||||||||
Class C | |||||||||||||||
Actual | $ | 1,000.00 | $ | 1,042.90 | $ | 10.25 | |||||||||
Hypothetical (5% return before expenses) | 1,000.00 | 1,015.17 | 10.11 | ||||||||||||
Institutional Class | |||||||||||||||
Actual | $ | 1,000.00 | $ | 1,048.40 | $ | 5.11 | |||||||||
Hypothetical (5% return before expenses) | 1,000.00 | 1,020.21 | 5.04 | ||||||||||||
| * | Expenses are equal to an annualized expense ratio for the six-month period ended October 31, 2017 of 1.24%, 1.99% and 0.99% for Class A, Class C and Institutional Class shares, respectively, for the Fund, multiplied by the average account value over the period, multiplied by the number of days in the most recent period (184), then divided by 365 to reflect the period. The Fund’s ending account values on the first line in the table are based on the actual six-month total returns for the Fund of 4.71%, 4.29% and 4.84% for Class A, Class C and Institutional Class shares, respectively. |
4
QUALITY DIVIDEND FUND
Portfolio Holdings Summary Table
October 31, 2017
(Unaudited)
The following table presents a summary by sector of the portfolio holdings of the Fund:
| % of Net Assets | Value | |||||||||
COMMON STOCKS: | ||||||||||
Oil, Gas & Consumable Fuels | 12.0 | % | $ | 8,810,932 | ||||||
Pharmaceuticals | 8.3 | 6,103,919 | ||||||||
Electric Utilities | 8.3 | 6,103,869 | ||||||||
Commercial Banks | 8.0 | 5,881,780 | ||||||||
REITs | 7.5 | 5,519,037 | ||||||||
Household Products | 7.3 | 5,328,411 | ||||||||
Diversified Telecommunication Services | 7.2 | 5,304,537 | ||||||||
Biotechnology | 4.4 | 3,221,564 | ||||||||
Chemicals | 4.3 | 3,120,610 | ||||||||
Communications Equipment | 4.2 | 3,111,304 | ||||||||
Aerospace & Defense | 4.2 | 3,094,728 | ||||||||
Hotels, Restaurants & Leisure | 4.2 | 3,043,270 | ||||||||
IT Services | 4.1 | 3,038,371 | ||||||||
Beverages | 3.9 | 2,855,726 | ||||||||
Containers & Packaging | 3.9 | 2,846,834 | ||||||||
Semiconductors & Semiconductor Equipment | 3.8 | 2,765,354 | ||||||||
Tobacco | 3.5 | 2,541,392 | ||||||||
Exchange Traded Fund | 0.2 | 146,211 | ||||||||
Other Assets in Excess of Liabilities | 0.7 | 484,837 | ||||||||
|
|
|
| |||||||
NET ASSETS | 100.0 | % | $ | 73,322,686 | ||||||
|
|
|
| |||||||
Portfolio holdings are subject to change at any time.
The accompanying notes are an integral part of the financial statements.
5
QUALITY DIVIDEND FUND
Portfolio of Investments
October 31, 2017
(Unaudited)
| Number of Shares | Value | |||||||
COMMON STOCKS — 99.1% | ||||||||
Aerospace & Defense — 4.2% | ||||||||
Boeing Co. (The) | 11,996 | $ | 3,094,728 | |||||
|
| |||||||
Beverages — 3.9% | ||||||||
Coca-Cola Co. (The) | 62,108 | 2,855,726 | ||||||
|
| |||||||
Biotechnology — 4.4% | ||||||||
AbbVie, Inc. | 35,696 | 3,221,564 | ||||||
|
| |||||||
Chemicals — 4.3% | ||||||||
DowDuPont, Inc. | 43,156 | 3,120,610 | ||||||
|
| |||||||
Commercial Banks — 8.0% | ||||||||
Bank of Montreal (Canada) | 19,007 | 1,456,126 | ||||||
Toronto-Dominion Bank (The) (Canada) | 26,049 | 1,480,886 | ||||||
Wells Fargo & Co. | 52,454 | 2,944,768 | ||||||
|
| |||||||
| 5,881,780 | ||||||||
|
| |||||||
Communications Equipment — 4.2% |
| |||||||
Cisco Systems, Inc. | 91,107 | 3,111,304 | ||||||
|
| |||||||
Containers & Packaging — 3.9% |
| |||||||
International Paper Co. | 49,709 | 2,846,834 | ||||||
|
| |||||||
Diversified Telecommunication Services — 7.2% |
| |||||||
AT&T, Inc. | 72,622 | 2,443,730 | ||||||
Verizon Communications, Inc. | 59,762 | 2,860,807 | ||||||
|
| |||||||
| 5,304,537 | ||||||||
|
| |||||||
Electric Utilities — 8.3% | ||||||||
Duke Energy Corp. | 33,645 | 2,971,190 | ||||||
Southern Co. (The) | 60,013 | 3,132,679 | ||||||
|
| |||||||
| 6,103,869 | ||||||||
|
| |||||||
Hotels, Restaurants & Leisure — 4.2% |
| |||||||
McDonald’s Corp. | 18,233 | 3,043,270 | ||||||
|
| |||||||
Household Products — 7.3% | ||||||||
Kimberly-Clark Corp. | 23,125 | 2,601,794 | ||||||
| Number of Shares | Value | |||||||
COMMON STOCKS — (Continued) |
| |||||||
Household Products — (Continued) |
| |||||||
Procter & Gamble Co. (The) | 31,580 | $ | 2,726,617 | |||||
|
| |||||||
| 5,328,411 | ||||||||
|
| |||||||
IT Services — 4.1% | ||||||||
International Business Machines Corp. | 19,722 | 3,038,371 | ||||||
|
| |||||||
Oil, Gas & Consumable Fuels — 12.0% |
| |||||||
Enbridge, Inc. (Canada) | 69,570 | 2,675,662 | ||||||
ONEOK, Inc. | 53,118 | 2,882,714 | ||||||
Valero Energy Corp. | 41,229 | 3,252,556 | ||||||
|
| |||||||
| 8,810,932 | ||||||||
|
| |||||||
Pharmaceuticals — 8.3% | ||||||||
Johnson & Johnson | 21,955 | 3,060,746 | ||||||
Pfizer, Inc. | 86,799 | 3,043,173 | ||||||
|
| |||||||
| 6,103,919 | ||||||||
|
| |||||||
REITs — 7.5% | ||||||||
Digital Realty Trust, Inc. | 25,068 | 2,969,054 | ||||||
Omega Healthcare Investors, Inc. | 88,357 | 2,549,983 | ||||||
|
| |||||||
| 5,519,037 | ||||||||
|
| |||||||
Semiconductors & Semiconductor Equipment — 3.8% |
| |||||||
QUALCOMM, Inc. | 54,212 | 2,765,354 | ||||||
|
| |||||||
Tobacco — 3.5% | ||||||||
Philip Morris International, Inc. | 24,287 | 2,541,392 | ||||||
|
| |||||||
TOTAL COMMON STOCKS (Cost $61,379,657) | 72,691,638 | |||||||
|
| |||||||
The accompanying notes are an integral part of the financial statements.
6
QUALITY DIVIDEND FUND
Portfolio of Investments (Concluded)
October 31, 2017
(Unaudited)
| Number of Shares | Value | |||||||
EXCHANGE TRADED FUND — 0.2% |
| |||||||
SPDR S&P Dividend ETF | 1,581 | $ | 146,211 | |||||
|
| |||||||
TOTAL EXCHANGE | 146,211 | |||||||
|
| |||||||
TOTAL INVESTMENTS - 99.3% | ||||||||
(Cost $61,488,386) | 72,837,849 | |||||||
|
| |||||||
OTHER ASSETS IN EXCESS OF LIABILITIES - 0.7% | 484,837 | |||||||
|
| |||||||
NET ASSETS - 100.0% | $ | 73,322,686 | ||||||
|
| |||||||
REIT | Real Estate Investment Trust | |
SPDR | Standard & Poor’s Depository Receipt |
The accompanying notes are an integral part of the financial statements.
7
QUALITY DIVIDEND FUND
Statement of Assets and Liabilities
October 31, 2017
(Unaudited)
Assets | ||||
Investments, at value (Cost $61,488,386) | $ | 72,837,849 | ||
Cash | 125,796 | |||
Receivable for investments sold | 219,034 | |||
Receivable for capital shares sold | 50,453 | |||
Dividends and interest receivable | 185,069 | |||
Prepaid expenses and other assets | 69,078 | |||
|
| |||
Total assets | 73,487,279 | |||
|
| |||
Liabilities | ||||
Payable to Investment Adviser | 33,562 | |||
Payable for distribution fees | 24,439 | |||
Payable for administration and accounting fees | 24,206 | |||
Payable for capital shares redeemed | 20,696 | |||
Payable for transfer agent fees | 17,212 | |||
Payable for printing fees | 12,907 | |||
Payable for audit fees | 12,739 | |||
Payable for shareholder servicing fees | 5,326 | |||
Payable for legal fees | 4,723 | |||
Payable for custodian fees | 3,082 | |||
Payable for distributions to shareholders | 458 | |||
Accrued expenses | 5,243 | |||
|
| |||
Total liabilities | 164,593 | |||
|
| |||
Net Assets | $ | 73,322,686 | ||
|
| |||
Net Assets consisted of: | ||||
Capital stock, $0.01 par value | $ | 58,194 | ||
Paid-in capital | 63,893,282 | |||
Accumulated net investment income | 127,558 | |||
Accumulated net realized loss from investments | (2,105,811 | ) | ||
Net unrealized appreciation on investments | 11,349,463 | |||
|
| |||
Net Assets | $ | 73,322,686 | ||
|
|
Class A: | ||||
Net asset value and redemption price per share ($39,424,873 / 3,133,017 shares) | $ | 12.58 | ||
|
| |||
Maximum offering price per share (100/94.25 of $12.58) | $ | 13.35 | ||
|
| |||
Class C: | ||||
Net asset value, offering and redemption price per share ($24,524,465 / 1,941,889 shares) | $ | 12.63 | ||
|
| |||
Institutional Class: | ||||
Net asset value, offering and redemption price per share ($9,373,348 / 744,500 shares) | $ | 12.59 | ||
|
|
The accompanying notes are an integral part of the financial statements.
8
QUALITY DIVIDEND FUND
Statement of Operations
For the Six Months Ended October 31, 2017
(Unaudited)
Investment income | ||||
Dividends | $ | 1,293,819 | ||
Less: foreign taxes withheld | (10,981 | ) | ||
|
| |||
Total investment income | 1,282,838 | |||
|
| |||
Expenses | ||||
Advisory fees (Note 2) | 220,103 | |||
Distribution fees (Class C) (Note 2) | 96,546 | |||
Distribution fees (Class A) (Note 2) | 48,000 | |||
Transfer agent fees (Note 2) | 35,914 | |||
Administration and accounting fees (Note 2) | 33,208 | |||
Shareholder servicing fees (Class C) | 32,182 | |||
Registration and filing fees | 21,576 | |||
Trustees’ and officers’ fees (Note 2) | 19,024 | |||
Legal fees | 14,982 | |||
Audit fees | 14,818 | |||
Printing and shareholder reporting fees | 13,064 | |||
Custodian fees (Note 2) | 9,769 | |||
Other expenses | 8,899 | |||
|
| |||
Total expenses before waivers and reimbursements | 568,085 | |||
|
| |||
Less: waivers and reimbursements (Note 2) | (28,311 | ) | ||
|
| |||
Net expenses after waivers and reimbursements | 539,774 | |||
|
| |||
Net investment income | 743,064 | |||
|
| |||
Net realized and unrealized gain from investments: | ||||
Net realized gain from investments | 1,486,108 | |||
Net change in unrealized appreciation/(depreciation) on investments | 1,023,144 | |||
|
| |||
Net realized and unrealized gain on investments | 2,509,252 | |||
|
| |||
Net increase in net assets resulting from operations | $ | 3,252,316 | ||
|
|
The accompanying notes are an integral part of the financial statements.
9
QUALITY DIVIDEND FUND
Statements of Changes in Net Assets
| For the Six Months Ended October 31, 2017 (Unaudited) | For the Year Ended April 30, 2017 | |||||||||
Increase/(decrease) in net assets from operations: | ||||||||||
Net investment income | $ | 743,064 | $ | 1,346,397 | ||||||
Net realized gain from investments | 1,486,108 | 2,178,275 | ||||||||
Net change in unrealized appreciation/(depreciation) on investments | 1,023,144 | 4,141,133 | ||||||||
|
|
|
| |||||||
Net increase in net assets resulting from operations | 3,252,316 | 7,665,805 | ||||||||
|
|
|
| |||||||
Less dividends and distributions to shareholders from: | ||||||||||
Net investment income: | ||||||||||
Class A | (556,443 | ) | (774,146 | ) | ||||||
Class C | (273,514 | ) | (312,026 | ) | ||||||
Institutional Class | (143,753 | ) | (70,873 | ) | ||||||
|
|
|
| |||||||
Total net investment income | (973,710 | ) | (1,157,045 | ) | ||||||
|
|
|
| |||||||
Net decrease in net assets from dividends and distributions to shareholders | (973,710 | ) | (1,157,045 | ) | ||||||
|
|
|
| |||||||
Increase/(decrease) in net assets derived from capital share transactions (Note 4) | (665,654 | ) | 6,377,427 | |||||||
|
|
|
| |||||||
Total increase in net assets | 1,612,952 | 12,886,187 | ||||||||
|
|
|
| |||||||
Net assets | ||||||||||
Beginning of period | 71,709,734 | 58,823,547 | ||||||||
|
|
|
| |||||||
End of period | $ | 73,322,686 | $ | 71,709,734 | ||||||
|
|
|
| |||||||
Accumulated net investment income, end of period | $ | 127,558 | $ | 358,204 | ||||||
|
|
|
| |||||||
The accompanying notes are an integral part of the financial statements.
10
QUALITY DIVIDEND FUND
Financial Highlights
Contained below is per share operating performance data for each Class A share outstanding, total investment return, ratios to average net assets and other supplemental data for the respective period. The total returns in the table represent the rate that an investor would have earned or lost on an investment in the Fund (assuming reinvestment of all dividends and distributions). This information has been derived from information provided in the financial statements and should be read in conjunction with the financial statements and the notes thereto.
| Class A | |||||||||||||||||||||||||
| For the Six Months Ended October 31, 2017 (Unaudited) | For the Year Ended April 30, 2017 | For the Year Ended April 30, 2016 | For the Year Ended April 30, 2015 | For the Period September 30, 2013* to April 30, 2014 | |||||||||||||||||||||
Per Share Operating Performance | |||||||||||||||||||||||||
Net asset value, beginning of period | $ | 12.19 | $ | 11.03 | $ | 11.66 | $ | 11.02 | $ | 10.00 | |||||||||||||||
|
|
|
|
|
|
|
|
|
| ||||||||||||||||
Net investment income(1) | 0.14 | 0.27 | 0.26 | 0.27 | 0.16 | ||||||||||||||||||||
Net realized and unrealized gain/(loss) on investments | 0.43 | 1.13 | (0.49 | ) | 0.79 | 0.96 | |||||||||||||||||||
|
|
|
|
|
|
|
|
|
| ||||||||||||||||
Net increase/(decrease) in net assets resulting from operations | 0.57 | 1.40 | (0.23 | ) | 1.06 | 1.12 | |||||||||||||||||||
|
|
|
|
|
|
|
|
|
| ||||||||||||||||
Dividends and distributions to shareholders from: | |||||||||||||||||||||||||
Net investment income | (0.18 | ) | (0.24 | ) | (0.26 | ) | (0.28 | ) | (0.10 | ) | |||||||||||||||
Net realized capital gains | — | — | (0.14 | ) | (0.14 | ) | — | ||||||||||||||||||
|
|
|
|
|
|
|
|
|
| ||||||||||||||||
Total dividends and distributions to shareholders | (0.18 | ) | (0.24 | ) | (0.40 | ) | (0.42 | ) | (0.10 | ) | |||||||||||||||
|
|
|
|
|
|
|
|
|
| ||||||||||||||||
Redemption fees | — | (2) | — | (2) | — | (2) | — | (2) | — | (2) | |||||||||||||||
|
|
|
|
|
|
|
|
|
| ||||||||||||||||
Net asset value, end of period | $ | 12.58 | $ | 12.19 | $ | 11.03 | $ | 11.66 | $ | 11.02 | |||||||||||||||
|
|
|
|
|
|
|
|
|
| ||||||||||||||||
Total investment return(3) | 4.71 | % | 12.82 | % | (1.84 | )% | 9.65 | % | 11.27 | % | |||||||||||||||
Ratios/Supplemental Data | |||||||||||||||||||||||||
Net assets, end of period (in thousands) | $ | 39,425 | $ | 36,731 | $ | 35,607 | $ | 35,629 | $ | 20,745 | |||||||||||||||
Ratio of expenses to average net assets | 1.24 | %(4) | 1.24 | % | 1.24 | % | 1.24 | % | 1.24 | %(4) | |||||||||||||||
Ratio of expenses to average net assets without waivers and expense reimbursements(5) | | 1.32 | %(4) | 1.35 | % | 1.37 | % | 1.62 | % | 2.97 | %(4) | ||||||||||||||
Ratio of net investment income to average net assets | | 2.26 | %(4) | 2.35 | % | 2.40 | % | 2.33 | % | 2.65 | %(4) | ||||||||||||||
Portfolio turnover rate | 26.08 | %(6) | 43.59 | % | 62.74 | % | 67.56 | % | 10.71 | %(6) | |||||||||||||||
| * | Commencement of operations. |
| (1) | The selected per share data was calculated using the average shares outstanding method for the period. |
| (2) | Amount is less than $0.005 per share. |
| (3) | Total investment return is calculated assuming a purchase of shares on the first day and a sale of shares on the last day of each period reported and includes reinvestment of dividends and distributions, if any. Total returns for periods less than one year are not annualized. Total investment return does not reflect the impact of the maximum front-end sales load of 5.75%. If reflected, the return would be lower. |
| (4) | Annualized. |
| (5) | During the period, certain fees were waived and/or reimbursed. If such fee waivers and/or reimbursements had not occurred, the ratios would have been as indicated (See Note 2). |
| (6) | Not annualized. |
The accompanying notes are an integral part of the financial statements.
11
QUALITY DIVIDEND FUND
Financial Highlights (Continued)
Contained below is per share operating performance data for each Class C share outstanding, total investment return, ratios to average net assets and other supplemental data for the respective period. The total returns in the table represent the rate that an investor would have earned or lost on an investment in the Fund (assuming reinvestment of all dividends and distributions). This information has been derived from information provided in the financial statements and should be read in conjunction with the financial statements and the notes thereto.
| Class C | |||||||||||||||||||||||||
| For the Six Months Ended October 31, 2017 (Unaudited) | For the Year Ended April 30, 2017 | For the Year Ended April 30, 2016 | For the Year Ended April 30, 2015 | For the Period October 1, 2013* to April 30, 2014 | |||||||||||||||||||||
Per Share Operating Performance | |||||||||||||||||||||||||
Net asset value, beginning of period | $ | 12.24 | $ | 11.06 | $ | 11.73 | $ | 11.02 | $ | 10.00 | |||||||||||||||
|
|
|
|
|
|
|
|
|
| ||||||||||||||||
Net investment income(1) | 0.09 | 0.18 | 0.18 | 0.18 | 0.12 | ||||||||||||||||||||
Net realized and unrealized gain/(loss) on investments | 0.43 | 1.15 | (0.51 | ) | 0.80 | 0.96 | |||||||||||||||||||
|
|
|
|
|
|
|
|
|
| ||||||||||||||||
Net increase/(decrease) in net assets resulting from operations | 0.52 | 1.33 | (0.33 | ) | 0.98 | 1.08 | |||||||||||||||||||
|
|
|
|
|
|
|
|
|
| ||||||||||||||||
Dividends and distributions to shareholders from: | |||||||||||||||||||||||||
Net investment income | (0.13 | ) | (0.15 | ) | (0.20 | ) | (0.13 | ) | (0.06 | ) | |||||||||||||||
Net realized capital gains | — | — | (0.14 | ) | (0.14 | ) | — | ||||||||||||||||||
|
|
|
|
|
|
|
|
|
| ||||||||||||||||
Total dividends and distributions to shareholders | (0.13 | ) | (0.15 | ) | (0.34 | ) | (0.27 | ) | (0.06 | ) | |||||||||||||||
Redemption fees | — | (2) | — | (2) | — | (2) | — | (2) | — | (2) | |||||||||||||||
|
|
|
|
|
|
|
|
|
| ||||||||||||||||
Net asset value, end of period | $ | 12.63 | $ | 12.24 | $ | 11.06 | $ | 11.73 | $ | 11.02 | |||||||||||||||
|
|
|
|
|
|
|
|
|
| ||||||||||||||||
Total investment return(3) | 4.29 | % | 12.07 | % | (2.65 | )% | 8.91 | % | 10.84 | % | |||||||||||||||
Ratios/Supplemental Data | |||||||||||||||||||||||||
Net assets, end of period (in thousands) | $ | 24,524 | $ | 26,247 | $ | 23,217 | $ | 20,820 | $ | 8,089 | |||||||||||||||
Ratio of expenses to average net assets | 1.99 | %(4) | 1.99 | % | 1.99 | % | 1.99 | % | 1.99 | %(4) | |||||||||||||||
Ratio of expenses to average net assets without waivers and expense reimbursements(5) | 2.07 | %(4) | 2.10 | % | 2.12 | % | 2.35 | % | 3.72 | %(4) | |||||||||||||||
Ratio of net investment income to average net assets | 1.51 | %(4) | 1.58 | % | 1.65 | % | 1.58 | % | 1.46 | %(4) | |||||||||||||||
Portfolio turnover rate | 26.08 | %(6) | 43.59 | % | 62.74 | % | 67.56 | % | 10.71 | %(6) | |||||||||||||||
| * | Commencement of operations. |
| (1) | The selected per share data was calculated using the average shares outstanding method for the period. |
| (2) | Amount is less than $0.005 per share. |
| (3) | Total investment return is calculated assuming a purchase of shares on the first day and a sale of shares on the last day of each period reported and includes reinvestment of dividends and distributions, if any. Total returns for periods less than one year are not annualized. |
| (4) | Annualized. |
| (5) | During the period, certain fees were waived and/or reimbursed. If such fee waivers and/or reimbursements had not occurred, the ratios would have been as indicated (See Note 2). |
| (6) | Not annualized. |
The accompanying notes are an integral part of the financial statements.
12
QUALITY DIVIDEND FUND
Financial Highlights (Concluded)
Contained below is per share operating performance data for each Institutional Class share outstanding, total investment return, ratios to average net assets and other supplemental data for the respective period. The total returns in the table represent the rate that an investor would have earned or lost on an investment in the Fund (assuming reinvestment of all dividends and distributions). This information has been derived from information provided in the financial statements and should be read in conjunction with the financial statements and the notes thereto.
| Institutional Class | ||||||||||
| For the Six Months Ended October 31, 2017 (Unaudited) | For the Period October 4, 2016* to April 30, 2017 | |||||||||
Per Share Operating Performance | ||||||||||
Net asset value, beginning of period | $ | 12.20 | $ | 11.33 | ||||||
|
|
|
| |||||||
Net investment income(1) | 0.16 | 0.16 | ||||||||
Net realized and unrealized gain on investments | 0.43 | 0.83 | ||||||||
|
|
|
| |||||||
Net increase in net assets resulting from operations | 0.59 | 0.99 | ||||||||
|
|
|
| |||||||
Dividends and distributions to shareholders from: | ||||||||||
Net investment income | (0.20 | ) | (0.12 | ) | ||||||
|
|
|
| |||||||
Total dividends and distributions to shareholders | (0.20 | ) | (0.12 | ) | ||||||
|
|
|
| |||||||
Redemption fees | — | (2) | — | (2) | ||||||
Net asset value, end of period | $ | 12.59 | $ | 12.20 | ||||||
|
|
|
| |||||||
Total investment return(3) | 4.84 | % | 8.72 | % | ||||||
Ratios/Supplemental Data | ||||||||||
Net assets, end of period (in thousands) | $ | 9,373 | $ | 8,731 | ||||||
Ratio of expenses to average net assets | 0.99 | %(4) | 0.99 | %(4) | ||||||
Ratio of expenses to average net assets without waivers and expense reimbursements(5) | 1.07 | %(4) | 1.12 | %(4) | ||||||
Ratio of net investment income to average net assets | 2.51 | %(4) | 2.29 | %(4) | ||||||
Portfolio turnover rate | 26.08 | %(6) | 43.59 | %(7) | ||||||
| * | Commencement of operations. |
| (1) | The selected per share data was calculated using the average shares outstanding method for the period. |
| (2) | Amount is less than $0.005 per share. |
| (3) | Total investment return is calculated assuming a purchase of shares on the first day and a sale of shares on the last day of each period reported and includes reinvestment of dividends and distributions, if any. Total returns for periods less than one year are not annualized. |
| (4) | Annualized. |
| (5) | During the period, certain fees were waived and/or reimbursed. If such fee waivers and/or reimbursements had not occurred, the ratios would have been as indicated (See Note 2). |
| (6) | Not annualized. |
| (7) | Reflects portfolio turnover of the Fund for the year ended April 30, 2017. |
The accompanying notes are an integral part of the financial statements.
13
QUALITY DIVIDEND FUND
Notes to Financial Statements
October 31, 2017
(Unaudited)
1. Organization and Significant Accounting Policies
The Quality Dividend Fund (the “Fund”) is a diversified, open-end management investment company registered under the Investment Company Act of 1940, as amended, (the “1940 Act”), which commenced investment operations on September 30, 2013. The Fund is a separate series of FundVantage Trust (the “Trust”) which was organized as a Delaware statutory trust on August 28, 2006. The Trust is a “series trust” authorized to issue an unlimited number of separate series or classes of shares of beneficial interest. Each series is treated as a separate entity for certain matters under the 1940 Act, and for other purposes, and a shareholder of one series is not deemed to be a shareholder of any other series. The Fund offers separate classes of shares; Class A, Class C and Institutional Class shares. Class A shares are subject to a front end sales charge. Front-end sales charges may be reduced or waived under certain circumstances. A contingent deferred sales charge (“CDSC”), as a percentage of the lower of the original purchase price or net asset value at redemption, of 1.00% may be imposed on full or partial redemptions of Class A shares made within twelve months of purchase where: (i) $1 million or more of Class A shares was purchased without an initial sales charge, and (ii) the selling broker-dealer received a commission for such sale. A CDSC of 1% may apply to Class C shares when shares are redeemed within 12 months after initial purchase where the selling broker-dealer received a commission for such sale.
The Fund is an investment company and follows accounting and reporting guidance in the Financial Accounting Standards Board Accounting Standards Codification Topic 946.
Portfolio Valuation — The Fund’s net asset value (“NAV”) is calculated once daily at the close of regular trading hours on the New York Stock Exchange (“NYSE”) (typically 4:00 p.m. Eastern time) on each day the NYSE is open. Securities held by the Fund are valued using the closing price or the last sale price on a national securities exchange or the National Association of Securities Dealers Automatic Quotation System (“NASDAQ”) market system where they are primarily traded. Equity securities traded in the over-the-counter (“OTC”) market are valued at their closing prices. If there were no transactions on that day, securities traded principally on an exchange or on NASDAQ will be valued at the mean of the last bid and ask prices prior to the market close. Investments in other open-end investment companies are valued based on the NAV of the investment companies (which may use fair value pricing as discussed in their prospectuses). If market quotations are unavailable or deemed unreliable, securities will be valued in accordance with procedures adopted by the Trust’s Board of Trustees (“Board of Trustees”). Relying on prices supplied by pricing services or dealers or using fair valuation may result in values that are higher or lower than the values used by other investment companies and investors to price the same investments. In the event that market quotes are not readily available, and the security or asset cannot be valued pursuant to one of the valuation methods, the value of the security or asset will be determined in good faith by the Adviser. The Trust has established a Valuation Committee which performs certain functions including the oversight of the Adviser’s fair valuation determinations.
14
QUALITY DIVIDEND FUND
Notes to Financial Statements (Continued)
October 31, 2017
(Unaudited)
Fair Value Measurements — The inputs and valuation techniques used to measure fair value of the Fund’s investments are summarized into three levels as described in the hierarchy below:
• Level 1 — | quoted prices in active markets for identical securities; | |
• Level 2 — | other significant observable inputs (including quoted prices for similar securities, interest rates, prepayment speeds, credit risk, etc.); and | |
• Level 3 — | significant unobservable inputs (including the Fund’s own assumptions in determining the fair value of investments). | |
The inputs or methodology used for valuing securities are not necessarily an indication of the risk associated with investing in those securities.
The following is a summary of the inputs used, as of October 31, 2017, in valuing the Fund’s investments carried at fair value:
| Total Value at 10/31/17 | Level 1 Quoted Price | Level 2 Other Significant Observable Inputs | Level 3 Significant Unobservable Inputs | |||||||||||||
Common Stocks* | $ | 72,691,638 | $ | 72,691,638 | $ | — | $ | — | ||||||||
Exchange Traded Fund | 146,211 | 146,211 | — | — | ||||||||||||
|
|
|
|
|
|
|
| |||||||||
Total Investments | $ | 72,837,849 | $ | 72,837,849 | $ | — | $ | — | ||||||||
|
|
|
|
|
|
|
| |||||||||
| * | Please refer to Portfolio of Investments for further details on portfolio holdings. |
At the end of each quarter, management evaluates the classification of Levels 1, 2 and 3 assets and liabilities. Various factors are considered, such as changes in liquidity from the prior reporting period; whether or not a broker is willing to execute at the quoted price; the depth and consistency of prices from third party pricing services; and the existence of contemporaneous, observable trades in the market. Additionally, management evaluates the classification of Level 1 and Level 2 assets and liabilities on a quarterly basis for changes in listings or delistings on national exchanges.
Due to the inherent uncertainty of determining the fair value of investments that do not have a readily available market value, the fair value of the Fund’s investments may fluctuate from period to period. Additionally, the fair value of investments may differ significantly from the values that would have been used had a ready market existed for such investments and may differ materially from the values the Fund may ultimately realize. Further, such investments may be subject to legal and other restrictions on resale or otherwise less liquid than publicly traded securities.
15
QUALITY DIVIDEND FUND
Notes to Financial Statements (Continued)
October 31, 2017
(Unaudited)
For fair valuations using significant unobservable inputs, U.S. generally accepted accounting principles (“U.S. GAAP”) require the Fund to present a reconciliation of the beginning to ending balances for reported market values that presents changes attributable to total realized and unrealized gains or losses, purchase and sales, and transfers in and out of Level 3 during the period. Transfers in and out between Levels are based on values at the end of the period. U.S. GAAP also requires the Fund to disclose amounts and reasons for all transfers in and out of Level 1 and Level 2 fair value measurements. A reconciliation of Level 3 investments is presented only when the Fund had an amount of Level 3 investments at the end of the reporting period that was meaningful in relation to its net assets. The amounts and reasons for all transfers in and out of each Level within the three-tier hierarchy are disclosed when the Fund had an amount of total transfers during the reporting period that was meaningful in relation to its net assets as of the end of the reporting period.
For the six months ended October 31, 2017, there were no transfers between Levels 1, 2 and 3 for the Fund.
Use of Estimates — The preparation of financial statements in conformity with U.S. GAAP requires management to make estimates and assumptions that affect the amounts reported in the financial statements and accompanying notes at the date of the financial statements and the reported amounts of revenues and expenses during the period. Actual results could differ from those estimates and those differences could be material.
Investment Transactions, Investment Income and Expenses — Investment transactions are recorded on trade date for financial statement preparation purposes. Realized gains and losses on investments sold are recorded on the identified cost basis. Interest income is recorded on the accrual basis. Dividends are recorded on the ex-dividend date. Estimated components of distributions received from real estate investment trusts may be considered income, return of capital distributions or capital gain distributions. Return of capital distributions are recorded as a reduction of cost of the related investments. Distribution (12b-1) fees and shareholder services fees relating to a specific class are charged directly to that class. General expenses of the Trust are generally allocated to each fund in proportion to its relative daily net assets. Expenses directly attributable to a particular fund in the Trust are charged directly to that fund. The Fund’s investment income, expenses (other than class-specific expenses) and unrealized and realized gains and losses are allocated daily to each class of shares based upon the relative proportion of net assets of each class at the beginning of the day.
MLPCommonUnits — Master Limited Partnership (“MLP”) common units represent limited partnership interests in the MLP. Common units are generally listed and traded on the U.S. securities exchanges or OTC with their value fluctuating predominantly based on the success of the MLP. Unlike owners of common stock of a corporation, owners of MLP common units have limited voting rights and have no ability to annually elect directors. MLPs generally distribute all available cash flow (cash flow from operations less maintenance capital expenditures) in the form of quarterly distributions. Common unit holders have first
16
QUALITY DIVIDEND FUND
Notes to Financial Statements (Continued)
October 31, 2017
(Unaudited)
priority to receive quarterly cash distributions up to the minimum quarterly distribution and have arrearage rights. In the event of liquidation, common unit holders have preference over subordinated units, but not debt holders or preferred unit holders, to remaining assets of the MLP.
Dividends and Distributions to Shareholders — Dividends from net investment income are declared and paid quarterly to shareholders. Distributions, if any, of net short-term capital gain and net capital gain (the excess of net long-term capital gain over the short-term capital loss) realized by the Fund, after deducting any available capital loss carryovers are declared and paid to its shareholders annually. Income dividends and capital gain distributions are determined in accordance with U.S. federal income tax regulations, which may differ from U.S. GAAP. These differences may include the treatment of non-taxable dividends, expiring capital loss carryforwards and losses deferred due to wash sales and excise tax regulations. Permanent book and tax basis differences relating to shareholder distributions will result in reclassifications within the components of net assets.
U.S. Tax Status — No provision is made for U.S. income taxes as it is the Fund’s intention to continue to qualify for and elect the tax treatment applicable to regulated investment companies under Subchapter M of the Internal Revenue Code of 1986, as amended (the “Internal Revenue Code”), and make the requisite distributions to its shareholders which will be sufficient to relieve it from U.S. income and excise taxes.
Other — In the normal course of business, the Fund may enter into contracts that provide general indemnifications. The Fund’s maximum exposure under these arrangements is dependent on claims that may be made against the Fund in the future, and therefore, cannot be estimated; however, based on experience, the risk of material loss for such claims is considered remote.
Recent Accounting Pronouncement — On August 1, 2017, the Fund implemented changes due to amendments to Regulation S-X, issued by the Securities and Exchange Commission, which require standardized, enhanced disclosures, particularly related to derivatives, in investment company financial statements. Adoption of the amendments had no effect on the Fund’s net assets or results of operations.
2. Transactions with Related Parties and Other Service Providers
Choice Financial Partners, Inc., doing business as EquityCompass Strategies (“EquityCompass” or the “Adviser”), serves as investment adviser to the Fund pursuant to an investment advisory agreement with the Trust. For its services, the Adviser is paid a monthly fee at the annual rate of 0.60% of the Fund’s average daily net assets. The Adviser has contractually agreed to reduce its investment advisory fee and/or reimburse certain expenses of the Fund to the extent necessary to ensure that the Fund’s total operating expenses (excluding taxes, any class-specific fees and expenses, “Acquired Fund Fees and Expenses,” interest, extraordinary items and brokerage commissions) do not exceed 0.99% of average daily net assets of the Fund (the “Expense Limitation”). The Expense Limitation will remain in effect
17
QUALITY DIVIDEND FUND
Notes to Financial Statements (Continued)
October 31, 2017
(Unaudited)
until August 31, 2018 unless the Board of Trustees approves its earlier termination. The Adviser is entitled to recover, subject to approval by the Board of Trustees, such amounts reduced or reimbursed for a period of up to three (3) years from the date on which the Adviser reduced its compensation and/or assumed expenses for the Fund. The Adviser is permitted to seek reimbursement from the Fund, subject to certain limitations, for fees it waived and Fund expenses it paid to the extent the total annual fund expenses do not exceed the limits described above or any lesser limits in effect at the time of reimbursement. No recoupment will occur unless the Fund’s expenses are below the Expense Limitation amount.
At October 31, 2017, the amount of potential recovery was as follows:
| Expiration | ||||||||
April 30, 2018 | April 30, 2019 | April 30, 2020 | October 31, 2020 | Total | ||||
$153,735 | $72,020 | $74,701 | $28,311 | $328,767 | ||||
For the six months ended October 31, 2017, the Adviser earned advisory fees of $220,103 and waived fees of $28,311.
Other Service Providers
BNY Mellon Investment Servicing (US) Inc. (“BNY Mellon”) serves as administrator and transfer agent for the Fund. For providing administrative and accounting services, BNY Mellon is entitled to receive a monthly fee equal to an annual percentage rate of the Fund’s average daily net assets, subject to certain minimum monthly fees. For providing transfer agent services, BNY Mellon is entitled to receive a monthly fee, subject to certain minimum, and out of pocket expenses.
The Bank of New York Mellon (the “Custodian”) provides certain custodial services to the Fund. The Custodian is entitled to receive a monthly fee, subject to certain minimum, and out of pocket expenses.
Foreside Funds Distributors LLC (the “Underwriter”) provides principal underwriting services to the Fund.
The Trust and the Underwriter are parties to an underwriting agreement. The Trust has adopted a distribution plan for Class A and Class C shares in accordance with Rule 12b-1 under the 1940 Act. Pursuant to the Class A and Class C shares plan, the Fund compensates the Underwriter for direct and indirect costs and expenses incurred in connection with advertising, marketing and other distribution services in an amount not to exceed 0.25% and 1.00% (0.75% Rule 12b-1 distribution fee and 0.25% shareholder service fee), respectively, on an annualized basis of the average daily net assets of the Fund’s Class A and Class C shares.
18
QUALITY DIVIDEND FUND
Notes to Financial Statements (Continued)
October 31, 2017
(Unaudited)
Trustees and Officers
The Trust is governed by its Board of Trustees. The Trustees receive compensation in the form of an annual retainer and per meeting fees for their services to the Trust. The remuneration paid to the Trustees by the Fund during the six months ended October 31, 2017 was $4,526. An employee of BNY Mellon serves as the Secretary of the Trust and is not compensated by the Fund or the Trust.
JW Fund Management LLC (“JWFM”) provides a Principal Executive Officer and Principal Financial Officer, respectively, to the Trust. JWFM is compensated for the services provided to the Trust.
Freeh Group International Solutions, LLC provides the Trust with a Chief Compliance Officer and an Anti-Money Laundering Officer.
3. Investment in Securities
For the six months ended October 31, 2017, aggregate purchases and sales of investment securities (excluding short-term investments) of the Fund were as follows:
| Purchases | Sales | |||||||
Investment Securities | $ | 18,794,794 | $ | 18,948,151 | ||||
4. Capital Share Transactions
For the six months ended October 31, 2017 and the year ended April 30, 2017, transactions in capital shares (authorized shares unlimited) were as follows:
| For the Six Months Ended October 31, 2017 (Unaudited) | For the Year Ended April 30, 2017 | |||||||||||||||
| Shares | Amount | Shares | Amount | |||||||||||||
Class A | ||||||||||||||||
Sales | 232,917 | $ | 2,889,081 | 769,608 | $ | 8,921,476 | ||||||||||
Reinvestments | 32,195 | 399,137 | 47,963 | 555,415 | ||||||||||||
Redemption Fees* | — | 1,099 | — | 636 | ||||||||||||
Redemptions | (144,213 | ) | (1,786,806 | ) | (1,034,323 | ) | (11,877,878 | ) | ||||||||
|
|
|
|
|
|
|
| |||||||||
Net increase/(decrease) | 120,899 | $ | 1,502,511 | (216,752 | ) | $ | (2,400,351 | ) | ||||||||
|
|
|
|
|
|
|
| |||||||||
Class C | ||||||||||||||||
Sales | 70,945 | $ | 884,081 | 452,997 | $ | 5,283,198 | ||||||||||
Reinvestments | 17,881 | 222,414 | 21,581 | 250,228 | ||||||||||||
Redemption Fees* | — | 758 | — | 451 | ||||||||||||
Redemptions | (291,782 | ) | (3,628,106 | ) | (428,881 | ) | (4,991,200 | ) | ||||||||
|
|
|
|
|
|
|
| |||||||||
Net increase | (202,956 | ) | $ | (2,520,853 | ) | 45,697 | $ | 542,677 | ||||||||
|
|
|
|
|
|
|
| |||||||||
19
QUALITY DIVIDEND FUND
Notes to Financial Statements (Continued)
October 31, 2017
(Unaudited)
| For the Six Months Ended October 31, 2017 (Unaudited) | For the Year Ended April 30, 2017 | |||||||||||||||
| Shares | Amount | Shares | Amount | |||||||||||||
Institutional Class** | ||||||||||||||||
Sales | 91,992 | $ | 1,135,251 | 758,552 | $ | 8,748,719 | ||||||||||
Reinvestments | 9,281 | 115,094 | 4,931 | 58,781 | ||||||||||||
Redemption Fees* | — | 261 | — | 108 | ||||||||||||
Redemptions | (72,449 | ) | (897,918 | ) | (47,807 | ) | (572,507 | ) | ||||||||
|
|
|
|
|
|
|
| |||||||||
Net increase | 28,824 | $ | 352,688 | 715,676 | $ | 8,235,101 | ||||||||||
|
|
|
|
|
|
|
| |||||||||
Total Net Increase | (53,233 | ) | $ | (665,654 | ) | 544,621 | $ | 6,377,427 | ||||||||
|
|
|
|
|
|
|
| |||||||||
| * | There is a 1.00% redemption fee that may be charged on shares redeemed which have been held for 60 days or less. The redemption fees are retained by the Fund for the benefit of the remaining shareholders and recorded as paid-in capital. |
| ** | Institutional Class commenced operations on October 4, 2016. |
5. Federal Tax Information
The Fund has followed the authoritative guidance on accounting for and disclosure of uncertainty in tax positions, which requires the Fund to determine whether a tax position is more likely than not to be sustained upon examination, including resolution of any related appeals or litigation processes, based on the technical merits of the position. Tax positions not deemed to meet the more-likely-than-not threshold would be recorded as tax benefit or expense in the current year. The Fund has determined that there was no effect on the financial statements from following this authoritative guidance. In the normal course of business, the Fund is subject to examination by federal, state and local jurisdictions, where applicable, for tax years for which applicable statutes of limitations have not expired.
For the year ended April 30, 2017, the tax character of distributions paid by the Fund was $1,157,045 of ordinary income dividends. Distributions from short-term capital gains are treated as ordinary income for federal income tax purposes.
As of April 30, 2017, the components of distributable earnings on a tax basis were as follows:
Capital Loss Carryforward | Undistributed Ordinary Income | Undistributed Long-Term Gain | Unrealized Appreciation | Qualified Late-Year Losses | Other Book/Tax Differences | |||||
| $(3,521,111) | $367,740 | $— | $10,254,018 | $— | $(8,043) |
20
QUALITY DIVIDEND FUND
Notes to Financial Statements (Concluded)
October 31, 2017
(Unaudited)
The differences between the book and tax basis components of distributable earnings relate primarily to the timing and recognition of income and gains for federal income tax purposes. Short-term capital gains are reported as ordinary income for federal income tax purposes.
As of October 31, 2017, the federal tax cost, aggregate gross unrealized appreciation and depreciation of securities held by the Fund were as follows:
Federal tax cost* | $ | 61,488,386 | ||||||
|
| |||||||
Gross unrealized appreciation | $ | 12,342,204 | ||||||
Gross unrealized depreciation | (992,741 | ) | ||||||
|
| |||||||
Net unrealized appreciation | $ | 11,349,463 | ||||||
|
|
| * | Because tax adjustments are calculated annually at the end of the Fund’s fiscal year, the above table does not reflect tax adjustments for the current fiscal year. For the previous year’s federal income tax information, please refer to the Notes to Financial Statements section in the Fund’s most recent annual report. |
Pursuant to federal income tax rules applicable to regulated investment companies, the Fund may elect to treat certain capital losses between November 1 and April 30 and late year ordinary losses ((i) ordinary losses between January 1 and April 30, and (ii) specified ordinary and currency losses between November 1 and April 30) as occurring on the first day of the following tax year. For the year ended April 30, 2017, the Fund had no short-term capital loss deferrals, no long-term capital loss deferrals or ordinary loss deferrals.
Accumulated capital losses represent net capital loss carryforwards as of April 30, 2017 that may be available to offset future realized capital gains and thereby reduce future capital gains distributions. As of April 30, 2017, the Fund’s capital loss carryforwards were $3,521,111, of which $1,380,809 were short-term losses and $2,140,302 were long-term losses. All losses will be carried forward indefinitely and will retain their character as short-term and long-term capital losses.
6. Subsequent Events
Management has evaluated the impact of all subsequent events on the Fund through the date the financial statements were issued and has determined that there were no subsequent events requiring recognition or disclosure in the financial statements.
21
QUALITY DIVIDEND FUND
Other Information
(Unaudited)
Proxy Voting
Policies and procedures that the Fund uses to determine how to vote proxies relating to portfolio securities as well as information regarding how the Fund voted proxies relating to portfolio securities for the most recent 12-month period ended June 30 are available without charge, upon request, by calling (888) 201-5799 and on the Securities and Exchange Commission’s (“SEC”) website at http:// www.sec.gov.
Quarterly Portfolio Schedules
The Trust files its complete schedule of portfolio holdings with the SEC for the first and third fiscal quarters of each fiscal year (quarters ended July 31 and January 31) on Form N-Q. The Trust’s Forms N-Q are available on the SEC’s website at http://www.sec.gov and may be reviewed and copied at the SEC’s Public Reference Room in Washington, D.C. Information on the operation of the SEC’s Public Reference Room may be obtained by calling 1-800-SEC-0330.
Board Consideration of Investment Advisory Agreement
At a meeting held on September 27-28, 2017 (the “Meeting”), the Board of Trustees (the “Board” or the “Trustees”) of FundVantage Trust (the “Trust”), including a majority of the Trustees who are not “interested persons” within the meaning of Section 2(a)(19) of the Investment Company Act of 1940, as amended (the “1940 Act”) (the “Independent Trustees”), unanimously approved the continuation of the Advisory agreement between Choice Financial Partners, Inc. doing business as EquityCompass Strategies (“EquityCompass” or the “Adviser”) and the Trust (the “Agreement”) on behalf of Quality Dividend Fund (the “Fund”). At the Meeting, the Board considered the continuation of the Agreement with respect to the Fund for an additional one year period.
In determining whether to approve the Agreement, the Trustees considered information provided by the Adviser in accordance with Section 15(c) of the 1940 Act regarding: (i) services performed for the Fund, (ii) the size and qualifications of their portfolio management staff, (iii) any potential or actual material conflicts of interest which may arise in connection with a portfolio manager’s management of the Fund, (iv) investment performance, (v) the capitalization and financial condition of EquityCompass, (vi) brokerage selection procedures (including soft dollar arrangements, if any), (vii) the procedures for allocating investment opportunities between the Fund and other clients, (viii) results of any regulatory examination, including any recommendations or deficiencies noted, (ix) any litigation, investigation or administrative proceeding which may have a material impact on EquityCompass’s ability to service the Fund, (x) compliance with the Fund’s investment objectives, policies and practices (including codes of ethics and proxy voting policies) and (xi) compliance with federal securities laws and other regulatory requirements. The Trustees noted the reports and discussions with portfolio managers as provided at
22
QUALITY DIVIDEND FUND
Other Information
(Unaudited) (Continued)
the Board meetings throughout the year covering matters such as the relative performance of the Fund; compliance with the investment objectives, policies, strategies and limitations for the Fund; the compliance of management personnel with the applicable code of ethics; and the adherence to the Trust’s pricing procedures as established by the Board.
Representatives from EquityCompass attended the Meeting in person. The representatives discussed the firm’s history, performance and investment strategies in connection with the proposed approval of the Agreement and answered questions from the Board.
Performance. The Trustees considered the investment performance for the Quality Dividend Fund and EquityCompass. The Trustees reviewed the historical performance charts which showed the performance of the Class A shares and Class C shares of the Quality Dividend Fund as compared to the Lipper Global Equity Income Fund Index, the Quality Dividend Fund’s applicable Lipper index for the year-to-date, one year, two year, three year, and since inception periods ended June 30, 2017, as applicable. The Trustees also reviewed historical performance charts which showed the performance of the Quality Dividend Fund’s Class A shares as compared to the Russell 1000 Value Index for the one year, three year and since inception periods ended July 31, 2017. The Trustees considered the short term and long term performance of the Quality Dividend Fund, as applicable. The Trustees noted that they considered performance reports provided at Board meetings throughout the year.
The Trustees noted that the Class A and Class C shares of the Quality Dividend Fund had underperformed the Lipper Global Equity Income Fund Index for the year-to-date and one year, periods ended June 30, 2017, and outperformed the Lipper Global Equity Income Fund Index for the two year, three year and since inception periods ended June 30, 2017. The Trustees also noted that the Class A shares of the Quality Dividend Fund underperformed the Russell 1000 Value Index for the one year, three year and since inception periods ended July 31, 2017. The Trustees concluded that the performance of the Quality Dividend Fund was within an acceptable range of performance relative to other mutual funds with similar investment objectives, strategies and policies based on the information provided at the Meeting.
Fees. The Trustees noted that the representatives of EquityCompass had provided information regarding its Advisory fees and an analysis of these fees in relation to the services provided to the Fund and any other ancillary benefit resulting from EquityCompass’ relationship with the Fund. The Trustees also reviewed information regarding the fees that EquityCompass charges to its separately managed accounts, and evaluated the explanations provided by EquityCompass as to differences in fees charged to the Quality Dividend Fund and separately managed accounts. The Trustees also reviewed a peer comparison of Advisory fees and total expenses for the Fund versus the universe of funds with similar share classes in the Lipper Global Equity Income Fund category with $250 million or less in assets. The Trustees noted that the gross Advisory fee and net total expense ratio of the Fund’s Class A and Class C shares were lower than the median of the gross Advisory fee and net total expense ratio of the funds with a similar share class in the Lipper Global Equity Income Fund category with $250 million or less in assets. The
23
QUALITY DIVIDEND FUND
Other Information
(Unaudited) (Continued)
Trustees concluded that the Advisory fees and services provided by EquityCompass are consistent with those of other advisers which manage mutual funds with investment objectives, strategies and policies similar to those of the Quality Dividend Fund based on the information provided at the Meeting.
Knowledge, experience, and qualifications. The Board considered the level and depth of knowledge of EquityCompass, including the professional experience and qualifications of senior personnel. In evaluating the quality of services to be provided by EquityCompass, the Board took into account its familiarity with EquityCompass’ senior management through Board meetings, discussions and reports during the preceding year. The Board also took into account EquityCompass’ compliance policies and procedures and reports regarding EquityCompass’ compliance operations from the Trust’s Chief Compliance Officer. The Board also considered any potential conflicts of interest that may arise in a portfolio manager’s management of the Quality Dividend Fund’s investments on the one hand, and the investments of other accounts, on the other. The Trustees reviewed the services provided to the Quality Dividend Fund by EquityCompass and concluded that the nature, extent and quality of the services provided were appropriate and consistent with the terms of the Agreement, that the quality of the proposed services appeared to be consistent with industry norms and that the Quality Dividend Fund is likely to benefit from the continued receipt of those services. They also concluded that EquityCompass has sufficient personnel, with the appropriate education and experience, to serve the Quality Dividend effectively and had demonstrated their ability to attract and retain qualified personnel.
Costs. The Trustees reviewed materials regarding the costs of the services provided by EquityCompass, the compensation and benefits received by EquityCompass in providing services to the Quality Dividend Fund, as well as EquityCompass’ profitability. The Trustees were provided with the most recent Item 6 (Selected Financial Data) from the Form 10-K of Stifel Financial Corp., EquityCompass’ parent company, for its most recent fiscal year ended December 31, 2016. The Trustees noted that EquityCompass’ level of profitability is an important factor to consider, and the Trustees should be satisfied that EquityCompass’ profits are sufficient to continue as a healthy concern generally and as investment adviser of the Quality Dividend specifically. The Trustees concluded that EquityCompass’ Advisory fee level was reasonable in relation to the nature and quality of the services provided, taking into account the current size and projected growth of the Quality Dividend Fund.
Economies of Scale. The Trustees considered the extent to which economies of scale would be realized relative to fee levels as the Quality Dividend Fund grows, and whether the Advisory fee levels reflect these economies of scale for the benefit of shareholders. The Board noted that economies of scale may be achieved at higher asset levels for the Quality Dividend Fund for the benefit of fund shareholders, but that the Advisory fee did not currently include breakpoint reductions as asset levels increased.
At the Meeting, the Trustees unanimously approved the continuation of the Agreement for an additional one year period. In approving the continuation of the Agreement, the Board considered all factors it deemed relevant and the information presented to the Board by EquityCompass. In arriving at its decision, the
24
QUALITY DIVIDEND FUND
Other Information
(Unaudited) (Concluded)
Board did not identify any single factor as being of paramount importance and each member of the Board gave varying weights to each factor according to his or her own judgment. The Board determined that the continuation of the Agreement for an additional one year period would be in the best interests of the Quality Dividend Fund and its shareholders.
25
[THIS PAGE INTENTIONALLY LEFT BLANK.]
[THIS PAGE INTENTIONALLY LEFT BLANK.]
Investment Adviser
Choice Financial Partners, Inc.
d/b/a EquityCompass Strategies
501 North Broadway
St. Louis, MO 63102
Administrator
BNY Mellon Investment Servicing (US) Inc.
301 Bellevue Parkway
Wilmington, DE 19809
Transfer Agent
BNY Mellon Investment Servicing (US) Inc.
4400 Computer Drive
Westborough, MA 01581
Principal Underwriter
Foreside Funds Distributors LLC
400 Berwyn Park
899 Cassatt Road
Berwyn, PA 19312
Custodian
The Bank of New York Mellon
225 Liberty Street
New York, NY 10286
Independent Registered Public Accounting Firm
Ernst & Young LLP
One Commerce Square
2005 Market Street, Suite 700
Philadelphia, PA 19103-7096
Legal Counsel
Pepper Hamilton LLP
3000 Two Logan Square
18th and Arch Streets
Philadelphia, PA 19103

QUALITY DIVIDEND
FUND
of
FundVantage Trust
Class A (QDVAX)
Class C (QDVCX)
Institutional Class (QDVIX)
SEMI-ANNUAL
REPORT
October 31, 2017
(Unaudited)
This report is submitted for the general information of the shareholders of the Quality Dividend Fund. It is not authorized for distribution unless preceded or accompanied by a current prospectus for the Quality Dividend Fund.
QUA-1017
SKYBRIDGE DIVIDEND VALUE FUND
Semi-Annual
Performance Data
October 31, 2017
(Unaudited)
| Average Annual Total Returns for Periods Ended October 31, 2017 | ||||||||||||||||
| Six | Since | |||||||||||||||
| Months† | 1 Year | 3 Year | Inception | |||||||||||||
Class A Shares (with sales charge)* | -6.41% | -1.16% | 3.74% | 3.81% | ||||||||||||
Class A Shares (without sales charge)* | -0.67% | 4.86% | 5.80% | 5.64% | ||||||||||||
S&P 500® Index | 9.10% | 23.63% | 10.76% | 11.06%(a) | ||||||||||||
Class C Shares* | -1.07% | 4.03% | 4.98% | 7.03% | ||||||||||||
S&P 500® Index | 9.10% | 23.63% | 10.76% | 13.11%(a) | ||||||||||||
Class I Shares* | -0.54% | 5.09% | 6.07% | 6.96% | ||||||||||||
S&P 500® Index | 9.10% | 23.63% | 10.76% | 12.10%(a) | ||||||||||||
| † | Not Annualized. |
| * | Class A shares, Class C shares and Class I shares of the SkyBridge Dividend Value Fund (the “Fund”) commenced operations on June 13, 2014, October 17, 2014 and April 7, 2014, respectively. |
| (a) | Benchmark performance is from inception date of the Class only and is not the inception date of the benchmark itself. |
The performance data quoted represents past performance and does not guarantee future results. The investment return and principal value of an investment in the Fund will fluctuate so that an investor’s shares, when redeemed, may be worth more or less than their original cost. The table does not reflect the deduction of taxes that a shareholder would pay on Fund distributions or redemption of Fund shares. Current performance may be lower or higher. Performance data current to the most recent month-end may be obtained by calling (888) 919-6885.
The returns shown for Class A shares reflect a deduction for the maximum front-end sales charge of 5.75%. As stated in the current prospectus dated September 1, 2017, the Fund’s “Total Annual Fund Operating Expenses” are 1.19%, 1.94% and 0.94%, and the Fund’s “Total Annual Fund Operating Expenses After Fee Waiver and/or Expense Reimbursement” are 1.25%, 2.00% and 1.00% for Class A shares, Class C shares and Class I shares, respectively, of the Fund’s average daily net assets. These ratios may differ from the actual expenses incurred by the Fund for the period covered by this report. SkyBridge Capital II, LLC (“SkyBridge” or the “Adviser”) has contractually agreed to reduce its management fee and/or reimburse certain expenses of the Fund to the extent necessary to ensure that the Fund’s total operating expenses (excluding taxes, “Acquired Fund Fees and Expenses,” interest, extraordinary items and brokerage commissions) do not exceed (on an annual basis) 1.25% with respect to Class A shares, 2.00% with respect to Class C shares and 1.00% with respect to Class I shares of average daily net assets of the Fund (the “Expense Limitation”). The Expense Limitation will remain in place until August 31, 2018, unless the Board of Trustees of FundVantage Trust (the “Trust”) approves its earlier termination. Total returns would be lower had such fees and/or expenses not been waived and/or reimbursed. The Adviser is entitled to recover, subject to approval by the Board of Trustees, such amounts reduced or reimbursed for a period of up to three (3) years from the year in which the Adviser reduced its compensation and/or assumed expenses for the Fund. The Adviser is permitted to seek reimbursement from the Fund, subject to certain limitations, for fees it waived and Fund expenses it paid to the extent the total annual fund expenses do not exceed the limits described above or any lesser limits in effect at the time of reimbursement. No recoupment will occur unless the Fund’s expenses are below the Expense Limitation amount.
1
SKYBRIDGE DIVIDEND VALUE FUND
Semi-Annual
Performance Data (Concluded)
October 31, 2017
(Unaudited)
Mutual fund investing involves risk including the possible loss of principal. The Fund’s long term “buy and hold” strategy under certain market conditions may cause it to be more susceptible to general market declines. The Fund seeks to invest in securities with dividend yield potential with both growth and value characteristics. Value investing involves the risk that companies believed to be undervalued may not appreciate as anticipated. There are no guarantees a company will continue to pay or increase its dividend. The Fund may invest in small to mid-capitalization companies which may be more volatile and less liquid than stocks of larger companies.
The Fund intends to evaluate performance as compared to that of the S&P 500® Index. The S&P 500® Index is a widely recognized, unmanaged index of 500 common stocks which are generally representative of the U.S. stock market as a whole. It is not possible to invest in an index.
2
SKYBRIDGE DIVIDEND VALUE FUND
Fund Expense Disclosure
October 31, 2017
(Unaudited)
As a shareholder of the Fund, you incur two types of costs: (1) transaction costs including sales charges (loads) on purchase payments (if any) or redemption fees; and (2) ongoing costs, including management fees, distribution and/or service (Rule 12b-1) fees (if any) and other Fund expenses. These examples are intended to help you understand your ongoing costs (in dollars) of investing in the Fund and to compare these costs with the ongoing costs of investing in other mutual funds.
These examples are based on an investment of $1,000 invested at the beginning of the six-month period from May 1, 2017 through October 31, 2017 and held for the entire period.
Actual Expenses
The first line of the accompanying table provides information about actual account values and actual expenses. You may use the information in this line, together with the amount you invested, to estimate the expenses that you paid over the period. Simply divide your account value by $1,000 (for example, an $8,600 account value divided by $1,000 = 8.6), then multiply the result by the number in the first line under the heading entitled “Expenses Paid During Period” to estimate the expenses you paid on your account during this period.
Hypothetical Examples for Comparison Purposes
The second line of the accompanying table provides information about hypothetical account values and hypothetical expenses based on the Fund’s actual expense ratio and an assumed rate of return of 5% per year before expenses, which is not your Fund’s actual return. The hypothetical account values and expenses may not be used to estimate the actual ending account balance or expenses you paid for the period. You may use this information to compare the ongoing costs of investing in the Fund and other funds. To do so, compare these 5% hypothetical examples with the 5% hypothetical examples that appear in the shareholder reports of other funds.
Please note that the expenses shown in the accompanying table are meant to highlight your ongoing costs only and do not reflect any transactional costs, such as sales charges (loads) on purchase payments (if any) or redemption fees. Therefore, the second line of the accompanying table is useful in comparing ongoing costs only, and will not help you determine the relative total costs of owning different funds. In addition, if these transactional costs were included, your costs would have been higher.
3
SKYBRIDGE DIVIDEND VALUE FUND
Fund Expense Disclosure (Concluded)
October 31, 2017
(Unaudited)
| SkyBridge Dividend Value Fund | ||||||||||||
| Beginning Account Value | Ending Account Value | Expenses Paid | ||||||||||
| May 1, 2017 | October 31, 2017 | During Period* | ||||||||||
Class A | ||||||||||||
Actual | $1,000.00 | $ 993.30 | $ 6.28 | |||||||||
Hypothetical (5% return before expenses) | 1,000.00 | 1,018.90 | 6.36 | |||||||||
Class C | ||||||||||||
Actual | $1,000.00 | $ 989.30 | $10.03 | |||||||||
Hypothetical (5% return before expenses) | 1,000.00 | 1,015.12 | 10.16 | |||||||||
Class I | ||||||||||||
Actual | $1,000.00 | $ 994.60 | $ 5.03 | |||||||||
Hypothetical (5% return before expenses) | 1,000.00 | 1,020.16 | 5.09 | |||||||||
| * | Expenses are equal to an annualized expense ratio for the six-month period ended October 31, 2017 of 1.25%, 2.00% and 1.00% for Class A, Class C and Class I shares, respectively, for the Fund, multiplied by the average account value over the period, multiplied by the number of days in the most recent period (184), then divided by 365 to reflect the period. The Fund’s ending account values on the first line in the table are based on the actual six-month total returns for the Fund of (0.67%), (1.07%) and (0.54%) for Class A, Class C and Class I shares, respectively. |
4
SKYBRIDGE DIVIDEND VALUE FUND
Portfolio Holdings Summary Table
October 31, 2017
(Unaudited)
The following table presents a summary by sector of the portfolio holdings of the Fund:
| % of Net | ||||||||
| Assets | Value | |||||||
COMMON STOCKS: | ||||||||
Consumer Discretionary | 32.9% | $103,113,306 | ||||||
Information Technology | 19.9 | 62,311,863 | ||||||
Industrials | 18.2 | 57,214,103 | ||||||
Health Care | 12.1 | 37,818,170 | ||||||
Energy | 7.1 | 22,176,852 | ||||||
Telecommunication Services | 6.4 | 20,104,814 | ||||||
Consumer Staples | 3.6 | 11,390,074 | ||||||
Liabilities in Excess of Other Assets | (0.2) | (568,891) | ||||||
NET ASSETS | 100.0% | $313,560,291 | ||||||
Portfolio holdings are subject to change at any time.
The accompanying notes are an integral part of the financial statements.
5
SKYBRIDGE DIVIDEND VALUE FUND
Portfolio of Investments
October 31, 2017
(Unaudited)
| Number of Shares | Value | |||||||
COMMON STOCKS — 100.2% |
| |||||||
Consumer Discretionary — 32.9% |
| |||||||
Best Buy Co., Inc. | 219,497 | $ | 12,287,442 | |||||
GameStop Corp., Class A | 480,374 | 8,978,190 | ||||||
Interpublic Group of Cos, Inc. (The) | 431,681 | 8,309,859 | ||||||
Kohl’s Corp. | 267,518 | 11,171,552 | ||||||
L Brands, Inc. | 224,412 | 9,658,692 | ||||||
Macy’s, Inc. | 363,526 | 6,819,748 | ||||||
Mattel, Inc. | 421,325 | 5,949,109 | ||||||
Nordstrom, Inc. | 228,760 | 9,070,334 | ||||||
Tapestry, Inc. | 265,913 | 10,889,137 | ||||||
Tupperware Brands Corp. | 165,074 | 9,698,098 | ||||||
Williams-Sonoma, Inc. | 199,247 | 10,281,145 | ||||||
|
| |||||||
| 103,113,306 | ||||||||
|
| |||||||
Consumer Staples — 3.6% | ||||||||
Coca-Cola Co. (The) | 247,718 | 11,390,074 | ||||||
|
| |||||||
Energy — 7.1% | ||||||||
Chevron Corp. | 98,560 | 11,422,118 | ||||||
Exxon Mobil Corp. | 129,031 | 10,754,734 | ||||||
|
| |||||||
| 22,176,852 | ||||||||
|
| |||||||
Health Care — 12.1% | ||||||||
AbbVie, Inc. | 164,562 | 14,851,721 | ||||||
Gilead Sciences, Inc. | 159,909 | 11,986,779 | ||||||
Pfizer, Inc. | 313,168 | 10,979,670 | ||||||
|
| |||||||
| 37,818,170 | ||||||||
|
| |||||||
Industrials — 18.2% | ||||||||
Boeing Co. (The) | 60,251 | 15,543,553 | ||||||
Caterpillar, Inc. | 112,933 | 15,336,301 | ||||||
| Number of Shares | Value | |||||||
COMMON STOCKS — (Continued) |
| |||||||
Industrials — (Continued) | ||||||||
General Electric Co. | 357,410 | $ | 7,205,386 | |||||
Pitney Bowes, Inc. | 827,281 | 11,366,841 | ||||||
RR Donnelley & Sons Co. | 843,698 | 7,762,022 | ||||||
|
| |||||||
| 57,214,103 | ||||||||
|
| |||||||
Information Technology — 19.9% |
| |||||||
CA, Inc. | 333,097 | 10,785,681 | ||||||
Cisco Systems, Inc. | 323,906 | 11,061,390 | ||||||
HP, Inc. | 583,677 | 12,578,239 | ||||||
International Business Machines Corp. | 62,194 | 9,581,608 | ||||||
QUALCOMM, Inc. | 199,603 | 10,181,749 | ||||||
Seagate Technology PLC (Ireland) | 219,724 | 8,123,196 | ||||||
|
| |||||||
| 62,311,863 | ||||||||
|
| |||||||
Telecommunication Services — 6.4% |
| |||||||
AT&T, Inc. | 288,059 | 9,693,185 | ||||||
Verizon Communications, Inc. | 217,498 | 10,411,629 | ||||||
|
| |||||||
| 20,104,814 | ||||||||
|
| |||||||
TOTAL COMMON STOCKS | 314,129,182 | |||||||
|
| |||||||
TOTAL INVESTMENTS - 100.2% |
| |||||||
(Cost $305,717,170) | 314,129,182 | |||||||
LIABILITIES IN EXCESS OF OTHER ASSETS - (0.2)% | (568,891 | ) | ||||||
|
| |||||||
NET ASSETS - 100.0% | $ | 313,560,291 | ||||||
|
| |||||||
The accompanying notes are an integral part of the financial statements.
6
SKYBRIDGE DIVIDEND VALUE FUND
Statement of Assets and Liabilities
October 31, 2017
(Unaudited)
Assets | ||||
Investments, at value (Cost $305,717,170) | $ | 314,129,182 | ||
Cash | 2,798,130 | |||
Receivable for investments sold | 4,790,157 | |||
Receivable for capital shares sold | 129,357 | |||
Dividends receivable | 567,511 | |||
Prepaid expenses and other assets | 76,706 | |||
|
| |||
Total assets | 322,491,043 | |||
|
| |||
Liabilities | ||||
Payable for capital shares redeemed | 5,433,048 | |||
Due to Custodian | 3,045,134 | |||
Payable to Investment Adviser | 208,662 | |||
Payable for administration and accounting fees | 75,343 | |||
Payable for transfer agent fees | 52,423 | |||
Payable for distribution fees | 48,221 | |||
Payable for custodian fees | 16,160 | |||
Accrued expenses | 51,761 | |||
|
| |||
Total liabilities | 8,930,752 | |||
|
| |||
Net Assets | $ | 313,560,291 | ||
|
| |||
Net Assets consisted of: | ||||
Capital stock, $0.01 par value | $ | 285,117 | ||
Paid-in capital | 307,319,962 | |||
Accumulated net investment income | 328,438 | |||
Accumulated net realized loss from investments | (2,785,238 | ) | ||
Net unrealized appreciation on investments | 8,412,012 | |||
|
| |||
Net Assets | $ | 313,560,291 | ||
|
|
Class A Shares: | ||||
Net asset value, redemption price per share | $ | 11.01 | ||
|
| |||
Maximum offering price per share (100/94.25 of $11.01) | $ | 11.68 | ||
|
| |||
Class C Shares: | ||||
Net asset value, offering and redemption price per share | $ | 10.94 | ||
|
| |||
Class I Shares: | ||||
Net asset value, offering and redemption price per share | $ | 11.01 | ||
|
|
The accompanying notes are an integral part of the financial statements.
7
SKYBRIDGE DIVIDEND VALUE FUND
Statement of Operations
For the Six Months Ended October 31, 2017
(Unaudited)
Investment income | ||||
Dividends | $ | 7,758,069 | ||
|
| |||
Total investment income | 7,758,069 | |||
|
| |||
Expenses | ||||
Advisory fees (Note 2) | 1,444,261 | |||
Distribution fees (Class C shares) (Note 2) | 183,945 | |||
Distribution fees (Class A shares) (Note 2) | 144,020 | |||
Transfer agent fees (Note 2) | 109,290 | |||
Administration and accounting fees (Note 2) | 108,946 | |||
Shareholder servicing fees (Class C shares) (Note 2) | 61,315 | |||
Trustees’ and officers’ fees (Note 2) | 51,706 | |||
Registration and filing fees | 43,276 | |||
Legal fees | 22,342 | |||
Custodian fees (Note 2) | 21,648 | |||
Printing and shareholder reporting fees | 21,149 | |||
Audit fees | 13,155 | |||
Other expenses | 16,653 | |||
|
| |||
Total expenses before recoupment | 2,241,706 | |||
|
| |||
Plus: Net expenses recouped (Note 2) | 73,361 | |||
|
| |||
Net expenses after recoupment | 2,315,067 | |||
|
| |||
Net investment income | 5,443,002 | |||
|
| |||
Net realized and unrealized gain/(loss) from investments: | ||||
Net realized loss from investments | (12,533,392 | ) | ||
Net change in unrealized appreciation/(depreciation) on investments | 3,842,214 | |||
|
| |||
Net realized and unrealized loss on investments | (8,691,178 | ) | ||
|
| |||
Net decrease in net assets resulting from operations | $ | (3,248,176 | ) | |
|
|
The accompanying notes are an integral part of the financial statements.
8
SKYBRIDGE DIVIDEND VALUE FUND
Statements of Changes in Net Assets
| For the Six Months Ended October 31, 2017 (Unaudited) | For the Year Ended April 30, 2017 | |||||||||
Increase in net assets from operations: | ||||||||||
Net investment income | $ | 5,443,002 | $ | 11,804,818 | ||||||
Net realized gain/(loss) from investments | (12,533,392 | ) | 15,003,234 | |||||||
Net change in unrealized appreciation/(depreciation) on investments | 3,842,214 | (826,659 | ) | |||||||
|
|
|
| |||||||
Net increase/(decrease) in net assets resulting from operations | (3,248,176 | ) | 25,981,393 | |||||||
|
|
|
| |||||||
Less dividends and distributions to shareholders from: | ||||||||||
Net investment income: | ||||||||||
Class A | (1,716,251 | ) | (3,212,939 | ) | ||||||
Class C | (526,823 | ) | (1,066,516 | ) | ||||||
Class I | (3,545,089 | ) | (7,045,406 | ) | ||||||
|
|
|
| |||||||
Total net investment income | (5,788,163 | ) | (11,324,861 | ) | ||||||
|
|
|
| |||||||
Net realized capital gains: | ||||||||||
Class A | — | (4,270,004 | ) | |||||||
Class C | — | (1,925,551 | ) | |||||||
Class I | — | (9,003,741 | ) | |||||||
|
|
|
| |||||||
Total net realized capital gains | — | (15,199,296 | ) | |||||||
|
|
|
| |||||||
Net decrease in net assets from dividends and distributions to shareholders | (5,788,163 | ) | (26,524,157 | ) | ||||||
|
|
|
| |||||||
Increase/(decrease) in net assets derived from capital share transactions (Note 4) | (119,544,493 | ) | 118,461,438 | |||||||
|
|
|
| |||||||
Total increase/(decrease) in net assets | (128,580,832 | ) | 117,918,674 | |||||||
|
|
|
| |||||||
Net assets | ||||||||||
Beginning of period | 442,141,123 | 324,222,449 | ||||||||
|
|
|
| |||||||
End of period | $ | 313,560,291 | $ | 442,141,123 | ||||||
|
|
|
| |||||||
Accumulated net investment income, end of period | $ | 328,438 | $ | 673,599 | ||||||
|
|
|
| |||||||
The accompanying notes are an integral part of the financial statements.
9
SKYBRIDGE DIVIDEND VALUE FUND
Financial Highlights
Contained below is per share operating performance data for Class A shares outstanding, total investment return, ratios to average net assets and other supplemental data for the respective period. The total returns in the table represent the rate that an investor would have earned or lost on an investment in the Fund (assuming reinvestment of all dividends and distributions). This information has been derived from information provided in the financial statements and should be read in conjunction with the financial statements and the notes thereto.
| Class A Shares | ||||||||||||||||||||
| For the Six Months Ended October 31, 2017 (Unaudited) | For the Year Ended April 30, 2017 | For the Year Ended April 30, 2016 | For the Period June 13, 2014* to April 30, 2015 | |||||||||||||||||
Per Share Operating Performance | ||||||||||||||||||||
Net asset value, beginning of period | $ | 11.24 | $ | 11.31 | $ | 11.27 | $ | 10.47 | ||||||||||||
|
|
|
|
|
|
|
| |||||||||||||
Net investment income(1) | 0.16 | 0.30 | 0.26 | 0.23 | ||||||||||||||||
Net realized and unrealized gain/(loss) on investments | (0.22 | ) | 0.30 | 0.24 | 0.78 | |||||||||||||||
|
|
|
|
|
|
|
| |||||||||||||
Net increase/(decrease) in net assets resulting from operations | (0.06 | ) | 0.60 | 0.50 | 1.01 | |||||||||||||||
|
|
|
|
|
|
|
| |||||||||||||
Dividends and distributions to shareholders from: | ||||||||||||||||||||
Net investment income | (0.17 | ) | (0.29 | ) | (0.24 | ) | (0.19 | ) | ||||||||||||
Net realized capital gains | — | (0.38 | ) | (0.22 | ) | (0.02 | ) | |||||||||||||
|
|
|
|
|
|
|
| |||||||||||||
Total dividends and distributions to shareholders | (0.17 | ) | (0.67 | ) | (0.46 | ) | (0.21 | ) | ||||||||||||
|
|
|
|
|
|
|
| |||||||||||||
Net asset value, end of period | $ | 11.01 | $ | 11.24 | $ | 11.31 | $ | 11.27 | ||||||||||||
|
|
|
|
|
|
|
| |||||||||||||
Total investment return(2) | (0.67 | )% | 5.35 | % | 4.76 | % | 9.74 | % | ||||||||||||
Ratio/Supplemental Data | ||||||||||||||||||||
Net assets, end of period (in thousands) | $ | 92,987 | $ | 126,802 | $ | 57,175 | $ | 37,732 | ||||||||||||
Ratio of expenses to average net assets | 1.25 | %(3) | 1.25 | % | 1.25 | % | 1.25 | %(3) | ||||||||||||
Ratio of expenses to average net assets without waivers and expense reimbursements or recoupment(4) | 1.21 | %(3) | 1.19 | % | 1.28 | % | 1.76 | %(3) | ||||||||||||
Ratio of net investment income to average net assets | 2.78 | %(3) | 2.66 | % | 2.39 | % | 2.48 | %(3) | ||||||||||||
Portfolio turnover rate | 4.78 | %(5) | 72.84 | % | 103.97 | % | 122.00 | %(6) | ||||||||||||
| * | Commencement of operations. |
| (1) | The selected per share data was calculated using the average shares outstanding method for the period. |
| (2) | Total investment return is calculated assuming a purchase of shares on the first day and a sale of shares on the last day of each period reported and includes reinvestment of dividends and distributions, if any. Total returns for periods less than one year are not annualized. Total investment return does not reflect the impact of the maximum front-end sales load of 5.75%. If reflected, the return would be lower. |
| (3) | Annualized. |
| (4) | During the period, certain fees were waived and/or reimbursed; or recouped, if any. If such fee waivers and/or reimbursements or recoupments had not occurred, the ratios would have been as indicated (See Note 2). |
| (5) | Not annualized. |
| (6) | Reflects portfolio turnover of the Fund for the year ended April 30, 2015. |
The accompanying notes are an integral part of the financial statements.
10
SKYBRIDGE DIVIDEND VALUE FUND
Financial Highlights (Continued)
Contained below is per share operating performance data for Class C shares outstanding, total investment return, ratios to average net assets and other supplemental data for the respective period. The total returns in the table represent the rate that an investor would have earned or lost on an investment in the Fund (assuming reinvestment of all dividends and distributions). This information has been derived from information provided in the financial statements and should be read in conjunction with the financial statements and the notes thereto.
| Class C Shares | ||||||||||||||||||||
| For the Six Months Ended October 31, 2017 (Unaudited) | For the Year Ended April 30, 2017 | For the Year Ended April 30, 2016 | For the Period October 17, 2014* to April 30, 2015 | |||||||||||||||||
Per Share Operating Performance | ||||||||||||||||||||
Net asset value, beginning of period | $ | 11.18 | $ | 11.26 | $ | 11.25 | $ | 9.95 | ||||||||||||
|
|
|
|
|
|
|
| |||||||||||||
Net investment income(1) | 0.11 | 0.22 | 0.18 | 0.08 | ||||||||||||||||
Net realized and unrealized gain/(loss) on investments | (0.23 | ) | 0.30 | 0.23 | 1.33 | |||||||||||||||
|
|
|
|
|
|
|
| |||||||||||||
Net increase/(decrease) in net assets resulting from operations | (0.12 | ) | 0.52 | 0.41 | 1.41 | |||||||||||||||
|
|
|
|
|
|
|
| |||||||||||||
Dividends and distributions to shareholders from: | ||||||||||||||||||||
Net investment income | (0.12 | ) | (0.22 | ) | (0.18 | ) | (0.09 | ) | ||||||||||||
Net realized capital gains | — | (0.38 | ) | (0.22 | ) | (0.02 | ) | |||||||||||||
|
|
|
|
|
|
|
| |||||||||||||
Total dividends and distributions to shareholders | (0.12 | ) | (0.60 | ) | (0.40 | ) | (0.11 | ) | ||||||||||||
|
|
|
|
|
|
|
| |||||||||||||
Net asset value, end of period | $ | 10.94 | $ | 11.18 | $ | 11.26 | $ | 11.25 | ||||||||||||
|
|
|
|
|
|
|
| |||||||||||||
Total investment return(2) | (1.07 | )% | 4.61 | % | 3.95 | % | 14.26 | % | ||||||||||||
Ratios/Supplemental Data | ||||||||||||||||||||
Net assets, end of period (in thousands) | $ | 41,162 | $ | 55,710 | $ | 43,537 | $ | 6,819 | ||||||||||||
Ratio of expenses to average net assets | 2.00 | %(3) | 2.00 | % | 2.00 | % | 2.00 | %(3) | ||||||||||||
Ratio of expenses to average net assets without waivers and expense reimbursements or recoupment(4) | 1.96 | %(3) | 1.94 | % | 2.03 | % | 2.32 | %(3) | ||||||||||||
Ratio of net investment income to average net assets | 2.03 | %(3) | 1.91 | % | 1.65 | % | 1.46 | %(3) | ||||||||||||
Portfolio turnover rate | 4.78 | %(5) | 72.84 | % | 103.97 | % | 122.00 | %(6) | ||||||||||||
| * | Commencement of operations. |
| (1) | The selected per share data was calculated using the average shares outstanding method for the period. |
| (2) | Total investment return is calculated assuming a purchase of shares on the first day and a sale of shares on the last day of each period reported and includes reinvestment of dividends and distributions, if any. Total returns for periods less than one year are not annualized. Total return does not reflect any applicable sales charge. |
| (3) | Annualized. |
| (4) | During the period, certain fees were waived and/or reimbursed; or recouped, if any. If such fee waivers and/or reimbursements or recoupments had not occurred, the ratios would have been as indicated (See Note 2). |
| (5) | Not annualized. |
| (6) | Reflects portfolio turnover of the Fund for the year ended April 30, 2015. |
The accompanying notes are an integral part of the financial statements.
11
SKYBRIDGE DIVIDEND VALUE FUND
Financial Highlights (Concluded)
Contained below is per share operating performance data for Class I shares outstanding, total investment return, ratios to average net assets and other supplemental data for the respective period. The total returns in the table represent the rate that an investor would have earned or lost on an investment in the Fund (assuming reinvestment of all dividends and distributions). This information has been derived from information provided in the financial statements and should be read in conjunction with the financial statements and the notes thereto.
| Class I Shares | |||||||||||||||||||||||||
| For the Six Months Ended October 31, 2017 (Unaudited) | For the Year Ended April 30, 2017 | For the Year Ended April 30, 2016 | For the Year Ended April 30, 2015 | For the Period April 7, 2014* to April 30, 2014 | |||||||||||||||||||||
Per Share Operating Performance | |||||||||||||||||||||||||
Net asset value, beginning of period | $ | 11.24 | $ | 11.31 | $ | 11.26 | $ | 10.23 | $ | 10.00 | |||||||||||||||
|
|
|
|
|
|
|
|
|
| ||||||||||||||||
Net investment income(1) | 0.17 | 0.33 | 0.28 | 0.29 | — | (2) | |||||||||||||||||||
Net realized and unrealized gain/(loss) on investments | (0.22 | ) | 0.29 | 0.25 | 0.98 | 0.23 | |||||||||||||||||||
|
|
|
|
|
|
|
|
|
| ||||||||||||||||
Net increase/(decrease) in net assets resulting from operations | (0.05 | ) | 0.62 | 0.53 | 1.27 | 0.23 | |||||||||||||||||||
|
|
|
|
|
|
|
|
|
| ||||||||||||||||
Dividends and distributions to shareholders from: | |||||||||||||||||||||||||
Net investment income | (0.18 | ) | (0.31 | ) | (0.26 | ) | (0.22 | ) | — | ||||||||||||||||
Net realized capital gains | — | (0.38 | ) | (0.22 | ) | (0.02 | ) | — | |||||||||||||||||
|
|
|
|
|
|
|
|
|
| ||||||||||||||||
Total dividends and distributions to shareholders | (0.18 | ) | (0.69 | ) | (0.48 | ) | (0.24 | ) | — | ||||||||||||||||
|
|
|
|
|
|
|
|
|
| ||||||||||||||||
Net asset value, end of period | $ | 11.01 | $ | 11.24 | $ | 11.31 | $ | 11.26 | $ | 10.23 | |||||||||||||||
|
|
|
|
|
|
|
|
|
| ||||||||||||||||
Total investment return(3) | (0.54 | )% | 5.57 | % | 5.09 | % | 12.54 | % | 2.30 | % | |||||||||||||||
Ratios/Supplemental Data | |||||||||||||||||||||||||
Net assets, end of period (in thousands) | $ | 179,411 | $ | 259,629 | $ | 223,510 | $ | 55,918 | $ | 117 | |||||||||||||||
Ratio of expenses to average net assets | 1.00 | %(4) | 1.00 | % | 1.00 | % | 1.00 | % | | 1.00 | %(4) | ||||||||||||||
Ratio of expenses to average net assets without waivers and expense reimbursements or recoupment(5) | 0.96 | %(4) | 0.94 | % | 1.03 | % | 1.63 | % | | 646.65 | %(4) | ||||||||||||||
Ratio of net investment income to average net assets | 3.03 | %(4) | 2.91 | % | 2.64 | % | 2.70 | % | | 0.79 | %(4) | ||||||||||||||
Portfolio turnover rate | 4.78 | %(6) | 72.84 | % | 103.97 | % | 122.00 | % | | 1.98 | %(6) | ||||||||||||||
| * | Commencement of operations. |
| (1) | The selected per share data was calculated using the average shares outstanding method for the period. |
| (2) | Amount is less than $0.005 per share. |
| (3) | Total investment return is calculated assuming a purchase of shares on the first day and a sale of shares on the last day of each period reported and includes reinvestment of dividends and distributions, if any. |
| (4) | Annualized. |
| (5) | During the period, certain fees were waived and/or reimbursed; or recouped, if any. If such fee waivers and/or reimbursements or recoupments had not occurred, the ratios would have been as indicated (See Note 2). |
| (6) | Not annualized. |
The accompanying notes are an integral part of the financial statements.
12
SKYBRIDGE DIVIDEND VALUE FUND
Notes to Financial Statements
October 31, 2017
(Unaudited)
1. Organization and Significant Accounting Policies
The SkyBridge Dividend Value Fund (the “Fund”) is a diversified, open-end management investment company registered under the Investment Company Act of 1940, as amended (the “1940 Act”), which commenced operations on April 7, 2014. The Fund is a separate series of FundVantage Trust (the “Trust”) which was organized as a Delaware statutory trust on August 28, 2006. The Trust is a “series trust” authorized to issue an unlimited number of separate series or classes of shares of beneficial interest. Each series is treated as a separate entity for certain matters under the 1940 Act, and for other purposes, and a shareholder of one series is not deemed to be a shareholder of any other series. The Fund offers Class A, Class C and Class I shares. Class A shares are sold subject to a front-end sales charge. Front-end sales charges may be reduced or waived under certain circumstances. A contingent deferred sales charge (“CDSC”) may be applicable to the purchase of Class A shares. A CDSC, as a percentage of the lower of the original purchase price or net asset value at redemption, of up to 1.00% may be imposed on full or partial redemptions of Class A shares made within eighteen months of purchase where: (i) $1 million or more of Class A shares were purchased without an initial sales charge and (ii) the selling broker-dealer received a commission for such sale.
The Fund is an investment company and follows accounting and reporting guidance in the Financial Accounting Standards Board Accounting Standards Codification Topic 946.
Portfolio Valuation — The Fund’s net asset value (“NAV”) is calculated once daily at the close of regular trading hours on the New York Stock Exchange (“NYSE”) (typically 4:00 p.m. Eastern time) on each day the NYSE is open. Securities held by the Fund are valued using the closing price or the last sale price on a national securities exchange or the National Association of Securities Dealers Automatic Quotation System (“NASDAQ”) market system where they are primarily traded. Equity securities traded in the over-the-counter market are valued at their closing prices. If there were no transactions on that day, securities traded principally on an exchange or on NASDAQ will be valued at the mean of the last bid and ask prices prior to the market close. Fixed income securities having a remaining maturity of greater than 60 days are valued using an independent pricing service. Fixed income securities having a remaining maturity of 60 days or less are generally valued at amortized cost, provided such amount approximates fair value. Investments in other open-end investment companies are valued based on the NAV of the investment companies (which may use fair value pricing as discussed in their prospectuses). If market quotations are unavailable or deemed unreliable, securities will be valued in accordance with procedures adopted by the Trust’s Board of Trustees (“Board of Trustees”). Relying on prices supplied by pricing services or dealers or using fair valuation may result in values that are higher or lower than the values used by other investment companies and investors to price the same investments. In the event that market quotes are not readily available, and the security or asset cannot be valued pursuant to one of the valuation methods, the value of the security or asset will be determined in good faith by the Adviser. The Trust has established a Valuation Committee which performs certain functions including the oversight of the Adviser’s fair valuation determinations.
13
SKYBRIDGE DIVIDEND VALUE FUND
Notes to Financial Statements (Continued)
October 31, 2017
(Unaudited)
Fair Value Measurements — The inputs and valuation techniques used to measure fair value of the Fund’s investments are summarized into three levels as described in the hierarchy below:
• Level 1 — | quoted prices in active markets for identical securities; | |
• Level 2 — | other significant observable inputs (including quoted prices for similar securities, interest rates, prepayment speeds, credit risk, etc.); and | |
• Level 3 — | significant unobservable inputs (including the Fund’s own assumptions in determining the fair value of investments). | |
The inputs or methodology used for valuing securities are not necessarily an indication of the risk associated with investing in those securities.
The following is a summary of the inputs used, as of October 31, 2017, in valuing the Fund’s investments carried at fair value:
| Total Value at 10/31/17 | Level 1 Quoted Prices | Level 2 Other Significant Observable Inputs | Level 3 Significant Unobservable Inputs | |||||||||||||
Investment in Securities* | $ | 314,129,182 | $ | 314,129,182 | $ | — | $ | — | ||||||||
|
|
|
|
|
|
|
| |||||||||
| * | Please refer to Portfolio of Investments for further details on portfolio holdings. |
At the end of each quarter, management evaluates the classification of Levels 1, 2 and 3 assets and liabilities. Various factors are considered, such as changes in liquidity from the prior reporting period; whether or not a broker is willing to execute at the quoted price; the depth and consistency of prices from third party pricing services; and the existence of contemporaneous, observable trades in the market. Additionally, management evaluates the classification of Level 1 and Level 2 assets and liabilities on a quarterly basis for changes in listings or delistings on national exchanges.
Due to the inherent uncertainty of determining the fair value of investments that do not have a readily available market value, the fair value of the Fund’s investments may fluctuate from period to period. Additionally, the fair value of investments may differ significantly from the values that would have been used had a ready market existed for such investments and may differ materially from the values the Fund may ultimately realize. Further, such investments may be subject to legal and other restrictions on resale or otherwise less liquid than publicly traded securities.
For fair valuations using significant unobservable inputs, U.S. generally accepted accounting principles (“U.S. GAAP”) require the Fund to present a reconciliation of the beginning to ending balances for reported market values that presents changes attributable to total realized and unrealized gains or losses, purchase
14
SKYBRIDGE DIVIDEND VALUE FUND
Notes to Financial Statements (Continued)
October 31, 2017
(Unaudited)
and sales, and transfers in and out of Level 3 during the period. Transfers in and out between Levels are based on values at the end of the period. U.S. GAAP also requires the Fund to disclose amounts and reasons for all transfers in and out of Level 1 and Level 2 fair value measurements. A reconciliation of Level 3 investments is presented only when the Fund had an amount of Level 3 investments at the end of the reporting period that was meaningful in relation to its net assets. The amounts and reasons for all transfers in and out of each Level within the three-tier hierarchy are disclosed when the Fund had an amount of total transfers during the reporting period that was meaningful in relation to its net assets as of the end of the reporting period.
For the six months ended October 31, 2017, there were no transfers between Levels 1, 2 and 3 for the Fund.
Use of Estimates — The preparation of financial statements in conformity with U.S. GAAP requires management to make estimates and assumptions that affect the amounts reported in the financial statements and accompanying notes at the date of the financial statements and the reported amounts of revenues and expenses during the period. Actual results could differ from those estimates and those differences could be material.
Investment Transactions, Investment Income and Expenses — Investment transactions are recorded on trade date for financial statement preparation purposes. Realized gains and losses on investments sold are recorded on the identified cost basis. Interest income is recorded on the accrual basis. Dividends are recorded on the ex-dividend date. Distribution (12b-1) fees and shareholder services fees relating to a specific class are charged directly to that class. General expenses of the Trust are generally allocated to each fund in proportion to its relative daily net assets. Expenses directly attributable to a particular fund in the Trust are charged directly to that fund. The Fund’s investment income, expenses (other than class-specific expenses) and unrealized and realized gains and losses are allocated daily to each class of shares based upon the relative proportion of net assets of each class at the beginning of the day.
Dividends and Distributions to Shareholders — Dividends from net investment income are declared and paid quarterly to shareholders. Distributions, if any, of net short-term capital gain and net capital gain (the excess of net long-term capital gain over the short-term capital loss) realized by the Fund, after deducting any available capital loss carryovers, are declared and paid to its shareholders annually. Income dividends and capital gain distributions are determined in accordance with U.S. federal income tax regulations, which may differ from U.S. GAAP. These differences may include the treatment of non-taxable dividends, expiring capital loss carryforwards and losses deferred due to wash sales and excise tax regulations. Permanent book and tax basis differences relating to shareholder distributions will result in reclassifications within the components of net assets.
U.S. Tax Status — No provision is made for U.S. income taxes as it is the Fund’s intention to continue to qualify for and elect the tax treatment applicable to regulated investment companies under Subchapter
15
SKYBRIDGE DIVIDEND VALUE FUND
Notes to Financial Statements (Continued)
October 31, 2017
(Unaudited)
M of the Internal Revenue Code of 1986, as amended (the “Internal Revenue Code”), and make the requisite distributions to its shareholders which will be sufficient to relieve it from U.S. income and excise taxes.
Other — In the normal course of business, the Fund may enter into contracts that provide general indemnifications. The Fund’s maximum exposure under these arrangements is dependent on claims that may be made against the Fund in the future, and therefore, cannot be estimated; however, based on experience, the risk of material loss for such claims is considered remote.
Recent Accounting Pronouncement — On August 1, 2017, the Fund implemented changes due to amendments to Regulation S-X, issued by the Securities and Exchange Commission, which require standardized, enhanced disclosures, particularly related to derivatives, in investment company financial statements. Adoption of the amendment had no effect on the Fund’s net assets or results of operations.
2. Transactions with Related Parties and Other Service Providers
SkyBridge Capital II, LLC (“SkyBridge” or the “Adviser”) serves as investment adviser to the Fund pursuant to an investment advisory agreement with the Trust (the “Advisory Agreement”). For its services, the Adviser is paid a monthly fee at the annual rate of 0.75% of the Fund’s average daily net assets. The Adviser has contractually agreed to reduce its management fee and/or reimburse certain expenses of the Fund to the extent necessary to ensure that the Fund’s total operating expenses (excluding taxes, “Acquired Fund Fees and Expenses,” interest, extraordinary items and brokerage commissions) do not exceed (on an annual basis) 1.25% with respect to Class A shares, 2.00% with respect to Class C shares and 1.00% with respect to Class I shares of average daily net assets of the Fund (the “Expense Limitation”). The Expense Limitation will remain in place until August 31, 2018, unless the Board of Trustees approves its earlier termination. The Adviser is entitled to recover, subject to approval by the Board of Trustees, such amounts reduced or reimbursed for a period of up to three (3) years from the year in which the Adviser reduced its compensation and/or assumed expenses for the Fund. The Adviser is permitted to seek reimbursement from the Fund, subject to certain limitations, for fees it waived and Fund expenses it paid to the extent the total annual fund expenses do not exceed the limits described above or any lesser limits in effect at the time of reimbursement. No recoupment will occur unless the Fund’s expenses are below the Expense Limitation amount. As of October 31, 2017, the amount of potential recovery was as follows:
Expiration |
April 30, 2019 |
$26,728 |
For the six months ended October 31, 2017, the Adviser earned advisory fees of $1,444,261 and recouped fees of $73,361 waived in prior periods.
16
SKYBRIDGE DIVIDEND VALUE FUND
Notes to Financial Statements (Continued)
October 31, 2017
(Unaudited)
Other Service Providers
BNY Mellon Investment Servicing (US) Inc. (“BNY Mellon”) serves as administrator and transfer agent for the Fund. For providing administrative and accounting services, BNY Mellon is entitled to receive a monthly fee equal to an annual percentage rate of the Fund’s average daily net assets, subject to certain minimum monthly fees. For providing transfer agency services, BNY Mellon is entitled to receive a monthly fee, subject to certain minimum, and out of pocket expenses.
The Bank of New York Mellon (the “Custodian”) provides certain custodial services to the Fund. The Custodian is entitled to receive a monthly fee, subject to certain minimum, and out of pocket expenses.
Foreside Funds Distributors LLC (the “Underwriter”) provides principal underwriting services to the Fund.
The Trust and the Underwriter are parties to an underwriting agreement. The Trust has adopted a distribution plan for Class A and Class C shares in accordance with Rule 12b-1 under the 1940 Act. Pursuant to the Class A and Class C shares plan, the Fund compensates the Underwriter for direct and indirect costs and expenses incurred in connection with advertising, marketing and other distribution services in an amount not to exceed 0.25% and 1.00% (0.75% Rule 12b-1 distribution fee and 0.25% shareholder service fee), respectively, on an annualized basis of the average daily net assets of the Fund’s Class A and Class C shares.
Trustees and Officers
The Trust is governed by its Board of Trustees. The Trustees receive compensation in the form of an annual retainer and per meeting fees for their services to the Trust. The remuneration paid to the Trustees by the Fund during the six months ended October 31, 2017 was $13,640. An employee of BNY Mellon serves as the Secretary of the Trust and is not compensated by the Fund or the Trust.
JW Fund Management LLC (“JWFM”) provides a Principal Executive Officer and Principal Financial Officer, respectively, to the Trust. JWFM is compensated for the services provided to the Trust.
Freeh Group International Solutions, LLC provides the Trust with a Chief Compliance Officer and an Anti-Money Laundering Officer.
17
SKYBRIDGE DIVIDEND VALUE FUND
Notes to Financial Statements (Continued)
October 31, 2017
(Unaudited)
3. Investment in Securities
For the six months ended October 31, 2017, aggregate purchases and sales of investment securities (excluding short-term investments) of the Fund were as follows:
| Purchases | Sales | |||||||
Investment Securities | $ | 18,146,930 | $ | 137,287,674 | ||||
4. Capital Share Transactions
For the six months ended October 31, 2017 and the year ended April 30, 2017, transactions in capital shares (authorized shares unlimited) were as follows:
| For the Six Months Ended October 31, 2017 (Unaudited) | For the Year Ended April 30, 2017 | |||||||||||||||||||
| Shares | Amount | Shares | Amount | |||||||||||||||||
Class A | ||||||||||||||||||||
Sales | 865,844 | $ | 9,649,321 | 7,970,106 | $ | 86,387,541 | ||||||||||||||
Reinvestments | 138,210 | 1,556,669 | 555,865 | 6,331,928 | ||||||||||||||||
Redemptions | (3,834,082 | ) | (41,837,711 | ) | (2,303,120 | ) | (26,136,355 | ) | ||||||||||||
|
|
|
|
|
|
|
| |||||||||||||
Net increase/(decrease) | (2,830,028 | ) | $ | (30,631,721 | ) | 6,222,851 | $ | 66,583,114 | ||||||||||||
|
|
|
|
|
|
|
| |||||||||||||
Class C | ||||||||||||||||||||
Sales | 196,468 | $ | 2,196,965 | 2,451,816 | $ | 27,626,953 | ||||||||||||||
Reinvestments | 22,567 | 253,081 | 111,394 | 1,264,111 | ||||||||||||||||
Redemptions | (1,442,249 | ) | (15,876,374 | ) | (1,445,109 | ) | (16,207,123 | ) | ||||||||||||
|
|
|
|
|
|
|
| |||||||||||||
Net increase/(decrease) | (1,223,214 | ) | $ | (13,426,328 | ) | 1,118,101 | $ | 12,683,941 | ||||||||||||
|
|
|
|
|
|
|
| |||||||||||||
Class I | ||||||||||||||||||||
Sales | 3,065,748 | $ | 33,972,722 | 13,024,377 | $ | 148,223,386 | ||||||||||||||
Reinvestments | 198,379 | 2,232,390 | 924,852 | 10,539,213 | ||||||||||||||||
Redemptions | (10,058,106 | ) | (111,691,556 | ) | (10,623,460 | ) | (119,568,216 | ) | ||||||||||||
|
|
|
|
|
|
|
| |||||||||||||
Net increase/(decrease) | (6,793,979 | ) | $ | (75,486,444 | ) | 3,325,769 | $ | 39,194,383 | ||||||||||||
|
|
|
|
|
|
|
| |||||||||||||
Total Net Increase/(Decrease) | (10,847,221 | ) | $ | (119,544,493 | ) | 10,666,721 | $ | 118,461,438 | ||||||||||||
|
|
|
|
|
|
|
| |||||||||||||
5. Federal Tax Information
The Fund has followed the authoritative guidance on accounting for and disclosure of uncertainty in tax positions, which requires the Fund to determine whether a tax position is more likely than not to be sustained upon examination, including resolution of any related appeals or litigation processes, based on the technical merits of the position. The Fund has determined that there was no effect on the financial statements from following this authoritative guidance. In the normal course of business, the Fund is subject to examination by federal, state and local jurisdictions, where applicable, for tax years for which applicable statutes of limitations have not expired.
18
SKYBRIDGE DIVIDEND VALUE FUND
Notes to Financial Statements (Continued)
October 31, 2017
(Unaudited)
For the year ended April 30, 2017, the tax character of distributions paid by the Fund was $20,570,952 of ordinary income dividends and $5,953,205 of long-term capital gains dividends. Distributions from short-term capital gains are treated as ordinary income for federal income tax purposes.
As of April 30, 2017, the components of distributable earnings on a tax basis were as follows:
Capital Loss Carryforward | Undistributed Ordinary Income | Undistributed Long-Term Gain | Unrealized Appreciation | |||
$ — | $8,775,866 | $4,280,405 | $1,935,280 |
The differences between the book and tax basis components of distributable earnings relate primarily to the timing and recognition of income and gains for federal income tax purposes. Short-term capital gains are reported as ordinary income for federal income tax purposes.
As of October 31, 2017, the federal tax cost, aggregate gross unrealized appreciation and depreciation of securities held by the Fund were as follows:
Federal tax cost* | $ | 305,717,170 | ||||
|
| |||||
Gross unrealized appreciation | $ | 39,159,311 | ||||
Gross unrealized depreciation | (30,747,299 | ) | ||||
|
| |||||
Net unrealized appreciation | $ | 8,412,012 | ||||
|
| |||||
| * | Because tax adjustments are calculated annually at the end of the Fund’s fiscal year, the above table does not reflect tax adjustments for the current fiscal year. For the previous year’s federal income tax information, please refer to the Notes to Financial Statements section in the Fund’s most recent annual report. |
Pursuant to the federal income tax rules applicable to regulated investment companies, the Fund may elect to treat certain capital losses between November 1 and April 30 and late year ordinary losses ((i) ordinary losses between January 1 and April��30, and (ii) specified ordinary and currency losses between November 1 and April 30) as occurring on the first day of the following tax year. For the year ended April 30, 2017, the Fund had no short-term capital loss deferrals and no long-term capital loss deferrals.
Accumulated capital losses represent net capital loss carryforwards as of April 30, 2017 that may be available to offset future realized capital gains and thereby reduce future capital gains distributions. As of April 30, 2017, the Fund did not have any capital loss carryforwards.
19
SKYBRIDGE DIVIDEND VALUE FUND
Notes to Financial Statements (Concluded)
October 31, 2017
(Unaudited)
6. Subsequent Events
Management has evaluated the impact of all subsequent events on the Fund through the date the financial statements were issued, and has determined that there were no subsequent events requiring recognition or disclosure in the financial statements.
20
SKYBRIDGE DIVIDEND VALUE FUND
Other Information
(Unaudited)
Proxy Voting
Policies and procedures that the Fund uses to determine how to vote proxies relating to portfolio securities as well as information regarding how the Fund voted proxies relating to portfolio securities for the most recent 12-month period ended June 30 are available without charge, upon request, by calling (888) 919-6885 and on the Securities and Exchange Commission’s (“SEC”) website at http:// www.sec.gov.
Quarterly Portfolio Schedules
The Trust files its complete schedule of portfolio holdings with the SEC for the first and third fiscal quarters of each fiscal year (quarters ended July 31 and January 31) on Form N-Q. The Trust’s Forms N-Q are available on the SEC’s website at http://www.sec.gov and may be reviewed and copied at the SEC’s Public Reference Room in Washington, D.C. Information on the operation of the SEC’s Public Reference Room may be obtained by calling 1-800-SEC-0330.
Meeting of Shareholders
A special meeting of shareholders (the “Meeting”) of the Fund was held on June 15, 2017 for the following purpose:
To approve a new investment advisory agreement between the Trust, on behalf of the Fund, and SkyBridge Capital II, LLC.
All Fund shareholders of record at the close of business on April 24, 2017 were entitled to attend or submit proxies. As of the record date, the Fund had 39,811,864 shares outstanding. At the Meeting, shareholders approved the new advisory agreement. The results of the voting for the proposal were as follows:
For Votes | Against Votes | Withheld Votes | Broker Non-Votes | |||
| 15,533,154 | 643,697 | 327,965 | 3,681,398 |
The new investment advisory agreement approved by shareholders at the Meeting will not become effective until the Transaction (defined below) is consummated. As previously disclosed, in the supplement dated January 19, 2017, the current owners of SkyBridge Capital II, LLC agreed to sell a majority ownership interest in SkyBridge to HNA Capital (U.S.) Holding (“HNA”) and RON Transatlantic EG (“RON Transatlantic”) (the “Transaction”). RON Transatlantic is a current minority owner of SkyBridge. In the event the Transaction is not consummated, SkyBridge Capital II, LLC will continue to serve as investment adviser to the Fund pursuant to the terms of the current investment advisory agreement. There can be no assurance that the transaction, which remains subject to regulatory reviews and approvals, will be consummated as contemplated.
21
[THIS PAGE INTENTIONALLY LEFT BLANK.]
[THIS PAGE INTENTIONALLY LEFT BLANK.]
Investment Adviser SkyBridge Capital II, LLC 527 Madison Avenue, 16th Floor New York, New York 10022
Administrator BNY Mellon Investment Servicing (US) Inc. 301 Bellevue Parkway Wilmington, DE 19809
Transfer Agent BNY Mellon Investment Servicing (US) Inc. 4400 Computer Drive Westborough, MA 01581
Principal Underwriter Foreside Funds Distributors LLC 400 Berwyn Park 899 Cassatt Road Berwyn, PA 19312
Custodian The Bank of New York Mellon 225 Liberty Street New York, NY 10286
Independent Registered Public Accounting Firm PricewaterhouseCoopers LLP Two Commerce Square, Suite 1800 2001 Market Street Philadelphia, PA 19103-7042
Legal Counsel Pepper Hamilton LLP 3000 Two Logan Square 2001 Market Street Philadelphia, PA 19103-7042 |
SkyBridge Dividend Value Fund
of
FundVantage Trust
Class A Shares
Class C Shares
Class I Shares
SEMI-ANNUAL REPORT
October 31, 2017 (Unaudited)
This report is submitted for the general information of the shareholders of the SkyBridge Dividend Value Fund. It is not authorized for distribution unless preceded or accompanied by a current prospectus for the SkyBridge Dividend Value Fund. |

SKY-1017
| Item 2. | Code of Ethics. |
Not applicable.
| Item 3. | Audit Committee Financial Expert. |
Not applicable.
| Item 4. | Principal Accountant Fees and Services. |
Not applicable.
| Item 5. | Audit Committee of Listed Registrants. |
Not applicable.
| Item 6. | Investments. |
| (a) | Schedule of Investments in securities of unaffiliated issuers as of the close of the reporting period is included as part of the report to shareholders filed under Item 1 of this form. |
| (b) | Not applicable. |
| Item 7. | Disclosure of Proxy Voting Policies and Procedures for Closed-End Management Investment Companies. |
Not applicable.
| Item 8. | Portfolio Managers of Closed-End Management Investment Companies. |
Not applicable.
| Item 9. | Purchases of Equity Securities by Closed-End Management Investment Company and Affiliated Purchasers. |
Not applicable.
| Item 10. | Submission of Matters to a Vote of Security Holders. |
There have been no material changes to the procedures by which the shareholders may recommend nominees to the registrant’s board of trustees, where those changes were implemented after the registrant last provided disclosure in response to the requirements of Item 407(c)(2)(iv) of Regulation S-K (17 CFR 229.407) (as required by Item 22(b)(15) of Schedule 14A (17 CFR 240.14a-101)), or this Item.
| Item 11. | Controls and Procedures. |
| (a) | The registrant’s principal executive and principal financial officers, or persons performing similar functions, have concluded that the registrant’s disclosure controls and procedures (as defined in Rule 30a-3(c) under the Investment Company Act of 1940, as amended (the “1940 Act”) (17 CFR 270.30a-3(c))) are effective, as of a date within 90 days of the filing date of the report that includes the disclosure required by this paragraph, based on their evaluation of these controls and procedures required by Rule 30a-3(b) under the 1940 Act (17 CFR 270.30a-3(b)) and Rules 13a-15(b) or 15d-15(b) under the Securities Exchange Act of 1934, as amended (17 CFR 240.13a-15(b) or 240.15d-15(b)). |
| (b) | There were no changes in the registrant’s internal control over financial reporting (as defined in Rule 30a-3(d) under the 1940 Act (17 CFR 270.30a-3(d))) that occurred during the registrant’s last fiscal quarter that has materially affected, or is reasonably likely to materially affect, the registrant’s internal control over financial reporting. |
| Item 12. | Disclosure of Securities Lending Activities for Closed-End Management Investment Companies. |
Not applicable.
| Item 13. | Exhibits. |
(a)(1) | Not applicable. | |
(a)(2) | Certifications pursuant to Rule 30a-2(a) under the 1940 Act and Section 302 of the Sarbanes-Oxley Act of 2002 are attached hereto. | |
(a)(3) | Not applicable. | |
(a)(4) | Not applicable. | |
(b) | Certifications pursuant to Rule 30a-2(b) under the 1940 Act and Section 906 of the Sarbanes-Oxley Act of 2002 are attached hereto. | |
SIGNATURES
Pursuant to the requirements of the Securities Exchange Act of 1934 and the Investment Company Act of 1940, the registrant has duly caused this report to be signed on its behalf by the undersigned, thereunto duly authorized.
(Registrant) | FundVantage Trust |
By (Signature and Title)* | /s/ Joel L. Weiss | |
Joel L. Weiss, President and | ||
Chief Executive Officer | ||
| (principal executive officer) |
Date | 1/5/2018 |
By (Signature and Title)* | /s/ Joel L. Weiss | |
Joel L. Weiss, President and | ||
Chief Executive Officer | ||
(principal executive officer) |
Date | 1/5/2018 |
By (Signature and Title)* | /s/ T. Richard Keyes | |
T. Richard Keyes, Treasurer and | ||
Chief Financial Officer | ||
(principal financial officer) |
Date | 1/5/2018 |
| * | Print the name and title of each signing officer under his or her signature. |