UNITED STATES
SECURITIES AND EXCHANGE COMMISSION
Washington, D.C. 20549
FORMN-CSR
CERTIFIED SHAREHOLDER REPORT OF REGISTERED MANAGEMENT INVESTMENT COMPANIES
Investment Company Act file number 811-22027
FundVantage Trust
(Exact name of registrant as specified in charter)
301 Bellevue Parkway
Wilmington, DE 19809
(Address of principal executive offices) (Zip code)
Joel L. Weiss
JW Fund Management LLC
100 Springdale Rd., SuiteA3-416
Cherry Hill, NJ 08003
(Name and address of agent for service)
Registrant’s telephone number, including area code: 856-528-3500
Date of fiscal year end: April 30
Date of reporting period: October 31, 2019
FormN-CSR is to be used by management investment companies to file reports with the Commission not later than 10 days after the transmission to stockholders of any report that is required to be transmitted to stockholders under Rule30e-1 under the Investment Company Act of 1940 (17 CFR270.30e-1). The Commission may use the information provided on FormN-CSR in its regulatory, disclosure review, inspection, and policymaking roles.
A registrant is required to disclose the information specified by FormN-CSR, and the Commission will make this information public. A registrant is not required to respond to the collection of information contained in FormN-CSR unless the Form displays a currently valid Office of Management and Budget (“OMB”) control number. Please direct comments concerning the accuracy of the information collection burden estimate and any suggestions for reducing the burden to Secretary, Securities and Exchange Commission, 450 Fifth Street, NW, Washington, DC 20549-0609. The OMB has reviewed this collection of information under the clearance requirements of 44 U.S.C. § 3507.
Item 1. Reports to Stockholders.
The Report to Shareholders is attached herewith.
DUPONT CAPITAL EMERGING MARKETS FUND
Semi-Annual Investment Adviser’s Report
October 31, 2019
(Unaudited)
Dear Fund Shareholder,
The DuPont Capital Emerging Markets Equity Fund (the “Fund”) declined-4.63%, net of fees, for thesix-month period ended October 31, 2019. The MSCI Emerging Markets Net Dividend Index fell-1.67% over the trailingsix-months ended October 31, 2019.
Emerging market equities dropped during the period due to economic growth uncertainty caused by the trade tension between the U.S. and China. This trade tension has depressed global trade and negatively impacted economic growth, not only in the U.S. and China but across the globe. Developed market central banks have responded by relaxing monetary policy, which has resulted in falling government bond yields and the outperformance of developed market equities relative to emerging market equities.
The Fund’s return was negative for the period. Among the largest detractors from the Fund’s return were positions in Argentina, South Africa and Thailand. The Fund’s positions in Argentina fell over 40% during the period after the current business friendly president was badly defeated in the country’s primary election. While the incoming president has not revealed his policy platform in detail, his party has been anti-business and was known for corrupt behaviors in prior administrations. We had anticipated the current government being reelected and maintaining the ongoing economic reforms, which despite some setbacks had begun to show progress. Understanding the risk involved in Argentina, we kept the Fund’s holdings to less than 1.5% of the portfolio, however the impact was still negative. We have mostly exited the position, with the remaining to be sold over the coming months. The portfolio’s holdings in South Africa were negatively impacted by both macro-economic and company specific factors. Economic growth in South Africa has been weak over the past few years due to a combination of factors including poor political leadership. A new president was elected earlier this year on an anti-corruption platform and a pledge to improve economic growth. We believe the Fund’s positions in South Africa offer very good return prospects on their own merit and the country will benefit from better political leadership. However, so far investors have been disappointed with the new government’s lack of urgency in enacting reforms, causing South African equities to underperform. Despite this delay, we are optimistic that the new government in South Africa can bring positive change to the country and bring economic growth back to reasonable levels, which would aid the Fund’s positions in that country.
Somewhat offsetting the aforementioned negatives were holdings in Brazil, Kazakhstan and Turkey, which were among the best performers for the Fund during the period. Brazil has implemented several positive structural reforms to its pension system, management of state-controlled companies and banking system over the past few years. These positive reforms have reduced long-term state liabilities, helped lower interest rates and increase company profitability. The Fund specifically benefited from positions in the state-owned oil company, a homebuilding company and a fast-growing discount airline during the period. Economic improvement in Turkey was also positive for the Fund, as the country rebounded from economic and currency turmoil last year. The Fund’s positions in an automobile manufacturer and an
1
DUPONT CAPITAL EMERGING MARKETS FUND
Semi-Annual Investment Adviser’s Report (Concluded)
October 31, 2019
(Unaudited)
industrial conglomerate performed well during the period. A position in the largest bank in Kazakhstan reported favorable financial results and increasing dividends, causing its shares to rise.
Investment Environment and Outlook
The biggest issue weighing on emerging markets is the ongoing trade dispute between the U.S. and China. This dispute has disrupted global supply chains, negatively impacted industrial production and has caused investment delays. Fortunately, it appears both China and the U.S. are on a path towardde-escalation of this conflict. It appears an initial set of resolutions could be signed sometime beforeyear-end with a more comprehensive package agreed to next year. Back and forth commentary will likely add some element of uncertainty to the negotiations, however we believe both countries have strong incentives to come to a lasting agreement within the next twelve months. We believe a resolution will help restore business confidence, give a boost to economic growth and be positive for both emerging market equities and the Fund.
We appreciate your investment in the Fund and look forward to communicating with you in the future.
DuPont Capital Management Corporation
This letter is intended to assist shareholders in understanding how the Fund performed over the past six months from April 30, 2019 through October 31, 2019 and reflects the views of the investment advisor at the time of this writing. These views may change and do not guarantee future performance of the Fund or the markets.
Portfolio composition is subject to change. The current and future portfolio holdings of the Fund are subject to investment risks. The investment return and principal value of an investment in the Fund will fluctuate so that an investor’s shares, when redeemed, may be worth more or less than their original cost.
Mutual fund investing involves risks, including possible loss of principal. The Fund invests primarily in markets of emerging countries which are riskier than more developed markets and may be considered speculative. Emerging markets are riskier than more developed markets because they tend to develop unevenly or may never fully develop. Emerging markets are more likely to experience hyperinflation and currency valuations, which adversely affect returns to U.S. investors. In addition, many emerging markets have far lower trading volumes and less liquidity than developed markets.
Foreign securities are subject to political, social, and economic risks including instability in the country of the issuer of a security, variation in international trade patterns, the possibility of the imposition of exchange controls, expropriation, confiscatory taxation, limits on movement to currency or other assets and nationalization of assets.
2
DUPONT CAPITAL EMERGING MARKETS FUND
Semi-Annual Report
Performance Data
October 31, 2019
(Unaudited)
| Average Annual Total Returns for the Periods Ended October 31, 2019 | ||||||||||||||||||||||||||||||
| Six Months† | 1 Year | 3 Year | 5 Year | Since Inception* | ||||||||||||||||||||||||||
Class I Shares | -4.63 | % | 7.37 | % | 6.66 | % | 1.73 | % | -0.71 | % | ||||||||||||||||||||
MSCI Emerging | ||||||||||||||||||||||||||||||
Markets Net | ||||||||||||||||||||||||||||||
Dividend Index | -1.67 | % | 11.86 | % | 7.36 | % | 2.93 | % | 1.59 | %** | ||||||||||||||||||||
| † | Not Annualized. |
| * | The DuPont Capital Emerging Markets Fund (the “Fund”) commenced operations on December 6, 2010. |
| ** | Benchmark performance is from inception date of the Fund only and is not the inception date of the benchmark itself. |
The performance data quoted represents past performance and does not guarantee future results. The investment return and principal value of an investment in the Fund will fluctuate so that an investor’s shares, when redeemed, may be worth more or less than their original cost. The table does not reflect the deduction of taxes that a shareholder would pay on Fund distributions or redemption of Fund shares. Current performance may be lower or higher. Performance data current to the most recentmonth-end may be obtained by calling (888)447-0014.
As stated in the current prospectus dated September 1, 2019, the Fund’s “Total Annual Fund Operating Expenses” and “Total Annual Fund Operating Expenses After Fee Waiver and/or Expense Reimbursement” are 2.38% and 1.28%, respectively of the Fund’s average daily net assets, which may differ from the actual expenses incurred by the Fund for the period covered by this report. DuPont Capital Management Corporation (the “Adviser”) has contractually agreed to reduce its investment advisory fee and/or reimburse certain expenses of the Fund to the extent necessary to ensure that the Fund’s total operating expenses, excluding taxes, fees and expenses attributable to a distribution or service plan adopted by FundVantage Trust (the “Trust”), “Acquired Fund Fees and Expenses,” interest, extraordinary items, and brokerage commissions do not exceed 1.27% (on an annual basis) of the Fund’s average daily net assets (the “Expense Limitation”). The Expense Limitation will remain in place until August 31, 2020, unless the Board of Trustees (“Board of Trustees”) of the Trust approves its earlier termination. The Adviser is entitled to recover, subject to approval by the Board of Trustees, amounts reduced or reimbursed for a period of up to three (3) years from the date on which the Adviser reduced its compensation and/or assumed expenses for the Fund. The Adviser is permitted to seek reimbursement from the Fund, subject to certain limitations, for fees it waived and Fund expenses it paid to the extent the total annual fund operating expenses do not exceed the limits described above or any lesser limits in effect at the time of reimbursement. No recoupment will occur unless the Fund’s expenses are below the Expense Limitation amount. Total returns would be lower had such fees and expenses not been waived and/or reimbursed.
A 2.00% redemption fee applies to shares redeemed within 60 days of purchase. The redemption fee is not reflected in the returns shown above.
The Fund intends to evaluate performance as compared to that of the MSCI Emerging Markets Net Dividend Index. This index is a free float-adjusted market capitalization index and is designed to measure equity market performance of emerging markets. This index is net total return which reinvests dividends after the deduction of withholding taxes. The returns for this index do not include any transaction costs, management fees or other costs. It is impossible to invest directly in an index.
3
DUPONT CAPITAL EMERGING MARKETS DEBT FUND
Semi-Annual Investment Adviser’s Report
October 31, 2019
(Unaudited)
Dear Fund Shareholder,
The DuPont Capital Emerging Markets Debt Fund (the “Fund”) returned +0.51%, net of fees, for thesix-month period ended October 31, 2019. The J.P. Morgan Emerging Markets Bond Index Global Diversified returned +5.68% over the trailingsix-months ended October 31, 2019.
Interest rates declined significantly over the past six months as the Federal Reserve reversed course in 2019 and cut the Federal Funds Rate three times. The rate cuts occurred while U.S. economic growth was moderate, but stronger than many other developed countries. The U.S. equity market rose strongly as investors became confident that the interest rate cuts would prevent a possible recession. Thetwo-year Treasury declined by 75 basis points over thesix-month period ending October 31, 2019 and closed at 1.52%. Theten-year treasury fell 82 basis bps from 2.51% to 1.69%. GDP grew by 2.0% in the 2nd quarter and 1.9% in the 3rd, weaker than the close to 3% growth in 2018. Oil prices have been generally trading in a range of $45 to $65 a barrel and ended the period slightly above the middle of this range.
Emerging Markets Debt (EMD) performed very well during the period. The strength in EMD was driven by a combination of much lower U.S. interest rates, looser monetary policy in several countries,low-to-moderate inflation, positive economic growth and the need for higher yields and returns by investors. Emerging market local currency outperformed U.S. Dollar sovereign EMD, but both posted strong returns. Within U.S. Dollar sovereigns, lower quality sovereigns underperformed investment grade sovereigns as higher quality countries performed much better in the declining yield environment. Some of the best performing countries within US Dollar EMD included Ukraine, El Salvador, Uruguay, and Peru. Venezuela and Argentina were the worst performing countries over the past six months. Lebanon was another country that experienced poor returns. Over the period, EMD spreads tightened by 16 basis points to +328 over Treasuries, while the yield of the index declined significantly by 91 bps and closed at 5.10%. The decline in yields was due to both much lower U.S. Treasury yields and tighter spreads.
Performance of the Fund over the past six months was mainly impacted by the overweights to Argentina and Venezuela and the underweight to higher quality countries such as Uruguay, Panama, Peru, Philippines and Colombia. Our overweights, security selection and local currency positions in Brazil and Mexico added to relative returns. In addition, our local currency position in Russia and overweights to Jordan and Israel helped the Fund’s relative returns.
In regards to current positioning, the primary overweight exposures in the Fund include Brazil, Ukraine, Russia, Egypt, and Israel. In local currency bonds, the primary positions are in Brazil, Mexico, Poland and Russia. The Fund is underweight several higher quality countries that the investment team believes are overvalued including Saudi Arabia, Qatar, Peru and Philippines. Other underweights include Indonesia, Colombia and Panama. The Fund has a yield advantage when compared to the benchmark, which is primarily due to the overweights to Ukraine, Egypt, and Turkey and the local currency exposure to Brazil, Russia, and Mexico.
4
DUPONT CAPITAL EMERGING MARKETS DEBT FUND
Semi-Annual Investment Adviser’s Report (Continued)
October 31, 2019
(Unaudited)
Investment Environment and Outlook
We believe that EMD is slightly attractive and will provide better returns than higher quality fixed income over the next year. Global economic activity continues to chug along at a slow but positive pace, and we do not believe a recession will occur over the next six months to a year. Central Banks have mostly shifted to a monetary easing environment due to weaker growth and lower inflation. This will aid in continuing the current economic expansion in the U.S. and abroad. The trade war with China is the main uncertainty that will hang over the financial markets and this will probably lead to continued volatility. The impeachment inquiry of President Trump will also lead to uncertainty. Finally, the problems in Argentina and Venezuela continue to weigh on overall EMD returns.
Despite numerous uncertainties, we believe the current valuations for EMD are slightly attractive for long-term investors, particularly with yields much higher than in developed markets. We will continue to gradually buy select credits and reduce cash as we find compelling opportunities. Our main hard currency overweights in the Fund include Brazil, Ukraine, Egypt, Argentina, and Israel. Our local currency allocation has not changed much in 2019 and is close to 12%. Our main positions in local currency are in Brazil, Poland, Russia, and Mexico. The portfolio has a large yield advantage over the index with a duration that is much shorter.
We appreciate your investment in the Fund and look forward to communicating with you in the future.
DuPont Capital Management Corporation
This letter is intended to assist shareholders in understanding how the Fund performed over the past six months from April 30, 2019 through October 31, 2019 and reflects the views of the investment advisor at the time of this writing. These views may change and do not guarantee future performance of the Fund or the markets.
Portfolio composition is subject to change. The current and future portfolio holdings of the Fund are subject to investment risks. The investment return and principal value of an investment in the Fund will fluctuate so that an investor’s shares, when redeemed, may be worth more or less than their original cost.
Mutual fund investing involves risks, including possible loss of principal. The Fund invests primarily in markets of emerging countries which are riskier than more developed markets and may be considered speculative. Emerging markets are riskier than more developed markets because they tend to develop unevenly or may never fully develop. Emerging markets are more likely to experience hyperinflation and currency valuations, which adversely affect returns to U.S. investors. In addition, many emerging markets have far lower trading volumes and less liquidity than developed markets. The Fund isnon-diversified, which means that a large portion of the Fund’s assets may be invested in one or few companies or sectors.
5
DUPONT CAPITAL EMERGING MARKETS DEBT FUND
Semi-Annual Investment Adviser’s Report (Concluded)
October 31, 2019
(Unaudited)
The Fund could fluctuate in value more than a diversified fund. Investing in foreign securities entails special risks, such as fluctuations in currency exchange rates and possible lax regulation of securities markets and accounting practices.
Foreign securities are subject to political, social, and economic risks including instability in the country of the issuer of a security, variation in international trade patterns, the possibility of the imposition of exchange controls, expropriation, confiscatory taxation, limits on movement to currency or other assets and nationalization of assets. The value of debt securities generally falls when interest rates rise. The Fund may invest without limit in below-investment grade debt securities commonly called “high yield” securities or “junk bonds.” Such securities may have greater default risk, less liquidity, and greater price volatility than investment-grade bonds.
6
DUPONT CAPITAL EMERGING MARKETS DEBT FUND
Semi-Annual Report
Performance Data
October 31, 2019
(Unaudited)
| Average Annual Total Returns for the Periods Ended October 31, 2019 | ||||||||||||||||||||||||||||||
| Six Months† | 1 Year | 3 Year | 5 Year | Since Inception* | ||||||||||||||||||||||||||
Class I Shares | 0.51 | % | 6.50 | % | 1.62 | % | 4.28 | % | 5.11 | % | ||||||||||||||||||||
J.P. Morgan EMBI Global | ||||||||||||||||||||||||||||||
Diversified Index | 5.68 | % | 14.35 | % | 5.14 | % | 5.44 | % | 6.28 | %** | ||||||||||||||||||||
| † | Not Annualized. |
| * | The DuPont Capital Emerging Markets Debt Fund (the “Fund”) commenced operations on September 27, 2013. |
| ** | Benchmark performance is from inception date of the Fund only and is not the inception date of the benchmark itself. |
The performance data quoted represents past performance and does not guarantee future results. The investment return and principal value of an investment in the Fund will fluctuate so that an investor’s shares, when redeemed, may be worth more or less than their original cost. The table does not reflect the deduction of taxes that a shareholder would pay on Fund distributions or redemption of Fund shares. Current performance may be lower or higher. Performance data current to the most recentmonth-end may be obtained by calling (888)447-0014.
As stated in the current prospectus dated September 1, 2019, the Fund’s “Total Annual Fund Operating Expenses” and “Total Annual Fund Operating Expenses After Fee Waiver and/or Expense Reimbursement” are 3.92% and 0.89%, respectively, of the Fund’s average daily net assets, which may differ from the actual expenses incurred by the Fund for the period covered by this report. DuPont Capital Management Corporation (the “Adviser”) has contractually agreed to reduce its investment advisory fee and/or reimburse certain expenses of the Fund to the extent necessary to ensure that the Fund’s total operating expenses, excluding taxes, fees and expenses attributable to a distribution or service plan adopted by FundVantage Trust (the “Trust”),“Acquired Fund Fees and Expenses,” interest, extraordinary items, and brokerage commissions do not exceed 0.89% (on an annual basis) of the Fund’s average daily net assets (the “Expense Limitation”). The Expense Limitation will remain in place until August 31, 2020, unless the Board of Trustees (“Board of Trustees”) of the Trust approves its earlier termination. The Adviser is entitled to recover, subject to approval by the Board of Trustees, amounts reduced or reimbursed for a period of up to three (3) years from the date on which the Adviser reduced its compensation and/or assumed expenses for the Fund. The Adviser is permitted to seek reimbursement from the Fund, subject to certain limitations, for fees it waived and Fund expenses it paid to the extent the total annual fund operating expenses do not exceed the limits described above or any lesser limits in effect at the time of reimbursement. No recoupment will occur unless the Fund’s expenses are below the Expense Limitation amount. Total returns would be lower had such fees and expenses not been waived and/or reimbursed.
A 2.00% redemption fee applies to shares redeemed within 60 days of purchase. The redemption fee is not reflected in the returns shown above.
The Fund intends to evaluate performance as compared to that of the J.P. Morgan Emerging Markets Bond Index Global Diversified (EMBI Global Diversified Index). This index tracks the traded market for U.S.-dollar-denominated debt instruments issued by emerging market sovereign and quasi-sovereign entities and includes Brady bonds, loans, Eurobonds and external debt instruments. It limits the weights of those Index countries with larger debt stock by only including specified portions of these countries eligible current face amounts of debt outstanding. The returns for the index do not include any transaction costs, management fees or other costs. It is impossible to invest directly in an index.
7
DUPONT CAPITAL FUNDS
Fund Expense Disclosure
October 31, 2019
(Unaudited)
As a shareholder of the Fund(s), you incur two types of costs: (1) transaction costs, including redemption fees; and (2) ongoing costs, including management fees and other Fund expenses. These examples are intended to help you understand your ongoing costs (in dollars) of investing in the Fund and to compare these costs with the ongoing costs of investing in other mutual funds.
These examples are based on an investment of $1,000 invested at the beginning of the period from May 1, 2019 through October 31, 2019 and held for the entire period.
Actual Expenses
The first line for each Fund in the accompanying table provides information about actual account values and actual expenses. You may use the information in this line, together with the amount you invested, to estimate the expenses that you paid over the period. Simply divide your account value by $1,000 (for example, an $8,600 account value divided by $1,000 = 8.6), then multiply the result by the number in the first line under the heading entitled “Expenses Paid During Period” to estimate the expenses you paid on your account during this period.
Hypothetical Example for Comparison Purposes
The second line for each Fund in the accompanying table provides information about hypothetical account values and hypothetical expenses based on each Fund’s actual expense ratio and an assumed rate of return of 5% per year before expenses, which is not your Fund’s actual return. The hypothetical account values and expenses may not be used to estimate the actual ending account balance or expenses you paid for the period. You may use this information to compare the ongoing costs of investing in the Funds and other funds. To do so, compare this 5% hypothetical example with the 5% hypothetical examples that appear in the shareholder reports of other funds.
Please note that the expenses shown in the accompanying table are meant to highlight your ongoing costs only and do not reflect any transactional costs, such as redemption fees. Therefore, the second line of the accompanying table is useful in comparing ongoing costs only and will not help you determine the relative total costs of owning different funds. In addition, if these transactional costs were included, your costs would have been higher.
8
DUPONT CAPITAL FUNDS
Fund Expense Disclosure (Concluded)
October 31, 2019
(Unaudited)
| DuPont Capital Emerging Markets Fund | |||||||||||||||
| Beginning Account Value May 1, 2019 | Ending Account Value October 31, 2019 | Expenses Paid During Period* | |||||||||||||
Class I | |||||||||||||||
Actual | $ | 1,000.00 | $ | 953.70 | $ | 6.24 | |||||||||
Hypothetical (5% return before expenses) | 1,000.00 | 1,018.75 | 6.44 | ||||||||||||
| DuPont Capital Emerging Markets Debt Fund | |||||||||||||||
| Beginning Account Value May 1, 2019 | Ending Account Value October 31, 2019 | Expenses Paid During Period** | |||||||||||||
Class I | |||||||||||||||
Actual | $ | 1,000.00 | $ | 1,005.10 | $ | 4.49 | |||||||||
Hypothetical (5% return before expenses) | 1,000.00 | 1,020.66 | 4.52 | ||||||||||||
| * | Expenses are equal to an annualized expense ratio for thesix-month period ended October 31, 2019 of 1.27% for Class I Shares of the DuPont Capital Emerging Markets Fund, multiplied by the average account value over the period, multiplied by the number of days in the most recent period (184), then divided by 366 to reflect the period. The DuPont Capital Emerging Markets Fund’s ending account value on the first line in the table is based on the actual total return for thesix-month period ended October 31, 2019 for the Fund of (4.63)%. |
| ** | Expenses are equal to an annualized expense ratio for thesix-month period ended October 31, 2019 of 0.89% for Class I Shares of the DuPont Capital Emerging Markets Debt Fund, multiplied by the average account value over the period, multiplied by the number of days in the most recent period (184), then divided by 366 to reflect the period. The DuPont Capital Emerging Markets Debt Fund’s ending account value on the first line in the table is based on the actual total return for thesix-month period ended October 31, 2019 for the Fund of 0.51%. |
9
DUPONT CAPITAL EMERGING MARKETS FUND
Portfolio Holdings Summary Table
October 31, 2019
(Unaudited)
The following table presents a summary by industry of the portfolio holdings of the Fund:
| % of Net Assets | Value | |||||||||
INDUSTRY CATEGORIES: | ||||||||||
Commercial Banks | 23.3 | % | $ | 5,648,505 | ||||||
Internet & Catalog Retail | 8.5 | 2,057,600 | ||||||||
Oil, Gas & Consumable Fuels | 8.2 | 1,997,412 | ||||||||
Semiconductors & Semiconductor Equipment | 6.3 | 1,524,757 | ||||||||
Technology Hardware, Storage & Peripherals | 6.2 | 1,497,611 | ||||||||
Insurance | 4.7 | 1,138,153 | ||||||||
Interactive Media & Services | 4.2 | 1,006,259 | ||||||||
Machinery | 3.2 | 782,104 | ||||||||
Automobiles | 3.2 | 773,643 | ||||||||
Exchange Traded Fund | 2.9 | 704,103 | ||||||||
Food Products | 2.7 | 661,049 | ||||||||
Household Durables | 2.5 | 617,215 | ||||||||
Specialty Retail | 2.1 | 504,218 | ||||||||
IT Services | 1.8 | 440,682 | ||||||||
Real Estate Management & Development | 1.7 | 403,903 | ||||||||
Electronic Equipment, Instruments & Components | 1.6 | 393,958 | ||||||||
Building Products | 1.5 | 370,709 | ||||||||
Auto Components | 1.5 | 365,857 | ||||||||
Construction & Engineering | 1.5 | 360,636 | ||||||||
Media | 1.3 | 305,795 | ||||||||
Metals & Mining | 1.2 | 290,255 | ||||||||
Wireless Telecommunication Services | 1.1 | 270,111 | ||||||||
Industrial Conglomerates | 1.1 | 264,207 | ||||||||
Airlines | 1.1 | 259,856 | ||||||||
Hotels, Restaurants & Leisure | 1.0 | 236,019 | ||||||||
Food & Staples Retailing | 1.0 | 229,279 | ||||||||
Chemicals | 0.8 | 204,582 | ||||||||
Air Freight & Logistics | 0.7 | 172,593 | ||||||||
Pharmaceuticals | 0.7 | 164,619 | ||||||||
Entertainment | 0.6 | 149,422 | ||||||||
Personal Products | 0.4 | 101,497 | ||||||||
Diversified Consumer Services | 0.3 | 65,341 | ||||||||
Thrifts & Mortgage Finance | 0.3 | 62,798 | ||||||||
Construction Materials | 0.2 | 51,545 | ||||||||
Independent Power And Renewable Electricity Producers | 0.1 | 34,457 | ||||||||
Electric Utilities | 0.1 | 24,149 | ||||||||
Other Assets in Excess of Liabilities | 0.4 | 97,753 | ||||||||
|
|
|
| |||||||
NET ASSETS | 100.0 | % | $ | 24,232,652 | ||||||
|
|
|
| |||||||
Portfolio holdings are subject to change at any time.
The accompanying notes are an integral part of the financial statements.
10
DUPONT CAPITAL EMERGING MARKETS FUND
Portfolio of Investments
October 31, 2019
(Unaudited)
| Number of Shares | Value | |||||||
COMMON STOCKS — 92.1% |
| |||||||
Argentina — 0.5% | ||||||||
Banco BBVA Argentina SA, ADR | 5,831 | $ | 20,408 | |||||
Central Puerto SA, SP ADR* | 10,701 | 34,457 | ||||||
Loma Negra Cia Industrial Argentina SA, SP ADR* | 8,663 | 51,545 | ||||||
Pampa Energia SA, SP ADR* | 1,551 | 24,149 | ||||||
|
| |||||||
| 130,559 | ||||||||
|
| |||||||
Brazil — 3.2% | ||||||||
Banco do Brasil SA* | 28,000 | 335,190 | ||||||
Even Construtora e Incorporadora SA* | 73,800 | 223,213 | ||||||
Iochpe Maxion SA* | 49,751 | 216,843 | ||||||
|
| |||||||
| 775,246 | ||||||||
|
| |||||||
China — 29.3% | ||||||||
Alibaba Group Holding, Ltd., SP ADR* | 7,242 | 1,279,444 | ||||||
China Communications Services Corp., Ltd., Class H | 584,000 | 360,636 | ||||||
China Construction Bank Corp., Class H | 825,000 | 661,048 | ||||||
China Lesso Group Holdings, Ltd. | 359,000 | 370,709 | ||||||
China Maple Leaf Educational Systems, Ltd. | 208,000 | 65,341 | ||||||
China Overseas Land & Investment, Ltd. | 128,000 | 403,903 | ||||||
CNOOC, Ltd. | 310,000 | 461,358 | ||||||
Dali Foods Group Co., Ltd.(a) | 219,000 | 149,726 | ||||||
| Number of Shares | Value | |||||||
COMMON STOCKS — (Continued) |
| |||||||
China — (Continued) | ||||||||
Dongfeng Motor Group Co., Ltd., Class H | 318,000 | $ | 318,990 | |||||
Haier Electronics Group Co., Ltd. | 138,000 | 394,002 | ||||||
Haitian International Holdings, Ltd. | 81,001 | 191,139 | ||||||
Industrial & Commercial Bank of China, Ltd., Class H | 440,000 | 315,213 | ||||||
Livzon Pharmaceutical Group, Inc., Class H | 56,370 | 164,619 | ||||||
Lonking Holdings, Ltd. | 509,000 | 141,087 | ||||||
PICC Property & Casualty Co., Ltd., Class H | 335,000 | 423,949 | ||||||
Ping An Insurance Group Co., of China Ltd., Class H | 29,000 | 334,712 | ||||||
Sinotrans, Ltd., Class H | 587,000 | 172,593 | ||||||
Tencent Holdings, Ltd. | 18,200 | 738,245 | ||||||
YY, Inc., ADR* | 2,638 | 149,944 | ||||||
|
| |||||||
| 7,096,658 | ||||||||
|
| |||||||
Czech Republic — 1.1% | ||||||||
Komercni banka as | 7,835 | 264,799 | ||||||
|
| |||||||
Greece — 1.0% | ||||||||
JUMBO SA | 12,316 | 239,945 | ||||||
|
| |||||||
India — 5.6% | ||||||||
HCL Technologies, Ltd. | 26,882 | 440,682 | ||||||
ICICI Bank, Ltd., SP ADR | 24,174 | 314,987 | ||||||
Indiabulls Housing Finance, Ltd. | 21,641 | 62,798 | ||||||
Just Dial, Ltd.* | 14,227 | 118,070 | ||||||
The accompanying notes are an integral part of the financial statements.
11
DUPONT CAPITAL EMERGING MARKETS FUND
Portfolio of Investments (Continued)
October 31, 2019
(Unaudited)
| Number of Shares | Value | |||||||
COMMON STOCKS — (Continued) |
| |||||||
India — (Continued) | ||||||||
Reliance Industries, Ltd., SP | 10,210 | $ | 419,120 | |||||
|
| |||||||
| 1,355,657 | ||||||||
|
| |||||||
Indonesia — 1.4% | ||||||||
Bank Rakyat Indonesia Persero Tbk PT | 1,171,084 | 350,898 | ||||||
|
| |||||||
Kazakhstan — 1.1% | ||||||||
Halyk Savings Bank of Kazakhstan JSC, GDR | 20,854 | 277,949 | ||||||
|
| |||||||
Malaysia — 1.6% | ||||||||
Bermaz Auto Bhd | 262,700 | 143,245 | ||||||
Genting Bhd | 93,096 | 129,321 | ||||||
Malayan Banking Bhd | 58,060 | 119,396 | ||||||
|
| |||||||
| 391,962 | ||||||||
|
| |||||||
Mexico — 2.5% | ||||||||
Grupo Financiero Banorte SAB de CV, Class O | 58,300 | 318,769 | ||||||
Ternium SA, SP ADR | 14,520 | 290,255 | ||||||
|
| |||||||
| 609,024 | ||||||||
|
| |||||||
Poland — 0.4% | ||||||||
Bank Handlowy w Warszawie SA | 6,420 | 85,698 | ||||||
|
| |||||||
Russia — 4.7% | ||||||||
Ros Agro PLC, GDR | 22,948 | 245,085 | ||||||
Sberbank of Russia PJSC, SP ADR | 41,282 | 607,932 | ||||||
Tatneft PJSC, SP ADR | 4,123 | 289,117 | ||||||
|
| |||||||
| 1,142,134 | ||||||||
|
| |||||||
Saudi Arabia — 2.2% | ||||||||
Jarir Marketing Co. | 2,865 | 121,028 | ||||||
Saudi British Bank (The) | 17,510 | 152,318 | ||||||
| Number of Shares | Value | |||||||
COMMON STOCKS — (Continued) |
| |||||||
Saudi Arabia — (Continued) |
| |||||||
Saudia Dairy & Foodstuff Co. | 7,862 | $ | 266,238 | |||||
|
| |||||||
| 539,584 | ||||||||
|
| |||||||
South Africa — 8.6% | ||||||||
Absa Group, Ltd. | 25,074 | 257,161 | ||||||
MultiChoice Group, Ltd.* | 36,717 | 305,795 | ||||||
Naspers, Ltd., N Shares | 5,499 | 778,156 | ||||||
Nedbank Group, Ltd. | 13,980 | 212,081 | ||||||
Old Mutual, Ltd. | 164,147 | 213,463 | ||||||
Sasol, Ltd. | 11,285 | 204,582 | ||||||
Tsogo Sun Gaming, Ltd. | 129,707 | 106,698 | ||||||
|
| |||||||
| 2,077,936 | ||||||||
|
| |||||||
South Korea — 14.5% | ||||||||
Hyundai Mipo Dockyard Co., Ltd. | 6,249 | 233,035 | ||||||
Hyundai Mobis Co., Ltd. | 1,794 | 365,857 | ||||||
Hyundai Motor Co. | 2,304 | 241,331 | ||||||
Jejuair Co., Ltd. | 12,602 | 259,856 | ||||||
Samsung Electronics Co., Ltd. | 34,651 | 1,497,611 | ||||||
Samsung Life Insurance Co., Ltd. | 2,734 | 166,029 | ||||||
Shinhan Financial Group Co., Ltd. | 12,564 | 457,770 | ||||||
SK Innovation Co., Ltd. | 2,086 | 285,439 | ||||||
|
| |||||||
| 3,506,928 | ||||||||
|
| |||||||
Taiwan — 10.0% | ||||||||
CTBC Financial Holding Co., Ltd. | 570,918 | 396,910 | ||||||
Hon Hai Precision Industry Co., Ltd. | 149,164 | 393,958 | ||||||
Novatek Microelectronics Corp. | 52,692 | 337,526 | ||||||
The accompanying notes are an integral part of the financial statements.
12
DUPONT CAPITAL EMERGING MARKETS FUND
Portfolio of Investments (Concluded)
October 31, 2019
(Unaudited)
| Number of Shares | Value | |||||||
COMMON STOCKS — (Continued) |
| |||||||
Taiwan — (Continued) | ||||||||
Taiwan Semiconductor Manufacturing Co., Ltd. | 94,000 | $ | 921,182 | |||||
Taiwan Semiconductor Manufacturing Co., Ltd., SP ADR | 5,153 | 266,049 | ||||||
TCI Co., Ltd. | 9,191 | 101,497 | ||||||
|
| |||||||
| 2,417,122 | ||||||||
|
| |||||||
Thailand — 1.3% | ||||||||
Kasikornbank PCL, NVDR | 33,671 | 154,936 | ||||||
Major Cineplex Group PCL | 183,400 | 149,422 | ||||||
|
| |||||||
| 304,358 | ||||||||
|
| |||||||
Turkey — 3.1% | ||||||||
KOC Holding AS | 80,605 | 264,207 | ||||||
Tofas Turk Otomobil Fabrikasi AS | 54,554 | 213,322 | ||||||
Turkcell Iletisim Hizmetleri AS | 122,844 | 270,111 | ||||||
|
| |||||||
| 747,640 | ||||||||
|
| |||||||
TOTAL COMMON STOCKS (Cost $20,413,479) | 22,314,097 | |||||||
|
| |||||||
PREFERRED STOCKS — 4.6% |
| |||||||
Brazil — 4.6% | ||||||||
Cia Brasileira de Distribuicao* | 11,100 | 229,279 | ||||||
Itau Unibanco Holding SA | 38,163 | 345,042 | ||||||
Petroleo Brasileiro SA | 71,600 | 542,378 | ||||||
|
| |||||||
| 1,116,699 | ||||||||
|
| |||||||
TOTAL PREFERRED STOCKS (Cost $750,270) | 1,116,699 | |||||||
|
| |||||||
| Number of Shares | Value | |||||||
EXCHANGE TRADED FUND — 2.9% |
| |||||||
iShares MSCI Emerging Market Index Fund | 16,536 | $ | 704,103 | |||||
|
| |||||||
TOTAL EXCHANGE TRADED FUND (Cost $693,322) |
| 704,103 | ||||||
|
| |||||||
TOTAL INVESTMENTS - 99.6% | 24,134,899 | |||||||
OTHER ASSETS IN EXCESS OF LIABILITIES - 0.4% | 97,753 | |||||||
|
| |||||||
NET ASSETS - 100.0% | $ | 24,232,652 | ||||||
|
| |||||||
| * | Non-income producing. |
| (a) | Securities exempt from registration under Rule 144A of the Securities Act of 1933, as amended. These securities were purchased in accordance with the guidelines approved by the Fund’s Board of Trustees and may be resold, in transactions exempt from registration, to qualified institutional buyers. At October 31, 2019, these securities amounted to $568,846 or 2.35% of net assets. These securities have been determined by the Adviser to be liquid securities. |
| ADR | American Depository Receipt | |
| GDR | Global Depository Receipt | |
| JSC | Joint Stock Company | |
| NVDR | Non-voting Depository Receipt | |
| PCL | Public Company Limited | |
| PJSC | Public Joint Stock Company | |
| PLC | Public Limited Company | |
| SP ADR | Sponsored American Depository Receipt | |
| SP GDR | Sponsored Global Depository Receipt |
The accompanying notes are an integral part of the financial statements.
13
DUPONT CAPITAL EMERGING MARKETS DEBT FUND
Portfolio Holdings Summary Table
October 31, 2019
(Unaudited)
The following table presents a summary by security type of the portfolio holdings of the Fund:
| % of Net Assets | Value | |||||||||
SECURITY TYPE: | ||||||||||
Foreign Government Bonds and Notes | 69.7 | % | $ | 5,060,333 | ||||||
Corporate Bonds and Notes | 16.6 | 1,209,777 | ||||||||
U.S. Treasury Obligations | 5.8 | 418,422 | ||||||||
Common Stocks | 0.0 | 361 | ||||||||
Other Assets in Excess of Liabilities | 7.9 | 572,415 | ||||||||
|
|
|
| |||||||
NET ASSETS | 100.0 | % | $ | 7,261,308 | ||||||
|
|
|
| |||||||
Portfolio holdings are subject to change at any time.
The accompanying notes are an integral part of the financial statements.
14
DUPONT CAPITAL EMERGING MARKETS DEBT FUND
Portfolio of Investments
October 31, 2019
(Unaudited)
| Par* Value | Value | |||||||||
CORPORATE BONDS AND NOTES — 16.6% |
| |||||||||
Austria — 0.0% | ||||||||||
OGX Austria GmbH | $ | 200,000 | $ | 2 | ||||||
|
| |||||||||
China — 4.3% | ||||||||||
China Evergrande Group | 250,000 | 209,367 | ||||||||
Sinochem Overseas Capital Co. Ltd. | 100,000 | 101,988 | ||||||||
|
| |||||||||
| 311,355 | ||||||||||
|
| |||||||||
Israel — 3.1% | ||||||||||
Israel Electric Corp., Ltd. | 200,000 | 227,314 | ||||||||
|
| |||||||||
Netherlands — 3.4% | ||||||||||
Petrobras Global Finance BV | 100,000 | 121,100 | ||||||||
Petrobras Global Finance BV | 100,000 | 116,787 | ||||||||
Petrobras Global Finance BV | 10,000 | 11,495 | ||||||||
|
| |||||||||
| 249,382 | ||||||||||
|
| |||||||||
Russia — 5.2% | ||||||||||
Gazprom OAO Via Gaz Capital SA | 150,000 | 214,815 | ||||||||
Russian Railways Via RZD Capital PLC | RUB | 10,000,000 | 161,909 | |||||||
|
| |||||||||
| 376,724 | ||||||||||
|
| |||||||||
| Par* Value | Value | |||||||||
CORPORATE BONDS AND NOTES — (Continued) |
| |||||||||
Venezuela — 0.6% | ||||||||||
Petroleos de Venezuela SA | $ | 300,000 | $ | 18,000 | ||||||
Petroleos de Venezuela SA | 100,000 | 6,000 | ||||||||
Petroleos de Venezuela SA | 350,000 | 21,000 | ||||||||
|
| |||||||||
| 45,000 | ||||||||||
|
| |||||||||
TOTAL CORPORATE BONDS AND NOTES | 1,209,777 | |||||||||
|
| |||||||||
FOREIGN GOVERNMENT BONDS AND NOTES — 69.7% |
| |||||||||
Argentina — 3.9% | ||||||||||
Argentine Republic Government International Bond | 460,000 | 180,555 | ||||||||
Argentine Republic Government International Bond | 70,000 | 26,601 | ||||||||
Argentine Republic Government International Bond | 190,000 | 76,285 | ||||||||
|
| |||||||||
| 283,441 | ||||||||||
|
| |||||||||
Brazil — 4.8% | ||||||||||
Brazil Notas Do Tesouro Nacional Serie F | BRL | 1,000,000 | 264,839 | |||||||
The accompanying notes are an integral part of the financial statements.
15
DUPONT CAPITAL EMERGING MARKETS DEBT FUND
Portfolio of Investments (Continued)
October 31, 2019
(Unaudited)
Par* Value | Value | |||||||||
FOREIGN GOVERNMENT BONDS AND NOTES — (Continued) |
| |||||||||
Brazil — (Continued) |
| |||||||||
Brazil Notas Do Tesouro Nacional Serie F | BRL | 290,000 | $ | 87,318 | ||||||
|
| |||||||||
| 352,157 | ||||||||||
|
| |||||||||
Costa Rica — 2.7% |
| |||||||||
Costa Rica Government International Bond | 200,000 | 195,502 | ||||||||
|
| |||||||||
Croatia — 3.2% |
| |||||||||
Croatia Government International Bond | 200,000 | 229,864 | ||||||||
|
| |||||||||
Dominican Republic — 3.3% |
| |||||||||
Dominican Republic International Bond | 200,000 | 239,502 | ||||||||
|
| |||||||||
Ecuador — 2.5% | ||||||||||
Ecuador Government International Bond | 200,000 | 179,200 | ||||||||
|
| |||||||||
Egypt — 8.0% |
| |||||||||
Egypt Government International Bond | 100,000 | 97,052 | ||||||||
Egypt Government International Bond | 250,000 | 267,592 | ||||||||
Egypt Government International Bond | 200,000 | 214,074 | ||||||||
|
| |||||||||
| 578,718 | ||||||||||
|
| |||||||||
| Par* Value | Value | |||||||||
FOREIGN GOVERNMENT BONDS AND NOTES — (Continued) |
| |||||||||
Hungary — 1.1% | ||||||||||
Hungary Government International Bond | $ | 50,000 | $ | 82,145 | ||||||
|
| |||||||||
Jordan — 2.9% | ||||||||||
Jordan Government International Bond | 200,000 | 210,570 | ||||||||
|
| |||||||||
Lebanon — 2.5% | ||||||||||
Lebanon Government International Bond | 50,000 | 41,579 | ||||||||
Lebanon Government International Bond | 70,000 | 41,300 | ||||||||
Lebanon Government International Bond | 175,000 | 98,000 | ||||||||
|
| |||||||||
| 180,879 | ||||||||||
|
| |||||||||
Mexico — 7.0% | ||||||||||
Mexican Bonos | MXN | 1,200,000 | 71,451 | |||||||
Mexican Bonos | MXN | 1,000,000 | 67,299 | |||||||
Petroleos Mexicanos | 125,000 | 123,750 | ||||||||
Petroleos Mexicanos | 200,000 | 179,250 | ||||||||
Petroleos Mexicanos | 50,000 | 44,950 | ||||||||
Petroleos Mexicanos | 25,000 | 24,875 | ||||||||
|
| |||||||||
| 511,575 | ||||||||||
|
| |||||||||
The accompanying notes are an integral part of the financial statements.
16
DUPONT CAPITAL EMERGING MARKETS DEBT FUND
Portfolio of Investments (Continued)
October 31, 2019
(Unaudited)
| Par* Value | Value | |||||||||||
FOREIGN GOVERNMENT BONDS AND NOTES — (Continued) |
| |||||||||||
Morocco — 2.9% |
| |||||||||||
Morocco Government International Bond | $ | 200,000 | $ | 209,494 | ||||||||
|
| |||||||||||
Nigeria — 2.8% | ||||||||||||
Nigeria Government International Bond | 200,000 | 200,332 | ||||||||||
|
| |||||||||||
Oman — 2.7% | ||||||||||||
Oman Government International Bond | 200,000 | 194,250 | ||||||||||
|
| |||||||||||
Pakistan — 1.4% | ||||||||||||
Pakistan Government International Bond | 100,000 | 100,459 | ||||||||||
|
| |||||||||||
Poland — 2.5% | ||||||||||||
Republic of Poland Government Bond | PLN | 700,000 | 183,563 | |||||||||
|
| |||||||||||
Romania — 0.9% | ||||||||||||
Romanian Government International Bond | 50,000 | 64,925 | ||||||||||
|
| |||||||||||
South Africa — 2.8% | ||||||||||||
Eskom Holdings SOC Ltd. | 200,000 | 205,164 | ||||||||||
|
| |||||||||||
Turkey — 4.0% | ||||||||||||
Turkey Government International Bond | 100,000 | 107,250 | ||||||||||
| Par* Value | Value | |||||||||||
FOREIGN GOVERNMENT BONDS AND NOTES — (Continued) |
| |||||||||||
Turkey — (Continued) |
| |||||||||||
Turkey Government International Bond | $ | 200,000 | $ | 186,000 | ||||||||
|
| |||||||||||
| 293,250 | ||||||||||||
|
| |||||||||||
Ukraine — 7.7% | ||||||||||||
Privatbank CJSC Via UK SPV Credit Finance PLC | 160,000 | 43,426 | ||||||||||
Ukraine Government International Bond | 50,000 | 46,938 | ||||||||||
Ukreximbank Via Biz Finance PLC,6-M LIBOR + 7.00%, | 210,000 | 204,792 | ||||||||||
Ukreximbank Via Biz Finance PLC | 250,000 | 265,000 | ||||||||||
|
| |||||||||||
| 560,156 | ||||||||||||
|
| |||||||||||
Venezuela — 0.1% | ||||||||||||
Venezuela Government International Bond | 50,000 | 5,187 | ||||||||||
|
| |||||||||||
TOTAL FOREIGN GOVERNMENT BONDS AND NOTES (Cost $5,607,380) | 5,060,333 | |||||||||||
|
| |||||||||||
The accompanying notes are an integral part of the financial statements.
17
DUPONT CAPITAL EMERGING MARKETS DEBT FUND
Portfolio of Investments (Continued)
October 31, 2019
(Unaudited)
| Par* Value | Value | |||||||
U.S. TREASURY OBLIGATIONS — 5.8% |
| |||||||
United States Treasury Notes — 5.8% |
| |||||||
2.25%, 08/15/2027 | $ | 200,000 | $ | 209,149 | ||||
2.25%, 11/15/2027 | 200,000 | 209,273 | ||||||
TOTAL U.S. TREASURY OBLIGATIONS (Cost $396,137) | 418,422 | |||||||
|
| |||||||
| Number of Shares | ||||||||
COMMON STOCKS — 0.0% |
| |||||||
Brazil — 0.0% | ||||||||
Dommo Energia SA, SP ADR(a) | 31 | 361 | ||||||
|
| |||||||
TOTAL COMMON STOCKS (Cost $ —) | 361 | |||||||
|
| |||||||
TOTAL INVESTMENTS - 92.1% |
| 6,688,893 | ||||||
OTHER ASSETS IN EXCESS OF LIABILITIES - 7.9% |
| 572,415 | ||||||
|
| |||||||
NET ASSETS - 100.0% | $ | 7,261,308 | ||||||
|
| |||||||
| * | Par amount denominated in USD unless otherwise noted. |
| (a) | Security is deemed illiquid at October 31, 2019. |
| (b) | Investments with a total aggregate value of $93,615 or 1.29% of net assets were in default as of October 31, 2019. |
| (c) | Securities exempt from registration under Rule 144A of the Securities Act of 1933, as amended. These securities were purchased in accordance with the guidelines approved by the Fund’s Board of Trustees and may be resold, in transactions exempt from registration, to qualified institutional buyers. At October 31, 2019 these securities amounted to $1,439,462 or 19.82% of net assets. These securities have been determined by the Adviser to be liquid securities. |
| (d) | Variable rate investments. The rate shown is based on the latest available information as of October 31, 2019. Certain variable rate securities are not based on a published reference rate and spread but are determined by the issuer or agent and are based on current market conditions. These securities do not indicate a reference rate or spread in their description. |
Forward foreign currency contracts outstanding as of October 31, 2019 were as follows:
Currency Purchased | Currency Sold | Expiration | Counterparty | Unrealized Depreciation | ||||||||||
USD 69,414 | EUR | 62,409 | 12/10/19 | TDS | $(384) | |||||||||
The accompanying notes are an integral part of the financial statements.
18
DUPONT CAPITAL EMERGING MARKETS DEBT FUND
Portfolio of Investments (Concluded)
October 31, 2019
(Unaudited)
| BRL | Brazilian Real | |
| CJSC | Closed Joint Stock Company | |
| EUR | Euro | |
| LIBOR | London Interbank Offered Rate | |
| MXN | Mexican Peso | |
| PLC | Public Limited Company | |
| PLN | Polish Zloty | |
| RUB | Russian Ruble | |
| SP ADR | Sponsored American Depository Receipt | |
| TDS | TD Securities Ltd | |
| USD | United States Dollar | |
| 6-M | Six Months |
The accompanying notes are an integral part of the financial statements.
19
DUPONT CAPITAL FUNDS
Statements of Assets and Liabilities
October 31, 2019
(Unaudited)
| DuPont Capital Emerging Markets Fund | DuPont Capital Emerging Markets Debt Fund | |||||||||
Assets | ||||||||||
Investments, at value (Cost $21,857,071 and $7,617,735, respectively) | $ | 24,134,899 | $ | 6,688,893 | ||||||
Cash | 240,204 | 362,090 | ||||||||
Foreign currency (Cost $296,104 and $121,926, respectively) | 296,107 | 119,747 | ||||||||
Dividends and interest receivable | 23,806 | 110,990 | ||||||||
Receivable from Investment Adviser | 500 | 11,299 | ||||||||
Prepaid expenses and other assets | 31,316 | 21,156 | ||||||||
|
|
|
| |||||||
Total assets | 24,726,832 | 7,314,175 | ||||||||
|
|
|
| |||||||
Liabilities | ||||||||||
Payable for investments purchased | 416,043 | — | ||||||||
Payable for audit fees | 21,895 | 14,714 | ||||||||
Payable for administration and accounting fees | 19,105 | 18,309 | ||||||||
Payable for transfer agent fees | 12,888 | 6,308 | ||||||||
Payable for printing fees | 9,621 | 1,058 | ||||||||
Payable for custodian fees | 7,255 | 5,298 | ||||||||
Payable for legal fees | 5,790 | 2,849 | ||||||||
Payable for foreign taxes | 1,266 | — | ||||||||
Payable for Trustees and Officers | — | 1,840 | ||||||||
Unrealized depreciation on forward foreign currency contracts* | — | 384 | ||||||||
Accrued expenses | 317 | 2,107 | ||||||||
|
|
|
| |||||||
Total liabilities | 494,180 | 52,867 | ||||||||
|
|
|
| |||||||
Net Assets | $ | 24,232,652 | $ | 7,261,308 | ||||||
|
|
|
| |||||||
Net Assets consisted of: | ||||||||||
Capital stock, $0.01 par value | $ | 28,700 | $ | 8,369 | ||||||
Paid-in capital | 107,123,031 | 8,150,763 | ||||||||
Total distributable loss | (82,919,079 | ) | (897,824 | ) | ||||||
|
|
|
| |||||||
Net Assets | $ | 24,232,652 | $ | 7,261,308 | ||||||
|
|
|
| |||||||
Class I: | ||||||||||
Net asset value, offering and redemption price per share ($24,232,652 / 2,870,043 shares) and ($7,261,308 / 836,885 shares), respectively | $8.44 | $8.68 | ||||||||
| * | Primary risk exposure is foreign currency contracts. |
The accompanying notes are an integral part of the financial statements.
20
DUPONT CAPITAL FUNDS
Statements of Operations
For the Six Months Ended October 31, 2019
(Unaudited)
| DuPont Capital Emerging Markets Fund | DuPont Capital Emerging Markets Debt Fund | |||||||||
Investment income | ||||||||||
Dividends | $ | 597,203 | $ | 1,027 | ||||||
Interest | — | 247,115 | ||||||||
Less: foreign taxes withheld | (60,606 | ) | — | |||||||
|
|
|
| |||||||
Total investment income | 536,597 | 248,142 | ||||||||
|
|
|
| |||||||
Expenses | ||||||||||
Advisory fees (Note 2) | 124,417 | 22,196 | ||||||||
Administration and accounting fees (Note 2) | 51,728 | 36,761 | ||||||||
Legal fees | 19,737 | 8,237 | ||||||||
Trustees’ and officers’ fees (Note 2) | 18,939 | 11,202 | ||||||||
Audit fees | 17,687 | 15,485 | ||||||||
Custodian fees (Note 2) | 16,534 | 10,579 | ||||||||
Registration and filing fees | 13,158 | 12,612 | ||||||||
Transfer agent fees (Note 2) | 12,230 | 13,706 | ||||||||
Printing and shareholder reporting fees | 325 | 4,320 | ||||||||
Other expenses | 8,133 | 5,783 | ||||||||
|
|
|
| |||||||
Total expenses before waivers and reimbursements | 282,888 | 140,881 | ||||||||
|
|
|
| |||||||
Less: waivers and reimbursements (Note 2) | (132,403 | ) | (107,956 | ) | ||||||
|
|
|
| |||||||
Net expenses after waivers and reimbursements | 150,485 | 32,925 | ||||||||
|
|
|
| |||||||
Net investment income | 386,112 | 215,217 | ||||||||
|
|
|
| |||||||
Net realized and unrealized gain/(loss) from investments | ||||||||||
Net realized gain from investments | 702,699 | 952 | ||||||||
Net realized gain/(loss) from foreign currency transactions | (10,008 | ) | 537 | |||||||
Net realized gain from forward foreign currency contracts* | — | 2,243 | ||||||||
Net change in unrealized appreciation/(depreciation) on investments(a) | (2,332,023 | ) | (180,540 | ) | ||||||
Net change in unrealized appreciation/(depreciation) on foreign currency translations | (139 | ) | (1,480 | ) | ||||||
Net change in unrealized appreciation/(depreciation) on forward foreign currency contracts* | — | (1,291 | ) | |||||||
|
|
|
| |||||||
Net realized and unrealized loss on investments | (1,639,471 | ) | (179,579 | ) | ||||||
|
|
|
| |||||||
Net increase/(decrease) in net assets resulting from operations | $ | (1,253,359 | ) | $ | 35,638 | |||||
|
|
|
| |||||||
| * | Primary risk exposure is foreign currency contracts. |
| (a) | Change in net unrealized appreciation/(depreciation) on investments for the DuPont Capital Emerging Markets Fund was net of an increase in deferred foreign capital gains tax of $836. |
The accompanying notes are an integral part of the financial statements.
21
DUPONT CAPITAL EMERGING MARKETS FUND
Statements of Changes in Net Assets
| For the Six Months Ended October 31, 2019 (Unaudited) | For the Year Ended April 30, 2019 | |||||||||
Increase/(decrease) in net assets from operations: | ||||||||||
Net investment income | $ | 386,112 | $ | 489,745 | ||||||
Net realized gain from investments and foreign currency transactions | 692,691 | 858,588 | ||||||||
Net change in unrealized appreciation/(depreciation) on investments and foreign currency translations | (2,332,162 | ) | (2,863,680 | ) | ||||||
|
|
|
| |||||||
Net decrease in net assets resulting from operations | (1,253,359 | ) | (1,515,347 | ) | ||||||
|
|
|
| |||||||
Less dividends and distributions to shareholders from: | ||||||||||
Total distributable earnings | — | (436,646 | ) | |||||||
|
|
|
| |||||||
Decrease in net assets from dividends and distributions to shareholders | — | (436,646 | ) | |||||||
|
|
|
| |||||||
Increase/(decrease) in net assets derived from capital share transactions (Note 4) | 24,179 | (1,590,174 | ) | |||||||
|
|
|
| |||||||
Total decrease in net assets | (1,229,180 | ) | (3,542,167 | ) | ||||||
|
|
|
| |||||||
Net assets | ||||||||||
Beginning of period | 25,461,832 | 29,003,999 | ||||||||
|
|
|
| |||||||
End of period | $ | 24,232,652 | $ | 25,461,832 | ||||||
|
|
|
| |||||||
The accompanying notes are an integral part of the financial statements.
22
DUPONT CAPITAL EMERGING MARKETS DEBT FUND
Statements of Changes in Net Assets
| For the Six Months Ended October 31, 2019 (Unaudited) | For the Year Ended April 30, 2019 | |||||||||
Increase/(decrease) in net assets from operations: | ||||||||||
Net investment income | $ | 215,217 | $ | 372,619 | ||||||
Net realized gain from investments, forward foreign currency contracts and foreign currency transactions | 3,732 | 18,638 | ||||||||
Net change in unrealized appreciation/(depreciation) on investments, forward foreign currency contracts and foreign currency translations | (183,311 | ) | (291,306 | ) | ||||||
|
|
|
| |||||||
Net increase in net assets resulting from operations | 35,638 | 99,951 | ||||||||
|
|
|
| |||||||
Less dividends and distributions to shareholders from: | ||||||||||
Total distributable earnings | (230,797 | ) | (388,320 | ) | ||||||
|
|
|
| |||||||
Decrease in net assets from dividends and distributions to shareholders | (230,797 | ) | (388,320 | ) | ||||||
|
|
|
| |||||||
Increase in net assets derived from capital share transactions (Note 4) | 196,713 | 976,392 | ||||||||
|
|
|
| |||||||
Total increase in net assets | 1,554 | 688,023 | ||||||||
|
|
|
| |||||||
Net Assets | ||||||||||
Beginning of period | 7,259,754 | 6,571,731 | ||||||||
|
|
|
| |||||||
End of period | $ | 7,261,308 | $ | 7,259,754 | ||||||
|
|
|
| |||||||
The accompanying notes are an integral part of the financial statements.
23
DUPONT CAPITAL EMERGING MARKETS FUND
Financial Highlights
Contained below is per share operating performance data for Class I shares outstanding, total investment return, ratios to average net assets and other supplemental data for the respective period. The total returns in the table represent the rate that an investor would have earned or lost on an investment in the Fund (assuming reinvestment of all dividends and distributions). This information has been derived from information provided in the financial statements and should be read in conjunction with the financial statements and the notes thereto.
| Class I | ||||||||||||||||||||||||||||||
| | For the Six Months Ended 2019 |
| | For the Year Ended April 30, 2019 |
| | For the Year Ended April 30, 2018 |
| | For the Year Ended April 30, 2017 | | | For the Year Ended April 30, 2016 | | | For the Year Ended April 30, 2015 | | |||||||||||||
Per Share Operating Performance | ||||||||||||||||||||||||||||||
Net asset value, beginning of period | $ | 8.85 | $ | 9.55 | $ | 7.97 | $ | 6.64 | $ | 8.28 | $ | 8.79 | ||||||||||||||||||
|
|
|
|
|
|
|
|
|
|
|
| |||||||||||||||||||
Net investment income(1) | 0.14 | 0.18 | 0.14 | 0.11 | 0.13 | 0.17 | ||||||||||||||||||||||||
Net realized and unrealized gain/(loss) on investments | (0.55 | ) | (0.72 | ) | 1.59 | 1.32 | (1.73 | ) | (0.53 | ) | ||||||||||||||||||||
|
|
|
|
|
|
|
|
|
|
|
| |||||||||||||||||||
Net increase/(decrease) in net assets resulting from operations | (0.41 | ) | (0.54 | ) | 1.73 | 1.43 | (1.60 | ) | �� | (0.36 | ) | |||||||||||||||||||
|
|
|
|
|
|
|
|
|
|
|
| |||||||||||||||||||
Dividends and distributions to shareholders from: | ||||||||||||||||||||||||||||||
Net investment income | — | (0.16 | ) | (0.15 | ) | (0.10 | ) | (0.04 | ) | (0.15 | ) | |||||||||||||||||||
|
|
|
|
|
|
|
|
|
|
|
| |||||||||||||||||||
Net asset value, end of period | $ | 8.44 | $ | 8.85 | $ | 9.55 | $ | 7.97 | $ | 6.64 | $ | 8.28 | ||||||||||||||||||
|
|
|
|
|
|
|
|
|
|
|
| |||||||||||||||||||
Total investment return(2) | (4.63 | )% | (5.46 | )% | 21.82 | % | 21.77 | % | (19.23 | )% | (3.97 | )% | ||||||||||||||||||
Ratios/Supplemental Data | ||||||||||||||||||||||||||||||
Net assets, end of period (in thousands) | $ | 24,233 | $ | 25,462 | $ | 29,004 | $ | 30,816 | $ | 54,137 | $ | 166,994 | ||||||||||||||||||
Ratio of expenses to average net assets | 1.27 | %(3) | 1.27 | % | 1.27 | % | 1.39 | % | 1.60 | % | 1.35 | % | ||||||||||||||||||
Ratio of expenses to average net assets without waivers and expense reimbursements(4) | 2.39 | %(3) | 2.37 | % | 2.17 | % | 2.06 | % | 1.63 | % | 1.35 | % | ||||||||||||||||||
Ratio of net investment income to average net assets | 3.26 | %(3) | 2.05 | % | 1.52 | % | 1.51 | % | 1.81 | % | 1.95 | % | ||||||||||||||||||
Portfolio turnover rate | 31 | %(5) | 35 | % | 65 | % | 28 | % | 53 | % | 86 | % | ||||||||||||||||||
| (1) | The selected per share data was calculated using the average shares outstanding method for the period. |
| (2) | Total investment return is calculated assuming a purchase of shares on the first day and a sale of shares on the last day of each period reported and includes reinvestment of dividends and distributions, if any. Total return for period less than one year is not annualized. |
| (3) | Annualized. |
| (4) | During the period, certain fees were waived and/or reimbursed. If such fee waivers and/or reimbursements had not occurred, the ratios would have been as indicated (See Note 2). |
| (5) | Not annualized. |
The accompanying notes are an integral part of the financial statements.
24
DUPONT CAPITAL EMERGING MARKETS DEBT FUND
Financial Highlights
Contained below is per share operating performance data for Class I shares outstanding, total investment return, ratios to average net assets and other supplemental data for the respective period. The total returns in the table represent the rate that an investor would have earned or lost on an investment in the Fund (assuming reinvestment of all dividends and distributions). This information has been derived from information provided in the financial statements and should be read in conjunction with the financial statements and the notes thereto.
| Class I | ||||||||||||||||||||||||||||||
| | For the Six Months | | | For the Year Ended April 30, 2019 | | | For the Year Ended April 30, 2018 | | | For the Year Ended April 30, 2017 | | | For the Year Ended April 30, 2016 | | | For the Year Ended April 30, 2015 | | |||||||||||||
Per Share Operating Performance | �� | |||||||||||||||||||||||||||||
Net asset value, beginning of period | $ | 8.91 | $ | 9.35 | $ | 9.79 | $ | 9.56 | $ | 9.77 | $ | 10.26 | ||||||||||||||||||
|
|
|
|
|
|
|
|
|
|
|
| |||||||||||||||||||
Net investment income(1) | 0.26 | 0.48 | 0.53 | 0.66 | 0.74 | 0.67 | ||||||||||||||||||||||||
Net realized and unrealized gain/(loss) on investments | (0.21 | ) | (0.40 | ) | (0.38 | ) | 0.11 | 0.21 | (0.43 | ) | ||||||||||||||||||||
|
|
|
|
|
|
|
|
|
|
|
| |||||||||||||||||||
Net increase in net assets resulting from operations | 0.05 | 0.08 | 0.15 | 0.77 | 0.95 | 0.24 | ||||||||||||||||||||||||
|
|
|
|
|
|
|
|
|
|
|
| |||||||||||||||||||
Dividends and distributions to shareholders from: | ||||||||||||||||||||||||||||||
Net investment income | (0.28 | ) | (0.52 | ) | (0.59 | ) | (0.52 | ) | (0.98 | ) | (0.44 | ) | ||||||||||||||||||
Net realized capital gains | — | — | — | (0.02 | ) | (0.18 | ) | (0.29 | ) | |||||||||||||||||||||
|
|
|
|
|
|
|
|
|
|
|
| |||||||||||||||||||
Total dividends and distributions to shareholders | (0.28 | ) | (0.52 | ) | (0.59 | ) | (0.54 | ) | (1.16 | ) | (0.73 | ) | ||||||||||||||||||
|
|
|
|
|
|
|
|
|
|
|
| |||||||||||||||||||
Net asset value, end of period | $ | 8.68 | $ | 8.91 | $ | 9.35 | $ | 9.79 | $ | 9.56 | $ | 9.77 | ||||||||||||||||||
|
|
|
|
|
|
|
|
|
|
|
| |||||||||||||||||||
Total investment return(2) | 0.51 | % | 1.16 | % | 1.46 | % | 8.45 | % | 10.82 | % | 2.41 | % | ||||||||||||||||||
Ratios/Supplemental Data | ||||||||||||||||||||||||||||||
Net assets, end of period (in thousands) | $ | 7,261 | $ | 7,260 | $ | 6,572 | $ | 6,145 | $ | 5,810 | $ | 7,427 | ||||||||||||||||||
Ratio of expenses to average net assets | 0.89 | %(3) | 0.89 | % | 0.89 | % | 0.89 | % | 0.89 | % | 0.89 | % | ||||||||||||||||||
Ratio of expenses to average net assets without waivers and expense reimbursements(4) | 3.81 | %(3) | 3.92 | % | 3.46 | % | 3.70 | % | 3.34 | % | 2.25 | % | ||||||||||||||||||
Ratio of net investment income to average net assets | 5.82 | %(3) | 5.45 | % | 5.45 | % | 6.84 | % | 7.93 | % | 6.70 | % | ||||||||||||||||||
Portfolio turnover rate | 1 | %(5) | 10 | % | 17 | % | 18 | % | 25 | % | 24 | % | ||||||||||||||||||
| (1) | The selected per share data was calculated using the average shares outstanding method for the period. |
| (2) | Total investment return is calculated assuming a purchase of shares on the first day and a sale of shares on the last day of each period reported and includes reinvestment of dividends and distributions, if any. Total return for period less than one year is not annualized. |
| (3) | Annualized. |
| (4) | During the period, certain fees were waived and/or reimbursed. If such fee waivers and/or reimbursements had not occurred, the ratios would have been as indicated (See Note 2). |
| (5) | Not annualized. |
The accompanying notes are an integral part of the financial statements.
25
DUPONT CAPITAL FUNDS
Notes to Financial Statements
October 31, 2019
(Unaudited)
1. Organization and Significant Accounting Policies
The DuPont Capital Emerging Markets Fund is a diversified,open-end management investment company registered under the Investment Company Act of 1940, as amended (the “1940 Act”). The DuPont Capital Emerging Markets Debt Fund is anon-diversified,open-end management investment company registered under the 1940 Act (the DuPont Capital Emerging Markets Fund and the DuPont Capital Emerging Markets Debt Fund are each a “Fund”, and together, the “Funds”). The DuPont Capital Emerging Markets Fund commenced operations on December 6, 2010 and the DuPont Capital Emerging Markets Debt Fund commenced operations on September 27, 2013. The Funds are each a separate series of FundVantage Trust (the “Trust”) which was organized as a Delaware statutory trust on August 28, 2006. The Trust is a “series trust” authorized to issue an unlimited number of separate series or classes of shares of beneficial interest. Each series is treated as a separate entity for certain matters under the 1940 Act, and for other purposes, and a shareholder of one series is not deemed to be a shareholder of any other series. The Funds are each authorized to issue and offer Class I Shares.
The Funds are investment companies and follow accounting and reporting guidance in the Financial Accounting Standards Board Accounting Standards Codification Topic 946.
Portfolio Valuation— Each Fund’s net asset value (“NAV”) is calculated once daily at the close of regular trading hours on the New York Stock Exchange (“NYSE”) (typically 4:00 p.m. Eastern time) on each day the NYSE is open. Securities held by each Fund are valued using the closing price or the last sale price on a national securities exchange or the National Association of Securities Dealers Automatic Quotation System (“NASDAQ”) market system where they are primarily traded. Equity securities listed on any national or foreign exchange market system will be valued at the last sale price. Equity securities traded in theover-the-counter market are valued at their closing price. If there were no transactions on that day, securities traded principally on an exchange will be valued at the mean of the last bid and ask prices prior to the market close. Prices for equity securities normally are supplied by an independent pricing service approved by the Trust’s Board of Trustees (“Board of Trustees”). Fixed income securities are valued based on market quotations, which are furnished by an independent pricing service approved by the FundVantage Board of Trustees. Fixed income securities having remaining maturities of 60 days or less are generally valued at amortized cost, provided such amounts approximates market value. Debt securities are valued on the basis of broker quotations or valuations provided by a pricing service, which utilizes information with respect to recent sales, market transactions in comparable securities, quotations from dealers, and various relationships between securities in determining value. Due to continued volatility in the current market, valuations developed through pricing techniques may materially vary from the actual amounts realized upon sale of the securities. Any assets held by the Funds that are denominated in foreign currencies are valued daily in U.S. dollars at the foreign currency exchange rates that are prevailing at the time that the Funds determine the daily NAV per share. Foreign securities may trade on weekends or other days when the Funds do not calculate NAV. As a result, the market value of these investments may change on days when you cannot buy or sell shares of the Funds. Foreign securities are valued
26
DUPONT CAPITAL FUNDS
Notes to Financial Statements (Continued)
October 31, 2019
(Unaudited)
based on prices from the primary market in which they are traded and are translated from the local currency into U.S. dollars using current exchange rates. Forward exchange contracts are valued at the forward rate. Investments in any mutual fund are valued at their respective NAVs as determined by those mutual funds each business day (which may use fair value pricing as disclosed in their prospectuses). If market quotations are unavailable or deemed unreliable, securities will be valued in accordance with procedures adopted by the Board of Trustees. Relying on prices supplied by pricing services or dealers or using fair valuation may result in values that are higher or lower than the values used by other investment companies and investors to price the same investments. In the event that market quotes are not readily available, and the security or asset cannot be valued pursuant to one of the valuation methods, the value of the security or asset will be determined in good faith by the Adviser. The Trust has established a Valuation Committee which performs certain functions including the oversight of the Adviser’s fair valuation determinations.
Fair Value Measurements— The inputs and valuation techniques used to measure fair value of each Fund’s investments are summarized into three levels as described in the hierarchy below:
| · Level 1 — | quoted prices in active markets for identical securities; | |||
| · Level 2 — | other significant observable inputs (including quoted prices for similar securities, interest rates, prepayment speeds, credit risk, etc.); and | |||
| · Level 3 — | significant unobservable inputs (including each Fund’s own assumptions in determining the fair value of investments). | |||
The fair value of each Fund’s bonds is generally based on quotes received from brokers or independent pricing services. Bonds with quotes that are based on actual trades with a sufficient level of activity on or near the measurement date are classified as Level 2 assets.
The inputs or methodology used for valuing securities are not necessarily an indication of the risk associated with investing in those securities. Transfers in and out are recognized at the value at the end of the period.
Significant events (such as movement in the U.S. securities market, or other regional and local developments) may occur between the time that foreign markets close (where the security is principally traded) and the time that each Fund calculates its NAV (generally, the close of the NYSE) that may impact the value of securities traded in these foreign markets. As a result, each Fund fair values foreign securities using an independent pricing service which considers the correlation of the trading patterns of the foreign security to the intraday trading in the U.S. markets for investments such as American Depositary Receipts, financial futures, exchange traded funds and certain indexes as well as prices for similar securities. Such fair valuations are categorized as Level 2 in the hierarchy.
27
DUPONT CAPITAL FUNDS
Notes to Financial Statements (Continued)
October 31, 2019
(Unaudited)
Securities listed on anon-U.S. exchange are generally fair valued daily by an independent fair value pricing service approved by the Board of Trustees and categorized as Level 2 investments within the hierarchy. The fair valuations for these securities may not be the same as quoted or published prices of the securities on their primary markets. Securities for which daily fair value prices from the independent fair value pricing service are not available are generally valued at the last quoted sale price at the close of an exchange on which the security is traded and categorized as Level 1 investments within the hierarchy. Values of foreign securities, currencies, and other assets and liabilities denominated in foreign currencies are translated into U.S. dollars at the exchange rate of said currencies against the U.S. dollar, as of valuation time, as provided by an independent pricing service approved by the Board of Trustees.
The following is a summary of the inputs used, as of October 31, 2019, in valuing each Fund’s investments carried at fair value:
| DuPont Capital Emerging Markets Fund | ||||||||||||||||
Assets | Total Value at 10/31/19 | Level 1 Quoted Prices | Level 2 Other Significant Observable Inputs | Level 3 Significant Unobservable Inputs | ||||||||||||
Common Stocks | ||||||||||||||||
Argentina | $ | 130,559 | $ | 130,559 | $ | — | $ | — | ||||||||
Brazil | 775,246 | 775,246 | — | — | ||||||||||||
China | 7,096,658 | 1,429,388 | 5,667,270 | — | ||||||||||||
Czech Republic | 264,799 | — | 264,799 | — | ||||||||||||
Greece | 239,945 | — | 239,945 | — | ||||||||||||
India | 1,355,657 | 1,174,789 | 180,868 | — | ||||||||||||
Indonesia | 350,898 | — | 350,898 | — | ||||||||||||
Kazakhstan | 277,949 | — | 277,949 | — | ||||||||||||
Malaysia | 391,962 | — | 391,962 | — | ||||||||||||
Mexico | 609,024 | 609,024 | — | — | ||||||||||||
Poland | 85,698 | 85,698 | — | — | ||||||||||||
Russia | 1,142,134 | 245,085 | 897,049 | — | ||||||||||||
Saudi Arabia | 539,584 | 266,238 | 273,346 | — | ||||||||||||
South Africa | 2,077,936 | 106,698 | 1,971,238 | — | ||||||||||||
South Korea | 3,506,928 | — | 3,506,928 | — | ||||||||||||
Taiwan | 2,417,122 | 266,049 | 2,151,073 | — | ||||||||||||
Thailand | 304,358 | — | 304,358 | — | ||||||||||||
Turkey | 747,640 | — | 747,640 | — | ||||||||||||
Preferred Stocks | 1,116,699 | 1,116,699 | — | — | ||||||||||||
Exchange Traded Fund | 704,103 | 704,103 | — | — | ||||||||||||
|
|
|
|
|
|
|
| |||||||||
Total Investments | $ | 24,134,899 | $ | 6,909,576 | $ | 17,225,323 | $ | — | ||||||||
|
|
|
|
|
|
|
| |||||||||
28
DUPONT CAPITAL FUNDS
Notes to Financial Statements (Continued)
October 31, 2019
(Unaudited)
| DuPont Capital Emerging Markets Debt Fund | ||||||||||||||||
Assets | Total Value at 10/31/19 | Level 1 Quoted Price | Level 2 Other Significant Observable Inputs | Level 3 Significant Unobservable Inputs | ||||||||||||
Corporate Bonds and Notes | $ | 1,209,777 | $ | — | $ | 1,209,777 | $ | — | ||||||||
Foreign Government Bonds and Notes | 5,060,333 | — | 5,060,333 | — | ||||||||||||
U.S. Treasury Obligations | 418,422 | — | 418,422 | — | ||||||||||||
Common Stocks | 361 | — | 361 | — | ||||||||||||
|
|
|
|
|
|
|
| |||||||||
Total Assets | $ | 6,688,893 | $ | — | $ | 6,688,893 | $ | — | ||||||||
|
|
|
|
|
|
|
| |||||||||
Liabilities | Total Value at 10/30/19 | Level 1 Quoted Price | Level 2 Other Significant Observable Inputs | Level 3 Significant Unobservable Inputs | ||||||||||||
Derivatives: | ||||||||||||||||
Foreign Currency Contracts | ||||||||||||||||
Forward Foreign Currency Contracts | $ | (384 | ) | $ | — | $ | (384 | ) | $ | — | ||||||
|
|
|
|
|
|
|
| |||||||||
Total Liabilities | $ | (384 | ) | $ | — | $ | (384 | ) | $ | — | ||||||
|
|
|
|
|
|
|
| |||||||||
At the end of each quarter, management evaluates the classification of Levels 1, 2 and 3 assets and liabilities. Various factors are considered, such as changes in liquidity from the prior reporting period; whether or not a broker is willing to execute at the quoted price; the depth and consistency of prices from third party pricing services; and the existence of contemporaneous, observable trades in the market. Additionally, management evaluates the classification of Level 1 and Level 2 assets and liabilities on a quarterly basis for changes in listings or delistings on national exchanges.
Due to the inherent uncertainty of determining the fair value of investments that do not have readily available market value, the fair value of each Fund’s investments may fluctuate from period to period. Additionally, the fair value of investments may differ significantly from the values that would have been used had a ready market existed for such investments and may differ materially from the values each Fund may ultimately realize. Further, such investments may be subject to legal and other restrictions on resale or otherwise less liquid than publicly traded securities.
For fair valuations using significant unobservable inputs, U.S. generally accepted accounting principles (“U.S. GAAP”) require each Fund to present a reconciliation of the beginning to ending balances for reported market values that present changes attributable to total realized and unrealized gains or losses, purchase and sales, and transfers in and out of Level 3 during the period. A reconciliation of Level 3
29
DUPONT CAPITAL FUNDS
Notes to Financial Statements (Continued)
October 31, 2019
(Unaudited)
investments is presented only when each Fund had an amount of Level 3 investments at the end of the reporting period that was meaningful in relation to its net assets. The amounts and reasons for all transfers in and out of each Level within the three-tier hierarchy are disclosed when each Fund had an amount of total transfers during the reporting period that was meaningful in relation to its net assets as of the end of the reporting period.
For the six months ended October 31, 2019, there were no transfers in or out of Level 3.
Use of Estimates— The preparation of financial statements in conformity with U.S. GAAP requires management to make estimates and assumptions that affect the amounts reported in the financial statements and accompanying notes at the date of the financial statements and the reported amounts of revenues and expenses during the period. Actual results could differ from those estimates and those differences could be material.
Investment Transactions, Investment Income and Expenses— Investment transactions are recorded on trade date for financial statement preparation purposes. Realized gains and losses on investments sold are recorded on the identified cost basis. Interest income is recorded on the accrual basis. Accretion of discounts and amortization of premiums are recorded on a daily basis using the effective yield method except for short term securities, which records discounts and premiums on a straight-line basis. Dividends are recorded on theex-dividend date. Estimated components of distributions received from real estate investment trusts may be considered income, return of capital distributions or capital gain distributions. Return of capital distributions are recorded as a reduction of cost of the related investments. General expenses of the Trust are generally allocated to each fund in proportion to its relative daily net assets. Expenses directly attributable to a particular fund in the Trust are charged directly to that fund.
Foreign Currency Translation— Assets and liabilities initially expressed innon-U.S. currencies are translated into U.S. dollars based on the applicable exchange rates at the date of the last business day of the financial statement period. Purchases and sales of securities, interest income, dividends, variation margin received and expenses denominated in foreign currencies are translated into U.S. dollars at the exchange rates in effect on the transaction date.
Each Fund does not separately report the effect of changes in foreign exchange rates from changes in market prices of securities held. Such changes are included with the net realized gain or loss and change in unrealized appreciation or depreciation on investment securities in the Statement of Operations. Other foreign currency transactions resulting in realized and unrealized gain or loss are reported separately as net realized gain or loss and change in unrealized appreciation or depreciation on foreign currencies in the Statement of Operations.
30
DUPONT CAPITAL FUNDS
Notes to Financial Statements (Continued)
October 31, 2019
(Unaudited)
Dividends and Distributions to Shareholders— Dividends from net investment income, if any, are declared and paid at least annually to shareholders of the DuPont Capital Emerging Markets Fund and dividends from net investment income are declared daily and paid semi-annually to shareholders of the DuPont Capital Emerging Markets Debt Fund. Distributions from net realized capital gains, if any, will be declared and paid at least annually to shareholders and recorded onex-date for both Funds. Income dividends and capital gain distributions are determined in accordance with U.S. federal income tax regulations, which may differ from U.S. GAAP.
U.S. Tax Status— No provision is made for U.S. income taxes as it is each Fund’s intention to continue to qualify for and elect the tax treatment applicable to regulated investment companies under Subchapter M of the Internal Revenue Code of 1986, as amended (the “Internal Revenue Code”), and make the requisite distributions to its shareholders which will be sufficient to relieve it from U.S. income and excise taxes.
Other— In the normal course of business, each Fund may enter into contracts that provide general indemnifications. Each Fund’s maximum exposure under these arrangements is dependent on claims that may be made against each Fund in the future, and, therefore, cannot be estimated; however, based on experience, the risk of material loss for such claims is considered remote.
Forward Foreign Currency Contracts— A forward foreign currency contract (��Forward Contract”) is a commitment to buy or sell a specific amount of a foreign currency at a negotiated price on a specified future date. Forward Contracts can help a fund manage the risk of changes in currency exchange rates. These contracts aremarked-to-market daily at the applicable forward currency translation rates. A fund records realized gains or losses at the time the Forward Contract is closed. A Forward Contract is extinguished through a closing transaction or upon delivery of the currency or entering an offsetting contract. The Fund’s maximum risk of loss from counterparty credit risk related to Forward Contracts is the fair value of the contract.
For the six months ended October 31, 2019, the average monthly volume of forward foreign currency contracts of the DuPont Capital Emerging Markets Debt Fund was as follows:
Forward Foreign Currency Contracts - Payable (Value At Trade Date) | Forward Foreign Currency Contracts - Receivable (Value At Trade Date) | |
| $(23,374) | $23,374 |
31
DUPONT CAPITAL FUNDS
Notes to Financial Statements (Continued)
October 31, 2019
(Unaudited)
Sovereign Debt Risk— The DuPont Capital Emerging Markets Debt Fund invests predominantly in sovereign debt securities issued or guaranteed by governments of emerging market countries, their agencies or instrumentalities, or other government-related entities. Investments in sovereign debt are subject to risks including, but are not limited to, the risk that a governmental entity may delay or refuse, or otherwise be unable, to pay interest or repay the principal on its sovereign debt. There may also be no legal process for collecting sovereign debt that a government does not pay or bankruptcy proceedings through which all or part of such sovereign debt may be collected.
Currency Risk— Each Fund invests in securities of foreign issuers, including American Depositary Receipts. These markets are subject to special risks associated with foreign investments not typically associated with investing in U.S. markets. Because the foreign securities in which each Fund may invest generally trade in currencies other than the U.S. dollar, changes in currency exchange rates will affect each Fund’s NAV, the value of dividends and interest earned and gains and losses realized on the sale of securities. Because the NAV for each Fund is determined on the basis of U.S. dollars, each Fund may lose money by investing in a foreign security if the local currency of a foreign market depreciates against the U.S. dollar, even if the local currency value of each Fund’s holdings goes up. Generally, a strong U.S. dollar relative to these other currencies will adversely affect the value of each Fund’s holdings in foreign securities.
Foreign Securities Market Risk— Securities of manynon-U.S. companies may be less liquid and their prices more volatile than securities of comparable U.S. companies. Securities of companies traded in many countries outside the U.S., particularly emerging markets countries, may be subject to further risks due to the inexperience of local investment professionals and financial institutions, the possibility of permanent or temporary termination of trading and greater spreads between bid and asked prices of securities. In addition,non-U.S. stock exchanges and investment professionals are subject to less governmental regulation, and commissions may be higher than in the United States. Also, there may be delays in the settlement ofnon-U.S. stock exchange transactions.
Emerging Markets Risk— Each Fund invests in emerging market instruments which are subject to certain credit and market risks. The securities and currency markets of emerging market countries are generally smaller, less developed, less liquid and more volatile than the securities and currency markets of the United States and other developed markets. Disclosure and regulatory standards in many respects are less stringent than in other developed markets. There also may be a lower level of monitoring and regulation of securities markets in emerging market countries and the activities of investors in such markets and enforcement of existing regulations may be extremely limited. Political and economic structures in many of these countries may be in their infancy and developing rapidly, and such countries may lack the social, political and economic stability characteristics of more developed countries.
32
DUPONT CAPITAL FUNDS
Notes to Financial Statements (Continued)
October 31, 2019
(Unaudited)
Debt Investment Risk— Debt investments are affected primarily by the financial condition of the companies or other entities that have issued them and by changes in interest rates. There is a risk that an issuer of a Fund’s debt investments may not be able to meet its financial obligations (e.g., may not be able to make principal and/or interest payments when they are due or otherwise default on other financial terms) and/or go bankrupt. Securities such as high-yield/high-risk bonds, e.g., bonds with low credit ratings by Moody’s (Ba or lower) or Standard & Poor’s (BB and lower) or if unrated are of comparable quality as determined by the manager, are especially subject to credit risk during periods of economic uncertainty or during economic downturns and are more likely to default on their interest and/or principal payments than higher rated securities. Debt investments may be affected by changes in interest rates. Debt investments with longer durations tend to be more sensitive to changes in interest rates, making them more volatile than debt investments with shorter durations or floating or adjustable interest rates. The value of debt investments may fall when interest rates rise.
Recent Regulatory Reporting Update and Accounting Pronouncement— In August 2018, the Financial Accounting Standards Board issued an Accounting Standards Update, ASU2018-13,Fair Value Measurement (Topic 820), Disclosure Framework – Changes to the Disclosure Requirements for Fair Value Measurement(the “2018 ASU”) which adds, modifies and removes disclosure requirements related to certain aspects of fair value measurement. The 2018 ASU is effective for fiscal years, and interim periods within those fiscal years, beginning after December 15, 2019. Early adoption is permitted. As of October 31, 2019, the Funds have fully adopted the provisions of the 2018 ASU, which did not have a material impact on the Funds’ financial statements and related disclosures or impact the Funds’ net assets or results of operations.
2. Transactions with Related Parties and Other Service Providers
DuPont Capital Management Corporation (“DuPont Capital” or the “Adviser”) serves as investment adviser to each Fund pursuant to an investment advisory agreement with the Trust. For its services, the Adviser is paid a monthly fee at the annual rate of 1.05% of the DuPont Capital Emerging Markets Fund’s average daily net assets; and 0.60% of the DuPont Capital Emerging Markets Debt Fund’s average daily net assets. The Adviser has contractually agreed to reduce its investment advisory fee and/or reimburse certain expenses of each Fund to the extent necessary to ensure that the Funds’ total operating expenses, excluding taxes, fees and expenses attributable to a distribution or service plan adopted by the Trust, “Acquired Fund Fees and Expenses,” interest, extraordinary items, and brokerage commissions, do not exceed 1.27% and 0.89%, respectively, (on an annual basis) of the DuPont Capital Emerging Markets Fund and the DuPont Capital Emerging Markets Debt Fund’s average daily net assets (the “Expense Limitation”), respectively. The Expense Limitations will each remain in place until August 31, 2020, unless the Board of Trustees approves their earlier termination. The Adviser is entitled to recover, subject to approval by the Board of Trustees, such amounts reduced or reimbursed for a period of up to three (3) years from the date on which the Adviser reduced its compensation and/or assumed expenses for each Fund. The Adviser is permitted to seek reimbursement from the Funds, subject to certain limitations, for
33
DUPONT CAPITAL FUNDS
Notes to Financial Statements (Continued)
October 31, 2019
(Unaudited)
fees it waived and Fund expenses it paid to the extent the total annual fund expenses do not exceed the limits described above or any lesser limits in effect at the time of reimbursement. No recoupment will occur unless each Fund’s expenses are below the respective Expense Limitation amounts.
For the six months ended October 31, 2019, the Adviser earned advisory fees of $124,417 and $22,196 for the DuPont Capital Emerging Markets Fund and the DuPont Capital Emerging Markets Debt Fund, respectively. For the six months ended October 31, 2019, the Adviser waived and reimbursed fees and expenses of $132,403 and $107,956 for the DuPont Capital Emerging Markets Fund and the DuPont Capital Emerging Markets Debt Fund, respectively.
As of October 31, 2019, the amount of potential recoupment by the Adviser was as follows:
| Expiration 04/30/2020 | Expiration 04/30/2021 | Expiration 04/30/2022 | Expiration 10/31/2022 | Total | ||||||||||||||||
DuPont Capital Emerging Markets Fund | $ | 114,831 | $ | 295,495 | $ | 261,409 | $ | 132,403 | $ | 804,138 | ||||||||||
DuPont Capital Emerging Markets Debt Fund | 88,749 | 166,742 | 207,576 | 107,956 | 571,023 | |||||||||||||||
Other Service Providers
The Bank of New York Mellon (“BNY Mellon”) serves as administrator and custodian for the Funds. For providing administrative and accounting services, BNY Mellon is entitled to receive a monthly fee equal to an annual percentage rate of the Funds’ average daily net assets and is subject to certain minimum monthly fees. For providing certain custodial services, BNY Mellon is entitled to receive a monthly fee, subject to certain minimum, and out of pocket expenses.
BNY Mellon Investment Servicing (US) Inc. (the “Transfer Agent”) provides transfer agent services to the Funds. The Transfer Agent is entitled to receive a monthly fee, subject to certain minimum, and out of pocket expenses.
The Trust, on behalf of the Funds, has entered into agreements with financial intermediaries to provide recordkeeping, processing, shareholder communications and other services to customers of the intermediaries investing in the Funds and have agreed to compensate the intermediaries for providing those services. The fees incurred by the Funds for these services are included in Transfer agent fees in the Statements of Operations.
Foreside Funds Distributors LLC (the “Underwriter”) provides principal underwriting services to the Funds pursuant to an underwriting agreement between the Trust and the Underwriter.
34
DUPONT CAPITAL FUNDS
Notes to Financial Statements (Continued)
October 31, 2019
(Unaudited)
Trustees and Officers
The Trust is governed by its Board of Trustees. The Trustees of the Trust receive compensation in the form of an annual retainer and per meeting fees for their services to the Trust. The remuneration paid to the Trustees by the Funds during the six months ended October 31, 2019 was $4,366 for the DuPont Capital Emerging Markets Fund and $1,365 for the DuPont Capital Emerging Markets Debt Fund. An employee of BNY Mellon serves as the Secretary of the Trust and is not compensated by the Funds or the Trust.
JW Fund Management LLC (“JWFM”) provides a Principal Executive Officer and Principal Financial Officer, respectively, to the Trust. Duff & Phelps, LLC (“D&P”) provides the Trust with a Chief Compliance Officer and an Anti-Money Laundering Officer. JWFM and D&P are compensated for their services provided to the Trust.
3. Investment in Securities
For the six months ended October 31, 2019, aggregate purchases and sales of investment securities (excluding U.S. Government and agency short-term investments and other short-term investments) of the Funds were as follows:
| Purchases | Sales | |||||||
DuPont Capital Emerging Markets Fund Investment Securities | $ | 7,744,615 | $ | 7,314,052 | ||||
DuPont Capital Emerging Markets Debt Fund Investment Securities | $ | — | $ | 35,885 | ||||
35
DUPONT CAPITAL FUNDS
Notes to Financial Statements (Continued)
October 31, 2019
(Unaudited)
4. Capital Share Transactions
For the six months ended October 31, 2019 and the year ended April 30, 2019, transactions in capital shares (authorized shares unlimited) were as follows:
| DuPont Capital Emerging Markets Fund | ||||||||||||||||||||
For the Six Months Ended October 31, 2019 | For the Year Ended April 30, 2019 | |||||||||||||||||||
| Shares | Amount | Shares | Amount | |||||||||||||||||
Class I | ||||||||||||||||||||
Sales | 272,986 | $ 2,224,856 | 108,199 | $ 942,412 | ||||||||||||||||
Reinvestments | — | — | 54,923 | 436,646 | ||||||||||||||||
Redemptions | (279,980 | ) | (2,200,677 | ) | (322,209 | ) | (2,969,232 | ) | ||||||||||||
Net decrease | (6,994 | ) | $ 24,179 | (159,087 | ) | $(1,590,174 | ) | |||||||||||||
| DuPont Capital Emerging Markets Debt Fund | ||||||||||||||||||||
For the Six Months Ended October 31, 2019 | For the Year Ended April 30, 2019 | |||||||||||||||||||
| Shares | Amount | Shares | Amount | |||||||||||||||||
Class I | ||||||||||||||||||||
Sales | 801 | $ 6,950 | 66,855 | $588,072 | ||||||||||||||||
Reinvestments | 25,845 | 230,797 | 45,552 | 388,320 | ||||||||||||||||
Redemptions | (4,700 | ) | (41,034 | ) | — | — | ||||||||||||||
Net increase | 21,946 | $196,713 | 112,407 | $976,392 | ||||||||||||||||
5. Federal Tax Information
The Funds have followed the authoritative guidance on accounting for and disclosure of uncertainty in tax positions, which requires the Funds to determine whether a tax position is more likely than not to be sustained upon examination, including resolution of any related appeals or litigation processes, based on the technical merits of the position. Each Fund has determined that there was no effect on the financial statements from following this authoritative guidance. In the normal course of business, the Funds are subject to examination by federal, state and local jurisdictions, where applicable, for tax years for which applicable statutes of limitations have not expired.
36
DUPONT CAPITAL FUNDS
Notes to Financial Statements (Continued)
October 31, 2019
(Unaudited)
For the year ended April 30, 2019, the tax character of distributions paid by the DuPont Capital Emerging Markets Fund and the DuPont Capital Emerging Markets Debt Fund were $436,646 and $388,320 of ordinary income dividends, respectively. Distributions from net investment income and short-term capital gains are treated as ordinary income for federal income tax purposes.
As of April 30, 2019, the components of distributable earnings on a tax basis were as follows:
| Capital Loss Carryforward | Undistributed Ordinary Income | Undistributed Long-Term Gain | Unrealized Appreciation/ (Depreciation) | Total Distributable Earnings | ||||||||||||
DuPont Capital Emerging Markets Fund | $ | (85,073,823 | ) | $ 34,659 | $ — | $ | 3,373,444 | $ | (81,665,720 | ) | ||||||
DuPont Capital Emerging Markets Debt Fund | $ | — | $159,023 | $900 | $ | (862,588 | ) | $ | (702,665 | ) | ||||||
The differences between the book and tax basis components of distributable earnings relate primarily to the timing and recognition of income and gains for federal income tax purposes.
At October 31, 2019, the federal tax cost, aggregate gross unrealized appreciation and depreciation of securities held by the Funds were as follows:
| Federal Tax Cost* | Unrealized Appreciation | Unrealized Depreciation | Net Unrealized Appreciation/ (Depreciation) | |||||||||||||
DuPont Capital Emerging Markets Fund | $ | 21,857,071 | $ | 4,161,675 | $ | (1,883,847 | ) | $ | 2,277,828 | |||||||
DuPont Capital Emerging Markets Debt Fund | 7,617,735 | 449,231 | (1,378,073 | ) | (928,842 | ) | ||||||||||
| * | Because tax adjustments are calculated annually at the end of the Funds’ fiscal year, the above table does not reflect tax adjustments for the current fiscal year. For the previous year’s federal income tax information, please refer to the Notes to Financial Statements section in the Funds’ most recent annual report. |
Pursuant to federal income tax rules applicable to regulated investment companies, the Funds may elect to treat certain net capital losses between November 1 and April 30 and late year ordinary losses ((i) ordinary losses between January 1 and April 30 and (ii) specified ordinary and currency losses between November 1 and April 30) as occurring on the first day of the following tax year. For the year ended April 30, 2019, any amount of losses elected within the tax return will not be recognized for federal income tax purposes until May 1, 2019. For the year ended April 30, 2019, the Funds had no capital loss or late year ordinary loss deferrals.
37
DUPONT CAPITAL FUNDS
Notes to Financial Statements (Concluded)
October 31, 2019
(Unaudited)
Accumulated capital losses represent net capital loss carryforwards as of April 30, 2019 that may be available to offset future realized capital gains and thereby reduce future capital gains distributions. As of April 30, 2019, the DuPont Capital Emerging Markets Fund had capital loss carryforwards of $85,073,823, of which $60,530,727 are long-term losses and $24,543,096 are short-term losses and have an unlimited period of capital loss carryforward. As of April 30, 2019, the DuPont Capital Emerging Markets Debt Fund had no capital loss carryforwards. On November 27, 2015, the DuPont Capital Emerging Markets Fund experienced a more than 50% change of ownership as defined by Internal Revenue Code Section 382(g) giving rise to an annual capital loss carryforward limitation on the use ofpre-ownership change capital losses. At the time of the change the DuPont Capital Emerging Markets Fund had $83,500,000 of capital loss carryforwards impacted by the ownership change and the use of those losses against capital gains will be limited to $1,618,329 per tax year. The permitted annual capital loss, if not applied to capital gains in the tax year, will accumulate and be available in the next year for use.
6. Subsequent Events
Management has evaluated the impact of all subsequent events on each Fund through the date the financial statements were issued and has determined that there are no material subsequent events requiring recognition or disclosure in the financial statements.
38
DUPONT CAPITAL FUNDS
Other Information
(Unaudited)
Proxy Voting
Policies and procedures that the Funds use to determine how to vote proxies relating to portfolio securities as well as information regarding how the Funds voted proxies relating to portfolio securities for the most recent12-month period ended June 30 are available without charge, upon request, by calling (888)447-0014 and on the Securities and Exchange Commission’s (“SEC”) website athttp://www.sec.gov.
Quarterly Portfolio Schedules
The Trust files its complete schedule of portfolio holdings with the SEC for the first and third fiscal quarters of each fiscal year (quarters ended July 31 and January 31) on FormN-Q. The Trust’s FormsN-Q are available on the SEC’s website athttp://www.sec.gov. FormN-Q is being rescinded. Once FormN-Q is rescinded, disclosure of the Funds’ complete holdings will be required to be made monthly on FormN-PORT, with every third month made available to the public by the Commission upon filing.
Board Consideration of Investment Advisory Agreement
At anin-person meeting held on June24-25, 2019 (the “Meeting”), the Board of Trustees (the “Board” or the “Trustees”) of FundVantage Trust (the “Trust”), including a majority of the Trustees who are not “interested persons” within the meaning of Section 2(a)(19) of the Investment Company Act of 1940, as amended (the “1940 Act”) (the “Independent Trustees”), unanimously approved the continuation of the Investment Advisory Agreement between DuPont Capital Management Corporation (“DuPont” or the “Adviser”) and the Trust (the “DuPont Agreement”) on behalf of the DuPont Capital Emerging Markets Fund (the “DuPont EM Fund”) and the DuPont Capital Emerging Markets Debt Fund (the “DuPont EM Debt Fund” and together with the DuPont EM Fund, the “Funds”). At the Meeting, the Board considered the continuation of the DuPont Agreement with respect to each Fund for an additional one year period.
In determining whether to approve the Agreement, the Trustees considered information provided by the Adviser in accordance with section 15(c) of the 1940 Act regarding (i) services performed for the DuPont Funds, (ii) the size and qualifications of their portfolio management staff, (iii) any potential or actual material conflicts of interest which may arise in connection with portfolio manager’s management of the DuPont Funds, (iv) investment performance, (v) the capitalization and financial condition of DuPont, (vi) brokerage selection procedures (including soft dollar arrangements, if any), (vii) the procedures for allocating investment opportunities between the DuPont Funds and other clients, (viii) results of any regulatory examination, including any recommendations or deficiencies noted, (ix) any litigation, investigation or administrative proceeding which may have a material impact on DuPont’s ability to service the DuPont Funds, and (x) compliance with the DuPont Funds’ investment objectives, policies and practices, federal securities laws and other regulatory requirements. The Trustees noted the reports provided at Board
39
DUPONT CAPITAL FUNDS
Other Information
(Unaudited)
meetings throughout the year covering matters including: the relative performance of the DuPont Funds; compliance with the investment objectives, policies, strategies and limitations for the DuPont Funds; the compliance of management personnel with the applicable code of ethics; and the adherence to fair value pricing procedures as established by the Board.
Investment Performance. The Trustees considered the investment performance for the Funds. The Trustees reviewed the historical performance charts for theyear-to-date, one year, two year, three year, five year and since inception periods ended March 31, 2019 for the Funds.
DuPont EM Fund.The Trustees considered the performance of the DuPont EM Fund relative to the Lipper Emerging Markets Funds Index, the DuPont EM Fund’s applicable Lipper peer index. The Trustees noted that the DuPont EM Fund underperformed the Lipper Emerging Markets Fund Index for theyear-to-date, one year, five year and since inception periods ended March 31, 2019 and outperformed the Lipper Emerging Markets Funds Index for the two year and three year periods ended March 31, 2019. The Trustees concluded that, although the DuPont EM Fund had underperformed the Lipper Emerging Markets Funds Index during certain periods, the performance of the DuPont EM Fund was within an acceptable range of performance relative to other mutual funds with similar investment objectives, strategies and policies based on the information provided at the Meeting.
DuPont EM Debt Fund.The Trustees also considered the investment performance for the DuPont EM Debt Fund relative to the Lipper Emerging Markets Hard Currency Debt Funds Index, the DuPont EM Debt Fund’s applicable Lipper peer index. The Trustees noted that the DuPont EM Debt Fund outperformed the Lipper Emerging Markets Hard Currency Debt Funds Index for theyear-to-date, two year, five year and since inception periods ended March 31, 2019 and underperformed the Lipper Emerging Markets Hard Currency Debt Funds Index for the one year and three year periods ended March 31, 2019. The Trustees concluded that the performance of the DuPont EM Debt Fund was within an acceptable range of performance relative to other mutual funds with similar investment objectives, strategies and policies based on the information provided at the Meeting.
Fees. The Trustees noted that the representatives of DuPont had provided information regarding its advisory fees and an analysis of these fees in relation to the delivery of services to the Funds and any other ancillary benefit resulting from DuPont’s relationship with the Funds. The Trustees considered the fees that DuPont charges to its separately managed accounts, and evaluated the explanations provided by DuPont as to differences in fees charged to the Funds and separately managed accounts. The Trustees also reviewed a peer comparison of advisory fees and total expenses for the Funds versus other similarly managed funds.
The Trustees noted that as of March 31, 2019 the DuPont EM Fund’s gross advisory fee was higher than, but substantially in line with, the median gross advisory fee of the funds in the DuPont EM Fund’s applicable Lipper category with $250 million or less in assets and that the DuPont EM Fund’s net total
40
DUPONT CAPITAL FUNDS
Other Information
(Unaudited)
expense ratio was higher than the median net total expense ratio of the funds in the DuPont EM Fund’s applicable Lipper category with $250 million or less in assets. The Trustees concluded that the advisory fees and services provided by DuPont are consistent with those of other advisers and sub-advisers which manage mutual funds with investment objectives, strategies and policies similar to those of the DuPont EM Fund based on the information provided at the Meeting.
The Trustees noted that as of March 31, 2019 the DuPont EM Debt Fund’s gross advisory fee was lower than the median gross advisory fee of the Lipper Emerging Markets Hard Currency Debt Funds category and that the Fund’s net total expense ratio was lower than, but substantially in line with, the median net total expense ratio of the Lipper Emerging Markets Hard Currency Debt Funds category. The Trustees concluded that the advisory fees and services provided by DuPont are consistent with those of other advisers and sub-advisers which manage mutual funds with investment objectives, strategies and policies similar to those of the DuPont EM Debt Fund based on the information provided at the Meeting.
Knowledge, experience, and qualifications. The Board then considered the level and depth of knowledge of DuPont, including the professional experience and qualifications of senior personnel. In evaluating the quality of services provided by DuPont, the Board took into account its familiarity with DuPont’s senior management through Board meetings, discussions and reports during the preceding year. The Board also took into account DuPont’s compliance policies and procedures and reports regarding DuPont’s compliance operations from the Trust’s Chief Compliance Officer. The Board also considered any potential conflicts of interest that may arise in a portfolio manager’s management of the DuPont Funds’ investments on the one hand, and the investments of other accounts, on the other.
The Trustees reviewed the services provided to the DuPont Funds by DuPont and concluded that the nature, extent and quality of the services provided were appropriate and consistent with the terms of the DuPont Agreement, that the quality of the proposed services appeared to be consistent with industry norms and that the DuPont Funds are likely to benefit from the continued receipt of those services. They also concluded that DuPont has sufficient personnel, with the appropriate education and experience, to serve the DuPont Funds effectively and had demonstrated their ability to attract and retain qualified personnel.
Costs. The Trustees then considered the costs of the services provided by DuPont, the compensation and benefits received by DuPont in providing services to the DuPont Funds, as well as DuPont’s profitability. The Trustees were provided with the most recent Item 6 ofForm10-K of DuPont’s parent company for its most recent fiscal year ended December 31, 2018. The Trustees noted that DuPont’s level of profitability is an important factor to consider, and the Trustees should be satisfied that DuPont’s profits are sufficient to continue as a healthy concern generally and as investment adviser of the DuPont Funds specifically.
41
DUPONT CAPITAL FUNDS
Other Information
(Unaudited) (Concluded)
The Trustees concluded that DuPont’s advisory fee level was reasonable in relation to the nature and quality of the services provided, taking into account the current size and projected growth of the DuPont Funds.
Economies of Scale. The Trustees considered the extent to which economies of scale would be realized relative to fee levels as the DuPont Funds grow, and whether the advisory fee levels reflect these economies of scale for the benefit of shareholders. The Board noted that economies of scale may be achieved at higher asset levels for the Funds for the benefit of fund shareholders, and that although the advisory fee did not currently include breakpoint reductions relative to asset levels, that the advisory fees were subject to contractual expense limitation agreements.
At the Meeting, the Trustees determined to approve the DuPont Agreement for an additional one year period. In voting to approve the continuation of the DuPont Agreement, the Board considered all factors it deemed relevant and the information presented to the Board by DuPont. In arriving at its decision, the Board did not identify any single factor as being of paramount importance and each member of the Board gave varying weights to each factor according to his or her own judgment. The Board determined that the continuation of the DuPont Agreement would be in the best interests of the Funds and their shareholders.
42
[THIS PAGE INTENTIONALLY LEFT BLANK.]
Investment Adviser
DuPont Capital Management Corporation
One Righter Parkway
Suite 3200
Wilmington, DE 19803
Administrator
The Bank of New York Mellon
301 Bellevue Parkway
Wilmington, DE 19809
Transfer Agent
BNY Mellon Investment Servicing (US) Inc.
4400 Computer Drive
Westborough, MA 01581
Principal Underwriter
Foreside Funds Distributors LLC
400 Berwyn Park
899 Cassatt Road
Berwyn, PA 19312
Custodian
The Bank of New York Mellon
240 Greenwich Street
New York, NY 10286
Independent Registered Public Accounting Firm
PricewaterhouseCoopers LLP
Two Commerce Square, Suite 1800
2001 Market Street
Philadelphia, PA 19103-7042
Legal Counsel
Pepper Hamilton LLP
3000 Two Logan Square
18th and Arch Streets
Philadelphia, PA 19103
DUP-1019
DUPONT CAPITAL
EMERGING MARKETS FUND
DUPONT CAPITAL
EMERGING MARKETS DEBT
FUND
of
FundVantage Trust
Class I
SEMI-ANNUAL REPORT
October 31, 2019
(Unaudited)
IMPORTANT NOTE: Beginning on January 1, 2021, paper copies of the DuPont Funds’ annual and semi-annual shareholder reports will no longer be sent by mail, unless you specifically request paper copies of the shareholder reports from the DuPont Funds or from your financial intermediary. Instead, annual and semi-annual shareholder reports will be available on the DuPont Funds’ website (www.mutualfunds.dupontcapital.com), and you will be notified by mail each time a report is posted and provided with a website link to access the report.
You may elect to receive all future annual and semi-annual shareholder reports in paper, free of charge. To elect to receive paper copies of shareholder reports through the mail or otherwise change your delivery method, contact your financial intermediary or, if you hold your shares directly through the DuPont Funds, call the DuPont Funds toll-free at (888)447-0014 or write to the DuPont Funds at:
DuPont Funds
FundVantage Trust
c/o BNY Mellon Investment Servicing
P.O. Box 9829
Providence, RI 02940-8029
Your election to receive shareholder reports in paper will apply to all DuPont Funds that you hold through the financial intermediary, or directly with DuPont Funds.
This report is submitted for the general information of the shareholders of the DuPont Capital Emerging Markets Fund and the DuPont Capital Emerging Markets Debt Fund. It is not authorized for distribution unless preceded or accompanied by a current prospectus for the DuPont Capital Emerging Markets Fund and the DuPont Capital Emerging Markets Debt Fund.

EIC VALUE FUND
Semi-Annual Investment Adviser’s Report
October 31, 2019
(Unaudited)
Dear Fellow Shareholder,
Thank you for reviewing our semi-annual report. In it, we discuss our perspective on the market, the EIC Value Fund’s (the “Fund”) performance, and some of the recent purchase and sale activity in the Fund. A listing of the Fund’s investments and other financial information follow our comments.
Perspective on the Market
Rebounding from a weak 2018, the S&P 500 has been off to its bestten-month start to the year since 2013, despite 2019 earnings estimates that continue to come down. Full-yearearnings-per-share growth is now anticipated to be roughly 1%, a deceleration from the estimated 2% full-year growth expected at the end of last quarter, almost 7% growth expected at the start of the year, and nearly 10% growth expected one year ago.1 Back out share buybacks, which in recent years have ranged between 2% and 3% per year of total shares outstanding2, and earnings dollars will likely decline for the full year. Only three sectors (communication services, financials, and health care) are anticipated to register high single-digit earnings growth for the year, while four sectors (energy, information technology, materials, and utilities) are expecting earnings declines.3 To say the least, the economic picture is a mixed bag, with the industrial sector seemingly in recession and the yield curve inverted, while employment and consumer spending have remained strong.
Valuations have been high, with the S&P 500 trading at roughly 22x trailing GAAP earnings4 and 18x anticipated 2019 pro forma5. Though we have seen some weakness in guidance this year, margins have remained elevated by historical standards. This suggests that valuations may be even richer than the headline numbers if margins were to revert to historical averages. Digging deeper, the valuation dynamics are more nuanced with increasing separation among themes or factors. As seen in the chart on the following page, currentlyout-of-favor factors such as value,small-cap, high beta, and low momentum appear to be unusually inexpensive relative to theirin-favor counterparts, a setup which presents forward-looking investors with opportunity.
The chart shows where several factors are currently trading (blue dot) compared to their counterparts (e.g., value versus growth) and where they typically have traded over the past twenty years (shaded area). The first five factors highlighted in the chart are trading quite cheaply relative to their history, in some cases extraordinarily so. Of particular note is the high volatility factor (as measured by historical beta), which is trading among its lowest valuations ever
| 1 | Data Source: S&P Capital IQ. Quarterly year-over-year forecast of calendar year 2019 earnings per share growth for S&P 500 based on consensus earnings estimates. Data as of October 7, 2019. |
| 2 | Data Source: S&P Dow Jones Indices. Quarterly buyback yield 2015-2018. 7 Oct. 2019. https://us.spindices.com/indices/equity/sp-500/sp-500-buyback.xlsx. |
| 3 | Data Source: S&P Capital IQ. Year-over-year forecast of calendar year 2019 earnings per share growth for S&P 500 Global Industry Classification Standard (GICS®) sectors based on consensus earnings estimates. Data as of October 7, 2019. |
| 4 | Data Source: S&P Dow Jones Indices. Actual as reported Generally Accepted Accounting Principal (GAAP) earnings for trailing four quarters as of June 30, 2019. 8 Oct. 2019.https://us.spindices.com/indices/equity/sp-500/sp-500- eps.est.xlsx. |
| 5 | Data Source: S&P Capital IQ. Year-over-year forecast of calendar year 2019 earnings per share for S&P 500 based on consensus earnings estimate. Data as of October 7, 2019. |
1
EIC VALUE FUND
Semi-Annual Investment Adviser’s Report (Continued)
October 31, 2019
(Unaudited)
compared to its low volatility counterpart. (For further context, in the far right column of the chart, we have added dividend payers, a subset of the low volatility theme, to show their relative historical richness.) The relative attractiveness of higher volatility areas is a theme we have explored in past letters and is an area where we are finding opportunity. We believe that historical beta only tells us so much about risk, and if investors overpay forlow-beta exposure, they may find themselves with the opposite result of what they intended.
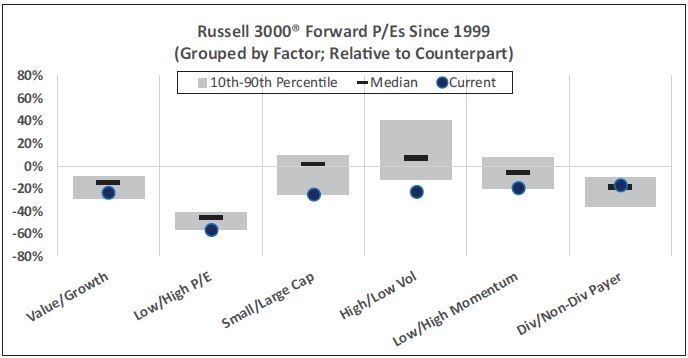
Data Source: S&P Capital IQ; Russell 3000 constituents. Median average forward Price/Earnings (P/E) ratios over each quarter from January 1999–October 2019 grouped by six factors. See note 6 for factor definitions.Indices are unmanaged and cannot be invested in directly. Past performance does not guarantee future results.
| 6 | Value/Growth: Russell 3000®Value Index vs. Russell 3000®Growth Index; Low/High P/E: 50% of Russell 3000®stocks with lowest P/E vs. 50% with highest P/E; Small/Large Cap: 80% of Russell 3000®stocks with smallest market capitalization vs. 20% with largest market capitalization; High/Low Vol: 50% of the Russell 3000®stocks with highest5-year monthly beta vs. 50% with lowest5-year monthly beta; Low/High Momentum: 50% of the Russell 3000®stocks with worst trailing quarterly returns vs. 50% with best trailing quarterly returns;Div/Non-Div Payer: Russell 3000®stocks that pay a dividend vs. those that do not. |
2
EIC VALUE FUND
Semi-Annual Investment Adviser’s Report (Continued)
October 31, 2019
(Unaudited)
Regarding small-caps, they have been trading as cheaply as they have relative to large-caps since the bursting of thedot-com bubble in 2001-2002. Though our portfolios continue to be biased towardlarge-cap stocks, we now find ourselves spending more time researchingsmall-cap andmid-cap opportunities. However,small-cap stocks are not as cheap as they nominally look. Manysmall-cap companies have suffered significant capital-structure degradation, and leverage trends in aggregate are worse, so we’re treading carefully.
It’s no secret that growth has trounced value over most of the last decade, leading some to believe that growth is a permanently better investing factor. A closer look at the attribution, however, is telling.
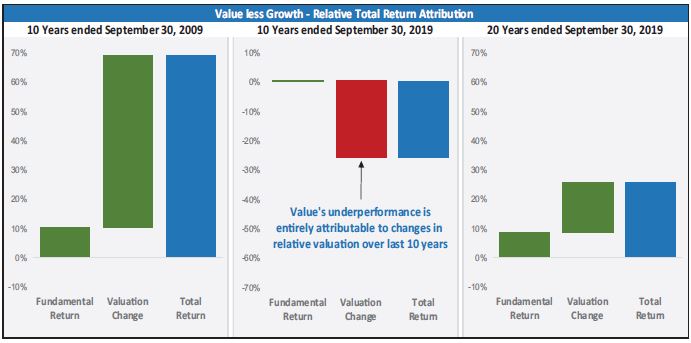
Data Source: S&P Capital IQ Cumulative Russell 3000 Value Index returns relative to cumulative Russell 3000 Growth Index returns. See note 7 for definitions.Indices are unmanaged and cannot be invested in directly. Past performance does not guarantee future results.
| 7 | Total Return: Relative total return of the Russell 3000®Value Index vs. the Russell 3000®Growth Index for each period; Valuation Change: Relative valuation of the Russell 3000®Value Index P/E vs. the Russell 3000®Growth Index P/E at the end of each period divided by their relative valuation at the beginning of each period; Fundamental Return: Relative Total Return of Russell 3000®Value Index vs. Russell 3000®Growth Index minus relative Valuation Change. |
3
EIC VALUE FUND
Semi-Annual Investment Adviser’s Report (Continued)
October 31, 2019
(Unaudited)
The diagram on the previous page shows relative performance of value versus growth over the last 20 years, broken up into two10-year periods (September 1999 to September 2009 and September 2009 to September 2019), along with the full20-year period.
A few highlights:
| · | Over the first10-year period, value outperformed growth. Most of this outperformance was attributable to valuation change (i.e., multiple expansion), though the fundamental return (earnings growth + dividends) also contributed. |
| · | Over the last 10 years (middle chart), all of the relative outperformance of growth versus value has come from valuation change. |
| · | Over the full 20 years, the fundamental return of value stocks has actually outperformed growth stocks. |
| · | Value stocks maintain a20-year performance edge versus growth of roughly 1% per year, despite the financial crisis and several energy crashes which disproportionately affected value. |
Value stocks recently traded at their cheapest levels relative to growth in 25 years, with the exception of the 1999-2000 tech-stock bubble, which distorts the historical data.8 As we have often said,starting valuation matters a great deal in determining forward investment returns.
We have talked at length in the past about how unusual the past 10 years have been, with low interest rates pushing investors out on the risk spectrum and causing all manner of distortions, from bonds with negative yields to pockets of growth-stock valuations reminiscent of the late ’90s. As we enter the final stretch of this decade, we wanted to share the chart on the next page with you. It shows, using data from Robert Shiller going back to the 1880s9, the percentage of positive monthly returns of the S&P 500 (and predecessors) on a rolling10-year basis (left axis, blue line), along with the subsequent10-year returns from that point forward (right axis, gray area).
Two points stand out:
| · | The last 10 years have been among the highest in history in terms of instances of positive monthly index returns. In fact, almost 70% of the S&P 500’s monthly returns have been positive. |
| · | There appears to be a strongnegativecorrelation between frequency of trailing monthly positive returns and actual subsequent returns. When the overall market persistently increases, that tends to reinforce risk taking, pushing conditions to excess, which then are worked off in the form of lower forward returns. And then the cycle repeats. |
| 8 | Data Source: Yardeni, Edward & Abbott, Joe. Investment Style Guide (7 October 2019), Figure 31. 3 October 2019. https://www.yardeni.com/pub/style.pdf. |
| 9 | Data Source: Shiller, Robert J. Irrational Exuberance. Princeton University Press: 2000, 2nd ed.: 2005, 3rd ed.: 2015, updated. 3 October 2019. http://www.econ.yale.edu/~shiller/data/ie_data.xls. |
4
EIC VALUE FUND
Semi-Annual Investment Adviser’s Report (Continued)
October 31, 2019
(Unaudited)
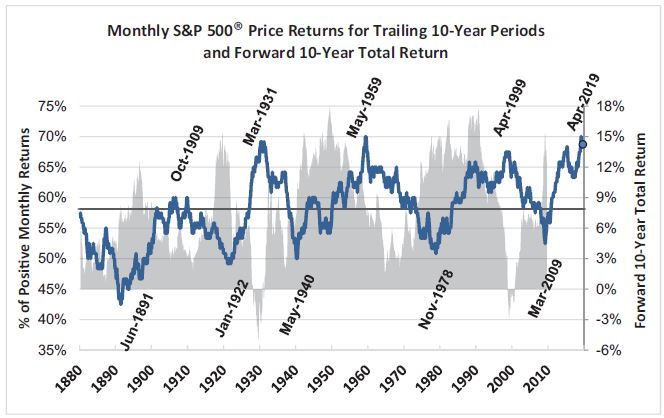
Data Source: Online Data Robert Shiller. Month over month price returns for the S&P 500 index for rolling10-year periods from February 1871–September 2019. Compound annual growth rate (CAGR) of S&P 500 price return plus annualized dividends from April 1880–September 2019 for rolling forward10-year periods.Indices are unmanaged and cannot be invested in directly. Past performance does not guarantee future results.
In the first quarter of 1999, near the tail end of anothergrowth-led bull market, we wrote the following to reinforce the perils of outcome-chasing versus process-driven investment management:
5
EIC VALUE FUND
Semi-Annual Investment Adviser’s Report (Continued)
October 31, 2019
(Unaudited)
In his book “Into Thin Air”, Jon Krakauer relates the tale of two guides leading relativelylow-skilled climbers up Mount Everest....Each guide faced a dilemma: patrons paying high fees expected to “get to the top”, but the capriciousness of high-altitude conditions sometimes means turning back for safety before reaching the summit....Unfortunately, the competing guides led novices to ever higher heights, and ultimately did reach the summit. But they did so by ignoring their own preset decision rules on latest safe turnaround times, as well as other grave risks. Too late to get down safely, they perished, along with a number of their clients, as an unnoticed storm came from below to engulf the expedition.10
In this case, the stakes are not nearly as high as those faced on Everest, but a significant drawdown or an extended period of muted returns would represent a major setback for most investors. How the market and its constituents perform tomorrow, next quarter or even next year is anyone’s guess. But we are optimistic about our current opportunity set. The market has offered up relatively extreme valuation disparities. Our focus on attractively priced,out-of-favor stocks may bode well for future returns, especially compared to the overall market and to currentlyin-favor themes and factors.
Fund Performance
The EIC Value Fund’s (Fund) Institutional Class shares (EICIX) gained 1.43% for the six months ended October 31, 2019. The Russell 3000® Value Index rose 2.82%, while the more growth-oriented S&P 500® Index increased 4.16%.
Performance attribution for thesix-month period follows. Fund results are compared to the Russell 3000® Value Index.
The Fund’s shortfall relative to its benchmark was primarily attributable to stock selection.
More specifically, our stock selection in the information technology sector hurt Fund performance. The Fund’s two holdings in this sector, Alliance Data Systems and Qualcomm, declined 36.9% and 22.4%, respectively. In contrast, the index’s technology stocks rose 1.9%.
Other poorly performing Fund holdings included Cimarex Energy Co., down 28.5%, Schlumberger Limited, down 21.1%, Franklin Resources, down 19.0%, Molson Coors Brewing Company, down 16.3%, and Exxon Mobil, down 13.8%.
10 Krakauer, Jon,Into Thin Air: A Personal Account of the Mount Everest Disaster. Barnes & Noble: 1997.
There can be no guarantee that any strategy will be successful. All investing involves risk, including potential loss of principal.
The performance data quoted represents past performance and does not guarantee future results. The investment return and principal value of an investment in the Fund will fluctuate so that an investor’s shares, when redeemed, may be worth more or less than their original cost. Current performance may be lower or higher. Performance data current to the most recentmonth-end may be obtained by calling (855)430-6487.
Securities in the Fund do not match those in the indices and performance of the Fund will differ. Indices are unmanaged, do not incur management fees, cost and expenses, and cannot be invested in directly.
6
EIC VALUE FUND
Semi-Annual Investment Adviser’s Report (Continued)
October 31, 2019
(Unaudited)
On the other hand, our security selection in the health care sector helped Fund performance. Fund holdings advanced a collective 11.7%, surpassing the index’s health care stocks, which rose 4.9%. Medtronic, up 23.9%, AmerisourceBergen Corp., up 15.3%, GlaxoSmithKline, up 14.0%, and McKesson Corp., up 12.2%, were the Fund’s standout performers in this sector.
Other Fund holdings of note included Target, up 40.4%, Globe Life, up 14.0%, and Booking Holdings and United Parcel Services, both up 10.4%.
In addition to stock selection, the Fund’s cash position (including short-term investments), which averaged 12.1% over thesix-month period, also adversely affected performance. We do not allocate to cash tactically. Rather, the Fund’s cash position is a residual of the stock-selection process and, as such, is primarily a function of the availability of undervalued stocks. We prefer to keep cash levels low, in the single digits if possible, but they can build up when attractive investment opportunities are hard to find.
Similarly, we don’t target sector weightings, either in an absolute sense or relative to market indices; they too are principally a residual of stock selection. Nevertheless, it is at times instructive to see how sector allocations affected returns. On balance, they helped Fund performance over the trailing six months.
Nine of the eleven sectors in the Russell 3000® Value Index posted positive returns for the six months ended October 31, 2019. Interest-sensitive sectors were the top performers – real estate rose 11.1% and utilities increased 9.5%. Communication services and consumer staples also performed well, gaining 6.8% and 6.2%, respectively. Relative to the index, the Fund had no exposure to real estate and was underweight in utilities and communication services. Conversely, the Fund was overweight in consumer staples.
In contrast, energy and materials were the two worst performing sectors, declining 12.6% and 2.1%, respectively. Consumer discretionary, which rose 1.6%, and information technology, which climbed 1.9%, were also relatively weak. The Fund maintained a market-like allocation to energy and was overweight in consumer discretionary. Helpfully, the Fund had less exposure to materials and especially information technology.
Portfolio Activity
Here’s a recap of some of the Fund’s recent purchase and sale activity.
The most significant changes to the Fund during thesix-month period were in the energy sector, where we sold Diamond Offshore Drilling, trimmed Exxon Mobil, and bought new positions in Total S.A. and Cimarex Energy. Net of these trades, the Fund maintained similar levels of energy-sector exposure, roughlyin-line with the value index. We sold Diamond on continued fundamental weakness in deep-water offshore drilling. While there are early signs of a rebound, the pace and magnitude of improvement were not sufficient for us in light of upcoming debt maturities. We trimmed Exxon Mobil on relative valuation within the sector – we think other opportunities like Total and Cimarex look more attractively priced.
French-based Total (TOT) is among the world’s largest integrated oil companies, with operations in more than 130 countries. Its exploration and production business is primarily focused in Europe, Africa, and the Middle East – with little exposure to the Americas and no exposure to unconventional US shale production. The company’s refinery and petrochemical operations are the second largest in Europe, and its downstream/marketing business is the second
7
EIC VALUE FUND
Semi-Annual Investment Adviser’s Report (Continued)
October 31, 2019
(Unaudited)
largest global distributor outside of North America. Total is a disciplined, conservative capital allocator – a trait it shares with Exxon – with ample dividend coverage and the balance sheet strength to make opportunistic acquisitions such as its recent agreement to acquire Anadarko’s African assets (made available due to Occidental buying Anadarko). Total trades at a compelling valuation relative to other supermajors, and a larger than normal discount to Exxon, precipitating our trade.
Cimarex (XEC), in contrast with Total’s global footprint, operates entirely within two of the largest shale plays in the United States, the Permian basin (Texas/New Mexico) and the Anadarko basin in Oklahoma. The company has among the lowest production and drilling costs of independent exploration and production companies, and a track record of cost-effective production growth. Cimarex recently acquired Resolute Energy, whose assets overlap the company’s Permian acreage, creating opportunities for cost savings and productivity improvement. Cimarex has historically demonstrated strong financial discipline relative to peers and maintains an investment grade balance sheet and a conservative cash flow posture. Like Total, Cimarex trades at an unusually low valuation relative to its history.
In addition to the energy sector trades, we sold the Fund’s position in Qualcomm. Qualcomm had a newsworthy spring, rising substantially on the settlement of its legal dispute with Apple, then giving back some of that gain when it lost a Federal Trade Commission lawsuit over its pricing practices. The FTC loss brings new earnings uncertainty, thus our sale of the position.
In June, we trimmed PNC Financial Services on price strength, using some of the proceeds to add to Wells Fargo on price weakness. Also during the summer, we trimmed the Fund’s positions in Target, eBay, and Medtronic, which had performed well.
In September, we purchased new positions in Sanofi S.A. and AGNC Investment Corp.
Sanofi (SNY) is the sixth largest pharmaceutical company in the world. Compared to peers, Sanofi’s portfolio tilts away from many of the headline industry risks prevalent today – it has negligible exposure to opioids, it is underweight the U.S. (drug-price regulation risk), and its largest drug accounts for a modest 9% of revenue. In addition, stiff headwinds from generic competition in legacy drugs are now abating, allowing the company to produce its best organic revenue growth rate in more than a decade. In short, risk is lower, growth is improving, and the valuation is reasonable – a recipe shared with many of our past successful investments.
AGNC Investment Corp. (AGNC) is the second largest mortgage REIT in the world. The company is fundamentally a “borrow short, lend long” investment vehicle – it borrows short term in the repo market to invest long term in agency residential mortgage-backed securities. Given the flattening yield curve, AGNC has endured compressing net interest margins for nearly a decade. With the yield curve now inverted, most of that compression should be behind it. We believe AGNC’s high dividend yield and below-book-value price support its valuation and offer opportunity for good prospective returns. Furthermore, compared to peers, we like the company’s focus (almost exclusively investing in government-guaranteed, agency-backed securities) and corporate governance (internally- rather than externally-managed).
As we approach year end, we continue to be concerned about corporate leverage and the ability of companies to maintain historically high margins, given the expectations of slower growth ahead. Moreover, we think market volatility
8
ı
EIC VALUE FUND
Semi-Annual Investment Adviser’s Report (Concluded)
October 31, 2019
(Unaudited)
will likely persist next year, as investors digest the many forces impacting the economy, interest rates, and corporate profits (not to mention the impeachment wildcard and the 2020 presidential election). In such an environment, our investment objective remains the same: constructing a portfolio of stocks that offers reasonable odds of investment success across a range of potential market outcomes.
This letter is intended to assist shareholders in understanding how the Fund performed during the fiscal year ended October 31, 2019 and reflects the views of the investment adviser at the time of this writing. Of course, these views may change and do not guarantee the future performance of the Fund or the markets.
The above commentary is for informational purposes only and does not represent an offer, recommendation or solicitation to buy, hold or sell any security. The specific securities identified and described do not represent all of the securities purchased or sold and you should not assume that investments in the securities identified and discussed will be profitable.
Portfolio composition is subject to change. The current and future portfolio holdings of the Fund are subject to investment risk.
London Stock Exchange Group PLC (“LSE Group”) is the source and owner of FTSE Russell index data. FTSE Russell is a trading name of certain of the LSE Group companies. “Russell®” is a trade mark of the relevant LSE Group companies and is used by any other LSE Group company under license. All rights in the FTSE Russell indexes or data vest in the relevant LSE Group company which owns the index or the data. Neither LSE Group nor its licensors accept any liability for any errors or omissions in the indexes or data and no party may rely on any indexes or data contained in this communication. No further distribution of data from the LSE Group is permitted without the relevant LSE Group company’s express written consent. The LSE Group does not promote, sponsor or endorse the content of this communication.
Sectors are determined using the Global Industry Classification Standard (“GICS”). GICS® was developed by, and is the exclusive property of, Standard & Poor’s Financial Services LLC (“S&P”) and MSCI Inc. (“MSCI”). GICS is the trademark of S&P and MSCI. “Global Industry Classification Standard (GICS)” and “GICS Direct” are service marks of S&P and MSCI.
9
EIC VALUE FUND
Semi-Annual Report
Performance Data
October 31, 2019
(Unaudited)
| Average Annual Total Returns for the Periods Ended October 31, 2019 | ||||||||||||||||||||
| Six Months† | 1 Year | 3 Years | 5 Years | Since Inception* | ||||||||||||||||
Class A (with sales charge) | -4.26% | 1.45 | % | 6.40% | 4.52% | 7.28% | ||||||||||||||
Class A (without sales charge) | 1.36% | 7.34 | % | 8.42% | 5.70% | 8.00% | ||||||||||||||
Russell 3000®Value Index | 2.82% | 10.65 | % | 10.40% | 7.52% | 10.27% | ** | |||||||||||||
S&P 500®Index | 4.16% | 14.33 | % | 14.91% | 10.78% | 12.46% | ** | |||||||||||||
Class C (with CDSC charge) | -0.05% | 5.55 | % | 7.62% | 4.91% | 7.53% | ||||||||||||||
Class C (without CDSC charge) | 0.95% | 6.52 | % | 7.62% | 4.91% | 7.53% | ||||||||||||||
Russell 3000®Value Index | 2.82% | 10.65 | % | 10.40% | 7.52% | 11.01% | ** | |||||||||||||
S&P 500®Index | 4.16% | 14.33 | % | 14.91% | 10.78% | 13.07% | ** | |||||||||||||
Institutional Class | 1.43% | 7.58 | % | 8.69% | 5.96% | 8.22% | ||||||||||||||
Russell 3000®Value Index | 2.82% | 10.65 | % | 10.40% | 7.52% | 10.01% | ** | |||||||||||||
S&P 500®Index | 4.16% | 14.33 | % | 14.91% | 10.78% | 12.20% | ** | |||||||||||||
| † | Not Annualized. |
| * | Class A, Class C and Institutional Class shares of the EIC Value Fund (the “Fund”) commenced operations on May 19, 2011, July 18, 2011 and May 1, 2011, respectively. |
| ** | Benchmark performance is from commencement date of the class only and is not the commencement date of the benchmark itself. |
The performance data quoted represents past performance and does not guarantee future results. The investment return and principal value of an investment in the Fund will fluctuate so that an investor’s shares, when redeemed, may be worth more or less than their original cost. The table does not reflect the deduction of taxes that a shareholder would pay on Fund distributions or redemption of Fund shares. Current performance may be lower or higher. Performance data current to the most recentmonth-end may be obtained by calling (855)430-6487.
The returns shown for Class A shares reflect a deduction for the maximumfront-end sales charge of 5.50%. The returns shown for Class C shares reflect a maximum deferred sales charge of 1.00%. All of the Fund’s share classes apply a 2.00% fee to the value of shares redeemed within 30 days of purchase. This redemption fee is not reflected in the returns shown above. As stated in the current prospectus dated September 1, 2019, the Fund’s “Total Annual Fund Operating Expenses” are 1.30%, 2.05% and 1.05%, and the Fund’s “Total Annual Fund Operating Expenses After Fee Waiver and/or Expense Reimbursement” are 1.21%, 1.96% and 0.96% for Class A shares, Class C shares and Institutional Class Shares, respectively, of the Fund Class’ average daily net assets. The ratios may differ from the actual expenses incurred by the Fund for the period covered by this report. Equity Investment Corporation (the “Adviser”) has contractually agreed to waive or otherwise reduce its annual compensation received from the Fund to the extent necessary to ensure that the Fund’s “Total Annual Fund Operating Expenses”, excluding taxes, fees and expenses attributable to a distribution or service plan adopted by the FundVantage Trust (the “Trust”), “Acquired Fund Fees and Expenses,” interest, extraordinary items and brokerage commissions, do not exceed 0.90% of average daily net assets of the Fund (the “Expense Limitation”). The Expense Limitation will remain in place until August 31, 2020, unless the Board of Trustees (“Board of Trustees”) of the Trust approves its earlier termination. Subject to approval by the Board of Trustees, the Adviser may recoup any expenses or fees it has reimbursed within a three-year period from the date on which the Adviser reduced its compensation and/or assumed expenses of the
10
EIC VALUE FUND
Semi-Annual Report
Performance Data (Concluded)
October 31, 2019
(Unaudited)
Fund. The Adviser is permitted to seek reimbursement from the Fund, subject to certain limitations, for fees it waived and Fund expenses it paid to the extent the total annual fund operating expenses do not exceed the limits described above or any lesser limits in effect at the time of reimbursement. No recoupment will occur unless the Fund’s expenses are below the Expense Limitation amount. Total returns would be lower had such fees and expenses not been waived and/or reimbursed.
Mutual fund investing involves risk, including possible loss of principal. Value investing involves the risk that the Fund’s investing in companies believed to be undervalued will not appreciate as anticipated. The Fund may invest in the stocks of smaller- andmedium-sized companies which may be more vulnerable to adverse business or economic events than larger, more established companies.
The Fund intends to evaluate performance as compared to that of the S&P 500® Index and the Russell 3000® Value Index. The S&P 500® Index is a widely recognized, unmanaged index of 500 common stocks which are generally representative of the U.S. stock market as a whole. The Russell 3000® Value Index is an unmanaged index that measures the performance of the 3,000 largest U.S. stocks, representing about 98% of the total capitalization of the entire U.S. stock market. It is impossible to invest directly in an index.
11
EIC VALUE FUND
Fund Expense Disclosure
October 31, 2019
(Unaudited)
As a shareholder of the Fund, you incur two types of costs: (1) transaction costs including sales charges (loads) on purchase payments (if any) or redemption fees; and (2) ongoing costs, including management fees, distribution and/or service (Rule12b-1) fees (if any) and other Fund expenses. These examples are intended to help you understand your ongoing costs (in dollars) of investing in the Fund and to compare these costs with the ongoing costs of investing in other mutual funds.
These examples are based on an investment of $1,000 invested at the beginning of thesix-month period from May 1, 2019 through October 31, 2019 and held for the entire period.
Actual Expenses
The first line of each accompanying table provides information about actual account values and actual expenses. You may use the information in this line, together with the amount you invested, to estimate the expenses that you paid over the period. Simply divide your account value by $1,000 (for example, an $8,600 account value divided by $1,000 = 8.6), then multiply the result by the number in the first line under the heading entitled “Expenses Paid During Period” to estimate the expenses you paid on your account during this period.
Hypothetical Examples for Comparison Purposes
The second line of each accompanying table provides information about hypothetical account values and hypothetical expenses based on the Fund’s actual expense ratio and an assumed rate of return of 5% per year before expenses, which is not your Fund’s actual return. The hypothetical account values and expenses may not be used to estimate the actual ending account balance or expenses you paid for the period. You may use this information to compare the ongoing costs of investing in the Fund and other funds. To do so, compare these 5% hypothetical examples with the 5% hypothetical examples that appear in the shareholder reports of other funds.
Please note that the expenses shown in the accompanying tables are meant to highlight your ongoing costs only and do not reflect any transactional costs, such as sales charges (loads) on purchase payments (if any) or redemption fees. Therefore, the second line of each accompanying table is useful in comparing ongoing costs only, and will not help you determine the relative total costs of owning different funds. In addition, if these transactional costs were included, your costs would have been higher.
12
EIC VALUE FUND
Fund Expense Disclosure (Concluded)
October 31, 2019
(Unaudited)
| EIC Value Fund | |||||||||||||||
Beginning Account Value | Ending Account Value | Expenses Paid | |||||||||||||
Class A | |||||||||||||||
Actual | $1,000.00 | $1,013.60 | $5.82 | ||||||||||||
Hypothetical (5% return before expenses) | 1,000.00 | 1,019.36 | 5.84 | ||||||||||||
Class C | |||||||||||||||
Actual | $1,000.00 | $1,009.50 | $9.60 | ||||||||||||
Hypothetical (5% return before expenses) | 1,000.00 | 1,015.58 | 9.63 | ||||||||||||
Institutional Class | |||||||||||||||
Actual | $1,000.00 | $1,014.30 | $4.56 | ||||||||||||
Hypothetical (5% return before expenses) | 1,000.00 | 1,020.61 | 4.57 | ||||||||||||
| * | Expenses are equal to the Fund’s annualized expense ratio for thesix-month period ended October 31, 2019 of 1.15%, 1.90%, and 0.90% for Class A, Class C, and Institutional Class shares, respectively, multiplied by the average account value over the period, multiplied by the number of days in the most recent period (184), then divided by 366 to reflect the period. The Fund’s ending account values on the first line in each table are based on the actualsix-month total returns for the Fund of 1.36%, 0.95%, and 1.43% for Class A, Class C, and Institutional Class shares, respectively. |
13
EIC VALUE FUND
Portfolio Holdings Summary Table
October 31, 2019
(Unaudited)
The following table presents a summary by sector of the portfolio holdings of the Fund:
% of Net | Value | |||||||||
COMMON STOCKS: | ||||||||||
Financial | 24.4 | % | $ | 49,348,191 | ||||||
Consumer,Non-cyclical | 21.7 | 43,920,460 | ||||||||
Communications | 11.1 | 22,420,044 | ||||||||
Consumer, Cyclical | 10.1 | 20,348,401 | ||||||||
Energy | 8.8 | 17,753,266 | ||||||||
Utilities | 4.4 | 8,914,050 | ||||||||
Industrial | 3.6 | 7,270,106 | ||||||||
Basic Materials | 2.5 | 5,023,568 | ||||||||
Information Technology | 1.6 | 3,260,000 | ||||||||
Short-Term Investments | 11.5 | 23,280,272 | ||||||||
Other Assets in Excess of Liabilities | 0.3 | 593,289 | ||||||||
|
|
|
| |||||||
NET ASSETS |
|
100.0 |
% |
$ |
202,131,647 |
| ||||
|
|
|
| |||||||
Portfolio holdings are subject to change at any time.
The accompanying notes are an integral part of the financial statements.
14
EIC VALUE FUND
Portfolio of Investments
October 31, 2019
(Unaudited)
| Number of Shares | Value | |||||||
COMMON STOCKS — 88.2% |
| |||||||
Basic Materials — 2.5% | ||||||||
PPG Industries, Inc. | 40,150 | $ | 5,023,568 | |||||
|
| |||||||
Communications — 11.1% | ||||||||
Discovery, Inc., Class C* | 160,000 | 4,038,400 | ||||||
ebay, Inc. | 183,870 | 6,481,418 | ||||||
Facebook, Inc., Class A* | 27,315 | 5,234,920 | ||||||
Verizon Communications, Inc. | 110,225 | 6,665,306 | ||||||
|
| |||||||
| 22,420,044 | ||||||||
|
| |||||||
Consumer, Cyclical — 10.1% |
| |||||||
Booking Holdings, Inc.* | 2,128 | 4,359,783 | ||||||
Honda Motor Co. Ltd., SP ADR | 95,000 | 2,562,150 | ||||||
Lowe’s Cos, Inc. | 36,500 | 4,073,765 | ||||||
Mohawk Industries, Inc.* | 31,050 | 4,451,949 | ||||||
Target Corp. | 45,840 | 4,900,754 | ||||||
|
| |||||||
| 20,348,401 | ||||||||
|
| |||||||
Consumer,Non-cyclical — 21.7% |
| |||||||
AmerisourceBergen Corp. | 60,775 | 5,188,970 | ||||||
GlaxoSmithKline PLC, SP ADR | 180,655 | 8,273,999 | ||||||
Johnson & Johnson | 44,065 | 5,818,343 | ||||||
Kroger Co. (The) | 163,050 | 4,017,552 | ||||||
McKesson Corp. | 24,575 | 3,268,475 | ||||||
Medtronic PLC | 37,610 | 4,095,729 | ||||||
Molson Coors Brewing Co., Class B | 75,875 | 4,000,130 | ||||||
PepsiCo, Inc. | 35,725 | 4,900,398 | ||||||
Sanofi SA, SP ADR | 94,550 | 4,356,864 | ||||||
|
| |||||||
| 43,920,460 | ||||||||
|
| |||||||
Energy — 8.8% | ||||||||
Cimarex Energy Co. | 109,850 | 4,637,867 | ||||||
ConocoPhillips | 68,150 | 3,761,880 | ||||||
| Number of Shares | Value | |||||||
COMMON STOCKS — (Continued) |
| |||||||
Energy — (Continued) | ||||||||
Exxon Mobil Corp. | 41,575 | $ | 2,809,223 | |||||
Schlumberger Ltd. | 75,460 | 2,466,787 | ||||||
TOTAL SA, SP ADR | 77,475 | 4,077,509 | ||||||
|
| |||||||
| 17,753,266 | ||||||||
|
| |||||||
Financial — 24.4% | ||||||||
AGNC Investment Corp. REIT | 263,050 | 4,485,002 | ||||||
American Express Co. | 51,800 | 6,075,104 | ||||||
Franklin Resources, Inc. | 52,400 | 1,443,620 | ||||||
Globe Life, Inc. | 34,947 | 3,401,391 | ||||||
Hartford Financial Services Group, Inc. (The) | 85,325 | 4,870,351 | ||||||
PNC Financial Services Group, Inc. (The) | 25,720 | 3,773,124 | ||||||
SunTrust Banks, Inc. | 87,655 | 5,990,343 | ||||||
Travelers Cos, Inc. (The) | 39,505 | 5,177,525 | ||||||
US Bancorp | 125,690 | 7,166,844 | ||||||
Wells Fargo & Co. | 134,900 | 6,964,887 | ||||||
|
| |||||||
| 49,348,191 | ||||||||
|
| |||||||
Industrial — 3.6% | ||||||||
United Parcel Service, Inc., Class B | 63,125 | 7,270,106 | ||||||
|
| |||||||
Informational Technology — 1.6% |
| |||||||
Alliance Data Systems Corp. | 32,600 | 3,260,000 | ||||||
|
| |||||||
Utilities — 4.4% | ||||||||
Exelon Corp. | 105,110 | 4,781,454 | ||||||
National Grid PLC, SP ADR | 70,800 | 4,132,596 | ||||||
|
| |||||||
| 8,914,050 | ||||||||
|
| |||||||
TOTAL COMMON STOCKS |
| 178,258,086 | ||||||
|
| |||||||
The accompanying notes are an integral part of the financial statements.
15
EIC VALUE FUND
Portfolio of Investments (Concluded)
October 31, 2019
(Unaudited)
| Number of Shares | Value | |||||||
SHORT-TERM INVESTMENTS — 11.5% |
| |||||||
Exchange Traded Fund — 6.4% |
| |||||||
iShares Short Treasury Bond ETF 1.64%(a) | 116,365 | $ | 12,883,933 | |||||
|
| |||||||
Money Market Fund — 5.1% |
| |||||||
Dreyfus Institutional Treasury Securities Cash Advantage Fund, Premier Shares 1.41%(b) | 10,396,339 | 10,396,339 | ||||||
|
| |||||||
TOTAL SHORT-TERM INVESTMENTS |
| 23,280,272 | ||||||
|
| |||||||
TOTAL INVESTMENTS - 99.7% |
| 201,538,358 | ||||||
OTHER ASSETS IN EXCESS OF LIABILITIES - 0.3% | 593,289 | |||||||
|
| |||||||
NET ASSETS - 100.0% | $ | 202,131,647 | ||||||
|
| |||||||
| * | Non-income producing. |
| (a) | Rate periodically changes. Rate disclosed is the30-day SEC yield at October 31, 2019. |
| (b) | Rate periodically changes. Rate disclosed is the7-day yield at October 31, 2019. |
| ADR | American Depository Receipt | |
| PLC | Public Limited Company | |
| REIT | Real Estate Investment Trust | |
| SP ADR | Sponsored American Depository Receipt |
The accompanying notes are an integral part of the financial statements.
16
EIC VALUE FUND
Statement of Assets and Liabilities
October 31, 2019
(Unaudited)
Assets | |||||
Investments, at value (Cost $161,612,958) | $ | 201,538,358 | |||
Receivable for investments sold | 762,020 | ||||
Receivable for capital shares sold | 32,079 | ||||
Dividends receivable | 233,305 | ||||
Prepaid expenses and other assets | 31,053 | ||||
|
| ||||
Total assets | 202,596,815 | ||||
|
| ||||
Liabilities | |||||
Payable for capital shares redeemed | 214,897 | ||||
Payable to Adviser | 112,298 | ||||
Payable for administration and accounting fees | 34,177 | ||||
Payable for transfer agent fees | 25,403 | ||||
Payable for distribution fees | 17,764 | ||||
Payable for printing fees | 16,198 | ||||
Payable for legal fees | 15,977 | ||||
Payable for audit fees | 14,126 | ||||
Payable for custodian fees | 7,874 | ||||
Payable for shareholder servicing fees | 5,003 | ||||
Accrued expenses | 1,451 | ||||
|
| ||||
Total liabilities | 465,168 | ||||
|
| ||||
Net Assets | $ | 202,131,647 | |||
|
| ||||
Net Assets consisted of: | |||||
Capital stock, $0.01 par value | $ | 142,979 | |||
Paid-in capital | 147,709,483 | ||||
Total distributable earnings | 54,279,185 | ||||
|
| ||||
Net Assets | $ | 202,131,647 | |||
|
| ||||
Class A: | |||||
Net asset value, redemption price per share | $14.17 | ||||
|
| ||||
Maximum offering price per share (100/94.5 of $14.17) | $14.99 | ||||
|
| ||||
Class C: | |||||
Net asset value, offering and redemption price per share | $13.86 | ||||
|
| ||||
Institutional Class: | |||||
Net asset value, offering and redemption price per share | $14.17 | ||||
|
|
The accompanying notes are an integral part of the financial statements.
17
EIC VALUE FUND
Statement of Operations
For the Six Months Ended October 31, 2019
(Unaudited)
Investment income | |||||
Dividends | $ | 2,826,327 | |||
Less: foreign taxes withheld | (20,530 | ) | |||
|
| ||||
Total investment income | 2,805,797 | ||||
|
| ||||
Expenses | |||||
Advisory fees (Note 2) | 772,165 | ||||
Distribution fees (Class C) (Note 2) | 93,251 | ||||
Transfer agent fees (Note 2) | 74,195 | ||||
Administration and accounting fees (Note 2) | 60,160 | ||||
Shareholder servicing fees (Class C) (Note 2) | 31,084 | ||||
Trustees’ and officers’ fees (Note 2) | 27,786 | ||||
Registration and filing fees | 26,288 | ||||
Legal fees | 19,382 | ||||
Distribution fees (Class A) (Note 2) | 17,311 | ||||
Printing and shareholder reporting fees | 16,878 | ||||
Audit fees | 14,706 | ||||
Custodian fees (Note 2) | 13,255 | ||||
Other expenses | 8,005 | ||||
|
| ||||
Total expenses | 1,174,466 | ||||
|
| ||||
Less: waivers and reimbursements (Note 2) | (106,223 | ) | |||
|
| ||||
Net expenses after waivers and reimbursements | 1,068,243 | ||||
|
| ||||
Net investment income | 1,737,554 | ||||
|
| ||||
Net realized and unrealized gain/(loss) from investments: | |||||
Net realized gain from investments | 6,019,613 | ||||
Net change in unrealized appreciation/(depreciation) on investments | (5,182,598 | ) | |||
|
| ||||
Net realized and unrealized gain on investments | 837,015 | ||||
|
| ||||
Net increase in net assets resulting from operations | $ | 2,574,569 | |||
|
| ||||
The accompanying notes are an integral part of the financial statements.
18
EIC VALUE FUND
Statements of Changes in Net Assets
| For the Six Months Ended October 31, 2019 (Unaudited) | For the Year Ended April 30, 2019 | |||||||||
Increase/(decrease) in net assets from operations: | ||||||||||
Net investment income | $ | 1,737,554 | $ | 3,543,641 | ||||||
Net realized gain from investments | 6,019,613 | 15,100,484 | ||||||||
Net change in unrealized appreciation/(depreciation) on investments | (5,182,598 | ) | (5,445,416 | ) | ||||||
|
|
|
| |||||||
Net increase in net assets resulting from operations | 2,574,569 | 13,198,709 | ||||||||
|
|
|
| |||||||
Less dividends and distributions to shareholders from: | ||||||||||
Total distributable earnings | ||||||||||
Class A | — | (1,467,856 | ) | |||||||
Class C | — | (2,431,876 | ) | |||||||
Institutional Class | — | (16,589,140 | ) | |||||||
|
|
|
| |||||||
Net decrease in net assets from dividends and distributions to shareholders | — | (20,488,872 | ) | |||||||
|
|
|
| |||||||
Decrease in net assets derived from capital share transactions (Note 4) | (16,337,043 | ) | (20,476,467 | ) | ||||||
|
|
|
| |||||||
Total decrease in net assets | (13,762,474 | ) | (27,766,630 | ) | ||||||
|
|
|
| |||||||
Net assets | ||||||||||
Beginning of period | 215,894,121 | 243,660,751 | ||||||||
|
|
|
| |||||||
End of period | $ | 202,131,647 | $ | 215,894,121 | ||||||
|
|
|
| |||||||
The accompanying notes are an integral part of the financial statements.
19
EIC VALUE FUND
Financial Highlights
Contained below is per share operating performance data for Class A shares outstanding, total investment return, ratios to average net assets and other supplemental data for the respective period. The total returns in the table represent the rate that an investor would have earned or lost on an investment in the Fund (assuming reinvestment of all dividends and distributions). This information has been derived from information provided in the financial statements and should be read in conjunction with the financial statements and the notes thereto.
| Class A | ||||||||||||||||||||||||||||||
| | For the Six Months | | | For the Year Ended April 30, 2019 | | | For the Year Ended April 30, 2018 | | | For the Year Ended April 30, 2017 | | | For the Year Ended April 30, 2016 | | | For the Year Ended April 30, 2015 | | |||||||||||||
Per Share Operating Performance | ||||||||||||||||||||||||||||||
Net asset value, beginning of period | $ | 13.98 | $ | 14.33 | $ | 14.22 | $ | 13.02 | $ | 13.91 | $ | 13.37 | ||||||||||||||||||
|
|
|
|
|
|
|
|
|
|
|
| |||||||||||||||||||
Net investment income(1) | 0.11 | 0.21 | 0.17 | 0.13 | 0.11 | 0.12 | ||||||||||||||||||||||||
Net realized and unrealized gain/(loss) on investments | 0.08 | 0.68 | 1.15 | 1.32 | (0.60 | ) | 0.98 | |||||||||||||||||||||||
|
|
|
|
|
|
|
|
|
|
|
| |||||||||||||||||||
Net increase/(decrease) in net assets resulting from operations | 0.19 | 0.89 | 1.32 | 1.45 | (0.49 | ) | 1.10 | |||||||||||||||||||||||
|
|
|
|
|
|
|
|
|
|
|
| |||||||||||||||||||
Dividends and distributions to shareholders from: | ||||||||||||||||||||||||||||||
Net investment income | — | (0.16 | ) | (0.15 | ) | (0.11 | ) | (0.14 | ) | (0.10 | ) | |||||||||||||||||||
Net realized capital gains | — | (1.08 | ) | (1.06 | ) | (0.14 | ) | (0.26 | ) | (0.46 | ) | |||||||||||||||||||
|
|
|
|
|
|
|
|
|
|
|
| |||||||||||||||||||
Total dividends and distributions to shareholders | — | (1.24 | ) | (1.21 | ) | (0.25 | ) | (0.40 | ) | (0.56 | ) | |||||||||||||||||||
|
|
|
|
|
|
|
|
|
|
|
| |||||||||||||||||||
Redemption fees | — | (2) | — | (2) | — | (2) | — | — | (2) | — | (2) | |||||||||||||||||||
|
|
|
|
|
|
|
|
|
|
|
| |||||||||||||||||||
Net asset value, end of period | $ | 14.17 | $ | 13.98 | $ | 14.33 | $ | 14.22 | $ | 13.02 | $ | 13.91 | ||||||||||||||||||
|
|
|
|
|
|
|
|
|
|
|
| |||||||||||||||||||
Total investment return(3) | 1.36 | % | 6.86 | % | 9.45 | % | 11.13 | % | (3.44 | )% | 8.22 | % | ||||||||||||||||||
Ratios/Supplemental Data | ||||||||||||||||||||||||||||||
Net assets, end of period (in thousands) | $ | 13,001 | $ | 15,019 | $ | 47,274 | $ | 52,845 | $ | 65,882 | $ | 85,653 | ||||||||||||||||||
Ratio of expenses to average net assets | 1.15 | %(4) | 1.18 | % | 1.24 | % | 1.20 | % | 1.25 | % | 1.25 | % | ||||||||||||||||||
Ratio of expenses to average net assets without waivers, expense reimbursements, and/or recoupments, if any | 1.25 | %(4)(5) | 1.23 | %(5) | 1.24 | % | 1.20 | % | 1.21 | %(5) | 1.18 | %(5) | ||||||||||||||||||
Ratio of net investment income to average net assets | 1.58 | %(4) | 1.47 | % | 1.16 | % | 0.98 | % | 0.85 | % | 0.90 | % | ||||||||||||||||||
Portfolio turnover rate | 15 | %(6) | 42 | % | 33 | % | 29 | % | 34 | % | 27 | % | ||||||||||||||||||
| (1) | The selected per share data was calculated using the average shares outstanding method for the period. |
| (2) | Amount is less than $0.005 per share. |
| (3) | Total investment return is calculated assuming a purchase of shares on the first day and a sale of shares on the last day of each period reported and includes reinvestment of dividends and distributions, if any. Total return for periods less than one year are not annualized. Total investment return does not reflect the impact of the maximumfront-end sales load of 5.50%. If reflected, the return would be lower. |
| (4) | Annualized. |
| (5) | During the period, certain fees were waived, reimbursed, and/or recouped. If such fee waivers, reimbursements, and/or recoupments had not occurred, the ratios would have been as indicated (See Note 2). |
| (6) | Not annualized. |
The accompanying notes are an integral part of the financial statements.
20
EIC VALUE FUND
Financial Highlights
Contained below is per share operating performance data for Class C shares outstanding, total investment return, ratios to average net assets and other supplemental data for the respective period. The total returns in the table represent the rate that an investor would have earned or lost on an investment in the Fund (assuming reinvestment of all dividends and distributions). This information has been derived from information provided in the financial statements and should be read in conjunction with the financial statements and the notes thereto.
| Class C | ||||||||||||||||||||||||||||||||
| | For the Six Months | | | For the Year Ended April 30, 2019 | | | For the Year Ended April 30, 2018 | | | For the Year Ended April 30, 2017 | | | For the Year Ended April 30, 2016 | | | For the Year Ended April 30, 2015 | | |||||||||||||||
Per Share Operating Performance | ||||||||||||||||||||||||||||||||
Net asset value, beginning of period | $ | 13.73 | $ | 14.12 | $ | 14.06 | $ | 12.87 | $ | 13.75 | $ | 13.24 | ||||||||||||||||||||
|
|
|
|
|
|
|
|
|
|
|
| |||||||||||||||||||||
Net investment income(1) | 0.06 | 0.10 | 0.06 | 0.03 | 0.01 | 0.02 | ||||||||||||||||||||||||||
Net realized and unrealized gain/(loss) on investments | 0.07 | 0.67 | 1.13 | 1.30 | (0.60 | ) | 0.97 | |||||||||||||||||||||||||
|
|
|
|
|
|
|
|
|
|
|
| |||||||||||||||||||||
Net increase/(decrease) in net assets resulting from operations | 0.13 | 0.77 | 1.19 | 1.33 | (0.59 | ) | 0.99 | |||||||||||||||||||||||||
|
|
|
|
|
|
|
|
|
|
|
| |||||||||||||||||||||
Dividends and distributions to shareholders from: | ||||||||||||||||||||||||||||||||
Net investment income | — | (0.08 | ) | (0.07 | ) | — | (2) | (0.03 | ) | (0.02 | ) | |||||||||||||||||||||
Net realized capital gains | — | (1.08 | ) | (1.06 | ) | (0.14 | ) | (0.26 | ) | (0.46 | ) | |||||||||||||||||||||
|
|
|
|
|
|
|
|
|
|
|
| |||||||||||||||||||||
Total dividends and distributions to shareholders | — | (1.16 | ) | (1.13 | ) | (0.14 | ) | (0.29 | ) | (0.48 | ) | |||||||||||||||||||||
|
|
|
|
|
|
|
|
|
|
|
| |||||||||||||||||||||
Redemption fees | — | (2) | — | (2) | — | (2) | — | — | (2) | — | (2) | |||||||||||||||||||||
|
|
|
|
|
|
|
|
|
|
|
| |||||||||||||||||||||
Net asset value, end of period | $ | 13.86 | $ | 13.73 | $ | 14.12 | $ | 14.06 | $ | 12.87 | $ | 13.75 | ||||||||||||||||||||
|
|
|
|
|
|
|
|
|
|
|
| |||||||||||||||||||||
Total investment return(3) | 0.95 | % | 6.05 | % | 8.63 | % | 10.35 | % | (4.17 | )% | 7.49 | % | ||||||||||||||||||||
Ratios/Supplemental Data | ||||||||||||||||||||||||||||||||
Net assets, end of period (in thousands) | $ | 23,590 | $ | 27,407 | $ | 35,488 | $ | 45,071 | $ | 51,146 | $ | 62,378 | ||||||||||||||||||||
Ratio of expenses to average net assets | 1.90 | %(4) | 1.93 | % | 1.99 | % | 1.95 | % | 2.00 | % | 2.00 | % | ||||||||||||||||||||
Ratio of expenses to average net assets without waivers, expense reimbursements, and/or recoupments, if any | 2.00 | %(4)(5) | 1.98 | %(5) | 1.99 | % | 1.95 | % | 1.96 | %(5) | 1.93 | %(5) | ||||||||||||||||||||
Ratio of net investment income to average net assets | 0.83 | %(4) | 0.71 | % | 0.41 | % | 0.23 | % | 0.10 | % | 0.15 | % | ||||||||||||||||||||
Portfolio turnover rate | 15 | %(6) | 42 | % | 33 | % | 29 | % | 34 | % | 27 | % | ||||||||||||||||||||
| (1) | The selected per share data was calculated using the average shares outstanding method for the period. |
| (2) | Amount is less than $0.005 per share. |
| (3) | Total investment return is calculated assuming a purchase of shares on the first day and a sale of shares on the last day of each period reported and includes reinvestment of dividends and distributions, if any. Total returns for periods less than one year are not annualized. Total return does not reflect any applicable sales charge. |
| (4) | Annualized. |
| (5) | During the period, certain fees were waived, reimbursed, and/or recouped. If such fee waivers, reimbursements, and/or recoupments had not occurred, the ratios would have been as indicated (See Note 2). |
| (6) | Not annualized. |
The accompanying notes are an integral part of the financial statements.
21
EIC VALUE FUND
Financial Highlights
Contained below is per share operating performance data for Institutional Class shares outstanding, total investment return, ratios to average net assets and other supplemental data for the respective period. The total returns in the table represent the rate that an investor would have earned or lost on an investment in the Fund (assuming reinvestment of all dividends and distributions). This information has been derived from information provided in the financial statements and should be read in conjunction with the financial statements and the notes thereto.
| Institutional Class | ||||||||||||||||||||||||||||||||
| | For the Six Months | | | For the Year Ended April 30, 2019 | | | For the Year Ended April 30, 2018 | | | For the Year Ended April 30, 2017 | | | For the Year Ended April 30, 2016 | | | For the Year Ended April 30, 2015 | | |||||||||||||||
Per Share Operating Performance | ||||||||||||||||||||||||||||||||
Net asset value, beginning of period | $ | 13.97 | $ | 14.37 | $ | 14.26 | $ | 13.06 | $ | 13.95 | $ | 13.41 | ||||||||||||||||||||
|
|
|
|
|
|
|
|
|
|
|
| |||||||||||||||||||||
Net investment income(1) | 0.13 | 0.24 | 0.21 | 0.17 | 0.14 | 0.16 | ||||||||||||||||||||||||||
Net realized and unrealized gain/(loss) on investments | 0.07 | 0.69 | 1.14 | 1.32 | (0.60 | ) | 0.98 | |||||||||||||||||||||||||
|
|
|
|
|
|
|
|
|
|
|
| |||||||||||||||||||||
Net increase/(decrease) in net assets resulting from operations | 0.20 | 0.93 | 1.35 | 1.49 | (0.46 | ) | 1.14 | |||||||||||||||||||||||||
|
|
|
|
|
|
|
|
|
|
|
| |||||||||||||||||||||
Dividends and distributions to shareholders from: | ||||||||||||||||||||||||||||||||
Net investment income | — | (0.25 | ) | (0.18 | ) | (0.15 | ) | (0.17 | ) | (0.14 | ) | |||||||||||||||||||||
Net realized capital gains | — | (1.08 | ) | (1.06 | ) | (0.14 | ) | (0.26 | ) | (0.46 | ) | |||||||||||||||||||||
|
|
|
|
|
|
|
|
|
|
|
| |||||||||||||||||||||
Total dividends and distributions to shareholders | — | (1.33 | ) | (1.24 | ) | (0.29 | ) | (0.43 | ) | (0.60 | ) | |||||||||||||||||||||
|
|
|
|
|
|
|
|
|
|
|
| |||||||||||||||||||||
Redemption fees | — | (2) | — | (2) | — | (2) | — | — | (2) | — | (2) | |||||||||||||||||||||
|
|
|
|
|
|
|
|
|
|
|
| |||||||||||||||||||||
Net asset value, end of period | $ | 14.17 | $ | 13.97 | $ | 14.37 | $ | 14.26 | $ | 13.06 | $ | 13.95 | ||||||||||||||||||||
|
|
|
|
|
|
|
|
|
|
|
| |||||||||||||||||||||
Total investment return(3) | 1.43 | % | 7.16 | % | 9.70 | % | 11.40 | % | (3.15 | )% | 8.54 | % | ||||||||||||||||||||
Ratios/Supplemental Data | ||||||||||||||||||||||||||||||||
Net assets, end of period (in thousands) | $ | 165,541 | $ | 173,468 | $ | 160,899 | $ | 171,105 | $ | 196,785 | $ | 189,860 | ||||||||||||||||||||
Ratio of expenses to average net assets | 0.90 | %(4) | 0.93 | % | 0.99 | % | 0.96 | % | 1.00 | % | 1.00 | % | ||||||||||||||||||||
Ratio of expenses to average net assets without waivers, expense reimbursements, and/or recoupments, if any | 1.00 | %(4)(5) | 0.99 | %(5) | 0.99 | % | 0.96 | % | 0.96 | %(5) | 0.93 | %(5) | ||||||||||||||||||||
Ratio of net investment income to average net assets | 1.83 | %(4) | 1.72 | % | 1.41 | % | 1.23 | % | 1.10 | % | 1.14 | % | ||||||||||||||||||||
Portfolio turnover rate | 15 | %(6) | 42 | % | 33 | % | 29 | % | 34 | % | 27 | % | ||||||||||||||||||||
| (1) | The selected per share data was calculated using the average shares outstanding method for the period. |
| (2) | Amount is less than $0.005 per share. |
| (3) | Total investment return is calculated assuming a purchase of shares on the first day and a sale of shares on the last day of each period reported and includes reinvestment of dividends and distributions, if any. Total return for period less than one year is not annualized. |
| (4) | Annualized. |
| (5) | During the period, certain fees were waived, reimbursed, and/or recouped. If such fee waivers, reimbursements, and/or recoupments had not occurred, the ratios would have been as indicated (See Note 2). |
| (6) | Not annualized. |
The accompanying notes are an integral part of the financial statements.
22
EIC VALUE FUND
Notes to Financial Statements
October 31, 2019
(Unaudited)
1. Organization and Significant Accounting Policies
The EIC Value Fund (the “Fund”) is a diversified,open-end management investment company registered under the Investment Company Act of 1940, as amended (the “1940 Act”), which commenced operations on May 1, 2011. The Fund is a separate series of FundVantage Trust (the “Trust”) which was organized as a Delaware statutory trust on August 28, 2006. The Trust is a “series trust” authorized to issue an unlimited number of separate series or classes of shares of beneficial interest. Each series is treated as a separate entity for certain matters under the 1940 Act, and for other purposes, and a shareholder of one series is not deemed to be a shareholder of any other series. The Fund offers separate classes of shares, Class A, Class C, Institutional Class and Retail Class shares. Class A shares are sold subject to afront-end sales charge.Front-end sales charges may be reduced or waived under certain circumstances. A contingent deferred sales charge (“CDSC”) may be applicable to the redemption of Class A shares. A CDSC, as a percentage of the lower of the original purchase price or net asset value at redemption, of up to 1.00% may be imposed on full or partial redemptions of Class A shares made within eighteen months of purchase where: (i) $1 million or more of Class A shares were purchased without an initial sales charge, and (ii) the Fund’s principal underwriter, Foreside Funds Distributors LLC (the “Underwriter”), paid a commission to the selling broker-dealer for such sale. A CDSC of up to 1.00% is assessed on redemptions of Class C Shares made within eighteen months after a purchase where the broker-dealer was paid a commission for such sale. As of October 31, 2019, the Retail Class Shares have not been issued.
The Fund is an investment company and follows accounting and reporting guidance in the Financial Accounting Standards Board Accounting Standards Codification Topic 946.
Portfolio Valuation— The Fund’s net asset value (“NAV”) is calculated once daily at the close of regular trading hours on the New York Stock Exchange (“NYSE”) (typically 4:00 p.m. Eastern time) on each day the NYSE is open. Securities held by the Fund are valued using the closing price or the last sale price on a national securities exchange or the National Association of Securities Dealers Automatic Quotation System (“NASDAQ”) market system where they are primarily traded. Equity securities traded in theover-the-counter market are valued at their closing prices. If there were no transactions on that day, securities traded principally on an exchange or on NASDAQ will be valued at the mean of the last bid and ask prices prior to the market close. Investments in otheropen-end investment companies are valued based on the NAV of the investment companies (which may use fair value pricing as discussed in their prospectuses). If market quotations are unavailable or deemed unreliable, securities will be valued in accordance with procedures adopted by the Trust’s Board of Trustees (“Board of Trustees”). Relying on prices supplied by pricing services or dealers or using fair valuation may result in values that are higher or lower than the values used by other investment companies and investors to price the same investments. In the event that market quotes are not readily available, and the security or asset cannot be valued pursuant to one of the valuation methods, the value of the security or asset will be determined
23
EIC VALUE FUND
Notes to Financial Statements (Continued)
October 31, 2019
(Unaudited)
in good faith by the Adviser. The Trust has established a Valuation Committee which performs certain functions including the oversight of the Adviser’s fair valuation determinations.
Fair Value Measurements— The inputs and valuation techniques used to measure fair value of the Fund’s investments are summarized into three levels as described in the hierarchy below:
| · Level 1 — | quoted prices in active markets for identical securities; | |
| · Level 2 — | other significant observable inputs (including quoted prices for similar securities, interest rates, prepayment speeds, credit risk, etc.); and | |
| · Level 3 — | significant unobservable inputs (including the Fund’s own assumptions in determining the fair value of investments). | |
The inputs or methodology used for valuing securities are not necessarily an indication of the risk associated with investing in those securities.
The following is a summary of the inputs used, as of October 31, 2019, in valuing the Fund’s investments carried at fair value:
| Total Value at 10/31/19 | Level 1 Quoted Prices | Level 2 Other Significant Observable Inputs | Level 3 Significant Unobservable Inputs | |||||||||||||
Common Stocks* | $ | 178,258,086 | $ | 178,258,086 | $ | — | $ | — | ||||||||
Short-Term Investments* | 23,280,272 | 23,280,272 | — | — | ||||||||||||
|
|
|
|
|
|
|
| |||||||||
Total Investments | $ | 201,538,358 | $ | 201,538,358 | $ | — | $ | — | ||||||||
|
|
|
|
|
|
|
| |||||||||
| * | Please refer to Portfolio of Investments for further details on portfolio holdings. |
At the end of each quarter, management evaluates the classification of Levels 1, 2 and 3 assets and liabilities. Various factors are considered, such as changes in liquidity from the prior reporting period; whether or not a broker is willing to execute at the quoted price; the depth and consistency of prices from third party pricing services; and the existence of contemporaneous, observable trades in the market. Additionally, management evaluates the classification of Level 1 and Level 2 assets and liabilities on a quarterly basis for changes in listings or delistings on national exchanges.
Due to the inherent uncertainty of determining the fair value of investments that do not have a readily available market value, the fair value of the Fund’s investments may fluctuate from period to period. Additionally, the fair value of investments may differ significantly from the values that would have been used had a ready market existed for such investments and may differ materially from the values the Fund
24
EIC VALUE FUND
Notes to Financial Statements (Continued)
October 31, 2019
(Unaudited)
may ultimately realize. Further, such investments may be subject to legal and other restrictions on resale or are otherwise less liquid than publicly traded securities.
For fair valuations using significant unobservable inputs, U.S. generally accepted accounting principles (“U.S. GAAP”) require the Fund to present a reconciliation of the beginning to ending balances for reported market values that present changes attributable to total realized and unrealized gains or losses, purchase and sales, and transfers in and out of Level 3 during the period. A reconciliation of Level 3 investments is presented only when the Fund had an amount of Level 3 investments at the end of the reporting period that was meaningful in relation to its net assets. The amounts and reasons for all transfers in and out of each Level within the three-tier hierarchy are disclosed when the Fund had an amount of total transfers during the reporting period that was meaningful in relation to its net assets as of the end of the reporting period.
For the six months ended October 31, 2019, there were no transfers in or out of Level 3.
Use of Estimates— The preparation of financial statements in conformity with U.S. GAAP requires management to make estimates and assumptions that affect the amounts reported in the financial statements and accompanying notes at the date of the financial statements and the reported amounts of revenues and expenses during the period. Actual results could differ from those estimates and those differences could be material.
Investment Transactions, Investment Income and Expenses— Investment transactions are recorded on trade date for financial statement preparation purposes. Realized gains and losses on investments sold are recorded on the identified cost basis. Interest income is recorded on the accrual basis. Dividends are recorded on theex-dividend date. Estimated components of distributions received from real estate investment trusts may be considered income, return of capital distributions or capital gain distributions. Return of capital distributions are recorded as a reduction of cost of the related investments. Distribution(12b-1) fees and shareholder services fees relating to a specific class are charged directly to that class. Fund level expenses common to all classes, investment income and realized and unrealized gains and losses on investments are allocated to each class based upon relative daily net assets of each class. General expenses of the Trust are generally allocated to each fund in proportion to its relative daily net assets. Expenses directly attributable to a particular fund in the Trust are charged directly to that fund.
Dividends and Distributions to Shareholders— Dividends from net investment income and distributions from net realized capital gains, if any, are declared, recorded onex-date and paid at least annually to shareholders. Income dividends and capital gain distributions are determined in accordance with U.S. federal income tax regulations, which may differ from U.S. GAAP.
U.S. Tax Status— No provision is made for U.S. income taxes as it is the Fund’s intention to continue to qualify for and elect the tax treatment applicable to regulated investment companies under Subchapter
25
EIC VALUE FUND
Notes to Financial Statements (Continued)
October 31, 2019
(Unaudited)
M of the Internal Revenue Code of 1986, as amended (the “Internal Revenue Code”), and make the requisite distributions to its shareholders which will be sufficient to relieve it from U.S. income and excise taxes.
Other— In the normal course of business, the Fund may enter into contracts that provide general indemnifications. The Fund’s maximum exposure under these arrangements is dependent on claims that may be made against the Fund in the future, and therefore, cannot be estimated; however, based on experience, the risk of material loss for such claims is considered remote.
Recent Regulatory Reporting Update and Accounting Pronouncement— In August 2018, the Financial Accounting Standards Board issued an Accounting Standards Update, ASU2018-13,Fair Value Measurement (Topic 820), Disclosure Framework – Changes to the Disclosure Requirements for Fair Value Measurement(the “2018 ASU”) which adds, modifies and removes disclosure requirements related to certain aspects of fair value measurement. The 2018 ASU is effective for fiscal years, and interim periods within those fiscal years, beginning after December 15, 2019. Early adoption is permitted. As of October 31, 2019, the Fund has fully adopted the provisions of the 2018 ASU, which did not have a material impact on the Fund’s financial statements and related disclosures or impact the Fund’s net assets or results of operations.
2. Transactions with Related Parties and Other Service Providers
Equity Investment Corporation (“EIC” or the “Adviser”) serves as investment adviser to the Fund pursuant to an investment advisory agreement with the Trust (the “Advisory Agreement”). For its services, the Adviser is paid a monthly fee at the annual rate of 0.75% of the Fund’s average daily net assets under $500 million; 0.65% of the Fund’s average daily net assets of $500 million or more but less than $1 billion; and 0.50% of the Fund’s average daily net assets of $1 billion and over. The Adviser has contractually agreed to waive or otherwise reduce its annual compensation received from the Fund to the extent necessary to ensure that the Fund’s “Total Annual Fund Operating Expenses”, excluding taxes, fees and expenses attributable to a distribution or service plan adopted by the Trust, “Acquired Fund Fees and Expenses,” interest, extraordinary items and brokerage commissions, do not exceed 0.90% of average daily net assets of the Fund (the “Expense Limitation”). The Expense Limitation will remain in place until August 31, 2020, unless the Board of Trustees approves its earlier termination. Subject to approval by the Board of Trustees, the Adviser may recoup any expenses or fees it has reimbursed within a three-year period from the date on which the Adviser reduced its compensation and/or assumed expenses of the Fund. The Adviser is permitted to seek reimbursement from the Fund, subject to certain limitations, for fees it waived and Fund expenses it paid to the extent the total annual fund operating expenses do not exceed the limits described above or any lesser limits in effect at the time of reimbursement. No recoupment will occur unless the Fund’s expenses are below the Expense Limitation amount.
As of October 31, 2019, the amount of potential recovery was as follows:
26
EIC VALUE FUND
Notes to Financial Statements (Continued)
October 31, 2019
(Unaudited)
| Expiration | ||||
4/30/2022 | 10/31/2022 | Total | ||
$118,185 | $106,223 | $224,408 | ||
For the six months ended October 31, 2019, the Adviser earned advisory fees of $772,165 and waived fees of $106,223.
Other Service Providers
The Bank of New York Mellon (“BNY Mellon”) serves as administrator and custodian for the Fund. For providing administrative and accounting services, BNY Mellon is entitled to receive a monthly fee equal to an annual percentage rate of the Fund’s average daily net assets and is subject to certain minimum monthly fees. For providing certain custodial services, BNY Mellon is entitled to receive a monthly fee, subject to certain minimum, and out of pocket expenses.
BNY Mellon Investment Servicing (US) Inc. (the “Transfer Agent”) provides transfer agent services to the Fund. The Transfer Agent is entitled to receive a monthly fee, subject to certain minimum, and out of pocket expenses.
The Trust, on behalf of the Fund, has entered into agreements with financial intermediaries to provide recordkeeping, processing, shareholder communications and other services to customers of the intermediaries investing in the Fund and have agreed to compensate the intermediaries for providing those services. The fees incurred by the Fund for these services are included in Transfer agent fees in the Statement of Operations.
Foreside Funds Distributors LLC (the “Underwriter”) provides principal underwriting services to the Fund pursuant to an underwriting agreement between the Trust and the Underwriter.
The Trust and the Underwriter are parties to an underwriting agreement. The Trust has adopted a distribution plan for Class A and Class C shares in accordance with Rule12b-1 under the 1940 Act. Pursuant to the Class A and Class C shares plan, the Fund compensates the Underwriter for direct and indirect costs and expenses incurred in connection with advertising, marketing and other distribution services in an amount not to exceed 0.25% and 1.00% (0.75% Rule12b-1 distribution fee and 0.25% shareholder service fee) on an annualized basis of the average daily net assets of the Fund’s Class A and Class C shares, respectively.
27
EIC VALUE FUND
Notes to Financial Statements (Continued)
October 31, 2019
(Unaudited)
Trustees and Officers
The Trust is governed by its Board of Trustees. The Trustees receive compensation in the form of an annual retainer and per meeting fees for their services to the Trust. The remuneration paid to the Trustees by the Fund during the six months ended October 31, 2019 was $7,383. An employee of BNY Mellon serves as the Secretary of the Trust and is not compensated by the Fund or the Trust.
JW Fund Management LLC (“JWFM”) provides a Principal Executive Officer and Principal Financial Officer, respectively, to the Trust. Duff & Phelps, LLC (“D&P”) provides the Trust with a Chief Compliance Officer and an Anti-Money Laundering Officer. JWFM and D&P are compensated for their services provided to the Trust.
3. Investment in Securities
For the six months ended October 31, 2019, aggregate purchases and sales of investment securities (excluding short-term investments) of the Fund were as follows:
| Purchases | Sales | |||||||
Investment Securities | $ | 28,498,250 | $ | 39,901,804 | ||||
4. Capital Share Transactions
For the six months ended October 31, 2019 and year ended April 30, 2019, transactions in capital shares (authorized shares unlimited) were as follows:
| For the Six Months Ended October 31, 2019 (Unaudited) | For the Year Ended April 30, 2019 | |||||||||||||||
| Shares | Amount | Shares | Amount | |||||||||||||
Class A | ||||||||||||||||
Sales | 10,484 | $ | 146,534 | 107,434 | $ | 1,538,913 | ||||||||||
Reinvestments | — | — | 89,030 | 1,155,614 | ||||||||||||
Redemption Fees* | — | 32 | — | 351 | ||||||||||||
Redemptions | (167,268 | ) | (2,309,294 | ) | (2,420,969 | ) | (35,638,291 | ) | ||||||||
|
|
|
|
|
|
|
| |||||||||
Net decrease | (156,784 | ) | $ | (2,162,728 | ) | (2,224,505 | ) | $ | (32,943,413 | ) | ||||||
|
|
|
|
|
|
|
| |||||||||
28
EIC VALUE FUND
Notes to Financial Statements (Continued)
October 31, 2019
(Unaudited)
| For the Six Months Ended October 31, 2019 (Unaudited) | For the Year Ended April 30, 2019 | |||||||||||||||
| Shares | Amount | Shares | Amount | |||||||||||||
Class C | ||||||||||||||||
Sales | 8,481 | $ | 116,163 | 69,363 | $ | 977,102 | ||||||||||
Reinvestments | — | — | 180,955 | 2,312,609 | ||||||||||||
Redemption Fees* | — | 59 | — | 565 | ||||||||||||
Redemptions | (303,142 | ) | (4,105,209 | ) | (767,907 | ) | (10,657,230 | ) | ||||||||
|
|
|
|
|
|
|
| |||||||||
Net decrease | (294,661 | ) | $ | (3,988,987 | ) | (517,589 | ) | $ | (7,366,954 | ) | ||||||
|
|
|
|
|
|
|
| |||||||||
Institutional Class | ||||||||||||||||
Sales | 555,345 | $ | 7,720,397 | 4,091,856 | $ | 58,852,083 | ||||||||||
Reinvestments | — | — | 1,258,074 | 16,292,060 | ||||||||||||
Redemption Fees* | — | 384 | — | 3,288 | ||||||||||||
Redemptions | (1,296,425 | ) | (17,906,109 | ) | (4,125,916 | ) | (55,313,531 | ) | ||||||||
|
|
|
|
|
|
|
| |||||||||
Net increase/(decrease) | (741,080 | ) | $ | (10,185,328 | ) | 1,224,014 | $ | 19,833,900 | ||||||||
|
|
|
|
|
|
|
| |||||||||
Total Net Decrease | (1,192,525 | ) | $ | (16,337,043 | ) | (1,518,080 | ) | $ | (20,476,467 | ) | ||||||
|
|
|
|
|
|
|
| |||||||||
| * | There is a 2.00% redemption fee that may be charged on shares redeemed which have been held for 30 days or less. The redemption fees are retained by the Fund for the benefit of the remaining shareholders and recorded aspaid-in-capital. |
5. Federal Tax Information
The Fund has followed the authoritative guidance on accounting for and disclosure of uncertainty in tax positions, which requires the Fund to determine whether a tax position is more likely than not to be sustained upon examination, including resolution of any related appeals or litigation processes, based on the technical merits of the position. The Fund has determined that there was no effect on the financial statements from following this authoritative guidance. In the normal course of business, the Fund is subject to examination by federal, state and local jurisdictions, where applicable, for tax years for which applicable statutes of limitations have not expired.
For the year ended April 30, 2019 the tax character of distributions paid by the Fund was $3,467,250 of ordinary income dividends and $17,021,622 of long-term capital gains dividends. Distributions from net investment income and short-term gains are treated as ordinary income for federal income tax purposes.
29
EIC VALUE FUND
Notes to Financial Statements (Concluded)
October 31, 2019
(Unaudited)
As of April 30, 2019, the components of distributable earnings on a tax basis were as follows:
Undistributed Ordinary Income | Undistributed | Net Unrealized | Total | |||||||||||||||
| $820,915 | $ | 5,775,703 | $ | 45,107,998 | $ | 51,704,616 | ||||||||||||
The differences between the book and tax basis components of distributable earnings relate primarily to the timing and recognition of income and gains for federal income tax purposes.
As of October 31, 2019, the federal tax cost, aggregate gross unrealized appreciation and depreciation of securities held by the Fund were as follows:
Federal tax cost* | $ | 161,612,958 | ||||
|
| |||||
Gross unrealized appreciation | $ | 44,682,410 | ||||
Gross unrealized depreciation | (4,757,010 | ) | ||||
|
| |||||
Net unrealized appreciation | $ | 39,925,400 | ||||
|
|
| * | Because tax adjustments are calculated annually at the end of the Fund’s fiscal year, the above table does not reflect tax adjustments for the current fiscal year. For the previous year’s federal income tax information, please refer to the Notes to Financial Statements section in the Fund’s most recent annual report. |
Pursuant to federal income tax rules applicable to regulated investment companies, the Fund may elect to treat certain capital losses between November 1 and April 30 and late year ordinary losses ((i) ordinary losses between January 1 and April 30, and (ii) specified ordinary and currency losses between November 1 and April 30 as occurring on the first day of the following tax year. For the year ended April 30, 2019, any amount of losses elected within the tax return will not be recognized for federal income tax purposes until May 1, 2019. For the year ended April 30, 2019, the Fund had no loss deferrals.
Accumulated capital losses represent net capital loss carry forwards as of April 30, 2019 that may be available to offset future realized capital gains and thereby reduce future capital gains distributions. As of April 30, 2019, the Fund did not have any capital loss carryforwards.
6. Subsequent Events
Management has evaluated the impact of all subsequent events on the Fund through the date the financial statements were issued, and has determined that there are no material subsequent events requiring recognition or disclosure in the financial statements.
30
EIC VALUE FUND
Other Information
(Unaudited)
Proxy Voting
Policies and procedures that the Fund uses to determine how to vote proxies relating to portfolio securities as well as information regarding how the Fund voted proxies relating to portfolio securities for the most recent12-month period ended June 30 are available without charge, upon request, by calling (855)430-6487 and on the Securities and Exchange Commission’s (“SEC”) website athttp:// www.sec.gov.
Quarterly Portfolio Schedules
The Trust files its complete schedule of portfolio holdings with the SEC for the first and third fiscal quarters of each fiscal year (quarters ended July 31 and January 31) on FormN-Q. The Trust’s FormsN-Q are available on the SEC’s website athttp://www.sec.gov. FormN-Q is being rescinded. Once FormN-Q is rescinded, disclosure of the Fund’s complete holdings will be required to be made monthly on FormN-PORT, with every third month made available to the public by the Commission upon filing.
31
Investment Adviser
Equity Investment Corporation
1776 Peachtree Street, NW
Suite 600S
Atlanta, GA 30309
Administrator
The Bank of New York Mellon
301 Bellevue Parkway
Wilmington, DE 19809
Transfer Agent
BNY Mellon Investment Servicing (US) Inc.
4400 Computer Drive
Westborough, MA 01581
Principal Underwriter
Foreside Funds Distributors LLC
400 Berwyn Park
899 Cassatt Road
Berwyn, PA 19312
Custodian
The Bank of New York Mellon
240 Greenwich Street
New York, NY 10286
Independent Registered Public Accounting Firm
Ernst & Young LLP
One Commerce Square
2005 Market Street, Suite 700
Philadelphia, PA 19103-7096
Legal Counsel
Pepper Hamilton LLP
3000 Two Logan Square
18th and Arch Streets
Philadelphia, PA 19103
EIC-1019

of
FundVantage Trust
Class A
Class C
Institutional Class
SEMI-ANNUAL
REPORT
October 31, 2019
(Unaudited)
IMPORTANT NOTE: Beginning on January 1, 2021, paper copies of the EIC Value Fund’s annual and semi-annual shareholder reports will no longer be sent by mail, unless you specifically request paper copies of the shareholder reports from the EIC Value Fund or from your financial intermediary. Instead, annual and semi-annual shareholder reports will be available on the EIC Value Fund’s website (www.eicvalue.com), and you will be notified by mail each time a report is posted and provided with a website link to access the report.
You may elect to receive all future annual and semi-annual shareholder reports in paper, free of charge. To elect to receive paper copies of shareholder reports through the mail or otherwise change your delivery method, contact your financial intermediary or, if you hold your shares directly through the EIC Value Fund, call the EIC Value Fund toll-free at (855)430-6487 or write to the EIC Value Fund at:
EIC Value Fund
FundVantage Trust
c/o BNY Mellon Investment Servicing
P.O. Box 9829
Providence, RI 02940-8029
This report is submitted for the general information of the shareholders of the EIC Value Fund. It is not authorized for distribution unless preceded or accompanied by a current prospectus for the EIC Value Fund.
LATEEF FOCUSED GROWTH FUND
Semi-Annual Report
Performance Data
October 31, 2019
(Unaudited)
| Average Annual Total Returns for the Periods Ended October 31, 2019 | ||||||||||||||||||||||||||||||
| Six Months† | 1 Year | 3 Years | 5 Years | 10 Years | ||||||||||||||||||||||||||
Class A Shares (with sales charge) | 0.74 | % | 15.84 | % | 13.38 | % | 8.24 | % | 11.63 | % | ||||||||||||||||||||
Class A Shares (without sales charge) | 6.08 | % | 21.88 | % | 15.33 | % | 9.35 | % | 12.21 | % | ||||||||||||||||||||
Class I Shares | 6.28 | % | 22.13 | % | 15.60 | % | 9.62 | % | 12.48 | % | ||||||||||||||||||||
Russell 3000®Index* | 3.44 | % | 13.49 | % | 14.47 | % | 10.32 | % | 13.62 | % | ||||||||||||||||||||
S&P 500®Index | 4.16 | % | 14.33 | % | 14.91 | % | 10.78 | % | 13.70 | % | ||||||||||||||||||||
| † | Not Annualized. |
| * | The Advisor believes the Standard & Poor’s 500®Index is the better comparison index for the Fund than the Russell 3000®Index. |
The Lateef Focused Growth Fund (the “Fund”) commenced operations on September 6, 2007.
The performance data quoted represents past performance and does not guarantee future results. The investment return and principal value of an investment in the Fund will fluctuate so that an investor’s shares, when redeemed, may be worth more or less than their original cost. The table does not reflect the deduction of taxes that a shareholder would pay on Fund distributions or redemption of Fund shares. Current performance may be lower or higher. Performance data current to the most recentmonth-end may be obtained by calling (866)499-2151.
The returns shown for Class A shares reflect a deduction for the maximumfront-end sales charge of 5.00%. All of the Fund’s share classes apply a 2.00% redemption fee to the value of shares redeemed within 30 days of purchase. This redemption fee is not reflected in the returns shown above. As stated in the current prospectus dated September 1, 2019, the Fund’s “Total Annual Fund Operating Expenses” are 1.69% and 1.44%, and the Fund’s “Total Annual Fund Operating Expenses After Fee Waiver and/or Reimbursement” are 1.10% and 0.85% for Class A and Class I shares, respectively, of the Fund’s average daily net assets. These rates may fluctuate and may differ from the actual expenses incurred by the Fund for the period covered by this report. Lateef Investment Management, L.P. (“the Adviser”) has contractually agreed to reduce its investment advisory fee and/or reimburse certain expenses of the Fund to the extent necessary to ensure that the Fund’s total operating expenses (excluding taxes, fees and expenses attributable to a distribution or service plan adopted by FundVantage Trust (the “Trust”), interest, extraordinary items, “Acquired Fund Fees and Expenses” and brokerage commissions) do not exceed 0.85% (on an annual basis) of the Fund’s average daily net assets (the “Expense Limitation”). The Expense Limitation shall remain in effect until August 31, 2020, unless the Board of Trustees (“Board of Trustees”) of the Trust approves its earlier termination. Total returns would be lower had such fees and/or expenses not been waived and/or reimbursed.
All mutual fund investing involves risk, including possible loss of principal. The Fund isnon-diversified, which means that a portion of the Fund’s assets may be invested in one or few companies or sectors. The Fund could fluctuate in value more than a diversified fund. The Fund may invest in undervalued securities and is subject to the risk that the securities may not appreciate in value as anticipated.
The Fund intends to evaluate performance as compared to that of the Standard & Poor’s 500® Index (“S&P 500® Index”). The S&P 500® Index is a widely recognized, unmanaged index of 500 common stocks which are generally representative of the U.S. stock market as a whole.
The Russell 3000® Index is an unmanaged index that measures the performance of the 3,000 largest U.S. stocks, representing about 98% of the total capitalization of the entire U.S. stock market. It is impossible to invest directly in an index.
1
LATEEF FOCUSED GROWTH FUND
Fund Expense Disclosure
October 31, 2019
(Unaudited)
As a shareholder of the Fund, you incur two types of costs: (1) transaction costs including sales charges (loads) on purchase payments (if any) or redemption fees; and (2) ongoing costs, including management fees, distribution and/or service (Rule12b-1) fees (if any) and other Fund expenses. These examples are intended to help you understand your ongoing costs (in dollars) of investing in the Fund and to compare these costs with the ongoing costs of investing in other mutual funds.
These examples are based on an investment of $1,000 invested at the beginning of thesix-month period from May 1, 2019 through October 31, 2019 and held for the entire period.
Actual Expenses
The first line of the accompanying table provides information about actual account values and actual expenses. You may use the information in this line, together with the amount you invested, to estimate the expenses that you paid over the period. Simply divide your account value by $1,000 (for example, an $8,600 account value divided by $1,000 = 8.6), then multiply the result by the number in the first line under the heading entitled “Expenses Paid During Period” to estimate the expenses you paid on your account during this period.
Hypothetical Examples for Comparison Purposes
The second line of the accompanying table provides information about hypothetical account values and hypothetical expenses based on the Fund’s actual expense ratio and an assumed rate of return of 5% per year before expenses, which is not your Fund’s actual return. The hypothetical account values and expenses may not be used to estimate the actual ending account balance or expenses you paid for the period. You may use this information to compare the ongoing costs of investing in the Fund and other funds. To do so, compare these 5% hypothetical examples with the 5% hypothetical examples that appear in the shareholder reports of other funds.
Please note that the expenses shown in the accompanying table are meant to highlight your ongoing costs only and do not reflect any transactional costs, such as sales charges (loads) on purchase payments (if any) or redemption fees. Therefore, each hypothetical line of the accompanying table is useful in comparing ongoing costs only and will not help you determine the relative total costs of owning different funds. In addition, if these transactional costs were included, your costs would have been higher.
2
LATEEF FOCUSED GROWTH FUND
Fund Expense Disclosure (Concluded)
October 31, 2019
(Unaudited)
| Lateef Fund | |||||||||||||||
| Beginning Account Value May 1, 2019 | Ending Account Value October 31, 2019 | Expenses Paid During Period* | |||||||||||||
Class A | |||||||||||||||
Actual | $ | 1,000.00 | $ | 1,060.80 | $ | 5.70 | |||||||||
Hypothetical (5% return before expenses) | 1,000.00 | 1,019.61 | 5.58 | ||||||||||||
Class I | |||||||||||||||
Actual | $ | 1,000.00 | $ | 1,062.80 | $ | 4.41 | |||||||||
Hypothetical (5% return before expenses) | 1,000.00 | 1,020.86 | 4.32 | ||||||||||||
| * | Expenses are equal to an annualized expense ratio for thesix-month period ended October 31, 2019 of 1.10% and 0.85% for Class A and Class I shares, respectively, for the Fund, multiplied by the average account value over the period, multiplied by the number of days in the most recent period (184), then divided by 366 to reflect the period. The Fund’s ending account values on the first line in the table are based on the actualsix-month total returns for the Fund of 6.08% and 6.28% for Class A and Class I shares, respectively. |
3
LATEEF FOCUSED GROWTH FUND
Portfolio Holdings Summary Table
October 31, 2019
(Unaudited)
The following table presents a summary by sector of the portfolio holdings of the Fund:
| % of Net Assets | Value | |||||||||
COMMON STOCKS: | ||||||||||
Technology | 27.8 | % | $ | 13,847,894 | ||||||
Industrial | 26.4 | 13,149,082 | ||||||||
Consumer,Non-cyclical | 22.9 | 11,445,776 | ||||||||
Financial | 14.4 | 7,198,301 | ||||||||
Consumer, Cyclical | 7.1 | 3,531,812 | ||||||||
Options Written | (0.1 | ) | (59,720 | ) | ||||||
Other Assets in Excess of Liabilities (excluding written options) | 1.5 | 758,614 | ||||||||
|
|
|
| |||||||
NET ASSETS | 100.0 | % | $ | 49,871,759 | ||||||
|
|
|
| |||||||
Portfolio holdings are subject to change at any time.
4
LATEEF FOCUSED GROWTH FUND
Portfolio of Investments
October 31, 2019
(Unaudited)
| Number of Shares | Value | |||||||
COMMON STOCKS — 98.6% |
| |||||||
Consumer, Cyclical — 7.1% |
| |||||||
Aptiv PLC | 19,080 | $ | 1,708,614 | |||||
Starbucks Corp. | 21,561 | 1,823,198 | ||||||
|
| |||||||
| 3,531,812 | ||||||||
|
| |||||||
Consumer,Non-cyclical — 22.9% |
| |||||||
AMERCO | 3,598 | 1,457,334 | ||||||
Anthem, Inc. | 6,175 | 1,661,569 | ||||||
Clarivate Analytics PLC* | 141,954 | 2,376,310 | ||||||
Danaher Corp. | 15,701 | 2,163,912 | ||||||
Elanco Animal Health, Inc.* | 23,746 | 641,617 | ||||||
IQVIA Holdings, Inc.* | 21,777 | 3,145,034 | ||||||
|
| |||||||
| 11,445,776 | ||||||||
|
| |||||||
Financial — 14.4% | ||||||||
Aon PLC | 5,951 | 1,149,495 | ||||||
Equinix, Inc. | 5,568 | 3,155,831 | ||||||
Progressive Corp. (The) | 25,958 | 1,809,273 | ||||||
SVB Financial Group* | 4,893 | 1,083,702 | ||||||
|
| |||||||
| 7,198,301 | ||||||||
|
| |||||||
Industrial — 26.4% | ||||||||
Arconic, Inc. | 101,238 | 2,781,008 | ||||||
Ball Corp. | 19,962 | 1,396,741 | ||||||
Hexcel Corp. | 40,632 | 3,031,960 | ||||||
Keysight Technologies, Inc.* | 18,039 | 1,820,315 | ||||||
Martin Marietta Materials, Inc. | 15,727 | 4,119,058 | ||||||
|
| |||||||
| 13,149,082 | ||||||||
|
| |||||||
Technology — 27.8% | ||||||||
Alphabet, Inc., Class A* | 2,022 | 2,545,294 | ||||||
Autodesk, Inc.* | 11,201 | 1,650,579 | ||||||
Fiserv, Inc.* | 19,428 | 2,062,088 | ||||||
Guidewire Software, Inc.* | 21,501 | 2,424,023 | ||||||
| Number of Shares | Value | |||||||
COMMON STOCKS — (Continued) |
| |||||||
Technology — (Continued) |
| |||||||
New York Times Co. (The), Class A | 82,990 | $ | 2,564,391 | |||||
Visa, Inc., Class A | 14,545 | 2,601,519 | ||||||
|
| |||||||
| 13,847,894 | ||||||||
|
| |||||||
TOTAL COMMON STOCKS |
| 49,172,865 | ||||||
|
| |||||||
TOTAL INVESTMENTS - 98.6% |
| 49,172,865 | ||||||
|
| |||||||
OTHER ASSETS IN EXCESS OF | 698,894 | |||||||
|
| |||||||
NET ASSETS - 100.0% | $ | 49,871,759 | ||||||
|
| |||||||
Contracts | ||||||||
OPTIONS WRITTEN — (0.1)% |
| |||||||
Call Options — (0.1)% | ||||||||
Hexcel Corp. Notional amount $391,000 Exchange: CME Expires 12/20/19 Strike Price $85*(a) | (46 | ) | (920 | ) | ||||
Martin Marietta Materials, Inc. Notional amount $1,040,000 Exchange: CME Expires 01/17/20 Strike Price $260*(a) | (40 | ) | �� | (58,800 | ) | |||
| (59,720 | ) | |||||||
TOTAL OPTIONS WRITTEN (Premium received $91,437) | (59,720 | ) | ||||||
The accompanying notes are an integral part of the financial statements.
5
LATEEF FOCUSED GROWTH FUND
Portfolio of Investments (Concluded)
October 31, 2019
(Unaudited)
| * | Non-income producing. |
| (a) | Primary risk exposure is equity price risk. |
CME Chicago Mercantile Exchange
PLC Public Limited Company
The accompanying notes are an integral part of the financial statements.
6
LATEEF FOCUSED GROWTH FUND
Statement of Assets and Liabilities
October 31, 2019
(Unaudited)
Assets | |||||
Investments, at value (Cost $33,345,414) | $ | 49,172,865 | |||
Cash | 838,633 | ||||
Receivable for capital shares sold | 856 | ||||
Dividends and interest receivable | 9,526 | ||||
Prepaid expenses and other assets | 40,645 | ||||
|
| ||||
Total assets | 50,062,525 | ||||
|
| ||||
Liabilities | |||||
Options written, at value (premiums received $91,437)* | 59,720 | ||||
Payable for capital shares redeemed | 61,634 | ||||
Payable for administration and accounting fees | 17,363 | ||||
Payable for audit fees | 13,292 | ||||
Payable for transfer agent fees | 11,621 | ||||
Payable for legal fees | 10,721 | ||||
Payable for custodian fees | 7,935 | ||||
Payable for distribution fees | 5,668 | ||||
Payable for printing fees | 1,301 | ||||
Payable to Investment Adviser | 490 | ||||
Payable for Trustees and Officers | 92 | ||||
Accrued expenses | 929 | ||||
|
| ||||
Total liabilities | 190,766 | ||||
|
| ||||
Net Assets | $ | 49,871,759 | |||
|
| ||||
Net Assets consisted of: | |||||
Capital stock, $0.01 par value | $ | 59,514 | |||
Paid-in capital | 24,615,253 | ||||
Total distributable earnings | 25,196,992 | ||||
|
| ||||
Net Assets | $ | 49,871,759 | |||
|
|
Class A Shares: | |||||
Net asset value and redemption price per share ($28,116,404 / 3,429,243 shares) | $ | 8.20 | |||
|
| ||||
Maximum offering price per share (100/95 of $8.20) | $ | 8.63 | |||
|
| ||||
Class I Shares: | |||||
Net asset value, offering and redemption price per share ($21,755,355 / 2,522,189 shares) | $ | 8.63 | |||
|
| ||||
| * | Primary risk exposure is equity contracts. |
The accompanying notes are an integral part of the financial statements.
7
LATEEF FOCUSED GROWTH FUND
Statement of Operations
For the Six Months Ended October 31, 2019
(Unaudited)
Investment income | |||||
Dividends | $ | 172,319 | |||
|
| ||||
Total investment income | 172,319 | ||||
|
| ||||
Expenses | |||||
Advisory fees (Note 2) | 220,009 | ||||
Transfer agent fees (Note 2) | 62,669 | ||||
Administration and accounting fees (Note 2) | 33,309 | ||||
Distribution fees (Class C) (Note 2) | 29,276 | ||||
Distribution fees (Class A) (Note 2) | 26,286 | ||||
Registration and filing fees | 25,136 | ||||
Legal fees | 20,514 | ||||
Trustees’ and officers’ fees (Note 2) | 19,764 | ||||
Audit fees | 13,729 | ||||
Shareholder services fees | 9,759 | ||||
Custodian fees (Note 2) | 9,664 | ||||
Printing and shareholder reporting fees | 7,653 | ||||
Other expenses | 8,435 | ||||
|
| ||||
Total expenses before waivers | 486,203 | ||||
|
| ||||
Less: waivers (Note 2) | (201,958 | ) | |||
|
| ||||
Net expenses after waivers | 284,245 | ||||
|
| ||||
Net investment loss | (111,926 | ) | |||
|
| ||||
Net realized and unrealized gain/(loss) from investments: | |||||
Net realized gain from investments | 2,521,545 | ||||
Net change in unrealized appreciation/(depreciation) on investments | 596,057 | ||||
Net change in unrealized appreciation/(depreciation) on written options* | 31,717 | ||||
|
| ||||
Net realized and unrealized gain on investments | 3,149,319 | ||||
|
| ||||
Net increase in net assets resulting from operations | $ | 3,037,393 | |||
|
|
| * | Primary risk exposure is equity contracts. |
The accompanying notes are an integral part of the financial statements.
8
LATEEF FOCUSED GROWTH FUND
Statements of Changes in Net Assets
| For the Six Months Ended October 31, 2019 (Unaudited) | For the Year Ended April 30, 2019 | |||||||||
Increase/(decrease) in net assets from operations: | ||||||||||
Net investment loss | $ | (111,926 | ) | $ | (160,643 | ) | ||||
Net realized gain from investments | 2,521,545 | 9,611,109 | ||||||||
Net change in unrealized appreciation/(depreciation) on investments and written options | 627,774 | (3,876,905 | ) | |||||||
|
|
|
| |||||||
Net increase in net assets resulting from operations: | 3,037,393 | 5,573,561 | ||||||||
|
|
|
| |||||||
Less dividends and distributions to shareholders from: | ||||||||||
Total distributable earnings | ||||||||||
Class A | — | (3,422,289 | ) | |||||||
Class C | — | (2,775,002 | ) | |||||||
Class I | — | (5,884,973 | ) | |||||||
|
|
|
| |||||||
Net decrease in net assets from dividends and distributions to shareholders | — | (12,082,264 | ) | |||||||
|
|
|
| |||||||
Decrease in net assets derived from capital share transactions (Note 4) | (5,270,778 | ) | (19,034,933 | ) | ||||||
|
|
|
| |||||||
Total decrease in net assets | (2,233,385 | ) | (25,543,636 | ) | ||||||
|
|
|
| |||||||
Net assets | ||||||||||
Beginning of period | 52,105,144 | 77,648,780 | ||||||||
|
|
|
| |||||||
End of period | $ | 49,871,759 | $ | 52,105,144 | ||||||
|
|
|
| |||||||
The accompanying notes are an integral part of the financial statements.
9
LATEEF FOCUSED GROWTH FUND
Financial Highlights
Contained below is per share operating performance data for Class A shares outstanding, total investment return, ratios to average net assets and other supplemental data for the respective period. The total returns in the table represent the rate that an investor would have earned or lost on an investment in the Fund (assuming reinvestment of all dividends and distributions). This information has been derived from information provided in the financial statements and should be read in conjunction with the financial statements and the notes thereto.
| Class A Shares | ||||||||||||||||||||||||||||||
| | For the Six Months Ended (Unaudited) |
| | For the Year Ended April 30, 2019 |
| | For the Year Ended April 30, 2018 |
| | For the Year Ended April 30, 2017 |
| | For the Year Ended April 30, 2016 |
| | For the Year Ended April 30, 2015 |
| |||||||||||||
Per Share Operating Performance | ||||||||||||||||||||||||||||||
Net asset value, beginning of period | $ | 7.73 | $ | 8.60 | $ | 9.54 | $ | 10.77 | $ | 14.00 | $ | 14.20 | ||||||||||||||||||
|
|
|
|
|
|
|
|
|
|
|
| |||||||||||||||||||
Net investment income/(loss)(1) | (0.02 | ) | (0.02 | ) | (0.04 | ) | (0.04 | ) | (0.05 | ) | 0.01 | |||||||||||||||||||
Net realized and unrealized gain/(loss) on investments | 0.49 | 0.79 | 1.40 | 1.25 | (0.19 | ) | 0.91 | |||||||||||||||||||||||
|
|
|
|
|
|
|
|
|
|
|
| |||||||||||||||||||
Net increase/(decrease) in net assets resulting from operations | 0.47 | 0.77 | 1.36 | 1.21 | (0.24 | ) | 0.92 | |||||||||||||||||||||||
|
|
|
|
|
|
|
|
|
|
|
| |||||||||||||||||||
Dividends and distributions to shareholders from: | ||||||||||||||||||||||||||||||
Net investment income | — | — | — | — | (0.02 | ) | (0.01 | ) | ||||||||||||||||||||||
Net realized capital gains | — | (1.64 | ) | (2.30 | ) | (2.44 | ) | (2.97 | ) | (1.11 | ) | |||||||||||||||||||
|
|
|
|
|
|
|
|
|
|
|
| |||||||||||||||||||
Total dividends and distributions to shareholders | — | (1.64 | ) | (2.30 | ) | (2.44 | ) | (2.99 | ) | (1.12 | ) | |||||||||||||||||||
|
|
|
|
|
|
|
|
|
|
|
| |||||||||||||||||||
Redemption fees | — | — | (2) | — | (2) | — | — | (2) | — | (2) | ||||||||||||||||||||
|
|
|
|
|
|
|
|
|
|
|
| |||||||||||||||||||
Net asset value, end of period | $ | 8.20 | $ | 7.73 | $ | 8.60 | $ | 9.54 | $ | 10.77 | $ | 14.00 | ||||||||||||||||||
|
|
|
|
|
|
|
|
|
|
|
| |||||||||||||||||||
Total investment return(3) | 6.08 | % | 12.62 | % | 15.26 | % | 12.64 | % | (2.31 | )% | 6.54 | % | ||||||||||||||||||
Ratios/Supplemental Data | ||||||||||||||||||||||||||||||
Net assets, end of period (in thousands) | $ | 28,116 | $ | 17,375 | $ | 20,580 | $ | 24,460 | $ | 56,657 | $ | 86,174 | ||||||||||||||||||
Ratio of expenses to average net assets | 1.10 | %(4) | 1.10 | % | 1.14 | % | 1.24 | % | 1.24 | % | 1.24 | % | ||||||||||||||||||
Ratio of expenses to average net assets without waivers and expense reimbursements(5) | 1.88 | %(4) | 1.69 | % | 1.65 | % | 1.57 | % | 1.42 | % | 1.38 | % | ||||||||||||||||||
Ratio of net investment income/(loss) to average net assets | (0.43 | )%(4) | (0.23 | )% | (0.38 | )% | (0.35 | )% | (0.37 | )% | 0.08 | % | ||||||||||||||||||
Portfolio turnover rate | 16 | %(6) | 51 | % | 50 | % | 42 | % | 65 | % | 29 | % | ||||||||||||||||||
| (1) | The selected per share data was calculated using the average shares outstanding method for the period. |
| (2) | Amount is less than $0.005 per share. |
| (3) | Total investment return is calculated assuming a purchase of shares on the first day and a sale of shares on the last day of each period reported and includes reinvestments of dividends and distributions, if any. Total returns for periods less than one year are not annualized. Total investment return does not reflect the impact of the maximumfront-end sales load of 5.00%. If reflected, the return would be lower. |
| (4) | Annualized. |
| (5) | During the period, certain fees were waived. If such fee waivers had not occurred, the ratios would have been as indicated (See Note 2). |
| (6) | Not annualized. |
The accompanying notes are an integral part of the financial statements.
10
LATEEF FOCUSED GROWTH FUND
Financial Highlights
Contained below is per share operating performance data for Class I shares outstanding, total investment return, ratios to average net assets and other supplemental data for the respective period. The total returns in the table represent the rate that an investor would have earned or lost on an investment in the Fund (assuming reinvestment of all dividends and distributions). This information has been derived from information provided in the financial statements and should be read in conjunction with the financial statements and the notes thereto.
| Class I Shares | ||||||||||||||||||||||||||||||
| | For the Six Months Ended (Unaudited) |
| | For the Year | | | For the Year Ended April 30, 2018 | | | For the Year Ended April 30, 2017 | | | For the Year Ended April 30, 2016 | | | For the Year Ended April 30, 2015 | | |||||||||||||
Per Share Operating Performance | ||||||||||||||||||||||||||||||
Net asset value, beginning of period | $ | 8.12 | $ | 8.93 | $ | 9.80 | $ | 10.98 | $ | 14.22 | $ | 14.41 | ||||||||||||||||||
|
|
|
|
|
|
|
|
|
|
|
| |||||||||||||||||||
Net investment income/(loss)(1) | (0.01 | ) | 0.00 | (2) | (0.01 | ) | (0.01 | ) | (0.02 | ) | 0.05 | |||||||||||||||||||
Net realized and unrealized gain/(loss) on investments | 0.52 | 0.83 | 1.44 | 1.27 | (0.19 | ) | 0.92 | |||||||||||||||||||||||
|
|
|
|
|
|
|
|
|
|
|
| |||||||||||||||||||
Net increase/(decrease) in net assets resulting from operations | 0.51 | 0.83 | 1.43 | 1.26 | (0.21 | ) | 0.97 | |||||||||||||||||||||||
|
|
|
|
|
|
|
|
|
|
|
| |||||||||||||||||||
Dividends and distributions to shareholders from: | ||||||||||||||||||||||||||||||
Net investment income. | — | — | — | — | (0.06 | ) | (0.05 | ) | ||||||||||||||||||||||
Net realized capital gains | — | (1.64 | ) | (2.30 | ) | (2.44 | ) | (2.97 | ) | (1.11 | ) | |||||||||||||||||||
|
|
|
|
|
|
|
|
|
|
|
| |||||||||||||||||||
Total dividends and distributions to shareholders | — | (1.64 | ) | (2.30 | ) | (2.44 | ) | (3.03 | ) | (1.16 | ) | |||||||||||||||||||
|
|
|
|
|
|
|
|
|
|
|
| |||||||||||||||||||
Redemption fees | — | — | (2) | — | (2) | — | — | (2) | — | (2) | ||||||||||||||||||||
|
|
|
|
|
|
|
|
|
|
|
| |||||||||||||||||||
Net asset value, end of period | $ | 8.63 | $ | 8.12 | $ | 8.93 | $ | 9.80 | $ | 10.98 | $ | 14.22 | ||||||||||||||||||
|
|
|
|
|
|
|
|
|
|
|
| |||||||||||||||||||
Total investment return(3) | 6.28 | % | 12.85 | % | 15.59 | % | 12.86 | % | (2.04 | )% | 6.79 | % | ||||||||||||||||||
Ratios/Supplemental Data | ||||||||||||||||||||||||||||||
Net assets, end of period (in thousands) | $ | 21,755 | $ | 23,167 | $ | 41,982 | $ | 66,969 | $ | 358,492 | $ | 623,561 | ||||||||||||||||||
Ratio of expenses to average net assets | 0.85 | %(4) | 0.85 | % | 0.89 | % | 0.99 | % | 0.99 | % | 0.99 | % | ||||||||||||||||||
Ratio of expenses to average net assets without waivers and expense reimbursements(5) | 1.63 | %(4) | 1.44 | % | 1.41 | % | 1.28 | % | 1.16 | % | 1.14 | % | ||||||||||||||||||
Ratio of net investment income/(loss) to average net assets | (0.18 | )%(4) | 0.02 | % | (0.14 | )% | (0.09 | )% | (0.12 | )% | 0.33 | % | ||||||||||||||||||
Portfolio turnover rate | 16 | %(6) | 51 | % | 50 | % | 42 | % | 65 | % | 29 | % | ||||||||||||||||||
| (1) | The selected per share data was calculated using the average shares outstanding method for the period. |
| (2) | Amount is less than $0.005 per share. |
| (3) | Total investment return is calculated assuming a purchase of shares on the first day and a sale of shares on the last day of each period reported and includes reinvestment of dividends and distributions, if any. Total returns for periods less than one year are not annualized. |
| (4) | Annualized. |
| (5) | During the period, certain fees were waived. If such fee waivers had not occurred, the ratios would have been as indicated (See Note 2). |
| (6) | Not annualized. |
The accompanying notes are an integral part of the financial statements.
11
LATEEF FOCUSED GROWTH FUND
Notes to Financial Statements
October 31, 2019
(Unaudited)
1. Organization and Significant Accounting Policies
The Lateef Focused Growth Fund (the “Fund”) is anon-diversified,open-end management investment company registered under the Investment Company Act of 1940, as amended (the “1940 Act”), which commenced investment operations on September 6, 2007. The Fund is a separate series of FundVantage Trust (the “Trust”) which was organized as a Delaware statutory trust on August 28, 2006. The Trust is a “series trust” authorized to issue an unlimited number of separate series or classes of shares of beneficial interest. Each series is treated as a separate entity for certain matters under the 1940 Act, and for other purposes, and a shareholder of one series is not deemed to be a shareholder of any other series. The Fund offers separate classes of shares, Class A and Class I shares. Class A shares are sold subject to afront-end sales charge.Front-end sales charges may be reduced or waived under certain circumstances. A contingent deferred sales charge (“CDSC”) may be applicable to the purchase of Class A shares. A CDSC, as a percentage of the lower of the original purchase price or net asset value at redemption, of up to 1.00% may be imposed on full or partial redemptions of Class A shares made within eighteen months of purchase where: (i) $1 million or more of Class A shares were purchased without an initial sales charge and (ii) the selling broker-dealer received a commission for such sale. Effective August 30, 2019, Class C Shares were converted to Class A Shares, and Class C Shares were concurrently terminated.
The Fund is an investment company and follows accounting and reporting guidance in the Financial Accounting Standards Board Accounting Standards Codification Topic 946.
Portfolio Valuation— The Fund’s net asset value (“NAV”) is calculated once daily at the close of regular trading hours on the New York Stock Exchange (“NYSE”) (typically 4:00 p.m. Eastern time) on each day the NYSE is open. Securities held by the Fund are valued using the closing price or the last sale price on a national securities exchange or the National Association of Securities Dealers Automatic Quotation System (“NASDAQ”) market system where they are primarily traded. Equity securities traded in theover-the-counter market are valued at their closing prices. If there were no transactions on that day, securities traded principally on an exchange or on NASDAQ will be valued at the mean of the last bid and ask prices prior to the market close. Fixed income securities having a remaining maturity of greater than 60 days are valued using an independent pricing service. Fixed income securities having a remaining maturity of 60 days or less are generally valued at amortized cost, provided such amount approximates fair value. Foreign securities are valued based on prices from the primary market in which they are traded and are translated from the local currency into U.S. dollars using current exchange rates. Investments in otheropen-end investment companies are valued based on the NAV of the investment companies (which may use fair value pricing as discussed in their prospectuses). If market quotations are unavailable or deemed unreliable, securities will be valued in accordance with procedures adopted by the Trust’s Board of Trustees (“Board of Trustees”). Options are valued at last sale price. Relying on prices supplied by pricing services or dealers or using fair valuation may result in values that are higher or lower than the values used by other investment companies and investors to price the same investments. In the event
12
LATEEF FOCUSED GROWTH FUND
Notes to Financial Statements (Continued)
October 31, 2019
(Unaudited)
that market quotes are not readily available, and the security or asset cannot be valued pursuant to one of the valuation methods, the value of the security or asset will be determined in good faith by the Adviser. The Trust has established a Valuation Committee which performs certain functions including the oversight of the Adviser’s fair valuation determinations.
Fair Value Measurements— The inputs and valuation techniques used to measure fair value of the Fund’s investments are summarized into three levels as described in the hierarchy below:
· Level 1 — | quoted prices in active markets for identical securities; | |
· Level 2 — | other significant observable inputs (including quoted prices for similar securities, interest rates, prepayment speeds, credit risk, etc.); and | |
· Level 3 — | significant unobservable inputs (including the Fund’s own assumptions in determining the fair value of investments). | |
The inputs or methodology used for valuing securities are not necessarily an indication of the risk associated with investing in those securities.
The following is a summary of the inputs used, as of October 31, 2019, in valuing the Fund’s investments carried at fair value:
| Total Value at 10/31/19 | Level 1 Quoted Price | Level 2 Other Significant Observable Inputs | Level 3 Significant Unobservable Inputs | |||||||||||||
Assets: | ||||||||||||||||
Investments in Securities* | $ | 49,172,865 | $ | 49,172,865 | $ | — | $ | — | ||||||||
|
|
|
|
|
|
|
| |||||||||
Liabilities: | ||||||||||||||||
Written Option on Equity Contracts | $ | (59,720 | ) | $ | (59,720 | ) | $ | — | $ | — | ||||||
|
|
|
|
|
|
|
| |||||||||
| * | Please refer to Portfolio of Investments for further details on portfolio holdings. |
At the end of each quarter, management evaluates the classification of Levels 1, 2 and 3 assets and liabilities. Various factors are considered, such as changes in liquidity from the prior reporting period; whether or not a broker is willing to execute at the quoted price; the depth and consistency of prices from third party pricing services; and the existence of contemporaneous, observable trades in the market. Additionally, management evaluates the classification of Level 1 and Level 2 assets and liabilities on a quarterly basis for changes in listings or delistings on national exchanges.
13
LATEEF FOCUSED GROWTH FUND
Notes to Financial Statements (Continued)
October 31, 2019
(Unaudited)
Due to the inherent uncertainty of determining the fair value of investments that do not have a readily available market value, the fair value of the Fund’s investments may fluctuate from period to period. Additionally, the fair value of investments may differ significantly from the values that would have been used had a ready market existed for such investments and may differ materially from the values the Fund may ultimately realize. Further, such investments may be subject to legal and other restrictions on resale or are otherwise less liquid than publicly traded securities.
For fair valuations using significant unobservable inputs, U.S. generally accepted accounting principles (“U.S. GAAP”) require the Fund to present a reconciliation of the beginning to ending balances for reported market values that present changes attributable to total realized and unrealized gains or losses, purchase and sales, and transfers in and out of Level 3 during the period. A reconciliation of Level 3 investments is presented only when the Fund had an amount of Level 3 investments at the end of the reporting period that was meaningful in relation to its net assets. The amounts and reasons for all transfers in and out of each Level within the three-tier hierarchy are disclosed when the Fund had an amount of total transfers during the reporting period that was meaningful in relation to its net assets as of the end of the reporting period.
For the six months ended October 31, 2019, there were no transfers in or out of Level 3.
Use of Estimates— The preparation of financial statements in conformity with U.S. GAAP requires management to make estimates and assumptions that affect the amounts reported in the financial statements and accompanying notes at the date of the financial statements and the reported amounts of revenues and expenses during the period. Actual results could differ from those estimates and those differences could be material.
Investment Transactions, Investment Income and Expenses— Investment transactions are recorded on trade date for financial statement preparation purposes. Realized gains and losses on investments sold are recorded on the identified cost basis. Interest income is recorded on the accrual basis. Dividends are recorded on theex-dividend date. Distribution(12b-1) fees and shareholder services fees relating to a specific class are charged directly to that class. Fund level expenses common to all classes, investment income and realized and unrealized gains and losses on investments are allocated to each class based upon the relative daily net assets of each class. General expenses of the Trust are generally allocated to each fund in proportion to its relative daily net assets. Expenses directly attributable to a particular fund in the Trust are charged directly to that fund.
Cash and Cash Equivalent— Cash and cash equivalents include cash and overnight investments in interest-bearing demand deposits with a financial institution with original maturities of three months or less. The Fund maintains deposits with a high quality financial institution in an amount that is in excess of federally insured limits.
14
LATEEF FOCUSED GROWTH FUND
Notes to Financial Statements (Continued)
October 31, 2019
(Unaudited)
Dividends and Distributions to Shareholders— Dividends from net investment income and distributions from net realized capital gains, if any, are declared, recorded onex-date and paid at least annually to shareholders. Income dividends and capital gain distributions are determined in accordance with U.S. federal income tax regulations, which may differ from U.S. GAAP.
U.S. Tax Status— No provision is made for U.S. income taxes as it is the Fund’s intention to continue to qualify for and elect the tax treatment applicable to regulated investment companies under Subchapter M of the Internal Revenue Code of 1986, as amended (the “Internal Revenue Code”), and make the requisite distributions to its shareholders which will be sufficient to relieve it from U.S. income and excise taxes.
Other— In the normal course of business, the Fund may enter into contracts that provide general indemnifications. The Fund’s maximum exposure under these arrangements is dependent on claims that may be made against the Fund in the future, and therefore, cannot be estimated; however, based on experience, the risk of material loss for such claims is considered remote.
Currency Risk— The Fund invests in securities of foreign issuers, including American Depositary Receipts. These markets are subject to special risks associated with foreign investments not typically associated with investing in U.S. markets. Because the foreign securities in which the Fund may invest generally trade in currencies other than the U.S. dollar, changes in currency exchange rates will affect the Fund’s NAV, the value of dividends and interest earned and gains and losses realized on the sale of securities. Because the NAV for the Fund is determined on the basis of U.S. dollars, the Fund may lose money by investing in a foreign security if the local currency of a foreign market depreciates against the U.S. dollar, even if the local currency value of the Fund’s holdings goes up. Generally, a strong U.S. dollar relative to these other currencies will adversely affect the value of the Fund’s holdings in foreign securities.
Written Options— The Fund is subject to equity and other risk exposure in the normal course of pursuing its investment objectives and may enter into options written to hedge against changes in interest rates, foreign exchange rates and values of equities. Such options may relate to particular securities or domestic stock indices, and may or may not be listed on a domestic securities exchange or issued by the Options Clearing Corporation. An option contract is a commitment that gives the purchaser of the contract the right, but not the obligation, to buy or sell an underlying asset at a specific price on or before a specified future date. On the other hand, the writer of an option contract is obligated, upon the exercise of the option, to buy or sell an underlying asset at a specific price on or before a specified future date. The maximum risk of loss associated with writing put options is limited to the exercised fair value of the option contract. The maximum risk of loss associated with writing call options is potentially unlimited. The Fund also has the additional risk of being unable to enter into a closing transaction at an acceptable price if a liquid secondary market does not exist. The Fund also may writeover-the-counter options where completing the obligation depends upon the credit standing of the other party. Option contracts also involve
15
LATEEF FOCUSED GROWTH FUND
Notes to Financial Statements (Continued)
October 31, 2019
(Unaudited)
the risk that they may result in loss due to unanticipated developments in market conditions or other causes. Written options are initially recorded as liabilities to the extent of premiums received and subsequently marked to market to reflect the current value of the option written. Gains or losses are realized when the option transaction expires or closes. When an option is exercised, the proceeds on sales for a written call option or the purchase cost for a written put option is adjusted by the amount of the premium received. Listed option contracts present minimal counterparty credit risk since they are exchange traded and the exchange’s clearinghouse, as counterparty to all exchange-traded options, guarantees the options against default. The Fund’s maximum risk of loss from counterparty credit risk related to OTC option contracts is limited to the premium paid. During the six months ended October 31, 2019, the Fund entered into 86 written options contracts, all of which were exchange-traded options.
For the six months ended October 31, 2019, the Fund’s quarterly average volume of derivatives is as follows:
Written Options Proceeds | ||||
| $30,479 |
Recent Regulatory Reporting Update and Accounting Pronouncement— In August 2018, the Financial Accounting Standards Board issued an Accounting Standards Update, ASU2018-13,Fair Value Measurement (Topic 820), Disclosure Framework – Changes to the Disclosure Requirements for Fair Value Measurement(the “2018 ASU”) which adds, modifies and removes disclosure requirements related to certain aspects of fair value measurement. The 2018 ASU is effective for fiscal years, and interim periods within those fiscal years, beginning after December 15, 2019. Early adoption is permitted. As of October 31, 2019, the Fund has fully adopted the provisions of the 2018 ASU, which did not have a material impact on the Fund’s financial statements and related disclosures or impact the Fund’s net assets or results of operations.
2. Transactions with Related Parties and Other Service Providers
Lateef Investment Management, L.P. (“Lateef” or the “Adviser”) serves as investment adviser to the Fund pursuant to an investment advisory agreement with the Trust. For its services, the Advisor is entitled to receive an annual investment advisory fee, paid monthly, comprising 0.85% of the average daily net assets of the Fund. The Adviser has contractually agreed to reduce its investment advisory fee and/or reimburse certain expenses of the Fund to the extent necessary to ensure that the Fund’s total operating expenses (excluding taxes, fees and expenses attributable to a distribution or service plan adopted by the Trust, interest, extraordinary items, “Acquired Fund Fees and Expenses ” and brokerage commissions) do not exceed 0.85% (on an annual basis) of the Fund’s average daily net assets (the “Expense Limitation”). The Expense Limitation shall remain in effect until August 31, 2020, unless the Board of Trustees of the
16
LATEEF FOCUSED GROWTH FUND
Notes to Financial Statements (Continued)
October 31, 2019
(Unaudited)
Trust approves its earlier termination. Each class of shares of the Fund pays its respectivepro-rata portion of the advisory fee payable by the Fund.
For the six months ended October 31, 2019, the Adviser earned advisory fees of $220,009 and waived fees of $201,958.
Other Service Providers
The Bank of New York Mellon (“BNY Mellon”) serves as administrator and custodian for the Fund. For providing administrative and accounting services, BNY Mellon is entitled to receive a monthly fee equal to an annual percentage rate of the Fund’s average daily net assets and is subject to certain minimum monthly fees. For providing certain custodial services, BNY Mellon is entitled to receive a monthly fee, subject to certain minimum, and out of pocket expenses.
BNY Mellon Investment Servicing (US) Inc. (the “Transfer Agent”) provides transfer agent services to the Fund. The Transfer Agent is entitled to receive a monthly fee, subject to certain minimum, and out of pocket expenses.
The Trust, on behalf of the Fund, has entered into agreements with financial intermediaries to provide recordkeeping, processing, shareholder communications and other services to customers of the intermediaries investing in the Fund and have agreed to compensate the intermediaries for providing those services. The fees incurred by the Fund for these services are included in Transfer agent fees in the Statement of Operations.
Foreside Funds Distributors LLC (the “Underwriter”) provides principal underwriting services to the Fund pursuant to an underwriting agreement between the Trust and the Underwriter.
The Trust and the Underwriter are parties to an underwriting agreement. The Trust has adopted a distribution plan for Class A and Class C Shares in accordance with Rule12b-1 under the 1940 Act. Pursuant to the Class A and Class C Shares plan, the Fund compensates the Underwriter for direct and indirect costs and expenses incurred in connection with advertising, marketing and other distribution services in an amount not to exceed 0.25% and 1.00% (0.75% Rule12b-1 distribution fee and 0.25% shareholder service fee), respectively, on an annualized basis of the average daily net assets of the Fund’s Class A and Class C Shares.
Trustees and Officers
The Trust is governed by its Board of Trustees. The Trustees receive compensation in the form of an annual retainer and per meeting fees for their services to the Trust. The remuneration paid to the
17
LATEEF FOCUSED GROWTH FUND
Notes to Financial Statements (Continued)
October 31, 2019
(Unaudited)
Trustees by the Fund during the six months ended October 31, 2019 was $3,752. An employee of BNY Mellon serves as the Secretary of the Trust and is not compensated by the Fund or the Trust.
JW Fund Management LLC (“JWFM”) provides a Principal Executive Officer and Principal Financial Officer, respectively, to the Trust. Duff & Phelps, LLC (“D&P”) provides the Trust with a Chief Compliance Officer and an Anti-Money Laundering Officer. JWFM and D&P are compensated for their services provided to the Trust.
3. Investment in Securities
For the six months ended October 31, 2019, aggregate purchases and sales of investment securities (excluding short-term investments) of the Fund were as follows:
| Purchases | Sales | |||||||
Investment Securities | $ | 7,983,061 | $ | 13,707,472 | ||||
4. Capital Share Transactions
For the six months ended October 31, 2019 and year ended April 30, 2019, transactions in capital shares (authorized shares unlimited) were as follows:
| For the Six months Ended October 31, 2019 (Unaudited) | For the Year Ended April 30, 2019 | |||||||||||||||
| Shares | Amount | Shares | Amount | |||||||||||||
Class A* | ||||||||||||||||
Sales | 61,675 | $ | 498,117 | 191,257 | $ | 1,383,540 | ||||||||||
Reinvestments | — | — | 482,695 | 3,127,861 | ||||||||||||
Redemption Fees** | — | — | — | 7 | ||||||||||||
Redemptions | (316,181 | ) | (2,555,580 | ) | (820,032 | ) | (6,208,686 | ) | ||||||||
Converted from Class C Shares | 1,436,082 | 11,804,592 | — | — | ||||||||||||
|
|
|
|
|
|
|
| |||||||||
Net increase/(decrease) | 1,181,576 | $ | 9,747,129 | (146,080 | ) | $ | (1,697,278 | ) | ||||||||
|
|
|
|
|
|
|
| |||||||||
18
LATEEF FOCUSED GROWTH FUND
Notes to Financial Statements (Continued)
October 31, 2019
(Unaudited)
| For the Six months Ended October 31, 2019 (Unaudited) | For the Year Ended April 30, 2019 | |||||||||||||||
| Shares | Amount | Shares | Amount | |||||||||||||
Class C* | ||||||||||||||||
Sales | — | $ | — | 121,882 | $ | 636,092 | ||||||||||
Reinvestments | — | — | 403,047 | 2,079,723 | ||||||||||||
Redemption Fees** | — | — | — | 5 | ||||||||||||
Redemptions | (70,155 | ) | (453,330 | ) | (727,258 | ) | (4,731,618 | ) | ||||||||
Converted to Class A Shares | (1,813,636 | ) | (11,804,592 | ) | — | — | ||||||||||
|
|
|
|
|
|
|
| |||||||||
Net decrease | (1,883,791 | ) | $ | (12,257,922 | ) | (202,329 | ) | $ | (2,015,798 | ) | ||||||
|
|
|
|
|
|
|
| |||||||||
Class I | ||||||||||||||||
Sales | 149,169 | $ | 1,267,217 | 274,897 | $ | 2,164,802 | ||||||||||
Reinvestments | — | — | 798,399 | 5,429,111 | ||||||||||||
Redemption Fees** | — | — | — | 11 | ||||||||||||
Redemptions | (478,831 | ) | (4,027,202 | ) | (2,924,137 | ) | (22,915,781 | ) | ||||||||
|
|
|
|
|
|
|
| |||||||||
Net decrease | (329,662 | ) | $ | (2,759,985 | ) | (1,850,841 | ) | $ | (15,321,857 | ) | ||||||
|
|
|
|
|
|
|
| |||||||||
Total Net decrease | (1,031,877 | ) | $ | (5,270,778 | ) | (2,199,250 | ) | $ | (19,034,933 | ) | ||||||
|
|
|
|
|
|
|
| |||||||||
| * | Class C Shares were converted to Class A Shares on August 30, 2019. |
| ** | There is a 2.00% redemption fee that may be charged on shares redeemed which have been held 30 days or less. The redemption fees are retained by the Fund for the benefit of the remaining shareholders and recorded aspaid-in capital. |
5. Federal Tax Information
The Fund has followed the authoritative guidance on accounting for and disclosure of uncertainty in tax positions, which requires the Fund to determine whether a tax position is more likely than not to be sustained upon examination, including resolution of any related appeals or litigation processes, based on the technical merits of the position. The Fund has determined that there was no effect on the financial statements from following this authoritative guidance. In the normal course of business, the Fund is subject to examination by federal, state and local jurisdictions, where applicable, for tax years for which applicable statutes of limitations have not expired.
For the year ended April 30, 2019, the tax character of distributions paid by the Fund was $12,082,264 of long-term capital gains dividends.
19
LATEEF FOCUSED GROWTH FUND
Notes to Financial Statements (Concluded)
October 31, 2019
(Unaudited)
As of April 30, 2019, the components of distributable earnings on a tax basis were as follows:
Undistributed | Net Unrealized | Total | |||||||||||
| $6,928,205 | $15,231,394 | $22,159,599 | |||||||||||
The differences between the book and tax basis components of distributable earnings relate primarily to the timing and recognition of income and gains for federal income tax purposes. Short term capital gains are reported as ordinary income for federal income tax purposes.
As of October 31, 2019, the federal tax cost, aggregate gross unrealized appreciation and depreciation of securities held by the Fund were as follows:
| Federal tax cost* | $ | 33,345,414 | ||||
|
| |||||
| Gross unrealized appreciation | $ | 15,952,777 | ||||
| Gross unrealized depreciation | (125,326 | ) | ||||
|
| |||||
| Net unrealized appreciation | $ | 15,827,451 | ||||
|
|
| * | Because tax adjustments are calculated annually at the end of the Fund’s fiscal year, the above table does not reflect tax adjustments for the current fiscal year. For the previous year’s federal income tax information, please refer to the Notes to Financial Statements section in the Fund’s most recent annual report. |
Pursuant to federal income tax rules applicable to regulated investment companies, the Fund may elect to treat certain capital losses between November 1 and April 30, 2019 and late year ordinary losses ((i) ordinary losses between January 1 and April 30, 2019, and (ii) specified ordinary and currency losses between November 1 and April 30, 2019 as occurring on the first day of the following tax year. For the year ended April 30, 2019 any amount of losses elected within the tax return will not be recognized for federal income tax purposes until May 1, 2019. For the year ended April 30, 2019, the Fund had no short-term capital loss deferrals, long-term capital loss deferrals and ordinary late year loss deferrals.
Accumulated capital losses represent net capital loss carry forwards as of April 30, 2019 that may be available to offset future realized capital gains and thereby reduce future capital gains distributions. As of April 30, 2019, the Fund did not have any capital loss carry forwards.
6. Subsequent Events
Management has evaluated the impact of all subsequent events on the Fund through the date the financial statements were issued, and has determined that there are no material subsequent events requiring recognition or disclosure in the financial statements.
20
LATEEF FOCUSED GROWTH FUND
Other Information
(Unaudited)
Proxy Voting
Policies and procedures that the Fund uses to determine how to vote proxies relating to portfolio securities as well as information regarding how the Fund voted proxies relating to portfolio securities for the most recent12-month period ended June 30 are available without charge, upon request, by calling (866)499-2151 and on the Securities and Exchange Commission’s (“SEC”) website athttp://www.sec.gov.
Quarterly Portfolio Schedules
The Trust files its complete schedule of portfolio holdings with the SEC for the first and third fiscal quarters of each fiscal year (quarters ended July 31 and January 31) on FormN-Q. The Trust’s FormsN-Q will be available on the SEC’s website athttp://www.sec.gov. FormN-Q is being rescinded. Once FormN-Q is rescinded, disclosure of the Fund’s complete holdings will be required to be made monthly on FormN-PORT, with every third month made available to the public by the Commission upon filing.
Board Consideration of Investment Advisory Agreement with Lateef Investment Management, L.P.
At anin-person meeting held on June24-25, 2019 (the “Meeting”), the Board of Trustees (the “Board” or the “Trustees”) of FundVantage Trust (the “Trust”), including a majority of the Trustees who are not “interested persons” within the meaning of Section 2(a)(19) of the Investment Company Act of 1940, as amended (the “1940 Act”) (the “Independent Trustees”), unanimously approved the continuation of the Investment Advisory Agreement between Lateef Investment Management, L.P. (“Lateef” or the “Adviser”) and the Trust (the “Lateef Agreement”) on behalf of the Lateef Focused Growth Fund (the “Fund”). At the Meeting, the Board considered the continuation of the Lateef Agreement for an additional one year period.
In determining whether to approve the Lateef Agreement, the Trustees considered information provided by Lateef in accordance with Section 15(c) of the 1940 Act. The Trustees considered information that Lateef provided regarding (i) the services performed for the Fund, (ii) the size and qualifications of Lateef’s portfolio management staff, (iii) any potential or actual material conflicts of interest which may arise in connection with a portfolio manager’s management of the Fund, (iv) investment performance, (v) the capitalization and financial condition of Lateef, (vi) investment performance information, (vii) brokerage selection procedures (including soft dollar arrangements, if any), (viii) the procedures for allocating investment opportunities between the Fund and other clients, (ix) results of any independent audit or regulatory examination, including any recommendations or deficiencies noted, (x) any litigation, investigation or administrative proceeding which may have a material impact on Lateef’s ability to service the Fund, and (xi) compliance with the Fund’s investment objective, policies and practices (including codes of ethics
21
LATEEF FOCUSED GROWTH FUND
Other Information (Continued)
(Unaudited)
and proxy voting policies), federal securities laws and other regulatory requirements. The Trustees noted the reports provided at Board meetings throughout the year covering matters such as the relative performance of the Fund; compliance with the investment objective, policies, strategies and limitations for the Fund; the compliance of management personnel with the applicable code of ethics; and the adherence to pricing procedures as established by the Board.
The Board noted that representatives from Lateef joined the meetingin-person and discussed Lateef’s history, performance, investment strategy, and compliance program. Representatives of Lateef responded to questions from the Board.
Performance.The Trustees considered the investment performance for the Fund. The Trustees reviewed historical performance charts prepared by a third-party, which showed the performance of the Fund as compared to the LipperMulti-Cap Growth Index and the S&P 500 Total Return Index for theyear-to-date, one year, two year, three year, five year, ten year and since inception periods ended March 31, 2019. The Trustees noted that the Class I shares of the Fund outperformed the LipperMulti-Cap Growth Index for theyear-to-date period ended March 31, 2019 and underperformed the LipperMulti-Cap Growth Index for the one year, two year, three year, five year, ten year and since inception periods ended March 31, 2019. The Trustees noted that the Class I shares of the Fund outperformed the S&P 500 Total Return Index for theyear-to-date and two year periods ended March 31, 2019 and underperformed the S&P 500 Total Return Index for the one year, three year, five year, ten year and since inception periods ended March 31, 2019.
The Trustees considered explanations provided by Lateef regarding the various factors contributing to the relative underperformance of the Fund during certain periods, including, among other things, differences in the Fund’s investment strategy and portfolio construction in comparison to the S&P 500 Total Return Index. The Trustees considered other factors that supported the continuation of the Lateef Agreement, including that Lateef’s investment decisions, such as security selection and sector allocation, contributing to such underperformance were consistent with the Fund’s investment objective and policies. Taking note of Lateef’s discussion of (i) the various factors contributing to the Fund’s performance and (ii) its continuing commitment to the Fund’s current investment strategy, the Trustees concluded that, although the Fund had underperformed the S&P 500 Total Return Index for certain periods, the performance of the Fund was within an acceptable range of performance relative to other mutual funds with similar investment objectives, strategies and policies based on the information provided at the Meeting.
Knowledge, experience, and qualifications.The Trustees considered Lateef’s personnel and the depth of Lateef’s personnel who possess the experience to provide investment management services to the Fund. Based on the information provided by Lateef, the Trustees concluded that (i) the nature, extent and quality of the services provided by Lateef are appropriate and consistent with the terms of the Lateef Agreement, (ii) that the quality of those services has been consistent with industry norms, (iii) the Fund is likely to benefit from the continued provision of those services, (iv) Lateef has sufficient
22
LATEEF FOCUSED GROWTH FUND
Other Information (Continued)
(Unaudited)
personnel, with the appropriate education and experience, to serve the Fund effectively and has demonstrated its continuing ability to attract and retain qualified personnel, and (v) the satisfactory nature, extent, and quality of services currently provided to the Fund and its shareholders is likely to continue under the Lateef Agreement.
Fees. The Trustees noted that the representatives of Lateef had provided information regarding its advisory fees and an analysis of the fees in relation to services provided to the Fund and any other ancillary benefit resulting from Lateef’s relationship with the Fund. The Trustees reviewed a peer comparison of advisory fees and total expenses for the Fund versus the universe of funds with similar share classes in the Lipper Multi Cap Growth Funds category with $250 million or less in assets. The Trustees noted that the contractual advisory fee of the Fund’s Class I shares was higher than the median of the contractual advisory fee of the universe of funds with a similar share class in the LipperMulti-Cap Growth Funds category with $250 million or less in assets. They further noted that the net total expense ratio and net advisory fee of the Fund’s Class I shares were each lower than the median of net total expense ratio and net advisory fee of the universe of funds with a similar share class in the LipperMulti-Cap Growth Funds category with $250 million or less in assets. The Trustees concluded that the advisory fees and services provided by Lateef are consistent with those of other advisers which manage mutual funds with investment objectives, strategies and policies similar to those of the Fund based on the information provided at the Meeting.
Costs. The Trustees considered the costs of the services provided by Lateef, the compensation and benefits received by Lateef in providing services to the Fund, and its profitability. The Trustees were provided with the Lateef’s audited balance sheet and statement of operations for the fiscal year ended December 31, 2018. In addition, the Trustees considered any direct or indirect revenues received by affiliates of Lateef. The Trustees noted that the level of profitability of Lateef in providing services to the Fund is an appropriate factor to consider, and the Trustees should be satisfied that Lateef’s profits are sufficient to continue as a healthy concern generally and an investment adviser of the Fund specifically. Based on the information provided, the Trustees concluded that Lateef’s fees and profits (if any) derived from its relationship with the Trust in light of the Fund’s expenses are reasonable in relation to the nature and quality of the services provided, taking into account the fees charged by other advisers for managing comparable mutual funds with similar strategies. The Trustees also concluded that the overall expense ratio of the Fund is reasonable, taking into account the size of the Fund, the quality of services provided by the adviser, the investment performance of the Fund and the expense limitation agreed to by Lateef.
Economies of Scale. The Trustees considered the extent to which economies of scale would be realized relative to fee levels as the Fund grows, and whether the advisory fee levels reflect these economies of scale for the benefit of shareholders. The Trustees considered and determined that economies of scale for the benefit of Fund shareholders should be achieved if assets of the Fund increase because fixed expenses will be spread across a larger asset base; however, the Trustees noted that the advisory
23
LATEEF FOCUSED GROWTH FUND
Other Information (Continued)
(Unaudited)
fee does not include “breakpoint” reductions in the advisory fee rate at specific asset levels, but that shareholders do benefit from the Fund’s contractual expense limitation agreement.
At the Meeting, the Trustees unanimously approved the continuation of the Lateef Agreement for an additional one year period. In approving the continuation of the Lateef Agreement, the Board considered all factors it deemed relevant and the information presented to the Board by Lateef. In arriving at its decision, the Board did not identify any single factor as being of paramount importance and each member of the Board gave varying weights to each factor according to his or her own judgment. The Board determined that the continuation of the Lateef Agreement for an additional one year period would be in the best interests of the Fund and its shareholders.
24
[THIS PAGE INTENTIONALLY LEFT BLANK.]
[THIS PAGE INTENTIONALLY LEFT BLANK.]
[THIS PAGE INTENTIONALLY LEFT BLANK.]
Investment Adviser
Lateef Investment Management, L.P.
1000 Fourth Street
Suite 800
San Rafael, CA 94901
Administrator
The Bank of New York Mellon
301 Bellevue Parkway
Wilmington, DE 19809
Transfer Agent
BNY Mellon Investment Servicing (US) Inc.
4400 Computer Drive
Westborough, MA 01581
Principal Underwriter
Foreside Funds Distributors LLC
400 Berwyn Park
899 Cassatt Road
Berwyn, PA 19312
Custodian
The Bank of New York Mellon
240 Greenwich Street
New York, NY 10286
Independent Registered Public Accounting Firm
PricewaterhouseCoopers LLP
Two Commerce Square, Suite 1800
2001 Market Street
Philadelphia, PA 19103-7042
Legal Counsel
Pepper Hamilton LLP
3000 Two Logan Square
18th and Arch Streets
Philadelphia, PA 19103
LAT-1019
LATEEF FOCUSED GROWTH FUND
of
FundVantage Trust
Class A Shares
Class I Shares
SEMI-ANNUAL REPORT
October 31, 2019
(Unaudited)
IMPORTANT NOTE: Beginning on January 1, 2021, paper copies of the Lateef Focused Growth Fund’s annual and semi-annual shareholder reports will no longer be sent by mail, unless you specifically request paper copies of the shareholder reports from the Lateef Focused Growth Fund or from your financial intermediary. Instead, annual and semi-annual shareholder reports will be available on the Lateef Focused Growth Fund’s website (www.lateef.com/lateef-focused-growth-fund), and you will be notified by mail each time a report is posted and provided with a website link to access the report.
You may elect to receive all future annual and semi-annual shareholder reports in paper, free of charge. To elect to receive paper copies of shareholder reports through the mail or otherwise change your delivery method, contact your financial intermediary or, if you hold your shares directly through the Lateef Focused Growth Fund, call the Lateef Focused Growth Fund toll-free at (866)499-2151 or write to the Lateef Focused Growth Fund at:
Lateef Focused Growth Fund
FundVantage Trust
c/o BNY Mellon Investment Servicing
P.O. Box 9829
Providence, RI 02940-8029
This report is submitted for the general information of the shareholders of the Lateef Fund. It is not authorized for distribution unless preceded or accompanied by a current prospectus for the Lateef Fund.
PACIFIC CAPITAL FUNDS
Pacific CapitalTax-Free Securities Fund
Semi-Annual Report
Performance Data
October 31, 2019 (Unaudited)
Credit Quality as of October 31, 2019 (as a percentage of total investments)
Credit quality ratings are primarily sourced from Moody’s but in the event that Moody’s has not assigned a rating, the Fund will use S&P or Fitch. If these ratings are in conflict, S&P will be used before Fitch. If none of the major rating agencies have assigned a rating, the Fund will assign a rating of NR(non-rated security). The ratings represent their (Moody’s, S&P, and Fitch) opinions as to the quality of the underlying securities in the Fund, and not the Fund itself. The ratings range from AAA (extremely strong capacity to meet financial commitment) to D (in default). Ratings are relative and subjective and are not absolute standards of quality. Apre-refunded bond is secured by an escrow fund of U.S. government obligations (i.e. Treasury securities) and assumes the superior credit rating of the government obligation. The ratings do not predict performance and are subject to change. |
Investment Style
High-quality, intermediate-term,tax-exempt
Investment Objective
The Pacific CapitalTax-Free Securities Fund (the “Fund”) seeks high current income that is exempt from federal and Hawaii income tax by normally investing at least 80% of its net assets in investment grade municipal obligations. The Fund normally invests greater than 50% of its assets in Hawaii municipal obligations — debt securities issued by or on behalf of the State of Hawaii and its political subdivisions, agencies and instrumentalities that pay interest which is exempt from Hawaii income tax as well as federal income tax.
Investment Considerations
Income received from the Fund may be subject to certain state and local taxes and, depending on one’s tax status, to the federal alternative minimum tax. Bonds offer a relatively stable level of income, although bond prices will fluctuate, providing the potential for principal gain or loss. Generally, bond prices and values fall when interest rates rise, and vice versa. The longer the average maturity of the Fund’s portfolio, the greater the fluctuation in value. Since the Fund invests significantly in securities of issuers in Hawaii, it will also be affected by a variety of Hawaii’s economic and political factors. The values of any of the Fund’s investments may also decline in response to events affecting the issuer or its credit rating.
Investment Process
· Top-down macroeconomic analysis of interest rate trends
· Bottom-up credit research to identify high quality bonds
Investment Management
Advised by Asset Management Group of Bank of Hawaii (“AMG”)
· As of October 31, 2019, AMG manages $1.37 billion in mutual fund assets. In addition, AMG personnel also manage approximately $2.31 billion in assets on behalf of Bank of Hawaii clients. | |||||
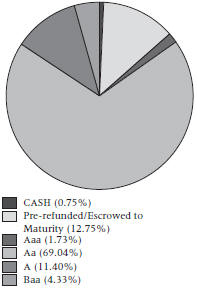
1
PACIFIC CAPITAL FUNDS
Pacific Capital Tax-Free Securities Fund
Semi-Annual Report
Performance Data (Concluded)
October 31, 2019 (Unaudited)
Average Annual Total Returns for the Periods Ended October 31, 2019
| Six Months* | 1 Year | 3 Year | 5 Year | 10 Year | ||||||||||||||||
Class Y | 3.23% | 8.44% | 2.85% | 2.84% | 3.59% | |||||||||||||||
Bloomberg Barclays Capital Hawaii Municipal Bond Index | 3.27% | 8.83% | 3.22% | 3.23% | 3.97% | |||||||||||||||
*Not Annualized
Past performance does not guarantee future results. The performance data quoted represents past performance and current returns may be lower or higher. The investment return and principal value will fluctuate so that an investor’s shares, when redeemed, may be worth more or less than the original cost. The table does not reflect the deduction of taxes that a shareholder would pay on Fund distributions or the redemption of Fund shares. To obtain performance information current to the most recent month end, please call (888)678-6034.
As stated in the current prospectus dated September 1, 2019, the Fund’s “Total Annual Fund Operating Expenses” are 0.31%, and the Fund’s “Total Annual Fund Operating Expenses After Fee Waiver” are 0.11%, of the Fund’s average daily net assets. These rates may fluctuate and may differ from the actual expenses incurred by the Fund for the period covered in this report. The Adviser has contractually agreed to waive its advisory fee (the “Waiver”) until August 31, 2021. The Waiver may not be terminated at any time prior to that date without the consent of the Board of Trustees (“Board of Trustees”) of FundVantage Trust (the “Trust”).
Before the Fund commenced operations, all of the assets of theTax-Free Securities Fund, a series of Pacific Capital Funds (the “Predecessor Fund”), were transferred to the Fund in atax-free reorganization (the “Reorganization”). Performance presented prior to June 28, 2010 reflects the performance of the Predecessor Fund.
Total returns reflect the waiver of advisory fees. Had these waivers not been in effect, performance quoted would have been lower.
The performance of the Fund is measured against the Bloomberg Barclays Capital Hawaii Municipal Bond Index, a rules-based, market-value weighted index engineered for the long-termtax-exempt Hawaii bond market. The index has four main sectors: general obligation bonds, revenue bonds, insured bonds and prerefunded bonds. The index is unmanaged and does not reflect the deduction of fees associated with a mutual fund, such as investment management and fund accounting fees. The Fund’s performance reflects the deduction of fees for these services. Investors cannot invest directly in an index.
The Fund is distributed by Foreside Funds Distributors LLC.
All mutual fund investing involves risk, including possible loss of principal. The Fund isnon-diversified, which means that a portion of the Fund’s assets may be invested in one or few companies or sectors. The Fund could fluctuate in value more than a diversified fund.
2
PACIFIC CAPITAL FUNDS
Pacific CapitalTax-Free Short Intermediate Securities Fund
Semi-Annual Report
Performance Data
October 31, 2019 (Unaudited)
Credit Quality as of October 31, 2019 (as a percentage of total investments)
Credit quality ratings are primarily sourced from Moody’s but in the event that Moody’s has not assigned a rating, the Fund will use S&P or Fitch. If these ratings are in conflict, S&P will be used before Fitch. If none of the major rating agencies have assigned a rating, the Fund will assign a rating of NR(non-rated security). The ratings represent their (Moody’s, S&P, and Fitch) opinions as to the quality of the underlying securities in the Fund, and not the Fund itself. The ratings range from AAA (extremely strong capacity to meet financial commitment) to D (in default). Ratings are relative and subjective and are not absolute standards of quality. Apre-refunded bond is secured by an escrow fund of U.S. government obligations (i.e. Treasury securities) and assumes the superior credit rating of the government obligation. The ratings do not predict performance and are subject to change. | Investment Style
High-quality, short-intermediate term,tax-exempt
Investment Objective
The Pacific CapitalTax-Free Short Intermediate Securities Fund (the “Fund”) seeks high current income that is exempt from federal and Hawaii income tax by normally investing at least 80% of its net assets in investment grade municipal obligations. The Fund normally invests greater than 50% of its assets in Hawaii municipal obligations — debt securities issued by or on behalf of the State of Hawaii and its political subdivisions, agencies and instrumentalities that pay interest which is exempt from Hawaii income tax as well as federal income tax. The Fund seeks to provide greater price stability than a long-term bond fund.
Investment Considerations
Income received from the Fund may be subject to certain state and local taxes and, depending on one’s tax status, to the federal alternative minimum tax. Bonds offer a relatively stable level of income, although bond prices will fluctuate, providing the potential for principal gain or loss. Generally, bond prices and values fall when interest rates rise, and vice versa. Intermediate term, higher-quality bonds generally offer less risk than longer-term bonds and a lower rate of return. Since the Fund invests significantly in securities of issuers in Hawaii, it will also be affected by a variety of Hawaii’s economic and political factors. The values of any of the Fund’s investments may also decline in response to events affecting the issuer or its credit rating.
Investment Process
· Top-down macroeconomic analysis of interest rate trends
· Bottom-up credit research to identify high quality bonds
Investment Management
Advised by Asset Management Group of Bank of Hawaii (“AMG”)
· As of October 31, 2019, AMG manages $1.37 billion in mutual fund assets. In addition, AMG personnel also manage approximately $2.31 billion in assets on behalf of Bank of Hawaii clients. | |||||
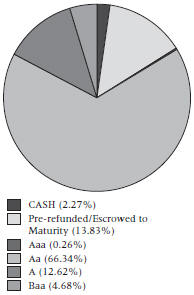
3
PACIFIC CAPITAL FUNDS
Pacific Capital Tax-Free Short Intermediate Securities Fund
Semi-Annual Report
Performance Data (Concluded)
October 31, 2019 (Unaudited)
Average Annual Total Returns for the Periods Ended October 31, 2019
| Six Months* | 1 Year | 3 Year | 5 Year | 10 Year | |||||||||||||||||||||
Class Y |
|
1.66 |
% |
|
4.34 |
% |
|
1.42 |
% |
|
1.31 |
% |
|
1.36 |
% | ||||||||||
Bloomberg Barclays Capital Hawaii3-Year Municipal Bond Index | 1.83 | % | 4.51 | % | 1.69 | % | 1.42 | % | 1.67 | % | |||||||||||||||
*Not Annualized
Past performance does not guarantee future results. The performance data quoted represents past performance and current returns may be lower or higher. The investment return and principal value will fluctuate so that an investor’s shares, when redeemed, may be worth more or less than the original cost. The table does not reflect the deduction of taxes that a shareholder would pay on Fund distributions or the redemption of Fund shares. To obtain performance information current to the most recent month end, please call (888)678-6034.
As stated in the current prospectus dated September 1, 2019, the Fund’s “Total Annual Fund Operating Expenses” are 0.54%, and the Fund’s “Total Annual Fund Operating Expense After Fee Waiver” are 0.34%, of the Fund’s average daily net assets. These rates may fluctuate and may differ from the actual expenses incurred by the Fund for the period covered in this report. The Adviser has contractually agreed to waive its advisory fee (the “Waiver”) until August 31, 2021. The Waiver may not be terminated at any time prior to that date without the consent of the Board of Trustees (“Board of Trustees”) of FundVantage Trust (the “Trust”).
Before the Fund commenced operations, all of the assets of theTax-Free Short Intermediate Securities Fund, a series of Pacific Capital Funds (the “Predecessor Fund”), were transferred to the Fund in atax-free reorganization (the “Reorganization”). Performance presented prior to June 28, 2010 reflects the performance of the Predecessor Fund.
Total returns reflect the waiver of advisory fees. Had these waivers not been in effect, performance quoted would have been lower.
The performance of the Fund is measured against the Bloomberg Barclays Capital Hawaii3-Year Municipal Bond Index, which is the2-4 year component of the Bloomberg Barclays Capital Hawaii Municipal Bond Index and is a rules-based, market-value weighted index engineered for the Hawaiitax-exempt bond market. The index has four main sectors: general obligation bonds, revenue bonds, insured bonds, and prerefunded bonds. The index is unmanaged and does not reflect the deduction of fees associated with a mutual fund, such as investment management and fund accounting fees. The Fund’s performance reflects the deduction of fees for these services. Investors cannot invest directly in an index.
The Fund is distributed by Foreside Funds Distributors LLC.
All mutual fund investing involves risk, including possible loss of principal. The Fund isnon-diversified, which means that a portion of the Fund’s assets may be invested in one or few companies or sectors. The Fund could fluctuate in value more than a diversified fund.
4
PACIFIC CAPITAL FUNDS
Fund Expense Disclosure
October 31, 2019
(Unaudited)
As a shareholder of the Fund(s), you incur two types of costs: (1) transaction costs, and (2) ongoing costs, including management fees, distribution and/or service (Rule12b-1) fees (if any) and other Fund expenses. These examples are intended to help you understand your ongoing costs (in dollars) of investing in the Fund and to compare these costs with the ongoing costs of investing in other mutual funds.
These examples are based on an investment of $1,000 invested at the beginning of thesix-month period from May 1, 2019 through October 31, 2019 and held for the entire period.
Actual Expenses
The first line for each Fund in the accompanying table provides information about actual account values and actual expenses. You may use the information in this line, together with the amount you invested, to estimate the expenses that you paid over the period. Simply divide your account value by $1,000 (for example, an $8,600 account value divided by $1,000 = 8.6), then multiply the result by the number in the first line of the table under the heading entitled “Expenses Paid During Period” to estimate the expenses you paid on your account during this period.
Hypothetical Examples for Comparison Purposes
The second line for each Fund in the accompanying table provides information about hypothetical account values and hypothetical expenses based on each Fund’s actual expense ratio and an assumed rate of return of 5% per year before expenses, which is not the Fund’s actual return. The hypothetical account values and expenses may not be used to estimate the actual ending account balance or expenses you paid for the period. You may use this information to compare the ongoing costs of investing in the Fund(s) and other funds. To do so, compare these 5% hypothetical examples with the 5% hypothetical examples that appear in the shareholder reports of other funds.
Please note that the expenses shown in the table are meant to highlight your ongoing costs only and do not reflect any transactional costs. Therefore, the second line of the accompanying table is useful in comparing ongoing costs only, and will not help you determine the relative total costs of owning different funds. In addition, if these transactional costs were included, your costs would have been higher.
5
PACIFIC CAPITAL FUNDS
Fund Expense Disclosure (Concluded)
October 31, 2019
(Unaudited)
| Beginning Account Value May 1, 2019 | Ending Account Value October 31, 2019 | Expenses Paid During Period* | Expense Ratio During Period** | ||||||||||||||||||||||
Pacific CapitalTax-Free Securities Fund | |||||||||||||||||||||||||
Actual Fund Return | Class Y | $ | 1,000.00 | $ | 1,032.30 | $ | 0.51 | 0.10 | % | ||||||||||||||||
Hypothetical Fund Return (5% return before expenses) | Class Y | 1,000.00 | 1,024.63 | 0.51 | 0.10 | % | |||||||||||||||||||
Pacific CapitalTax-Free Short Intermediate Securities Fund | |||||||||||||||||||||||||
Actual Fund Return | Class Y | $ | 1,000.00 | $ | 1,016.60 | $ | 1.27 | 0.25 | % | ||||||||||||||||
Hypothetical Fund Return (5% return before expenses) | Class Y | 1,000.00 | 1,023.88 | 1.27 | 0.25 | % | |||||||||||||||||||
Pacific Capital U.S. Government Money Market Fund |
| ||||||||||||||||||||||||
Actual Fund Return | Investor Class | $ | 1,000.00 | $ | 1,009.20 | $ | 1.82 | 0.36 | % | ||||||||||||||||
Hypothetical Fund Return (5% return before expenses) | Investor Class | 1,000.00 | 1,023.33 | 1.83 | 0.36 | % | |||||||||||||||||||
| * | Expense are equal to an annualized expense ratio for thesix-month period ended October 31, 2019, multiplied by average account value over the period, multiplied by the number of days in the most recent period (184), then divided by 366 to reflect the period. The Funds’ ending account values on the first line in each table are based on the actualsix-month total returns of 3.23% for the Pacific CapitalTax-Free Securities Fund, 1.66% for the Pacific CapitalTax-Free Short Intermediate Securities Fund and 0.92% for the Pacific Capital U.S. Government Money Market Fund. |
| ** | Annualized. |
6
PACIFIC CAPITAL FUNDS
Pacific Capital Tax-Free Securities Fund
Portfolio of Investments
October 31, 2019
(Unaudited)
| Principal Amount ($) | Value ($) | |||||||||||
MUNICIPAL BONDS — 99.5% |
| |||||||||||
Arizona — 2.4% | ||||||||||||
Phoenix Civic Improvement Corp., Civic Plaza, Convertible CAB, OID, Series B, | 5,000,000 | 6,845,150 | ||||||||||
|
| |||||||||||
California — 1.5% | ||||||||||||
Norwalk-La Mirada Unified School District GO, CAB, OID, Series B, | 5,000,000 | 4,335,950 | ||||||||||
|
| |||||||||||
Hawaii — 93.1% | ||||||||||||
Hawaii County GO, Series A, Callable 03/01/27 at 100, | 5,045,000 | 6,209,285 | ||||||||||
Hawaii County GO, Series A, Callable 03/01/27 at 100, | 4,775,000 | 5,833,140 | ||||||||||
Hawaii Housing Finance & Development Corp., Hale-Kewalo Apartments, Series A, Callable 01/01/20 at 100, | 4,410,000 | 4,414,895 | ||||||||||
Hawaii Housing Finance & Development Corp., Multi-Family Housing, Iwilei Apartments, Series A, Callable 07/01/22 at 100, | 3,120,000 | 3,232,913 | ||||||||||
| Principal Amount ($) | Value ($) | |||||||
MUNICIPAL BONDS — (Continued) |
| |||||||
Hawaii — (Continued) | ||||||||
Hawaii Housing Finance & Development Corp., Series B, Callable 07/01/21 at 100, | 2,325,000 | 2,394,727 | ||||||
Hawaii State Airports System Revenue, AMT, OID, Callable 08/01/23 at 100, | 400,000 | 446,808 | ||||||
Hawaii State Airports System Revenue, Series A, Callable 07/01/20 at 100, | 1,000,000 | 1,027,070 | ||||||
Hawaii State Airports System Revenue, Series A, Callable 07/01/20 at 100, | 1,010,000 | 1,036,048 | ||||||
Hawaii State Airports System Revenue, AMT, Callable 07/01/21 at 100, | 2,000,000 | 2,118,580 | ||||||
Hawaii State Airports System Revenue, AMT, Callable 07/01/28 at 100, | 1,500,000 | 1,784,820 | ||||||
Hawaii State Airports System Revenue, Series A, Callable 07/01/20 at 100, | 545,000 | 559,203 | ||||||
The accompanying notes are an integral part of the financial statements.
7
PACIFIC CAPITAL FUNDS
Pacific Capital Tax-Free Securities Fund
Portfolio of Investments (Continued)
October 31, 2019
(Unaudited)
| Principal Amount ($) | Value ($) | |||||||
MUNICIPAL BONDS — (Continued) |
| |||||||
Hawaii — (Continued) | ||||||||
Hawaii State Airports System Revenue, Series A, Callable 07/01/20 at 100, | 4,040,000 | 4,142,858 | ||||||
Hawaii State Department of Budget & Finance Revenue, Hawaii Pacific Health Obligation, Callable 07/01/23 at 100, | 1,330,000 | 1,493,909 | ||||||
Hawaii State Department of Budget & Finance Revenue, Hawaii Pacific Health Obligation, OID, | 500,000 | 546,890 | ||||||
Hawaii State Department of Budget & Finance Revenue, Hawaiian Electric Company, AMT, MWC, | 3,500,000 | 3,669,995 | ||||||
Hawaii State Department of Budget & Finance Revenue, Hawaiian Electric Company, AMT, MWC, Callable 03/01/27 at 100, | 1,500,000 | 1,600,950 | ||||||
Hawaii State Department of Budget & Finance Revenue, Hawaiian Electric Company, AMT, MWC, Callable 10/01/24 at 100, | 2,000,000 | 2,011,500 | ||||||
| Principal Amount ($) | Value ($) | |||||||
MUNICIPAL BONDS — (Continued) |
| |||||||
Hawaii — (Continued) | ||||||||
Hawaii State Department of Budget & Finance Revenue, Hawaiian Electric Company, MWC, Refunding, Callable 07/01/29 at 100, | 6,775,000 | 6,904,741 | ||||||
Hawaii State Department of Budget & Finance, Special Purpose Revenue, Kahala Nui, Callable 11/15/22 at 100, | 1,790,000 | 1,994,346 | ||||||
Hawaii State Department of Budget & Finance, Special Purpose Revenue, Kahala Nui, Callable 11/15/22 at 100, | 550,000 | 609,961 | ||||||
Hawaii State Department of Budget & Finance, Series A, Queens Health System, Callable 07/01/25 at 100, | 10,000,000 | 11,502,800 | ||||||
Hawaii State Department of Hawaiian Home Lands Revenue, Refunding, | 1,370,000 | 1,442,665 | ||||||
Hawaii State Department of Hawaiian Home Lands Revenue, Refunding, | 500,000 | 579,470 | ||||||
The accompanying notes are an integral part of the financial statements.
8
PACIFIC CAPITAL FUNDS
Pacific Capital Tax-Free Securities Fund
Portfolio of Investments (Continued)
October 31, 2019
(Unaudited)
| Principal Amount ($) | Value ($) | |||||||
MUNICIPAL BONDS — (Continued) |
| |||||||
Hawaii — (Continued) | ||||||||
Hawaii State Department of Hawaiian Home Lands Revenue, Refunding, Callable 04/01/27 at 100, | 945,000 | 1,165,298 | ||||||
Hawaii State Department of Hawaiian Home Lands Revenue, Refunding, Callable 04/01/27 at 100, | 335,000 | 407,008 | ||||||
Hawaii State Department of Hawaiian Home Lands, Kapolei Office Facility, Series A, Refunding, Callable 11/01/27 at 100, | 1,170,000 | 1,462,909 | ||||||
Hawaii State Department of Hawaiian Home Lands, Kapolei Office Facility, Series A, Refunding, Callable 11/01/27 at 100, | 800,000 | 991,736 | ||||||
Hawaii State Department of Hawaiian Home Lands, Kapolei Office Facility, Series A, Refunding, Callable 11/01/27 at 100, | 815,000 | 1,003,591 | ||||||
Hawaii State GO, Series DT, | 2,150,000 | 2,150,000 | ||||||
Hawaii State GO, Series DZ, Prerefunded 12/01/21 at 100, | 155,000 | 167,133 | ||||||
| Principal Amount ($) | Value ($) | |||||||
MUNICIPAL BONDS — (Continued) |
| |||||||
Hawaii — (Continued) | ||||||||
Hawaii State GO, Series DZ, Prerefunded 12/01/21 at 100, | 895,000 | 966,018 | ||||||
Hawaii State GO, Series DZ, Prerefunded 12/01/21 at 100, | 1,620,000 | 1,746,814 | ||||||
Hawaii State GO, Series DZ, Prerefunded 12/01/21 at 100, | 1,155,000 | 1,246,649 | ||||||
Hawaii State GO, Series DZ, Prerefunded 12/01/21 at 100, | 1,805,000 | 1,948,227 | ||||||
Hawaii State GO, Series DZ, Prerefunded 12/01/21 at 100, | 1,730,000 | 1,867,276 | ||||||
Hawaii State GO, Series DZ, Unrefunded portion, Callable 12/01/21 at 100, | 300,000 | 323,805 | ||||||
Hawaii State GO, Series DZ, Unrefunded portion, Callable 12/01/21 at 100, | 1,235,000 | 1,332,997 | ||||||
Hawaii State GO, Series DZ, Unrefunded portion, Callable 12/01/21 at 100, | 1,095,000 | 1,181,888 | ||||||
Hawaii State GO, Series EA, | 265,000 | 265,766 | ||||||
The accompanying notes are an integral part of the financial statements.
9
PACIFIC CAPITAL FUNDS
Pacific Capital Tax-Free Securities Fund
Portfolio of Investments (Continued)
October 31, 2019
(Unaudited)
| Principal Amount ($) | Value ($) | |||||||
MUNICIPAL BONDS — (Continued) |
| |||||||
Hawaii — (Continued) | ||||||||
Hawaii State GO, Series EE, Prerefunded 11/01/22 at 100, | 55,000 | 61,261 | ||||||
Hawaii State GO, Series EE, Prerefunded 11/01/22 at 100, | 1,450,000 | 1,615,068 | ||||||
Hawaii State GO, Series EE, Prerefunded 11/01/22 at 100, | 90,000 | 100,246 | ||||||
Hawaii State GO, Series EE, Prerefunded 11/01/22 at 100, | 1,000,000 | 1,113,840 | ||||||
Hawaii State GO, Series EE, Prerefunded 11/01/22 at 100, | 90,000 | 100,246 | ||||||
Hawaii State GO, Series EE, Prerefunded 11/01/22 at 100, | 740,000 | 824,242 | ||||||
Hawaii State GO, Series EE, Prerefunded 11/01/22 at 100, | 20,000 | 22,277 | ||||||
Hawaii State GO, Series EE, Unrefunded portion, Callable 11/01/22 at 100, | 100,000 | 111,384 | ||||||
| Principal Amount ($) | Value ($) | |||||||
MUNICIPAL BONDS — (Continued) |
| |||||||
Hawaii — (Continued) | ||||||||
Hawaii State GO, Series EE, Unrefunded portion, Callable 11/01/22 at 100, | 1,365,000 | 1,520,392 | ||||||
Hawaii State GO, Series EE, Unrefunded portion, Callable 11/01/22 at 100, | 345,000 | 384,275 | ||||||
Hawaii State GO, Series EE, Unrefunded portion, Callable 11/01/22 at 100, | 340,000 | 378,706 | ||||||
Hawaii State GO, Series EH, Prerefunded 08/01/23 at 100, | 305,000 | 348,121 | ||||||
Hawaii State GO, Series EH, Prerefunded, ETM, | 445,000 | 507,914 | ||||||
Hawaii State GO, Series EH, Prerefunded, ETM, | 110,000 | 125,552 | ||||||
Hawaii State GO, Series EH, Unrefunded portion, | 345,000 | 393,441 | ||||||
Hawaii State GO, Series EH, Unrefunded portion, Callable 08/01/23 at 100, | 895,000 | 1,019,969 | ||||||
Hawaii State GO, Series EL, | 1,000,000 | 1,140,410 | ||||||
Hawaii State GO, Series EO, Callable 08/01/24 at 100, | 1,285,000 | 1,484,136 | ||||||
The accompanying notes are an integral part of the financial statements.
10
PACIFIC CAPITAL FUNDS
Pacific Capital Tax-Free Securities Fund
Portfolio of Investments (Continued)
October 31, 2019
(Unaudited)
| Principal Amount ($) | Value ($) | |||||||
MUNICIPAL BONDS — (Continued) |
| |||||||
Hawaii — (Continued) | ||||||||
Hawaii State GO, Series EO, Prerefunded 08/01/24 at 100, | 140,000 | 164,660 | ||||||
Hawaii State GO, Series EO, Unrefunded portion, Callable 08/01/24 at 100, | 2,660,000 | 3,111,349 | ||||||
Hawaii State GO, Series EP, | 1,000,000 | 1,175,150 | ||||||
Hawaii State GO, Series ET, | 1,060,000 | 1,146,464 | ||||||
Hawaii State GO, Series EY, Callable 10/01/25 at 100, | 3,040,000 | 3,664,446 | ||||||
Hawaii State GO, Series EZ, | 4,000,000 | 4,289,040 | ||||||
Hawaii State GO, Series FB, | 5,000,000 | 5,980,900 | ||||||
Hawaii State GO, Series FB, Callable 04/01/26 at 100, | 2,000,000 | 2,290,660 | ||||||
Hawaii State GO, Series FG, Callable 10/01/26 at 100, | 10,000,000 | 12,241,100 | ||||||
Hawaii State GO, Series FG, Callable 10/01/26 at 100, | 1,000,000 | 1,124,780 | ||||||
Hawaii State GO, Series FK, Callable 05/01/27 at 100, | 2,500,000 | 3,074,250 | ||||||
Hawaii State GO, Series FK, Callable 05/01/27 at 100, | 2,000,000 | 2,251,900 | ||||||
| Principal Amount ($) | Value ($) | |||||||
MUNICIPAL BONDS — (Continued) |
| |||||||
Hawaii — (Continued) | ||||||||
Hawaii State GO, Series FN, | 2,500,000 | 3,101,750 | ||||||
Hawaii State GO, Series FT, | 1,950,000 | 2,396,258 | ||||||
Hawaii State GO, Series FT, Callable 01/01/28 at 100, | 4,000,000 | 4,945,720 | ||||||
Hawaii State GO, Series FW, | 2,000,000 | 2,333,300 | ||||||
Hawaii State Harbor System Revenue, OID, Series A, Callable 07/01/20 at 100, | 220,000 | 224,985 | ||||||
Hawaii State Harbor System Revenue, OID, Series A, Callable 07/01/20 at 100, | 4,125,000 | 4,239,840 | ||||||
Hawaii State Highway Fund Revenue, Series A, Callable 07/01/24 at 100, | 1,085,000 | 1,253,793 | ||||||
Hawaii State Highway Fund Revenue, Series A, Prerefunded 01/01/22 at 100, | 5,490,000 | 5,942,925 | ||||||
Hawaii State Highway Fund Revenue, Series A, Prerefunded 01/01/22 at 100, | 1,120,000 | 1,212,400 | ||||||
Hawaii State Highway Fund Revenue, Series B, Callable 07/01/26 at 100, | 910,000 | 1,118,736 | ||||||
The accompanying notes are an integral part of the financial statements.
11
PACIFIC CAPITAL FUNDS
Pacific Capital Tax-Free Securities Fund
Portfolio of Investments (Continued)
October 31, 2019
(Unaudited)
| Principal Amount ($) | Value ($) | |||||||
MUNICIPAL BONDS — (Continued) |
| |||||||
Hawaii — (Continued) | ||||||||
Hawaii State Highway Fund Revenue, Series B, Callable 07/01/26 at 100, | 5,000,000 | 6,127,550 | ||||||
Honolulu City & County Board of Water Supply System Revenue, Refunding, Series A, Callable 07/01/24 at 100, | 1,500,000 | 1,752,615 | ||||||
Honolulu City & County Board of Water Supply System Revenue, Refunding, Series A, Callable 07/01/22 at 100, | 1,000,000 | 1,098,460 | ||||||
Honolulu City & County Board of Water Supply System Revenue, Refunding, Series A, Callable 07/01/22 at 100, | 3,125,000 | 3,430,094 | ||||||
Honolulu City & County Board of Water Supply System Revenue, Refunding, Series A, Callable 07/01/24 at 100, | 850,000 | 989,000 | ||||||
Honolulu City & County GO, Series A, Callable 09/01/27 at 100, | 1,235,000 | 1,495,128 | ||||||
Honolulu City & County GO, Series A, Callable 11/01/22 at 100, | 2,855,000 | 3,180,013 | ||||||
| Principal Amount ($) | Value ($) | |||||||
MUNICIPAL BONDS — (Continued) |
| |||||||
Hawaii — (Continued) | ||||||||
Honolulu City & County GO, Series A, Callable 11/01/22 at 100, | 1,000,000 | 1,113,840 | ||||||
Honolulu City & County GO, Series A, Callable 10/01/25 at 100, | 2,175,000 | 2,593,535 | ||||||
Honolulu City & County GO, Series A, Callable 11/01/22 at 100, | 450,000 | 501,228 | ||||||
Honolulu City & County GO, Series A, Callable 11/01/22 at 100, | 1,970,000 | 2,194,265 | ||||||
Honolulu City & County GO, Series A, Callable 10/01/25 at 100, | 3,000,000 | 3,551,790 | ||||||
Honolulu City & County GO, Series A, Callable 10/01/25 at 100, | 1,000,000 | 1,176,020 | ||||||
Honolulu City & County GO, Series A, Callable 10/01/25 at 100, | 1,040,000 | 1,220,877 | ||||||
Honolulu City & County GO, Series A, Callable 10/01/25 at 100, | 1,000,000 | 1,171,960 | ||||||
Honolulu City & County GO, Series A, ETM, | 2,000,000 | 2,227,680 | ||||||
The accompanying notes are an integral part of the financial statements.
12
PACIFIC CAPITAL FUNDS
Pacific Capital Tax-Free Securities Fund
Portfolio of Investments (Continued)
October 31, 2019
(Unaudited)
| Principal Amount ($) | Value ($) | |||||||
MUNICIPAL BONDS — (Continued) |
| |||||||
Hawaii — (Continued) | ||||||||
Honolulu City & County GO, Series A, Refunding, Callable 11/01/22 at 100, | 1,000,000 | 1,056,420 | ||||||
Honolulu City & County GO, Series B, Callable 11/01/22 at 100, | 2,050,000 | 2,280,010 | ||||||
Honolulu City & County GO, Series B, Callable 12/01/20 at 100, | 1,280,000 | 1,333,056 | ||||||
Honolulu City & County GO, Series B, Refunding, | 1,000,000 | 1,110,090 | ||||||
Honolulu City & County GO, Series B, Refunding, | 2,300,000 | 2,789,394 | ||||||
Honolulu City & County GO, Series B, Refunding, Callable 10/01/25 at 100, | 500,000 | 605,190 | ||||||
Honolulu City & County GO, Series B, Refunding, Honolulu Rail Transit Project, | 1,215,000 | 1,423,008 | ||||||
Honolulu City & County GO, Series C, Callable 08/01/29 at 100, | 400,000 | 465,352 | ||||||
Honolulu City & County GO, Series C, Callable 08/01/29 at 100, | 2,000,000 | 2,273,240 | ||||||
| Principal Amount ($) | Value ($) | |||||||
MUNICIPAL BONDS — (Continued) |
| |||||||
Hawaii — (Continued) | ||||||||
Honolulu City & County GO, Series C, Refunding, Callable 10/01/25 at 100, | 2,000,000 | 2,410,820 | ||||||
Honolulu City & County GO, Series C, Refunding, Callable 10/01/25 at 100, | 4,115,000 | 4,918,536 | ||||||
Honolulu City & County GO, Series E, Refunding, Callable 09/01/27 at 100, | 1,500,000 | 1,872,630 | ||||||
Honolulu City & County GO, Variable Honolulu Rail Transit Project, SIFMA + 0.30%, Callable 11/14/19 at 100, | 1,500,000 | 1,500,075 | ||||||
Honolulu City & County Wastewater System Revenue, 1st Bond Resolution, Series A, Callable 07/01/29 at 100, | 2,845,000 | 3,302,561 | ||||||
Honolulu City & County Wastewater System Revenue, Refunding, Junior Series A, Callable 07/01/25 at 100, | 4,000,000 | 4,745,720 | ||||||
Honolulu City & County Wastewater System Revenue, Senior 1st Bond Resolution, Refunding, Callable 07/01/25 at 100, | 3,000,000 | 3,595,920 | ||||||
The accompanying notes are an integral part of the financial statements.
13
PACIFIC CAPITAL FUNDS
Pacific Capital Tax-Free Securities Fund
Portfolio of Investments (Continued)
October 31, 2019
(Unaudited)
| Principal Amount ($) | Value ($) | |||||||
MUNICIPAL BONDS — (Continued) |
| |||||||
Hawaii — (Continued) | ||||||||
Honolulu City & County Wastewater System Revenue, Senior 1st Bond Resolution, Refunding, Callable 07/01/25 at 100, | 325,000 | 388,342 | ||||||
Honolulu City & County Wastewater System Revenue, Senior 1st Bond Resolution, Series A, Callable 07/01/25 at 100, | 395,000 | 469,193 | ||||||
Honolulu City & County Wastewater System Revenue, Senior 1st Bond Resolution, Series A, Callable 01/01/28 at 100, | 2,000,000 | 2,461,300 | ||||||
Honolulu City & County Wastewater System Revenue, Senior Series B, Refunding, Callable 07/01/26 at 100, | 125,000 | 149,874 | ||||||
Kauai County GO, | 390,000 | 443,992 | ||||||
Kauai County GO, | 250,000 | 314,990 | ||||||
Kauai County GO, Callable 08/01/27 at 100, | 250,000 | 309,815 | ||||||
Kauai County GO, Callable 08/01/27 at 100, | 270,000 | 306,958 | ||||||
| Principal Amount ($) | Value ($) | |||||||
MUNICIPAL BONDS — (Continued) |
| |||||||
Hawaii — (Continued) | ||||||||
Kauai County GO, Callable 08/01/27 at 100, | 775,000 | 937,076 | ||||||
Kauai County GO, Series A, Refunding, 5.00%, 08/01/22 | 385,000 | 424,820 | ||||||
Kauai County GO, OID, Series A, Callable 08/01/21 at 100, | 1,195,000 | 1,237,829 | ||||||
Kauai County GO, OID, Series A, Callable 08/01/22 at 100, | 1,300,000 | 1,353,339 | ||||||
Maui County GO, Refunding, | 300,000 | 340,317 | ||||||
Maui County GO, Refunding, | 975,000 | 1,259,271 | ||||||
Maui County GO, Refunding, Callable 09/01/28 at 100, | 5,305,000 | 6,256,664 | ||||||
Maui County GO, Refunding, Callable 09/01/25 at 100, | 195,000 | 203,514 | ||||||
University of Hawaii Revenue, Series B, Refunding, | 165,000 | 186,247 | ||||||
University of Hawaii Revenue, Series B, Refunding, Callable 10/01/25 at 100, | 1,000,000 | 1,180,230 | ||||||
The accompanying notes are an integral part of the financial statements.
14
PACIFIC CAPITAL FUNDS
Pacific Capital Tax-Free Securities Fund
Portfolio of Investments (Continued)
October 31, 2019
(Unaudited)
| Principal Amount ($) | Value ($) | |||||||||||
MUNICIPAL BONDS — (Continued) |
| |||||||||||
Hawaii — (Continued) | ||||||||||||
University of Hawaii Revenue, Series E, Refunding, | 3,000,000 | 3,528,570 | ||||||||||
University of Hawaii Revenue, Series E, Refunding, Callable 10/01/26 at 100, | 1,000,000 | 1,218,150 | ||||||||||
University of Hawaii Revenue, Series F, Refunding, Callable 10/01/27 at 100, | 3,000,000 | 3,697,320 | ||||||||||
University of Hawaii Revenue, Series F, Refunding, Callable 10/01/27 at 100, | 2,000,000 | 2,459,540 | ||||||||||
|
| |||||||||||
| 260,954,003 | ||||||||||||
|
| |||||||||||
Illinois — 1.0% | ||||||||||||
Illinois Municipal Electric Agency Power Supply Revenue, Series C, | 2,665,000 | 2,792,840 | ||||||||||
|
| |||||||||||
Texas — 1.5% | ||||||||||||
Galveston County GO, CAB, OID, Series RD, | 2,630,000 | 2,475,198 | ||||||||||
| Principal Amount ($) | Value ($) | |||||||||||
MUNICIPAL BONDS — (Continued) |
| |||||||||||
Texas — (Continued) | ||||||||||||
Houston Combined Utility System Revenue, Unrefunded Balance CAB, OID, Junior Series A, | 2,000,000 | 1,729,500 | ||||||||||
|
| |||||||||||
| 4,204,698 | ||||||||||||
|
| |||||||||||
TOTAL MUNICIPAL BONDS | 279,132,641 | |||||||||||
|
| |||||||||||
Shares | ||||||||||||
REGISTERED INVESTMENT COMPANY — 0.8% |
| |||||||||||
Dreyfus Government Cash Management Fund, Institutional Shares, | 2,142,483 | 2,142,483 | ||||||||||
|
| |||||||||||
TOTAL REGISTERED INVESTMENT COMPANY | 2,142,483 | |||||||||||
|
| |||||||||||
TOTAL INVESTMENTS - 100.3% |
| 281,275,124 | ||||||||||
LIABILITIES IN EXCESS OF OTHER ASSETS - (0.3)% | (869,731 | ) | ||||||||||
|
| |||||||||||
NET ASSETS - 100.0% | $ | 280,405,393 | ||||||||||
|
| |||||||||||
The accompanying notes are an integral part of the financial statements.
15
PACIFIC CAPITAL FUNDS
Pacific Capital Tax-Free Securities Fund
Portfolio of Investments (Concluded)
October 31, 2019
(Unaudited)
| (a) | Variable rate investments. The rate shown is based on the latest available information as of October 31, 2019. Certain variable rate securities are not based on a published reference rate and spread but are determined by the issuer or agent and are based on current market conditions. |
| (b) | Rate periodically changes. Rate disclosed is the7-day yield at October 31, 2019. |
Portfolio holdings are subject to change at any time.
AGM | Assured Guaranty Municipal Corp. | |
AGM-CR | Assured Guaranty Municipal Corp. | |
| Custodial Receipts | ||
AMT | Subject to Alternative Minimum Tax | |
CAB | Capital Appreciation Bond | |
ETM | Escrowed to Maturity | |
FGIC | Financial Guaranty Insurance Co. | |
FHLMC | Federal Home Loan Mortgage Corp. | |
FNMA | Federal National Mortgage Association | |
GNMA | Government National Mortgage Association | |
GO | General Obligation | |
MWC | Make Whole Callable | |
NATL-RE | National Reinsurance Corp. | |
OID | Original Issue Discount | |
SIFMA | The Securities Industry and Financial | |
| Markets Association Municipal Swap Index |
The accompanying notes are an integral part of the financial statements.
16
PACIFIC CAPITAL FUNDS
Pacific Capital Tax-Free Short Intermediate Securities Fund
Portfolio of Investments
October 31, 2019
(Unaudited)
| Principal Amount ($) | Value ($) | |||||||||||
MUNICIPAL BONDS — 97.5% |
| |||||||||||
Arizona — 1.7% | ||||||||||||
Tempe City Excise Tax Revenue, Series A, Callable 07/01/21 at 100, | 900,000 | 957,501 | ||||||||||
|
| |||||||||||
Hawaii — 95.5% | ||||||||||||
Hawaii County GO, Series A, | 1,000,000 | 1,031,420 | ||||||||||
Hawaii County GO, Prerefunded, Callable 03/01/20 at 100, | 190,000 | 191,786 | ||||||||||
Hawaii County GO, Series A, | 550,000 | 567,281 | ||||||||||
Hawaii County GO, Series D, Refunding, | 500,000 | 584,890 | ||||||||||
Hawaii Housing Finance & Development Corp., Hale-Kewalo Apartments, Series A, Callable 01/01/20 at 100, | 2,150,000 | 2,152,386 | ||||||||||
Hawaii Pacific Health Revenue, Series A, OID, Prerefunded, Callable 07/01/20 at 100, | 645,000 | 663,163 | ||||||||||
Hawaii Pacific Health Revenue, Series B, ETM, | 175,000 | 179,356 | ||||||||||
| Principal Amount ($) | Value ($) | |||||||
MUNICIPAL BONDS — (Continued) |
| |||||||
Hawaii — (Continued) | ||||||||
Hawaii State Airports System Revenue, AMT, Callable 08/01/23 at 100, | 260,000 | 291,229 | ||||||
Hawaii State Airports System Revenue, Refunding, AMT, | 2,000,000 | 2,116,900 | ||||||
Hawaii State Airports System Revenue, Refunding, AMT, Callable 07/01/21 at 100, | 500,000 | 529,730 | ||||||
Hawaii State Airports System Revenue, Refunding, AMT, OID, Callable 07/01/21 at 100, | 500,000 | 520,480 | ||||||
Hawaii State Airports System Revenue, Series A, Callable 07/01/20 at 100, | 500,000 | 513,870 | ||||||
Hawaii State Airports System Revenue, Series B, | 1,010,000 | 1,266,126 | ||||||
Hawaii State Department of Budget & Finance Revenue, Hawaiian Electric Company, AMT, MWC, | 2,520,000 | 2,642,396 | ||||||
The accompanying notes are an integral part of the financial statements.
17
PACIFIC CAPITAL FUNDS
Pacific Capital Tax-Free Short Intermediate Securities Fund
Portfolio of Investments (Continued)
October 31, 2019
(Unaudited)
| Principal Amount ($) | Value ($) | |||||||
MUNICIPAL BONDS — (Continued) |
| |||||||
Hawaii — (Continued) | ||||||||
Hawaii State Department of Budget & Finance, Pacific Health Obligation, | 220,000 | 241,054 | ||||||
Hawaii State Department of Budget & Finance, Series A, Queens Health System, | 115,000 | 125,942 | ||||||
Hawaii State Department of Budget & Finance, Series A, Queens Health System, | 495,000 | 573,938 | ||||||
Hawaii State Department of Budget & Finance, Series A, Queens Health System, | 500,000 | 594,725 | ||||||
Hawaii State Department of Budget & Finance, Series A, Queens Health System, Callable 07/01/25 at 100, | 300,000 | 354,174 | ||||||
Hawaii State Department of Hawaiian Home Lands, Refunding, 4.00%, 04/01/20 | 1,555,000 | 1,572,727 | ||||||
Hawaii State GO, Series DZ, Prerefunded, Callable 12/01/21 at 100, | 290,000 | 312,701 | ||||||
| Principal Amount ($) | Value ($) | |||||||
MUNICIPAL BONDS — (Continued) |
| |||||||
Hawaii — (Continued) | ||||||||
Hawaii State GO, Series DZ, Prerefunded, Callable 12/01/21 at 100, | 190,000 | 204,873 | ||||||
Hawaii State GO, Series DZ, Prerefunded, Callable 12/01/21 at 100, | 1,110,000 | 1,198,078 | ||||||
Hawaii State GO, Series DZ, Prerefunded, ETM, | 130,000 | 130,376 | ||||||
Hawaii State GO, Series DZ, Refunding, ETM, | 505,000 | 525,932 | ||||||
Hawaii State GO, Series DZ, Unrefunded portion, Callable 12/01/21 at 100, | 360,000 | 388,566 | ||||||
Hawaii State GO, Series EA, Refunding, | 1,100,000 | 1,133,748 | ||||||
Hawaii State GO, Series EA, Refunding, Callable 12/01/21 at 100, | 1,055,000 | 1,138,071 | ||||||
Hawaii State GO, Series EE, ETM, | 1,305,000 | 1,415,273 | ||||||
Hawaii State GO, Series EE, Prerefunded, Callable 11/01/22 at 100, | 45,000 | 50,123 | ||||||
The accompanying notes are an integral part of the financial statements.
18
PACIFIC CAPITAL FUNDS
Pacific Capital Tax-Free Short Intermediate Securities Fund
Portfolio of Investments (Continued)
October 31, 2019
(Unaudited)
| Principal Amount ($) | Value ($) | |||||||
MUNICIPAL BONDS — (Continued) |
| |||||||
Hawaii — (Continued) | ||||||||
Hawaii State GO, Series EE, Prerefunded, Callable 11/01/22 at 100, | 25,000 | 27,846 | ||||||
Hawaii State GO, Series EE, Prerefunded, Callable 11/01/22 at 100, | 760,000 | 846,518 | ||||||
Hawaii State GO, Series EF, Refunding, Callable 11/01/22 at 100, | 1,030,000 | 1,145,236 | ||||||
Hawaii State GO, Series EH, Prerefunded, Callable 08/01/23 at 100, | 270,000 | 308,173 | ||||||
Hawaii State GO, Series EH, Unrefunded, Callable 08/01/23 at 100, | 830,000 | 945,893 | ||||||
Hawaii State GO, Series EP, Refunding, 5.00%, 08/01/22 | 1,100,000 | 1,214,400 | ||||||
Hawaii State GO, Series FB, | 495,000 | 521,398 | ||||||
Hawaii State GO, Series FG, | 410,000 | 455,137 | ||||||
Hawaii State GO, Series FT, | 1,000,000 | 1,057,370 | ||||||
Hawaii State GO, Series FW, | 500,000 | 559,610 | ||||||
| Principal Amount ($) | Value ($) | |||||||
MUNICIPAL BONDS — (Continued) |
| |||||||
Hawaii — (Continued) | ||||||||
Hawaii State Harbor System Revenue, Refunding, AMT, Series B, Callable 07/01/20 at 100, | 500,000 | 513,745 | ||||||
Hawaii State Harbor System Revenue, Series A, Callable 07/01/20 at 100, | 600,000 | 614,574 | ||||||
Hawaii State Harbor System Revenue, Series A, OID, | 50,000 | 50,918 | ||||||
Hawaii State Harbor System Revenue, Series A, OID, Callable 07/01/20 at 100, | 35,000 | 35,748 | ||||||
Hawaii State Highway Fund Revenue, Series A, | 1,000,000 | 1,043,680 | ||||||
Hawaii State Highway Fund Revenue, Series A, | 1,010,000 | 1,042,542 | ||||||
Hawaii State Highway Fund Revenue, Series A, Callable 01/01/22 at 100, | 500,000 | 530,280 | ||||||
Honolulu City & County GO, Series A, Prerefunded, Callable 08/01/21 at 100, | 715,000 | 762,705 | ||||||
The accompanying notes are an integral part of the financial statements.
19
PACIFIC CAPITAL FUNDS
Pacific Capital Tax-Free Short Intermediate Securities Fund
Portfolio of Investments (Continued)
October 31, 2019
(Unaudited)
| Principal Amount ($) | Value ($) | |||||||
MUNICIPAL BONDS — (Continued) |
| |||||||
Hawaii — (Continued) | ||||||||
Honolulu City & County Board of Water Supply System Revenue, Refunding, Series A, | 320,000 | 328,032 | ||||||
Honolulu City & County Board of Water Supply System Revenue, Refunding, Series A, | 300,000 | 318,864 | ||||||
Honolulu City & County Board of Water Supply System Revenue, Refunding, Series A, | 680,000 | 748,456 | ||||||
Honolulu City & County Board of Water Supply System Revenue, Refunding, Series A, | 515,000 | 584,571 | ||||||
Honolulu City & County Board of Water Supply System Revenue, Refunding, Series A, Callable 07/01/24 at 100, | 110,000 | 128,216 | ||||||
Honolulu City & County Board of Water Supply System Revenue, Refunding, Series A, Callable 07/01/24 at 100, | 235,000 | 273,430 | ||||||
Honolulu City & County GO, Honolulu Rail Transit Project, Series B, | 900,000 | 930,303 | ||||||
| Principal Amount ($) | Value ($) | |||||||
MUNICIPAL BONDS — (Continued) |
| |||||||
Hawaii — (Continued) | ||||||||
Honolulu City & County GO, Honolulu Rail Transit Project, Series B, | 500,000 | 553,525 | ||||||
Honolulu City & County GO, Series A, OID, Prerefunded, Callable 08/01/21 at 100, | 20,000 | 20,990 | ||||||
Honolulu City & County GO, Series B, | 1,000,000 | 1,107,050 | ||||||
Honolulu City & County GO, Series C, | 800,000 | 861,664 | ||||||
Honolulu City & County GO, Series C, | 1,200,000 | 1,324,680 | ||||||
Honolulu City & County GO, Series D, Refunding, | 500,000 | 571,710 | ||||||
Honolulu City & County GO, Variable Honolulu Rail Transit Project, SIFMA + 0.30%, Callable 11/14/19 at 100, | 500,000 | 500,025 | ||||||
Honolulu City & County Wastewater System Revenue, 1st Bond Resolution, Refunding, Senior Series A, | 1,015,000 | 1,078,640 | ||||||
The accompanying notes are an integral part of the financial statements.
20
PACIFIC CAPITAL FUNDS
Pacific Capital Tax-Free Short Intermediate Securities Fund
Portfolio of Investments (Continued)
October 31, 2019
(Unaudited)
| Principal Amount ($) | Value ($) | |||||||
MUNICIPAL BONDS — (Continued) |
| |||||||
Hawaii — (Continued) | ||||||||
Honolulu City & County Wastewater System Revenue, 1st Bond Resolution, Refunding, Senior Series B, | 545,000 | 570,250 | ||||||
Honolulu City & County Wastewater System Revenue, 1st Bond Resolution, Senior Series A, Prerefunded, Callable 07/01/22 at 100, | 500,000 | 550,665 | ||||||
Honolulu City & County Wastewater System Revenue, 1st Bond Resolution, Senior Series A, Unrefunded, Callable 11/06/19 at 100, | 530,000 | 531,510 | ||||||
Honolulu City & County Wastewater System Revenue, 1st Bond Resolution, Series A, | 500,000 | 549,955 | ||||||
Honolulu City & County Wastewater System Revenue, 1st Bond Resolution, Series A, | 1,000,000 | 1,135,660 | ||||||
Honolulu City & County Wastewater System Revenue, Refunding, Junior Series A, | 500,000 | 584,405 | ||||||
| Principal Amount ($) | Value ($) | |||||||
MUNICIPAL BONDS — (Continued) |
| |||||||
Hawaii — (Continued) | ||||||||
Honolulu City & County Wastewater System Revenue, Senior Series A, | 1,005,000 | 1,051,562 | ||||||
Honolulu City & County Wastewater System Revenue, Senior Series A, Prerefunded, Callable 07/01/21 at 100, | 35,000 | 37,368 | ||||||
Kauai Country GO, | 305,000 | 309,130 | ||||||
Kauai County GO, Refunding, Series A, | 70,000 | 71,463 | ||||||
Kauai County GO, Refunding, Series A, | 345,000 | 349,671 | ||||||
Maui County GO, Refunding, | 1,225,000 | 1,298,586 | ||||||
Maui County GO, Refunding, | 20,000 | 21,394 | ||||||
Maui County GO, Refunding, | 1,000,000 | 1,143,420 | ||||||
University of Hawaii Revenue, Refunding, Series B, | 525,000 | 579,537 | ||||||
The accompanying notes are an integral part of the financial statements.
21
PACIFIC CAPITAL FUNDS
Pacific Capital Tax-Free Short Intermediate Securities Fund
Portfolio of Investments (Concluded)
October 31, 2019
(Unaudited)
| Principal Amount ($) | Value ($) | |||||||||
MUNICIPAL BONDS — (Continued) |
| |||||||||
Hawaii — (Continued) | ||||||||||
University of Hawaii Revenue, Refunding, Series B, | 500,000 | 564,385 | ||||||||
University of Hawaii Revenue, Refunding, Series F, | 500,000 | 536,225 | ||||||||
|
| |||||||||
| 54,102,429 | ||||||||||
|
| |||||||||
Texas — 0.3% | ||||||||||
Needville Independent School District GO, Refunding, | 140,000 | 144,196 | ||||||||
|
| |||||||||
TOTAL MUNICIPAL BONDS | 55,204,126 | |||||||||
|
| |||||||||
REGISTERED INVESTMENT COMPANY — 4.6% |
| |||||||||
Dreyfus Government Cash Management Fund, Institutional Shares, | 2,583,151 | 2,583,151 | ||||||||
|
| |||||||||
TOTAL REGISTERED INVESTMENT COMPANY | 2,583,151 | |||||||||
|
| |||||||||
| Value ($) | ||||
TOTAL INVESTMENTS - 102.1% | 57,787,277 | |||
LIABILITIES IN EXCESS OF OTHER ASSETS - (2.1)% | (1,167,548 | ) | ||
|
| |||
NET ASSETS - 100.0% | $ | 56,619,729 | ||
|
| |||
| (a) | Variable rate investments. The rate shown is based on the latest available information as of October 31, 2019. Certain variable rate securities are not based on a published reference rate and spread but are determined by the issuer or agent and are based on current market conditions. |
| (b) | Rate periodically changes. Rate disclosed is the7-day yield at October 31, 2019. |
Portfolio holdings are subject to change at any time.
| AMT | Alternative Minimum Tax | |
| ETM | Escrowed To Maturity | |
| GNMA | Government National Mortgage Association | |
| GO | General Obligation | |
| MWC | Make Whole Callable | |
| OID | Original Issue Discount | |
| PSF-GTD | Permanent School Fund Guaranteed | |
| SIFMA | The Securities Industry and Financial Markets Association Municipal Swap Index |
The accompanying notes are an integral part of the financial statements.
22
PACIFIC CAPITAL FUNDS
Pacific Capital U.S. Government Money Market Fund
Portfolio Holdings Summary Table
October 31, 2019
(Unaudited)
The following table presents a summary by security type of the portfolio holdings of the Fund:
| % of Net Assets | Value | |||||||||||||||||||
SECURITY TYPE: | ||||||||||||||||||||
U.S. Government Agency Obligations | 69.2 | % | $ | 253,311,667 | ||||||||||||||||
U.S. Treasury Obligations. | 27.2 | 99,731,683 | ||||||||||||||||||
Registered Investment Company | 7.9 | 28,840,831 | ||||||||||||||||||
Liabilities in Excess of Other Assets | (4.3 | ) | (15,588,238 | ) | ||||||||||||||||
|
|
|
| |||||||||||||||||
NET ASSETS | 100.0 | % | $ | 366,295,943 | ||||||||||||||||
|
|
|
| |||||||||||||||||
Portfolio holdings are subject to change at any time.
The accompanying notes are an integral part of the financial statements.
23
PACIFIC CAPITAL FUNDS
Pacific Capital U.S. Government Money Market Fund
Portfolio of Investments
October 31, 2019
(Unaudited)
| Principal Amount ($) | Value ($) | |||||||
U.S. GOVERNMENT AGENCY OBLIGATIONS — 69.2% |
| |||||||
Federal Home Loan Bank — 69.2% |
| |||||||
1.75%, 11/04/2019(a) | 10,600,000 | 10,598,454 | ||||||
2.04%, 11/05/2019(a) | 10,000,000 | 9,997,744 | ||||||
1.70%, 11/06/2019(a) | 20,000,000 | 19,995,278 | ||||||
1.83%, 11/08/2019(a) | 30,000,000 | 29,989,558 | ||||||
1.73%, 11/12/2019(a) | 10,000,000 | 9,994,714 | ||||||
1.50%, 11/13/2019(a) | 10,000,000 | 9,995,000 | ||||||
1.94%, 11/14/2019(a) | 15,000,000 | 14,989,546 | ||||||
1.79%, 11/18/2019(a) | 30,000,000 | 29,974,748 | ||||||
1.73%, 11/20/2019(a) | 15,000,000 | 14,986,344 | ||||||
1.94%, 11/25/2019(a) | 20,000,000 | 19,974,267 | ||||||
1.94%, 11/26/2019(a) | 15,000,000 | 14,979,896 | ||||||
1.94%, 11/27/2019(a) | 20,000,000 | 19,972,050 | ||||||
1.73%, 12/06/2019(a) | 13,000,000 | 12,978,135 | ||||||
1.67%, 12/19/2019(a) | 15,000,000 | 14,966,600 | ||||||
1.66%, 01/28/2020(a) | 20,000,000 | 19,919,333 | ||||||
|
| |||||||
| 253,311,667 | ||||||||
|
| |||||||
TOTAL U.S. GOVERNMENT AGENCY OBLIGATIONS | 253,311,667 | |||||||
|
| |||||||
U.S. TREASURY OBLIGATIONS — 27.2% |
| |||||||
U.S. Treasury Bills — 27.2% |
| |||||||
1.74%, 11/07/2019(b) | 10,000,000 | 9,996,650 | ||||||
1.95%, 11/29/2019(b) | 10,000,000 | 9,984,444 | ||||||
1.67%, 12/03/2019(b) | 10,000,000 | 9,984,844 | ||||||
1.85%, 12/19/2019(b) | 12,500,000 | 12,468,833 | ||||||
1.62%, 12/24/2019(b) | 20,000,000 | 19,951,711 | ||||||
1.86%, 01/02/2020(b) | 12,500,000 | 12,459,851 | ||||||
1.70%, 01/30/2020(b) | 10,000,000 | 9,957,500 | ||||||
| Principal Amount ($) | Value ($) | |||||||
U.S. TREASURY OBLIGATIONS — (Continued) |
| |||||||
U.S. Treasury Bills — (Continued) |
| |||||||
1.56%, 02/20/2020(b) | 15,000,000 | 14,927,850 | ||||||
|
| |||||||
| 99,731,683 | ||||||||
|
| |||||||
TOTAL U.S. TREASURY OBLIGATIONS | 99,731,683 | |||||||
|
| |||||||
| Shares | ||||||||
REGISTERED INVESTMENT COMPANY — 7.9% |
| |||||||
Dreyfus Government Cash Management Fund, Institutional Shares, 1.73%(c) | 28,840,831 | 28,840,831 | ||||||
|
| |||||||
TOTAL REGISTERED INVESTMENT COMPANY | 28,840,831 | |||||||
|
| |||||||
TOTAL INVESTMENTS - 104.3% |
| 381,884,181 | ||||||
LIABILITIES IN EXCESS OF OTHER ASSETS - (4.3)% | (15,588,238 | ) | ||||||
|
| |||||||
NET ASSETS - 100.0% | $ | 366,295,943 | ||||||
|
| |||||||
| (a) | Interest rate disclosed represents the discount rate at the time of purchase. |
| (b) | Rate disclosed represents theyield-to-maturity as of October 31, 2019. |
| (c) | Rate periodically changes. Rate disclosed is the7-day yield at October 31, 2019. |
Portfolio holdings are subject to change at any time.
The accompanying notes are an integral part of the financial statements.
24
PACIFIC CAPITAL FUNDS
Statements of Assets and Liabilities
October 31, 2019
(Unaudited)
| Pacific Capital Tax-Free Securities Fund | Pacific Capital Tax-Free Short Intermediate Securities Fund | Pacific Capital U.S. Government Money Market Fund | |||||||||||||
Assets | |||||||||||||||
Investments, at value* | $ | 281,275,124 | $ | 57,787,277 | $ | 381,884,181 | |||||||||
Receivable for capital shares sold | 160,494 | 17,673 | — | ||||||||||||
Interest receivable | 2,968,397 | 680,727 | 26,134 | ||||||||||||
Prepaid expenses and other assets | 17,217 | 1,521 | 65,079 | ||||||||||||
|
|
|
|
|
| ||||||||||
Total assets | 284,421,232 | 58,487,198 | 381,975,394 | ||||||||||||
|
|
|
|
|
| ||||||||||
Liabilities | |||||||||||||||
Payable for investments purchased | 3,274,737 | 1,681,715 | — | ||||||||||||
Payable for distributions to shareholders | 598,807 | 80,665 | — | ||||||||||||
Payable for capital shares redeemed | 54,335 | 50,823 | 15,566,452 | ||||||||||||
Payable for administration and accounting fees | 25,925 | 14,746 | 18,396 | ||||||||||||
Payable for legal fees | 20,202 | 6,058 | — | ||||||||||||
Payable for audit fees | 13,915 | 13,741 | 14,135 | ||||||||||||
Payable for custodian fees | 12,478 | 10,270 | 8,594 | ||||||||||||
Payable for printing fees | 9,214 | 2,804 | 1,804 | ||||||||||||
Payable for transfer agent fees | 5,821 | 5,894 | 5,270 | ||||||||||||
Payable for Trustees and Officers | 65 | 42 | — | ||||||||||||
Payable for distribution fees | — | — | 53,814 | ||||||||||||
Payable to Investment Adviser | — | — | 10,986 | ||||||||||||
Accrued expenses | 340 | 711 | — | ||||||||||||
|
|
|
|
|
| ||||||||||
Total liabilities | 4,015,839 | 1,867,469 | 15,679,451 | ||||||||||||
|
|
|
|
|
| ||||||||||
Net Assets | $ | 280,405,393 | $ | 56,619,729 | $ | 366,295,943 | |||||||||
|
|
|
|
|
| ||||||||||
Net Assets consisted of: | |||||||||||||||
Capital stock, $0.01 par value | $ | 268,595 | $ | 55,670 | $ | 3,662,958 | |||||||||
Paid-in capital | 267,667,499 | 55,799,035 | 362,600,566 | ||||||||||||
Total distributable earnings | 12,469,299 | 765,024 | 32,419 | ||||||||||||
|
|
|
|
|
| ||||||||||
Net Assets | $ | 280,405,393 | $ | 56,619,729 | $ | 366,295,943 | |||||||||
|
|
|
|
|
| ||||||||||
Class Y: | |||||||||||||||
Net assets | $ | 280,405,393 | $ | 56,619,729 | $ | — | |||||||||
|
|
|
|
|
| ||||||||||
Shares outstanding | 26,859,503 | 5,566,953 | — | ||||||||||||
|
|
|
|
|
| ||||||||||
Net asset value, offering and redemption price per share | $ | 10.44 | $ | 10.17 | $ | — | |||||||||
|
|
|
|
|
| ||||||||||
Investor Class: | |||||||||||||||
Net assets | $ | — | $ | — | $ | 366,295,943 | |||||||||
|
|
|
|
|
| ||||||||||
Shares outstanding | — | — | 366,295,840 | ||||||||||||
|
|
|
|
|
| ||||||||||
Net asset value, offering and redemption price per share | $ | — | $ | — | $ | 1.00 | |||||||||
|
|
|
|
|
| ||||||||||
| * Investments, at cost | $ | 267,203,929 | $ | 56,868,987 | $ | 381,884,181 | |||||||||
The accompanying notes are an integral part of the financial statements.
25
PACIFIC CAPITAL FUNDS
Statements of Operations
For the Six Months Ended October 31, 2019
(Unaudited)
| Pacific Capital Tax-Free Securities Fund | Pacific Capital Tax-Free Short Intermediate Securities Fund | Pacific Capital U.S. Government Money Market Fund | |||||||||||||
Investment income | |||||||||||||||
Interest | $ | 3,676,827 | $ | 526,232 | $ | 3,482,890 | |||||||||
Dividends | 28,872 | 25,757 | 153,419 | ||||||||||||
|
|
|
|
|
| ||||||||||
Total investment income | 3,705,699 | 551,989 | 3,636,309 | ||||||||||||
|
|
|
|
|
| ||||||||||
Expenses | |||||||||||||||
Advisory fees (Note 2) | 287,397 | 56,131 | 666,338 | ||||||||||||
Administration and accounting fees | 40,199 | 23,426 | 35,622 | ||||||||||||
Trustees’ and officers’ fees (Note 2) | 28,055 | 7,871 | 33,135 | ||||||||||||
Legal fees | 22,916 | 4,191 | 18,131 | ||||||||||||
Audit fees | 14,767 | 14,593 | 13,635 | ||||||||||||
Custodian fees (Note 2) | 11,722 | 4,176 | 15,875 | ||||||||||||
Transfer agent fees (Note 2) | 11,166 | 11,171 | 11,021 | ||||||||||||
Printing and shareholder reporting fees | 5,894 | 3,458 | 3,646 | ||||||||||||
Registration and filing fees | 86 | 100 | 5,956 | ||||||||||||
Distribution fees (Investor Class) (Note 2) | — | — | 416,461 | ||||||||||||
Offering expenses | — | — | 15,459 | ||||||||||||
Other expenses | 13,313 | 1,650 | 11,869 | ||||||||||||
|
|
|
|
|
| ||||||||||
Total expenses before waivers and reimbursements | 435,515 | 126,767 | 1,247,148 | ||||||||||||
|
|
|
|
|
| ||||||||||
Less: waivers and reimbursements (Note 2) | (287,397 | ) | (56,131 | ) | (645,731 | ) | |||||||||
|
|
|
|
|
| ||||||||||
Net expenses after waivers and reimbursements | 148,118 | 70,636 | 601,417 | ||||||||||||
|
|
|
|
|
| ||||||||||
Net investment income | 3,557,581 | 481,353 | 3,034,892 | ||||||||||||
|
|
|
|
|
| ||||||||||
Net realized and unrealized gain/(loss) from investments | |||||||||||||||
Net realized gain from investments | 103,626 | 24,719 | 1,174 | ||||||||||||
Net change in unrealized appreciation/(depreciation) on investments | 5,518,256 | 408,872 | — | ||||||||||||
|
|
|
|
|
| ||||||||||
Net realized and unrealized gain on investments | 5,621,882 | 433,591 | 1,174 | ||||||||||||
|
|
|
|
|
| ||||||||||
Net increase in net assets resulting from operations | $ | 9,179,463 | $ | 914,944 | $ | 3,036,066 | |||||||||
|
|
|
|
|
| ||||||||||
The accompanying notes are an integral part of the financial statements.
26
PACIFIC CAPITAL FUNDS
Pacific CapitalTax-Free Securities Fund
Statements of Changes in Net Assets
| Six Months Ended October 31, 2019 (Unaudited) | Year Ended April 30, 2019 | |||||||||
Increase/(decrease) in net assets from operations: | ||||||||||
Net investment income | $ | 3,557,581 | $ | 7,051,847 | ||||||
Net realized gain from investments | 103,626 | 20,043 | ||||||||
Net change in unrealized appreciation/(depreciation) on investments | 5,518,256 | 7,540,470 | ||||||||
|
|
|
| |||||||
Net increase in net assets resulting from operations | 9,179,463 | 14,612,360 | ||||||||
|
|
|
| |||||||
Less dividends and distributions to shareholders from: | ||||||||||
Total distributable earnings | (3,557,609 | ) | (7,051,814 | ) | ||||||
|
|
|
| |||||||
Decrease in net assets from dividends and distributions to shareholders | (3,557,609 | ) | (7,051,814 | ) | ||||||
|
|
|
| |||||||
Decrease in net assets derived from capital share transactions (Note 4) | (6,831,443 | ) | (15,114,487 | ) | ||||||
|
|
|
| |||||||
Total decrease in net assets | (1,209,589 | ) | (7,553,941 | ) | ||||||
|
|
|
| |||||||
Net assets | ||||||||||
Beginning of period | 281,614,982 | 289,168,923 | ||||||||
|
|
|
| |||||||
End of period | $ | 280,405,393 | $ | 281,614,982 | ||||||
|
|
|
| |||||||
The accompanying notes are an integral part of the financial statements.
27
PACIFIC CAPITAL FUNDS
Pacific CapitalTax-Free Short Intermediate Securities Fund
Statements of Changes in Net Assets
| Six Months Ended October 31, 2019 (Unaudited) | Year Ended April 30, 2019 | |||||||||
Increase/(decrease) in net assets from operations: | ||||||||||
Net investment income | $ | 481,353 | $ | 790,040 | ||||||
Net realized gain/(loss) from investments | 24,719 | (106,437 | ) | |||||||
Net change in unrealized appreciation/(depreciation) on investments | 408,872 | 849,209 | ||||||||
|
|
|
| |||||||
Net increase in net assets resulting from operations | 914,944 | 1,532,812 | ||||||||
|
|
|
| |||||||
Less dividends and distributions to shareholders from: | ||||||||||
Total distributable earnings | (481,293 | ) | (790,089 | ) | ||||||
|
|
|
| |||||||
Decrease in net assets from dividends and distributions to shareholders | (481,293 | ) | (790,089 | ) | ||||||
|
|
|
| |||||||
Increase in net assets derived from capital share transactions (Note 4) | 2,706,605 | 374,072 | ||||||||
|
|
|
| |||||||
Total increase in net assets | 3,140,256 | 1,116,795 | ||||||||
|
|
|
| |||||||
Net assets | ||||||||||
Beginning of period | 53,479,473 | 52,362,678 | ||||||||
|
|
|
| |||||||
End of period | $ | 56,619,729 | $ | 53,479,473 | ||||||
|
|
|
| |||||||
The accompanying notes are an integral part of the financial statements.
28
PACIFIC CAPITAL FUNDS
Pacific Capital U.S. Government Money Market Fund
Statements of Changes in Net Assets
| Six Months Ended October 31, 2019 (Unaudited) | For the Period June 14, 2018* to April 30, 2019 | |||||||||
Increase/(decrease) in net assets from operations: | ||||||||||
Net investment income. | $ | 3,034,892 | $ | 5,428,253 | ||||||
Net realized gain/(loss) from investments | 1,174 | (1,077 | ) | |||||||
|
|
|
| |||||||
Net increase in net assets resulting from operations | 3,036,066 | 5,427,176 | ||||||||
|
|
|
| |||||||
Less dividends and distributions to shareholders from: | ||||||||||
Total distributable earnings | (3,034,892 | ) | (5,428,253 | ) | ||||||
|
|
|
| |||||||
Decrease in net assets from dividends and distributions to shareholders | (3,034,892 | ) | (5,428,253 | ) | ||||||
|
|
|
| |||||||
Increase in net assets derived from capital share transactions (Note 4) | 42,402,297 | 323,893,549 | ||||||||
|
|
|
| |||||||
Total increase in net assets | 42,403,471 | 323,892,472 | ||||||||
|
|
|
| |||||||
Net assets | ||||||||||
Beginning of period | 323,892,472 | — | ||||||||
|
|
|
| |||||||
End of period | $ | 366,295,943 | $ | 323,892,472 | ||||||
|
|
|
| |||||||
| * | Commencement of operations. |
The accompanying notes are an integral part of the financial statements.
29
PACIFIC CAPITAL FUNDS
Pacific CapitalTax-Free Securities Fund
Financial Highlights
Contained below is per share operating performance data for Class Y shares outstanding, total investment return, ratios to average net assets and other supplemental data for the respective periods. The total returns in the table represent the rate that an investor would have earned or lost on an investment in the Fund (assuming reinvestment of all dividends and distributions). This information has been derived from information provided in the financial statements and should be read in conjunction with the financial statements and the notes thereto.
Class Y shares | For the Six Months Ended October 31, 2019 (Unaudited) | For the Year Ended April 30, 2019 | For the Year Ended April 30, 2018 | For the Year Ended April 30, 2017 | For the Year Ended April 30, 2016 | For the Year Ended April 30, 2015 | ||||||||||||||||||
Per Share Operating Performance | ||||||||||||||||||||||||
Net asset value, beginning of period | $ | 10.24 | $ | 9.97 | $ | 10.15 | $ | 10.41 | $ | 10.24 | $ | 10.18 | ||||||||||||
|
|
|
|
|
|
|
|
|
|
|
| |||||||||||||
Net investment income | 0.13 | 0.25 | 0.25 | 0.25 | 0.30 | 0.33 | ||||||||||||||||||
Net realized and unrealized gain/(loss) from investments | 0.20 | 0.27 | (0.18 | ) | (0.26 | ) | 0.17 | 0.06 | ||||||||||||||||
|
|
|
|
|
|
|
|
|
|
|
| |||||||||||||
Net increase/(decrease) in net assets resulting from operations. | 0.33 | 0.52 | 0.07 | (0.01 | ) | 0.47 | 0.39 | |||||||||||||||||
|
|
|
|
|
|
|
|
|
|
|
| |||||||||||||
Dividends and distributions to shareholders from: | ||||||||||||||||||||||||
Net investment income | (0.13 | ) | (0.25 | ) | (0.25 | ) | (0.25 | ) | (0.30 | ) | (0.33 | ) | ||||||||||||
|
|
|
|
|
|
|
|
|
|
|
| |||||||||||||
Net asset value, end of period. | $ | 10.44 | $ | 10.24 | $ | 9.97 | $ | 10.15 | $ | 10.41 | $ | 10.24 | ||||||||||||
|
|
|
|
|
|
|
|
|
|
|
| |||||||||||||
Total investment return(1) | 3.23 | % | 5.30 | % | 0.63 | % | (0.10 | )% | 4.63 | % | 3.87 | % | ||||||||||||
Ratios/Supplemental Data | ||||||||||||||||||||||||
Net assets, end of period (in thousands) | $ | 280,405 | $ | 281,615 | $ | 289,169 | $ | 314,733 | $ | 300,517 | $ | 211,289 | ||||||||||||
Ratio of expenses to average net assets | 0.10 | %* | 0.11 | % | 0.10 | % | 0.10 | % | 0.10 | % | 0.12 | % | ||||||||||||
Ratio of expenses to average net assets without waivers(2) | 0.30 | %* | 0.31 | % | 0.30 | % | 0.30 | % | 0.30 | % | 0.32 | % | ||||||||||||
Ratio of net investment income to average net assets | 2.48 | %* | 2.50 | % | 2.41 | % | 2.42 | % | 2.87 | % | 3.21 | % | ||||||||||||
Portfolio turnover rate | 6 | %** | 11 | % | 22 | % | 15 | % | 18 | % | 17 | % | ||||||||||||
| * | Annualized. |
| ** | Not Annualized. |
| (1) | Total investment return is calculated assuming a purchase of shares on the first day and a sale of shares on the last day of each period reported and includes reinvestment of dividends and distributions, if any. Total return for period less than one year is not annualized. |
| (2) | During the period, certain fees were waived. If such fee waivers had not occurred, the ratios would have been as indicated (See Note 2). |
The accompanying notes are an integral part of the financial statements.
30
PACIFIC CAPITAL FUNDS
Pacific CapitalTax-Free Short Intermediate Securities Fund
Financial Highlights
Contained below is per share operating performance data for Class Y shares outstanding, total investment return, ratios to average net assets and other supplemental data for the respective periods. The total returns in the table represent the rate that an investor would have earned or lost on an investment in the Fund (assuming reinvestment of all dividends and distributions). This information has been derived from information provided in the financial statements and should be read in conjunction with the financial statements and the notes thereto.
Class Y shares | For the Six Months Ended October 31, 2019 (Unaudited) | For the Year Ended April 30, 2019 | For the Year Ended April 30, 2018 | For the Year Ended April 30, 2017 | For the Year Ended April 30, 2016 | For the Year Ended April 30, 2015 | ||||||||||||||||||
Per Share Operating Performance | ||||||||||||||||||||||||
Net asset value, beginning of period | $ | 10.09 | $ | 9.95 | $ | 10.14 | $ | 10.27 | $ | 10.19 | $ | 10.17 | ||||||||||||
|
|
|
|
|
|
|
|
|
|
|
| |||||||||||||
Net investment income | 0.09 | 0.16 | 0.14 | 0.13 | 0.12 | 0.10 | ||||||||||||||||||
Net realized and unrealized gain/(loss) from investments | 0.08 | 0.14 | (0.19 | ) | (0.10 | ) | 0.08 | 0.02 | ||||||||||||||||
|
|
|
|
|
|
|
|
|
|
|
| |||||||||||||
Net increase/(decrease) in net assets resulting from operations | 0.17 | 0.30 | (0.05 | ) | 0.03 | 0.20 | 0.12 | |||||||||||||||||
|
|
|
|
|
|
|
|
|
|
|
| |||||||||||||
Dividends and distributions to shareholders from: | ||||||||||||||||||||||||
Net investment income | (0.09 | ) | (0.16 | ) | (0.14 | ) | (0.13 | ) | (0.12 | ) | (0.10 | ) | ||||||||||||
Net realized gains | — | — | (0.00 | )(1) | (0.03 | ) | — | — | ||||||||||||||||
|
|
|
|
|
|
|
|
|
|
|
| |||||||||||||
Total dividends and distributions and shareholders | (0.09 | ) | (0.16 | ) | (0.14 | ) | (0.16 | ) | (0.12 | ) | (0.10 | ) | ||||||||||||
|
|
|
|
|
|
|
|
|
|
|
| |||||||||||||
Net asset value, end of period | $ | 10.17 | $ | 10.09 | $ | 9.95 | $ | 10.14 | $ | 10.27 | $ | 10.19 | ||||||||||||
|
|
|
|
|
|
|
|
|
|
|
| |||||||||||||
Total investment return(2) | 1.66 | % | 3.01 | % | (0.49 | )% | 0.24 | % | 1.93 | % | 1.23 | % | ||||||||||||
Ratios/Supplemental Data | ||||||||||||||||||||||||
Net assets, end of period (in thousands) | $ | 56,620 | $ | 53,479 | $ | 52,363 | $ | 68,075 | $ | 90,438 | $ | 132,494 | ||||||||||||
Ratio of expenses to average net assets | 0.25 | %* | 0.34 | % | 0.25 | % | 0.25 | % | 0.15 | % | 0.13 | % | ||||||||||||
Ratio of expenses to average net assets without waivers(3) | 0.45 | %* | 0.54 | % | 0.45 | % | 0.45 | % | 0.35 | % | 0.33 | % | ||||||||||||
Ratio of net investment income to average net assets | 1.71 | %* | 1.57 | % | 1.36 | % | 1.24 | % | 1.12 | % | 1.02 | % | ||||||||||||
Portfolio turnover rate | 13 | %** | 34 | % | 27 | % | 19 | % | 19 | % | 24 | % | ||||||||||||
| * | Annualized. |
| ** | Not Annualized. |
| (1) | Amount is less than $0.005 per share. |
| (2) | Total investment return is calculated assuming a purchase of shares on the first day and a sale of shares on the last day of each period reported and includes reinvestment of dividends and distributions, if any. Total return for period less than one year is not annualized. |
| (3) | During the period, certain fees were waived. If such fee waivers had not occurred, the ratios would have been as indicated (See Note 2). |
The accompanying notes are an integral part of the financial statements.
31
PACIFIC CAPITAL FUNDS
Pacific Capital U.S. Government Money Market Fund
Financial Highlights
Contained below is per share operating performance data for Investor Class shares outstanding, total investment return, ratios to average net assets and other supplemental data for the respective periods. The total returns in the table represent the rate that an investor would have earned or lost on an investment in the Fund (assuming reinvestment of all dividends and distributions). This information has been derived from information provided in the financial statements and should be read in conjunction with the financial statements and the notes thereto.
Investor Class shares | For the Six Months Ended 2019 (Unaudited) | For the Period to April 30, 2019 | ||||||||||
Per Share Operating Performance | ||||||||||||
Net asset value, beginning of period | $ | 1.00 | $ | 1.00 | ||||||||
|
|
|
| |||||||||
Net investment income | 0.0092 | 0.0162 | ||||||||||
Net realized gain/(loss) from investments | 0.0000 | (2) | (0.0000 | )(2) | ||||||||
|
|
|
| |||||||||
Net increase in net assets resulting from operations | 0.0092 | 0.0162 | ||||||||||
|
|
|
| |||||||||
Dividends and distributions to shareholders from: | ||||||||||||
Net investment income | (0.0092 | ) | (0.0162 | ) | ||||||||
|
|
|
| |||||||||
Net asset value, end of period | $ | 1.00 | $ | 1.00 | ||||||||
|
|
|
| |||||||||
Total investment return(3) | 0.92 | % | 1.64 | % | ||||||||
Ratios/Supplemental Data | ||||||||||||
Net assets, end of period (in thousands) | $ | 366,296 | $ | 323,892 | ||||||||
Ratio of expenses to average net assets | 0.36 | %* | 0.33 | %* | ||||||||
Ratio of expenses to average net assets without waivers(4) | 0.75 | %* | 0.77 | %* | ||||||||
Ratio of net investment income to average net assets | 1.82 | %* | 1.88 | %* | ||||||||
| * | Annualized. |
| (1) | Commencement of operations. |
| (2) | Amount is less than $0.00005 per share. |
| (3) | Total investment return is calculated assuming a purchase of shares on the first day and a sale of shares on the last day of each period reported and includes reinvestment of dividends and distributions, if any. Total return for period less than one year is not annualized. |
| (4) | During the period, certain fees were waived and/or reimbursed. If such fee waivers and/or reimbursements had not occurred, the ratios would have been as indicated (See Note 2). |
The accompanying notes are an integral part of the financial statements.
32
PACIFIC CAPITAL FUNDS
Notes to Financial Statements
October 31, 2019
(Unaudited)
1. Organization and Significant Accounting Policies
The Pacific CapitalTax-Free Securities Fund, the Pacific CapitalTax-Free Short Intermediate Securities Fund and the Pacific Capital U.S. Government Money Market Fund (each a “Fund” and together the “Funds”) areopen-end management investment companies registered under the Investment Company Act of 1940, as amended (the “1940 Act”). The Pacific CapitalTax-Free Securities Fund and the Pacific CapitalTax-Free Short Intermediate Securities Fund arenon-diversified. The Pacific Capital U.S. Government Money Market Fund is diversified. The Funds are each a separate series of FundVantage Trust (the “Trust”) which was organized as a Delaware statutory trust on August 28, 2006. The Trust is a “series trust” authorized to issue an unlimited number of separate series or classes of shares of beneficial interest. Each series is treated as a separate entity for certain matters under the 1940 Act, and for other purposes, and a shareholder of one series is not deemed to be a shareholder of any other series. The Pacific CapitalTax-Free Securities Fund and the Pacific CapitalTax-Free Short Intermediate Securities Fund are each authorized to issue and offer Class Y shares. The Pacific Capital U.S. Government Money Market Fund commenced investment operations on June 14, 2018, and is authorized to issue and offer Investor Class shares.
The Funds are investment companies and follow accounting and reporting guidance in the Financial Accounting Standards BoardAccounting Standards CodificationTopic 946.
Portfolio Valuation— Each Fund’s net asset value (“NAV”) is calculated once daily at the close of regular trading hours on the New York Stock Exchange (“NYSE”) (typically 4:00 p.m. Eastern time) on each day the NYSE is open. Fixed income securities having a remaining maturity of greater than 60 days are valued using an independent pricing service. Fixed income securities having a remaining maturity of 60 days or less are generally valued at amortized cost, provided such amount approximates fair value. Debt securities are valued on the basis of broker quotations or valuations provided by a pricing service, which utilizes information with respect to recent sales, market transactions in comparable securities, quotations from dealers, and various relationships between securities in determining value. Valuations developed through pricing techniques may materially vary from the actual amounts realized upon sale of the securities. Investments in otheropen-end investment companies are valued based on the NAV of such investment companies (which may use fair value pricing as discussed in their prospectuses). If market quotations are unavailable or deemed unreliable, securities will be valued in accordance with procedures adopted by the Trust’s Board of Trustees (“Board of Trustees”). Relying on prices supplied by pricing services or dealers or using fair valuation may result in values that are higher or lower than the values used by other investment companies and investors to price the same investments. In the event that market quotes are not readily available, and the security or asset cannot be valued pursuant to one of the valuation methods, the value of the security or asset will be determined in good faith by the Adviser. The Trust has established a Valuation Committee which performs certain functions including the oversight of the Adviser’s fair valuation determinations.
33
PACIFIC CAPITAL FUNDS
Notes to Financial Statements (Continued)
October 31, 2019
(Unaudited)
The Pacific Capital U.S. Government Money Market Fund operates as a “government money market fund” and accordingly: (1) invests at least 99.5% of its total assets in: (i) cash; (ii) securities or instruments issued or guaranteed as to principal and interest by the United States or certain U.S. Government agencies or instrumentalities; and/or (iii) repurchase agreements that are collateralized fully by U.S. Government obligations or cash; (2) uses amortized cost, which approximates fair value, to value its portfolio securities and seeks to transact at a stable $1.00 NAV per Participation Certificate; and (3) has elected not to provide for the imposition of liquidity fees and redemption gates at this time as permitted under the amended rules.
Fair Value Measurements— The inputs and valuation techniques used to measure fair value of the Funds’ investments are summarized into three levels as described in the hierarchy below:
| · | Level 1 — | quoted prices in active markets for identical securities; | ||
| · | Level 2 — | other significant observable inputs (including quoted prices for similar securities, interest rates, prepayment speeds, credit risk, etc.); and | ||
| · | Level 3 — | significant unobservable inputs (including a Fund’s own assumptions in determining the fair value of investments). | ||
The fair value of a Fund’s bonds are generally based on quotes received from brokers or independent pricing services. Bonds with quotes that are based on actual trades with a sufficient level of activity on or near the measurement date are classified as Level 2 assets.
Securities held within the Pacific Capital U.S. Government Money Market Fund are generally valued at amortized cost, which approximates fair value, in accordance with Rule2a-7 under the 1940 Act. Generally, amortized cost approximates the current fair value of a security, but since the value is not obtained from a quoted price in an active market, such securities are reflected as Level 2.
The inputs or methodology used for valuing securities are not necessarily an indication of the risk associated with investing in those securities.
34
PACIFIC CAPITAL FUNDS
Notes to Financial Statements (Continued)
October 31, 2019
(Unaudited)
The following is a summary of the inputs used, as of October 31, 2019, in valuing the Funds’ investments carried at fair value:
Funds | Total Value at 10/31/19 | Level 1 Quoted Price | Level 2 Other Significant Observable Inputs | Level 3 Significant Unobservable Inputs | ||||||||||||
Pacific CapitalTax-Free Securities Fund | ||||||||||||||||
Municipal Bonds | $ | 279,132,641 | $ | — | $ | 279,132,641 | $ | — | ||||||||
Registered Investment Company | 2,142,483 | 2,142,483 | — | — | ||||||||||||
|
|
|
|
|
|
|
| |||||||||
Total | $ | 281,275,124 | $ | 2,142,483 | $ | 279,132,641 | $ | — | ||||||||
|
|
|
|
|
|
|
| |||||||||
Pacific CapitalTax-Free Short Intermediate Securities Fund | ||||||||||||||||
Municipal Bonds | $ | 55,204,126 | $ | — | $ | 55,204,126 | $ | — | ||||||||
Registered Investment Company | 2,583,151 | 2,583,151 | — | — | ||||||||||||
|
|
|
|
|
|
|
| |||||||||
Total | $ | 57,787,277 | $ | 2,583,151 | $ | 55,204,126 | $ | — | ||||||||
|
|
|
|
|
|
|
| |||||||||
Pacific Capital U.S. Government Money Market Fund | ||||||||||||||||
U.S. Government Agency Obligations | $ | 253,311,667 | $ | — | $ | 253,311,667 | $ | — | ||||||||
U.S. Treasury Obligations | 99,731,683 | — | 99,731,683 | — | ||||||||||||
Registered Investment Company | 28,840,831 | 28,840,831 | — | — | ||||||||||||
|
|
|
|
|
|
|
| |||||||||
Total | $ | 381,884,181 | $ | 28,840,831 | $ | 353,043,350 | $ | — | ||||||||
|
|
|
|
|
|
|
| |||||||||
At the end of each quarter, management evaluates the classification of Levels 1, 2 and 3 assets and liabilities. Various factors are considered, such as changes in liquidity from the prior reporting period; whether or not a broker is willing to execute at the quoted price; the depth and consistency of prices from third party pricing services; and the existence of contemporaneous, observable trades in the market. Additionally, management evaluates the classification of Level 1 and Level 2 assets and liabilities on a quarterly basis for changes in listings or delistings on national exchanges.
Due to the inherent uncertainty of determining the fair value of investments that do not have a readily available market value, the fair value of a Fund’s investments may fluctuate from period to period. Additionally, the fair value of investments may differ significantly from the values that would have been used had a ready market existed for such investments and may differ materially from the values a Fund may ultimately
35
PACIFIC CAPITAL FUNDS
Notes to Financial Statements (Continued)
October 31, 2019
(Unaudited)
realize. Further, such investments may be subject to legal and other restrictions on resale or otherwise less liquid than publicly traded securities.
For fair valuations using significant unobservable inputs, U.S. generally accepted accounting principles (“U.S. GAAP”) require the Funds to present a reconciliation of the beginning to ending balances for reported market values that present changes attributable to total realized and unrealized gains or losses, purchase and sales, and transfers in and out of Level 3 during the period. A reconciliation of Level 3 investments is presented only when the Funds have an amount of Level 3 investments at the end of the reporting period that was meaningful in relation to its net assets. The amounts and reasons for all transfers in and out of each Level within the three-tier hierarchy are disclosed when the Funds have an amount of total transfers during the reporting period that was meaningful in relation to its net assets as of the end of the reporting period.
For the six months ended October 31, 2019, there were no transfers in or out of Level 3.
Use of Estimates— The preparation of financial statements in conformity with U.S. GAAP requires management to make estimates and assumptions that affect the amounts reported in the financial statements and accompanying notes at the date of the financial statements and the reported amounts of revenues and expenses during the period. Actual results could differ from those estimates and those differences could be material.
Investment Transactions, Investment Income and Expenses— Investment transactions are recorded on trade date for financial statement preparation purposes. Realized gains and losses on investments sold are recorded on the identified cost basis. Interest income is recorded on the accrual basis. Accretion of discounts and amortization of premiums are recorded on a daily basis using the effective yield method except for short term securities, which records discounts and premiums on a straight-line basis. Dividends are recorded on theex-dividend date. Distribution(12b-1) fees and shareholder services fees relating to a specific class are charged directly to that class. General expenses of the Trust are generally allocated to each fund in proportion to its relative daily net assets. Expenses directly attributable to a particular fund in the Trust are charged directly to that fund.
Deferred Offering Costs —For the Pacific Capital U.S. Government Money Market Fund, offering costs, including costs of printing initial prospectus and legal fees, are amortized over twelve-months from inception of the Fund. As of October 31, 2019, the Fund has fully amortized all offering costs.
Dividends and Distributions to Shareholders— Dividends from net investment income for each Fund are declared daily and paid monthly to shareholders. Distributions, if any, of net short-term capital gain and net capital gain (the excess of net long-term capital gain over the short-term capital loss) realized by a Fund, after deducting any available capital loss carryovers are declared and paid to its shareholders
36
PACIFIC CAPITAL FUNDS
Notes to Financial Statements (Continued)
October 31, 2019
(Unaudited)
annually. Income dividends and capital gain distributions are determined in accordance with U.S. federal income tax regulations, which may differ from U.S. GAAP.
U.S. Tax Status— No provision is made for U.S. income taxes as it is each Fund’s intention to continue to qualify for and elect the tax treatment applicable to regulated investment companies under Subchapter M of the Internal Revenue Code of 1986, as amended (“Internal Revenue Code”), and make the requisite distributions to such Fund’s shareholders, which will be sufficient to relieve it from U.S. income and excise taxes.
Other— In the normal course of business, a Fund may enter into contracts that provide general indemnifications. A Fund’s maximum exposure under these arrangements is dependent on claims that may be made against it in the future, and, therefore, cannot be estimated; however, based on experience, the risk of material loss for such claims is considered remote.
Recent Regulatory Reporting Update and Accounting Pronouncement— In August 2018, the Financial Accounting Standards Board issued an Accounting Standards Update, ASU2018-13, Fair Value Measurement (Topic 820), Disclosure Framework – Changes to the Disclosure Requirements for Fair Value Measurement (the “2018 ASU”) which adds, modifies and removes disclosure requirements related to certain aspects of fair value measurement. The 2018 ASU is effective for fiscal years, and interim periods within those fiscal years, beginning after December 15, 2019. Early adoption is permitted. As of October 31, 2019, the Funds have fully adopted the provisions of the 2018 ASU, which did not have a material impact on the Funds’ financial statements and related disclosures or impact the Funds’ net assets or results of operations.
2. Transactions with Related Parties and Other Service Providers
Investment advisory services are provided to the Funds by the Asset Management Group of Bank of Hawaii (the “Adviser”). Under terms of an advisory agreement, the Pacific CapitalTax-Free Securities Fund and the Pacific CapitalTax-Free Short Intermediate Securities Fund are charged an annual fee of 0.20% which is computed daily and paid monthly based upon average daily net assets. The Adviser has contractually agreed to waive its advisory fee (the “Waiver”). The Waiver will remain in effect until August 31, 2021. The Waiver may not be terminated at any time prior to that date without the consent of the Board of Trustees of FundVantage Trust (the “Trust”). While the Adviser is currently waiving its entire investment advisory fee, investors who invest in a Fund through a bank trust account may be subject to account level fees applicable to such amount charged by affiliates of the Adviser, including Bank of Hawaii’s Trust Services Group.
37
PACIFIC CAPITAL FUNDS
Notes to Financial Statements (Continued)
October 31, 2019
(Unaudited)
Fee rates for the period ended October 31, 2019, were as follows:
| Maximum Annual Advisory Fee | Net Annual Fees Paid After Contractual Waivers | |||||||||
Pacific CapitalTax-Free Securities Fund | 0.20 | % | 0.00 | % | ||||||
Pacific CapitalTax-Free Short Intermediate Securities Fund | 0.20 | % | 0.00 | % | ||||||
For the Pacific Capital U.S. Government Money Market Fund, under terms of an advisory agreement, the Fund is charged an annual fee of 0.40% which is computed daily and paid monthly based upon average daily net assets. The Adviser has voluntarily agreed to reduce its advisory fee and/or reimburse certain expenses of the Fund to the extent necessary to maintain a minimum daily net yield for the Fund (the “MMF Waiver”). The MMF Waiver may be discontinued at any time at the discretion of the Adviser. For the six months ended October 31, 2019, the Adviser earned advisory fees of $666,338 and waived fees of $520,583 and reimbursed fees and expenses of $125,148.
Other Service Providers
The Bank of New York Mellon (“BNY Mellon”) serves as administrator and custodian for the Funds. For providing administrative and accounting services, BNY Mellon is entitled to receive a monthly fee equal to an annual percentage rate of the Funds’ average daily net assets and is subject to certain minimum monthly fees. For providing certain custodial services, BNY Mellon is entitled to receive a monthly fee, subject to certain minimum, and out of pocket expenses.
BNY Mellon Investment Servicing (US) Inc. (the “Transfer Agent”) provides transfer agent services to the Funds. The Transfer Agent is entitled to receive a monthly fee, subject to certain minimum, and out of pocket expenses.
Foreside Funds Distributors LLC (the “Underwriter”) provides principal underwriting services to the Funds pursuant to an underwriting agreement between the Trust and the Underwriter.
The Trust and the Underwriter are parties to an underwriting agreement. The Trust has adopted a distribution plan for Investor Class shares of the Pacific Capital U.S. Government Money Market Fund in accordance with Rule12b-1 under the 1940 Act. Pursuant to the distribution plan, the Fund compensates the Underwriter for direct and indirect costs and expenses incurred in connection with advertising, marketing and other distribution services in an amount not to exceed 0.25% on an annualized basis of the average daily net assets of the Fund’s Investor Class shares.
38
PACIFIC CAPITAL FUNDS
Notes to Financial Statements (Continued)
October 31, 2019
(Unaudited)
Trustees and Officers
The Trust is governed by its Board of Trustees. The Trustees receive compensation in the form of an annual retainer and per meeting fees for their services to the Trust. The remuneration paid to the Trustees by the Funds during the six months ended October 31, 2019 was $9,781 for the Pacific CapitalTax-Free Securities Fund, $1,795 for the Pacific CapitalTax-Free Short Intermediate Securities Fund and $13,176 for the Pacific Capital U.S. Government Money Market Fund, respectively. An employee of BNY Mellon serves as the Secretary of the Trust and is not compensated by the Funds or the Trust.
JW Fund Management LLC (“JWFM”) provides a Principal Executive Officer and Principal Financial Officer, respectively, to the Trust. Duff & Phelps, LLC (“D&P”) provides the Trust with a Chief Compliance Officer and an Anti-Money Laundering Officer. JWFM and D&P are compensated for their services provided to the Trust.
3. Investment in Securities
For the six months ended October 31, 2019, aggregate purchases and sales of investment securities (excluding short-term investments) of the Funds were as follows:
| Purchases | Sales | |||||||
Pacific CapitalTax-Free Securities Fund | $ | 16,564,742 | $ | 17,644,387 | ||||
Pacific CapitalTax-Free Short Intermediate Securities Fund | 10,882,927 | 6,816,708 | ||||||
The Funds are permitted to purchase or sell securities from or to certain other affiliated funds under specified conditions outlined in the procedures adopted by the Board of Trustees of the Funds. The procedures have been designed to provide assurances that any purchase or sale of securities by the Funds from or to another fund that is or could be considered an affiliate by virtue of having a common investment adviser (or affiliated investment adviser), common Trustees and/or common officers complies with Rule17a-7 under the 1940 Act. Further, as defined under the procedures, each transaction is effective at the current market price.
For the six months ended October 31, 2019, the Pacific CapitalTax-Free Securities Fund and the Pacific CapitalTax-Free Short Intermediate Securities Fund engaged in security transactions with affiliated funds under Rule17a-7. The Pacific CapitalTax-Free Securities Fund engaged in security sales with proceeds of $952,097 and net realized gain of $2,209. The Pacific CapitalTax-Free Short Intermediate Securities Fund engaged in security purchases of $2,002,337 under Rule17a-7.
39
PACIFIC CAPITAL FUNDS
Notes to Financial Statements (Continued)
October 31, 2019
(Unaudited)
4. Capital Share Transactions
For the six months ended October 31, 2019 and for the year or period ended April 30, 2019, transactions in capital shares (authorized shares unlimited) were as follows:
| For the Six Months Ended October 31, 2019 (Unaudited) | For the Year Ended April 30, 2019 | |||||||||||||||
Shares |
Amount |
Shares |
Amount | |||||||||||||
Pacific CapitalTax-Free Securities Fund | ||||||||||||||||
Class Y | ||||||||||||||||
Sales | 1,473,196 | $ | 15,338,496 | 2,640,506 | $ | 26,536,650 | ||||||||||
Reinvestments | 2,009 | 20,963 | 4,609 | 46,316 | ||||||||||||
Redemptions | (2,124,018 | ) | (22,190,902 | ) | (4,154,968 | ) | (41,697,453 | ) | ||||||||
|
|
|
|
|
|
|
| |||||||||
Net decrease | (648,813 | ) | $ | (6,831,443 | ) | (1,509,853 | ) | $ | (15,114,487 | ) | ||||||
|
|
|
|
|
|
|
| |||||||||
| For the Six Months Ended October 31, 2019 (Unaudited) | For the Year Ended April 30, 2019 | |||||||||||||||
Shares |
Amount |
Shares |
Amount | |||||||||||||
Pacific CapitalTax-Free Short Intermediate Securities Fund | ||||||||||||||||
Class Y | ||||||||||||||||
Sales | 651,622 | $ | 6,616,404 | 1,102,203 | $ | 11,045,479 | ||||||||||
Reinvestments | 256 | 2,603 | 478 | 4,783 | ||||||||||||
Redemptions | (385,159 | ) | (3,912,402 | ) | (1,067,544 | ) | (10,676,190 | ) | ||||||||
|
|
|
|
|
|
|
| |||||||||
Net increase | 266,719 | $ | 2,706,605 | 35,137 | $ | 374,072 | ||||||||||
|
|
|
|
|
|
|
| |||||||||
40
PACIFIC CAPITAL FUNDS
Notes to Financial Statements (Continued)
October 31, 2019
(Unaudited)
| For the Six Months Ended October 31, 2019 (Unaudited) | For the Period June 14, 2018* to April 30, 2019 | |||||||||||||||
Shares |
Amount |
Shares |
Amount | |||||||||||||
Pacific Capital U.S. Government Money Market Fund | ||||||||||||||||
Investor Class | ||||||||||||||||
Sales | 1,044,516,985 | $ | 1,044,516,985 | 2,343,451,670 | $ | 2,343,451,670 | ||||||||||
Reinvestments | 3,034,892 | 3,034,892 | 5,426,754 | 5,426,760 | ||||||||||||
Redemptions | (1,005,149,580 | ) | (1,005,149,580 | ) | (2,024,984,881 | ) | (2,024,984,881 | ) | ||||||||
|
|
|
|
|
|
|
| |||||||||
Net increase |
|
42,402,297 |
|
$ |
42,402,297 |
|
|
323,893,543 |
|
$ |
323,893,549 |
| ||||
|
|
|
|
|
|
|
| |||||||||
| * | Commencement of operations. |
5. Federal Tax Information
The Funds have followed the authoritative guidance on accounting for and disclosure of uncertainty in tax positions, which requires the Funds to determine whether a tax position is more likely than not to be sustained upon examination, including resolution of any related appeals or litigation processes, based on the technical merits of the position. The Funds have determined that there was no effect on the financial statements from following this authoritative guidance. In the normal course of business, the Funds are subject to examination by federal, state, and local jurisdictions, where applicable, for tax years for which applicable statutes of limitations have not expired.
The tax character of distributions paid during the year ended April 30, 2019, were as follows:
| Net Investment Income | Total Taxable Distributions | Tax Exempt Distributions | Total Distributions Paid* | |||||||||||||
Pacific CapitalTax-Free Securities Fund | $ | 53,432 | $ | 53,432 | $ | 6,525,946 | $ | 6,579,378 | ||||||||
Pacific CapitalTax-Free Short Intermediate Securities Fund | 34,167 | 34,167 | 696,962 | 731,129 | ||||||||||||
Pacific Capital U.S. Government Money Market Fund | 5,428,253 | 5,428,253 | — | 5,428,253 | ||||||||||||
| * | Distributions will not tie to Statement of Changes because distributions are recognized when actually paid for tax purposes. |
Distributions from net investment income and short-term capital gains are treated as ordinary income for federal income tax purposes.
41
PACIFIC CAPITAL FUNDS
Notes to Financial Statements (Continued)
October 31, 2019
(Unaudited)
As of April 30, 2019, the components of accumulated earnings/(deficit) on a tax basis were as follows:
| Undistributed Tax-Exempt Income | Undistributed Ordinary Income | Qualified Late-Year Losses | Distributions Payable | Capital Loss Carryforwards | Unrealized Appreciation/ (Depreciation) | |||||||||||||||||||||||||
Pacific CapitalTax-Free Securities Fund | $ | 571,685 | $ | — | $ | — | $ | (571,655 | ) | $ | (1,705,524 | ) | $ | 8,552,939 | ||||||||||||||||
Pacific CapitalTax-Free Short Intermediate Securities Fund | 58,911 | — | — | (69,908 | ) | (167,048 | ) | 509,418 | ||||||||||||||||||||||
Pacific Capital U.S. Government Money Market Fund | — | 32,322 | (1,077 | ) | — | — | — | |||||||||||||||||||||||
The differences between the book and tax basis components of distributable earnings relate primarily to the timing and recognition of income and gains for federal income tax purposes. Short-term capital gain is reported as ordinary income for federal income tax purposes.
The cost for federal income tax purposes, gross unrealized appreciation, gross unrealized depreciation and net unrealized appreciation as of October 31, 2019 is as follows:
| Tax Cost of Securities* | Unrealized Appreciation | Unrealized Depreciation | Net Unrealized Appreciation/ (Depreciation) | |||||||||||||
Pacific CapitalTax-Free Securities Fund | $ | 267,203,929 | $ | 14,074,473 | $ (3,278) | $14,071,195 | ||||||||||
Pacific CapitalTax-Free Short Intermediate Securities Fund | 56,868,987 | 934,871 | (16,581) | 918,290 | ||||||||||||
Pacific Capital U.S. Government Money Market Fund | 381,884,181 | — | — | — | ||||||||||||
| * | Because tax adjustments are calculated annually at the end of the Funds’ fiscal year, the above table does not reflect tax adjustments for the current fiscal year. For the previous year’s federal income tax information, please refer to the Notes to Financial Statements section in the Funds’ most recent annual report. |
42
PACIFIC CAPITAL FUNDS
Notes to Financial Statements (Continued)
October 31, 2019
(Unaudited)
Pursuant to federal income tax rules applicable to regulated investment companies, the Funds may elect to treat certain capital losses between November 1 and April 30 and late year ordinary losses ((i) ordinary losses between January 1 and April 30, and (ii) specified ordinary and currency losses between November 1 and April 30) as occurring on the first day of the following tax year. For the year ended April 30, 2019, any amount of losses elected within the tax return will not be recognized for federal income tax purposes until May 1, 2019. For the year ended April 30, 2019, the Funds did not have late year ordinary loss deferrals and they deferred to May 1, 2019 the following losses:
| Short-Term Capital Loss Deferral | Long-Term Capital Loss Deferral | |||||||||
Pacific CapitalTax-Free Securities Fund | $ | — | $ | — | ||||||
Pacific CapitalTax-Free Short Intermediate Securities Fund | — | — | ||||||||
Pacific Capital U.S. Government Money Market Fund | 1,077 | — | ||||||||
Accumulated capital losses represent net capital loss carryforwards as of April 30, 2019 that may be available to offset future realized capital gains and thereby reduce future capital gains distributions. As of April 30, 2019, the Funds’ capital loss carryforward, which were comprised of both short-term losses and long-term losses, and had an unlimited period of capital loss carryover were as follows:
| Capital Loss Carryforward | ||||||||
| Short-Term | Long-Term | |||||||
Pacific CapitalTax-Free Securities Fund | $ | 1,141,616 | $ | 563,908 | ||||
Pacific CapitalTax-Free Short Intermediate Securities Fund | 42,664 | 124,384 | ||||||
Pacific Capital U.S. Government Money Market Fund | — | — | ||||||
6. Concentration of Credit Risk
The Pacific CapitalTax-Free Securities Fund and the Pacific CapitalTax-Free Short Intermediate Securities Fund primarily invest in debt obligations issued by the state of Hawaii and its political subdivisions, agencies, and public authorities to obtain funds for various public purposes. The Funds are more susceptible to factors adversely affecting issues of Hawaii municipal securities than is a municipal bond fund that is not concentrated in these issuers to the same extent.
43
PACIFIC CAPITAL FUNDS
Notes to Financial Statements (Concluded)
October 31, 2019
(Unaudited)
7. Debt Investment Risk
Debt investments are affected primarily by the financial condition of the companies or other entities that have issued them and by changes in interest rates. There is a risk that an issuer of a Fund’s debt investments may not be able to meet its financial obligations (e.g., may not be able to make principal and/or interest payments when they are due or otherwise default on other financial terms) and/or go bankrupt. Securities such as high-yield/high-risk bonds, e.g., bonds with low credit ratings by Moody’s (Ba or lower) or Standard & Poor’s (BB and lower) or if unrated are of comparable quality as determined by the manager, are especially subject to credit risk during periods of economic uncertainty or during economic downturns and are more likely to default on their interest and/or principal payments than higher rated securities. Debt investments may be affected by changes in interest rates. Debt investments with longer durations tend to be more sensitive to changes in interest rates, making them more volatile than debt investments with shorter durations or floating or adjustable interest rates. The value of debt investments may fall when interest rates rise.
8. U.S. Government Obligations Risk
Obligations of U.S. Government agencies, authorities, instrumentalities and sponsored enterprises have historically involved little risk of loss of principal if held to maturity. However, not all U.S. Government securities are backed by the full faith and credit of the United States. Obligations of certain agencies, authorities, instrumentalities and sponsored enterprises of the U.S. Government are backed by the full faith and credit of the United States (e.g., the Government National Mortgage Association); other obligations are backed by the right of the issuer to borrow from the U.S. Treasury (e.g., the Federal Home Loan Banks) and others are supported by the discretionary authority of the U.S. Government to purchase an agency’s obligations. Still others are backed only by the credit of the agency, authority, instrumentality or sponsored enterprise issuing the obligation. No assurance can be given that the U.S. Government would provide financial support to any of these entities if it is not obligated to do so by law.
9. Subsequent Events
Management has evaluated the impact of all subsequent events on the Funds through the date that the financial statements were issued, and has determined that there are no material subsequent events requiring recognition or disclosure in the financial statements.
44
PACIFIC CAPITAL FUNDS
Other Information
(Unaudited)
Proxy Voting
Policies and procedures that the Funds use to determine how to vote proxies relating to portfolio securities as well as information regarding how the Funds voted proxies relating to portfolio securities for the most recent12-month period ended June 30 are available without charge, upon request, by calling (888)678-6034 and on the Securities and Exchange Commission’s (“SEC”) website at http://www.sec.gov.
Quarterly Portfolio Schedules
The Trust files its complete schedule of portfolio holdings with the SEC for the first and third fiscal quarters of each fiscal year (quarters ended July 31 and January 31) on FormN-Q. The Trust’s FormsN-Q are available on the SEC’s website at http://www.sec.gov. FormN-Q is being rescinded. Once FormN-Q is rescinded, disclosure of the Funds’ complete holdings will be required to be made monthly on FormN-PORT, with every third month made available to the public by the Commission upon filing.
45
PACIFIC CAPITAL FUNDS
Privacy Notice
(Unaudited)
The privacy of your personal financial information is extremely important to us. When you open an account with us, we collect a significant amount of information from you in order to properly invest and administer your account. We take very seriously the obligation to keep that information private and confidential, and we want you to know how we protect that important information.
We collect nonpublic personal information about you from applications or other forms you complete and from your transactions with us or our affiliates. We do not disclose information about you, or our former clients, to our affiliates or to service providers or other third parties, except as permitted by law. We share only the information required to properly administer your accounts, which enables us to send transaction confirmations, monthly or quarterly statements, financials and tax forms. Even within FundVantage Trust and its affiliated entities, a limited number of people who actually service accounts will have access to your personal financial information. Further, we do not share information about our current or former clients with any outside marketing groups or sales entities.
To ensure the highest degree of security and confidentiality, FundVantage Trust and its affiliates maintain various physical, electronic and procedural safeguards to protect your personal information. We also apply special measures for authentication of information you request or submit to us on our web site.
If you have questions or comments about our privacy practices, please call us at (888)678-6034.
46
[THIS PAGE INTENTIONALLY LEFT BLANK.]
Investment Adviser
Asset Management Group of Bank of Hawaii
130 Merchant Street, Suite 370
Honolulu, HI 96813
Administrator
The Bank of New York Mellon
301 Bellevue Parkway
Wilmington, DE 19809
Transfer Agent
BNY Mellon Investment Servicing (US) Inc.
4400 Computer Drive
Westborough, MA 01581
Principal Underwriter
Foreside Funds Distributors LLC
400 Berwyn Park
899 Cassatt Road
Berwyn, PA 19312
Custodian
The Bank of New York Mellon
240 Greenwich Street
New York, NY 10286
Independent Registered Public Accounting Firm
PricewaterhouseCoopers LLP
Two Commerce Square, Suite 1800
2001 Market Street
Philadelphia, PA 19103-7042
Legal Counsel
Pepper Hamilton LLP
3000 Two Logan Square
18th and Arch Streets
Philadelphia, PA 19103
PAC-1019

of
FundVantage Trust
Pacific CapitalTax-Free
Securities Fund
Pacific CapitalTax-Free
Short Intermediate Securities Fund
Pacific Capital U.S. Government
Money Market Fund
SEMI-ANNUAL REPORT
October 31, 2019
(Unaudited)
IMPORTANT NOTE: Beginning on January 1, 2021, paper copies of the Pacific Capital Funds’ annual and semi-annual shareholder reports will no longer be sent by mail, unless you specifically request paper copies of the shareholder reports from the Pacific Capital Funds or from your financial intermediary. Instead, annual and semi-annual shareholder reports will be available on the Pacific Capital Funds’ websites (www.boh.com/wealth-management/solutions/mutual-funds-investment-products.asp andwww.boh.com/personal/non-banking-products/mutual-funds-investment-products.asp), and you will be notified by mail each time a report is posted and provided with a website link to access the report.
You may elect to receive all future annual and semi-annual shareholder reports in paper, free of charge. To elect to receive paper copies of shareholder reports through the mail or otherwise change your delivery method, contact your financial intermediary or, if you hold your shares directly through the Pacific Capital Funds, call the Pacific Capital Funds toll-free at (888)678-6034 or write to the Pacific Capital Funds at:
Pacific Capital Funds
FundVantage Trust
c/o BNY Mellon Investment Servicing
P.O. Box 9829
Providence, RI 02940-8029
Your election to receive shareholder reports in paper will apply to all Pacific Capital Funds that you hold through the financial intermediary, or directly with the Pacific Capital Funds.
This report is submitted for the general information of the shareholders of the Pacific Capital Funds. It is not authorized for distribution unless preceded or accompanied by a current prospectus for the Pacific Capital Funds.
POLEN GROWTH FUND
Semi-Annual Report
Performance Data
October 31, 2019
(Unaudited)
| Average Annual Total Returns for the Periods Ended October 31, 2019 | |||||||||||||||||||||||||
| Six Months† | 1 Year | 3 Year | 5 Year | Since Inception* | |||||||||||||||||||||
Institutional Class | 4.58 | % | 22.03 | % | 20.96 | % | 16.16 | % | 16.02 | % | |||||||||||||||
S&P 500®Index | 4.16 | % | 14.33 | % | 14.91 | % | 10.79 | % | 13.89 | %*** | |||||||||||||||
Russell 1000®Growth Index | 4.47 | % | 17.10 | % | 18.92 | % | 13.44 | % | 15.72 | %*** | |||||||||||||||
| Six Months† | 1 Year | 3 Year | 5 Year | Since Inception** | |||||||||||||||||||||
Investor Class | 4.45 | % | 21.72 | % | 20.64 | % | 15.87 | % | 14.54 | % | |||||||||||||||
S&P 500®Index | 4.16 | % | 14.33 | % | 14.91 | % | 10.79 | % | 12.81 | %*** | |||||||||||||||
Russell 1000®Growth Index | 4.47 | % | 17.10 | % | 18.92 | % | 13.44 | % | 14.38 | %*** | |||||||||||||||
| † | Not Annualized. |
| * | The Polen Growth Fund (the “Fund”) Institutional Class shares commenced operations on September 15, 2010. |
| ** | The Fund’s Investor Class shares commenced operations on December 30, 2010. |
| *** | Benchmark performance is from the commencement date of the Fund Class only and is not the commencement date of the benchmark itself. |
The performance data quoted represents past performance and does not guarantee future results. Current performance may be lower or higher. Performance data current to the most recentmonth-end may be obtained by calling (888)678-6024. The investment return and principal value of an investment will fluctuate so that shares, when redeemed, may be worth more or less than their original cost. The table does not reflect the deduction of taxes that a shareholder would pay on Fund distributions or the redemption of Fund shares.
The Fund’s “Total Annual Fund Operating Expenses” as stated in the current prospectus dated September 1, 2019, are 1.00% for the Institutional Class shares and 1.25% for the Investor Class shares, respectively, of the Fund’s average daily net assets, which may differ from the actual expenses incurred by the Fund for the period covered by this report. Polen Capital Management, LLC (“PCM” or the “Adviser”) has contractually agreed to reduce its investment advisory fee and/or reimburse certain expenses of the Fund to the extent necessary to ensure that the Fund’s total operating expenses (excluding taxes, fees and expenses attributable to a distribution or service plan adopted by the Trust, interest, extraordinary items, “Acquired Fund Fees and Expenses” and brokerage commissions) do not exceed 1.00% (on an annual basis) with respect to the Fund’s average daily net assets (the “Expense Limitation”). The Expense Limitation will remain in place until August 31, 2020 unless the Board of Trustees (“Board of Trustees”) of FundVantage Trust (the “Trust”) approves its earlier termination. The Adviser is entitled to recover, subject to approval by the Board of Trustees, any fees waived and/or expenses reimbursed by the Adviser on or after January 1, 2017 with respect to the Fund for a three (3) year period following the date of such fee waiver and/or expense reimbursement. The Adviser is permitted to seek reimbursement from the Fund, subject to certain limitations, for fees it waived and Fund expenses it paid to the extent the total annual fund operating expenses do not exceed the limits described above or any lesser limits in effect at the time of reimbursement. No recoupment will occur unless the Fund’s expenses are below the Expense Limitation amount. Total returns would be lower had such fees and expenses not been waived and/or reimbursed.
1
POLEN GROWTH FUND
Semi-Annual Report
Performance Data
October 31, 2019
(Unaudited)
A 2.00% redemption fee applies to shares redeemed within 60 days of purchase. This redemption fee is not reflected in the returns shown above.
The Fund intends to evaluate performance as compared to that of the Standard & Poor’s 500 (“S&P 500®”) Index and the Russell 1000® Growth Index. The S&P 500® Index is a widely recognized, unmanaged index of 500 common stocks which are generally representative of the U.S. stock market as a whole. The Russell 1000® Growth Index is an unmanaged index that measures the performance of thelarge-cap growth segment of the U.S. equity universe. It includes those Russell 1000® Growth Index companies with higherprice-to-book ratios and higher forecasted growth values. It is impossible to invest directly in an index.
All mutual fund investing involves risk, including possible loss of principal. The Fund isnon-diversified, which means that a large portion of the Fund’s assets may be invested in one or few companies or sectors. The Fund could fluctuate in value more than a diversified fund.
2
POLEN GLOBAL GROWTH FUND
Semi-Annual Report
Performance Data
October 31, 2019
(Unaudited)
| Average Annual Total Returns for the Periods Ended October 31, 2019 | ||||||||||||||||||||||||||
| Six Months† | 1 Year | 3 Year | Since Inception* | |||||||||||||||||||||||
| Institutional Class | 3.98 | % | 22.27 | % | 19.08 | % | 13.44 | % | ||||||||||||||||||
| MSCI All Country World®Index (“ACWI”)(Net Dividend) | 2.95 | % | 2.95 | % | 11.34 | % | 7.14 | %*** | ||||||||||||||||||
| Six Months† | 1 Year | 3 Year | Since Inception** | |||||||||||||||||||||||
| Investor Class | 3.84 | % | 21.92 | % | 18.76 | % | 14.00 | % | ||||||||||||||||||
| MSCI All Country World®Index (“ACWI”)(Net Dividend) | 2.95 | % | 2.95 | % | 11.34 | % | 7.44 | %*** | ||||||||||||||||||
| † | Not Annualized. |
| * | The Polen Global Growth Fund (the “Fund”) Institutional Class shares commenced operations on December 30, 2014. |
| ** | The Fund’s Investor Class shares commenced operations on July 6, 2015. |
| *** | Benchmark performance is from the commencement date of the Fund Class only and is not the commencement date of the benchmark itself. |
The performance data quoted represents past performance and does not guarantee future results. Current performance may be lower or higher. Performance data current to the most recentmonth-end may be obtained by calling (888)678-6024. The investment return and principal value of an investment will fluctuate so that shares, when redeemed, may be worth more or less than their original cost. The table does not reflect the deduction of taxes that a shareholder would pay on Fund distributions or the redemption of Fund shares.
The Fund’s “Total Annual Fund Operating Expenses” and “Total Annual Fund Operating Expenses After Fee Waiver and/or Expense Reimbursement”, as stated in the current prospectus dated September 1, 2019, are 1.31% and 1.10%, respectively, for the Institutional Class shares and 1.56% and 1.35%, respectively, for the Investor Class shares of the Fund’s average daily net assets, which may differ from the actual expenses incurred by the Fund for the period covered by this report. Polen Capital Management, LLC (“PCM” or the “Adviser”) has contractually agreed to reduce its investment advisory fee and/or reimburse certain expenses of the Fund to the extent necessary to ensure that the Fund’s total operating expenses (excluding taxes, fees and expenses attributable to a distribution or service plan adopted by the Trust, interest, extraordinary items, “Acquired Fund Fees and Expenses” and brokerage commissions) do not exceed 1.10% (on an annual basis) with respect to the Fund’s average daily net assets (the “Expense Limitation”). The Expense Limitation will remain in place until August 31, 2020 unless the Board of Trustees (“Board of Trustees”) of FundVantage Trust (the “Trust”) approves its earlier termination. The Adviser is entitled to recover, subject to approval by the Board of Trustees, such amounts reduced or reimbursed for a period of up to three (3) years from the date on which the Adviser reduced its compensation and/or assumed expenses for the Fund. The Adviser is permitted to seek reimbursement from the Fund, subject to certain limitations, for fees it waived and Fund expenses it paid to the extent the total annual fund operating expenses do not exceed the limits described above or any lesser limits in effect at the time of reimbursement. No recoupment will occur unless the Fund’s expenses
3
POLEN GLOBAL GROWTH FUND
Semi-Annual Report
Performance Data
October 31, 2019
(Unaudited)
are below the Expense Limitation amount. Total returns would be lower had such fees and expenses not been waived and/or reimbursed.
A 2.00% redemption fee applies to shares redeemed within 60 days of purchase. This redemption fee is not reflected in the returns shown above.
The Fund intends to evaluate performance as compared to that of the MSCI ACWI Index (Net Dividend), which captures large andmid-cap representation across 23 Developed Markets (DM) and 26 Emerging Markets (EM) countries. With 2,853 constituents, the index covers approximately 85% of the global investable equity opportunity set. Indexes are unmanaged and it is not possible to invest directly in an index.
All mutual fund investing involves risk, including possible loss of principal. The Fund isnon-diversified, which means that a large portion of the Fund’s assets may be invested in one or few companies or sectors. The Fund could fluctuate in value more than a diversified fund. Investing in foreign securities entails special risks, such as fluctuations in currency exchange rates and possible lax regulation of securities markets and accounting practices.
The Fund may invest a substantial amount of its assets in issuers located in a limited number of countries. If the Fund concentrates its investments in this manner, it assumes the risk that economic, political and social conditions in those countries will have a significant impact on its investment performance. The Fund’s investment performance may also be more volatile if it concentrates its investments in certain countries, especially emerging market countries.
4
POLEN INTERNATIONAL GROWTH FUND
Semi-Annual Report
Performance Data
October 31, 2019
(Unaudited)
| Average Annual Total Returns for the Periods Ended October 31, 2019 |
| ||||||||||||||
Six Months† | 1 Year | Since Inception* | |||||||||||||
Institutional Class | 2.16 | % | 14.47 | % | 14.75 | % | |||||||||
MSCI All Country World®Index (“ACWI”)(ex-USA) | 1.96 | % | 11.26 | % | 25.18 | %*** | |||||||||
Six Months† | 1 Year | Since Inception** | |||||||||||||
Investor Class | 1.96 | % | 14.08 | % | 11.89 | % | |||||||||
MSCI All Country World®Index (“ACWI”)(ex-USA) | 1.96 | % | 11.26 | % | 6.77 | %*** | |||||||||
| † | Not Annualized. |
| * | The Polen International Growth Fund (the “Fund”) Institutional Class shares commenced operations on December 30, 2016. |
| ** | The Fund’s Investor Class shares commenced operations on March 15, 2017. |
| *** | Benchmark performance is from the commencement date of the Fund Class only and is not the commencement date of the benchmark itself. |
The performance data quoted represents past performance and does not guarantee future results. Current performance may be lower or higher. Performance data current to the most recentmonth-end may be obtained by calling (888)678-6024. The investment return and principal value of an investment will fluctuate so that shares, when redeemed, may be worth more or less than their original cost. The table does not reflect the deduction of taxes that a shareholder would pay on Fund distributions or the redemption of Fund shares.
The Fund’s “Total Annual Fund Operating Expenses” and “Total Annual Fund Operating Expenses After Fee Waiver and/or Expense Reimbursement”, as stated in the current prospectus dated September 1, 2019, are 1.40% and 1.10%, respectively, for the Institutional Class shares and 1.65% and 1.35%, respectively, for the Investor Class shares of the Fund’s average daily net assets, which may differ from the actual expenses incurred by the Fund for the period covered by this report. Polen Capital Management, LLC (“PCM” or the “Adviser”) has contractually agreed to reduce its investment advisory fee and/or reimburse certain expenses of the Fund to the extent necessary to ensure that the Fund’s total operating expenses (excluding taxes, fees and expenses attributable to a distribution or service plan adopted by the Trust, interest, extraordinary items, “Acquired Fund Fees and Expenses” and brokerage commissions) do not exceed 1.10% (on an annual basis) with respect to the Fund’s average daily net assets (the “Expense Limitation”). The Expense Limitation will remain in place until August 31, 2020 unless the Board of Trustees (“Board of Trustees”) of FundVantage Trust (the “Trust”) approves its earlier termination. The Adviser is entitled to recover, subject to approval by the Board of Trustees, any fees waived and/or expenses reimbursed for a three (3) year period following the date of such fee waiver and/or expense reimbursement. The Adviser is permitted to seek reimbursement from the Fund, subject to certain limitations, for fees it waived and Fund expenses it paid to the extent the total annual fund operating expenses do not exceed the limits described above or any lesser limits in effect at the time of reimbursement. No recoupment will occur unless the Fund’s expenses are below the Expense Limitation amount. Total returns would be lower had such fees and expenses not been waived and/or reimbursed.
5
POLEN INTERNATIONAL GROWTH FUND
Semi-Annual Report
Performance Data
October 31, 2019
(Unaudited)
A 2.00% redemption fee applies to shares redeemed within 60 days of purchase. This redemption fee is not reflected in the returns shown above.
The Fund intends to evaluate performance as compared to that of the MSCI ACWI(ex-USA), which captures large andmid-cap representation across 22 of 23 Developed Markets (DM) countries (excluding the US) and 26 Emerging Markets (EM) countries. With 2,217 constituents, the index covers approximately 85% of the global equity opportunity set outside the US. Indexes are unmanaged and it is not possible to invest directly in an index.
All mutual fund investing involves risk, including possible loss of principal. The Fund isnon-diversified, which means that a large portion of the Fund’s assets may be invested in one or few companies or sectors. The Fund could fluctuate in value more than a diversified fund. Investing in foreign securities entails special risks, such as fluctuations in currency exchange rates and possible lax regulation of securities markets and accounting practices.
The Fund may invest a substantial amount of its assets in issuers located in a limited number of countries. If the Fund concentrates its investments in this manner, it assumes the risk that economic, political and social conditions in those countries will have a significant impact on its investment performance. The Fund’s investment performance may also be more volatile if it concentrates its investments in certain countries, especially emerging market countries.
6
POLEN U.S. SMALL COMPANY GROWTH FUND
Semi-Annual Report
Performance Data
October 31, 2019
(Unaudited)
| Average Annual Total Returns for the Periods Ended October 31, 2019 |
| ||||||||||||||
Six Months† | 1 Year | Since Inception* | |||||||||||||
Institutional Class | -4.02 | % | 12.41 | % | 9.31 | % | |||||||||
Russell 2000®Growth Index | -1.73 | % | 6.41 | % | 5.28 | %*** | |||||||||
Six Months† | Since Inception** | ||||||||||||||
Investor Class | -4.11 | % | 3.21 | % | |||||||||||
Russell 2000®Growth Index | -1.73 | % | 6.04 | %*** | |||||||||||
| † | Not Annualized. |
| * | The Polen U.S. Small Company Growth Fund (the “Fund”) Institutional Class shares commenced operations on November 1, 2017. |
| ** | The Fund’s Investor Class shares commenced operations on February 8, 2019. |
| *** | Benchmark performance is from the commencement date of the Fund Class only and is not the commencement date of the benchmark itself. |
The performance data quoted represents past performance and does not guarantee future results. Current performance may be lower or higher. Performance data current to the most recentmonth-end may be obtained by calling (888)678-6024. The investment return and principal value of an investment will fluctuate so that shares, when redeemed, may be worth more or less than their original cost. The table does not reflect the deduction of taxes that a shareholder would pay on Fund distributions or the redemption of Fund shares.
The Fund’s “Total Annual Fund Operating Expenses” and “Total Annual Fund Operating Expenses After Fee Waiver and/or Expense Reimbursement”, as stated in the current prospectus dated September 1, 2019, are 3.38% and 1.25%, respectively, for the Institutional Class shares and 3.63% and 1.50%, respectively, for the Investor Class shares of the Fund’s average daily net assets, which may differ from the actual expenses incurred by the Fund for the period covered by this report. Polen Capital Management, LLC (“PCM” or the “Adviser”) has contractually agreed to reduce its investment advisory fee and/or reimburse certain expenses of the Fund to the extent necessary to ensure that the Fund’s total operating expenses (excluding taxes, fees and expenses attributable to a distribution or service plan adopted by the Trust, interest, extraordinary items, “Acquired Fund Fees and Expenses” and brokerage commissions) do not exceed 1.25% (on an annual basis) with respect to the Fund’s average daily net assets (the “Expense Limitation”). The Expense Limitation will remain in place until August 31, 2020 unless the Board of Trustees (“Board of Trustees”) of FundVantage Trust (the “Trust”) approves its earlier termination. The Adviser is entitled to recover, subject to approval by the Board of Trustees, such amounts reduced or reimbursed for a period of up to three (3) years from the date on which the Adviser reduced its compensation and/or assumed expenses for the Fund. The Adviser is permitted to seek reimbursement from the Fund for fees it waived and Fund expenses it paid to the extent the total annual fund expenses do not exceed the limits described above or any lesser limits in effect at the time of reimbursement. No reimbursement will occur unless the Fund’s expenses are below the Expense Limitation. Total returns would be lower had such fees and expenses not been waived and/or reimbursed.
A 2.00% redemption fee applies to shares redeemed within 60 days of purchase. This redemption fee is not reflected in the returns shown above.
7
POLEN U.S. SMALL COMPANY GROWTH FUND
Semi-Annual Report
Performance Data
October 31, 2019
(Unaudited)
The Fund intends to evaluate performance as compared to that of the Russell 2000® Growth Index, which is an unmanaged index measuring the performance of the 2,000 smallest companies in the Russell 3000® Index, which is made up of 3,000 of the biggest U.S. stocks. It is impossible to invest directly in an index.
All mutual fund investing involves risk, including possible loss of principal. The Fund isnon-diversified, which means that a large portion of the Fund’s assets may be invested in one or few companies or sectors. The Fund could fluctuate in value more than a diversified fund. The Fund invests in securities of small-capitalization companies, which may be subject to more abrupt or erratic market movements than securities of larger, more established companies. Small-capitalization companies may have limited product lines or financial resources, or may be dependent upon a small or inexperienced management group. Securities of small-capitalization companies may trade less frequently and in lower volumes than the securities of larger companies, which could lead to higher transaction costs.
8
POLEN INTERNATIONAL SMALL COMPANY GROWTH FUND
Semi-Annual Report
Performance Data
October 31, 2019
(Unaudited)
| Total Returns for the Periods Ended October 31, 2019 | ||||||||
| Six Months† | Since Inception* | |||||||
| Institutional Class | 5.87% | 26.30% | ||||||
| MSCI All Country World®Index (“ACWI”)(ex-USA Small Cap) | 1.81% | 7.10%*** | ||||||
| Six Months† | Since Inception** | |||||||
| Investor Class | 5.71% | 16.56% | ||||||
| MSCI All Country World®Index (“ACWI”)(ex-USA Small Cap) | 1.81% | 7.10%*** | ||||||
| † | Not Annualized. |
| * | The Polen International Small Company Growth Fund (the “Fund”) Institutional Class shares commenced operations on December 31, 2018. |
| ** | The Fund’s Investor Class shares commenced operations on February 8, 2019. |
| *** | Benchmark performance is from the commencement date of the Fund Class only and is not the commencement date of the benchmark itself. |
The performance data quoted represents past performance and does not guarantee future results. Current performance may be lower or higher. Performance data current to the most recentmonth-end may be obtained by calling (888)678-6024. The investment return and principal value of an investment will fluctuate so that shares, when redeemed, may be worth more or less than their original cost. The table does not reflect the deduction of taxes that a shareholder would pay on Fund distributions or the redemption of Fund shares.
The Fund’s “Total Annual Fund Operating Expenses” and “Total Annual Fund Operating Expenses After Fee Waiver and/or Expense Reimbursement”, as stated in the current prospectus dated September 1, 2019, are 7.51% and 1.25%, respectively, for the Institutional Class shares and 7.76% and 1.50%, respectively, for the Investor Class shares of the Fund’s average daily net assets, which may differ from the actual expenses incurred by the Fund for the period covered by this report. Polen Capital Management, LLC (“PCM” or the “Adviser”) has contractually agreed to reduce its investment advisory fee and/or reimburse certain expenses of the Fund to the extent necessary to ensure that the Fund’s total operating expenses (excluding taxes, fees and expenses attributable to a distribution or service plan adopted by the Trust, interest, extraordinary items, “Acquired Fund Fees and Expenses” and brokerage commissions) do not exceed 1.25% (on an annual basis) with respect to the Fund’s average daily net assets (the “Expense Limitation”). The Expense Limitation will remain in place until August 31, 2020 unless the Board of Trustees (“Board of Trustees”) of FundVantage Trust (the “Trust”) approves its earlier termination. The Adviser is entitled to recover, subject to approval by the Board of Trustees, such amounts reduced or reimbursed for a period of up to three (3) years from the date on which the Adviser reduced its compensation and/or assumed expenses for the Fund. The Adviser is permitted to seek reimbursement from the Fund for fees it waived and Fund expenses it paid to the extent the total annual fund expenses do not exceed the limits described above or any lesser limits in effect at the time of reimbursement. No recoupment will occur unless the Fund’s expenses are below the Expense Limitation. Total returns would be lower had such fees and expenses not been waived and/or reimbursed.
9
POLEN INTERNATIONAL SMALL COMPANY GROWTH FUND
Semi-Annual Report
Performance Data
October 31, 2019
(Unaudited)
A 2.00% redemption fee applies to shares redeemed within 60 days of purchase. This redemption fee is not reflected in the returns shown above.
The Fund intends to evaluate performance as compared to that of the MSCI ACWI(ex-USA Small Cap), which captures small cap representation across 22 of 23 Developed Markets (DM) countries (excluding the US) and 26 Emerging Markets (EM) countries. With 4,172 constituents, the index covers approximately 14% of the global equity opportunity set outside the US. Indexes are unmanaged and it is not possible to invest directly in an index.
All mutual fund investing involves risk, including possible loss of principal. The Fund isnon-diversified, which means that a large portion of the Fund’s assets may be invested in one or few companies or sectors. The Fund could fluctuate in value more than a diversified fund. Investing in foreign securities entails special risks, such as fluctuations in currency exchange rates and possible lax regulation of securities markets and accounting practices. The Fund is a recently formed mutual fund and has a limited history of operations.
The Fund may invest a substantial amount of its assets in issuers located in a limited number of countries. If the Fund concentrates its investments in this manner, it assumes the risk that economic, political and social conditions in those countries will have a significant impact on its investment performance. The Fund’s investment performance may also be more volatile if it concentrates its investments in certain countries, especially emerging market countries.
10
POLEN GROWTH FUNDS
Funds Expense Disclosure
October 31, 2019
(Unaudited)
As a shareholder of the Fund(s), you incur two types of costs: (1) transaction costs, including redemption fees; and (2) ongoing costs, including management fees, distribution and/or service (Rule12b-1) fees (if any) and other Fund expenses. These examples are intended to help you understand your ongoing costs (in dollars) of investing in the Fund(s) and to compare these costs with the ongoing costs of investing in other mutual funds.
These examples are based on an investment of $1,000 invested at the beginning of thesix-month period from May 1, 2019 through October 31, 2019 and held for the entire period.
Actual Expenses
The first line of each accompanying table provides information about actual account values and actual expenses. You may use the information in this line, together with the amount you invested, to estimate the expenses that you paid over the period. Simply divide your account value by $1,000 (for example, an $8,600 account value divided by $1,000 = 8.6), then multiply the result by the number in the first line under the heading entitled “Expenses Paid During Period” to estimate the expenses you paid on your account during this period.
Hypothetical Examples for Comparison Purposes
The second line of each accompanying table provides information about hypothetical account values and hypothetical expenses based on a Fund’s actual expense ratio and an assumed rate of return of 5% per year before expenses, which is not your Fund’s actual return. The hypothetical account values and expenses may not be used to estimate the actual ending account balance or expenses you paid for the period. You may use this information to compare the ongoing costs of investing in the Fund(s) and other funds. To do so, compare these 5% hypothetical examples with the 5% hypothetical examples that appear in the shareholder reports of other funds.
Please note that the expenses shown in the accompanying table are meant to highlight your ongoing costs only and do not reflect any transactional costs, such as redemption fees. Therefore, each hypothetical line of the accompanying table is useful in comparing ongoing costs only and will not help you determine the relative total costs of owning different funds. In addition, if these transactional costs were included, your costs would have been higher.
11
POLEN GROWTH FUNDS
Funds Expense Disclosure
October 31, 2019
(Unaudited)
| Polen Growth Fund | |||||||||||||||
Beginning Account Value May 1, 2019 |
Ending Account Value October 31, 2019 |
Expenses Paid | |||||||||||||
Institutional Class* | |||||||||||||||
Actual | $1,000.00 | $1,045.80 | $4.94 | ||||||||||||
Hypothetical (5% return before expenses) | 1,000.00 | 1,020.31 | 4.88 | ||||||||||||
Investor Class* | |||||||||||||||
Actual | $1,000.00 | $1,044.50 | $6.22 | ||||||||||||
Hypothetical (5% return before expenses) | 1,000.00 | 1,019.05 | 6.14 | ||||||||||||
| Polen Global Growth Fund | |||||||||||||||
Beginning Account Value |
Ending Account Value |
Expenses Paid | |||||||||||||
Institutional Class** | |||||||||||||||
Actual | $1,000.00 | $1,039.80 | $5.64 | ||||||||||||
Hypothetical (5% return before expenses) | 1,000.00 | 1,019.61 | 5.58 | ||||||||||||
Investor Class** | |||||||||||||||
Actual | $1,000.00 | $1,038.40 | $6.92 | ||||||||||||
Hypothetical (5% return before expenses) | 1,000.00 | 1,018.35 | 6.85 | ||||||||||||
| Polen International Growth Fund | |||||||||||||||
Beginning Account Value |
Ending Account Value |
Expenses Paid | |||||||||||||
Institutional Class*** | |||||||||||||||
Actual | $1,000.00 | $1,021.60 | $5.59 | ||||||||||||
Hypothetical (5% return before expenses) | 1,000.00 | 1,019.61 | 5.58 | ||||||||||||
Investor Class*** | |||||||||||||||
Actual | $1,000.00 | $1,019.60 | $6.85 | ||||||||||||
Hypothetical (5% return before expenses) | 1,000.00 | 1,018.35 | 6.85 | ||||||||||||
12
POLEN GROWTH FUNDS
Funds Expense Disclosure
October 31, 2019
(Unaudited)
| Polen U.S. Small Company Growth Fund | |||||||||||||||
Beginning Account Value |
Ending Account Value |
Expenses Paid | |||||||||||||
Institutional Class**** | |||||||||||||||
Actual | $1,000.00 | $ 959.80 | $6.16 | ||||||||||||
Hypothetical (5% return before expenses) | 1,000.00 | 1,018.85 | 6.34 | ||||||||||||
Investor Class**** | |||||||||||||||
Actual | $1,000.00 | $ 958.90 | $7.39 | ||||||||||||
Hypothetical (5% return before expenses) | 1,000.00 | 1,017.60 | 7.61 | ||||||||||||
| Polen International Small Company Growth Fund | |||||||||||||||
Beginning Account Value |
Ending Account Value |
Expenses Paid | |||||||||||||
Institutional Class***** | |||||||||||||||
Actual | $1,000.00 | $1,058.70 | $6.47 | ||||||||||||
Hypothetical (5% return before expenses) | 1,000.00 | 1,018.85 | 6.34 | ||||||||||||
Investor Class***** | |||||||||||||||
Actual | $1,000.00 | $1,057.10 | $7.76 | ||||||||||||
Hypothetical (5% return before expenses) | 1,000.00 | 1,017.60 | 7.61 | ||||||||||||
| * | Expenses are equal to an annualized expense ratio for thesix-month period ended October 31, 2019 of 0.96% for Institutional Class and 1.21% for Investor Class, multiplied by the average account value over the period, multiplied by the number of days in the most recent period (184), then divided by 366 to reflect the period. The Fund’s ending account values on the first line of each table are based on the actualsix-month total returns for the Fund of 4.58% and 4.45% for Institutional Class and Investor Class, respectively. |
| ** | Expenses are equal to an annualized expense ratio for thesix-month period ended October 31, 2019 of 1.10% for Institutional Class and 1.35% for Investor Class, multiplied by the average account value over the period, multiplied by the number of days in the most recent period (184), then divided by 366 to reflect the period. The Fund’s ending account values on the first line of each table are based on the actualsix-month total returns for the Fund of 3.98% and 3.84% for Institutional Class and Investor Class, respectively. |
| *** | Expenses are equal to an annualized expense ratio for thesix-month period ended October 31, 2019 of 1.10% for Institutional Class and 1.35% for Investor Class, multiplied by the average account value over the period, multiplied by the number of days in the most recent period (184), then divided by 366 to reflect the period. The Fund’s ending account values on the first line of each table are based on the actualsix-month total returns for the Fund of 2.16% and 1.96% for Institutional Class and Investor Class, respectively. |
| **** | Expenses are equal to an annualized expense ratio for thesix-month period ended October 31, 2019 of 1.25% for Institutional Class and 1.50% for Investor Class, multiplied by the average account value over the period, multiplied by the number of days in the most recent period (184), then divided by 366 to reflect the period. The |
13
POLEN GROWTH FUNDS
Funds Expense Disclosure (Concluded)
October 31, 2019
(Unaudited)
Fund’s ending account values on the first line of each table are based on the actualsix-month total returns for the Fund of (4.02)% and (4.11)% for Institutional Class and Investor Class, respectively.. |
| ***** | Expenses are equal to an annualized expense ratio for thesix-month period ended October 31, 2019 of 1.25% for Institutional Class and 1.50% for the Investor Class, multiplied by the average account value over the period, multiplied by the number of days in the most recent period (184), then divided by 366 to reflect the period. The Fund’s ending account values on the first line of each table are based on the actualsix-month total returns for the Fund of 5.87% and 5.71% for Institutional Class and Investor Class, respectively. |
14
POLEN GROWTH FUND
Portfolio Holdings Summary Table
October 31, 2019
(Unaudited)
The following table presents a summary by industry of the portfolio holdings of the Fund:
| % of Net Assets | Value | |||||||||||
COMMON STOCKS: | ||||||||||||
Software Infrastructure | 18.5 | % | $ | 827,151,115 | ||||||||
Internet Content & Information | 17.1 | 763,565,223 | ||||||||||
Credit Services | 15.4 | 686,781,182 | ||||||||||
Information Technology Services | 7.9 | 351,222,528 | ||||||||||
Drug Manufacturers - Specialty & Generic | 5.7 | 252,159,102 | ||||||||||
Discount Stores | 4.2 | 189,526,209 | ||||||||||
Specialty Retail | 4.1 | 181,216,147 | ||||||||||
Footwear & Accessories | 3.9 | 174,340,328 | ||||||||||
Packaged Foods | 3.4 | 152,694,749 | ||||||||||
Staffing & Employment Services | 3.3 | 144,997,767 | ||||||||||
Medical Devices | 2.8 | 123,441,965 | ||||||||||
Restaurants | 2.5 | 111,748,746 | ||||||||||
Biotechnology | 2.1 | 94,692,281 | ||||||||||
Software Application | 2.1 | 92,511,724 | ||||||||||
Financial Data & Stock Exchanges | 2.0 | 91,336,491 | ||||||||||
Travel Services | 2.0 | 90,467,537 | ||||||||||
Other Assets In Excess of Liabilities | 3.0 | 133,608,829 | ||||||||||
|
|
|
| |||||||||
NET ASSETS | 100.0 | % | $ | 4,461,461,923 | ||||||||
|
|
|
| |||||||||
Portfolio holdings are subject to change at any time.
The accompanying notes are an integral part of the financial statements.
15
POLEN GROWTH FUND
Portfolio of Investments
October 31, 2019
(Unaudited)
| Number of Shares | Value | |||||||
COMMON STOCKS — 97.0% |
| |||||||
Biotechnology — 2.1% |
| |||||||
Regeneron Pharmaceuticals, Inc.* | 309,169 | $ | 94,692,281 | |||||
|
| |||||||
Credit Services — 15.4% | ||||||||
Mastercard, Inc., Class A | 779,729 | 215,836,785 | ||||||
PayPal Holdings, Inc.* | 1,394,683 | 145,186,500 | ||||||
Visa, Inc., Class A | 1,821,301 | 325,757,897 | ||||||
|
| |||||||
| 686,781,182 | ||||||||
|
| |||||||
Discount Stores — 4.2% | ||||||||
Dollar General Corp. | 1,182,027 | 189,526,209 | ||||||
|
| |||||||
Drug Manufacturers - Specialty & Generic — 5.7% |
| |||||||
Zoetis, Inc. | 1,971,225 | 252,159,102 | ||||||
|
| |||||||
Financial Data & Stock Exchanges — 2.0% |
| |||||||
MSCI, Inc. | 389,395 | 91,336,491 | ||||||
|
| |||||||
Footwear & Accessories — 3.9% |
| |||||||
NIKE, Inc., Class B | 1,946,849 | 174,340,328 | ||||||
|
| |||||||
Information Technology Services — 7.9% |
| |||||||
Accenture PLC, Class A | 1,098,327 | 203,651,792 | ||||||
Gartner, Inc.* | 957,754 | 147,570,736 | ||||||
|
| |||||||
| 351,222,528 | ||||||||
|
| |||||||
Internet Content & Information — 17.1% |
| |||||||
Alphabet, Inc., Class A* | 77,897 | 98,056,744 | ||||||
Alphabet, Inc., Class C* | 247,601 | 312,004,496 | ||||||
Facebook, Inc., Class A* | 1,844,529 | 353,503,983 | ||||||
|
| |||||||
| 763,565,223 | ||||||||
|
| |||||||
Medical Devices — 2.8% | ||||||||
Align Technology, Inc.* | 489,286 | 123,441,965 | ||||||
|
| |||||||
Packaged Foods — 3.4% | ||||||||
Nestle SA, SP ADR | 1,424,923 | 152,694,749 | ||||||
|
| |||||||
Restaurants — 2.5% | ||||||||
Starbucks Corp | 1,321,532 | 111,748,746 | ||||||
|
| |||||||
| Number of Shares | Value | |||||||
COMMON STOCKS — (Continued) |
| |||||||
Software Application — 2.1% |
| |||||||
salesforce.com, Inc.* | 591,167 | $ | 92,511,724 | |||||
|
| |||||||
Software Infrastructure — 18.5% |
| |||||||
Adobe, Inc.* | 882,166 | 245,180,396 | ||||||
Microsoft Corp. | 3,006,830 | 431,089,217 | ||||||
Oracle Corp. | 2,768,976 | 150,881,502 | ||||||
|
| |||||||
| 827,151,115 | ||||||||
|
| |||||||
Specialty Retail — 4.1% | ||||||||
O’Reilly Automotive, Inc.* | 416,101 | 181,216,147 | ||||||
|
| |||||||
Staffing & Employment Services — 3.3% |
| |||||||
Automatic Data Processing, Inc. | 893,779 | 144,997,767 | ||||||
|
| |||||||
Travel Services — 2.0% | ||||||||
Booking Holdings, Inc.* | 44,157 | 90,467,537 | ||||||
|
| |||||||
TOTAL COMMON STOCKS | 4,327,853,094 | |||||||
|
| |||||||
TOTAL INVESTMENTS - 97.0% | 4,327,853,094 | |||||||
OTHER ASSETS IN EXCESS OF LIABILITIES - 3.0% | 133,608,829 | |||||||
|
| |||||||
NET ASSETS - 100.0% | $ | 4,461,461,923 | ||||||
|
| |||||||
| * | Non-income producing. |
| PLC | Public Limited Corporation | |
| SP ADR | Sponsored American Depository Receipt |
The accompanying notes are an integral part of the financial statements.
16
POLEN GLOBAL GROWTH FUND
Portfolio Holdings Summary Table
October 31, 2019
(Unaudited)
The following table presents a summary by industry of the portfolio holdings of the Fund:
| % of Net Assets | Value | |||||||||||
COMMON STOCKS: | ||||||||||||
Software | 18.5 | % | $ | 17,875,179 | ||||||||
Information Technology Services | 17.9 | 17,224,344 | ||||||||||
Interactive Media & Services | 13.3 | 12,802,224 | ||||||||||
Textiles, Apparel & Luxury Goods | 9.5 | 9,192,147 | ||||||||||
Health Care Equipment & Supplies | 9.3 | 9,015,344 | ||||||||||
Internet & Direct Marketing Retail | 4.9 | 4,765,143 | ||||||||||
Specialty Retail | 4.7 | 4,548,155 | ||||||||||
Pharmaceuticals | 4.5 | 4,374,657 | ||||||||||
Food Products | 4.2 | 4,011,907 | ||||||||||
Biotechnology | 3.9 | 3,741,757 | ||||||||||
Hotels, Restaurants & Leisure | 2.5 | 2,405,816 | ||||||||||
Household Products | 1.6 | 1,501,749 | ||||||||||
Other Assets In Excess of Liabilities | 5.2 | 4,969,062 | ||||||||||
|
|
|
| |||||||||
NET ASSETS | 100.0 | % | $ | 96,427,484 | ||||||||
|
|
|
| |||||||||
Portfolio holdings are subject to change at any time.
The accompanying notes are an integral part of the financial statements.
17
POLEN GLOBAL GROWTH FUND
Portfolio of Investments
October 31, 2019
(Unaudited)
| Number of Shares | Value | |||||||
COMMON STOCKS — 94.8% |
| |||||||
Australia — 3.9% | ||||||||
CSL, Ltd. | 21,217 | $ | 3,741,757 | |||||
|
| |||||||
China — 8.8% | ||||||||
Alibaba Group Holding, Ltd., SP ADR* | 26,972 | 4,765,143 | ||||||
Tencent Holdings, Ltd. | 92,920 | 3,769,106 | ||||||
|
| |||||||
| 8,534,249 | ||||||||
|
| |||||||
Denmark — 3.0% | ||||||||
Coloplast A/S, Class B | 16,115 | 1,940,181 | ||||||
Novo Nordisk A/S, SP ADR | 18,253 | 1,007,931 | ||||||
|
| |||||||
| 2,948,112 | ||||||||
|
| |||||||
France — 2.1% | ||||||||
EssilorLuxottica SA | 13,484 | 2,058,930 | ||||||
|
| |||||||
Germany — 11.2% | ||||||||
adidas AG | 13,656 | 4,216,573 | ||||||
SAP SE | 32,406 | 4,293,842 | ||||||
Siemens Healthineers AG | 53,620 | 2,278,171 | ||||||
|
| |||||||
| 10,788,586 | ||||||||
|
| |||||||
Ireland — 3.7% | ||||||||
Accenture PLC, Class A | 19,246 | 3,568,593 | ||||||
|
| |||||||
Spain — 1.6% | ||||||||
Industria De Diseno Textil SA | 49,340 | 1,537,474 | ||||||
|
| |||||||
Switzerland — 4.2% | ||||||||
Nestle SA, Registered Shares | 37,501 | 4,011,907 | ||||||
|
| |||||||
United Kingdom — 1.6% | ||||||||
Reckitt Benckiser Group PLC | 19,407 | 1,501,749 | ||||||
|
| |||||||
United States — 54.7% | ||||||||
Abbott Laboratories | 32,072 | 2,681,540 | ||||||
| Number of Shares | Value | |||||||
COMMON STOCKS — (Continued) |
| |||||||
United States — (Continued) |
| |||||||
Adobe, Inc.* | 18,590 | $ | 5,166,719 | |||||
Align Technology, Inc.* | 8,385 | 2,115,452 | ||||||
Alphabet, Inc., Class C* | 4,442 | 5,597,409 | ||||||
Automatic Data Processing, Inc. | 19,577 | 3,175,977 | ||||||
Facebook, Inc., Class A* | 17,927 | 3,435,709 | ||||||
Mastercard, Inc., Class A | 19,577 | 5,419,109 | ||||||
Microsoft Corp. | 46,875 | 6,720,469 | ||||||
NIKE, Inc., Class B | 32,570 | 2,916,644 | ||||||
Oracle Corp. | 31,091 | 1,694,149 | ||||||
O’Reilly Automotive, Inc.* | 6,913 | 3,010,681 | ||||||
Starbucks Corp. | 28,451 | 2,405,816 | ||||||
Visa, Inc., Class A | 28,294 | 5,060,665 | ||||||
Zoetis, Inc. | 26,319 | 3,366,726 | ||||||
|
| |||||||
| 52,767,065 | ||||||||
|
| |||||||
TOTAL COMMON STOCKS | 91,458,422 | |||||||
|
| |||||||
TOTAL INVESTMENTS - 94.8% | 91,458,422 | |||||||
OTHER ASSETS IN EXCESS OF LIABILITIES - 5.2% | 4,969,062 | |||||||
|
| |||||||
NET ASSETS - 100.0% | $ | 96,427,484 | ||||||
|
| |||||||
| * | Non-income producing. |
| PLC | Public Limited Corporation | |
| SP ADR | Sponsored American Depository Receipt |
The accompanying notes are an integral part of the financial statements.
18
POLEN INTERNATIONAL GROWTH FUND
Portfolio Holdings Summary Table
October 31, 2019
(Unaudited)
The following table presents a summary by industry of the portfolio holdings of the Fund:
% of Net | Value | |||||||||
COMMON STOCKS: | ||||||||||
Software | 15.2 | % | $ | 16,421,023 | ||||||
Health Care Equipment & Supplies | 11.3 | 12,207,030 | ||||||||
Information Technology Services | 8.2 | 8,809,081 | ||||||||
Professional Services | 7.8 | 8,402,263 | ||||||||
Textiles, Apparel & Luxury Goods | 6.7 | 7,261,402 | ||||||||
Internet & Direct Marketing Retail | 6.3 | 6,802,678 | ||||||||
Life Sciences Tools & Services | 6.1 | 6,581,414 | ||||||||
Interactive Media & Services | 5.5 | 5,907,989 | ||||||||
Personal Products | 4.7 | 5,068,949 | ||||||||
Biotechnology | 4.7 | 5,045,914 | ||||||||
Food Products | 3.7 | 3,936,165 | ||||||||
Hotels, Restaurants & Leisure | 3.5 | 3,803,475 | ||||||||
Trading Companies & Distributors | 3.5 | 3,796,811 | ||||||||
Household Products | 2.9 | 3,125,607 | ||||||||
Specialty Retail | 2.6 | 2,817,249 | ||||||||
Food & Staples Retailing | 2.1 | 2,301,091 | ||||||||
Other Assets In Excess of Liabilities | 5.2 | 5,633,683 | ||||||||
|
|
|
| |||||||
NET ASSETS | 100.0 | % | $ | 107,921,824 | ||||||
|
|
|
| |||||||
Portfolio holdings are subject to change at any time.
The accompanying notes are an integral part of the financial statements.
19
POLEN INTERNATIONAL GROWTH FUND
Portfolio of Investments
October 31, 2019
(Unaudited)
| Number of Shares | Value | |||||||
COMMON STOCKS — 94.8% |
| |||||||
Australia — 4.7% | ||||||||
CSL, Ltd. | 28,612 | $ | 5,045,914 | |||||
|
| |||||||
China — 11.8% | ||||||||
Alibaba Group Holding, Ltd., SP ADR* | 38,505 | 6,802,678 | ||||||
Tencent Holdings, Ltd. | 145,650 | 5,907,989 | ||||||
|
| |||||||
| 12,710,667 | ||||||||
|
| |||||||
Denmark — 1.9% | ||||||||
Coloplast A/S, Class B | 17,402 | 2,095,130 | ||||||
|
| |||||||
France — 5.1% | ||||||||
Dassault Systemes SE | 20,873 | 3,170,123 | ||||||
LVMH Moet Hennessy Louis Vuitton SE | 5,490 | 2,344,537 | ||||||
|
| |||||||
| 5,514,660 | ||||||||
|
| |||||||
Germany — 14.5% | ||||||||
adidas AG | 15,924 | 4,916,865 | ||||||
SAP SE | 48,937 | 6,484,223 | ||||||
Siemens Healthineers AG | 100,192 | 4,256,892 | ||||||
|
| |||||||
| 15,657,980 | ||||||||
|
| |||||||
Ireland — 20.7% | ||||||||
Accenture PLC, Class A | 29,418 | 5,454,685 | ||||||
Experian PLC | 141,776 | 4,468,978 | ||||||
ICON PLC* | 44,802 | 6,581,414 | ||||||
Medtronic PLC | 53,765 | 5,855,008 | ||||||
|
| |||||||
| 22,360,085 | ||||||||
|
| |||||||
Israel — 2.6% | ||||||||
Check Point Software Technologies, Ltd.* | 24,468 | 2,750,448 | ||||||
|
| |||||||
Mexico — 2.1% | ||||||||
Wal-Mart de Mexico SAB de CV | 767,822 | 2,301,091 | ||||||
|
| |||||||
Netherlands — 3.6% | ||||||||
RELX PLC | 163,458 | 3,933,285 | ||||||
|
| |||||||
| Number of Shares | Value | |||||||
COMMON STOCKS — (Continued) |
| |||||||
Spain — 5.7% | ||||||||
Amadeus IT Group SA | 45,343 | $ | 3,354,396 | |||||
Industria De Diseno Textil SA | 90,410 | 2,817,249 | ||||||
|
| |||||||
| 6,171,645 | ||||||||
|
| |||||||
Switzerland — 3.7% | ||||||||
Nestle SA, Registered Shares | 36,793 | 3,936,165 | ||||||
|
| |||||||
United Kingdom — 18.4% | ||||||||
Bunzl PLC | 145,948 | 3,796,811 | ||||||
Compass Group PLC | 142,858 | 3,803,475 | ||||||
Reckitt Benckiser Group PLC | 40,392 | 3,125,607 | ||||||
Sage Group PLC (The) | 430,920 | 4,016,229 | ||||||
Unilever PLC | 84,653 | 5,068,949 | ||||||
|
| |||||||
| 19,811,071 | ||||||||
|
| |||||||
TOTAL COMMON STOCKS | 102,288,141 | |||||||
|
| |||||||
TOTAL INVESTMENTS - 94.8% | 102,288,141 | |||||||
OTHER ASSETS IN EXCESS OF LIABILITIES - 5.2% | 5,633,683 | |||||||
|
| |||||||
NET ASSETS - 100.0% | $ | 107,921,824 | ||||||
|
| |||||||
| * | Non-income producing. |
PLC | Public Limited Corporation | |
SP ADR | Sponsored American Depository Receipt |
The accompanying notes are an integral part of the financial statements.
20
POLEN U.S. SMALL COMPANY GROWTH FUND
Portfolio Holdings Summary Table
October 31, 2019
(Unaudited)
The following table presents a summary by industry of the portfolio holdings of the Fund:
| % of Net Assets | Value | |||||||||||
COMMON STOCKS: | ||||||||||||
Software Application | 20.8 | % | $ | 2,170,207 | ||||||||
Medical Instruments & Supplies | 10.6 | 1,105,341 | ||||||||||
Leisure | 7.3 | 763,440 | ||||||||||
Medical Care Facilities | 7.2 | 749,645 | ||||||||||
Recreational Vehicles | 5.9 | 610,070 | ||||||||||
Software Infrastructure | 5.8 | 600,600 | ||||||||||
Information Technology Services | 5.5 | 572,613 | ||||||||||
Building Products & Equipment | 5.0 | 520,221 | ||||||||||
Home Improvement Retail | 3.7 | 382,589 | ||||||||||
Mortgage Finance | 3.3 | 345,096 | ||||||||||
Education & Training Services | 2.9 | 305,583 | ||||||||||
Electronic Components | 2.9 | 298,469 | ||||||||||
Diagnostics & Research | 2.7 | 285,288 | ||||||||||
Discount Stores | 2.6 | 273,534 | ||||||||||
Restaurants | 2.4 | 253,572 | ||||||||||
Specialty Retail | 2.2 | 228,826 | ||||||||||
Internet Retail | 1.9 | 197,030 | ||||||||||
Other Assets In Excess of Liabilities | 7.3 | 763,854 | ||||||||||
|
|
|
|
|
| |||||||
NET ASSETS | 100.0 | % | $ | 10,425,978 | ||||||||
|
|
|
|
|
| |||||||
Portfolio holdings are subject to change at any time.
The accompanying notes are an integral part of the financial statements.
21
POLEN U.S. SMALL COMPANY GROWTH FUND
Portfolio of Investments
October 31, 2019
(Unaudited)
| Number of Shares | Value | |||||||
COMMON STOCKS — 92.7% | ||||||||
Building Products & Equipment — 5.0% |
| |||||||
Trex Co., Inc.* | 5,919 | $ | 520,221 | |||||
|
| |||||||
Diagnostics & Research — 2.7% |
| |||||||
Neogen Corp.* | 4,385 | 285,288 | ||||||
|
| |||||||
Discount Stores — 2.6% | ||||||||
Ollie’s Bargain Outlet Holdings, Inc.* | 4,282 | 273,534 | ||||||
|
| |||||||
Education & Training Services — 2.9% |
| |||||||
Grand Canyon Education, Inc.* | 3,323 | 305,583 | ||||||
|
| |||||||
Electronic Components — 2.9% | ||||||||
Littelfuse, Inc. | 1,700 | 298,469 | ||||||
|
| |||||||
Home Improvement Retail — 3.7% |
| |||||||
Floor & Decor Holdings, Inc., Class A* | 8,348 | 382,589 | ||||||
|
| |||||||
Information Technology Services — 5.5% |
| |||||||
EPAM Systems, Inc.* | 1,686 | 296,669 | ||||||
ExlService Holdings, Inc.* | 3,963 | 275,944 | ||||||
|
| |||||||
| 572,613 | ||||||||
|
| |||||||
Internet Retail — 1.9% | ||||||||
Medifast, Inc. | 1,776 | 197,030 | ||||||
|
| |||||||
Leisure — 7.3% | ||||||||
Pool Corp. | 3,681 | 763,440 | ||||||
|
| |||||||
Medical Care Facilities — 7.2% |
| |||||||
AMN Healthcare Services, Inc.* | 4,909 | 288,453 | ||||||
US Physical Therapy, Inc. | 3,260 | 461,192 | ||||||
|
| |||||||
| 749,645 | ||||||||
|
| |||||||
| Number of Shares | Value | |||||||
COMMON STOCKS — (Continued) |
| |||||||
Medical Instruments & Supplies — 10.6% |
| |||||||
Cantel Medical Corp. | 4,398 | $ | 320,570 | |||||
LeMaitre Vascular, Inc. | 12,556 | 434,438 | ||||||
Masimo Corp.* | 2,403 | 350,333 | ||||||
|
| |||||||
| 1,105,341 | ||||||||
|
| |||||||
Mortgage Finance — 3.3% | ||||||||
LendingTree, Inc.* | 959 | 345,096 | ||||||
|
| |||||||
Recreational Vehicles — 5.9% |
| |||||||
Fox Factory Holding Corp.*. | 10,011 | 610,070 | ||||||
|
| |||||||
Restaurants — 2.4% | ||||||||
Texas Roadhouse, Inc. | 4,488 | 253,572 | ||||||
|
| |||||||
Software Application — 20.8% |
| |||||||
Alarm.com Holdings, Inc.* | 6,456 | 318,927 | ||||||
Appfolio, Inc., Class A* | 4,371 | 424,992 | ||||||
Blackbaud, Inc. | 5,932 | 497,991 | ||||||
Globant SA* | 6,851 | 638,924 | ||||||
Paycom Software, Inc.* | 1,368 | 289,373 | ||||||
|
| |||||||
| 2,170,207 | ||||||||
|
| |||||||
Software Infrastructure — 5.8% |
| |||||||
Altair Engineering, Inc., Class A* | 7,210 | 265,833 | ||||||
Euronet Worldwide, Inc.* | 2,390 | 334,767 | ||||||
|
| |||||||
| 600,600 | ||||||||
|
| |||||||
Specialty Retail — 2.2% | ||||||||
Five Below, Inc.* | 1,829 | 228,826 | ||||||
|
| |||||||
TOTAL COMMON STOCKS | 9,662,124 | |||||||
|
| |||||||
The accompanying notes are an integral part of the financial statements.
22
POLEN U.S. SMALL COMPANY GROWTH FUND
Portfolio of Investments (Continued)
October 31, 2019
(Unaudited)
| Value | ||||
TOTAL INVESTMENTS - 92.7% | $ | 9,662,124 | ||
OTHER ASSETS IN EXCESS OF | 763,854 | |||
|
| |||
NET ASSETS - 100.0% |
$ |
10,425,978 |
| |
|
| |||
| * | Non-income producing. |
The accompanying notes are an integral part of the financial statements.
23
POLEN INTERNATIONAL SMALL COMPANY GROWTH FUND
Portfolio Holdings Summary Table
October 31, 2019
(Unaudited)
The following table presents a summary by industry of the portfolio holdings of the Fund:
| % of Net Assets | Value | |||||||
COMMON STOCKS: | ||||||||
Software | 20.8 | % | $ | 1,268,675 | ||||
Interactive Media & Services | 14.4 | 881,319 | ||||||
Professional Services | 6.7 | 409,075 | ||||||
Entertainment | 6.2 | 380,960 | ||||||
Health Care Equipment & Supplies | 6.0 | 366,385 | ||||||
Commercial Services & Supplies | 5.8 | 356,717 | ||||||
Health Care Technology | 5.4 | 326,813 | ||||||
Aerospace & Defense | 5.2 | 319,667 | ||||||
Capital Markets | 5.1 | 313,767 | ||||||
Information Technology Services | 4.4 | 270,944 | ||||||
Leisure Products | 3.5 | 212,498 | ||||||
Life Sciences Tools & Services | 3.3 | 201,566 | ||||||
Health Care Providers & Services | 2.7 | 165,652 | ||||||
Semiconductors & Semiconductor Equipment | 2.4 | 145,565 | ||||||
Household Products | 2.2 | 136,692 | ||||||
Food Products | 1.8 | 107,477 | ||||||
Internet & Direct Marketing Retail | 1.0 | 63,446 | ||||||
Other Assets In Excess of Liabilities | 3.1 | 188,763 | ||||||
|
|
|
| |||||
NET ASSETS | 100.0 | % | $ | 6,115,981 | ||||
|
|
|
| |||||
Portfolio holdings are subject to change at any time.
The accompanying notes are an integral part of the financial statements.
24
POLEN INTERNATIONAL SMALL COMPANY GROWTH FUND
Portfolio of Investments
October 31, 2019
(Unaudited)
| Number of Shares | Value | |||||||
COMMON STOCKS — 96.9% |
| |||||||
Argentina — 1.0% | ||||||||
Despegar.com Corp.* | 5,675 | $ | 63,446 | |||||
|
| |||||||
Australia — 8.1% | ||||||||
Cochlear, Ltd. | 1,540 | 224,671 | ||||||
Computershare, Ltd. | 24,822 | 270,944 | ||||||
|
| |||||||
| 495,615 | ||||||||
|
| |||||||
Brazil — 1.8% | ||||||||
M. Dias Branco SA | 11,400 | 107,477 | ||||||
|
| |||||||
Canada — 16.0% | ||||||||
CAE, Inc. | 12,747 | 319,667 | ||||||
Kinaxis, Inc.* | 3,490 | 222,871 | ||||||
Morneau Shepell, Inc. | 10,860 | 261,461 | ||||||
TMX Group, Ltd. | 2,004 | 175,097 | ||||||
|
| |||||||
| 979,096 | ||||||||
|
| |||||||
Denmark — 5.4% | ||||||||
Netcompany Group A/S* | 5,250 | 223,789 | ||||||
SimCorp A/S | 1,224 | 109,521 | ||||||
|
| |||||||
| 333,310 | ||||||||
|
| |||||||
Germany — 15.5% | ||||||||
CompuGroup Medical SE | 5,105 | 326,813 | ||||||
CTS Eventim AG & Co. KGaA | 6,290 | 380,960 | ||||||
Scout24 AG | 3,914 | 242,615 | ||||||
|
| |||||||
| 950,388 | ||||||||
|
| |||||||
Israel — 2.5% | ||||||||
Nice Ltd., SP ADR* | 971 | 153,214 | ||||||
|
| |||||||
Italy — 2.7% | ||||||||
Amplifon SpA | 6,587 | 165,652 | ||||||
|
| |||||||
Japan — 12.2% | ||||||||
Kakaku.com, Inc. | 13,700 | 318,113 | ||||||
Nakanishi, Inc. | 8,500 | 141,714 | ||||||
Pigeon Corp. | 2,800 | 136,692 | ||||||
TechnoPro Holdings, Inc. | 2,400 | 147,614 | ||||||
|
| |||||||
| 744,133 | ||||||||
|
| |||||||
| Number of Shares | Value | |||||||
COMMON STOCKS — (Continued) | ||||||||
Luxembourg — 4.5% | ||||||||
Globant SA* | 2,940 | $ | 274,184 | |||||
|
| |||||||
Norway — 1.6% | ||||||||
Tomra Systems ASA | 3,604 | 97,140 | ||||||
|
| |||||||
South Korea — 4.0% | ||||||||
Douzone Bizon Co. Ltd. | 1,560 | 98,417 | ||||||
Koh Young Technology, Inc. | 1,800 | 145,565 | ||||||
|
| |||||||
| 243,982 | ||||||||
|
| |||||||
Sweden — 3.5% | ||||||||
Thule Group AB (The) | 10,435 | 212,498 | ||||||
|
| |||||||
Switzerland — 3.3% | ||||||||
Tecan Group AG | 852 | 201,566 | ||||||
|
| |||||||
United Kingdom — 14.8% | ||||||||
Auto Trader Group PLC | 25,420 | 185,218 | ||||||
GB Group PLC | 23,860 | 186,679 | ||||||
HomeServe PLC | 17,290 | 259,577 | ||||||
Rightmove PLC | 17,440 | 135,373 | ||||||
Sanne Group PLC | 20,275 | 138,670 | ||||||
|
| |||||||
| 905,517 | ||||||||
|
| |||||||
TOTAL COMMON STOCKS | 5,927,218 | |||||||
|
| |||||||
TOTAL INVESTMENTS - 96.9% | 5,927,218 | |||||||
OTHER ASSETS IN EXCESS OF LIABILITIES - 3.1% | 188,763 | |||||||
|
| |||||||
NET ASSETS - 100.0% | $ | 6,115,981 | ||||||
|
| |||||||
| * | Non-income producing. |
| PLC | Public Limited Corporation | |
| SP ADR | Sponsored American Depository Receipt |
The accompanying notes are an integral part of the financial statements.
25
POLEN GROWTH FUNDS
Statements of Assets and Liabilities
October 31, 2019
(Unaudited)
| Polen Growth Fund | Polen Global Growth Fund | Polen International Growth Fund | |||||||||||||
Assets | |||||||||||||||
Investments, at value* | $ | 4,327,853,094 | $ | 91,458,422 | $ | 102,288,141 | |||||||||
Cash | 140,310,293 | 4,389,926 | 5,511,366 | ||||||||||||
Foreign currency (Cost $0, $129 and $289, respectively) | — | 129 | 291 | ||||||||||||
Receivable for investments sold | 20,063,004 | — | — | ||||||||||||
Receivable for capital shares sold | 11,119,292 | 627,049 | 221,593 | ||||||||||||
Dividends and interest receivable | 3,066,053 | 130,795 | 138,860 | ||||||||||||
Prepaid expenses and other assets | 152,190 | 16,248 | 27,266 | ||||||||||||
|
|
|
|
|
| ||||||||||
Total assets | 4,502,563,926 | 96,622,569 | 108,187,517 | ||||||||||||
|
|
|
|
|
| ||||||||||
Liabilities | |||||||||||||||
Payable for investments purchased | 32,730,177 | — | — | ||||||||||||
Payable for capital shares redeemed | 4,827,392 | 84,606 | 162,981 | ||||||||||||
Payable to Investment Adviser | 3,104,244 | 58,449 | 64,598 | ||||||||||||
Payable for administration and accounting fees | 186,699 | 12,903 | 13,894 | ||||||||||||
Payable for transfer agent fees | 123,283 | 12,114 | 6,172 | ||||||||||||
Payable for distribution fees. | 67,314 | 2,429 | 344 | ||||||||||||
Payable for legal fees | 28,875 | 1,516 | 97 | ||||||||||||
Payable for custodian fees | 16,233 | 3,848 | 2,277 | ||||||||||||
Payable for audit fees | 14,939 | 14,045 | 14,425 | ||||||||||||
Payable for printing fees | 1,414 | 4,427 | 905 | ||||||||||||
Payable for Trustees and Officers | 1,194 | 19 | — | ||||||||||||
Accrued expenses | 239 | 729 | — | ||||||||||||
|
|
|
|
|
| ||||||||||
Total liabilities | 41,102,003 | 195,085 | 265,693 | ||||||||||||
|
|
|
|
|
| ||||||||||
Net Assets | $ | 4,461,461,923 | $ | 96,427,484 | $ | 107,921,824 | |||||||||
|
|
|
|
|
| ||||||||||
Net Assets consisted of: | |||||||||||||||
Capital stock, $0.01 par value | $ | 1,369,598 | $ | 53,535 | $ | 73,626 | |||||||||
Paid-in capital | 3,124,902,184 | 76,270,372 | 100,784,190 | ||||||||||||
Total distributable earnings | 1,335,190,141 | 20,103,577 | 7,064,008 | ||||||||||||
|
|
|
|
|
| ||||||||||
Net Assets | $ | 4,461,461,923 | $ | 96,427,484 | $ | 107,921,824 | |||||||||
|
|
|
|
|
| ||||||||||
Institutional Class: | |||||||||||||||
Net assets. | $ | 4,135,280,191 | $ | 83,501,930 | $ | 106,098,482 | |||||||||
|
|
|
|
|
| ||||||||||
Shares outstanding | 126,749,978 | 4,628,780 | 7,237,459 | ||||||||||||
|
|
|
|
|
| ||||||||||
Net asset value, offering and redemption price per share | $ | 32.63 | $ | 18.04 | $ | 14.66 | |||||||||
|
|
|
|
|
| ||||||||||
Investor Class: | |||||||||||||||
Net assets. | $ | 326,181,732 | $ | 12,925,554 | $ | 1,823,342 | |||||||||
|
|
|
|
|
| ||||||||||
Shares outstanding | 10,209,826 | 724,739 | 125,103 | ||||||||||||
|
|
|
|
|
| ||||||||||
Net asset value, offering and redemption price per share | $ | 31.95 | $ | 17.83 | $ | 14.57 | |||||||||
|
|
|
|
|
| ||||||||||
* Investments, at cost | $ | 2,979,162,757 | $ | 70,504,384 | $ | 94,026,135 | |||||||||
The accompanying notes are an integral part of the financial statements.
26
POLEN GROWTH FUNDS
Statements of Assets and Liabilities
October 31, 2019
(Unaudited)
| Polen U.S. Small Company Growth Fund | Polen International Small Company Growth Fund | ||||||||||||||
Assets | |||||||||||||||
Investments, at value* | $ | 9,662,124 | $ | 5,927,218 | |||||||||||
Cash | 913,568 | 570,483 | |||||||||||||
Receivable for capital shares sold | 1,838 | 1,342 | |||||||||||||
Receivable from investment adviser | 5,073 | 9,472 | |||||||||||||
Dividends and interest receivable | 1,143 | 4,369 | |||||||||||||
Prepaid expenses and other assets | 30,156 | 25,867 | |||||||||||||
|
|
|
| ||||||||||||
Total assets. | 10,613,902 | 6,538,751 | |||||||||||||
|
|
|
| ||||||||||||
Liabilities | |||||||||||||||
Payable for investments purchased | 165,084 | 289,073 | |||||||||||||
Payable for capital shares redeemed | 9,581 | 110,833 | |||||||||||||
Payable for transfer agent fees | 7,217 | 6,651 | |||||||||||||
Payable for audit fees | 3,655 | 13,175 | |||||||||||||
Payable for administration and accounting fees | 1,067 | 1,353 | |||||||||||||
Payable for custodian fees | 755 | 942 | |||||||||||||
Payable for distribution fees | 45 | 15 | |||||||||||||
Payable for printing fees | 7 | 607 | |||||||||||||
Payable for Trustees and Officers | 3 | — | |||||||||||||
Payable for legal fees | — | 38 | |||||||||||||
Accrued expenses | 510 | 83 | |||||||||||||
|
|
|
| ||||||||||||
Total liabilities | 187,924 | 422,770 | |||||||||||||
|
|
|
| ||||||||||||
Net Assets | $ | 10,425,978 | $ | 6,115,981 | |||||||||||
|
|
|
| ||||||||||||
Net Assets consisted of: | |||||||||||||||
Capital stock, $0.01 par value | $ | 8,736 | $ | 4,844 | |||||||||||
Paid-in capital | 9,728,616 | 5,425,557 | |||||||||||||
Total distributable earnings | 688,626 | 685,580 | |||||||||||||
|
|
|
| ||||||||||||
Net Assets | $ | 10,425,978 | $ | 6,115,981 | |||||||||||
|
|
|
| ||||||||||||
Institutional Class: | |||||||||||||||
Net assets | $ | 10,216,165 | $ | 6,040,641 | |||||||||||
|
|
|
| ||||||||||||
Shares outstanding | 856,024 | 478,434 | |||||||||||||
|
|
|
| ||||||||||||
Net asset value, offering and redemption price per share | $ | 11.93 | $ | 12.63 | |||||||||||
|
|
|
| ||||||||||||
Investor Class: | |||||||||||||||
Net assets | $ | 209,813 | $ | 75,340 | |||||||||||
|
|
|
| ||||||||||||
Shares outstanding | 17,610 | 5,978 | |||||||||||||
|
|
|
| ||||||||||||
Net asset value, offering and redemption price per share | $ | 11.91 | $ | 12.60 | |||||||||||
|
|
|
| ||||||||||||
* Investments, at cost. | $ | 8,494,794 | $ | 5,293,075 | |||||||||||
The accompanying notes are an integral part of the financial statements.
27
POLEN GROWTH FUNDS
Statements of Operations
For the Six Months Ended October 31, 2019
(Unaudited)
| Polen Growth Fund | Polen Global Growth Fund | Polen International Growth Fund | |||||||||||||
Investment income | |||||||||||||||
Dividends | $ | 11,632,527 | $ | 403,478 | $ | 647,227 | |||||||||
Less: foreign taxes withheld | — | (24,558 | ) | (32,041 | ) | ||||||||||
|
|
|
|
|
| ||||||||||
Total investment income | 11,632,527 | 378,920 | 615,186 | ||||||||||||
|
|
|
|
|
| ||||||||||
Expenses | |||||||||||||||
Advisory fees (Note 2) | 17,230,485 | 368,412 | 389,796 | ||||||||||||
Transfer agent fees (Note 2) | 1,151,700 | 43,426 | 48,361 | ||||||||||||
Distribution fees (Investor Shares) (Note 2) | 387,010 | 14,342 | 1,885 | ||||||||||||
Administration and accounting fees (Note 2) | 374,898 | 23,475 | 24,113 | ||||||||||||
Trustees’ and officers’ fees (Note 2) | 195,066 | 4,096 | 3,754 | ||||||||||||
Custodian fees (Note 2) | 86,491 | 10,345 | 11,820 | ||||||||||||
Registration and filing fees | 85,577 | 25,601 | 20,381 | ||||||||||||
Legal fees | 81,743 | 1,568 | 2,313 | ||||||||||||
Printing and shareholder reporting fees | 75,506 | 11,132 | 11,110 | ||||||||||||
Audit fees | 14,257 | 14,241 | 14,368 | ||||||||||||
Other expenses | 56,322 | 2,349 | 2,291 | ||||||||||||
|
|
|
|
|
| ||||||||||
Total expenses before waivers and reimbursements and/or recoupment | 19,739,055 | 518,987 | 530,192 | ||||||||||||
|
|
|
|
|
| ||||||||||
Less: (waivers) and (reimbursements) and/or recoupment (Note 2) | 52,409 | (27,877 | ) | (23,982 | ) | ||||||||||
|
|
|
|
|
| ||||||||||
Net expenses after waivers and reimbursements and/or recoupment | 19,791,464 | 491,110 | 506,210 | ||||||||||||
|
|
|
|
|
| ||||||||||
Net investment income/(loss) | (8,158,937 | ) | (112,190 | ) | 108,976 | ||||||||||
|
|
|
|
|
| ||||||||||
Net realized and unrealized gain/(loss) from investments | |||||||||||||||
Net realized gain/(loss) from investments | 31,465,212 | (255,339 | ) | (936,517 | ) | ||||||||||
Net realized loss from foreign currency transactions | — | (25,503 | ) | (62,249 | ) | ||||||||||
Net change in unrealized appreciation/(depreciation) on investments | 167,563,031 | 3,948,564 | 3,034,161 | ||||||||||||
Net change in unrealized appreciation/(depreciation) on foreign currency translations | — | 1,330 | 4,566 | ||||||||||||
|
|
|
|
|
| ||||||||||
Net realized and unrealized gain on investments | 199,028,243 | 3,669,052 | 2,039,961 | ||||||||||||
|
|
|
|
|
| ||||||||||
Net increase in net assets resulting from operations | $ | 190,869,306 | $ | 3,556,862 | $ | 2,148,937 | |||||||||
|
|
|
|
|
| ||||||||||
The accompanying notes are an integral part of the financial statements.
28
POLEN GROWTH FUNDS
Statements of Operations
For the Six Months Ended October 31, 2019
(Unaudited)
| Polen U.S. Small Company Growth Fund | Polen International Small Company Growth Fund | |||||||||
Investment income | ||||||||||
Dividends | $ | 14,663 | $ | 35,413 | ||||||
Less: foreign taxes withheld | — | (3,968 | ) | |||||||
|
|
|
| |||||||
Total investment income | 14,663 | 31,445 | ||||||||
|
|
|
| |||||||
Expenses | ||||||||||
Advisory fees (Note 2) | 45,001 | 23,259 | ||||||||
Transfer agent fees (Note 2) | 22,777 | 21,461 | ||||||||
Registration and filing fees | 21,115 | 15,445 | ||||||||
Audit fees | 12,696 | 12,983 | ||||||||
Printing and shareholder reporting fees | 8,284 | 6,837 | ||||||||
Administration and accounting fees (Note 2) | 3,750 | 4,368 | ||||||||
Custodian fees (Note 2) | 3,680 | 8,997 | ||||||||
Trustees’ and officers’ fees (Note 2) | 428 | 167 | ||||||||
Distribution fees (Investor Shares) (Note 2) | 164 | 127 | ||||||||
Legal fees | 147 | 18 | ||||||||
Other expenses | 1,500 | 1,513 | ||||||||
|
|
|
| |||||||
Total expenses before waivers and reimbursements and/or recoupment | 119,542 | 95,175 | ||||||||
|
|
|
| |||||||
Less: (waivers) and (reimbursements) and/or recoupment (Note 2) | (63,129 | ) | (65,973 | ) | ||||||
|
|
|
| |||||||
Net expenses after waivers and reimbursements and/or recoupment | 56,413 | 29,202 | ||||||||
|
|
|
| |||||||
Net investment income/(loss) | (41,750 | ) | 2,243 | |||||||
|
|
|
| |||||||
Net realized and unrealized gain/(loss) from investments | ||||||||||
Net realized gain/(loss) from investments | (412,759 | ) | 72,790 | |||||||
Net realized loss from foreign currency transactions | — | (5,654 | ) | |||||||
Net change in unrealized appreciation/(depreciation) on investments | 130,998 | 218,880 | ||||||||
Net change in unrealized appreciation/(depreciation) on foreign currency translations | — | (766 | ) | |||||||
|
|
|
| |||||||
Net realized and unrealized gain/(loss) on investments | (281,761 | ) | 285,250 | |||||||
|
|
|
| |||||||
Net increase/(decrease) in net assets resulting from operations | $ | (323,511 | ) | $ | 287,493 | |||||
|
|
|
| |||||||
The accompanying notes are an integral part of the financial statements.
29
POLEN GROWTH FUND
Statements of Changes in Net Assets
| For the Six Months Ended October 31, 2019 (Unaudited) | For the Year Ended April 30, 2019 | |||||||||
Increase/(decrease) in net assets from operations: | ||||||||||
Net investment loss | $ | (8,158,937 | ) | $ | (5,079,486 | ) | ||||
Net realized gain from investments | 31,465,212 | 20,384,872 | ||||||||
Net change in unrealized appreciation/(depreciation) on investments | 167,563,031 | 623,497,248 | ||||||||
|
|
|
| |||||||
Net increase in net assets resulting from operations | 190,869,306 | 638,802,634 | ||||||||
|
|
|
| |||||||
Less dividends and distributions to shareholders from: | ||||||||||
Total distributable earnings: | ||||||||||
Institutional Class | — | (61,771,852 | ) | |||||||
Investor Class | — | (4,657,005 | ) | |||||||
|
|
|
| |||||||
Net decrease in net assets from dividends and distributions to shareholders | — | (66,428,857 | ) | |||||||
|
|
|
| |||||||
Increase in net assets derived from capital share transactions (Note 4) | 603,141,366 | 1,188,667,121 | ||||||||
|
|
|
| |||||||
Total increase in net assets | 794,010,672 | 1,761,040,898 | ||||||||
|
|
|
| |||||||
Net assets | ||||||||||
Beginning of period | 3,667,451,251 | 1,906,410,353 | ||||||||
|
|
|
| |||||||
End of period | $ | 4,461,461,923 | $ | 3,667,451,251 | ||||||
|
|
|
| |||||||
The accompanying notes are an integral part of the financial statements.
30
POLEN GLOBAL GROWTH FUND
Statements of Changes in Net Assets
| For the Six Months Ended October 31, 2019 (Unaudited) | For the Year Ended April 30, 2019 | |||||||||
Increase/(decrease) in net assets from operations: | ||||||||||
Net investment loss | $ | (112,190 | ) | $ | (87,533 | ) | ||||
Net realized gain/(loss) from investments and foreign currency transactions | (280,842 | ) | 155,063 | |||||||
Net change in unrealized appreciation/(depreciation) on investments | 3,949,894 | 10,787,025 | ||||||||
|
|
|
| |||||||
Net increase in net assets resulting from operations | 3,556,862 | 10,854,555 | ||||||||
|
|
|
| |||||||
Less dividends and distributions to shareholders from: | ||||||||||
Total distributable earnings: | ||||||||||
Institutional Class | — | (772,271 | ) | |||||||
Investor Class | — | (142,087 | ) | |||||||
|
|
|
| |||||||
Net decrease in net assets from dividends and distributions to shareholders | — | (914,358 | ) | |||||||
|
|
|
| |||||||
Increase in net assets derived from capital share transactions (Note 4) | 13,125,078 | 34,009,830 | ||||||||
|
|
|
| |||||||
Total increase in net assets | 16,681,940 | 43,950,027 | ||||||||
|
|
|
| |||||||
Net assets | ||||||||||
Beginning of period | 79,745,544 | 35,795,517 | ||||||||
|
|
|
| |||||||
End of period | $ | 96,427,484 | $ | 79,745,544 | ||||||
|
|
|
| |||||||
The accompanying notes are an integral part of the financial statements.
31
POLEN INTERNATIONAL GROWTH FUND
Statements of Changes in Net Assets
| For the Six Months Ended October 31, 2019 (Unaudited) | For the Year Ended April 30, 2019 | |||||||||
Increase/(decrease) in net assets from operations: | ||||||||||
Net investment income | $ | 108,976 | $ | 85,611 | ||||||
Net realized loss from investments and foreign currency transactions | (998,766 | ) | (383,994 | ) | ||||||
Net change in unrealized appreciation/(depreciation) on investments | 3,038,727 | 4,578,389 | ||||||||
|
|
|
| |||||||
Net increase in net assets resulting from operations | 2,148,937 | 4,280,006 | ||||||||
|
|
|
| |||||||
Less dividends and distributions to shareholders from: | ||||||||||
Total distributable earnings: | ||||||||||
Institutional Class | — | (42,741 | ) | |||||||
Investor Class | — | (649 | ) | |||||||
|
|
|
| |||||||
Net decrease in net assets from dividends and distributions to shareholders | — | (43,390 | ) | |||||||
|
|
|
| |||||||
Increase in net assets derived from capital share transactions (Note 4) | 35,594,940 | 54,712,301 | ||||||||
|
|
|
| |||||||
Total increase in net assets | 37,743,877 | 58,948,917 | ||||||||
|
|
|
| |||||||
Net assets | ||||||||||
Beginning of period | 70,177,947 | 11,229,030 | ||||||||
|
|
|
| |||||||
End of period | $ | 107,921,824 | $ | 70,177,947 | ||||||
|
|
|
| |||||||
The accompanying notes are an integral part of the financial statements.
32
POLEN U.S. SMALL COMPANY GROWTH FUND
Statements of Changes in Net Assets
| For the Six Months Ended October 31, 2019 (Unaudited) | For the Year Ended April 30, 2019 | |||||||||
Increase/(decrease) in net assets from operations: | ||||||||||
Net investment loss | $ | (41,750 | ) | $ | (46,365 | ) | ||||
Net realized gain/(loss) from investments | (412,759 | ) | 11,252 | |||||||
Net change in unrealized appreciation/(depreciation) on investments | 130,998 | 1,010,346 | ||||||||
|
|
|
| |||||||
Net increase/(decrease) in net assets resulting from operations | (323,511 | ) | 975,233 | |||||||
|
|
|
| |||||||
Less dividends and distributions to shareholders from: | ||||||||||
Total distributable earnings: | ||||||||||
Institutional Class | — | (9,611 | ) | |||||||
|
|
|
| |||||||
Net decrease in net assets from dividends and distributions to shareholders | — | (9,611 | ) | |||||||
|
|
|
| |||||||
Increase in net assets derived from capital share transactions (Note 4) | 2,795,812 | 3,654,361 | ||||||||
|
|
|
| |||||||
Total increase in net assets | 2,472,301 | 4,619,983 | ||||||||
|
|
|
| |||||||
Net assets | ||||||||||
Beginning of period | 7,953,677 | 3,333,694 | ||||||||
|
|
|
| |||||||
End of period | $ | 10,425,978 | $ | 7,953,677 | ||||||
|
|
|
| |||||||
The accompanying notes are an integral part of the financial statements.
33
POLEN INTERNATIONAL SMALL COMPANY GROWTH FUND
Statements of Changes in Net Assets
| For the Six Months Ended October 31, 2019 (Unaudited) | For the Period Ended April 30, 2019* | |||||||||
Increase/(decrease) in net assets from operations: | ||||||||||
Net investment income | $ | 2,243 | $ | 88 | ||||||
Net realized gain/(loss) from investments and foreign currency transactions | 67,136 | (17,263 | ) | |||||||
Net change in unrealized appreciation/(depreciation) on investments | 218,114 | 415,262 | ||||||||
|
|
|
| |||||||
Net increase in net assets resulting from operations | 287,493 | 398,087 | ||||||||
|
|
|
| |||||||
Increase in net assets derived from capital share transactions (Note 4) | 2,433,975 | 2,996,426 | ||||||||
|
|
|
| |||||||
Total increase in net assets | 2,721,468 | 3,394,513 | ||||||||
|
|
|
| |||||||
Net assets | ||||||||||
Beginning of period | 3,394,513 | — | ||||||||
|
|
|
| |||||||
End of period | $ | 6,115,981 | $ | 3,394,513 | ||||||
|
|
|
| |||||||
| * | The Polen International Small Company Growth Fund commenced operations on December 31, 2018. |
The accompanying notes are an integral part of the financial statements.
34
POLEN GROWTH FUND
Financial Highlights
Contained below is per share operating performance data for Institutional Class shares outstanding, total investment return, ratios to average net assets and other supplemental data for the respective period. The total returns in the table represent the rate that an investor would have earned or lost on an investment in the Fund (assuming reinvestment of all dividends and distributions). This information has been derived from information provided in the financial statements and should be read in conjunction with the financial statements and the notes thereto. | ||||||||||||
| Institutional Class | ||||||||||||||||||||||||||||||
| For the | ||||||||||||||||||||||||||||||
| Six Months Ended | For the | For the | For the | For the | For the | |||||||||||||||||||||||||
| October 31, 2019 | Year Ended | Year Ended | Year Ended | Year Ended | Year Ended | |||||||||||||||||||||||||
| (Unaudited) | April 30, 2019 | April 30, 2018 | April 30, 2017 | April 30, 2016 | April 30, 2015 | |||||||||||||||||||||||||
Per Share Operating Performance | ||||||||||||||||||||||||||||||
Net asset value, beginning of period | $ | 31.20 | $ | 25.34 | $ | 21.85 | $ | 18.92 | $ | 18.29 | $ | 16.45 | ||||||||||||||||||
|
|
|
|
|
|
|
|
|
|
|
| |||||||||||||||||||
Net investment income/(loss)(1) | (0.06 | ) | (0.05 | ) | (0.06 | ) | (0.04 | ) | 0.01 | 0.02 | ||||||||||||||||||||
Net realized and unrealized gain on investments | 1.49 | 6.62 | 3.95 | 2.97 | 1.45 | 3.09 | ||||||||||||||||||||||||
|
|
|
|
|
|
|
|
|
|
|
| |||||||||||||||||||
Net increase in net assets resulting from operations | 1.43 | 6.57 | 3.89 | 2.93 | 1.46 | 3.11 | ||||||||||||||||||||||||
|
|
|
|
|
|
|
|
|
|
|
| |||||||||||||||||||
Dividends and distributions to shareholders from: | ||||||||||||||||||||||||||||||
Net investment income | — | — | — | — | (2) | — | (0.02 | ) | ||||||||||||||||||||||
Net realized capital gains | — | (0.71 | ) | (0.40 | ) | — | (0.83 | ) | (1.25 | ) | ||||||||||||||||||||
|
|
|
|
|
|
|
|
|
|
|
| |||||||||||||||||||
Total dividends and distributions to shareholders | — | (0.71 | ) | (0.40 | ) | — | (0.83 | ) | (1.27 | ) | ||||||||||||||||||||
|
|
|
|
|
|
|
|
|
|
|
| |||||||||||||||||||
Redemption fees | — | (2) | — | (2) | — | (2) | — | (2) | — | (2) | — | (2) | ||||||||||||||||||
|
|
|
|
|
|
|
|
|
|
|
| |||||||||||||||||||
Net asset value, end of period | $ | 32.63 | $ | 31.20 | $ | 25.34 | $ | 21.85 | $ | 18.92 | $ | 18.29 | ||||||||||||||||||
|
|
|
|
|
|
|
|
|
|
|
| |||||||||||||||||||
Total investment return(3) | 4.58 | % | 26.44 | % | 17.90 | % | 15.50 | % | 7.86 | % | 19.17 | % | ||||||||||||||||||
Ratios/Supplemental Data | ||||||||||||||||||||||||||||||
Net assets, end of period (in thousands) | $ | 4,135,280 | $ | 3,381,068 | $ | 1,839,280 | $ | 1,363,731 | $ | 959,962 | $ | 376,718 | ||||||||||||||||||
Ratio of expenses to average net assets | 0.96 | %(4) | 1.00 | % | 1.00 | % | 1.00 | % | 1.00 | % | 1.00 | % | ||||||||||||||||||
Ratio of expenses to average net assets without waivers, expense reimbursements and/or recoupment, if any(5) | 0.95 | %(4) | 1.00 | % | 0.98 | % | 1.12 | % | 1.17 | % | 1.25 | % | ||||||||||||||||||
Ratio of net investment income/(loss) to average net assets | (0.38 | )%(4) | (0.18 | )% | (0.24 | )% | (0.18 | )% | 0.04 | % | 0.10 | % | ||||||||||||||||||
Portfolio turnover rate | 5 | %(6) | 19 | % | 20 | % | 14 | % | 9 | % | 33 | % | ||||||||||||||||||
| (1) | The selected per share data was calculated using the average shares outstanding method for the period. |
| (2) | Amount is less than $0.005 per share. |
| (3) | Total investment return is calculated assuming a purchase of shares on the first day and a sale of shares on the last day of each period reported and includes reinvestments of dividends and distributions, if any. Total returns for periods less than one year are not annualized. |
| (4) | Annualized. |
| (5) | During the period, certain fees were waived and/or reimbursed; or recouped, if any. If such fee waivers and/or reimbursements or recoupments had not occurred, the ratios would have been as indicated (See Note 2). |
| (6) | Not annualized. |
The accompanying notes are an integral part of the financial statements.
35
POLEN GROWTH FUND
Financial Highlights
Contained below is per share operating performance data for Investor Class shares outstanding, total investment return, ratios to average net assets and other supplemental data for the respective period. The total returns in the table represent the rate that an investor would have earned or lost on an investment in the Fund (assuming reinvestment of all dividends and distributions). This information has been derived from information provided in the financial statements and should be read in conjunction with the financial statements and the notes thereto. | ||||||||||||
| Investor Class | ||||||||||||||||||||||||||||||
| For the | ||||||||||||||||||||||||||||||
| Six Months Ended | For the | For the | For the | For the | For the | |||||||||||||||||||||||||
| October 31, 2019 | Year Ended | Year Ended | Year Ended | Year Ended | Year Ended | |||||||||||||||||||||||||
| (Unaudited) | April 30, 2019 | April 30, 2018 | April 30, 2017 | April 30, 2016 | April 30, 2015 | |||||||||||||||||||||||||
Per Share Operating Performance | ||||||||||||||||||||||||||||||
Net asset value, beginning of period | $ | 30.59 | $ | 24.92 | $ | 21.55 | $ | 18.70 | $ | 18.14 | $ | 16.35 | ||||||||||||||||||
|
|
|
|
|
|
|
|
|
|
|
| |||||||||||||||||||
Net investment loss(1) | (0.10 | ) | (0.12 | ) | (0.11 | ) | (0.08 | ) | (0.04 | ) | (0.02 | ) | ||||||||||||||||||
Net realized and unrealized gain on investments | 1.46 | 6.50 | 3.88 | 2.93 | 1.43 | 3.06 | ||||||||||||||||||||||||
|
|
|
|
|
|
|
|
|
|
|
| |||||||||||||||||||
Net increase in net assets resulting from operations | 1.36 | 6.38 | 3.77 | 2.85 | 1.39 | 3.04 | ||||||||||||||||||||||||
|
|
|
|
|
|
|
|
|
|
|
| |||||||||||||||||||
Dividends and distributions to shareholders from: | ||||||||||||||||||||||||||||||
Net investment income | — | — | — | — | — | — | ||||||||||||||||||||||||
Net realized capital gains | — | (0.71 | ) | (0.40 | ) | — | (0.83 | ) | (1.25 | ) | ||||||||||||||||||||
|
|
|
|
|
|
|
|
|
|
|
| |||||||||||||||||||
Total dividends and distributions to shareholders | — | (0.71 | ) | (0.40 | ) | — | (0.83 | ) | (1.25 | ) | ||||||||||||||||||||
|
|
|
|
|
|
|
|
|
|
|
| |||||||||||||||||||
Redemption fees | — | (2) | — | (2) | — | (2) | — | (2) | — | (2) | — | (2) | ||||||||||||||||||
|
|
|
|
|
|
|
|
|
|
|
| |||||||||||||||||||
Net asset value, end of period | $ | 31.95 | $ | 30.59 | $ | 24.92 | $ | 21.55 | $ | 18.70 | $ | 18.14 | ||||||||||||||||||
|
|
|
|
|
|
|
|
|
|
|
| |||||||||||||||||||
Total investment return(3) | 4.45 | % | 26.12 | % | 17.59 | % | 15.24 | % | 7.54 | % | 18.87 | % | ||||||||||||||||||
Ratios/Supplemental Data | ||||||||||||||||||||||||||||||
Net assets, end of period (in thousands) | $ | 326,182 | $ | 286,383 | $ | 67,130 | $ | 107,358 | $ | 150,617 | $ | 29,545 | ||||||||||||||||||
Ratio of expenses to average net assets | 1.21 | %(4) | 1.25 | % | 1.25 | % | 1.25 | % | 1.25 | % | 1.25 | % | ||||||||||||||||||
Ratio of expenses to average net assets without waivers, expense reimbursements and/or recoupment, if any(5) | 1.20 | %(4) | 1.26 | % | 1.23 | % | 1.38 | % | 1.42 | % | 1.50 | % | ||||||||||||||||||
Ratio of net investment loss to average net assets | | (0.63 | )%(4) | (0.43 | )% | (0.49 | )% | (0.43 | )% | (0.21 | )% | (0.14 | )% | |||||||||||||||||
Portfolio turnover rate | 5 | %(6) | 19 | % | 20 | % | 14 | % | 9 | % | 33 | % | ||||||||||||||||||
| (1) | The selected per share data was calculated using the average shares outstanding method for the period. |
| (2) | Amount is less than $0.005 per share. |
| (3) | Total investment return is calculated assuming a purchase of shares on the first day and a sale of shares on the last day of each period reported and includes reinvestments of dividends and distributions, if any. Total returns for periods less than one year are not annualized. |
| (4) | Annualized. |
| (5) | During the period, certain fees were waived and/or reimbursed; or recouped, if any. If such fee waivers and/or reimbursements or recoupments had not occurred, the ratios would have been as indicated (See Note 2). |
| (6) | Not annualized. |
The accompanying notes are an integral part of the financial statements.
36
POLEN GLOBAL GROWTH FUND
Financial Highlights
Contained below is per share operating performance data for Institutional Class shares outstanding, total investment return, ratios to average net assets and other supplemental data for the respective period. The total returns in the table represent the rate that an investor would have earned or lost on an investment in the Fund (assuming reinvestment of all dividends and distributions). This information has been derived from information provided in the financial statements and should be read in conjunction with the financial statements and the notes thereto. |
| Institutional Class | ||||||||||||||||||||||||||||||
| For the Six Months Ended October 31, 2019 (Unaudited) | For the Year Ended April 30, 2019 | For the Year Ended April 30, 2018 | For the Year Ended April 30, 2017 | For the Year Ended April 30, 2016 | For the Period December 30, 2014* to April 30, 2015 | |||||||||||||||||||||||||
Per Share Operating Performance | ||||||||||||||||||||||||||||||
Net asset value, beginning of period | $ | 17.35 | $ | 14.74 | $ | 12.29 | $ | 10.67 | $ | 10.29 | $ | 10.00 | ||||||||||||||||||
|
|
|
|
|
|
|
|
|
|
|
| |||||||||||||||||||
Net investment income/(loss)(1) | (0.02 | ) | (0.02 | ) | (0.03 | ) | (0.02 | ) | — | (2) | 0.02 | |||||||||||||||||||
Net realized and unrealized gain on investments | 0.71 | 2.90 | 2.48 | 1.65 | 0.39 | 0.27 | ||||||||||||||||||||||||
|
|
|
|
|
|
|
|
|
|
|
| |||||||||||||||||||
Net increase in net assets resulting from operations | 0.69 | 2.88 | 2.45 | 1.63 | 0.39 | 0.29 | ||||||||||||||||||||||||
|
|
|
|
|
|
|
|
|
|
|
| |||||||||||||||||||
Dividends and distributions to shareholders from: | ||||||||||||||||||||||||||||||
Net investment income | — | — | — | — | (0.01 | ) | — | |||||||||||||||||||||||
Net realized capital gains | — | (0.28 | ) | — | (0.01 | ) | — | — | ||||||||||||||||||||||
|
|
|
|
|
|
|
|
|
|
|
| |||||||||||||||||||
Total dividends and distributions to shareholders | — | (0.28 | ) | — | (0.01 | ) | (0.01 | ) | — | |||||||||||||||||||||
|
|
|
|
|
|
|
|
|
|
|
| |||||||||||||||||||
Redemption fees | — | (2) | 0.01 | — | (2) | — | (2) | — | (2) | — | ||||||||||||||||||||
|
|
|
|
|
|
|
|
|
|
|
| |||||||||||||||||||
Net asset value, end of period | $ | 18.04 | $ | 17.35 | $ | 14.74 | $ | 12.29 | $ | 10.67 | $ | 10.29 | ||||||||||||||||||
|
|
|
|
|
|
|
|
|
|
|
| |||||||||||||||||||
Total investment return(3) | 3.98 | % | 19.91 | % | 19.94 | % | 15.24 | % | 3.78 | % | 2.90 | % | ||||||||||||||||||
Ratios/Supplemental Data | ||||||||||||||||||||||||||||||
Net assets, end of period (in thousands) | $ | 83,502 | $ | 68,617 | $ | 30,702 | $ | 18,618 | $ | 13,483 | $ | 3,076 | ||||||||||||||||||
Ratio of expenses to average net assets | 1.10 | %(4) | 1.10 | % | 1.10 | % | 1.10 | % | 1.10 | % | 1.10 | %(4) | ||||||||||||||||||
Ratio of expenses to average net assets without waivers and expense reimbursements(5) | 1.16 | %(4) | 1.31 | % | 1.50 | % | 2.40 | % | 3.63 | % | 9.78 | %(4) | ||||||||||||||||||
Ratio of net investment income/(loss) to average net assets | (0.23 | )%(4) | (0.13 | )% | (0.18 | )% | (0.18 | )% | (0.01 | )% | 0.47 | %(4) | ||||||||||||||||||
Portfolio turnover rate | 10 | %(6) | 20 | % | 14 | % | 12 | % | 7 | % | — | |||||||||||||||||||
| * | Commencement of operations. |
| (1) | The selected per share data was calculated using the average shares outstanding method for the period. |
| (2) | Amount is less than $0.005 per share. |
| (3) | Total investment return is calculated assuming a purchase of shares on the first day and a sale of shares on the last day of each period reported and includes reinvestments of dividends and distributions, if any. Total returns for periods less than one year are not annualized. |
| (4) | Annualized. |
| (5) | During the period, certain fees were waived and/or reimbursed. If such fee waivers and/or reimbursements had not occurred, the ratios would have been as indicated (See Note 2). |
| (6) | Not annualized. |
The accompanying notes are an integral part of the financial statements.
37
POLEN GLOBAL GROWTH FUND
Financial Highlights
Contained below is per share operating performance data for Investor Class shares outstanding, total investment return, ratios to average net assets and other supplemental data for the respective period. The total returns in the table represent the rate that an investor would have earned or lost on an investment in the Fund (assuming reinvestment of all dividends and distributions). This information has been derived from information provided in the financial statements and should be read in conjunction with the financial statements and the notes thereto. |
| Investor Class | |||||||||||||||||||||||||
| For the Six Months Ended October 31, 2019 (Unaudited) | For the Year Ended April 30, 2019 | For the Year Ended April 30, 2018 | For the Year Ended April 30, 2017 | For the Period July 6, 2015* to April 30, 2016 | |||||||||||||||||||||
Per Share Operating Performance | |||||||||||||||||||||||||
Net asset value, beginning of period | $ | 17.17 | $ | 14.62 | $ | 12.23 | $ | 10.64 | $ | 10.32 | |||||||||||||||
|
|
|
|
|
|
|
|
|
| ||||||||||||||||
Net investment loss(1) | (0.04 | ) | (0.06 | ) | (0.06 | ) | (0.05 | ) | — | (2) | |||||||||||||||
Net realized and unrealized gain on investments | 0.70 | 2.88 | 2.45 | 1.65 | 0.32 | ||||||||||||||||||||
|
|
|
|
|
|
|
|
|
| ||||||||||||||||
Net increase in net assets resulting from operations | 0.66 | 2.82 | 2.39 | 1.60 | 0.32 | ||||||||||||||||||||
|
|
|
|
|
|
|
|
|
| ||||||||||||||||
Dividends and distributions to shareholders from: | |||||||||||||||||||||||||
Net investment income | — | — | — | — | — | (2) | |||||||||||||||||||
Net realized capital gains | — | (0.28 | ) | — | (0.01 | ) | — | ||||||||||||||||||
|
|
|
|
|
|
|
|
|
| ||||||||||||||||
Total dividends and distributions to shareholders | — | (0.28 | ) | — | (0.01 | ) | — | ||||||||||||||||||
|
|
|
|
|
|
|
|
|
| ||||||||||||||||
Redemption fees | — | (2) | 0.01 | — | (2) | — | (2) | — | (2) | ||||||||||||||||
|
|
|
|
|
|
|
|
|
| ||||||||||||||||
Net asset value, end of period | $ | 17.83 | $ | 17.17 | $ | 14.62 | $ | 12.23 | $ | 10.64 | |||||||||||||||
|
|
|
|
|
|
|
|
|
| ||||||||||||||||
Total investment return(3) | 3.84 | % | 19.66 | % | 19.54 | % | 15.00 | % | 3.13 | % | |||||||||||||||
Ratios/Supplemental Data | |||||||||||||||||||||||||
Net assets, end of period (in thousands) | $ | 12,926 | $ | 11,129 | $ | 5,094 | $ | 996 | $ | 523 | |||||||||||||||
Ratio of expenses to average net assets | 1.35 | %(4) | 1.35 | % | 1.35 | % | 1.35 | % | 1.35 | %(4) | |||||||||||||||
Ratio of expenses to average net assets without waivers and expense reimbursements(5) | 1.41 | %(4) | 1.56 | % | 1.71 | % | 2.61 | % | 3.51 | %(4) | |||||||||||||||
Ratio of net investment loss to average net assets | (0.48 | )%(4) | (0.38 | )% | (0.43 | )% | (0.43 | )% | (0.06 | )%(4) | |||||||||||||||
Portfolio turnover rate | 10 | %(6) | 20 | % | 14 | % | 12 | % | 7 | %(7) | |||||||||||||||
| * | Commencement of operations. |
| (1) | The selected per share data was calculated using the average shares outstanding method for the period. |
| (2) | Amount is less than $0.005 per share. |
| (3) | Total investment return is calculated assuming a purchase of shares on the first day and a sale of shares on the last day of each period reported and includes reinvestments of dividends and distributions, if any. Total returns for periods less than one year are not annualized. |
| (4) | Annualized. |
| (5) | During the period, certain fees were waived and/or reimbursed. If such fee waivers and/or reimbursements had not occurred, the ratios would have been as indicated (See Note 2). |
| (6) | Not annualized. |
| (7) | Reflects portfolio turnover of the Fund for the year ended April 30, 2016. |
The accompanying notes are an integral part of the financial statements.
38
POLEN INTERNATIONAL GROWTH FUND
Financial Highlights
Contained below is per share operating performance data for Institutional Class shares outstanding, total investment return, ratios to average net assets and other supplemental data for the respective period. The total returns in the table represent the rate that an investor would have earned or lost on an investment in the Fund (assuming reinvestment of all dividends and distributions). This information has been derived from information provided in the financial statements and should be read in conjunction with the financial statements and the notes thereto. |
| Institutional Class | ||||||||||||||||||||
| For the | ||||||||||||||||||||
| Six Months Ended | For the | For the | For the Period | |||||||||||||||||
| October 31, 2019 | Year Ended | Year Ended | December 30, 2016* | |||||||||||||||||
| (Unaudited) | April 30, 2019 | April 30, 2018 | to April 30, 2017 | |||||||||||||||||
Per Share Operating Performance | ||||||||||||||||||||
Net asset value, beginning of period | $ | 14.35 | $ | 13.24 | $ | 11.57 | $ | 10.00 | ||||||||||||
|
|
|
|
|
|
|
| |||||||||||||
Net investment income(1) | 0.02 | 0.03 | 0.06 | 0.05 | ||||||||||||||||
Net realized and unrealized gain on investments | 0.29 | 1.10 | 1.70 | 1.52 | ||||||||||||||||
|
|
|
|
|
|
|
| |||||||||||||
Net increase in net assets resulting from operations | 0.31 | 1.13 | 1.76 | 1.57 | ||||||||||||||||
|
|
|
|
|
|
|
| |||||||||||||
Dividends and distributions to shareholders from: | ||||||||||||||||||||
Net investment income | — | (0.01 | ) | (0.07 | ) | — | ||||||||||||||
Net realized capital gains | — | (0.01 | ) | (0.02 | ) | — | ||||||||||||||
|
|
|
|
|
|
|
| |||||||||||||
Total dividends and distributions to shareholders | — | (0.02 | ) | (0.09 | ) | — | ||||||||||||||
|
|
|
|
|
|
|
| |||||||||||||
Redemption fees | — | (2) | — | (2) | — | — | ||||||||||||||
|
|
|
|
|
|
|
| |||||||||||||
Net asset value, end of period | $ | 14.66 | $ | 14.35 | $ | 13.24 | $ | 11.57 | ||||||||||||
|
|
|
|
|
|
|
| |||||||||||||
Total investment return(3) | 2.16 | % | 8.50 | % | 15.18 | % | 15.70 | % | ||||||||||||
Ratios/Supplemental Data | ||||||||||||||||||||
Net assets, end of period (in thousands) | $ | 106,098 | $ | 68,857 | $ | 10,982 | $ | 2,648 | ||||||||||||
Ratio of expenses to average net assets | 1.10 | %(4) | 1.10 | % | 1.10 | % | 1.10 | %(4) | ||||||||||||
Ratio of expenses to average net assets without waivers and expense reimbursements(5) | 1.15 | %(4) | 1.40 | % | 3.45 | % | 9.84 | %(4) | ||||||||||||
Ratio of net investment income to average net assets | 0.24 | %(4) | 0.22 | % | 0.48 | % | 1.32 | %(4) | ||||||||||||
Portfolio turnover rate | 4 | %(6) | 12 | % | 6 | % | — | |||||||||||||
| * | Commencement of operations. |
| (1) | The selected per share data was calculated using the average shares outstanding method for the period. |
| (2) | Amount is less than $0.005 per share. |
| (3) | Total investment return is calculated assuming a purchase of shares on the first day and a sale of shares on the last day of each period reported and includes reinvestments of dividends and distributions, if any. Total returns for periods less than one year are not annualized. |
| (4) | Annualized. |
| (5) | During the period, certain fees were waived and/or reimbursed. If such fee waivers and/or reimbursements had not occurred, the ratios would have been as indicated (See Note 2). |
| (6) | Not annualized. |
The accompanying notes are an integral part of the financial statements.
39
POLEN INTERNATIONAL GROWTH FUND
Financial Highlights
Contained below is per share operating performance data for Investor Class shares outstanding, total investment return, ratios to average net assets and other supplemental data for the respective period. The total returns in the table represent the rate that an investor would have earned or lost on an investment in the Fund (assuming reinvestment of all dividends and distributions). This information has been derived from information provided in the financial statements and should be read in conjunction with the financial statements and the notes thereto. |
Investor Class | ||||||||||||||||||||
| For the | ||||||||||||||||||||
| Six Months Ended | For the | For the | For the Period | |||||||||||||||||
| October 31, 2019 | Year Ended | Year Ended | March 15, 2017* | |||||||||||||||||
| (Unaudited) | April 30, 2019 | April 30, 2018 | to April 30, 2017 | |||||||||||||||||
Per Share Operating Performance | ||||||||||||||||||||
Net asset value, beginning of period | $ | 14.29 | $ | 13.21 | $ | 11.56 | $ | 10.91 | ||||||||||||
|
|
|
|
|
|
|
| |||||||||||||
Net investment income/(loss)(1) | — | (2) | — | (2) | 0.03 | 0.04 | ||||||||||||||
Net realized and unrealized gain on investments | 0.28 | 1.09 | 1.69 | 0.61 | ||||||||||||||||
|
|
|
|
|
|
|
| |||||||||||||
Net increase in net assets resulting from operations | 0.28 | 1.09 | 1.72 | 0.65 | ||||||||||||||||
|
|
|
|
|
|
|
| |||||||||||||
Dividends and distributions to shareholders from: | ||||||||||||||||||||
Net investment income | — | — | (0.05 | ) | — | |||||||||||||||
Net realized capital gains | — | (0.01 | ) | (0.02 | ) | — | ||||||||||||||
|
|
|
|
|
|
|
| |||||||||||||
Total dividends and distributions to shareholders | — | (0.01 | ) | (0.07 | ) | — | ||||||||||||||
|
|
|
|
|
|
|
| |||||||||||||
Redemption fees | — | (2) | — | (2) | — | — | ||||||||||||||
|
|
|
|
|
|
|
| |||||||||||||
Net asset value, end of period | $ | 14.57 | $ | 14.29 | $ | 13.21 | $ | 11.56 | ||||||||||||
|
|
|
|
|
|
|
| |||||||||||||
Total investment return(3) | 1.96 | % | 8.25 | % | 14.91 | % | 5.96 | % | ||||||||||||
Ratios/Supplemental Data | ||||||||||||||||||||
Net assets, end of period (in thousands) | $ | 1,823 | $ | 1,321 | $ | 247 | $ | 14 | ||||||||||||
Ratio of expenses to average net assets | 1.35 | %(4) | 1.35 | % | 1.35 | % | 1.35 | %(4) | ||||||||||||
Ratio of expenses to average net assets without waivers and expense reimbursements(5) | 1.40 | %(4) | 1.64 | % | 3.50 | % | 9.47 | %(4) | ||||||||||||
Ratio of net investment income/(loss) to average net assets | (0.01 | )%(4) | (0.03 | )% | 0.23 | % | 2.63 | %(4) | ||||||||||||
Portfolio turnover rate | 4 | %(6) | 12 | % | 6 | % | — | |||||||||||||
| * | Commencement of operations. |
| (1) | The selected per share data was calculated using the average shares outstanding method for the period. |
| (2) | Amount is less than $0.005 per share. |
| (3) | Total investment return is calculated assuming a purchase of shares on the first day and a sale of shares on the last day of each period reported and includes reinvestments of dividends and distributions, if any. Total returns for periods less than one year are not annualized. |
| (4) | Annualized. |
| (5) | During the period, certain fees were waived and/or reimbursed. If such fee waivers and/or reimbursements had not occurred, the ratios would have been as indicated (See Note 2). |
| (6) | Not annualized. |
The accompanying notes are an integral part of the financial statements.
40
POLEN U.S. SMALL COMPANY GROWTH FUND
Financial Highlights
Contained below is per share operating performance data for Institutional Class shares outstanding, total investment return, ratios to average net assets and other supplemental data for the respective period. The total returns in the table represent the rate that an investor would have earned or lost on an investment in the Fund (assuming reinvestment of all dividends and distributions). This information has been derived from information provided in the financial statements and should be read in conjunction with the financial statements and the notes thereto. | |||||||||||||||
| Institutional Class | |||||||||||||||
| For the Six Months Ended October 31, 2019 (Unaudited) | For the Year Ended April 30, 2019 | For the Period November 01, 2017* to April 30, 2018 | |||||||||||||
Per Share Operating Performance | |||||||||||||||
Net asset value, beginning of period | $ | 12.43 | $ | 10.21 | $ | 10.00 | |||||||||
|
|
|
|
|
| ||||||||||
Net investment loss(1) | (0.06 | ) | (0.10 | ) | (0.05 | ) | |||||||||
Net realized and unrealized gain/(loss) on investments | (0.44 | ) | 2.34 | 0.26 | |||||||||||
|
|
|
|
|
| ||||||||||
Net increase/(decrease) in net assets resulting from operations | (0.50 | ) | 2.24 | 0.21 | |||||||||||
|
|
|
|
|
| ||||||||||
Dividends and distributions to shareholders from: | |||||||||||||||
Net realized capital gains | — | (0.02 | ) | — | |||||||||||
|
|
|
|
|
| ||||||||||
Redemption fees | — | (2) | — | (2) | — | ||||||||||
|
|
|
|
|
| ||||||||||
Net asset value, end of period | $ | 11.93 | $ | 12.43 | $ | 10.21 | |||||||||
|
|
|
|
|
| ||||||||||
Total investment return(3) | (4.02 | )% | 21.94 | % | 2.10 | % | |||||||||
Ratios/Supplemental Data | |||||||||||||||
Net assets, end of period (in thousands) | $ | 10,216 | $ | 7,940 | $ | 3,334 | |||||||||
Ratio of expenses to average net assets | | 1.25 | %(4) | 1.25 | % | | 1.25 | %(4) | |||||||
Ratio of expenses to average net assets without waivers and expense reimbursements(5) | | 2.65 | %(4) | 3.38 | % | | 7.51 | %(4) | |||||||
Ratio of net investment loss to average net assets | | (0.92 | )%(4) | (0.87 | )% | | (0.95 | )%(4) | |||||||
Portfolio turnover rate | 18 | %(6) | 35 | % | 8 | %(6) | |||||||||
| * | Commencement of operations. |
| (1) | The selected per share data was calculated using the average shares outstanding method for the period. |
| (2) | Amount is less than $0.005 per share. |
| (3) | Total investment return is calculated assuming a purchase of shares on the first day and a sale of shares on the last day of each period reported and includes reinvestments of dividends and distributions, if any. Total returns for periods less than one year are not annualized. |
| (4) | Annualized. |
| (5) | During the period, certain fees were waived and/or reimbursed. If such fee waivers and/or reimbursements had not occurred, the ratios would have been as indicated (See Note 2). |
| (6) | Not annualized. |
The accompanying notes are an integral part of the financial statements.
41
POLEN U.S. SMALL COMPANY GROWTH FUND
Financial Highlights
Contained below is per share operating performance data for Investor Class shares outstanding, total investment return, ratios to average net assets and other supplemental data for the respective period. The total returns in the table represent the rate that an investor would have earned or lost on an investment in the Fund (assuming reinvestment of all dividends and distributions). This information has been derived from information provided in the financial statements and should be read in conjunction with the financial statements and the notes thereto. | ||||
| Investor Class | ||||||||||
| For the Six Months Ended October 31, 2019 (Unaudited) | For the Period February 8, 2019* to April 30, 2019 | |||||||||
Per Share Operating Performance | ||||||||||
Net asset value, beginning of period | $ | 12.42 | $ | 11.54 | ||||||
|
|
|
| |||||||
Net investment loss(1) | (0.07 | ) | (0.03 | ) | ||||||
Net realized and unrealized gain/(loss) on investments | (0.44 | ) | 0.91 | |||||||
|
|
|
| |||||||
Net increase/(decrease) in net assets resulting from operations | (0.51 | ) | 0.88 | |||||||
|
|
|
| |||||||
Redemption fees | — | (2) | — | |||||||
|
|
|
| |||||||
Net asset value, end of period | $ | 11.91 | $ | 12.42 | ||||||
|
|
|
| |||||||
Total investment return(3) | (4.11 | )% | 7.63 | % | ||||||
Ratios/Supplemental Data | ||||||||||
Net assets, end of period (in thousands) | $ | 210 | $ | 13 | ||||||
Ratio of expenses to average net assets | 1.50 | %(4) | 1.50 | %(4) | ||||||
Ratio of expenses to average net assets without waivers and expense reimbursements(5) | 2.96 | %(4) | 2.98 | %(4) | ||||||
Ratio of net investment loss to average net assets | (1.19 | )%(4) | (1.12 | )%(4) | ||||||
Portfolio turnover rate | 18 | %(6) | 35 | %(7) | ||||||
| * | Commencement of operations. |
| (1) | The selected per share data was calculated using the average shares outstanding method for the period. |
| (2) | Amount is less than $0.005 per share. |
| (3) | Total investment return is calculated assuming a purchase of shares on the first day and a sale of shares on the last day of each period reported and includes reinvestments of dividends and distributions, if any. Total returns for periods less than one year are not annualized. |
| (4) | Annualized. |
| (5) | During the period, certain fees were waived and/or reimbursed. If such fee waivers and/or reimbursements had not occurred, the ratios would have been as indicated (See Note 2). |
| (6) | Not annualized. |
| (7) | Reflects portfolio turnover of the Fund for the year ended April 30, 2019. |
The accompanying notes are an integral part of the financial statements.
42
POLEN INTERNATIONAL SMALL COMPANY GROWTH FUND
Financial Highlights
Contained below is per share operating performance data for Institutional Class shares outstanding, total investment return, ratios to average net assets and other supplemental data for the respective period. The total returns in the table represent the rate that an investor would have earned or lost on an investment in the Fund (assuming reinvestment of all dividends and distributions). This information has been derived from information provided in the financial statements and should be read in conjunction with the financial statements and the notes thereto. |
| Institutional Class | |||||||||||||||
For the Six Months Ended | For the Period December 31, 2018* to April 30, 2019 | ||||||||||||||
Per Share Operating Performance | |||||||||||||||
Net asset value, beginning of period | $ | 11.93 | $ | 10.00 | |||||||||||
|
|
|
| ||||||||||||
Net investment income(1) | 0.01 | — | (2) | ||||||||||||
Net realized and unrealized gain on investments | 0.69 | 1.93 | |||||||||||||
|
|
|
| ||||||||||||
Net increase in net assets resulting from operations | 0.70 | 1.93 | |||||||||||||
|
|
|
| ||||||||||||
Redemption fees | — | (2) | — | ||||||||||||
|
|
|
| ||||||||||||
Net asset value, end of period | $ | 12.63 | $ | 11.93 | |||||||||||
|
|
|
| ||||||||||||
Total investment return(3) | 5.87 | % | 19.30 | % | |||||||||||
Ratios/Supplemental Data | |||||||||||||||
Net assets, end of period (in thousands) | $ | 6,041 | $ | 3,357 | |||||||||||
Ratio of expenses to average net assets | 1.25 | %(4) | 1.25 | %(4) | |||||||||||
Ratio of expenses to average net assets without waivers and expense reimbursements(5) | 4.08 | %(4) | 7.51 | %(4) | |||||||||||
Ratio of net investment income to average net assets | 0.10 | %(4) | 0.01 | %(4) | |||||||||||
Portfolio turnover rate | 10 | %(6) | 9 | %(6) | |||||||||||
| * | Commencement of operations. |
| (1) | The selected per share data was calculated using the average shares outstanding method for the period. |
| (2) | Amount is less than $0.005 per share. |
| (3) | Total investment return is calculated assuming a purchase of shares on the first day and a sale of shares on the last day of each period reported and includes reinvestments of dividends and distributions, if any. Total returns for periods less than one year are not annualized. |
| (4) | Annualized. |
| (5) | During the period, certain fees were waived and/or reimbursed. If such fee waivers and/or reimbursements had not occurred, the ratios would have been as indicated (See Note 2). |
| (6) | Not annualized. |
The accompanying notes are an integral part of the financial statements.
43
POLEN INTERNATIONAL SMALL COMPANY GROWTH FUND
Financial Highlights
Contained below is per share operating performance data for Investor Class shares outstanding, total investment return, ratios to average net assets and other supplemental data for the respective period. The total returns in the table represent the rate that an investor would have earned or lost on an investment in the Fund (assuming reinvestment of all dividends and distributions). This information has been derived from information provided in the financial statements and should be read in conjunction with the financial statements and the notes thereto. |
| Investor Class | ||||||||||||||||||||
For the Six Months Ended | For the Period February 8, 2019* to April 30, 2019 | |||||||||||||||||||
Per Share Operating Performance | ||||||||||||||||||||
Net asset value, beginning of period | $ | 11.92 | $ | 10.81 | ||||||||||||||||
|
|
|
| |||||||||||||||||
Net investment income/(loss)(1) | (0.01 | ) | 0.01 | |||||||||||||||||
Net realized and unrealized gain on investments | 0.69 | 1.10 | ||||||||||||||||||
|
|
|
| |||||||||||||||||
Net increase in net assets resulting from operations | 0.68 | 1.11 | ||||||||||||||||||
|
|
|
| |||||||||||||||||
Redemption fees | — | (2) | — | |||||||||||||||||
|
|
|
| |||||||||||||||||
Net asset value, end of period | $ | 12.60 | $ | 11.92 | ||||||||||||||||
|
|
|
| |||||||||||||||||
Total investment return(3) | 5.71 | % | 10.27 | % | ||||||||||||||||
Ratios/Supplemental Data | ||||||||||||||||||||
Net assets, end of period (in thousands) | $ | 75 | $ | 37 | ||||||||||||||||
Ratio of expenses to average net assets | 1.50 | %(4) | 1.50 | %(4) | ||||||||||||||||
Ratio of expenses to average net assets without waivers and expense reimbursements(5) | 4.41 | %(4) | 7.17 | %(4) | ||||||||||||||||
Ratio of net investment income/(loss) to average net assets | (0.15 | )%(4) | 0.36 | %(4) | ||||||||||||||||
Portfolio turnover rate | 10 | %(6) | 9 | %(6)(7) | ||||||||||||||||
| * | Commencement of operations. |
| (1) | The selected per share data was calculated using the average shares outstanding method for the period. |
| (2) | Amount is less than $0.005 per share. |
| (3) | Total investment return is calculated assuming a purchase of shares on the first day and a sale of shares on the last day of each period reported and includes reinvestments of dividends and distributions, if any. Total returns for periods less than one year are not annualized. |
| (4) | Annualized. |
| (5) | During the period, certain fees were waived and/or reimbursed. If such fee waivers and/or reimbursements had not occurred, the ratios would have been as indicated (See Note 2). |
| (6) | Not annualized. |
| (7) | Reflects portfolio turnover of the Fund for the period December 31, 2018 to April 30, 2019. |
The accompanying notes are an integral part of the financial statements.
44
POLEN GROWTH FUNDS
Notes to Financial Statements
October 31, 2019
(Unaudited)
1. Organization and Significant Accounting Policies
The Polen Growth Fund, Polen Global Growth Fund, Polen International Growth Fund, Polen U.S. Small Company Growth Fund and Polen International Small Company Growth Fund (each a “Fund” and together the “Funds”) arenon-diversified,open-end management investment companies registered under the Investment Company Act of 1940, as amended, (the “1940 Act”), which commenced investment operations on September 15, 2010, December 30, 2014, December 30, 2016, November 1, 2017 and December 31, 2018, respectively. The Funds are separate series of FundVantage Trust (the “Trust”) which was organized as a Delaware statutory trust on August 28, 2006. The Trust is a “series trust” authorized to issue an unlimited number of separate series or classes of shares of beneficial interest. Each series is treated as a separate entity for certain matters under the 1940 Act, and for other purposes, and a shareholder of one series is not deemed to be a shareholder of any other series. The Funds offer two separate classes of shares, Investor Class (prior to September 1, 2015, Investor Class shares were called “Retail Class” shares) and Institutional Class.
The Funds are investment companies and follow accounting and reporting guidance in the Financial Accounting Standards Board Accounting Standards Codification Topic 946.
Portfolio Valuation— The Funds’ net asset value (“NAV”) is calculated once daily at the close of regular trading hours on the New York Stock Exchange (“NYSE”) (typically 4:00 p.m. Eastern time) on each day the NYSE is open. Securities held by the Funds are valued using the closing price or the last sale price on a national securities exchange or the National Association of Securities Dealers Automatic Quotation System (“NASDAQ”) market system where they are primarily traded. Equity securities traded in theover-the-counter market are valued at their closing prices. If there were no transactions on that day, securities traded principally on an exchange or on NASDAQ will be valued at the mean of the last bid and ask prices prior to the market close. Fixed income securities having a remaining maturity of greater than 60 days are valued using an independent pricing service. Fixed income securities having a remaining maturity of 60 days or less are generally valued at amortized cost, provided such amount approximates fair value. Investments in otheropen-end investment companies are valued based on the NAV of the investment companies (which may use fair value pricing as discussed in their prospectuses). If market quotations are unavailable or deemed unreliable, securities will be valued in accordance with procedures adopted by the Trust’s Board of Trustees (“Board of Trustees”). Relying on prices supplied by pricing services or dealers or using fair valuation may result in values that are higher or lower than the values used by other investment companies and investors to price the same investments. In the event that market quotes are not readily available, and the security or asset cannot be valued pursuant to one of the valuation methods, the value of the security or asset will be determined in good faith by the Adviser. The Trust has established a Valuation Committee which performs certain functions including the oversight of the Adviser’s fair valuation determinations.
45
POLEN GROWTH FUNDS
Notes to Financial Statements (Continued)
October 31, 2019
(Unaudited)
Fair Value Measurements —The inputs and valuation techniques used to measure fair value of the Funds’ investments are summarized into three levels as described in the hierarchy below:
| · | Level 1 — quoted prices in active markets for identical securities; |
| · | Level 2 — other significant observable inputs (including quoted prices for similar securities, interest rates, prepayment speeds, credit risk, etc.); and |
| · | Level 3 — significant unobservable inputs (including the Funds’ own assumptions in determining the fair value of investments). |
The inputs or methodology used for valuing securities are not necessarily an indication of the risk associated with investing in those securities.
Significant events (such as movement in the U.S. securities market, or other regional and local developments) may occur between the time that foreign markets close (where the security is principally traded) and the time that each Fund calculates its NAV (generally, the close of the NYSE) that may impact the value of securities traded in these foreign markets. As a result, each Fund fair values foreign securities using an independent pricing service which considers the correlation of the trading patterns of the foreign security to the intraday trading in the U.S. markets for investments such as American Depositary Receipts, financial futures, exchange traded funds and certain indexes as well as prices for similar securities. Such fair valuations are categorized as Level 2 in the hierarchy.
Securities listed on anon-U.S. exchange are generally fair valued daily by an independent fair value pricing service approved by the Board of Trustees and categorized as Level 2 investments within the hierarchy. The fair valuations for these securities may not be the same as quoted or published prices of the securities on their primary markets. Securities for which daily fair value prices from the independent fair value pricing service are not available are generally valued at the last quoted sale price at the close of an exchange on which the security is traded and categorized as Level 1 investments within the hierarchy. Values of foreign securities, currencies, and other assets and liabilities denominated in foreign currencies are translated into U.S. dollars at the exchange rate of said currencies against the U.S. dollar, as of valuation time, as provided by an independent pricing service approved by the Board of Trustees.
46
POLEN GROWTH FUNDS
Notes to Financial Statements (Continued)
October 31, 2019
(Unaudited)
The following is a summary of the inputs used, as of October 31, 2019, in valuing the Funds’ investments carried at fair value:
| Level 2 | ||||||||||||||||
| Other | Level 3 | |||||||||||||||
| Total Value | Level 1 | Significant | Significant | |||||||||||||
| at | Quoted | Observable | Unobservable | |||||||||||||
Funds | 10/31/19 | Price | Inputs | Inputs | ||||||||||||
Polen Growth Fund | ||||||||||||||||
Investments in Securities* | $ | 4,327,853,094 | $ | 4,327,853,094 | $ | — | $ | — | ||||||||
|
|
|
|
|
|
|
| |||||||||
Polen Global Growth Fund | ||||||||||||||||
Australia | $ | 3,741,757 | $ | — | $ | 3,741,757 | $ | — | ||||||||
China | 8,534,249 | 4,765,143 | 3,769,106 | — | ||||||||||||
Denmark | 2,948,112 | 1,007,931 | 1,940,181 | — | ||||||||||||
France | 2,058,930 | — | 2,058,930 | — | ||||||||||||
Germany | 10,788,586 | 6,494,744 | 4,293,842 | — | ||||||||||||
Ireland | 3,568,593 | 3,568,593 | — | — | ||||||||||||
Spain | 1,537,474 | — | 1,537,474 | — | ||||||||||||
Switzerland | 4,011,907 | — | 4,011,907 | — | ||||||||||||
United Kingdom | 1,501,749 | — | 1,501,749 | — | ||||||||||||
United States | 52,767,065 | 52,767,065 | — | — | ||||||||||||
|
|
|
|
|
|
|
| |||||||||
Total | $ | 91,458,422 | $ | 68,603,476 | $ | 22,854,946 | $ | — | ||||||||
|
|
|
|
|
|
|
| |||||||||
Polen International Growth Fund |
| |||||||||||||||
Australia | $ | 5,045,914 | $ | — | $ | 5,045,914 | $ | — | ||||||||
China | 12,710,667 | 6,802,678 | 5,907,989 | — | ||||||||||||
Denmark | 2,095,130 | — | 2,095,130 | — | ||||||||||||
France | 5,514,660 | — | 5,514,660 | — | ||||||||||||
Germany | 15,657,980 | 9,173,757 | 6,484,223 | — | ||||||||||||
Ireland | 22,360,085 | 17,891,107 | 4,468,978 | — | ||||||||||||
Israel | 2,750,448 | 2,750,448 | — | — | ||||||||||||
Mexico | 2,301,091 | 2,301,091 | — | — | ||||||||||||
Netherlands | 3,933,285 | — | 3,933,285 | — | ||||||||||||
Spain | 6,171,645 | — | 6,171,645 | — | ||||||||||||
Switzerland | 3,936,165 | — | 3,936,165 | — | ||||||||||||
United Kingdom | 19,811,071 | — | 19,811,071 | — | ||||||||||||
|
|
|
|
|
|
|
| |||||||||
Total | $ | 102,288,141 | $ | 38,919,081 | $ | 63,369,060 | $ | — | ||||||||
|
|
|
|
|
|
|
| |||||||||
47
POLEN GROWTH FUNDS
Notes to Financial Statements (Continued)
October 31, 2019
(Unaudited)
| Level 2 | ||||||||||||||||
| Other | Level 3 | |||||||||||||||
| Total Value | Level 1 | Significant | Significant | |||||||||||||
| at | Quoted | Observable | Unobservable | |||||||||||||
Funds | 10/31/19 | Price | Inputs | Inputs | ||||||||||||
Polen U.S. Small Company Growth Fund | ||||||||||||||||
Investments in Securities* | $ | 9,662,124 | $ | 9,662,124 | $ | — | $ | — | ||||||||
|
|
|
|
|
|
|
| |||||||||
Polen International Small Company Growth Fund | ||||||||||||||||
Argentina | $ | 63,446 | $ | 63,446 | $ | — | $ | — | ||||||||
Australia | 495,615 | — | 495,615 | — | ||||||||||||
Brazil | 107,477 | 107,477 | — | — | ||||||||||||
Canada | 979,096 | 979,096 | — | — | ||||||||||||
Denmark | 333,310 | — | 333,310 | — | ||||||||||||
Germany | 950,388 | 326,813 | 623,575 | — | ||||||||||||
Israel | 153,214 | 153,214 | — | — | ||||||||||||
Italy | 165,652 | — | 165,652 | — | ||||||||||||
Japan | 744,133 | — | 744,133 | — | ||||||||||||
Luxembourg | 274,184 | 274,184 | — | — | ||||||||||||
Norway | 97,140 | — | 97,140 | — | ||||||||||||
South Korea | 243,982 | — | 243,982 | — | ||||||||||||
Sweden | 212,498 | — | 212,498 | — | ||||||||||||
Switzerland | 201,566 | — | 201,566 | — | ||||||||||||
United Kingdom | 905,517 | 584,926 | 320,591 | — | ||||||||||||
|
|
|
|
|
|
|
| |||||||||
Total | $ | 5,927,218 | $ | 2,489,156 | $ | 3,438,062 | $ | — | ||||||||
|
|
|
|
|
|
|
| |||||||||
| * | Please refer to Portfolio of Investments for details on portfolio holdings. |
At the end of each quarter, management evaluates the classification of Levels 1, 2 and 3 assets and liabilities. Various factors are considered, such as changes in liquidity from the prior reporting period; whether or not a broker is willing to execute at the quoted price; the depth and consistency of prices from third party pricing services; and the existence of contemporaneous, observable trades in the market. Additionally, management evaluates the classification of Level 1 and Level 2 assets and liabilities on a quarterly basis for changes in listings or delistings on national exchanges.
Due to the inherent uncertainty of determining the fair value of investments that do not have a readily available market value, the fair value of the Funds’ investments may fluctuate from period to period.
48
POLEN GROWTH FUNDS
Notes to Financial Statements (Continued)
October 31, 2019
(Unaudited)
Additionally, the fair value of investments may differ significantly from the values that would have been used had a ready market existed for such investments and may differ materially from the values the Funds may ultimately realize. Further, such investments may be subject to legal and other restrictions on resale or otherwise less liquid than publicly traded securities.
For fair valuations using significant unobservable inputs, U.S. generally accepted accounting principles (“U.S. GAAP”) require the Funds to present a reconciliation of the beginning to ending balances for reported market values that present changes attributable to total realized and unrealized gains or losses, purchase and sales, and transfers in and out of Level 3 during the period. A reconciliation of Level 3 investments is presented only when the Funds had an amount of Level 3 investments at the end of the reporting period that was meaningful in relation to their net assets. The amounts and reasons for all transfers in and out of Level 3 are disclosed when the Funds had an amount of transfers during the reporting period that was meaningful in relation to their net assets as of the end of the reporting period.
For the six months ended October 31, 2019, there were no transfers in or out of Level 3.
Use of Estimates— The preparation of financial statements in conformity with U.S. GAAP requires management to make estimates and assumptions that affect the amounts reported in the financial statements and accompanying notes at the date of the financial statements and the reported amounts of revenues and expenses during the period. Actual results could differ from those estimates and those differences could be material.
Investment Transactions, Investment Income and Expenses— Investment transactions are recorded on trade date for financial statement preparation purposes. Realized gains and losses on investments sold are recorded on the identified cost basis. Interest income is recorded on the accrual basis. Dividends are recorded on theex-dividend date. Distribution(12b-1) fees relating to a specific class are charged directly to that class. Fund level expenses common to all classes, investment income and realized and unrealized gains and losses on investments are generally allocated to each class of each Fund based upon the relative daily net assets of each class of each Fund. General expenses of the Trust are generally allocated to each Fund in proportion to its relative daily net assets. Expenses directly attributable to a particular Fund in the Trust are charged directly to that Fund. The Funds’ investment income, expenses (other than class-specific expenses) and unrealized and realized gains and losses are allocated daily to each class of shares based upon the relative proportion of net assets of each class at the beginning of the day.
Foreign Currency Translation— Assets and liabilities initially expressed innon-U.S. currencies are translated into U.S. dollars based on the applicable exchange rates at the date of the last business day of the financial statement period. Purchases and sales of securities, interest income, dividends, variation margin received and expenses denominated in foreign currencies are translated into U.S. dollars at the exchange rates in effect on the transaction date. The Funds do not separately report the effect of
49
POLEN GROWTH FUNDS
Notes to Financial Statements (Continued)
October 31, 2019
(Unaudited)
changes in foreign exchange rates from changes in market prices of securities held. Such changes are included with the net realized gain or loss and change in unrealized appreciation or depreciation on investment securities in the Statement of Operations. Other foreign currency transactions resulting in realized and unrealized gain or loss are reported separately as net realized gain or loss and change in unrealized appreciation or depreciation on foreign currencies in the Statement of Operations.
Dividends and Distributions to Shareholders— Dividends from net investment income and distributions from net realized capital gains, if any, are declared and paid at least annually to shareholders and are recorded onex-date. Income dividends and capital gain distributions are determined in accordance with U.S. federal income tax regulations, which may differ from U.S. GAAP.
U.S. Tax Status— No provision is made for U.S. income taxes as it is the Funds’ intention to continue to qualify for and elect the tax treatment applicable to regulated investment companies under Subchapter M of the Internal Revenue Code of 1986, as amended (“Internal Revenue Code”), and make the requisite distributions to its shareholders which will be sufficient to relieve it from U.S. income and excise taxes.
Other— In the normal course of business, the Funds may enter into contracts that provide general indemnifications. The Funds’ maximum exposure under these arrangements is dependent on claims that may be made against the Funds in the future, and therefore, cannot be estimated; however, based on experience, the risk of material loss for such claims is considered remote.
Currency Risk— The Funds invest in securities of foreign issuers, including American Depositary Receipts. These markets are subject to special risks associated with foreign investments not typically associated with investing in U.S. markets. Because the foreign securities in which the Funds may invest generally trade in currencies other than the U.S. dollar, changes in currency exchange rates will affect the Funds’ NAV, the value of dividends and interest earned and gains and losses realized on the sale of securities. Because the NAV for the Funds is determined on the basis of U.S. dollars, the Funds may lose money by investing in a foreign security if the local currency of a foreign market depreciates against the U.S. dollar, even if the local currency value of the Funds’ holdings goes up. Generally, a strong U.S. dollar relative to these other currencies will adversely affect the value of the Funds’ holdings in foreign securities.
Foreign Securities Market Risk— Securities of manynon-U.S. companies may be less liquid and their prices more volatile than securities of comparable U.S. companies. Securities of companies traded in many countries outside the U.S., particularly emerging markets countries, may be subject to further risks due to the inexperience of local investment professionals and financial institutions, the possibility of permanent or temporary termination of trading and greater spreads between bid and asked prices of securities. In addition,non-U.S. stock exchanges and investment professionals are subject to less governmental regulation, and commissions may be higher than in the United States. Also, there may be delays in the settlement ofnon-U.S. stock exchange transactions.
50
POLEN GROWTH FUNDS
Notes to Financial Statements (Continued)
October 31, 2019
(Unaudited)
Recent Regulatory Reporting Update and Accounting Pronouncement— In August 2018, the Financial Accounting Standards Board issued an Accounting Standards Update, ASU2018-13,Fair Value Measurement (Topic 820), Disclosure Framework – Changes to the Disclosure Requirements for Fair Value Measurement(the “2018 ASU”) which adds, modifies and removes disclosure requirements related to certain aspects of fair value measurement. The 2018 ASU is effective for fiscal years, and interim periods within those fiscal years, beginning after December 15, 2019. Early adoption is permitted. As of October 31, 2019, the Funds have fully adopted the provisions of the 2018 ASU, which did not have a material impact on the Funds’ financial statements and related disclosures or impact the Funds’ net assets or results of operations.
2. Transactions with Related Parties and Other Service Providers
Polen Capital Management, LLC (“PCM” or the “Adviser”) serves as investment adviser to the Funds pursuant to an investment advisory agreement with the Trust. For its services, the Adviser is paid a monthly fee at the annual rate of 0.85% of the average daily net assets of the Polen Growth Fund, Polen Global Growth Fund and Polen International Growth Fund, and 1.00% of average daily net assets of the Polen U.S. Small Company Growth Fund and Polen International Small Company Growth Fund. The Adviser has contractually agreed to reduce its investment advisory fee and/or reimburse certain expenses of the Funds to the extent necessary to ensure that the Funds’ total operating expenses (excluding taxes, fees and expenses attributable to a distribution or service plan adopted by the Trust, interest, extraordinary items, “Acquired Fund Fees and Expenses” and brokerage commissions) do not exceed (on an annual basis) 1.00% of the Polen Growth Fund’s, 1.10% of the Polen Global Growth Fund’s and Polen International Growth Fund’s and 1.25% of the Polen U.S. Small Company Growth Fund’s and Polen International Small Company Growth Fund’s, average daily net assets (the “Expense Limitations”). The Expense Limitations will remain in place until August 31, 2020 with respect to each Fund, unless the Board of Trustees approves its earlier termination. The Adviser is entitled to recover, subject to approval by the Board of Trustees, such amounts reduced or reimbursed for a period of up to three (3) years from the date on which the Adviser reduced its compensation and/or assumed expenses for such Fund. The Adviser is permitted to seek reimbursement from a Fund, subject to certain limitations, for fees it waived and Fund expenses it paid to the extent the total annual fund expenses do not exceed the limits described above or any lesser limits in effect at the time of reimbursement. For the Polen Growth Fund, the Adviser is entitled to recoup only the advisory fees waived or expenses reimbursed on or after January 1, 2017. No recoupment will occur unless the Fund’s expenses are below the Expense Limitation amount.
For the six months ended October 31, 2019, the Adviser earned advisory fees of $17,282,894, $368,412, $389,796, $45,001 and $23,259 for the Polen Growth Fund, Polen Global Growth Fund, Polen International Growth Fund, Polen U.S. Small Company Growth Fund and Polen International Small Company Growth Fund, respectively. For the six months ended October 31, 2019, the Adviser recouped fees of $52,409 waived in prior periods for the Polen Growth Fund, and waived fees and reimbursed expenses of $27,877,
51
POLEN GROWTH FUNDS
Notes to Financial Statements (Continued)
October 31, 2019
(Unaudited)
$23,982, $63,129 and $65,973 for the Polen Global Growth Fund, Polen International Growth Fund, Polen U.S. Small Company Growth Fund and Polen International Small Company Growth Fund, respectively.
As of October 31, 2019, the amount of potential recovery was as follows:
| Expiration | |||||||||||||||||||||||||||
| 04/30/2020 | 04/30/2021 | 04/30/2022 | 10/31/2022 | Total | |||||||||||||||||||||||
| |||||||||||||||||||||||||||
Polen Global Growth Fund | $ | 67,591 | $ | 97,239 | $ | 114,262 | $ | 27,877 | $ | 306,969 | |||||||||||||||||
Polen International Growth Fund | $ | 53,471 | $ | 130,305 | $ | 116,513 | $ | 23,982 | $ | 324,271 | |||||||||||||||||
Polen U.S. Small Company Growth Fund | $ | — | $ | 65,823 | $ | 112,930 | $ | 63,129 | $ | 241,882 | |||||||||||||||||
Polen International Small Company Growth Fund | $ | — | $ | — | $ | 52,240 | $ | 65,973 | $ | 118,213 | |||||||||||||||||
Other Service Providers
The Bank of New York Mellon (“BNY Mellon”) serves as administrator and custodian for the Funds. For providing administrative and accounting services, BNY Mellon is entitled to receive a monthly fee equal to an annual percentage rate of the Funds’ average daily net assets and is subject to certain minimum monthly fees. For providing certain custodial services, BNY Mellon is entitled to receive a monthly fee, subject to certain minimum, and out of pocket expenses.
BNY Mellon Investment Servicing (US) Inc. (the “Transfer Agent”) provides transfer agent services to the Funds. The Transfer Agent is entitled to receive a monthly fee, subject to certain minimum, and out of pocket expenses.
The Trust, on behalf of the Funds, has entered into agreements with financial intermediaries to provide recordkeeping, processing, shareholder communications and other services to customers of the intermediaries investing in the Funds and has agreed to compensate the intermediaries for providing those services. The fees incurred by the Funds for these services are included in Transfer agent fees in the Statements of Operations.
Foreside Funds Distributors LLC (the “Underwriter”) provides principal underwriting services to the Funds.
The Trust and the Underwriter are parties to an underwriting agreement. The Trust has adopted a distribution plan for the Investor Shares of the Funds in accordance with Rule12b-1 under the 1940 Act. Pursuant to the Investor Shares plan, the Funds compensate the Underwriter for direct and indirect costs and expenses incurred in connection with advertising, marketing and other distribution services in an amount not to exceed 0.25% on an annualized basis of the average daily net assets of the Funds’ Investor Shares.
52
POLEN GROWTH FUNDS
Notes to Financial Statements (Continued)
October 31, 2019
(Unaudited)
Trustees and Officers
The Trust is governed by its Board of Trustees. The Trustees receive compensation in the form of an annual retainer and per meeting fees for their services to the Trust. The remuneration paid to the Trustees by the Funds during the six months ended October 31, 2019 was $91,482, $1,907, $1,936, $209 and $77 for the Polen Growth Fund, Polen Global Growth Fund, Polen International Growth Fund, Polen U.S. Small Company Growth Fund and Polen International Small Company Growth Fund, respectively. An employee of BNY Mellon serves as the Secretary of the Trust and is not compensated by the Funds or the Trust.
JW Fund Management LLC (“JWFM”) provides a Principal Executive Officer and Principal Financial Officer to the Trust. Duff & Phelps, LLC (“D&P”) provides the Trust with a Chief Compliance Officer and an Anti-Money Laundering Officer. JWFM and D&P are compensated for their services provided to the Trust.
3. Investment in Securities
For the six months ended October 31, 2019, aggregate purchases and sales of investment securities (excluding short-term investments) of the Funds were as follows:
| Purchases | Sales | |||||||
Polen Growth Fund | $ | 827,451,212 | $ | 209,548,731 | ||||
Polen Global Growth Fund | $ | 19,579,530 | $ | 7,994,398 | ||||
Polen International Growth Fund | $ | 37,093,570 | $ | 3,131,176 | ||||
Polen U.S. Small Company Growth Fund | $ | 3,942,494 | $ | 1,496,588 | ||||
Polen International Small Company Growth Fund | $ | 2,813,643 | $ | 435,682 | ||||
53
POLEN GROWTH FUNDS
Notes to Financial Statements (Continued)
October 31, 2019
(Unaudited)
4. Capital Share Transactions
For the six months ended October 31, 2019 and the year or period ended April 30, 2019, transactions in capital shares (authorized shares unlimited) were as follows:
| Polen Growth Fund | ||||||||||||||||
| Six Months Ended | ||||||||||||||||
| October 31, 2019 | For the Year Ended | |||||||||||||||
| (Unaudited) | April 30, 2019 | |||||||||||||||
| Shares | Amount | Shares | Amount | |||||||||||||
Institutional Class | ||||||||||||||||
Sales | 27,380,433 | $ | 860,128,758 | 51,581,595 | $ | 1,440,277,408 | ||||||||||
Reinvestments | — | — | 2,018,326 | 52,859,833 | ||||||||||||
Redemption Fees* | — | 82,266 | — | 143,243 | ||||||||||||
Redemptions | (9,007,148 | ) | (283,313,049 | ) | (17,794,917 | ) | (492,616,940 | ) | ||||||||
|
|
|
|
|
|
|
| |||||||||
Net increase | 18,373,285 | $ | 576,897,975 | 35,805,004 | $ | 1,000,663,544 | ||||||||||
|
|
|
|
|
|
|
| |||||||||
Investor Class | ||||||||||||||||
Sales | 2,435,225 | $ | 75,054,267 | 8,089,750 | $ | 226,705,821 | ||||||||||
Reinvestments | — | — | 175,372 | 4,507,051 | ||||||||||||
Redemption Fees* | — | 6,903 | — | 10,082 | ||||||||||||
Redemptions | (1,588,056 | ) | (48,817,779 | ) | (1,596,154 | ) | (43,219,377 | ) | ||||||||
|
|
|
|
|
|
|
| |||||||||
Net increase | 847,169 | $ | 26,243,391 | 6,668,968 | $ | 188,003,577 | ||||||||||
|
|
|
|
|
|
|
| |||||||||
Total net increase | 19,220,454 | $ | 603,141,366 | 42,473,972 | $ | 1,188,667,121 | ||||||||||
|
|
|
|
|
|
|
| |||||||||
| Polen Global Growth Fund | ||||||||||||||||
| Six Months Ended | ||||||||||||||||
| October 31, 2019 | For the Year Ended | |||||||||||||||
| (Unaudited) | April 30, 2019 | |||||||||||||||
| Shares | Amount | Shares | Amount | |||||||||||||
Institutional Class | ||||||||||||||||
Sales | 1,261,962 | $ | 21,988,304 | 2,544,773 | $ | 39,693,428 | ||||||||||
Reinvestments | — | — | 50,021 | 738,309 | ||||||||||||
Redemption Fees* | — | 14,869 | — | 14,659 | ||||||||||||
Redemptions | (588,497 | ) | (10,258,003 | ) | (723,038 | ) | (11,082,475 | ) | ||||||||
|
|
|
|
|
|
|
| |||||||||
Net increase | 673,465 | $ | 11,745,170 | 1,871,756 | $ | 29,363,921 | ||||||||||
|
|
|
|
|
|
|
| |||||||||
54
POLEN GROWTH FUNDS
Notes to Financial Statements (Continued)
October 31, 2019
(Unaudited)
| Polen Global Growth Fund | ||||||||||||||||
| Six Months Ended | ||||||||||||||||
| October 31, 2019 | For the Year Ended | |||||||||||||||
| (Unaudited) | April 30, 2019 | |||||||||||||||
| Shares | Amount | Shares | Amount | |||||||||||||
Investor Class | ||||||||||||||||
Sales | 259,324 | $ | 4,512,433 | 587,723 | $ | 9,053,374 | ||||||||||
Reinvestments | — | — | 9,586 | 140,154 | ||||||||||||
Redemption Fees* | — | 2,283 | — | 2,520 | ||||||||||||
Redemptions | (182,654 | ) | (3,134,808 | ) | (297,551 | ) | (4,550,139 | ) | ||||||||
|
|
|
|
|
|
|
| |||||||||
Net increase | 76,670 | $ | 1,379,908 | 299,758 | $ | 4,645,909 | ||||||||||
|
|
|
|
|
|
|
| |||||||||
Total net increase | 750,135 | $ | 13,125,078 | 2,171,514 | $ | 34,009,830 | ||||||||||
|
|
|
|
|
|
|
| |||||||||
| Polen International Growth Fund | ||||||||||||||||
| Six Months Ended | ||||||||||||||||
| October 31, 2019 | For the Year Ended | |||||||||||||||
| (Unaudited) | April 30, 2019 | |||||||||||||||
| Shares | Amount | Shares | Amount | |||||||||||||
Institutional Class | ||||||||||||||||
Sales | 2,759,933 | $ | 39,713,326 | 4,457,711 | $ | 60,314,850 | ||||||||||
Reinvestments | — | — | 3,280 | 42,343 | ||||||||||||
Redemption Fees* | — | 1,179 | — | 6,973 | ||||||||||||
Redemptions | (319,587 | ) | (4,584,777 | ) | (493,161 | ) | (6,663,372 | ) | ||||||||
|
|
|
|
|
|
|
| |||||||||
Net increase | 2,440,346 | $ | 35,129,728 | 3,967,830 | $ | 53,700,794 | ||||||||||
|
|
|
|
|
|
|
| |||||||||
Investor Class | ||||||||||||||||
Sales | 44,793 | $ | 641,638 | 103,864 | $ | 1,417,453 | ||||||||||
Reinvestments | — | — | 50 | 649 | ||||||||||||
Redemption Fees* | — | 18 | — | 136 | ||||||||||||
Redemptions | (12,107 | ) | (176,444 | ) | (30,174 | ) | (406,731 | ) | ||||||||
|
|
|
|
|
|
|
| |||||||||
Net increase | 32,686 | $ | 465,212 | 73,740 | $ | 1,011,507 | ||||||||||
|
|
|
|
|
|
|
| |||||||||
Total net increase | 2,473,032 | $ | 35,594,940 | 4,041,570 | $ | 54,712,301 | ||||||||||
|
|
|
|
|
|
|
| |||||||||
55
POLEN GROWTH FUNDS
Notes to Financial Statements (Continued)
October 31, 2019
(Unaudited)
| Polen U.S. Small Company Growth Fund | ||||||||||||||||
| Six Months Ended | ||||||||||||||||
| October 31, 2019 | For the Year Ended | |||||||||||||||
| (Unaudited) | April 30, 2019 | |||||||||||||||
| Shares | Amount | Shares | Amount | |||||||||||||
Institutional Class | ||||||||||||||||
Sales | 300,989 | $ | 3,604,472 | 370,471 | $ | 4,242,234 | ||||||||||
Reinvestments | — | — | 909 | 9,611 | ||||||||||||
Redemption Fees* | — | 2,363 | — | 431 | ||||||||||||
Redemptions | (83,947 | ) | (1,015,189 | ) | (59,010 | ) | (611,287 | ) | ||||||||
|
|
|
|
|
|
|
| |||||||||
Net increase | 217,042 | $ | 2,591,646 | 312,370 | $ | 3,640,989 | ||||||||||
|
|
|
|
|
|
|
| |||||||||
Investor Class | ||||||||||||||||
Sales | 17,610 | $ | 217,346 | 1,330 | $ | 16,165 | ||||||||||
Reinvestments | — | — | — | — | ||||||||||||
Redemption Fees* | — | 35 | — | — | ||||||||||||
Redemptions | (1,084 | ) | (13,215 | ) | (246 | ) | (2,793 | ) | ||||||||
|
|
|
|
|
|
|
| |||||||||
Net increase | 16,526 | $ | 204,166 | 1,084 | $ | 13,372 | ||||||||||
|
|
|
|
|
|
|
| |||||||||
Total net increase | 233,568 | $ | 2,795,812 | 313,454 | $ | 3,654,361 | ||||||||||
|
|
|
|
|
|
|
| |||||||||
| Polen International Small Company Growth Fund** | ||||||||||||||||
| Six Months Ended | ||||||||||||||||
| October 31, 2019 | For the Period Ended | |||||||||||||||
| (Unaudited) | April 30, 2019 | |||||||||||||||
| Shares | Amount | Shares | Amount | |||||||||||||
Institutional Class | ||||||||||||||||
Sales | 207,648 | $ | 2,529,653 | 281,454 | $ | 2,960,716 | ||||||||||
Reinvestments | — | — | — | — | ||||||||||||
Redemption Fees* | — | 423 | — | — | ||||||||||||
Redemptions | (10,668 | ) | (132,711 | ) | — | — | ||||||||||
|
|
|
|
|
|
|
| |||||||||
Net increase | 196,980 | $ | 2,397,365 | 281,454 | $ | 2,960,716 | ||||||||||
|
|
|
|
|
|
|
| |||||||||
56
POLEN GROWTH FUNDS
Notes to Financial Statements (Continued)
October 31, 2019
(Unaudited)
| Polen International Small Company Growth Fund** | ||||||||||||||||
| Six Months Ended | ||||||||||||||||
| October 31, 2019 | For the Period Ended | |||||||||||||||
| (Unaudited) | April 30, 2019 | |||||||||||||||
| Shares | Amount | Shares | Amount | |||||||||||||
Investor Class | ||||||||||||||||
Sales | 10,252 | $ | 125,221 | 3,142 | $ | 35,710 | ||||||||||
Reinvestments | — | — | — | — | ||||||||||||
Redemption Fees* | — | 5 | — | — | ||||||||||||
Redemptions | (7,416 | ) | (88,616 | ) | — | — | ||||||||||
|
|
|
|
|
|
|
| |||||||||
Net increase | 2,836 | $ | 36,610 | 3,142 | $ | 35,710 | ||||||||||
|
|
|
|
|
|
|
| |||||||||
Total net increase | 199,816 | $ | 2,433,975 | 284,596 | $ | 2,996,426 | ||||||||||
|
|
|
|
|
|
|
| |||||||||
| * | There is a 2.00% redemption fee that may be charged on shares redeemed within the first 60 days of their acquisition. The redemption fees are retained by the Funds for the benefit of the remaining shareholders and recorded aspaid-in capital. |
| ** | The Polen International Small Company Growth Fund’s Institutional Class and Investor Class commenced operations on December 31, 2018 and February 8, 2019, respectively. |
5. Federal Tax Information
The Funds have followed the authoritative guidance on accounting for and disclosure of uncertainty in tax positions, which requires the Funds to determine whether a tax position is more likely than not to be sustained upon examination, including resolution of any related appeals or litigation processes, based on the technical merits of the position. Tax positions not deemed to meet themore-likely-than-not threshold would be recorded as tax benefit or expense in the current year. The Funds have determined that there was no effect on the financial statements from following this authoritative guidance. In the normal course of business, the Funds are subject to examination by federal, state and local jurisdictions, where applicable, for tax years for which applicable statutes of limitations have not expired.
For the year ended April 30, 2019, the tax character of distributions paid by the Polen Growth Fund, Polen Global Growth Fund, Polen International Growth Fund and Polen U.S. Small Company Growth Fund were $6,667,348, $26,262, $18,339 and $9,611 of ordinary income dividends and $59,761,509, $888,096, $25,051 and $0 of long-term capital gains, respectively. There were no distributions for the Polen International Small Company Growth Fund. Distributions from net investment income and short-term capital gains are treated as ordinary income for federal income tax purposes.
57
POLEN GROWTH FUNDS
Notes to Financial Statements (Continued)
October 31, 2019
(Unaudited)
As of April 30, 2019 the components of distributable earnings on a tax basis were as follows:
| Undistributed | Undistributed | Qualified | Total | |||||||||||||||||
| Ordinary | Long-Term | Unrealized | Late Year | Distributable | ||||||||||||||||
| Income | Gain | Appreciation | Loss Deferral | Earnings | ||||||||||||||||
Polen Growth Fund | $ | — | $ | — | $ | 1,175,348,879 | $ | (31,028,044 | ) | $ | 1,144,320,835 | |||||||||
Polen Global Growth Fund | $ | 21,679 | $ | 32,042 | $ | 16,492,994 | $ | — | $ | 16,546,715 | ||||||||||
Polen International Growth Fund | $ | 14,471 | $ | — | $ | 5,031,129 | $ | (130,529 | ) | $ | 4,915,071 | |||||||||
Polen U.S. Small Company Growth Fund | $ | 63,989 | $ | — | $ | 948,148 | $ | — | $ | 1,012,137 | ||||||||||
Polen International Small Company Growth Fund | $ | — | $ | — | $ | 415,271 | $ | (17,184 | ) | $ | 398,087 | |||||||||
The differences between the book and tax basis components of distributable earnings relate primarily to the timing and recognition of income and gains for federal income tax purposes. Foreign currency and short-term capital gains are reported as ordinary income for federal income tax purposes.
As of October 31, 2019, the federal tax cost, aggregate gross unrealized appreciation and depreciation of securities held by each Fund were as follows:
| Gross | Gross | |||||||||||||||
| Federal Tax | Unrealized | Unrealized | Net Unrealized | |||||||||||||
| Cost* | Appreciation | Depreciation | Appreciation | |||||||||||||
Polen Growth Fund | $ | 2,979,162,757 | $ | 1,365,838,433 | $ | (17,148,096 | ) | $ | 1,348,690,337 | |||||||
Polen Global Growth Fund | 70,504,384 | 21,110,179 | (156,141 | ) | 20,954,038 | |||||||||||
Polen International Growth Fund | 94,026,135 | 9,412,708 | (1,150,702 | ) | 8,262,006 | |||||||||||
Polen U.S. Small Company Growth Fund | 8,494,794 | 1,334,935 | (167,605 | ) | 1,167,330 | |||||||||||
Polen International Small Company Growth Fund | 5,293,075 | 700,693 | (66,550 | ) | 634,143 | |||||||||||
| * | Because tax adjustments are calculated annually at the end of the Fund’s fiscal year, the above table does not reflect tax adjustments for the current fiscal year. For the previous year’s federal income tax information, please refer to the Notes to Financial Statements section in the Fund’s most recent annual report. |
58
POLEN GROWTH FUNDS
Notes to Financial Statements (Concluded)
October 31, 2019
(Unaudited)
Pursuant to federal income tax rules applicable to regulated investment companies, the Funds may elect to treat certain capital losses between November 1 and October 31 and late year ordinary losses ((i) ordinary losses between January 1 and October 31, and (ii) specified ordinary and currency losses between November 1 and October 31) as occurring on the first day of the following tax year. For the year ended April 30, 2019, any amount of losses elected within the tax return will not be recognized for federal income tax purposes until May 1, 2019. For the year ended April 30, 2019, the Funds deferred to May 1, 2019 the following losses:
| Late-Year Ordinary | Short-Term Capital | Long-Term Capital | ||||||||||
| Losses Deferral | Loss Deferral | Loss Deferral | ||||||||||
Polen Growth Fund | $ | — | $ | 37,411,131 | $ | (6,383,087) | ||||||
Polen Global Growth Fund | — | — | — | |||||||||
Polen International Growth Fund | — | 112,883 | 17,646 | |||||||||
Polen U.S. Small Company Growth Fund | — | — | — | |||||||||
Polen International Small Company | ||||||||||||
Growth Fund | 8,001 | 9,183 | — | |||||||||
Accumulated capital losses represent net capital loss carryforwards as of April 30, 2019 that may be available to offset future realized capital gains and thereby reduce future capital gains distributions. As of April 30, 2019, the Funds did not have any capital loss carryforwards.
6. Subsequent Events
Management has evaluated the impact of all subsequent events on the Funds through the date the financial statements were issued, and has determined that there are no material subsequent events requiring recognition or disclosure in the financial statements.
59
POLEN GROWTH FUNDS
Other Information
(Unaudited)
Proxy Voting
Policies and procedures that the Funds use to determine how to vote proxies relating to portfolio securities as well as information regarding how the Funds voted proxies relating to portfolio securities for the most recent12-month period ended June 30 are available without charge, upon request, by calling (888)678-6024 and on the Securities and Exchange Commission’s (“SEC”) website athttp:// www.sec.gov.
Quarterly Portfolio Schedules
The Trust files its complete schedule of portfolio holdings with the SEC for the first and third fiscal quarters of each fiscal year (quarters ended July 31 and January 31) on FormN-Q. The Trust’s FormsN-Q are available on the SEC’s website at http://www.sec.gov. FormN-Q is being rescinded. Once FormN-Q is rescinded, disclosure of the Funds’ complete holdings will be required to be made monthly on FormN-PORT, with every third month made available to the public by the Commission upon filing.
Board Consideration of Investment Advisory Agreement
At anin-person meeting held on September24-25, 2019 (the “Meeting”), the Board of Trustees (the “Board” or the “Trustees”) of FundVantage Trust (the “Trust”), including a majority of the Trustees who are not “interested persons” within the meaning of Section 2(a)(19) of the Investment Company Act of 1940, as amended (the “1940 Act”) (the “Independent Trustees”), unanimously approved the continuation of the Investment Advisory Agreement between Polen Capital Management, LLC (“Polen” or the “Adviser”) and the Trust (the “Polen Agreement”) on behalf of the Polen Growth Fund, Polen Global Growth Fund, Polen International Growth Fund and Polen U.S. Small Company Growth Fund (together, the “Funds”). At the Meeting, the Board considered the continuation of the Polen Agreement with respect to each Fund for an additional one year period.
In determining whether to approve the Polen Agreement, the Trustees considered information provided by the Adviser in accordance with Section 15(c) of the 1940 Act regarding: (i) services performed for the Funds, (ii) the size and qualifications of the Adviser’s portfolio management staff, (iii) any potential or actual material conflicts of interest that may arise in connection with a portfolio manager’s management of a Fund, (iv) investment performance for each Fund (v) the capitalization and financial condition of Polen, (vi) Polen’s brokerage selection procedures (including soft dollar arrangements, if any), (vii) Polen’s procedures for allocating investment opportunities between the Funds and Polen’s other clients, (viii) results of any regulatory examination, including any recommendations or deficiencies noted, (ix) any litigation, investigation or administrative proceeding that may have a material impact on Polen’s ability to service the Funds, (x) compliance with the Funds’ investment objectives, policies and practices (including
60
POLEN GROWTH FUNDS
Other Information (Continued)
(Unaudited)
codes of ethics and proxy voting policies) and (xi) compliance with federal securities laws and other regulatory requirements. The Trustees noted the reports and discussions with portfolio managers as provided at the Board meetings throughout the year covering matters such as the relative performance of the Funds; compliance with the investment objectives, policies, strategies and limitations for the Funds; the compliance of management personnel with the code of ethics; and the adherence to the Trust’s pricing procedures as established by the Board.
Investment Performance.Polen Growth Fund.The Trustees considered the investment performance for the Polen Growth Fund. The Trustees reviewed the historical performance charts for the year to date, one year, two year, three year, five year and since inception periods ended June 30, 2019 for (i) the Institutional and Investor Class shares of the Polen Growth Fund; (ii) the Russell 1000 Growth Total Return Index; (iii) the S&P 500 Total Return Index and (iv) the Lipper Large Cap Growth Funds Index, the Polen Growth Fund’s applicable Lipper index.
The Trustees noted that the Polen Growth Fund outperformed the Lipper Large Cap Growth Fund Index for theyear-to-date, one year, two year, three year, five year, and since inception periods ended June 30, 2019. The Trustees noted that the Polen Growth Fund outperformed the Russell 1000 Growth Total Return Index for theyear-to-date, one year, two year, three year, five year and since inception periods ended June 30, 2019. The Trustees noted further that the Polen Growth Fund outperformed the S&P 500 Total Return Index for theyear-to-date, one year, two year, three year, five year, and since inception periods ended June 30, 2019. The Trustees concluded that the performance of the Polen Growth Fund was within an acceptable range of performance relative to other mutual funds with similar investment objectives, strategies and policies based on the information provided at the Meeting.
Polen Global Growth Fund.The Trustees considered the performance of the Polen Global Growth Fund as compared to the Lipper Global Large Cap Growth Funds Index and the MSCI All Country World Net Dividends Index for theyear-to-date, one year, two year, three year and since inception periods ended June 30, 2019 and noted that the Polen Global Growth Fund outperformed the Lipper Global Large Cap Growth Index and the MSCI All Country World Net Dividends Index for each period. The Trustees concluded that the performance of the Polen Global Growth Fund was within an acceptable range of performance relative to other mutual funds with similar investment objectives, strategies and policies based on the information provided at the Meeting.
Polen International Growth Fund.With respect to the Polen International Growth Fund, the Trustees considered the performance of the Institutional and Investor Class shares as compared to the Lipper InternationalLarge-Cap Growth Funds Index and the MSCI All Country World (Ex U.S.) Net Dividends Index for theyear-to-date, one year, two year and since inception periods ended June 30, 2019 and noted that the Polen International Growth Fund outperformed the MSCI All Country World (Ex U.S.) Net Dividends Index for each period. The Trustees also noted that the Polen International Growth Fund outperformed the Lipper InternationalMulti-Cap Growth Fund Index for the one year, two year and since inception periods
61
POLEN GROWTH FUNDS
Other Information (Continued)
(Unaudited)
ended June 30, 2019 and underperformed the Lipper InternationalMulti-Cap Growth Fund Index for the year to date period ended June 30, 2019. The Trustees concluded that the performance of the Polen International Growth Fund was within an acceptable range of performance relative to other mutual funds with similar investment objectives, strategies and policies based on the information provided at the Meeting.
Polen US Small Company Growth Fund.With respect to the Polen U.S. Small Company Growth Fund, the Trustees considered the performance of the Institutional Class shares as compared to the LipperSmall-Cap Growth Funds Index and the Russell 2000 Growth Total Return Index for theyear-to-date, one year and since inception periods ended June 30, 2019 and noted that the Polen U.S. Small Company Growth Fund Institutional Class shares outperformed the Russell 2000 Growth Total Return Index for each period. The Trustees also noted that the Polen U.S. Small Company Growth Fund Institutional Class shares outperformed the LipperSmall-Cap Growth Fund Index for the one year and since inception periods ended June 30, 2019, and underperformed the LipperSmall-Cap Growth Fund Index for the year to date period ended June 30, 2019. The Trustees concluded that the performance of the Polen U.S. Small Company Growth Fund was within an acceptable range of performance relative to other mutual funds with similar investment objectives, strategies and policies based on the information provided at the Meeting.
Fees. The Trustees also noted that Polen had provided information regarding its advisory fees and an analysis of these fees in relation to the delivery of services to the Funds and any other ancillary benefit resulting from Polen’s relationship with the Funds. The Trustees considered the fees that Polen charges to its similarly managed accounts, and evaluated the explanations provided by Polen as to differences in fees charged to the Funds and similarly managed accounts. The Trustees also reviewed a peer comparison of advisory fees and total expenses for the Funds versus the advisory fees of other funds or accounts managed by Polen and the average expense ratio for the Funds’ respective peer groups.
The Trustees noted that the contractual advisory fee and net total expense ratio of the Institutional Class shares of the Polen Growth Fund, Polen Global Growth Fund, Polen International Growth Fund and Polen U.S. Small Company Growth Fund were each higher than the median of funds in their respective Lipper peer groups. The Lipper peer group for the Polen Growth Fund included all funds within the peer group regardless of asset size, and the Lipper peer groups for the Polen Global Growth Fund, Polen International Growth Fund and Polen U.S. Small Company Growth Fund, respectively, included funds with assets of $250 million or less. The Trustees evaluated explanations provided by Polen regarding its belief that the proposed advisory fee is within the range of advisory fees for other similarly managed funds and expenses for funds of similar size, composition and type of investment product. The Trustees concluded that the advisory fees and services provided by Polen are reasonable and sufficiently consistent with those of other advisers which manage mutual funds with investment objectives, strategies and policies similar to those of the Funds.
62
POLEN GROWTH FUNDS
Other Information (Continued)
(Unaudited)
Knowledge, experience, and qualifications. The Board considered the level and depth of knowledge of Polen, including the professional experience and qualifications of senior personnel. In evaluating the quality of services provided by Polen, the Board took into account its familiarity with Polen’s senior management through Board meetings, discussions and reports during the preceding year. The Board also took into account Polen’s compliance policies and procedures and reports regarding Polen’s compliance operations from the Trust’s Chief Compliance Officer. The Board also considered any potential conflicts of interest that may arise in a portfolio manager’s management of the Funds’ investments on the one hand, and the investments of other accounts, on the other. The Trustees reviewed the services provided to the Funds by Polen and concluded that the nature, extent and quality of the services provided were appropriate and consistent with the terms of the Polen Agreement, that the quality of the proposed services appeared to be consistent with industry norms and that the Funds are likely to benefit from the provision of those services. They also concluded that Polen has sufficient personnel, with the appropriate education and experience, to serve the Funds effectively and had demonstrated their ability to attract and retain qualified personnel.
Cost of Services. The Trustees considered the costs of the services provided by Polen, the compensation and benefits received by, or to be received by, Polen in providing services to the Polen Funds, as well as Polen’s profitability. The Trustees were provided with the audited financial statements of Polen for the years ended December 31, 2018 and December 31, 2017. The Trustees noted that Polen’s level of profitability is an appropriate factor to consider, and the Trustees should be satisfied that Polen’s profits are sufficient to continue as a healthy concern generally and as investment adviser of the Funds specifically. The Trustees concluded that Polen’s fees derived from their relationship with the Trust, in light of the Funds’ expenses, were reasonable in relation to the nature and quality of the services provided, taking into account the fees charged by other advisers for managing comparable mutual funds with similar strategies. The Trustees also concluded that the overall expense ratios of the Funds were reasonable, taking into account the projected growth and size of each Fund and the quality of services provided by Polen.
Economies of Scale. The Trustees considered the extent to which economies of scale would be realized relative to fee levels as the Funds grow or are expected to grow, and whether the advisory fee levels reflect these economies of scale for the benefit of shareholders. The Board noted that economies of scale may be achieved at higher asset levels for the Funds for the benefit of fund shareholders but that the advisory fee did not currently include breakpoint reductions in the advisory fee as asset levels increase. In addition, the Board noted, that while no breakup points are included in the advisory fee schedule, Polen has agreed to contractual fee waivers and expense reimbursements in order to cap certain Funds net expense ratios.
At the Meeting, the Trustees unanimously approved the Polen Agreement with respect to the Polen Growth Fund, Polen Global Growth Fund, Polen International Growth Fund and Polen U.S. Small Company Growth Fund for an additional one year period. In voting to approve the Polen Agreement, the Board considered all factors it deemed relevant and the information presented to the Board by Polen. In arriving
63
POLEN GROWTH FUNDS
Other Information (Concluded)
(Unaudited)
at its decision, the Board did not identify any single factor as being of paramount importance and each member of the Board gave varying weights to each factor according to his or her own judgment. The Board determined that the continuation of the Polen Agreement with respect to the Polen Growth Fund, Polen Global Growth Fund, Polen International Growth Fund and Polen U.S. Small Company Growth Fund would be in the best interests of the Funds and their shareholders.
64
[THIS PAGE INTENTIONALLY LEFT BLANK.]
[THIS PAGE INTENTIONALLY LEFT BLANK.]
[THIS PAGE INTENTIONALLY LEFT BLANK.]
Investment Adviser
Polen Capital Management, LLC
1825 NW Corporate Blvd.
Suite 300
Boca Raton, FL 33431
Administrator
The Bank of New York Mellon
301 Bellevue Parkway
Wilmington, DE 19809
Transfer Agent
BNY Mellon Investment Servicing (US) Inc.
4400 Computer Drive
Westborough, MA 01581
Principal Underwriter
Foreside Funds Distributors LLC
400 Berwyn Park
899 Cassatt Road
Berwyn, PA 19312
Custodian
The Bank of New York Mellon
240 Greenwich Street
New York, NY 10286
Independent Registered Public Accounting Firm
PricewaterhouseCoopers LLP
Two Commerce Square, Suite 1800
2001 Market Street
Philadelphia, PA 19103-7042
Legal Counsel
Pepper Hamilton LLP
3000 Two Logan Square
18th and Arch Streets
Philadelphia, PA 19103
POL-1019

Polen Growth Fund
Polen Global Growth Fund
Polen International Growth Fund
Polen U.S. Small Company Growth Fund
Polen International Small Company Growth Fund
of
FundVantage Trust
Institutional Class
Investor Class
SEMI-ANNUAL REPORT
October 31, 2019
(Unaudited)
IMPORTANT NOTE: Beginning on January 1, 2021, paper copies of the Polen Funds’ annual and semi-annual shareholder reports will no longer be sent by mail, unless you specifically request paper copies of the shareholder reports from the Polen Funds or from your financial intermediary. Instead, annual and semi-annual shareholder reports will be available on the Polen Funds’ website (www.polencapital.com), and you will be notified by mail each time a report is posted and provided with a website link to access the report.
You may elect to receive all future annual and semi-annual shareholder reports in paper, free of charge. To elect to receive paper copies of shareholder reports through the mail or otherwise change your delivery method, contact your financial intermediary or, if you hold your shares directly through the Polen Funds, call the Polen Funds toll-free at (888)678-6024 or write to the Polen Funds at:
Polen Funds
FundVantage Trust
c/o BNY Mellon Investment Servicing
P.O. Box 9829
Providence, RI 02940-8029
Your election to receive shareholder reports in paper will apply to all Polen Funds that you hold through the financial intermediary, or directly with the Polen Funds.
This report is submitted for the general information of the shareholders of the Polen Growth Fund, the Polen Global Growth Fund, the Polen International Growth Fund, the Polen U.S. Small Company Growth Fund and the Polen International Small Company Growth Fund. It is not authorized for distribution unless preceded or accompanied by a current prospectus for the Polen Growth Fund, the Polen Global Growth Fund, the Polen International Growth Fund, the Polen U.S. Small Company Growth Fund and/or the Polen International Small Company Growth Fund.
PRIVATE CAPITAL MANAGEMENT VALUE FUND
Semi-Annual Investment Adviser’s Report
October 31, 2019
(Unaudited)
Dear Fellow Shareholder:
The U.S. equity markets posted mixed results over the past six months assmall-cap stocks continued to show significant volatility over what was generally a positive period. The Private Capital Management Value Fund’s (the “Fund”) Class I shares were particularly hard hit (in relative terms) in August and finished the period down-8.64%. This result trailed the Russell 2000 Index’s loss of-1.09% and the S&P 500 Index’s gain of 4.16%. As you are aware, the Fund’s portfolio composition is driven by our bottom up research conviction in the long-term value opportunities of the names the Fund holds. A significant driver of the Fund’s negative performance in August was attributable to core Fund positions that reported good results only to experience significant share price declines in the ensuing days. We are obviously disappointed and frustrated by the market’s unwillingness to translate strong corporate performance into commensurate stock price appreciation. That said, angst over near-term market performance does not equate to frustration with the companies that comprise the Fund’s portfolio. We want to be emphatic on this point – we view the Fund’s portfolio as being fundamentally strong and resilient, and deeply undervalued today.
We have witnessed this type of “sell the good news” market behavior in the past. Sometimes it is driven by forced selling or profit taking by active managers; sometimes it is a function of programmatic trading by passive strategies (index funds and/or ETFs). This time it seemed to us to be a mixture of both – with the end result being a relatively illiquidsmall-cap market that was failing to act in a predictable or even rational fashion. Our most significant takeaway is that in the late summer we experienced a “buyer’s strike” which had the effect of overwhelming company undervaluation, sound operational performance and attractive business fundamentals. Over any reasonable longer-term investment horizon our experience has demonstrated that company-specific fundamentals and intrinsic value discounts invariably drive stock performance when investor psychology improves. That said, we are more than a little surprised by the rapidity with which perceptions shifted from the near certainty that the U.S. economy was overheating to the alternative (opposite) hypothesis that we were potentially seeing the approach of a recession. We are encouraged by the emergence of a more measured view that despite political uncertainties and trade concerns, the U.S. economy has remained on solid footing.
As we have written previously, we believe that the Trump administration would prefer to achieve a settlement with China that allows it to declare victory in time for the 2020 election. It is perhaps more surprising that China currently seems willing to offer some concessions on a critical and contentious topic like intellectual property protections in order to achieve an agreement. We view it as particularly telling that this offer was made despite the U.S. Congress taking a very politically-charged stance towards the demonstrations in Hong Kong. Instead of looking for an excuse to walk away, the Chinese government has apparently decided to remain engaged in talks – which implies to us that they want an agreement as much as the Trump administration does.
1
PRIVATE CAPITAL MANAGEMENT VALUE FUND
Semi-Annual Investment Adviser’s Report (Continued)
October 31, 2019
(Unaudited)
In addition to the possibility of relief on the trade front, as we evaluate the broader environment for U.S. equity markets moving into 2020 we think it is important to continue to bear in mind that:
· The consumer economy – 70% of GDP – has remained very healthy.
· Unemployment is at record lows.
· Inflation remains negligible, which allows the Federal Reserve relatively free reign with interest rate policy.
Less obvious, but perhaps most importantly, the industrial slowdown that has occurred has largely been due to diminished or delayed corporate investment spending. While corporate earnings are basically fine, uncertainty with respect to trade policy and the “where should I put my supply chain” question has likely createdpent-up requirements. A trade deal could let the cork out of the bottle so to speak and an associated reacceleration of worldwide economic growth could be the biggest surprise of 2020.
On the political front, impeachment has dominated headlines at a time when markets have continued to trend higher. Polling suggests that U.S. voters have become jaded to political chicanery on both sides of the aisle and doubt the current hearings will lead to the Senate jettisoning the President. However this sorry saga plays out, at some point investors will necessarily undertake a sober assessment of the differences between the two political parties. Since we are still in the silly season of candidates making grandiose promises crafted to win the support of their target constituencies during the primaries, it is still too early to waste brain cycles (or lose sleep) over the various positions being taken. We will, however, be paying much closer attention asmid-July and the Democratic convention approach to understand the party’s “real” platform and what it is likely to imply for investors.
In the meantime, we remain focused on activities that are actionable – like analyzing the qualitative and quantitative business performance of the Fund’s holdings and relentlessly looking for potentially more attractive alternatives. Long-time Fund investors know that our performance can be episodic. Since our discipline simply does not correlate with the market, it should not come as a terrible surprise when we have periods of underperformance or, for that matter, outperformance. It is important, however, to remain patient through the former in order to enjoy the latter.
In our opinion, the Fund’s portfolio remains very undervalued – not quite as ridiculously so as last August – but not all that far removed when taken in aggregate. We look forward to demonstrating this assertion empirically.
We appreciate your continued support.
Private Capital Management
2
PRIVATE CAPITAL MANAGEMENT VALUE FUND
Semi-Annual Investment Adviser’s Report (Concluded)
October 31, 2019
(Unaudited)
Mutual Fund investing involves risk and it is possible to lose money by investing in a fund. The Fund is a diversified fund, but nevertheless has invested a significant portion of its assets in the securities of a single or small number of issuers, which may cause the Fund’s value to fluctuate more widely than some other diversified funds. As a result of the Fund’s investment approach and the appreciation of certain Fund holdings, as of October 31, 2019 the Fund’s holdings profile reflected a portfolio concentration level normally associated with anon-diversified fund. This may result in the Fund exhibiting greater volatility and less liquidity than other diversified funds.The above commentary is for informational purposes only and investors should consider the investment objectives, risks, charges, and expenses of the Fund carefully before investing. This report is not authorized for distribution unless preceded or accompanied by a current prospectus for the Private Capital Management Value Fund. The prospectus contains this and other important information about the Fund. Read it carefully before investing.
Shares of the Private Capital Management Value Fund are distributed by Foreside Funds Distributors LLC, not an adviser affiliate.
This letter is intended to assist shareholders in understanding how the Fund performed during the six months ended October 31, 2019 and reflects the views of the investment adviser at the time of this writing. Of course, these views may change and do not guarantee the future performance of the Fund or the markets.
Portfolio composition is subject to change. The current and future portfolio holdings of the Fund are subject to investment risks.
3
PRIVATE CAPITAL MANAGEMENT VALUE FUND
Semi-Annual Investment Adviser’s Report
Performance Data
October 31, 2019
(Unaudited)
Average Annual Total Returns for the Periods Ended October 31, 2019
| Six Months† | 1 Year | 3 Years | 5 Years | 10 Years | |||||||||||||||||||||
Class A (with sales charge)* | -13.35 | % | -9.12 | % | 6.66 | % | 2.14 | % | 8.08 | % | |||||||||||||||
Class A (without sales charge) | -8.74 | % | -4.33 | % | 8.49 | % | 3.19 | % | 9.13 | % | |||||||||||||||
S&P 500®Index* | 4.16 | % | 14.33 | % | 14.91 | % | 10.78 | % | 13.70 | % | |||||||||||||||
Russell 2000®Index | -1.09 | % | 4.90 | % | 10.96 | % | 7.37 | % | 12.27 | % | |||||||||||||||
| † | Not Annualized. |
| * | Performance shown for the Private Capital Management Value Fund (The “Fund”) for the period from May 1, 2009 to May 28, 2010 is the performance of a corporate defined contribution plan account (the “Predecessor Account”), which transferred its assets to the Fund in connection with the Fund’s commencement of operations on May 28, 2010 and does not reflect any taxes that you may pay as a result of any distributions or sale of shares of the Fund. Average annual total returns for Class A shares of the Fund reflect the imposition of the maximum front-end sales charge of 5.00%. Performance shown for the periods prior to October 6, 2010, is the performance of the Class I shares, which includes the performance of the Predecessor Account for the period from May 1, 2009 to May 28, 2010, adjusted to reflect the monthly deduction of the Fund’s Total Annual Fund Operating Expenses After Fee Waiver and/or Expense Reimbursement applicable to Class A shares effective at the commencement of operations of Class A shares on October 6, 2010. The Predecessor Account was not registered as a mutual fund under the Investment Company Act of 1940, as amended (“1940 Act”), and therefore was not subject to certain investment restrictions, limitations and diversification requirements imposed by the 1940 Act and Internal Revenue Code. If the Predecessor Account had been registered under the 1940 Act its performance may have been different. |
Class A shares of the Fund have a 5.00% maximum sales charge.
The performance data quoted represents past performance and does not guarantee future results. Current performance may be lower or higher. Performance data current to the most recentmonth-end may be obtained by calling (888)568-1267. The investment return and principal value of an investment will fluctuate so that shares, when redeemed, may be worth more or less than their original cost. The table does not reflect the deduction of taxes that a shareholder would pay on Fund distributions or the redemption of Fund shares.
Class A shares “Total Annual Fund Operating Expenses” and “Total Fund Operating Expenses After Fee Waiver and/or Expense Reimbursement” are 1.73% and 1.45%, respectively, of the Fund’s average daily net assets. These ratios are stated in the current prospectus dated September 1, 2019, and may differ from the actual expenses incurred by the Fund for the period covered by this report. Effective September 1, 2019, Private Capital Management, LLC (the “Adviser”), has contractually agreed to reduce its investment advisory fee and/or reimburse certain expenses of the Fund to the extent necessary to ensure that the Fund’s total operating expenses, excluding taxes, fees and expenses attributable to a distribution or service plan adopted by FundVantage Trust (the “Trust”), “Acquired Fund Fees and Expenses,” interest, extraordinary items and brokerage commissions do not exceed 1.20% (on an annual basis) of the Fund’s average daily net assets (the “Expense Limitation”). The Expense Limitation will remain in place until August 31, 2020, unless the Board of Trustees (“Board of Trustees”) of the Trust approves its early termination. Prior to September 1, 2019, the Fund’s Expense Limitation was 1.10%. The Adviser is entitled to recover, subject to approval by the Board of Trustees, such amounts reduced or reimbursed for a period of up to three (3) years
4
PRIVATE CAPITAL MANAGEMENT VALUE FUND
Semi-Annual Investment Adviser’s Report
Performance Data (Continued)
October 31, 2019
(Unaudited)
from the date on which the Adviser reduced its compensation and/or assumed expenses for the Fund. The Adviser is permitted to seek reimbursement from the Fund, subject to certain limitations, for fees it waived and Fund expenses it paid to the extent the total annual Fund expenses do not exceed the limits described above or any lesser limits in effect at the time of reimbursement. No recoupment will occur unless the Fund’s expenses are below the Expense Limitation amount. Total returns would be lower had such fees and expenses not been waived and/or reimbursed.
A 2.00% redemption fee applies to shares redeemed within 30 days of purchase. This redemption fee is not reflected in the returns shown above.
The Fund intends to evaluate performance as compared to that of Standard & Poor’s 500® Index (“S&P 500® Index”) and the Russell 2000® Index. The S&P 500® Index is a widely recognized, unmanaged index of 500 common stocks which are generally representative of the U.S. stock market as a whole. The Russell 2000® Index is an unmanaged index measuring the performance of the 2,000 smallest companies in the Russell 3000® Index, which is made up of 3,000 of the biggest U.S. stocks. It is impossible to invest directly in an index.
5
PRIVATE CAPITAL MANAGEMENT VALUE FUND
Semi-Annual Investment Adviser’s Report
Performance Data (Continued)
October 31, 2019
(Unaudited)
Average Annual Total Returns for the Periods Ended October 31, 2019
| Six Months† | 1 Year | 3 Years | 5 Years | 10 Years | |||||||||||||||||||||
Class I* | -8.64 | % | -4.12 | % | 8.75 | % | 3.45 | % | 9.38 | % | |||||||||||||||
S&P 500®Index | 4.16 | % | 14.33 | % | 14.91 | % | 10.78 | % | 13.70 | % | |||||||||||||||
Russell 2000®Index | -1.09 | % | 4.90 | % | 10.96 | % | 7.37 | % | 12.27 | % | |||||||||||||||
| † | Not Annualized. |
| * | Performance shown for the Private Capital Management Value Fund (The “Fund”) for the period from May 1, 2009 to May 28, 2010 is the performance of a corporate defined contribution plan account (the “Predecessor Account”), which transferred its assets to the Fund in connection with the Fund’s commencement of operations on May 28, 2010 and does not reflect any taxes that you may pay as a result of any distributions or sale of shares of the Fund. The Predecessor Account’s performance has been adjusted to reflect the monthly deduction of the Fund’s Total Annual Fund Operating Expenses After Fee Waiver and/or Expense Reimbursement applicable to Class I shares of the Fund effective at the Fund’s commencement of operations on May 28, 2010. Performance from May 28, 2010 to October 31, 2019 is from the performance of the Class I Shares. The Predecessor Account was not registered as a mutual fund under the Investment Company Act of 1940, as amended (the “1940 Act”), and therefore was not subject to certain investment restrictions, limitations and diversification requirements imposed by the 1940 Act and the Internal Revenue Code of 1986, as amended. If the Predecessor Account had been registered under the 1940 Act, its performance may have been different. |
The performance data quoted represents past performance and does not guarantee future results. Current performance may be lower or higher. Performance data current to the most recentmonth-end may be obtained by calling (888)568-1267. The investment return and principal value of an investment will fluctuate so that shares, when redeemed, may be worth more or less than their original cost. The table does not reflect the deduction of taxes that a shareholder would pay on Fund distributions or the redemption of Fund shares.
Class I shares “Total Annual Fund Operating Expenses” and “Total Fund Operating Expenses After Fee and Waiver and/or Expense Reimbursement” are 1.48% and 1.20%, respectively, of the Fund’s average daily net assets. These ratios are stated in the current prospectus dated September 1, 2019, and may differ from the actual expenses incurred by the Fund for the period covered by this report. Effective September 1, 2019, Private Capital Management, LLC (the “Adviser”), has contractually agreed to reduce its investment advisory fee and/or reimburse certain expenses of the Fund to the extent necessary to ensure that the Fund’s total operating expenses, excluding taxes, fees and expenses attributable to a distribution or service plan adopted by the Trust , “Acquired Fund Fees and Expenses,” interest, extraordinary items and brokerage commissions) do not exceed 1.20% (on an annual basis) of the Fund’s average daily net assets (the “Expense Limitation”). The Expense Limitation will remain in place until August 31, 2020, unless the Board of Trustees approves its early termination. Prior to September 1, 2019, the Fund’s Expense Limitation was 1.10%. The Adviser is entitled to recover, subject to approval by the Board of Trustees, such amounts reduced or reimbursed for a period of up to three (3) years from the date on which the Adviser reduced its compensation and/or assumed expenses for the Fund. The Adviser is permitted to seek reimbursement from the Fund, subject to certain limitations, for fees it waived and Fund expenses it paid to the extent the total annual Fund expenses do not exceed the limits described above or any lesser limits in effect at the time of reimbursement. No recoupment will
6
PRIVATE CAPITAL MANAGEMENT VALUE FUND
Semi-Annual Investment Adviser’s Report
Performance Data (Concluded)
October 31, 2019
(Unaudited)
occur unless the Fund’s expenses are below the Expense Limitation amount. Total return would be lower had such fees and expenses not been waived and/or reimbursed.
A 2.00% redemption fee applies to shares redeemed within 30 days of purchase. This redemption fee is not reflected in the returns shown above.
The Fund intends to evaluate performance as compared to that of Standard & Poor’s 500® Index (“S&P 500® Index”) and the Russell 2000® Index. The S&P 500® Index is a widely recognized, unmanaged index of 500 common stocks which are generally representative of the U.S. stock market as a whole. The Russell 2000® Index is an unmanaged index measuring the performance of the 2,000 smallest companies in the Russell 3000® Index, which is made up of 3,000 of the biggest U.S. stocks. It is impossible to invest directly in an index.
7
PRIVATE CAPITAL MANAGEMENT VALUE FUND
Fund Expense Disclosure
October 31, 2019
(Unaudited)
As a shareholder of the Fund you incur two types of costs: (1) transaction costs, including sales charges (loads) on purchase payments, if any, and redemption fees; and (2) ongoing costs, including management fees, distribution and/or service (Rule12b-1) fees, if any, and other Fund expenses. These examples are intended to help you understand your ongoing costs (in dollars) of investing in the Fund and to compare these costs with the ongoing costs of investing in other mutual funds.
These examples are based on an investment of $1,000 invested at the beginning of thesix-month period from May 1, 2019 through October 31, 2019 and held for the entire period.
Actual Expenses
The first line of the accompanying table provides information about actual account values and actual expenses. You may use the information in this line, together with the amount you invested, to estimate the expenses that you paid over the period. Simply divide your account value by $1,000 (for example, an $8,600 account value divided by $1,000 = 8.6), then multiply the result by the number in the first line under the heading entitled “Expenses Paid During Period” to estimate the expenses you paid on your account during this period.
Hypothetical Examples for Comparison Purposes
The second line of the accompanying table provides information about hypothetical account values and hypothetical expenses based on the Fund’s actual expense ratio and an assumed rate of return of 5% per year before expenses, which is not your Fund’s actual return. The hypothetical account values and expenses may not be used to estimate the actual ending account balance or expenses you paid for the period. You may use this information to compare the ongoing costs of investing in the Fund and other funds. To do so, compare these 5% hypothetical examples with the 5% hypothetical examples that appear in the shareholder reports of other funds.
Please note that the expenses shown in the accompanying table are meant to highlight your ongoing costs only and do not reflect any transactional costs, such as sales charges (loads), if any, and redemption fees. Therefore, each hypothetical line of the accompanying table is useful in comparing ongoing costs only and will not help you determine the relative total costs of owning different funds. In addition, if these transactional costs were included, your costs would have been higher.
8
PRIVATE CAPITAL MANAGEMENT VALUE FUND
Fund Expense Disclosure (Concluded)
October 31, 2019
(Unaudited)
| Private Capital Management Value Fund | |||||||||||||||
| Beginning Account Value | Ending Account Value | Expenses Paid | |||||||||||||
| May 1, 2019 | October 31, 2019 | During Period* | |||||||||||||
Class A | |||||||||||||||
Actual | $ | 1,000.00 | $ | 912.60 | $ | 6.63 | |||||||||
Hypothetical (5% return before expenses) | 1,000.00 | 1,018.20 | 7.00 | ||||||||||||
Class I | |||||||||||||||
Actual | $ | 1,000.00 | $ | 913.60 | $ | 5.44 | |||||||||
Hypothetical (5% return before expenses) | 1,000.00 | 1,019.46 | 5.74 | ||||||||||||
| * | Expenses are equal to an annualized expenses ratio for thesix-month period ended October 31, 2019 of 1.38% and 1.13% for Class A and Class I shares, respectively, for the Fund, multiplied by the average account value over the period, multiplied by the number of days in the most recent period (184), then divided by 366 to reflect the period. The Fund’s ending account values on the first line in each table are based on the actualsix-month total return for the Fund of (8.74)% and (8.64)% for Class A and Class I shares, respectively. |
9
PRIVATE CAPITAL MANAGEMENT VALUE FUND
Portfolio Holdings Summary Table
October 31, 2019
(Unaudited)
The following table presents a summary by sector of the portfolio holdings of the Fund:
| % of Net Assets | Value | |||||||
COMMON STOCKS: | ||||||||
Financials | 38.0 | % | $ | 13,471,310 | ||||
Consumer Discretionary | 27.1 | 9,583,508 | ||||||
Industrials | 9.5 | 3,350,098 | ||||||
Communication Services | 5.6 | 1,977,257 | ||||||
Materials | 5.3 | 1,877,612 | ||||||
Health Care | 2.2 | 764,412 | ||||||
Information Technology | 2.0 | 714,960 | ||||||
Utilities | 1.9 | 673,080 | ||||||
Other Assets in Excess of Liabilities | 8.4 | 2,984,703 | ||||||
|
|
|
| |||||
NET ASSETS | 100.0 | % | $ | 35,396,940 | ||||
|
|
|
| |||||
Portfolio holdings are subject to change at any time.
The accompanying notes are an integral part of the financial statements.
10
PRIVATE CAPITAL MANAGEMENT VALUE FUND
Portfolio of Investments
October 31, 2019
(Unaudited)
| Number of Shares | Value | |||||||
COMMON STOCKS — 91.6% |
| |||||||
Communication Services — 5.6% |
| |||||||
QuinStreet, Inc.* | 154,112 | $ | 1,977,257 | |||||
|
| |||||||
Consumer Discretionary — 27.1% |
| |||||||
At Home Group, Inc.* | 62,180 | 529,773 | ||||||
Carrols Restaurant Group, Inc.* | 184,300 | 1,314,059 | ||||||
Everi Holdings, Inc.* | 204,156 | 2,053,809 | ||||||
Fiesta Restaurant Group, Inc.* | 84,623 | 727,335 | ||||||
Gildan Activewear, Inc. (Canada) | 24,640 | 629,059 | ||||||
Lakeland Industries, Inc.* | 41,575 | 459,404 | ||||||
Motorcar Parts of America, Inc.* | 76,613 | 1,460,244 | ||||||
Stoneridge, Inc.* | 26,245 | 810,446 | ||||||
Target Hospitality Corp.* | 96,444 | 534,300 | ||||||
Visteon Corp.* | 11,450 | 1,065,079 | ||||||
|
| |||||||
| 9,583,508 | ||||||||
|
| |||||||
Financials — 38.0% | ||||||||
Community Financial Corp. (The) | 19,135 | 637,578 | ||||||
ECN Capital Corp. (Canada) | 533,700 | 1,766,920 | ||||||
First Northwest Bancorp | 39,675 | 697,090 | ||||||
HomeTrust Bancshares, Inc. | 38,594 | 1,030,460 | ||||||
INTL. FCStone, Inc.* | 50,986 | 2,039,440 | ||||||
Jefferies Financial Group, Inc. | 45,005 | 840,243 | ||||||
KKR & Co., Inc., Class A | 78,520 | 2,263,731 | ||||||
Northrim BanCorp, Inc. | 13,200 | 514,140 | ||||||
OceanFirst Financial Corp. | 25,360 | 606,865 | ||||||
Old National Bancorp. | 30,560 | 549,927 | ||||||
| Number of Shares | Value | |||||||
COMMON STOCKS — (Continued) |
| |||||||
Financials — (Continued) | ||||||||
Raymond James Financial, Inc. | 14,600 | $ | 1,218,954 | |||||
SmartFinancial, Inc.* | 29,500 | 620,975 | ||||||
Synovus Financial Corp. | 20,224 | 684,987 | ||||||
|
| |||||||
| 13,471,310 | ||||||||
|
| |||||||
Health Care — 2.2% | ||||||||
Zimmer Biomet Holdings, Inc. | 5,530 | 764,412 | ||||||
|
| |||||||
Industrials — 9.5% | ||||||||
Air Transport Services Group, Inc.* | 79,800 | 1,668,618 | ||||||
DIRTT Environmental Solutions (Canada)* | 370,370 | 1,681,480 | ||||||
|
| |||||||
| 3,350,098 | ||||||||
|
| |||||||
Information Technology — 2.0% |
| |||||||
Information Services Group, Inc.* | 331,000 | 714,960 | ||||||
|
| |||||||
Materials — 5.3% | ||||||||
Celanese Corp. | 5,545 | 671,777 | ||||||
Tronox Holdings PLC (United Kingdom), Class A | 142,030 | 1,205,835 | ||||||
|
| |||||||
| 1,877,612 | ||||||||
|
| |||||||
Utilities — 1.9% | ||||||||
National Fuel Gas Co. | 14,855 | 673,080 | ||||||
|
| |||||||
TOTAL COMMON STOCKS (Cost $22,167,945) | 32,412,237 | |||||||
|
| |||||||
The accompanying notes are an integral part of the financial statements.
11
PRIVATE CAPITAL MANAGEMENT VALUE FUND
Portfolio of Investments (Concluded)
October 31, 2019
(Unaudited)
| Value | ||||
TOTAL INVESTMENTS - 91.6% | $ | 32,412,237 | ||
OTHER ASSETS IN | 2,984,703 | |||
|
| |||
NET ASSETS - 100.0% | $ | 35,396,940 | ||
|
| |||
| * | Non-income producing. |
PLC Public Limited Company
The accompanying notes are an integral part of the financial statements.
12
PRIVATE CAPITAL MANAGEMENT VALUE FUND
Statement of Assets and Liabilities
October 31, 2019
(Unaudited)
Assets | ||||
Investments, at value (Cost $22,167,945) | $ | 32,412,237 | ||
Cash | 3,583,736 | |||
Receivable for capital shares sold | 24,896 | |||
Dividends and interest receivable | 3,681 | |||
Prepaid expenses and other assets | 32,943 | |||
|
| |||
Total assets | 36,057,493 | |||
|
| |||
Liabilities | ||||
Payable for capital shares redeemed | 548,961 | |||
Payable for investments purchased | 23,614 | |||
Payable for transfer agent fees | 20,352 | |||
Payable for administration and accounting fees | 17,986 | |||
Payable for legal fees | 13,649 | |||
Payable for audit fees | 13,238 | |||
Payable for printing fees | 6,618 | |||
Payable to Investment Adviser | 6,564 | |||
Payable for custodian fees | 5,666 | |||
Payable for distribution fees | 813 | |||
Payable for Trustees and Officers | 156 | |||
Accrued expenses | 2,936 | |||
|
| |||
Total liabilities | 660,553 | |||
|
| |||
Net Assets | $ | 35,396,940 | ||
|
| |||
Net Assets consisted of: | ||||
Capital Stock, $0.01 par value | $ | 24,662 | ||
Paid-in capital | 19,384,427 | |||
Total distributable earnings | 15,987,851 | |||
|
| |||
Net Assets | $ | 35,396,940 | ||
|
| |||
Class A: | ||||
Net asset value and redemption price per share ($3,910,117 / 277,522 shares) | $ | 14.09 | ||
|
| |||
Maximum offering price per share (100/95 of $14.09) | $ | 14.83 | ||
|
| |||
Class I: | ||||
Net asset value, offering and redemption price per share ($31,486,823 / 2,188,657 shares) | $ | 14.39 | ||
|
| |||
The accompanying notes are an integral part of the financial statements.
13
PRIVATE CAPITAL MANAGEMENT VALUE FUND
Statement of Operations
For the Six Months Ended October 31, 2019
(Unaudited)
Investment income | ||||
Dividends | $ | 263,728 | ||
Less: foreign taxes withheld | (3,386 | ) | ||
|
| |||
Total investment income | 260,342 | |||
|
| |||
Expenses | ||||
Advisory fees (Note 2) | 183,631 | |||
Transfer agent fees (Note 2) | 41,743 | |||
Administration and accounting fees (Note 2) | 32,602 | |||
Registration and filing fees | 27,157 | |||
Legal fees | 20,830 | |||
Trustees’ and officers’ fees (Note 2) | 19,352 | |||
Audit fees | 13,702 | |||
Custodian fees (Note 2) | 10,040 | |||
Printing and shareholder reporting fees | 7,365 | |||
Distribution fees (Class A) (Note 2) | 5,135 | |||
Other expenses | 3,435 | |||
|
| |||
Total expenses before waivers | 364,992 | |||
|
| |||
Less: waivers (Note 2) | (129,417 | ) | ||
|
| |||
Net expenses after waivers | 235,575 | |||
|
| |||
Net investment income | 24,767 | |||
|
| |||
Net realized and unrealized gain/(loss) from investments: | ||||
Net realized gain from investments | 2,144,640 | |||
Net realized gain from foreign currency transactions | 7 | |||
Net change in unrealized appreciation/(depreciation) on investments | (6,227,760 | ) | ||
Net change in unrealized appreciation/(depreciation) on foreign currency transactions | (6 | ) | ||
|
| |||
Net realized and unrealized loss on investments | (4,083,119 | ) | ||
|
| |||
Net decrease in net assets resulting from operations | $ | (4,058,352 | ) | |
|
| |||
The accompanying notes are an integral part of the financial statements.
14
PRIVATE CAPITAL MANAGEMENT VALUE FUND
Statements of Changes in Net Assets
| For the Six Months Ended October 31, 2019 (Unaudited) | For the Year Ended April 30, 2019 | |||||||||
Increase/(decrease) in net assets from operations: | ||||||||||
Net investment income/(loss) | $ | 24,767 | $ | (103,327 | ) | |||||
Net realized gain from investments | 2,144,647 | 9,715,427 | ||||||||
Net change in unrealized appreciation/(depreciation) on investments | (6,227,766 | ) | (6,592,129 | ) | ||||||
|
|
|
| |||||||
Net increase/(decrease) in net assets resulting from operations | (4,058,352 | ) | 3,019,971 | |||||||
|
|
|
| |||||||
Less dividends and distributions to shareholders from: | ||||||||||
Total distributable earnings | ||||||||||
Class A | — | (857,373 | ) | |||||||
Class I | — | (7,873,214 | ) | |||||||
|
|
|
| |||||||
Net decrease in net assets from dividends and distributions to shareholders | — | (8,730,587 | ) | |||||||
|
|
|
| |||||||
Decrease in net assets derived from capital share transactions (Note 4) | (8,151,771 | ) | (9,097,320 | ) | ||||||
|
|
|
| |||||||
Total decrease in net assets | (12,210,123 | ) | (14,807,936 | ) | ||||||
|
|
|
| |||||||
Net assets | ||||||||||
Beginning of period | 47,607,063 | 62,414,999 | ||||||||
|
|
|
| |||||||
End of period | $ | 35,396,940 | $ | 47,607,063 | ||||||
|
|
|
| |||||||
The accompanying notes are an integral part of the financial statements.
15
PRIVATE CAPITAL MANAGEMENT VALUE FUND
Financial Highlights
| ||||||||||||
Contained below is per share operating performance data for Class A shares outstanding, total investment return, ratios to average net assets and other supplemental data for the respective period. The total returns in the table represent the rate that an investor would have earned or lost on an investment in the Fund (assuming reinvestment of all dividends and distributions). This information has been derived from information provided in the financial statements and should be read in conjunction with the financial statements and the notes thereto. | ||||||||||||
| ||||||||||||
| Class A | ||||||||||||||||||||||||||||||
| For the Six Months Ended October 31, 2019 (Unaudited) | For the Year Ended April 30, 2019 | For the Year Ended April 30, 2018 | For the Year Ended April 30, 2017 | For the Year Ended April 30, 2016 | For the Year Ended April 30, 2015 | |||||||||||||||||||||||||
Per Share Operating Performance | ||||||||||||||||||||||||||||||
Net asset value, beginning of period | $ | 15.44 | $ | 17.13 | $ | 16.44 | $ | 13.72 | $ | 17.07 | $ | 15.16 | ||||||||||||||||||
|
|
|
|
|
|
|
|
|
|
|
| |||||||||||||||||||
Net investment income/(loss)(1) | (0.01 | ) | (0.07 | ) | (0.08 | ) | (0.26 | ) | 0.16 | (0.03 | ) | |||||||||||||||||||
Net realized and unrealized gain/(loss) on investments | (1.34 | ) | 1.07 | 1.00 | 3.15 | (2.55 | ) | 2.88 | ||||||||||||||||||||||
|
|
|
|
|
|
|
|
|
|
|
| |||||||||||||||||||
Net increase/(decrease) in net assets resulting from operations | (1.35 | ) | 1.00 | 0.92 | 2.89 | (2.39 | ) | 2.85 | ||||||||||||||||||||||
|
|
|
|
|
|
|
|
|
|
|
| |||||||||||||||||||
Dividends and distributions to shareholders from: | ||||||||||||||||||||||||||||||
Net investment income | — | — | — | (0.17 | ) | — | — | |||||||||||||||||||||||
Net realized capital gains | — | (2.69 | ) | (0.23 | ) | — | (0.96 | ) | (0.94 | ) | ||||||||||||||||||||
|
|
|
|
|
|
|
|
|
|
|
| |||||||||||||||||||
Total dividends and distributions to shareholders | — | (2.69 | ) | (0.23 | ) | (0.17 | ) | (0.96 | ) | (0.94 | ) | |||||||||||||||||||
|
|
|
|
|
|
|
|
|
|
|
| |||||||||||||||||||
Redemption fees | — | — | (2) | — | — | (2) | — | (2) | — | |||||||||||||||||||||
|
|
|
|
|
|
|
|
|
|
|
| |||||||||||||||||||
Net asset value, end of period | $ | 14.09 | $ | 15.44 | $ | 17.13 | $ | 16.44 | $ | 13.72 | $ | 17.07 | ||||||||||||||||||
|
|
|
|
|
|
|
|
|
|
|
| |||||||||||||||||||
Total investment return(3) | (8.74 | )% | 8.02 | % | 5.56 | % | 21.18 | % | (14.00 | )% | 19.11 | % | ||||||||||||||||||
Ratios/Supplemental Data | ||||||||||||||||||||||||||||||
Net assets, end of period (in thousands) | $ | 3,910 | $ | 4,625 | $ | 5,965 | $ | 6,063 | $ | 7,408 | $ | 8,042 | ||||||||||||||||||
Ratio of expenses to average net assets | 1.38 | %(4) | 1.35 | % | 1.32 | % | 1.25 | % | 1.25 | % | 1.25 | % | ||||||||||||||||||
Ratio of expenses to average net assets without waivers and expense reimbursements(5) | 2.01 | %(4) | 1.74 | % | 1.63 | % | 1.59 | % | 1.54 | % | 1.69 | % | ||||||||||||||||||
Ratio of net investment income/(loss) to average net assets | (0.10 | )%(4) | (0.41 | )% | (0.47 | )% | (1.78 | )% | 1.06 | % | (0.20 | )% | ||||||||||||||||||
Portfolio turnover rate | 5 | %(6) | 20 | % | 17 | % | 11 | % | 14 | % | 31 | % | ||||||||||||||||||
| (1) | The selected per share data was calculated using the average shares outstanding method for the period. |
| (2) | Amount is less than $0.005 per share. |
| (3) | Total investment return is calculated assuming a purchase of shares on the first day and a sale of shares on the last day of each period reported and includes reinvestments of dividends and distributions, if any. Total returns for periods less than one year are not annualized. Total investment return does not reflect the impact of the maximumfront-end sales load of 5.00%. If reflected, the return would be lower. |
| (4) | Annualized. |
| (5) | During the period, certain fees were waived. If such fee waivers had not occurred, the ratios would have been as indicated (See Note 2). |
| (6) | Not annualized. |
The accompanying notes are an integral part of the financial statements.
16
PRIVATE CAPITAL MANAGEMENT VALUE FUND
Financial Highlights
| ||||||||||||
Contained below is per share operating performance data for Class I shares outstanding, total investment return, ratios to average net assets and other supplemental data for the respective period. The total returns in the table represent the rate that an investor would have earned or lost on an investment in the Fund (assuming reinvestment of all dividends and distributions). This information has been derived from information provided in the financial statements and should be read in conjunction with the financial statements and the notes thereto. | ||||||||||||
| ||||||||||||
| Class I | ||||||||||||||||||||||||||||||
| For the Six Months Ended October 31, 2019 (Unaudited) | For the Year Ended April 30, 2019 | For the Year Ended April 30, 2018 | For the Year Ended April 30, 2017 | For the Year Ended April 30, 2016 | For the Year Ended April 30, 2015 | |||||||||||||||||||||||||
Per Share Operating Performance | ||||||||||||||||||||||||||||||
Net asset value, beginning of period | $ | 15.75 | $ | 17.37 | $ | 16.63 | $ | 13.88 | $ | 17.21 | $ | 15.24 | ||||||||||||||||||
|
|
|
|
|
|
|
|
|
|
|
| |||||||||||||||||||
Net investment income/(loss)(1) | 0.01 | (0.03 | ) | (0.04 | ) | (0.22 | ) | 0.20 | 0.01 | |||||||||||||||||||||
Net realized and unrealized gain/(loss) on investments | (1.37 | ) | 1.10 | 1.01 | 3.19 | (2.57 | ) | 2.90 | ||||||||||||||||||||||
|
|
|
|
|
|
|
|
|
|
|
| |||||||||||||||||||
Net increase/(decrease) in net assets resulting from operations | (1.36 | ) | 1.07 | 0.97 | 2.97 | (2.37 | ) | 2.91 | ||||||||||||||||||||||
|
|
|
|
|
|
|
|
|
|
|
| |||||||||||||||||||
Dividends and distributions to shareholders from: | ||||||||||||||||||||||||||||||
Net investment income | — | — | — | (0.22 | ) | — | — | |||||||||||||||||||||||
Net realized capital gains | — | (2.69 | ) | (0.23 | ) | — | (0.96 | ) | (0.94 | ) | ||||||||||||||||||||
|
|
|
|
|
|
|
|
|
|
|
| |||||||||||||||||||
Total dividends and distributions to shareholders | — | (2.69 | ) | (0.23 | ) | (0.22 | ) | (0.96 | ) | (0.94 | ) | |||||||||||||||||||
|
|
|
|
|
|
|
|
|
|
|
| |||||||||||||||||||
Redemption fees | — | — | (2) | — | — | (2) | — | (2) | — | |||||||||||||||||||||
|
|
|
|
|
|
|
|
|
|
|
| |||||||||||||||||||
Net asset value, end of period | $ | 14.39 | $ | 15.75 | $ | 17.37 | $ | 16.63 | $ | 13.88 | $ | 17.21 | ||||||||||||||||||
|
|
|
|
|
|
|
|
|
|
|
| |||||||||||||||||||
Total investment return(3) | (8.64 | )% | 8.33 | % | 5.80 | % | 21.50 | % | (13.76 | )% | 19.41 | % | ||||||||||||||||||
Ratios/Supplemental Data | ||||||||||||||||||||||||||||||
Net assets, end of period (in thousands) | $ | 31,487 | $ | 42,982 | $ | 56,450 | $ | 71,173 | $ | 79,078 | $ | 63,069 | ||||||||||||||||||
Ratio of expenses to average net assets | 1.13 | %(4) | 1.10 | % | 1.07 | % | 1.00 | % | 1.00 | % | 1.00 | % | ||||||||||||||||||
Ratio of expenses to average net assets without waivers and expense reimbursements(5) | 1.76 | %(4) | 1.48 | % | 1.38 | % | 1.34 | % | 1.29 | % | 1.45 | % | ||||||||||||||||||
Ratio of net investment income/(loss) to average net assets | 0.15 | %(4) | (0.16 | )% | (0.22 | )% | (1.53 | )% | 1.30 | % | 0.05 | % | ||||||||||||||||||
Portfolio turnover rate | 5 | %(6) | 20 | % | 17 | % | 11 | % | 14 | % | 31 | % | ||||||||||||||||||
| (1) | The selected per share data was calculated using the average shares outstanding method for the period. |
| (2) | Amount is less than $0.005 per share. |
| (3) | Total investment return is calculated assuming a purchase of shares on the first day and a sale of shares on the last day of each period reported and includes reinvestment of dividends and distributions, if any. Total return for period less than one year is not annualized. |
| (4) | Annualized. |
| (5) | During the period, certain fees were waived. If such fee waivers had not occurred, the ratios would have been as indicated (See Note 2). |
| (6) | Not annualized. |
The accompanying notes are an integral part of the financial statements.
17
PRIVATE CAPITAL MANAGEMENT VALUE FUND
Notes to Financial Statements
October 31, 2019
(Unaudited)
1. Organization and Significant Accounting Policies
The Private Capital Management Value Fund (the “Fund”) is operating as a diversified,open-end management investment company registered under the Investment Company Act of 1940, as amended, (the “1940 Act”), which commenced investment operations on May 28, 2010. The Fund is a separate series of FundVantage Trust (the “Trust”) which was organized as a Delaware statutory trust on August 28, 2006. The Trust is a “series trust” authorized to issue an unlimited number of separate series or classes of shares of beneficial interest. Each series is treated as a separate entity for certain matters under the 1940 Act, and for other purposes, and a shareholder of one series is not deemed to be a shareholder of any other series. The Fund offers separate classes of shares, Class A, Class C, Class I and Class R Shares. Class A Shares are sold subject to afront-end sales charge.Front-end sales charges may be reduced or waived under certain circumstances. A 1.00% contingent deferred sales charge (“CDSC”) will be assessed when Class C shares are redeemed within 12 months after initial purchase; however, the CDSC shall not apply to the purchases of Class C shares where the selling broker dealer was not paid a commission at the time of initial purchase. As of October 31, 2019, the Class C shares and the Class R shares have not yet commenced operations.
The Fund is an investment company and follows accounting and reporting guidance in the Financial Accounting Standards Board Accounting Standards Codification Topic 946.
Portfolio Valuation — The Fund’s net asset value (“NAV”) is calculated once daily as of the close of regular trading hours on the New York Stock Exchange (“NYSE”) (typically 4:00 p.m. Eastern time) on each day the NYSE is open. Securities held by the Fund are valued using the closing price or the last sale price on a national securities exchange or the National Association of Securities Dealers Automatic Quotation System (“NASDAQ”) market system where they are primarily traded. Equity securities traded in theover-the-counter market are valued at their closing prices. If there were no transactions on that day, securities traded principally on an exchange or on NASDAQ will be valued at the mean of the last bid and ask prices prior to the market close. Fixed income securities having a remaining maturity of greater than 60 days are valued using an independent pricing service. Fixed income securities having a remaining maturity of 60 days or less are generally valued at amortized cost, provided such amount approximates fair value. Foreign securities are valued based on prices from the primary market in which they are traded and are translated from the local currency into U.S. dollars using current exchange rates. Investments in otheropen-end investment companies are valued based on the NAV of the investment companies (which may use fair value pricing as discussed in their prospectuses). If market quotations are unavailable or deemed unreliable, securities will be valued in accordance with procedures adopted by the Trust’s Board of Trustees (“Board of Trustees”). Relying on prices supplied by pricing services or dealers or using fair valuation may result in values that are higher or lower than the values used by other investment companies and investors to price the same investments. In the event that market quotes are not readily available, and the security or asset cannot be valued pursuant to one of the valuation methods, the value
18
PRIVATE CAPITAL MANAGEMENT VALUE FUND
Notes to Financial Statements (Continued)
October 31, 2019
(Unaudited)
of the security or asset will be determined in good faith by the Adviser. The Trust has established a Valuation Committee which performs certain functions including the oversight of the Adviser’s fair valuation determinations.
Fair Value Measurements — The inputs and valuation techniques used to measure fair value of the Fund’s investments are summarized into three levels as described in the hierarchy below:
| · Level 1 — | quoted prices in active markets for identical securities; | |
| · Level 2 — | other significant observable inputs (including quoted prices for similar securities, interest rates, prepayment speeds, credit risk, etc.); and | |
| · Level 3 — | significant unobservable inputs (including the Fund’s own assumptions in determining the fair value of investments). | |
The inputs or methodology used for valuing securities are not necessarily an indication of the risk associated with investing in those securities.
The following is a summary of the inputs used, as of October 31, 2019, in valuing the Fund’s investments carried at fair value:
| Level 2 | Level 3 | |||||||||||||||
| Level 1 | Other Significant | Significant | ||||||||||||||
| Total Value at | Quoted | Observable | Unobservable | |||||||||||||
| 10/31/19 | Price | Inputs | Inputs | |||||||||||||
Assets: | ||||||||||||||||
Investments in Securities* | $ | 32,412,237 | $ | 32,412,237 | $ | — | $ | — | ||||||||
|
|
|
|
|
|
|
| |||||||||
| * | Please refer to Portfolio of Investments for further details on portfolio holdings. |
At the end of each quarter, management evaluates the classification of Levels 1, 2 and 3 assets and liabilities. Various factors are considered, such as changes in liquidity from the prior reporting period; whether or not a broker is willing to execute at the quoted price; the depth and consistency of prices from third party pricing services; and the existence of contemporaneous, observable trades in the market. Additionally, management evaluates the classification of Level 1 and Level 2 assets and liabilities on a quarterly basis for changes in listings or delistings on national exchanges.
Due to the inherent uncertainty of determining the fair value of investments that do not have a readily available market value, the fair value of the Fund’s investments may fluctuate from period to period. Additionally, the fair value of investments may differ significantly from the values that would have been used had a ready market existed for such investments and may differ materially from the values the Fund
19
PRIVATE CAPITAL MANAGEMENT VALUE FUND
Notes to Financial Statements (Continued)
October 31, 2019
(Unaudited)
may ultimately realize. Further, such investments may be subject to legal and other restrictions on resale or otherwise less liquid than publicly traded securities.
For fair valuations using significant unobservable inputs, U.S. generally accepted accounting principles (“U.S. GAAP”) require the Fund to present a reconciliation of the beginning to ending balances for reported market values that present changes attributable to total realized and unrealized gains or losses, purchase and sales, and transfers in and out of Level 3 during the period. A reconciliation of Level 3 investments is presented only when the Fund had an amount of Level 3 investments at the end of the reporting period that was meaningful in relation to its net assets. The amounts and reasons for all transfers in and out of each Level within the three-tier hierarchy are disclosed when the Fund had an amount of total transfers during the reporting period that was meaningful in relation to its net assets as of the end of the reporting period.
For the six months ended October 31, 2019, there were no transfers in or out of Level 3.
Use of Estimates— The preparation of financial statements in conformity with U.S. GAAP requires management to make estimates and assumptions that affect the amounts reported in the financial statements and accompanying notes at the date of the financial statements and the reported amounts of revenues and expenses during the period. Actual results could differ from those estimates and those differences could be material.
Investment Transactions, Investment Income and Expenses— Investment transactions are recorded on trade date for financial statement preparation purposes. Realized gains and losses on investments sold are recorded on the identified cost basis. Interest income is recorded on the accrual basis. Dividends are recorded on theex-dividend date. Distribution(12b-1) fees relating to a specific class are charged directly to that class. Fund level expenses common to all classes, investment income and realized and unrealized gains and losses on investments are generally allocated to each class based upon the relative daily net assets of each class. General expenses of the Trust are generally allocated to each fund in proportion to its relative daily net assets. Expenses directly attributable to a particular fund in the Trust are charged directly to that fund.
Dividends and Distributions to Shareholders— Dividends from net investment income and distributions from net realized capital gains, if any, are declared, recorded onex-date and paid at least annually to shareholders. Income dividends and capital gain distributions are determined in accordance with U.S. federal income tax regulations, which may differ from U.S. GAAP.
U.S. Tax Status— No provision is made for U.S. income taxes as it is the Fund’s intention to continue to qualify for and elect the tax treatment applicable to regulated investment companies under Subchapter M of the Internal Revenue Code of 1986, as amended (“Internal Revenue Code”), and make the requisite distributions to its shareholders which will be sufficient to relieve it from U.S. income and excise taxes.
20
PRIVATE CAPITAL MANAGEMENT VALUE FUND
Notes to Financial Statements (Continued)
October 31, 2019
(Unaudited)
Other— In the normal course of business, the Fund may enter into contracts that provide general indemnifications. The Fund’s maximum exposure under these arrangements is dependent on claims that may be made against the Fund in the future, and therefore, cannot be estimated; however, based on experience, the risk of material loss for such claims is considered remote.
Currency Risk— The Fund invests in securities of foreign issuers, including American Depositary Receipts. These markets are subject to special risks associated with foreign investments not typically associated with investing in U.S. markets. Because the foreign securities in which the Fund may invest generally trade in currencies other than the U.S. dollar, changes in currency exchange rates will affect the Fund’s NAV, the value of dividends and interest earned and gains and losses realized on the sale of securities. Because the NAV for the Fund is determined on the basis of U.S. dollars, the Fund may lose money by investing in a foreign security if the local currency of a foreign market depreciates against the U.S. dollar, even if the local currency value of the Fund’s holdings goes up. Generally, a strong U.S. dollar relative to these other currencies will adversely affect the value of the Fund’s holdings in foreign securities.
Recent Regulatory Reporting Update and Accounting Pronouncement— In August 2018, the Financial Accounting Standards Board issued an Accounting Standards Update, ASU2018-13,Fair Value Measurement (Topic 820), Disclosure Framework – Changes to the Disclosure Requirements for Fair Value Measurement(the “2018 ASU”) which adds, modifies and removes disclosure requirements related to certain aspects of fair value measurement. The 2018 ASU is effective for fiscal years, and interim periods within those fiscal years, beginning after December 15, 2019. Early adoption is permitted. As of October 31, 2019, the Fund has fully adopted the provisions of the 2018 ASU, which did not have a material impact on the Fund’s financial statements and related disclosures or impact the Fund’s net assets or results of operations.
2. Transactions with Related Parties and Other Service Providers
Private Capital Management, LLC (the “Adviser”) serves as the investment adviser to the Fund pursuant to an investment advisory agreement with the Trust (the “Advisory Agreement”). For its services, the Adviser is paid a monthly fee at the annual rate of 0.90% of the Fund’s average daily net assets. Effective September 1, 2019, the Adviser has contractually agreed to reduce its investment advisory fee and/or reimburse certain expenses of the Fund to the extent necessary to ensure that the Fund’s total operating expenses, excluding taxes, fees and expenses attributable to a distribution or service plan adopted by the Trust, “Acquired Fund Fees and Expenses,” interest, extraordinary items and brokerage commissions do not exceed 1.20% (on an annual basis) of the Fund’s average daily net assets (the “Expense Limitation”). The Expense Limitation will remain in place until August 31, 2020, unless the Board of Trustees approves its earlier termination. Prior to September 1, 2019, the Expense Limitation was 1.10%. The Adviser is entitled to recover, subject to approval by the Board of Trustees, such amounts reduced or reimbursed
21
PRIVATE CAPITAL MANAGEMENT VALUE FUND
Notes to Financial Statements (Continued)
October 31, 2019
(Unaudited)
for a period of up to three (3) years from the date on which the Adviser reduced its compensation and/or assumed expenses for the Fund. The Adviser is permitted to seek reimbursement from the Fund, subject to certain limitations, for fees it waived and Fund expenses it paid to the extent the total annual Fund expenses do not exceed the limits described above or any lesser limits in effect at the time of reimbursement. No recoupment will occur unless the Fund’s expenses are below the Expense Limitation amount.
As of October 31, 2019, the amount of potential recovery was as follows:
| Expiration | ||||||||
4/30/2020 | 4/30/2021 | 4/30/2022 | 10/31/2022 | Total | ||||
| $138,132 | $231,595 | $219,502 | $129,417 | $718,646 | ||||
For the six months ended October 31, 2019, the Adviser earned fees of $183,631 and waived fees of $129,417.
Other Service Providers
The Bank of New York Mellon (“BNY Mellon”) serves as administrator and custodian for the Fund. For providing administrative and accounting services, BNY Mellon is entitled to receive a monthly fee equal to an annual percentage rate of the Fund’s average daily net assets and is subject to certain minimum monthly fees. For providing certain custodial services, BNY Mellon is entitled to receive a monthly fee, subject to certain minimum, and out of pocket expenses.
BNY Mellon Investment Servicing (US) Inc. (the “Transfer Agent”) provides transfer agent services to the Fund. The Transfer Agent is entitled to receive a monthly fee, subject to certain minimum, and out of pocket expenses.
The Trust, on behalf of the Fund, has entered into agreements with financial intermediaries to provide recordkeeping, processing, shareholder communications and other services to customers of the intermediaries investing in the Fund and have agreed to compensate the intermediaries for providing those services. The fees incurred by the Fund for these services are included in Transfer agent fees in the Statement of Operations.
Foreside Funds Distributors LLC (the “Underwriter”) provides principal underwriting services to the Fund pursuant to an underwriting agreement between the Trust and the Underwriter.
The Trust and the Underwriter are parties to an underwriting agreement. The Trust has adopted a distribution plan for the Fund’s Class A Shares in accordance with Rule12b-1 under the 1940 Act. Pursuant to the Class A Shares plan, the Fund compensates the Underwriter for direct and indirect costs and
22
PRIVATE CAPITAL MANAGEMENT VALUE FUND
Notes to Financial Statements (Continued)
October 31, 2019
(Unaudited)
expenses incurred in connection with advertising, marketing and other distribution services in an amount not to exceed 0.25% on an annualized basis of the average daily net assets of the Fund’s Class A Shares.
Trustees and Officers
The Trust is governed by its Board of Trustees. The Trustees receive compensation in the form of an annual retainer and per meeting fees for their services to the Trust. The remuneration paid to the Trustees by the Fund during the six months ended October 31, 2019 was $3,507. An employee of BNY Mellon serves as the Secretary of the Trust and is not compensated by the Fund or the Trust.
JW Fund Management LLC (“JWFM”) provides a Principal Executive Officer and Principal Financial Officer, respectively, to the Trust. Duff & Phelps, LLC (“D&P”) provides the Trust with a Chief Compliance Officer and an Anti-Money Laundering Officer. JWFM and D&P are compensated for their services provided to the Trust.
3. Investment in Securities
For the six months ended October 31, 2019, aggregate purchases and sales of investment securities (excluding short-term investments) of the Fund were as follows:
| Purchases | Sales | |||||||
Investment Securities | $ | 2,148,672 | $ | 11,971,060 | ||||
23
PRIVATE CAPITAL MANAGEMENT VALUE FUND
Notes to Financial Statements (Continued)
October 31, 2019
(Unaudited)
4. Capital Share Transactions
For the six months ended October 31, 2019 and the year ended April 30, 2019, transactions in capital shares (authorized shares unlimited) were as follows:
For the Six Months Ended (Unaudited) | For the Year Ended April 30, 2019 | |||||||||||||||||||||||
Shares | Amount | Shares | Amount | |||||||||||||||||||||
Class A | ||||||||||||||||||||||||
Sales | — | $ | — | 34,520 | $ | 668,891 | ||||||||||||||||||
Reinvestments | — | — | 61,649 | 836,578 | ||||||||||||||||||||
Redemption Fees* | — | — | — | 165 | ||||||||||||||||||||
Redemptions | (21,905 | ) | (306,405 | ) | (144,994 | ) | (2,310,788 | ) | ||||||||||||||||
|
|
|
|
|
|
|
| |||||||||||||||||
Net decrease | (21,905 | ) | $ | (306,405 | ) | (48,825 | ) | $ | (805,154 | ) | ||||||||||||||
|
|
|
|
|
|
|
| |||||||||||||||||
Class I | ||||||||||||||||||||||||
Sales | 80,756 | $ | 1,179,106 | 282,371 | $ | 5,041,866 | ||||||||||||||||||
Reinvestments | — | — | 453,396 | 6,270,466 | ||||||||||||||||||||
Redemption Fees* | — | — | — | 1,353 | ||||||||||||||||||||
Redemptions | (621,029 | ) | (9,024,472 | ) | (1,256,335 | ) | (19,605,851 | ) | ||||||||||||||||
|
|
|
|
|
|
|
| |||||||||||||||||
Net decrease | (540,273 | ) | $ | (7,845,366 | ) | (520,568 | ) | $ | (8,292,166 | ) | ||||||||||||||
|
|
|
|
|
|
|
| |||||||||||||||||
Total net decrease | (562,178 | ) | $ | (8,151,771 | ) | (569,393 | ) | $ | (9,097,320 | ) | ||||||||||||||
|
|
|
|
|
|
|
| |||||||||||||||||
| * | There is a 2.00% redemption fee that may be charged on shares redeemed within the first 30 days of their acquisition. The redemption fees are retained by the Fund for the benefit of the remaining shareholders and recorded aspaid-in capital. |
5. Federal Tax Information
The Fund has followed the authoritative guidance on accounting for and disclosure of uncertainty in tax positions, which requires the Fund to determine whether a tax position is more likely than not to be sustained upon examination, including resolution of any related appeals or litigation processes, based on the technical merits of the position. The Fund has determined that there was no effect on the financial statements from following this authoritative guidance. In the normal course of business, the Fund is subject to examination by federal, state and local jurisdictions, where applicable, for tax years for which applicable statutes of limitations have not expired.
For the year ended April 30, 2019, the tax character of distributions paid by the Fund was $8,730,587 of long-term capital gains dividends.
24
PRIVATE CAPITAL MANAGEMENT VALUE FUND
Notes to Financial Statements (Concluded)
October 31, 2019
(Unaudited)
As of April 30, 2019, the components of distributable earnings on a tax basis were as follows:
| Net | Total | |||||
| Undistributed | Unrealized | Qualified Late-Year | Distributable | |||
Long-Term Gain | Appreciation | Losses | Earnings | |||
| $4,076,667 | $16,213,657 | $(244,121) | $20,046,203 |
The differences between the book and tax basis components of distributable earnings relate primarily to the timing and recognition of income and gains for federal income tax purposes.
At October 31, 2019, the federal tax cost, aggregate gross unrealized appreciation and depreciation of securities held by the Fund were as follows:
Federal tax cost* | $ | 22,167,945 | ||||
|
| |||||
| Gross unrealized appreciation | $ | 11,581,836 | |||
Gross unrealized depreciation | (1,337,544 | ) | ||||
|
| |||||
Net unrealized appreciation | $ | 10,244,292 | ||||
|
|
| * | Because tax adjustments are calculated annually at the end of the Fund’s fiscal year, the above table does not reflect tax adjustments for the current fiscal year. For the previous year’s federal income tax information, please refer to the Notes to Financial Statements section in the Fund’s most recent annual report. |
Pursuant to federal income tax rules applicable to regulated investment companies, the Fund may elect to treat certain capital losses between November 1 and October 31 and late year ordinary losses ((i) ordinary losses between January 1 and October 31, and (ii) specified ordinary and currency losses between November 1 and October 31) as occurring on the first day of the following tax year. For the year ended April 30, 2019, any amount of losses elected within the tax return will not be recognized for federal income tax purposes until May 1, 2019. For the year ended April 30, 2019, the Fund had late-year ordinary loss deferrals of $244,121.
Accumulated capital losses represent net capital loss carry forwards as of April 30, 2019 that may be available to offset future realized capital gains and thereby reduce future capital gains distributions. As of April 30, 2019, the Fund had no capital losses.
6. Subsequent Events
Management has evaluated the impact of all subsequent events on the Fund through the date the financial statements were issued, and has determined that there are no material subsequent events requiring recognition or disclosure in the financial statements.
25
PRIVATE CAPITAL MANAGEMENT VALUE FUND
Other Information
(Unaudited)
Proxy Voting
Policies and procedures that the Fund uses to determine how to vote proxies relating to portfolio securities as well as information regarding how the Fund voted proxies relating to portfolio securities for the most recent12-month period ended June 30 are available without charge, upon request, by calling (888)568-1267 and on the Securities and Exchange Commission’s (“SEC”) website athttp:// www.sec.gov.
Quarterly Portfolio Schedules
The Trust files its complete schedule of portfolio holdings with the SEC for the first and third fiscal quarters of each fiscal year (quarters ended July 31 and January 31) on FormN-Q. The Trust’s FormsN-Q are available on the SEC’s website athttp://www.sec.gov. FormN-Q is being rescinded. Once FormN-Q is rescinded, disclosure of the Fund’s complete holdings will be required to be made monthly on FormN-PORT, with every third month made available to the public by the Commission upon filing.
Board Consideration of Investment Advisory Agreement
At anin-person meeting held on June24-25, 2019 (the “Meeting”), the Board of Trustees (the “Board” or the “Trustees”) of FundVantage Trust (the “Trust”), including a majority of the Trustees who are not “interested persons” within the meaning of Section 2(a)(19) of the Investment Company Act of 1940, as amended (the “1940 Act”) (the “Independent Trustees”), unanimously approved the continuation of the Investment Advisory Agreement between Private Capital Management, LLC (“PCM” or the “Adviser”) and the Trust (the “PMC Agreement”) on behalf of the Private Capital Management Value Fund (the “Fund”). At the Meeting, the Board considered the continuation of the PCM Agreement for an additional one year period.
In determining whether to approve the Agreement, the Trustees considered information provided by the Adviser in accordance with Section 15 (c) of the 1940 Act regarding (i) services performed for the Fund, (ii) the size and qualifications of their portfolio management staff, (iii) any potential or actual material conflicts of interest which may arise in connection with a portfolio manager’s management of the Fund, (iv) investment performance, (v) the capitalization and financial condition of PCM, (vi) brokerage selection procedures (including soft dollar arrangements, if any), (vii) the procedures for allocating investment opportunities between the Fund and other clients, (viii) results of any regulatory examination, including any recommendations or deficiencies noted, (ix) any litigation, investigation or administrative proceeding which may have a material impact on PCM’s ability to service the Fund, (x) compliance with the Fund’s investment objectives, policies and procedures (including codes of ethics and proxy voting policies) and (xi) compliance with federal securities laws and other regulatory requirements. The Trustees noted that they received reports and discussions with PCM at the Board meetings throughout the year covering
26
PRIVATE CAPITAL MANAGEMENT VALUE FUND
Other Information (Continued)
(Unaudited)
matters such as the relative performance of the Fund; compliance with the investment objectives, policies, strategies and limitations for the Fund; the compliance of management personnel with the applicable code of ethics; and the adherence to the Trust’s pricing procedures as established by the Board.
Representatives from PCM attended the meeting in person. The representatives discussed the firm’s history, performance and investment strategy in connection with the proposed approval of the Agreement and answered questions from the Board.
Performance. The Trustees considered the investment performance of the Fund. The Trustees reviewed the historical performance charts for the Fund’s Class A shares and Class I shares as compared to the Russell 2000 Total Return Index and the LipperMid-Cap Core Funds Index, the Fund’s applicable Lipper index, for theyear-to-date, one year,two-year, three year, five year and since inception periods ended March 31, 2019. The Trustees noted that they considered performance reports provided at Board meetings throughout the year.
The Trustees noted that the Fund’s Class A shares and Class I underperformed the LipperMid-Cap Core Funds Index and the Russell 2000 Total Return Index the for theyear-to-date, two year, three year, five year, and since inception periods ended March 31, 2019. The Trustees further noted that the Fund’s Class A shares and Class I outperformed the LipperMid-Cap Core Funds Index and the Russell 2000 Total Return Index for the one year period ended March 31, 2019. The Trustees concluded that, although the Fund had underperformed the Russell 2000 Total Return Index and the LipperMid-Cap Core Funds Index during certain time periods, the performance of the Fund was within an acceptable range of performance relative to other mutual funds with similar investment objectives, strategies and policies based on the information provided at the Meeting.
Fees. The Trustees also noted that the representatives of PCM had provided information regarding its advisory fees and an analysis of these fees in relation to the services provided to the Fund and any other ancillary benefit resulting from the PCM’s relationship with the Fund. The Trustees also reviewed information regarding the fees PCM charges to other clients and evaluated explanations provided by PCM as to differences in fees charged to the Fund and other similarly managed accounts. The Trustees reviewed fees charged by other advisers that manage comparable mutual funds with similar strategies. The Trustees concluded that the advisory fees and services provided by PCM are consistent with those of other advisers which manage mutual funds with investment objectives, strategies and policies similar to those of the Fund as measured by the information provided by PCM.
The Board evaluated explanations provided by PCM as to differences in fees charged to the Fund and other accounts managed by PCM. The Trustees also reviewed a comparison of advisory fees of the Fund versus other similarly managed funds. The Trustees noted that the gross advisory fees and net total expense ratios of the Fund’s Class A shares and Class I shares were higher than the medians of the gross advisory fees and net total expense ratios of funds in the Lipper category with $250 million
27
PRIVATE CAPITAL MANAGEMENT VALUE FUND
Other Information (Continued)
(Unaudited)
or less in assets. The Trustees concluded that the advisory fee and services provided by PCM were sufficiently consistent with those of other advisers that manage mutual funds with investment objectives, strategies and policies similar to those of the Fund based on the information provided at the Meeting.
Knowledge, experience, and qualifications. The Board then considered the level and depth of knowledge of PCM, including the professional experience and qualifications of its senior personnel. In evaluating the quality of services provided by PCM, the Board took into account its familiarity with PCM’s senior management through Board meetings, discussions and reports during the preceding year. The Board also took into account PCM’s compliance policies and procedures and reports regarding PCM’s compliance operations from the Trust’s Chief Compliance Officer. The Board also considered any potential conflicts of interest that may arise in a portfolio manager’s management of the Fund’s investments on the one hand, and the investments of other accounts, on the other. The Trustees reviewed the services provided to the Fund by PCM and concluded that the nature, extent and quality of the services provided were appropriate and consistent with the terms of the PCM Agreement, that the quality of the services appeared to be consistent with industry norms and that the Fund is likely to benefit from the continued receipt of those services. They also concluded that PCM has sufficient personnel, with the appropriate education and experience, to serve the Fund effectively and had demonstrated their ability to attract and retain qualified personnel.
Costs. The Trustees then reviewed materials regarding the costs of the services provided by PCM, the compensation and benefits received by PCM in providing services to the Fund, as well as PCM’s profitability. The Trustees also considered the fact that PCM executes brokerage transactions on behalf of the Fund through its affiliate Carnes Capital and that related reports were provided at Board meetings throughout the year. The Trustees were provided with PCM’s most recent balance sheet and income statement for the year ended December 31, 2018. The Trustees noted that PCM’s level of profitability is an appropriate factor to consider, and the Trustees should be satisfied that PCM’s profits are sufficient to continue as a healthy concern generally and as investment adviser of the Fund specifically. The Trustees concluded that PCM’s advisory fee level was reasonable in relation to the nature and quality of the services provided, taking into account the current size and projected growth of the Fund.
Economies of Scale. The Trustees considered the extent to which economies of scale would be realized relative to fee levels as the Fund grows, and whether the advisory fee levels reflect these economies of scale for the benefit of shareholders. The Board noted that economies of scale may be achieved at higher asset levels for the Fund for the benefit of fund shareholders, and that although the advisory fee did not currently include breakpoint reductions as asset levels increase, the advisory fee was subject to a contractual expense limitation agreement.
At the Meeting, the Trustees determined to approve the continuation of the PCM Agreement for an additional one year period. In approving the continuation of the PCM Agreement, the Board considered all factors it deemed relevant and the information presented to the Board by PCM. In arriving at its decision,
28
PRIVATE CAPITAL MANAGEMENT VALUE FUND
Other Information (Concluded)
(Unaudited)
the Board did not identify any single factor as being of paramount importance and each member of the Board gave varying weights to each factor according to his or her own judgment. The Board determined that the continuation of the PCM Agreement would be in the best interests of the Fund and its shareholders.
29
[THIS PAGE INTENTIONALLY LEFT BLANK.]
[THIS PAGE INTENTIONALLY LEFT BLANK.]
Investment Adviser
Private Capital Management, LLC
8889 Pelican Bay Boulevard
Suite 500
Naples, FL 34108
Administrator
The Bank of New York Mellon
301 Bellevue Parkway
Wilmington, DE 19809
Transfer Agent
BNY Mellon Investment Servicing (US) Inc.
4400 Computer Drive
Westborough, MA 01581
Principal Underwriter
Foreside Funds Distributors LLC
400 Berwyn Park
899 Cassatt Road
Berwyn, PA 19312
Custodian
The Bank of New York Mellon
240 Greenwich Street
New York, NY 10286
Independent Registered Public Accounting Firm
PricewaterhouseCoopers LLP
Two Commerce Square, Suite 1800
2001 Market Street
Philadelphia, PA 19103-7042
Legal Counsel
Pepper Hamilton LLP
3000 Two Logan Square
18th and Arch Streets
Philadelphia, PA 19103
PRI-1019
PRIVATE CAPITAL
MANAGEMENT VALUE
FUND
of
FundVantage Trust
Class A
Class I
SEMI-ANNUAL
REPORT
October 31, 2019
(Unaudited)
IMPORTANT NOTE: Beginning on January 1, 2021, paper copies of the Private Capital Management Value Fund’s annual and semi-annual shareholder reports will no longer be sent by mail, unless you specifically request paper copies of the shareholder reports from the Private Capital Management Value Fund or from your financial intermediary.Instead,annual and semi-annual shareholder reports will be available on the Private Capital Management Value Fund’s website(www.private-cap.com), and you will be notified by mail each time a report is posted and provided with a website link to access the report.
You may elect to receive all future annual and semi-annual shareholder reports in paper, free of charge. To elect to receive paper copies of shareholder reports through the mail or otherwise change your delivery method, contact your financial intermediary or, if you hold your shares directly through the Private Capital Management Value Fund, call the Private Capital Management Value Fund toll-free at (888)568-1267 or write to the Private Capital Management Value Fund at:
Private Capital Management Value Fund
FundVantage Trust
c/o BNY Mellon Investment Servicing
P.O. Box 9829
Providence, RI 02940-8029
This report is submitted for the general information of the shareholders of the Private Capital Management Value Fund. It is not authorized for distribution unless preceded or accompanied by a current prospectus for the Private Capital Management Value Fund.
QUALITY DIVIDEND FUND
Semi-Annual Report
Performance Data
October 31, 2019
(Unaudited)
| Average Annual Total Returns for the Periods Ended October 31, 2019† |
| ||||||||||||||||||||||||||
| Six Months†† | 1 Year | 3 Years | 5 Years | Since Inception | |||||||||||||||||||||||
Class A (with sales charge) | -3.26 | % | 7.36 | % | 7.93 | % | 5.70 | % | 7.50 | % | |||||||||||||||||
Class A (without sales charge) | 2.61 | % | 13.87 | % | 10.10 | % | 6.96 | % | 8.55 | % | |||||||||||||||||
Russell 1000®Value Index | 3.07 | % | 11.21 | % | 10.51 | % | 7.61 | % | 9.67 | %* | |||||||||||||||||
Class C (with CDSC charge) | 1.29 | % | 12.14 | % | 9.29 | % | 6.17 | % | 7.76 | % | |||||||||||||||||
Class C (without CDSC charge) | 2.29 | % | 13.14 | % | 9.29 | % | 6.17 | % | 7.76 | % | |||||||||||||||||
Russell 1000®Value Index | 3.07 | % | 11.21 | % | 10.51 | % | 7.61 | % | 9.54 | %** | |||||||||||||||||
Institutional Class | 2.74 | % | 14.25 | % | 10.40 | % | N/A | 9.83 | % | ||||||||||||||||||
Russell 1000®Value Index | 3.07 | % | 11.21 | % | 10.51 | % | N/A | 10.02 | %*** | ||||||||||||||||||
| † | The Quality Dividend Fund (“the Fund”) Class A shares commenced operations on September 30, 2013; Class C shares commenced operations on October 1, 2013; Institutional Class shares commenced operations on October 4, 2016. |
| †† | Not annualized. |
| * | Benchmark performance is from the inception date of Class A shares of the Fund (September 30, 2013) only and is not the inception date of the benchmark itself. |
| ** | Benchmark performance is from the inception date of Class C shares of the Fund (October 1, 2013) only and is not the inception date of the benchmark itself. |
| *** | Benchmark performance is from the inception date of Institutional Class shares of the Fund (October 4, 2016) only and is not the inception date of the benchmark itself. |
The performance data quoted represents past performance and does not guarantee future results. The investment return and principal value of an investment in the Fund will fluctuate so that an investor’s shares, when redeemed, may be worth more or less than their original cost. The table does not reflect the deduction of taxes that a shareholder would pay on Fund distributions or redemption of Fund shares. Current performance may be lower or higher. Performance data current to the most recent month end may be obtained by calling (888)201-5799.
The returns of Class A shares reflect a deduction for the maximum front end sales charge of 5.75%. The returns shown for Class C shares reflect a maximum deferred sales charge of 1.00%.
The Fund’s “Total Annual Fund Operating Expenses” and “Total Annual Fund Operating Expenses After Fee Waiver and/or Expense Reimbursement”, as stated in the current prospectus dated September 1, 2019, are 1.42% and 1.24%, respectively, for Class A shares, 2.17% and 1.99%, respectively, for Class C shares and 1.17% and 0.99%, respectively, for Institutional Class shares of the Fund’s average daily net assets. These rates may fluctuate and may differ from the actual expenses incurred by the Fund for the period covered by this report. EquityCompass Investment Management, LLC (“EquityCompass” or the “Adviser”) has contractually agreed to reduce its investment advisory fee and/or reimburse certain expenses of the Fund to the extent necessary to ensure that the Fund’s total operating expenses (excluding taxes, fees and expenses attributable to a distribution or service plan adopted by FundVantage Trust (the “Trust”), “Acquired Fund Fees and Expenses,” dividend and interest expense on securities sold short, interest, extraordinary items and brokerage commissions) do not exceed 0.99% of average daily net assets of the Fund (the “Expense Limitation”). The Expense Limitation will remain in effect until August 31, 2020, unless the Board of Trustees (“Board of Trustees”) of the Trust approves its earlier termination. The Adviser is
1
QUALITY DIVIDEND FUND
Semi-Annual Report
Performance Data (Concluded)
October 31, 2019
(Unaudited)
entitled to recover, subject to approval by the Board of Trustees, such amounts reduced or reimbursed for a period of up to three (3) years from the date on which the Adviser reduced its compensation and/or assumed expenses for the Fund. The Adviser is permitted to seek reimbursement from the Fund, subject to certain limitations, for fees it waived and Fund expenses it paid to the extent the total annual fund operating expenses do not exceed the limits described above or any lesser limits in effect at the time of reimbursement. No recoupment will occur unless the Fund’s expenses are below the Expense Limitation amount. Total fees would be higher had such fees and expenses not been waived and/or reimbursed.
A 1.00% redemption fee applies to shares redeemed within 60 days of purchase. The redemption fee is not reflected in the returns shown above.
The Fund intends to evaluate performance as compared to those of the Russell 1000® Value Index. The Russell 1000® Value Index is an unmanaged index that measures the performance of the highest-ranking 1,000 stocks in the Russell 3000® Index, which represents about 90% of the total market capitalization of all listed U.S. stocks. It is impossible to invest directly in an index.
Mutual fund investing involves risk, including possible loss of principal. The Fund’s dividend income and distributions will fluctuate, and at times the Fund may underperform other funds that invest more broadly or that have different investment styles. Some of the assets in which the Fund may invest entail special risks. Foreign stocks may be affected by currency fluctuations, social and political instability, and lax regulatory and financial reporting standards. Master Limited Partnerships (“MLPs”) may fluctuate abruptly in value and be difficult to liquidate. Real Estate Investment Trusts (“REITs”) entail risks related to real estate, such as tenant defaults, declining occupancy rates, and falling property values due to deteriorating economic conditions. Listed REIT stocks may fluctuate erratically in market price whilenon-listed REITs may be illiquid.
2
QUALITY DIVIDEND FUND
Fund Expense Disclosure
October 31, 2019
(Unaudited)
As a shareholder of the Fund, you incur two types of costs: (1) transaction costs, including sales charges (loads) on purchase payments, if any, and redemption fees; and (2) ongoing costs, including management fees, distribution and/or service (Rule12b-1) fees, if any, and other Fund expenses. These examples are intended to help you understand your ongoing costs (in dollars) of investing in the Fund and to compare these costs with the ongoing costs of investing in other mutual funds.
These examples are based on an investment of $1,000 invested at the beginning of thesix-month period from May 1, 2019 through October 31, 2019 and held for the entire period.
Actual Expenses
The first line of each accompanying table provides information about actual account values and actual expenses. You may use the information in this line, together with the amount you invested, to estimate the expenses that you paid over the period. Simply divide your account value by $1,000 (for example, an $8,600 account value divided by $1,000 = 8.6), then multiply the result by the number in the first line under the heading entitled “Expenses Paid During Period” to estimate the expenses you paid on your account during this period.
Hypothetical Examples for Comparison Purposes
The second line of each accompanying table provides information about hypothetical account values and hypothetical expenses based on the Fund’s actual expense ratio and an assumed rate of return of 5% per year before expenses, which is not your Fund’s actual return. The hypothetical account values and expenses may not be used to estimate the actual ending account balance or expenses you paid for the period. You may use this information to compare the ongoing costs of investing in the Fund and other funds. To do so, compare these 5% hypothetical examples with the 5% hypothetical examples that appear in the shareholder reports of other funds.
Please note that the expenses shown in the accompanying table are meant to highlight your ongoing costs only and do not reflect any transactional costs, such as sales charges (loads), if any, or redemption fees. Therefore, the second line of the accompanying table is useful in comparing ongoing costs only, and will not help you determine the relative total costs of owning different funds. In addition, if these transactional costs were included, your costs would have been higher.
3
QUALITY DIVIDEND FUND
Fund Expense Disclosure (Concluded)
October 31, 2019
(Unaudited)
| Quality Dividend Fund | |||||||||||||||
| Beginning Account Value May 1, 2019 | Ending Account Value October 31, 2019 | Expenses Paid During Period* | |||||||||||||
Class A | |||||||||||||||
Actual | $ | 1,000.00 | $ | 1,026.10 | $ | 6.32 | |||||||||
Hypothetical (5% return before expenses) | 1,000.00 | 1,018.90 | 6.29 | ||||||||||||
Class C | |||||||||||||||
Actual | $ | 1,000.00 | $ | 1,022.90 | $ | 10.12 | |||||||||
Hypothetical (5% return before expenses) | 1,000.00 | 1,015.13 | 10.08 | ||||||||||||
Institutional Class | |||||||||||||||
Actual | $ | 1,000.00 | $ | 1,027.40 | $ | 5.05 | |||||||||
Hypothetical (5% return before expenses) | 1,000.00 | 1,020.16 | 5.03 | ||||||||||||
| * | Expenses are equal to an annualized expense ratio for thesix-month period ended October 31, 2019 of 1.24%, 1.99% and 0.99% for Class A, Class C and Institutional Class shares, respectively, for the Fund, multiplied by the average account value over the period, multiplied by the number of days in the most recent period (184), then divided by 366 to reflect the period. The Fund’s ending account values on the first line in the table are based on the actualsix-month total returns for the Fund of 2.61%, 2.29% and 2.74% for Class A, Class C and Institutional Class shares, respectively. |
4
QUALITY DIVIDEND FUND
Portfolio Holdings Summary Table
October 31, 2019
(Unaudited)
The following table presents a summary by sector of the portfolio holdings of the Fund:
| % of Net Assets | Value | |||||||
COMMON STOCKS: | ||||||||
Oil, Gas & Consumable Fuels | 19.0 | % | $ | 13,783,939 | ||||
REITs | 11.6 | 8,386,060 | ||||||
Electric Utilities | 8.8 | 6,367,001 | ||||||
Diversified Telecommunication Services | 8.3 | 6,012,891 | ||||||
Commercial Banks | 8.1 | 5,907,962 | ||||||
Technology Hardware, Storage & Peripherals | 4.5 | 3,283,062 | ||||||
Semiconductors & Semiconductor Equipment | 4.5 | 3,262,405 | ||||||
Beverages | 4.4 | 3,163,091 | ||||||
Household Products | 4.3 | 3,089,593 | ||||||
IT Services | 4.0 | 2,867,439 | ||||||
Health Care Providers & Services | 3.9 | 2,799,068 | ||||||
Tobacco | 3.7 | 2,664,391 | ||||||
Biotechnology | 3.6 | 2,637,480 | ||||||
Hotels, Restaurants & Leisure | 3.4 | 2,481,873 | ||||||
Pharmaceuticals | 3.4 | 2,452,610 | ||||||
Containers & Packaging | 3.3 | 2,416,509 | ||||||
Exchange Traded Fund | 0.4 | 328,763 | ||||||
Other Assets in Excess of Liabilities | 0.8 | 566,400 | ||||||
|
|
|
| |||||
NET ASSETS | 100.0 | % | $ | 72,470,537 | ||||
|
|
|
| |||||
Portfolio holdings are subject to change at any time.
The accompanying notes are an integral part of the financial statements.
5
QUALITY DIVIDEND FUND
Portfolio of Investments
October 31, 2019
(Unaudited)
| Number of Shares | Value | |||||||
COMMON STOCKS — 98.8% |
| |||||||
Beverages — 4.4% | ||||||||
Coca-Cola Co. (The) | 58,113 | $ | 3,163,091 | |||||
|
| |||||||
Biotechnology — 3.6% | ||||||||
AbbVie, Inc. | 33,155 | 2,637,480 | ||||||
|
| |||||||
Commercial Banks — 8.1% | ||||||||
SunTrust Banks, Inc. | 44,381 | 3,032,997 | ||||||
Wells Fargo & Co. | 55,684 | 2,874,965 | ||||||
|
| |||||||
| 5,907,962 | ||||||||
|
| |||||||
Containers & Packaging — 3.3% |
| |||||||
International Paper Co. | 55,323 | 2,416,509 | ||||||
|
| |||||||
Diversified Telecommunication Services — 8.3% |
| |||||||
AT&T, Inc. | 81,797 | 3,148,367 | ||||||
Verizon Communications, Inc. | 47,371 | 2,864,524 | ||||||
|
| |||||||
| 6,012,891 | ||||||||
|
| |||||||
Electric Utilities — 8.8% | ||||||||
Duke Energy Corp. | 31,419 | 2,961,555 | ||||||
Southern Co. (The) | 54,348 | 3,405,446 | ||||||
|
| |||||||
| 6,367,001 | ||||||||
|
| |||||||
Health Care Providers & Services — 3.9% |
| |||||||
Cardinal Health, Inc. | 56,604 | 2,799,068 | ||||||
|
| |||||||
Hotels, Restaurants & Leisure — 3.4% |
| |||||||
Carnival Corp. | 57,866 | 2,481,873 | ||||||
|
| |||||||
Household Products — 4.3% |
| |||||||
Kimberly-Clark Corp. | 23,251 | 3,089,593 | ||||||
|
| |||||||
IT Services — 4.0% | ||||||||
International Business Machines Corp. | 21,442 | 2,867,439 | ||||||
|
| |||||||
Oil, Gas & Consumable Fuels — 19.0% |
| |||||||
Chevron Corp. | 21,602 | 2,508,856 | ||||||
Enbridge, Inc. (Canada) | 74,780 | 2,722,740 | ||||||
ONEOK, Inc. | 42,297 | 2,953,599 | ||||||
| Number of Shares | Value | |||||||
COMMON STOCKS — (Continued) |
| |||||||
Oil, Gas & Consumable Fuels — (Continued) |
| |||||||
Valero Energy Corp. | 34,411 | $ | 3,337,179 | |||||
Williams Cos, Inc. (The) | 101,370 | 2,261,565 | ||||||
|
| |||||||
| 13,783,939 | ||||||||
|
| |||||||
Pharmaceuticals — 3.4% | ||||||||
Pfizer, Inc. | 63,920 | 2,452,610 | ||||||
|
| |||||||
REITs — 11.6% | ||||||||
Digital Realty Trust, Inc. | 24,736 | 3,142,461 | ||||||
Iron Mountain, Inc. | 84,705 | 2,778,324 | ||||||
Simon Property Group, Inc. | 16,361 | 2,465,275 | ||||||
|
| |||||||
| 8,386,060 | ||||||||
|
| |||||||
Semiconductors & Semiconductor Equipment — 4.5% |
| |||||||
QUALCOMM, Inc. | 40,557 | 3,262,405 | ||||||
|
| |||||||
Technology Hardware, Storage & Peripherals — 4.5% |
| |||||||
NetApp, Inc. | 58,752 | 3,283,062 | ||||||
|
| |||||||
Tobacco — 3.7% | ||||||||
Philip Morris International, Inc. | 32,716 | 2,664,391 | ||||||
|
| |||||||
TOTAL COMMON STOCKS (Cost $62,754,306) |
| 71,575,374 | ||||||
|
| |||||||
The accompanying notes are an integral part of the financial statements.
6
QUALITY DIVIDEND FUND
Portfolio of Investments (Concluded)
October 31, 2019
(Unaudited)
| Number of Shares | Value | |||||||
EXCHANGE TRADED FUND — 0.4% |
| |||||||
SPDR S&P Dividend ETF | 3,153 | $ | 328,763 | |||||
|
| |||||||
TOTAL EXCHANGE TRADED FUND (Cost $267,565) | 328,763 | |||||||
|
| |||||||
TOTAL INVESTMENTS - 99.2% (Cost $63,021,871) | 71,904,137 | |||||||
OTHER ASSETS IN EXCESS OF LIABILITIES - 0.8% | 566,400 | |||||||
|
| |||||||
NET ASSETS - 100.0% | $ | 72,470,537 | ||||||
|
| |||||||
REIT Real Estate Investment Trust
SPDR Standard & Poor’s Depository Receipt
The accompanying notes are an integral part of the financial statements.
7
QUALITY DIVIDEND FUND
Statement of Assets and Liabilities
October 31, 2019
(Unaudited)
Assets | ||||
Investments, at value (Cost $63,021,871) | $ | 71,904,137 | ||
Cash | 544,112 | |||
Receivable for capital shares sold | 96,997 | |||
Dividends receivable | 106,325 | |||
Prepaid expenses and other assets | 36,309 | |||
|
| |||
Total assets | 72,687,880 | |||
|
| |||
Liabilities | ||||
Payable for capital shares redeemed | 89,428 | |||
Payable to Investment Adviser | 29,805 | |||
Payable for distribution fees | 22,592 | |||
Payable for administration and accounting fees | 16,379 | |||
Payable for transfer agent fees | 16,067 | |||
Payable for audit fees | 13,963 | |||
Payable for legal fees | 13,562 | |||
Payable for printing fees | 6,406 | |||
Payable for shareholder servicing fees | 4,985 | |||
Payable for custodian fees | 2,349 | |||
Accrued expenses | 1,807 | |||
|
| |||
Total liabilities | 217,343 | |||
|
| |||
Net Assets | $ | 72,470,537 | ||
|
| |||
Net Assets consisted of: | ||||
Capital stock, $0.01 par value | $ | 54,942 | ||
Paid-in capital | 59,514,405 | |||
Total distributable earnings | 12,901,190 | |||
|
| |||
Net Assets | $ | 72,470,537 | ||
|
| |||
Class A: | ||||
Net asset value and redemption price per share ($36,334,678 / 2,758,523 shares) | $13.17 | |||
|
| |||
Maximum offering price per share (100/94.25 of $13.17) | $13.97 | |||
|
| |||
Class C: | ||||
Net asset value, offering and redemption price per share ($23,790,603 / 1,798,804 shares) | $13.23 | |||
|
| |||
Institutional Class: | ||||
Net asset value, offering and redemption price per share ($12,345,256 / 936,849 shares) | $13.18 | |||
|
| |||
The accompanying notes are an integral part of the financial statements.
8
QUALITY DIVIDEND FUND
Statement of Operations
For the Six Months Ended October 31, 2019
(Unaudited)
Investment income | ||||
Dividends | $ | 1,519,364 | ||
Less: foreign taxes withheld | (12,644 | ) | ||
|
| |||
Total investment income | 1,506,720 | |||
|
| |||
Expenses | ||||
Advisory fees (Note 2) | 214,896 | |||
Distribution fees (Class C) (Note 2) | 87,901 | |||
Transfer agent fees (Note 2) | 47,182 | |||
Distribution fees (Class A) (Note 2) | 46,397 | |||
Administration and accounting fees (Note 2) | 32,603 | |||
Shareholder servicing fees (Class C) | 29,301 | |||
Registration and filing fees | 27,700 | |||
Legal fees | 22,142 | |||
Trustees’ and officers’ fees (Note 2) | 19,877 | |||
Audit fees | 14,651 | |||
Printing and shareholder reporting fees | 11,228 | |||
Custodian fees (Note 2) | 9,393 | |||
Other expenses | 5,468 | |||
|
| |||
Total expenses before waivers and reimbursements | 568,739 | |||
|
| |||
Less: waivers and reimbursements (Note 2) | (50,562 | ) | ||
|
| |||
Net expenses after waivers and reimbursements | 518,177 | |||
|
| |||
Net investment income | 988,543 | |||
|
| |||
Net realized and unrealized gain from investments: | ||||
Net realized gain from investments | 2,908,272 | |||
Net change in unrealized appreciation/(depreciation) on investments | (2,175,082 | ) | ||
|
| |||
Net realized and unrealized gain on investments | 733,190 | |||
|
| |||
Net increase in net assets resulting from operations | $ | 1,721,733 | ||
|
|
The accompanying notes are an integral part of the financial statements.
9
QUALITY DIVIDEND FUND
Statements of Changes in Net Assets
| For the Six Months Ended October 31, 2019 (Unaudited) | For the Year Ended April 30, 2019 | |||||||||
Increase/(decrease) in net assets from operations: | ||||||||||
Net investment income | $ | 988,543 | $ | 1,732,533 | ||||||
Net realized gain from investments | 2,908,272 | 1,588,090 | ||||||||
Net change in unrealized appreciation/(depreciation) on investments | (2,175,082 | ) | 6,323,031 | |||||||
|
|
|
| |||||||
Net increase in net assets resulting from operations | 1,721,733 | 9,643,654 | ||||||||
|
|
|
| |||||||
Less dividends and distributions to shareholders from: | ||||||||||
Total distributable earnings | ||||||||||
Class A | (519,003 | ) | (2,894,783 | ) | ||||||
Class C | (246,015 | ) | (1,585,083 | ) | ||||||
Institutional Class | (176,380 | ) | (734,246 | ) | ||||||
|
|
|
| |||||||
Net decrease in net assets from dividends and distributions to shareholders | (941,398 | ) | (5,214,112 | ) | ||||||
|
|
|
| |||||||
Increase/(decrease) in net assets derived from capital share transactions (Note 4) | (3,480,797 | ) | 206,093 | |||||||
|
|
|
| |||||||
Total increase/(decrease) in net assets | (2,700,462 | ) | 4,635,635 | |||||||
|
|
|
| |||||||
Net assets | ||||||||||
Beginning of period | 75,170,999 | 70,535,364 | ||||||||
|
|
|
| |||||||
End of period | $ | 72,470,537 | $ | 75,170,999 | ||||||
|
|
|
| |||||||
The accompanying notes are an integral part of the financial statements.
10
QUALITY DIVIDEND FUND
Financial Highlights
Contained below is per share operating performance data for each Class A share outstanding, total investment return, ratios to average net assets and other supplemental data for the respective period. The total returns in the table represent the rate that an investor would have earned or lost on an investment in the Fund (assuming reinvestment of all dividends and distributions). This information has been derived from information provided in the financial statements and should be read in conjunction with the financial statements and the notes thereto. |
| Class A | |||||||||||||||||||||||||||||||||||
| For the Six Months Ended October 31, 2019 (Unaudited) | For the Year Ended April 30, 2019 | For the Year Ended April 30, 2018 | For the Year Ended April 30, 2017 | For the Year Ended April 30, 2016 | For the Year Ended April 30, 2015 | ||||||||||||||||||||||||||||||
Per Share Operating Performance | |||||||||||||||||||||||||||||||||||
Net asset value, beginning of period | $ | 13.02 | $ | 12.29 | $ | 12.19 | $ | 11.03 | $ | 11.66 | $ | 11.02 | |||||||||||||||||||||||
|
|
|
|
|
|
|
|
|
|
|
| ||||||||||||||||||||||||
Net investment income(1) | 0.19 | 0.33 | 0.29 | 0.27 | 0.26 | 0.27 | |||||||||||||||||||||||||||||
Net realized and unrealized gain/(loss) on investments | 0.15 | 1.36 | 0.16 | 1.13 | (0.49 | ) | 0.79 | ||||||||||||||||||||||||||||
|
|
|
|
|
|
|
|
|
|
|
| ||||||||||||||||||||||||
Net increase/(decrease) in net assets resulting from operations | 0.34 | 1.69 | 0.45 | 1.40 | (0.23 | ) | 1.06 | ||||||||||||||||||||||||||||
|
|
|
|
|
|
|
|
|
|
|
| ||||||||||||||||||||||||
Dividends and distributions to shareholders from: | |||||||||||||||||||||||||||||||||||
Net investment income | (0.19 | ) | (0.38 | ) | (0.35 | ) | (0.24 | ) | (0.26 | ) | (0.28 | ) | |||||||||||||||||||||||
Net realized capital gains | — | (0.58 | ) | — | — | (0.14 | ) | (0.14 | ) | ||||||||||||||||||||||||||
|
|
|
|
|
|
|
|
|
|
|
| ||||||||||||||||||||||||
Total dividends and distributions to shareholders | (0.19 | ) | (0.96 | ) | (0.35 | ) | (0.24 | ) | (0.40 | ) | (0.42 | ) | |||||||||||||||||||||||
|
|
|
|
|
|
|
|
|
|
|
| ||||||||||||||||||||||||
Redemption fees | — | (2) | — | (2) | — | (2) | — | (2) | — | (2) | — | (2) | |||||||||||||||||||||||
|
|
|
|
|
|
|
|
|
|
|
| ||||||||||||||||||||||||
Net asset value, end of period | $ | 13.17 | $ | 13.02 | $ | 12.29 | $ | 12.19 | $ | 11.03 | $ | 11.66 | |||||||||||||||||||||||
|
|
|
|
|
|
|
|
|
|
|
| ||||||||||||||||||||||||
Total investment return(3) | 2.61 | % | 14.66 | % | 3.64 | % | 12.82 | % | (1.84 | )% | 9.65 | % | |||||||||||||||||||||||
Ratios/Supplemental Data | |||||||||||||||||||||||||||||||||||
Net assets, end of period (in thousands) | $ | 36,335 | $ | 40,283 | $ | 37,800 | $ | 36,731 | $ | 35,607 | $ | 35,629 | |||||||||||||||||||||||
Ratio of expenses to average net assets | 1.24 | %(4) | 1.24 | % | 1.24 | % | 1.24 | % | 1.24 | % | 1.24 | % | |||||||||||||||||||||||
Ratio of expenses to average net assets without waivers and expense reimbursements(5) | 1.38 | %(4) | 1.41 | % | 1.32 | % | 1.35 | % | 1.37 | % | 1.62 | % | |||||||||||||||||||||||
Ratio of net investment income to average net assets | 2.97 | %(4) | 2.62 | % | 2.32 | % | 2.35 | % | 2.40 | % | 2.33 | % | |||||||||||||||||||||||
Portfolio turnover rate | 13 | %(6) | 37 | % | 51 | % | 44 | % | 63 | % | 68 | % | |||||||||||||||||||||||
| (1) | The selected per share data was calculated using the average shares outstanding method for the period. |
| (2) | Amount is less than $0.005 per share. |
| (3) | Total investment return is calculated assuming a purchase of shares on the first day and a sale of shares on the last day of each period reported and includes reinvestment of dividends and distributions, if any. Total returns for periods less than one year are not annualized. |
Total investment return does not reflect the impact of the maximumfront-end sales load of 5.75%. If reflected, the return would be lower.
| (4) | Annualized. |
| (5) | During the period, certain fees were waived and/or reimbursed. If such fee waivers and/or reimbursements had not occurred, the ratios would have been as indicated (See Note 2). |
| (6) | Not annualized. |
The accompanying notes are an integral part of the financial statements.
11
QUALITY DIVIDEND FUND
Financial Highlights (Continued)
Contained below is per share operating performance data for each Class C share outstanding, total investment return, ratios to average net assets and other supplemental data for the respective period. The total returns in the table represent the rate that an investor would have earned or lost on an investment in the Fund (assuming reinvestment of all dividends and distributions). This information has been derived from information provided in the financial statements and should be read in conjunction with the financial statements and the notes thereto. |
| Class C | |||||||||||||||||||||||||||||||||||
| For the Six Months Ended October 31, 2019 (Unaudited) | For the Year Ended April 30, 2019 | For the Year Ended April 30, 2018 | For the Year Ended April 30, 2017 | For the Year Ended April 30, 2016 | For the Year Ended April 30, 2015 | ||||||||||||||||||||||||||||||
Per Share Operating Performance | |||||||||||||||||||||||||||||||||||
Net asset value, beginning of period | $ | 13.07 | $ | 12.34 | $ | 12.24 | $ | 11.06 | $ | 11.73 | $ | 11.02 | |||||||||||||||||||||||
|
|
|
|
|
|
|
|
|
|
|
| ||||||||||||||||||||||||
Net investment income(1) | 0.14 | 0.24 | 0.20 | 0.18 | 0.18 | 0.18 | |||||||||||||||||||||||||||||
Net realized and unrealized gain/(loss) on investments | 0.16 | 1.36 | 0.15 | 1.15 | (0.51 | ) | 0.80 | ||||||||||||||||||||||||||||
|
|
|
|
|
|
|
|
|
|
|
| ||||||||||||||||||||||||
Net increase/(decrease) in net assets resulting from operations | 0.30 | 1.60 | 0.35 | 1.33 | (0.33 | ) | 0.98 | ||||||||||||||||||||||||||||
|
|
|
|
|
|
|
|
|
|
|
| ||||||||||||||||||||||||
Dividends and distributions to shareholders from: | |||||||||||||||||||||||||||||||||||
Net investment income | (0.14 | ) | (0.29 | ) | (0.25 | ) | (0.15 | ) | (0.20 | ) | (0.13 | ) | |||||||||||||||||||||||
Net realized capital gains | — | (0.58 | ) | — | — | (0.14 | ) | (0.14 | ) | ||||||||||||||||||||||||||
|
|
|
|
|
|
|
|
|
|
|
| ||||||||||||||||||||||||
Total dividends and distributions to shareholders | (0.14 | ) | (0.87 | ) | (0.25 | ) | (0.15 | ) | (0.34 | ) | (0.27 | ) | |||||||||||||||||||||||
|
|
|
|
|
|
|
|
|
|
|
| ||||||||||||||||||||||||
Redemption fees | — | (2) | — | (2) | — | (2) | — | (2) | — | (2) | — | (2) | |||||||||||||||||||||||
|
|
|
|
|
|
|
|
|
|
|
| ||||||||||||||||||||||||
Net asset value, end of period | $ | 13.23 | $ | 13.07 | $ | 12.34 | $ | 12.24 | $ | 11.06 | $ | 11.73 | |||||||||||||||||||||||
|
|
|
|
|
|
|
|
|
|
|
| ||||||||||||||||||||||||
Total investment return(3) | 2.29 | % | 13.73 | % | 2.84 | % | 12.07 | % | (2.65 | )% | 8.91 | % | |||||||||||||||||||||||
Ratios/Supplemental Data | |||||||||||||||||||||||||||||||||||
Net assets, end of period (in thousands) | $ | 23,791 | $ | 24,326 | $ | 23,728 | $ | 26,247 | $ | 23,217 | $ | 20,820 | |||||||||||||||||||||||
Ratio of expenses to average net assets | 1.99 | %(4) | 1.99 | % | 1.99 | % | 1.99 | % | 1.99 | % | 1.99 | % | |||||||||||||||||||||||
Ratio of expenses to average net assets without waivers and expense reimbursements(5) | 2.13 | %(4) | 2.16 | % | 2.06 | % | 2.10 | % | 2.12 | % | 2.35 | % | |||||||||||||||||||||||
Ratio of net investment income to average net assets | 2.22 | %(4) | 1.87 | % | 1.57 | % | 1.58 | % | 1.65 | % | 1.58 | % | |||||||||||||||||||||||
Portfolio turnover rate | 13 | %(6) | 37 | % | 51 | % | 44 | % | 63 | % | 68 | % | |||||||||||||||||||||||
| (1) | The selected per share data was calculated using the average shares outstanding method for the period. |
| (2) | Amount is less than $0.005 per share. |
| (3) | Total investment return is calculated assuming a purchase of shares on the first day and a sale of shares on the last day of each period reported and includes reinvestment of dividends and distributions, if any. Total returns for periods less than one year are not annualized. |
| (4) | Annualized. |
| (5) | During the period, certain fees were waived and/or reimbursed. If such fee waivers and/or reimbursements had not occurred, the ratios would have been as indicated (See Note 2). |
| (6) | Not annualized. |
The accompanying notes are an integral part of the financial statements.
12
QUALITY DIVIDEND FUND
Financial Highlights (Concluded)
Contained below is per share operating performance data for each Institutional Class share outstanding, total investment return, ratios to average net assets and other supplemental data for the respective period. The total returns in the table represent the rate that an investor would have earned or lost on an investment in the Fund (assuming reinvestment of all dividends and distributions). This information has been derived from information provided in the financial statements and should be read in conjunction with the financial statements and the notes thereto.
| Institutional Class | ||||||||||||||||||||
| For the Six Months Ended October 31, 2019 (Unaudited) | For the Year Ended April 30, 2019 | For the Year Ended April 30, 2018 | For the Period October 4, 2016* to April 30, 2017 | |||||||||||||||||
Per Share Operating Performance | ||||||||||||||||||||
Net asset value, beginning of period | $ | 13.03 | $ | 12.30 | $ | 12.20 | $ | 11.33 | ||||||||||||
|
|
|
|
|
|
|
| |||||||||||||
Net investment income(1) | 0.21 | 0.36 | 0.32 | 0.16 | ||||||||||||||||
Net realized and unrealized gain on investments | 0.14 | 1.36 | 0.16 | 0.83 | ||||||||||||||||
|
|
|
|
|
|
|
| |||||||||||||
Net increase in net assets resulting from operations | 0.35 | 1.72 | 0.48 | 0.99 | ||||||||||||||||
|
|
|
|
|
|
|
| |||||||||||||
Dividends and distributions to shareholders from: | ||||||||||||||||||||
Net investment income | (0.20 | ) | (0.41 | ) | (0.38 | ) | (0.12 | ) | ||||||||||||
Net realized capital gains | — | (0.58 | ) | — | — | |||||||||||||||
|
|
|
|
|
|
|
| |||||||||||||
Total dividends and distributions to shareholders | (0.20 | ) | (0.99 | ) | (0.38 | ) | (0.12 | ) | ||||||||||||
|
|
|
|
|
|
|
| |||||||||||||
Redemption fees | — | (2) | — | (2) | — | (2) | — | (2) | ||||||||||||
|
|
|
|
|
|
|
| |||||||||||||
Net asset value, end of period | $ | 13.18 | $ | 13.03 | $ | 12.30 | $ | 12.20 | ||||||||||||
|
|
|
|
|
|
|
| |||||||||||||
Total investment return(3) | 2.74 | % | 14.94 | % | 3.89 | % | 8.72 | % | ||||||||||||
Ratios/Supplemental Data | ||||||||||||||||||||
Net assets, end of period (in thousands) | $ | 12,345 | $ | 10,562 | $ | 9,007 | $ | 8,731 | ||||||||||||
Ratio of expenses to average net assets | 0.99 | %(4) | 0.99 | % | 0.99 | % | 0.99 | %(4) | ||||||||||||
Ratio of expenses to average net assets without waivers and expense reimbursements(5) | 1.13 | %(4) | 1.17 | % | 1.07 | % | 1.12 | %(4) | ||||||||||||
Ratio of net investment income to average net assets | 3.22 | %(4) | 2.87 | % | 2.57 | % | 2.29 | %(4) | ||||||||||||
Portfolio turnover rate | 13 | %(6) | 37 | % | 51 | % | 44 | %(7) | ||||||||||||
| * | Commencement of operations. |
| (1) | The selected per share data was calculated using the average shares outstanding method for the period. |
| (2) | Amount is less than $0.005 per share. |
| (3) | Total investment return is calculated assuming a purchase of shares on the first day and a sale of shares on the last day of each period reported and includes reinvestment of dividends and distributions, if any. Total returns for periods less than one year are not annualized. |
| (4) | Annualized. |
| (5) | During the period, certain fees were waived and/or reimbursed. If such fee waivers and/or reimbursements had not occurred, the ratios would have been as indicated (See Note 2). |
| (6) | Not annualized. |
| (7) | Reflects portfolio turnover of the Fund for the year ended April 30, 2017. |
The accompanying notes are an integral part of the financial statements.
13
QUALITY DIVIDEND FUND
Notes to Financial Statements
October 31, 2019
(Unaudited)
1. Organization and Significant Accounting Policies
The Quality Dividend Fund (the “Fund”) is a diversified,open-end management investment company registered under the Investment Company Act of 1940, as amended, (the “1940 Act”), which commenced investment operations on September 30, 2013. The Fund is a separate series of FundVantage Trust (the “Trust”) which was organized as a Delaware statutory trust on August 28, 2006. The Trust is a “series trust” authorized to issue an unlimited number of separate series or classes of shares of beneficial interest. Each series is treated as a separate entity for certain matters under the 1940 Act, and for other purposes, and a shareholder of one series is not deemed to be a shareholder of any other series. The Fund offers separate classes of shares; Class A, Class C and Institutional Class shares. Class A shares are subject to a front end sales charge.Front-end sales charges may be reduced or waived under certain circumstances. A contingent deferred sales charge (“CDSC”), as a percentage of the lower of the original purchase price or net asset value at redemption, of 1.00% may be imposed on full or partial redemptions of Class A shares made within twelve months of purchase where: (i) $1 million or more of Class A shares was purchased without an initial sales charge, and (ii) the selling broker-dealer received a commission for such sale. A CDSC of 1% may apply to Class C shares when shares are redeemed within 12 months after initial purchase where the selling broker-dealer received a commission for such sale.
The Fund is an investment company and follows accounting and reporting guidance in the Financial Accounting Standards Board Accounting Standards Codification Topic 946.
Portfolio Valuation— The Fund’s net asset value (“NAV”) is calculated once daily at the close of regular trading hours on the New York Stock Exchange (“NYSE”) (typically 4:00 p.m. Eastern time) on each day the NYSE is open. Securities held by the Fund are valued using the closing price or the last sale price on a national securities exchange or the National Association of Securities Dealers Automatic Quotation System (“NASDAQ”) market system where they are primarily traded. Equity securities traded in theover-the-counter (“OTC”) market are valued at their closing prices. If there were no transactions on that day, securities traded principally on an exchange or on NASDAQ will be valued at the mean of the last bid and ask prices prior to the market close. Investments in otheropen-end investment companies are valued based on the NAV of the investment companies (which may use fair value pricing as discussed in their prospectuses). If market quotations are unavailable or deemed unreliable, securities will be valued in accordance with procedures adopted by the Trust’s Board of Trustees (“Board of Trustees”). Relying on prices supplied by pricing services or dealers or using fair valuation may result in values that are higher or lower than the values used by other investment companies and investors to price the same investments. In the event that market quotes are not readily available, and the security or asset cannot be valued pursuant to one of the valuation methods, the value of the security or asset will be determined in good faith by the Adviser. The Trust has established a Valuation Committee which performs certain functions including the oversight of the Adviser’s fair valuation determinations.
14
QUALITY DIVIDEND FUND
Notes to Financial Statements (Continued)
October 31, 2019
(Unaudited)
Fair Value Measurements— The inputs and valuation techniques used to measure fair value of the Fund’s investments are summarized into three levels as described in the hierarchy below:
| · Level 1 — | quoted prices in active markets for identical securities; | |
| · Level 2 — | other significant observable inputs (including quoted prices for similar securities, interest rates, prepayment speeds, credit risk, etc.); and | |
| · Level 3 — | significant unobservable inputs (including the Fund’s own assumptions in determining the fair value of investments). | |
The inputs or methodology used for valuing securities are not necessarily an indication of the risk associated with investing in those securities.
The following is a summary of the inputs used, as of October 31, 2019, in valuing the Fund’s investments carried at fair value:
| Total Value at 10/31/19 | Level 1 Quoted Price | Level 2 Other Significant Observable Inputs | Level 3 Significant Unobservable Inputs | |||||||||||||
Common Stocks* | $ | 71,575,374 | $ | 71,575,374 | $ | — | $ | — | ||||||||
Exchange Traded Fund | 328,763 | 328,763 | — | — | ||||||||||||
|
|
|
|
|
|
|
| |||||||||
Total Investments | $ | 71,904,137 | $ | 71,904,137 | $ | — | $ | — | ||||||||
|
|
|
|
|
|
|
| |||||||||
| * | Please refer to Portfolio of Investments for further details on portfolio holdings. |
At the end of each quarter, management evaluates the classification of Levels 1, 2 and 3 assets and liabilities. Various factors are considered, such as changes in liquidity from the prior reporting period; whether or not a broker is willing to execute at the quoted price; the depth and consistency of prices from third party pricing services; and the existence of contemporaneous, observable trades in the market. Additionally, management evaluates the classification of Level 1 and Level 2 assets and liabilities on a quarterly basis for changes in listings or delistings on national exchanges.
Due to the inherent uncertainty of determining the fair value of investments that do not have a readily available market value, the fair value of the Fund’s investments may fluctuate from period to period. Additionally, the fair value of investments may differ significantly from the values that would have been used had a ready market existed for such investments and may differ materially from the values the Fund may ultimately realize. Further, such investments may be subject to legal and other restrictions on resale or otherwise less liquid than publicly traded securities.
15
QUALITY DIVIDEND FUND
Notes to Financial Statements (Continued)
October 31, 2019
(Unaudited)
For fair valuations using significant unobservable inputs, U.S. generally accepted accounting principles (“U.S. GAAP”) require the Fund to present a reconciliation of the beginning to ending balances for reported market values that present changes attributable to total realized and unrealized gains or losses, purchase and sales, and transfers in and out of Level 3 during the period. A reconciliation of Level 3 investments is presented only when the Fund had an amount of Level 3 investments at the end of the reporting period that was meaningful in relation to its net assets. The amounts and reasons for all transfers in and out of each Level within the three-tier hierarchy are disclosed when the Fund had an amount of total transfers during the reporting period that was meaningful in relation to its net assets as of the end of the reporting period.
For the six months ended October 31, 2019, there were no transfers in or out of Level 3.
Use of Estimates— The preparation of financial statements in conformity with U.S. GAAP requires management to make estimates and assumptions that affect the amounts reported in the financial statements and accompanying notes at the date of the financial statements and the reported amounts of revenues and expenses during the period. Actual results could differ from those estimates and those differences could be material.
Investment Transactions, Investment Income and Expenses— Investment transactions are recorded on trade date for financial statement preparation purposes. Realized gains and losses on investments sold are recorded on the identified cost basis. Interest income is recorded on the accrual basis. Dividends are recorded on theex-dividend date. Estimated components of distributions received from real estate investment trusts may be considered income, return of capital distributions or capital gain distributions. Return of capital distributions are recorded as a reduction of cost of the related investments. Distribution(12b-1) fees and shareholder services fees relating to a specific class are charged directly to that class. Fund level expenses common to all classes, investment income and realized and unrealized gains and losses on investments are allocated to each class based upon relative daily net assets of each class. General expenses of the Trust are generally allocated to each fund in proportion to its relative daily net assets. Expenses directly attributable to a particular fund in the Trust are charged directly to that fund.
MLP Common Units— Master Limited Partnership (“MLP”) common units represent limited partnership interests in the MLP. Common units are generally listed and traded on the U.S. securities exchanges or OTC with their value fluctuating predominantly based on the success of the MLP. Unlike owners of common stock of a corporation, owners of MLP common units have limited voting rights and have no ability to annually elect directors. MLPs generally distribute all available cash flow (cash flow from operations less maintenance capital expenditures) in the form of quarterly distributions. Common unit holders have first priority to receive quarterly cash distributions up to the minimum quarterly distribution and have arrearage rights. In the event of liquidation, common unit holders have preference over subordinated units, but not debt holders or preferred unit holders, to remaining assets of the MLP.
16
QUALITY DIVIDEND FUND
Notes to Financial Statements (Continued)
October 31, 2019
(Unaudited)
Dividends and Distributions to Shareholders— Dividends from net investment income and distributions from net realized capital gains, if any, are declared, recorded onex-date and paid at least annually to shareholders. Income dividends and capital gain distributions are determined in accordance with U.S. federal income tax regulations, which may differ from U.S. GAAP.
U.S. Tax Status— No provision is made for U.S. income taxes as it is the Fund’s intention to continue to qualify for and elect the tax treatment applicable to regulated investment companies under Subchapter M of the Internal Revenue Code of 1986, as amended (the “Internal Revenue Code”), and make the requisite distributions to its shareholders which will be sufficient to relieve it from U.S. income and excise taxes.
Other— In the normal course of business, the Fund may enter into contracts that provide general indemnifications. The Fund’s maximum exposure under these arrangements is dependent on claims that may be made against the Fund in the future, and therefore, cannot be estimated; however, based on experience, the risk of material loss for such claims is considered remote.
Recent Regulatory Reporting Update and Accounting Pronouncement— In August 2018, the Financial Accounting Standards Board issued an Accounting Standards Update, ASU2018-13, Fair Value Measurement (Topic 820), Disclosure Framework – Changes to the Disclosure Requirements for Fair Value Measurement (the “2018 ASU”) which adds, modifies and removes disclosure requirements related to certain aspects of fair value measurement. The 2018 ASU is effective for fiscal years, and interim periods within those fiscal years, beginning after December 15, 2019. Early adoption is permitted. As of October 31, 2019, the Fund has fully adopted the provisions of the 2018 ASU, which did not have a material impact on the Fund’s financial statements and related disclosures or impact the Fund’s net assets or results of operations.
2. Transactions with Related Parties and Other Service Providers
EquityCompass Investment Management, LLC (“EquityCompass” or the “Adviser”), serves as investment adviser to the Fund pursuant to an investment advisory agreement with the Trust. For its services, the Adviser is paid a monthly fee at the annual rate of 0.60% of the Fund’s average daily net assets. The Adviser has contractually agreed to reduce its investment advisory fee and/or reimburse certain expenses of the Fund to the extent necessary to ensure that the Fund’s total operating expenses (excluding taxes, fees and expenses attributable to a distribution or service plan adopted by the Trust, “Acquired Fund Fees and Expenses,” dividend and interest expense on securities sold short, interest, extraordinary items and brokerage commissions) do not exceed 0.99% of average daily net assets of the Fund (the “Expense Limitation”). The Expense Limitation will remain in effect until August 31, 2020 unless the Board of Trustees of the Trust approves its earlier termination. The Adviser is entitled to recover, subject to approval by the Board of Trustees, such amounts reduced or reimbursed for a period of up to three (3) years from the date on which the Adviser reduced its compensation and/or assumed expenses for the Fund. The Adviser
17
QUALITY DIVIDEND FUND
Notes to Financial Statements (Continued)
October 31, 2019
(Unaudited)
is permitted to seek reimbursement from the Fund, subject to certain limitations, for fees it waived and Fund expenses it paid to the extent the total annual fund expenses do not exceed the limits described above or any lesser limits in effect at the time of reimbursement. No recoupment will occur unless the Fund’s expenses are below the Expense Limitation amount. As of October 31, 2019, the amount of potential recovery was as follows:
| Expiration | ||||||||
April 30, 2020 | April 30, 2021 | April 30, 2022 | October 31, 2022 | Total | ||||
| $41,143 | $55,487 | $125,818 | $50,562 | $273,010 | ||||
For the six months ended October 31, 2019, the Adviser earned advisory fees of $214,896 and waived fees of $50,562.
Other Service Providers
The Bank of New York Mellon (“BNY Mellon”) serves as administrator and custodian for the Fund. For providing administrative and accounting services, BNY Mellon is entitled to receive a monthly fee equal to an annual percentage rate of the Fund’s average daily net assets and is subject to certain minimum monthly fees. For providing certain custodial services, BNY Mellon is entitled to receive a monthly fee, subject to certain minimum, and out of pocket expenses.
BNY Mellon Investment Servicing (US) Inc. (the “Transfer Agent”) provides transfer agent services to the Fund. The Transfer Agent is entitled to receive a monthly fee, subject to certain minimum, and out of pocket expenses.
The Trust, on behalf of the Fund, has entered into agreements with financial intermediaries to provide recordkeeping, processing, shareholder communications and other services to customers of the intermediaries investing in the Fund and has agreed to compensate the intermediaries for providing those services. The fees incurred by the Fund for these services are included in Transfer agent fees in the Statement of Operations.
Foreside Funds Distributors LLC (the “Underwriter”) provides principal underwriting services to the Fund pursuant to an underwriting agreement between the Trust and the Underwriter.
The Trust and the Underwriter are parties to an underwriting agreement. The Trust has adopted a distribution plan for Class A and Class C shares in accordance with Rule12b-1 under the 1940 Act. Pursuant to the Class A and Class C shares plan, the Fund compensates the Underwriter for direct and indirect costs and expenses incurred in connection with advertising, marketing and other distribution services in an amount not to exceed 0.25% and 1.00% (0.75% Rule12b-1 distribution fee and 0.25% shareholder
18
QUALITY DIVIDEND FUND
Notes to Financial Statements (Continued)
October 31, 2019
(Unaudited)
service fee), respectively, on an annualized basis of the average daily net assets of the Fund’s Class A and Class C shares.
Trustees and Officers
The Trust is governed by its Board of Trustees. The Trustees receive compensation in the form of an annual retainer and per meeting fees for their services to the Trust. The remuneration paid to the Trustees by the Fund during the six months ended October 31, 2019 was $4,128. An employee of BNY Mellon serves as the Secretary of the Trust and is not compensated by the Fund or the Trust.
JW Fund Management LLC (“JWFM”) provides a Principal Executive Officer and Principal Financial Officer, respectively, to the Trust. Duff & Phelps, LLC (“D&P”) provides the Trust with a Chief Compliance Officer and an Anti-Money Laundering Officer. JWFM and D&P are compensated for their services provided to the Trust.
3. Investment in Securities
For the six months ended October 31, 2019, aggregate purchases and sales of investment securities (excluding short-term investments) of the Fund were as follows:
| Purchases | Sales | |||||||
Investment Securities | $ | 9,417,017 | $ | 12,989,062 | ||||
19
QUALITY DIVIDEND FUND
Notes to Financial Statements (Continued)
October 31, 2019
(Unaudited)
4. Capital Share Transactions
For the six months ended October 31, 2019 and the year ended April 30, 2019, transactions in capital shares (authorized shares unlimited) were as follows:
| For the Six Months Ended October 31, 2019 (Unaudited) | For the Year Ended April 30, 2019 | |||||||||||||||
Shares | Amount | Shares | Amount | |||||||||||||
Class A | ||||||||||||||||
Sales | 103,404 | $ | 1,316,717 | 317,608 | $ | 4,002,713 | ||||||||||
Reinvestments | 30,567 | 394,626 | 182,887 | 2,186,047 | ||||||||||||
Redemption Fees* | — | 5 | — | 502 | ||||||||||||
Redemptions | (469,698 | ) | (6,011,172 | ) | (480,869 | ) | (6,041,107 | ) | ||||||||
|
|
|
|
|
|
|
| |||||||||
Net increase | (335,727 | ) | $ | (4,299,824 | ) | 19,626 | $ | 148,155 | ||||||||
|
|
|
|
|
|
|
| |||||||||
Class C | ||||||||||||||||
Sales | 88,483 | $ | 1,139,665 | 153,614 | $ | 1,944,213 | ||||||||||
Reinvestments | 15,518 | 201,357 | 113,038 | 1,350,775 | ||||||||||||
Redemption Fees* | — | 3 | — | 303 | ||||||||||||
Redemptions | (166,060 | ) | (2,129,265 | ) | (328,701 | ) | (4,185,180 | ) | ||||||||
|
|
|
|
|
|
|
| |||||||||
Net decrease | (62,059 | ) | $ | (788,240 | ) | (62,049 | ) | $ | (889,889 | ) | ||||||
|
|
|
|
|
|
|
| |||||||||
Institutional Class | ||||||||||||||||
Sales | 162,957 | $ | 2,074,381 | 147,127 | $ | 1,845,337 | ||||||||||
Reinvestments | 10,905 | 140,963 | 49,118 | 588,938 | ||||||||||||
Redemption Fees* | — | 2 | — | 123 | ||||||||||||
Redemptions | (47,916 | ) | (608,079 | ) | (117,623 | ) | (1,486,571 | ) | ||||||||
|
|
|
|
|
|
|
| |||||||||
Net increase | 125,946 | $ | 1,607,267 | 78,622 | $ | 947,827 | ||||||||||
|
|
|
|
|
|
|
| |||||||||
Total Net Increase/(Decrease) | (271,840 | ) | $ | (3,480,797 | ) | 36,199 | $ | 206,093 | ||||||||
|
|
|
|
|
|
|
| |||||||||
| * | There is a 1.00% redemption fee that may be charged on shares redeemed which have been held for 60 days or less. The redemption fees are retained by the Fund for the benefit of the remaining shareholders and recorded aspaid-in capital. |
5. Federal Tax Information
The Fund has followed the authoritative guidance on accounting for and disclosure of uncertainty in tax positions, which requires the Fund to determine whether a tax position is more likely than not to be sustained upon examination, including resolution of any related appeals or litigation processes, based
20
QUALITY DIVIDEND FUND
Notes to Financial Statements (Continued)
October 31, 2019
(Unaudited)
on the technical merits of the position. Tax positions not deemed to meet themore-likely-than-not threshold would be recorded as tax benefit or expense in the current year. The Fund has determined that there was no effect on the financial statements from following this authoritative guidance. In the normal course of business, the Fund is subject to examination by federal, state and local jurisdictions, where applicable, for tax years for which applicable statutes of limitations have not expired.
For the year ended April 30, 2019, the tax character of distributions paid by the Fund was $1,895,819 of ordinary income dividends and $3,318,293 of long-term capital gains dividends.
As of April 30, 2019, the components of distributable earnings on a tax basis were as follows:
Undistributed Long-Term Gain | Net Unrealized Appreciation | Other Book/Tax Differences | Total Distributable Earnings | |||
| $1,132,832 | $10,994,649 | $(6,626) | $12,120,855 |
The differences between the book and tax basis components of distributable earnings relate primarily to the timing and recognition of income and gains for federal income tax purposes.
As of October 31, 2019, the federal tax cost, aggregate gross unrealized appreciation and depreciation of securities held by the Fund were as follows:
Federal tax cost* | $ | 63,021,871 | ||||||
|
| |||||||
Gross unrealized appreciation | $ | 10,634,917 | ||||||
Gross unrealized depreciation | (1,752,651 | ) | ||||||
|
| |||||||
Net unrealized appreciation | $ | 8,882,266 | ||||||
|
|
| * | Because tax adjustments are calculated annually at the end of the Fund’s fiscal year, the above table does not reflect tax adjustments for the current fiscal year. For the previous year’s federal income tax information, please refer to the Notes to Financial Statements section in the Fund’s most recent annual report. |
Pursuant to federal income tax rules applicable to regulated investment companies, the Fund may elect to treat certain capital losses between November 1 and April 30 and late year ordinary losses ((i) ordinary losses between January 1 and April 30, and (ii) specified ordinary and currency losses between November 1 and April 30) as occurring on the first day of the following tax year. For the year ended April 30, 2019, the Fund had no short-term capital loss deferrals, no long-term capital loss deferrals or ordinary loss deferrals.
Accumulated capital losses represent net capital loss carryforwards as of April 30, 2019, that may be available to offset future realized capital gains and thereby reduce future capital gains distributions. As of April 30, 2019, the Fund did not have any capital loss carryforwards.
21
QUALITY DIVIDEND FUND
Notes to Financial Statements (Concluded)
October 31, 2019
(Unaudited)
6. Subsequent Events
Management has evaluated the impact of all subsequent events on the Fund through the date the financial statements were available to be issued and has determined that there are no material subsequent events requiring recognition or disclosure in the financial statements.
22
QUALITY DIVIDEND FUND
Other Information
(Unaudited)
Proxy Voting
Policies and procedures that the Fund uses to determine how to vote proxies relating to portfolio securities as well as information regarding how the Fund voted proxies relating to portfolio securities for the most recent12-month period ended June 30 are available without charge, upon request, by calling (888)201-5799 and on the Securities and Exchange Commission’s (“SEC”) website athttp://www.sec.gov.
Quarterly Portfolio Schedules
The Trust files its complete schedule of portfolio holdings with the SEC for the first and third fiscal quarters of each fiscal year (quarters ended July 31 and January 31) on FormN-Q. The Trust’s FormsN-Q are available on the SEC’s website athttp://www.sec.gov. FormN-Q is being rescinded. Once FormN-Q is rescinded, disclosure of the Fund’s complete holdings will be required to be made monthly on FormN-PORT, with every third month made available to the public by the Commission upon filing.
Board Consideration of Investment Advisory Agreement
At anin-person meeting held on September24-25, 2019 (the “Meeting”), the Board of Trustees (the “Board” or the “Trustees”) of FundVantage Trust (the “Trust”), including a majority of the Trustees who are not “interested persons” within the meaning of Section 2(a)(19) of the Investment Company Act of 1940, as amended (the “1940 Act”) (the “Independent Trustees”), unanimously approved the continuation of the Investment Advisory Agreement between EquityCompass Investment Management, LLC (“EquityCompass” or the “Adviser”) and the Trust (the “EquityCompass Agreement”) on behalf of the Quality Dividend Fund (the“Fund”).At the Meeting, the Board considered the continuation of the EquityCompass Agreement for an additional one year period.
In determining whether to approve the continuation of the EquityCompass Agreement, the Trustees considered information provided by the Adviser in accordance with Section 15(c) of the 1940 Act regarding: (i) services performed for the Fund, (ii) the size and qualifications of their portfolio management staff, (iii) any potential or actual material conflicts of interest that may arise in connection with a portfolio manager’s management of the Fund, (iv) investment performance, (v) the capitalization and financial condition of EquityCompass, (vi) brokerage selection procedures (including soft dollar arrangements, if any), (vii) the procedures for allocating investment opportunities between the Fund and other clients of the Adviser, (viii) results of any regulatory examination, including any recommendations or deficiencies noted, (ix) any litigation, investigation or administrative proceeding that may have a material impact on EquityCompass’s ability to service the Fund, (x) compliance with the Fund’s investment objectives, policies and practices (including codes of ethics and proxy voting policies) and (xi) compliance with federal securities laws and other regulatory requirements. The Trustees noted the reports and discussions with portfolio managers
23
QUALITY DIVIDEND FUND
Other Information (Continued)
(Unaudited)
as provided at the Board meetings throughout the year covering matters such as the relative performance of the Fund; compliance with the investment objectives, policies, strategies and limitations for the Fund; the compliance of management personnel with the applicable code of ethics; and the adherence to the Trust’s pricing procedures as established by the Board.
Performance.The Trustees considered the investment performance for the Fund and EquityCompass. The Trustees reviewed historical performance tables that showed the performance of the Class A, Class C, and Institutional Class shares of the Fund as compared to the Lipper Global Equity Income Funds Index, the Fund’s applicable Lipper peer index, and the Russell 1000 Value Total Return Index and the S&P 500 Total Return Index for theyear-to-date, one year, two year, three year, five year and since inception periods ended June 30, 2019, as applicable.
The Trustees noted that the Fund’s Institutional Class shares outperformed the Lipper Global Equity Income Fund Index for the one year, two year and since inception periods ended June 30, 2019, and underperformed for theyear-to-date period ended June 30, 2019. The Trustees noted further that the Fund’s Institutional Class shares underperformed the S&P 500 Total Return Index for theyear-to-date, one year, two year and since inception periods ended June 30, 2019. The Trustees also noted that the Fund’s Institutional Class shares outperformed the Russell 1000 Value Total Return Index for the one year and two year periods ended June 30, 2019 and underperformed the Russell 1000 Value Total Return Index for the year to date and since inception periods ended June 30, 2019.
Fees.The Trustees noted that the representatives of EquityCompass had provided information regarding its advisory fees and an analysis of these fees in relation to the services provided to the Fund and any other ancillary benefits resulting from EquityCompass’s relationship with the Fund. The Trustees also reviewed information regarding the fees that EquityCompass charges to its separately managed accounts, and evaluated the explanations provided by EquityCompass as to differences in fees charged to the Fund and the separately managed accounts. The Trustees also reviewed a peer comparison of advisory fees and total expenses for the Fund versus the universe of funds with similar share classes in the Lipper Global Equity Income Fund category with $250 million or less in assets. The Trustees noted that the gross advisory fee and net total expense ratio of the Fund’s Class A, Class C and Institutional Class shares were each lower or substantially in line with the median of the gross advisory fee and net total expense ratio of the funds with a similar share class in the Lipper Global Equity Income Fund category with $250 million or less in assets. The Trustees concluded that the advisory fees and services provided by EquityCompass are consistent with those of other advisers that manage mutual funds of comparable size with investment objectives, strategies and policies similar to those of the Fund based on the information provided at the Meeting.
Knowledge, experience, and qualifications.The Board considered the level and depth of knowledge of EquityCompass, including the professional experience and qualifications of senior personnel. In evaluating the quality of services provided by EquityCompass, the Board took into account its familiarity with
24
QUALITY DIVIDEND FUND
Other Information (Concluded)
(Unaudited)
EquityCompass’ senior management through Board meetings, discussions and reports during the preceding year. The Board also took into account EquityCompass’ compliance policies and procedures and reports regarding EquityCompass’ compliance operations from the Trust’s Chief Compliance Officer. The Board also considered any potential conflicts of interest that may arise in a portfolio manager’s management of the Fund’s investments on the one hand, and the investments of other accounts, on the other. The Trustees reviewed the services provided to the Fund by EquityCompass and concluded that the nature, extent and quality of the services provided were appropriate and consistent with the terms of the EquityCompass Agreement, that the quality of the proposed services appeared to be consistent with industry norms and that the Fund is likely to benefit from the continued receipt of those services. They also concluded that EquityCompass has sufficient personnel, with the appropriate education and experience, to serve the Fund effectively and had demonstrated their ability to attract and retain qualified personnel.
Costs.The Trustees reviewed materials regarding the costs of the services provided by EquityCompass, the compensation and benefits received by EquityCompass in providing services to the Fund, as well as EquityCompass’ profitability. The Trustees were provided with an unaudited income statement and balance sheet for EquityCompass, each as of June 30, 2019. The Trustees noted that EquityCompass’ level of profitability is an important factor to consider, and the Trustees should be satisfied that EquityCompass’ profits are sufficient to continue as a healthy concern generally and as investment adviser of the Fund specifically. The Trustees concluded that EquityCompass’ advisory fee level was reasonable in relation to the nature and quality of the services provided, taking into account the current size and projected growth of the Fund.
Economies of Scale.The Trustees considered the extent to which economies of scale would be realized relative to fee levels as the Fund grows, and whether the advisory fee levels reflect these economies of scale for the benefit of shareholders. The Board noted that economies of scale may be achieved at higher asset levels for the Fund for the benefit of fund shareholders, but that the advisory fee, although subject to a contractual fee waiver, did not currently include breakpoint reductions in the advisory fee as asset levels increased.
At the Meeting, the Trustees unanimously approved the continuation of the EquityCompass Agreement for an additional one year period. In approving the continuation of the EquityCompass Agreement, the Board considered all factors it deemed relevant and the information presented to the Board by EquityCompass. In arriving at its decision, the Board did not identify any single factor as being of paramount importance and each member of the Board gave varying weights to each factor according to his or her own judgment. The Board determined that the continuation of the EquityCompass Agreement for an additional one year period would be in the best interests of the Fund and its shareholders.
25
[THIS PAGE INTENTIONALLY LEFT BLANK.]
[THIS PAGE INTENTIONALLY LEFT BLANK.]
Investment Adviser
EquityCompass Investment Management, LLC
One South Street
Baltimore, MD 21202
Administrator
The Bank of New York Mellon
301 Bellevue Parkway
Wilmington, DE 19809
Transfer Agent
BNY Mellon Investment Servicing (US) Inc.
4400 Computer Drive
Westborough, MA 01581
Principal Underwriter
Foreside Funds Distributors LLC
400 Berwyn Park
899 Cassatt Road
Berwyn, PA 19312
Custodian
The Bank of New York Mellon
240 Greenwich Street
New York, NY 10286
Independent Registered Public Accounting Firm
Ernst & Young LLP
One Commerce Square
2005 Market Street, Suite 700
Philadelphia, PA 19103-7096
Legal Counsel
Pepper Hamilton LLP
3000 Two Logan Square
18th and Arch Streets
Philadelphia, PA 19103
QUA-1019

QUALITY DIVIDEND
FUND
of
FundVantage Trust
Class A (QDVAX)
Class C (QDVCX)
Institutional Class (QDVIX)
SEMI-ANNUAL
REPORT
October 31, 2019
(Unaudited)
IMPORTANT NOTE: Beginning on January 1, 2021, paper copies of the Quality Dividend Fund’s annual and semi-annual shareholder reports will no longer be sent by mail, unless you specifically request paper copies of the shareholder reports from the Quality Dividend Fund or from your financial intermediary. Instead, annual and semi-annual shareholder reports will be available on the Quality Dividend Funds website (www.equitycompass.com), and you will be notified by mail each time a report is posted and provided with a website link to access the report.
You may elect to receive all future annual and semi-annual shareholder reports in paper, free of charge. To elect to receive paper copies of shareholder reports through the mail or otherwise change your delivery method, contact your financial intermediary or, if you hold your shares directly through the Quality Dividend Fund, call the Quality Dividend Fund toll-free at (888)201-5799 or write to the Quality Dividend Fund at:
Quality Dividend Fund
FundVantage Trust
c/o BNY Mellon Investment Servicing
P.O. Box 9829
Providence, RI 02940-8029
This report is submitted for the general information of the shareholders of the Quality Dividend Fund. It is not authorized for distribution unless preceded or accompanied by a current prospectus for the Quality Dividend Fund.
Item 2. Code of Ethics.
Not applicable.
Item 3. Audit Committee Financial Expert.
Not applicable.
Item 4. Principal Accountant Fees and Services.
Not applicable.
Item 5. Audit Committee of Listed Registrants.
Not applicable.
Item 6. Investments.
| (a) | Schedule of Investments in securities of unaffiliated issuers as of the close of the reporting period is included as part of the report to shareholders filed under Item 1 of this form. |
| (b) | Not applicable. |
| Item 7. | Disclosure of Proxy Voting Policies and Procedures forClosed-End Management Investment Companies. |
Not applicable.
Item 8. Portfolio Managers ofClosed-End Management Investment Companies.
Not applicable.
| Item 9. | Purchases of Equity Securities byClosed-End Management Investment Company and Affiliated Purchasers. |
Not applicable.
Item 10. Submission of Matters to a Vote of Security Holders.
There have been no material changes to the procedures by which the shareholders may recommend nominees to the registrant’s board of trustees, where those changes were implemented after the registrant last provided disclosure in response to the requirements of Item 407(c)(2)(iv) of RegulationS-K (17 CFR 229.407) (as required by Item 22(b)(15) of Schedule 14A (17 CFR240.14a-101)), or this Item.
Item 11. Controls and Procedures.
| (a) | The registrant’s principal executive and principal financial officers, or persons performing similar functions, have concluded that the registrant’s disclosure controls and procedures (as defined in Rule30a-3(c) under the Investment Company Act of 1940, as amended (the “1940 Act”) (17 CFR270.30a-3(c))) are effective, as of a date within 90 days of the filing date of the report that includes the disclosure required by this paragraph, based on their evaluation of these controls and procedures required by Rule30a-3(b) under the 1940 Act (17 CFR270.30a-3(b)) and Rules13a-15(b) or15d-15(b) under the Securities Exchange Act of 1934, as amended (17 CFR240.13a-15(b) or240.15d-15(b)). |
| (b) | There were no changes in the registrant’s internal control over financial reporting (as defined in Rule30a-3(d) under the 1940 Act (17 CFR270.30a-3(d)) that occurred during the period covered by this report that has materially affected, or is reasonably likely to materially affect, the registrant’s internal control over financial reporting. |
Item 12. Disclosure of Securities Lending Activities forClosed-End Management Investment Companies.
Not applicable.
Item 13. Exhibits.
| (a)(1) | Not applicable. |
| (a)(2) | Certifications pursuant to Rule30a-2(a) under the 1940 Act and Section 302 of the Sarbanes-Oxley Act of 2002 are attached hereto. |
| (a)(3) | Not applicable. |
| (a)(4) | Not applicable. |
| (b) | Certifications pursuant to Rule30a-2(b) under the 1940 Act and Section 906 of the Sarbanes-Oxley Act of 2002 are attached hereto. |
SIGNATURES
Pursuant to the requirements of the Securities Exchange Act of 1934 and the Investment Company Act of 1940, the registrant has duly caused this report to be signed on its behalf by the undersigned, thereunto duly authorized.
(Registrant)FundVantage Trust
By (Signature and Title)* | /s/ Joel L. Weiss | |
Joel L. Weiss, President and | ||
Chief Executive Officer | ||
(principal executive officer) |
Date: December 27, 2019
Pursuant to the requirements of the Securities Exchange Act of 1934 and the Investment Company Act of 1940, this report has been signed below by the following persons on behalf of the registrant and in the capacities and on the dates indicated.
By (Signature and Title)* | /s/ Joel L. Weiss | |
Joel L. Weiss, President and | ||
Chief Executive Officer | ||
(principal executive officer) | ||
Date: December 27, 2019 | ||
By (Signature and Title)* | /s/ T. Richard Keyes | |
T. Richard Keyes, Treasurer and | ||
Chief Financial Officer | ||
(principal financial officer) | ||
Date: December 27, 2019 | ||
| * | Print the name and title of each signing officer under his or her signature. |