UNITED STATES
SECURITIES AND EXCHANGE COMMISSION
Washington, D.C. 20549
FORM 10-Q
| x | QUARTERLY REPORT PURSUANT TO SECTION 13 OR 15(d) OF THE SECURITIES EXCHANGE ACT OF 1934 |
For the quarterly period ended September 30, 2013
or
| ¨ | TRANSITION REPORT PURSUANT TO SECTION 13 OR 15 (d) OF THE SECURITIES EXCHANGE ACT OF 1934 |
For the transition period from to
Commission file number: 001-33631
Crestwood Midstream Partners LP
(Exact name of registrant as specified in its charter)
| | |
| Delaware | | 56-2639586 |
(State or other jurisdiction of incorporation or organization) | | (I.R.S. Employer Identification No.) |
| |
| 700 Louisiana Street, Suite 2060, Houston, Texas | | 77002 |
| (Address of principal executive offices) | | (Zip Code) |
(832) 519-2200
(Registrant’s telephone number, including area code)
Indicate by check mark whether the registrant: (1) has filed all reports required to be filed by Section 13 or 15(d) of the Securities Exchange Act of 1934 during the preceding 12 months (or for such shorter period that the registrant was required to file such reports), and (2) has been subject to such filing requirements for the past 90 days. Yes x No ¨
Indicate by check mark whether the registrant has submitted electronically and posted on its corporate Web site, if any, every Interactive Data File required to be submitted and posted pursuant to Rule 405 of Regulation S-T (§232.405 of this chapter) during the preceding 12 months (or for such shorter period that the registrant was required to submit and post such files). Yes x No ¨
Indicate by check mark whether the registrant is a large accelerated filer, an accelerated filer, a non-accelerated filer, or a smaller reporting company. See the definitions of “large accelerated filer,” “accelerated filer” and “smaller reporting company” in Rule 12b-2 of the Exchange Act.
| | | | | | |
| Large accelerated filer | | x | | Accelerated filer | | ¨ |
| | | |
| Non-accelerated filer | | ¨ (Do not check if smaller reporting company) | | Smaller Reporting company | | ¨ |
Indicate by check mark whether the registrant is a shell company (as defined in Rule 12b-2 of the Exchange Act). Yes ¨ No x
Indicate the number of shares outstanding of the issuer’s common units and Class C units, as of the latest practicable date:
| | |
Title of Class | | Outstanding as of October 3, 2013(1) |
Common Units | | 53,765,220 |
| (1) | On October 7, 2013, Crestwood Midstream Partners LP merged with and into Inergy Midstream, L.P. |
CRESTWOOD MIDSTREAM PARTNERS LP
TABLE OF CONTENTS
2
EXPLANATORY NOTE
On October 7, 2013, Crestwood Midstream Partners LP (CMLP) completed the merger (the Merger) with a subsidiary of Inergy Midstream, L.P. (NRGM) pursuant to a merger agreement dated as of May 5, 2013, by and among NRGM, NRGM GP, LLC, Intrepid Merger Sub, LLC (Merger Sub), Inergy, L.P. (NRGY), CMLP, Crestwood Holdings LLC (Crestwood Holdings) and Crestwood Gas Services GP LLC (CMLP GP). Immediately following the effective time of the Merger, CMLP merged with and into NRGM, with NRGM continuing as the surviving entity and changing its name to Crestwood Midstream Partners LP (Crestwood Midstream). The Merger has been accounted for as a reverse acquisition under which CMLP was considered the accounting acquirer of NRGM. As such, the financial statements of CMLP are treated as the historical financial statements of Crestwood Midstream, the combined partnership.
This Quarterly Report on Form 10-Q of CMLP for the period ended September 30, 2013 is being filed by Crestwood Midstream as the legal successor by the merger to CMLP. The financial information in this report and the accompanying Management’s Discussion and Analysis of Financial Condition and Results of Operations reflect the status of the reporting entity as of September 30, 2013. Unless the context requires otherwise, all references in this Quarterly Report on Form 10-Q to “we,” “us,” “our,” or “CMLP” refer to the business and operations of Crestwood Midstream Partners LP, a Delaware limited partnership, and its consolidated subsidiaries for the periods prior to the closing of the Merger.
3
FORWARD-LOOKING INFORMATION
Certain statements contained in this report and other materials we file with the U.S. Securities and Exchange Commission (SEC), or in other written or oral statements made or to be made by us, other than statements of historical fact, are forward-looking statements as defined in the Private Securities Litigation Reform Act of 1995. Forward-looking statements reflect our current expectations or forecasts of future events. Words such as “may,” “assume,” “forecast,” “predict,” “strategy,” “expect,” “intend,” “plan,” “aim,” “estimate,” “anticipate,” “believe,” “project,” “budget,” “potential,” or “continue,” and similar expressions are used to identify forward-looking statements. Forward-looking statements can be affected by assumptions used or by known or unknown risks or uncertainties. Consequently, no forward-looking statements can be guaranteed.
Important factors that could cause our actual results to differ materially from the results contemplated by such forward-looking statements include, but are not limited to, the following risks and uncertainties:
| | • | | our ability to consummate acquisitions, successfully integrate the businesses of CMLP and NRGM, and realize any cost savings and other synergies from any acquisition; |
| | • | | our ability to complete our growth projects; |
| | • | | our ability to generate stable cash flows; |
| | • | | our ability to successfully implement our business plan for our assets and operations; |
| | • | | the extent and success of producer or customer drilling efforts, as well as the extent and quality of crude oil and natural gas volumes produced within areas of acreage dedicated to and within the proximity of our assets; |
| | • | | failure or delays by our customers in achieving expected production targets; |
| | • | | competitive conditions in our industry and their impact on our ability to connect natural gas supplies to our gathering and processing assets or systems; |
| | • | | actions or inactions taken or non-performance by third parties, including suppliers, contractors, operators, processors, transporters and customers; |
| | • | | the effects of existing and future laws and governmental legislation and regulations; |
| | • | | industry factors that influence the supply and prices of, and demand for, crude oil, natural gas and natural gas liquids (NGLs); |
| | • | | operating hazards, natural disasters, weather-related delays, casualty losses and other matters beyond our control; |
| | • | | industry factors that influence the demand for natural gas storage and transportation capacity; |
| | • | | changes in general economic conditions; |
| | • | | the availability and price of crude oil, natural gas and NGLs to consumers compared to the prices of alternative and competing fuels; |
| | • | | changes in interest rates; |
| | • | | the price and availability of debt and equity financing; |
| | • | | risks related to our substantial indebtedness; the effects of existing or future litigations; and |
| | • | | certain factors discussed elsewhere in this report. |
All of the forward-looking statements made in this document are qualified by these cautionary statements, and we cannot assure you that actual results or developments that we anticipate will be realized or, even if substantially realized, will have the expected consequences to, or effect on, us or our business or operations. Also note that we provided additional cautionary discussion of risks and uncertainties under “Risk Factors” in our 2012 Annual Report on Form 10-K, in our other public filings and press releases. Although the expectations in the forward-looking statements are based on our current beliefs and expectations, caution should be taken not to place undue reliance on any such forward-looking statements because such statements speak only as of the date hereof. Except as required by federal and state securities laws, we undertake no obligation to publicly update or revise any forward-looking statements, whether as a result of new information, future events or otherwise. All forward-looking statements attributable to us or any person acting on our behalf are expressly qualified in their entirety by the cautionary statements contained or referred to in this report and in our future periodic reports filed with the SEC. In light of these risks, uncertainties and assumptions, the forward-looking events discussed in this report may not occur.
4
PART I. FINANCIAL INFORMATION
Item 1. Financial Statements
CRESTWOOD MIDSTREAM PARTNERS LP
CONSOLIDATED STATEMENTS OF INCOME
(In thousands, except for per unit data)
(Unaudited)
| | | | | | | | | | | | | | | | |
| | | Three Months Ended | | | Nine Months Ended | |
| | | September 30, | | | September 30, | |
| | | 2013 | | | 2012(1) | | | 2013 | | | 2012(1) | |
Operating revenues | | | | | | | | | | | | | | | | |
Gathering revenues | | $ | 25,188 | | | $ | 21,715 | | | $ | 73,287 | | | $ | 51,313 | |
Gathering revenues—related party | | | 18,726 | | | | 21,658 | | | | 57,699 | | | | 67,120 | |
Processing revenues | | | 3,548 | | | | 2,271 | | | | 11,522 | | | | 4,665 | |
Processing revenues—related party | | | 5,421 | | | | 6,298 | | | | 16,618 | | | | 19,619 | |
Compression revenues | | | 4,075 | | | | — | | | | 11,874 | | | | — | |
Product sales | | | 14,180 | | | | 11,071 | | | | 43,653 | | | | 29,258 | |
| | | | | | | | | | | | | | | | |
Total operating revenues | | | 71,138 | | | | 63,013 | | | | 214,653 | | | | 171,975 | |
| | | | | | | | | | | | | | | | |
Operating expenses | | | | | | | | | | | | | | | | |
Product purchases | | | 5,295 | | | | 10,341 | | | | 18,197 | | | | 26,755 | |
Product purchases—related party | | | 7,556 | | | | — | | | | 22,191 | | | | — | |
Operations and maintenance | | | 14,895 | | | | 10,942 | | | | 40,503 | | | | 30,053 | |
General and administrative | | | 10,367 | | | | 6,570 | | | | 28,536 | | | | 21,965 | |
Depreciation, amortization and accretion | | | 14,557 | | | | 11,568 | | | | 49,618 | | | | 35,909 | |
| | | | | | | | | | | | | | | | |
Total operating expenses | | | 52,670 | | | | 39,421 | | | | 159,045 | | | | 114,682 | |
| | | | | | | | | | | | | | | | |
Goodwill impairment | | | (4,053 | ) | | | — | | | | (4,053 | ) | | | — | |
Gain on sale of asset | | | 4,392 | | | | — | | | | 4,392 | | | | — | |
| | | | | | | | | | | | | | | | |
Operating income | | | 18,807 | | | | 23,592 | | | | 55,947 | | | | 57,293 | |
Loss from unconsolidated affiliate | | | (447 | ) | | | — | | | | (447 | ) | | | — | |
Interest and debt expense | | | (11,625 | ) | | | (8,905 | ) | | | (34,260 | ) | | | (25,425 | ) |
| | | | | | | | | | | | | | | | |
Income before income taxes | | | 6,735 | | | | 14,687 | | | | 21,240 | | | | 31,868 | |
Income tax expense | | | 347 | | | | 306 | | | | 1,024 | | | | 884 | |
| | | | | | | | | | | | | | | | |
Net income | | | 6,388 | | | | 14,381 | | | | 20,216 | | | | 30,984 | |
Net income attributable to noncontrolling interest | | | 1,923 | | | | — | | | | 1,923 | | | | — | |
| | | | | | | | | | | | | | | | |
Net income attributable to Crestwood Midstream Partners LP | | $ | 4,465 | | | $ | 14,381 | | | $ | 18,293 | | | $ | 30,984 | |
| | | | | | | | | | | | | | | | |
General partner’s interest in net income attributable to Crestwood Midstream Partners LP | | $ | 81 | | | $ | 7,516 | | | $ | 10,474 | | | $ | 15,038 | |
Limited partners’ interest in net income attributable to Crestwood Midstream Partners LP | | $ | 4,384 | | | $ | 6,865 | | | $ | 7,819 | | | $ | 15,946 | |
Net income attributable to Crestwood Midstream Partners LP per limited partner unit: | | | | | | | | | | | | | | | | |
Basic and Diluted | | $ | 0.07 | | | $ | 0.15 | | | $ | 0.13 | | | $ | 0.36 | |
| (1) | Financial information has been revised to include the results of Crestwood Marcellus Midstream LLC as discussed in Note 2. |
See accompanying notes.
5
CRESTWOOD MIDSTREAM PARTNERS LP
CONSOLIDATED BALANCE SHEETS
(In thousands, except for unit data)
(Unaudited)
| | | | | | | | |
| | | September 30, | | | December 31, | |
| | | 2013 | | | 2012 | |
| ASSETS | | | | | | | | |
Current assets | | | | | | | | |
Cash and cash equivalents | | $ | 5,668 | | | $ | 111 | |
Accounts receivable | | | 27,666 | | | | 21,636 | |
Accounts receivable—related party | | | 24,050 | | | | 23,755 | |
Insurance receivable | | | 3,072 | | | | 2,920 | |
Prepaid expenses and other | | | 791 | | | | 1,941 | |
| | | | | | | | |
Total current assets | | | 61,247 | | | | 50,363 | |
Property, plant and equipment, net of accumulated depreciation of $168,497 in 2013 and $130,030 in 2012 | | | 1,144,872 | | | | 939,846 | |
Intangible assets, net of accumulated amortization of $22,448 in 2013 and $12,814 in 2012 | | | 428,880 | | | | 501,380 | |
Goodwill | | | 99,596 | | | | 95,031 | |
Investment in unconsolidated affiliate | | | 127,651 | | | | — | |
Deferred financing costs, net | | | 20,719 | | | | 22,528 | |
Other assets | | | 1,018 | | | | 1,321 | |
| | | | | | | | |
Total assets | | $ | 1,883,983 | | | $ | 1,610,469 | |
| | | | | | | | |
| LIABILITIES AND PARTNERS’ CAPITAL | | | | | | | | |
Current liabilities | | | | | | | | |
Accrued additions to property, plant and equipment | | $ | 41,248 | | | $ | 9,213 | |
Capital leases | | | 2,945 | | | | 3,862 | |
Deferred revenue | | | 2,426 | | | | 2,634 | |
Accounts payable—related party | | | 4,517 | | | | 3,088 | |
Accounts payable, accrued expenses and other liabilities | | | 41,035 | | | | 29,717 | |
| | | | | | | | |
Total current liabilities | | | 92,171 | | | | 48,514 | |
Long-term debt | | | 899,386 | | | | 685,161 | |
Long-term capital leases | | | 1,252 | | | | 3,161 | |
Asset retirement obligations | | | 14,633 | | | | 14,024 | |
Commitments and contingent liabilities (Note 9) | | | | | | | | |
Partners’ capital | | | | | | | | |
Crestwood Midstream Partners LP partners’ capital | | | | | | | | |
Common unitholders (53,765,676 and 41,164,737 units issued and outstanding at September 30, 2013 and December 31, 2012) | | | 653,441 | | | | 442,348 | |
Class C unitholders (7,165,819 units issued and outstanding at December 31, 2012) | | | — | | | | 159,908 | |
Class D unitholder (6,483,129 units issued and outstanding at September 30, 2013) | | | 127,116 | | | | — | |
General partner (1,112,674 and 979,614 units issued and outstanding at September 30, 2013 and December 31, 2012) | | | (2,012 | ) | | | 257,353 | |
| | | | | | | | |
Total Crestwood Midstream Partners LP partners’ capital | | | 778,545 | | | | 859,609 | |
Noncontrolling interests—preferred equity of subsidiary | | | 97,996 | | | | — | |
| | | | | | | | |
Total partners’ capital | | | 876,541 | | | | 859,609 | |
| | | | | | | | |
Total liabilities and partners’ capital | | $ | 1,883,983 | | | $ | 1,610,469 | |
| | | | | | | | |
See accompanying notes.
6
CRESTWOOD MIDSTREAM PARTNERS LP
CONSOLIDATED STATEMENTS OF CASH FLOWS
(In thousands)
(Unaudited)
| | | | | | | | |
| | | Nine Months Ended | |
| | | September 30, | |
| | | 2013 | | | 2012(1) | |
Cash flows from operating activities | | | | | | | | |
Net income | | $ | 20,216 | | | $ | 30,984 | |
Adjustments to reconcile net income to net cash provided by operating activities: | | | | | | | | |
Depreciation, amortization and accretion | | | 49,618 | | | | 35,909 | |
Goodwill impairment | | | 4,053 | | | | — | |
Gain on sale of asset | | | (4,392 | ) | | | — | |
Equity-based compensation | | | 2,138 | | | | 1,528 | |
Loss from unconsolidated affiliate | | | 447 | | | | — | |
Other non-cash income items | | | 3,203 | | | | 3,743 | |
Changes in assets and liabilities: | | | | | | | | |
Accounts receivable | | | (6,030 | ) | | | (4,985 | ) |
Accounts receivable—related party | | | (295 | ) | | | 4,689 | |
Insurance receivable | | | (152 | ) | | | — | |
Prepaid expenses and other assets | | | 1,453 | | | | 783 | |
Accounts payable—related party | | | 1,429 | | | | (900 | ) |
Accounts payable, accrued expenses and other liabilities | | | 9,665 | | | | 6,117 | |
| | | | | | | | |
Net cash provided by operating activities | | | 81,353 | | | | 77,868 | |
| | | | | | | | |
Cash flows from investing activities | | | | | | | | |
Capital expenditures | | | (164,596 | ) | | | (34,346 | ) |
Acquisitions, net of cash acquired | | | — | | | | (468,987 | ) |
Proceeds from sale of asset | | | 11,000 | | | | — | |
Investment in unconsolidated affiliate | | | (128,098 | ) | | | — | |
Other | | | 20 | | | | — | |
| | | | | | | | |
Net cash used in investing activities | | | (281,674 | ) | | | (503,333 | ) |
| | | | | | | | |
Cash flows from financing activities | | | | | | | | |
Proceeds from credit facilities | | | 483,400 | | | | 377,700 | |
Repayments of credit facilities | | | (269,000 | ) | | | (337,500 | ) |
Payments on capital leases | | | (3,015 | ) | | | (2,155 | ) |
Deferred financing costs paid | | | (85 | ) | | | (6,489 | ) |
Proceeds from issuance of common units, net | | | 118,562 | | | | 217,508 | |
Proceeds from issuance of preferred equity of subsidiary, net | | | 96,073 | | | | — | |
Contributions from partners | | | — | | | | 249,680 | |
Distribution to General Partner for additional interest in CMM | | | (129,000 | ) | | | — | |
Distributions to partners | | | (90,357 | ) | | | (73,653 | ) |
Taxes paid for equity-based compensation vesting | | | (700 | ) | | | (406 | ) |
| | | | | | | | |
Net cash provided by financing activities | | | 205,878 | | | | 424,685 | |
| | | | | | | | |
Change in cash and cash equivalents | | | 5,557 | | | | (780 | ) |
Cash and cash equivalents at beginning of period | | | 111 | | | | 797 | |
| | | | | | | | |
Cash and cash equivalents at end of period | | $ | 5,668 | | | $ | 17 | |
| | | | | | | | |
| (1) | Financial information has been revised to include the results of Crestwood Marcellus Midstream LLC as discussed in Note 2. |
See accompanying notes.
7
CRESTWOOD MIDSTREAM PARTNERS LP
CONSOLIDATED STATEMENTS OF CHANGES IN PARTNERS’ CAPITAL
(In thousands)
(Unaudited)
| | | | | | | | | | | | | | | | | | | | | | | | |
| | | Limited Partners | | | | | | | | | | |
| | | Common | | | Class C
Unitholders | | | Class D
Unitholder | | | General Partner | | | Noncontrolling
Interest | | | Total | |
Partners’ capital as of December 31, 2012 | | $ | 442,348 | | | $ | 159,908 | | | $ | — | | | $ | 257,353 | | | $ | — | | | $ | 859,609 | |
Issuance of units, net of offering costs | | | 118,562 | | | | — | | | | — | | | | — | | | | — | | | | 118,562 | |
Issuance of units | | | — | | | | — | | | | 126,286 | | | | (126,286 | ) | | | — | | | | — | |
Issuance of preferred equity of subsidiary | | | — | | | | — | | | | — | | | | — | | | | 96,073 | | | | 96,073 | |
Conversion of Class C units to common units | | | 159,908 | | | | (159,908 | ) | | | — | | | | — | | | | — | | | | — | |
Net income | | | 6,989 | | | | — | | | | 830 | | | | 10,474 | | | | 1,923 | | | | 20,216 | |
Equity-based compensation | | | 2,138 | | | | — | | | | — | | | | — | | | | — | | | | 2,138 | |
Taxes paid for equity-based compensation vesting | | | (700 | ) | | | — | | | | — | | | | — | | | | — | | | | (700 | ) |
Distributions to partners | | | (75,804 | ) | | | — | | | | — | | | | (14,553 | ) | | | — | | | | (90,357 | ) |
Distribution to General Partner for additional interest in CMM | | | — | | | | — | | | | — | | | | (129,000 | ) | | | — | | | | (129,000 | ) |
| | | | | | | | | | | | | | | | | | | | | | | | |
Partners’ capital as of September 30, 2013 | | $ | 653,441 | | | $ | — | | | $ | 127,116 | | | $ | (2,012 | ) | | $ | 97,996 | | | $ | 876,541 | |
| | | | | | | | | | | | | | | | | | | | | | | | |
| | | | |
| | | Limited Partners | | | | | | | | | | |
| | | Common | | | Class C
Unitholders | | | Class D
Unitholder | | | General Partner | | | Noncontrolling
Interest | | | Total | |
Partners’ capital as of December 31, 2011 | | $ | 286,945 | | | $ | 157,386 | | | $ | — | | | $ | 11,292 | | | $ | — | | | $ | 455,623 | |
Issuance of units, net of offering costs | | | 217,508 | | | | — | | | | — | | | | — | | | | — | | | | 217,508 | |
Contributions from partners | | | — | | | | — | | | | — | | | | 249,680 | | | | — | | | | 249,680 | |
Net income | | | 13,532 | | | | 2,414 | | | | — | | | | 15,038 | | | | — | | | | 30,984 | |
Equity-based compensation | | | 1,528 | | | | — | | | | — | | | | — | | | | — | | | | 1,528 | |
Taxes paid for equity-based compensation vesting | | | (406 | ) | | | — | | | | — | | | | — | | | | — | | | | (406 | ) |
Distributions to partners | | | (56,730 | ) | | | — | | | | — | | | | (16,923 | ) | | | — | | | | (73,653 | ) |
| | | | | | | | | | | | | | | | | | | | | | | | |
Partners’ capital as of September 30, 2012(1) | | $ | 462,377 | | | $ | 159,800 | | | $ | — | | | $ | 259,087 | | | $ | — | | | $ | 881,264 | |
| | | | | | | | | | | | | | | | | | | | | | | | |
| (1) | Financial information has been revised to include the results of Crestwood Marcellus Midstream LLC as discussed in Note 2. |
See accompanying notes.
8
CRESTWOOD MIDSTREAM PARTNERS LP
NOTES TO CONSOLIDATED FINANCIAL STATEMENTS
UNAUDITED
1. ORGANIZATION AND DESCRIPTION OF BUSINESS
Organization
Prior to the Crestwood Midstream Partners LP (CMLP) merger with Inergy Midstream, L.P. (NRGM) on October 7, 2013 discussed below, CMLP was a publicly traded Delaware limited partnership formed for the purpose of acquiring and operating midstream assets. CMLP’s common units were listed on the New York Stock Exchange (NYSE) under the symbol “CMLP.” Crestwood Gas Services GP LLC was the CMLP general partner (General Partner) until the effective date of our Merger described below. On June 5, 2013, our General Partner distributed all of its common units and Class D units that it owned in us to Crestwood Holdings Partners LLC and its affiliates (Crestwood Holdings). Prior to June 19, 2013, the General Partner was owned by Crestwood Holdings. On June 19, 2013, Crestwood Holdings acquired the general partner of Inergy, L.P. (NRGY) and contributed its ownership of our General Partner and incentive distribution rights to NRGY in exchange for NRGY common units.
On October 7, 2013, CMLP completed the merger (the Merger) with a subsidiary of NRGM pursuant to a merger agreement dated as of May 5, 2013. Immediately following the Merger, CMLP merged with and into NRGM, with NRGM continuing as the surviving entity and changing its name to Crestwood Midstream Partners LP (Crestwood Midstream). The common units of the combined partnership are listed on the NYSE under the symbol “CMLP.” Under the merger agreement, CMLP unitholders received 1.07 units of NRGM units for each unit of CMLP they owned and as a result, there were no CMLP common or Class D units outstanding immediately following the Merger. Additionally, CMLP unitholders (other than Crestwood Holdings), received a one-time approximately $35 million cash payment at the closing of the Merger, or $1.03 per unit, $25 million of which was paid by NRGM and approximately $10 million of which was paid by Crestwood Holdings. Also in conjunction with the Merger, CMLP was delisted on the NYSE.
9
Organizational Structure – Will be updated to reflect Preferred Units in Crestwood Niobrara
The following chart depicts our ownership structure as of September 30, 2013:
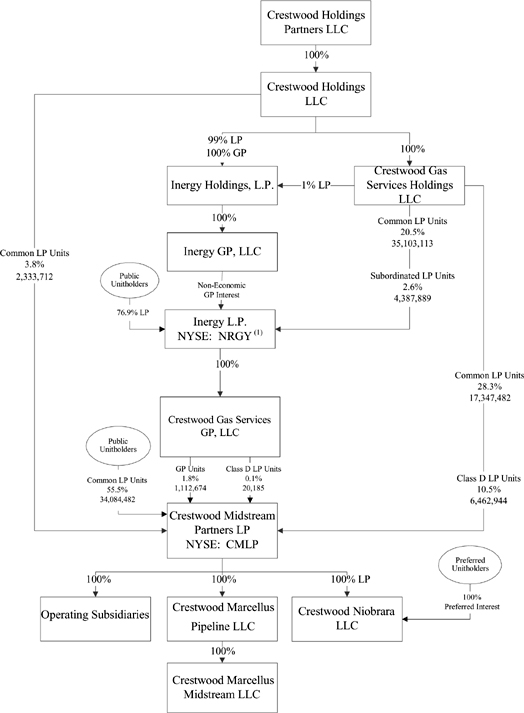
| (1) | Concurrent with the October 7, 2013 merger discussed above, NRGY changed its name from Inergy, L.P. to Crestwood Equity Partners LP and changed its NYSE listing symbol from “NRGY” to “CEQP.” |
10
Description of Business
We are a growth-oriented midstream master limited partnership which owns and operates predominately fee-based gathering, processing, treating and compression assets servicing producers in the Marcellus Shale in northern West Virginia, the Barnett Shale in north Texas, the Fayetteville Shale in northwestern Arkansas, the Granite Wash in the Texas Panhandle, the Avalon Shale/Bone Spring in southeastern New Mexico and the Haynesville/Bossier Shale in western Louisiana.
2. BASIS OF PRESENTATION AND SUMMARY OF SIGNIFICANT ACCOUNTING POLICIES
Basis of Presentation
We prepared this Quarterly Report on Form 10-Q under the rules and regulations of the SEC and in accordance with accounting principles generally accepted in the United States of America (GAAP) for interim consolidated financial statements. Accordingly, they do not include all of the disclosures required by GAAP.
On March 26, 2012, Crestwood Holdings contributed approximately $244 million for a 65% membership interest in Crestwood Marcellus Midstream LLC (CMM) and we contributed approximately $131 million for a 35% membership interest in CMM. On January 8, 2013, we acquired Crestwood Holdings’ 65% membership interest in CMM and as a result, we now own 100% of CMM and have the ability to control the operating and financial decisions of CMM. We accounted for this transaction as a reorganization of entities under common control and the accounting standards related to such transactions require us to retroactively adjust our historical results. Accordingly, the consolidated balance sheets reflect the historical carrying value of CMM’s assets and liabilities. Earnings related to the recast of our historical results due to the acquisition of the 65% membership interest in CMM were allocated to the General Partner. As a result, there was no impact to our 2012 reported basic or diluted earnings per limited partner unit. We funded the purchase price for the 65% membership interest in CMM of approximately $258 million through $129 million of borrowings under our CMLP credit facility, the issuance of 6,190,469 Class D units, representing limited partner interests in us to Crestwood Holdings, and the issuance of 133,060 general partner units to our General Partner. For accounting purposes, because of the consolidation of CMM, we reflected the $129 million cash paid to acquire the 65% interest in CMM and the issuance of Class D units as a reduction of our General Partner’s capital.
You should read this Quarterly Report on Form 10-Q along with our Form 8-K filed with the SEC on May 10, 2013. The financial statements as of September 30, 2013 and for the three and nine months ended September 30, 2013 and 2012 are unaudited. The consolidated balance sheet as of December 31, 2012, was derived from the audited balance sheet filed in our Form 8-K filed with the SEC on May 10, 2013. In management’s opinion, all necessary adjustments to fairly present our results of operations, financial position and cash flows for the periods presented have been made and all such adjustments are of a normal and recurring nature. Information for interim periods may not be indicative of our operating results for the entire year. Our disclosures in this Form 10-Q are an update to those provided in our Form 8-K filed with the SEC on May 10, 2013.
Significant Accounting Policies
There were no changes in the significant accounting policies described in our 2012 Annual Report on Form 10-K filed with the SEC on February 27, 2013, except as noted below.
Revenues
Our revenues are generated from the gathering, compression and processing of natural gas from producers predominately under fee-based contracts. Our gathering revenues relate to contracts pursuant to which we both transport and compress natural gas based on the volumes that flow through our systems and are not directly dependent on commodity prices. Compression revenues relate to contracts under which we solely provide compression services or contracts under which we charge a compression services fee that is separate from other services provided under our contracts. For the three and nine months ended September 30, 2013, our compression revenues were entirely comprised of services provided under contracts obtained in the E. Marcellus Asset Company, LLC (EMAC) acquisition (See Note 3). The majority of our processing revenues are generated from contracts under which we charge a fixed-fee. Under certain of our processing contracts, raw natural gas is gathered, processed and sold at published index prices. Producers are paid based on an agreed percentage of the residue gas and NGLs multiplied by index prices or the actual sale prices.
Goodwill
Our goodwill represents consideration paid in excess of the fair value of the identifiable assets acquired in a business combination. We have assigned our goodwill to four of our operating segments (Marcellus, Granite Wash, Fayetteville and Haynesville) which, based on management’s judgment, we also consider reporting units for goodwill assessment purposes.
We evaluate goodwill for impairment, at a minimum, annually on December 31, or whenever events or changes indicate that it is more likely than not that the fair value of a reporting unit could be less than its carrying amount. This evaluation requires us to compare the fair value of each of the three reporting units above to its carrying value (including goodwill). If the fair value exceeds the carry amount, goodwill of the reporting unit is not considered impaired.
11
We estimate the fair value of our reporting units based on a number of factors, including the potential value we would receive if we sold the reporting unit, discount rates and projected cash flows. Projected cash flows of the reporting unit are generally based on current and anticipated future market conditions, which require significant judgment to make projections and assumptions about pricing, demand, competition, operating costs, legal and regulatory issues and other factors that may extend many years into the future and are often outside of our control. Due to the imprecise nature of these projections and assumptions, actual results can and often do, differ from our estimates.
During the three months ended September 30, 2013, we recorded an impairment of goodwill of approximately $4 million on our Haynesville/Bossier Shale system as a result of a decrease in anticipated revenues to be generated from those operations due primarily to our inability to renew and extend a significant revenue contract that expired in mid-2013.
Investment in Unconsolidated Affiliate
We apply the equity method of accounting where we can exert significant influence over, but do not control or direct, the policies, decisions or activities of the entity. We use the cost method of accounting where we are unable to exert significant influence over the entity. The Financial Accounting Standards Board’s accounting standards related to equity method investments and joint ventures requires entities to periodically review their equity method investments to determine whether current events or circumstances indicate that the carrying value of the equity method investment may be impaired. We evaluate our equity method investment for impairment when there are indicators of impairment. If indicators suggest impairment we will perform an impairment test to assess whether an adjustment is necessary. The impairment test considers whether the fair value of our equity method investment has declined and if any such decline is other than temporary. If a decline in fair value is determined to be other than temporary, the investment’s carrying value is written down to fair value.
3. ACQUISITIONS AND DIVESTITURES
Acquisitions
Antero Acquisition
On February 27, 2012, we announced the execution, through CMM, of an Asset Purchase Agreement related to the acquisition of gathering assets owned by Antero Resources Appalachian Corporation (Antero) in the Marcellus Shale located in Harrison and Doddridge Counties, West Virginia (Antero Acquisition), and, at closing, the planned execution of a 20 year, fixed-fee, Gas Gathering and Compression Agreement (GGA) with Antero. On March 26, 2012, CMM completed the Antero Acquisition for approximately $380 million. The assets acquired by CMM consisted of a 33 mile low pressure gathering system which delivers Antero’s Marcellus Shale production to various regional pipeline systems including Columbia, Dominion, Equitrans and MarkWest Energy Partners’ Sherwood Gas Processing Plant.
The GGA with Antero provides for an area of dedication at the time of acquisition of approximately 127,000 gross acres, or 104,000 net acres, largely located in the rich gas corridor of the southwestern core of the Marcellus Shale play. As part of the GGA, Antero committed to deliver minimum annual throughput volumes to us for a seven year period from January 1, 2012 to January 1, 2019, ranging from an average of 300 million cubic feet per day (MMcf/d) in 2012 to an average of 450 MMcf/d in 2018. During the period ended December 31, 2012, Antero delivered less than the minimum annual throughput volumes and at December 31, 2012, we recorded a receivable and deferred revenue of approximately $2.6 million due to Antero’s potential ability to recover this amount if Antero’s 2013 throughput volumes exceed the minimum annual throughput volumes included in the GGA for 2013.
The final purchase price allocation is as follows (In thousands):
| | | | |
Cash | | $ | 381,718 | |
| | | | |
Total purchase price | | $ | 381,718 | |
| | | | |
Purchase price allocation: | | | | |
Property, plant and equipment | | $ | 90,562 | |
Intangible assets | | | 291,218 | |
| | | | |
Total assets | | $ | 381,780 | |
| | | | |
Asset retirement obligation | | $ | 62 | |
| | | | |
Total liabilities | | $ | 62 | |
| | | | |
Total | | $ | 381,718 | |
| | | | |
12
Our intangible assets recorded as a result of the Antero Acquisition relate to the GGA with Antero. These intangible assets will be amortized over the life of the contract. For the period from the acquisition date (March 26, 2012) to September 30, 2012, we recorded approximately $15 million of operating revenues and $7 million of operating expenses related to the operations of the assets acquired from Antero.
Devon Acquisition
On August 24, 2012, we completed the acquisition of certain gathering and processing assets in the NGL rich gas region of the Barnett Shale (Devon Acquisition) from Devon Energy Corporation (Devon). We paid approximately $88 million for these assets. During the three months ended September 30, 2013, we finalized the purchase price allocation of the assets acquired and liabilities assumed, and as a result, we reduced our depreciation, amortization and accretion expense by approximately $2 million.
The final purchase price allocation is as follows (In thousands):
| | | | |
Cash | | $ | 87,943 | |
| | | | |
Total purchase price | | $ | 87,943 | |
| | | | |
Purchase price allocation: | | | | |
Property, plant and equipment | | $ | 88,626 | |
| | | | |
Total assets | | $ | 88,626 | |
| | | | |
Asset retirement obligation | | $ | 483 | |
Environmental liability | | | 200 | |
| | | | |
Total liabilities | | $ | 683 | |
| | | | |
Total | | $ | 87,943 | |
| | | | |
We believe that it is impracticable to present financial information for the acquired assets prior to the acquisition date due to the lack of availability of historical financial information related to the acquired assets, and because the 20 year fixed-fee gathering, processing and compression agreement with Devon has significantly different terms than the historical intercompany relationships between the acquired assets and Devon.
EMAC Acquisition
On December 28, 2012, CMM acquired all of the membership interest of E. Marcellus Asset Company, LLC (EMAC) from Enerven Compression, LLC (Enerven) for approximately $95 million. We financed this acquisition through our CMM credit facility. At the time of acquisition, EMAC’s assets consisted of four compression and dehydration stations located on our gathering systems in Harrison County, West Virginia. These assets provide compression and dehydration services to Antero under a compression services agreement through 2018. Antero has the option to renew the agreement for an additional five years upon expiration of the original agreement.
During the three months ended September 30, 2013, we finalized the purchase price allocation of the assets acquired and liabilities assumed, and as a result, we reduced our depreciation, amortization and accretion expense by approximately $1 million. In addition, we recognized goodwill of approximately $9 million, primarily related to anticipated operating synergies between the assets acquired and our existing assets.
13
The final purchase price allocation is as follows (In thousands):
| | | | |
Cash | | $ | 94,979 | |
| | | | |
Total purchase price | | $ | 94,979 | |
| | | | |
Purchase price allocation: | | | | |
Property, plant and equipment | | $ | 53,357 | |
Intangible assets | | | 33,909 | |
Goodwill | | | 8,618 | |
| | | | |
Total assets | | $ | 95,884 | |
| | | | |
Asset retirement obligation | | $ | 755 | |
Environmental liability | | | 150 | |
| | | | |
Total liabilities | | $ | 905 | |
| | | | |
Total | | $ | 94,979 | |
| | | | |
Our intangible assets recorded as a result of the EMAC acquisition relate to the compression services agreements with Antero. These intangible assets will be amortized over the life of the contract. Pro forma information has not been provided for the acquisition of the EMAC assets as the impact is immaterial to our financial statements.
Divestitures
On July 25, 2013, we sold a cryogenic plant and associated equipment for approximately $11 million (net of fees) and recognized a gain of approximately $4 million during the three months ended September 30, 2013.
4. EARNINGS PER LIMITED PARTNER UNIT AND DISTRIBUTIONS
Earnings Per Limited Partner Unit. Our net income attributable to CMLP is allocated to the General Partner and the limited partners, in accordance with their respective ownership percentages, after giving effect to incentive distributions paid to the General Partner. To the extent cash distributions exceed net income attributable to CMLP, the excess distributions are allocated proportionately to all participating units outstanding based on their respective ownership percentages. Basic earnings per unit are computed by dividing net income attributable to limited partner unitholders by the weighted-average number of limited partner units outstanding during each period. Diluted earnings per unit are computed using the treasury stock method, which considers the impact to net income attributable to CMLP and limited partner units from the potential issuance of limited partner units.
The tables below show the (i) allocation of net income attributable to limited partners and the (ii) net income attributable to CMLP per limited partner unit based on the number of basic and diluted limited partner units outstanding for the three and nine months ended September 30, 2013 and 2012.
Allocation of Net Income Attributable to CMLP to General Partner and Limited Partners
| | | | | | | | | | | | | | | | |
| | | Three Months Ended | | | Nine Months Ended | |
| | | September 30, | | | September 30, | |
| | | 2013 | | | 2012 | | | 2013 | | | 2012 | |
| | | (In thousands) | |
Net income attributable to CMLP | | $ | 4,465 | | | $ | 14,381 | | | $ | 18,293 | | | $ | 30,984 | |
General Partner’s incentive distributions(1) | | | — | | | | (4,101 | ) | | | (10,140 | ) | | | (10,636 | ) |
| | | | | | | | | | | | | | | | |
Net income attributable to CMLP after incentive distributions | | | 4,465 | | | | 10,280 | | | | 8,153 | | | | 20,348 | |
General Partner’s interest in net income attributable to CMLP after incentive distributions | | | (81 | ) | | | (3,415 | ) | | | (334 | ) | | | (4,402 | ) |
| | | | | | | | | | | | | | | | |
Limited Partners’ interest in net income attributable to CMLP after distributions | | $ | 4,384 | | | $ | 6,865 | | | $ | 7,819 | | | $ | 15,946 | |
| | | | | | | | | | | | | | | | |
| (1) | As a result of the Merger on October 7, 2013 described in Note 1.Organization and Description of Business, there were no distributions to CMLP’s unitholders for the three months ended September 30, 2013; therefore, our General Partner did not receive any incentive distributions attributable to that period. |
14
Earnings Per Limited Partner Unit
Three Months Ended September 30,
| | | | | | | | |
| | | 2013 | | | 2012 | |
| | | (In thousands, except per unit data) | |
Limited partners’ interest in net income attributable to CMLP | | $ | 4,384 | | | $ | 6,865 | |
Weighted-average limited partner units—basic(1) | | | 60,188 | | | | 46,564 | |
Effect of dilutive units | | | 260 | | | | 203 | |
| | | | | | | | |
Weighted-average limited partner units—diluted(1) | | | 60,448 | | | | 46,767 | |
| | | | | | | | |
Basic and diluted net income attributable to CMLP per limited partner unit | | $ | 0.07 | | | $ | 0.15 | |
| (1) | The three months ended September 30, 2013 includes 6,421,641 Class D units. The three months ended September 30, 2012 includes 6,929,763 Class C units. |
Nine Months Ended September 30,
| | | | | | | | |
| | | 2013 | | | 2012 | |
| | | (In thousands, except per unit data) | |
Limited partners’ interest in net income attributable to CMLP | | $ | 7,819 | | | $ | 15,946 | |
Weighted-average limited partner units—basic(1) | | | 58,339 | | | | 44,206 | |
Effect of dilutive units | | | 269 | | | | 189 | |
| | | | | | | | |
Weighted-average limited partner units—diluted(1) | | | 58,608 | | | | 44,395 | |
| | | | | | | | |
Basic and diluted net income attributable to CMLP per limited partner unit | | $ | 0.13 | | | $ | 0.36 | |
| (1) | The nine months ended September 30, 2013 includes 8,536,178 Class C and Class D units. The nine months ended September 30, 2012 includes 6,795,130 Class C units. |
We exclude potentially dilutive securities from the determination of diluted earnings per unit (as well as their related income statement impacts) when their impact on net income attributable to CMLP per limited partner unit is anti-dilutive. For the three and nine months ended September 30, 2013, we excluded 3,262,275 and 1,099,375 preferred security units issued by our consolidated subsidiary, Crestwood Niobrara LLC (Crestwood Niobrara), from our diluted earnings per unit. There were no units excluded from our diluted earnings per unit as we did not have any anti-dilutive units for the three and nine months ended September 30, 2012. Our potentially dilutive securities for the three and nine months ended September 30, 2013 and 2012 consist of unvested phantom units.
Distributions. Our Second Amended and Restated Agreement of Limited Partnership, dated February 19, 2008, as amended (Partnership Agreement), requires that, within 45 days after the end of each quarter, we distribute all of our Available Cash (as defined therein) to unitholders of record on the applicable record date, as determined by our General Partner. As a result of the Merger on October 7, 2013 described in Note 1. Organization and Description of Business, there were no distributions to CMLP’s unitholders for the three months ended September 30, 2013. Under the merger agreement, CMLP unitholders received 1.07 units of NRGM units for each unit of CMLP they owned and such unitholders will receive a distribution for the three months ended September 30, 2013 as determined by Crestwood Midstream’s board of directors.
15
The following table presents distributions for 2013 and 2012 (In millions, except per unit data):
| | | | | | | | | | | | | | | | | | | | | | | | | | | | | | | | | | | | | | |
| | | | | | | | Distributions Paid | | | | |
| | | | | | | | Limited Partner | | | General Partner | | | | |
Payment Date | | Attributable to the Quarter Ended | | Per Unit
Distribution | | | Cash paid
to common(1) | | | Paid-In-Kind
Value to
Class C
unitholders | | | Paid-In-Kind
Value to
Class D
unitholder | | | Cash paid
to General
Partner
and IDR | | | Paid-In-Kind
Value to
Class C
unitholder | | | Paid-In-Kind
Value to
Class D
unitholder | | | Total
Cash | | | Total
Distribution | |
2013 | | | | | | | | | | | | | | | | | | | | | | | | | | | | | | | | | | | | | | |
August 9, 2013 | | June 30, 2013 | | $ | 0.51 | | | $ | 27.4 | | | $ | — | | | $ | 3.2 | | | $ | 5.2 | | | $ | — | | | $ | 0.5 | | | $ | 32.6 | | | $ | 36.3 | |
May 10, 2013 | | March 31, 2013 | | $ | 0.51 | | | $ | 27.4 | | | $ | — | | | $ | 3.2 | | | $ | 5.2 | | | $ | — | | | $ | 0.5 | | | $ | 32.6 | | | $ | 36.3 | |
February 12, 2013 | | December 31, 2012 | | $ | 0.51 | �� | | $ | 21.0 | | | $ | 3.7 | | | $ | — | | | $ | 4.1 | | | $ | 0.6 | | | $ | — | | | $ | 25.1 | | | $ | 29.4 | |
2012 | | | | | | | | | | | | | | | | | | | | | | | | | | | | | | | | | | | | | | |
November 9, 2012 | | September 30, 2012 | | $ | 0.51 | | | $ | 21.0 | | | $ | 3.5 | | | $ | — | | | $ | 4.1 | | | $ | 0.6 | | | $ | — | | | $ | 25.1 | | | $ | 29.2 | |
August 10, 2012 | | June 30, 2012 | | $ | 0.50 | | | $ | 20.6 | | | $ | 3.4 | | | $ | — | | | $ | 3.7 | | | $ | 0.5 | | | $ | — | | | $ | 24.3 | | | $ | 28.2 | |
May 11, 2012 | | March 31, 2012 | | $ | 0.50 | | | $ | 18.2 | | | $ | 3.4 | | | $ | — | | | $ | 3.3 | | | $ | 0.5 | | | $ | — | | | $ | 21.5 | | | $ | 25.4 | |
February 10, 2012 | | December 31, 2011 | | $ | 0.49 | | | $ | 17.9 | | | $ | 3.2 | | | $ | — | | | $ | 2.8 | | | $ | 0.5 | | | $ | — | | | $ | 20.7 | | | $ | 24.4 | |
| (1) | Distributions for the quarters ended June 30, 2012 and September 30, 2012 exclude approximately $3 million and $4 million paid by CMM to Crestwood Holdings. |
Our Class D units are substantially similar in all respects to our existing common units, representing limited partner interests, except that we have the option to pay distributions to our Class D unitholders with cash or by issuing additional Paid-In-Kind Class D units, based upon the volume weighted-average price of our common units for the 10 trading days immediately preceding the date the distribution is declared. We issued 151,238 and 141,422 additional Class D units in lieu of paying cash quarterly distributions on our Class D units attributable to the quarters ended March 31, 2013 and June 30, 2013.
On April 1, 2013, our outstanding Class C units converted to common units on a one-for-one basis. Prior to the conversion of our Class C units to common, we had the option to pay distributions to our Class C unitholders with cash or by issuing additional Paid-In-Kind Class C units, based upon the volume weighted-average price of our common units for the 10 trading days immediately preceding the date the distribution is declared. The unitholders of the converted units received a quarterly cash distribution for the period ended March 31, 2013 although the Class C units were not converted until April 1, 2013. We issued 136,128, 138,731 and 174,230 additional Class C units in lieu of paying cash quarterly distributions on our Class C units attributable to the quarters ended March 31, 2012, June 30, 2012 and September 30, 2012.
On March 22, 2013, we completed a public offering of 4,500,000 common units, representing limited partner interests in us, at a price of $23.90 per common unit ($23.00 per common unit, net of underwriting discounts) providing net proceeds of approximately $103.5 million. We granted the underwriters a 30-day option to purchase up to 675,000 additional common units if the underwriters sold more than 4,500,000 common units in the offering. The underwriters exercised this option on April 5, 2013 providing net proceeds of approximately $15.5 million. The unitholders of these common units received a quarterly distribution for the period ended March 31, 2013.
5. INVESTMENT IN UNCONSOLIDATED AFFILIATE
On July 19, 2013, Crestwood Niobrara acquired RKI Exploration and Production, LLC’s (RKI) 50% interest in Jackalope Gas Gathering Services, L.L.C. (Jackalope) for approximately $108 million. RKI is a privately-owned, independent exploration and production company in which an affiliate of our General Partner owns a significant minority ownership interest, and therefore is considered our related party. Access Midstream Partners, L.P. (Access) owns the remaining 50% interest in and operates Jackalope. Crestwood Niobrara manages the commercial operations of the Jackalope system. We account for our investment in Jackalope under the equity method of accounting.
The Jackalope gathering and processing system is currently comprised of approximately 100 miles of gathering pipelines and 9,400 horsepower of compression equipment located in Converse County, Wyoming. The existing Jackalope assets and planned future development are supported by a 20-year gathering and processing agreement with Chesapeake Energy Corporation and RKI under which Jackalope receives cost-of-service based fees with annual redeterminations. The gathering and processing agreements provide for an area of dedication of approximately 311,000 gross acres located in the core of the Powder River Basin Niobrara Shale. During the three months ended September 30, 2013, Crestwood Niobrara contributed an additional $20 million to Jackalope to fund its construction projects.
16
We have reflected the earnings from our investment in Jackalope in our consolidated statements of income, which includes our share of net earnings based on our ownership interest and other adjustments recorded by us as discussed below. During the three and nine months ended September 30, 2013, our share of Jackalope’s net earnings was approximately $0.2 million. As of September 30, 2013, our investment balance in Jackalope exceeded our equity in the underlying net assets of Jackalope by approximately $57 million. We amortize and generally assess the recoverability of this amount based on the life of Jackalope’s gathering agreement. The amortization is reflected as a reduction of our earnings from unconsolidated affiliate, and during the three and nine months ended September 30, 2013, we recorded amortization expense of approximately $0.6 million.
In accordance with the Jackalope limited liability company agreement, Jackalope is required to make quarterly distributions of its available cash to its members based on their respective ownership percentage.
6. PREFERRED EQUITY OF SUBSIDIARY
In conjunction with Crestwood Niobrara’s acquisition discussed in Note 5. Investment in Unconsolidated Affiliate, Crestwood Niobrara issued a preferred interest of approximately $81 million to a subsidiary of General Electric Capital Corporation and GE Structured Finance, Inc. (collectively, GE EFS). The preferred interest is reflected as noncontrolling interest in our consolidated financial statements. During the three and nine months ended September 30, 2013, we allocated approximately $2 million of net income to the noncontrolling interest, which was based on the overall return attributable to the preferred security.
Crestwood Niobrara will fund 75% of future capital contributions to Jackalope through additional preferred interest issuances to GE EFS (up to a maximum of an additional $69 million), with the remainder to be funded through our capital contributions to Crestwood Niobrara. During the three and nine months ended September 30, 2013, GE EFS contributed approximately $96 million (which consisted of the initial contribution of $81 million and additional capital contributions of approximately $15 million) to Crestwood Niobrara in exchange for an equivalent number of preferred units. The proceeds from the initial GE EFS contribution were used to purchase the investment in Jackalope and the proceeds from the subsequent contributions were used to fund capital contributions to the Jackalope investment.
In accordance with the Crestwood Niobrara limited liability company agreement, Crestwood Niobrara has the option to pay distributions to GE EFS with cash or by issuing additional preferred units through the January 2015 distribution. On October 30, 2013, Crestwood Niobrara issued GE EFS approximately 2,161,657 million units in lieu of paying a cash distribution. We serve as the managing member of Crestwood Niobrara and, subject to certain restrictions, we have the ability to redeem GE EFS’ preferred security in either cash or CMLP common units of the combined partnership as discussed in Note 1.Organization and Description of Business.
7. FINANCIAL INSTRUMENTS
Fair Values
We separate the fair values of our financial instruments into three levels (Levels 1, 2 and 3) based on our assessment of the availability of observable market data and the significance of non-observable data used to determine fair value. Our assessment and classification of an instrument within a level can change over time based on the maturity or liquidity of the instrument and would be reflected at the end of the period in which the change occurs. At September 30, 2013 and December 31, 2012, there have been no changes to the inputs and valuation techniques used to measure fair value, the types of instruments, or the levels in which they are classified.
Cash and Cash Equivalents, Accounts Receivable and Accounts Payable. As of September 30, 2013 and December 31, 2012, the carrying amounts of cash and cash equivalents, accounts receivable and accounts payable represent fair value based on the short-term nature of these instruments.
Credit Facilities. The fair value of our credit facilities approximates their carrying amounts as of September 30, 2013 and December 31, 2012 due primarily to the variable nature of the interest rate of the instrument, which is considered a Level 2 fair value measurement.
17
Senior Notes. We estimated the fair value of our 7.75% Senior Notes due April 2019 (Senior Notes) (representing a Level 2 fair value measurement) primarily based on quoted market prices for the same or similar issuances. The following table reflects the carrying value and fair value of our Senior Notes (In millions):
| | | | | | | | | | | | | | | | |
| | | September 30, 2013 | | | December 31, 2012 | |
| | | Carrying
Amount | | | Fair
Value | | | Carrying
Amount | | | Fair
Value | |
Senior Notes | | $ | 351 | | | $ | 369 | | | $ | 351 | | | $ | 365 | |
Debt
Our long-term debt consists of the following (In thousands):
| | | | | | | | |
| | | September 30,
2013 | | | December 31,
2012 | |
CMM Credit Facility, due March 2017 | | $ | 191,900 | | | $ | 127,000 | |
CMLP Credit Facility, due November 2017 | | | 356,200 | | | | 206,700 | |
Senior Notes, due April 2019 | | | 350,000 | | | | 350,000 | |
| | | | | | | | |
| | | 898,100 | | | | 683,700 | |
Plus: Unamortized premium on Senior Notes | | | 1,286 | | | | 1,461 | |
| | | | | | | | |
Total long-term debt | | $ | 899,386 | | | $ | 685,161 | |
| | | | | | | | |
Credit Facilities
CMM Credit Facility. In conjunction with the Merger discussed in Note 1. Organization and Description of Business, we terminated the CMM credit agreement (CMM Credit Facility). No amounts were outstanding under the CMM Credit Facility following the consummation of the Merger. The CMM credit agreement allowed for revolving loans, letters of credit and swingline loans in an aggregate principal amount of up to $200 million. The CMM Credit Facility was secured by substantially all of CMM’s assets.
Borrowings under the CMM Credit Facility bore interest at the London Interbank Offered Rate (LIBOR) plus an applicable margin or base rate as defined in the CMM Credit Facility. Under the terms of the CMM Credit Facility, the applicable margin under LIBOR was 2.8% and 2.5% at September 30, 2013 and December 31, 2012. The weighted-average interest rate at September 30, 2013 and December 31, 2012 was 3.0% and 2.8%. For the three and nine months ended September 30, 2013, our average outstanding borrowings were approximately $157 million and $126 million. For the three and nine months ended September 30, 2013, our maximum outstanding borrowings were approximately $192 million.
CMLP Credit Facility. In conjunction with the Merger discussed in Note 1. Organization and Description of Business, we terminated the CMLP amended and restated senior secured credit agreement (CMLP Credit Facility). No amounts were outstanding under the CMLP Credit Facility following the consummation of the Merger. The CMLP Credit Facility allowed for revolving loans, letters of credit and swingline loans in an aggregate amount of up to $550 million. The CMLP Credit Facility was secured by substantially all of CMLP’s assets and those of certain of its subsidiaries. As of September 30, 2013, the CMLP Credit Facility was guaranteed by our 100% owned subsidiaries except for Crestwood Niobrara and CMM and its consolidated subsidiaries.
Borrowings under the CMLP Credit Facility bore interest at LIBOR plus an applicable margin or a base rate as defined in the CMLP Credit Facility. Under the terms of the CMLP Credit Facility, the applicable margin under LIBOR borrowings was 2.8% and 2.5% at September 30, 2013 and December 31, 2012. The weighted-average interest rate as of September 30, 2013 and December 31, 2012 was 3.0% and 2.8%. For the three and nine months ended September 30, 2013, our average outstanding borrowings were $343 million and $330 million. For the three and nine months ended September 30, 2013, our maximum outstanding borrowings were $365 million and $373 million.
Senior Notes
In November 2012, we issued $150 million aggregate principal amount of 7.75% Senior Notes in a private placement offering. These notes were issued as additional notes under the indenture dated April 1, 2011 among us, Crestwood Midstream Finance Corporation, the guarantors names therein, and The Bank of New York Mellon Trust Company, N.A., as trustee, pursuant to which we previously issued our $200 million aggregate principal amount of 7.75% Senior Notes in April 2011. In conjunction with the Merger discussed in Note 1. Organization and Description of Business, CMLP entered into a supplemental indenture governing the 7.75% Senior Notes. Pursuant to the supplemental indenture, Crestwood Midstream Partners LP (formerly NRGM) and Crestwood Midstream Finance Corp (formerly NRGM Finance Corp.), which we refer to together as the Successor Issuers, have unconditionally assumed all of the obligations under the 7.75% Senior Notes due April 2019. In addition, certain subsidiaries have entered into financial guarantees pursuant to which they unconditionally guarantee the obligations under the indenture and Senior Notes.
18
8. ACCOUNTS PAYABLE, ACCRUED EXPENSES AND OTHER LIABILITIES
Accounts payable, accrued expenses and other liabilities consist of the following (In thousands):
| | | | | | | | |
| | | September 30,
2013 | | | December 31,
2012 | |
Accrued expenses | | $ | 11,305 | | | $ | 9,608 | |
Accrued property taxes | | | 5,843 | | | | 5,638 | |
Accrued product purchases payable | | | 1,818 | | | | 2,450 | |
Tax payable | | | 1,353 | | | | 2,159 | |
Interest payable | | | 14,054 | | | | 7,505 | |
Accounts payable | | | 6,653 | | | | 2,278 | |
Other | | | 9 | | | | 79 | |
| | | | | | | | |
Total accounts payable, accrued expenses and other liabilities | | $ | 41,035 | | | $ | 29,717 | |
| | | | | | | | |
9. COMMITMENTS AND CONTINGENT LIABILITIES
Legal Proceedings
Class Action Lawsuits. Five putative class action lawsuits challenging the Merger were filed, four in federal court in the United States District Court for the Southern District of Texas: (i) Abraham Knoll v. Robert G. Phillips, et al. (Case No. 4:13-cv-01528, filed May 23, 2013); (ii) Greg Podell v. Crestwood Midstream Partners, LP, et al. (Case No. 4:13-cv-01599, filed May 30, 2013); (iii) Johnny Cooper v. Crestwood Midstream Partners LP, et al. (Case No. 4:13-cv-01660, filed June 7, 2013), subsequently replaced as named plaintiff in this action by Linda Giaimo; and (iv) Steven Elliot LLC v. Robert G. Phillips, et al. (Case No. 4:13-cv-01763, filed June 17, 2013), and one in the Delaware Court of Chancery;Hawley v. Crestwood Midstream Partners LP, et al. (Case No. 8689-VCL, filed June 27, 2013). All the cases name Crestwood, Crestwood Gas Services GP LLC, Crestwood Holdings LLC, the current and former directors of Crestwood Gas Services GP LLC, Inergy, L.P., Inergy Midstream, L.P., NRGM GP, LLC, and Intrepid Merger Sub, LLC as defendants. All of the suits were brought by a purported holder of common units of Crestwood, both individually and on behalf of a putative class consisting of holders of common units of Crestwood. The lawsuits generally alleged, among other things, that the directors of Crestwood Gas Services GP LLC breached their fiduciary duties to holders of common units of Crestwood by agreeing to a transaction with inadequate consideration and unfair terms and pursuant to an inadequate process. The lawsuits further alleged that Inergy, L.P., Inergy Midstream, L.P., NRGM GP, LLC, and Intrepid Merger Sub, LLC aided and abetted the Crestwood directors in the alleged breach of their fiduciary duties. The lawsuits sought, in general, (i) injunctive relief enjoining the merger, (ii) in the event the merger is consummated, rescission or an award of rescissory damages, (iii) an award of plaintiffs’ costs, including reasonable attorneys’ and experts’ fees, (iv) the accounting by the defendants to plaintiffs for all damages caused by the defendants, and (v) such further equitable relief as the court deems just and proper. The four federal actions also asserted claims of inadequate disclosure under Sections 14(a) and 20(a) of the Securities Exchange Act of 1934, and theElliot case also named Citigroup Global Markets Inc. as an alleged aider and abettor. The plaintiff in theHawleyaction in Delaware filed a motion for expedited proceedings but subsequently withdrew that motion and then filed a stipulation voluntarily dismissing the action without prejudice, which was granted by the Court, such that theHawley action was dismissed. The plaintiff in the Elliot action filed a motion for expedited discovery, which was denied by the Court. The plaintiffs in theKnoll, Podell, Cooper, andElliot actions filed an unopposed motion to consolidate these four cases, which the Court granted and captioned the consolidated matters asIn re: Crestwood Midstream Partners Unitholder Litigation, Lead Case No. 4:12-cv-01528 (the Consolidated Action). The plaintiffs entered into a Memorandum of Understanding (MOU) on September 24, 2013 to settle the Consolidated Action whereby the defendants denied liability. The settlement contemplated by the MOU is subject to a number of conditions, including notice to the class and final court approval following completion of a settlement hearing. The defendants expect the Court to approve the terms of the MOU by the end of the first quarter of 2014. The anticipated settlement of the MOU will not have a material impact to our consolidated financial statements.
From time to time, we are party to certain legal or administrative proceedings that arise in the ordinary course and are incidental to our business. There are currently no such pending proceedings to which we are a party that our management believes will have a material adverse effect on our results of operations, cash flows or financial condition. However, future events or circumstances, currently unknown to management, will determine whether the resolution of any litigation or claims will ultimately have a material effect on our results of operations, cash flows or financial condition in any future reporting periods. At September 30, 2013 and December 31, 2012, we had $0.4 million and less than $0.1 million accrued for our legal proceedings.
19
Regulatory Compliance
In the ordinary course of our business, we are subject to various laws and regulations. In the opinion of our management, compliance with current laws and regulations will not have a material effect on our results of operations, cash flows or financial condition.
Environmental Compliance
Our operations are subject to stringent and complex laws and regulations pertaining to health, safety, and the environment. We are subject to laws and regulations at the federal, state and local levels that relate to air and water quality, hazardous and solid waste management and disposal and other environmental matters. The cost of planning, designing, constructing and operating our facilities must incorporate compliance with environmental laws and regulations and safety standards. Failure to comply with these laws and regulations may trigger a variety of administrative, civil and potentially criminal enforcement measures. At September 30, 2013 and December 31, 2012, we had accrued approximately $0.3 million and $0.2 million for environmental matters, which are based on our undiscounted estimate of amounts we will spend on environmental compliance and remediation. We estimate that our potential liability for reasonably possible outcomes related to our environmental exposures could range from approximately $0.3 million to $0.5 million.
10. INCOME TAXES
No provision for federal or state income taxes is included in our results of operations as such income is taxable directly to the partners. Accordingly, each partner is responsible for its share of federal and state income tax. Net earnings for financial statement purposes may differ significantly from taxable income reportable to each partner as a result of differences between the tax basis and financial reporting basis of assets and liabilities.
We are responsible for our portion of the Texas Margin tax that is included in Crestwood Holdings’ consolidated Texas franchise tax return. Our current tax liability will be assessed based on 0.7% of the gross revenue apportioned to Texas. The margin tax qualifies as an income tax under GAAP, which requires us to recognize the impact of this tax on the temporary differences between the financial statement assets and liabilities and their tax basis attributable to such tax. See our Form 8-K filed with the SEC on May 10, 2013 for more information about our income taxes.
11. EQUITY PLAN
In conjunction with the Merger discussed in Note 1. Business and Description of Business, we terminated our Fourth Amended and Restated 2007 Equity Plan (2007 Equity Plan). All of our unvested phantom and restricted units became vested upon consummation of the Merger and all unamortized compensation expense related to those units was recognized on that date. The following table summarizes information regarding phantom and restricted unit activity during the nine months ended September 30, 2013:
| | | | | | | | | | | | | | | | |
| | | Payable In Cash | | | Payable In Units | |
| | | Units | | | Weighted-
Average Grant
Date Fair
Value | | | Units | | | Weighted-
Average Grant
Date Fair
Value | |
Unvested—January 1, 2013 | | | 8,312 | | | $ | 26.45 | | | | 221,992 | | | $ | 28.35 | |
Vested—phantom units | | | (3,013 | ) | | $ | 27.22 | | | | (71,006 | ) | | $ | 28.70 | |
Vested—restricted units | | | — | | | | — | | | | (11,349 | ) | | $ | 26.40 | |
Granted—phantom units | | | — | | | | — | | | | 161,807 | | | $ | 24.33 | |
Granted—restricted units | | | — | | | | — | | | | 27,900 | | | $ | 24.86 | |
Canceled—phantom units I | | | (354 | ) | | $ | 25.81 | | | | (7,114 | ) | | $ | 27.96 | |
| | | | | | | | | | | | | | | | |
Unvested—September 30, 2013 | | | 4,945 | | | $ | 26.02 | | | | 322,230 | | | $ | 26.01 | |
| | | | | | | | | | | | | | | | |
As of September 30, 2013 and December 31, 2012, we had total unamortized compensation expense of approximately $4 million and $3 million related to phantom and restricted units. As discussed above, the vesting period of our phantom and restricted units were accelerated upon consummation of the Merger. We recognized compensation expense of approximately $2.1 million and $1.5 million during the nine months ended September 30, 2013 and 2012, included in operating expenses on our consolidated statements of income. We granted phantom and restricted units with a grant date fair value of approximately $5 million during the nine months ended September 30, 2013.
20
Under the 2007 Equity Plan, participants who were granted restricted units could elect to have us withhold common units to satisfy minimum statutory tax withholding obligations arising in connection with the vesting of non-vested common units. Any such common units withheld were returned to the 2007 Equity Plan on the applicable vesting dates, which corresponded to the times at which income was recognized by the employee. When we withhold these common units, we were required to remit to the appropriate taxing authorities the fair value of the units withheld as of the vesting date. The number of units withheld was determined based on the closing price per common unit as reported on the NYSE on such dates. During the nine months ended September 30, 2013 and 2012, we withheld 3,341 common units and 414 common units to satisfy employee tax withholding obligations.
12. TRANSACTIONS WITH RELATED PARTIES
We enter into transactions with our affiliates within the ordinary course of business. Concurrent with the Merger described in Note 1.Organization and Description of Business, Quicksilver Resources, Inc. is no longer a related party. For a further discussion of our related party transactions during the three and nine months ended September 30, 2013, see Note 5.Investment in Unconsolidated Affiliate. For a description of our affiliated transactions, see our 2012 Annual Report on Form 10-K.
Reimbursements from our affiliates were approximately $1 million and $2 million for the three and nine months September 30, 2013, and less than $1 million for the three and nine months ended September 30, 2012. The following table shows revenues and expenses from our affiliates for the three and nine months ended September 30, 2013 and 2012 (In millions):
| | | | | | | | | | | | | | | | |
| | | Three Months Ended
September 30, | | | Nine Months Ended
September 30, | |
| | | 2013 | | | 2012 | | | 2013 | | | 2012 | |
Operating revenues | | $ | 24 | | | $ | 28 | | | $ | 74 | | | $ | 87 | |
Operating expenses | | | 13 | | | | 5 | | | | 39 | | | | 15 | |
13. SEGMENT INFORMATION
We conduct our operations in the midstream sector with eight operating segments, four of which are reportable segments. These operating segments reflect the way we internally report the financial information used to make decisions and allocate resources in connection with our operations. We evaluate the performance of our operating segments based on EBITDA, which represents operating income plus depreciation, amortization and accretion expense and income tax expense.
Our reportable segments reflect the primary geographic areas in which we operate and consist of Marcellus, Barnett, Fayetteville and Granite Wash, all of which are located within the United States. Our reportable segments are engaged in the gathering, processing, treating, compression, transportation and sales of natural gas and delivery of NGLs. Our Other operating segment consists of those operating segments or reporting units that did not meet quantitative reporting thresholds. In conjunction with the Merger described in Note 1, we revised our segments to reflect the new operations of the combined entities.
For the nine months ended September 30, 2013 and 2012, one of our customers in the Barnett segment accounted for approximately 34% and 50% of our total revenues. In each of our Marcellus and Granite Wash segments, one customer accounted for approximately 21% and 10%, respectively, of our revenues for the nine months ended September 30, 2013. In addition, in our Fayetteville segment, one customer accounted for approximately 10% of our total revenues for the nine months ended September 30, 2012.
The following table is a reconciliation of net income to EBITDA (In thousands):
| | | | | | | | | | | | | | | | |
| | | Three Months Ended | | | Nine Months Ended | |
| | | September 30, | | | September 30, | |
| | | 2013 | | | 2012 | | | 2013 | | | 2012 | |
Net income | | $ | 6,388 | | | $ | 14,381 | | | $ | 20,216 | | | $ | 30,984 | |
Add: | | | | | | | | | | | | | | | | |
Interest and debt expense | | | 11,625 | | | | 8,905 | | | | 34,260 | | | | 25,425 | |
Income tax expense | | | 347 | | | | 306 | | | | 1,024 | | | | 884 | |
Depreciation, amortization and accretion expense | | | 14,557 | | | | 11,568 | | | | 49,618 | | | | 35,909 | |
| | | | | | | | | | | | | | | | |
EBITDA | | $ | 32,917 | | | $ | 35,160 | | | $ | 105,118 | | | $ | 93,202 | |
| | | | | | | | | | | | | | | | |
21
The following tables summarize the reportable segment data for the three and nine months ended September 30, 2013 and 2012 (In thousands):
| | | | | | | | | | | | | | | | | | | | | | | | | | | | |
| | | Three Months Ended September 30, 2013 | |
| | | Marcellus | | | Barnett | | | Fayetteville | | | Granite
Wash | | | Other | | | Corporate | | | Total | |
Operating revenues | | $ | 15,914 | | | $ | 8,257 | | | $ | 7,799 | | | $ | 12,733 | | | $ | 2,288 | | | $ | — | | | $ | 46,991 | |
Operating revenues—related party | | | 74 | | | | 23,624 | | | | — | | | | 449 | | | | — | | | | — | | | | 24,147 | |
Product purchases | | | — | | | | 157 | | | | 249 | | | | 3,872 | | | | 1,017 | | | | — | | | | 5,295 | |
Product purchases—related party | | | — | | | | — | | | | — | | | | 7,556 | | | | — | | | | — | | | | 7,556 | |
Operations and maintenance expense | | | 2,832 | | | | 7,717 | | | | 2,303 | | | | 810 | | | | 1,233 | | | | — | | | | 14,895 | |
General and administrative expense | | | — | | | | — | | | | — | | | | — | | | | — | | | | 10,367 | | | | 10,367 | |
Goodwill impairment | | | — | | | | — | | | | — | | | | — | | | | (4,053 | ) | | | — | | | | (4,053 | ) |
Gain on sale of asset | | | — | | | | — | | | | — | | | | 4,392 | | | | — | | | | — | | | | 4,392 | |
Loss from unconsolidated affiliate | | | — | | | | — | | | | — | | | | — | | | | (447 | ) | | | — | | | | (447 | ) |
| | | | | | | | | | | | | | | | | | | | | | | | | | | | |
EBITDA | | $ | 13,156 | | | $ | 24,007 | | | $ | 5,247 | | | $ | 5,336 | | | $ | (4,462 | ) | | $ | (10,367 | ) | | $ | 32,917 | |
| | | | | | | | | | | | | | | | | | | | | | | | | | | | |
Goodwill | | $ | 8,618 | | | $ | — | | | $ | 76,767 | | | $ | 14,211 | | | $ | — | | | $ | — | | | $ | 99,596 | |
Total assets | | $ | 672,627 | | | $ | 604,569 | | | $ | 297,064 | | | $ | 77,719 | | | $ | 204,053 | | | $ | 27,951 | | | $ | 1,883,983 | |
Capital expenditures | | $ | 71,124 | | | $ | 156 | | | $ | 4,106 | | | $ | 3,958 | | | $ | 4,794 | | | $ | 161 | | | $ | 84,299 | |
| |
| | | Three Months Ended September 30, 2012 | |
| | | Marcellus | | | Barnett | | | Fayetteville | | | Granite
Wash | | | Other | | | Corporate | | | Total | |
Operating revenues | | $ | 7,976 | | | $ | 5,390 | | | $ | 7,174 | | | $ | 10,702 | | | $ | 3,815 | | | $ | — | | | $ | 35,057 | |
Operating revenues—related party | | | — | | | | 27,956 | | | | — | | | | — | | | | — | | | | — | | | | 27,956 | |
Product purchases | | | — | | | | 60 | | | | 137 | | | | 9,481 | | | | 663 | | | | — | | | | 10,341 | |
Operations and maintenance expense | | | 815 | | | | 6,963 | | | | 1,855 | | | | 560 | | | | 749 | | | | — | | | | 10,942 | |
General and administrative expense | | | — | | | | — | | | | — | | | | — | | | | — | | | | 6,570 | | | | 6,570 | |
| | | | | | | | | | | | | | | | | | | | | | | | | | | | |
EBITDA | | $ | 7,161 | | | $ | 26,323 | | | $ | 5,182 | | | $ | 661 | | | $ | 2,403 | | | $ | (6,570 | ) | | $ | 35,160 | |
| | | | | | | | | | | | | | | | | | | | | | | | | | | | |
Goodwill | | $ | — | | | $ | — | | | $ | 76,767 | | | $ | 14,211 | | | $ | 4,053 | | | $ | — | | | $ | 95,031 | |
Total assets | | $ | 396,634 | | | $ | 619,768 | | | $ | 304,669 | | | $ | 77,611 | | | $ | 83,701 | | | $ | 17,097 | | | $ | 1,499,480 | |
Capital expenditures | | $ | 4,540 | | | $ | 4,719 | | | $ | 1,086 | | | $ | 448 | | | $ | 955 | | | $ | 225 | | | $ | 11,973 | |
22
| | | | | | | | | | | | | | | | | | | | | | | | | | | | |
| | | Nine Months Ended September 30, 2013 | |
| | | Marcellus | | | Barnett | | | Fayetteville | | | Granite
Wash | | | Other | | | Corporate | | | Total | |
Operating revenues | | $ | 45,497 | | | $ | 26,647 | | | $ | 21,383 | | | $ | 39,368 | | | $ | 7,441 | | | $ | — | | | $ | 140,336 | |
Operating revenues—related party | | | 162 | | | | 72,856 | | | | — | | | | 1,299 | | | | — | | | | — | | | | 74,317 | |
Product purchases | | | — | | | | 558 | | | | 732 | | | | 13,936 | | | | 2,971 | | | | — | | | | 18,197 | |
Product purchases—related party | | | — | | | | — | | | | — | | | | 22,191 | | | | — | | | | — | | | | 22,191 | |
Operations and maintenance expense | | | 7,774 | | | | 21,284 | | | | 6,747 | | | | 2,103 | | | | 2,595 | | | | — | | | | 40,503 | |
General and administrative expense | | | — | | | | — | | | | — | | | | — | | | | — | | | | 28,536 | | | | 28,536 | |
Goodwill impairment | | | — | | | | — | | | | — | | | | — | | | | (4,053 | ) | | | — | | | | (4,053 | ) |
Gain on sale of asset | | | — | | | | — | | | | — | | | | 4,392 | | | | — | | | | — | | | | 4,392 | |
Loss from unconsolidated affiliate | | | — | | | | — | | | | — | | | | — | | | | (447 | ) | | | — | | | | (447 | ) |
| | | | | | | | | | | | | | | | | | | | | | | | | | | | |
EBITDA | | $ | 37,885 | | | $ | 77,661 | | | $ | 13,904 | | | $ | 6,829 | | | $ | (2,625 | ) | | $ | (28,536 | ) | | $ | 105,118 | |
| | | | | | | | | | | | | | | | | | | | | | | | | | | | |
Goodwill | | $ | 8,618 | | | $ | — | | | $ | 76,767 | | | $ | 14,211 | | | $ | — | | | $ | — | | | $ | 99,596 | |
Total assets | | $ | 672,627 | | | $ | 604,569 | | | $ | 297,064 | | | $ | 77,719 | | | $ | 204,053 | | | $ | 27,951 | | | $ | 1,883,983 | |
Capital expenditures | | $ | 135,845 | | | $ | 8,925 | | | $ | 6,818 | | | $ | 6,481 | | | $ | 5,954 | | | $ | 573 | | | $ | 164,596 | |
| |
| | | Nine Months Ended September 30, 2012 | |
| | | Marcellus | | | Barnett | | | Fayetteville | | | Granite
Wash | | | Other | | | Corporate | | | Total | |
Operating revenues | | $ | 15,003 | | | $ | 12,053 | | | $ | 20,368 | | | $ | 28,021 | | | $ | 9,791 | | | $ | — | | | $ | 85,236 | |
Operating revenues—related party | | | — | | | | 86,739 | | | | — | | | | — | | | | — | | | | — | | | | 86,739 | |
Product purchases | | | — | | | | 60 | | | | 343 | | | | 24,514 | | | | 1,838 | | | | — | | | | 26,755 | |
Operations and maintenance expense | | | 1,328 | | | | 18,438 | | | | 6,399 | | | | 1,619 | | | | 2,269 | | | | — | | | | 30,053 | |
General and administrative expense | | | — | | | | — | | | | — | | | | — | | | | — | | | | 21,965 | | | | 21,965 | |
| | | | | | | | | | | | | | | | | | | | | | | | | | | | |
EBITDA | | $ | 13,675 | | | $ | 80,294 | | | $ | 13,626 | | | $ | 1,888 | | | $ | 5,684 | | | $ | (21,965 | ) | | $ | 93,202 | |
| | | | | | | | | | | | | | | | | | | | | | | | | | | | |
Goodwill | | $ | — | | | $ | — | | | $ | 76,767 | | | $ | 14,211 | | | $ | 4,053 | | | $ | — | | | $ | 95,031 | |
Total assets | | $ | 396,634 | | | $ | 619,768 | | | $ | 304,669 | | | $ | 77,611 | | | $ | 83,701 | | | $ | 17,097 | | | $ | 1,499,480 | |
Capital expenditures | | $ | 5,378 | | | $ | 10,718 | | | $ | 10,040 | | | $ | 2,411 | | | $ | 5,140 | | | $ | 659 | | | $ | 34,346 | |
14. CONDENSED CONSOLIDATING FINANCIAL STATEMENTS
In conjunction with the Merger discussed in Note 1. Organization and Description of Business, CMLP entered into a supplemental indenture governing the 7.75% Senior Notes. Pursuant to the supplemental indenture, Crestwood Midstream Partners LP (formerly NRGM) and Crestwood Midstream Finance Corp (formerly NRGM Finance Corp.), which we refer to together as the Successor Issuers, have unconditionally assumed all of the obligations under the 7.75% Senior Notes due April 2019. In addition, certain subsidiaries have entered into financial guarantees pursuant to which they unconditionally guarantee the obligations under the indenture and Senior Notes. Prior to the Merger, the CMLP Credit Facility and our Senior Notes were fully and unconditionally guaranteed, jointly and severally, by CMLP’s present and future direct and indirect 100% owned subsidiaries (the Guarantor Subsidiaries), except for Crestwood Niobrara and CMM and its consolidated subsidiaries (the Non-Guarantor Subsidiaries). CMLP (Issuer) issued the Senior Notes together with Crestwood Midstream Finance Corporation (Co-Issuer). The Co-Issuer is our 100% owned subsidiary and has no material assets, operations, revenues or cash flows other than those that were related to its service as co-issuer of our Senior Notes. Accordingly, it had no ability to service obligations on our debt securities.
The following reflects condensed consolidating financial information of the Issuer, Co-Issuer, Guarantor Subsidiaries, Non-Guarantor Subsidiaries, eliminating entries to combine the entities and our consolidated results as of September 30, 2013 and December 31, 2012 and for the three and nine months ended September 30, 2013 and 2012.
23
| | | | | | | | | | | | | | | | | | | | | | | | |
| | | For the Three Months Ended September 30, 2013 | |
| | | Issuer | | | Co-Issuer | | | Guarantor
Subsidiaries | | | Non-Guarantor
Subsidiaries | | | Eliminations | | | Consolidated | |
| | | (In thousands) | |
Operating revenues | | $ | — | | | $ | — | | | $ | 55,457 | | | $ | 15,681 | | | $ | — | | | $ | 71,138 | |
Operating expenses | | | 245 | | | | — | | | | 46,077 | | | | 6,348 | | | | — | | | | 52,670 | |
Goodwill impairment | | | — | | | | — | | | | (4,053 | ) | | | — | | | | — | | | | (4,053 | ) |
Gain on sale of asset | | | — | | | | — | | | | 4,392 | | | | — | | | | — | | | | 4,392 | |
| | | | | | | | | | | | | | | | | | | | | | | | |
Operating income (loss) | | | (245 | ) | | | — | | | | 9,719 | | | | 9,333 | | | | — | | | | 18,807 | |
Loss from unconsolidated affiliate | | | — | | | | — | | | | — | | | | (447 | ) | | | — | | | | (447 | ) |
Interest and debt expense | | | (10,518 | ) | | | — | | | | 42 | | | | (1,149 | ) | | | — | | | | (11,625 | ) |
| | | | | | | | | | | | | | | | | | | | | | | | |
Income (loss) before income tax | | | (10,763 | ) | | | — | | | | 9,761 | | | | 7,737 | | | | — | | | | 6,735 | |
Income tax expense | | | — | | | | — | | | | 347 | | | | — | | | | — | | | | 347 | |
| | | | | | | | | | | | | | | | | | | | | | | | |
Income (loss) before earnings from consolidated subsidiaries | | | (10,763 | ) | | | — | | | | 9,414 | | | | 7,737 | | | | — | | | | 6,388 | |
Earnings (loss) from consolidated subsidiaries | | | 17,151 | | | | — | | | | — | | | | — | | | | (17,151 | ) | | | — | |
| | | | | | | | | | | | | | | | | | | | | | | | |
Net income (loss) | | | 6,388 | | | | — | | | | 9,414 | | | | 7,737 | | | | (17,151 | ) | | | 6,388 | |
Net income attributable to noncontrolling interest | | | — | | | | — | | | | — | | | | 1,923 | | | | — | | | | 1,923 | |
| | | | | | | | | | | | | | | | | | | | | | | | |
Net income (loss) attributable to Crestwood Midstream Partners LP | | | 6,388 | | | | — | | | | 9,414 | | | | 5,814 | | | | (17,151 | ) | | | 4,465 | |
General partner’s interest in net income | | | 81 | | | | — | | | | — | | | | — | | | | — | | | | 81 | |
| | | | | | | | | | | | | | | | | | | | | | | | |
Limited partner’s interest in net income (loss) | | $ | 6,307 | | | $ | — | | | $ | 9,414 | | | $ | 5,814 | | | $ | (17,151 | ) | | $ | 4,384 | |
| | | | | | | | | | | | | | | | | | | | | | | | |
| |
| | | For the Three Months Ended September 30, 2012 | |
| | | Issuer | | | Co-Issuer | | | Guarantor
Subsidiaries | | | Non-Guarantor
Subsidiaries | | | Eliminations | | | Consolidated | |
| | | (In thousands) | |
Operating revenues | | $ | — | | | $ | — | | | $ | 55,037 | | | $ | 7,976 | | | $ | — | | | $ | 63,013 | |
Operating expenses | | | 179 | | | | — | | | | 37,009 | | | | 2,233 | | | | — | | | | 39,421 | |
| | | | | | | | | | | | | | | | | | | | | | | | |
Operating income (loss) | | | (179 | ) | | | — | | | | 18,028 | | | | 5,743 | | | | — | | | | 23,592 | |
Interest and debt expense | | | (8,147 | ) | | | — | | | | (55 | ) | | | (703 | ) | | | — | | | | (8,905 | ) |
| | | | | | | | | | | | | | | | | | | | | | | | |
Income (loss) before income tax | | | (8,326 | ) | | | — | | | | 17,973 | | | | 5,040 | | | | — | | | | 14,687 | |
Income tax expense | | | — | | | | — | | | | 306 | | | | — | | | | — | | | | 306 | |
| | | | | | | | | | | | | | | | | | | | | | | | |
Income (loss) before earnings from consolidated subsidiaries | | | (8,326 | ) | | | — | | | | 17,667 | | | | 5,040 | | | | — | | | | 14,381 | |
Earnings (loss) from consolidated subsidiaries | | | 22,707 | | | | — | | | | — | | | | — | | | | (22,707 | ) | | | — | |
| | | | | | | | | | | | | | | | | | | | | | | | |
Net income (loss) | | | 14,381 | | | | — | | | | 17,667 | | | | 5,040 | | | | (22,707 | ) | | | 14,381 | |
General partner’s interest in net income | | | 7,516 | | | | — | | | | — | | | | — | | | | — | | | | 7,516 | |
| | | | | | | | | | | | | | | | | | | | | | | | |
Limited partner’s interest in net income (loss) | | $ | 6,865 | | | $ | — | | | $ | 17,667 | | | $ | 5,040 | | | $ | (22,707 | ) | | $ | 6,865 | |
| | | | | | | | | | | | | | | | | | | | | | | | |
24
| | | | | | | | | | | | | | | | | | | | | | | | |
| | | For the Nine Months Ended September 30, 2013 | |
| | | Issuer | | | Co-Issuer | | | Guarantor
Subsidiaries | | | Non-Guarantor
Subsidiaries | | | Eliminations | | | Consolidated | |
| | | (In thousands) | |
Operating revenues | | $ | — | | | $ | — | | | $ | 169,389 | | | $ | 45,264 | | | $ | — | | | $ | 214,653 | |
Operating expenses | | | 640 | | | | — | | | | 135,891 | | | | 22,514 | | | | — | | | | 159,045 | |
Goodwill impairment | | | — | | | | — | | | | (4,053 | ) | | | — | | | | — | | | | (4,053 | ) |
Gain on sale of asset | | | — | | | | — | | | | 4,392 | | | | — | | | | — | | | | 4,392 | |
| | | | | | | | | | | | | | | | | | | | | | | | |
Operating income (loss) | | | (640 | ) | | | — | | | | 33,837 | | | | 22,750 | | | | — | | | | 55,947 | |
Loss from unconsolidated affiliate | | | — | | | | — | | | | — | | | | (447 | ) | | | — | | | | (447 | ) |
Interest and debt expense | | | (30,731 | ) | | | — | | | | (91 | ) | | | (3,438 | ) | | | — | | | | (34,260 | ) |
| | | | | | | | | | | | | | | | | | | | | | | | |
Income (loss) before income tax | | | (31,371 | ) | | | — | | | | 33,746 | | | | 18,865 | | | | — | | | | 21,240 | |
Income tax expense | | | — | | | | — | | | | 1,024 | | | | — | | | | — | | | | 1,024 | |
| | | | | | | | | | | | | | | | | | | | | | | | |
Income (loss) before earnings from consolidated subsidiaries | | | (31,371 | ) | | | — | | | | 32,722 | | | | 18,865 | | | | — | | | | 20,216 | |
Earnings (loss) from consolidated subsidiaries | | | 51,587 | | | | — | | | | — | | | | — | | | | (51,587 | ) | | | — | |
| | | | | | | | | | | | | | | | | | | | | | | | |
Net income (loss) | | | 20,216 | | | | — | | | | 32,722 | | | | 18,865 | | | | (51,587 | ) | | | 20,216 | |
Net income attributable to noncontrolling interest | | | — | | | | — | | | | — | | | | 1,923 | | | | — | | | | 1,923 | |
| | | | | | | | | | | | | | | | | | | | | | | | |
Net income (loss) attributable to Crestwood Midstream Partners LP | | | 20,216 | | | | — | | | | 32,722 | | | | 16,942 | | | | (51,587 | ) | | | 18,293 | |
General partner’s interest in net income | | | 10,474 | | | | — | | | | — | | | | — | | | | — | | | | 10,474 | |
| | | | | | | | | | | | | | | | | | | | | | | | |
Limited partner’s interest in net income (loss) | | $ | 9,742 | | | $ | — | | | $ | 32,722 | | | $ | 16,942 | | | $ | (51,587 | ) | | $ | 7,819 | |
| | | | | | | | | | | | | | | | | | | | | | | | |
| |
| | | For the Nine Months Ended September 30, 2012 | |
| | | Issuer | | | Co-Issuer | | | Guarantor
Subsidiaries | | | Non-Guarantor
Subsidiaries | | | Eliminations | | | Consolidated | |
| | | (In thousands) | |
Operating revenues | | $ | — | | | $ | — | | | $ | 156,972 | | | $ | 15,003 | | | $ | — | | | $ | 171,975 | |
Operating expenses | | | 397 | | | | — | | | | 106,961 | | | | 7,324 | | | | — | | | | 114,682 | |
| | | | | | | | | | | | | | | | | | | | | | | | |
Operating income (loss) | | | (397 | ) | | | — | | | | 50,011 | | | | 7,679 | | | | — | | | | 57,293 | |
Interest and debt expense | | | (23,896 | ) | | | — | | | | (149 | ) | | | (1,380 | ) | | | — | | | | (25,425 | ) |
| | | | | | | | | | | | | | | | | | | | | | | | |
Income (loss) before income tax | | | (24,293 | ) | | | — | | | | 49,862 | | | | 6,299 | | | | — | | | | 31,868 | |
Income tax expense | | | — | | | | — | | | | 884 | | | | — | | | | — | | | | 884 | |
| | | | | | | | | | | | | | | | | | | | | | | | |
Income (loss) before earnings from consolidated subsidiaries | | | (24,293 | ) | | | — | | | | 48,978 | | | | 6,299 | | | | — | | | | 30,984 | |
Earnings (loss) from consolidated subsidiaries | | | 55,277 | | | | — | | | | — | | | | — | | | | (55,277 | ) | | | — | |
| | | | | | | | | | | | | | | | | | | | | | | | |
Net income (loss) | | | 30,984 | | | | — | | | | 48,978 | | | | 6,299 | | | | (55,277 | ) | | | 30,984 | |
General partner’s interest in net income | | | 15,038 | | | | — | | | | — | | | | — | | | | — | | | | 15,038 | |
| | | | | | | | | | | | | | | | | | | | | | | | |
Limited partner’s interest in net income (loss) | | $ | 15,946 | | | $ | — | | | $ | 48,978 | | | $ | 6,299 | | | $ | (55,277 | ) | | $ | 15,946 | |
| | | | | | | | | | | | | | | | | | | | | | | | |
25
| | | | | | | | | | | | | | | | | | | | | | | | |
| | | As of September 30, 2013 | |
| | | Issuer | | | Co-Issuer | | | Guarantor
Subsidiaries | | | Non-Guarantor
Subsidiaries | | | Eliminations | | | Consolidated | |
| | | (In thousands) | |
| ASSETS | | | | | | | | | | | | | | | | | | | | | | | | |
Current assets | | | | | | | | | | | | | | | | | | | | | | | | |
Cash and cash equivalents | | $ | 4,506 | | | $ | — | | | $ | — | | | $ | 1,162 | | | $ | — | | | $ | 5,668 | |
Accounts receivable | | | 1,626 | | | | — | | | | 15,024 | | | | 11,016 | | | | — | | | | 27,666 | |
Accounts receivable—related party | | | 399,755 | | | | 1 | | | | 23,783 | | | | 12 | | | | (399,501 | ) | | | 24,050 | |
Insurance receivable | | | — | | | | — | | | | 3,072 | | | | — | | | | — | | | | 3,072 | |
Prepaid expenses and other | | | 174 | | | | — | | | | 595 | | | | 22 | | | | — | | | | 791 | |
| | | | | | | | | | | | | | | | | | | | | | | | |
Total current assets | | | 406,061 | | | | 1 | | | | 42,474 | | | | 12,212 | | | | (399,501 | ) | | | 61,247 | |
Investment in unconsolidated affiliate | | | — | | | | — | | | | — | | | | 127,651 | | | | — | | | | 127,651 | |
Investment in consolidated affiliates | | | 1,186,766 | | | | — | | | | — | | | | — | | | | (1,186,766 | ) | | | — | |
Property, plant and equipment—net | | | 3,069 | | | | — | | | | 861,728 | | | | 280,075 | | | | — | | | | 1,144,872 | |
Intangible assets—net | | | — | | | | — | | | | 112,178 | | | | 316,702 | | | | — | | | | 428,880 | |
Goodwill | | | — | | | | — | | | | 90,978 | | | | 8,618 | | | | — | | | | 99,596 | |
Deferred financing costs, net | | | 16,290 | | | | — | | | | — | | | | 4,429 | | | | — | | | | 20,719 | |
Other assets | | | 25 | | | | — | | | | 993 | | | | — | | | | — | | | | 1,018 | |
| | | | | | | | | | | | | | | | | | | | | | | | |
Total assets | | $ | 1,612,211 | | | $ | 1 | | | $ | 1,108,351 | | | $ | 749,687 | | | $ | (1,586,267 | ) | | $ | 1,883,983 | |
| | | | | | | | | | | | | | | | | | | | | | | | |
| LIABILITIES AND PARTNERS’ CAPITAL/MEMBERS’ EQUITY | | | | | | | | | | | | | | | | | | | | | | | | |
Current liabilities | | | | | | | | | | | | | | | | | | | | | | | | |
Accrued additions to property, plant and equipment | | $ | — | | | $ | — | | | $ | 24,786 | | | $ | 16,462 | | | $ | — | | | $ | 41,248 | |
Capital leases | | | 389 | | | | — | | | | 2,556 | | | | — | | | | — | | | | 2,945 | |
Deferred revenue | | | — | | | | — | | | | — | | | | 2,426 | | | | — | | | | 2,426 | |
Accounts payable—related party | | | 1,887 | | | | — | | | | 401,460 | | | | 671 | | | | (399,501 | ) | | | 4,517 | |
Accounts payable, accrued expenses and other liabilities | | | 25,229 | | | | — | | | | 9,180 | | | | 6,626 | | | | — | | | | 41,035 | |
| | | | | | | | | | | | | | | | | | | | | | | | |
Total current liabilities | | | 27,505 | | | | — | | | | 437,982 | | | | 26,185 | | | | (399,501 | ) | | | 92,171 | |
Long-term debt | | | 707,486 | | | | — | | | | — | | | | 191,900 | | | | — | | | | 899,386 | |
Long-term capital leases | | | 679 | | | | — | | | | 573 | | | | — | | | | — | | | | 1,252 | |
Asset retirement obligations | | | — | | | | — | | | | 13,759 | | | | 874 | | | | — | | | | 14,633 | |
Partners’/members’ equity | | | 876,541 | | | | 1 | | | | 656,037 | | | | 530,728 | | | | (1,186,766 | ) | | | 876,541 | |
| | | | | | | | | | | | | | | | | | | | | | | | |
Total liabilities and partners’ capital/members’ equity | | $ | 1,612,211 | | | $ | 1 | | | $ | 1,108,351 | | | $ | 749,687 | | | $ | (1,586,267 | ) | | $ | 1,883,983 | |
| | | | | | | | | | | | | | | | | | | | | | | | |
26
| | | | | | | | | | | | | | | | | | | | | | | | |
| | | As of December 31, 2012 | |
| | | Issuer | | | Co-Issuer | | | Guarantor
Subsidiaries | | | Non-Guarantor
Subsidiaries | | | Eliminations | | | Consolidated | |
| | | (In thousands) | |
| ASSETS | | | | | | | | | | | | | | | | | | | | | | | | |
Current assets | | | | | | | | | | | | | | | | | | | | | | | | |
Cash and cash equivalents | | $ | 21 | | | $ | — | | | $ | — | | | $ | 90 | | | $ | — | | | $ | 111 | |
Accounts receivable | | | 608 | | | | — | | | | 14,515 | | | | 6,513 | | | | — | | | | 21,636 | |
Accounts receivable—related party | | | 366,405 | | | | 1 | | | | 22,587 | | | | — | | | | (365,238 | ) | | | 23,755 | |
Insurance receivable | | | — | | | | — | | | | 2,920 | | | | — | | | | — | | | | 2,920 | |
Prepaid expenses and other | | | 584 | | | | — | | | | 1,357 | | | | — | | | | — | | | | 1,941 | |
| | | | | | | | | | | | | | | | | | | | | | | | |
Total current assets | | | 367,618 | | | | 1 | | | | 41,379 | | | | 6,603 | | | | (365,238 | ) | | | 50,363 | |
Investment in consolidated affiliates | | | 1,041,936 | | | | — | | | | — | | | | — | | | | (1,041,936 | ) | | | — | |
Property, plant and equipment—net | | | 8,519 | | | | — | | | | 775,852 | | | | 155,475 | | | | — | | | | 939,846 | |
Intangible assets—net | | | — | | | | — | | | | 163,021 | | | | 338,359 | | | | — | | | | 501,380 | |
Goodwill | | | — | | | | — | | | | 95,031 | | | | — | | | | — | | | | 95,031 | |
Deferred financing costs, net | | | 17,149 | | | | — | | | | — | | | | 5,379 | | | | — | | | | 22,528 | |
Other assets | | | 20 | | | | — | | | | 1,301 | | | | — | | | | — | | | | 1,321 | |
| | | | | | | | | | | | | | | | | | | | | | | | |
Total assets | | $ | 1,435,242 | | | $ | 1 | | | $ | 1,076,584 | | | $ | 505,816 | | | $ | (1,407,174 | ) | | $ | 1,610,469 | |
| | | | | | | | | | | | | | | | | | | | | | | | |
| LIABILITIES AND PARTNERS’ CAPITAL/MEMBERS’ EQUITY | | | | | | | | | | | | | | | | | | | | | | | | |
Current liabilities | | | | | | | | | | | | | | | | | | | | | | | | |
Accrued additions to property, plant and equipment | | $ | — | | | $ | — | | | $ | 3,829 | | | $ | 5,384 | | | $ | — | | | $ | 9,213 | |
Capital leases | | | 429 | | | | — | | | | 3,433 | | | | — | | | | — | | | | 3,862 | |
Deferred revenue | | | — | | | | — | | | | — | | | | 2,634 | | | | — | | | | 2,634 | |
Accounts payable—related party | | | 536 | | | | — | | | | 367,682 | | | | 108 | | | | (365,238 | ) | | | 3,088 | |
Accounts payable, accrued expenses and other liabilities | | | 15,547 | | | | — | | | | 11,876 | | | | 2,294 | | | | — | | | | 29,717 | |
| | | | | | | | | | | | | | | | | | | | | | | | |
Total current liabilities | | | 16,512 | | | | — | | | | 386,820 | | | | 10,420 | | | | (365,238 | ) | | | 48,514 | |
Long-term debt | | | 558,161 | | | | — | | | | — | | | | 127,000 | | | | — | | | | 685,161 | |
Long-term capital leases | | | 960 | | | | — | | | | 2,201 | | | | — | | | | — | | | | 3,161 | |
Asset retirement obligations | | | — | | | | — | | | | 13,188 | | | | 836 | | | | — | | | | 14,024 | |
Partners’/members’ equity | | | 859,609 | | | | 1 | | | | 674,375 | | | | 367,560 | | | | (1,041,936 | ) | | | 859,609 | |
| | | | | | | | | | | | | | | | | | | | | | | | |
Total liabilities and partners’ capital/members’ equity | | $ | 1,435,242 | | | $ | 1 | | | $ | 1,076,584 | | | $ | 505,816 | | | $ | (1,407,174 | ) | | $ | 1,610,469 | |
| | | | | | | | | | | | | | | | | | | | | | | | |
27
| | | | | | | | | | | | | | | | | | | | | | | | |
| | | For the Nine Months Ended September 30, 2013 | |
| | | Issuer | | | Co-Issuer | | | Guarantor
Subsidiaries | | | Non-Guarantor
Subsidiaries | | | Eliminations | | | Consolidated | |
| | | (In thousands) | |
Net cash provided by (used in) operating activities | | $ | (18,629 | ) | | $ | — | | | $ | 102,271 | | | $ | 31,506 | | | $ | (33,795 | ) | | $ | 81,353 | |
| | | | | | | | | | | | | | | | | | | | | | | | |
Investing activities: | | | | | | | | | | | | | | | | | | | | | | | | |
Capital expenditures | | | (573 | ) | | | — | | | | (52,464 | ) | | | (111,559 | ) | | | — | | | | (164,596 | ) |
Capital contribution to consolidated affiliate | | | (82,025 | ) | | | — | | | | — | | | | — | | | | 82,025 | | | | — | |
Proceeds from sale of asset | | | — | | | | — | | | | 11,000 | | | | — | | | | — | | | | 11,000 | |
Investment in unconsolidated affiliate | | | — | | | | — | | | | — | | | | (128,098 | ) | | | — | | | | (128,098 | ) |
Other | | | — | | | | — | | | | — | | | | 20 | | | | — | | | | 20 | |
Change in advances to affiliates, net | | | 57,413 | | | | — | | | | — | | | | — | | | | (57,413 | ) | | | — | |
| | | | | | | | | | | | | | | | | | | | | | | | |
Net cash provided by (used in) investing activities | | | (25,185 | ) | | | — | | | | (41,464 | ) | | | (239,637 | ) | | | 24,612 | | | | (281,674 | ) |
| | | | | | | | | | | | | | | | | | | | | | | | |
Financing activities: | | | | | | | | | | | | | | | | | | | | | | | | |
Proceeds from credit facilities | | | 343,500 | | | | — | | | | — | | | | 139,900 | | | | — | | | | 483,400 | |
Repayments of credit facilities | | | (194,000 | ) | | | — | | | | — | | | | (75,000 | ) | | | — | | | | (269,000 | ) |
Payments on capital leases | | | (321 | ) | | | — | | | | (2,694 | ) | | | — | | | | — | | | | (3,015 | ) |
Deferred financing costs paid | | | (85 | ) | | | — | | | | — | | | | — | | | | — | | | | (85 | ) |
Proceeds from issuance of common units, net | | | 118,562 | | | | — | | | | — | | | | — | | | | — | | | | 118,562 | |
Proceeds from issuance of preferred equity of subsidiary | | | — | | | | — | | | | — | | | | 96,073 | | | | — | | | | 96,073 | |
Contributions received | | | — | | | | — | | | | — | | | | 82,025 | | | | (82,025 | ) | | | — | |
Distributions to General Partner for additional interest in CMM | | | (129,000 | ) | | | — | | | | — | | | | — | | | | — | | | | (129,000 | ) |
Distributions paid | | | (90,357 | ) | | | — | | | | — | | | | (33,795 | ) | | | 33,795 | | | | (90,357 | ) |
Change in advances from affiliates, net | | | — | | | | — | | | | (57,413 | ) | | | — | | | | 57,413 | | | | — | |
Taxes paid for equity-based compensation vesting | | | — | | | | — | | | | (700 | ) | | | — | | | | — | | | | (700 | ) |
| | | | | | | | | | | | | | | | | | | | | | | | |
Net cash provided by (used in) financing activities | | | 48,299 | | | | — | | | | (60,807 | ) | | | 209,203 | | | | 9,183 | | | | 205,878 | |
| | | | | | | | | | | | | | | | | | | | | | | | |
Change in cash and cash equivalents | | | 4,485 | | | | — | | | | — | | | | 1,072 | | | | — | | | | 5,557 | |
Cash and cash equivalents at beginning of period | | | 21 | | | | — | | | | — | | | | 90 | | | | — | | | | 111 | |
| | | | | | | | | | | | | | | | | | | | | | | | |
Cash and cash equivalents at end of period | | $ | 4,506 | | | $ | — | | | $ | — | | | $ | 1,162 | | | $ | — | | | $ | 5,668 | |
| | | | | | | | | | | | | | | | | | | | | | | | |
28
| | | | | | | | | | | | | | | | | | | | | | | | |
| | | For the Nine Months Ended September 30, 2012 | |
| | | Issuer | | | Co-Issuer | | | Guarantor
Subsidiaries | | | Non-Guarantor
Subsidiaries | | | Eliminations | | | Consolidated | |
| | | (In thousands) | |
Net cash provided by (used in) operating activities | | $ | (16,014 | ) | | $ | — | | | $ | 86,153 | | | $ | 9,934 | | | $ | (2,205 | ) | | $ | 77,868 | |
| | | | | | | | | | | | | | | | | | | | | | | | |
Investing activities: | | | | | | | | | | | | | | | | | | | | | | | | |
Acquisitions, net of cash acquired | | | — | | | | — | | | | (87,269 | ) | | | (381,718 | ) | | | — | | | | (468,987 | ) |
Capital expenditures | | | (659 | ) | | | — | | | | (28,309 | ) | | | (5,378 | ) | | | — | | | | (34,346 | ) |
Acquisition of interests in CMM | | | (131,250 | ) | | | — | | | | — | | | | — | | | | 131,250 | | | | — | |
Capital contribution to consolidated affiliate | | | 1,647 | | | | — | | | | — | | | | — | | | | (1,647 | ) | | | — | |
Change in advances to affiliates, net | | | (31,730 | ) | | | — | | | | — | | | | — | | | | 31,730 | | | | — | |
| | | | | | | | | | | | | | | | | | | | | | | | |
Net cash provided by (used in) investing activities | | | (161,992 | ) | | | — | | | | (115,578 | ) | | | (387,096 | ) | | | 161,333 | | | | (503,333 | ) |
| | | | | | | | | | | | | | | | | | | | | | | | |
Financing activities: | | | | | | | | | | | | | | | | | | | | | | | | |
Proceeds from credit facilities | | | 350,200 | | | | — | | | | — | | | | 27,500 | | | | — | | | | 377,700 | |
Repayments of credit facilities | | | (329,500 | ) | | | — | | | | — | | | | (8,000 | ) | | | — | | | | (337,500 | ) |
Payments on capital leases | | | (256 | ) | | | — | | | | (1,899 | ) | | | — | | | | — | | | | (2,155 | ) |
Deferred financing costs paid | | | (161 | ) | | | — | | | | — | | | | (6,328 | ) | | | — | | | | (6,489 | ) |
Proceeds from issuance of common units, net | | | 217,508 | | | | — | | | | — | | | | — | | | | — | | | | 217,508 | |
Contributions received | | | 5,930 | | | | — | | | | — | | | | 375,000 | | | | (131,250 | ) | | | 249,680 | |
Distributions paid | | | (66,500 | ) | | | — | | | | — | | | | (11,005 | ) | | | 3,852 | | | | (73,653 | ) |
Change in advances from affiliate, net | | | — | | | | — | | | | 31,730 | | | | — | | | | (31,730 | ) | | | — | |
Taxes paid for equity-based compensation vesting | | | — | | | | — | | | | (406 | ) | | | — | | | | — | | | | (406 | ) |
| | | | | | | | | | | | | | | | | | | | | | | | |
Net cash provided by (used in) financing activities | | | 177,221 | | | | — | | | | 29,425 | | | | 377,167 | | | | (159,128 | ) | | | 424,685 | |
| | | | | | | | | | | | | | | | | | | | | | | | |
Change in cash and cash equivalents | | | (785 | ) | | | — | | | | — | | | | 5 | | | | — | | | | (780 | ) |
Cash and cash equivalents at beginning of period | | | 797 | | | | — | | | | — | | | | — | | | | — | | | | 797 | |
| | | | | | | | | | | | | | | | | | | | | | | | |
Cash and cash equivalents at end of period | | $ | 12 | | | $ | — | | | $ | — | | | $ | 5 | | | $ | — | | | $ | 17 | |
| | | | | | | | | | | | | | | | | | | | | | | | |
29
15. SUBSEQUENT EVENTS
As discussed in Note 1.Organization and Description of Business, on October 7, 2013, CMLP merged with and into NRGM with NRGM continuing as the surviving entity. The Merger was accounted for as a reverse acquisition of NRGM under the purchase method of accounting in accordance with the accounting standards related to business combinations. The accounting for a reverse merger results in the legal acquiree (CMLP) being the acquirer for accounting purposes. Therefore, CMLP will account for the merger as if CMLP acquired NRGM. For additional information related to the Merger, See Notes 7, 9, 11, 12 and 13.
The following table represents the pro forma consolidated statements of operations as if the reverse acquisition had been included in the consolidated results of CMLP on January 1, 2012 (In millions, except per unit data):
| | | | | | | | | | | | | | | | |
| | | Three Months
Ended | | | Nine Months
Ended | |
| | | September 30, | | | September 30, | |
| | | 2013 | | | 2012 | | | 2013 | | | 2012 | |
Revenues | | $ | 140 | | | $ | 114 | | | $ | 418 | | | $ | 318 | |
| | | | | | | | | | | | | | | | |
Net income (loss) | | $ | 12 | | | $ | 24 | | | $ | 40 | | | $ | 63 | |
| | | | | | | | | | | | | | | | |
Net income (loss) per limited partner unit: | | | | | | | | | | | | | | | | |
Basic | | $ | 0.02 | | | $ | 0.15 | | | $ | 0.17 | | | $ | 0.40 | |
| | | | | | | | | | | | | | | | |
Diluted: | | $ | 0.02 | | | $ | 0.15 | | | $ | 0.17 | | | $ | 0.40 | |
| | | | | | | | | | | | | | | | |
30
Item 2. Management’s Discussion and Analysis of Financial Condition and Results of Operations
On June 19, 2013, Crestwood Holdings acquired the general partner of Inergy, L.P. (NRGY) and contributed its ownership of our General Partner and incentive distribution rights to NRGY in exchange for NRGY common units. On October 7, 2013, CMLP completed the merger (the Merger) with a subsidiary of Inergy Midstream, L.P. (NRGM) pursuant to a merger agreement dated as of May 5, 2013. Immediately following the Merger, NRGM and CMLP merged, with NRGM continuing as the surviving entity and changing its name to Crestwood Midstream Partners LP. The common units of the combined partnership are listed on the NYSE under the symbol “CMLP.” Under the merger agreement, CMLP unitholders received 1.07 units of NRGM units for each unit of CMLP they owned and as a result, there were no CMLP common or Class D units outstanding immediately following the Merger. Additionally, CMLP unitholders (other than Crestwood Holdings), received a one-time approximately $35 million cash payment at the closing of the Merger, or $1.03 per unit, $25 million of which was paid by NRGM and approximately $10 million of which was paid by Crestwood Holdings. Also in conjunction with the Merger, CMLP was delisted on the NYSE.
The Management’s Discussion and Analysis of Financial Condition and Results of Operations should be read keeping in mind that we became a wholly-owned subsidiary of NRGM subsequent to the periods covered hereby. Except as otherwise specifically provided, this discussion and analysis relates to the business and operations of Crestwood Midstream Partners LP, a Delaware limited partnership and its consolidated subsidiaries for the periods prior to the closing of the Merger.
Overview and Performance Metrics
We are a growth-oriented midstream master limited partnership which owns and operates predominately fee-based gathering, processing, treating and compression assets servicing producers in the Marcellus Shale in northern West Virginia, the Barnett Shale in north Texas, the Fayetteville Shale in northwestern Arkansas, the Granite Wash in the Texas Panhandle, the Avalon Shale/Bone Spring in southeastern New Mexico and the Haynesville/Bossier Shale in western Louisiana. We provide midstream services to oil and gas producers that focus on developing unconventional resources across the United States.
We conduct all of our operations in the midstream sector in eight operating segments, four of which are reportable. Our operating segments reflect how we manage our operations and are generally reflective of the geographic areas in which we operate. Our reportable segments consist of Marcellus, Barnett, Fayetteville and Granite Wash. Our operating segments are engaged in gathering, processing, treating, compression, transportation and sales of natural gas and delivery of NGLs in the United States. Our Other operating segment consists of those operating segments or reporting units that did not meet quantitative reporting thresholds.
The results of our operations are significantly influenced by the volumes of natural gas gathered and processed through our systems. We gather, process, treat, compress, transport and sell natural gas pursuant to fixed-fee and percent-of-proceeds contracts. Under our fixed-fee contracts, we do not take title to the natural gas or associated NGLs. For the nine months ended September 30, 2013, approximately 98% of our gross margin, which we define as total revenue less product purchases, is derived from fixed-fee service contracts, which minimizes our commodity price exposure and provides us with less volatile operating performance and cash flows. Under our percent-of-proceeds contracts, we take title to the residue gas, NGLs and condensate and remit a portion of the sale proceeds to the producer based on prevailing commodity prices. For the nine months ended September 30, 2013, the net revenues from percent-of-proceeds contracts accounted for approximately 2% of our gross margin.
Although we do not have significant direct commodity price exposure, lower natural gas prices could have a potential negative impact on the pace of drilling in dry gas areas – such as areas in the Barnett Shale (gathered by the Alliance and Lake Arlington Systems), the Fayetteville Systems and the Sabine System (part of the Haynesville/Bossier Shale). We operate or have an interest in six systems located in basins that include NGL rich gas shale plays: (i) the Cowtown System in the Barnett Shale; (ii) the Granite Wash System; (iii) the Las Animas Systems in the Avalon Shale; (iv) two systems in the Marcellus segment; and (v) the Jackalope Gas Gathering Services, L.L.C. (Jackalope) system (our unconsolidated affiliate). For both the three and nine months ended September 30, 2013, our systems located in NGL rich gas basins contributed approximately 71% of our total revenues and 65% of our total gathering volumes. A prolonged decrease in the commodity price environment could result in our customers reducing their production volumes which would result in a decrease in our revenues.
Our management uses a variety of financial and operational measures to analyze our performance. We view these measures as important factors affecting our profitability and unitholder value and therefore we review them monthly for consistency and to identify trends in our operations. These performance measures are outlined below.
31
Volumes— We must continually obtain new supplies of natural gas to maintain or increase throughput volumes on our gathering and processing systems. We routinely monitor producer activity in the areas we serve to identify new supply opportunities. Our ability to achieve these objectives is impacted by:
| | • | | the level of successful drilling and production activity in areas where our systems are located; |
| | • | | our ability to compete with other midstream companies for production volumes; and |
| | • | | our pursuit of new acquisition opportunities. |
Operations and Maintenance Expenses — We consider operations and maintenance expenses in evaluating the performance of our operations. These expenses are comprised primarily of labor, parts and materials, insurance, taxes other than income taxes, repair and maintenance costs, utilities and contract services. Our ability to manage operations and maintenance expenses has a significant impact on our profitability and ability to pay distributions.
EBITDA and Adjusted EBITDA — We believe that EBITDA and Adjusted EBITDA are widely accepted financial indicators of a company’s operational performance and its ability to incur and service debt, fund capital expenditures and make distributions. EBITDA and Adjusted EBITDA are not measures calculated in accordance with accounting principles generally accepted in the United States of America (GAAP), as they do not include deductions for items such as depreciation, amortization and accretion, interest and income taxes, which are necessary to maintain our business. In addition, Adjusted EBITDA considers the impact of certain significant items, such as third party costs incurred related to potential and completed acquisitions and other transactions identified in a specific reporting period. Adjusted EBITDA also considers the adjusted earnings impact of our unconsolidated affiliate by adjusting our equity earnings or losses from our unconsolidated affiliate for our proportionate share of its depreciation and interest. EBITDA and Adjusted EBITDA should not be considered an alternative to net income, operating cash flow or any other measure of financial performance presented in accordance with GAAP. EBITDA and Adjusted EBITDA calculations may vary among entities, so our computation may not be comparable to measures used by other companies.
See our reconciliation of Net Income to EBITDA and Adjusted EBITDA inResults of Operations below.
Current Year Highlights
Below is a discussion of events that highlight our core business and financing activities.
Operational and Industry Highlights
Shale gas production in the United States has grown rapidly in recent years as the natural gas industry has improved drilling and extraction methods while increasing exploration efforts. The United States has a wide distribution of shale formations containing vast resources of natural gas, NGLs and oil. Led by the rapid development of the Barnett Shale in Texas, shale gas activity has expanded into other areas such as the Marcellus, Fayetteville and Haynesville/Bossier shale plays.
Growth through Diversification —Our operating results reflect our ability to diversify our shale play portfolio and increase volumes not only through our base business located in the Barnett Shale, but also through strategic acquisitions in a number of attractive shale plays in the United States. We believe that our experience and market position will allow us to realize significant ongoing growth opportunities by developing new greenfield projects in NGL and oil plays in areas with limited or constrained infrastructure which offer attractive returns on investment and seeking bolt-on acquisitions that provide operating synergies and allow for the development of our business in rich gas infrastructure plays. Our acquisition strategy includes diversifying and extending our geographic, customer and business profile and developing organic growth opportunities along the midstream value chain.
Our systems gathered 993 MMcf/d and 987 MMcf/d during the three and nine months ended September 30, 2013, which is an increase of 11% and 27% from the same periods in 2012. This increase was largely due to a 47% increase in our Marcellus segment volumes, partially offset by a 4% decrease in our Barnett segment volumes during the three months ended September 30, 2013 compared to the same period in 2012. During the three and nine months ended September 30, 2013, our Marcellus systems’ compression volumes were 267 MMcf/d and 274 MMcf/d. Additionally, our processed volumes were 202 MMcf/d and 214 MMcf/d for the three and nine months ended September 30, 2013, an increase of 12% and 36% compared to the same periods in 2012, respectively. The increase in volumes resulted in a 13% and 25% increase in our overall revenues for the three and nine months ended September 30, 2013 compared to the same periods in 2012.
32
Marcellus Segment Update
In March 2013, Crestwood Marcellus Midstream LLC (CMM) entered into a seven year agreement with Antero Resources Appalachian Corporation (Antero) to provide natural gas compression services on developing rich gas acreage in Doddridge County, West Virginia (Compression Services Agreement). The Compression Services Agreement provides for the construction and operation of compressor stations on Antero’s Western Area acreage (Western Area) which is not dedicated to us under the existing Gas Gathering and Compression Agreement (GGA) which covers the Eastern Area of Dedication (Eastern AOD). We will provide fixed-fee compression services to Antero under the Compression Services Agreement, which provides for minimum fees based on the capacity of the compressor stations constructed under the agreement. The Compression Services Agreement does not impact our seven year right of first offer to acquire midstream infrastructure from Antero in the Western Area and is in addition to the previously announced construction of two compressor stations we are constructing in the Eastern AOD during 2013.
On August 1, 2013, we placed the initial phase of the Tichenal to Trent low pressure trunkline system in service. This new pipeline system is a 12-mile, 20 inch diameter pipeline located in Harrison County, West Virginia. The system is located in the Eastern AOD under the existing GGA with Antero and has a capacity of approximately 400 MMcf/d and extends our low pressure gathering into the Greenbrier area of our AOD. The pipeline system is expected to result in approximately 80 MMcf/d to 100 MMcf/d of incremental throughput during the remainder of 2013, with gathering volumes continuing to increase as additional wells and compressor stations are connected to the system.
Additionally, on August 8, 2013, we completed phase I of the West Union compressor station, adding 55 MMcf/d of capacity to serve Antero’s rich gas production to Doddridge County, West Virginia. Phase II of the West Union compressor station will add 65 MMcf/d and is expected to be in service by the end of 2013. The Victoria compressor station to be constructed will add approximately 120 MMcf/d of flow capacity. Phase I is expected to be in service during the first quarter of 2014 and Phase II is expected to be in service during the second quarter of 2014. The Compression Services Agreement also provides for the construction of additional compression facilities if agreed to by Antero and CMM in the future.
In December 2012, CMM completed the acquisition of natural gas compression and dehydration assets from Enerven Compression, LLC (Enerven) for approximately $95 million expanding the value chain and range of services we provide in the high growth Marcellus Shale. The acquisition included four compression stations connected to CMM’s low pressure gathering systems and a five-year minimum term compression services agreement with Antero which expires in 2018. In addition, CMM provides compression services to Antero under a 20 year, fixed fee, GGA, which became effective in January 2012. We believe the Enerven assets will provide an excellent opportunity for organic growth as gathering infrastructure in the Marcellus rich gas region continues to be built at a rapid pace.
Powder River Basin/Niobrara Update
On July 19, 2013, Crestwood Niobrara LLC (Crestwood Niobrara), our consolidated subsidiary, paid approximately $108 million to acquire a 50% interest in a gathering system located in the Powder River Basin of the Niobrara Shale play from RKI Exploration and Production, LLC (RKI). During the three months ended September 30, 2013, we contributed an additional $20 million to our unconsolidated affiliate to fund its construction projects. During 2014, we intend to expand the gathering system from the current capacity of 60 MMcf/d to 180 MMcf/d. In addition, the joint venture is constructing a 120 MMcf/d gas processing facility. Both of these expansions are targeted to be completed during the third quarter of 2014.
The joint venture gathering system has 20 year gathering and processing agreements with Chesapeake Energy Corporation (Chesapeake) and RKI under which it receives cost-of-service based fees with annual redeterminations. The gathering and processing agreements provide for an area of dedication of approximately 311,000 gross acres located in the core of the Powder River Basin Niobrara Shale.
This acquisition further diversifies our portfolio and positions us to participate in additional greenfield development opportunities in the liquids rich core of the Powder River Basin Niobrara Shale which currently has limited midstream infrastructure.
Financing Activities
On January 8, 2013, we acquired Crestwood Holdings’ 65% membership interest in CMM for approximately $258 million. We funded the purchase price through $129 million of borrowings under our CMLP credit facility, the issuance of 6,190,469 Class D units, representing limited partner interests in us to Crestwood Holdings, and the issuance of 133,060 general partner units to our General Partner.
33
On March 22, 2013, we completed a public offering of 4,500,000 common units, representing limited partner interests in us at a price of $23.90 per common unit ($23.00 per common unit, net of underwriting discounts) providing net proceeds of approximately $103.5 million. We granted the underwriters a 30 day option to purchase up to 675,000 additional common units if the underwriters sold more than 4,500,000 common units in the offering. The underwriters exercised this option on April 5, 2013, providing net proceeds of approximately $15.5 million. The net proceeds from these transactions were used to reduce indebtedness under each of the CMM and CMLP Credit Facilities.
In July 2013, Crestwood Niobrara acquired a 50% interest in a joint venture which was funded through our contribution of approximately $27 million (which was borrowed under the CMLP Credit Facility) and an additional $81 million obtained through Crestwood Niobrara’s issuance of a preferred interest to a subsidiary of General Electric Capital Corporation and GE Structured Finance, Inc. (collectively, GE EFS). Crestwood Niobrara will fund 75% of future capital contributions to the gathering system joint venture through additional preferred interest issuances to GE EFS (up to a maximum of an additional $69 million), with the remainder to be funded through our capital contributions to Crestwood Niobrara. During the three months ended September 30, 2013, GE EFS contributed an additional $15 million to Crestwood Niobrara in exchange for an equivalent number of preferred units. We serve as the managing member of Crestwood Niobrara and, subject to certain restrictions, we have the ability to redeem GE EFS’s preferred security in either cash or CMLP common units of the combined partnership.
Results of Operations
Three and Nine Months Ended September 30, 2013 Compared with Three and Nine Months Ended September 30, 2012
The following table summarizes our results of operations (In thousands):
| | | | | | | | | | | | | | | | |
| | | Three Months Ended
September 30, | | | Nine Months Ended
September 30, | |
| | | 2013 | | | 2012 | | | 2013 | | | 2012 | |
Operating revenues | | $ | 71,138 | | | $ | 63,013 | | | $ | 214,653 | | | $ | 171,975 | |
Product purchases | | | 12,851 | | | | 10,341 | | | | 40,388 | | | | 26,755 | |
Operations and maintenance expense | | | 14,895 | | | | 10,942 | | | | 40,503 | | | | 30,053 | |
General and administrative expense | | | 10,367 | | | | 6,570 | | | | 28,536 | | | | 21,965 | |
Depreciation, amortization and accretion expense | | | 14,557 | | | | 11,568 | | | | 49,618 | | | | 35,909 | |
Goodwill impairment | | | (4,053 | ) | | | — | | | | (4,053 | ) | | | — | |
Gain on sale of asset | | | 4,392 | | | | — | | | | 4,392 | | | | — | |
| | | | | | | | | | | | | | | | |
Operating income | | | 18,807 | | | | 23,592 | | | | 55,947 | | | | 57,293 | |
Loss from unconsolidated affiliate | | | (447 | ) | | | — | | | | (447 | ) | | | — | |
Interest and debt expense | | | 11,625 | | | | 8,905 | | | | 34,260 | | | | 25,425 | |
Income tax expense | | | 347 | | | | 306 | | | | 1,024 | | | | 884 | |
| | | | | | | | | | | | | | | | |
Net income | | $ | 6,388 | | | $ | 14,381 | | | $ | 20,216 | | | $ | 30,984 | |
Add: | | | | | | | | | | | | | | | | |
Interest and debt expense | | | 11,625 | | | | 8,905 | | | | 34,260 | | | | 25,425 | |
Income tax expense | | | 347 | | | | 306 | | | | 1,024 | | | | 884 | |
Depreciation, amortization and accretion expense | | | 14,557 | | | | 11,568 | | | | 49,618 | | | | 35,909 | |
| | | | | | | | | | | | | | | | |
EBITDA | | $ | 32,917 | | | $ | 35,160 | | | $ | 105,118 | | | $ | 93,202 | |
Expenses associated with significant items | | | 5,143 | | | | 954 | | | | 10,660 | | | | 3,300 | |
Goodwill impairment | | | 4,053 | | | | — | | | | 4,053 | | | | — | |
Gain on sale of asset | | | (4,392 | ) | | | — | | | | (4,392 | ) | | | — | |
Loss from unconsolidated affiliate | | | 447 | | | | — | | | | 447 | | | | — | |
EBITDA from unconsolidated affiliate | | | 573 | | | | — | | | | 573 | | | | — | |
| | | | | | | | | | | | | | | | |
Adjusted EBITDA | | $ | 38,741 | | | $ | 36,114 | | | $ | 116,459 | | | $ | 96,502 | |
| | | | | | | | | | | | | | | | |
34
EBITDA in the table above includes operating results from our Marcellus, Barnett, Fayetteville and Granite Wash segments and other operations, and general and administrative expenses. The following table summarizes the results of our Barnett, Marcellus, Fayetteville and Granite Wash segments and other operations (In thousands):
| | | | | | | | | | | | | | | | | | | | | | | | |
| | | For the Three Months Ended September 30, 2013 | |
| | | Marcellus | | | Barnett | | | Fayetteville | | | Granite Wash | | | Other | | | Total | |
Gathering revenues | | $ | 11,913 | | | $ | 22,687 | | | $ | 7,548 | | | $ | 495 | | | $ | 1,271 | | | $ | 43,914 | |
Processing revenues | | | — | | | | 8,968 | | | | — | | | | 1 | | | | — | | | | 8,969 | |
Compression revenues | | | 4,075 | | | | — | | | | — | | | | — | | | | — | | | | 4,075 | |
Product sales | | | — | | | | 226 | | | | 251 | | | | 12,686 | | | | 1,017 | | | | 14,180 | |
| | | | | | | | | | | | | | | | | | | | | | | | |
Total operating revenues | | $ | 15,988 | | | $ | 31,881 | | | $ | 7,799 | | | $ | 13,182 | | | $ | 2,288 | | | $ | 71,138 | |
Product purchases | | | — | | | | 157 | | | | 249 | | | | 11,428 | | | | 1,017 | | | | 12,851 | |
Operations and maintenance expense | | | 2,832 | | | | 7,717 | | | | 2,303 | | | | 810 | | | | 1,233 | | | | 14,895 | |
Goodwill impairment | | | — | | | | — | | | | — | | | | — | | | | (4,053 | ) | | | (4,053 | ) |
Gain on sale of asset | | | — | | | | — | | | | — | | | | 4,392 | | | | — | | | | 4,392 | |
Loss from unconsolidated affiliate | | | — | | | | — | | | | — | | | | — | | | | (447 | ) | | | (447 | ) |
| | | | | | | | | | | | | | | | | | | | | | | | |
EBITDA | | $ | 13,156 | | | $ | 24,007 | | | $ | 5,247 | | | $ | 5,336 | | | $ | (4,462 | ) | | | | |
| | | | | | | | | | | | | | | | | | | | | | | | |
Gathering volumes (in MMcf) | | | 39,041 | | | | 38,643 | | | | 9,538 | | | | 1,829 | | | | 2,286 | | | | 91,337 | |
Processing volumes (in MMcf) | | | — | | | | 16,710 | | | | — | | | | 1,831 | | | | — | | | | 18,541 | |
Compression volumes (in MMcf) | | | 24,569 | | | | — | | | | — | | | | — | | | | — | | | | 24,569 | |
| |
| | | For the Three Months Ended September 30, 2012 | |
| | | Marcellus | | | Barnett | | | Fayetteville | | | Granite Wash | | | Other | | | Total | |
Gathering revenues | | $ | 7,976 | | | $ | 24,737 | | | $ | 7,043 | | | $ | 465 | | | $ | 3,152 | | | $ | 43,373 | |
Processing revenues | | | — | | | | 8,540 | | | | — | | | | 29 | | | | — | | | | 8,569 | |
Product sales | | | — | | | | 69 | | | | 131 | | | | 10,208 | | | | 663 | | | | 11,071 | |
| | | | | | | | | | | | | | | | | | | | | | | | |
Total operating revenues | | $ | 7,976 | | | $ | 33,346 | | | $ | 7,174 | | | $ | 10,702 | | | $ | 3,815 | | | $ | 63,013 | |
Product purchases | | | — | | | | 60 | | | | 137 | | | | 9,481 | | | | 663 | | | | 10,341 | |
Operations and maintenance expense | | | 815 | | | | 6,963 | | | | 1,855 | | | | 560 | | | | 749 | | | | 10,942 | |
| | | | | | | | | | | | | | | | | | | | | | | | |
EBITDA | | $ | 7,161 | | | $ | 26,323 | | | $ | 5,182 | | | $ | 661 | | | $ | 2,403 | | | | | |
| | | | | | | | | | | | | | | | | | | | | | | | |
Gathering volumes (in MMcf) | | | 26,585 | | | | 40,252 | | | | 8,403 | | | | 1,856 | | | | 5,041 | | | | 82,137 | |
Processing volumes (in MMcf) | | | — | | | | 14,671 | | | | — | | | | 1,859 | | | | — | | | | 16,530 | |
35
| | | | | | | | | | | | | | | | | | | | | | | | |
| | | For the Nine Months Ended September 30, 2013 | |
| | | Marcellus | | | Barnett | | | Fayetteville | | | Granite Wash | | | Other | | | Total | |
Gathering revenues | | $ | 33,785 | | | $ | 70,597 | | | $ | 20,647 | | | $ | 1,487 | | | $ | 4,470 | | | $ | 130,986 | |
Processing revenues | | | — | | | | 28,136 | | | | — | | | | 4 | | | | — | | | | 28,140 | |
Compression revenues | | | 11,874 | | | | — | | | | — | | | | — | | | | — | | | | 11,874 | |
Product sales | | | — | | | | 770 | | | | 736 | | | | 39,176 | | | | 2,971 | | | | 43,653 | |
| | | | | | | | | | | | | | | | | | | | | | | | |
Total operating revenues | | $ | 45,659 | | | $ | 99,503 | | | $ | 21,383 | | | $ | 40,667 | | | $ | 7,441 | | | $ | 214,653 | |
Product purchases | | | — | | | | 558 | | | | 732 | | | | 36,127 | | | | 2,971 | | | | 40,388 | |
Operations and maintenance expense | | | 7,774 | | | | 21,284 | | | | 6,747 | | | | 2,103 | | | | 2,595 | | | | 40,503 | |
Goodwill impairment | | | — | | | | — | | | | — | | | | — | | | | (4,053 | ) | | | (4,053 | ) |
Gain on sale of asset | | | — | | | | — | | | | — | | | | 4,392 | | | | — | | | | 4,392 | |
Loss from unconsolidated affiliate | | | — | | | | — | | | | — | | | | — | | | | (447 | ) | | | (447 | ) |
| | | | | | | | | | | | | | | | | | | | | | | | |
EBITDA | | $ | 37,885 | | | $ | 77,661 | | | $ | 13,904 | | | $ | 6,829 | | | $ | (2,625 | ) | | | | |
| | | | | | | | | | | | | | | | | | | | | | | | |
Gathering volumes (in MMcf) | | | 110,715 | | | | 118,849 | | | | 24,679 | | | | 5,734 | | | | 9,401 | | | | 269,378 | |
Processing volumes (in MMcf) | | | — | | | | 52,945 | | | | — | | | | 5,540 | | | | — | | | | 58,485 | |
Compression volumes (in MMcf) | | | 74,726 | | | | — | | | | — | | | | — | | | | — | | | | 74,726 | |
| |
| | | For the Nine Months Ended September 30, 2012 | |
| | | Marcellus | | | Barnett | | | Fayetteville | | | Granite Wash | | | Other | | | Total | |
Gathering revenues | | $ | 15,003 | | | $ | 74,568 | | | $ | 20,037 | | | $ | 873 | | | $ | 7,952 | | | $ | 118,433 | |
Processing revenues | | | — | | | | 24,156 | | | | — | | | | 128 | | | | — | | | | 24,284 | |
Product sales | | | — | | | | 68 | | | | 331 | | | | 27,020 | | | | 1,839 | | | | 29,258 | |
| | | | | | | | | | | | | | | | | | | | | | | | |
Total operating revenues | | $ | 15,003 | | | $ | 98,792 | | | $ | 20,368 | | | $ | 28,021 | | | $ | 9,791 | | | $ | 171,975 | |
Product purchases | | | — | | | | 60 | | | | 343 | | | | 24,514 | | | | 1,838 | | | | 26,755 | |
Operations and maintenance expense | | | 1,328 | | | | 18,438 | | | | 6,399 | | | | 1,619 | | | | 2,269 | | | | 30,053 | |
| | | | | | | | | | | | | | | | | | | | | | | | |
EBITDA | | $ | 13,675 | | | $ | 80,294 | | | $ | 13,626 | | | $ | 1,888 | | | $ | 5,684 | | | | | |
| | | | | | | | | | | | | | | | | | | | | | | | |
Gathering volumes (in MMcf) | | | 50,009 | | | | 117,434 | | | | 23,049 | | | | 4,576 | | | | 17,149 | | | | 212,217 | |
Processing volumes (in MMcf) | | | — | | | | 38,493 | | | | — | | | | 4,566 | | | | — | | | | 43,059 | |
EBITDA and Adjusted EBITDA — EBITDA decreased approximately $2 million for the three months ended September 30, 2013 compared to the same period in 2012. However, we experienced an increase of approximately $12 million for the nine months ended September 30, 2013 compared to same period in 2012. In the same manner, Adjusted EBITDA for the three and nine months ended September 30, 2013 was approximately $39 million and $116 million, an increase of approximately $3 million and $20 million compared to the same periods in 2012. Adjusted EBITDA includes expenses for merger-related costs and evaluating certain investment opportunities, which were approximately $5 million and $11 million for the three and nine months ended September 30, 2013 compared to costs of approximately $1 million and $3 million for the same periods in 2012, respectively. Additionally, Adjusted EBITDA includes approximately $1 million of net earnings adjustments related to adding back our proportionate share of our unconsolidated affiliate’s depreciation and interest for the three and nine months ended September 30, 2013. Also impacting our Adjusted EBITDA during the three and nine months ended September 30, 2013 was a gain of approximately $4 million on the sale of a cryogenic plant and associated equipment and a loss on the impairment of goodwill of approximately $4 million on our Haynesville/Bossier Shale system.
Below is a discussion of the factors that impacted EBITDA by segment for the three and nine months ended September 30, 2013 compared to the same periods in 2012.
Marcellus:
EBITDA for our Marcellus segment was approximately $13 million and $38 million for the three and nine months ended September 30, 2013. On March 26, 2012, CMM acquired gathering assets from Antero, which contributed approximately $8 million and $15 million of revenues to our Marcellus segment EBITDA for the three and nine months ended September 30, 2012.
Revenues and Volumes — Revenues in our Marcellus segment increased by approximately $8 million and $31 million during the three and nine months ended September 30, 2013 compared to the same periods in 2012, primarily due to the increase in gathering volumes. For the three and nine months ended September 30, 2013, we gathered 424 MMcf/d and 406 MMcf/d in our Marcellus segment compared to 289 MMcf/d and 273 MMcf/d for the three and nine months ended September 30, 2012. In addition, we recognized gathering revenues for the full nine months of 2013 versus six months during the same period in 2012. During the three
36
and nine months ended September 30, 2013, we connected 14 and 44 new wells in our Marcellus segment which contributed to the increase in gathering volumes and revenues. In addition, we placed several gathering and compression projects in service during the three months ended September 30, 2013, which also contributed to the increase in our gathering volumes.
In addition to the increase in gathering revenues, our compression volumes increased due to CMM’s acquisition of E. Marcellus Asset Company, LLC (EMAC) from Enerven in December 2012. The acquisition of these natural gas compression and dehydration assets has expanded the value chain and range of services we provide in the high growth Marcellus Shale. The acquisition included four compression stations connected to CMM’s low pressure gathering systems and a five-year minimum term compression services agreement with Antero which expires in 2018. During the three and nine months ended September 30, 2013, our compression volumes under this agreement were 267 MMcf/d and 274 MMcf/d. In addition, we anticipate an increase in our compression revenues during the fourth quarter of 2013 and into 2014 as a result of a compressor station that was placed in service during the third quarter of 2013.
Operations and Maintenance Expense — Operations and maintenance expenses in our Marcellus segment increased by approximately $2 million and $6 million for the three and nine months ended September 30, 2013 when compared to the same periods in 2012, primarily due to the acquisition of the Enerven assets discussed above and the additional assets placed in service during the three months ended September 30, 2013.
Barnett:
For the three and nine months ended September 30, 2013, our Barnett segment’s EBITDA decreased by approximately $2 million and $3 million compared to the same periods in 2012, primarily due to lower gathering revenues and higher operations and maintenance expenses, partially offset by higher processing revenues.
Revenues and Volumes — Our gathering revenues decreased by approximately $2 million and $4 million during the three and nine months ended September 30, 2013 compared to the same periods in 2012, primarily due to lower dry gas gathering volumes. The decrease in dry gas gathering volumes primarily related to reduced production from Quicksilver’s existing wells. In addition, Quicksilver did not connect any new wells during the three months ended September 30, 2013. Partially offsetting the decline in Quicksilver volumes were three new wells we connected from other producers during the three months ended September 30, 2013 and eight new wells connected during the nine months ended September 30, 2013. Partially offsetting the decrease in gathering revenues was an increase in processing revenues of $0.4 million and $4.0 million for the three and nine months ended September 30, 2013 compared to the same periods in 2012, primarily due to the Devon Acquisition, which was completed on August 24, 2012.
Operations and Maintenance Expense — Operations and maintenance expenses in our Barnett segment increased by approximately $1 million and $3 million for the three and nine months ended September 30, 2013 when compared to the same periods in 2012, primarily due to the operation of the West Johnson County system acquired in the Devon Acquisition during August 2012. During the three and nine months ended September 30, 2013, operations and maintenance expenses related to the West Johnson County system were approximately $1 million and $2 million, which reflects the full synergies of the integration of the system with our Cowtown system completed in December 2012. As a result of the integration, the West Johnson County plant that was acquired in the Devon Acquisition is now available for redeployment or other uses.
Fayetteville:
Our Fayetteville segment EBITDA was relatively flat during the three and nine months ended September 30, 2013 compared to the same periods in 2012.
Revenues and Volumes —During the three and nine months ended September 30, 2013, gathering revenues in our Fayetteville segment increased by approximately $0.5 million and $0.6 million compared to the same periods in 2012 primarily due to an increase in volumes due to 18 new wells connected during the nine months ended September 30, 2013.
Operations and Maintenance Expense —Operations and maintenance expenses in our Fayetteville segment for the three and nine months ended September 30, 2013 were relatively flat compared to the same periods in 2012.
Granite Wash:
Our Granite Wash segment EBITDA increased by approximately $5 million during the three and nine months ended September 30, 2013 compared to the same periods in 2012, primarily due to the gain of approximately $4 million recorded on the sale of a cryogenic plant and associated equipment and slightly higher gathering revenues, partially offset by slightly higher operations and maintenance expense.
37
Revenues/Margin and Volumes — For the nine months ended September 30, 2013, we experienced a $0.6 million increase in gathering revenues due to a gathering and processing agreement entered into during the third quarter of 2012 with Sabine Oil and Gas LLC and its affiliates (Sabine), an affiliate of our General Partner. During the nine months ended September 30, 2013, we gathered 21 MMcf/d in the Granite Wash compared to 17 MMcf/d during the same period in 2012. Granite Wash’s margins earned on our percent-of-proceeds contracts were relatively flat for the three and nine months ended September 30, 2013 compared to the same periods in 2012.
Operations and Maintenance Expense — Operations and maintenance expenses in our Granite Wash segment were approximately $0.3 million and $0.5 million higher during the three and nine months ended September 30, 2013 compared to the same periods in 2012, primarily due to the increase in volumes gathered and processed under our agreement with Sabine described above.
Other:
Our other operations include our assets in the Haynesville/Bossier Shale (Sabine System) and our assets in the Avalon Shale (Las Animas System). For the three and nine months ended September 30, 2013, our other operations’ EBITDA decreased by approximately $7 million and $8 million compared to the same periods in 2012, which primarily relates to the operations of our Sabine System. During the three months ended September 30, 2013, we recorded an impairment of goodwill of approximately $4 million on our Sabine system as a result of a decrease in anticipated revenues to be generated from those operations due primarily to our inability to renew and extend a significant revenue contract that expired in mid-2013.
Revenues and Volumes — The Sabine System had 15 MMcf/d and 26 MMcf/d in gathered volumes for the three and nine months ended September 30, 2013 compared to 45 MMcf/d and 53 MMcf/d during the same periods in 2012. The decrease in volumes was primarily due to lower volumes transported under our gathering contract with a subsidiary of US Infrastructure Holdings, LLC which expired in June 2013. Our gathering volumes from other producers on our Sabine System was lower for the three and nine months ended September 30, 2013 compared to the same periods in 2012, which also contributed to the $2 million and $3 million decrease in revenues period over period. EBITDA related to our Las Animas System remained relatively unchanged for the three and nine months ended September 30, 2013, compared to the same periods in 2012.
Operations and Maintenance Expense —Operations and maintenance expenses increased by approximately $0.5 million and $0.3 million during the three and nine months ended September 30, 2013 compared to the same period in 2012, primarily due to the write-off of costs associated with the construction of a lateral on our Las Animas System.
Investment in Jackalope
On July 19, 2013, Crestwood Niobrara acquired RKI’s 50% interest in Jackalope for approximately $108 million. Access Midstream Partners, L.P. (Access) owns the remaining 50% interest in and operates Jackalope. Crestwood Niobrara will manage the commercial operations of the Jackalope system. We account for our investment in Jackalope under the equity method of accounting.
For the three months ended September 30, 2013, we recorded a loss from our consolidated affiliate of approximately $0.4 million, which primarily related to (i) our proportionate share of Jackalope’s net income and (ii) the amortization of the excess of our investment balance compared to Jackalope’s net assets which was approximately $0.6 million for the three months ended September 30, 2013.
For the three and nine months ended September 30, 2013, Jackalope gathered 60 MMcf/d through its assets. Jackalope anticipates an increase in its gathering volumes as a result of several gathering and compression construction projects. During 2014, we intend to expand the gathering system from the current capacity of 60 MMcf/d to 180 MMcf/d. In addition, the joint venture is constructing a 120 MMcf/d gas processing facility. Both of these expansions are targeted to be completed during the third quarter of 2014.
Below is a discussion of items impacting our EBITDA that are not allocated to our segments.
General and Administrative Expenses — During the three and nine months ended September 30, 2013, general and administrative expenses increased by approximately $4 million and $7 million when compared to the same periods in 2012. General and administrative expenses include merger-related costs as well as other costs related to legal and other consulting services to evaluate certain transaction opportunities and other non-recurring matters. We incurred approximately $5 million and $11 million of these costs during the three and nine months ended September 30, 2013 compared to $1 million and $3 million of these costs in the same periods in 2012, respectively, which was the primary driver for the increase in general and administrative expense compared to the same periods in 2012.
38
Items not affecting EBITDA include the following:
Depreciation, Amortization and Accretion Expense —We have experienced increases in our depreciation, amortization and accretion expense primarily due to assets acquired during 2012, partially offset by a decrease of approximately $3 million related to the finalization of the purchase price allocation for Devon and EMAC acquisitions. For a further discussion of our asset acquisitions during 2012, see our 2012 Annual Report on Form 10-K.
Interest and Debt Expense— Interest and debt expense increased for the three and nine months ended September 30, 2013 compared to the same periods in 2012, primarily due to (i) higher outstanding balances on our credit facilities; and (ii) the issuance of an additional $150 million of 7.75% Senior Notes in November 2012.
The following table provides a summary of interest and debt expense (In thousands):
| | | | | | | | | | | | | | | | |
| | | Three Months Ended | | | Nine Months Ended | |
| | | September 30, | | | September 30, | |
| | | 2013 | | | 2012 | | | 2013 | | | 2012 | |
Credit Facilities | | $ | 4,957 | | | $ | 4,875 | | | $ | 13,610 | | | $ | 12,981 | |
Senior Notes | | | 7,118 | | | | 4,070 | | | | 21,133 | | | | 12,124 | |
Capital lease interest | | | 47 | | | | 55 | | | | 189 | | | | 149 | |
Other debt-related costs | | | 2 | | | | — | | | | (52 | ) | | | 462 | |
| | | | | | | | | | | | | | | | |
Gross interest and debt expense | | | 12,124 | | | | 9,000 | | | | 34,880 | | | | 25,716 | |
Less capitalized interest | | | (499 | ) | | | (95 | ) | | | (620 | ) | | | (291 | ) |
| | | | | | | | | | | | | | | | |
Interest and debt expense | | $ | 11,625 | | | $ | 8,905 | | | $ | 34,260 | | | $ | 25,425 | |
| | | | | | | | | | | | | | | | |
Liquidity and Capital Resources
Prior to the Merger discussed above, our sources of liquidity included cash flows generated from operations, available borrowing capacity under each of the CMM and CMLP Credit Facilities, and issuances of additional debt and equity in the capital markets. We believe that our sources of liquidity subsequent to the Merger will be sufficient to fund our short-term working capital requirements and capital expenditures for the remainder of 2013. We regularly review opportunities for both acquisitions and greenfield growth projects that will enhance our financial performance. Management continuously monitors our anticipated capital expenditures relative to our expected cash flows. We continue to evaluate funding alternatives, including additional borrowings and the issuance of debt or equity securities, to secure funds as needed or refinance outstanding debt balances with longer term notes.
Known Trends and Uncertainties Impacting Liquidity
Our financial condition and results of operations, including our liquidity and profitability, can be significantly affected by the following:
| | • | | Natural Gas Prices: Adding new volumes through our gathering systems is dependent on the drilling and completion activities of natural gas producers in our areas of operations. Although investment returns differ between natural gas basins, rich gas and dry gas reservoirs in certain natural gas basins and between various production companies, low natural gas prices may reduce the levels of drilling activity in areas around certain of our assets, particularly those that concentrate on gathering from dry gas reservoirs. We seek to mitigate this risk by diversifying into various geographical production basins with predominately rich gas natural gas reservoirs. We have observed that largely due to superior prices for crude oil and NGLs compared to natural gas, producers are shifting their drilling and development plans to focus on increasing production from rich gas basins or shale plays which offer better drilling economics as compared to production from dry gas basins. We operate or have an interest in six systems located in basins that include NGL rich gas shale plays, (i) the Cowtown System; (ii) the Granite Wash System; (iii) the Las Animas Systems; (iv) two systems in the Marcellus segment; and (v) the Jackalope System (our unconsolidated affiliate). For three and nine months ended September 30, 2013, these rich gas systems accounted for approximately 71% of our total revenues. We will continue to focus on expanding our business activities and opportunities in rich gas basins or rich gas shale plays due to the current trend of increased drilling and producer activities in these areas. |
| | • | | Regulatory Requirements: Our operations and the operations of our customers are subject to complex and evolving federal, state, local and other laws and regulations. In April 2012, the United States Environmental Protection Agency issued a final rule establishing new emission limitations for certain oil and gas facilities. These rules establish emission standards for gas wells that are hydraulically fractured (or re-fractured). These rules also establish emissions standards for natural gas processing equipment, including compressors, controllers, storage tanks, and gas processing plants. These or |
39
| | other federal or state initiatives relating to hydraulic fracturing or other environmental matters could impact the extent of our operations and/or give rise to or accelerate the need for additional capital projects. In addition, any further changes in laws or regulations, or delays in the issuance of required permits, may further impact the volumes on our systems. |
| | • | | Impact of Inflation and Interest Rates: Although inflation in the United States has been relatively low in recent years, the United States economy may experience a significant inflationary effect in the future. Although inflation would negatively impact the cost of our operations and cash flows through services provided to us, the majority of our gathering and processing agreements allow us to charge increased rates based on indices expected to track such inflationary trends. Interest rates have also remained low in recent years, as compared with historical averages. Should interest rates rise, our financing costs would increase accordingly. In addition, as with other yield-oriented securities, our unit price would also be negatively impacted by higher interest rates. Higher interest rates would increase the costs of issuing debt or equity necessary to finance potential future acquisitions. However, our competitors would face similar circumstances and we expect our cost of capital to remain competitive. |
Cash Flows
The following table provides a summary of our cash flows by category (In thousands):
| | | | | | | | |
| | | Nine Months Ended
September 30, | |
| | | 2013 | | | 2012 | |
Net cash provided by operating activities | | $ | 81,353 | | | $ | 77,868 | |
Net cash used in investing activities | | | (281,674 | ) | | | (503,333 | ) |
Net cash provided by financing activities | | | 205,878 | | | | 424,685 | |
Operating Activities
During the nine months ended September 30, 2013, we experienced an increase in our operating revenues compared to the same period in 2012, primarily due to our asset acquisitions during 2012, partially offset by higher operations and maintenance expenses and general and administrative costs related to the acquired assets and higher general and administrative costs primarily related to the Merger discussed above. In addition, our interest costs increased during the nine months of 2013 compared to the same period in 2012 as a result of higher outstanding balances on our credit facilities and Senior Notes.
Investing Activities
The midstream energy business is capital intensive, requiring significant investments for the acquisition or development of new facilities. We categorize our capital expenditures as either:
| | • | | expansion capital expenditures, which are made to construct additional assets, expand and upgrade existing systems, or acquire additional assets; or |
| | • | | maintenance capital expenditures, which are made to replace partially or fully depreciated assets, to maintain the existing operating capacity of our assets, extend their useful lives or comply with regulatory requirements. |
The following table summarizes our capital expenditures for the nine months ended September 30, 2013.
| | | | |
| | | (In thousands) | |
Expansion capital | | $ | 154,267 | |
Maintenance capital | | | 5,761 | |
Other(1) | | | 4,568 | |
| | | | |
Total | | $ | 164,596 | |
| | | | |
| (1) | Represents capital expenditures that are primarily reimbursable from our insurers. |
In July 2013, Crestwood Niobrara paid approximately $108 million to acquire a 50% interest in a gathering system located in the Powder River Basin of the Niobrara Shale play from RKI. In addition, during the three months ended September 30, 2013, we contributed an additional $20 million to our unconsolidated affiliate to fund its construction projects.
40
Financing Activities
Significant items impacting our financing activities during the nine months ended September 30, 2013 included the following:
| | • | | Net borrowings under our credit facilities of approximately $214 million; and |
| | • | | $103.5 million in proceeds from the issuance of 4,500,000 common units in March 2013. |
| | • | | $15.5 million in proceeds from the issuance of 675,000 common units in April 2013. |
In January 2013, we acquired Crestwood Holdings’ 65% membership interest in CMM for $258 million, which was funded through $129 million of borrowings under the CMLP Credit Facility and the issuance of approximately $129 million of equity to Crestwood Holdings.
In July 2013, Crestwood Niobrara acquired a 50% interest in a joint venture which was funded through our contribution of approximately $27 million (which was borrowed under the CMLP Credit Facility) and an additional $81 million was obtained through Crestwood Niobrara’s issuance of a preferred interest to a subsidiary of GE EFS). Crestwood Niobrara will fund 75% of future capital contributions to the gathering system joint venture through additional preferred interest issuances to GE EFS (up to a maximum of $69 million), with the remainder to be funded through our capital contributions to Crestwood Niobrara. During the three months ended September 30, 2013, GE EFS contributed an additional $15 million to Crestwood Niobrara in exchange for an equivalent number of preferred units. We serve as the managing member of Crestwood Niobrara and we have the ability to redeem GE EFS’s preferred security in either cash or common units, subject to certain restrictions.
Item 3. Quantitative and Qualitative Disclosures About Market Risk
There are no material changes in our quantitative and qualitative disclosures about market risks from those reported in our 2012 Annual Report on Form 10-K.
Item 4. Controls and Procedures
Disclosure Controls and Procedures
As of September 30, 2013, we carried out an evaluation under the supervision and with the participation of our management, including the Chief Executive Officer and Interim Chief Financial Officer of our General Partner, as to the effectiveness, design and operation of our disclosure controls and procedures (as defined in the Securities Exchange Act of 1934, as amended (Exchange Act) Rules 13a-15(e) and 15d-15(e)). This evaluation considered the various processes carried out under the direction of our disclosure committee in an effort to ensure that information required to be disclosed in the SEC reports we file or submit under the Exchange Act is accumulated and communicated to our management, including our Chief Executive Officer and Interim Chief Financial Officer of our General Partner, as appropriate, to allow timely decisions regarding required disclosure and is recorded, processed, summarized and reported within the time periods specified in the rules and forms of the SEC. Our management, including the Chief Executive Officer and Interim Chief Financial Officer of our General Partner, does not expect that our disclosure controls and procedures or our internal controls will prevent and/or detect all errors and all fraud. A control system, no matter how well conceived and operated, can provide only reasonable, not absolute, assurance that the objectives of the control system are met. Further, the design of a control system must reflect the fact that there are resource constraints, and the benefits of controls must be considered relative to their costs. Our disclosure controls and procedures are designed to provide reasonable assurance of achieving their objectives and our Chief Executive Officer and Interim Chief Financial Officer of our General Partner concluded that our disclosure controls and procedures were effective at the reasonable assurance level as of September 30, 2013.
Changes in Internal Control Over Financial Reporting
There were no changes in our internal control over financial reporting (as defined in Exchange Act Rules 13a-15(f) and 15d-15(f)) during the three months ended September 30, 2013 that have materially affected, or are reasonably likely to materially affect our internal control over financial reporting.
41
PART II — OTHER INFORMATION
Item 1. Legal Proceedings
See Part I, Item 1. Financial Statements, Note 9, which is incorporated herein by reference.
Item 1A. Risk Factors
Important factors that could cause actual results to differ materially from estimates or projections contained in our forward-looking statements are described in our 2012 Annual Report on Form 10-K under Part I, Item 1A. Risk Factors.
Item 2. Unregistered Sales of Equity Securities and Use of Proceeds
None.
Item 3. Defaults Upon Senior Securities
None.
Item 4. Mine Safety Disclosures
Not Applicable.
Item 5. Other Information
None.
Item 6. Exhibits
The exhibit index is incorporated herein by reference into this Quarterly Report on Form 10-Q.
42
SIGNATURES
Pursuant to the requirements of the Securities Exchange Act of 1934, the registrant has duly caused this report to be signed on its behalf by the undersigned thereunto duly authorized.
| | | | | | |
| | | | | CRESTWOOD MIDSTREAM PARTNERS LP |
| | | | (formerly known as Inergy Midstream, L.P.) |
| | | | By: CRESTWOOD MIDSTREAM GP LLC, |
| | | | (its General Partner) |
| | | |
| Date: November 7, 2013 | | | | By: | | /s/ Michael J. Campbell |
| | | | | | Michael J. Campbell |
| | | | | | Senior Vice President and Chief Financial Officer |
| | | | | | (Duly Authorized Officer and Principal Financial Officer) |
43
EXHIBIT INDEX
Exhibits designated by an asterisk (*) are filed herewith and those with (**) are furnished and not filed herewith. Exhibits designated by a plus (+) represent a management contract or compensatory plan or arrangement.
| | |
Exhibit
No. | | Description |
| |
| 3.1 | | Third Amended and Restated Partnership Agreement of Crestwood Midstream Partners LP (filed as Exhibit 3.1 to Crestwood Midstream Partners LP’s Form 8-K/A filed October 9, 2013, and included herein by reference). |
| |
| 3.2 | | Certificate of Limited Partnership of Quicksilver Gas Services LP (incorporated by reference to Exhibit 3.1 to Crestwood Midstream Partners LP’s Form S-1, File No. 33-140599, filed on February 12, 2007). |
| |
| 3.3 | | Certificate of Amendment to the Certificate of Limited Partnership of Quicksilver Gas Services LP (incorporated by reference to Exhibit 3.1 to Crestwood Midstream Partners LP’s Form 8-K, filed on October 7, 2010). |
| |
| 4.1 | | Supplemental Indenture No. 5, dated as of October 7, 2013, among Crestwood Midstream Partners LP (f/k/a Inergy Midstream, L.P.), Crestwood Midstream Finance Corp (f/k/a NRGM Finance Corp.), Crestwood Midstream Partners, LP, as original issuer, Crestwood Midstream Finance Corporation, as original co-issuer and The Bank of New York Mellon Trust Company, N.A. and the guarantor parties thereto (filed as Exhibit 4.1 to Crestwood Midstream Partners LP’s Form 8-K/A filed October 8, 2013, and included herein by reference). |
| |
| 10.1 | | Amended and Restated Limited Liability Company Agreement of Crestwood Niobrara LLC, dated July 19, 2013 (filed as Exhibit 10.1 to Crestwood Midstream Partners LP’s Form 8-K filed July 22, 2013, and incorporated herein by reference).*** |
| |
| 10.2 | | Registration Rights Agreement by and between Crestwood Midstream Partners LP and Aircraft Services Corporation, dated July 19, 2013 (filed as Exhibit 10.1 to Crestwood Midstream Partners LP’s Form 8-K filed July 22, 2013, and incorporated herein by reference). |
| |
| *12.1 | | Computation of Ratio of Earnings to Fixed Charges. |
| |
| *31.1 | | Certification Pursuant to Section 302 of the Sarbanes-Oxley Act of 2002. |
| |
| *31.2 | | Certification Pursuant to Section 302 of the Sarbanes-Oxley Act of 2002. |
| |
| **32.1 | | Certification Pursuant to 18 U.S.C. Section 1350, as adopted pursuant to Section 906 of the Sarbanes-Oxley Act of 2002. |
| |
| **101.INS | | XBRL Instance Document |
| |
| **101.SCH | | XBRL Taxonomy Extension Schema Linkbase Document |
| |
| **101.CAL | | XBRL Taxonomy Extension Calculation Linkbase Document |
| |
| **101.DEF | | XBRL Taxonomy Extension Definition Linkbase Document |
| |
| **101.LAB | | XBRL Taxonomy Extension Labels Linkbase Document |
| |
| **101.PRE | | XBRL Taxonomy Extension Presentation Linkbase Document |
| *** | Confidential treatment has been requested for certain portions which are omitted in the copy of the exhibit electronically filed with the Commission. The omitted information has been filed separately with the Commission pursuant to our application for confidential treatment. |
44