Table of Contents
Filed Pursuant to Rule 424(b)(3)
Registration No. 333-140240
THE FRONTIER FUND
Minimum Number of Units to be Sold during the Initial Offering Period† | Maximum Number of Units to be Offered | Price to the Public Per Unit‡ | Upfront Selling Commissions* | Proceeds to The Frontier Fund** | |||||||
Balanced Series-1: | N/A | 7,820,000 | Net Asset Value | None | 100 | % | |||||
Balanced Series-2: | 1,930,000 | Net Asset Value | None | 100 | % | ||||||
Balanced Series-1a: | N/A | 200,000 | Net Asset Value | None | 100 | % | |||||
Balanced Series-2a: | 70,000 | Net Asset Value | None | 100 | % | ||||||
Graham Series-1: | N/A | 980,000 | Net Asset Value | None | 100 | % | |||||
Graham Series-2: | 120,000 | Net Asset Value | None | 100 | % | ||||||
Winton Series-1: | N/A | 560,000 | Net Asset Value | None | 100 | % | |||||
Winton Series-2: | 90,000 | Net Asset Value | None | 100 | % | ||||||
Campbell/Graham Series-1: | N/A | 2,500,000 | Net Asset Value | None | 100 | % | |||||
Campbell/Graham Series-2: | 500,000 | Net Asset Value | None | 100 | % | ||||||
Currency Series-1: | N/A | 200,000 | Net Asset Value | None | 100 | % | |||||
Currency Series-2: | 30,000 | Net Asset Value | None | 100 | % | ||||||
Long Only Commodity Series-1: | N/A | 250,000 | Net Asset Value | None | 100 | % | |||||
Long Only Commodity Series-2: | 100,000 | Net Asset Value | None | 100 | % | ||||||
Long/Short Commodity Series-1: | N/A | 1,200,000 | Net Asset Value | None | 100 | % | |||||
Long/Short Commodity Series-2: | 250,000 | Net Asset Value | None | 100 | % | ||||||
Managed Futures Index Series-1: | N/A | 500,000 | Net Asset Value | None | 100 | % | |||||
Managed Futures Index Series-2: | 250,000 | Net Asset Value | None | 100 | % | ||||||
| 17,550,000 |
| † | The Initial Offering Period for the Balanced Series, Winton Series and Currency Series ended in September 2004, the Initial Offering Period for the Graham Series ended in November 2004, the Initial Offering Period for the Campbell/Graham Series ended in February 2005, the Initial Offering Period for the Long Only Commodity Series and the Long/Short Commodity Series ended in March 2006, the Initial Offering Period for the Managed Futures Index Series ended in April 2006 and the Initial Offering Period for the Class 1a and Class 2a of the Balanced Series ended in May 2006. |
| ‡ | During the Continuous Offering Period, Units may be purchased, and, subject to certain restrictions, Units of one Series may be exchanged for Units of another Series, at the then-current Net Asset Value per Unit of the applicable Series. |
| * | Each Series of Units is offering Units designated as Class 1 Units and Class 2 Units. In addition, the Balanced Series is offering Units designated as Class 1a Units and Class 2a Units. The Selling Agents will receive (i) with respect to all Class 1 Units and Class 1a Units sold by them, an initial service fee of up to 3.0% of the purchase price of your Units and annual on-going service fees of up to 3.0% of the Net Asset Value of your Units, and (ii) with respect to all Class 2 Units and Class 2a Units sold by them, on-going service fees of up to 0.5% of the Net Asset Value of your Units. The initial service fee will be prepaid by the Managing Owner. |
| ** | During the Continuous Offering Period, the proceeds will be turned over to such Series for trading. See “Series Subscription Minimums” on page 8 of this Prospectus. Because Equinox Fund Management, LLC will be responsible for payment of the organization and offering expenses of The Frontier Fund, except for the initial service fee, if any, 100% of the proceeds raised during the Continuous Offering Period will be initially available for each Series’ trading activities. During the Continuous Offering Period, the proceeds will be turned over to such Series for trading. See “Series Subscription Minimums” on page 8 of this Prospectus. Because Equinox Fund Management, LLC will be responsible for payment of the organization and offering expenses of The Frontier Fund, except for the initial service fee, if any, 100% of the proceeds raised during the Continuous Offering Period will be initially available for each Series’ trading activities. |
| • | The Initial Offering Period for the Balanced Series, Winton Series and Currency Series closed in September 2004, the Initial Offering Period for the Graham Series closed in November 2004, the Initial Offering Period for the Campbell/Graham Series closed in February 2005, the Initial Offering Period for the Long Only Commodity Series and the Long/Short Commodity Series closed in March 2006, the Initial Offering Period for the Managed Futures Index Series ended in April 2006 and the Initial Offering Period for the Class 1a and Class 2a of the Balanced Series ended in May 2006. Currently, Units in the Balanced Series, Graham Series, Winton Series, Campbell/Graham Series, Currency Series, Long Only Commodity Series, Long/Short Commodity Series and Managed Futures Index Series are being offered as of each day of each week and will continue to be offered until the maximum amount of each such Series’ Units which are registered are sold. The Managing Owner may terminate the Continuous Offering Period at any time. |
| • | The Selling Agents, including Bornhoft Group Securities Corporation, an affiliate of the Managing Owner, will use their “best efforts” to sell Units. This means that the Selling Agents are not required to sell any specific number or dollar amount of Units but will use their best efforts to sell the Units offered. |
| • | The Units of each Series are speculative securities and their purchase involves a high degree of risk.You should consider all risk factors before investing in any Series of The Frontier Fund. Please refer to “Risk Factors” beginning on page 22 of this Prospectus.Specifically, you should be aware that: |
| – | Futures, forward and options trading is volatile and highly leveraged |
| – | Past performance is not necessarily indicative of future results |
| – | Each Series will rely on its Trading Advisor(s) for success |
| – | You could lose a substantial portion, or even all, of your investment |
| – | Your annual tax liability is anticipated to exceed cash distributions to you |
| – | If you redeem all or a portion of your Units in Class 1 of any Series on or before the end of twelve (12) full months following the effective date of the purchase of the Units being redeemed, you will be charged a redemption fee of up to 3.0% of the Net Asset Value at which your Units are redeemed |
| – | Transfers are restricted; no market exists or is expected to exist for the Units of any Series |
| • | The Frontier Fund is not a mutual fund and is not subject to regulation under the Investment Company Act of 1940, as amended. |
NEITHER THE SECURITIES AND EXCHANGE COMMISSION NOR ANY STATE SECURITIES COMMISSION HAS APPROVED OR DISAPPROVED THESE SECURITIES, OR DETERMINED IF THIS PROSPECTUS IS TRUTHFUL OR COMPLETE. ANY REPRESENTATION TO THE CONTRARY IS A CRIMINAL OFFENSE.
THE COMMODITY FUTURES TRADING COMMISSION HAS NOT PASSED UPON THE MERITS OF PARTICIPATING IN THIS POOL NOR HAS THE COMMISSION PASSED ON THE ADEQUACY OR ACCURACY OF THIS DISCLOSURE DOCUMENT.
The date of this Prospectus is February 12, 2007.
Table of Contents
| • | Each Series of Units of The Frontier Fund will engage in the speculative trading of a diversified portfolio of futures, forward (including interbank foreign currencies) and options contracts and other derivative instruments. Each Series is being separately offered, and the assets of each Series will be segregated from the other Series and separately valued. |
Series: | Units of Beneficial Interest: | Trading Advisor: | Program(s): | |||
Balanced | 10,020,000 | Major Advisors: Campbell & Company, Inc Non-Major Advisors Emerging Managers (allocation of <5%) |
Financial, Metal & Energy Large Portfolio
Diversified Program Various Programs | |||
Graham | 1,100,000 | Graham Capital Management, L.P. | K-4 Program at 150% leverage | |||
Winton | 650,000 | Winton Capital Management Ltd. | Diversified Program | |||
Campbell/Graham | 3,000,000 | Campbell & Company, Inc. Graham Capital Management, L.P. | Financial, Metal & Energy Large Portfolio K-4 Program at 150% leverage | |||
Currency | 230,000 | C-View International Limited | Currency Program | |||
| FX Concepts, Inc. | Developed Markets Currency and Global Currency Programs | |||||
| Gain Capital Asset Management LLC | Gain MAC-2x Program | |||||
Long Only Commodity | 350,000 | N/A | Reuters/Jefferies CRB Index and Jefferies Commodity Performance Index | |||
Long/Short Commodity | 1,450,000 | Cornerstone Quantitative Investment Group, Inc. | Real Commodity Analysis Program | |||
| Non-Major Commodity Trading Advisors | Various Programs | |||||
Managed Futures Index | 750,000 | Conquest Capital, LLC | Conquest Managed Futures Select Program |
| • | Once trading commences for the Series in which you have invested, you may purchase additional Units in such Series, Exchange your Units in one Series for Units in another Series which has also commenced trading or may redeem your Units on a daily basis. Exchanges will be available between the various Class 1 Units of the Series of Units, and Exchanges will be available between the various Class 2 Units. However, it is important to note that Exchanges will not be allowed from Class 1 to Class 2 or vice versa. In addition, you will only be allowed to Exchange your Units in one Series for Units in another Series which is registered for sale in your State. Furthermore, Exchanges will be allowed out of the Graham Series, but Exchanges into the Graham Series will be restricted to those investors that have purchased their Units through a Selling Agent that acts as a selling agent for the Graham Series. |
| • | In general, your minimum initial subscription is $1,000, or, if you are a Plan (including an IRA), an employee or family member of an employee of the Managing Owner or its affiliates or a charitable organization, you have no minimum initial subscription requirements. Your minimum initial purchase in any one Series is $1,000, and, if you are an existing Limited Owner, you will be able to purchase additional Units in increments of $100. If you are a Plan (including an IRA), an employee or family member of an employee of the Managing Owner or its affiliates or a charitable organization, you have no minimum on the amount of additional Units that may be purchased. |
Table of Contents
COMMODITY FUTURES TRADING COMMISSION
RISK DISCLOSURE STATEMENT
YOU SHOULD CAREFULLY CONSIDER WHETHER YOUR FINANCIAL CONDITION PERMITS YOU TO PARTICIPATE IN A COMMODITY POOL. IN SO DOING, YOU SHOULD BE AWARE THAT FUTURES AND OPTIONS TRADING CAN QUICKLY LEAD TO LARGE LOSSES AS WELL AS GAINS. SUCH TRADING LOSSES CAN SHARPLY REDUCE THE NET ASSET VALUE OF THE POOL AND CONSEQUENTLY THE VALUE OF YOUR INTEREST IN THE POOL. IN ADDITION, RESTRICTIONS ON REDEMPTIONS MAY AFFECT YOUR ABILITY TO WITHDRAW YOUR PARTICIPATION IN THE POOL.
FURTHER, COMMODITY POOLS MAY BE SUBJECT TO SUBSTANTIAL CHARGES FOR MANAGEMENT, AND ADVISORY AND BROKERAGE FEES. IT MAY BE NECESSARY FOR THOSE POOLS THAT ARE SUBJECT TO THESE CHARGES TO MAKE SUBSTANTIAL TRADING PROFITS TO AVOID DEPLETION OR EXHAUSTION OF THEIR ASSETS. THIS DISCLOSURE DOCUMENT CONTAINS A COMPLETE DESCRIPTION OF EACH EXPENSE TO BE CHARGED THIS POOL AT PAGES 55 THROUGH 62 AS WELL AS IN THE APPENDICES ATTACHED TO THIS PROSPECTUS FOR EACH SERIES OF UNITS AND A STATEMENT OF THE PERCENTAGE RETURN NECESSARY TO BREAK EVEN, THAT IS, TO RECOVER THE AMOUNT OF YOUR INITIAL INVESTMENT IN THE SUPPLEMENT TO THIS PROSPECTUS FOR EACH INDIVIDUAL SERIES.
THIS BRIEF STATEMENT CANNOT DISCLOSE ALL THE RISKS AND OTHER FACTORS NECESSARY TO EVALUATE YOUR PARTICIPATION IN THIS COMMODITY POOL. THEREFORE, BEFORE YOU DECIDE TO PARTICIPATE IN THIS COMMODITY POOL, YOU SHOULD CAREFULLY STUDY THIS DISCLOSURE DOCUMENT, INCLUDING A DESCRIPTION OF THE PRINCIPAL RISK FACTORS OF THIS INVESTMENT AT PAGES 18 THROUGH 33.
YOU SHOULD ALSO BE AWARE THAT THIS COMMODITY POOL MAY TRADE FOREIGN FUTURES OR OPTIONS CONTRACTS. TRANSACTIONS ON MARKETS LOCATED OUTSIDE THE UNITED STATES, INCLUDING MARKETS FORMALLY LINKED TO A UNITED STATES MARKET, MAY BE SUBJECT TO REGULATIONS WHICH OFFER DIFFERENT OR DIMINISHED PROTECTION TO THE POOL AND ITS PARTICIPANTS. FURTHER, UNITED STATES REGULATORY AUTHORITIES MAY BE UNABLE TO COMPEL THE ENFORCEMENT OF THE RULES OF REGULATORY AUTHORITIES OR MARKETS IN NON UNITED STATES JURISDICTIONS WHERE TRANSACTIONS FOR THE POOL MAY BE EFFECTED.
THIS POOL HAS A LIMITED PERFORMANCE HISTORY.
| • | You should rely only on the information contained in this Prospectus or incorporated by reference which legally forms a part of the Prospectus. We have not authorized anyone to provide you with information that is different. |
| • | This Prospectus is in two parts: a disclosure document and a statement of additional information attached as Part II to this Prospectus, or the Statement of Additional Information. These parts are bound together, and both parts contain important information. |
| • | This Prospectus is not an offer to sell, nor is it seeking an offer to buy these securities in any jurisdiction where the offer or sale is not permitted. |
| • | There is no guarantee that information in this Prospectus is correct as of any time after the date appearing on the cover. |
| • | The Trust is not a mutual fund or any other type of investment company within the meaning of the Investment Company Act of 1940, as amended, and is not subject to the regulations under the Investment Company Act. |
Table of Contents
| • | This Prospectus must be accompanied by a recent monthly report of the Trust. |
| • | The Selling Agents of the Trust must deliver any supplemented or amended Prospectus issued by the Trust. |
| • | You should not invest more than 10% of your net worth (exclusive of home, furnishings and automobiles in the case of individuals; or readily marketable securities in the case of entities) in any Series of Units of the Trust, or in the Trust as a whole. |
Table of Contents
Page | ||
PART I: | ||
| 1 | ||
| 22 | ||
| 41 | ||
| 42 | ||
| 43 | ||
DESCRIPTION OF THE TRUST, TRUSTEE, MANAGING OWNER AND AFFILIATES | 44 | |
| 56 | ||
| 58 | ||
| 59 | ||
| 59 | ||
| 61 | ||
| 64 | ||
| 64 | ||
| 73 | ||
| 78 | ||
| 79 | ||
| 81 | ||
| 83 | ||
| 101 | ||
| 104 | ||
| 104 | ||
| 105 | ||
| 105 | ||
| 105 | ||
| Fin. - 1 | ||
APPENDICES TO PART I | ||
| Balanced App. – 1 | ||
| Graham App. – 1 | ||
| Winton App. – 1 | ||
| Campbell/Graham App. – 1 | ||
| Currency App. – 1 | ||
| Long Only Commodity App. – 1 | ||
| Long/Short Commodity App. – 1 | ||
| Managed Futures Index App. – 1 | ||
| SAI-1 | ||
| SAI-8 | ||
| SAI-12 | ||
| SAI-16 | ||
| SAI-17 | ||
| SAI-30 | ||
| SAI-63 | ||
Table of Contents
Page | ||
EXHIBITS: | ||
Exhibit A - Amended and Restated Declaration of Trust and Trust Agreement | A-1 | |
| B-1 | ||
| C-1 | ||
| D-1 | ||
| E-1 | ||
Exhibit F - Application for Transfer of Ownership / Re-registration Form | F-1 | |
| G-1 | ||
Under Separate Cover: | ||
Subscription Agreement | ||
Table of Contents
This summary of all material information provided in this Prospectus is intended for quick reference only. The remainder of this Prospectus contains more detailed information; you should read the entire Prospectus, including the Statement of Additional Information and all exhibits to the Prospectus, before deciding to invest in any Series of Units. This Prospectus is intended to be used beginning February 12, 2007.
The Trust | The Frontier Fund, or the Trust, was formed as a Delaware statutory trust on August 8, 2003, with separate series, or each, a Series, of units of beneficial interest, or the Units. Its term will expire on December 31, 2053 (unless terminated earlier in certain circumstances). The principal offices of the Trust and Equinox Fund Management, LLC, or the Managing Owner, are located at 1660 Lincoln Street, Suite 100, Denver, Colorado 80264, and their telephone number is (303) 837-0600. See “Trust Agreement.” The Trust is a multi-advisor commodity pool as described in Commodity Futures Trading Commission, or CFTC, Regulation § 4.10(d)(2). |
The Series | The Trust’s Units are being offered in eight (8) separate and distinct Series: Balanced Series, Graham Series, Winton Series, Campbell/Graham Series, Currency Series, Long Only Commodity Series, Long/Short Commodity Series and Managed Futures Index Series. The Trust may issue future Series of Units. The Units of the Graham Series, Winton Series, Campbell/Graham Series, Currency Series, Long Only Commodity Series, Long/Short Commodity Series and Managed Futures Index Series will be separated into two sub-classes, or each, a Sub-Class, of Units, and the Units of the Balanced Series will be separated into four Sub-Classes of Units. The Trust, with respect to each Series, will: |
| • | engage in the speculative trading of a diversified portfolio of futures, forward (including interbank foreign currencies) and options contracts and other derivative instruments and may, from time to time, engage in cash and spot transactions; |
| • | allocate funds, directly or indirectly, to a subsidiary trading vehicle or managed account or invest in a limited liability company, limited partnership or other investment vehicle, or each, a Trading Company. Except for the Trading Company established for the Long Only Commodity Series, each Trading Company will have one-year renewable contracts with its own independent commodity trading advisor(s), or each, a Trading Advisor, that will manage all or a portion of such Trading Company’s assets, make the trading decisions for the assets of each Series vested in such Trading Company, segregate its assets from any other Trading Company and maintain separate, distinct records for each Series, and account for its assets separately from the other Series and the other Trust assets; |
| • | calculate the net assets, or the Net Asset Value, of its Units separately from the other Series; |
| • | have an investment objective of increasing the value of your Units over the long term (capital appreciation), while controlling risk and |
1
Table of Contents
volatility; further, to offer exposure to the investment programs of individual Trading Advisors and to specific instruments (e.g., currencies); |
| • | will offer Units in the Graham Series, Winton Series, Campbell/Graham Series, Currency Series, Long Only Commodity Series, Long/Short Commodity Series and Managed Futures Index Series in two Sub-Classes—Class 1 and Class 2; and |
| • | will offer Units in the Balanced Series in four Sub-Classes—Class 1, Class 2, Class 1a and Class 2a. |
Class 1 Units, Class 2 Units, Class 1a Units and Class 2a Units | • Investors who purchase Class 1 Units of the Balanced Series, Winton Series, Campbell/Graham Series, Currency Series, Graham Series or Long/Short Commodity Series, as well as investors who purchase Class 1a Units of the Balanced Series, will be charged an initial service fee up to three percent (3.0%) of the Net Asset Value of each Unit purchased, for the benefit of Selling Agents selling Class 1 Units, or Class 1a Units, as applicable. The Managing Owner will prepay the initial service fee for bona fide transactions, which initial service fee will be amortized monthly at an annual rate of up to three percent (3.0%) of the average daily Net Asset Value of Class 1 or Class 1a, as applicable, of such Series, provided, however, that investors who redeem all or a portion of their Class 1 Units or Class 1a Units of any Series during the first twelve (12) months following the effective date of their purchase will be subject to a redemption fee of up to three percent (3.0%) of the Net Asset Value at which such investor redeemed to reimburse the Managing Owner for the then-unamortized balance of the prepaid initial service fee. In addition, after the expiration of twelve (12) months following the purchase of Class 1 Units of the Balanced Series, Winton Series, Campbell/Graham Series, Currency Series or Graham Series, investors who purchased Class 1 Units of such Series will be charged an annual on-going service fee of up to three percent (3.0%) of the Net Asset Value of each Unit purchased, for the benefit of Selling Agents selling Class 1 Units for on-going services provided to the Trust and the Limited Owners by the Selling Agents. |
| • | After the expiration of twelve (12) months following the purchase of Class 1 Units of the Long/Short Commodity Series or Class 1a Units of the Balanced Series, investors who purchased Class 1 Units or Class 1a Units, as applicable, of such Series will be charged an annual on-going service fee of up to three percent (3.0%) of the Net Asset Value of each Unit purchased, for the benefit of Selling Agents selling Class 1 Units or Class 1a Units, as applicable, for on-going services provided to the Trust and the Limited Owners by the Selling Agents. The on-going service fee with respect to the Class 1 Units of the Long/Short Commodity Series or Class 1a Units of the Balanced Series will continue only until the aggregate initial service fees and on-going service fees received by the Selling Agent with respect to |
2
Table of Contents
such Units totals ten percent (10%) of the purchase price of such Class 1 Units of such Series. |
| • | Investors who purchase Class 1 Units of the Long Only Commodity Series or the Managed Futures Index Series will be charged an initial service fee up to two percent (2.0%) of the Net Asset Value of each Unit purchased, for the benefit of Selling Agents selling Class 1 Units. The Managing Owner will prepay the initial service fee for bona fide transactions, which initial service fee will be amortized monthly at an annual rate of up to two percent (2.0%) of the average daily Net Asset Value of Class 1 of such Series, provided, however, that investors who redeem all or a portion of their Class 1 Units of such Series during the first twelve (12) months following the effective date of their purchase will be subject to a redemption fee of up to two percent (2.0%) of the Net Asset Value at which such investor redeemed to reimburse the Managing Owner for the then-unamortized balance of the prepaid initial service fee. |
| • | After the expiration of twelve (12) months following the purchase of Class 1 Units of the Long Only Commodity Series or the Managed Futures Index Series, investors who purchased Class 1 Units of such Series will be charged an annual on-going service fee of up to two percent (2.0%) of the Net Asset Value of each Unit purchased, for the benefit of Selling Agents selling Class 1 Units for on-going services provided to the Trust and the Limited Owners by the Selling Agents. The on-going service fee with respect to the Class 1 Units of the Long Only Commodity Series or the Managed Futures Index Series will continue only until the aggregate initial service fees and on-going service fees received by the Selling Agent with respect to such Units totals ten percent (10%) of the purchase price of such Class 1 Units of such Series. |
| • | Class 2 Units and Class 2a Units may only be offered to investors who are represented by approved Selling Agents who are directly compensated by the investor for services rendered in connection with an investment in the Trust (such arrangements commonly referred to as “wrap-accounts”). Investors who purchase Class 2 Units of any Series or Class 2a Units of the Balanced Series will be charged no initial service fee. However, the Managing Owner may pay the Selling Agents an on-going service fee of up to 0.5% annually of the Net Asset Value of each Class 2 Unit or Class 2a Unit sold by them for certain administrative services. The on-going service fee payable to the Selling Agents with respect to the Class 2 Units of the Long Only Commodity Series, the Long/Short Commodity Series and the Managed Futures Index Series and the Class 2a Units of the Balanced Series will continue until the aggregate initial service fees and on-going service fees received by the Selling Agent with respect to such Units totals ten percent (10%) of the purchase price of such Class 2 Units or Class 2a Units of such Series. The on-going service fee payable to the Selling Agents with respect to the Class 2 Units of the Balanced Series registered with the SEC on or after January 26, 2007, will continue until the aggregate initial service fees and |
3
Table of Contents
on-going service fees received by the Selling Agent with respect to such Units totals ten percent (10%) of the purchase price of such Class 2 Units of such Series. The Trust intends to sell the newly-registered Class 2 Units of the Balanced Series only once all previously-registered Class 2 Units of the Balanced Series have been sold. The Managing Owner will pay such on-going service fee out of brokerage commissions and fees paid to the Managing Owner and the Clearing Brokers. See “Fees and Expenses—Charges to be paid by the Trust—Brokerage Commissions and Fees.” |
Balanced Series | Trading for the Balanced Series will be directed by a group of Trading Advisors, including Campbell & Company, Inc., or Campbell; Chesapeake Capital Corporation, or Chesapeake, Cornerstone Quantitative Investment Group, Inc., or Cornerstone; Conquest Capital, LLC, or Conquest; Meyer Capital Management Inc., or Meyer; Winton Capital Management Ltd., or Winton; and one or more Trading Advisors designated as “Emerging Managers” to the Balanced Series. The Managing Owner anticipates that between ten percent (10%) and twenty percent (20%) of the Balanced Series’ assets will be allocated to each Trading Advisor designated as a “major commodity trading advisor” that is trading in such Series. In addition, a portion of the assets of the Balanced Series will be allocated to the Trading Company for the Currency Series, the Trading Company for the Long Only Commodity Series, the Trading Company for the Long/Short Commodity Series and the Trading Company for the Managed Futures Index Series. The actual allocation of the Balanced Series’ assets will vary based upon the trading performance of the Trading Advisors and the Managing Owner’s asset allocation activities. The Managing Owner may appoint additional, replacement or substitute Trading Advisors, subject to its review and due diligence. Other or additional trading programs and Trading Advisors may be used in the future. See the appendix for the Balanced Series Units attached to Part I of this Prospectus, or the Balanced Series Appendix. |
Graham Series | Trading for the Graham Series will be directed by Graham Capital Management, L.P., or Graham. Graham will trade 100% of Graham Series’ assets pursuant to its K-4 program at 150% leverage. Other or additional trading programs may be used in the future. See the appendix for the Graham Series Units attached to Part I of this Prospectus, or the Graham Series Appendix. |
Winton Series | The Winton Series was originally designated as the “Beach Series,” and trading for the Winton Series was directed by Beach Capital Management Ltd. As the Series will be directed by Winton, its name was changed to the “Winton Series.” Trading for the Winton Series will be directed by Winton. Winton will trade 100% of Winton Series’ assets pursuant to its diversified program. Other or additional trading programs may be used in the future. See the appendix for the Winton Series Units attached to Part I of this Prospectus, or the Winton Series Appendix. |
Campbell/Graham Series | Trading for the Campbell/Graham Series will be directed by Campbell and Graham. The Managing Owner anticipates that each of Campbell and Graham will be allocated approximately 50% of Campbell/Graham |
4
Table of Contents
Series’ assets. The actual allocation of the Campbell/Graham Series’ assets may vary based upon the trading performance of the Trading Advisors and the Managing Owner’s asset allocation activities. Campbell will trade the portion of Campbell/Graham Series’ assets allocated to it pursuant to its Financial, Metal & Energy Large Portfolio and Graham will trade the portion of Campbell/Graham Series’ assets allocated to it pursuant to its K-4 program at 150% leverage. The Managing Owner may appoint additional, replacement or substitute Trading Advisors, subject to its review and due diligence. Other or additional trading programs and Trading Advisors may be used in the future. See the appendix for the Campbell/Graham Series Units attached to Part I of this Prospectus, or the Campbell/Graham Series Appendix. |
Currency Series | The Currency Series was originally a single-advisor Series designated as the “C-View Currency Series.” As trading for the Series is now directed by multiple Trading Advisors, its name was changed to the “Currency Series.” Trading for the Currency Series will be directed by a group of Trading Advisors, including C-View International Limited, or C-View, FX Concepts, Inc., or FX Concepts, and GAIN Capital Asset Management LLC, or Gain. The Managing Owner anticipates that between ten percent (10%) and fifty percent (50%) of the Currency Series’ assets will be allocated to each Trading Advisor designated as a “major FX trading advisor” that is trading in such Series. The actual allocation of the Currency Series’ assets will vary based upon the trading performance of the Trading Advisors and the Managing Owner’s asset allocation activities. The Managing Owner may appoint additional, replacement or substitute Trading Advisors, subject to its review and due diligence. Other or additional trading programs may be used in the future. See the appendix for the Currency Series Units attached to Part I of this Prospectus, or the Currency Series Appendix. |
Long Only Commodity Series | Trading for the Long Only Commodity Series will be directed by the Managing Owner, pursuant to the limited liability company agreement governing the Trading Company to which assets of the Long Only Commodity Series will be allocated. 50% of the Long Only Commodity Series’ assets will be invested in a swap which will track the performance, positive or negative, of the Reuters/Jefferies CRB Index and 50% of the Long Only Commodity Series’ assets will be invested in a swap which will track the performance, positive or negative, of the Jefferies Commodity Performance Index, in each case less the costs of the swaps. Other or additional trading programs may be used in the future. See the appendix for the Long Only Commodity Series Units attached to Part I of this Prospectus, or the Long Only Commodity Series Appendix. |
Long/Short Commodity Series | Trading for the Long/Short Commodity Series will be directed by a group of Trading Advisors. The Managing Owner anticipates that less than ten percent (10%) of the Long/Short Commodity Series’ assets will be allocated to each Trading Advisor that is trading on behalf of such Series. The actual allocation of the Long/Short Commodity Series’ assets will vary based upon the trading performance of the Trading Advisors and the |
5
Table of Contents
Managing Owner’s asset allocation activities. The Managing Owner may appoint additional, replacement or substitute Trading Advisors, subject to its review and due diligence. Other or additional trading programs and Trading Advisors may be used in the future. See the appendix for the Long Short Commodity Series Units attached to Part I of this Prospectus, or the Long/Short Commodity Series Appendix. |
Managed Futures Index Series | Trading for the Managed Futures Index Series will be directed by Conquest. Conquest will trade 100% of Managed Futures Index Series’ assets pursuant to its Conquest Managed Futures Select program. Other or additional trading programs may be used in the future. See the appendix for the Managed Futures Index Series Units attached to Part I of this Prospectus, or the Managed Futures Index Series Appendix. |
Appendices | The Balanced Series Appendix, the Graham Series Appendix, the Winton Series Appendix, the Campbell/Graham Series Appendix, the Currency Series Appendix, the Long Only Commodity Series Appendix, the Long/Short Commodity Series Appendix and the Managed Futures Index Series Appendix are individually referred to in the abstract as an Appendix and collectively referred to as the Appendices. |
Investment Risks | UNITS IN EACH SERIES ARE SPECULATIVE SECURITIES AND AN INVESTMENT IN ANY SERIES OF THE TRUST INVOLVES A HIGH DEGREE OF RISK. YOU SHOULD BE AWARE THAT: |
| • | The Trust has a limited operating history; |
| • | With respect to all Series, the Trading Advisors may use additional trading programs that are not identified in this Prospectus and, with respect to the Balanced Series, the Campbell/Graham Series, the Currency Series and the Long/Short Commodity Series, the Managing Owner may appoint additional or replacement Trading Advisors that are not identified in this Prospectus, in each case without the approval of the holders of Units in such Series; |
| • | Purchasers of Class 1 Units or Class 1a Units in any Series will have to pay a redemption fee of up to 3% of the Net Asset Value of any such Units redeemed during the first twelve (12) months after purchase; |
| • | The incentive nature of the compensation to be paid to the Trading Advisors may encourage the Trading Advisors to take riskier or more speculative positions; |
| • | Futures, forward and options trading is speculative, volatile and highly leveraged. Due to the volatile nature of the commodities markets and the high degree of leverage to the employed by the Trust, a relatively small change in the price of a contract can cause significant losses for the Trust. |
| • | The Trading Advisors’ programs may not perform for each Series as they have performed in the past; |
| • | Each of the Trust’s Series relies on its Trading Advisor(s) for success; |
| • | There is no guarantee that the Trust, with respect to any Series, will meet its intended objective; accordingly, you could lose a substantial portion, or even all, of your investment; |
6
Table of Contents
| • | Your annual tax liability may exceed cash distributions to you; |
| • | Substantial expenses will be incurred by the investors in each Series, regardless of the performance of that Series. We estimate that the Trust, with respect to each Series, will have to achieve net trading profits (after taking interest income into account) of between from -1.15% to 4.64% each year for investors to break-even on their investments; |
| • | Transfers are restricted. No trading market exists or is expected to exist for the Units of any Series; |
| • | Actual and potential conflicts of interest exist among the Managing Owner and the Trading Advisors. The full attention and efforts of the Managing Owner and the Trading Advisors will not be devoted to the activities of the Trust. The Managing Owner and some of the Trading Advisors may have business arrangements between them that do not directly relate to the Trust’s business. The Managing Owner and the Trading Advisors may trade in commodities for their own accounts. The Managing Owner does not intend to effect any distributions by the Trust, thus increasing the management fees payable to it and the Trading Advisors; |
| • | You will have limited voting rights and no control over the Trust’s business; and |
| • | Unless the Series in which you invest is successful—and we cannot assure you that it will be—it cannot serve as a beneficial diversification for your portfolio. |
The Trustee | Wilmington Trust Company, or the Trustee, a Delaware banking corporation, is the Trust’s sole trustee. The Trustee delegated to the Managing Owner all of the power and authority to manage the business and affairs of the Trust and has only nominal duties and liabilities to the Trust. |
The Managing Owner | Equinox Fund Management, LLC is a limited liability company formed in the state of Delaware in June 2003. The Managing Owner is the Trust’s and each Series’ commodity pool operator, and will administer the business and affairs of each Series (excluding commodity trading decisions, except in certain limited, and essentially emergency, situations). See “Actual and Potential Conflicts of Interest.” The Managing Owner will make a contribution to Series of the Trust necessary to maintain at least a 1% interest in the aggregate profits and losses of all Series at all times. See “Managing Owner’s Commitments— Minimum Purchase Commitment” and “Managing Owner’s Commitments—Net Worth Commitment.” Under the Trust Agreement, the Managing Owner has agreed to accept liability for the obligations of each Series that exceed that Series’ net assets. See “Trust Agreement.” |
The Clearing Brokers | UBS Securities LLC, or UBS Securities, Banc of America Securities LLC, or Banc of America Securities and Man Financial Inc., or Man Financial, act as certain of the Trading Company’s futures clearing |
7
Table of Contents
brokers, or the Futures Clearing Brokers. Deutsche Bank AG London, or Deutsche Bank, serves certain Trading Companies which trade over-the-counter foreign currencies as the foreign exchange counterparty, or the FX Counterparty. Jefferies Financial Products LLC, or Jefferies, acts as the swap counterparty for the Trading Company utilized by the Long Only Commodity Series, or the Swap Counterparty. The Futures Clearing Brokers and the FX Counterparty are collectively referred to as the Clearing Brokers. The Clearing Brokers will execute and clear the Trading Company’s futures, options and over-the-counter foreign currency transactions, as applicable, and will perform certain administrative services for each Trading Company. |
The Selling Agents | Bornhoft Group Securities Corporation, an affiliate of the Managing Owner, acts as a selling agent of the Trust. The Managing Owner intends to appoint certain other broker-dealers registered under the Securities Exchange Act of 1934, as amended, and members of the National Association of Securities Dealers, Inc., or the NASD, as the Trust’s selling agents (collectively with Bornhoft Group Securities Corporation, the Selling Agents). The Selling Agents will use their “best efforts” to sell Units. This means that the Selling Agents are not required to sell any specific number or dollar amount of Units but will use their best efforts to sell the Units offered. |
Liabilities You Assume | Although the Managing Owner has unlimited liability for any obligations of a Series that exceed that Series’ net assets, your investment in a Series is part of the assets of that Series, and it will therefore be subject to the risks of that Series’ trading. You cannot lose more than your investment in any Series in which you invest, and you will not be subject to the losses or liabilities of any Series in which you have not invested. We have received an opinion of counsel that each Series shall be entitled to the benefits of the limitation on interseries liability set forth in Section 3804(a) of the Trust Act. See “Trust Agreement—Liabilities” for a more complete explanation. |
Limitation of Liabilities | The debts, liabilities, obligations, claims and expenses of a particular Series shall be enforceable against the assets of that Series only, and not against the assets of the Trust generally or the assets of any other Series, and, unless otherwise provided in the Trust Agreement, none of the debts, liabilities, obligations and expenses incurred, contracted for or otherwise existing with respect to the Trust generally or any other Series thereof shall be enforceable against the assets of such Series. |
Who May Subscribe | An investment in the Trust is speculative and involves a high degree of risk. The Trust is not suitable for all investors. The Managing Owner offers the Trust as a diversification opportunity for an investor’s entire investment portfolio, and therefore an investment in the Trust should only represent a limited portion of your overall portfolio. To subscribe in the Units of any Series: |
| • | You must have at a minimum (1) a net worth (exclusive of your home, home furnishings and automobiles) of at least $150,000 or (2) a net worth, similarly calculated, of at least $45,000 and an annual gross income of at least $45,000. A significant number of |
8
Table of Contents
states impose on their residents substantially higher suitability standards than the minimums described above. Before investing, you should review the minimum suitability requirements for your state of residence which are described in “State Suitability Requirements” in “SUBSCRIPTION INFORMATION” attached as Exhibit B to the Statement of Additional Information. These suitability requirements are, in each case, regulatory minimums only, and just because you meet such requirements does not mean that an investment in the Units is suitable for you; |
| • | You may not invest more than 10% of your net worth, exclusive of your home, furnishings and automobiles, in any Series or combination of Series; |
| • | IRAs, Keogh plans covering no common law employees and employee benefit plans not subject to the Employee Retirement Income Security Act of 1974, as amended, or ERISA, may not invest more than 10% of the subscriber’s and their participants’ net worth (exclusive of home, home furnishings and automobiles) in any Series or combination of Series. |
| • | Employee benefit plans subject to ERISA are subject to special suitability requirements and should not invest more than 10% of their assets in any Series or combination of Series. |
See “Who May Subscribe” beginning on page 62 of this Prospectus. |
What You Must Understand Before You Subscribe | You should not subscribe for Units unless you understand: |
| • | the fundamental risks and possible financial hazards of the investment; |
| • | the trading strategies to be followed in the Series in which you will invest; |
| • | the tax consequences of this investment; |
| • | that if you decide to sell securities to subscribe for Units, you may have income tax consequences from that sale; |
| • | the fees and expenses to which you will be subject; |
| • | your rights and obligations as a Limited Owner. |
See “Risk Factors,” “Fees and Expenses,” “Federal Income Tax Consequences” and the appendix attached to this Prospectus for the Series of Units in which you wish to invest. |
Your Minimum Subscription and Unit Pricing | Minimum required subscriptions and Unit prices are as follows: |
Your minimum initial subscription is $1,000 and your minimum initial purchase in any one Series is $1,000, or, if you are a Plan (including an IRA), an employee or family member of an employee of the Managing Owner or its affiliates or a charitable organization, you have no minimum initial subscription requirements; |
9
Table of Contents
During the Continuous Offering Period, each Series’ Units will be offered and sold at their daily Net Asset Value, and existing Limited Owners will be able to purchase additional Units in increments of $100, or, if you are a Plan (including an IRA), an employee or family member of an employee of the Managing Owner or its affiliates or a charitable organization, you have no minimum additional subscription requirements; |
If you are a resident of Texas, your minimum initial subscription requirement is $5,000, or, if you are a Plan, an employee or family member of an employee of the Managing Owner or its affiliates or a charitable organization, your minimum initial subscription requirement is $1,000; |
No front-end sales charges or selling commissions will be charged to any Series of Units; and |
No Series’ Net Asset Value will be diluted by the Trust’s organization and offering expenses. |
How to Subscribe | To subscribe for any Series’ Units: |
You will be required to complete and submit to the Trust a Subscription Agreement. |
Any subscription may be rejected in whole or in part by the Managing Owner for any reason. |
Initial Offering Period | The Units of each Series were offered for an initial offering period of limited duration, or the Initial Offering Period. The Initial Offering Period for the Winton Series and Currency Series as well as the Class 1 and Class 2 of the Balanced Series ended in September 2004, the Initial Offering Period for the Graham Series ended in November 2004, the Initial Offering Period for the Campbell/Graham Series ended in February 2005, the Initial Offering Period for the Long Only Commodity Series and the Long/Short Commodity Series ended in March 2006, the Initial Offering Period for the Managed Futures Index Series ended in April 2006 and the Initial Offering Period for the Class 1a and Class 2a of the Balanced Series ended in May 2006. Following the close of the Initial Offering Period for any Series, Units in such Series will be continuously offered. |
Series Subscription Minimums | Because the Initial Offering Period for the Winton Series and Currency Series as well as the Class 1 and Class 2 of the Balanced Series ended in September 2004, the Initial Offering Period for the Graham Series ended in November 2004, the Initial Offering Period for the Campbell/Graham Series ended in February 2005, the Initial Offering Period for the Long Only Commodity Series and the Long/Short Commodity Series ended in March 2006, the Initial Offering Period for the Managed Futures Index Series ended in April 2006 and the Initial Offering Period for the Class 1a and Class 2a of the Balanced Series ended in May 2006 and each such Series has begun trading, none of such Series has a Subscription Minimum. |
Continuous Offering Period | As trading has commenced for the Balanced Series, Graham Series, Winton Series, Campbell/Graham Series, Currency Series, Long Only |
10
Table of Contents
Commodity Series, Long/Short Commodity Series and Managed Futures Index Series, we will offer Units of such Series as of each day of each week and will continue to offer Units in each Series until the maximum amount of each Series’ Units which are registered are sold, such period being referred to as the Continuous Offering Period. The Managing Owner may terminate the Continuous Offering Period at any time. |
Subscription Effective Dates During Continuous Offering Period | The effective date of all accepted subscriptions during the Continuous Offering Period, whether you are a new subscriber to a Series, or an existing Limited Owner in a Series who is purchasing additional Units in that Series or exchanging Units in one Series for Units in a different Series, is the day of the week two (2) Business Days after the day in which your Subscription Agreement or Exchange Request is received by the Managing Owner on a timely basis by 4:00 PM New York City Time, or NYT. The Managing Owner in its sole and absolute discretion may change such notice requirement upon written notice to you. |
Segregated Accounts/Interest Income | Except for that portion of each Trading Company’s assets used as margin to maintain that Trading Company’s forward currency contract or swap positions and that portion of each Series’ assets maintained at the Trust level for cash management, the proceeds of the offering for each Series will be deposited in cash in segregated accounts in the name of each Trading Company maintained for each Trading Company at the Clearing Brokers in accordance with CFTC segregation requirements. The Clearing Brokers credit each Trading Company with 80%-100% of the interest earned on its average net assets (other than those assets held in the form of U.S. Government securities) on deposit with the Clearing Brokers each week. With respect to the Balanced Series, Graham Series, Winton Series, Campbell/Graham Series, Currency Series, Long Only Commodity Series, Long/Short Commodity Series and Managed Futures Index Series, interest income is currently estimated at 4.90%. In an attempt to increase interest income earned, the Managing Owner also may invest non-margin assets in U.S. government securities which include any security issued or guaranteed as to principal or interest by the United States, or by a person controlled by or supervised by and acting as an instrumentality of the government of the United States pursuant to authority granted by Congress of the United States or any certificate of deposit for any of the foregoing, including U.S. treasury bonds, U.S. treasury bills and issues of agencies of the United States government, and certain cash items such as money market funds, certificates of deposit (under nine months) and time deposits. The Managing Owner has selected Merrill Lynch and STW Fixed Income Management Ltd. to serve as the cash managers for the Trust, and the Managing Owner, in its sole and absolute discretion, may appoint additional or substitute cash managers for the Trust. With respect to the Graham Series, Winton Series, Campbell/Graham Series, Currency Series and the Class 1 and Class 2 of the Balanced Series, interest income up to 2.0% will be paid to the Managing Owner. With respect to the Long Only Commodity Series, |
11
Table of Contents
Long/Short Commodity Series, Managed Futures Index Series and the Class 1a and Class 2a of the Balanced Series, twenty percent (20%) of interest income earned per annum by the Trust will be paid to the Managing Owner, and the remaining eighty percent (80%) of interest income earned per annum by the Trust will be retained by the Trust for the benefit of such Series. |
Organization and Offering Expenses | The Managing Owner is responsible for the payment of all of the ordinary expenses associated with the organization of the Trust and the offering of each Series of Units, except for the initial service fee, if any, and no Series will be required to reimburse these expenses. As a result, 100% of each Series’ offering proceeds will be initially available for that Series’ trading activities. See “The Structure of the Trust—Overview of the Series” and “Fees and Expenses.” |
12
Table of Contents
Summary Table of Fees and Expenses
| Amount of Expense† | ||||||||||||||||||||
| Balanced Series-1 | Balanced Series-2‡ | Balanced Series-1a | Balanced Series-2a‡ | |||||||||||||||||
| $ | % | $ | % | $ | % | $ | % | |||||||||||||
Syndication and Selling Expense | 0.00 | 0.00 | 0.00 | 0.00 | 0.00 | 0.00 | 0.00 | 0.00 | ||||||||||||
Trust Operating Expenses | 0.00 | 0.00 | 0.00 | 0.00 | 0.00 | 0.00 | 0.00 | 0.00 | ||||||||||||
Management Fee | 5.00 | 0.50 | 5.00 | 0.50 | 10.00 | 1.00 | 10.00 | 1.00 | ||||||||||||
Service Fee | 30.00 | 3.00 | 0.00 | 0.00 | 30.00 | 3.00 | 0.00 | 0.00 | ||||||||||||
Incentive Fee (expressed as a percentage of New High Net Trading Profits) | N/A | * | 25.00 | N/A | * | 25.00 | N/A | * | 25.00 | N/A | * | 25.00 | ||||||||
Interest income** | 49.00 | 4.90 | 49.00 | 4.90 | 49.00 | 4.90 | 49.00 | 4.90 | ||||||||||||
Brokerage Commissions and Trading Fees*** | 16.40 | 1.64 | 16.40 | 1.64 | 25.80 | 2.58 | 25.80 | 2.58 | ||||||||||||
| Amount of Expense† | ||||||||||||||||||||
| Graham Series-1 | Graham Series-2‡ | Winton Series-1 | Winton Series-2‡ | |||||||||||||||||
| $ | % | $ | % | $ | % | $ | % | |||||||||||||
Syndication and Selling Expense | 0.00 | 0.00 | 0.00 | 0.00 | 0.00 | 0.00 | 0.00 | 0.00 | ||||||||||||
Trust Operating Expenses | 0.00 | 0.00 | 0.00 | 0.00 | 0.00 | 0.00 | 0.00 | 0.00 | ||||||||||||
Management Fee | 25.00 | 2.50 | 25.00 | 2.50 | 20.00 | 2.00 | 20.00 | 2.00 | ||||||||||||
Service Fee | 30.00 | 3.00 | 0.00 | 0.00 | 30.00 | 3.00 | 0.00 | 0.00 | ||||||||||||
Incentive Fee (expressed as a percentage of New High Net Trading Profits) | N/A | * | 20.00 | N/A | * | 20.00 | N/A | * | 20.00 | N/A | * | 20.00 | ||||||||
Interest income** | 49.00 | 4.90 | 49.00 | 4.90 | 49.00 | 4.90 | 49.00 | 4.90 | ||||||||||||
Brokerage Commissions and Trading Fees*** | 14.90 | 1.49 | 14.90 | 1.49 | 20.80 | 2.08 | 20.80 | 2.08 | ||||||||||||
| Amount of Expense† | ||||||||||||||||||||
| Campbell/Graham Series-1 | Campbell/Graham Series-2‡ | Currency Series-1 | Currency Series-2‡ | |||||||||||||||||
| $ | % | $ | % | $ | % | $ | % | |||||||||||||
Syndication and Selling Expense | 0.00 | 0.00 | 0.00 | 0.00 | 0.00 | 0.00 | 0.00 | 0.00 | ||||||||||||
Trust Operating Expenses | 0.00 | 0.00 | 0.00 | 0.00 | 0.00 | 0.00 | 0.00 | 0.00 | ||||||||||||
Management Fee | 25.00 | 2.50 | 25.00 | 2.50 | 20.00 | 2.00 | 20.00 | 2.00 | ||||||||||||
Service Fee | 30.00 | 3.00 | 0.00 | 0.00 | 30.00 | 3.00 | 0.00 | 0.00 | ||||||||||||
Incentive Fee (expressed as a percentage of New High Net Trading Profits) | N/A | * | 20.00 | N/A | * | 20.00 | N/A | * | 20.00 | N/A | * | 20.00 | ||||||||
Interest income** | 49.00 | 4.90 | 49.00 | 4.90 | 49.00 | 4.90 | 49.00 | 4.90 | ||||||||||||
Brokerage Commissions and Trading Fees*** | 13.70 | 1.37 | 13.70 | 1.37 | 7.50 | 0.75 | 7.50 | 0.75 | ||||||||||||
| Amount of Expense† | ||||||||||||||||||||
| Long Only Commodity Series-1 | Long Only Commodity Series-2‡ | Long/Short Commodity Series-1 | Long/Short Commodity Series-2‡ | |||||||||||||||||
| $ | % | $ | % | $ | % | $ | % | |||||||||||||
Syndication and Selling Expense | 0.00 | 0.00 | 0.00 | 0.00 | 0.00 | 0.00 | 0.00 | 0.00 | ||||||||||||
Trust Operating Expenses | 0.00 | 0.00 | 0.00 | 0.00 | 0.00 | 0.00 | 0.00 | 0.00 | ||||||||||||
Management Fee | 20.00 | 2.00 | 20.00 | 2.00 | 35.00 | 3.50 | 35.00 | 3.50 | ||||||||||||
Service Fee | 20.00 | 2.00 | 0.00 | 0.00 | 30.00 | 3.00 | 0.00 | 0.00 | ||||||||||||
Incentive Fee (expressed as a percentage of New High Net Trading Profits) | N/A | * | 0.00 | N/A | * | 0.00 | N/A | * | 20.00 | N/A | * | 20.00 | ||||||||
Interest income** | 49.00 | 4.90 | 49.00 | 4.90 | 49.00 | 4.90 | 49.00 | 4.90 | ||||||||||||
Brokerage Commissions and Trading Fees*** | 7.50 | 0.75 | 7.50 | 0.75 | 20.60 | 2.06 | 20.60 | 2.06 | ||||||||||||
13
Table of Contents
| Amount of Expense† | ||||||||||
| Managed Futures Index Series-1 | Managed Futures Index Series-2‡ | |||||||||
| $ | % | $ | % | |||||||
Syndication and Selling Expense | 0.00 | 0.00 | 0.00 | 0.00 | ||||||
Trust Operating Expenses | 0.00 | 0.00 | 0.00 | 0.00 | ||||||
Management Fee | 20.00 | 2.00 | 20.00 | 2.00 | ||||||
Service Fee | 20.00 | 2.00 | 0.00 | 0.00 | ||||||
Incentive Fee (expressed as a percentage of New High Net Trading Profits) | N/A | * | 0.00 | N/A | * | 0.00 | ||||
Interest income** | 49.00 | 4.90 | 49.00 | 4.90 | ||||||
Brokerage Commissions and Trading Fees*** | 12.00 | 1.20 | 12.00 | 1.20 | ||||||
| † | The dollar value for each fee and expense presented is calculated on the basis of a $1,000 investment in the Trust. |
| ‡ | Class 2 Units may only be offered to investors who are represented by approved Selling Agents who are directly compensated by the investor for services rendered in connection with an investment in the Trust (such arrangements commonly referred to as “wrap-accounts”). |
| * | Because the incentive fee is based upon New High Net Trading Profits, it is impossible to estimate a dollar value for such fee. |
| ** | With respect to the Balanced Series, Graham Series, Winton Series, Campbell/Graham Series, Currency Series, Long Only Commodity Series, Long/Short Commodity Series and Managed Futures Index Series, interest income is currently estimated at 4.90%. With respect to the Graham Series, Winton Series, Campbell/Graham Series, Currency Series and the Class 1 and Class 2 of the Balanced Series, the first two percent (2.0%) of interest income earned per annum by the Trust on each Series will be paid to the Managing Owner. In addition, if interest rates fall below 0.75% (calculated daily based on each Series’ Net Asset Value), the Managing Owner will be paid the difference between the Trust’s annualized income interest and 0.75%. Interest income above two percent (2.0%) per Series (calculated daily based on each Series’ Net Asset Value) is retained by the Trust. With respect to the Long Only Commodity Series, Long/Short Commodity Series, Managed Futures Index Series and the Class 1a and Class 2a of the Balanced Series, twenty percent (20%) of interest income earned per annum by the Trust will be paid to the Managing Owner, and the remaining eighty percent (80%) of interest income earned per annum by the Trust will be retained by the Trust. |
| *** | The amount of brokerage commissions and trading fees to be incurred will vary on a Series by Series basis. Although the actual rates of brokerage commissions and transaction related fees and expenses are the same for all Trading Advisors, the total amount of brokerage commissions and trading fees varies from Series to Series based upon the trading frequency of such Series’ Trading Advisor (or Trading Advisors, in the case of the Balanced Series, Campbell/Graham Series, Currency Series and Long/Short Commodity Series) and the types of instruments traded. The estimates presented in the table above are prepared using historical data about the Trading Advisors’ trading activities. |
14
Table of Contents
Fees and Expenses | Charges to be paid by the Trust include: |
| • | Each Series will pay to the Managing Owner a monthly management fee equal to a certain percentage of each Series’ Net Asset Value. For the actual percentage of the Net Asset Value of a Series payable to the Managing Owner as a management fee, please see the Appendix for such Series. The Managing Owner may pay all or a portion of such management fees to the Trading Advisor(s) for such Series; |
| • | Each Series will pay to the Managing Owner an incentive fee of a certain percentage (between 0% and 25%) of profits net of fees and expenses generated by such Series, including realized and unrealized gains and losses thereon, as of the close of business on the last day of each calendar month or quarter. The Managing Owner will pay all or a portion of such incentive fees to the Trading Advisor(s) for such Series; |
| • | The Trust, with respect to each Series, will pay the Clearing Brokers and the Managing Owner a fee of approximately 0.75% to 2.58% of each Series’ Net Asset Value annually which will be used to pay all brokerage commissions, including applicable exchange fees, NFA fees, give up fees, pit brokerage fees and other transaction related fees and expenses charged in connection with each Series’ trading activities and on-going service fees of up to 0.75% annually of the Net Asset Value of the Class 2 Units and Class 2a Units for certain administrative services payable to certain Selling Agents selling Class 2 Units and Class 2a Units of any Series; |
| • | With respect to the Graham Series, Winton Series, Campbell/Graham Series, Currency Series and the Class 1 and Class 2 of the Balanced Series, the first two percent (2.0%) of interest income earned per annum by the Trust on each Series will be paid to the Managing Owner. In addition, if interest rates fall below 0.75% (calculated daily based on each Series’ Net Asset Value), the Managing Owner will be paid the difference between the Trust’s annualized income interest and 0.75%. Interest income above two percent (2.0%) per Series (calculated daily based on each Series’ Net Asset Value) is retained by the Trust; |
| • | With respect to the Long Only Commodity Series, Long/Short Commodity Series, Managed Futures Index Series and the Class 1a and Class 2a of the Balanced Series, twenty percent (20%) of interest income earned per annum by the Trust will be paid to the Managing Owner, and the remaining eighty percent (80%) of interest income earned per annum by the Trust will be retained by the Trust; |
| • | The Trust will pay all extraordinary fees and expenses. |
Charges to be paid by the Managing Owner include:
| • | Routine operational, administrative and other expenses; and |
| • | Expenses incurred in connection with the organization of the Trust. |
15
Table of Contents
Charges to be paid by the Limited Owners include:
| • | With respect to the Class 1 Units of the Balanced Series, Winton Series, Campbell/Graham Series, Currency Series, Graham Series and Long/Short Commodity Series, as well as the Class 1a Units of the Balanced Series, as compensation, the Selling Agents will receive an initial service fee of up to three percent (3.0%) of the subscription amount. |
| • | After the expiration of twelve (12) months following the purchase of Class 1 Units of the Balanced Series, Winton Series, Campbell/Graham Series, Currency Series or Graham Series, investors who purchased Class 1 Units of such Series will be charged an annual on-going service fee of up to three percent (3.0%) of the Net Asset Value of each Unit purchased, for the benefit of Selling Agents selling Class 1 Units for on-going services provided to the Trust and the Limited Owners by the Selling Agents. |
| • | After the expiration of twelve (12) months following the purchase of Class 1 Units of the Long/Short Commodity Series or Class 1a Units of the Balanced Series, investors who purchased Class 1 Units or Class 1a Units, as applicable, of such Series will be charged an annual on-going service fee of up to three percent (3.0%) of the Net Asset Value of each Unit purchased, for the benefit of Selling Agents selling Class 1 Units or Class 1a Units, as applicable, for on-going services provided to the Trust and the Limited Owners by the Selling Agents. The on-going service fee with respect to the Class 1 Units of the Long/Short Commodity Series or Class 1a Units of the Balanced Series will continue only until the aggregate initial service fees and on-going service fees received by the Selling Agent with respect to such Units totals ten percent (10%) of the purchase price of such Class 1 Units of such Series; |
| • | With respect to the Class 1 Units of the Long Only Commodity Series and the Managed Futures Index Series, as compensation, the Selling Agents will receive an initial service fee of up to two percent (2.0%) of the subscription amount. In addition, after the expiration of twelve (12) months following the purchase of Class 1 Units of the Long Only Commodity Series or the Managed Futures Index Series, investors who purchased Class 1 Units of such Series will be charged an annual on-going service fee of up to two percent (2.0%) of the Net Asset Value of each Unit purchased, for the benefit of Selling Agents selling Class 1 Units for on-going services provided to the Trust and the Limited Owners by the Selling Agents. The on-going service fee with respect to the Class 1 Units of the Long Only Commodity Series or the Managed Futures Index Series will continue only until the aggregate initial service fees and on-going service fees received by the Selling Agent with respect to such Units totals ten percent (10%) of the purchase price of such Class 1 Units of such Series; |
| • | Investors who purchase Class 2 Units of any Series or Class 2a Units of the Balanced Series will be charged no initial service fee, but Selling Agents selling Class 2 Units or Class 2a Units may receive an |
16
Table of Contents
on-going service fee of up to 0.5% annually of the Net Asset Value of the Class 2 Units or Class 2a Units sold by them. The on-going service fee payable to the Selling Agents with respect to the Class 2 Units of the Long Only Commodity Series, the Long/Short Commodity Series and the Managed Futures Index Series and the Class 2a Units of the Balanced Series will continue until the aggregate initial service fees and on-going service fees received by the Selling Agent with respect to such Units totals ten percent (10%) of the purchase price of such Class 2 Units or Class 2a Units of such Series. The on-going service fee payable to the Selling Agents with respect to the Class 2 Units of the Balanced Series registered with the SEC on or after January 26, 2007, will continue until the aggregate initial service fees and on-going service fees received by the Selling Agent with respect to such Units totals ten percent (10%) of the purchase price of such Class 2 Units of such Series. The Trust intends to sell the newly-registered Class 2 Units of the Balanced Series only once all previously-registered Class 2 Units of the Balanced Series have been sold. |
| • | Investors who redeem all or a portion of their Class 1 Units of the Balanced Series, Winton Series, Campbell/Graham Series, Currency Series, Graham Series and Long/Short Commodity Series, as well as the Class 1a Units of the Balanced Series, during the first twelve (12) months following the effective date of their purchase will be subject to a redemption fee of up to three percent (3.0%) of the Net Asset Value at which such investor redeemed to reimburse the Managing Owner for the then-unamortized balance of the prepaid initial service fee; |
| • | Investors who redeem all or a portion of their Class 1 Units of the Long Only Commodity Series and the Managed Futures Index Series during the first twelve (12) months following the effective date of their purchase will be subject to a redemption fee of up to two percent (2.0%) of the Net Asset Value at which such investor redeemed to reimburse the Managing Owner for the then-unamortized balance of the prepaid initial service fee; and |
| • | There is no redemption fee associated with the Class 2 Units. |
Respective Break-Even Amounts for Each Series | The following summary displays the estimated amount of all fees and expenses which are anticipated to be incurred by a new investor in each Sub-Class of each Series during the first twelve months. In each case, the total estimated cost and expense load is expressed as a percentage of $1,000, the amount of minimum investment in the Trust (other than IRAs, Plans, employees or family members of an employee of the Managing Owner or its affiliates or charitable organizations). |
| • | Balanced Series-1: 2.27% (or $22.70 for each $1,000 invested); |
| • | Balanced Series-2: -0.76% (or -$7.60 for each $1,000 invested); |
| • | Balanced Series-1a: 2.69% (or $26.90 for each $1,000 invested); |
| • | Balanced Series-2a: -0.34% (or -$3.40 for each $1,000 invested); |
17
Table of Contents
| • | Graham Series-1: 4.11% (or $41.10 for each $1,000 invested); |
| • | Graham Series-2: 1.09% (or $10.90 for each $1,000 invested); |
| • | Winton Series-1: 4.18% (or $41.80 for each $1,000 invested); |
| • | Winton Series-2: 1.18% (or $11.80 for each $1,000 invested); |
| • | Campbell/Graham Series -1: 3.99% (or $39.90 for each $1,000 invested); |
| • | Campbell/Graham Series -2: 0.97% (or $9.70 for each $1,000 invested); |
| • | Currency Series-1: 2.85% (or $28.50 for each $1,000 invested); |
| • | Currency Series-2: -0.15% (or -$1.50 for each $1,000 invested); |
| • | Long Only Commodity Series-1: 0.85% (or $8.50 for each $1,000 invested); |
| • | Long Only Commodity Series-2: -1.15% (or -$11.50 for each $1,000 invested); |
| • | Long/Short Commodity Series-1: 4.64% (or $46.40 for each $1,000 invested); |
| • | Long/Short Commodity Series-2: 1.64% (or $16.40 for each $1,000 invested); |
| • | Managed Futures Index Series-1: 1.28% (or $12.80 for each $1,000 invested); |
| • | Managed Futures Index Series-2: -0.72% (or -$7.20 for each $1,000 invested); |
Transfer of Units | The Trust Agreement restricts the transferability and assignability of the Units of each Series. There is not now, nor is there expected to be, a primary or secondary trading market for the Units of any Series. |
Exchange Privilege | Once trading commences for the Series in which you have invested, you may exchange your Units in such Series for Units in another Series which has also commenced trading. Exchanges will be available between the various Classes 1 of the Series and Exchanges will be available between the various Classes 2 of the Series. However, Exchanges will not be allowed from Class 1 to Class 2 or vice versa. In addition, you will only be allowed to Exchange your Units in one Series for Units in another Series which is registered for sale in your State. Furthermore, Exchanges will be allowed out of the Graham Series, but Exchanges into the Graham Series will be restricted to those investors that have purchased their Units through a Selling Agent that acts as a selling agent for the Graham Series. The Exchange of Units will be treated as a redemption of Units in one Series (with the related tax consequences) and the immediate purchase of Units in the Series you exchange into. See “Federal Income Tax Consequences.” Exchanges are made at the applicable Series’ then-current Net Asset Value per Unit (which includes, among other things, accrued but unpaid incentive fees due to that Series’ Trading Advisor) at the close of business on each day, or the Valuation Point, immediately |
18
Table of Contents
preceding the day on which your Exchange will become effective. The effective date of an Exchange will be the day of the week two (2) Business Days following your submission of an Exchange Request to the Managing Owner on a timely basis by 4:00 PM NYT. The Managing Owner, in its sole and absolute discretion, may change the notice requirement upon written notice to you. The Managing Owner, in its sole and absolute discretion, may reject any Exchange request. If you Exchange all or a portion of your Class 1 Units of the Balanced Series, Winton Series, Campbell/Graham Series, Currency Series, Graham Series or Long/Short Commodity Series or your Class 1a Units of the Balanced Series for Class 1 Units of the Long Only Commodity Series or the Managed Futures Index Series on or before the end of twelve (12) full months following the effective date of the purchase of the Units being Exchanged, the Long Only Commodity Series or the Managed Futures Index Series, as applicable, will charge you an exchange equalization fee for switching into the Long Only Commodity Series or the Managed Futures Index Series of 1.0% of the Net Asset Value at which your Units are Exchanged to reimburse the Managing Owner for the prepaid initial service fee of the Series you are Exchanging out of, which is charged at a higher rate than the initial service fee of the Long Only Commodity Series or the Managed Futures Index Series. Depending on the number of months that have elapsed since the purchase of Class 1 Units of the Balanced Series, Winton Series, Campbell/Graham Series, Currency Series, Graham Series or Long/Short Commodity Series or Class 1a Units of the Balanced Series being Exchanged, the total amount of initial service fees and exchange equalization fees which you will pay may exceed 3.0%. No exchange charges will be imposed for all other Exchanges. See “Trust Agreement—Exchange Privilege.” |
Redemption of Units | Once trading commences for the Series in which you have invested, Units you own in such Series may be redeemed, in whole or in part, on a daily basis. You may redeem Units as of any day upon at least one (1) Business Day’s prior delivery of a redemption request to be received by the Managing Owner prior to 4:00 PM NYT in order for the redemption to be effective as of the next Business Day. The Managing Owner in its sole and absolute discretion, may change the notice requirement upon written notice to you. Redemptions are made at the applicable Series’ then-current Net Asset Value per Unit (which includes, among other things, accrued but unpaid incentive fees due to that Series’ Trading Advisor) on the Valuation Point of the first Business Day following the day on which your redemption request is received. If you redeem all or a portion of your Class 1 Units of the Balanced Series, Winton Series, Campbell/Graham Series, Currency Series, Graham Series or Long/Short Commodity Series or your Class 1a Units of the Balanced Series on or before the end of twelve (12) full months following the effective date of the purchase of the Units being redeemed, you will be charged a redemption fee of up to 3.0% of the Net Asset Value at which your Units are redeemed to reimburse the Managing Owner for the then-unamortized balance of the prepaid initial service fee. If you redeem all or a portion of your Class 1 Units of the Long Only Commodity Series or the Managed |
19
Table of Contents
Futures Index Series on or before the end of twelve (12) full months following the effective date of the purchase of the Units being redeemed, you will be charged a redemption fee of up to 2.0% of the Net Asset Value at which your Units are redeemed to reimburse the Managing Owner for the then-unamortized balance of the prepaid initial service fee. Redemption fees will be paid to the Managing Owner. See “Trust Agreement—Redemption of Units.” These redemption fees will not be charged if you exchange a Class 1 Unit in one Series for a Class 1 Unit in another Series. |
Distributions | The Managing Owner will make distributions to you at its discretion. Because the Managing Owner does not presently intend to make on-going distributions, your income tax liability for the profits of Units in any Series in which you have invested will, in all likelihood, exceed any distributions you receive from that Series. See “Federal Income Tax Consequences.” |
Income Tax Consequences | We have obtained an opinion of counsel to the effect that the Trust will be treated as a partnership for U.S. federal, or Federal, income tax purposes and, assuming that at least 90% of the gross income of the Trust will constitute “qualifying income” within the meaning of Section 7704(d) of the Internal Revenue Code of 1986, as amended, or the Code, the Trust will not be a publicly traded partnership treated as a corporation. See “Federal Income Tax Consequences—The Trust’s Tax Status.” |
As long as the Trust is treated as a partnership for Federal income tax purposes, the Trust will not be subject to Federal income tax. Instead, as a Limited Owner, you generally will be taxed on an amount equal to your allocable share of the income generated by the Series in which you have purchased Units (whether or not any cash is distributed to you). Your ability to deduct losses and expenses allocated to you may be subject to significant limitations. Special tax risks apply with respect to tax-exempt Limited Owners, foreign investors and others. The tax laws applicable to the Trust and an investment in Units of each Series are subject to change and to differing interpretations. For a more complete discussion of tax risks relating to this investment, see “Risk Factors—Tax and ERISA Risks” and “Federal Income Tax Consequences.” We urge you to consult your own tax advisor regarding the Federal, state, local and foreign income tax consequences to you of the purchase, ownership, and disposition of Units in light of your individual tax circumstances, and of the effects of possible changes in the tax laws.
Reports and Accounting | As of the end of each month and as of the end of each Fiscal Year, we will furnish you with those reports required by the CFTC and the NFA including, but not limited to, an annual audited financial statement certified by independent public accountants and any other reports required by any other governmental authority, such as the SEC, that has jurisdiction over the activities of the Trust. You also will be provided with appropriate information to permit you (on a timely basis) to file your Federal and state income tax returns with respect to your Units. |
Fiscal Year | The Trust’s fiscal year ends on December 31 on each year. |
20
Table of Contents
Financial Information | The Trust has recently been organized and has limited financial history. Financial information concerning the Trust and the Managing Owner is set forth in “Index to Certain Financial Information” below. |
Glossary of Terms | See the “Glossary of Terms” in the Statement of Additional Information for the definition of certain key terms used in this Prospectus. |
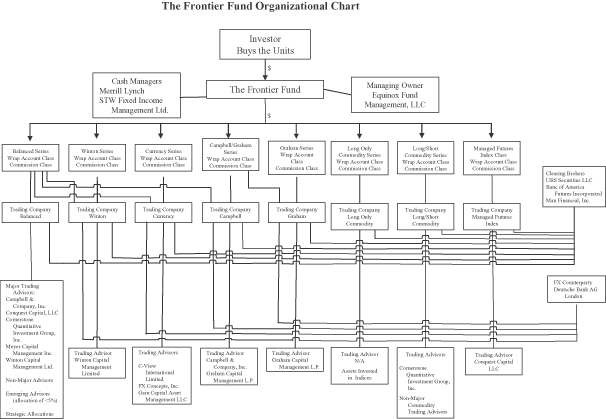
Organizational Chart | The following organizational chart illustrates the structure of the Trust and all related parties. |
21
Table of Contents
The Trust is a new venture in a high-risk business. An investment in the Units of each Series is very speculative. You should make an investment in one or more of the Series only after consulting with independent, qualified sources of investment and tax advice and only if your financial condition will permit you to bear the risk of a total loss of your investment. You should consider an investment in the Units only as a long-term investment. Moreover, to evaluate the risks of this investment properly, you must familiarize yourself with the relevant terms and concepts relating to commodities trading and the regulation of commodities trading, which are discussed in this Prospectus in the Statement of Additional Information below, in the section captioned “Futures Markets.”
You should carefully consider the risks and uncertainties described below, as well as all of the other information included in the Prospectus, before you decide whether to purchase any Units. Any of the following risks and uncertainties could materially adversely affect the Trust, its trading activities, operating results, financial condition and Net Asset Value and therefore could negatively impact the value of your investment. You should not invest in the Units unless you can afford to lose all of your investment.
Market Risks
The commodity interest markets in which the Trading Advisors trade are highly volatile, which could cause substantial losses and may cause you to lose your entire investment.
Commodity interest contracts are highly volatile and are subject to occasional rapid and substantial fluctuations. Consequently, you could lose all or substantially all of your investment in the Units of any Series should such Series’ trading positions suddenly turn unprofitable. The profitability of any Series depends primarily on the ability of its Trading Advisor(s) to predict these fluctuations accurately. Price movements for commodity interests are influenced by, among other things:
| • | changes in interest rates; |
| • | governmental, agricultural, trade, fiscal, monetary and exchange control programs and policies; |
| • | weather and climate conditions; |
| • | natural disasters, such as hurricanes; |
| • | changing supply and demand relationships; |
| • | changes in balances of payments and trade; |
| • | U.S. and international rates of inflation; |
| • | currency devaluations and revaluations; |
| • | U.S. and international political and economic events; and |
| • | changes in philosophies and emotions of market participants. |
The Trading Advisors’ technical trading methods may not take account of these factors except as they may be reflected in the technical input data analyzed by the Trading Advisors.
In addition, governments from time to time intervene, directly and by regulation, in certain markets, often with the intent to influence prices directly. The effects of governmental intervention may be particularly significant at certain times in the financial instrument and currency markets, and this intervention may cause these markets to move rapidly.
Futures, forward and options trading is volatile and may cause large losses.
A principal risk in futures, forward and options trading is volatile performance. Because the trading decisions for each of the Trust’s Graham Series, Winton Series and Managed Futures Index Series will be made
22
Table of Contents
by a single Trading Advisor, the trading for each such Series is similar to a single advisor fund in which one trading advisor makes all the trading decisions. In single advisor funds, volatility may increase as compared to a fund with several trading advisors who, collectively, can diversify risk to a greater extent (assuming those advisors are non-correlated with each other).
Options trading can be more volatile and expensive than futures trading and may cause large losses.
Certain Trading Advisors may trade options on futures. Although successful options trading requires many of the same skills as successful futures trading, the risks involved are somewhat different. For example, the assessment of near-term market volatility—which is directly reflected in the price of outstanding options—can be of much greater significance in trading options than it is in many long-term futures strategies. If market volatility is incorrectly predicted, then the use of options can be extremely expensive.
Futures, forward and options trading is highly leveraged and may cause large losses.
The low margin normally required in futures, forward and options trading provides a large amount of leverage;i.e., contracts can have a value substantially greater than their margin and may be traded for a comparatively small amount of money. If a relatively small change in the market price of an open position occurs, then this change can produce a disproportionately large profit or loss. Leverage is normally monitored through the margin-to-equity ratio employed by each Trading Advisor. Under normal circumstances, the Trading Advisors will vary between a 10% to 30% margin-to-equity ratio.
Futures, forward and options trading may be illiquid and may cause large losses.
Although each Series generally will purchase and sell actively traded contracts, orders may not be executed at or near the desired price, particularly in thinly traded markets, in markets that lack trading liquidity, or because of applicable “daily price fluctuation limits,” “speculative position limits” or market disruptions. If market illiquidity or disruptions occur, then major losses could result. Some Trading Advisors have encountered illiquid situations in the past and may encounter others in the future.
Options are volatile and inherently leveraged, and sharp movements in prices could cause the Trust to incur large losses.
Certain Trading Advisors may use options on futures contracts, forward contracts or commodities to generate premium income or speculative gains. Options involve risks similar to futures, because options are subject to sudden price movements and are highly leveraged, in that payment of a relatively small purchase price, called a premium, gives the buyer the right to acquire an underlying futures contract, forward contract or commodity that has a face value substantially greater than the premium paid. The buyer of an option risks losing the entire purchase price of the option. The writer, or seller, of an option risks losing the difference between the purchase price received for the option and the price of the futures contract, forward contract or commodity underlying the option that the writer must purchase or deliver upon exercise of the option. There is no limit on the potential loss. Specific market movements of the futures contracts, forward contracts or commodities underlying an option cannot accurately be predicted. In addition, over-the-counter options present risks in addition to those associated with exchange-traded options, as discussed immediately below.
Exchanges of futures for physicals may adversely affect performance.
Certain Trading Advisors may engage in exchanges of futures for physicals for client accounts. An exchange of futures for physicals is a transaction permitted under the rules of many futures exchanges in which two parties holding futures positions may close out their positions without making an open, competitive trade on the exchange. Generally, the holder of a short futures position buys the physical commodity, while the holder of a long futures position sells the physical commodity. The prices at which such transactions are executed are
23
Table of Contents
negotiated between the parties. If a Trading Advisor engaging in exchanges of futures for physicals were prevented from such trading as a result of regulatory changes, then the performance of client accounts of such Trading Advisor could be adversely affected.
Cash flow needs may cause positions to be closed which may cause substantial losses.
Certain Trading Advisors may trade options on futures. Futures contract gains and losses are market-to-market daily for purposes of determining margin requirements. Option positions generally are not, although short option positions will require additional margin if the market moves against the position. Due to these differences in margin treatment between futures and options, there may be periods in which positions on both sides must be closed down prematurely due to short term cash flow needs. If this occurs during an adverse move in a spread or straddle relationship, then a substantial loss could occur.
The Trading Companies may enter into swap and similar transactions which may create risks.
Swap contracts are not traded on exchanges and are not subject to the same type of government regulation as exchange markets. As a result, many of the protections afforded to participants on organized exchanges and in a regulated environment are not available in connection with these transactions.
The swap markets are “principals’ markets,” in which performance with respect to a swap contract is the responsibility only of the counterparty to the contract, and not of any exchange or clearinghouse. As a result, each Trading Company is subject to the risk of the inability or refusal to perform with respect to swap contracts on the part of the counterparties with which the portfolio managers trade. There are no limitations on daily price movements in swap transactions. Speculative position limits are not applicable to swap transactions, although the counterparties with which the portfolio managers trade may limit the size or duration of positions available to the portfolios managers as a consequence of credit considerations. Participants in the swap markets are not required to make continuous markets in the swap contracts they trade. Participants could refuse to quote prices for swap contracts or quote prices with an unusually wide spread between the price at which they are prepared to buy and the price at which they are prepared to sell.
Over-the-counter transactions are subject to little, if any, regulation and may be subject to the risk of counterparty default.
A portion of each Series’ assets may be used to trade over-the-counter commodity interest contracts, such as forward contracts, option contracts in foreign currencies and other commodities, or swap or spot contracts. Over-the-counter contracts are typically traded on a principal-to-principal basis through dealer markets that are dominated by major money center and investment banks and other institutions and are essentially unregulated by the CFTC. You therefore do not receive the protection of CFTC regulation or the statutory scheme of the Commodity Exchange Act, as amended, or the CE Act, in connection with this trading activity by any Trading Advisor. The markets for over-the-counter contracts rely upon the integrity of market participants in lieu of the additional regulation imposed by the CFTC on participants in the futures markets. The lack of regulation in these markets could expose a Series in certain circumstances to significant losses in the event of trading abuses or financial failure by participants.
Each Series also faces the risk of non-performance by the counterparties to the over-the-counter contracts. Unlike in futures contracts, the counterparty to these contracts is generally a single bank or other financial institution, rather than a clearing organization backed by a group of financial institutions. As a result, there will be greater counterparty credit risk in these transactions. The clearing member, clearing organization or other counterparty may not be able to meet its obligations, in which case the applicable Series could suffer significant losses on these contracts.
24
Table of Contents
Your investment could be illiquid.
A Trading Advisor may not always be able to liquidate its commodity interest positions at the desired price. It is difficult to execute a trade at a specific price when there is a relatively small volume of buy and sell orders in a market. A market disruption, such as a foreign government taking political actions that disrupt the market in its currency or in a major export, can also make it difficult to liquidate a position. Alternatively, limits imposed by futures exchanges or other regulatory organizations, such as speculative position limits and daily price fluctuation limits, may contribute to a lack of liquidity with respect to some commodity interests.
Unexpected market illiquidity may cause major losses to investors at any time or from time to time. The large face value of the positions that the Trading Advisors will acquire for each Series increases the risk of illiquidity by both making its positions more difficult to liquidate at favorable prices and increasing the losses incurred while trying to do so.
Also, there is not likely to be a secondary market for the Units. While the Units have redemption rights and Exchange rights, there are restrictions. For example, transfers of Units are permitted only with the prior written consent of the Managing Owner and provided that conditions specified in the Trust Agreement are satisfied.
New exchange-traded commodity interest contracts, including security futures, are characterized by a higher degree of illiquidity and volatility, which may subject investors in those contracts to increased losses.
Certain Trading Advisors may trade newly developed futures contracts, including without limitation, security futures contracts. Traditionally, only those commodity interest contracts approved by the CFTC may be traded on U.S. futures exchanges. Likewise, foreign regulatory authorities are typically required to authorize the trading of new commodity interest contracts on foreign exchanges. Periodically, the CFTC or other foreign regulatory authorities may designate additional contracts as approved contracts. If any of the Trading Advisors determine that it is appropriate to trade in a new contract, they may do so on behalf of the Series for which they trade. Because these contracts will be new, the trading strategies of the Trading Advisors may not be applicable to, or advisable for, these contracts. The markets in new contracts, moreover, have been historically both illiquid and highly volatile for some period of time after the contract begins trading. These contracts therefore present significant risk potential.
The above risks are particularly applicable to the markets for security futures contracts. Security futures contracts are a new class of financial instruments that allow, for the first time in the United States, the trading of futures contracts on individual U.S. equity securities or on narrow-based stock indices, which are indices made up of a small group of stocks that allow an investor to take a position in a concentrated area of the equities market. Security futures contracts have only been trading in the United States since November 2002, and the markets for these contracts generally have been characterized by very limited volumes when compared to futures markets generally. As a result, a Trading Advisor that trades security futures contracts could at times find it difficult to buy or sell a security futures contract at a favorable price, which could result in losses to the applicable Series.
Certain Trading Advisors may purchase and sell single stock futures contracts and other security futures products. A single stock future obligates the seller to deliver (and the purchaser to take delivery of) a specified equity security to settle the futures transaction. Other security futures products include “narrow-based” stock index futures contracts (in general, contracts based on the value of nine or fewer securities in a specific market or industry sector, such as energy, health care or banking) and futures contracts based on exchange-traded funds that are designed to track the value of broader stock market indices (such as the Dow Jones Industrial Average or the NASDAQ 100 Index). Single stock futures and other security futures products are relatively illiquid and trade on a limited number of exchanges. The margin required with respect to single stock futures (usually at least 20% of the face value of the contract) generally is higher than the margin required with respect to other types of futures contracts (in some cases as low as 2% of the face value of the contract). The resulting lower level of leverage available to the Trading Advisors with respect to security futures products may adversely affect the respective
25
Table of Contents
Trading Company’s performance. Security futures products are typically traded on electronic trading platforms and are subject to risks related to system access, varying response time, security and system or component failure. In addition, although the Clearing Brokers will be required to segregate the Trading Company’s trades, positions and funds from those of each Clearing Broker itself as required by CFTC regulations, the insurance provided to securities customers by the Securities Investor Protection Corporation, or the SIPC, will not be applicable to the Trading Company’s security futures positions because SIPC protection does not apply to futures accounts.
An investment in the Trust may not diversify an overall portfolio and portfolio risk may be increased.
Historically, managed futures have been generally non-correlated to the performance of other asset classes such as stocks and bonds. Non-correlation means that there is no statistically valid relationship between the performance of futures and other commodity interest transactions, on the one hand, and stocks or bonds, on the other hand. Non-correlation should not be confused with negative correlation, where the performance of two asset classes would be opposite of each other. Because of this non-correlation, the results of each Series cannot be expected to be automatically profitable during unfavorable periods for the stock market, or vice versa. If, however, a Series does not perform in a non-correlated manner with respect to the general financial markets or does not perform successfully, you will obtain little or no diversification benefits by investing in the Units. The Units may have no gains to offset your losses from other investments, and you may suffer losses on your investment in the Units at the same time losses on your other investments are increasing. You should therefore not consider the Units to be a hedge against losses in your core stock and bond portfolios.
Trading in international markets creates exposure to credit and regulatory risk.
A substantial portion of the Trading Advisors’ trades are expected to take place on markets or exchanges outside the United States. There is no limit to the amount of assets of any Series that may be committed to trading on foreign markets. The risk of loss in trading foreign futures and options on futures contracts can be substantial. Participation in foreign futures and options on futures contracts involves the execution and clearing of trades on, or subject to the rules of, a foreign board of trade or exchange. Some of these foreign markets, in contrast to U.S. exchanges, are so-called principals’ markets in which performance is the responsibility only of the individual counterparty with whom the trader has entered into a commodity interest transaction and not of the exchange or clearing corporation. In these kinds of markets, there is risk of bankruptcy or other failure or refusal to perform by the counterparty.
Some foreign markets present additional risk, because they are not subject to the same degree of regulation as their U.S. counterparts. None of the CFTC, NFA or any domestic exchange regulates activities of any foreign boards of trade or exchanges, including the execution, delivery and clearing of transactions, nor has the power to compel enforcement of the rules of a foreign board of trade or exchange or of any applicable foreign laws. Similarly, the rights of market participants, in the event of the insolvency or bankruptcy of a foreign market or broker are also likely to be more limited than in the case of U.S. markets or brokers. As a result, in these markets, there is less legal and regulatory protection than that available domestically.
Additionally, trading on foreign exchanges is subject to the risks presented by exchange controls, expropriation, increased tax burdens and exposure to local economic declines and political instability. An adverse development with respect to any of these variables could reduce the profit or increase the loss earned on trades in the affected international markets.
International trading activities are subject to foreign exchange risk.
The price of any foreign futures, options on futures or other commodity interest contract and, therefore, the potential profit and loss on such contract, may be affected by any variance in the foreign exchange rate between the time the order is placed and the time it is liquidated, offset or exercised. As a result, if changes in the value of the local currency relative to the U.S. dollar occur, then such changes may cause losses even if the contract traded is profitable.
26
Table of Contents
International trading may cause exposure to losses resulting from foreign exchanges that are less developed or less reliable than U.S. exchanges.
Some foreign exchanges also may be in a more developmental stage so that prior price histories may not be indicative of current price dynamics. In addition, Trading Advisors may not have the same access to certain positions on foreign trading exchanges as do local traders, and the historical market data on which the Trading Advisors base their strategies may not be as reliable or accessible as it is in the United States. As a result, Trading Advisors entering into transactions on foreign exchanges may incur losses on behalf of the applicable Series.
Each Series’ start-up period entails increased investment risks.
The Trust may encounter start-up periods for each Series following subsequent closings during the Continuous Offering Period. During such start-up periods, the Trust, with respect to each Series, may incur risks relating to the initial investment of the assets received at such times, because it may take a period of time before a Series can develop a fully diversified portfolio, thereby resulting in a greater concentration of positions in a limited number of markets which could result in increased volatility in the Series’ portfolio. A decline in the initial Net Asset Value of a Series could result from the level of diversification in that Series’ trading activities at the outset, which may be lower than in a fully committed portfolio.
Trading Risks
The trading on behalf of each Series will be highly leveraged, which means that sharp declines in price could lead to large losses.
Because the amount of margin funds necessary to be deposited with a Futures Clearing Broker to enter into a futures or forward contract position is typically about 2% to 10% of the total value of the contract, each Trading Advisor may take positions on behalf of a Series with face values equal to several times such Series’ Net Asset Value. As a result of this leveraging, even a small movement in the price of a contract can cause major losses. Any purchase or sale of a futures or forward contract may result in losses that substantially exceed the amount invested in the contract. For example, if $2,200 in margin is required to hold one U.S. Treasury bond futures contract with a face value of $100,000, a $2,200 decrease in the value of that contract could, if the contract is then closed out, result in a complete loss of the margin deposit, not even taking into account deductions of fees and/or commissions. If severe short-term price declines occur, then such declines could, therefore, force the liquidation of open positions with large losses.
There are disadvantages to making trading decisions based on technical analysis.
Most of the Trading Advisors except C-View, FX Concepts, Gain and certain Trading Advisors trading for the Long/Short Commodity Series may base their trading decisions on trading strategies that use mathematical analyses of technical factors relating to past market performance. The buy and sell signals generated by a technical, trend-following trading strategy are derived from a study of actual daily, weekly and monthly price fluctuations, volume variations and changes in open interest in the markets. The profitability of any technical, trend-following trading strategy depends upon the occurrence in the future of significant, sustained price moves in some of the markets traded. A danger for trend-following traders is whip-saw markets, that is, markets in which a potential price trend may start to develop but reverses before an actual trend is realized. A pattern of false starts may generate repeated entry and exit signals in technical systems, resulting in unprofitable transactions. In the past, there have been prolonged periods without sustained price moves. Presumably these periods will continue to occur. Periods without sustained price moves may produce substantial losses for trend-following trading strategies. Further, any factor that may lessen the prospect of these types of moves in the future, such as increased governmental control of, or participation in, the relevant markets, may reduce the prospect that any trend- following trading strategy will be profitable in the future.
27
Table of Contents
There are disadvantages to making trading decisions based on fundamental analysis.
Certain Trading Advisors, including C-View, FX Concepts, Gain and certain Trading Advisors trading for the Long/Short Commodity Series, will base their decisions on trading strategies which utilize in whole or in part fundamental analysis of underlying market forces. Fundamental analysis attempts to examine factors external to the trading market which affect the supply and demand for a particular commodity interest in order to predict future prices. Such analysis may not result in profitable trading because certain Trading Advisors may not have knowledge of all factors affecting supply and demand or may incorrectly interpret the information it does have. Furthermore, prices may often be affected by unrelated or unexpected factors and fundamental analysis may not enable the trader to determine whether its previous decisions where incorrect in sufficient time to avoid substantial losses. In addition, fundamental analysis assumes that commodity markets are inefficient—i.e., that commodity prices do not always reflect all available information—which some market analysts dispute.
The risk management approaches of one or all of the Trading Advisors may not be fully effective, and a Series may incur losses.
The mechanisms employed by each Trading Advisor to monitor and manage the risks associated with its trading activities on behalf of the Series for which it trades may not succeed in mitigating all identified risks. Even if a Trading Advisor’s risk management approaches are fully effective, it cannot anticipate all risks that it may face. If one or more of the Trading Advisors fails to identify and adequately monitor and manage all of the risks associated with its trading activities, then the Series for which they trade may suffer losses.
Increased competition from other trend-following traders could reduce the Trading Advisors’ profitability.
There has been a dramatic increase over the past 15 to 25 years in the amount of assets managed by trend-following trading systems like those that some of the Trading Advisors may employ. This means increased trading competition among a larger number of market participants for transactions at favorable prices, which could operate to the detriment of some or all Series by preventing the Trading Advisors from effecting transactions at the desired prices. It may become more difficult for the Trading Advisors to implement their trading strategies if other commodity trading advisors using technical systems are, at the same time, also attempting to initiate or liquidate commodity interest positions at the same time as the Trading Advisors.
Discretionary decision-making may result in missed opportunities or losses.
Because each of the Trading Advisors’ strategies involves some discretionary aspects in addition to their technical factors, certain Trading Advisors may occasionally use discretion in investing the assets of a Series. For example, the Trading Advisors often use discretion in selecting contracts and markets to be followed. In exercising such discretion, such Trading Advisor may take positions opposite to those recommended by the Trading Advisor’s trading system or signals. Discretionary decision making may also result in a Trading Advisor’s failing to capitalize on certain price trends or making unprofitable trades in a situation where another trader relying solely on a systematic approach might not have done so. Furthermore, such use of discretion may not enable the Trust to avoid losses, and in fact, such use of discretion may cause the Trust to forego profits which it may have otherwise earned had such discretion not been used.
Speculative position limits and daily price fluctuation limits may force the alteration of trading decisions which may cause a Series to forego profitable trades or strategies.
The CFTC and U.S. exchanges have established limits, known as speculative position limits, on the maximum net long or net short positions that any person may hold or control in certain futures and options on futures contracts. Most exchanges also impose limits, known as daily limits, on the amount of fluctuation in certain futures and options on futures contracts in a single trading day. All accounts controlled by a particular Trading Advisor and its principals are combined for speculative position limit purposes. If positions in those accounts were to approach the level of the particular speculative position limit, or if prices were to approach the
28
Table of Contents
level of the daily limit, these limits could cause a modification of the particular Trading Advisor’s trading decisions or force liquidation of certain futures or options on futures positions. If one or more of the Trading Advisors must take either of these actions, then one or more Series may be required to forego profitable trades or strategies.
Increases in assets under management of any of the Trading Advisors may affect trading decisions and may cause losses.
In general, none of the Trading Advisors intends to limit the amount of additional equity that it may manage, and each will continue to seek major new accounts. The more equity a Trading Advisor manages, the more difficult it may be for it to trade profitably because of the difficulty of trading larger positions without adversely affecting prices and performance and of managing risk associated with larger positions. Accordingly, future increases in equity under management may require a Trading Advisor to modify its trading decisions for a Series because it cannot deploy all the assets in the commodities which it desires to trade. Furthermore, if the Trading Advisors for a Series cannot manage any additional allocation from the Trust, the Managing Owner may add additional Trading Advisors for such Series who may have less experience or less favorable performance than the existing Trading Advisors.
The use of multiple Trading Advisors may result in offsetting or opposing trading positions and may also require one Trading Advisor to fund the margin requirements of another Trading Advisor.
The use of multiple Trading Advisors for the Balanced Series, the Campbell/Graham Series, the Currency Series and the Long/Short Commodity Series may result in developments or positions that adversely affect the respective Series’ Net Asset Value. For example, because the Trading Advisors trading for the Balanced Series, the Campbell/Graham Series, the Currency Series and the Long/Short Commodity Series will be acting independently, such Series could buy and sell the same futures contract, thereby incurring additional expenses but with no net change in its holdings. The Trading Advisors also may compete, from time to time, for the same trades or other transactions, increasing the cost to such Series of making trades or transactions or causing some of them to be foregone altogether. Even though each Trading Advisor’s margin requirements ordinarily will be met from that Trading Advisor’s allocated net assets, one Trading Advisor may incur losses of such magnitude that the Balanced Series, the Campbell/Graham Series, the Currency Series or the Long/Short Commodity Series is unable to meet margin calls from the allocated net assets of that Trading Advisor. If such an event were to occur, then such Series Trading Company’s Clearing Brokers may require liquidations and contributions from the allocated net assets of another Trading Advisor.
The Trading Advisors’ trading programs bear some similarities and, therefore, may lessen the benefits to the Balanced Series, the Campbell/Graham Series, the Currency Series and the Long/Short Commodity Series of having multiple Trading Advisors.
Each Trading Advisor has, over time, developed and modified the program it will use in trading. Nevertheless, the Trading Advisors’ trading programs have some similarities. These similarities may, in fact, mitigate the positive effect of having multiple Trading Advisors for the Balanced Series, the Campbell/Graham Series, the Currency Series and the Long/Short Commodity Series. For example, in periods where one Trading Advisor experiences a draw-down, it is possible that these similarities will cause the other Trading Advisors to also experience a draw-down.
Each Series other than the Long Only Commodity Series relies on its Trading Advisor(s) for success, and if a Trading Advisor’s trading is unsuccessful, the Series may incur losses.
The Trading Advisor(s) for each Series other than the Long Only Commodity Series will make the commodity trading decisions for that Series. Therefore, the success of each Series largely depends on the judgment and ability of the Trading Advisors. A Trading Advisor’s trading for any Series may not prove successful under all or any market conditions. If a Trading Advisor’s trading is unsuccessful, the applicable Series may incur losses.
29
Table of Contents
The Trading Advisors or their trading strategies may not continually serve the Series which may put such Series at a disadvantage or incur losses for such Series.
It is possible that (i) any Trading Advisor, the Managing Owner or the Trust, will exercise their rights to terminate the Advisory Agreement for any Series under certain conditions, (ii) the Advisory Agreement with any Trading Advisor, once it expires, will not be renewed on the same terms as the current Advisory Agreement for that Trading Advisor, or (iii) if any Series retains a new trading advisor, the new advisor will not be retained on terms as favorable to the Series as those negotiated with that Series’ Trading Advisor or the new advisor will not be required to recoup losses sustained previously before being entitled to receive incentive fees.
Each Trading Advisor’s past performance record is inconsistent, and the Trading Advisor’s trading for a Series could be similarly inconsistent and incur losses.
The performance records of each Trading Advisor reflect significant variations in profitability from period to period. It is possible that a Trading Advisor’s trading for the Series will similarly vary from period to period, resulting in losses to such Series.
Each Trading Advisor advises other clients and may achieve more favorable results for its other accounts.
Each of the Trading Advisors currently manages other trading accounts, and each will remain free to manage additional accounts, including its own accounts, in the future. A Trading Advisor may vary the trading strategies applicable to the Series for which it trades from those used for its other managed accounts, or its other managed accounts may impose a different cost structure than that of the Series for which it trades. Consequently, the results any Trading Advisor achieves for the Series for which it trades may not be similar to those achieved for other accounts managed by the Trading Advisor or its affiliates at the same time. Moreover, it is possible that those other accounts managed by the Trading Advisor or its affiliates may compete with the Series for which it trades for the same or similar positions in the commodity interest markets and that those other accounts may make trades at better prices than the Series for which it trades.
A Trading Advisor may also have a financial incentive to favor other accounts because the compensation received from those other accounts exceeds, or may in the future exceed, the compensation that it receives from managing the account of the Series for which it trades. Because records with respect to other accounts are not accessible to investors in the Units, investors will not be able to determine if any Trading Advisor is favoring other accounts.
The Trading Advisors’ positions may be concentrated from time to time, which may render each Series susceptible to larger losses than if the positions were more diversified.
One or more of the Trading Advisors may from time to time cause a Series to hold a few, relatively large positions in relation to its assets. Consequently, a loss in any such position could result in a proportionately greater loss to such Series than if such Series’ assets had been spread among a wider number of instruments.
Markets or positions may be correlated and may expose a Series to significant risk of loss.
Different markets traded or individual positions held by a Series of Units may be highly correlated to one another at times. Accordingly, a significant change in one such market or position may affect other such markets or positions. The Trading Advisors cannot always predict correlation. Correlation may expose such Series of Units both to significant risk of loss and significant potential for profit.
Turnover in each Series’ portfolio may be high which could result in higher brokerage commissions and transaction fees and expenses.
Each Trading Advisor will make certain trading decisions on the basis of short-term market considerations. The portfolio turnover rate may be substantial at times, either due to such decisions or to “whip-saw” market conditions and result in one or more Series incurring substantial brokerage commissions and other transaction fees and expenses.
30
Table of Contents
Operating Risks
Past performance is not necessarily indicative of future performance.
The Managing Owner has selected each Trading Advisor to manage the assets of each Series because each Trading Advisor performed well through the date of its selection. You must consider, however, the uncertain significance of past performance, and you should not rely to a substantial degree on the Trading Advisors’ or the Managing Owner’s records to date for predictive purposes. You should not assume that any Trading Advisor’s future trading decisions will create profit, avoid substantial losses or result in performance for the Series comparable to that Trading Advisor’s or to the Managing Owner’s past performance. In fact, as a significant amount of academic study has shown, futures funds more frequently than not underperform the past performance records included in their prospectuses.
Because you and other investors will acquire, exchange and redeem Units at different times, you may experience a loss on your Units even though the Series in which you have invested as a whole is profitable and even though other investors in that Series experience a profit. The past performance of any Series may not be representative of each investor’s investment experience in it.
Likewise, you and other investors will invest in different Series managed by different Trading Advisors. Each Series’ assets are
| • | segregated from the other Series’ assets; and |
| • | valued and accounted for separately from every other Series. |
Consequently, the past performance of one Series has no bearing on the past performance of another Series. You cannot, for example, consider Balanced Series’ past performance in deciding whether to invest in the Graham Series, Winton Series, Campbell/Graham Series, Currency Series, Long Only Commodity Series, Long/Short Commodity Series or Managed Futures Index Series.
There is no “principal protection” feature, and you could lose your entire investment.
The Trust is not guaranteed as to principal, so you are not assured of any minimum return. Therefore, you could lose your entire investment (including any undistributed profits), in addition to losing the use of your subscription funds for the period you maintain an investment in any Series.
Performance is not correlated to the debt or equity markets, but during certain periods a given Series may perform in a manner very similar to more traditional portfolio holdings, providing few, if any, diversification benefits.
We anticipate that over time each Series’ performance will be “non-correlated” with the general equity and debt markets—that each Series’ performance might or might not be similar to the performance of the general financial markets. Non-correlation means, for example, that the Net Asset Value of a Series may rise while stock indices rise or while stock indices fall. Non-correlation is not, however, negative correlation. Negative correlation would mean that there is an inverse relationship between a Series’ performance and the performance of the general financial markets (for example, that the Net Asset Value of a Series will rise when stock indices fall or will fall when stock indices rise). Because of non-correlation, during certain periods a given Series may perform in a manner very similar to more traditional portfolio holdings, providing few, if any, diversification benefits.
The Trust has a limited operating history, and you have limited performance information on which to evaluate an investment in a Series.
The Trust has not commenced trading for all Series and has a limited performance history upon which to evaluate your investment in any Series. Although past performance is not necessarily indicative of future results,
31
Table of Contents
if the Trust had a longer performance history, such performance history might provide you with more information on which to base your investment in the Trust. As the Trust has a limited performance history, you will have to make your decision to invest in a Series without such possibly useful information.
Each Series is charged substantial fees and expenses regardless of profitability.
Each Series is charged brokerage charges, over-the-counter dealer spreads and related transaction fees and expenses and management fees in all cases regardless of whether any Series’ activities are profitable. In addition, each Series is charged for the benefit of each Trading Advisor an incentive fee based on a percentage of trading profits earned on the Series’ net assets allocated to that Trading Advisor. Because the Balanced Series, the Campbell/Graham Series, Currency Series and the Long/Short Commodity Series each employ multiple Trading Advisors, it is possible that such Series could pay substantial incentive fees to one or more Trading Advisors in a year in which such Series has no net trading profits or in which it actually loses money. In addition, each Series must earn trading gains sufficient to compensate for these fees and expenses before it can earn any profit. See “Fees and Expenses.”
You may not be able to purchase Class 2 Units unless you have a particular relationship with a Selling Agent or if Class 2 Units are not available for purchase.
In order to purchase Class 2 Units of any Series, you must have an arrangement with a Selling Agent where you directly compensate such Selling Agent for services rendered in connection with investments, including an investment in the Trust (such arrangements commonly referred to as “wrap-accounts”). If you do not have such an arrangement with a Selling Agent, you will only be able to purchase Class 1 Units in any Series, which will result in you being charged higher service fees.
Whether you have such an arrangement with a Selling Agent will depend on your relationship with such Selling Agent. Neither the Trust nor the Managing Owner has any control over the type of arrangement you have with a Selling Agent.
In addition, the Class 2 Units represent only a small portion of the total amount of Units which are currently registered with the SEC for sale by the Trust. Therefore, even if you have such an arrangement with a Selling Agent, Class 2 Units may not be available to you for purchase.
The Trust may incur higher fees and expenses upon renewing existing or entering into new contractual relationships.
The clearing agreements between the Clearing Brokers and the Trading Companies generally are terminable by the Clearing Brokers once the Clearing Broker has given the Trading Company the required notice. Upon termination of a clearing agreement, the Managing Owner may be required to renegotiate that agreement or make other arrangements for obtaining services if the Trust intends to continue trading in commodity interest contracts at its present level of capacity. The services of the Clearing Brokers may not be available, or even if available, these services may not be available on the terms as favorable as those contained in the expired or terminated clearing agreements.
Likewise, upon termination of any of the Advisory Agreements entered into between the Trust and each Trading Advisor, the Managing Owner may be required to renegotiate the contracts or make other arrangements for obtaining commodity trading advisory services. The services of the particular Trading Advisor may not be available, or these services may not be available on terms as favorable as those contained in the expired or terminated advisory contract. There is severe competition for the services of qualified commodity trading advisors, and the Managing Owner may not be able to retain replacement or additional Trading Advisors on acceptable terms. This could result in losses to one or more Series and/or the inability of one or more Series to achieve its investment objectives. Moreover, if an advisory contract is renegotiated or additional or substitute
32
Table of Contents
Trading Advisors are retained by the Managing Owner on behalf of one or more Series, the fee structures of the new or additional arrangements may not be as favorable to the affected Series as are those currently in place. See “Fees and Expenses.”
The incentive fees could be an incentive to the Trading Advisors to make riskier investments.
Each Trading Advisor employs a speculative strategy and receives incentive fees based on the trading profits earned by it for the applicable Series. Accordingly, each of the Trading Advisors has a financial incentive to make investments that are riskier than might be made if a Series’ assets were managed by a Trading Advisor that did not receive performance-based compensation. For example, if an investment earns large amounts of trading profits, the Trading Advisor making such an investment will receive a larger incentive fee. Therefore, a Trading Advisor may decide to make an investment with potential for large amounts of trading profits, despite the fact that such investment may have a high degree of risk. If the investment is unsuccessful, the Series could incur losses. Conversely, a Trading Advisor that does not receive any performance-based incentive fees might not make such a risky investment. See “Fees and Expenses.”
The interest rate floor may create financial risk.
With respect to the Graham Series, Winton Series, Campbell/Graham Series, Currency Series and the Class 1 and Class 2 of the Balanced Series, the Trust has agreed to pay all interest income earned by it up to a cap of 2.0% to the Managing Owner. To the extent that the interest income earned by the Trust falls below 0.75% annually, the Trust will be obligated to pay the Managing Owner the difference between the interest income actually earned by the Trust and 0.75%. Such shortfall will be charged pro rata across such Series of Units. Accordingly, if interest rates fall, then you could be charged a portion of such interest income shortfall which would reduce the value of your Units in such Series. See “Fees and Expenses—Interest Income.”
You have limited rights, and you cannot prevent the Trust from taking actions which could cause losses.
Pursuant to the Trust Agreement, you will exercise no control over the Trust’s day-to-day business. Therefore, the Trust may take certain actions and enter into certain transactions or agreements of which you have no approval. For example, the Trust may retain a Trading Advisor for a Series in which you are invested, and such Trading Advisor may ultimately incur losses for the Series. As a Limited Owner, you have no ability to determine or influence the hiring, retention or firing of such Trading Advisor. However, certain actions, such as termination or dissolution of a Series, may be taken, or approved, upon the affirmative vote of Limited Owners holding Units representing at least a majority (over 50%) of the Net Asset Value of the Series (excluding Units owned by the Managing Owner and its affiliates). See “Trust Agreement.”
You may not be able to establish a basis for liability against a Trading Advisor, a Clearing Broker or the Swap Counterparty.
Each Trading Advisor, each Clearing Broker and the Swap Counterparty acts only as a trading advisor, clearing broker or swap counterparty, respectively, to the applicable Series and Trading Company. None of these parties acts in such capacity to you. Therefore, you have no contractual privity with the Trading Advisors, the Clearing Brokers or the Swap Counterparty. Due to this lack of contractual privity, you will likely not be able to establish a basis for liability against a Trading Advisor, a Clearing Broker or the Swap Counterparty.
An unanticipated number of redemption requests during a short period of time could have an adverse effect on the Net Asset Value of a Series.
If a substantial number of requests for redemption of Units in a Series are received by the Trust during a relatively short period of time, such Series may not be able to satisfy the requests from funds not committed to trading. As a consequence, it could be necessary to liquidate positions in such Series’ trading positions before the
33
Table of Contents
time that the applicable Trading Advisor(s)’ trading strategies would dictate liquidation. If this were to occur, it could affect adversely the Net Asset Value per Unit of such Series and each Sub-Class within such Series, not only for Limited Owners redeeming units but also for nonredeeming Limited Owners. Your redemption price for Units in a Series is based on the Net Asset Value per Unit of such Series, which value could be less than the initial price you paid for your Units.
Reserves for contingent liabilities may be established upon redemption, and the Trust may withhold a portion of your redemption amount.
The Trust may find it necessary upon redemption by you to set up a reserve for undetermined or contingent liabilities and withhold a certain portion of your redemption amount. This could occur, for example, in the event some of the positions of the Series in which you were invested were illiquid, if there are any assets which cannot be properly valued on the redemption date, or if there is any pending transaction or claim by or against the Trust involving or which may affect your book capital account or your obligations of which the Trust cannot, in the sole judgment and discretion of the Managing Owner, be then ascertained. See “Trust Agreement.”
Conflicts of interest exist in the structure and operation of the Trust.
A number of actual and potential conflicts of interest exist in the operation of the Trust’s business. The Managing Owner, the Trading Advisors and their respective principals, all of which are engaged in other investment activities, are not required to devote substantially all of their time to the Trust’s business, which also presents the potential for numerous conflicts of interest with the Trust.
As a result of these and other relationships, parties involved with the Trust have a financial incentive to act in a manner other than in the best interests of the Trust and its Limited Owners. The Managing Owner has not established, and has no plans to establish, any formal procedures to resolve these and other conflicts of interest. Consequently, there is no independent control over how the Managing Owner will resolve these conflicts on which investors can rely in ensuring that the Trust is treated equitably.
The failure or bankruptcy of one of its Futures Clearing Brokers could result in a substantial loss of one or more Series’ assets.
Under CFTC regulations, a futures commission merchant maintains customers’ assets in a bulk segregated account. If a Futures Clearing Broker fails to do so, or is unable to satisfy a substantial deficit in a customer account, its other customers may be subject to risk of loss of their funds in the event of that Futures Clearing Broker’s bankruptcy. In that event, the Futures Clearing Broker’s customers, such as one or more Trading Companies which utilize such Futures Clearing Broker, are entitled to recover, even in respect of property specifically traceable to them, only a proportional share of all property available for distribution to all that Futures Clearing Broker’s customers. Each Series also may be subject to the risk of the failure of, or delay in performance by, any exchanges and markets and their clearing organizations, if any, on which commodity interest contracts are traded.
You will not be able to review any Series’ holdings on a daily basis, and you may suffer unanticipated losses.
The Trading Advisors make trading decisions on behalf of the assets of each Series other than the Long Only Commodity Series. While the Trading Advisors receive daily trade confirmations from the Clearing Brokers of each transaction entered into on behalf of each Series for which they manage the trading of, each Series’ trading results are only reported to investors monthly in summary fashion. Accordingly, an investment in the Units does not offer investors the same transparency that a personal trading account offers in that you will not have access to detailed information concerning the positions held on behalf of any Series. As a result, you may suffer unanticipated losses as a result of the Series’ portfolio holdings.
34
Table of Contents
The Trust could terminate before you achieve your investment objective causing potential loss of your investment or upsetting your investment portfolio.
Unforeseen circumstances, including substantial losses, withdrawal of the Trust’s Managing Owner or suspension or revocation of the Managing Owner’s or any of the registered Trading Advisors’ respective registrations with the CFTC or memberships in the NFA could cause the Trust to terminate before its stated termination date of December 31, 2053. The Trust’s termination would cause the liquidation and potential loss of your investment and could upset the overall maturity and timing of your investment portfolio.
The Trust is not a regulated investment company and thus is subject to different protections than a regulated investment company.
The Trust is not an investment company subject to the Investment Company Act. Accordingly, you do not have the protections afforded by that statute. For example, the Investment Company Act requires investment companies to have a majority of disinterested directors and regulates the relationship between the investment company and its investment manager. Since the Trust is not a registered investment company, you will not benefit from such protections.
Litigation could result in substantial additional expenses.
The Trust could be named as a defendant in a lawsuit or regulatory action arising out of the activities of the Managing Owner or the Trading Advisors. If this happens, the Trust will bear the costs of defending such suit or action and will be at further risk if its defense is unsuccessful which could result in losses to your investment.
Dilution could occur as a result of the initial service fee and/or on-going service fee.
Investors who subscribe for larger amounts of Units will pay initial service fees and/or on-going service fees at reduced levels. The reduction of the initial service fee and/or on-going service fee will be effectuated through the issuance of additional Units to such investors. If such additional Units are issued to such investors, then the dilution of the other investors in such Series will result. Therefore, effectively, the other owners of Units in such Series will bear the cost of the reduction of the initial service fees and/or on-going service fees for the larger Unit owners because they will receive a smaller portion of the profits earned by such Series. See “Fees and Expenses—Selling Agent Compensation.”
The Managing Owner is leanly staffed and relies heavily on its key personnel to manage the Trust’s trading activities, and the loss of such personnel could adversely affect the Trust.
In managing and directing the day-to-day activities and affairs of the Trust, the Managing Owner relies heavily on its principals. The Managing Owner is leanly staffed, so if any of its key persons were to leave or be unable to carry out his or her present responsibilities, it may have an adverse effect on the management of the Trust.
In addition, under the operating agreement of the Managing Owner, Mr. Bornhoft’s ability to serve as the Manager of the Managing Owner is dependent upon certain factors. If Mr. Bornhoft is removed as the Manager of the Managing Owner, then the Trust could be adversely affected.
The Managing Owner places significant reliance on the Trading Advisors and their key personnel and the loss of such personnel could adversely affect a Series.
The Managing Owner relies on the Trading Advisors to achieve trading gains for each Series, entrusting each of them with the responsibility for, and discretion over, the investment of their allocated portions of the Trust’s assets. The Trading Advisors, in turn, are dependent on the services of a limited number of persons to develop and refine their trading approaches and strategies and execute the trading transactions. The loss of the
35
Table of Contents
services of any Trading Advisor’s principals or key employees, or the failure of those principals or key employees to function effectively as a team, may have an adverse effect on that Trading Advisor’s ability to manage its trading activities successfully or may cause the Trading Advisor to cease operations entirely, either of which, in turn, could negatively impact one or more Series’ performance. Each of the Trading Advisors is wholly-owned and controlled, directly or indirectly, by single individuals, and these individuals have major roles in developing, refining and implementing the Trading Advisor’s trading strategies and operating its business. The death, incapacity or other prolonged unavailability of such individuals likely would greatly hinder these Trading Advisors’ operation, and could result in their ceasing operations entirely, which could adversely affect the value of your investment.
The Managing Owner may terminate, replace and/or add Trading Advisors in its sole discretion which may disrupt trading, adversely affecting the Net Asset Value of a Series.
The Managing Owner may terminate, substitute or retain Trading Advisors on behalf of each Series in its sole discretion. The addition of a new Trading Advisor and/or the removal of one of the current Trading Advisors may cause disruptions in trading as assets are reallocated and new Trading Advisors transition over, which may have an adverse effect on the Net Asset Value of the affected Series.
The Managing Owner’s allocation of the Trust’s assets among Trading Advisors may result in less than optimal performance by the Trust.
The Managing Owner may reallocate assets among the Trading Advisors for the Balanced Series, the Campbell/Graham Series, the Currency Series or the Long/Short Commodity Series upon termination of a Trading Advisor or retention of a new Trading Advisor or at the commencement of any month. Consequently, the net assets for such Series may be apportioned among the Trading Advisors in a different manner than the currently anticipated apportionment. The Managing Owner’s allocation of assets will directly affect the profitability of the Balanced Series’, the Campbell/Graham Series’, the Currency Series’ and the Long/Short Commodity Series’ trading, possibly in an adverse manner. For example, a Trading Advisor may experience a high rate of return but may be managing only a small percentage of such Series net assets. In this case, the Trading Advisor’s performance could have a minimal effect on the Net Asset Value of such Series.
Third parties may infringe or otherwise violate a Trading Advisor’s intellectual property rights or assert that a Trading Advisor has infringed or otherwise violated their intellectual property rights, which may result in significant costs and diverted attention.
Third parties may obtain and use a Trading Advisor’s intellectual property or technology, including its trading program software, without permission. Any unauthorized use of a Trading Advisor’s proprietary software and other technology could adversely affect its competitive advantage. Proprietary software and other technology are becoming increasingly easy to duplicate, particularly as employees with proprietary knowledge leave the owner or licensed user of that software or other technology. Each Trading Advisor may have difficulty monitoring unauthorized uses of its proprietary software and other technology. The precautions it has taken may not prevent misappropriation or infringement of its proprietary software and other technology. Also, third parties may independently develop proprietary software and other technology similar to that of a Trading Advisor or claim that the Trading Advisor has violated their intellectual property rights, including their copyrights, trademark rights, trade names, trade secrets and patent rights. As a result, a Trading Advisor may have to litigate in the future to protect its trade secrets, determine the validity and scope of other parties’ proprietary rights, defend itself against claims that it has infringed or otherwise violated other parties’ rights, or defend itself against claims that its rights are invalid. Any litigation of this type, even if the Trading Advisor is successful and regardless of the merits, may result in significant costs, divert its resources from the manager of the Series’ assets, or require it to change its proprietary software and other technology or enter into royalty or licensing agreements.
36
Table of Contents
The success of each Series depends on the ability of the personnel of its Trading Advisor(s) to accurately implement their trading systems, and any failure to do so could subject a Series to losses on such transactions.
The Trading Advisors’ computerized trading systems rely on the Trading Advisors’ personnel to accurately process the systems’ outputs and execute the transactions called for by the systems. In addition, each Trading Advisor relies on its staff to properly operate and maintain its computer and communications systems upon which the trading systems rely. Execution and operation of each Trading Advisor’s systems is therefore subject to human errors. Any failure, inaccuracy or delay in implementing any of the Trading Advisors’ systems and executing transactions could impair its ability to identify profit opportunities and benefit from them. It could also result in decisions to undertake transactions based on inaccurate or incomplete information. This could cause substantial losses on transactions.
A Series may experience substantial losses on transactions if the computer or communications systems of its Trading Advisor(s) fail.
Each Trading Advisor’s trading activities, including its risk management, depends on the integrity and performance of the computer and communications systems supporting it. Extraordinary transaction volume, hardware or software failure, power or telecommunications failure, a natural disaster or other catastrophe could cause any Trading Advisor’s computer systems to operate at an unacceptably slow speed or even fail. Any significant degradation or failure of the systems that a Trading Advisor uses to gather and analyze information, enter orders, process data, monitor risk levels and otherwise engage in trading activities may result in substantial losses on transactions, liability to other parties, lost profit opportunities, damages to the Trading Advisors’, the Managing Owner’s and the Trust’s reputations, increased operational expenses and diversion of technical resources.
Each Trading Advisor depends on the reliable performance of the computer or communications systems of third parties, such as brokers and futures exchanges, and may experience substantial losses on transactions if they fail.
Each Trading Advisor depends on the proper and timely function of complex computer and communications systems maintained and operated by the futures exchanges, brokers and other data providers that the Trading Advisor uses to conduct its trading activities. Failure or inadequate performance of any of these systems could adversely affect the Trading Advisor’s ability to complete transactions, including its ability to close out positions, and result in lost profit opportunities and significant losses on commodity interest transactions. This could have a material adverse effect on revenues and materially reduce the Trust’s available capital. For example, unavailability of price quotations from third parties may make it difficult or impossible for a Trading Advisor to use its proprietary software that it relies upon to conduct its trading activities. Unavailability of records from brokerage firms can make it difficult or impossible for the Trading Advisor to accurately determine which transactions have been executed or the details, including price and time, of any transaction executed. This unavailability of information also may make it difficult or impossible for the Trading Advisor to reconcile its records of transactions with those of another party or to accomplish settlement of executed transactions.
If a Trading Advisor, or third parties on which a Trading Advisor depends, fail to upgrade computer and communications systems, the Trust’s financial condition could be harmed.
The development of complex communications and new technologies may render the existing computer and communication systems supporting the Trading Advisors’ trading activities obsolete. In addition, these computer and communications systems must be compatible with those of third parties, such as the systems of exchanges, the Clearing Brokers and the executing brokers used by the Trading Advisors. As a result, if these third parties upgrade their systems, the Trading Advisors will need to make corresponding upgrades to continue effectively its trading activities. The Trust’s future success will depend on each Trading Advisor’s and third parties’ ability to respond to changing technologies on a timely and cost-effective basis.
37
Table of Contents
The occurrence of a terrorist attack, or the outbreak, continuation or expansion of war or other hostilities, pandemics or natural disasters could disrupt trading activity and materially affect profitability.
The operations of the Managing Owner, the Trading Advisors, the Trust, the exchanges, brokers and counterparties with which the Managing Owner, the Trading Advisors and the Trust do business, and the markets in which the Managing Owner, the Trading Advisors and the Trust do business could be severely disrupted in the event of a major terrorist attack or the outbreak, continuation or expansion of war or other hostilities. The terrorist attacks of September 11, 2001, have heightened this concern tremendously. The situations in Iraq, Iran and North Korea, global anti-terrorism initiatives and political unrest in the Middle East and Southeast Asia continue to fuel this concern. Additionally, a serious pandemic, such as avian influenza, or a natural disaster, such as a hurricane, could severely disrupt the global economy.
If any of the Trading Advisors are unable to attract and retain qualified employees, its ability to conduct trading activities may be adversely affected.
Each Series’ future success and growth depends on each Trading Advisor’s ability to attract and retain employees that fit into its culture. There is intense competition for the limited pool of qualified personnel that meets these criteria. If any of the Trading Advisors are unable to attract and retain qualified personnel, then its ability to successfully execute its trading strategies may be diminished.
Regulation of the commodity interest markets is extensive and constantly changing; future regulatory developments are impossible to predict, but may significantly and adversely affect the Trust.
The futures, options on futures and security futures markets are subject to comprehensive statutes, regulations and margin requirements. Recent legislation has created a new multi-tiered structure of exchanges in the United States subject to varying degrees of regulation, and rules and interpretations regarding various aspects of this new regulatory structure have only recently been proposed or finalized. Traditional futures exchanges, which are now called designated contract markets, are now subject to more streamlined and flexible core principles rather than the prior statutory and regulatory mandates. However, with respect to these traditional futures exchanges, the CFTC and the exchanges are authorized to take extraordinary actions in the event of a market emergency, including, for example, the retroactive implementation of speculative position limits or higher margin requirements, the establishment of daily limits and the suspension of trading. The regulation of commodity interest transactions in the United States is a rapidly changing area of law and is subject to on-going modification by government and judicial action. In addition, various national governments have expressed concern regarding the disruptive effects of speculative trading in the currency markets and the need to regulate the derivatives markets in general. The effect of any future regulatory change is impossible to predict, but could be substantial and adverse.
Tax and ERISA Risks
You are strongly urged to consult your own tax advisor and counsel about the possible tax consequences to you of an investment in the Trust. Tax consequences may differ for different investors, and you could be affected by changes in the tax laws.
Your tax liability may exceed distributions to you.
Cash is distributed to Limited Owners at the sole discretion of the Managing Owner, and the Managing Owner does not currently intend to make any such distribution. Nevertheless, you will be taxed each year on your share of the Trust’s income and gain allocable to the Series of Units in which you invest, regardless of whether you redeem any Units or receive any cash distributions from the Trust.
You could owe taxes on your share of the Trust’s ordinary income despite overall losses.
Gain or loss on domestic futures and options on futures as well as on most foreign currency contracts will generally be taxed as capital gains or losses for Federal income tax purposes. Interest income and other ordinary
38
Table of Contents
income earned generally cannot be offset by capital losses. Consequently, you could owe taxes on your allocable share of ordinary income for a calendar year even if the Series in which you hold Units reports a net trading loss for that year. Also, your ability to deduct particular operating expenses allocable to your Series may be subject to limitations for purposes of calculating your Federal and/or state and local income tax liability.
You may be taxed on gains that the Trust never realizes.
Because a substantial portion of the Trust’s open positions are “marked-to-market” at the end of each year, some of your tax liability for each year will be based on unrealized gains that the Trust may never actually realize.
Partnership treatment is not assured, and if the Trust is not treated as a Partnership, you could suffer adverse tax consequences.
The Managing Owner has obtained an opinion of counsel to the effect that the Trust will be treated as a partnership for Federal income tax purposes and, assuming that at least 90% of the gross income of the Trust will constitute “qualifying income” within the meaning of Section 7704(d) of the Code, will not be a publicly traded partnership treated as a corporation. The Managing Owner believes it is likely, but not certain, that the Trust will meet this income test. The Trust has not requested, and does not intend to request, a ruling from the Internal Revenue Service, or the Service, concerning its tax treatment. An opinion of counsel is not binding on the Service or the courts and is subject to any changes in applicable tax laws.
If the Trust were to be treated as a corporation for Federal income tax purposes: the net income of the Trust would be taxed at corporate income tax rates, thereby substantially reducing its distributable cash; you would not be allowed to deduct losses of the Trust; and distributions to you, other than liquidating distributions, would constitute dividends to the extent of the current or accumulated earnings and profits of the Trust and would be taxable as such. See “Federal Income Tax Consequences.”
There is the possibility of a tax audit which could result in additional taxes to you.
The Trust’s tax returns may be audited by a taxing authority, and an audit could result in adjustments to the Trust’s returns. If an audit results in an adjustment, you may be compelled to file amended returns and to pay additional taxes plus interest and penalties.
The investment of Benefit Plan Investors may be limited or prohibited if any or all of the Series are deemed to hold plan assets or if the Trading Advisors have pre-existing fiduciary relationships with certain investing Benefit Plan Investors.
Special considerations apply to investments in the Trust by pension, profit-sharing, stock bonus, individual retirement accounts, Keogh plans, welfare benefit plans and other employee benefit plans subject to Part 4 of Subtitle B of Title I of ERISA or Section 4975 of the Code, or an ERISA Plan, and any entity whose underlying assets include plan assets by reason of an ERISA Plan’s investment in such entity, or together with ERISA Plans, Benefit Plan Investors. While the assets of any Series (and Sub-Class of any Series) are intended not to constitute plan assets with respect to any Benefit Plan Investors, the United States Department of Labor, or the DOL, could disagree. If the DOL were to find that the assets of some or all of the Series are plan assets, the Managing Owner and the Trading Advisor(s) to such Series would be fiduciaries, certain transactions in the Trust could be prohibited, and the Managing Owner would then have the right to mandatorily redeem out any Limited Owner which is a Benefit Plan Investor. For example, if the Trust were deemed to hold plan assets, the Trading Advisors may have to refrain from directing certain transactions that are currently contemplated. Furthermore, whether or not the Trust is deemed to hold plan assets, if an ERISA Plan has certain pre-existing relationships with the Managing Owner, one or more Trading Advisors, the Selling Agents or a Clearing Broker, investment in a Series may be limited or prohibited. See “ERISA Considerations” and “Restrictions Affecting Benefit Plan Investors.”
39
Table of Contents
Foreign investors may face exchange rate risk and local tax consequences.
Foreign investors should note that the Units are denominated in U.S. dollars and that changes in the rates of exchange between currencies may cause the value of their investment to decrease.
Regulatory Risks
Government regulations may change and adversely affect the Trust.
Considerable regulatory attention has recently been focused on publicly distributed partnerships, and, in particular, on “commodity pools” such as the Trust. In addition, tax law revisions could have a materially adverse effect on the Trust. Concern has also been expressed about speculative pools of capital trading in the currency markets, because these pools have the potential to disrupt central banks’ attempts to influence exchange rates. In the current environment, you must recognize the possibility that future regulatory changes may alter, perhaps to a material extent, the nature of an investment in any Series of the Trust.
Failure of the Trust’s other counterparties may result in losses to the Trust.
The Trust may be unable to recover any of its assets in the event of the bankruptcy of any unregulated or over-the-counter counterparty with whom it trades. Such inability to recover the Trust’s assets may result in losses to your investment.
CFTC registrations could be terminated which could adversely affect the Trust or a Series.
If the CE Act registrations or NFA memberships of the Managing Owner or the registered Trading Advisors were no longer effective, these entities would not be able to act for the Trust. If the Managing Owner or a registered Trading Advisor were unable to act for the Trust or a Series, it could adversely affect the Trust or such Series.
For example, if the Managing Owner’s registration as a commodity pool operator, or CPO, under the CE Act or the Managing Owner’s membership as a CPO with the NFA were suspended, revoked or terminated, unless there were at least one remaining managing owner whose registration or membership has not been suspended, revoked or terminated, the Trust will be required to dissolve.
Likewise, if a registered Trading Advisor’s registration as a commodity trading advisor under the CE Act or such Trading Advisor’s membership as a commodity trading advisor with the NFA were suspended, revoked or terminated, the Trust would remove such Trading Advisor as a trading advisor for the applicable Series. The Managing Owner would then either terminate the Series or hire another commodity trading advisor to act as Trading Advisor for such Series.
The Trust and the Managing Owner have been represented by unified counsel, and you will not benefit from further review of this offering by independent counsel.
In connection with this offering, the Trust and the Managing Owner have been represented by unified counsel, and the offering and this Prospectus have only been reviewed by such unified counsel. To the extent that the Trust, the Managing Owner or you could benefit by further independent review, such benefit will not be available.
Although the foregoing risk factors are not a complete explanation of all the risks involved in purchasing interests in a fund that invests in the highly speculative, highly leveraged trading of futures, forwards and options, the foregoing risk factors are a complete explanation of all material risks involved in purchasing Units in the Trust. You should read this entire Prospectus before determining to subscribe for Units.
40
Table of Contents
The Trust was formed on August 8, 2003, as a Delaware statutory trust and will issue separate Series of Units in segregated pools of assets of the Trust, pursuant to the requirements of the Delaware Statutory Trust Act, as amended, or the Trust Act. The Trust’s office in the State of Delaware is c/o Wilmington Trust Company, 1100 N. Market Street, Rodney Square North, Wilmington, Delaware 19805. The Trust’s principal office is c/o Equinox Fund Management, LLC, 1660 Lincoln Street, Suite 100, Denver, Colorado 80264.
The Trust is a multi-advisor commodity pool as described in CFTC Regulation § 4.10(d)(2).
Purchasers of Units will become limited owners of the Trust, or Limited Owners. The Trust Act provides that, except as otherwise provided in the amended and restated declaration of trust and trust agreement of the Trust, or the Trust Agreement, Unitholders in a Delaware statutory trust will have the same limitation of liability as do stockholders of private corporations organized under the General Corporation Law of the State of Delaware. The Trust Agreement confers substantially the same limited liability, and contains the same limited exceptions thereto, as would a limited partnership agreement for a Delaware limited partnership engaged in like transactions as the Trust. In addition, pursuant to the Trust Agreement, the Managing Owner of the Trust is liable for obligations of a Series in excess of that Series’ assets. Limited Owners do not have any such liability. See “The Trust Agreement—Liabilities—Exercise of Rights by Limited Owners.”
THIS POOL HAS A LIMITED PERFORMANCE HISTORY.
Overview of the Series
The Trust’s Units are being offered in eight (8) separate Series: Balanced Series, Graham Series, Winton Series, Campbell/Graham Series, Currency Series, Long Only Commodity Series, Long/Short Commodity Series and Managed Futures Index Series. Previously, the Trust had offered an additional Series of Units called the Dunn Series, but such Series of Units is no longer being offered by the Trust.
The Trust, with respect to the Graham Series, Winton Series, Campbell/Graham Series, Currency Series, Long Only Commodity Series, Long/Short Commodity Series and Managed Futures Index Series, will offer Units in two separate Sub-Classes—Class 1 and Class 2. The Trust, with respect to the Balanced Series, will offer Units in four separate Sub-Classes—Class 1, Class 2, Class 1a and Class 2a. The Trust, with respect to each Series, will engage in the speculative trading of a diversified portfolio of futures, forward (including interbank foreign currencies) and options contracts and other derivative instruments and may, from time to time, engage in cash and spot transactions. Substantially all of the assets of Graham Series, Winton Series and Currency Series have been invested in the Trading Company for such Series. The assets of the Balanced Series have been invested in several different Trading Companies and the assets of Campbell/Graham Series will be invested in two (2) different Trading Companies. Each Trading Company (except the Trading Company for the Balanced Series, the Campbell/Graham Series, the Currency Series, the Long Only Commodity Series and the Long/Short Commodity Series) will have its own Trading Advisor that will manage 100% of the assets invested in such Trading Company and make that Trading Company’s trading decisions. It is expected that between 10% and 30% of each Series’ assets normally will be committed as margin for commodities trading, but from time to time these percentages may be substantially more or less. See “Trading Limitations and Policies.”
The Trading Advisors were selected based upon the Managing Owner’s evaluation of each Trading Advisor’s past performance, trading portfolios and strategies, as well as how each Trading Advisor’s performance, portfolio and strategies complement and differ from those of the other Trading Advisors. The Managing Owner is authorized under each advisory agreement between the Trust, the relevant Trading Company, the Managing Owner and each Trading Advisor, or each, an Advisory Agreement, however, to utilize the services of additional trading advisors for any Series. Except with respect to that portion of each Series’ assets maintained at the Trust level for cash management purposes, the Managing Owner has invested the
41
Table of Contents
balance of the proceeds from the Initial Offering of such Series’ Units in the Trading Company (or Trading Companies, in the case of the Balanced Series Units, the Campbell/Graham Series, the Currency Series and the Long/Short Commodity Series) for each such Series and all such proceeds will be initially available for commodities trading purposes. It is currently contemplated that, except with respect to that portion of each Series’ assets maintained at the Trust level for cash management purposes, the balance of the additional capital raised from such Series during the Continuous Offering of Units will continue to be invested in each Trading Company (or Trading Companies, in the case of the Balanced Series Units, the Campbell/Graham Series Units, the Currency Series Units and the Long/Short Commodity Series Units). The Trading Advisors are not affiliated with the Trust, the Trustee or the Managing Owner. If a Trading Advisor’s trading reaches a level where certain position limits restrict its trading, that Trading Advisor will modify its trading instructions for the Series and its other accounts in a good faith effort to achieve an equitable treatment of all accounts. See “Past Performance of Other Pools Sponsored by the Managing Owner and The Bornhoft Group Corporation.” None of the Trading Advisors nor any of their principals currently have any beneficial interest in the Trust, but some or all of such persons may acquire such an interest in the future. For a summary of the Advisory Agreements between each Trading Advisor, the Trust and the Managing Owner, see “Advisory Agreements.”
With respect to the Balanced Series, the Campbell/Graham Series, the Currency Series and the Long/Short Commodity Series, the Managing Owner may employ leverage at two possible levels. First, the Managing Owner may strategically employ notional equity at the overall portfolio level by strategically allocating an amount of assets to the Trading Advisors in excess of such Series’ net assets, thereby increasing the overall leverage of such Series’ portfolio. Second, the Managing Owner may utilize various techniques when allocating assets amongst various Trading Advisors that employ varying amounts of leverage within their individual trading programs. See the Balanced Series Appendix, the Campbell/Graham Series Appendix, the Currency Series Appendix and the Long/Short Commodity Series Appendix.
For a description of each Series’ Trading Advisor(s) and its(their) principals, as well as a general description of the trading strategies and trading portfolios each Trading Advisor will employ in its trading on behalf of the Trust, the past performance of such Trading Advisor(s), the Break-Even Analysis for each Series and management and incentive fees to be charged to each Series of Units, see the Appendix for such Series. The descriptions in such Appendices were derived by the Managing Owner in part from information provided by each Trading Advisor and, in the case of the Long Only Commodity Series the Swap Counterparty, which such persons prepared themselves. Because the Trading Advisors’ trading strategies are proprietary, the descriptions in each Appendix are of necessity general in nature.
CAUTIONARY NOTE REGARDING FORWARD-LOOKING STATEMENTS
This Prospectus includes forward-looking statements that reflect the Managing Owner’s current expectations about the future results, performance, prospects and opportunities of the Trust. The Managing Owner has tried to identify these forward-looking statements by using words such as “may,” “will,” “expect,” “anticipate,” “believe,” “intend,” “should,” “estimate” or the negative of those terms or similar expressions. These forward-looking statements are based on information currently available to the Managing Owner and are subject to a number of risks, uncertainties and other factors, both known, such as those described in “Risk Factors” and elsewhere in this Prospectus, and unknown, that could cause the Trust’s actual results, performance, prospects or opportunities to differ materially from those expressed in, or implied by, these forward-looking statements.
You should not place undue reliance on any forward-looking statements. Except as expressly required by the Federal securities laws, the Managing Owner undertakes no obligation to publicly update or revise any forward-looking statements or the risks, uncertainties or other factors described in this Prospectus, as a result of new information, future events or changed circumstances or for any other reason after the date of this Prospectus.
42
Table of Contents
TRADING LIMITATIONS AND POLICIES
The following limitations and policies are applicable to the Trust as a whole and, at the outset, to each Series individually. The application of these limitations and policies will be identical for all Series of the Trust and each Trading Advisor. A Trading Advisor sometimes may be prohibited from taking positions for a Series that it would otherwise prefer to acquire because of the need to comply with these limitations and policies. The Managing Owner will monitor compliance with the trading limitations and policies set forth below, and it may impose such additional restrictions upon the trading activities of any Trading Advisor (through modification of the limitations and policies) as it, in good faith, deems appropriate and in the best interests of each Series, subject to the terms of each Advisory Agreement. See “Advisory Agreements.”
The Managing Owner will not approve a material change in the following trading limitations and policies for any Series without obtaining the prior written approval of Limited Owners holding Units representing at least a majority (over 50%) of the Net Asset Value of that Series (excluding Units owned by the Managing Owner and its Affiliates). The Managing Owner may, however, without obtaining such approval, impose additional limitations on the trading or investment activities of each Series or on the types of instruments in which a Trading Advisor can invest if the Managing Owner determines that additional limitations are necessary to assure that 90% of the Trust’s income is Qualifying Income or are in the best interests of a Series.
Trading Limitations
No Series of the Trust will: (i) engage in pyramiding its commodities positions (i.e., use unrealized profits on existing positions to provide margin for the acquisition of additional positions in the same or a related commodity), but may take into account open trading equity on existing positions in determining generally whether to acquire additional commodities positions; (ii) borrow or loan money (except with respect to the initiation or maintenance of the Series’ commodities positions or obtaining lines of credit for the trading of forward currency contracts; provided, however, that each Series of the Trust is prohibited from incurring any indebtedness on a non-recourse basis); (iii) permit rebates to be received by the Managing Owner or its affiliates, or permit the Managing Owner or any affiliate to engage in any reciprocal business arrangements that would circumvent the foregoing prohibition; (iv) permit any Trading Advisor to share in any portion of the commodity brokerage fees paid by a Series of the Trust; (v) commingle its assets, except as permitted by law; or (vi) permit the churning of its commodity accounts.
The Trust, with respect to each Series, will conform in all respects to the rules, regulations and guidelines of the markets on which its trades are executed.
Trading Policies
Subject to the foregoing limitations, each Trading Advisor has agreed to abide by the trading policies of the Series of the Trust, which currently are as follows:
(1) Series funds generally will be invested in contracts that are traded in sufficient volume which, at the time such trades are initiated, are reasonably expected to permit entering and liquidating positions.
(2) Stop or limit orders may, in a Trading Advisor’s discretion, be given with respect to initiating or liquidating positions in order to attempt to limit losses or secure profits. If stop or limit orders are used, however, no assurance can be given that the Clearing Brokers will be able to liquidate a position at a specified stop or limit order price, due to either the volatility of the market or the inability to trade because of market limitations.
(3) A Trading Advisor generally will not initiate an open position in a futures contract (other than a cash settlement contract) during any delivery month in that contract, except when required by exchange rules, law or exigent market circumstances. This policy does not apply to forward and cash market transactions.
43
Table of Contents
(4) A Trading Advisor, on behalf of the applicable Trading Company, may occasionally make or accept delivery of a commodity including, without limitation, currencies. A Trading Advisor also may engage in “EFP” transactions (i.e., an exchange of futures for physical transaction, as permitted on the relevant exchange) involving currencies and metals and other commodities. Provided that the applicable Trading Company constitutes an “eligible contract participant” (as such term is defined in Section 1(a)(12) of the CE Act), such Trading Company may engage in swap transactions and a Trading Company may access certain Trading Advisors by entering into total-return swap transactions.
(5) A Trading Advisor may, from time to time, employ trading techniques such as spreads, straddles and conversions.
(6) A Trading Advisor will not initiate open futures or option positions that would result in net long or short positions requiring as margin or premium for outstanding positions in excess of 15% of the applicable Series’ Net Asset Value for any one commodity or in excess of 66% of the applicable Series’ Net Asset Value for all commodities combined. Under certain market conditions, such as where there is an inability to liquidate open commodities positions because of daily price fluctuations, the Managing Owner may be required to commit as margin in excess of the foregoing limits and in such case the Managing Owner will cause the Trading Advisor to reduce its open futures and option positions to comply with these limits before initiating new commodities positions.
(7) If a Trading Advisor engages in transactions in forward currency contracts on behalf of a Series other than with or through the Clearing Brokers, it will only engage in such transactions with or through a bank that has, as of the end of its last fiscal year, an aggregate balance in its capital, surplus and related accounts of at least $100,000,000, as shown by its published financial statements for that year, and through other broker-dealer firms whose aggregate balance in its capital, surplus and related accounts is at least $50,000,000. If transactions are effected for a Trading Company in the forward markets, the only forward markets that will be permitted to be utilized are the interbank foreign currency markets and the London Metal Exchange. The utilization of other forward markets requires the consent of the Managing Owner.
DESCRIPTION OF THE TRUST, TRUSTEE, MANAGING OWNER AND AFFILIATES
The Trust was formed on August 8, 2003, under the Trust Act. The sole trustee of the Trust is Wilmington Trust Company, which delegated its duty and authority for the management of the business and affairs of the Trust to the Managing Owner and will have no liability. See “Fiduciary Responsibilities—Accountability.”
The Managing Owner may be deemed to be, and the Trustee will not be deemed to be, a “Promoter” of the Trust within the meaning of the Securities Act. None of the foregoing persons is an “affiliate” (as that term is used for purposes of the Securities Act) of any of the Trading Advisors. The Managing Owner may be deemed to be a “parent” of the Trust within the meaning of the Federal securities laws.
A brief description of the Trustee, the Managing Owner, and the officers and directors of the Managing Owner, follows:
The Trustee
Wilmington Trust Company, a Delaware banking corporation, is the sole trustee of the Trust. The Trustee’s principal offices are located at 1100 N. Market Street, Rodney Square North, Wilmington, Delaware 19805. The Trustee is unaffiliated with each of the Managing Owner and the Trading Advisors, and the Trustee’s duties and liabilities with respect to the offering of the Units and the administration of the Trust are limited to its express obligations under the Trust Agreement. The Trustee will accept service of legal process upon the Trust in the State of Delaware. See “Trust Agreement—Trustee.” Limited Owners will be notified by the Managing Owner of any change of the Trust’s trustee.
44
Table of Contents
The Managing Owner
Equinox Fund Management, LLC, a Delaware limited liability company formed in June 2003, is the managing owner of the Trust. The Managing Owner became registered with the CFTC as a CPO as of August 6, 2003, and has been a member in the NFA in such capacity since that date. The Managing Owner’s main business office is located at 1660 Lincoln Street, Suite 100, Denver, Colorado 80264, telephone (303) 837-0600. For a description of the Managing Owner’s responsibilities to the Trust, see “Duties of the Managing Owner.”
The most recent audited consolidated statement of financial condition of the Managing Owner and report of the independent accountants thereon is attached to this Prospectus. See “Index to Certain Financial Information.”
Principals of the Managing Owner
The current officers and directors of the Managing Owner are as follows:
Richard E. Bornhoft is the President, Chief Operating Officer, Manager and a member of the managing committee of the Managing Owner, or the Executive Committee. In addition, Mr. Bornhoft has been registered as a principal and an associated person of the Managing Owner since August 2003. Mr. Bornhoft also is President of The Bornhoft Group Corporation, or The Bornhoft Group, and has been registered as a principal and an associated person of The Bornhoft Group since September 1985 and November 1985, respectively. Mr. Bornhoft is also a principal of Bornhoft Group Securities Corporation, a registered broker/dealer, and SectorQuant Capital Management. Mr. Bornhoft has over twenty-five years of experience in advising both Private and Institutional clientele in the alternative investment industry, beginning his career in 1979. The Bornhoft Group was formed in 1985 as an investment management firm, providing alternative investments (i.e., investments other than long-only investments in publicly-traded stocks, bonds and cash-equivalent securities) to institutions and high net worth investors. Over the past two decades, Mr. Bornhoft has been responsible for the planning, creation and execution of the company’s business strategy. This responsibility has included such tasks as the design, technology and implementation of the asset allocation, valuation and risk management systems, and the distribution of client assets into alternative investment products and services. His company has designed and operated alternative investment portfolios for approximately twenty (20) pension plans, corporations and banking institutions throughout the world. Prior to forming The Bornhoft Group in 1985, Mr. Bornhoft was Vice-President of Product Development for the Managed Account Corporation, an investment- consulting firm that offered Alternative Investment products to its clientele. From 1979 to 1983, his activities included serving as a Denver branch manager for Geldermann, Inc. (a Chicago-based brokerage firm) and as an investment advisor, developing trading systems and advising client assets in alternative investments. He has served on numerous arbitration boards and various committees of certain regulatory and industry organizations and is a frequent speaker at international conferences and symposiums on alternative investments. He has written numerous articles in leading financial publications and is a contributing author toThe Handbook of Managed Futures—Performance, Evaluation and Analysis(McGraw-Hill, 1997) andSearching for Alpha—The Quest for Exceptional Investment Performance(Wiley, 2000). Mr. Bornhoft is a board member and principal of Morningstar Hedge Inc. He currently holds SEC/NASD Series 7, 24 and 63 registrations, in addition to a CFTC/NFA series 3 registration.
Ron S. Montanois the Chief Administration Officer and Secretary of the Managing Owner. In addition, Mr. Montano has been registered as a principal of the Managing Owner since August 2003. Mr. Montano is also the Chief Operations Officer of The Bornhoft Group. Mr. Montano joined the Bornhoft Group in November 1997 and has been registered as a principal thereof since May 1998. Mr. Montano is also a principal of Bornhoft Group Securities Corporation. His responsibilities include providing oversight and management to all divisions of The Bornhoft Group companies, managing all personnel activities, and directing marketing campaigns. Mr. Montano draws upon his extensive experience in leadership and management skills during his successful and highly decorated 23-year career in the United States Army/Army Recruiting Command. He achieved the rank of Command Sergeant Major responsible for administrative functions including manpower assessment, relocation and problem solving, training, documentation and community relations. During his tenure, his oversight has
45
Table of Contents
included overseeing six recruiting companies and 51 recruiting stations within the New England states territory, and seven companies and 52 recruiting offices and over 300 recruiting sales representatives in Michigan, which was the largest recruiting territory in the United States. He graduated with a degree in Applied Science as well as being selected for and graduated from the United States Army Sergeants Major Academy. Mr. Montano was selected to be directly involved in the United States Army Recruiting Command policy development process. He has been highly decorated for his accomplishments in promoting his assigned territories, which earned him the Army’s coveted “Legion of Merit Award.”
S. Brent Balesis the Chief Financial Officer of the Managing Owner. In addition, Mr. Bales has been registered as a principal of the Managing Owner since August 2003. Mr. Bales is also the Vice President of Finance for The Bornhoft Group. Mr. Bales joined The Bornhoft Group in June 2000 and has been registered as a principal thereof since December 2001. Prior to that, from June 1992 through June 2000, he was employed as the Controller of Colorado Pen Company. Mr. Bales’ responsibilities include supervision of all accounting activities, valuation of client portfolios and monitoring of risk management systems. Mr. Bales has over 25 years of experience in finance, accounting and the operation of businesses, as well as over 15 years of experience in senior management positions with various start-up and developmental businesses. He is a Certified Public Accountant with past experience that includes tenures with Touche Ross & Co. and other corporations with responsibilities that encompassed auditing, revenue and cost accounting, cash management and tax audit representation. Mr. Bales received his Bachelor’s degree in Accounting in 1973 from University of Denver and his Certified Public Accountant certification in 1977.
Executive Committee
The Executive Committee is responsible for the general oversight of the Managing Owner’s business and functions like a board of directors of a corporation. The initial members of the Executive Committee are Richard E. Bornhoft, John C. Plimpton and John R. Zumbrunn.
Richard E. Bornhoft
Mr. Bornhoft’s biography appears above under the caption“Officers of the Managing Owner.”
John C. Plimpton
Mr. Plimpton is a member of the Executive Committee of the Managing Owner. In addition, Mr. Plimpton has been registered as a principal and associated person of the Managing Owner since August 2003 and has been a member of the NFA in such capacities as of such date. He has raised assets and marketed the investment programs of several prominent commodity trading advisors. In November 2002, Mr. Plimpton formed Solon Capital, LLC and T-Rex Brokerage, LLC, CPO and independent brokerage firms. These businesses raise assets for commodity trading advisors and structure innovative products to support asset-raising. Mr. Plimpton has been registered with the CFTC as a principal and as an associated person of Solon Capital, LLC since December 2002 and has been a member of the NFA in such capacities since June 2003. Mr. Plimpton is associated with T-Rex Brokerage, LLC which had applied for registration with the CFTC as an introducing broker but withdrew such registration in September 2003.
He was a Director of Investments at Willowbridge Associates Inc. from 1995 through September of 2000 where he was responsible for raising assets and for evaluating investment opportunities in insurance and financial services for Willowbridge Associates Inc. and its affiliates, including Union Spring Asset Management, Inc. From September 2000 through January 2001, he was employed at Quantitative Financial Services in Stamford, Connecticut.
From February 2001 through September 2002, he was the Director of Corporate Development for Beacon Management Corporation USA of Princeton, New Jersey. Mr. Plimpton was registered with the CFTC as an associated person of Beacon Management Corporation USA and was a member of the NFA in such capacity but withdrew such registration and membership in August 2004.
46
Table of Contents
He holds a B.A. in Economics from the University of Chicago and an M.B.A. in corporate finance and corporate accounting from the William E. Simon School of Management at the University of Rochester. He earned his Chartered Life Underwriter and Chartered Financial Consultant designations from the American College.
John R. Zumbrunn
Mr. Zumbrunn is a member of the Executive Committee of the Managing Owner. In addition, Mr. Zumbrunn has been registered as a principal of the Managing Owner since August 2003. Since 1995 he has served as a financial and trading consultant to Willowbridge Associates Inc. and Union Spring Asset Management, Inc., and as a principal of Millstone Portfolio Management, an advisory affiliate of Union Spring Asset Management, Inc. Since 1985 Mr. Zumbrunn was Managing Director of Princeton Investment Technologies, an investment advisory and consulting firm. From 1991 to 1994, he was the Director of Research of Tricon U.S.A., a managed futures and alternative investments fund. Since July 1982, Mr. Zumbrunn has been registered with the CFTC as a sole proprietor commodity trading advisor and was a member of the NFA in such capacity until he withdrew such membership in October 2004. He has over 20 years of investment, trading, and quantitative research experience with Chemical Bank, The Prudential Insurance Company of America, Salomon Brothers, and Commodities Corporation. Mr. Zumbrunn holds a Ph.D. in Mathematics from the University of California at Berkeley and an A.B. in Mathematics from Princeton University and has taught mathematics at Columbia University and the City University of New York.
The sole members of the Managing Owner are Plimpton Capital, LLC and The Bornhoft Group which have been registered as principals of the Managing Owner since August 2003.
The Bornhoft Group
The overall fund management and asset allocation activities will be performed for the Trust by one of the members of Managing Owner, The Bornhoft Group. The Bornhoft Group has been registered with the CFTC as a CPO and as a commodity trading advisor since November 1985 and has been a member of the NFA in such capacities as of such date. The principals of The Bornhoft Group are Richard E. Bornhoft, Ron S. Montano, Brian R. Bell and S. Brent Bales. All trading decisions for The Bornhoft Group are performed by the Investment Committee of The Bornhoft Group which consists of Messrs. Bornhoft, Bell and Bales. The biographies for Messrs. Bornhoft, Montano and Bales appear above under the caption“Officers of the Managing Owner.” The biography for Mr. Bell appears below.
Brian R. Bell is Director of Research for The Bornhoft Group and is responsible for the research and selection of qualified commodity trading advisors for various institutional and retail portfolios. Mr. Bell has been involved in the futures industry since 1987. Mr. Bell joined The Bornhoft Group in April 2005 and has been registered as a principal of The Bornhoft Group since August 2005. Mr. Bell is also involved in an additional project with CTS Capital Management, LLC, a commodity trading advisor located in Denver, Colorado, where he manages the trading and research, focusing on a multiple-strategy portfolio approach. Mr. Bell has been registered as a principal of CTS Capital Management, LLC since September 2005. Beginning in February 2000, Mr. Bell was President and owner of Custom Trading Solutions, Inc., which developed and marketedCTS Studies and BestCommodityCharts.com, technical indicators used with CQG, Inc. and TradeStation to customers across North and South America, Australia, Asia and Europe. Mr. Bell also developed and instructed three-day seminars on designing and evaluating mechanical trading systems to major Wall Street clients, including Morgan Stanley, Credit Suisse First Boston, SAC Capital, Greenwich Capital and FX-Concepts. Mr. Bell has been registered as an associated person and principal of Custom Trading Solutions, Inc. and a member of the NFA in such capacities since April 2004. Mr. Bell also provided consulting services to many private and professional traders on the design and evaluation of technical indicators and trading systems. Additionally, he designed proprietary trading system evaluation and optimization algorithms and supporting software. Prior to starting Custom Trading Solutions, Inc. in February 2000, Mr. Bell was a Senior Software Engineer at CQG, Inc. for
47
Table of Contents
fourteen years from May 1987 through February 2000. It was at CQG, Inc. that Mr. Bell conducted technical analysis and trading system research which resulted in many of the features in CQG for Windows. Mr. Bell has published articles inTechnical Analysis of Stocks & Commodities, andWorking Money Magazine. Mr. Bell earned both his Masters of Science in Electrical Engineering and his Bachelors of Science in Engineering Physics from the University of Colorado. Mr. Bell currently holds a CFTC/NFA series 3 registration.
Established in 1985, The Bornhoft Group (formerly Hart-Bornhoft, Inc.) is one of the oldest asset management firms specializing in alternative investments. The firm structures and actively manages funds and portfolios comprised of performance-oriented portfolio managers for United States and internationally based private and institutional investors. Investments include managed futures, hedge funds, alternative investment indexing, structured notes and portfolio overlays.
The Bornhoft Group has specialized in the identification, research, and management of multi-advisor managed futures portfolios since its inception with allocated assets of approximately $1.4 billion to commodity trading advisors. Over its history, The Bornhoft Group has also established relationships with over twenty-five (25) U.S. brokerage firms that have sold their commodity and hedge funds.
The Bornhoft Group has a database of over 2000 alternative investment programs. It began the creation of a proprietary database of Advisors as well as proprietary analytical software in 1983. Since this time, the company’s database has evolved to also include commercial information. It has a well-established and tested infrastructure that provides fund administration, accounting, cash management, client services and reporting services for commodity and hedge funds (began development in 1989 of proprietary fund administration and valuation systems).
The Bornhoft Group has an on-going commitment to the development of alternative investment products.
Reported Information
Information concerning the Trust and its operations, including Management’s Discussion and Analysis of Financial Condition and Results of Operations and Quantitative and Qualitative Disclosures About Market Risk, is set forth in the Trust’s most recent annual report on Form 10-K as well as the Trust’s most recent quarterly report on Form 10-Q each as filed with the SEC. The Trust hereby specifically incorporates by reference into this Prospectus the Trust’s most recent annual report on Form 10-K and all other reports filed by the Trust pursuant to Section 13(a) or 15(d) of the Exchange Act since the end of the fiscal year covered by such most recent annual report on Form 10-K. Upon written or oral request, the Trust will provide to each person, including any beneficial owner of Units, to whom a Prospectus is delivered, a copy of any or all of the reports or documents that have been incorporated by reference in this Prospectus but not delivered with the Prospectus. The Trust will provide such reports or documents at no cost to the requester. If you would like copies of such reports, please contact the Managing Owner at 1660 Lincoln Street, Suite 100, Denver, Colorado 80264, telephone number (303) 837-0600. In addition, such reports may be accessed via the Trust’s website at http://www.thefrontierfund.com/main.asp?m=15.
The Trust files annual reports on Form 10-K, quarterly reports on Form 10-Q as well as current reports on Form 8-K with the SEC. The public may read and copy any materials that the Trust files with the SEC at the SEC’s Public Reference Room at 100 F Street, N.E., Washington, DC 20549. The public may obtain information on the operation of the Public Reference Room by calling the SEC at 1-800-SEC-0330. In addition, the SEC maintains an Internet site that contains reports, and other information regarding issuers that file electronically with the SEC (such as the Trust). Such Internet site is located at http://www.sec.gov.
Past Performance of The Trust
Set forth on the following page is the performance record of trading of the Trust from its inception through November 2006.
48
Table of Contents
PAST PERFORMANCE OF THE FRONTIER FUND
The Capsule Performance Table which follows sets forth the actual past performance of The Frontier Fund during the period covered by the table.PAST PERFORMANCE IS NOT NECESSARILY INDICATIVE OF FUTURE RESULTS.
| Month | 2006 | 2005 | 2004 | ||||||
January | 3.04 | % | -4.90 | % | |||||
February | -2.38 | % | -1.15 | % | |||||
March | 3.06 | % | -2.42 | % | |||||
April | 1.45 | % | -6.06 | % | |||||
May | -1.89 | % | 2.97 | % | |||||
June | -1.35 | % | 4.69 | % | |||||
July | -1.33 | % | -1.58 | % | |||||
August | -1.06 | % | -0.68 | % | |||||
September | -1.40 | % | 1.53 | % | -0.60 | % | |||
October | 0.42 | % | -0.57 | % | 2.46 | % | |||
November | 1.80 | % | 7.06 | % | 5.31 | % | |||
December | -1.19 | % | -0.61 | % | |||||
Year | 0.16 | % | -3.03 | % | 6.60 | % |
Name of pool: | The Frontier Fund | |
This pool is a multi-advisor advisor pool as defined in CFTC Regulation Section 4.10(d)(2). | ||
Inception of Trading: | September 24, 2004† | |
Aggregate Gross Capital Subscriptions for The Frontier Fund as of November 30, 2006: | $385,709,516.91 | |
Net Asset Value of The Frontier Fund as of November 30, 2006: | $357,906,712.10 | |
Worst Monthly Percentage Draw-down: | -6.06% (April 2005) | |
Worst peak-to-valley Draw-down: | -14.35% (November 2004 through April 2005) |
The Frontier Fund performance table sets forth the actual performance of all Series of The Frontier Fund. Actual gross trading performance (gross realized and unrealized gain/loss before deduction for trading commissions and fees, management fees, any other expenses, and before addition of interest income) is adjusted for the trading expenses, management fees, incentive fees, initial service fees, on-going service fees, and interest income of the Series of The Frontier Fund.
| † | The Winton Series, Currency Series and Dunn Series and Class 1 and Class 2 of the Balanced Series of The Frontier Fund commenced trading on September 24, 2004. The Graham Series commenced trading on November 22, 2004. The Campbell/Graham Series commenced trading on February 14, 2005. The Long Only Commodity Series commenced trading on March 1, 2006. The Long/Short Commodity Series commenced trading on March 6, 2006. The Managed Futures Index Series commenced trading on April 25, 2006. Class 1a and Class 2a of the Balanced Series commenced trading on May 1, 2006. Therefore, the performance table above includes the performance of the Winton Series, Currency Series and Dunn Series and Class 1 and Class 2 of the Balanced Series from October 2004 forward, the performance of the Graham Series from December 2004 forward, the performance of the Campbell Graham Series from March 2005 forward, the performance of the Long Only Commodity Series and Long/Short Commodity Series from March 2006 forward, the performance of the Managed Futures Index Series from April 2006 forward and |
49
Table of Contents
the performance of Class 1a and Class 2a of the Balanced Series from May 2006 forward. As of November 2005, the Dunn Series is no longer being offered by the Trust. |
| * | Draw-down means losses experienced by the pool over a specified period. |
| ** | Worst peak to valley draw-down means the greatest cumulative percentage decline in month-end net asset value due to losses sustained by the pool during any period in which the initial month-end net asset value is not equaled or exceeded by a subsequent month-end net asset value. |
Past Performance of the Series
For the performance record of trading for the Units in each Class of each Series of the Trust, please see the Appendix for each Series of the Trust.
Set forth on the following pages is the actual performance record of trading of the Dunn Series of Units its inception through November 2006. The Dunn Series of Units commenced trading in September 2004 and is no longer being offered by the Trust.
50
Table of Contents
PAST PERFORMANCE OF DUNN SERIES CLASS 1
The Capsule Performance Table which follows sets forth the actual past performance of the Dunn Series Class 1 Units during the period covered by the table.PAST PERFORMANCE IS NOT NECESSARILY INDICATIVE OF FUTURE RESULTS.
— The Dunn Series is Closed —
| Month | 2006 | 2005 | 2004 | ||||||
January | -6.61 | % | -4.09 | % | |||||
February | -2.75 | % | -6.38 | % | |||||
March | 9.19 | % | -4.61 | % | |||||
April | 10.42 | % | -9.08 | % | |||||
May | -5.59 | % | 13.53 | % | |||||
June | -5.82 | % | 9.61 | % | |||||
July | -3.05 | % | -4.73 | % | |||||
August | -2.05 | % | -5.46 | % | |||||
September | -2.27 | % | -5.85 | % | -5.18 | % | |||
October | -3.14 | % | 1.74 | % | 9.06 | % | |||
November | 1.83 | % | 3.09 | % | 6.56 | % | |||
December | -4.02 | % | -4.75 | % | |||||
Year | -10.88 | % | -17.28 | % | 4.96 | % |
Name of pool: | The Frontier Fund | |
This pool is a multi-advisor advisor pool as defined in CFTC Regulation Section 4.10(d)(2). | ||
Name of Series: | Dunn Series Class 1 | |
Inception of Trading of Dunn Series Class 1: | September 24, 2004 | |
Aggregate Gross Capital Subscriptions for Dunn Series Class 1 as of November 30, 2006: | $278,793.00 | |
Net Asset Value of Dunn Series Class 1 as of November 20, 2006: | $123,919.06 | |
Worst Monthly Percentage Draw-down: | -9.08% (April 2005) | |
Worst peak-to-valley Draw-down: | -31.04% (November 2004 to October 2006) |
The Dunn Series Class 1 performance table sets forth the actual performance of the Dunn Series Class 1. Actual gross trading performance (gross realized and unrealized gain/loss before deduction for trading commissions and fees, management fees, any other expenses, and before addition of interest income) is adjusted for the trading expenses, management fees, initial service fees, on-going service fees, and interest income of the Dunn Series Class 1 of The Frontier Fund. These items, as an annualized percentage calculated monthly on the adjusted beginning of month net asset value are:
| • | Brokerage Commissions and trading fees: 1.34% |
| • | Management fees: 0.0% |
| • | Initial service fees and on-going service fees: 3.0% |
An incentive fee of 25% of New High Net Trading Profits (as defined), earned monthly, is calculated in the pro forma. Also, any interest income in excess of an annualized rate of 2%, based upon the 90-day Treasury Bill rate for each month to the adjusted beginning of month net asset value, is credited.
Draw-down means losses experienced by the pool over a specified period.
Worst peak to valley draw-down means the greatest cumulative percentage decline in month-end net asset value due to losses sustained by the pool during any period in which the initial month-end net asset value is not equaled or exceeded by a subsequent month-end net asset value.
51
Table of Contents
PAST PERFORMANCE OF DUNN SERIES CLASS 2
The Capsule Performance Table which follows sets forth the actual past performance of the Dunn Series Class 2 Units during the period covered by the table.PAST PERFORMANCE IS NOT NECESSARILY INDICATIVE OF FUTURE RESULTS.
— The Dunn Series is Closed —
| Month | 2006 | 2005 | 2004 | ||||||
January | -6.37 | % | -3.84 | % | |||||
February | -2.53 | % | -6.16 | % | |||||
March | 9.47 | % | -4.37 | % | |||||
April | 10.67 | % | -8.86 | % | |||||
May | -5.33 | % | 13.83 | % | |||||
June | -5.59 | % | 9.88 | % | |||||
July | -2.81 | % | -4.48 | % | |||||
August | -1.80 | % | -5.22 | % | |||||
September | -2.04 | % | -5.62 | % | -5.15 | % | |||
October | -2.88 | % | 2.00 | % | 9.31 | % | |||
November | 2.08 | % | 3.34 | % | 6.84 | % | |||
December | -3.79 | % | -4.51 | % | |||||
Year | -8.40 | % | -14.77 | % | 5.77 | % |
Name of pool: | The Frontier Fund | |
This pool is a multi-advisor advisor pool as defined in CFTC Regulation Section 4.10(d)(2). | ||
Name of Series: | Dunn Series Class 2 | |
Inception of Trading of Dunn Series Class 2: | September 24, 2004 | |
Aggregate Gross Capital Subscriptions for Dunn Series Class 2 as of November 30, 2006: | $2,150,563.86 | |
Net Asset Value of Dunn Series Class 2 as of November 30, 2006: | $115,182.19 | |
Worst Monthly Percentage Draw-down: | -8.86% (April 2005) | |
Worst peak-to-valley Draw-down: | -26.97% (November 2004 to October 2006) |
The Dunn Series Class 2 performance table sets forth the actual performance of the Dunn Series Class 2. Actual gross trading performance (gross realized and unrealized gain/loss before deduction for trading commissions and fees, management fees, any other expenses, and before addition of interest income) is adjusted for the trading expenses, management fees, initial service fees, on-going service fees, and interest income of the Dunn Series Class 2 of The Frontier Fund. These items, as an annualized percentage calculated monthly on the adjusted beginning of month net asset value are:
| • | Brokerage Commissions and trading fees: 1.34% |
| • | Management fees: 0.0% |
An incentive fee of 25% of New High Net Trading Profits (as defined), earned monthly, is calculated in the pro forma. Also, any interest income in excess of an annualized rate of 2%, based upon the 90-day Treasury Bill rate for each month to the adjusted beginning of month net asset value, is credited.
Draw-down means losses experienced by the pool over a specified period.
Worst peak to valley draw-down means the greatest cumulative percentage decline in month-end net asset value due to losses sustained by the pool during any period in which the initial month-end net asset value is not equaled or exceeded by a subsequent month-end net asset value.
52
Table of Contents
Experience of, and Past Performance of Other Pools Sponsored by, the Managing Owner and The Bornhoft Group
The Managing Owner currently does not sponsor any other commodity pools or commodity funds. Mr. Bornhoft, Mr. Montano, Mr. Bell and Mr. Bales, however, are affiliated with The Bornhoft Group, which currently is the general partner/managing owner and CPO of non-public commodity funds.
Established in 1985, The Bornhoft Group Corporation is one of the oldest alternative investment advisors in the investment industry. The principals of The Bornhoft Group designed their first multi-manager futures fund in 1983. The Bornhoft Group (its principals, predecessors and affiliates) have financially engineered and managed alternative investment portfolios and/or Structured Derivative Products for approximately twenty (20) of the largest Banking organizations in the world, multi-billion dollar Public Pension Plans, as well as several Fortune 500 Corporations. The Bornhoft Group’s current profile includes the following: a) presently manages eight (8) futures and hedge funds, b) presently has over $750 million under its direction and management, c) has allocated approximately $1.4 billion to Managed Futures Advisors.
Set forth on the following page (in Capsule A) is the performance record of trading from January 2000 through November 2006 for the non-public commodity funds for which The Bornhoft Group acts as the general partner and CPO.
The Bornhoft Group has established and managed more than a dozen managed futures funds since 1985. These managed futures funds have varied in type and structure from single advisor funds to multiple advisor funds. The funds presented in Capsule A include several single advisor funds designed for “emerging advisors,” funds developed for a few established advisors and a few multiple advisor funds. Each of the listed funds is only available to accredited (high net worth) investors.
The Bornhoft Group has experienced numerous performance cycles within the managed futures industry over the past two decades. These performance cycles have ranged from difficult losing periods to exceptional performance periods. Specific to The Bornhoft Group funds, the largest losing time periods documented in Capsule A represent some of these most difficult times.
Three of the funds presented in Capsule A have had monthly drawdowns in excess of 10% and three of the funds have had peak-to-valley drawdowns in excess of 25%.
Since the investment mandate and expenses of each fund is different from one another and none of the listed funds have the same investment objective or expenses as the Trust, performance shown in Capsule A is not necessarily a reliable indicator of future results for the Trust.
THE INFORMATION IN CAPSULE A HAS NOT BEEN AUDITED. HOWEVER, THE MANAGING OWNER REPRESENTS AND WARRANTS THAT THE CAPSULE IS COMPLETE AND ACCURATE IN ALL MATERIAL RESPECTS.
THIS POOL HAS A LIMITED PERFORMANCE HISTORY.
53
Table of Contents
CAPSULE A
CAPSULE PERFORMANCE OF OTHER POOLS OPERATED BY THE BORNHOFT GROUP
CORPORATION AND AFFILIATE(S)
(SEE ACCOMPANYING NOTES)
| Name of Fund | Inception of Trading | Gross Aggregate Subscriptions | Current Total NAV | Worst Monthly % Drawdown | Worst Peak-to-Valley Drawdown | 2001 | 2002 | 2003 | 2004 | 2005 | 2006† | |||||||||||||
Privately Offered Single-Advisor Funds | ||||||||||||||||||||||||
Ascent Growth Fund, Ltd.* | 9/98 | $ | 747,052 | $ | 670,538 | (3.07)% 2/01 | (4.83)% 1/01-3/01 | 5.78% | 15.93% | 4.91% | 6.40% | (0.84)% | 13.74% | |||||||||||
Chesapeake LP* | 5/96 | $ | 58,679,766 | $ | 16,282,700 | (11.10)% 11/01 | (25.64)% 3/01-4/02 | (14.31)% | 11.34% | 22.28% | 6.72% | (4.03)% | 6.58% | |||||||||||
Privately Offered Multi-Advisor Funds | ||||||||||||||||||||||||
Legends Fund LP (Series A)* | 5/92 | $ | 2,861,144 | $ | 3,382,002 | (2.03)% 11/01 | (2.72)% 2/05-5/05 | 10.27% | 5.66% | 12.45% | 4.65% | 10.31% | 12.31% | |||||||||||
Legends Fund LP (Series B)* | 1/03 | $ | 1,644,016 | $ | 1,917,881 | (3.56)% 10/03 | (4.36)% 2/05-5/05 | N/A | N/A | 7.82% | 5.94% | 11.65% | 10.03% | |||||||||||
Legends Fund LP (Series C)* | 12/01 | $ | 155,462 | $ | 176,948 | (7.12)% 5/06 | (8.95)% 4/06-6/06 | 4.96% | (5.28)% | 30.98% | 9.07% | 13.01% | 6.06% | |||||||||||
Legends Fund LP (Series D)* | 8/01 | $ | 3,526,886 | $ | 3,929,797 | (1.59)% 6/04 | (3.41)% 3/04 –9/04 | 1.49% | 7.88% | 7.20% | 2.32% | 7.06% | 25.89% | |||||||||||
PGA Growth Fund, LP (Series F)* | 6/01 | $ | 21,339,155 | $ | 10,445,161 | (4.57)% 10/01 | (7.80)% 8/01-10/01 | 23.83% | 49.94% | 34.21% | 1.04% | 1.82% | (3.00)% | |||||||||||
PGA Growth Fund, LP (Series S)* | 8/01 | $ | 27,543,071 | $ | 5,047,389 | (2.47)% 08/02 | (4.76)% 3/06-11/06 | 12.28% | 6.66% | 6.68% | 2.80% | 2.45% | (3.09)% | |||||||||||
Closed Funds | ||||||||||||||||||||||||
Ascent Fund, Ltd. (Cls’d 9/04) | 4/95 | N/A | N/A | (3.94)% 2/01 | (11.20)% 3/03-9/04 | 10.66% | (4.32)% | 1.50% | (8.03)% | N/A | N/A | |||||||||||||
BG Strategic Fund LP (Series C) (Cls’d 9/04) | 5/03 | N/A | N/A | (3.54)% 7/03 | (10.11)% 3/03-8/04 | N/A | N/A | (6.94)% | (2.37)% | N/A | N/A | |||||||||||||
BG Strategic Fund LP (Series FOF) (Cls’d 9/04) | 2/03 | N/A | N/A | (4.61)% 7/03 | (12.76)% 1/03-8/04 | N/A | N/A | (10.11)% | (2.05)% | N/A | N/A | |||||||||||||
MAR Trading Advisor Index Fund LP (Cls’d 8/01) | 8/97 | N/A | N/A | (6.31)% 4/01 | (6.36)% 3/01-6/01 | (0.11)% | N/A | N/A | N/A | N/A | N/A | |||||||||||||
Emerald Masters LP (Cls’d 9/02) | 7/98 | N/A | N/A | (2.28)% 2/01 | (15.95)% 2/00-8/02 | (3.37)% | (2.19)% | N/A | N/A | N/A | N/A | |||||||||||||
BG Chesapeake 2XL Fund LP (Cls’d 12/02) | 1/99 | N/A | N/A | (18.52)% 11/01 | (40.86)% 3/01-4/02 | (25.46)% | 19.01% | N/A | N/A | N/A | N/A | |||||||||||||
BG Strategic Fund LP (Series B) (Cls’d 9/03) | 2/03 | N/A | N/A | (5.87)% 7/03 | (11.88)% 1/03-9/03 | N/A | 33.31% | (11.53)% | N/A | N/A | N/A | |||||||||||||
APC Fund LP (Cls’d 8/03) | 1/93 | N/A | N/A | (32.17)% 8/02 | (66.98)% 4/00-6/03 | (16.93)% | (42.86)% | (11.05)% | N/A | N/A | N/A | |||||||||||||
Witter & Lester Strategic Equity Fund, Ltd. (Cls’d 4/02) | 1/93 | N/A | N/A | (8.52)% 2/01 | (21.36)% 1/01-1/02 | (18.66)% | 1.77% | N/A | N/A | N/A | N/A | |||||||||||||
| † | Updated November 30, 2006 |
| * | November 2006 estimated |
PAST PERFORMANCE IS NOT NECESSARILY INDICATIVE OF FUTURE RESULTS.
54
Table of Contents
NOTES TO CAPSULE A:
The above capsule information presents the results for each fund. A summary of the significant accounting policies which have been followed in preparing the accompanying capsule performance information. All performance has been prepared on an accrual basis in accordance with accounting principles generally accepted in the Unites States of America.
Worst Monthly Percentage draw-down: Represents the largest loss experienced by the fund in any calendar month expressed as a percentage of the beginning Net Asset Value. The term “draw-down” means losses experienced by the fund over a specified period.
Worst Peak-to-Valley draw-down: Represents the greatest cumulative percentage decline in the month end net asset value due to losses sustained by the fund during any period in which the initial month end Net Asset Value is not equaled or exceeded by a subsequent month end Net Asset Value.
Monthly Rate of Return: The Monthly Rate of Return is computed by dividing the Net Performance (net trading gain or loss less all expenses plus other income) by Adjusted Beginning Equity (end of prior month equity adjusted for additions and redemptions).
Annual Rate of Return: Represents the cumulative compounded rate of return for each year or portion thereof. It is computed by applying successively the respective monthly rate of return for each month beginning with the first month presented in each period and represents the net percentage change since the beginning of the period presented.
55
Table of Contents
Management of the Trust
The Managing Owner will manage each Series’ business and affairs, but will not (except in certain limited, and essentially emergency, situations) direct the trading activities for any Series. The Managing Owner will be responsible for the renewal of the Advisory Agreements with the Trading Advisors, as well as for the selection of additional and/or substitute trading advisors. See “Advisory Agreements.” In addition, the Managing Owner selected the Trustee and is responsible for determining whether to retain or replace the Trustee.
The Managing Owner seeks to provide various fund features including, but not limited to:
| • | Institutional quality asset allocation with institutional pricing; and |
| • | Unit Series and Sub-Classes available for the institutional investor. |
The Managing Owner will be directly responsible for preparing monthly and annual reports to the Limited Owners, filing reports required by the CFTC, the SEC and any other Federal or state agencies or self-regulatory organizations, and calculating the Net Asset Value of each Series and all fees and expenses, if any, to be paid by each Series. The Managing Owner provides suitable facilities and procedures for handling and executing redemptions, exchanges, transfers and distributions (if any), and the orderly liquidation of each Series. The Managing Owner is responsible for selecting the futures commission merchants, over-the-counter foreign currency prime brokers and swap counterparties for each Trading Company.
Retention of Affiliates
The Managing Owner may retain affiliates to provide certain administrative services necessary to the prudent operation of the Trust and each Series so long as the Managing Owner has made a good faith determination that:
| • | the affiliate that it proposes to engage is qualified to perform such services; |
| • | the terms and conditions of the agreement with an affiliate are no less favorable than could be obtained from equally qualified unaffiliated third parties; and |
| • | the maximum period covered by any such agreement shall not exceed one year, and shall be terminable without penalty upon sixty (60) days’ prior written notice by the Trust. |
The fees of any such affiliates will be paid by the Managing Owner or an affiliate.
Notification of Decline in Net Asset Value
If the estimated Net Asset Value per Unit of any Series declines, as of the end of any Business Day, to less than 50% of the Net Asset Value per Unit of that Series as of the end of the immediately preceding Valuation Point, the Managing Owner will notify the Limited Owners of that Series within seven (7) Business Days of such decline. The notice will include a description of the Limited Owners’ voting and redemption rights.
Maximum Contract Term
The Trust or any Series of the Trust is prohibited from entering into any contract with the Managing Owner or its affiliates which has a term of more than one (1) year and which is not terminable by the Trust without penalty upon sixty (60) days’ prior written notice.
The Managing Owner participates in the income and losses of each Series in the proportion which its ownership of General Units bears to the total number of Units of a Series on the same basis as the Limited Owners.
56
Table of Contents
Selection and Replacement of Trading Advisors
The Managing Owner is responsible for the selection, retention and termination of the Trading Advisors on behalf of each Series. The Managing Owner has delegated such responsibility to one of its principals—The Bornhoft Group.
The Bornhoft Group utilizes certain quantitative and qualitative analysis in connection with the identification, evaluation and selection of the Trading Advisors. The Bornhoft Group’s proprietary and commercial analytical software programs and comprehensive trading advisor database provide the quantitative basis for the Trading Advisor selection and portfolio implementation process.
In 1983, the principals of The Bornhoft Group began compiling The Bornhoft Group’s proprietary database of the leading United States and internationally based alternative investment programs. Trading Advisors are monitored and performance data is entered on a daily, monthly, quarterly or bi-annual basis according to internal ranking systems.
The Bornhoft Group’s research department is continually refining ways to assimilate the vast amounts of trading advisor performance data and due-diligence information. The proprietary and commercial database of alternative investment programs is always increasing. Research team members regularly interact with Trading Advisors throughout the due-diligence and monitoring process. Only those programs that have met strict quantitative and qualitative review are considered as potential managers of client assets. Following is a summary of the quantitative and qualitative analysis:
Quantitative Analysis
The Bornhoft Group’s analytical software system applies a variety of statistical measures towards the evaluation of current and historical advisor performance data. Statistical measures include but are not limited to: 1) risk/reward analysis, 2) time window analysis, 3) risk analysis, 4) correlation analysis, 5) statistical overlays and 6) performance cycle analysis.
Qualitative Analysis
Although Quantitative analysis statistically identifies the top performing Trading Advisors, Qualitative analysis plays a major role in the Trading Advisor evaluation and final selection process. Each Trading Advisor The Bornhoft Group monitors initially undergoes extensive Qualitative review by The Bornhoft Group’s research department, as well as continual monitoring. This analysis generally includes, but is not limited to: 1) preliminary information and due-diligence, 2) background review, 3) onsite due-diligence, 4) extensive due diligence questionnaires and 5) written review and periodic updates. This information allows a thorough review of each Trading Advisor’s trading philosophy, trading systems and corporate structure.
Multi-Manager Approach
A multi-manager approach to portfolio management provides diversification of Trading Advisors and access to broader global markets. Multiple Trading Advisors can provide diversification across trading methodologies, trading time horizons, and markets traded. Additionally, multi-manager portfolios tend to provide a greater level of professional management with ongoing risk management and review. The result can be more consistent returns with lower volatility. The overall manager selection and portfolio construction process previously stated is depicted in the following chart:
57
Table of Contents
Accountability
Pursuant to the Trust Act, the Trustee has delegated to the Managing Owner responsibility for the management of the business and affairs of the Trust and each Series, and it has neither a duty to supervise or monitor the Managing Owner’s performance nor liability for the acts or omissions of the Managing Owner. The Trustee retains a statutory fiduciary duty to the Trust only for the performance of the express obligations it retains under the Trust Agreement, which are limited to the making of certain filings under the Trust Act and to accepting service of process on behalf of the Trust in the State of Delaware. The Trustee owes no other duties to the Trust or any Series. The Managing Owner is accountable to each Limited Owner as a fiduciary and must exercise good faith and fairness in all dealings affecting the Trust. Under the Trust Act, if, in law or equity, the Trustee or the Managing Owner has duties (including fiduciary duties) to the Trust or to the Limited Owners, and liabilities relating to those duties, (i) the Trustee and the Managing Owner shall not be liable for their good faith reliance on the provisions of the Trust Agreement, and (ii) the Trustee’s and the Managing Owner’s duties and liabilities may be expanded or restricted by the express provisions of the Trust Agreement. The Managing Owner may not contract away its fiduciary obligations.
Legal Proceedings
If you believe that the Managing Owner has violated its fiduciary duty to the Limited Owners of a Series, you may seek legal relief for yourself or, subject to the satisfaction of certain conditions, may seek on behalf of that Series to recover damages from, or require an accounting by, the Managing Owner. You may have the right to institute legal action on behalf of yourself and all other similarly situated Limited Owners of that Series (a class action), to recover damages from the Managing Owner for violations of fiduciary duties. See “Trust Agreement—Indemnification.” Potential defenses, among others, to any claim by you or another Limited Owner of breach of fiduciary duty include that discretion was reasonably exercised or that the action at issue was contractually authorized. In addition, (i) Limited Owners of a Series may have the right, subject to procedural and jurisdictional requirements, to bring a class action against a Series in Federal court to enforce their rights under the Federal securities and commodities laws; and (ii) Limited Owners of a Series who have suffered losses in connection with the purchase or sale of their Units in that Series may be able to recover such losses from the Managing Owner where the losses result from a violation by the Managing Owner of the antifraud provisions of the Federal securities and commodities laws.
Reparations and Arbitration Proceedings
Limited Owners of a Series also have the right to institute a reparations proceeding before a CFTC administrative law judge against the Managing Owner which is a registered CPO, the Futures Clearing Brokers which are registered futures commission merchants, or those Trading Advisors of that Series which are registered commodity trading advisors under the CE Act, and the rules promulgated thereunder, as well as the right to initiate arbitration proceedings in lieu thereof.
Basis for Liability
Potential investors should be aware, however, that certain provisions in the Advisory Agreements, the Brokerage Agreements and the Trust Agreement generally make it more difficult to establish a basis for liability against any Trading Advisor, any Clearing Broker and the Managing Owner than it would be absent such provisions, including (a) each Advisory Agreement gives broad discretion to each Trading Advisor; and (b) each Advisory Agreement, the Brokerage Agreement and the Trust Agreement contain exculpatory and indemnity provisions (see “Advisory Agreement,” “Brokerage Agreement” and “Trust Agreement”). Payment of any indemnity to any such person by the Trust or any Series of the Trust pursuant to such provisions would reduce the assets of the Series affected. The Managing Owner does not carry insurance covering such potential losses, and the Trust carries no liability insurance covering its potential indemnification exposure.
58
Table of Contents
Because the foregoing summary involves developing and changing areas of the law, Limited Owners who believe that the Trustee, the Managing Owner, any Clearing Broker or any Trading Advisor may have violated applicable law should consult with their own counsel as to their evaluation of the status of the law at such time.
Minimum Purchase Commitment
The Managing Owner intends to contribute funds to the Trust in order to have a 1% interest in the aggregate capital, profits and losses of all Series and in return will receive Units designated as General Units in the Series in which the Managing Owner invests such funds. The General Units may only be purchased by the Managing Owner and may be subject to no advisory fees or advisory fees at reduced rates. Otherwise, the General Units hold the same rights as the Limited Units. The Managing Owner is required to maintain at least a 1% interest in the aggregate capital, profits and losses of all Series so long as it is acting as the Managing Owner of the Trust. Such contribution was made by the Managing Owner before trading commenced for the Trust and will be maintained throughout the existence of the Trust, and the Managing Owner will make such purchases as are necessary to effect this requirement. In addition to the General Units the Managing Owner receives in respect of its Minimum Purchase Commitment, the Managing Owner may purchase Limited Units in any Series as a Limited Owner. See “The Offering—Initial Offering.” All Units purchased by the Managing Owner are held for investment purposes only and not for resale. As of January 22, 2007, Richard E. Bornhoft, a principal of the Managing Owner, owned 0.01% of the outstanding Units of the Trust. Other than Mr. Bornhoft, no principal of the Managing Owner owns any beneficial interest in the Trust but any of them is free to do so.
Net Worth Commitment
The Managing Owner’s net worth is set forth in its consolidated statements of financial condition on page Fin. - 47 and is in excess of the minimum net worth requirements under the North American Securities Administrators Association Guidelines for Registration of Commodity Pool Programs, or the NASAA Guidelines. The Managing Owner has agreed that so long as the Managing Owner remains the Managing Owner of the Trust, it will not take or voluntarily permit to be taken any affirmative action to reduce the Managing Owner’s net worth below any regulation-required amounts.
THE CLEARING BROKERS AND THE SWAP COUNTERPARTY
UBS Securities, Banc of America Securities and Man Financial have entered into futures brokerage agreements, or each, a Futures Brokerage Agreement, with each Trading Company, and the Managing Owner, acting as agent for Trading Companies which perform trades for the Balanced Series, the Winton Series, the Currency Series, the Graham Series and the Campbell/Graham Series, has entered into a foreign exchange prime brokerage agreement, or a FX Prime Brokerage Agreement, with Deutsche Bank. In addition, the Trading Company which acts for the Long Only Commodity Series has entered into an ISDA Master Agreement including the schedule thereto, the credit support annex and the paragraph 13 thereto, or collectively, the Swap Agreement, with Jefferies. The Futures Brokerage Agreements, the FX Prime Brokerage Agreement and the Swap Agreement are sometimes collectively referred to as the Brokerage Agreements. The Managing Owner, in its sole and absolute discretion, may appoint additional or substitute clearing brokers for each Trading Company. The actual amount of trading conducted by the Trading Companies through each Clearing Broker is determined periodically by the Managing Owner taking into account such factors as (i) “best execution” of transactions, (ii) historical net prices (after markups, markdowns or other transaction-related compensation) on other transactions; (iii) the execution, clearance, and settlement and error-correction capabilities of the Clearing Broker generally and in connection with securities or financial instruments of the types and in the amounts to be bought or sold; (iv) the Clearing Broker’s willingness to commit capital; (v) the Clearing Broker’s reliability and financial stability; (vi) the size of the transaction; (vii) availability of securities to borrow for short sales; and (viii) the market for the security or financial instrument. At any given time, it is possible that certain Clearing Brokers are providing brokerage services for some, all or none of the Trading Companies.
59
Table of Contents
UBS Securities
UBS Securities’ principal business address is 677 Washington Boulevard, Stamford, Connecticut 06901. UBS Securities is a futures clearing broker for each Trading Company. UBS Securities is registered in the U.S. with the NASD as a Broker Dealer and with the CFTC as a futures commission merchant. UBS Securities is a member of various U.S. futures and securities exchanges.
UBS Securities was involved in the 2003 Global Research Analyst Settlement. This settlement is part of the global settlement that UBS Securities and nine other firms have reached with the SEC, NASD, NYSE and various state regulators. As part of the settlement, UBS Securities has agreed to pay $80,000,000 divided among retrospective relief, for procurement of independent research and for investor education. UBS Securities has also undertaken to adopt enhanced policies and procedures reasonably designed to address potential conflicts of interest arising from research practices.
Further, UBS Securities, like most large, full service investment banks and broker-dealers, receives inquiries and is sometimes involved in investigations by the SEC, NYSE and various other regulatory organizations and government agencies. UBS Securities fully cooperates with the authorities in all such requests. UBS Securities regularly reports to the SEC on Form B-D investigations that result in orders. These reports are publicly available.
UBS Securities will act only as clearing broker for each Trading Company and as such will be paid commissions for executing and clearing trades on behalf of each Trading Company. UBS Securities has not passed upon the adequacy or accuracy of this Prospectus. UBS Securities neither will act in any supervisory capacity with respect to the Managing Owner or the Trading Advisors nor participate in the management of the Trust, the Managing Owner or the Trading Companies.
Banc of America Securities
Banc of America Securities’ principal business address is 9 West 57th Street, New York, New York, 10019. Banc of America Securities is a futures clearing broker for each Trading Company. Banc of America Securities is registered in the U.S. with the NASD as a Broker Dealer and with the CFTC as a futures commission merchant. Banc of America Securities is a member of various U.S. futures and securities exchanges.
Banc of America Securities did not sponsor or organize the Trust or any Trading Company and is not responsible for the activities of the Managing Owner or the Trading Advisors.
Man Financial
Man Financial is registered under the CE Act, as amended, as a futures commission merchant and a CPO, and is a member of the NFA in such capacities. Man Financial, which is part of the Man Group of companies, is a member of all major U.S. futures exchanges. Man Financial’s main office is located at 717 Fifth Avenue, 9th Floor, New York, New York 10022-8101. Man Financial’s telephone number at such location is (212) 589-6200.
At any given time, Man Financial is involved in numerous legal actions and administrative proceedings, which in the aggregate, are not, as of the date of this Prospectus, expected to have a material effect upon its condition, financial or otherwise, or to the services it will render to the Trust or any Trading Company. There have been no material, administrative, civil or criminal proceedings pending, on appeal or concluded against Man Financial or its principals within the five years preceding the date of this Prospectus, except that Man Financial has been sued by the Receiver for Philadelphia Alternate Asset Partnership, or PAAF, and associated entities for common law negligence, common law fraud, violations of the CE Act and RICO violations, or the Litigation. The Receiver’s claims for damages are not quantified in the Complaint, but are believed to be substantial. Man Financial has informed the Managing Owner that in acting as clearing broker for PAAF it was not responsible for its losses and, among other things, has brought in a number of third party defendants. Accordingly, Man
60
Table of Contents
Financial will deny the material allegations of the Complaint and will otherwise vigorously defend the Litigation. Further, the outcome of the Litigation should not materially affect Man Financial or its ability to perform as clearing broker for the Trust. The CFTC is also investigating the events involving PAAF’s losses and Man Financial’s relationship to PAAF. To date, the CFTC has not brought any action against Man Financial.
Man Financial acts only as clearing broker for the Trust and the Trading Companies and as such is paid commissions for executing and clearing trades on behalf of the Trust and the Trading Companies. Man Financial has not passed upon the adequacy or accuracy of this Prospectus. Man Financial neither will act in any supervisory capacity with respect to the Managing Owner nor participate in the management of the Managing Owner, the Trust or the Trading Companies. Therefore, prospective investors should not rely on Man Financial in deciding whether or not to participate in the Trust.
Deutsche Bank
Deutsche Bank AG, London Branch is the London branch of Deutsche Bank AG. Deutsche Bank AG is a banking company with limited liability incorporated under the laws of the Federal Republic of Germany.
Deutsche Bank AG is the parent company of the Deutsche Bank Group, consisting of banks, capital market companies, fund management companies and a property finance company, installment financing companies, research and consultancy companies and other domestic and foreign companies. The Deutsche Bank Group has branches and offices engaged in banking business and other financial businesses worldwide.
Jefferies Financial Products, LLC
Operating from Stamford, Connecticut, Jefferies was founded in 2003 by an experienced team of commodity professionals. Jefferies is not a futures commission merchant and is not regulated by the CFTC. Jefferies is a wholly owned subsidiary of Jefferies Group, Inc., or Jefferies Group (NYSE: JEF), a global investment bank and institutional securities firm. Swap transactions with Jefferies are covered by a parent guarantee from Jefferies Group, which has a long-term unsecured debt rating of BBB from Standard & Poor’s Corporation and Baa1 from Moody’s Investors Services, Inc.
Jefferies Group controls numerous operating companies including Jefferies and various other US and foreign financial institutions. Many aspects of these businesses involve substantial risks of liability. Certain affiliates are involved in a number of judicial and regulatory matters arising out of the conduct of their businesses. Investors and prospective investors are invited to view the disclosure documents that Jefferies Group has filed with the SEC, which are publicly available on the SEC’s web site.
ACTUAL AND POTENTIAL CONFLICTS OF INTEREST
Some of the parties involved with the operation and/or management of the Trust, including the Managing Owner, have other relationships that may create disincentives to act in the best interests of the Trust and its Limited Owners. The Managing Owner may have conflicts of interest in relation to its duties to the Trust. However, the Managing Owner shall, at all times, pay regard to its obligations to act in the best interests of the Trust and the Managing Owner will ensure that all such potential conflicts of interest are resolved fairly and in the interests of Unit holders.
In evaluating these conflicts of interest, you should be aware that the Managing Owner has a responsibility to investors to exercise good faith and fairness in all dealings affecting the Trust. The fiduciary responsibility of a managing owner to investors is a developing and changing area of the law and if you have questions concerning the duties of the Managing Owner, you should consult with your counsel. See “FIDUCIARY RESPONSIBILITIES,” above.
61
Table of Contents
Other Activities
Because the Managing Owner may engage from time to time in other activities in the normal course of business, including acting as managing owner to other similar statutory trusts, the Managing Owner’s and its officers’ and employees’ full efforts will not be devoted to the activities of the Trust. This may create a conflict of interest with respect to the Managing Owner’s and its principals’ and employees’ commitment to the Trust of its resources. The Managing Owner, however, intends to devote sufficient time to Trust activities to properly manage the Trust consistent with its fiduciary duties.
Ancillary Business Arrangements Between the Managing Owner and Certain Trading Advisors
The Managing Owner and some of the Trading Advisors may have business arrangements between them that do not directly relate to the Trust’s business. For example, the Managing Owner or its affiliates may sponsor other investment funds which employ one or more of the Trading Advisors. In addition, CTS Capital Management, LLC, one of the Emerging Managers for the Balanced Series, is affiliated with Brian Bell, one of the principals of The Bornhoft Group which is a principal of the Managing Owner. Furthermore, Bornhoft Group Securities Corporation, an affiliate of the Managing Owner, currently acts as the selling agent for an investment fund operated by Phoenix Global Advisors, LLC, one of the Trading Advisors, and may enter into similar arrangements with other Trading Advisors. These business arrangements may present a disincentive for the Managing Owner to terminate such Trading Advisors even though termination may be in the best interest of the Series for which they trade.
Trading For Own Account, the Accounts of Others
The officers, directors and employees of the Managing Owner and the Trading Advisors may from time to time trade in commodities for their own accounts. Thus, the Managing Owner and the Trading Advisors may effect transactions for themselves, their officers, directors, employees or customers, agents or correspondents (or employees of such agents or correspondents). These transactions might be effected when similar Series trades are not executed or are executed at less favorable prices, or these persons or entities might compete with a Series in bidding or offering on purchases or sales of contracts without knowing that the Series also is so bidding or offering. Although Limited Owners will not be permitted to inspect such persons’ trading records in light of their confidential nature, the Managing Owner will have access to these records.
Management of Other Accounts by the Trading Advisors
The Trading Advisors are permitted, and have specifically indicated their intention, to manage and trade accounts for other investors (including other commodity pools) and to trade commodities for their own accounts and the accounts of their principals. They will continue to be free to do so, so long as each Trading Advisor’s ability to carry out its obligations and duties to the Series for which it has trading responsibility under the Advisory Agreements is not materially impaired thereby. See “Advisory Agreements.” The Trading Advisors might compete with the Series in bidding or offering on purchases or sales of contracts through the same or a different trading program than that to be used for a Series, and there can be no assurance that any such trades will be consistent with those of the Series, or that the Trading Advisors or their principals will not be the other party to a trade entered into by any Series. In addition, certain affiliates of the Trading Advisors operate commodity pools that may compete with the Series. Pursuant to the Advisory Agreements, each Trading Advisor must treat the Series for which it has trading responsibility equitably and provide the Managing Owner with access to information so that the Managing Owner can be assured of such equitable treatment. Limited Owners, however, have no inspection rights. See “Advisory Agreements.” In addition, because the financial incentives of a Trading Advisor in other accounts managed by it may exceed any incentives payable by a Series, the Trading Advisor might have an incentive to favor those accounts over a Series in trading. The Trading Advisor’s management of other clients’ accounts may increase the level of competition among other clients and a Series for the execution of the same or similar transactions and affect the priority of order entry. All open positions held in the accounts owned or controlled by a Trading Advisor and its principals will be aggregated for purposes of applying
62
Table of Contents
speculative position limits in the United States. Thus, a Series might be unable to enter into or hold certain positions if such positions, when added to contracts held for other accounts of that Series’ Trading Advisor or for the Trading Advisor itself, would exceed the applicable speculative position limits.
No Distributions
The Managing Owner has discretionary authority over all distributions made by the Trust. In view of the Trust’s objective of seeking significant capital appreciation, the Managing Owner currently does not intend to make any distributions. Greater management fees will be generated to the benefit of the Managing Owner and the Trading Advisors if the Trust’s assets are not reduced by distributions to the Limited Owners.
Selling Agents
The Selling Agents, including Bornhoft Group Securities Corporation, may receive prepaid initial service fees and on-going service fees with respect to Units sold by them. Therefore, they may have a conflict of interest in advising investors whether to purchase or redeem Units. Since the Managing Owner is affiliated with Bornhoft Group Securities Corporation, the Managing Owner has a conflict of interest in selecting Selling Agents and its pecuniary interest in selecting Bornhoft Group Securities Corporation as a Selling Agent, thereby increasing the compensation payable to its affiliate.
Exchange Committees And Industry Associations
Officers, directors and employees of the Managing Owner, the Trading Advisors, the Clearing Brokers and their respective affiliates from time to time may serve on various committees and boards of United States futures exchanges and the NFA and assist in making rules and policies of those exchanges and the NFA. In such capacity they have a fiduciary duty to the exchanges on which they serve and the NFA and are required to act in the best interests of such organizations, even if such action may be adverse to the interests of the Trust.
Incentive Fees
The incentive fee arrangement between each Series of Units, the Managing Owner and the Trading Advisors may create an incentive for the Trading Advisors to make trading decisions that are more speculative or subject to a greater risk of loss than would be the case if no such arrangement existed. Because the Managing Owner charges each Series an incentive fee which it uses to pay the Trading Advisor or Trading Advisors for such Series, it has a conflict of interest between its duty to act in the best interests of each Series and its pecuniary interest in selecting Trading Advisors which charge lower rates of incentive fees, therefore increasing the portion of the incentive fees retained by the Managing Owner.
Unified Counsel
In connection with this offering, the Trust and the Managing Owner have been represented by unified counsel. To the extent that this offering could benefit by further independent review, such benefit will not be available in this offering.
63
Table of Contents
PROJECTED TWELVE-MONTH “BREAK-EVEN” ANALYSIS
THE PROJECTED TWELVE MONTH BREAK-EVEN ANALYSIS FOR EACH SERIES OF UNITS IS SET FORTH IN THE APPENDIX TO THIS PROSPECTUS FOR SUCH SERIES OF UNITS.
Summary Table of Fees and Expenses
| Amount of Expense† | ||||||||||||||||||||
Balanced Series-1 | Balanced Series-2‡ | Balanced Series-1a | Balanced Series-2a‡ | |||||||||||||||||
| $ | % | $ | % | $ | % | $ | % | |||||||||||||
Syndication and Selling Expense | 0.00 | 0.00 | 0.00 | 0.00 | 0.00 | 0.00 | 0.00 | 0.00 | ||||||||||||
Trust Operating Expenses | 0.00 | 0.00 | 0.00 | 0.00 | 0.00 | 0.00 | 0.00 | 0.00 | ||||||||||||
Management Fee | 5.00 | 0.50 | 5.00 | 0.50 | 10.00 | 1.00 | 10.00 | 1.00 | ||||||||||||
Service Fee | 30.00 | 3.00 | 0.00 | 0.00 | 30.00 | 3.00 | 0.00 | 0.00 | ||||||||||||
Incentive Fee (expressed as a percentage of New High Net Trading Profits) | N/A | * | 25.00 | N/A | * | 25.00 | N/A | * | 25.00 | N/A | * | 25.00 | ||||||||
Interest income** | 49.00 | 4.90 | 49.00 | 4.90 | 49.00 | 4.90 | 49.00 | 4.90 | ||||||||||||
Brokerage Commissions and Trading Fees*** | 16.40 | 1.64 | 16.40 | 1.64 | 25.80 | 2.58 | 25.80 | 2.58 | ||||||||||||
| Amount of Expense† | ||||||||||||||||||||
Graham Series-1 | Graham Series-2‡ | Winton Series-1 | Winton Series-2‡ | |||||||||||||||||
| $ | % | $ | % | $ | % | $ | % | |||||||||||||
Syndication and Selling Expense | 0.00 | 0.00 | 0.00 | 0.00 | 0.00 | 0.00 | 0.00 | 0.00 | ||||||||||||
Trust Operating Expenses | 0.00 | 0.00 | 0.00 | 0.00 | 0.00 | 0.00 | 0.00 | 0.00 | ||||||||||||
Management Fee | 25.00 | 2.50 | 25.00 | 2.50 | 20.00 | 2.00 | 20.00 | 2.00 | ||||||||||||
Service Fee | 30.00 | 3.00 | 0.00 | 0.00 | 30.00 | 3.00 | 0.00 | 0.00 | ||||||||||||
Incentive Fee (expressed as a percentage of New High Net Trading Profits) | N/A | * | 20.00 | N/A | * | 20.00 | N/A | * | 20.00 | N/A | * | 20.00 | ||||||||
Interest income** | 49.00 | 4.90 | 49.00 | 4.90 | 49.00 | 4.90 | 49.00 | 4.90 | ||||||||||||
Brokerage Commissions and Trading Fees*** | 14.90 | 1.49 | 14.90 | 1.49 | 20.80 | 2.08 | 20.80 | 2.08 | ||||||||||||
| Amount of Expense† | ||||||||||||||||||||
| Campbell/Graham Series-1 | Campbell/Graham Series-2‡ | Currency Series-1 | Currency Series-2‡ | |||||||||||||||||
| $ | % | $ | % | $ | % | $ | % | |||||||||||||
Syndication and Selling Expense | 0.00 | 0.00 | 0.00 | 0.00 | 0.00 | 0.00 | 0.00 | 0.00 | ||||||||||||
Trust Operating Expenses | 0.00 | 0.00 | 0.00 | 0.00 | 0.00 | 0.00 | 0.00 | 0.00 | ||||||||||||
Management Fee | 25.00 | 2.50 | 25.00 | 2.50 | 20.00 | 2.00 | 20.00 | 2.00 | ||||||||||||
Service Fee | 30.00 | 3.00 | 0.00 | 0.00 | 30.00 | 3.00 | 0.00 | 0.00 | ||||||||||||
Incentive Fee (expressed as a percentage of New High Net Trading Profits) | N/A | * | 20.00 | N/A | * | 20.00 | N/A | * | 20.00 | N/A | * | 20.00 | ||||||||
Interest income** | 49.00 | 4.90 | 49.00 | 4.90 | 49.00 | 4.90 | 49.00 | 4.90 | ||||||||||||
Brokerage Commissions and Trading Fees*** | 13.70 | 1.37 | 13.70 | 1.37 | 7.50 | 0.75 | 7.50 | 0.75 | ||||||||||||
64
Table of Contents
| Amount of Expense† | ||||||||||||||||||||
| Long Only Commodity Series-1 | Long Only Commodity Series-2‡ | Long/Short Commodity Series-1 | Long/Short Commodity Series-2‡ | |||||||||||||||||
| $ | % | $ | % | $ | % | $ | % | |||||||||||||
Syndication and Selling Expense | 0.00 | 0.00 | 0.00 | 0.00 | 0.00 | 0.00 | 0.00 | 0.00 | ||||||||||||
Trust Operating Expenses | 0.00 | 0.00 | 0.00 | 0.00 | 0.00 | 0.00 | 0.00 | 0.00 | ||||||||||||
Management Fee | 20.00 | 2.00 | 20.00 | 2.00 | 35.00 | 3.50 | 35.00 | 3.50 | ||||||||||||
Service Fee | 20.00 | 2.00 | 0.00 | 0.00 | 30.00 | 3.00 | 0.00 | 0.00 | ||||||||||||
Incentive Fee (expressed as a percentage of New High Net Trading Profits) | N/A | * | 0.00 | N/A | * | 0.00 | N/A | * | 20.00 | N/A | * | 20.00 | ||||||||
Interest income** | 49.00 | 4.90 | 49.00 | 4.90 | 49.00 | 4.90 | 49.00 | 4.90 | ||||||||||||
Brokerage Commissions and Trading Fees*** | 7.50 | 0.75 | 7.50 | 0.75 | 20.60 | 2.06 | 20.60 | 2.06 | ||||||||||||
| Amount of Expense† | ||||||||||
| Managed Futures Index Series-1 | Managed Futures Index Series-2‡ | |||||||||
| $ | % | $ | % | |||||||
Syndication and Selling Expense | 0.00 | 0.00 | 0.00 | 0.00 | ||||||
Trust Operating Expenses | 0.00 | 0.00 | 0.00 | 0.00 | ||||||
Management Fee | 20.00 | 2.00 | 20.00 | 2.00 | ||||||
Service Fee | 20.00 | 2.00 | 0.00 | 0.00 | ||||||
Incentive Fee (expressed as a percentage of New High Net Trading Profits) | N/A | * | 0.00 | N/A | * | 0.00 | ||||
Interest income** | 49.00 | 4.90 | 49.00 | 4.90 | ||||||
Brokerage Commissions and Trading Fees*** | 12.00 | 1.20 | 12.00 | 1.20 | ||||||
| † | The dollar value for each fee and expense presented is calculated on the basis of a $1,000 investment in the Trust. |
| ‡ | Class 2 Units may only be offered to investors who are represented by approved Selling Agents who are directly compensated by the investor for services rendered in connection with an investment in the Trust (such arrangements commonly referred to as “wrap-accounts”). |
| * | Because the incentive fee is based upon New High Net Trading Profits, it is impossible to estimate a dollar value for such fee. |
| ** | With respect to the Balanced Series, Graham Series, Winton Series, Campbell/Graham Series, Currency Series, Long Only Commodity Series, Long/Short Commodity Series and Managed Futures Index Series, interest income is currently estimated at 4.90%. With respect to the Graham Series, Winton Series, Campbell/Graham Series, Currency Series and the Class 1 and Class 2 of the Balanced Series, the first two percent (2.0%) of interest income earned per annum by the Trust on each Series will be paid to the Managing Owner. In addition, if interest rates fall below 0.75% (calculated daily based on each Series’ Net Asset Value), the Managing Owner will be paid the difference between the Trust’s annualized income interest and 0.75%. Interest income above two percent (2.0%) per Series (calculated daily based on each Series’ Net Asset Value) is retained by the Trust. With respect to the Long Only Commodity Series, Long/Short Commodity Series, Managed Futures Index Series and the Class 1a and Class 2a of the Balanced Series, twenty percent (20%) of interest income earned per annum by the Trust will be paid to the Managing Owner, and the remaining eighty percent (80%) of interest income earned per annum by the Trust will be retained by the Trust. |
| *** | The amount of brokerage commissions and trading fees to be incurred will vary on a Series by Series basis. Although the actual rates of brokerage commissions and transaction related fees and expenses are the same for all Trading Advisors, the total amount of brokerage commissions and trading fees varies from Series to Series based upon the trading frequency of such Series’ Trading Advisor (or Trading Advisors, in the case of the Balanced Series, Campbell/Graham Series, Currency Series and Long/Short Commodity Series) and the types of instruments traded. The estimates presented in the table above are prepared using historical data about the Trading Advisors’ trading activities. |
65
Table of Contents
Charges to be Paid by the Trust
Management Fee
Each Series of Units will pay to the Managing Owner a monthly management fee equal to a certain percentage of such Series’ Net Asset Value. The Managing Owner may pay all or a portion of such management fees to the Trading Advisor(s) for such Series and may retain between 0% and 0.5% of such Series’ Net Asset Value paid by such Series. For the actual percentage of the assets of a Series payable to the Managing Owner as a management fee, please see the Appendix for such Series. The Managing Owner will reimburse any of the Series of the Trust for any management fees charged to such Series exceeding 6% of the assets of the Series.
For purposes of calculating the management fee payable to the Managing Owner, the Net Asset Value of a Series will be determined before reduction for any management fees accrued, incentive fees accrued or extraordinary fees and expenses accrued as of such day-end and before giving effect to any capital contributions made and any distributions or redemptions accrued during or as of such day-end. For a description of the calculation of the Net Asset Value of a Series, please see “Summary of Agreements—Trust Agreement—Net Asset Value,” below.
Investments made by the Managing Owner, a Trading Advisor or their respective employees, family members and affiliates may, in the sole and absolute discretion of the Managing Owner, be charged no management fees or management fees at reduced rates.
Incentive Fee
In addition, each Series (other than the Balanced Series, the Campbell/Graham Series, the Currency Series and the Long/Short Commodity Series) will pay to the Managing Owner an incentive fee of a certain percentage (between 0% and 25%) of “New High Net Trading Profits” generated by such Series, including realized and unrealized gains and losses thereon, as of the close of business on the last day of each calendar month or quarter, or the Incentive Measurement Date. Because the Balanced Series, the Campbell/Graham Series, the Currency Series and the Long/Short Commodity Series will employ multiple Trading Advisors, such Series will pay the Managing Owner a monthly or quarterly incentive fee calculated on a Trading Advisor by Trading Advisor basis. It is therefore possible that in any given period the Balanced Series, the Campbell/Graham Series, the Currency Series and the Long/Short Commodity Series may pay incentive fees to one or more Trading Advisors while such Series as a whole experiences losses. The fee will accrue monthly. The Managing Owner will pay all or a portion of such incentive fees to the Trading Advisor(s) for such Series and may retain between 0% and 10% of the New High Net Trading Profits paid by each Series. For the actual percentage of the New High Net Trading Profits of a Series payable to the Managing Owner as an incentive fee, please see the Appendix for such Series.
For example, if you invest in a Series that is charged an incentive fee of 20% of “New High Net Trading Profits” and such Series achieves “New High Net Trading Profits” of $100,000 in a quarter, such Series will pay to the Managing Owner an incentive fee of $20,000 in such quarter. The Managing Owner will then pay all or a portion of such amount to the Trading Advisor for such Series.
“New High Net Trading Profits” (for purposes of calculating the Managing Owner’s incentive fees) will be computed as of the Incentive Measurement Date and will include such profits (as outlined below) since the Incentive Measurement Date of the most recent preceding calendar month or quarter for which an incentive fee was earned (or, with respect to the first Incentive Fee, as of the commencement of operations), or the Incentive Measurement Period. New High Net Trading Profits for any Incentive Measurement Period will be the net profits, if any, from the Series’ (or in the case of the Balanced Series, the Campbell/Graham Series, the Currency Series and the Long/Short Commodity Series, the Trading Advisor’s) trading during such period (including (i) gross realized trading profit (loss) plus or minus (ii) the change in unrealized trading profit (loss) on open positions) minus (iii) the fees charged to the Series (or in the case of the Balanced Series, the Campbell/Graham Series, the Currency Series and the Long/Short Commodity Series, such Trading Advisor) by the Managing
66
Table of Contents
Owner and the Clearing Brokers for brokerage commissions, exchange fees, NFA fees, give up fees and other transaction related fees and expenses charged in connection with the Series’ (or in the case of the Balanced Series, the Campbell/Graham Series, the Currency Series and the Long/Short Commodity Series, such Trading Advisor’s) trading activities and on-going service fees for certain administrative services payable to certain Selling Agents and will be calculated after the determination of the Managing Owner’s management fee, but before deduction of any incentive fees payable during the Incentive Measurement Period minus (iv) the “Carryforward Loss” (as defined in the next sentence), if any, as of the beginning of the Incentive Measurement Period. If the total of items (i) through (iv), above, is negative at the end of an Incentive Measurement Period, such amount shall be the Carryforward Loss for the next month or quarter. Carryforward Losses shall (v) be proportionately reduced to reflect reductions in allocated assets. Such proportional reduction shall be based upon the ratio that the reduction of assets allocated away from the Trading Advisor bears to the then current amount of Allocated Assets which the Trading Advisor is managing prior to giving effect to such reduction in the Allocated Assets. New High Net Trading Profits will not include interest earned or credited. New High Net Trading Profits will be generated only to the extent that the Series’ (or in the case of the Balanced Series the Campbell/Graham Series, the Currency Series and the Long/Short Commodity Series, the Trading Advisor’s) cumulative New High Net Trading Profits exceed the highest level of cumulative New High Net Trading Profits achieved by such Series (or in the case of the Balanced Series, the Campbell/Graham Series, the Currency Series and the Long/Short Commodity Series, such Trading Advisor’s) as of a previous Incentive Measurement Date. Except as set forth below, net losses after proportional reduction under clause (v), above from prior quarters must be recouped before New High Net Trading Profits can again be generated. If a withdrawal or distribution occurs at any date that is not an Incentive Measurement Date, the date of the withdrawal or distribution will be treated as if it were an Incentive Measurement Date, but any Incentive Fee accrued in respect of the withdrawn assets on such date shall not be paid to the Managing Owner until the next scheduled Incentive Measurement Date. New High Net Trading Profits for an Incentive Measurement Period shall exclude capital contributions to the Series (or in the case of the Balanced Series, the Campbell/Graham Series, the Currency Series and the Long/Short Commodity Series, such Trading Advisor’s) in an Incentive Measurement Period, distributions or redemptions payable by the Series (or in the case of the Balanced Series, the Campbell/Graham Series, the Currency Series and the Long/Short Commodity Series, such Trading Advisor’s) during an Incentive Measurement Period, as well as losses, if any, associated with redemptions during the Incentive Measurement Period and prior to the Incentive Measurement Date. In calculating New High Net Trading Profits, incentive fees paid for a previous Incentive Measurement Period will not reduce cumulative New High Net Trading Profits in subsequent periods.
Investments made by the Managing Owner, a Trading Advisor or their respective employees, family members and affiliates may, in the sole and absolute discretion of the Managing Owner, be charged no incentive fees or incentive fees at reduced rates.
Interest Income
With respect to the Graham Series, Winton Series, Campbell/Graham Series, Currency Series and the Class 1 and Class 2 of the Balanced Series, the first two percent (2.0%) of interest income earned per annum by the Trust on each Series will be paid to the Managing Owner. In addition, if interest rates fall below 0.75% (calculated daily based on each Series’ Net Asset Value), the Managing Owner will be paid the difference between the Trust’s annualized income interest and 0.75%. Interest income above two percent (2.0%) per Series (calculated daily based on each Series’ Net Asset Value) is retained by the Trust. With respect to the Long Only Commodity Series, Long/Short Commodity Series, Managed Futures Index Series and the Class 1a and Class 2a of the Balanced Series, twenty percent (20%) of interest income earned per annum by the Trust will be paid to the Managing Owner, and the remaining eighty percent (80%) of interest income earned per annum by the Trust will be retained by the Trust. With respect to the Long Only Commodity Series, the Long/Short Commodity Series, the Managed Futures Index Series and the Class 1a and Class 2a of the Balanced Series, subject to compliance with the 6% annual limit on “net asset fees” payable to the Managing Owner pursuant to Section IV.C.1 of the NASAA Guidelines and assuming the classification of interest income as a net asset fee, to the extent that the receipt of such 20% of interest income earned by the Long Only Commodity Series, the Long/
67
Table of Contents
Short Commodity Series, the Managed Futures Index Series and the Class 1a and Class 2a of the Balanced Series does or would exceed the 6% annual limit on “net asset fees,” such excess interest income would be paid by the Managing Owner to the Clearing Brokers.
Brokerage Commissions and Fees
The Trust, with respect to the Class 1 Units and Class 2 Units of each Series, will pay the Clearing Brokers and the Managing Owner a fee in a total amount estimated to be approximately 0.51% to 2.58% of each Series’ Net Asset Value annually. Such estimated fee range includes the actual costs of brokerage commissions and transaction related fees and expenses and up to a maximum of 0.75% per annum of each Series’ Net Asset Value annually.
The Clearing Brokers and the Managing Owner will use such fee to pay all brokerage commissions, including applicable exchange fees, NFA fees, give up fees, pit brokerage fees and other transaction related fees and expenses charged in connection with each Series’ trading activities and on-going service fees of up to 0.5% annually of the Net Asset Value of the Class 2 Units and Class 2a Units for certain administrative services payable to certain Selling Agents selling Class 2 Units or Class 2a Units of any Series. The exact amount of brokerage commissions, exchange fees, NFA fees, give up fees, pit brokerage fees and transaction related fees and expenses which will be incurred by each Series is impossible to estimate and will depend upon a number of factors including the nature and frequency of the market opportunities presented, the size of the transactions, the degree of leverage employed and the transaction rates in effect from time to time. The Managing Owner will retain the excess, if any, between the amount of the fees charged to cover brokerage fees and commissions and on-going service fees for certain administrative services and the actual amounts paid to the Clearing Brokers and the Selling Agents selling Class 2 Units of any Series. Such excess, if any, would constitute compensation to the Managing Owner. With respect to the Class 1 Units of each Series, the Managing Owner will retain up to a maximum of 0.75% per annum of the Net Asset Value of the Class 1 Units of each Series as compensation.
Extraordinary Fees and Expenses
The Trust shall pay all extraordinary fees and expenses, if any. Extraordinary fees and expenses are fees and expenses which are non-recurring and unusual in nature, such as legal claims and liabilities and litigation costs and any permitted indemnification payments related thereto. Extraordinary fees and expenses shall also include material expenses which are not currently anticipated obligations of the Trust or of managed futures funds in general, such as the payment of partnership taxes or governmental fees associated with payment of such taxes. Routine operational, administrative and other ordinary expenses (as described under “Charges to be Paid by the Managing Owner or its Affiliates”) will not be deemed extraordinary expenses and will be paid by the Managing Owner. Any fees and expenses imposed on the Trust due to the status of an individual shall be paid by such individual or the Trust, not the Managing Owner. Except as otherwise set forth in this Prospectus, all Trust expenses which are specific to a particular Series of Units will be allocated to such Series. All general expenses of the Trust not paid by the Managing Owner will be allocatedpro rataamong all Series of Units according to their respective Net Asset Values and taking into account the timing of such Unit purchases.
Charges to be Paid by the Managing Owner
The Managing Owner is responsible for the payment of the following charges and will not be reimbursed by the Trust therefor:
Routine Operational, Administrative and Other Ordinary Expenses.
All of the Trust’s routine operational, administrative and other ordinary expenses including, but not limited to, accounting and computer services, on-going offering fees and expenses, filing fees, printing, mailing and duplication costs for each Series will be paid by the Managing Owner. Such routine operational, administrative and other ordinary expenses of the Trust were estimated to be approximately $6,175,000 (unaudited) in 2006. The Managing Owner also is responsible for all routine legal, auditing and other expenses of third-party service providers to each Series, including the Trustee.
68
Table of Contents
Organization and Offering Expenses
Expenses incurred in connection with the organization of the Trust and the offering of Units during the Initial Offering Period and Continuous Offering Period for each Series except for the initial service fee, if any, is expected to be approximately $2,970,000. Such organizational and initial offering expenses, except for the initial service fee, if any, shall be paid by the Managing Owner, and investors in the Trust shall not be responsible for any such expenses.
The Managing Owner will not allocate to the Trust or any Series of the Trust, the indirect expenses of the Managing Owner.
Charges Paid by Limited Owners
Service Fees—General
The Managing Owner has selected the Selling Agents to assist in the making of offers and sales of Units and provide customary on-going services provided to the Trust and its Limited Owners for commodities related brokerage services. Such on-going services may include, without limitation, advising Limited Owners of the Net Asset Value of the Trust, of the relevant Series of the Trust and of their Units in such Series, responding to Limited Owners’ inquiries about monthly statements and annual reports and tax information provided to them, advising Limited Owners whether to make additional capital contributions to the Trust or to redeem their Units, assisting with redemptions of Units, providing information to Limited Owners with respect to futures and forward market conditions and providing further services which may be requested by Limited Owners. Any Selling Agent that will receive any initial service fees and on-going service fees which in the aggregate exceed ten percent (10%) of the purchase price of the Units sold by it must be duly registered with the CFTC as a futures commission merchant or introducing broker and must be a member in good standing of the NFA in such capacity. Any associated person of such a Selling Agent must be registered with the NFA as an associated person having taken the Series 3 and/or Series 31 Commodity Brokerage Exam or having been “grandfathered” as an associated person qualified to do commodities brokerage.
Class 1 and Class 1a – Initial Service Fee
The maximum amount of compensation paid to an NASD member as an initial service fee may not exceed ten percent (10.0%) (plus an additional 0.5% for bona fide due diligence expenses) of the subscription amount. The initial service fee for the first year after the sale of the Units will be pre-paid by the Managing Owner for bona fide transactions in an amount equal to up to 3.0% of the amount contributed with respect to the Balanced Series, Winton Series, Campbell/Graham Series, Currency Series, Graham Series and Long/Short Commodity Series and in an amount equal to up to 2.0% of the amount contributed with respect to the Long Only Commodity Series and Managed Futures Index Series. The prepaid initial service fee will be amortized monthly at an annual rate of up to 3.0% with respect to the Balanced Series, Winton Series, Campbell/Graham Series, Currency Series, Graham Series and Long/Short Commodity Series and up to 2.0% with respect to the Long Only Commodity Series and Managed Futures Index Series of the average daily Net Asset Value of Class 1 or Class 1a, as applicable, of such Series. The Selling Agents will be paid the initial service fee in full by the Managing Owner upon the sale of the respective Units in bona fide transactions. The initial Net Asset Value of your investment in Units will not be reduced by the prepayment of the initial service fee to the Selling Agents by the Managing Owner. With respect to Class 1 and Class 1a, as applicable, of each Series, the Series pays monthly to the Managing Owner a service fee at an annualized rate of up to 3.0% with respect to the Balanced Series, Winton Series, Campbell/Graham Series, Currency Series, Graham Series and Long/Short Commodity Series and at an annualized rate of up to 2.0% with respect to the Long Only Commodity Series and Managed Futures Index Series, which the Managing Owner then pays to the Selling Agents. The initial service fee (for the first twelve (12) months) relating to a sale of the Units is prepaid to the Managing Owner by each Series, and paid to the Selling Agents by the Managing Owner in the month following sale. The Managing Owner records the pre-paid service fees received from the Series as deferred service fee revenue, and recognizes the revenue over the initial service fee period of twelve (12) months. Since the Managing Owner is prepaying the initial service fee for the
69
Table of Contents
first year and is being reimbursed therefor by the Trust monthly in arrears based upon a corresponding percentage of Net Asset Value, it bears the risk and the upside potential of any mismatch between the amount of the initial service fee prepaid and the amount of the reimbursement thereof as a result of variations in Net Asset Value.
Class 1 of Balanced Series, Winton Series, Campbell/Graham Series, Currency Series, Graham Series and Long/Short Commodity Series and Class 1a of Balanced Series
With respect to Class 1 of the Balanced Series, Winton Series, Campbell/Graham Series, Currency Series, Graham Series and Long/Short Commodity Series of Units, as well as Class 1a of the Balanced Series, as compensation, the Selling Agents will receive an initial service fee at an annual rate of up to 3.0% of the subscription amount of each subscription for Class 1 Units or Class 1a Units, as applicable, of such Series sold by them.
Class 1 of Long Only Commodity Series and Managed Futures Index Series
With respect to Class 1 of the Long Only Commodity Series and Managed Futures Index Series, as compensation, the Selling Agents will receive an initial service fee at an annual rate of up to 2.0% of the subscription amount of each subscription for Class 1 Units of such Series sold by them.
Class 1 and Class 1a – On-going Service Fee
Class 1 of Balanced Series, Winton Series, Campbell/Graham Series, Currency Series and Graham Series
After the expiration of twelve (12) months following the purchase of Class 1 Units of the Balanced Series, Winton Series, Campbell/Graham Series, Currency Series and Graham Series, the Managing Owner will also charge for the benefit of the Selling Agents selling Class 1 Units a monthly or quarterly on-going service fee of up to 3.0% annually of the Net Asset Value of each Class 1 Unit sold by them on an on-going basis for on-going services provided to the Trust and its Limited Owners by the Selling Agents. The on-going service fee is compensation which remains payable with respect to the Units subject to payment thereof for as long as such Units are outstanding.
Class 1 of Long/Short Commodity Series and Class 1a of Balanced Series
After the expiration of twelve (12) months following the purchase of Class 1 Units of the Long/Short Commodity Series and Class 1a Units of the Balanced Series, the Managing Owner will also charge for the benefit of the Selling Agents selling Class 1 Units or Class 1a Units, as applicable, a monthly or quarterly on-going service fee of up to 3.0% annually of the Net Asset Value of each Class 1 Unit or Class 1a Unit, as applicable, sold by them on an on-going basis for on-going services provided to the Trust and its Limited Owners by the Selling Agents. The on-going service fee is compensation which remains payable with respect to the Units subject to payment thereof for as long as such Units are outstanding. The on-going service fee with respect to the Class 1 Units of the Long/Short Commodity Series or Class 1a Units of the Balanced Series will continue only until the aggregate initial service fees and on-going service fees received by the Selling Agent with respect to such Units totals ten percent (10%) of the purchase price of such Class 1 Units of such Series.
Class 1 of Long Only Commodity Series and Managed Futures Index Series
After the expiration of twelve (12) months following the purchase of Class 1 Units of the Long Only Commodity Series and Managed Futures Index Series, the Managing Owner will also charge for the benefit of the Selling Agents selling Class 1 Units a monthly or quarterly on-going service fee of up to 2.0% annually of the Net Asset Value of each Class 1 Unit sold by them on an on-going basis for on-going services provided to the Trust and its Limited Owners by the Selling Agents. The on-going service fee is compensation which remains
70
Table of Contents
payable with respect to the Units subject to payment thereof for as long as such Units are outstanding. The on-going service fee with respect to the Class 1 Units of the Long Only Commodity Series or the Managed Futures Index Series will continue only until the aggregate initial service fees and on-going service fees received by the Selling Agent with respect to such Units totals ten percent (10%) of the purchase price of such Class 1 Units of such Series.
Class 1 and Class 1a – Calculation of Service Fee
The initial service fee and on-going service fee for Class 1 Units in the Balanced Series, Winton Series, Campbell/Graham Series, Currency Series, Graham Series and Long/Short Commodity Series, as well as Class 1a Units in the Balanced Series, will be calculated according to the following scale:
Aggregate Amount of Investment in Units in the Class 1: | Percentage: | ||
$0 - $99,999 | 3.00 | % | |
$100,000 - $499,999 | 2.50 | % | |
$500,000 - $999,999 | 1.25 | % | |
$1,000,000 and above | 0.80 | %* |
| * | Investors who purchase at least $1,000,000 in Class 1 Units in the Balanced Series, Winton Series, Campbell/Graham Series, Currency Series, Graham Series and Long/Short Commodity Series, as well as Class 1a Units in the Balanced Series will also receive a rebate from the Managing Owner of 0.25% of the Net Asset Value of such investors’ Units which would otherwise be paid as brokerage commissions and trading expenses. |
The initial service fee and on-going service fee for Class 1 Units in the Long Only Commodity Series and Managed Futures Index Series, will be calculated according to the following scale:
Aggregate Amount of Investment in Units in the Class 1: | Percentage: | ||
$0 - $499,999 | 2.00 | % | |
$500,000 - $999,999 | 1.25 | % | |
$1,000,000 and above | 0.80 | %* |
| * | Investors who purchase at least $1,000,000 in Class 1 Units in the Long Only Commodity Series and Managed Futures Index Series will also receive a rebate from the Managing Owner of 0.25% of the Net Asset Value of such investors’ Units which would otherwise be paid as brokerage commissions and trading expenses. |
The calculation of the initial service fee for incremental Unit purchases is based on the aggregate amount of Units held by an investor at the time of each Unit purchase (taking into account the right of accumulation). For example, if you purchase $75,000 in Class 1 Units of the Campbell/Graham Series in one month, the applicable Selling Agent will receive an initial service fee of 3.00% of the purchase price of such Units. If you then purchase an additional $50,000 in Class 1 Units of the Campbell/Graham Series three months later, the Selling Agent will be paid an initial service fee of 2.50% of the purchase price of such Units. If you subsequently invest $500,000 in Class 1 Units of the Campbell/Graham Series, the Selling Agent will be paid an initial service fee of 1.25% of the purchase price of such Units.
The initial service fee is calculated based upon the Net Asset Value of the aggregate amount of Units in Class 1 or Class 1a, as applicable, at the time of such purchase and the service fee applicable thereof. The on-going service fee after the initial 12 months of each purchase has expired is calculated based upon the Net Asset Value of the aggregate amount of Units in Class 1 or Class 1a, as applicable, at the end of such 12 month period(s).
71
Table of Contents
Using the above example (assuming no redemption of Units has occurred), the initial service fee for the initial twelve months will be 3.00% of the Net Asset Value of the initial Unit purchase of $75,000; 2.50% of the Net Asset Value of the additional Unit purchase of $50,000; and 1.25% of the Net Asset Value of the additional Unit purchase of $500,000. One year from the initial Unit purchase of $75,000, the on-going service fee will be 1.25% of the Net Asset Value of the Unit purchase of $75,000. One year after the second Unit purchase of $50,000, the on-going service fee will be calculated at a rate of 1.25% of the Net Asset Value of the cumulative $125,000 investment. Finally, one year after the third Unit purchase of $500,000, the on-going service fee will be calculated at a rate of 1.25% of the Net Asset Value of the entire investment of $625,000.
The reduced rate of the initial service fee and on-going service fee based upon incremental Unit purchases is used to purchase additional Units of the relevant Series in your name if you are entitled to the benefit of such reduced rate of the initial service fee and on-going service fee.
Class 2 Units may only be offered to investors who are represented by approved Selling Agents who are directly compensated by the investor for services rendered in connection with an investment in the Trust (such arrangements commonly referred to as “wrap-accounts”).
Class 2 – Initial Service Fee
Investors who purchase Class 2 Units or Class 2a Units will be charged no initial service fee on such Class 2 Units or Class 2a Units.
Class 2 – On-going Service Fee
The Managing Owner may pay certain Selling Agents customary on-going service fees of up to 0.5% annually of the Net Asset Value of each Class 2 Unit or Class 2a Units sold by them for certain administrative services provided to the Trust and its Limited Owners for commodities related brokerage services. The on-going service fee payable to the Selling Agents with respect to the Class 2 Units of the Long Only Commodity Series, the Long/Short Commodity Series and the Managed Futures Index Series and the Class 2a Units of the Balanced Series will continue until the aggregate initial service fees and on-going service fees received by the Selling Agent with respect to such Units totals ten percent (10%) of the purchase price of such Class 2 Units or Class 2a Units of such Series. The on-going service fee payable to the Selling Agents with respect to the Class 2 Units of the Balanced Series registered with the SEC on or after January 26, 2007, will continue until the aggregate initial service fees and on-going service fees received by the Selling Agent with respect to such Units totals ten percent (10%) of the purchase price of such Class 2 Units of such Series. The Trust intends to sell the newly-registered Class 2 Units of the Balanced Series only once all previously-registered Class 2 Units of the Balanced Series have been sold.
Redemption Fees – Class 1 and Class 1a only
If you redeem all or a portion of your Class 1 Units of the Balanced Series, Winton Series, Campbell/Graham Series, Currency Series, Graham Series and Long/Short Commodity Series, as well as Class 1a Units of the Balanced Series, during the first twelve (12) months following the effective date of their purchase, you will be subject to a redemption fee of up to 3.0% of the Net Asset Value at which they are redeemed; provided, however, that the amount of the redemption fee shall be reduced pro rata on a daily basis by approximately 1/365th each day following the end of the month in which you purchased the Units. If you redeem all or a portion of your Class 1 Units of the Long Only Commodity Series and Managed Futures Index Series, during the first twelve (12) months following the effective date of their purchase, you will be subject to a redemption fee of up to 2.0% of the Net Asset Value at which they are redeemed; provided, however, that the amount of the redemption fee shall be reduced pro rata on a daily basis by approximately 1/365th each day following the end of the month in which you purchased the Units. Such redemption fees are paid to the Managing Owner to reimburse it for the then unamortized portion of the prepaid initial service fee calculated at the highest applicable rate.
72
Table of Contents
There is no redemption fee for Class 2 of each Series.
In the event that an investor acquires Units at more than one closing date, the early redemption fee will be calculated on a “first-in, first-out” basis for redemption purposes (including determining the amount of any applicable redemption charge). Redemption fees are not charged in respect of Class 1 Units of any Series that are being exchanged for Class 1 Units in any other Series. See “Trust Agreement—Exchange Privilege.” Redemption fees do not reduce Net Asset Value or New High Net Trading Profit for any purpose, only the amount which Unitholders receive upon redemption.
The Managing Owner believes that the fee structure of the Trust described above complies with sections IV.C.1, IV.C.2 and IV.C.3c of the NASAA Guidelines.
If you subscribe for additional Class 1 Units at a date subsequent to the date of your initial investment in Class 1 Units, and if such additional subscription entitles you to a reduced rate of the initial service fee and on-going service fee, the redemption fee applicable to you will be applied at the highest rate of the initial service fee and on-going service fee applicable to your initial investment in Class 1 Units.
Exchange Equalization Fees – Class 1 and Class 1a only
If you Exchange all or a portion of your Class 1 Units of the Balanced Series, Winton Series, Campbell/Graham Series, Currency Series, Graham Series or Long/Short Commodity Series or your Class 1a Units of the Balanced Series for Class 1 Units of the Long Only Commodity Series or the Managed Futures Index Series on or before the end of twelve (12) full months following the effective date of the purchase of the Units being Exchanged, the Long Only Commodity Series or the Managed Futures Index Series, as applicable, will charge you an exchange equalization fee for switching into the Long Only Commodity Series or the Managed Futures Index Series of 1.0% of the Net Asset Value at which your Units are Exchanged to reimburse the Managing Owner for the prepaid initial service fee of the Series you are Exchanging out of, which is charged at a higher rate than the initial service fee of the Long Only Commodity Series or the Managed Futures Index Series. Depending on the number of months that have elapsed since the purchase of Class 1 Units of the Balanced Series, Winton Series, Campbell/Graham Series, Currency Series, Graham Series or Long/Short Commodity Series or Class 1a Units of the Balanced Series being Exchanged, the total amount of initial service fees and exchange equalization fees which you will pay may exceed 3.0%. No exchange charges will be imposed for all other Exchanges.
Investor Suitability
The Selling Agents selling Units in the Trust are obligated to make every reasonable effort to determine that the purchase of Units is a suitable and appropriate investment for each subscriber, based on information provided by the subscriber regarding his or its financial situation and investment objective.
A PURCHASE OF THE UNITS SHOULD BE MADE ONLY BY THOSE PERSONS WHOSE FINANCIAL CONDITION WILL PERMIT THEM TO BEAR THE RISK OF A TOTAL LOSS OF THEIR INVESTMENT IN THE TRUST. AN INVESTMENT IN THE UNITS SHOULD BE CONSIDERED ONLY AS A LONG-TERM INVESTMENT.
Investors should not purchase Units with the expectation of tax benefits in the form of losses or deductions. See “Tax and ERISA Risks—Your Tax Liability May Exceed Distributions to You.” If losses accrue to a Series, your distributive share of such losses will, in all probability, be treated as a capital loss and generally will be available only for offsetting capital gains from other sources. To the extent that you have no capital gains, capital losses can be used only to a very limited extent as a deduction from ordinary income. See “Federal Income Tax Consequences.”
73
Table of Contents
By accepting subscriptions on behalf of Plans, the Trust is not, nor are the Managing Owner, the Trading Advisors or any other party, representing that this investment meets any or all of the relevant legal requirements for investments by any particular Plan or that this investment is appropriate for any particular Plan. The person with investment discretion should consult with his attorney and financial advisors as to the propriety of this investment in light of the particular Plan’s circumstances and current tax law.
Subscriptions for the purchase of the Units are subject to the following conditions:
Minimum Purchases
- Minimum Initial Subscription: | $1,000; no minimum for Plans (including IRAs), an employees or family members of an employee of the Managing Owner or its affiliates or charitable organizations; the initial subscription for Units may be in any one or a combination of Series, although the minimum purchase for any single Series is $1,000.† | |
- Additional Purchases: | $100 increments; no minimum for Plans (including IRAs), an employees or family members of an employee of the Managing Owner or its affiliates or charitable organizations.† | |
| † | If you are a resident of Texas, your minimum initial subscription requirement is $5,000, or, if you are a Plan, an employee or family member of an employee of the Managing Owner or its affiliates or a charitable organization, your minimum initial subscription requirement is $1,000. |
Net Worth and Income Requirements
The following net worth and/or net asset requirements may be higher under the securities laws of the State of the subscriber’s residency. The requirements of each State are set forth under the caption “State Suitability Requirements” in “SUBSCRIPTION INFORMATION” attached as Exhibit B to the Statement of Additional Information.
The Managing Owner also may impose greater net worth or income requirements on subscribers who propose to purchase more than the minimum number of Units.
Subscriber Category Requirements
Subscribers (other than pension, profit-sharing, stock bonus, individual retirement accounts, Keogh plans, welfare benefit plans and other employee benefit plans, whether or not subject to ERISA or Section 4975 of the Code, or collectively, Plans) must:
Have a net worth (exclusive of home, home furnishings and automobiles) of at least $150,000;
OR
Have a net worth (similarly calculated) of $45,000 and an annual gross income of $45,000;
AND
Invest no more than 10% of the subscriber’s net worth (exclusive of home, home furnishings and automobiles) in any Series or in all Series combined.
74
Table of Contents
Subscribers that are IRAs or Keogh plans covering no common law employees or employee benefit plans not subject to ERISA (for example, government plans) and their participants must:
Have a net worth (exclusive of home, home furnishings and automobiles) of at least $150,000;
OR
Have a net worth (similarly calculated) of at least $45,000 and an annual gross income of at least $45,000;
AND
Invest no more than 10% of the subscriber’s net worth (exclusive of home, home furnishings and automobiles) in any Series or in all Series combined.
Subscribers that are employee benefit plans subject to ERISA (for example, generally qualified pension plans, profit sharing plans, and Keogh plans and welfare benefit plans, such as group insurance plans, or other fringe benefit plans, not including IRAs or Keogh plans which cover no common law employees or government plans) must:
Have net assets of at least $150,000;
AND
Have an aggregate investment in any Series or in all Series combined that does not exceed 10% of its assets.
In the case of sale to fiduciary accounts, the income and net worth standards described above shall be met by the beneficiary, the fiduciary account, or by the donor or grantor who directly or indirectly supplies the funds to purchase the Units if the donor or grantor is the fiduciary.
The fiduciary of an employee benefit plan subject to ERISA should consider, among other things, whether the investment is prudent, considering the nature of the Trust and the Trust’s Series.
Fundamental Knowledge
Each subscriber should make sure that it understands, among other things: (i) the fundamental risks and possible financial hazards of the investment; (ii) the trading strategies to be followed in the Series in which it will invest; (iii) that transferability of the Units is restricted; (iv) that the Managing Owner will manage and control each Series’ and the Trust’s business operations; (v) the tax consequences of the investment; (vi) the liabilities being assumed by a Unitholder; (vii) the redemption and exchange rights that apply; and (viii) the Trust’s structure, including each Series’ fees. In addition, the Managing Owner must consent to each subscription, which consent may be withheld in whole or in part for any reason.
Ineligible Investors
Units may not be purchased with the assets of an ERISA Plan if the Trustee, the Managing Owner, the Trading Advisor or any of their respective affiliates (a) is an employer maintaining or contributing to such ERISA Plan, or (b) has investment discretion over the investment of the assets of the ERISA Plan. See “ERISA Considerations.” An investment in any Series of the Trust is not suitable for Charitable Remainder Annuity Trusts or Charitable Remainder Unit Trusts.
ERISA Considerations
Before authorizing an investment in the Trust, fiduciaries of Plans should consider, among other matters, (a) fiduciary standards imposed by ERISA or governing state law, if applicable, (b) whether such investment in the Trust by the Plan satisfies the prudence and diversification requirements of ERISA and governing state law, if applicable, taking into account the overall investment policy of the Plan, the composition of the Plan’s portfolio,
75
Table of Contents
and all terms of the investment, (c) whether such fiduciaries have authority to make such investment in the Trust under the applicable Plan investment policies and governing instruments, (d) rules relating to the periodic valuation of Plan assets and the delegation of control over or responsibility for “plan assets” under ERISA or governing state law, if applicable, and (e) prohibitions under ERISA, the Code, and/or governing state law relating to Plans engaging in certain transactions involving “plan assets” with persons who are “disqualified persons” under the Code or “parties in interest” under ERISA (both “Parties in Interest”) or governing state law, if applicable.
DOL regulation 29 C.F.R. § 2510.3-101, as modified by Section 3(42) of ERISA, or the Plan Asset Regulation, sets forth guidelines to determine when an investment in an entity, such as the Trust, by a Plan that is subject to Part 4 of Subtitle B of Title I of ERISA or Section 4975 of the Code, or an ERISA Plan, and any entity whose underlying assets include plan assets by reason of an ERISA Plan’s investment in such entity, or together with ERISA Plans, Benefit Plan Investors, will cause the assets of such entity to be treated as “plan assets.” If the Trust were deemed to hold “plan assets”, it is likely, among other things, that (a) the fiduciaries of ERISA Plans subject to Title I of ERISA who directed the ERISA Plan’s investment in the Trust would be subject to ERISA’s fiduciary duty rules with respect to the assets held by the Trust, (b) the Managing Owner and the Trading Advisors would become fiduciaries or Parties in Interest of ERISA Plans that invest in the Trust, and (c) Trust transactions could constitute prohibited transactions under ERISA and the Code.
Under the Plan Asset Regulation, unless an exception applies, if an ERISA Plan makes an equity investment in an entity such as the Trust, the ERISA Plan’s assets include both the interest in the Trust and an undivided interest in each of the underlying assets of the Trust. Under an exception contained in the Plan Asset Regulation, the assets of an entity will not be deemed to be “plan assets” of investing ERISA Plans if, after the most recent acquisition of any equity interest in the entity, less than 25% of the value of each class of equity interests in the entity is held by Benefit Plan Investors, or the Less Than 25% Exception. Under Section 3(42) of ERISA, a Benefit Plan Investor that is an entity (and not itself an ERISA Plan) is considered to hold “plan assets” only to the extent of the percentage of its equity held by Benefit Plan Investors. For purposes of determining compliance with the Less Than 25% Exception, any interest held by a person that has discretionary authority or control with respect to the assets of the entity or that provides investment advice for a fee (direct or indirect) with respect to such assets, or an affiliate of such person, is disregarded.
Under an exception contained in the Plan Asset Regulation, if the Units in a Series (including a separate Sub-Class) were to qualify as “publicly offered securities” (as defined in the Plan Asset Regulation), the Trust’s assets would not be deemed to be “plan assets” by reason of an ERISA Plan’s acquisition or holding of the Units. For the Units in a Series (including a separate Sub-Class) to be considered publicly offered, they must be “widely held,” “freely transferable” and must satisfy certain registration requirements under Federal securities laws. Under the Plan Asset Regulation, a class of securities is considered “widely held” if it is owned by 100 or more investors who are independent of the issuer and of one another. Whether a security is “freely transferable” is a factual question to be determined on the basis of all relevant facts and circumstances. However, the Plan Asset Regulation sets forth a number of factors that will not ordinarily, either alone or in combination, affect a finding that securities are freely transferable. In particular, the Plan Asset Regulation provides that a restriction or prohibition against transfers or assignments that would result in either the termination or reclassification of an entity for Federal income tax purposes ordinarily will not cause securities issued by that entity to fail to be freely transferable. A 1989 DOL Advisory Opinion reiterated this position with respect to transfer restrictions imposed by a Trust to insure against reclassification of the Trust under Section 7704 of the Code (which did not exist when the Plan Asset Regulation was adopted) for Federal income tax purposes.
The Trust intends to restrict investment in and transfer of each Series (including each separate Sub-Class) so that the value of interests held by Benefit Plan Investors complies with the Less Than 25% Exception until the Series (including each separate Sub-Class) has more than 150 investors and is otherwise intended to constitute publicly offered securities. Accordingly, no Benefit Plan Investor may be admitted to a Series, and no other transfer (including an Exchange or redemption) of Units in the Series by a non-Benefit Plan Investor shall be
76
Table of Contents
permitted, if after giving effect thereto, the assets of the Series would include assets of any ERISA Plan. Certain ownership and transfer restrictions (including mandatory transfer and calls for redemption of Units held by Benefit Plan Investors) may also be imposed. Once a Series (including a separate Sub-Class) has 150 investors and is otherwise intended to constitute a publicly offered security within the meaning of the Plan Asset Regulation, the Trust does not intend to monitor the participation of Benefit Plan Investors to determine whether the Less Than 25% Exception is met. Accordingly, there can be no assurance that the Trust will not be deemed to hold plan assets to the extent that ERISA Plans have invested in one or more Series.
Under ERISA and Section 4975 of the Code, investment in a Series by an ERISA Plan which has a pre-existing relationship with a party affiliated with the Trust, such as the Managing Owner, the Selling Agents, or any affiliates thereof, could, in certain circumstances, be viewed as a prohibited transaction. Accordingly, the Managing Owner has determined that, for any ERISA Plan assets with respect to which it believes it is a fiduciary, neither the Managing Owner, the Selling Agents nor any affiliate will recommend an investment in the Units of a Series, nor will it or any affiliate allocate to a Series any ERISA Plan assets over which they have discretionary control. There can be no assurances, however, that an investment in the Trust by an ERISA Plan will not be a prohibited transaction under ERISA or the Code.
The Trust’s acceptance of a subscription with respect to a Plan is in no respect a representation by the Trust or any other person that the investment meets all relevant legal requirements with respect to investments by the Plan or that the investment is appropriate for the Plan. Any prospective investor in the Trust that is a Plan should consult its own advisers with respect to the provisions of ERISA, the Code and any governing state or foreign law that may apply with respect to an investment in the Trust by such investor.
In the event that, for any reason, the assets of any Series are deemed to be Plan Assets, and if any transactions would or might constitute prohibited transactions under ERISA or the Code and an exemption for such transaction or transactions cannot be obtained from the DOL (or the Managing Owner determines not to seek such exemption), the Managing Owner reserves the right, upon notice to, but without the consent of any Limited Owner, to mandatorily redeem out any Limited Owner which is Benefit Plan Investor. See “Trust Agreement—Redemption of Units.”
FIDUCIARIES OF ERISA PLANS THAT ARE PROSPECTIVE INVESTORS SHOULD CONSULT WITH THEIR OWN ATTORNEYS AND FINANCIAL ADVISERS TO DETERMINE THE CONSEQUENCES UNDER ERISA AND THE CODE OF AN INVESTMENT IN THE TRUST, AND TO DETERMINE THE PROPRIETY OF SUCH AN INVESTMENT IN LIGHT OF THE CIRCUMSTANCES OF THAT PARTICULAR PLAN OR FUND AND CURRENT APPLICABLE LAW.
Discretionary Accounts
In compliance with NASD Conduct Rules, the Trust will not sell Units to discretionary accounts without the prior specific written approval of the customer.
Compliance With Anti-Money Laundering Laws
To satisfy the Trust’s, the Managing Owner’s and the Selling Agents’ obligations under applicable anti-money laundering laws and regulations, subscribers will be required to make representations and warranties in the Subscription Agreement concerning the nature of the subscriber, its source of investment funds and other related matters. The Managing Owner and the Selling Agents reserve the right to request additional information from subscribers as either of the Managing Owner or a Selling Agents, in its sole discretion, requires in order to satisfy applicable anti-money laundering obligations. By subscribing for units in the Trust, each subscriber agrees to provide this information upon request.
77
Table of Contents
To subscribe for Units, a subscriber must:
| • | complete a Subscription Agreement if you are a new or existing Subscriber to the Series being purchased or complete an Addition Form if you are an existing Subscriber to the Series being purchased; |
| • | complete an Exchange Request (Exhibit C to the Statement of Additional Information) if you are exchanging Units in one Series for Units of one or more other Series; |
| • | deliver the Subscription Agreement or Exchange Request to your Selling Agent in a timely manner; and |
| • | meet established suitability standards. |
Subscriptions (as well as redemptions and Exchanges) may be made on-line in the future. Prospective investors desiring information on such on-line subscription, redemption or Exchange methods should contact the Managing Owner.
Ways to Subscribe
| • | Individual or Joint Tenant: |
Individual accounts are owned by one person. Joint accounts can have two or more owners.
| • | Gifts or transfers to a minor – UGMA or UTMA: |
An individual can gift up to $11,000 per year per person without paying Federal gift tax. Depending on state law, you can establish a custodial account under the Uniform Gifts to Minors Act, or UGMA, or the Uniform Transfers to Minors Act, or UTMA.
| • | Trust: |
The subscribing trust must be established before an account can be opened.
| • | Business or Organization: |
Corporations, partnerships, associations or other groups.
| • | Plans: |
Pension, profit-sharing, stock bonus, individual retirement accounts, Keogh plans, welfare benefit plans and other employee benefit plans, whether or not subject to ERISA or Section 4975 of the Code.
When a Subscription Becomes Final
THE MANAGING OWNER MAY, AT ITS DISCRETION, REJECT ANY SUBSCRIPTION IN WHOLE OR IN PART. Proceeds for subscriptions which have been rejected by the Managing Owner will be returned directly to the investor via first class U.S. mail, with interest and without deduction for expenses. Subscriptions will not be final or binding on any subscriber until the Managing Owner has been in receipt of subscriber’s Subscription Agreement or Exchange Request for at least two (2) Business Days. Except as set forth below, all subscriptions will be irrevocable by the subscriber. If a subscription is rejected by the Managing Owner, in whole or in part, for any reason, the subscription funds, or applicable portion thereof, will be returned promptly to the payor of such funds. Any interest earned on subscriptions which have been accepted by the Trust will be retained by the Trust for the benefit of all investors in such Series. All accepted subscribers will receive written confirmation of the purchase of Units in any Series of the Trust.
78
Table of Contents
Representations and Warranties of Investors in the Subscription Agreement and Power of Attorney
To invest in the Trust, you must make representations and warranties in the Subscription Agreement and power of attorney. The representations and warranties enable the Managing Owner to determine whether you are qualified to invest in the Trust. The representations and warranties relate to:
| • | your eligibility to invest in the Trust, including legal age, net worth, annual income, investment objectives and investment experience; |
| • | your representative capacity; |
| • | information provided by you; |
| • | information received by you; |
| • | investments made on behalf of Plans; and |
| • | your compliance with applicable anti-money laundering laws. |
In the Subscription Agreement, you are also required to represent that you received the Prospectus five (5) Business Days prior to the date of your Subscription Agreement. We are prohibited from selling Units to you until five (5) Business Days after you receive the Prospectus. If you did not receive the Prospectus five (5) Business Days in advance, you have the right to withdraw your subscription.
Initial Offering
The Units are offered for sale, pursuant to Rule 415 of Regulation C under the Securities Act, through the Selling Agents. The Initial Offering Period for each of the Winton Series and Currency Series as well as the Class 1 and Class 2 of the Balanced Series ended in September 2004, the Initial Offering Period for the Graham Series ended in November 2004, the Initial Offering Period for the Campbell/Graham Series ended in February 2005, the Initial Offering Period for the Long Only Commodity Series and the Long/Short Commodity Series ended in March 2006, the Initial Offering Period for the Managed Futures Index Series ended in April 2006 and the Initial Offering Period for the Class 1a and Class 2a of the Balanced Series ended in May 2006. Therefore, none of such Series has a Subscription Minimum. Each of the Balanced Series, Winton Series and Currency Series commenced operations in September 2004, the Graham Series commenced operations in November 2004, the Campbell/Graham Series commenced operations in February 2005, the Long Only Commodity Series and the Long/Short Commodity Series commenced operations in March 2006, the Managed Futures Index Series commenced operations in April 2006 and the Class 1a and Class 2a of the Balanced Series commenced operations in May 2006. See “Who May Subscribe.”
The Managing Owner, the Trustee, the Trading Advisor and their respective principals, stockholders, directors, officers, employees and affiliates may subscribe for Units as a Limited Owners, and any such Units in a Series subscribed for by such persons will be counted for purposes of determining whether the Series’ Subscription Minimum is sold during the Initial Offering Period.
The maximum number of Units in each Series that can be sold during the Initial Offering Period and the Continuous Offering Period is:
| • | Balanced Series - 10,020,000 Units |
| • | Graham Series - 1,100,000 Units |
| • | Winton Series - 650,000 Units |
| • | Campbell/Graham Series - 3,000,000 Units |
79
Table of Contents
| • | Currency Series - 230,000 Units |
| • | Long Only Commodity Series - 350,000 Units |
| • | Long/Short Commodity Series - 1,450,000 Units |
| • | Managed Futures Index Series - 750,000 Units |
Determination of the Subscription Maximum in each Series will be made after taking into account the Managing Owner’s contribution. Because the Managing Owner will be responsible for payment of the Trust’s organization and offering expenses, except for the initial service fee, if any, 100% of the proceeds of the Initial Offering will be initially available for each Series’ trading activities.
Units are being offered for a minimum initial subscription of $1,000 per subscriber; however, any investment made on behalf of a Plan (including an IRA), an employee or family member of an employee of the Managing Owner or its affiliates or a charitable organization, has no minimum initial subscription. A subscriber may purchase Units in any one or a combination of Series, although the minimum purchase for any single Series is $1,000. If you are a resident of Texas, your minimum initial subscription requirement is $5,000, or, if you are a Plan (including an IRA), an employee or family member of an employee of the Managing Owner or its affiliates or a charitable organization, your minimum initial subscription requirement is $1,000.
Continuous Offering Period
During the Continuous Offering Period, each Series’ Units will be offered on a daily basis at the Series’ Net Asset Value per Unit as of the Valuation Point immediately preceding the subscription effective date. Additional Units may be purchased in increments of $100, or, if you are a Plan (including an IRA), an employee or family member of an employee of the Managing Owner or its affiliates or a charitable organization, you have no minimum additional subscription requirements. Subscribers will be admitted as Limited Owners as of the day of the week two Business Days following the receipt of the Subscriber’s Subscription Agreement. A Subscriber’s Subscription Agreement must be received by the Managing Owner at its principal office on a timely basis—at least two (2) Business Days before the day on which the subscription is to become effective, and sufficient funds must be received by check or via wire transfer on a timely basis. In the event that sufficient funds are not received, the Managing Owner may, in its sole discretion, reject the subscription. Proceeds for subscriptions which have been rejected by the Managing Owner will be returned directly to the investor via first class U.S. mail, with interest and without deduction for expenses. Funds from accepted subscriptions will be deposited in the applicable Series’ escrow account at U.S. Bank National Association, Denver, Colorado, or the Escrow Agent. Once the daily Net Asset Value per Unit is determined, a confirmation of each accepted subscription will be sent to subscribers.
Subscription Effective Dates
The effective date of all accepted subscriptions during the Continuous Offering Period, whether you are a new subscriber to a Series, or an existing Limited Owner in a Series who is purchasing additional Units in that Series or exchanging Units in one Series for Units in a different Series (See “Exchange Privilege.”), is the day of the week two (2) Business Days following the day in which your Subscription Agreement is received on a timely basis.
Calculation of Number of Units Purchased
During the Continuous Offering Period for a Series, the number of Units in such Series of Units that an investor receives will be calculated by dividing the amount of the investor’s total subscription by the Series’ Net Asset Value per Unit as of the Valuation Point immediately preceding the subscription effective date. Fractional Units of up to five (5) decimal places will be issued by the Trust. All Units will be held in book-entry form and will not be certificated.
80
Table of Contents
Service Fees
With respect to the Class 1 Units of the Balanced Series, Winton Series, Campbell/Graham Series, Currency Series, Graham Series and Long/Short Commodity Series, as well as the Class 1a Units of the Balanced Series, as compensation, the Selling Agents will receive an initial service fee of up to three percent (3.0%) of the subscription amount. In addition, after the expiration of twelve (12) months following the purchase of Class 1 Units of the Balanced Series, Winton Series, Campbell/Graham Series, Currency Series or Graham Series, investors who purchased Class 1 Units of such Series will be charged an annual on-going service fee of up to three percent (3.0%) of the Net Asset Value of each Unit purchased, for the benefit of Selling Agents selling Class 1 Units for on-going services provided to the Trust and the Limited Owners by the Selling Agents.
After the expiration of twelve (12) months following the purchase of Class 1 Units of the Long/Short Commodity Series or Class 1a Units of the Balanced Series, investors who purchased Class 1 Units or Class 1a Units, as applicable, of such Series will be charged an annual on-going service fee of up to three percent (3.0%) of the Net Asset Value of each Unit purchased, for the benefit of Selling Agents selling Class 1 Units or Class 1a Units, as applicable, for on-going services provided to the Trust and the Limited Owners by the Selling Agents. The on-going service fee with respect to the Class 1 Units of the Long/Short Commodity Series or Class 1a Units of the Balanced Series will continue only until the aggregate initial service fees and on-going service fees received by the Selling Agent with respect to such Units totals ten percent (10%) of the purchase price of such Class 1 Units of such Series.
With respect to the Class 1 Units of the Long Only Commodity Series and the Managed Futures Index Series, as compensation, the Selling Agents will receive an initial service fee of up to two percent (2.0%) of the subscription amount. In addition, after the expiration of twelve (12) months following the purchase of Class 1 Units of the Long Only Commodity Series or the Managed Futures Index Series, investors who purchased Class 1 Units of such Series will be charged an annual on-going service fee of up to two percent (2.0%) of the Net Asset Value of each Unit purchased, for the benefit of Selling Agents selling Class 1 Units for on-going services provided to the Trust and the Limited Owners by the Selling Agents. The on-going service fee with respect to the Class 1 Units of the Long Only Commodity Series or the Managed Futures Index Series will continue only until the aggregate initial service fees and on-going service fees received by the Selling Agent with respect to such Units totals ten percent (10%) of the purchase price of such Class 1 Units of such Series.
Investors who purchase Class 2 Units of any Series or Class 2a Units of the Balanced Series will be charged no initial service fee, but Selling Agents selling Class 2 Units or Class 2a Units may receive an on-going service fee of up to 0.5% annually of the Net Asset Value of the Class 2 Units or Class 2a Units sold by them. The on-going service fee payable to the Selling Agents with respect to the Class 2 Units of the Long Only Commodity Series, the Long/Short Commodity Series and the Managed Futures Index Series and the Class 2a Units of the Balanced Series will continue until the aggregate initial service fees and on-going service fees received by the Selling Agent with respect to such Units totals ten percent (10%) of the purchase price of such Class 2 Units or Class 2a Units of such Series. The on-going service fee payable to the Selling Agents with respect to the Class 2 Units of the Balanced Series registered with the SEC on or after January 26, 2007, will continue until the aggregate initial service fees and on-going service fees received by the Selling Agent with respect to such Units totals ten percent (10%) of the purchase price of such Class 2 Units of such Series. The Trust intends to sell the newly-registered Class 2 Units of the Balanced Series only once all previously-registered Class 2 Units of the Balanced Series have been sold.
All of the proceeds of this offering will be received in the name of each Series and will be deposited and maintained in cash in segregated escrow accounts maintained for each Series at the Escrow Agent. Following the commencement of trading for any Series, except for that portion of any Series’ assets that is deposited as margin to maintain forward currency contract and swap positions and that portion of each Series’ assets maintained at
81
Table of Contents
the Trust level for cash management, each Series’ assets will be maintained in accordance with requirements of the CE Act and the regulations thereunder, which means that assets will be maintained either on deposit with the Clearing Brokers or, for margin purposes, with the various exchanges on which the Series are permitted to trade. Assets also may be maintained on deposit in U.S. banks, although there is no present intention to do so. Assets will not be maintained in foreign banks. Neither the Escrow Agent nor the Managing Owner will commingle the property of any Series with the property of another person, nor will the Trust commingle the assets of one Series with the assets of any other Series except for the portion of each Series’ assets maintained at the Trust level for cash management. The Trust will not invest in or loan funds to any other person or entity, nor will assets from one Series be loaned to or allocated to another Series. The Managing Owner has selected Merrill Lynch and STW Fixed Income Management Ltd. to serve as the cash managers for the Trust, and the Managing Owner, in its sole and absolute discretion, may appoint additional or substitute cash managers for the Trust.
82
Table of Contents
ADVISORY AGREEMENTS
Except with respect to the Long Only Commodity Series, there is an Advisory Agreement among the Trust, the Managing Owner and each Trading Advisor to each Series by which the Managing Owner delegated to such Trading Advisor, discretion and responsibility to trade commodities for such Series. The Trading Advisor will place trades based on its agreed-upon trading approach, or the Trading Approach, which is described in the Appendix for such Series attached to this Prospectus, and each Trading Advisor has agreed that at least 90% of the annual gross income and gains if any, generated by its Trading Approach will be from buying and selling commodities or futures, forwards and options on commodities. All trading is subject to the Trust’s Trading Limitations and Policies which are described under the heading “Trading Limitations and Policies.” Except with respect to the Long Only Commodities Series, each Trading Advisor will be allocated 100% of the proceeds from the offering of Units during the Initial Offering and the Continuous Offering Periods for the Series for which it has trading responsibility in the case of the single advisor Series and, if applicable, a portion of the proceeds from the offering of Units during the Initial Offering and Continuous Offering Periods for the Balanced Series, the Campbell/Graham Series, the Currency Series and the Long/Short Commodity Series.
The Advisory Agreements will be effective for one year after trading commences and will be renewed automatically for additional one (1)-year terms unless terminated. Each Advisory Agreement with a Trading Advisor will terminate automatically (i) in the event that the Series it manages is terminated; or (ii) if, as of the end of any Business Day, the Series’ Net Asset Value declines by 50% or more from the Series’ Net Asset Value (a) as of the first day of the Advisory Agreement, or (b) as of the first day of any calendar year, as adjusted on an on-going basis by (A) any decline(s) in the Allocated Assets caused by distributions, exchanges, redemptions, permitted reallocations, and withdrawals, and (B) additions to the Allocated Assets caused by additional allocations of the Trust Estate to the Trading Advisor’s management based on sales of additional Units of the applicable Series.
Each Advisory Agreement also may be terminated at the sole discretion of the Managing Owner at any time upon at least one (1) day’s prior written notice to a Trading Advisor, or for cause on less than one (1) day’s prior written notice, in the event that: (i) the Managing Owner determines in good faith following consultation appropriate under the circumstances with the Trading Advisor that the Trading Advisor is unable to use its agreed upon Trading Approach to any material extent, as such Trading Approach may be refined or modified in the future in accordance with the terms of this Agreement for the benefit of the Trust; (ii) the Trading Advisor’s registration, if required, as a commodity trading advisor, or CTA, under the CE Act or membership as a CTA with the NFA is revoked, suspended, terminated or not renewed; (iii) the Managing Owner determines in good faith that the Trading Advisor has failed to conform and, after receipt of written notice, continues to fail to conform in any material respect, to (A) the Trading Limitations and Policies, or (B) the Trading Advisor’s Trading Approach; (iv) there is an unauthorized assignment of the Advisory Agreement by the Trading Advisor; (v) the Trading Advisor dissolves, merges or consolidates with another entity or sells a substantial portion of its assets, any portion of its Trading Approach utilized by a Series or its business goodwill, in each instance without the consent of the Managing Owner; (vi) any of the key principals of the Trading Advisor, if any, are not in control of the Trading Advisor’s trading activities for the Trading Company; (vii) the Trading Advisor becomes bankrupt or insolvent; or (viii) for any other reason if the Managing Owner determines in good faith that the termination is essential for the protection of the Trust, the Trading Company and the assets of the Series, including, without limitation, a good faith determination by the Managing Owner that such Trading Advisor has breached a material obligation to the Trust or the Trading Company under the Advisory Agreement relating to the trading of the Series’ Assets.
Each Trading Advisor also generally has the right to terminate the Advisory Agreement in its discretion at any time for cause upon ten (10) days’ written notice to each of the Trust, the Trading Company and the Managing Owner, appropriate under the circumstances, in the event (i) of the receipt by the Trading Advisor of an opinion of independent counsel satisfactory to the Trading Advisor and the Trust that by reason of the Trading
83
Table of Contents
Advisor’s activities with respect to the Trust and the Trading Company, the Trading Advisor is required to register as an investment adviser under the Investment Advisers Act of 1940, as amended, and it is not so registered; (ii) the registration of the Managing Owner as a CPO under the CE Act, or its membership with the NFA in such capacity, is revoked, suspended, terminated or not renewed; (iii) the Managing Owner imposes additional trading limitation(s) which the Trading Advisor does not agree to follow in its trading of a Series’ Assets; or the Managing Owner overrides trading instructions; (iv) if the assets allocated to the Trading Advisor decrease, for any reason, to less than $15 million in the case of Balanced Series, to less than $5 million in the case of Graham, to less than $5 million in the case of Winton, to less than $8 million in the case of Campbell and to less than $1 million in the case of Currency as the result of redemptions, reallocations or extraordinary expenses, but not trading losses, as of the close of business on any Business Day; (v) the Managing Owner elects to have the Trading Advisor use a different Trading Approach and the Trading Advisor objects; (vi) there is an unauthorized assignment of the Advisory Agreement by the Trust or the Managing Owner; or (vii) other good cause is shown and the written consent of the Managing Owner is obtained (which shall not unreasonably be withheld).
The business of each Trading Advisor is to manage commodity trading accounts. In addition to the trading management services each Trading Advisor provides for a Series, each Trading Advisor also is permitted to manage and trade accounts for other investors (including other public and private commodity pools). Each Trading Advisor may use the same Trading Approach and other information it uses on behalf of the applicable Series, so long as the Trading Advisor’s ability to carry out its obligations and duties to such Series pursuant to the Advisory Agreement is not materially impaired thereby.
No Trading Advisor will accept additional capital for commodities management if doing so would have a reasonable likelihood of resulting in the Trading Advisor’s having to modify materially its agreed upon Trading Approach in a manner that might reasonably be expected to have a material adverse effect on the Series for which it has trading responsibility; the foregoing will not, however, prohibit a Trading Advisor from accepting additional funds if to do so will require only routine adjustments to its trading patterns in order to comply with speculative position limits or daily trading limits.
Each Trading Advisor and its shareholders, directors, officers, employees and agents also are permitted to trade for their own accounts so long as their trading does not materially impair the Trading Advisor’s ability to carry out its obligations and duties to the Trust. Limited Owners are not permitted to inspect records of any of the Trading Advisors or the individuals associated with the Trading Advisors because of the confidential nature of such records. Each Trading Advisor will, upon reasonable request, permit the Managing Owner to review at the Trading Advisor’s offices such trading records that the Managing Owner may reasonably request for the purpose of confirming that the Trust has been treated equitably with respect to advice rendered by the Trading Advisor for other accounts managed by the Trading Advisor.
No Trading Advisor shall be liable to the Managing Owner, the Trust, the Trustee, the Trading Company or the Limited Owners, or any of their respective successors or assigns under this Agreement for any act or failure to act taken or omitted in good faith in a manner reasonably believed to be in, or not opposed to the best interests of the Trust and the Trading Company if such act or failure to act did not constitute a breach of the Advisory Agreement, misconduct or negligence on the part of the Trading Advisor.
In any threatened, pending or completed action, arbitration, claim, demand, dispute, lawsuit or other proceeding, or each, a Proceeding, to which a Trading Advisor was or is a party or is threatened to be made a party arising out of or in connection with the respective Advisory Agreement or the management of the Trust’s or Trading Company’s assets by such Trading Advisor or the offering and sale of Units, the Managing Owner and the Trading Company will indemnify and hold harmless such Trading Advisor and its principals, officers, directors, members, managers, shareholders, partners, employees, and affiliates, or Principals and Affiliates, against any loss, liability, damage, cost, expense (including, without limitation, reasonable attorneys’ and accountants’ fees), judgments and amounts paid in settlement actually and reasonably incurred by them in connection with such Proceeding if such Trading Advisor acted in good faith and in a manner reasonably
84
Table of Contents
believed to be in, or not opposed to, the best interests of the Trust and the Trading Company and provided that its conduct did not constitute negligence, misconduct, or a breach of the Advisory Agreement; provided, however, that no indemnification shall be available from the Managing Owner if such indemnification is prohibited by Section 4.6(c) of the Trust Agreement. The termination of any Proceeding by judgment, order or settlement shall not, of itself, create a presumption that the Trading Advisor did not act in good faith and in a manner reasonably believed to be in or not opposed to the best interests of the Trust.
In addition, each Trading Advisor will indemnify and hold harmless the Managing Owner, the Trust, the Trustee, the Trading Company and each of their respective Principals and Affiliates against any loss, liability, damage, cost or expense (including, without limitation, reasonable attorneys’ and accountants’ fees), judgments and amounts paid in settlement actually and reasonably incurred by them (A) as a result of a breach of any representation, warranty or agreement of such Trading Advisor made in the Advisory Agreement or (B) as a result of act or omission of such Trading Advisor relating to the Trust or the Trading Company if there has been a final judicial or regulatory determination that such act or failure to act constituted a breach of the Advisory Agreement, misconduct or negligence on the part of the Trading Advisor; provided, however that such final judicial or regulatory determination shall not be required in the event of a settlement of any Proceeding with the prior written consent of the Trading Advisor.
BROKERAGE AGREEMENTS
Each of the Clearing Brokers have entered into Brokerage Agreements with some or all of the Trading Companies. As a result each Clearing Broker (i) acts as the Trading Companies’ executing and clearing broker, (ii) acts as custodian of the Trading Companies’ assets, (iii) assists with foreign currency, (iv) assists the Managing Owner in the performance of its administrative functions for the Trading Companies, and (v) performs such other services for the Trading Companies as the Managing Owner may from time to time request.
As executing and clearing brokers for each of the Trading Companies, the Clearing Brokers receive each Trading Advisor’s orders for trades. Generally, when the Trading Advisor gives an instruction either to sell or buy a particular foreign currency forward contract, the Trust engages in back-to-back principal trades with the Clearing Brokers in order to carry out the Trading Advisor’s instructions. In back-to-back currency transactions, a Clearing Broker, as principal, arranges bank lines of credit and contracts to make or to take future delivery of specified amounts of the currency at the negotiated price. The Clearing Broker, again as principal, in turn contracts with each Trading Company to make or take future delivery of the same specified amounts of currencies at the same price. In these transactions, such Clearing Broker acts in the best interests of the Trading Company.
Confirmations of all executed trades for each Series are given to the Trading Company by the Clearing Brokers. The Brokerage Agreement incorporates the Clearing Brokers’ standard customer agreements and related documents, which generally include provisions that (i) all funds, commodities and open or cash positions carried for each Trading Company will be held as security for that Trading Company’s obligations to the Clearing Broker; (ii) the margins required to initiate or maintain open positions will be as from time to time established by the Clearing Brokers and may exceed exchange minimum levels; and (iii) each Clearing Broker may close out positions, purchase commodities or cancel orders at any time it deems necessary for its protection, without the consent of the Trading Company.
As custodian of the Trading Companies’ assets, the Clearing Brokers are responsible, among other things, for providing periodic accountings of all dealings and actions taken by each Trading Company during the reporting period, together with an accounting of all securities, cash or other indebtedness or obligations held by it or its nominees for or on behalf of each Trading Company on behalf of each Series of the Trust.
Administrative functions provided by the Clearing Brokers for each Trading Company include, but are not limited to, preparing and transmitting daily confirmations of transactions and monthly statements of account, calculating equity balances and margin requirements.
85
Table of Contents
As long as the Brokerage Agreement between it and the Trading Company is in effect, each Clearing Broker will not charge the Trading Company a fee for any of the services it has agreed to perform, except for the agreed-upon brokerage fee. See “Fees and Expenses.”
Each Futures Brokerage Agreement is not exclusive and runs for successive one-year terms to be renewed automatically each year unless terminated. Each Banc of America Securities Futures Brokerage Agreement is terminable by any Trading Company or Banc of America Securities without penalty upon sixty (60) days’ prior written notice. Each UBS Securities Futures Brokerage Agreement is terminable by any Trading Company or UBS Securities without penalty upon thirty (30) days’ prior written notice (unless where certain events of default occur or there is a material adverse change in such Trading Company’s financial position, in which case only prior written notice is required to terminate the UBS Securities Brokerage Agreement). Each Man Financial Futures Brokerage Agreement is terminable by Man Financial where certain events of default occur. The Deutsche Bank FX Prime Brokerage Agreement is terminable by the Managing Owner or Deutsche Bank without penalty upon twenty (20) Business Days’ prior written notice (unless where certain events of default occur, in which case the Deutsche Bank FX Prime Brokerage Agreement may be terminated immediately at the time of such occurrence). The Swap Agreement is terminable by either party thereto upon twenty (20) days’ notice where certain events of default occur.
The Futures Brokerage Agreement with UBS Securities provides that neither UBS Securities nor any of its managing directors, officers, employees or affiliates shall be liable for any costs, losses, penalties, fines, taxes and damages sustained or incurred by any Trading Company other than as a result of UBS Securities negligence or reckless or intentional misconduct or breach of such agreement.
The Futures Brokerage Agreement with Banc of America Securities provides that Banc of America Securities shall not be liable for any loss, cost, expense or damage to any Trading Company other than as a result of Banc of America Securities’ gross negligence, willful misconduct or fraud.
The Futures Brokerage Agreement with Man Financial provides that Man Financial shall not be liable for any loss, liability, damage or expense to any Trading Company other than as a result of Man Financial’s negligence, willful misconduct or fraud. The FX Prime Brokerage Agreement with Deutsche Bank provides that Deutsche Bank shall not be liable for any loss, fees or expenses to any Trading Company which has retained Deutsche Bank resulting from any error or discrepancy in any information provided by Deutsche Bank.
SELLING AGENT AGREEMENT
Each of the Selling Agents will enter into a selling agent agreement, or each, a Selling Agent Agreement, with the Trust and the Managing Owner. As a result, each Selling Agent will act as a selling agent for the Trust on a “best efforts” basis.
Each Selling Agent, in recommending to any person the purchase or sale of Units, will use commercially reasonable efforts to determine, on the basis of information obtained from the prospective purchaser concerning the prospective purchaser’s investment objectives, the prospective purchaser’s other investments and the prospective purchaser’s financial situation and needs, and any other information known by the Selling Agent through the review of its offeree questionnaire completed by such prospective purchaser and maintain in the Selling Agent’s files documents disclosing the basis upon which the determination of suitability was reached as to each purchaser.
Pursuant to the Selling Agent Agreement, each Selling Agent has no commitment with regard to the sale of the Units other than to use its best efforts. In connection with the offer, sale and distribution of the Units, each Selling Agent has agreed that it will comply fully with all applicable laws and regulations, and the rules, policy statements and interpretations of the NASD, the SEC, the CFTC, state securities administrators and any other regulatory or self-regulatory body. Each Selling Agent has agreed that it will not execute any sales of Units from a discretionary account over which it has control without prior written approval of the customer in whose name such discretionary account is being maintained.
86
Table of Contents
Each Selling Agent Agreement will be terminated at the conclusion of the Continuous Offering Period with respect to each Series. Prior to the conclusion of the Continuing Offering Period, each Selling Agent Agreement may be terminated by the Selling Agent, at the Selling Agent’s option, by giving thirty (30) days’ notice to the Trust and the Managing Owner, in the event (i) there is, since the respective dates as of which information is given in the Registration Statement, any material adverse change in the condition, financial or otherwise, of the Trust or the Managing Owner which, in the judgment of the Selling Agent, renders it inadvisable to proceed with the offer and sale of the Units; (ii) the Registration Statement and/or the Prospectus is not amended promptly after written request by the Selling Agent for it to be so amended because an event has occurred which, in the opinion of counsel for the Selling Agent, should be set forth in the Registration Statement or the Prospectus in order to make the statements therein not misleading; (iii) any of the conditions specified in Section 7 of the Selling Agent Agreement are not fulfilled when and as required by the Selling Agent Agreement to be fulfilled; (iv) there is a general suspension of, or a general limitation on prices for, trading in commodity futures or option contracts on commodity exchanges in the United States or other commodities instruments, or there is any other national or international calamity or crisis in the financial markets of the United States to the extent that it is determined by the Selling Agent, in its discretion, that such limitations would materially impede the Trust’s trading activities or make the offering or delivery of the Units impossible or impractical; (v) there is a declaration of a banking moratorium by Federal, New York or Delaware authorities. In addition, each Selling Agent Agreement may be terminated with respect to a Series by written agreement among the parties to the Selling Agent Agreement.
The Selling Agent shall not be liable to the Trust, the Trustee or the Managing Owner for any act or failure to act of the Selling Agent in connection with the performance of services under this Agreement, if such act or failure to act on the part of the Selling Agent or its Principals or Affiliates did not constitute negligence, misconduct or a breach of any of the representations, warranties, covenants or agreements of the Selling Agent contained in the Selling Agent Agreement.
The Managing Owner and the Trust will indemnify and hold harmless the Selling Agent and its Principals and Affiliates from and against any and all loss, liability, claim, damage, expense, fine, penalty, cost or expense (including, without limitation, attorneys’ and accountants’ fees and disbursements), judgments and amounts paid in settlement, or Losses, to which the Selling Agent or its Principals and Affiliates may become subject arising out of or in connection with the Selling Agent Agreement, the transactions contemplated thereby or the fact that the Selling Agent is or was a selling agent of the Trust arising out of or based upon (i) any untrue statement of material fact contained in the Selling Agent Agreement, the Prospectus or any application or written communication executed by the Managing Owner or the Trust filed in any jurisdiction in order to qualify the Units under the securities laws thereof, or the Documents, (ii) any omission from the Documents of a material fact required to be stated therein or necessary to make the statements therein not misleading, or (iii) any breach of any representation, warranty, covenant or agreement made by the Managing Owner or the Trust in the Selling Agent Agreement, except to the extent that any such Losses arise out of, relate to, or are based upon the Selling Agent’s failure to meet the standard of liability applicable to it under the Selling Agent Agreement.
The Selling Agent agrees to indemnify and hold harmless the Trust, the Trustee and the Managing Owner and the Principals and Affiliates of the Trustee and the Managing Owner from and against all Losses incurred by any of them arising out of or based upon the Selling Agent’s failure to meet the standard of liability set forth in the Selling Agent Agreement.
TRUST AGREEMENT
The rights and duties of the Trustee, the Managing Owner and the Limited Owners are governed by provisions of the Trust Act and by the Trust Agreement which is attached as Exhibit A to the Statement of Additional Information. The key features of the Trust Agreement which are not discussed elsewhere in the Prospectus are outlined below, but reference is made to the Trust Agreement for complete details of all of its terms and conditions.
87
Table of Contents
Trustee
Wilmington Trust Company is the Trustee of the Trust and serves as the Trust’s sole trustee in the State of Delaware. The Trustee is permitted to resign upon sixty (60) days’ notice to the Trust, provided, that any such resignation will not be effective until a successor Trustee is appointed by the Managing Owner. The Trust Agreement provides that the Trustee will be compensated by the Managing Owner or its affiliates, and the Trustee will be indemnified by the Managing Owner against any expenses (as defined in the Trust Agreement) it incurs relating to or arising out of the formation, operation or termination of the Trust or the performance of its duties pursuant to the Trust Agreement, except to the extent that such expenses result from the negligence or willful misconduct of the Trustee. The Managing Owner has the discretion to retain the Trustee or replace the Trustee with a new trustee.
Only the Managing Owner has signed the Registration Statement of which this Prospectus is a part, and the assets of the Trustee are not subject to issuer liability under the Federal securities laws for the information contained in this Prospectus and under Federal and state law with respect to the issuance and sale of the Units. Under such laws, neither the Trustee, either in its capacity as Trustee or in its individual capacity, nor any director, officer or controlling person of the Trustee is, or has any liability as, the issuer or a director, officer or controlling person of the issuer of the Units. The Trustee’s liability in connection with the issuance and sale of the Units, and with respect to the Trust’s obligations under the Units, is limited solely to the express obligations of the Trustee set forth in the Trust Agreement. See “The Trustee” under “Description of The Trust, Trustee, Managing Owner and Affiliates.”
Management Responsibilities of the Managing Owner
Under the Trust Agreement, the Trustee of the Trust has delegated to the Managing Owner the exclusive management and control of all aspects of the business of the Trust. The Trustee has no duty or liability to supervise or monitor the performance of the Managing Owner, nor shall the Trustee have any liability for the acts or omissions of the Managing Owner. In addition, the Managing Owner has been designated as the “tax matters partner” for purposes of the Code. The Limited Owners will have no voice in the operations of the Trust, other than certain limited voting rights which are set forth in the Trust Agreement. See “Termination,” “Election or Removal of Managing Owner,” “Exercise of Rights by Limited Owners” and “Amendments and Meetings” under this heading. In the course of its management, the Managing Owner may, in its sole and absolute discretion, appoint an Affiliate or Affiliates of the Managing Owner as additional managing owners (except where Limited Owners having Units representing at least a majority of the Net Asset Value of each Series have notified the Managing Owner that the Managing Owner is to be replaced as the managing owner) and retain such persons, including Affiliates of the Managing Owner, as it deems necessary for the efficient operation of the Trust.
Transfer of Units
Subject to compliance with suitability standards imposed by the Trust, applicable Federal securities and state “Blue Sky” laws (See “Who May Subscribe.”) and the rules of other governmental authorities, the Units may be assigned at your election, upon notice to the Managing Owner on a form acceptable to the Managing Owner. The Managing Owner shall refuse to recognize an assignment only if necessary, in its judgment, to maintain the treatment of the Trust as a partnership for Federal income tax purposes or to preserve the characterization or treatment of Series income or loss and upon receipt of an opinion of counsel supporting its conclusion. The Managing Owner will exercise this right by taking any actions as it deems necessary or appropriate in its reasonable discretion so that such transfers or assignments of rights are not in fact recognized and that the assignor or transferor continues to be recognized as a beneficial owner of Series Units for all purposes, including the payment of any cash distribution. Notwithstanding the foregoing, and except for certain situations set forth in the Trust Agreement, no assignment may be made if such assignment would result in (a) a contravention of the NASAA Guidelines, as adopted in any state where the proposed assignor and assignee reside, including the current restriction that generally prohibits transfers or assignments of Units in one or more
88
Table of Contents
Series valued at less than $1,000 (with no minimum in the case of Plans (including IRAs), employees or family members of an employee of the Managing Owner or its affiliates or charitable organizations) or transfers or assignments of Units in such amounts as would result in your or permitted assignees’ having an aggregate investment in all Series of less than $1,000 (with no minimum in the case of Plans (including IRAs), employees or family members of an employee of the Managing Owner or its affiliates or charitable organizations), unless the proposed transfer relates to your aggregate Units in all Series or unless the proposed transfer is a transfer by gifts, inheritance, intrafamily transfer, family dissolution or a transfer to affiliates; or (b) the aggregate total of Units transferred in a twelve-month period equaling forty-nine percent (49%) or more of the outstanding Units (taking into account applicable attribution rules and excluding transfers by gift, bequest, or inheritance). The Trust Agreement provides that the Managing Owner will incur no liability to any investor or prospective investor for any action or inaction by it in connection with the foregoing, provided it acted in good faith.
Assignments to (i) your ancestors or descendants (ii) the personal representative or heir of a deceased Limited Owner, (iii) the trustee of a trust to which you are a beneficiary or another person to whom a transfer could otherwise be made, or (iv) the shareholders, partners or beneficiaries of a corporation, partnership or trust upon its termination or liquidation, shall be effective as of the day immediately following the day in which the Managing Owner receives the written instrument of assignment. Assignments or transfers of Units to any other person shall be effective on the next succeeding day, provided the Managing Owner shall have been in receipt of the written instrument of assignment for at least two (2) Business Days.
An assignee may become a substituted Limited Owner only with the written consent of the Managing Owner, which consent may be withheld in the Managing Owner’s sole and absolute discretion as described above. Upon receipt by the Managing Owner of (i) a duly executed and acknowledged, written instrument of assignment, (ii) an opinion of the Trust’s independent counsel, rendered upon the Managing Owner’s request, that such assignment will not jeopardize the Trust’s tax classification as a partnership and that the assignment will not violate the Trust Agreement or the Trust Act and (iii) such other documents as the Managing Owner deems necessary or desirable to effect such substitution, the Managing Owner may accept the assignee as a substituted Limited Owner. A permitted assignee who does not become a substituted Limited Owner shall be entitled to receive the share of the profits or the return of capital to which his assignor would otherwise be entitled, but shall not be entitled to vote, to receive any information on or an account of the Series’ transactions or to inspect the books of the Series. Under the Trust Agreement an assigning Limited Owner is not released from its liability to the Trust for any amounts for which he may be liable under the Trust Agreement (see “Redemption of Units” and “Liabilities” under this heading), whether or not the assignee to whom he has assigned Units becomes a substituted Limited Owner. All Limited Owners are responsible for all costs relating to the assignment or transfer or their own Units.
Exchange Privilege
Once trading commences for the Series in which you have invested, you may exchange, your Units in such Series for Units in another Series which has also commenced trading, each such transaction, an Exchange. Exchanges will be available between the various Classes 1 of the Series, and Exchanges will be available between the various Classes 2 of the Series. However, Exchanges will not be allowed from Class 1 to Class 2 or vice versa. In addition, you will only be allowed to Exchange your Units in one Series for Units in another Series which is registered for sale in your State. Furthermore, Exchanges will be allowed out of the Graham Series, but Exchanges into the Graham Series will be restricted to those investors that have purchased their Units through a Selling Agent that acts as a selling agent for the Graham Series. An Exchange will be treated as a redemption of Units in one Series and an immediate purchase of Units in another Series. Each Unit purchased in an Exchange will be issued and sold at a price per Unit equal to 100% of the Net Asset Value of a Unit of the new Series as of the Valuation Point immediately preceding the date upon which notice of the Exchange, or the Request for Exchange, is provided to the Managing Owner. An exchanging Limited Owner may realize a taxable gain or loss in connection with the Exchange.
89
Table of Contents
Each Exchange is subject to satisfaction of the conditions governing redemption on the applicable day, as well as the requirement that the Series being exchanged into is then offering registered Units. The Net Asset Value of Units to be exchanged, as well as the Units to be acquired, on the applicable Valuation Point may be higher or lower than it is on the date that the Request for Exchange is submitted due to the potential fluctuation in the Net Asset Value per Unit of each Series. In addition, see “Redemption of Units.” To effect an Exchange, a Request for Exchange must be submitted to the Managing Owner on a timely basis (i.e., at 4:00 PM NYT at least two (2) Business Days prior to the day on which the Exchange is to become effective). The Managing Owner, in its sole and absolute discretion, may change the notice requirement upon written notice to you. You must request an Exchange on the Request for Exchange form attached as Exhibit C to the Statement of Additional Information.
If you Exchange all or a portion of your Class 1 Units of the Balanced Series, Winton Series, Campbell/Graham Series, Currency Series, Graham Series or Long/Short Commodity Series or your Class 1a Units of the Balanced Series for Class 1 Units of the Long Only Commodity Series or the Managed Futures Index Series on or before the end of twelve (12) full months following the effective date of the purchase of the Units being Exchanged, the Long Only Commodity Series or the Managed Futures Index Series, as applicable, will charge you an exchange equalization fee for switching into the Long Only Commodity Series or the Managed Futures Index Series of 1.0% of the Net Asset Value at which your Units are Exchanged to reimburse the Managing Owner for the prepaid initial service fee of the Series you are Exchanging out of, which is charged at a higher rate than the initial service fee of the Long Only Commodity Series or the Managed Futures Index Series. Depending on the number of months that have elapsed since the purchase of Class 1 Units of the Balanced Series, Winton Series, Campbell/Graham Series, Currency Series, Graham Series or Long/Short Commodity Series or Class 1a Units of the Balanced Series being Exchanged, the total amount of initial service fees and exchange equalization fees which you will pay may exceed 3.0%. No exchange charges will be imposed for all other Exchanges.
Redemption of Units
Units or any portion thereof held by the Limited Owners (or any assignee thereof) may be redeemed on the day of the week after the date the Managing Owner is in receipt of a redemption request for at least one (1) Business Day, or a Redemption Date, to be received by the Managing Owner prior to 4:00 PM NYT in order for the redemption to be effective as of the next Business Day. The Managing Owner, in its sole and absolute discretion, may change the notice requirement upon written notice to you. Except as set forth below, Units will be redeemed at a redemption price equal to 100% of the Net Asset Value per Unit of the applicable Series, calculated as of the Valuation Point immediately preceding the relevant Redemption Date. Accordingly, Limited Owners bear the risk of any decline in Net Asset Value from the date notice of intent to redeem is given until the Valuation Point. Class 1 Units of any Series redeemed on or before the end of the first twelve- month period after their effective dates will be subject to a redemption fee of up to 3.0% of the Net Asset Value at which they are redeemed unless the redemption is part of an Exchange for Class 1 Units of another Series offered hereby. Such redemption fees are paid to the Managing Owner.
In the event that the estimated Net Asset Value per Unit of a Series, after adjustment for distributions, as of the close of business of any Business Day is less than 50% of the Net Asset Value per Unit of a Series as of the last Valuation Point (i.e., the close of business of the immediately preceding Business Day), a special redemption period shall be established, Limited Owners will be given notice of such event within seven (7) Business Days of such occurrence. Trading in such Series shall be temporarily suspended during such special redemption period. In addition, the twentieth (20th) Business Day following the notification by the Managing Owner to the Limited Owners of a decline in the Net Asset Value per Unit of any Series to less than 50% of the Net Asset Value per Unit of such Series as of the immediately preceding day shall be deemed a special redemption date.
The Net Asset Value per Unit upon redemption on any date also will reflect all accrued expenses for which the applicable Series is responsible, including incentive fees, if any (including incentive fees which may be due
90
Table of Contents
and owing other than at the end of a quarter), and will be reduced by such Unit’s pro rata portion of any expenses or losses incurred by the Series resulting from such redeeming Limited Owner (and his assignee, if any) unrelated to the Series’ business, as well as the Limited Owner’s liabilities for certain Series taxes, if any, or for liabilities resulting from violations of the transfer provisions in the Trust Agreement. Limited Owners shall be notified in writing within seven (7) Business Days following the Redemption Date whether or not their Units shall be redeemed, unless payment for the redeemed Units is made within that seven-Business Day period, in which case notice shall not be required. Except as otherwise provided in the Trust Agreement, in the case of extraordinary circumstances, payment normally shall be made within seven (7) Business Days following the Redemption Date. You may revoke your intention to redeem before the Redemption Date by written instruction to the Managing Owner.
All timely requests for redemption in proper form will be honored and the applicable Series’ commodity positions will be liquidated to the extent necessary to effect such redemptions. The Managing Owner may suspend temporarily any redemption if the effect of the redemption, either alone or in conjunction with other redemptions, would be to impair the Trust’s ability to operate in pursuit of its objectives (for example, if the Managing Owner believes a redemption, if allowed, would advantage one investor over another investor). The Managing Owner anticipates suspending redemptions only under extreme circumstances, such as in the event of a natural disaster, force majeure, act of war, terrorism or other event which results in the closure of financial markets. Such suspension of redemptions would last a maximum of thirty (30) days. The right to obtain redemption also is contingent upon the Series’ having property sufficient to discharge its liabilities on the date of redemption. In the event that a Series has insufficient assets net of liabilities to satisfy all requests for redemption, redemption requests will be processed in a “First-In, First-Out” order. Redemption requests of investors affiliated with the Trust, the Managing Owner, a Trading Advisor or their respective affiliates will not receive favorable treatment over non-affiliated investors. It is also contingent upon timely receipt by the Managing Owner of a request for redemption in the form attached as Exhibit D to the Statement of Additional Information (or any other form approved by the Managing Owner). Redemption requests may be mailed or otherwise delivered to the Managing Owner.
The Trust Agreement provides that the Managing Owner also has the right mandatorily to redeem, upon two (2) days’ prior notice acknowledged by you, Units of any Limited Owner if (a) the Managing Owner determines that the continued participation of such Limited Owner in the Trust might cause the Trust or any Unitholder to be deemed to be holding “plan assets” under ERISA; (b) there is an unauthorized assignment or transfer pursuant to the Trust Agreement; or (c) in the event that any transaction would or might violate any law or constitute a prohibited transaction under ERISA or the Code and a statutory, class or individual exemption from the prohibited transaction provisions of ERISA for such transaction or transactions does not apply or cannot be obtained from the DOL (or the Managing Owner determines not to seek such an exemption).
If you are redeeming Class 1 Units of a Series within the first twelve (12) months following your purchase of Units, you will be charged an early redemption fee. See “Fees and Expenses.”
Termination
Unless earlier dissolved, the term of the Trust and each Series in the Trust shall expire on December 31, 2053. The Trust or, as the case may be, any Series shall also be dissolved upon the occurrence of any of the following events:
(a) The filing of a certificate of dissolution or the revocation of the Managing Owner’s charter (and the expiration of 90 days after the date of notice to the Managing Owner of revocation without a reinstatement of its charter) or the withdrawal, removal, adjudication of bankruptcy or insolvency of the Managing Owner, or each of the foregoing, an Event of Withdrawal, unless (i) at the time there is at least one remaining managing owner and that remaining managing owner carries on the business of the Trust or (ii) within 90 days of an Event of Withdrawal, all the remaining Unitholders in each Series agree in writing to continue the business of the Trust
91
Table of Contents
and to select, as of the date of such Event of Withdrawal, one or more successor managing owners. Within 120 days of any Event of Withdrawal, if action is not taken pursuant to (i) or (ii) and the Trust and each Series are dissolved, Limited Owners of each Series holding Units representing at least a majority (over 50%) of the Net Asset Value of the Series (without regard for Units held by the Managing Owner or its Affiliates) may elect to continue the business of the Trust and each Series by forming a new statutory trust, or the Reconstituted Trust, on the same terms and provisions set forth in the Trust Agreement. Any such election must also provide for the election of a Managing Owner to the Reconstituted Trust. If such election is made, all Limited Owners will be bound thereby and continue as Limited Owners of the Reconstituted Trust;
(b) The occurrence of any event that makes the continued existence of the Trust or any Series in the Trust unlawful, as the case may be;
(c) With respect to a Series, the failure to sell the Subscription Minimum of such Series to subscribers during the Initial Offering Period;
(d) The suspension, revocation or termination of the Managing Owner’s registration as a CPO under the CE Act, as amended, or membership as a CPO with the NFA, unless at the time there is at least one remaining Managing Owner whose registration or membership has not been suspended, revoked or terminated;
(e) The Trust or, as the case may be, any Series becomes insolvent or bankrupt;
(f) The Limited Owners holding Units representing at least a majority (over 50%) of the Net Asset Value of a Series (which excludes the Units of the Managing Owner) vote to dissolve the Series, notice of which is sent to the Managing Owner not less than ninety (90) Business Days prior to the effective date of such Series’ termination;
(g) The Limited Owners of each Series holding Units representing at least a majority (over 50%) of the Net Asset Value of the Series (excluding Units held by the Managing Owner or an Affiliate) vote to dissolve the Trust, with 90 days’ prior written notice to the Managing Owner; or
(h) The decline of the Net Asset Value of a Series by 50% or more from the Net Asset Value of the Series (i) as of the commencement of the Series’ trading activities or (ii) on the first day of a fiscal year, in each case after appropriate adjustment for distributions, redemptions, reallocations and additional contributions to capital.
A Series may also dissolve, in the discretion of the Managing Owner, upon the determination of the Managing Owner that the Series’ aggregate Net Asset Value in relation to the operating expenses of the Series makes it unreasonable or imprudent to continue the business of the Series. The Managing Owner is not required to, and should not be expected to, obtain an opinion of legal counsel or any other third party prior to determining to dissolve any Series in the Trust.
Upon dissolution of the Trust or a Series, its affairs shall be wound up, its liabilities discharged and its remaining assets distributed pro rata to the Unitholders. To the extent the Trust or the Series has open positions at such time, it will use its best efforts to close such positions, although no assurance can be given that market conditions might not delay such liquidation and that amounts received thereon will not be less than if market conditions permitted an immediate liquidation. If all Series are terminated, the Trust will terminate.
The Trust Agreement provides that the death, legal disability, bankruptcy or withdrawal of a Limited Owner will not terminate or dissolve the Series (unless such Limited Owner is the sole Limited Owner of the Trust) or the Trust and that the legal representatives of such Limited Owner have no right to withdraw or value his, her or its Units except by redemption of Units pursuant to the Trust Agreement.
92
Table of Contents
Net Asset Value
“Net Asset Value of a Series” means the total assets in the Trust Estate of a Series including, but not limited to, all cash and cash equivalents (valued at cost plus accrued interest and amortization of original issue discount) less total liabilities of the Series, each determined on the basis of generally accepted accounting principles in the United States, consistently applied under the accrual method of accounting, including, but not limited to, the extent specifically set forth below:
(a) Net Asset Value of a Series shall include any unrealized profit or loss on open commodities positions, and any other credit or debit accruing to the Series but unpaid or not received by the Series.
(b) All open commodity futures contracts and options traded on a United States exchange are calculated at their then current market value, which shall be based upon the settlement price for that particular commodity futures contract and option traded on the applicable United States exchange on the date with respect to which Net Asset Value of a Series is being determined; provided, that if a commodity futures contract or option traded on a United States exchange could not be liquidated on such day, due to the operation of daily limits or other rules of the exchange upon which that position is traded or otherwise, the settlement price on the first subsequent day on which the position could be liquidated shall be the basis for determining the market value of such position for such day. The current market value of all open commodity futures contracts and options traded on a non-United States exchange shall be based upon the liquidating value for that particular commodity futures contract and option traded on the applicable non-United States exchange on the date with respect to which Net Asset Value of a Series is being determined; provided, that if a commodity futures contract or option traded on a non- United States exchange could not be liquidated on such day, due to the operation of rules of the exchange upon which that position is traded or otherwise, the liquidating value on the first subsequent day on which the position could be liquidated shall be the basis for determining the market value of such position for such day. The current market value of all open forward contracts entered into by a Series shall be the mean between the last bid and last asked prices quoted by the bank or financial institution which is a party to the contract on the date with respect to which Net Asset Value of a Series is being determined; provided, that if such quotations are not available on such date, the mean between the last bid and asked prices on the first subsequent day on which such quotations are available shall be the basis for determining the market value of such forward contract for such day. The Managing Owner may in its discretion value any of the Trust Estate pursuant to such other principles as it may deem fair and equitable so long as such principles are consistent with normal industry standards.
(c) Interest earned on a Series commodity brokerage account shall be accrued at least daily.
(d) The amount of any distribution made pursuant to Article VI of the Trust Agreement shall be a liability of the Series from the day when the distribution is declared until it is paid.
“Net Asset Value of a Series per Unit” means the Net Asset Value of a Series divided by the number of Units of a Series outstanding on the date of calculation.
Reports and Accounting
The Trust maintains its books on the accrual basis. The financial statements of each Series in the Trust will be prepared in accordance with accounting principles generally accepted in the United States of America and will be audited at least annually by independent certified public accountants designated by the Managing Owner, in its sole discretion. The Managing Owner shall submit any information, including but not limited to reports and statements required to be distributed to Limited Owners, required to be filed with any official or agency of a state in which Units of the Trust are registered to such official or agency. Each Limited Owner is furnished with unaudited monthly and certified annual reports containing such information as the CFTC and NFA require. A current annual report of the Trust is attached to this Prospectus starting at page Fin.-1, and current monthly reports for a Series accompany this Prospectus to all new subscribers after trading in such Series commences.
93
Table of Contents
The CFTC requires that an annual report be provided not later than one hundred and twenty (120) days after the end of each fiscal year or the permanent cessation of trading as defined in the CE Act, whichever is earlier and set forth, among other matters:
1) the Net Asset Value of the Series and the Net Asset Value per Unit per Series or the total value of your interest in the Trust, in either case, as of the end of the year in question and the preceding year;
2) a Statement of Financial Condition as of the close of the fiscal year and, if applicable, the preceding fiscal year;
3) Statements of Income (Loss) and Changes in Limited Owners’ Capital during the fiscal year and, to the extent applicable, the previous two fiscal years; and
4) appropriate footnote disclosure and such further material information as may be necessary to make the required statements not misleading.
The CFTC also requires that an unaudited monthly report be distributed to each Limited Owner within thirty (30) days of the end of each month containing information presented in the form of a Statement of Income (Loss) and a Statement of Changes in Net Asset Value.
The Statement of Income (Loss) must set forth, among other matters:
1) the total amount of realized net gain or loss on commodity interest positions liquidated during the month;
2) the change in unrealized net gain or loss on commodity interest positions during the month;
3) the total amount of net gain or loss from all other transactions in which a Series is engaged; and
4) the total amounts of management fees, advisory fees, brokerage fees and other fees for commodity and other investment transactions, and all other expenses incurred or accrued by the Trust during the month.
The Statement of Changes in Net Asset Value must itemize the following:
1) the Net Asset Value of the Series as of the beginning and end of the month;
2) the total amount representing redemptions of Units during the month;
3) the total net income or loss of the Series during the month; and
4) the Net Asset Value per Unit or the total value of your interest in the Trust as of the end of the month.
The monthly report also is required to describe any other material business dealings between the Trust, the Managing Owner, the Trading Advisors, the Clearing Brokers, the Selling Agents or any affiliate of any of the foregoing.
Limited Owners also will be furnished with such additional information as the Managing Owner, in its discretion, deems appropriate, as well as any other information required to be provided by any governmental authority having jurisdiction over the Trust.
Net Asset Value is calculated for each Business Day as required. Upon request, the Managing Owner will make available to any Limited Owner the Net Asset Value per Unit for a Series. Each Limited Owner will be notified of any decline in the Net Asset Value per Unit of a Series to less than fifty percent (50%) of the Net Asset Value per Unit as of the last Valuation Point. Included in such notification will be a description of the Limited Owners’ voting and redemption rights. See “Redemption of Units,” above.
In addition, the Managing Owner will furnish you with tax information in a form which may be utilized in the preparation of your Federal income tax returns which is anticipated to be distributed no later than March 15.
94
Table of Contents
The books and records maintained by the Trust will be kept for eight (8) fiscal years at its principal office. The Limited Owners have the right to obtain information about all matters affecting the Trust, provided that such is for a purpose reasonably related to the Limited Owner’s interest in the Trust, and to have access at all times during normal business hours to the Trust’s books and records in person or by their authorized attorney or agent and to examine such books and records in compliance with CFTC rules and regulations. The Managing Owner will maintain (at the Managing Owner’s principal office) a current list, in alphabetical order, of the names and last known addresses and, if available, business telephone numbers of, and number of Units owned by, all Unitholders; a copy of the Trust Certificate and all certificates of amendment thereto, together with executed copies of any powers of attorney pursuant to which any certificate has been executed; copies of the Trust’s Federal, state and local income tax returns and reports, if any; and copies of any effective written Trust Agreements, Subscription Agreements and any financial statements of the Trust for the six (6) most recent years. Such information will be made available at reasonable times for inspection and copying by any Limited Owner or his representative for any purpose reasonably related to the Limited Owner’s interest as a beneficial owner of the Trust during ordinary business hours. The Managing Owner will furnish a copy of the list of Limited Owners to you or your representative within ten days of a request therefor for any purpose reasonably related to your interest as a Limited Owner in the Trust (including, without limitation, matters relating to your voting rights under the Trust Agreement or the exercise of your rights under Federal proxy laws) upon request and upon payment of the reasonable cost of reproduction and mailing; provided, however, that if you are requesting such list, you must give written assurances that it will not be used for commercial purposes. Subject to applicable law, you must give the Managing Owner at least ten (10) Business Days’ prior written notice for such inspection or copying by you or your authorized attorney or agent. Each Limited Owner will be notified of any material change in the Advisory Agreements or in the compensation of any party within seven (7) Business Days thereof and will be provided with a description of any material effect on the Units such changes may have.
Summary of Critical Accounting Policies
The preparation of financial statements in conformity with accounting principles generally accepted in the United States of America, or GAAP, requires the Managing Owner to adopt accounting policies and make estimates and assumptions that affect amounts reported in the Trust’s financial statements. The Managing Owner believes that the Trust’s critical accounting policies and related estimates and judgments underlying the financial statements will be as identified below.
Investment Transactions and Valuation—The Trust will record investment transactions on trade date and all investments will be recorded at fair value in its financial statements, with changes in fair value reported as a component of Trading Profits (Losses) in the Statements of Income (Loss). Generally, fair values will be based on quoted market prices; however, in certain circumstances, significant judgments and estimates may be required in determining fair value in the absence of an active market closing price.
In applying these policies, the Managing Owner may make judgments that can frequently require estimates about matters that are inherently uncertain. The Managing Owner shall provide a good faith estimate of the daily Net Asset Value for each Series based on such uncertain information. The Managing Owner’s good faith estimates of each Series’ Net Asset Value will be published daily by the Trust and shall be used for subscriptions, redemptions and exchanges of all Trust Units, and such Unit transactions shall be final and not subject to subsequent adjustment unless the estimate of Net Asset Value varies from the actual Net Asset Value by more than one percent (1.0%) of the Actual Net Asset Value.
Distributions
Other than as limited by the Trust Agreement, the Managing Owner has sole discretion in determining the amount and frequency of distributions. However, you have the right to redeem a portion or all of your Units in accordance with the redemption procedures contained in the Trust Agreement. See “Redemption of Units,” above. In the event any type of distribution is declared, each Unitholder will receive an amount of such
95
Table of Contents
distribution in proportion to the interest in the Series held by him, as of the record date of distribution. Any distribution shall become a liability of the Series for purposes of calculating Net Asset Value as of the date of its declaration until it is paid. See “Federal Income Tax Consequences—Cash Distributions, Redemptions and Exchanges of Units” for the income tax effect of such distributions.
Sharing of Profits and Losses
Each investor in a Series has a tax capital account and a book capital account. The initial balance of each will be the amount paid for the Units in the Series. For the purposes of an Investor’s book capital account, at the end of each Business Day, the amount of any increase or decrease in the Net Asset Value per Unit from the preceding Business Day is credited to or charged against the book capital account of each investor for that Series.
For purposes of an Investor’s tax capital account, all items of income, gain, loss and deduction of each Series will be allocated among holders of the Units in such Series at the end of each fiscal year of the Trust. The allocation will be made as follows: First, all items that arise other than from a disposition of Series assets will be allocated among the Limited Owners based on their respective book capital accounts as of the days on which such items arose. Second, each Series’ aggregate recognized gain, if any, shall be allocated among the Limited Owners who redeemed or exchanged Units to the extent of the excess of the book capital account balances attributable to the redeemed or exchanged Units over the tax capital account balances attributable to those Units. Third, each Series’ remaining aggregate recognized gain, if any, shall be allocated among the Limited Owners whose book capital account balance exceeds its tax capital account, until such excess is eliminated. Any remaining aggregate recognized gain will be allocated among all Unitholders in proportion to their respective book capital account balances. Each Series’ aggregate recognized loss, if any, shall then be allocated among the Limited Owners who redeemed or exchanged Units to the extent of the excess of the tax capital account balances attributable to the redeemed or exchanged Units over the book capital account balances attributable to those Units. Next, each Series’ aggregate recognized loss, if any, will be allocated to each Unit whose tax capital account balance exceeds the book capital account balance of such Units until such excess has been eliminated. Any remaining aggregate recognized loss will be allocated among all Unitholders who were Unitholders in proportion to their respective book capital account balances. Notwithstanding the foregoing, loss will not be allocated to a Unit (and instead will be allocated to the Managing Owner) to the extent that allocating such loss to such Unit would cause the book capital account balance of such Unit to be reduced below zero.
Liabilities
Liability of Series
The Trust is formed in a manner such that each the Trust, with respect to each Series, will be liable only for obligations attributable to such Series and Limited Owners will not be subject to the losses or liabilities of any Series in which they have not invested. In the event that any creditor or Limited Owner of Units in any particular Series asserted against the Trust a valid claim with respect to its indebtedness or Units, the creditor or Limited Owner would only be able to recover money from that particular Series and its assets and from the Managing Owner and its assets. Accordingly, the debts, liabilities, obligations, claims and expenses, or collectively, Claims, incurred, contracted for or otherwise existing solely with respect to a particular Series will be enforceable only against the assets of that Series and against the Managing Owner and its assets, and not against any other Series or the Trust generally or any of their respective assets. The assets of any particular Series include only those funds and other assets that are paid to, held by or distributed to the Trust on account of and for the benefit of that Series, including, without limitation, funds delivered to the Trust for the purchase of Units in a Series. This limitation on liability is referred to as the “Inter-Series Limitation on Liability.” The Inter-Series Limitation on Liability is expressly provided for under Section 3804(a) of the Trust Act, which provides that if certain conditions (as set forth in Section 3804(a)) are met, then the debts of any particular Series will be enforceable only against the assets of such series and not against the trust generally.
In furtherance of the Inter-Series Limitation on Liability, the Managing Owner will use its best efforts to ensure that every party, including the Limited Owners, the Trustee and all parties providing goods or services to
96
Table of Contents
the Trust, any Series or the Managing Owner on behalf of the Trust or any Series, will consent in writing, or a Written Consent, to: (i) the Inter-Series Limitation on Liability with respect to such party’s Claims or Units; (ii) voluntarily reduce the priority of its Claims against and Units in the Trust or any Series or their respective assets, such that its Claims and Units are junior in right of repayment to all other parties’ Claims against and Units in the Trust or any Series or their respective assets, except that (a) Units in the particular Series that such party purchased pursuant to a Subscription Agreement or similar agreement and (b) Claims against the Trust where recourse for the payment of such Claims was, by agreement, limited to the assets of a particular Series, will not be junior in right of repayment, but will receive repayment from the assets of such particular Series (but not from the assets of any other Series or the Trust generally) equal to the treatment received by all other creditors and Limited Owners that dealt with such Series and (iii) a waiver of certain rights that such party may have under the United States Bankruptcy Code, if such party held collateral for its Claims, in the event that the Trust is a debtor in a chapter 11 case under the United States Bankruptcy Code, to have any deficiency Claim (i.e., the difference, if any, between the amount of the Claim and the value of the collateral) treated as an unsecured Claim against the Trust generally or any other Series.
Limited Owner Liability
Your capital contribution is subject to the risks of the each Series’ trading and business. The Trust Act provides that, except to the extent otherwise provided in the Trust Agreement, you shall be entitled to the same limitation of personal liability extended to stockholders of private corporations for profit organized under the General Corporation Law of the State of Delaware. No similar statutory or other authority limiting statutory or business trust beneficial owner liability exists in many other states. As a result, to the extent that you or the Trust is subject to the jurisdiction of courts in those states, the courts may not apply Delaware law, and may thereby subject you to liability. To guard against this risk, the Trust Agreement (i) provides for indemnification to the extent of the Series’ assets of any Limited Owner against claims of liability asserted against such Limited Owner solely because he or it is a beneficial owner of the Trust; and (ii) requires that every written obligation of the Trust contain a statement that such obligation may only be enforced against the assets of the applicable Series provided that the omission of such disclaimer is not intended to create personal liability for any Unitholder. Thus, subject to the exceptions set forth in the Trust Agreement and described below, your risk of incurring financial loss beyond your investment because of liability as a beneficial owner is limited to circumstances in which (i) a court refuses to apply Delaware law; (ii) no contractual limitation on liability was in effect; and (iii) the Trust or the applicable Series itself would be unable to meet its obligations. Moreover, and perhaps more importantly, the Managing Owner has agreed in the Trust Agreement for the benefit of the Limited Owners and any third parties that it will be liable for all obligations of the Trust in excess of the Trust’s assets as if it were the general partner of a limited partnership.
In addition, while, as stated above, a Limited Owner in the Trust generally cannot lose more than his or its investment and his or its share of the Trust’s profits, the Trust Agreement provides that you may incur liability (i) in the event the Trust is required to make payments to any Federal, state or local or any foreign taxing authority in respect of any Unitholder’s allocable share of Trust income, in which case such Unitholder shall be liable for the repayment of such amounts; (ii) to indemnify the Trust if the Trust incurs losses (including expenses) as a result of any claim or legal action to which the Trust is subject which arises out of your obligations or liabilities unrelated to the Trust’s business, (iii) to indemnify the Trust and each Unitholder against any losses or damages (including tax liabilities or loss of tax benefits) arising as a result of any transfer or purported transfer of your Unit in violation of the Trust Agreement, and (iv) if the Subscription Agreement you delivered in connection with your purchase of Units contains misstatements.
Moreover, the Trust Agreement provides that, subject to the exceptions referred to above, the Trust will not make a claim against you with respect to amounts distributed to you or amounts received by you upon redemption of Units unless under Delaware law you are liable to repay such amounts. Except as set forth above, assessments of any kind shall not be made of the Limited Owners. Except as provided under Delaware law and by the Trust Agreement, each Unit, when issued, will be fully paid and non-assessable. Except as indicated above, losses in excess of the Trust’s assets will be the obligation of the Managing Owner.
97
Table of Contents
Election or Removal of Managing Owner
The Managing Owner may be removed on reasonable prior written notice by Limited Owners holding Units representing at least a majority (over 50%) of the Net Asset Value of each Series (not including Units held by the Managing Owner). The Trust Agreement provides that the Managing Owner may voluntarily withdraw as managing owner of the Trust provided that it gives the Limited Owners one hundred twenty (120) days’ prior written notice and its withdrawal as Managing Owner is approved by Limited Owners holding Units representing at least a majority (over 50%) of the Net Asset Value of each Series (not including Units held by the Managing Owner). The Trust Agreement provides that if the Managing Owner elects to withdraw as Managing Owner to the Trust and it is the sole Managing Owner, Limited Owners holding Units representing at least a majority (over 50%) of the Net Asset Value of each Series (not including Units held by the Managing Owner) may vote to elect, prior to such withdrawal, a successor managing owner to carry on the business of the Trust. If the Managing Owner withdraws as managing owner and the Limited Owners or remaining Managing Owners elect to continue the Trust, the withdrawing Managing Owner shall pay all expenses incurred as a result of its withdrawal. The Trust Agreement further provides that in the event of the withdrawal of the Managing Owner, the Managing Owner shall be entitled to redeem its General Units in each Series of the Trust at their Net Asset Value as of the next permissible Redemption Date. See “Trust Agreement—Management Responsibilities of the Managing Owner.”
Alternatively, the Trust Agreement provides that if the Trust is dissolved as a result of an Event of Withdrawal (as defined in Article XIII of the Trust Agreement) of a Managing Owner, then within one hundred and twenty (120) days of such Event of Withdrawal, Limited Owners holding Units representing a majority (over 50%) of the Net Asset Value of each Series (not including Units held by the managing Owner) may elect to form a new statutory trust on the same terms as set forth in the Trust Agreement and continue the business of the Trust and elect a new managing owner.
Exercise of Rights by Limited Owners
Limited Owners holding Units representing in excess of fifty percent (50%) of the Net Asset Value of each Series (excluding Units held by the Managing Owner and its Affiliates) must approve any material change in a Series’ trading policies, which change will not be effective without such approval. See “Trading Limitations and Policies.” In addition, Limited Owners holding Units representing in excess of fifty percent (50%) of the Net Asset Value of each Series (excluding Units held by the Managing Owner and its Affiliates) may vote to adopt amendments to the Trust Agreement proposed by the Managing Owner or by Limited Owners holding Units representing at least ten percent (10%) of the Net Asset Value of a Series. See “Amendments and Meetings” below. Additionally, Limited Owners holding Units representing at least a majority (over 50%) of the Net Asset Value of a Series (excluding Units held by the Managing Owner and its Affiliates) may vote to (i) terminate and dissolve the Series upon ninety (90) days’ prior notice to the Managing Owner, (ii) remove the Managing Owner on reasonable prior written notice to the Managing Owner, (iii) elect one or more additional Managing Owners, (iv) approve the voluntary withdrawal of the Managing Owner and elect a successor managing owner in the event the Managing Owner is the sole managing owner of the Trust, (v) approve the termination of any agreement between the Trust and the Managing Owner or its Affiliates for any reason, without penalty, and (vi) approve a material change in the trading policies of the Trust or a Series, and, in the case of (iii) and (v) on sixty (60) days’ prior written notice.
Indemnification
The Trust Agreement provides that with respect to any action in which the Managing Owner or any of its affiliates is a party because of its relationship to the Trust, the Trust shall indemnify and hold harmless to the full extent permitted by law such person against any losses, judgments, liabilities, expenses and amounts paid in settlement of any claims sustained by such person in connection with each Series of the Trust, provided that (1) the Managing Owner was acting on behalf of or performing services for the Trust and has determined, in good faith, that such course of conduct was in the best interests of the Trust and such liability or loss was not the
98
Table of Contents
result of negligence, misconduct or a breach of the Trust Agreement on the part of the Managing Owner or its affiliates and (2) any such indemnification will only be recoverable from the assets of each Series of the Trust. All rights to indemnification permitted by the Trust Agreement and payment of associated expenses will not be affected by the dissolution or other cessation to exist of the Managing Owner, or the withdrawal, adjudication of bankruptcy or insolvency of the Managing Owner. The Trust Agreement further provides that any such indemnification of the Managing Owner or any of its Affiliates, unless ordered by a court, shall be made by the Trust only as authorized in the specific case and only upon a determination by independent legal counsel in a written opinion that indemnification of the Managing Owner is proper in the circumstances because it has met the applicable standard of conduct set forth in the Trust Agreement. Expenses incurred in defending a threatened or pending action or proceeding against the Managing Owner may be paid by each Series (on a pro rata basis, as the case may be) in advance of the final disposition of such action if (i) the legal action relates to the performance of duties or services by the Managing Owner or an Affiliate on behalf of the Trust; (ii) the legal action is initiated by a third party who is not a Limited Owner or the legal action is initiated by a Limited Owner and a court of competent jurisdiction specifically approves such advancement; and (iii) the Managing Owner undertakes to repay the advanced funds to each Series (on a pro rata basis, as the case may be) with interest, in the event indemnification is subsequently held not to be permitted. No indemnification of the Managing Owner or its Affiliates is permitted for liabilities or expenses arising under Federal or state securities laws unless (i) there has been a successful adjudication on the merits of each count involving alleged securities law violations as to the particular indemnitee and the court approves the indemnification of such expenses (including, without limitation, litigation costs); (ii) such claims have been dismissed with prejudice on the merits by a court of competent jurisdiction as to the particular indemnitee and the court approves the indemnification of such expenses (including, without limitation, litigation costs; or (iii) a court of competent jurisdiction approves a settlement of claims against a particular indemnitee and finds that indemnification of the settlement and related costs should be made. Insofar as indemnification for liabilities arising under the Securities Act may be permitted to the Managing Owner or its affiliates, the Managing Owner has been advised that in the opinion of the SEC such indemnification is against public policy as expressed in the Securities Act, and is therefore unenforceable.
In any claim for indemnification in actions involving alleged Federal or state securities laws violations, the party seeking indemnification must place before the court the position of the SEC, the position of the Tennessee Securities Division and any other applicable state securities division which requires disclosure with respect to the issue of indemnification for securities law violations. The Trust Agreement also provides that with respect to any action taken by the Managing Owner as “tax matters partner,” including consenting to an audit, the Trust shall indemnify and hold harmless the Managing Owner.
Amendments and Meetings
The Trust Agreement may be amended in certain respects by a vote of the Limited Owners holding Units representing at least a majority (over 50%) of the Net Asset Value of each Series (which excludes the Units of the Managing Owner), either pursuant to a written vote or at a duly called meeting of the Limited Owners. An amendment may be proposed by the Managing Owner or by Limited Owners holding Units equal to at least ten percent (10%) of the Net Asset Value of each Series, unless the proposed amendment affects only certain Series, in which case such amendment may be proposed by Limited Owners holding Units equal to ten percent (10%) of the Net Asset Value of each affected Series. Unitholders will be supplied with a verbatim copy of any proposed amendment which potentially could affect them and statements concerning the legality thereof. It is not anticipated that the Managing Owner will call any annual meetings of the Limited Owners.
The Managing Owner may, without the consent of the Limited Owners, make amendments to the Trust Agreement which are necessary to (i) add to the representations, duties or obligations of the Managing Owner or to surrender any right or power of the Managing Owner, for the benefit of the Limited Owners, (ii) cure any ambiguity, (iii) correct or supplement any provision of the Trust Agreement which may be inconsistent with any other provision of the Trust Agreement or this Prospectus, or (iv) make any other provisions with respect to matters or questions arising under the Trust Agreement that the Managing Owner deems advisable, provided, however, that no such amendment shall be adopted unless the amendment is not adverse to the interests of the
99
Table of Contents
Limited Owners, is consistent with the Managing Owner’s management of the Trust pursuant to Section 3806 of the Trust Act, does not affect the allocation of profits and losses to them or among them, and does not adversely affect the limited liability status of the Limited Owners or the status of the Trust as a partnership for Federal income tax purposes. The Managing Owner further may, without the consent of the Limited Owners, amend the provisions of the Trust Agreement relating to the allocations among Limited Owners of profits, losses and distributions if it is advised by its accountants or counsel that any such allocations are unlikely to be upheld for Federal income tax purposes.
Meetings of the Trust may be called by the Managing Owner. In addition, meetings will be called upon receipt by the Managing Owner of a written request signed by Limited Owners holding Units equal to at least ten percent (10%) of the Net Asset Value of a Series. Thereafter, the Managing Owner shall give written notice to all Limited Owners, in person or by certified mail within fifteen (15) days after such receipt, of such meeting and its purpose. Such meeting must be held at least thirty (30) but not more than sixty (60) days after the receipt of such notice. Any action permitted to be taken at a meeting may be taken without a meeting on written approval of the Limited Owners holding Units of the percentage required to approve any such action if a meeting were held.
Fiscal Year
The Trust’s fiscal year shall begin on January 1 of each year and end on December 31 of each year, except that (i) the first fiscal year of the Trust commenced on August 8, 2003, the date the Certificate of Trust was filed, and (ii) the fiscal year in which the Trust terminates shall end on the date of termination of the Trust.
100
Table of Contents
FEDERAL INCOME TAX CONSEQUENCES
The following constitutes the opinion of Arnold & Porter LLP and summarizes the material Federal income tax consequences of the purchase, ownership and disposition of Units in the Trust.
This opinion is based on current law, which is subject to change (including retroactive changes) or to possible differing interpretations. It is not intended as a complete analysis of all potential Federal income tax considerations relating to your purchase, ownership and disposition of Units, and does not address all aspects of taxation that may be relevant to you in light of your individual circumstances (including the effect of any foreign, state or local tax laws). Unless otherwise expressly indicated, this opinion is addressed and applies only to Limited Owners who are individuals who are citizens or residents of the United States and is not addressed to corporate Limited Owners or to certain other types of Limited Owners subject to special treatment under Federal income tax laws (such as persons not citizens or residents of the United States, tax-exempt entities, partnerships or other pass-through entities, or dealers in commodities).
We urge you to consult your own tax advisor regarding the Federal, state, local and foreign income tax consequences to you of the purchase, ownership and disposition of Units in light of your individual tax circumstances, and of the effects of possible changes in the tax laws.
U.S. Treasury Circular 230 Notice
The tax discussion contained in this Prospectus was not intended or written to be used, and cannot be used, for the purpose of avoiding Federal tax penalties. This discussion was written to support the promotion or marketing of the transactions or matters addressed in this Prospectus. You should seek advice based on your particular circumstances from an independent tax advisor.
The Trust’s Tax Status
In the opinion of Arnold & Porter LLP, counsel to the Trust and the Managing Owner, (1) the Trust will be treated as a partnership for Federal income tax purposes and, assuming that at least 90% of the gross income of the Trust will constitute “qualifying income” within the meaning of Section 7704(d) of the Code, the Trust will not be a publicly traded partnership treated as a corporation, and (2) the discussion set forth in this Prospectus under the heading “Federal Income Tax Consequences” correctly summarizes the material Federal income tax consequences as of the date of this Prospectus to potential investors of the purchase, ownership and disposition of Units in the Trust.
You should be aware, however, that the opinion of Arnold & Porter LLP is subject to the qualifications and assumptions set forth in the opinion and in this Prospectus, is based on facts described in this Prospectus, relies on certain certifications of the Managing Owner and is based upon current legislative, judicial and administrative interpretations of existing Federal income tax law. In addition, the opinion represents counsel’s legal judgment and is not binding on the Service or the courts.
Taxation of the Trust’s Profits and Losses
You must pay tax on your distributable share of the Trust’s income and gains for each year even if the Trust does not make any cash distributions to you.
The Trust generally will allocate the income, gains and losses of each Series on a daily basis among Limited Owners who hold Units in the Series as described above. If you redeem any Units in a Series or exchange Units in one Series for Units in another Series, however, you will be allocated a disproportionate amount of the Series’ gains and losses if necessary to increase your adjusted tax basis in the redeemed or exchanged Units to the value of those Units. This will have the effect of causing you to recognize a tax gain or tax loss equal to the appreciation or depreciation in the redeemed or exchanged Units. Your adjusted tax basis in your Units generally equals the amount
101
Table of Contents
that you paid for the Units increased by income or gains allocated to you with respect to the Units and decreased (but not below zero) by distributions, deductions and losses allocated to you with respect to the Units.
Character of the Trust’s Income, Gains and Losses
Interest
Interest earned by the Trust, as well as interest earned on subscription funds on deposit with the Escrow Agent during the Initial Offering Period, will be ordinary income.
Bonds and Other Securities
Gains and losses from dispositions and short sales of bonds and other securities by the Trust generally will be capital gains and losses. Such capital gains or losses will be long term if the Trust has held the bonds or other securities for more than one year.
Options and Futures Contracts
Certain options and futures contracts, known as “Section 1256 contracts,” are subject to special tax rules. Section 1256 contracts include certain futures contracts, options, and foreign currency contracts. Section 1256 contracts that remain open on the last business day of a tax year are marked to market and gain or loss is recognized for tax purposes as if the contracts had been sold on that day at fair market value.
Gain or loss attributable to Section 1256 contracts is generally treated as 40% short-term capital gain or loss and 60% long-term capital gain or loss, regardless of how long they were held. However, gain or loss with respect to dealer equity options or dealer securities futures contracts allocable to limited partners is treated entirely as short-term capital gain or loss. The Service has ruled that specific categories of market makers that satisfy quotation-related criteria will be treated as dealers in securities futures contracts for purposes of this exception to the general rule of Section 1256. To the extent that the Trust recognizes gain or loss with respect to dealer equity options or dealer securities futures contracts, such gain or loss would be treated as short-term capital gain or loss to the Limited Owners.
Gain or loss is not recognized with respect to an option or futures contract that is not a Section 1256 contract until the option is exercised, the sale is made pursuant to the futures contract, or the option or futures contract is sold, exchanged, lapses, or is terminated. Gain or loss attributable to non-Section 1256 contracts will generally be short-term capital gain or loss because the Trust generally will hold such contracts for less than one year.
Income Tax Rates
Short-term capital gains and ordinary income of the Trust that are allocated to you (such as interest, net gain on capital assets held one year or less, and 40% of the gain on Section 1256 contracts) will be taxed at a maximum Federal rate of 35%. Long-term capital gains of the Trust that are allocated to you (such as net gain on capital assets held more than one year and 60 percent of the gain on Section 1256 contracts) generally will be taxed at a maximum Federal rate of 15% for sales that occur before January 1, 2011 and, under current law, 20% for sales occurring thereafter.
Deductibility of Losses
Your ability to deduct losses allocated to you by the Trust is limited by several rules. You may deduct Trust losses only to the extent of your adjusted tax basis in your Units. You may only deduct losses to the extent of your “at-risk” amount, which is calculated in a manner that is similar to the calculation of your adjusted tax basis, except that the “at risk” amount does not include any amount borrowed on a nonrecourse basis by the Trust or from someone with an interest in the Trust.
You may deduct capital losses only to the extent of your short-term or long-term capital gains for the year, plus $3,000 ($1,500 if you are married and you and your spouse file separate returns). You may thus not be able
102
Table of Contents
to deduct all of the losses the Trust allocates to you in the year in which those losses are allocated. You may also be required in any year to pay taxes on your share of the Trust’s interest income even though the Trust allocated losses to you in excess of that interest income.
You generally may not carry back capital losses to offset gains in prior years. You may, however, generally elect to carry back losses realized from trading in Section 1256 contracts to each of the three preceding years as an offset against Section 1256 contract gains in those years.
Capital losses that you cannot deduct in any year are carried over indefinitely to future years.
Passive-Activity Loss Rules and Their Effect on the Treatment of Income and Loss
The Trust’s trading activities will not be a “passive activity.” Therefore, the passive activity loss rules will not result in any tax losses of the Trust attributable to those trading activities being nondeductible (but such losses may be subject to other deductibility limitations described in this summary, such as the limitation on deductibility of capital losses discussed above). Similarly, your share of the Trust’s gains from trading activities will not constitute passive income and may not be offset by your losses from passive activities.
Organizational and Syndication Expenses
The Managing Owner will pay, without reimbursement, all costs related to the organization of the Trust and the offering of Units, except for the initial service fee, if any. Therefore, no deductions for organizational expenses will pass through to you. The Service may take the position that certain expenses the Trust allocates to you as deductible expenses are non-deductible syndication expenses. Syndication expenses (i.e., expenses related to the issuance or marketing of Units) are not deductible and may not be amortized, even though such expenses will reduce Net Asset Value if paid by the Trust.
Cash Distributions, Redemptions and Exchanges of Units
You will not be taxed on any cash distributions or partial redemption payments from the Trust until the aggregate amount you receive exceeds your adjusted tax basis in all of your Units. If you receive distributions or redemption payments in excess of your adjusted tax basis, you will recognize gain equal to the excess. Tax rules do not permit recognition of a loss upon a partial redemption of your Units. If you receive a cash payment in complete redemption of all of your Units, you will recognize gain or loss for Federal income tax purposes equal to the difference between the amount of cash you receive and your adjusted tax basis in your Units. The gain or loss will be characterized as long-term or short-term capital gain or loss depending on whether you held the Units for more than one year. Exchanges will be treated as redemptions followed by the purchase of Units in the new Series for Federal income tax purposes, with the fair market value of the Units received in the exchange treated as the amount of the redemption payment.
Limitation on Deductibility of Investment Advisory Expenses
You are subject to certain limitations on your ability to deduct investment advisory expenses because those expenses are characterized for Federal tax purposes as miscellaneous itemized deductions. The Trust intends to treat management and advisory fees and certain other Trust expenses as fully deductible business expenses for Federal income tax purposes. The Service may, however, characterize such expenses as investment advisory expenses or, alternatively, assert that such expenses should be capitalized.
Limitation on Deductibility of Investment Interest
You may deduct investment interest (including your share of the Trust’s investment interest) only to the extent of your net investment income. Investment interest includes interest on indebtedness allocable to property held for investment. Net investment income does not include net long-term capital gain unless you elect to treat that gain as ordinary income rather than capital gain. Investment interest expense that cannot be deducted because of this limitation may be carried over to the following taxable year.
103
Table of Contents
Fund Audit Procedures
The Service audits Trust-related items at the Trust level rather than at the Limited Owner level. The Managing Owner acts as “tax matters partner” with the authority to determine the Trust’s responses to an audit. If an audit results in an adjustment, you may be required to pay additional taxes, interest and penalties.
Tax Shelter Regulations
Regulations applicable to tax shelters may require the Trust to maintain a list of the names and taxpayer identification numbers of Limited Owners who are U.S. persons, which may be subject to disclosure to the Service upon its request. In addition, the regulations may require each such Limited Owner to make certain annual disclosures to the Service with respect to its investment in the Trust. Published guidance on these regulations indicates that the tax shelter disclosure requirements should not apply with respect to a loss transaction where the loss arises from certain “mark-to-market” provisions of the Code. The Managing Owner expects that some or all of the investments made by the Trust will satisfy this exception, but there can be no assurance that the tax shelter regulations are not otherwise applicable to you. Significant penalties may be imposed for failure to make the required disclosures of investment in tax shelters to the Service.
Tax-Exempt Limited Owners
Based on the expected income and activities of the Trust, a tax-exempt U.S. Limited Owner generally should not be required to pay tax on its share of income or gains of the Trust so long as it is not treated as using borrowed funds in connection with its purchase of Units.
Foreign Limited Owners
A non-resident alien individual who is not otherwise engaged in a United States trade or business should not be deemed to be engaged in a United States trade or business solely as a result of the purchase of Units in the Trust. Capital gains and interest earned by the Trust and allocated to such a foreign Limited Owner will, as a general rule, not be subject to Federal income or withholding tax, provided the foreign Limited Owner satisfies applicable certification requirements. However, capital gains and interest earned by the Trust may be subject to tax in other jurisdictions in which the foreign Limited Owner is subject to taxation. Certain interest income that the Trust might earn may be subject to a 30% (or lower treaty rate) Federal withholding tax.
Non-public personal information received by the Trust and the Managing Owner with respect to investors who are natural persons, including the information provided to the Trust by such investors in the subscription documents, will not be shared with nonaffiliated third parties which are not service providers to the Trust and the Managing Owner without prior notice to such investors. Such service providers include but are not limited to the auditors and the legal advisors of the Trust. The Trust and the Managing Owner may disclose such nonpublic personal information as required by law. See “Exhibit G—Privacy Notice.”
Legal matters in connection with this offering have been passed upon for the Trust and the Managing Owner by Arnold & Porter LLP, 399 Park Avenue, New York, New York 10022. Certain legal matters relating to Delaware law have been passed upon for the Trust and the Managing Owner by Richards, Layton & Finger, P.A., One Rodney Square, 920 N. King Street, Wilmington, Delaware 19801. Arnold & Porter LLP acts as counsel generally for the Managing Owner and advises the Managing Owner with respect to its responsibilities as Managing Owner of, and with respect to matters relating to, the Trust. Arnold & Porter LLP also represents certain affiliates of the Managing Owner from time to time in various matters, and it is expected they will continue to represent such entities in the future.
104
Table of Contents
INDEPENDENT REGISTERED PUBLIC ACCOUNTING FIRMS
McGladrey and Pullen LLP is the Trust’s independent registered public accounting firm. For years ended December 31, 2004 and prior, Deloitte & Touche LLP was the Trust’s independent registered public accounting firm.
The Trust has filed with the SEC in Washington, D.C. a registration statement covering all Series of Units on Form S-1, as amended, or the Registration Statement, with respect to the securities offered hereby. This Prospectus does not contain all of the information set forth in the Registration Statement, certain portions of which have been omitted pursuant to the rules and regulations of the SEC, including, without limitation, certain exhibits attached to the Registration Statement (e.g., the Selling Agreement, the Escrow Agreement, and the Brokerage Agreements). A copy of the Registration Statement has also been provided to the NFA, Chicago, Illinois. The descriptions contained herein of agreements included as exhibits to the Registration Statement are necessarily summaries. Reference is made to the Registration Statement, including the exhibits attached thereto, for further information with respect to the Trust and each Series’ securities. You may read and copy the registration statement and the exhibits to the registration statement at the SEC public reference room located at 450 Fifth Street N.W., Washington, D.C. 20549. You may obtain information on the operation of the public reference room be calling the SEC at 1-800-SEC-0330. The registration statement is also available on the SEC’s website at http://www.sec.gov, which contains reports, proxy and information statements and other information regarding companies that file electronically with the SEC.
The consolidated financial statements of the Trust as of December 31, 2005 appearing in this Prospectus have been audited by McGladrey & Pullen, LLP, an independent registered public accounting firm, to the extent and for the periods indicated in their report appearing elsewhere herein, which report expresses an unqualified opinion and are included in reliance upon such report and upon the authority of such firm as experts in accounting and auditing.
The consolidated statement of financial condition of the Managing Owner as of December 31, 2005 appearing in this Prospectus has been audited by McGladrey & Pullen, LLP, an independent registered public accounting firm, to the extent and for the periods indicated in their report appearing elsewhere herein, which report expresses an unqualified opinion and is included in reliance upon such report and upon the authority of such firm as experts in accounting and auditing.
The statements of financial condition of the Trust as of December 31, 2004, including the condensed schedules of investments as of December 31, 2004, and the related statements of operations and changes in owners’ capital for the year ended December 31, 2004, included in this Prospectus have been audited by Deloitte & Touche LLP, independent registered public accounting firm, as stated in their report appearing herein and is included in reliance upon the report of such firm given upon their authority as experts in accounting and auditing.
The statements referred to under “Federal Income Tax Consequences” have been reviewed by Arnold & Porter LLP and are included in reliance upon their authority as experts in tax law in the United States.
105
Table of Contents
CERTAIN FINANCIAL INFORMATION
| Page | ||
THE FRONTIER FUND | ||
Statements of Financial Condition, September 30, 2006 (Unaudited) | Fin. - 2 | |
| Fin. - 5 | ||
Condensed Statements of Operations for the Nine Months Ended September 30, 2006 and 2005 (Unaudited) | Fin. - 8 | |
| Fin. - 11 | ||
Notes to Financial Statements as of September 30, 2006 (Unaudited) | Fin. - 16 | |
| Fin. - 28 | ||
| Fin. - 29 | ||
Statements of Financial Condition, December 31, 2005 and 2004 | Fin. - 30 | |
| Fin. - 32 | ||
| Fin. - 33 | ||
Statements of Operations For the Years Ended December 31, 2005 and 2004 | Fin. - 34 | |
Statements of Changes in Owners’ Capital For the Years Ended December 31, 2005 and 2004 | Fin. - 36 | |
Notes to Financial Statements As of December 31, 2005, and December 31, 2004 | Fin. - 39 | |
EQUINOX FUND MANAGEMENT, LLC | ||
| Fin. - 50 | ||
| Fin. - 51 | ||
| Fin. - 52 | ||
Fin. - 1
Table of Contents
PART I. FINANCIAL INFORMATION
ITEM 1. Financial Statements
Statements of Financial Condition
September 30, 2006 and December 31, 2005
| Balanced Series | Winton Series (2) | Campbell/Graham Series (1) | ||||||||||||||||
| 9/30/2006 | 12/31/2005 | 9/30/2006 | 12/31/2005 | 9/30/2006 | 12/31/2005 | |||||||||||||
| (Unaudited) | (Unaudited) | (Unaudited) | ||||||||||||||||
ASSETS | ||||||||||||||||||
Cash and cash equivalents | $ | 47,815,176 | $ | 12,994,278 | $ | 261,265 | $ | 198,255 | $ | 13,760,722 | $ | 3,114,605 | ||||||
Short-term investments | 108,758,871 | 99,549,452 | — | 1,413,937 | 31,471,672 | 16,436,045 | ||||||||||||
Cash held at futures commodity merchants | 24,102,302 | 19,097,934 | — | — | 8,653,770 | 5,019,359 | ||||||||||||
Open trade equity | 2,280,466 | 7,145,996 | — | — | 416,029 | 97,185 | ||||||||||||
Investments in unconsolidated trading companies | — | 3,949,182 | 55,712 | 626,070 | 7,946,464 | 5,129,155 | ||||||||||||
Inter-series receivables | 68,537,289 | — | — | — | — | — | ||||||||||||
Prepaid service fees—Class 1 | 1,670,491 | 1,034,673 | 26 | 10,946 | 385,415 | 294,429 | ||||||||||||
Incentive fees receivable from Managing Owner | — | — | 532 | — | — | — | ||||||||||||
Receivable from related parties | 1,119,382 | — | — | 329 | 514,779 | 110,889 | ||||||||||||
Other assets | 92,157 | 82,549 | 249 | 2,063 | 26,313 | 18,257 | ||||||||||||
Total Assets | $ | 254,376,134 | $ | 143,854,064 | $ | 317,784 | $ | 2,251,600 | $ | 63,175,164 | $ | 30,219,924 | ||||||
| LIABILITIES & OWNERS’ CAPITAL | ||||||||||||||||||
LIABILITIES | ||||||||||||||||||
Inter-series payables | $ | — | $ | — | $ | — | $ | — | $ | 5,227,298 | $ | — | ||||||
Pending owner additions | 680,184 | 1,368,927 | — | 5,000 | 144,500 | 586,595 | ||||||||||||
Owner redemptions payable | 106,793 | 10,588 | — | — | 136,022 | 9,687 | ||||||||||||
Incentive fees payable to Managing Owner | 29,127 | 654,345 | — | 12,209 | — | — | ||||||||||||
Management fees payable to Managing Owner | 69,190 | 54,370 | 163 | 3,282 | 106,341 | 47,266 | ||||||||||||
Interest fees payable to Managing Owner | 288,611 | 133,428 | 188 | 3,753 | 86,180 | 39,251 | ||||||||||||
Trading fees payable to Managing Owner | 77,484 | 54,371 | 41 | 821 | 21,266 | 9,453 | ||||||||||||
Payables to related parties | 13,300 | 20,690 | 5,676 | 922 | 149,535 | 2,547 | ||||||||||||
Other liabilities | 193,932 | 2,416 | 32 | 60 | 31,016 | 535 | ||||||||||||
Total Liabilities | 1,458,621 | 2,299,135 | 6,100 | 26,047 | 5,902,158 | 695,334 | ||||||||||||
MINORITY INTERESTS | 3,248,736 | 5,588,701 | — | 9,069,799 | 5,116,544 | |||||||||||||
OWNERS’ CAPITAL | ||||||||||||||||||
Managing Owner Units—Class 1 | 183 | — | 1,003 | — | — | — | ||||||||||||
Managing Owner Units—Class 2 | 1,683,832 | 1,087 | 310,681 | 1,163 | 594,939 | 968 | ||||||||||||
Limited Owner Units—Class 1 | 206,577,926 | 114,741,316 | — | 2,047,247 | 42,189,229 | 21,561,490 | ||||||||||||
Limited Owner Units—Class 2 | 41,406,836 | 21,223,825 | — | 177,143 | 5,419,039 | 2,845,588 | ||||||||||||
Total Owners’ Capital | 249,668,777 | 135,966,228 | 311,684 | 2,225,553 | 48,203,207 | 24,408,046 | ||||||||||||
Total Liabilities, Minority Interests and Owners’ Capital | $ | 254,376,134 | $ | 143,854,064 | $ | 317,784 | $ | 2,251,600 | $ | 63,175,164 | $ | 30,219,924 | ||||||
Units Outstanding | ||||||||||||||||||
Class 1 | 2,006,406 | 1,097,178 | 10 | 18,290 | 470,166 | 228,642 | ||||||||||||
Class 1a | 31,517 | N/A | N/A | N/A | N/A | N/A | ||||||||||||
Class 2 | 394,834 | 195,216 | 3,086 | 1,533 | 63,832 | 29,396 | ||||||||||||
Class 2a | 5,165 | N/A | N/A | N/A | N/A | N/A | ||||||||||||
Net Asset Value per Unit | ||||||||||||||||||
Class 1 | $ | 101.52 | $ | 104.58 | $ | 100.32 | $ | 111.93 | $ | 89.73 | $ | 94.30 | ||||||
Class 1a | $ | 91.49 | N/A | N/A | N/A | N/A | N/A | |||||||||||
Class 2 | $ | 107.92 | $ | 108.73 | $ | 100.68 | $ | 116.27 | $ | 94.22 | $ | 96.83 | ||||||
Class 2a | $ | 92.62 | N/A | N/A | N/A | N/A | N/A | |||||||||||
| (1) | The Campbell/Graham Series of the Trust commenced trading operations on February 11, 2005. |
| (2) | The Beach Series was renamed the Winton Series in May, 2006. (See Note 1) |
The accompanying notes are an integral part of these statements.
Fin. - 2
Table of Contents
The Frontier Fund
Statements of Financial Condition
September 30, 2006 and December 31, 2005
| Currency Series | Dunn Series | Graham Series | ||||||||||||||||
| 9/30/2006 | 12/31/2005 | 9/30/2006 | 12/31/2005 | 9/30/2006 | 12/31/2005 | |||||||||||||
| (Unaudited) | (Unaudited) | (Unaudited) | ||||||||||||||||
ASSETS | ||||||||||||||||||
Cash and cash equivalents | $ | 6,769,197 | $ | 483,973 | $ | 190,750 | $ | 98,068 | $ | 6,109,600 | $ | 822,215 | ||||||
Short-term investments | 11,399,735 | 1,490,688 | 340,202 | 403,646 | 13,709,276 | 5,015,459 | ||||||||||||
Cash held at futures commodity merchants | 1,543,854 | 875,159 | — | — | — | — | ||||||||||||
Open trade equity | 721,111 | 19,481 | — | — | — | — | ||||||||||||
Investments in unconsolidated trading companies | — | — | — | — | 4,452,889 | 1,640,031 | ||||||||||||
Prepaid service fees - Class 1 | 47,233 | 2,804 | 60 | 1,464 | 19,923 | 31,998 | ||||||||||||
Receivable from related parties | 1,337 | 91 | 28 | — | 1,293 | 1,917 | ||||||||||||
Other assets | 4,007 | 52 | 215 | 55 | 15,295 | 4,365 | ||||||||||||
Total Assets | $ | 20,486,474 | $ | 2,872,248 | $ | 531,255 | $ | 503,233 | $ | 24,308,276 | $ | 7,515,985 | ||||||
LIABILITIES & OWNERS’ CAPITAL | ||||||||||||||||||
LIABILITIES | ||||||||||||||||||
Liability to unconsolidated trading company | $ | — | $ | 472,669 | $ | 136,530 | $ | 166,524 | $ | — | $ | — | ||||||
Inter-series payables | 13,046,989 | — | — | — | 16,154,336 | — | ||||||||||||
Pending owner additions | 64,400 | 53,750 | — | 6,000 | 5,000 | 50,000 | ||||||||||||
Owner redemptions payable | — | — | — | — | 30,091 | 13,892 | ||||||||||||
Incentive fees payable to Managing Owner | — | — | — | — | — | — | ||||||||||||
Management fees payable to Managing Owner | 7,443 | 1,307 | — | — | 51,149 | 18,964 | ||||||||||||
Interest fees payable to Managing Owner | 33,267 | 1,519 | 404 | 577 | 39,202 | 12,542 | ||||||||||||
Trading fees payable to Managing Owner | 7,369 | 327 | 121 | 133 | 10,230 | 3,793 | ||||||||||||
Payables to related parties | 1,039,253 | — | 150,853 | 204 | 238,693 | 1,981 | ||||||||||||
Other liabilities | 6,062 | — | 1,415 | 354 | 7,233 | 129 | ||||||||||||
Total Liabilities | 14,204,783 | 529,572 | 289,323 | 173,792 | 16,535,934 | 101,301 | ||||||||||||
MINORITY INTERESTS | — | — | — | — | — | — | ||||||||||||
OWNERS’ CAPITAL | ||||||||||||||||||
Managing Owner Units—Class 2 | 87,995 | 2,059,895 | 833 | 902 | 368,210 | 857 | ||||||||||||
Limited Owner Units—Class 1 | 5,856,564 | 276,762 | 125,754 | 193,425 | 5,699,664 | 5,642,080 | ||||||||||||
Limited Owner Units—Class 2 | 337,132 | 6,019 | 115,345 | 135,114 | 1,704,468 | 1,771,747 | ||||||||||||
Total Owners’ Capital | 6,281,691 | 2,342,676 | 241,932 | 329,441 | 7,772,342 | 7,414,684 | ||||||||||||
Total Liabilities, Minority Interests and Owners’ Capital | $ | 20,486,474 | $ | 2,872,248 | $ | 531,255 | $ | 503,233 | $ | 24,308,276 | $ | 7,515,985 | ||||||
Units Outstanding | ||||||||||||||||||
Class 1 | 60,474 | 2,834 | 1,603 | 2,227 | 70,719 | 68,058 | ||||||||||||
Class 2 | 4,134 | 20,370 | 1,395 | 1,509 | 24,319 | 20,676 | ||||||||||||
Net Asset Value per Unit | ||||||||||||||||||
Class 1 | $ | 96.85 | $ | 97.66 | $ | 78.46 | $ | 86.83 | $ | 80.60 | $ | 82.90 | ||||||
Class 2 | $ | 102.83 | $ | 101.42 | $ | 83.30 | $ | 90.15 | $ | 85.23 | $ | 85.73 | ||||||
The accompanying notes are an integral part of these statements.
Fin. - 3
Table of Contents
The Frontier Fund
Statements of Financial Condition
September 30, 2006
| Long Only Commodity Series (1) 9/30/2006 | Long/Short 9/30/2006 | Managed Futures 9/30/2006 | |||||||
| (Unaudited) | (Unaudited) | (Unaudited) | |||||||
| ASSETS | |||||||||
Cash and cash equivalents | $ | 2,858,986 | $ | 11,058,216 | $ | 2,529,461 | |||
Short-term investments | 4,649,858 | 24,063,365 | 5,627,283 | ||||||
Cash held at futures commodity merchants | 4,355 | 4,680,761 | 1,698,889 | ||||||
Open trade equity | 1,010,576 | 524,294 | 89,689 | ||||||
Prepaid service fees—Class 1 | 31,929 | 291,588 | 935 | ||||||
Receivable from related parties | 1,343 | 30,597 | 22 | ||||||
Other assets | 4,964 | 18,509 | 7,073 | ||||||
Total Assets | $ | 8,562,011 | $ | 40,667,330 | $ | 9,953,352 | |||
| LIABILITIES & OWNERS’ CAPITAL | |||||||||
LIABILITIES | |||||||||
Inter-series payables | $ | 5,507,416 | $ | 18,995,293 | $ | 9,605,957 | |||
Pending owner additions | 49,000 | 208,200 | — | ||||||
Incentive fees payable to Managing Owner | — | 48,020 | — | ||||||
Management fees payable to Managing Owner | 8,184 | 108,973 | 16,998 | ||||||
Interest fees payable to Managing Owner | 6,620 | 31,237 | 8,022 | ||||||
Trading fees payable to Managing Owner | 3,282 | 15,567 | 4,250 | ||||||
Payables to related parties | 3,055 | — | 3,359 | ||||||
Other liabilities | 36 | 1,810 | 112 | ||||||
Total Liabilities | 5,577,593 | 19,409,100 | 9,638,698 | ||||||
MINORITY INTERESTS | — | — | — | ||||||
OWNERS’ CAPITAL | |||||||||
Managing Owner Units—Class 2 | 47,585 | 214,586 | 48,989 | ||||||
Limited Owner Units—Class 1 | 2,758,433 | 18,939,882 | 263,205 | ||||||
Limited Owner Units—Class 2 | 178,400 | 2,103,762 | 2,460 | ||||||
Total Owners’ Capital | 2,984,418 | 21,258,230 | 314,654 | ||||||
Total Liabilities, Minority Interests and Owners’ Capital | $ | 8,562,011 | $ | 40,667,330 | $ | 9,953,352 | |||
Units Outstanding | |||||||||
Class 1 | 28,784 | 199,744 | 2,771 | ||||||
Class 2 | 2,329 | 24,026 | 535 | ||||||
Net Asset Value per Unit | |||||||||
Class 1 | $ | 95.83 | $ | 94.82 | $ | 95.00 | |||
Class 2 | $ | 97.03 | $ | 96.49 | $ | 96.17 | |||
| (1) | The Long Only Commodity Series, Long/Short Commodity Series and the Managed Futures Index Series of the Trust received additional capital contributions to commence trading operations on February 24, 2006. |
The accompanying notes are an integral part of these statements.
Fin. - 4
Table of Contents
Condensed Statements of Operations
For the Three Months Ended September 30, 2006 and 2005
| Balanced Series | Winton Series (2) | Campbell/Graham Series (1) | |||||||||||||||||||||
| 9/30/2006 | 9/30/2005 | 9/30/2006 | 9/30/2005 | 9/30/2006 | 9/30/2005 | ||||||||||||||||||
| (Unaudited) | (Unaudited) | (Unaudited) | |||||||||||||||||||||
Investment Income: | |||||||||||||||||||||||
Interest—net | $ | 1,213,667 | $ | 303,549 | $ | 1,258 | $ | 4,142 | $ | 379,188 | $ | 35,023 | |||||||||||
Total Income | 1,213,667 | 303,549 | 1,258 | 4,142 | 379,188 | 35,023 | |||||||||||||||||
Expenses: | |||||||||||||||||||||||
Incentive Fees | 54,761 | 497,283 | — | 16,328 | 8,429 | 54,292 | |||||||||||||||||
Management Fees | 203,999 | 116,543 | 181 | 6,672 | 323,515 | 70,032 | |||||||||||||||||
Service Fees—Class 1 | 1,462,094 | 546,246 | 4 | 9,547 | 304,531 | 76,282 | |||||||||||||||||
Trading Fees | 211,881 | 122,082 | 45 | 1,668 | 64,677 | 14,012 | |||||||||||||||||
Total Expenses | 1,932,735 | 1,282,154 | 230 | 34,215 | 701,152 | 214,618 | |||||||||||||||||
Investment gain/(loss)—net | (719,068 | ) | (978,605 | ) | 1,028 | (30,073 | ) | (321,964 | ) | (179,595 | ) | ||||||||||||
Realized and unrealized gain (loss) on investments: | |||||||||||||||||||||||
Net realized gain/(loss) on investments | (7,940,108 | ) | (2,043,407 | ) | — | — | (1,178,800 | ) | — | ||||||||||||||
Net change in open trade equity | (334,745 | ) | 2,752,929 | — | — | 146,518 | — | ||||||||||||||||
Trading commissions | (277,199 | ) | (345,129 | ) | — | — | (31,919 | ) | — | ||||||||||||||
Net change in inter-series receivables | (2,587,733 | ) | — | — | — | — | — | ||||||||||||||||
Net change in inter-series payables | — | — | — | — | 299,003 | — | |||||||||||||||||
Equity in earnings/(loss) from trading company | — | — | 536 | 208,706 | (2,293,289 | ) | 388,044 | ||||||||||||||||
Net gain/(loss) on investments | (11,139,785 | ) | 364,393 | 536 | 208,706 | (3,058,487 | ) | 388,044 | |||||||||||||||
Minority interests | 2,311,199 | 106,287 | — | — | 1,064,201 | — | |||||||||||||||||
NET INCREASE/(DECREASE) IN OWNERS’ CAPITAL RESULTING FROM OPERATIONS | $ | (9,547,654 | ) | $ | (507,925 | ) | $ | 1,564 | $ | 178,633 | $ | (2,316,250 | ) | $ | 208,449 | ||||||||
NET INCOME/(LOSS) PER UNIT | |||||||||||||||||||||||
Class 1 | $ | (4.27 | ) | $ | (1.17 | ) | $ | 0.32 | $ | 10.31 | $ | (4.65 | ) | $ | (0.41 | ) | |||||||
Class 1a | $ | (4.01 | ) | N/A | N/A | N/A | N/A | N/A | |||||||||||||||
Class 2 | $ | (3.71 | ) | $ | (0.43 | ) | $ | 0.68 | $ | 11.33 | $ | (4.13 | ) | $ | 0.31 | ||||||||
Class 2a | $ | (3.33 | ) | N/A | N/A | N/A | N/A | N/A | |||||||||||||||
| (1) | The Campbell/Graham Series of the Trust commenced trading operations on February 11, 2005. |
| (2) | The Beach Series was renamed the Winton Series in May, 2006. (See Note 1.) |
The accompanying notes are an integral part of these statements.
Fin. - 5
Table of Contents
The Frontier Fund
Condensed Statements of Operations
For the Three Months Ended September 30, 2006 and 2005
| Currency Series | Dunn Series | Graham Series | ||||||||||||||||||||||
| 9/30/2006 | 9/30/2005 | 9/30/2006 | 9/30/2005 | 9/30/2006 | 9/30/2005 | |||||||||||||||||||
| (Unaudited) | (Unaudited) | (Unaudited) | ||||||||||||||||||||||
Investment Income: | ||||||||||||||||||||||||
Interest—net | $ | 138,977 | $ | 418 | $ | 1,799 | $ | 6,577 | $ | 149,454 | $ | 27,632 | ||||||||||||
Total Income | 138,977 | 418 | 1,799 | 6,577 | 149,454 | 27,632 | ||||||||||||||||||
Expenses: | ||||||||||||||||||||||||
Incentive Fees | 300 | (387 | ) | — | — | — | 16,989 | |||||||||||||||||
Management Fees | 28,469 | 2,073 | — | — | 140,871 | 59,856 | ||||||||||||||||||
Service Fees—Class 1 | 39,006 | 575 | 971 | 1,457 | 42,718 | 32,851 | ||||||||||||||||||
Trading Fees | 22,337 | 518 | 374 | 2,981 | 28,176 | 11,981 | ||||||||||||||||||
Total Expenses | 90,112 | 2,779 | 1,345 | 4,438 | 211,765 | 121,677 | ||||||||||||||||||
Investment gain/(loss)—net | 48,865 | (2,361 | ) | 454 | 2,139 | (62,311 | ) | (94,045 | ) | |||||||||||||||
Realized and unrealized gain (loss) on investments: | ||||||||||||||||||||||||
Net realized gain/(loss) on investments | (187,882 | ) | — | — | — | — | 770,787 | |||||||||||||||||
Net change in open trade equity | 218,051 | — | — | — | — | (152,995 | ) | |||||||||||||||||
Trading commissions | — | — | — | — | — | (21,933 | ) | |||||||||||||||||
Net change in inter-series payables | (82,589 | ) | — | — | — | 639,456 | — | |||||||||||||||||
Equity in earnings/(loss) from trading company | — | 921 | (18,446 | ) | (360,390 | ) | (1,064,201 | ) | — | |||||||||||||||
Net gain/(loss) on investments | (52,420 | ) | 921 | (18,446 | ) | (360,390 | ) | (424,745 | ) | 595,859 | ||||||||||||||
Minority interests | — | — | — | — | — | (343,330 | ) | |||||||||||||||||
NET INCREASE/(DECREASE) IN OWNERS’ CAPITAL RESULTING FROM OPERATIONS | $ | (3,555 | ) | $ | (1,440 | ) | $ | (17,992 | ) | $ | (358,251 | ) | $ | (487,056 | ) | $ | 158,484 | |||||||
NET INCOME/(LOSS) PER UNIT | ||||||||||||||||||||||||
Class 1 | $ | (0.10 | ) | $ | (0.95 | ) | $ | (6.08 | ) | $ | (15.47 | ) | $ | (5.28 | ) | $ | 0.71 | |||||||
Class 2 | $ | 0.65 | $ | (0.20 | ) | $ | (5.79 | ) | $ | (15.15 | ) | $ | (4.91 | ) | $ | 1.38 | ||||||||
The accompanying notes are an integral part of these statements.
Fin. - 6
Table of Contents
The Frontier Fund
Condensed Statements of Operations
For the Three Months Ended September 30, 2006
| Long Only Commodity Series (1) 9/30/2006 | Long/Short Commodity Series (1) 9/30/2006 | Managed Futures Index Series (1) 9/30/2006 | ||||||||||
| (Unaudited) | (Unaudited) | (Unaudited) | ||||||||||
Investment Income: | ||||||||||||
Interest—net | $ | 73,659 | $ | 352,326 | $ | 97,233 | ||||||
Total Income | 73,659 | 352,326 | 97,233 | |||||||||
Expenses: | ||||||||||||
Incentive Fees | — | 61,818 | — | |||||||||
Management Fees | 23,393 | 307,355 | 51,212 | |||||||||
Service Fees—Class 1 | 7,457 | 112,290 | 948 | |||||||||
Trading Fees | 9,370 | 43,887 | 12,803 | |||||||||
Total Expenses | 40,220 | 525,350 | 64,963 | |||||||||
Investment gain/(loss)—net | 33,439 | (173,024 | ) | 32,270 | ||||||||
Realized and unrealized gain (loss) on investments: | ||||||||||||
Net realized gain/(loss) on investments | 24,887 | (751,290 | ) | (522,087 | ) | |||||||
Net change in open trade equity | (1,097,133 | ) | (244,236 | ) | 108,632 | |||||||
Trading commissions | — | (75,003 | ) | (12,466 | ) | |||||||
Net change in inter-series payables | 756,585 | 594,191 | 381,087 | |||||||||
Net gain/(loss) on investments | (315,661 | ) | (476,338 | ) | (44,834 | ) | ||||||
Minority interests | — | — | — | |||||||||
NET INCREASE/(DECREASE) IN OWNERS’ CAPITAL RESULTING FROM OPERATIONS | $ | (282,222 | ) | $ | (649,362 | ) | $ | (12,564 | ) | |||
NET INCOME/(LOSS) PER UNIT | ||||||||||||
Class 1 | $ | (13.63 | ) | $ | (3.69 | ) | $ | (4.26 | ) | |||
Class 2 | $ | (13.25 | ) | $ | (3.02 | ) | $ | (3.81 | ) | |||
| (1) | The Long Only Commodity Series, Long/Short Commodity Series and the Managed Future Index Series of the Trust commenced trading operations February 24, 2006. |
The accompanying notes are an integral part of these statements.
Fin. - 7
Table of Contents
Condensed Statements of Operations
For the Nine Months Ended September 30, 2006 and 2005
| Balanced Series | Winton Series (2) | Campbell/Graham Series (1) | ||||||||||||||||||||||
| 9/30/2006 | 9/30/2005 | 9/30/2006 | 9/30/2005 | 9/30/2006 | 9/30/2005 | |||||||||||||||||||
| (Unaudited) | (Unaudited) | (Unaudited) | ||||||||||||||||||||||
Investment Income: | ||||||||||||||||||||||||
Interest—net | $ | 2,956,610 | $ | 519,652 | $ | 33,769 | $ | 9,515 | $ | 830,638 | $ | 48,340 | ||||||||||||
Total Income | 2,956,610 | 519,652 | 33,769 | 9,515 | 830,638 | 48,340 | ||||||||||||||||||
Expenses: | ||||||||||||||||||||||||
Incentive Fees | 2,869,054 | 1,339,173 | 67,885 | 16,488 | 184,247 | 173,231 | ||||||||||||||||||
Management Fees | 542,106 | 252,880 | 11,946 | 16,876 | 793,490 | 106,306 | ||||||||||||||||||
Service Fees—Class 1 | 3,701,182 | 1,082,283 | 17,802 | 23,795 | 765,572 | 113,590 | ||||||||||||||||||
Trading Fees | 549,693 | 253,005 | 2,986 | 4,216 | 158,685 | 21,248 | ||||||||||||||||||
Total Expenses | 7,662,035 | 2,927,341 | 100,619 | 61,375 | 1,901,994 | 414,375 | ||||||||||||||||||
Investment gain/(loss)—net | (4,705,425 | ) | (2,407,689 | ) | (66,850 | ) | (51,860 | ) | (1,071,356 | ) | (366,035 | ) | ||||||||||||
Realized and unrealized gain (loss) on investments: | ||||||||||||||||||||||||
Net realized gain/(loss) on investments | 2,756,369 | (3,861,234 | ) | — | — | (944,627 | ) | — | ||||||||||||||||
Net change in open trade equity | (4,752,980 | ) | 5,680,144 | — | — | 201,942 | — | |||||||||||||||||
Trading commissions | (1,014,872 | ) | (728,617 | ) | — | — | (72,604 | ) | — | |||||||||||||||
Net change in inter-series receivables | (3,212,711 | ) | — | — | — | — | — | |||||||||||||||||
Net change in inter-series payables | — | — | — | — | 772,702 | — | ||||||||||||||||||
Equity in earnings/(loss) from trading company | 22,289 | — | 376,000 | 79,435 | (2,260,385 | ) | 950,290 | |||||||||||||||||
Net gain/(loss) on investments | (6,201,905 | ) | 1,090,293 | 376,000 | 79,435 | (2,302,972 | ) | 950,290 | ||||||||||||||||
Minority interests | 1,898,877 | (155,512 | ) | — | — | 815,289 | — | |||||||||||||||||
NET INCREASE/(DECREASE) IN OWNERS’ CAPITAL RESULTING FROM OPERATIONS | $ | (9,008,453 | ) | $ | (1,472,908 | ) | $ | 309,150 | $ | 27,575 | $ | (2,559,039 | ) | $ | 584,255 | |||||||||
NET INCOME/(LOSS) PER UNIT | ||||||||||||||||||||||||
Class 1 | $ | (3.06 | ) | $ | (7.76 | ) | $ | 0.32 | $ | (6.06 | ) | $ | (4.57 | ) | $ | (5.17 | ) | |||||||
Class 1a | $ | (8.51 | ) | N/A | N/A | N/A | N/A | N/A | ||||||||||||||||
Class 2 | $ | (0.81 | ) | $ | (5.46 | ) | $ | 0.68 | $ | (3.79 | ) | $ | (2.61 | ) | $ | (3.36 | ) | |||||||
Class 2a | $ | (7.38 | ) | N/A | N/A | N/A | N/A | N/A | ||||||||||||||||
| (1) | The Campbell/Graham Series of the Trust commenced trading operations on February 11, 2005. |
| (2) | The Beach Series was renamed the Winton Series in May, 2006. (See Note 1.) |
The accompanying notes are an integral part of these statements.
Fin. - 8
Table of Contents
The Frontier Fund
Condensed Statements of Operations
For the Nine Months Ended September 30, 2006 and 2005
| Currency Series | Dunn Series | Graham Series | ||||||||||||||||||||||
| 9/30/2006 | 9/30/2005 | 9/30/2006 | 9/30/2005 | 9/30/2006 | 9/30/2005 | |||||||||||||||||||
| (Unaudited) | (Unaudited) | (Unaudited) | ||||||||||||||||||||||
Investment Income: | ||||||||||||||||||||||||
Interest—net | $ | 287,073 | $ | 1,585 | $ | 5,316 | $ | 19,390 | $ | 262,706 | $ | 50,249 | ||||||||||||
Total Income | 287,073 | 1,585 | 5,316 | 19,390 | 262,706 | 50,249 | ||||||||||||||||||
Expenses: | ||||||||||||||||||||||||
Incentive Fees | 19,672 | (303 | ) | — | 12 | — | — | |||||||||||||||||
Management Fees | 98,128 | 5,169 | — | — | 262,409 | 153,839 | ||||||||||||||||||
Service Fees—Class 1 | 74,065 | 1,034 | 3,583 | 3,457 | 131,203 | 83,211 | ||||||||||||||||||
Trading Fees | 51,830 | 1,292 | 1,126 | 8,735 | 52,577 | 30,829 | ||||||||||||||||||
Total Expenses | 243,695 | 7,192 | 4,709 | 12,204 | 446,189 | 267,879 | ||||||||||||||||||
Investment gain/(loss)—net | 43,378 | (5,607 | ) | 607 | 7,186 | (183,483 | ) | (217,630 | ) | |||||||||||||||
Realized and unrealized gain (loss) on investments: | ||||||||||||||||||||||||
Net realized gain/(loss) on investments | 28,234 | — | — | — | — | (1,216,989 | ) | |||||||||||||||||
Net change in open trade equity | (21,940 | ) | — | — | — | — | 787,952 | |||||||||||||||||
Trading commissions | — | — | — | — | — | (43,248 | ) | |||||||||||||||||
Net change in inter-series payables | (46,989 | ) | — | — | — | 845,664 | — | |||||||||||||||||
Equity in earnings/(loss) from trading company | — | 222 | (14,492 | ) | (392,352 | ) | (815,289 | ) | — | |||||||||||||||
Net gain/(loss) on investments | (40,695 | ) | 222 | (14,492 | ) | (392,352 | ) | 30,375 | (472,285 | ) | ||||||||||||||
Minority interests | (22,289 | ) | — | — | — | — | (481,782 | ) | ||||||||||||||||
NET INCREASE/(DECREASE) IN OWNERS’ CAPITAL RESULTING FROM OPERATIONS | $ | (19,606 | ) | $ | (5,385 | ) | $ | (13,885 | ) | $ | (385,166 | ) | $ | (153,108 | ) | $ | (1,171,697 | ) | ||||||
NET INCOME/(LOSS) PER UNIT | ||||||||||||||||||||||||
Class 1 | $ | (0.81 | ) | $ | (2.13 | ) | $ | (8.37 | ) | $ | (18.71 | ) | $ | (2.30 | ) | $ | (17.90 | ) | ||||||
Class 2 | $ | 1.41 | $ | 0.15 | $ | (6.85 | ) | $ | (16.88 | ) | $ | (0.50 | ) | $ | (15.99 | ) | ||||||||
The accompanying notes are an integral part of these statements.
Fin. - 9
Table of Contents
The Frontier Fund
Condensed Statements of Operations
For the Nine Months Ended September 30, 2006
| Long Only Commodity Series (1) 9/30/2006 | Long/Short Commodity Series (1) 9/30/2006 | Managed Futures Index Series (1) 9/30/2006 | ||||||||||
| (Unaudited) | (Unaudited) | (Unaudited) | ||||||||||
Investment Income: | ||||||||||||
Interest—net | $ | 146,215 | $ | 570,920 | $ | 192,914 | ||||||
Total Income | 146,215 | 570,920 | 192,914 | |||||||||
Expenses: | ||||||||||||
Incentive Fees | — | 107,965 | — | |||||||||
Management Fees | 46,684 | 493,762 | 90,180 | |||||||||
Service Fees—Class 1 | 10,132 | 154,107 | 1,643 | |||||||||
Trading Fees | 18,691 | 70,503 | 22,548 | |||||||||
Total Expenses | 75,507 | 826,337 | 114,371 | |||||||||
Investment gain/(loss)—net | 70,708 | (255,417 | ) | 78,543 | ||||||||
Realized and unrealized gain (loss) on investments: | ||||||||||||
Net realized gain/(loss) on investments | 24,887 | (1,357,761 | ) | (563,881 | ) | |||||||
Net change in open trade equity | (605,958 | ) | (253,432 | ) | 89,688 | |||||||
Trading commissions | — | (125,408 | ) | (21,903 | ) | |||||||
Net change in inter-series payables | 242,584 | 1,004,707 | 394,043 | |||||||||
Equity in earnings/(loss) from trading company | — | — | — | |||||||||
Net gain/(loss) on investments | (338,487 | ) | (731,894 | ) | (102,053 | ) | ||||||
Minority interests | — | — | — | |||||||||
NET INCREASE/(DECREASE) IN OWNERS’ CAPITAL RESULTING FROM OPERATIONS | $ | (267,779 | ) | $ | (987,311 | ) | $ | (23,510 | ) | |||
NET INCOME/)LOSS) PER UNIT | ||||||||||||
Class 1 | $ | (4.17 | ) | $ | (5.18 | ) | $ | (5.00 | ) | |||
Class 2 | $ | (2.97 | ) | $ | (3.51 | ) | $ | (3.83 | ) | |||
| (1) | The Long Only Commodity Series, Long/Short Commodity Series and the Managed Future Index Series of the Trust commenced trading operations February 24, 2006. |
The accompanying notes are an integral part of these statements.
Fin. - 10
Table of Contents
Statements of Changes in Owners’ Capital
For the Nine Months Ended September 30, 2006 (Unaudited)
| Balanced Series (1) | |||||||||||||||||||||||||||||||
| Class 1 | Class 1a | Class 2 | Class 2a | ||||||||||||||||||||||||||||
| Managing Owner | Limited Owners | Managing Owner | Limited Owners | Managing Owner | Limited Owners | Managing Owner | Limited Owners | ||||||||||||||||||||||||
Owners’ Capital, December 31, 2005 | — | 114,741,316 | — | — | 1,087 | 21,223,825 | — | — | |||||||||||||||||||||||
Sale of Units | — | 107,861,997 | 200 | 2,988,442 | 1,700,000 | 21,780,503 | 50,000 | 445,000 | |||||||||||||||||||||||
Redemption of Units | — | (11,025,507 | ) | — | — | — | (1,089,633 | ) | — | — | |||||||||||||||||||||
Net (decrease) in Owners’ Capital resulting from operations | — | (7,883,189 | ) | (17 | ) | (105,133 | ) | (63,567 | ) | (939,910 | ) | (3,688 | ) | (12,949 | ) | ||||||||||||||||
Owners’ Capital, September 30, 2006 | $ | — | $ | 203,694,617 | $ | 183 | $ | 2,883,309 | $ | 1,637,520 | $ | 40,974,785 | $ | 46,312 | $ | 432,051 | |||||||||||||||
Owners’ Capital—Units, December 31, 2005 | — | 1,097,178 | — | — | 10 | 195,206 | — | — | |||||||||||||||||||||||
Sale of Units | — | 1,012,888 | 2 | 31,515 | 15,163 | 194,240 | 500 | 4,665 | |||||||||||||||||||||||
Redemption of Units | — | (103,660 | ) | — | — | — | (9,785 | ) | — | — | |||||||||||||||||||||
Owners’ Capital—Units, September 30, 2006 | — | 2,006,406 | 2 | 31,515 | 15,173 | 379,661 | 500 | 4,665 | |||||||||||||||||||||||
Net asset value per unit at December 31, 2005 or at commencement of operations | $ | 104.58 | $ | 100.00 | $ | 108.73 | $ | 100.00 | |||||||||||||||||||||||
Change in net asset value per unit for three months ended March 31, 2006 | 4.23 | N/A | 5.23 | N/A | |||||||||||||||||||||||||||
Net asset value per unit at March 31, 2006 | $ | 108.81 | $ | 100.00 | $ | 113.96 | $ | 100.00 | |||||||||||||||||||||||
Change in net asset value per unit for three months ended June 30, 2006 | (3.02 | ) | (4.50 | ) | (2.33 | ) | (4.05 | ) | |||||||||||||||||||||||
Net asset value per unit at June 30, 2006 | $ | 105.79 | $ | 95.50 | $ | 111.63 | $ | 95.95 | |||||||||||||||||||||||
Change in net asset value per unit for three months ended September 30, 2006 | (4.27 | ) | (4.01 | ) | (3.71 | ) | (3.33 | ) | |||||||||||||||||||||||
Net asset value per unit at September 30, 2006 | $ | 101.52 | $ | 91.49 | $ | 107.92 | $ | 92.62 | |||||||||||||||||||||||
| (1) | The Balanced Series Classes 1a and 2a of the Trust commenced trading operations on April 26, 2006 |
The accompanying notes are an integral part of these statements.
Fin. - 11
Table of Contents
The Frontier Fund
Statements of Changes in Owners’ Capital
For the Nine Months Ended September 30, 2006 (Unaudited)
| Winton Series (1) | Campbell/Graham Series | |||||||||||||||||||||||||||||
| Class 1 | Class 2 | Class 1 | Class 2 | |||||||||||||||||||||||||||
| Managing Owner | Limited Owners | Managing Owner | Limited Owners | Managing Owner | Limited Owners | Managing Owner | Limited Owners | |||||||||||||||||||||||
Owners’ Capital, December 31, 2005 | — | 2,047,247 | 1,163 | 177,143 | — | 21,561,490 | 968 | 2,845,588 | ||||||||||||||||||||||
Sale of Units | 1,000 | 771,916 | 310,000 | 30,200 | — | 25,088,298 | 600,000 | 3,114,172 | ||||||||||||||||||||||
Redemption of Units | — | (3,102,189 | ) | — | (233,946 | ) | — | (2,133,217 | ) | — | (315,053 | ) | ||||||||||||||||||
Net increase (decrease) in Owners’ Capital resulting from operations | 3 | 283,026 | (482 | ) | 26,603 | — | (2,327,342 | ) | (6,029 | ) | (225,668 | ) | ||||||||||||||||||
Owners’ Capital, September 30, 2006 | $ | 1,003 | $ | — | $ | 310,681 | $ | — | $ | — | $ | 42,189,229 | $ | 594,939 | $ | 5,419,039 | ||||||||||||||
Owners’ Capital—Units, December 31, 2005 | — | 18,290 | 10 | 1,523 | — | 228,642 | 10 | 29,386 | ||||||||||||||||||||||
Sale of Units | 10 | 6,451 | 3,086 | 251 | — | 264,482 | 6,305 | 31,297 | ||||||||||||||||||||||
Redemption of Units | — | (24,741 | ) | (10 | ) | (1,774 | ) | — | (22,958 | ) | — | (3,166 | ) | |||||||||||||||||
Owners’ Capital—Units, September 30, 2006 | 10 | — | 3,086 | — | — | 470,166 | 6,315 | 57,517 | ||||||||||||||||||||||
Net asset value per unit at December 31, 2005 or commencement of operations | $ | 100.00 | $ | 100.00 | $ | 94.30 | $ | 96.83 | ||||||||||||||||||||||
Change in net asset value per unit for three months ended March 31, 2006 | N/A | N/A | 2.60 | 3.40 | ||||||||||||||||||||||||||
Net asset value per unit at March 31, 2006 | $ | 100.00 | $ | 100.00 | $ | 96.90 | $ | 100.23 | ||||||||||||||||||||||
Change in net asset value per unit for three months ended June 30, 2006 | N/A | N/A | (2.52 | ) | (1.88 | ) | ||||||||||||||||||||||||
Net asset value per unit at June 30, 2006 | $ | 100.00 | $ | 100.00 | $ | 94.38 | $ | 98.35 | ||||||||||||||||||||||
Change in net asset value per unit for three months ended September 30, 2006 | 0.32 | 0.68 | (4.65 | ) | (4.13 | ) | ||||||||||||||||||||||||
Net asset value per unit at September 30, 2006 | $ | 100.32 | $ | 100.68 | $ | 89.73 | $ | 94.22 | ||||||||||||||||||||||
| (1) | The Winton Series began trading on August 11, 2006. (See Note 1.) |
The accompanying notes are an integral part of these statements.
Fin. - 12
Table of Contents
The Frontier Fund
Statements of Changes in Owners’ Capital
For the Nine Months Ended September 30, 2006 (Unaudited)
| Currency Series | Dunn Series | |||||||||||||||||||||||||||||
| Class 1 | Class 2 | Class 1 | Class 2 | |||||||||||||||||||||||||||
| Managing Owner | Limited Owners | Managing Owner | Limited Owners | Managing Owner | Limited Owners | Managing Owner | Limited Owners | |||||||||||||||||||||||
Owners’ Capital, December 31, 2005 | — | 276,762 | 2,059,895 | 6,019 | — | 193,425 | 902 | 135,114 | ||||||||||||||||||||||
Sale of Units | — | 5,762,247 | — | 331,000 | — | — | — | — | ||||||||||||||||||||||
Redemption of Units | — | (134,626 | ) | (2,000,000 | ) | — | — | (63,624 | ) | — | (10,000 | ) | ||||||||||||||||||
Net increase (decrease) in Owners’ Capital resulting from operations | — | (47,819 | ) | 28,100 | 113 | — | (4,047 | ) | (69 | ) | �� | (9,769 | ) | |||||||||||||||||
Owners’ Capital, September 30, 2006 | $ | — | $ | 5,856,564 | $ | 87,995 | $ | 337,132 | $ | — | $ | 125,754 | $ | 833 | $ | 115,345 | ||||||||||||||
Owners’ Capital—Units, December 31, 2005 | — | 2,834 | 20,311 | 59 | — | 2,227 | 10 | 1,499 | ||||||||||||||||||||||
Sale of Units | — | 59,039 | — | 3,219 | — | — | — | — | ||||||||||||||||||||||
Redemption of Units | — | (1,399 | ) | (19,455 | ) | — | — | (624 | ) | — | (114 | ) | ||||||||||||||||||
Owners’ Capital—Units, September 30, 2006 | — | 60,474 | 856 | 3,278 | — | 1,603 | 10 | 1,385 | ||||||||||||||||||||||
Net asset value per unit at December 31, 2005 or at commencement of operations | $ | 97.66 | $ | 101.42 | $ | 86.83 | $ | 90.15 | ||||||||||||||||||||||
Change in net asset value per unit for three months ended March 31, 2006 | 0.57 | 1.35 | (0.72 | ) | (0.08 | ) | ||||||||||||||||||||||||
Net asset value per unit at March 31, 2006 | $ | 98.23 | $ | 102.77 | $ | 86.11 | $ | 90.07 | ||||||||||||||||||||||
Change in net asset value per unit for three months ended June 30, 2006 | (1.28 | ) | (0.59 | ) | (1.57 | ) | (0.98 | ) | ||||||||||||||||||||||
Net asset value per unit at June 30, 2006 | $ | 96.95 | $ | 102.18 | $ | 84.54 | $ | 89.09 | ||||||||||||||||||||||
Change in net asset value per unit for three months ended September 30, 2006 | (0.10 | ) | 0.65 | (6.08 | ) | (5.79 | ) | |||||||||||||||||||||||
Net asset value per unit at September 30, 2006 | $ | 96.85 | $ | 102.83 | $ | 78.46 | $ | 83.30 | ||||||||||||||||||||||
The accompanying notes are an integral part of these statements.
Fin. - 13
Table of Contents
The Frontier Fund
Statements of Changes in Owners’ Capital
For the Nine Months Ended September 30, 2006 (Unaudited)
| Graham Series | Long Only Commodity Series (1) | |||||||||||||||||||||||||||||
| Class 1 | Class 2 | Class 1 | Class 2 | |||||||||||||||||||||||||||
| Managing Owner | Limited Owners | Managing Owner | Limited Owners | Managing Owner | Limited Owners | Managing Owner | Limited Owners | |||||||||||||||||||||||
Owners’ Capital, December 31, 2005 | — | 5,642,080 | 857 | 1,771,747 | — | — | — | — | ||||||||||||||||||||||
Sale of Units | — | 1,621,285 | 391,309 | 1,167,697 | — | 3,095,483 | 51,000 | 199,250 | ||||||||||||||||||||||
Redemption of Units | — | (1,442,411 | ) | — | (1,227,114 | ) | — | (93,536 | ) | — | — | |||||||||||||||||||
Net increase (decrease) in Owners’ Capital resulting from operations | — | (121,290 | ) | (23,956 | ) | (7,862 | ) | — | (243,514 | ) | (3,415 | ) | (20,850 | ) | ||||||||||||||||
Owners’ Capital, September 30, 2006 | $ | — | $ | 5,699,664 | $ | 368,210 | $ | 1,704,468 | $ | — | $ | 2,758,433 | $ | 47,585 | $ | 178,400 | ||||||||||||||
Owners’ Capital—Units, December 31, 2005 | — | 68,058 | 10 | 20,666 | — | — | — | — | ||||||||||||||||||||||
Sale of Units | — | 19,362 | 4,310 | 12,923 | — | 29,657 | 490 | 1,839 | ||||||||||||||||||||||
Redemption of Units | — | (16,701 | ) | — | (13,590 | ) | — | (873 | ) | — | — | |||||||||||||||||||
Owners’ Capital - Units, September 30, 2006 | — | 70,719 | 4,320 | 19,999 | — | 28,784 | 490 | 1,839 | ||||||||||||||||||||||
Net asset value per unit at December 31, 2005 or at commencement of operations (1) | $ | 82.90 | $ | 85.73 | $ | 100.00 | $ | 100.00 | ||||||||||||||||||||||
Change in net asset value per unit for three months ended March 31, 2006 | 1.15 | 1.83 | 3.82 | 4.08 | ||||||||||||||||||||||||||
Net asset value per unit at March 31, 2006 | $ | 84.05 | $ | 87.56 | $ | 103.82 | $ | 104.08 | ||||||||||||||||||||||
Change in net asset value per unit for three months ended June 30, 2006 | $ | 1.83 | $ | 2.58 | $ | 5.64 | $ | 6.20 | ||||||||||||||||||||||
Net asset value per unit at June 30, 2006 | $ | 85.88 | $ | 90.14 | $ | 109.46 | $ | 110.28 | ||||||||||||||||||||||
Change in net asset value per unit for three months ended September 30, 2006 | $ | (5.28 | ) | $ | (4.91 | ) | $ | (13.63 | ) | $ | (13.25 | ) | ||||||||||||||||||
Net asset value per unit at September 30, 2006 | $ | 80.60 | $ | 85.23 | $ | 95.83 | $ | 97.03 | ||||||||||||||||||||||
| (1) | The Long Only Commodity Series of the Trust commenced trading operations on February 24, 2006 |
The accompanying notes are an integral part of these statements.
Fin. - 14
Table of Contents
The Frontier Fund
Statements of Changes in Owners’ Capital
For the Nine Months Ended September 30, 2006 (Unaudited)
| Long/Short Commodity Series (1) | Managed Futures Index Series (1) | |||||||||||||||||||||||||||||
| Class 1 | Class 2 | Class 1 | Class 2 | |||||||||||||||||||||||||||
| Managing Owner | Limited Owners | Managing Owner | Limited Owners | Managing Owner | Limited Owners | Managing Owner | Limited Owners | |||||||||||||||||||||||
Owners’ Capital, December 31, 2005 | — | — | — | — | — | — | — | — | ||||||||||||||||||||||
Sale of Units | — | 20,042,399 | 221,000 | 2,224,225 | — | 375,679 | 51,000 | 2,500 | ||||||||||||||||||||||
Redemption of Units | — | (202,083 | ) | — | (40,000 | ) | — | (91,015 | ) | — | — | |||||||||||||||||||
Net increase (decrease) in Owners’ Capital resulting from operations | — | (900,434 | ) | (6,414 | ) | (80,463 | ) | — | (21,459 | ) | (2,011 | ) | (40 | ) | ||||||||||||||||
Owners’ Capital, September 30, 2006 | $ | — | $ | 18,939,882 | $ | 214,586 | $ | 2,103,762 | $ | — | $ | 263,205 | $ | 48,989 | $ | 2,460 | ||||||||||||||
Owners’ Capital—Units, December 31, 2005 | — | — | — | — | — | — | — | — | ||||||||||||||||||||||
Sale of Units | — | 201,839 | 2,224 | 22,210 | 3,716 | 509 | 26 | |||||||||||||||||||||||
Redemption of Units | — | (2,095 | ) | — | (408 | ) | (945 | ) | — | — | ||||||||||||||||||||
Owners’ Capital—Units, September 30, 2006 | — | 199,744 | 2,224 | 21,802 | — | 2,771 | 509 | 26 | ||||||||||||||||||||||
Net asset value per unit at commencement of | $ | 100.00 | $ | 100.00 | $ | 100.00 | $ | 100.00 | ||||||||||||||||||||||
Change in net asset value per unit for three months ended March 31, 2006 | 0.94 | 1.20 | (0.11 | ) | 0.11 | |||||||||||||||||||||||||
Net asset value per unit at March 31, 2006 | $ | 100.94 | $ | 101.20 | $ | 99.89 | $ | 100.11 | ||||||||||||||||||||||
Change in net asset value per unit for three months ended June 30, 2006 | (2.43 | ) | (1.69 | ) | (0.63 | ) | (0.13 | ) | ||||||||||||||||||||||
Net asset value per unit at June 30, 2006 | $ | 98.51 | $ | 99.51 | $ | 99.26 | $ | 99.98 | ||||||||||||||||||||||
Change in net asset value per unit for three months ended September 30, 2006 | (3.69 | ) | (3.02 | ) | (4.26 | ) | (3.81 | ) | ||||||||||||||||||||||
Net asset value per unit at September 30, 2006 | $ | 94.82 | $ | 96.49 | $ | 95.00 | $ | 96.17 | ||||||||||||||||||||||
| (1) | The Long/Short Commodity Series and the Managed Futures Index Series of the Trust commenced trading operations on February 24, 2006 |
The accompanying notes are an integral part of these statements.
Fin. - 15
Table of Contents
Notes to Financial Statements
As of September 30, 2006 (Unaudited)
1. Organization
The Frontier Fund, or the Trust, was formed as a Delaware statutory trust on August 8, 2003, with separate Series of Units. Its term will expire on December 31, 2053 (unless terminated earlier in certain circumstances). The Trust is a multi-advisor commodity pool as described in CFTC Regulation § 4.10(d)(2).
The Trust manages nine separate and distinct Series: Balanced Series, Winton Series, Campbell/Graham Series, Currency Series, Dunn Series, Graham Series, Long Only Commodity Series, Long/Short Commodity Series and the Managed Futures Index Series (each, a “Series”). The Units of each Series are separated into two sub-classes of Units, except the Balanced Series which has four sub-classes of Units.
On September 24, 2004, the Trust commenced operations for Balanced Series, Winton Series (formerly Beach Series, as described below), Currency Series and Dunn Series. The Graham Series commenced operations as of November 19, 2004. The Campbell/Graham Series commenced operations on February 11, 2005. On February 24, 2006, the Trust commenced operations for the Long Only Commodity, Long/Short Commodity and the Managed Futures Index Series. On May 1, 2006, two new classes of the Balanced Series commenced operations: Balanced Series 1a, and Balanced Series 2a.
The Continuous Offering Period of the Dunn Series was terminated by the Managing Owner in February 2006.
Effective as of April 13, 2006, (i) the Advisory Agreement dated as of March 1, 2004 by and among the Trust, Frontier Trading Company II LLC (the “Trading Company II”), the Managing Owner and Beach Capital Management Limited (“Beach”), which set forth the terms and conditions upon which Beach would render and implement trading advisory services on behalf of the Trading Company II and the Trust with respect to the Beach Series of the Trust and (ii) the Advisory Agreement dated as of March 1, 2004 by and among the Trust, Frontier Trading Company I LLC (the “Trading Company I”), the Managing Owner and Beach, which set forth the terms and conditions upon which Beach would render and implement trading advisory services on behalf of the Trading Company I and the Trust with respect to the assets of the Balanced Series of the Trust allocated to Beach (collectively, the “Agreements”) were terminated. The Agreements were terminated because Beach informed the Managing Owner that Beach had ceased trading pursuant to its Discretionary Program, which was the trading program Beach utilized in providing the trading advisory services under the Agreements.
As a result of the termination of the Agreements, the Trust ceased accepting new subscriptions for the Units in the Beach Series, and, effective April 1, 2006, the Trust ceased assessing all fees on the Beach Series. Upon termination of the Agreements, the Managing Owner delivered written notice to the existing investors in the Beach Series informing them of their exchange and redemption rights as disclosed in the Trust’s prospectus (the “Prospectus”). In addition, the assets of the Balanced Series which had previously been allocated to Beach were reallocated to one or more of the other trading advisors pursuant to the Managing Owner’s asset allocation discretion as disclosed in the Prospectus. On July 31, 2006, all remaining investor accounts in the Beach Series were redeemed.
In May 2006, Beach Series was renamed as Winton Series. For purposes of this report, Beach Series is referred to as Winton Series, regardless of whether the applicable time period referred to is prior or subsequent to the name change, unless explicitly set forth otherwise.
2. Significant Accounting Policies
Basis of Presentation
The interim financial statements of the Series included herein have been prepared in accordance with accounting principles generally accepted in the United States of America for interim financial information
Fin. - 16
Table of Contents
and Rule 10-01 of Regulation S-X. Accordingly, they do not include all the information and footnotes required by generally accepted accounting principles for complete financial statements. These condensed financial statements are unaudited and should be read in conjunction with the audited financial statements and notes thereto included in the Trust’s Annual Report on Form 10-K for the year ended December 31, 2005. The Series follow the same accounting policies in the preparation of interim reports as set forth in the annual report. In the opinion of management, the financial statements reflect all adjustments, which are of a normal recurring nature, necessary for a fair presentation of the financial position, results of operation and changes in owners’ capital for the interim periods presented and are not necessarily indicative of a full year’s results. Certain prior year numbers have been reclassified to conform to current year presentation.
The Series, through investing in a subsidiary limited liability trading company or companies (“Trading Company”), place assets under management of certain independent commodity trading advisor(s) (Trading Advisors). The Trading Companies were organized by Equinox Fund Management, LLC (the “Managing Owner”) for the purpose of investing in futures contracts and derivative instruments, and have no operating income or expenses, except for trading income and expenses, all of which is allocated to the Series. Trading Companies in which a Series has a majority equity interest are consolidated by such Series. Investments in Trading Companies in which a Series does not have a controlling or majority interest are accounted for under the equity method and are carried in the statement of financial condition of such Series at fair value based on the interest of each Series in such Trading Company.
The consolidated financial statements of Balanced Series include the assets, liabilities and earnings of its wholly-owned or majority owned Trading Companies, Frontier Trading Company I, LLC, Frontier Trading Company II, LLC, Frontier Trading Company IV, LLC and Frontier Trading Company VI, LLC.
The consolidated financial statements of Currency Series, Campbell/Graham Series, Long Only Commodity Series, Long/Short Commodity Series and Managed Futures Index Series include the assets, liabilities and earnings of their wholly owned or majority owned trading companies, Frontier Trading Company III, LLC, Frontier Trading Company V, LLC, Frontier Trading Company VII, LLC, Frontier Trading Company VIII, LLC and Frontier Trading Company IX, LLC, respectively.
Transactions are recorded on a trade date basis and all investments are recorded at fair value in the financial statements, with changes in fair value reported as a component of Realized and Unrealized Gain / (Loss) on Investments in the Statements of Operations. Generally, fair values will be based on quoted market prices; however, in certain circumstances, significant judgments and estimates may be required in determining fair value in the absence of an active market closing price.
The Managing Owner may make judgments that can frequently require estimates about matters that are inherently uncertain. The Managing Owner provides a good faith estimate of the daily net asset value (NAV) for each Series based on such uncertain information. The Managing Owner’s good faith estimates of each Series’ NAV is published daily by the Trust and is used for subscriptions, redemptions and exchanges of all Trust Units, and such Unit transactions are final and not subject to subsequent adjustment unless the estimate of NAV varies from the actual NAV by more than one percent (1.0%) of the Actual NAV as described within the Prospectus.
The Balanced Series, in order to make investments in the Campbell/Graham Series, Currency Series, Graham Series, Long Only Commodity Series, Long/Short Commodity Series and Managed Futures Index Series, advances funds to such Series for the purpose of investing in the respective Trading Company or Trading Companies for such Series on behalf of the Balanced Series. The amount of the funds advanced by the Balanced Series to each of the Campbell/Graham Series, Currency Series, Graham Series, Long Only Commodity Series, Long/Short Commodity Series and Managed Futures Index Series participates on apari passu basis with the Class 2 Units of such investee Series. The Balanced Series reflects the change in value of these investments as “Net change in inter-series receivables” in the Statement of Operations. The Balanced Series is subject to the same allocations of income and fees as the Limited Owners of such Series.
Fin. - 17
Table of Contents
As a result of fees charged by the investee Series, fees are not charged by the Balanced Series on the capital allocated to investments in affiliated Series, and the Managing Owner monitors such allocations so that aggregate fees of the investee Series on the Balanced Series investments do not exceed the allowable fees of the Balanced Series as provided in the Trust’s Prospectus.
3. Investments in Unconsolidated Trading Companies
The following table summarizes the Balanced Series, Winton Series, Campbell/Graham Series, Dunn Series and Graham Series investments in unconsolidated trading companies as of September 30, 2006, and December 31, 2005. These investments represent cash and open trade equity invested in the trading companies by the Series and cumulative trading profits or losses allocated to the Series by the trading companies. Trading companies allocate trading profits or losses on the basis of the proportion of each Series’ capital allocated for trading to each respective trading company, including both cash and notional funds, which bears no relationship to the amount of cash invested by the Series in the trading company.
| As of September 30, 2006 | As of December 31, 2005 | |||||||||||||
Trading Company (1) | Percentage of Net Assets | Fair Value | Percentage of Net Assets | Fair Value | ||||||||||
| (Unaudited) | (Unaudited) | (Unaudited) | (Unaudited) | |||||||||||
Balanced Series— | ||||||||||||||
Frontier Trading Company I, LLC | — | — | 2.90 | % | $ | 3,949,182 | ||||||||
Winton Series— | ||||||||||||||
Frontier Trading Company II, LLC | 17.87 | % | $ | 55,712 | 28.13 | % | $ | 626,070 | ||||||
Campbell/Graham Series | ||||||||||||||
Frontier Trading Company VI, LLC | 16.49 | % | $ | 7,946,464 | 21.01 | % | 5,129,155 | |||||||
Dunn Series— | ||||||||||||||
Frontier Trading Company IV, LLC | N/M | (2) | $ | (136,530 | ) | N/M | (2) | $ | (166,524 | ) | ||||
Graham Series— | ||||||||||||||
Frontier Trading Company V, LLC | 57.29 | % | $ | 4,452,889 | 22.12 | % | $ | 1,640,031 | ||||||
| (1) | The Frontier Trading Company VI, LLC commenced operations on February 11, 2005. |
| (2). | Not meaningful. |
Fin. - 18
Table of Contents
The following tables summarize the Winton Series, Campbell/Graham Series, Currency Series, Dunn Series and Graham Series equity in earnings from trading companies for the three months ended September 30, 2006 and 2005.
| Three Months Ended September 30, 2006 | Three Months Ended September 30, 2005 | |||||||||||||||||||||||||||||||
Trading Company (1) | Trading Commissions | Realized Gain (Loss) | Change in Unrealized Gain (Loss) | Net Income (Loss) | Trading Commissions | Realized Loss | Change in Unrealized Gain (Loss) | Net Income (Loss) | ||||||||||||||||||||||||
| (Unaudited) | (Unaudited) | (Unaudited) | (Unaudited) | (Unaudited) | (Unaudited) | (Unaudited) | (Unaudited) | |||||||||||||||||||||||||
Winton Series— | ||||||||||||||||||||||||||||||||
Frontier Trading Company II, LLC | $ | (77 | ) | $ | (3,385 | ) | $ | 3,998 | $ | 536 | $ | (9,002 | ) | $ | 20,326 | $ | 197,382 | $ | 208,706 | |||||||||||||
Campbell/Graham Series— | ||||||||||||||||||||||||||||||||
Frontier Trading Company V, LLC | — | — | — | — | $ | (8,602 | ) | $ | 338,175 | $ | 14,053 | $ | 343,626 | |||||||||||||||||||
Frontier Trading Company VI, LLC | (48,821 | ) | (2,013,325 | ) | (231,143 | ) | (2,293,289 | ) | (5,049 | ) | 4,182 | 45,285 | 44,418 | |||||||||||||||||||
Total Series | $ | (48,821 | ) | $ | (2,013,325 | ) | $ | (231,143 | ) | $ | (2,293,289 | ) | $ | (13,651 | ) | $ | 342,357 | $ | 59,338 | $ | 388,044 | |||||||||||
Currency Series— | ||||||||||||||||||||||||||||||||
Frontier Trading Company III, LLC | — | — | — | — | $ | 0 | $ | 1,831 | $ | (910 | ) | $ | 921 | |||||||||||||||||||
Dunn Series— | ||||||||||||||||||||||||||||||||
Frontier Trading Company IV, LLC | $ | (409 | ) | $ | (25,884 | ) | $ | 7,847 | $ | (18,446 | ) | $ | (6,709 | ) | $ | (183,182 | ) | $ | (170,499 | ) | $ | (360,390 | ) | |||||||||
Graham Series— | ||||||||||||||||||||||||||||||||
Frontier Trading Company V, LLC | $ | (31,919 | ) | $ | (1,178,800 | ) | $ | 146,518 | $ | (1,064,201 | ) | — | — | — | — | |||||||||||||||||
| (1) | The Frontier Trading Company VI, LLC commenced operations on February 11, 2005. |
Fin. - 19
Table of Contents
The following tables summarize the Balanced Series, Winton Series, Campbell/Graham Series, Currency Series, Dunn Series and Graham Series equity in earnings from trading companies for the nine months ended September 30, 2006 and 2005.
| Nine Months Ended September 30, 2006 | Nine Months Ended September 30, 2005 | |||||||||||||||||||||||||||||||
Trading Company (1) | Trading Commissions | Realized Gain (Loss) | Change in Unrealized Gain (Loss) | Net Income (Loss) | Trading Commissions | Realized Loss | Change in Unrealized Gain (Loss) | Net Income (Loss) | ||||||||||||||||||||||||
| (Unaudited) | (Unaudited) | (Unaudited) | (Unaudited) | (Unaudited) | (Unaudited) | (Unaudited) | (Unaudited) | |||||||||||||||||||||||||
Balanced Series— | ||||||||||||||||||||||||||||||||
Frontier Trading Company III, LLC | $ | 0 | $ | 24,411 | $ | (2,122 | ) | $ | 22,289 | — | — | — | — | |||||||||||||||||||
Winton Series— | ||||||||||||||||||||||||||||||||
Frontier Trading Company II, LLC | $ | (16,229 | ) | $ | 1,012,474 | $ | (620,245 | ) | $ | 376,000 | $ | (18,749 | ) | $ | (61,410 | ) | $ | 159,594 | $ | 79,4 35 | ||||||||||||
Campbell/Graham Series— | ||||||||||||||||||||||||||||||||
Frontier Trading Company V, LLC | — | — | — | — | $ | (11,418 | ) | $ | 116,252 | $ | 377,245 | $ | 482,079 | |||||||||||||||||||
Frontier Trading Company VI, LLC | (156,039 | ) | (2,476,487 | ) | 372,141 | (2,260,385 | ) | (8,209 | ) | 200,842 | 275,578 | 468,211 | ||||||||||||||||||||
Total Series | $ | (156,039 | ) | $ | (2,476,487 | ) | $ | 372,141 | $ | (2,260,385 | ) | $ | (19,627 | ) | $ | 317,094 | $ | 652,823 | $ | 950,290 | ||||||||||||
Currency Series— | ||||||||||||||||||||||||||||||||
Frontier Trading Company III, LLC | — | — | — | — | $ | 0 | $ | 5,003 | $ | (4,781 | ) | $ | 222 | |||||||||||||||||||
Dunn Series— | ||||||||||||||||||||||||||||||||
Frontier Trading Company IV, LLC | $ | (1,570 | ) | $ | (46,746 | ) | $ | 33,824 | $ | (14,492 | ) | $ | (17,753 | ) | $ | (420,901 | ) | $ | 46,302 | $ | (392,352 | ) | ||||||||||
Graham Series— | ||||||||||||||||||||||||||||||||
Frontier Trading Company V, LLC | $ | (72,604 | ) | $ | (944,627 | ) | $ | 201,942 | $ | (815,289 | ) | — | — | — | — | |||||||||||||||||
| (1) | The Frontier Trading Company VI, LLC commenced operations on February 11, 2005. |
Fin. - 20
Table of Contents
The unaudited condensed statements of financial condition as of September 30, 2006, and December 31, 2005 for the unconsolidated trading companies are as follows:
| Frontier Trading Company II, LLC | Frontier Trading Company IV, LLC | Frontier Trading Company V, LLC | Frontier Trading Company VI, LLC | ||||||||||
| (Unaudited) | (Unaudited) | (Unaudited) | (Unaudited) | ||||||||||
Condensed Statements of Financial Condition—September 30, 2006 | |||||||||||||
Cash held at futures commodities merchants | $ | 4,701,440 | $ | 1,544,538 | $ | 8,653,770 | $ | 12,253,987 | |||||
Open trade equity | 1,499,197 | 465,169 | 416,029 | (547,677 | ) | ||||||||
Total Assets | $ | 6,200,637 | $ | 2,009,708 | $ | 9,069,799 | $ | 11,706,310 | |||||
Members’ equity | $ | 6,200,637 | $ | 2,009,708 | $ | 9,069,799 | $ | 11,706,310 | |||||
Condensed Statements of Financial Condition—December 31, 2005 | |||||||||||||
Cash held at futures commodities merchants | $ | 3,604,769 | $ | 1,939,800 | $ | 5,019,359 | $ | 8,077,776 | |||||
Open trade equity | 3,527,640 | 187,880 | 97,185 | (1,222,005 | ) | ||||||||
Total Assets | $ | 7,132,409 | $ | 2,127,680 | $ | 5,116,544 | $ | 6,855,771 | |||||
Members’ equity | $ | 7,132,409 | $ | 2,127,680 | $ | 5,116,544 | $ | 6,855,771 | |||||
| (1) | The Frontier Trading Company VI, LLC commenced operations on February 11, 2005. |
The unaudited condensed statements of income for the three and nine months ended September 30, 2006, for the unconsolidated trading companies are as follows:
| Frontier Trading Company II, LLC | Frontier Trading Company III, LLC | Frontier Trading Company IV, LLC | Frontier Trading Company V, LLC | Frontier Trading Company VI, LLC | |||||||||||||||
| (Unaudited) | (Unaudited) | (Unaudited) | (Unaudited) | (Unaudited) | |||||||||||||||
Condensed Statements of Income—For the Three Months Ended September 30, 2006 | |||||||||||||||||||
Interest income | $ | 5,824 | $ | — | $ | 30,553 | $ | 67,283 | $ | 133,191 | |||||||||
Net realized gain (loss) on investments, less commissions | (1,232,247 | ) | (1,648,350 | ) | (2,654,190 | ) | (1,843,478 | ) | |||||||||||
Change in open trade equity | 1,440,321 | — | 406,154 | 139,258 | (680,898 | ) | |||||||||||||
Net income (loss) | $ | 213,898 | — | $ | (1,211,643 | ) | $ | (2,447,649 | ) | $ | (2,391,185 | ) | |||||||
Condensed Statements of Income—For the Nine Months Ended September 30, 2006 | |||||||||||||||||||
Interest income | $ | 135,023 | $ | — | $ | 78,369 | $ | 218,968 | $ | 344,469 | |||||||||
Net realized loss on investments, less commissions | 5,814,902 | — | (2,296,725 | ) | (1,947,785 | ) | (5,048,642 | ) | |||||||||||
Change in open trade equity | (2,087,641 | ) | — | 277,406 | 318,844 | 683,987 | |||||||||||||
Net income (loss) | $ | 3,862,284 | $ | — | $ | (1,940,950 | ) | $ | (1,409,973 | ) | $ | (4,020,186 | ) | ||||||
Fin. - 21
Table of Contents
| Frontier Trading Company II, LLC | Frontier Trading Company III, LLC | Frontier Trading Company IV, LLC | Frontier Trading Company V, LLC | Frontier Trading Company VI, LLC | |||||||||||||||
| (Unaudited) | (Unaudited) | (Unaudited) | (Unaudited) | (Unaudited) | |||||||||||||||
Condensed Statements of Income—For the Three Months Ended September 30, 2005 | |||||||||||||||||||
Interest income | $ | 39,232 | $ | 4,663 | $ | 23,985 | $ | 45,165 | $ | 34,124 | |||||||||
Net realized gain (loss) on investments, less commissions | 189,969 | 45,544 | (1,010,027 | ) | 748,824 | 75,671 | |||||||||||||
Change in open trade equity | 2,411,201 | (16,101 | ) | (891,438 | ) | (152,995 | ) | 43,372 | |||||||||||
Net income (loss) | $ | 2,640,402 | $ | 34,106 | $ | (1,877,480 | ) | $ | 640,994 | $ | 153,167 | ||||||||
Condensed Statements of Income—For the Nine Months Ended September 30, 2005 | |||||||||||||||||||
Interest income | $ | 73,161 | $ | 11,189 | $ | 57,254 | $ | 78,036 | $ | 60,783 | |||||||||
Net realized loss on investments, less commissions | (885,219 | ) | 88,297 | (2,185,804 | ) | (1,260,237 | ) | 953,289 | |||||||||||
Change in open trade equity | 1,802,513 | (10,900 | ) | 555,355 | 787,952 | 1,351,163 | |||||||||||||
Net income (loss) | $ | 990,455 | $ | 88,586 | $ | (1,573,195 | ) | $ | (394,249 | ) | $ | 2,365,235 | |||||||
4. Transactions with Affiliates
Equinox Fund Management LLC contributes funds to the Trust in order to have a 1% interest in the aggregate capital, profits and losses of all Series and in return will receive units designated as general units in the Series in which the Managing Owner invests such funds. The general units may only be purchased by the Managing Owner and may be subject to no advisory fees or advisory fees at reduced rates. Otherwise, the general units hold the same rights as the limited units. The Managing Owner is required to maintain at least a 1% interest (“Minimum Purchase Commitment”) in the aggregate capital, profits and losses of all Series so long as it is acting as the Managing Owner of the Trust. Such contribution was made by the Managing Owner before trading commenced for the Trust and will be maintained throughout the existence of the Trust, and the Managing Owner will make such purchases as are necessary to effect this requirement. Additionally, during 2006, the Managing Owner agreed with certain regulatory bodies to maintain a 1% interest specifically in the Balanced Series Class 1a Units and Balanced Series Class 2a Units, aggregated, and each of the Long Only Commodity Series, Long/Short Commodity Series and Managed Futures Index Series. The 1% interest in these specific Series is included in computing the Minimum Purchase Commitment in aggregate capital. In addition to the General Units the Managing Owner receives in respect of its Minimum Purchase Commitment, the Managing Owner may purchase Limited Units in any Series as a Limited Owner. All Units purchased by the Managing Owner are held for investment purposes only and not for resale.
On February 24, 2006, the Managing Owner invested $1,000 in each of the Long Only Commodity Series, Class 2, Long/Short Commodity Series, Class 2 and the Managed Futures Index Series, Class 2. On March 31, 2006, the Managing Owner invested $1.2 million in the Balanced Series, Class 2, $100,000 in the Campbell Graham Series, Class 2 and $50,000 in each of the Long Only Commodity Series, Class 2, Long/Short Commodity Series, Class 2 and the Managed Futures Index Series, Class 2. Also, on March 31, 2006, the Managing Owner redeemed $1.0 million of its interest in the Currency Series, Class 2. On April 28, 2006, the Managing Owner invested $1,309 in the Graham Series, Class 2 and redeemed a like amount in
Fin. - 22
Table of Contents
the Winton Series, Class 2. On May 1, 2006 the Managing Owner invested $200 in the Balanced Series, Class 1a and $50,000 in the Balanced Series, Class 2a. On May 31, 2006, the Managing Owner invested $260,000 in the Graham Series, Class 2 and $50,000 in the Long/Short Commodity Series, Class 2. On June 30, 2006, the Managing Owner invested $130,000 in the Graham Series, Class 2 and $20,000 in the Long/Short Commodity Series, Class 2. On August 11, 2006, the Managing Owner invested $30,000 in the Long/Short Commodity Series, Class 2, $1,000 in the Winton Series, Class 1 and $100,000 in the Winton Series, Class 2. On September 29, 2006, the Managing Owner invested $70,000 in the Long/Short Commodity Series, Class 2 and $210,000 in the Winton Series, Class 2. On that same date, the Managing Owner invested $500,000 in each of the Balanced Series, Class 2 and the Campbell Graham Series, Class 2 and redeemed $1,000,000 in the Currency Series, Class 2. The Managing Owner may make purchases or redemptions at any time on the same terms as any Limited Owner.
On January 13, 2006, Richard E. Bornhoft, President of the Managing Owner, redeemed $4,165 from the Graham Series, Class 1. On January 17, 2006, Mr. Bornhoft invested $4,165 in the Campbell/Graham Series, Class 2. Mr. Bornhoft exchanged all of his Winton Series Units for the same class of Units in the Graham Series on April 28, 2006: $1,251 Class 1 and $1,309 Class 2. On June 7, 2006, Mr. Bornhoft redeemed $250 from Balanced Series, Class 1, $750 from Campbell/Graham Series, Class 1, $750 from Dunn Series, Class 1 and $1,000 from Graham Series, Class 1. Mr. Bornhoft redeemed $17,500 from Graham Series, Class 2 on June 14, 2006. On August 11, 2006, Mr. Bornhoft redeemed $5,000 from the Campbell/Graham Series, Class 2 and $10,000 from the Dunn Series, Class 2. Mr. Bornhoft may make purchases or redemptions at any time on the same terms as any Limited Owner. No other principal of the Managing Owner or affiliates own any beneficial interest in the Trust but are allowed to do so.
The Balanced Series, in order to make investments in the Campbell/Graham Series, Currency Series, Graham Series, Long Only Commodity Series, Long/Short Commodity Series and Managed Futures Index Series, advances funds to such Series, for the purpose of investing in the respective Trading Company or Trading Companies for such Series on behalf of the Balanced Series. The Balanced Series advanced $8,000,000 to the Currency Series on January 31, 2006, $5,000,000 to the Long Only Commodity Series on February 24, 2006, $10,000,000 to the Long/Short Commodity Series on March 3, 2006, $10,000,000 to the Managed Futures Index Series on March 29, 2006, $5,000,000 to the Currency Series on April 24, 2006, $8,000,000 to the Campbell/Graham Series on April 26, 2006, $5,000,000 to the Graham Series on April 28, 2006, $5,000,000 to the Long/Short Commodity Series on May 8, 2006, $5,000,000 to the Long/Short Commodity Series on May 26, 2006, $10,000,000 to the Graham Series on July 17, 2006 and $750,000 to the Long Only Commodity Series on July 28, 2006. In addition, on August 30, 2006, the Balanced Series advanced $2,000,000 to the Graham Series while withdrawing $2,000,000 it had previously advanced to the Campbell/Graham Series. The amount of the funds advanced by the Balanced Series to each of the Campbell/Graham Series, Currency Series, Graham Series, Long Only Commodity Series, Long/Short Commodity Series and Managed Futures Index Series participates on apari passu basis with the Class 2 Units of such investee Series. The Balanced Series reflects the change in value of these investments as “Net change in inter-series receivables” in the Statement of Operations. The Balanced Series is subject to the same allocations of income and fees as the Limited Owners of such Series. As a result of fees charged by the investee Series, fees are not charged by the Balanced Series on the capital allocated to investments in affiliated Series, and the Managing Owner monitors such allocations so that aggregate fees of the investee Series on the Balanced Series investments do not exceed the allowable fees of the Balanced Series as provided in the Trust’s Prospectus.
Fin. - 23
Table of Contents
The following table summarizes the Balanced Series advances to and reductions from other Series of the Trust as of September 30, 2006
| Nine Months Ending September 30, 2006 | ||||||||||||||||||||||
Name of Series | Amount of Investment January 1, 2006 | Additions During Period | Reductions During Period | Amount of Investment September 30, 2006 | Earnings in Investments in Inter-Series Receivables Net P/L for the Period | Amount of Dividends or Interest | Value September 30, 2006 | |||||||||||||||
| (Unaudited) | ||||||||||||||||||||||
Campbell/Graham Series | $ | 0 | $ | 8,000,000 | $ | 2,000,000 | $ | 6,000,000 | $ | (772,702 | ) | $ | 0 | $ | 5,227,298 | |||||||
Currency Series | $ | 0 | $ | 13,000,000 | $ | 0 | $ | 13,000,000 | $ | 46,989 | $ | 0 | $ | 13,046,989 | ||||||||
Graham Series | $ | 0 | $ | 17,000,000 | $ | 0 | $ | 17,000,000 | $ | (845,664 | ) | $ | 0 | $ | 16,154,336 | |||||||
Long Only Commodity Series | $ | 0 | $ | 5,750,000 | $ | 0 | $ | 5,750,000 | $ | (242,584 | ) | $ | 0 | $ | 5,507,416 | |||||||
Long/Short Commodity Series | $ | 0 | $ | 20,000,000 | $ | 0 | $ | 20,000,000 | $ | (1,004,707 | ) | $ | 0 | $ | 18,995,293 | |||||||
Managed Futures Index Series | $ | 0 | $ | 10,000,000 | $ | 0 | $ | 10,000,000 | $ | (394,043 | ) | $ | 0 | $ | 9,605,957 | |||||||
| $ | 71,750,000 | $ | (3,212,711 | ) | $ | 0 | $ | 68,537,289 | ||||||||||||||
Each Series of Units pays to the Managing Owner a monthly management fee equal to a certain percentage of such Series’ assets, calculated on a daily basis. The annual rate of the management fee is 0.5% for the Balanced Series, 2.0% for the Winton Series, Currency Series, Long Only Commodity Series and the Managed Futures Index Series, 2.5% for the Graham Series and Campbell/Graham Series, and 3.5% for the Long/Short Commodity Series. There is no management fee for the Dunn Series. The Managing Owner may pay all or a portion of such management fees to the Trading Advisor(s) for such Series. For the three months ended September 30, 2006, management fees incurred were $203,999 by the Balanced Series, $181 by the Winton Series, $323,515 by the Campbell/Graham Series, $28,469 by the Currency Series, $140,871 by the Graham Series, $23,393 by the Long Only Commodity Series, $307,355 by the Long/Short Commodity Series and $51,212 by the Managed Futures Index Series. For the nine months ended September 30, 2006, management fees incurred were $542,106 by the Balanced Series, $11,946 by the Winton Series, $793,490 by the Campbell/Graham Series, $98,128 by the Currency Series, $262,409 by the Graham Series, $46,684 by the Long Only Commodity Series, $493,762 by the Long/Short Commodity Series and $90,180 by the Managed Futures Index Series. Amounts payable at September 30, 2006 to the Managing Owner for management fees were $69,190 by the Balanced Series, $163 by the Winton Series, $106,341 by the Campbell/Graham Series, $7,443 by the Currency Series, $51,149 by the Graham Series, $8,184 by the Long Only Commodity Series, $108,973 by the Long/Short Commodity Series and $16,998 by the Managed Futures Index Series.
Each Series pays to the Managing Owner a monthly trading fee (FCM Fee) equal to 1/12th of 0.50% of such Series’ Net Asset Value, calculated daily. For the three months ended September 30, 2006, FCM fees incurred were $211,811 by the Balanced Series, $45 by the Winton Series, $64,677 by the Campbell/Graham Series, $22,337 by the Currency Series, $374 by the Dunn Series, $28,176 by the Graham Series, $9,370 by the Long Only Commodity Series, $43,887 by the Long/Short Commodity Series and $12,803 by the Managed Futures Index Series. For the nine months ended September 30, 2006, FCM fees incurred were $549,693 by the Balanced Series, $2,986 by the Winton Series, $158,685 by the Campbell/Graham Series, $51,830 by the Currency Series, $1,126 by the Dunn Series, $52,577 by the Graham Series, $18,691 by the Long Only Commodity Series, $70,503 by the Long/Short Commodity Series and $22,548 by the Managed Futures Index Series. Amounts payable at September 30, 2006 to the Managing Owner for FCM fees were $77,484 by the Balanced Series, $41 by the Winton Series, $21,266 by the Campbell/Graham Series, $7,369 by the Currency Series, $121 by the Dunn Series, $10,230 by the Graham Series, $3,282 by the Long Only Commodity Series, $15,567 by the Long/Short Commodity Series and $4,250 by the Managed Futures Index Series.
Fin. - 24
Table of Contents
In addition, some Series pay to the Managing Owner an incentive fee of a certain percentage of new net trading profits generated by such Series, monthly or quarterly. Because the Balanced Series and Long/Short Commodity Series each employ multiple Trading Advisors, these Series will pay the Managing Owner a monthly incentive fee calculated on a Trading Advisor by Trading Advisor basis. It is therefore possible that in any given period the Balanced Series or the Long/Short Commodity Series may pay incentive fees to the Managing Owner for one or more Trading Advisors while each of these Series as a whole experiences losses. The incentive fee is 25% for the Balanced and Dunn Series and 20% for the Winton, Currency, Graham, Campbell/Graham Series and Long/Short Commodity Series. There is no incentive fee for the Long Only Commodity Series or the Managed Futures Index Series. The Managing Owner may pay all or a portion of such incentive fees to the Trading Advisor(s) for such Series. For the three months ended September 30, 2006, incentive fees incurred were $54,761 by the Balanced Series, $0 by the Winton Series, $8,429 by the Campbell/Graham Series, $300 by the Currency Series, $0 for the Dunn Series, $0 by the Graham Series and $61,818 by the Long/Short Commodity Series. For the nine months ended September 30, 2006, incentive fees incurred were $2,869,054 by the Balanced Series, $67,885 by the Winton Series, $184,247 by the Campbell/Graham Series, $19,672 by the Currency Series, $0 for the Dunn Series, $0 for the Graham Series and $107,965 by the Long/Short Commodity Series. Amounts payable at September 30, 2006 to the Managing Owner for incentive fees were $29,127 by the Balanced Series, and $48,020 by the Long/Short Series. Amounts receivable at September 30, 2006 from the Managing Owner for incentive fees were $532 for the Winton Series.
Aggregate interest income from all sources, including assets held at clearing brokers, up to 2% (annualized) is paid to the Managing Owner by the Balanced Series (Class 1 and Class 2 only), Winton Series, Campbell/Graham Series, Currency Series, Dunn Series and Graham Series. For the Balanced Series (Class 1a and Class 2a only), Long Only Commodity Series, Long/Short Commodity Series and Managed Futures Index Series, 20% of the total interest allocated to each Series is paid to the Managing Owner. During the three months ended September 30, 2006, the Trust paid $1,466,823 of such interest income to the Managing Owner. During the nine months ended September 30, 2006, the Trust paid $3,685,216 of such interest income to the Managing Owner.
With respect to Class 1 of each Series, the Series pays monthly to the Managing Owner a service fee at an annualized rate of up to 3.0% (2% for the Long Only Commodity Series and Managed Futures Index Series), which the Managing Owner pays to selling agents of the Trust. For the three months ended
September 30, 2006, service fees incurred were $1,462,094 by the Balanced Series, $4 by the Winton Series, $304,531 by the Campbell/Graham Series, $39,006 by the Currency Series, $971 by the Dunn Series, $42,718 by the Graham Series, $7,457 by the Long Only Commodity Series, $112,290 by the Long/Short Commodity Series and $948 by the Managed Futures Index Series. For the nine months ended September 30, 2006, service fees incurred were $3,701,182 by the Balanced Series, $17,802 by the Winton Series, $765,572 by the Campbell/Graham Series, $74,065 by the Currency Series, $3,583 by the Dunn Series, $131,203 by the Graham Series, $10,132 by the Long Only Commodity Series, $154,107 by the Long/Short Commodity Series and $1,643 by the Managed Futures Index Series. Amounts payable at September 30, 2006 to the Managing Owner for service fees (included in other liabilities on the Statements of Financial Condition) were $179,099 by the Balanced Series, $0 by the Winton Series, $29,539 by the Campbell Graham Series, $697 by the Currency Series, $279 by the Dunn Series, $7,233 by the Graham Series, $36 by the Long Only Commodity Series, $1,810 by the Long/Short Commodity Series and $112 by the Managed Futures Index Series. The initial service fee (for the first 12 months) relating to a sale of the Units is prepaid to the Managing Owner by each Series, and paid to the selling agents by the Managing Owner in the month following sale. Since the Managing Owner is prepaying the initial service fee for the first year and is being reimbursed therefore by the Series monthly in arrears based upon a corresponding percentage of net asset value, it bears the risk and the upside potential of any difference between the amount of the initial service fee prepaid and the amount of the reimbursement thereof as a result of variations in net asset value. For the three months ended September 30, 2006, due to variations in net asset values, amounts received or receivable from the Managing Owner for the difference in monthly service fees from the prepaid
Fin. - 25
Table of Contents
initial service fees were $47,925 for Balanced Series, $21,859 for Campbell Graham Series, $42 for Dunn Series, $2,570 for Graham Series, $631 for Long Only Series, $747 for Long/Short Series and $1,635 for Managed Futures Index Series. For the three months ended September 30, 2006, amounts paid or owing the Managing Owner for excess of monthly service fees over prepaid initial service fees were $30 for Winton Series and $1,538 for the Currency Series.
On September 29, 2006, the Managing Owner exchanged $1.0 million of its interest in Currency Series Class 2 Units for $500,000 interest each in Balanced Series Class 2 Units and Campbell Graham Class 2 Units. The Statements of Financial Condition at September 30, 2006 reflect a payable to related parties by the Currency Series of $1.0 million and a corresponding receivable from related parties of $500,000 for each of the Balanced Series and the Campbell Graham Series.
The Managing Owner pays to The Bornhoft Group Corporation, an affiliate of the Trust, a monthly fee of 0.25% (annualized) of the net asset value of the Trust, for services in connection with the daily valuation of each Series and Class. The amount paid under this agreement was $200,986 and $489,970, respectively, for the three months and nine months ended September 30, 2006. Additionally, The Bornhoft Group Corporation provides office space to the Managing Owner, prorates office expenses, and advances certain direct expenses on behalf of the Managing Owner. Under this agreement, the Managing Owner reimbursed The Bornhoft Group Corporation $128,663 for the nine months ended September 30, 2006.
Solon Capital, LLC, an affiliate of the Trust, serves as wholesaler of the Trust by marketing to broker/dealer organizations. For these services, the Managing Owner paid Solon Capital, LLC, $602,959 and $1,469,910, respectively, for the three months and nine months ended September 30, 2006.
5. Off-Balance Sheet Risk
The term “off-balance sheet risk” refers to an unrecorded potential liability that, even though it does not appear on the balance sheet, may result in future obligation or loss. Each Trading Company trades in futures, forward and swap contracts and is therefore a party to financial instruments with elements of off-balance sheet market and credit risk. In entering into these contracts there exists a market risk that such contracts may be significantly influenced by market conditions, such as interest rate volatility, resulting in such contracts being less valuable. If the markets should move against all of the futures interests positions held by a Trading Company in respect of any Series at the same time, and if the Trading Advisor(s) of such Trading Company are unable to offset such futures interests positions, such Trading Company could lose all of its assets and the holders of Units of such Series would realize a 100% loss. The Managing Owner seeks to minimize market risk through real-time monitoring of open positions and the level of diversification of each Trading Advisor’s portfolio. It is anticipated that any Trading Advisor’s margin-to-equity ratio will typically not exceed approximately 35% although the actual ratio could be higher or lower from time to time.
In addition to market risk, trading futures, forward and swap contracts entails credit risk in that a counterparty will not be able to meet its obligations to a Trading Company. The counterparty for futures contracts traded in the United States and on most foreign exchanges is the clearinghouse associated with such exchange. In general, clearinghouses are backed by the corporate members of the clearinghouse who are required to share any financial burden resulting from the non-performance by one of their members and, as such, should significantly reduce this credit risk. In cases where the clearinghouse is not backed by the clearing members, like some foreign exchanges, it is normally backed by a consortium of banks or other financial institutions. Some non-U.S. exchanges, in contrast to U.S. exchanges are principals’ markets in which performance is the responsibility only of the individual counterparty with whom the Trading Company has entered into the transaction with and not of the exchange or clearing corporation. In these kinds of markets, there is risk of bankruptcy or other failure or refusal to perform by the counterparty.
In the case of forward contracts traded on the interbank market and swaps, neither is traded on an exchange. The counterparty is generally a single bank or other financial institution, rather than a group of financial
Fin. - 26
Table of Contents
institutions; thus there may be a greater counterparty credit risk. The Managing Owner expects the Trading Advisors to trade only with those counterparties which it believes to be creditworthy. All positions of each Trading Company are valued each day on a mark-to-market basis. There can be no assurance that any clearing member, clearinghouse or other counterparty will be able to meet its obligations to any Trading Company.
6. Subsequent Events
The Balanced Series advanced $7,000,000 to the Graham Series on October 19, 2006 and withdrew $3,000,000 it had previously advanced to the Long Only Commodity Series on October 18, 2006. The Balanced Series is subject to the same allocations of income and fees as the Limited Owners of the investee Series. As a result of fees charged by the investee Series, fees are not charged by the Balanced Series on the capital allocated to Series to Series investments, and the Managing Owner monitors such allocations so that aggregate fees of the investee Series on the Balanced Series investments do not exceed the allowable fees of the Balanced Series as provided in the Trust’s prospectus. In October 2006, the Managing Owner determined that aggregate fees of the investee Series on the Balanced Series investments did exceed the allowable fees of the Balanced Series and returned $168,484 in excess fees to the Balanced Series.
The Managing Owner invested $100,000 in Units of the Campbell Graham Series, Class 2 and $20,000 in Units of the Long/Short Commodity Series, Class 2 on October 31, 2006.
The Trust commenced accepting Limited Owner subscriptions for the Winton Series on November 1, 2006.
Fin. - 27
Table of Contents
REPORT OF INDEPENDENT REGISTERED PUBLIC ACCOUNTING FIRM
To the Unitholders
The Frontier Fund
Denver, Colorado
We have audited the accompanying statements of financial condition of Balanced Series, Beach Series, Currency Series, Dunn Series, Campbell/Graham Series, and Graham Series of The Frontier Fund (collectively, the “Trust”) as of December 31, 2005, including the condensed schedules of investments of the Balanced Series, Currency Series, and Campbell/Graham Series as of December 31, 2005, and the related statements of operations and changes in owners’ capital for the year ended December 31, 2005. These financial statements are the responsibility of the Trust’s management. Our responsibility is to express an opinion on these financial statements based on our audit.
We conducted our audit in accordance with the standards of the Public Company Accounting Oversight Board (United States). Those standards require that we plan and perform the audit to obtain reasonable assurance about whether the financial statements are free of material misstatement. An audit includes examining, on a test basis, evidence supporting the amounts and disclosures in the financial statements. An audit also includes assessing the accounting principles used and significant estimates made by management, as well as evaluating the overall financial statement presentation. We believe that our audit provided a reasonable basis for our opinion.
In our opinion, such financial statements present fairly, in all material respects, the financial position of Balanced Series, Beach Series, Currency Series, Dunn Series, Campbell/Graham Series, and Graham Series of The Frontier Fund as of December 31, 2005, and the results of their operations and changes in owners’ capital for the year ended December 31, 2005, in conformity with U.S. generally accepted accounting principles.
/s/ McGladrey & Pullen, LLP
Denver, Colorado
March 15, 2006
Fin. - 28
Table of Contents
REPORT OF INDEPENDENT REGISTERED PUBLIC ACCOUNTING FIRM
To the Unitholders of The Frontier Fund,
We have audited the accompanying statements of financial condition of Balanced Series, Beach Series, Currency Series, Dunn Series and Graham Series of The Frontier Fund (the “Trust”), including the condensed schedules of investments of the Balanced Series and Graham Series, as of December 31, 2004, and the related statements of operations and changes in owners’ capital for the year ended December 31, 2004. These financial statements are the responsibility of the Trust’s management. Our responsibility is to express an opinion on these financial statements based on our audits.
We conducted our audits in accordance with the standards of the Public Company Accounting Oversight Board (United States). Those standards require that we plan and perform the audit to obtain reasonable assurance about whether the financial statements and financial highlights are free of material misstatement. The Trust is not required to have, nor were we engaged to perform, an audit of internal control over financial reporting. Our audits included consideration of internal control over financial reporting as a basis for designing audit procedures that are appropriate in the circumstances, but not for the purpose of expressing an opinion on the effectiveness of the Trust’s internal control over financial reporting. Accordingly, we express no such opinion. An audit also includes examining, on a test basis, evidence supporting the amounts and disclosures in the financial statements, assessing the accounting principles used and significant estimates made by management, as well as evaluating the overall financial statement presentation. We believe that our audits provide a reasonable basis for our opinion.
In our opinion, such financial statements present fairly, in all material respects, the financial position of Balanced Series, Beach Series, Currency Series, Dunn Series and Graham Series of The Frontier Fund as of December 31, 2004, and the results of their operations and changes in owners’ capital for the year ended December 31, 2004, in conformity with accounting principles generally accepted in the United States of America.
/s/ Deloitte & Touche LLP
Princeton, New Jersey
April 11, 2005
Fin. - 29
Table of Contents
Statements of Financial Condition
December 31, 2005 and 2004(1)
| Balanced Series | Beach Series | Campbell/Graham Series | ||||||||||||||||
| 2005 | 2004 | 2005 | 2004 | 2005 | 2004 | |||||||||||||
ASSETS | ||||||||||||||||||
Cash and cash equivalents | $ | 12,994,278 | $ | 11,554,318 | $ | 198,255 | $ | 207,744 | $ | 3,114,605 | $ | — | ||||||
Short-term investments | 99,549,452 | 15,808,825 | 1,413,937 | 438,528 | 16,436,045 | — | ||||||||||||
Cash held at futures commodity merchants | 19,097,934 | 5,518,100 | — | — | 5,019,359 | — | ||||||||||||
Open trade equity | 7,145,996 | 623,376 | — | — | 97,185 | — | ||||||||||||
Investments in unconsolidated trading companies | 3,949,182 | — | 626,070 | 15,709 | 5,129,155 | — | ||||||||||||
Prepaid service fees—Class 1 | 1,034,673 | 144,092 | 10,946 | 5,708 | 294,429 | — | ||||||||||||
Subscriptions receivable | — | — | — | 3,369 | — | — | ||||||||||||
Receivable from related parties | — | — | 329 | — | 110,889 | — | ||||||||||||
Other assets | 82,549 | 12,520 | 2,063 | 242 | 18,257 | — | ||||||||||||
Total Assets | $ | 143,854,064 | $ | 33,661,231 | $ | 2,251,600 | $ | 671,300 | $ | 30,219,924 | $ | — | ||||||
| LIABILITIES & OWNERS’ CAPITAL | ||||||||||||||||||
LIABILITIES | ||||||||||||||||||
Pending owner additions | $ | 1,368,927 | $ | 616,797 | $ | 5,000 | $ | — | $ | 586,595 | $ | — | ||||||
Owner redemptions payable | 10,588 | 56,738 | — | — | 9,687 | — | ||||||||||||
Incentive fees payable to Managing Owner | 654,345 | 35,629 | 12,209 | 1,226 | — | — | ||||||||||||
Management fees payable to Managing Owner | 54,370 | 13,673 | 3,282 | 1,086 | 47,266 | — | ||||||||||||
Interest fees payable to Managing Owner | 133,428 | 125,603 | 3,753 | 1,293 | 39,251 | — | ||||||||||||
Trading fees payable to Managing Owner | 54,371 | 13,596 | 821 | 274 | 9,453 | — | ||||||||||||
Payables to related parties | 20,690 | — | 922 | — | 2,547 | — | ||||||||||||
Other liabilities | 2,416 | — | 60 | — | 535 | — | ||||||||||||
Total Liabilities | 2,299,135 | 862,036 | 26,047 | 3,879 | 695,334 | — | ||||||||||||
MINORITY INTERESTS | 5,588,701 | 142,010 | — | — | 5,116,544 | |||||||||||||
OWNERS’ CAPITAL | ||||||||||||||||||
Managing Owner Units—Class 2 | 1,087 | 16,902,820 | 1,163 | 1,068 | 968 | — | ||||||||||||
Limited Owner Units—Class 1 | 114,741,316 | 11,772,262 | 2,047,247 | 488,932 | 21,561,490 | — | ||||||||||||
Limited Owner Units—Class 2 | 21,223,825 | 3,982,103 | 177,143 | 177,421 | 2,845,588 | — | ||||||||||||
Total Owners’ Capital | 135,966,228 | 32,657,185 | 2,225,553 | 667,421 | 24,408,046 | — | ||||||||||||
Total Liabilities, Minority Interests and Owners’ Capital | $ | 143,854,064 | $ | 33,661,231 | $ | 2,251,600 | $ | 671,300 | $ | 30,219,924 | $ | — | ||||||
Units Outstanding | ||||||||||||||||||
Class 1 | 1,097,178 | 111,031 | 18,290 | 4,612 | 228,642 | — | ||||||||||||
Class 2 | 195,216 | 195,464 | 1,533 | 1,671 | 29,396 | — | ||||||||||||
Net Asset Value per Unit | ||||||||||||||||||
Class 1 | $ | 104.58 | $ | 106.03 | $ | 111.93 | $ | 106.01 | $ | 94.30 | $ | — | ||||||
Class 2 | $ | 108.73 | $ | 106.85 | $ | 116.27 | $ | 106.84 | $ | 96.83 | $ | — | ||||||
| (1) | The Balanced Series and Beach Series of the Trust received additional capital contributions to commence trading operations on September 24, 2004. The Campbell/Graham Series of the Trust commenced trading operations on February 11, 2005. |
The accompanying notes are an integral part of these statements.
Fin. - 30
Table of Contents
The Frontier Fund
Statements of Financial Condition
December 31, 2005 and 2004(1)
| Currency Series | Dunn Series | Graham Series | ||||||||||||||||||
| 2005 | 2004 | 2005 | 2004 | 2005 | 2004 | |||||||||||||||
ASSETS | ||||||||||||||||||||
Cash and cash equivalents | $ | 483,973 | $ | 457,055 | $ | 98,068 | $ | 576,904 | $ | 822,215 | $ | 1,707,951 | ||||||||
Short-term investments | 1,490,688 | 1,520 | 403,646 | 1,699,960 | 5,015,459 | 2,649,787 | ||||||||||||||
Cash held at futures commodity merchants | 875,159 | — | — | — | — | 2,553,921 | ||||||||||||||
Open trade equity | 19,481 | — | — | — | — | (28,060 | ) | |||||||||||||
Investments in unconsolidated trading companies | — | 138 | — | 126,163 | 1,640,031 | — | ||||||||||||||
Prepaid service fees—Class 1 | 2,804 | 14 | 1,464 | 2,606 | 31,998 | 17,463 | ||||||||||||||
Subscriptions Receivable | — | — | — | — | — | 77,969 | ||||||||||||||
Receivable from related parties | 91 | — | — | — | 1,917 | — | ||||||||||||||
Other assets | 52 | 3 | 55 | 1,115 | 4,365 | 2,596 | ||||||||||||||
Total Assets | $ | 2,872,248 | $ | 458,730 | $ | 503,233 | $ | 2,406,748 | $ | 7,515,985 | $ | 6,981,627 | ||||||||
LIABILITIES & OWNERS’ CAPITAL | ||||||||||||||||||||
LIABILITIES | ||||||||||||||||||||
Liability to unconsolidated trading company | $ | — | $ | — | $ | 166,524 | $ | — | $ | — | $ | — | ||||||||
Pending owner additions | 53,750 | — | 6,000 | — | 50,000 | 46,126 | ||||||||||||||
Owner redemptions payable | — | — | — | — | 13,892 | — | ||||||||||||||
Incentive fees payable to Managing Owner | — | — | — | (12 | ) | — | 50,855 | |||||||||||||
Management fees payable to Managing Owner | 1,307 | 22 | — | — | 18,964 | 16,747 | ||||||||||||||
Interest fees payable to Managing Owner | 1,519 | 48 | 577 | 11,912 | 12,542 | 13,767 | ||||||||||||||
Trading fees payable to Managing Owner | 327 | 5 | 133 | 1,179 | 3,793 | 3,345 | ||||||||||||||
Payables to related parties | — | — | 204 | — | 1,981 | — | ||||||||||||||
Other liabilities | — | — | 354 | — | 129 | — | ||||||||||||||
Total Liabilities | 56,903 | 75 | 173,792 | 13,079 | 101,301 | 130,840 | ||||||||||||||
MINORITY INTERESTS | 472,669 | — | — | — | ||||||||||||||||
OWNERS’ CAPITAL | ||||||||||||||||||||
Managing Owner Units—Class 2 | 2,059,895 | 441,035 | 902 | 1,058 | 857 | 4,573,598 | ||||||||||||||
Limited Owner Units—Class 1 | 276,762 | 16,586 | 193,425 | 117,047 | 5,642,080 | 1,961,583 | ||||||||||||||
Limited Owner Units—Class 2 | 6,019 | 1,034 | 135,114 | 2,275,564 | 1,771,747 | 315,606 | ||||||||||||||
Total Owners’ Capital | 2,342,676 | 458,655 | 329,441 | 2,393,669 | 7,414,684 | 6,850,787 | ||||||||||||||
Total Liabilities, Minority Interests and Owners’ Capital | $ | 2,872,248 | $ | 458,730 | $ | 503,233 | $ | 2,406,748 | $ | 7,515,985 | $ | 6,981,627 | ||||||||
Units Outstanding | ||||||||||||||||||||
Class 1 | 2,834 | 162 | 2,227 | 1,115 | 68,058 | 18,939 | ||||||||||||||
Class 2 | 20,370 | 4,272 | 1,509 | 21,524 | 20,676 | 47,047 | ||||||||||||||
Net Asset Value per Unit | ||||||||||||||||||||
Class 1 | $ | 97.66 | $ | 102.67 | $ | 86.83 | $ | 104.96 | $ | 82.90 | $ | 103.57 | ||||||||
Class 2 | $ | 101.42 | $ | 103.47 | $ | 90.15 | $ | 105.77 | $ | 85.73 | $ | 103.92 | ||||||||
| (1) | The Currency Series (formerly C-View Currency Series) and Dunn Series of the Trust received additional capital contributions to commence trading operations on September 24, 2004. The Graham Series of the Trust commenced trading operations on November 19, 2004, upon receipt of additional capital contributions. |
The accompanying notes are an integral part of these statements.
Fin. - 31
Table of Contents
Condensed Schedules of Investments
December 31, 2005
| Balanced Series | Currency Series | Campbell/Graham Series | ||||||||||||||||||
Description | Value | % of Net Asset Value | Value | % of Net Asset Value | Value | % of Net Asset Value | ||||||||||||||
LONG FUTURES CONTRACTS {1} | ||||||||||||||||||||
Various base metals futures contracts (US) | $ | 1,554,786 | 1.15 | % | $ | — | 0.00 | % | $ | — | 0.00 | % | ||||||||
Various base metals futures contracts (Europe) | 7,706,946 | 5.67 | % | — | 0.00 | % | 383,844 | 1.57 | % | |||||||||||
Various currency futures contracts (US) | (366,546 | ) | -0.27 | % | — | 0.00 | % | — | 0.00 | % | ||||||||||
Various currency futures contracts (Europe) | (4,857 | ) | 0.00 | % | — | 0.00 | % | — | 0.00 | % | ||||||||||
Various currency futures contracts (Far East) | 8,533 | 0.01 | % | — | 0.00 | % | — | 0.00 | % | |||||||||||
Various energy futures contracts (US) | 105,137 | 0.08 | % | — | 0.00 | % | 16,136 | 0.07 | % | |||||||||||
Various energy futures contracts (Europe) | 12,784 | 0.01 | % | — | 0.00 | % | — | 0.00 | % | |||||||||||
Various interest rates futures contracts (US) | 17,380 | 0.01 | % | — | 0.00 | % | — | 0.00 | % | |||||||||||
Various interest rates futures contracts (Canada) | (110,328 | ) | -0.08 | % | — | 0.00 | % | — | 0.00 | % | ||||||||||
Various interest rates futures contracts (Europe) | 342,382 | 0.25 | % | — | 0.00 | % | 27,387 | 0.11 | % | |||||||||||
Various interest rates futures contracts (Far East) | 144,557 | 0.11 | % | — | 0.00 | % | — | 0.00 | % | |||||||||||
Various precious metals futures contracts (US) | 762,145 | 0.56 | % | — | 0.00 | % | — | 0.00 | % | |||||||||||
Various soft futures contracts (US) | 1,266,893 | 0.93 | % | — | 0.00 | % | 5,656 | 0.02 | % | |||||||||||
Various soft futures contracts (Europe) | 126,086 | 0.09 | % | — | 0.00 | % | — | 0.00 | % | |||||||||||
Various stock index futures contracts (US) | (774,467 | ) | -0.57 | % | — | 0.00 | % | (67,407 | ) | -0.27 | % | |||||||||
Various stock index futures contracts (Canada) | 4,520 | 0.00 | % | — | 0.00 | % | — | 0.00 | % | |||||||||||
Various stock index futures contracts (Europe) | 563,283 | 0.41 | % | — | 0.00 | % | 57,527 | 0.24 | % | |||||||||||
Various stock index futures contracts (Far East) | 940,804 | 0.69 | % | — | 0.00 | % | (11,455 | ) | -0.05 | % | ||||||||||
Total Long Futures Contracts | 12,300,038 | 9.05 | % | — | 0.00 | % | 411,688 | 1.69 | % | |||||||||||
LONG CURRENCY FORWARDS {1} | (1,075,394 | ) | -0.79 | % | 19,481 | 0.83 | % | 9,417 | 0.04 | % | ||||||||||
SHORT FUTURES CONTRACTS {1} | ||||||||||||||||||||
Various base metals futures contracts (US) | (791,174 | ) | -0.58 | % | — | 0.00 | % | — | 0.00 | % | ||||||||||
Various base metals futures contracts (Europe) | (3,691,514 | ) | -2.71 | % | — | 0.00 | % | (249,765 | ) | -1.02 | % | |||||||||
Various currency futures contracts (US) | 289,181 | 0.21 | % | — | 0.00 | % | (33,837 | ) | -0.14 | % | ||||||||||
Various currency futures contracts (Europe) | 1,047,814 | 0.77 | % | 0.00 | % | 5,311 | 0.02 | % | ||||||||||||
Various currency futures contracts (Far East) | (8,809 | ) | -0.01 | % | — | 0.00 | % | — | 0.00 | % | ||||||||||
Various energy futures contracts (US) | (166,894 | ) | -0.12 | % | — | 0.00 | % | — | 0.00 | % | ||||||||||
Various energy futures contracts (Europe) | (56,845 | ) | -0.04 | % | — | 0.00 | % | 6,480 | 0.03 | % | ||||||||||
Various interest rates futures contracts (US) | (204,260 | ) | -0.15 | % | — | 0.00 | % | (32,719 | ) | -0.14 | % | |||||||||
Various interest rates futures contracts (Canada) | 112,778 | 0.08 | % | — | 0.00 | % | — | 0.00 | % | |||||||||||
Various interest rates futures contracts (Europe) | 14,149 | 0.01 | % | — | 0.00 | % | 19,527 | 0.08 | % | |||||||||||
Various interest rates futures contracts (Far East) | (163,982 | ) | -0.12 | % | — | 0.00 | % | (15,970 | ) | -0.07 | % | |||||||||
Various soft futures contracts (US) | (352,749 | ) | -0.26 | % | — | 0.00 | % | (22,613 | ) | -0.09 | % | |||||||||
Various soft futures contracts (Canada) | 4,251 | 0.00 | % | — | 0.00 | % | — | 0.00 | % | |||||||||||
Various soft futures contracts (Europe) | — | 0.00 | % | — | 0.00 | % | (1,854 | ) | -0.01 | % | ||||||||||
Various stock index futures contracts (US) | 2,845 | 0.00 | % | — | 0.00 | % | 1,520 | 0.01 | % | |||||||||||
Various stock index futures contracts (Europe) | (100,235 | ) | -0.07 | % | — | 0.00 | % | — | 0.00 | % | ||||||||||
Various stock index futures contracts (Far East) | (13,204 | ) | -0.01 | % | — | 0.00 | % | — | 0.00 | % | ||||||||||
Total Short Futures Contracts | (4,078,648 | ) | -3.00 | % | — | 0.00 | % | (323,920 | ) | -1.33 | % | |||||||||
Total Open Trade Equity | $ | 7,145,996 | 5.26 | % | $ | 19,481 | 0.83 | % | $ | 97,185 | 0.40 | % | ||||||||
| {1} | No individual futures or forward contract positions constituted greater than 1.00% of net asset value. Accordingly, the number of contracts and expiration dates are not presented. |
The accompanying notes are an integral part of these statements.
Fin. - 32
Table of Contents
Condensed Schedules of Investments
December 31, 2004
| Balanced Series | Graham Series | |||||||||||||
Description | Value | % of Net Asset Value | Value | % of Net Asset Value | ||||||||||
LONG FUTURES CONTRACTS {1} | ||||||||||||||
Various base metals futures contracts (US) | $ | 214,940 | 0.66 | % | $ | — | 0.00 | % | ||||||
Various base metals futures contracts (Europe) | 658,461 | 2.02 | % | 30,760 | 0.45 | % | ||||||||
Various currency futures contracts (US) | 131,451 | 0.40 | % | (2,825 | ) | -0.04 | % | |||||||
Various currency futures contracts (Europe) | 7,541 | 0.02 | % | 11,037 | 0.16 | % | ||||||||
Various currency futures contracts (Far East) | 220 | 0.00 | % | — | 0.00 | % | ||||||||
Various energy futures contracts (US) | (9,979 | ) | -0.03 | % | — | 0.00 | % | |||||||
Various energy futures contracts (Europe) | (12,250 | ) | -0.04 | % | — | 0.00 | % | |||||||
Various interest rates futures contracts (US) | (12,539 | ) | -0.04 | % | 15,883 | 0.23 | % | |||||||
Various interest rates futures contracts (Canada) | 6,879 | 0.02 | % | — | 0.00 | % | ||||||||
Various interest rates futures contracts (Europe) | 39,870 | 0.12 | % | (29,838 | ) | -0.44 | % | |||||||
Various interest rates futures contracts (Far East) | (178,511 | ) | -0.55 | % | (3,835 | ) | -0.06 | % | ||||||
Various precious metals futures contracts (US) | (79,090 | ) | -0.24 | % | (14,150 | ) | -0.21 | % | ||||||
Various soft futures contracts (US) | 68,752 | 0.21 | % | 4,556 | 0.07 | % | ||||||||
Various soft futures contracts (Europe) | (645 | ) | 0.00 | % | — | 0.00 | % | |||||||
Various stock index futures contracts (US) | 97,810 | 0.30 | % | 73,878 | 1.08 | % | ||||||||
Various stock index futures contracts (Canada) | 1,502 | 0.00 | % | — | 0.00 | % | ||||||||
Various stock index futures contracts (Europe) | 92,027 | 0.28 | % | 27,299 | 0.40 | % | ||||||||
Various stock index futures contracts (Far East) | 164,573 | 0.50 | % | 3,176 | 0.05 | % | ||||||||
Total Long Futures Contracts | 1,191,012 | 3.65 | % | 115,941 | 1.69 | % | ||||||||
LONG CURRENCY FORWARDS {1} | 63,666 | 0.19 | % | (140,733 | ) | -2.05 | % | |||||||
SHORT FUTURES CONTRACTS {1} | ||||||||||||||
Various base metals futures contracts (US) | (115,946 | ) | -0.36 | % | — | 0.00 | % | |||||||
Various base metals futures contracts (Europe) | (539,218 | ) | -1.65 | % | (9,228 | ) | -0.13 | % | ||||||
Various currency futures contracts (US) | 28,248 | 0.09 | % | 1,275 | 0.02 | % | ||||||||
Various currency futures contracts (Europe) | — | 0.00 | % | (4,485 | ) | -0.07 | % | |||||||
Various energy futures contracts (US) | 50,730 | 0.16 | % | 9,170 | 0.13 | % | ||||||||
Various energy futures contracts (Europe) | 1,910 | 0.01 | % | — | 0.00 | % | ||||||||
Various interest rates futures contracts (US) | (49,370 | ) | -0.15 | % | — | 0.00 | % | |||||||
Various interest rates futures contracts (Canada) | 1,231 | 0.00 | % | — | 0.00 | % | ||||||||
Various interest rates futures contracts (Europe) | (5,479 | ) | -0.02 | % | — | 0.00 | % | |||||||
Various interest rates futures contracts (Far East) | (259 | ) | 0.00 | % | — | 0.00 | % | |||||||
Various precious metals futures contracts (US) | 3,460 | 0.01 | % | — | 0.00 | % | ||||||||
Various soft futures contracts (US) | 6 | 0.00 | % | — | 0.00 | % | ||||||||
Various soft futures contracts (Canada) | 749 | 0.00 | % | — | 0.00 | % | ||||||||
Various soft futures contracts (Europe) | 726 | 0.00 | % | — | 0.00 | % | ||||||||
Various stock index futures contracts (US) | 530 | 0.00 | % | — | 0.00 | % | ||||||||
Various stock index futures contracts (Far East) | (8,620 | ) | -0.03 | % | — | 0.00 | % | |||||||
Total Short Futures Contracts | (631,302 | ) | -1.93 | % | (3,268 | ) | -0.05 | % | ||||||
Total Open Trade Equity | $ | 623,376 | 1.91 | % | $ | (28,060 | ) | -0.41 | % | |||||
| {1} | No individual futures or forward contract positions constituted greater than 1.00% of net asset value. Accordingly, the number of contracts and expiration dates are not presented. |
The accompanying notes are an integral part of these statements.
Fin. - 33
Table of Contents
Statements of Operations
For the Years Ended December 31, 2005 and 2004(1)
| Balanced Series | Beach Series | Campbell/Graham Series | |||||||||||||||||||||
| 12/31/2005 | 12/31/2004 | 12/31/2005 | 12/31/2004 | 12/31/2005 | 12/31/2004 | ||||||||||||||||||
Investment Income: | |||||||||||||||||||||||
Interest—net | $ | 1,010,834 | $ | 5,876 | $ | 16,877 | $ | 116 | $ | 126,602 | $ | — | |||||||||||
Total Income | 1,010,834 | 5,876 | 16,877 | 116 | 126,602 | — | |||||||||||||||||
Expenses: | |||||||||||||||||||||||
Incentive Fees | 3,997,498 | 595,855 | 60,246 | 2,929 | 210,651 | — | |||||||||||||||||
Management Fees | 413,523 | 31,548 | 25,932 | 1,232 | 228,694 | — | |||||||||||||||||
Service Fees—Class 1 | 1,834,871 | 28,836 | 36,835 | 1,190 | 245,963 | — | |||||||||||||||||
Trading Fees | 413,670 | 31,442 | 6,481 | 310 | 45,739 | — | |||||||||||||||||
Total Expenses | 6,659,562 | 687,681 | 129,494 | 5,661 | 731,047 | — | |||||||||||||||||
Investment gain/(loss)—net | (5,648,728 | ) | (681,805 | ) | (112,617 | ) | (5,545 | ) | (604,445 | ) | — | ||||||||||||
Realized and unrealized gain (loss) on investments: | |||||||||||||||||||||||
Net realized loss on investments | 7,979,535 | 1,842,923 | — | — | 467,176 | — | |||||||||||||||||
Net change in open trade equity | 6,537,199 | 623,376 | — | — | (1,373,930 | ) | — | ||||||||||||||||
Trading commissions | (1,097,696 | ) | (69,857 | ) | — | — | (17,946 | ) | — | ||||||||||||||
Equity in earnings from trading company | (795 | ) | 365,856 | 17,300 | 1,570,356 | — | |||||||||||||||||
Net gain/(loss) on investments | 13,418,243 | 2,396,442 | 365,856 | 17,300 | 645,656 | — | |||||||||||||||||
Minority interests | (724,988 | ) | (221,836 | ) | — | — | 363,365 | — | |||||||||||||||
NET INCREASE/(DECREASE) IN OWNERS’ CAPITAL RESULTING FROM OPERATIONS | $ | 7,044,527 | $ | 1,492,801 | $ | 253,239 | $ | 11,755 | $ | 404,576 | $ | — | |||||||||||
| (1) | The Balanced Series and Beach Series of the Trust received additional capital contributions to commence trading operations on September 24, 2004. The Campbell/Graham Series of the Trust commenced trading operations on February 11, 2005. |
The accompanying notes are an integral part of these statements.
Fin. - 34
Table of Contents
The Frontier Fund
Statements of Operations
For the Years Ended December 31, 2005 and 2004(1)
| Currency Series | Dunn Series | Graham Series | ||||||||||||||||||||||
| 12/31/2005 | 12/31/2004 | 12/31/2005 | 12/31/2004 | 12/31/2005 | 12/31/2004 | |||||||||||||||||||
Investment Income: | ||||||||||||||||||||||||
Interest—net | $ | 3,370 | $ | 2 | $ | 20,588 | $ | — | $ | 85,327 | $ | — | ||||||||||||
Total Income | 3,370 | 2 | 20,588 | — | 85,327 | — | ||||||||||||||||||
Expenses: | ||||||||||||||||||||||||
Incentive Fees | — | — | — | 74,896 | — | 50,855 | ||||||||||||||||||
Management Fees | 7,049 | 22 | — | — | 215,540 | 16,747 | ||||||||||||||||||
Service Fees—Class 1 | 2,161 | 17 | 4,892 | 333 | 122,139 | 3,562 | ||||||||||||||||||
Trading Fees | 1,459 | 5 | 9,280 | 2,985 | 43,121 | 3,345 | ||||||||||||||||||
Total Expenses | 10,669 | 44 | 14,172 | 78,214 | 380,800 | 74,509 | ||||||||||||||||||
Investment gain/(loss)—net | (7,299 | ) | (42 | ) | 6,416 | (78,214 | ) | (295,473 | ) | (74,509 | ) | |||||||||||||
Realized and unrealized gain (loss) on investments: | ||||||||||||||||||||||||
Net realized loss on investments | (310 | ) | — | — | — | (1,234,755 | ) | 306,423 | ||||||||||||||||
Net change in open trade equity | (1,164 | ) | — | — | — | 1,499,174 | (28,060 | ) | ||||||||||||||||
Trading commissions | — | — | — | — | (56,465 | ) | (6,161 | ) | ||||||||||||||||
Equity in earnings from trading company | (3,701 | ) | 154 | (389,573 | ) | 204,380 | (363,365 | ) | — | |||||||||||||||
Net gain/(loss) on investments | (5,175 | ) | 154 | (389,573 | ) | 204,380 | (155,411 | ) | 272,202 | |||||||||||||||
Minority interests | 795 | — | — | — | (817,950 | ) | — | |||||||||||||||||
NET INCREASE/(DECREASE) IN OWNERS’ CAPITAL RESULTING FROM OPERATIONS | $ | (11,679 | ) | $ | 112 | $ | (383,157 | ) | $ | 126,166 | $ | (1,268,834 | ) | $ | 197,693 | |||||||||
| (1) | The Currency Series (formerly C-View Currency Series) and Dunn Series of the Trust received additional capital contributions to commence trading operations on September 24, 2004. The Graham Series of the Trust commenced trading operations on November 19, 2004, upon receipt of additional capital contributions. |
The accompanying notes are an integral part of these statements.
Fin. - 35
Table of Contents
Statements of Changes in Owners’ Capital
For the Years Ended December 31, 2005 and 2004(1)
| Balanced Series | Beach Series | ||||||||||||||||||||||||||||
| Class 1 | Class 2 | Class 1 | Class 2 | ||||||||||||||||||||||||||
| Managing Owner | Limited Owners | Managing Owner | Limited Owners | Managing Owner | Limited Owners | Managing Owner | Limited Owners | ||||||||||||||||||||||
Owner’s Capital, January 1, 2004 | $ | — | $ | — | $ | 1,000 | $ | — | $ | — | $ | — | $ | 1,000 | $ | — | |||||||||||||
Sale of Units | 11,653,988 | 20,000,000 | 3,968,134 | 481,793 | 172,873 | ||||||||||||||||||||||||
Redemption of Units | (8,738 | ) | (4,400,000 | ) | (50,000 | ) | |||||||||||||||||||||||
Net increase in Owners’ Capital resulting from operations | 127,012 | 1,301,820 | 63,969 | 7,139 | 68 | 4,548 | |||||||||||||||||||||||
Owners’ Capital, December 31, 2004 | — | 11,772,262 | 16,902,820 | 3,982,103 | — | 488,932 | 1,068 | 177,421 | |||||||||||||||||||||
Sale of Units | 100,673,862 | 18,337,828 | 1,398,568 | 71,500 | |||||||||||||||||||||||||
Redemption of Units | (3,339,477 | ) | (17,195,006 | ) | (2,212,691 | ) | (81,685 | ) | (83,490 | ) | |||||||||||||||||||
Net (decrease) in Owners’ Capital resulting from operations | 5,634,669 | 293,273 | 1,116,585 | 241,432 | 95 | 11,712 | |||||||||||||||||||||||
Owners’ Capital, December 31, 2005 | $ | — | $ | 114,741,316 | $ | 1,087 | $ | 21,223,825 | $ | — | $ | 2,047,247 | $ | 1,163 | $ | 177,143 | |||||||||||||
Owner’s Capital—Units, January 1, 2004 | — | — | 10 | — | — | — | 10 | — | |||||||||||||||||||||
Sale of Units | 111,113 | 200,000 | 37,741 | 4,612 | 1,661 | ||||||||||||||||||||||||
Redemption of Units | (82 | ) | (41,815 | ) | (472 | ) | |||||||||||||||||||||||
Owners’ Capital—Units, December 31, 2004 | — | 111,031 | 158,195 | 37,269 | — | 4,612 | 10 | 1,661 | |||||||||||||||||||||
Sale of Units | 1,020,184 | 180,579 | 14,578 | 731 | |||||||||||||||||||||||||
Redemption of Units | (34,037 | ) | (158,185 | ) | (22,642 | ) | (900 | ) | (869 | ) | |||||||||||||||||||
Owners’ Capital—Units, December 31, 2005 | — | 1,097,178 | 10 | 195,206 | — | 18,290 | 10 | 1,523 | |||||||||||||||||||||
Net asset value per unit at commencement of operations(1) | $ | 100.00 | $ | 100.00 | $ | 100.00 | $ | 100.00 | |||||||||||||||||||||
Change in net asset value per unit for year ended | 6.03 | 6.85 | 6.01 | 6.84 | |||||||||||||||||||||||||
Net asset value per unit at December 31, 2004 | $ | 106.03 | $ | 106.85 | $ | 106.01 | $ | 106.84 | |||||||||||||||||||||
Change in net asset value per unit for year ended | (1.45 | ) | 1.88 | 5.92 | 9.43 | ||||||||||||||||||||||||
Net asset value per unit at December 31, 2005 | $ | 104.58 | $ | 108.73 | $ | 111.93 | $ | 116.27 | |||||||||||||||||||||
| (1) | The Balanced Series and Beach Series of the Trust received additional capital contributions to commence trading operations on September 24, 2004. |
The accompanying notes are an integral part of these statements.
Fin. - 36
Table of Contents
The Frontier Fund
Statements of Changes in Owners’ Capital
For the Years Ended December 31, 2005 and 2004(1)
| Campbell/Graham Series | Currency Series | |||||||||||||||||||||||||||||
| Class 1 | Class 2 | Class 1 | Class 2 | |||||||||||||||||||||||||||
| Managing Owner | Limited Owners | Managing Owner | Limited Owners | Managing Owner | Limited Owners | Managing Owner | Limited Owners | |||||||||||||||||||||||
Owner’s Capital, January 1, 2004 | $ | — | $ | — | $ | — | $ | — | $ | — | $ | — | $ | 1,000 | $ | — | ||||||||||||||
Sale of Units | 16,543 | 440,000 | 1,000 | |||||||||||||||||||||||||||
Redemption of Units | ||||||||||||||||||||||||||||||
Net increase in Owners’ Capital resulting from operations | 43 | 35 | 34 | |||||||||||||||||||||||||||
Owners’ Capital, December 31, 2004 | — | — | — | — | — | 16,586 | 441,035 | 1,034 | ||||||||||||||||||||||
Sale of Units | 21,748,476 | 1,000 | 2,750,994 | 303,197 | 2,000,000 | 5,000 | ||||||||||||||||||||||||
Redemption of Units | (497,000 | ) | (37,497 | ) | (375,000 | ) | ||||||||||||||||||||||||
Net increase (decrease) in Owners’ Capital resulting from operations | 310,014 | (32 | ) | 94,594 | (5,524 | ) | (6,140 | ) | (15 | ) | ||||||||||||||||||||
Owners’ Capital, December 31, 2005 | $ | — | $ | 21,561,490 | $ | 968 | $ | 2,845,588 | $ | — | $ | 276,762 | $ | 2,059,895 | $ | 6,019 | ||||||||||||||
Owner’s Capital—Units, January 1, 2004 | — | — | — | — | — | — | 10 | — | ||||||||||||||||||||||
Sale of Units | 162 | 4,252 | 10 | |||||||||||||||||||||||||||
Redemption of Units | ||||||||||||||||||||||||||||||
Owners’ Capital—Units, December 31, 2004 | — | — | — | — | — | 162 | 4,262 | 10 | ||||||||||||||||||||||
Sale of Units | 233,903 | 10 | 29,386 | 3,050 | 19,712 | 49 | ||||||||||||||||||||||||
Redemption of Units | (5,261 | ) | (378 | ) | (3,663 | ) | ||||||||||||||||||||||||
Owners’ Capital—Units, December 31, 2005 | — | 228,642 | 10 | 29,386 | — | 2,834 | 20,311 | 59 | ||||||||||||||||||||||
Net asset value per unit at commencement of operations(1) | $ | 100.00 | $ | 100.00 | $ | 100.00 | $ | 100.00 | ||||||||||||||||||||||
Change in net asset value per unit for year ended December 31, 2004 | N/A | N/A | 2.67 | 3.47 | ||||||||||||||||||||||||||
Net asset value per unit at December 31, 2004 | N/A | N/A | $ | 102.67 | $ | 103.47 | ||||||||||||||||||||||||
Change in net asset value per unit for year ended December 31, 2005 | (5.70 | ) | (3.17 | ) | (5.01 | ) | (2.05 | ) | ||||||||||||||||||||||
Net asset value per unit at December 31, 2005 | $ | 94.30 | $ | 96.83 | $ | 97.66 | $ | 101.42 | ||||||||||||||||||||||
| (1) | The Campbell/Graham Series of the Trust commenced trading operations on February 11, 2005. The Currency Series (formerly C-View Currency Series) of the Trust received additional capital contributions to commence trading operations on September 24, 2004. |
The accompanying notes are an integral part of these statements.
Fin. - 37
Table of Contents
The Frontier Fund
Statements of Changes in Owners’ Capital
For the Years Ended December 31, 2005 and 2004(1)
| Dunn Series | Graham Series | |||||||||||||||||||||||||||||
| Class 1 | Class 2 | Class 1 | Class 2 | |||||||||||||||||||||||||||
| Managing Owner | Limited Owners | Managing Owner | Limited Owners | Managing Owner | Limited Owners | Managing Owner | Limited Owners | |||||||||||||||||||||||
Owner’s Capital, January 1, 2004 | $ | — | $ | — | $ | 1,000 | $ | — | $ | — | $ | — | $ | 1,000 | $ | — | ||||||||||||||
Sale of Units | 121,000 | 2,145,503 | 1,939,594 | 4,400,000 | 312,500 | |||||||||||||||||||||||||
Redemption of Units | ||||||||||||||||||||||||||||||
Net increase (decrease) in Owners’ Capital resulting from operations | (3,953 | ) | 58 | 130,061 | 21,989 | 172,598 | 3,106 | |||||||||||||||||||||||
Owners’ Capital, December 31, 2004 | — | 117,047 | 1,058 | 2,275,564 | — | 1,961,583 | 4,573,598 | 315,606 | ||||||||||||||||||||||
Sale of Units | 117,793 | 5,061 | 5,283,276 | 1,573,710 | ||||||||||||||||||||||||||
Redemption of Units | (19,430 | ) | (1,784,495 | ) | (953,857 | ) | (3,991,781 | ) | (78,617 | ) | ||||||||||||||||||||
Net increase (decrease) in Owners’ Capital resulting from operations | (21,985 | ) | (156 | ) | (361,016 | ) | (648,922 | ) | (580,960 | ) | (38,952 | ) | ||||||||||||||||||
Owners’ Capital, December 31, 2005 | $ | — | $ | 193,425 | $ | 902 | $ | 135,114 | $ | — | $ | 5,642,080 | $ | 857 | $ | 1,771,747 | ||||||||||||||
Owner’s Capital—Units, January 1, 2004 | — | — | 10 | — | — | — | 10 | — | ||||||||||||||||||||||
Sale of Units | 1,115 | 21,514 | 18,939 | 44,000 | 3,037 | |||||||||||||||||||||||||
Redemption of Units | — | |||||||||||||||||||||||||||||
Owners’ Capital—Units, December 31, 2004 | — | 1,115 | 10 | 21,514 | — | 18,939 | 44,010 | 3,037 | ||||||||||||||||||||||
Sale of Units | 1,330 | 53 | 60,602 | 18,544 | ||||||||||||||||||||||||||
Redemption of Units | (218 | ) | (20,068 | ) | (11,483 | ) | (44,000 | ) | (915 | ) | ||||||||||||||||||||
Owners’ Capital—Units, December 31, 2005 | — | 2,227 | 10 | 1,499 | — | 68,058 | 10 | 20,666 | ||||||||||||||||||||||
Net asset value per unit at commencement of operations(1) | $ | 100.00 | $ | 100.00 | $ | 100.00 | $ | 100.00 | ||||||||||||||||||||||
Change in net asset value per unit for year ended December 31, 2004 | 4.96 | 5.77 | 3.57 | 3.92 | ||||||||||||||||||||||||||
Net asset value per unit at December 31, 2004 | $ | 104.96 | $ | 105.77 | $ | 103.57 | $ | 103.92 | ||||||||||||||||||||||
Change in net asset value per unit for year ended December 31, 2005 | (18.13 | ) | (15.62 | ) | (20.67 | ) | (18.19 | ) | ||||||||||||||||||||||
Net asset value per unit at December 31, 2005 | $ | 86.83 | $ | 90.15 | $ | 82.90 | $ | 85.73 | ||||||||||||||||||||||
| (1) | The Dunn Series of the Trust received additional capital contributions to commence trading operations on September 24, 2004. The Graham Series of the Trust commenced trading operations on November 19, 2004, upon receipt of additional capital contributions. |
The accompanying notes are an integral part of these statements.
Fin. - 38
Table of Contents
Notes to Financial Statements
As of December 31, 2005, and December 31, 2004
1. Organization and Purpose
The Frontier Fund, or the Trust, was formed as a Delaware statutory trust on August 8, 2003, with separate Series of Units. Its term will expire on December 31, 2053 (unless terminated earlier in certain circumstances). The Trust is a multi-advisor commodity pool as described in CFTC Regulation § 4.10(d)(2).
The Trust offers six (6) separate and distinct Series: Balanced Series, Beach Series, Currency Series, Dunn Series, Graham Series, and Campbell Graham Series (each, a “Series” and collectively, the “Series”). The Trust may issue additional Series of Units. The Units of each Series are separated into two sub-classes of Units (except for the Balanced Series which are separated into four sub-classes of Units, of which Class 1a and Class 2a are currently inactive). The Trust, with respect to each Series:
| • | engages in the speculative trading of a diversified portfolio of futures, forward (including interbank foreign currencies) and options contracts and may, from time to time, engage in cash and spot transactions; |
| • | allocates funds to a subsidiary limited liability Trading Company or Companies. Each Trading Company has one-year renewable contracts with its own independent commodity trading advisor(s), or each, a Trading Advisor, that will manage all or a portion of such Trading Company’s assets, make the trading decisions for the assets of each Series vested in such Trading Company, segregate its assets from any other Trading Company and maintain separate, distinct records for each Series, and account for its assets separately from the other Series and the other Trust assets; |
| • | calculates the Net Asset Value of its Units separately from the other Series; |
| • | has an investment objective of increasing the value of each Series’ Units over the long term (capital appreciation), while controlling risk and volatility; further, to offer exposure to the investment programs of individual Trading Advisors and to specific instruments (currencies); and |
| • | offers each Series of Units in two sub-classes-Class 1 and Class 2 (except for the Balanced Series, which has four sub-classes– Class 1, Class 1a, Class 2 and Class 2a). Investors who purchase Class 1 or Class 1a Units of any Series are charged a service fee of up to three percent (3.0%) annually of the Net Asset Value of each Unit purchased, for the benefit of Selling Agents selling such Class 1 or Class 1a Units. Equinox Fund Management, LLC, or the Managing Owner, prepays the initial service fee which is amortized monthly at an annual rate of three percent (3.0%) of the average daily Net Asset Value of Class 1 or Class 1a of such Series; provided, however, that investors who redeem all or a portion of their Class 1 or Class 1a Units of any Series during the first twelve (12) months following the effective date of their purchase are subject to a redemption fee of up to three percent (3.0%) of the Net Asset Value at which such investor redeemed to reimburse the Managing Owner for the then-unamortized balance of the prepaid initial service fee. Investors who purchase Class 2 or Class 2a Units of any Series are charged no initial or ongoing service fee. However, the Managing Owner may pay the Selling Agents an on-going service fee for certain administrative services. Any such payments by the Managing Owner will not be subject to reimbursement by the Unitholders. |
| • | Units of any Class in a Series may be redeemed, in whole or in part, on a daily basis, at the then current Net Asset Value per Unit for such Series on the day of the week after the date the Managing Owner is in receipt of a redemption request for at least one (1) Business Day to be received by the Managing Owner prior to 4:00 PM in New York. Redemption of Class 1 Units of any Series, which have been held by the Unit holder for less than twelve (12) full months, will be subject to a redemption fee of up to three percent (3.0%) of the value of such Units being redeemed. Redemption fees are payable to Equinox Fund Management, LLC as Managing Owner of the Trust. |
Fin. - 39
Table of Contents
As of September 24, 2004, the Trust commenced operations for each Series except the Graham Series and Campbell Graham Series. The Graham Series commenced operations as of November 19, 2004. The Campbell Graham Series commenced operations on February 11, 2005.
2. Significant Accounting Polices
The following are the significant accounting policies of the Trust.
Basis of Presentation—The financial statements of each Series of the Trust included herein have been prepared in accordance with accounting principles generally accepted in the United States of America (“GAAP”).
The Series, through investing in Trading Companies, place assets under management of certain Trading Advisors. The Trading Companies were organized by the Managing Owner for the purpose of investing in securities and derivative instruments, and have no operating income or expenses, except for trading income and expenses, all of which is allocated to the Series. Trading Companies in which a Series has a majority equity interest are consolidated by such Series. Investments in Trading Companies in which a Series does not have a controlling or majority interest are accounted for under the equity method and are carried in the statement of financial condition of such Series at fair value based on the interest of each Series in such Trading Company.
The consolidated financial statements of Balanced Series include the assets, liabilities and earnings of its wholly-owned and majority owned Trading Companies, Frontier Trading Company I, LLC, Frontier Trading Company II, LLC, Frontier Trading Company IV, LLC and Frontier Trading Company VI, LLC.
The consolidated financial statements of Currency Series include the assets, liabilities and earnings of its majority-owned trading company, Frontier Trading Company III, LLC.
The consolidated financial statements of Campbell/Graham Series include the assets, liabilities and earnings of its majority-owned trading company, Frontier Trading Company V, LLC.
The Trust has elected not to provide statements of cash flows as permitted by Statement of Financial Accounting Standards No. 102,Statements of Cash Flows—Exemption of Certain Enterprises andClassification of Cash Flows from Certain Securities Acquired for Resale.
Cash and Cash Equivalents and Short Term Investments—For purposes of the statements of financial condition, cash and cash equivalents include money market accounts, money market funds, and time deposits with original maturities of 90 days or less. Short term investments include time deposits with original maturities of 91 days up to one year. The cash and cash equivalents, and short term investments of all Series is pooled for maximization of return. Aggregate interest income from all sources, including assets held at clearing brokers, up to 2% (annualized) is paid to the Managing Owner; any excess is accrued as income allocated to all Series in proportion to their daily net asset value.
Deposits with Broker—The Trust deposits assets with a broker subject to Commodity Futures Trading Commission regulations and various exchange and broker requirements. Margin requirements are satisfied by the deposit of cash with such broker. The Trust earns interest income on its assets deposited with the broker.
Use of Estimates—The preparation of financial statements in conformity with GAAP requires the Managing Owner to make estimates and assumptions that affect amounts of assets and liabilities and disclosure of contingent assets and liabilities that are reported in the Trust’s financial statements. The Trust’s significant accounting policies and related estimates and judgments underlying the financial statements are as identified below.
Fin. - 40
Table of Contents
Allocation of Earnings—Each Series of the Trust offers two sub-classes of Units—Class 1 and Class 2 (except for the Balanced Series, which offers four sub-classes of Units—Class 1, Class 1a, Class 2 and Class 2a). All classes have identical voting, dividend, liquidation and other rights and the same terms and conditions, except that Class 1 or Class 1a Units of each Series bear certain expenses related to the servicing of such Units. Revenues, expenses (other than expenses attributable to a specific class), and realized and unrealized trading profits and losses of each Series are allocated daily to Class 1, Class 1a, Class 2 and Class 2a Units based on each Class’ relative owners’ capital balance.
Each Series allocates funds to a subsidiary Trading Company, or Companies, of the Trust. Each Trading Company allocates all of its daily trading profits or losses to the Series in proportion to each Series’ funds allocated to the Trading Company, adjusted on a daily basis. As of December 31, 2005, the value of all open contracts and cash held at clearing brokers is similarly allocated to the Series in proportion to each Series’ funds allocated to the Trading Company, or Companies.
Investment Transactions and Valuation—The Trust records investment transactions on trade date and all investments are recorded at fair value in its financial statements, with changes in fair value reported as a component of realized and unrealized gains (losses) on investments in the Statements of Operations. Generally, fair values will be based on quoted market prices; however, in certain circumstances, significant judgments and estimates may be required in determining fair value in the absence of an active market closing price.
Income Taxes—The Trust is not subject to federal income taxes; each owner reports his allocable share of income, gain, loss, deductions or credits on his own income tax return.
Fees and Expenses—All management fees, incentive fees, and service fees of the Trust are paid to the Managing Owner. Additionally, the trading fees are paid to the Managing Owner. It is the responsibility of the Managing Owner to pay all Trading Advisor management and incentive fees, as well as all other operating expenses and continuing offering costs of the Trust.
Pending Owner Additions—Funds received for new subscriptions and for additions to existing owner interests are recorded as capital additions at the net asset value per unit of the second business day following receipt.
In applying these policies, the Managing Owner may make judgments that may require estimates about matters that are inherently uncertain.
Fin. - 41
Table of Contents
3. Investments in Unconsolidated Trading Companies
The following tables summarize the Balanced Series, Beach Series, Campbell/Graham Series, Currency Series, Dunn Series and the Graham Series investments in unconsolidated trading companies as of and for the year ended December 31, 2005.
Trading Company | Percentage of Net Assets | Fair Value | Trading Commissions | Realized Gain (Loss) | Change in Unrealized Gain (Loss) | Net Income (Loss) | |||||||||||||||||
Balanced Series— | |||||||||||||||||||||||
Frontier Trading Company I, LLC | 2.90 | % | $ | 3,949,1822 | $ | 0 | $ | (172 | ) | $ | (623 | ) | $ | (795 | ) | ||||||||
Beach Series— | |||||||||||||||||||||||
Frontier Trading Company II, LLC | 28.13 | % | $ | 626,070 | $ | (27,305 | ) | $ | 161,475 | $ | 231,686 | $ | 365,856 | ||||||||||
Campbell/Graham Series— | |||||||||||||||||||||||
Frontier Trading Company VI, LLC | 21.01 | % | $ | 5,129,155 | $ | (34,625 | ) | $ | 1,641,003 | $ | (36,022 | ) | $ | 1,570,356 | |||||||||
Currency Series— | |||||||||||||||||||||||
Frontier Trading Company III, LLC | — | — | $ | 0 | $ | (984 | ) | $ | (2,717 | ) | $ | (3,701 | ) | ||||||||||
Dunn Series— | |||||||||||||||||||||||
Frontier Trading Company IV, LLC | N/M | $ | (166,524 | ) | $ | (18,299 | ) | $ | (389,656 | ) | $ | 18,382 | $ | (389,573 | ) | ||||||||
Graham Series— | |||||||||||||||||||||||
Frontier Trading Company V, LLC | 22.12 | % | $ | 1,640,031 | $ | (7,386 | ) | $ | 160,246 | $ | (516,225 | ) | $ | (363,365 | ) | ||||||||
The following tables summarize the Beach Series, Currency Series and the Dunn Series investments in unconsolidated trading companies as of and for the year ended December 31, 2004.
Trading Company | Percentage of Net Assets | Fair Value | Trading Commissions | Realized Gain (Loss) | Change in Unrealized Gain (Loss) | Net Income (Loss) | ||||||||||||||
Beach Series— | ||||||||||||||||||||
Frontier Trading Company II, LLC | 2.35 | % | $ | 15,709 | $ | (770 | ) | $ | 2,515 | $ | 15,555 | $ | 17,300 | |||||||
Currency Series— | ||||||||||||||||||||
Frontier Trading Company III, LLC | 0.03 | % | $ | 138 | $ | 0 | $ | 256 | $ | (102 | ) | $ | 154 | |||||||
Dunn Series— | ||||||||||||||||||||
Frontier Trading Company IV, LLC | 5.27 | % | $ | 126,163 | $ | (5,170 | ) | $ | 219,345 | $ | (9,795 | ) | $ | 204,380 | ||||||
Fin. - 42
Table of Contents
The unaudited condensed statements of financial condition and statements of income as of and for the year ended December 31, 2005 for the unconsolidated trading companies are as follows:
| Frontier Trading Company II, LLC | Frontier Trading Company IV, LLC | Frontier Trading Company V, LLC | Frontier Trading Company VI, LLC | ||||||||||||
| (Unaudited) | (Unaudited) | (Unaudited) | (Unaudited) | ||||||||||||
Condensed Statement of Financial Condition—December 31, 2005 | |||||||||||||||
Cash held at futures commodities merchants | $ | 3,604,769 | $ | 1,939,800 | $ | 5,019,359 | $ | 8,077,776 | |||||||
Open trade equity | 3,527,640 | 187,880 | 97,185 | (1,222,005 | ) | ||||||||||
Total assets | $ | 7,132,409 | $ | 2,127,680 | $ | 5,116,544 | $ | 6,855,771 | |||||||
Members equity | $ | 7,132,409 | $ | 2,127,680 | $ | 5,116,544 | $ | 6,855,771 | |||||||
Condensed Statement of Income—For the Year Ended December 31, 2005 | |||||||||||||||
Interest income | $ | 137,820 | $ | 78,437 | $ | 123,550 | $ | 113,858 | |||||||
Net realized gain on investments, less commissions | 1,722,360 | (1,545,244 | ) | (857,179 | ) | 4,961,141 | |||||||||
Change in open trade equity | 3,142,512 | 269,038 | 136,041 | (1,222,005 | ) | ||||||||||
Net income | $ | 5,002,692 | $ | (1,197,769 | ) | $ | (597,588 | ) | $ | 3,852,994 | |||||
| Frontier Trading Company II, LLC | Frontier Trading Company III, LLC | Frontier Trading Company IV, LLC | |||||||||||||
| (Unaudited) | (Unaudited) | (Unaudited) | |||||||||||||
Condensed Statement of Financial Condition—December 31, 2004 | |||||||||||||||
Cash held at futures commodities merchants | $ | 1,342,163 | $ | 448,185 | $ | 1,658,389 | |||||||||
Open trade equity | 385,128 | 8,328 | (81,158 | ) | |||||||||||
Total assets | $ | 1,727,291 | $ | 456,513 | $ | 1,577,231 | |||||||||
Members equity | $ | 1,727,291 | $ | 456,513 | $ | 1,577,231 | |||||||||
Condensed Statement of Income—For the Year Ended December 31, 2004 | |||||||||||||||
Interest income | $ | 4,628 | $ | 1,161 | $ | 4,592 | |||||||||
Net realized gain on investments, less commissions | 250,724 | 53,601 | 625,916 | ||||||||||||
Change in open trade equity | 385,129 | 8,328 | (81,158 | ) | |||||||||||
Net income | $ | 640,481 | $ | 63,090 | $ | 549,350 | |||||||||
4. Transactions with Affiliates
The Managing Owner contributes funds to the Trust in order to have a 1% interest in the aggregate capital, profits and losses of all Series and in return will receive Units designated as General Units in the Series in which the Managing Owner invests such funds. The General Units may only be purchased by the Managing Owner and may be subject to no advisory fees or advisory fees at reduced rates. Otherwise, the General Units hold the same rights as the Limited Units. The Managing Owner is required to maintain at least a 1%
Fin. - 43
Table of Contents
interest in the aggregate capital, profits and losses of all Series so long as it is acting as the Managing Owner of the Trust. Such contribution was made by the Managing Owner before trading commenced for the Trust and will be maintained throughout the existence of the Trust, and the Managing Owner will make such purchases as are necessary to effect this requirement. In addition to the General Units the Managing Owner receives in respect of its Minimum Purchase Commitment, the Managing Owner may purchase Limited Units in any Series as a Limited Owner. All Units purchased by the Managing Owner are held for investment purposes only and not for resale. No principal of the Managing Owner owns any beneficial interest in the Trust but any of them is free to do so.
On September 23, 2004, the Managing Owner paid $5,000,000 to purchase a barrier option which effectively leveraged the purchase of $20,000,000 of the Trust’s Balanced Series Class 2 Units upon escrow break. On November 19, 2004, $4,400,000 of the Balanced Series Class 2 Units was exchanged by the Managing Owner for Graham Series Class 2 Units. These Units were controlled by the Managing Owner, subject to certain provisions in favor of the counterparty. Under the original terms of the barrier option, the option’s expiration date was one year after its effective date. On September 20, 2005, the Managing Owner and the counterparty extended the term of the option to December 31, 2005. As of December 1, 2005 the option was exercised in full. The counterparty liquidated the entire investment in the Trust and returned $4,561,653 to the Managing Owner.
On December 30, 2004, the Managing Owner purchased Units in the Trust’s Currency Series Class 2 for $440,000 at $103.47 per Unit. On April 29, 2005, the Managing Owner redeemed Units in the Trust’s Currency Series Class 2 for $375,000 at $102.37 per Unit. On December 22, 2005, the Managing Owner purchased Units in the Trust’s Currency Series Class 2 for $2,000,000 at $101.46 per Unit. The Managing Owner may make purchases or redemptions at any time on the same terms as any Limited Owner.
As sponsoring Management Company of the Trust, the Managing Owner has agreed to bear the organization and offering costs of the Trust. These costs were (unaudited) $1,825,024 in 2005 and $1,397,934 in 2004.
Each Series of Units will pay to the Managing Owner a monthly management fee equal to a certain percentage of such Series’ assets, calculated on a daily basis. The annual rate of the management fee for the Balanced Series is 0.5%, for the Graham Series and Campbell Graham Series is 2.5%, and for the Beach Series and Currency Series is 2.0%. There is no management fee for the Dunn Series. The Managing Owner may pay all or a portion of such management fees to the Trading Advisor(s) for such Series. For the year ended December 31, 2005, management fees due the Managing Owner were $412,657 by the Balanced Series, $26,205 by the Beach Series, $228,694 by the Campbell/Graham Series, $5,841 by the Currency Series and $216,048 by the Graham Series. Amounts payable at December 31, 2005 to the Managing Owner for management fees were $54,370 by the Balanced Series, $3,282 by the Beach Series, $47,266 by the Campbell/Graham Series, $1,307 by the Currency Series and $18,964 by the Graham Series.
Each Series pays to the Managing Owner a monthly trading fee (FCM Fee) equal to 1/12th of 0.50% of such Series’ Net Asset Value, calculated daily. For the year ended December 31, 2005, FCM fees due the Managing Owner were $381,415 by the Balanced Series, $6,551 by the Beach Series, $45,739 by the Campbell/Graham Series, $1,460 by the Currency Series, $9,317 by the Dunn Series and $43,270 by the Graham Series. Amounts payable at December 31, 2005 to the Managing Owner for FCM fees were $54,371 by the Balanced Series, $821 by the Beach Series, $9,453 by the Campbell/Graham Series, $327 by the Currency Series, $133 by the Dunn Series and $3,793 by the Graham Series.
In addition, each Series will pay to the Managing Owner an incentive fee of a certain percentage of new net trading profits generated by such Series, monthly or quarterly. Because the Balanced Series will employ multiple Trading Advisors, the Balanced Series will pay the Managing Owner a monthly incentive fee calculated on a Trading Advisor by Trading Advisor basis. It is therefore possible that in any given period the Balanced Series may pay incentive fees to the Managing Owner for one or more Trading Advisors while
Fin. - 44
Table of Contents
the Balanced Series as a whole experiences losses. The incentive fee for the Balanced and Dunn Series is 25%, and for the Beach, Currency, Graham and Campbell Graham Series is 20%. The Managing Owner may pay all or a portion of such incentive fees to the Trading Advisor(s) for such Series. For the year ended December 31, 2005, incentive fees due the Managing Owner were $4,057,615 by the Balanced Series, $60,086 by the Beach Series, $211,239 and by the Campbell/Graham Series. Amounts payable at December 31, 2005 to the Managing Owner for incentive fees were $654,435 by the Balanced Series and $12,209 by the Beach Series. Amounts receivable at December 31, 2005 from the Managing owner for incentive fees was $110,889 to the Campbell/Graham Series. This resulted from an incentive fee being calculated on a quarterly basis and, in December, the recovery of previous month’s estimated incentive fees earned.
Aggregate interest income from all sources, including assets held at clearing brokers, up to 2% (annualized) is paid to the Managing Owner. In 2005, the Trust paid $2,203,580 of such interest income to the Managing Owner.
With respect to Class 1 of each Series, the Series will pay to the Managing Owner a service fee at an annualized rate of up to 3.0%, which the Managing Owner pays to selling agents of the Trust. Bornhoft Group Securities Corporation, an affiliate of the Managing Owner, was paid service fees of $37 in 2005.
The Bornhoft Group Corporation, an affiliate of the Trust, provides services to the Trust in connection with the daily valuation of each Series and Class. For these services the Managing Owner paid The Bornhoft Group Corporation $273,067 in 2005. Additionally, The Bornhoft Group Corporation provides office space to the Managing Owner, prorates office expenses, and advances certain direct expenses on behalf of the Managing Owner. The Managing Owner reimbursed The Bornhoft Group Corporation $196,400 for these expenses in 2005.
Solon Capital, LLC, an affiliate of the Trust, serves as wholesaler of the Trust by marketing to broker/dealer organizations. For these services, the Managing Owner paid Solon Capital, LLC, $273,067 in 2005.
Fin. - 45
Table of Contents
5. Financial Highlights
The following information presents the financial highlights of the Fund for the year ended December 31, 2005. This data has been derived from information presented in the financial statements.
| Balanced Series | Beach Series | Campbell/Graham Series | ||||||||||||||||||||||
| Class 1 | Class 2 | Class 1 | Class 2 | Class 1 | Class 2 | |||||||||||||||||||
Per unit operating performance (1) | ||||||||||||||||||||||||
Net asset value, January 1, 2005 | $ | 106.03 | $ | 106.85 | $ | 106.01 | $ | 106.84 | $ | 100.00 | $ | 100.00 | ||||||||||||
Net operating results: | ||||||||||||||||||||||||
Interest income | 1.14 | 1.14 | 1.17 | 1.17 | 1.12 | 1.12 | ||||||||||||||||||
Expenses | (8.42 | ) | (5.46 | ) | (9.25 | ) | (6.40 | ) | (6.78 | ) | (4.30 | ) | ||||||||||||
Net gain/(loss) on investments, net of minority interests | 5.83 | 6.20 | 14.00 | 14.66 | (0.04 | ) | 0.01 | |||||||||||||||||
Net income | (1.45 | ) | 1.88 | 5.92 | 9.43 | (5.70 | ) | (3.17 | ) | |||||||||||||||
Net asset value, December 31, 2005 | $ | 104.58 | $ | 108.73 | $ | 111.93 | $ | 116.27 | $ | 94.30 | $ | 96.83 | ||||||||||||
Ratios to average net assets (2) | ||||||||||||||||||||||||
Net investment gain/(loss) | (7.33 | )% | (4.34 | )% | (8.46 | )% | (5.46 | )% | (8.48 | )% | (4.68 | )% | ||||||||||||
Expenses before incentive fees | 3.93 | % | 0.94 | % | 5.33 | % | 2.34 | % | 7.38 | % | 3.58 | % | ||||||||||||
Expenses after incentive fees | 8.48 | % | 5.49 | % | 9.67 | % | 6.68 | % | 10.13 | % | 6.34 | % | ||||||||||||
| Total return before incentive fees (3) | 13.72 | % | 9.89 | % | 23.95 | % | 11.92 | % | 6.69 | % | 9.58 | % | ||||||||||||
| Total return after incentive fees (3) | 9.17 | % | 5.34 | % | 19.61 | % | 7.58 | % | 4.25 | % | 7.14 | % | ||||||||||||
| Currency Series | Dunn Series | Graham Series | ||||||||||||||||||||||
| Class 1 | Class 2 | Class 1 | Class 2 | Class 1 | Class 2 | |||||||||||||||||||
Per unit operating performance (1) | ||||||||||||||||||||||||
Net asset value, January 1, 2005 | $ | 102.67 | $ | 103.47 | $ | 104.96 | $ | 105.77 | $ | 103.57 | $ | 103.92 | ||||||||||||
Net operating results: | ||||||||||||||||||||||||
Interest income | 1.10 | 1.10 | 1.13 | 1.13 | .85 | .85 | ||||||||||||||||||
Expenses | (5.69 | ) | (2.77 | ) | (3.24 | ) | (0.51 | ) | (5.09 | ) | (2.58 | ) | ||||||||||||
Net gain/(loss) on investments, net of minority interests | (0.42 | ) | (0.38 | ) | (16.02 | ) | (16.24 | ) | (16.43 | ) | (16.46 | ) | ||||||||||||
Net income | (5.01 | ) | (2.05 | ) | (18.13 | ) | (15.62 | ) | (20.67 | ) | (18.19 | ) | ||||||||||||
Net asset value, December 31, 2005 | $ | 97.66 | $ | 101.42 | $ | 86.83 | $ | 90.15 | $ | 82.90 | $ | 85.73 | ||||||||||||
Ratios to average net assets (2) | ||||||||||||||||||||||||
Net investment gain/(loss) | (4.57 | )% | (1.64 | )% | (2.33 | )% | 0.66 | % | (5.01 | )% | (2.02 | )% | ||||||||||||
Expenses before incentive fees | 5.64 | % | 2.71 | % | 3.54 | % | 0.54 | % | 6.00 | % | 3.02 | % | ||||||||||||
Expenses after incentive fees | 5.64 | % | 2.71 | % | 3.54 | % | 0.54 | % | 6.00 | % | 3.02 | % | ||||||||||||
| Total return before incentive fees (3) | (7.50 | )% | (2.56 | )% | (13.46 | )% | (23.33 | )% | (15.86 | )% | (13.83 | )% | ||||||||||||
| Total return after incentive fees (3) | (7.50 | )% | (2.56 | )% | (13.46 | )% | (23.33 | )% | (15.86 | )% | (13.83 | )% | ||||||||||||
| (1) | The Campbell/Graham Series commenced operations on February 11, 2005. Interest income and expenses per unit are calculated by dividing these amounts by the weighted average number of units outstanding during the period. The net gain/(loss) on investments, net of minority interests is a balancing amount necessary to reconcile the change in net asset value per unit with the other per unit information. |
Fin. - 46
Table of Contents
| (2) | Ratios have been annualized for the Campbell/Graham Series and exclude the impact of the incentive fees except where otherwise noted. Incentive fees have not been annualized. |
| (3) | Computed using weighted average net assets outstanding during the period. An owner’s total returns may vary from the above returns based on the timing of contributions and withdrawals. Total returns are not annualized. |
The following information presents the financial highlights of the Fund for the year ended December 31, 2004. This data has been derived from information presented in the financial statements.
| Balanced Series | Beach Series | C-View Currency Series | ||||||||||||||||||||||
| Class 1 | Class 2 | Class 1 | Class 2 | Class 1 | Class 2 | |||||||||||||||||||
Per unit operating performance (1) | ||||||||||||||||||||||||
Net asset value, inception of Series | $ | 100.00 | $ | 100.00 | $ | 100.00 | $ | 100.00 | $ | 100.00 | $ | 100.00 | ||||||||||||
Net operating results: | ||||||||||||||||||||||||
Interest income | .02 | .02 | .02 | .02 | .01 | .00 | ||||||||||||||||||
Expenses | (.93 | ) | (2.99 | ) | (.82 | ) | (1.11 | ) | (.19 | ) | (0 | ) | ||||||||||||
Net gain on investments | 7.16 | 10.83 | 6.81 | 7.93 | 2.85 | 3.47 | ||||||||||||||||||
Minority Interests | (.22 | ) | (1.01 | ) | ||||||||||||||||||||
Net income | 6.03 | 6.85 | 6.01 | 6.84 | 2.67 | 3.47 | ||||||||||||||||||
Net asset value, December 31, 2004 | $ | 106.03 | $ | 106.85 | $ | 106.01 | $ | 106.84 | $ | 102.67 | $ | 103.47 | ||||||||||||
Ratios to average net assets (2) | ||||||||||||||||||||||||
Net investment loss | (3.79 | )% | (0.90 | )% | (5.30 | )% | (2.32 | )% | (5.30 | )% | (2.35 | )% | ||||||||||||
Expenses before incentive fees | 3.97 | % | 0.97 | % | 5.50 | % | 2.48 | % | 5.48 | % | 2.35 | % | ||||||||||||
Expenses after incentive fees | 5.76 | % | 3.61 | % | 6.60 | % | 4.10 | % | 5.48 | % | 2.35 | % | ||||||||||||
| Total return before incentive fees (3) | 9.09 | % | 9.51 | % | 7.37 | % | 8.79 | % | 2.67 | % | 3.47 | % | ||||||||||||
| Total return after incentive fees (3) | 6.03 | % | 6.85 | % | 6.01 | % | 6.84 | % | 2.67 | % | 3.47 | % | ||||||||||||
| Dunn Series | Graham Series | |||||||||||||||||||||||
| Class 1 | Class 2 | Class 1 | Class 2 | |||||||||||||||||||||
Per unit operating performance (1) | ||||||||||||||||||||||||
Net asset value, inception of Series | $ | 100.00 | $ | 100.00 | $ | 100.00 | $ | 100.00 | ||||||||||||||||
Net operating results: | ||||||||||||||||||||||||
Interest income | 0 | 0 | 0 | 0 | ||||||||||||||||||||
Expenses | (1.38 | ) | (3.56 | ) | (1.06 | ) | (1.16 | ) | ||||||||||||||||
Net gain on investments | 6.34 | 9.33 | 4.63 | 5.08 | ||||||||||||||||||||
Net income | 4.96 | 5.77 | 3.57 | 3.92 | ||||||||||||||||||||
Net asset value, December 31, 2004 | $ | 104.96 | $ | 105.77 | $ | 103.57 | $ | 103.92 | ||||||||||||||||
Ratios to average net assets (2) | ||||||||||||||||||||||||
Net investment loss | (3.48 | )% | (0.49 | )% | (6.04 | )% | (2.95 | )% | ||||||||||||||||
Expenses before incentive fees | 3.48 | % | 0.49 | % | 6.04 | % | 2.95 | % | ||||||||||||||||
Expenses after incentive fees | 6.28 | % | 3.81 | % | 7.32 | % | 3.75 | % | ||||||||||||||||
| Total return before incentive fees (3) | 3.51 | % | 9.04 | % | 5.67 | % | 4.77 | % | ||||||||||||||||
| Total return after incentive fees (3) | 4.96 | % | 5.77 | % | 3.57 | % | 3.92 | % | ||||||||||||||||
| (4) | Selected data for a Unit outstanding from inception through year-end. The Balanced, Beach, C-View and Dunn Series commenced operations on September 24, 2004. The Graham Series commenced November 19, 2004. |
Fin. - 47
Table of Contents
| (5) | Ratios have been annualized and exclude the impact of the incentive fees except where otherwise noted. Incentive fees have not been annualized. |
| (6) | An owner’s total returns may vary from the above returns based on the timing of contributions and withdrawals. Total returns are not annualized. |
6. Trading Activities and Related Risks
The purchase and sale of futures and options on futures contracts require margin deposits with Futures Commodities Merchants (FCMs). Additional deposits may be necessary for any loss on contract value. The Commodity Exchange Act requires an FCM to segregate all customer transactions and assets from the FCM’s proprietary activities. A customer’s cash and other property (for example, U.S. Treasury bills) deposited with an FCM are considered commingled with all other customer funds subject to the FCM’s segregation requirements. In the event of an FCM’s insolvency, recovery may be limited to a pro rata share of segregated funds available. It is possible that the recovered amount could be less than the total of cash and other property deposited.
The term “off-balance sheet risk” refers to an unrecorded potential liability that, even though it does not appear on the Statement of Financial Condition, may result in future obligation or loss in excess of the amount paid by the Series for a particular investment. Each Trading Company expects to trade in futures, options, forward and swap contracts and will therefore be a party to financial instruments with elements of off-balance sheet market and credit risk. In entering into these contracts, there exists a market risk that such contracts may be significantly influenced by market conditions, such as interest rate volatility, resulting in such contracts being less valuable. If the markets should move against all of the futures positions held by a Trading Company in respect of any Series at the same time, and if the Trading Advisor(s) of such Trading Company are unable to offset such futures interests positions, such Trading Company could lose all of its assets and the holders of Units of such Series would realize a 100% loss. The Managing Owner will seek to minimize market risk through real-time monitoring of open positions and the level of diversification of each Trading Advisor’s portfolio. It is anticipated that any Trading Advisor’s margin-to-equity ratio will typically not exceed approximately 35% although the actual ratio could be higher or lower from time to time.
In addition to market risk, trading futures, forward and swap contracts entails credit risk in that a counterparty will not be able to meet its obligations to a Trading Company. The counterparty for futures contracts traded in the United States and on most foreign exchanges is the clearinghouse associated with such exchange. In general, clearinghouses are backed by the corporate members of the clearinghouse who are required to share any financial burden resulting from the non-performance by one of their members and, as such, should significantly reduce this credit risk. In cases where the clearinghouse is not backed by the clearing members, like some foreign exchanges, it is normally backed by a consortium of banks or other financial institutions. Some non-U.S. exchanges, in contrast to U.S. exchanges, are principals’ markets in which performance is the responsibility only of the individual counterparty with whom the Trading Company has entered into the transaction, and not of the exchange or clearing corporation. In these kinds of markets, there is risk of bankruptcy or other failure or refusal to perform by the counterparty.
In the case of forward contracts traded on the interbank market and swaps, neither are traded on exchanges. The counterparty is generally a single bank or other financial institution, rather than a group of financial institutions; thus there may be a greater counterparty credit risk. The Managing Owner expects the Trading Advisors to trade only with those counterparties which it believes to be creditworthy. All positions of each Trading Company will be valued each day on a mark-to-market basis. There can be no assurance that any clearing member, clearinghouse or other counterparty will be able to meet its obligations to any Trading Company.
Fin. - 48
Table of Contents
The unrealized gain (loss) on open futures contracts is comprised of the following:
Futures Contracts (exchange-traded) | ||||||||
| December 31, 2005 | December 31, 2004 | |||||||
Gross unrealized gains | $ | 17,528,857 | $ | 2,337,340 | ||||
Gross unrealized (losses) | (10,266,195 | ) | (1,742,024 | ) | ||||
Net unrealized gain (loss) | $ | 7,262,662 | $ | 595,316 | ||||
The Managing Owner has established procedures to actively monitor and minimize market and credit risks. The Limited Owners bear the risk of loss only to the extent of the market value of their respective investments and, in certain specific circumstances, distributions and redemptions received.
7. Indemnifications
The Trust has entered into agreements, which provide for the indemnification of futures clearing brokers, currency trading companies, and commodity trading advisers, among others, against losses, costs, claims and liabilities arising from the performance of their individual obligations under such agreements, except for gross negligence or bad faith. The Trust has had no prior claims or payments pursuant to these agreements. The Trust’s individual maximum exposure under these arrangements is unknown, as this would involve future claims that may be made against the Trust that have not yet occurred. However, based on experience the Trust expects the risk of loss to be remote.
8. Subsequent Events
On February 9, 2006, a registration statement filed November 15, 2005 on Form S-1 (File No. 333-129701), as amended February 8, 2006, was declared effective. The Trust registered a total of 1,620,000 Units in such registration statement, including 270,000 Units in Balanced Series (Class 1a and 2a), 350,000 Units in Long Only Commodity Series, 250,000 Units in Long/Short Commodity Series and 750,000 Units in Managed Futures Index Series. The estimated aggregate offering price was $162,000,000, which amount was calculated assuming that all Units were sold during the Initial Offering Period at the price of $100 per Unit.
Fin. - 49
Table of Contents
REPORT OF INDEPENDENT REGISTERED PUBLIC ACCOUNTING FIRM
To the Executive Committee of the Managing Owners
Equinox Fund Management, LLC
Denver, Colorado
We have audited the accompanying consolidated statement of financial condition of Equinox Fund Management, LLC and subsidiaries (the Company) as of December 31, 2005. This consolidated statement of financial condition is the responsibility of the Company’s management. Our responsibility is to express an opinion on this financial statement based on our audit.
We conducted our audit in accordance with the standards of the Public Company Accounting Oversight Board (United States). Those standards require that we plan and perform the audit to obtain reasonable assurance about whether the financial statements are free of material misstatement. An audit includes examining, on a test basis, evidence supporting the amounts and disclosures in the financial statements. An audit also includes assessing the accounting principles used and significant estimates made by management, as well as evaluating the overall financial statement presentation. We believe that our audit provided a reasonable basis for our opinion.
In our opinion, the consolidated statement of financial condition presents fairly, in all material respects, the financial position the Equinox Fund Management, LLC and subsidiaries as of December 31, 2005, in conformity with U.S. generally accepted accounting principles.
/s/ McGladrey & Pullen, LLP
Denver, Colorado
March 31, 2006
Fin. - 50
Table of Contents
Consolidated Statements of Financial Condition
September 30, 2006 | December 31, 2005 | |||||||
| (unaudited) | ||||||||
| ASSETS | ||||||||
Current Assets | ||||||||
Cash, Cash Equivalents and Short-term Investments | $ | 1,194,185 | $ | 4,400,432 | ||||
Cash Held at Futures Commodity Merchants | — | 875,159 | ||||||
Investments in The Frontier Fund | 3,358,836 | 4,977 | ||||||
Accounts Receivable from Affiliates | 1,648,326 | 1,367,573 | ||||||
Open Trade Equity | — | 19,481 | ||||||
Other Current Assets | — | 5,947 | ||||||
Total Current Assets | 6,201,347 | 6,673,569 | ||||||
Property and Equipment | ||||||||
Furniture, Fixtures and Equipment | 28,689 | 27,653 | ||||||
Information Systems | 41,032 | 35,411 | ||||||
| 69,721 | 63,064 | |||||||
Accumulated Depreciation | (40,939 | ) | (32,539 | ) | ||||
Net Property and Equipment | 28,782 | 30,525 | ||||||
Total Assets | $ | 6,230,129 | $ | 6,704,094 | ||||
| LIABILITIES, MEMBERS' CAPITAL & OWNERS' CAPITAL | ||||||||
LIABILITIES | ||||||||
Accounts Payable | 2,002,729 | 1,313,833 | ||||||
Accounts Payable and Accrued Expenses due to Affiliates | 58,451 | 45,739 | ||||||
Deferred Service Fee Revenue | 2,870,520 | 1,805,352 | ||||||
Accrued Expenses | 76,821 | 397,407 | ||||||
Note Payable to Affiliate | — | 100,000 | ||||||
Total Liabilities | 5,008,521 | 3,662,331 | ||||||
MINORITY INTERESTS | — | 755,450 | ||||||
MEMBERS' CAPITAL | ||||||||
Capital Contributions—Class A | 5,006,000 | 5,006,000 | ||||||
Capital Contributions—Class B | 2,978,146 | 2,978,146 | ||||||
Accumulated Deficit | (6,762,538 | ) | (5,697,833 | ) | ||||
Total Members' Capital | 1,221,608 | 2,286,313 | ||||||
Total Liabilities and Owners' Capital | $ | 6,230,129 | $ | 6,704,094 | ||||
See Notes to Consolidated Statements of Financial Condition.
Fin. - 51
Table of Contents
Notes to Consolidated Statements of Financial Condition
As of September 30, 2006 (unaudited), and December 31, 2005
1. Nature of Business and Summary of Significant Accounting Policies
Equinox Fund Management, LLC (the “Company”) was formed as a Delaware limited liability company on June 25, 2003, to organize and manage various funds, including The Frontier Fund (the “Trust”), a Delaware Unit Trust, which consists of the Balanced Series, Campbell/Graham Series, Currency Series, Dunn Series, Graham Series, Long Only Commodity Series, Long/Short Commodity Series, Managed Futures Index Series, and Winton Series (collectively, the “Series”).
The Company has four classes of capital investors, as defined in the Operating Agreement of Equinox Fund Management, LLC (the “Agreement”), dated June 25, 2003:
| • | “Class A Member” shall mean that entity, as defined in the Agreement, which makes capital contributions to the Company to be invested by the Company directly in the Trust. |
| • | “Class B Member” shall mean that entity, as defined in the Agreement, which makes the start-up capital contributions to the Company. Profits and losses will be allocated to this member until start-up capital is recovered. |
| • | “Class C Member” shall mean that entity, as defined in the Agreement, issued Class C membership interests in exchange for services rendered. |
| • | “Class D Member” shall mean the person or entity, as defined in the Agreement, issued a membership interest in the Company pursuant to the exercise of certain options pursuant to the terms and conditions of the option agreement. |
A summary of significant accounting policies is as follows:
Basis of Presentation—The interim Statement of Financial Condition of the Company included herein has been prepared in accordance with accounting principles generally accepted in the United States of America for interim financial information. Accordingly, it does not include all the information and footnotes required by generally accepted accounting principles for complete financial statements. This interim financial statement is unaudited and should be read in conjunction with the audited Consolidated Statement of Financial Condition and notes thereto included herein for the year ended December 31, 2005. The Company follows the same accounting policies in the preparation of interim reports as set forth in the annual report. In the opinion of management, the interim Statement of Financial Condition reflects all adjustments, which are of a normal recurring nature, necessary for a fair presentation of the financial position for the interim period. Certain prior year numbers have been reclassified to conform to current year presentation.
Pursuant to the terms of the barrier option, see Note 5, as of December 31, 2004, the Company had the ability to exercise significant influence over the Frontier Fund—Balanced Series (“Balanced Series”) and the Frontier Fund—Graham Series (“Graham Series”) and bore the risk of gains and losses on approximately 90% of the Balanced Series and 67% of the Graham Series. The Company also owned 100% of the Frontier Fund—Currency Series (“Currency Series”).
During 2005, independent third party ownership interests in the Balanced Series, Currency Series, and Graham Series increased above 50% and the Company no longer had a controlling interest in these Series; therefore, the Balanced Series, Currency Series, and Graham Series were deconsolidated during 2005. See note 2. At the time of deconsolidation, the Company began to account for its investments in those series using the equity method of accounting. As of December 22, 2005, the Company again held a controlling interest in the Currency Series. The accompanying consolidated statement of financial condition as of December 31, 2005, includes the accounts of the Company and the Currency Series. All significant
Fin. - 52
Table of Contents
intercompany balances and transactions were eliminated in consolidation. As of March 31, 2006, the Company reduced its interest in the Currency Series below 50% and the Company no longer had a controlling interest in the Currency Series, which was deconsolidated at that time. At the time of deconsolidation, the Company began to account for its investment in the Currency Series using the equity method of accounting.
The consolidated statements of financial condition as of September 30, 2006, and December 31, 2005, and the accompanying notes have been prepared in accordance with accounting principles generally accepted in the United States of America. In the opinion of management, these statements of financial condition reflect all adjustments, which are of a normal recurring nature, necessary for a fair presentation of the financial condition as of September 30, 2006, and December 31, 2005.
Cash and Cash Equivalents and Short Term Investments—Cash and cash equivalents include money market accounts and time deposits with original maturities of 90 days or less. Short term investments include time deposits with original maturities of 91 days up to one year.
Investment Transactions and Valuation—The Company records investment transactions on a trade date basis. All investments in futures are recorded at fair value in the statements of financial condition, with changes in fair value reported as a component of trading profits (losses) in the period of the change. Generally, fair values will be based on quoted market prices; however, in certain circumstances, significant judgments and estimates may be required in determining fair value in the absence of an active market closing price. The Company records investments in the Trust at the net asset value for each respective Series as of the Company’s financial statement date.
As sponsoring management company of the Trust, the Company can exert influence over the operations of the Series of the Trust. The Company invests in each Series in the Trust and where the Company does not have a controlling interest, the Company accounts for its investment using the equity method and recognizes its pro rata share of the earnings or losses of the respective Series. Because the series publish a daily net asset value, the carrying value of Company’s investments in such series is at fair value. Series in which the Company has a majority equity interest are consolidated by the Company, and the consolidated statements of financial condition of the Company include the assets, liabilities and earnings of the majority owned series.
Use of Estimates—The preparation of financial statements in accordance with accounting principles generally accepted in the United States of America requires management to make estimates and assumptions that affect the reported amounts of assets and liabilities and reported amounts of revenues and expenses. Actual results could materially differ from those estimates.
Furniture, Fixtures, Information Systems and Equipment—Furniture, Fixtures & Equipment are recorded at cost and depreciated on the double declining balance method over useful lives ranging from five to seven years. Information systems consist of hardware and capitalized software recorded at cost and depreciated on the double declining balance method over five years. Maintenance and repair costs are charged to expense as incurred. When long-lived assets are retired or disposed, the costs and accumulated depreciation are eliminated and the resulting profit or loss is recognized in income. For the nine months ended September 30, 2006, and the year ended December 31, 2005, depreciation expense was $8,400 and $14,239, respectively.
Impairment of long-lived assets—The Company reviews long-lived assets for impairment whenever events or changes in circumstances indicate that the carrying amount of an asset may not be recoverable.
Recoverability is determined based on future undiscounted cash flows from the use and ultimate disposition of the asset. Impairment loss is calculated as the difference between the carrying amount of the asset and its fair value. No impairment losses have been recorded.
Fin. - 53
Table of Contents
Income Taxes—The Company is classified as a partnership for Federal income tax purposes. As a partnership for Federal income tax purposes, the Company will not incur Federal income tax liability. Items of partnership income, gains, loss and deduction will pass through to members, as partners in the Company. Therefore no Federal income tax provision is required.
Fair Value of Financial Instruments—Substantially all of the Company’s assets and liabilities are carried at fair value or contracted amounts that approximate fair value. Estimates of fair value are made at a specific point in time, based on relative market information and information about the financial instrument, specifically, the value of the underlying financial instrument. Assets that are recorded at fair value consist largely of short-term receivables and prepaid expenses, which are carried at contracted amounts that approximate fair value. Similarly, the Company’s liabilities consist of short term liabilities recorded at contracted amounts that approximate fair value.
2. Investments in The Frontier Fund
The Company is required under its registration statement to maintain an investment in the Trust equal to or greater than 1% of the aggregate of the Trust’s Series’ capital. The Company’s investment may be in only one Series, or divided into various Series in any proportion, at the Company’s discretion. In 2006 the Company agreed with certain regulatory agencies to modify this discretion to maintain a 1% investment in the capital of each of the Balanced Series’ Classes 1a and 2a, the Long Only Commodity Series, Long/Short Commodity Series and Managed Futures Index Series.
Investments in consolidated and unconsolidated series of the Trust at September 30, 2006, and December 31, 2005 are as follows:
| September 30, 2006 | December 31, 2005 | |||||||||||
| Investment | Basis of Accounting | Investment | Basis of Accounting | |||||||||
Balanced Series—Class 2 | $ | 1,637,520 | Equity | $ | 1,087 | Equity | (1) | |||||
Balanced Series—Classes 1a and 2a | 46,495 | Equity | — | |||||||||
Campbell/Graham Series | 594,939 | Equity | 968 | Equity | (3) | |||||||
Currency Series | 87,995 | Equity | (4) | 2,059,895 | Consolidated | (2) | ||||||
Dunn Series | 833 | Equity | 902 | Equity | ||||||||
Graham Series | 368,210 | Equity | 857 | Equity | (1) | |||||||
Long Only Commodity Series | 47,585 | Equity | — | |||||||||
Long/Short Commodity Series | 214,586 | Equity | — | |||||||||
Managed Futures Index Series | 48,989 | Equity | — | |||||||||
Winton Series | 311,684 | Equity | 1,163 | Equity | ||||||||
Total | $ | 3,358,836 | $ | 2,064,872 | ||||||||
| (1) | Deconsolidated during the quarter ended March 31, 2005. |
| (2) | Deconsolidated during the quarter ended June 30, 2005, and again consolidated during the quarter ended December 31, 2005. |
| (3) | The series did not commence operations until February, 2005. |
| (4) | Deconsolidated during the quarter ended March 31, 2006. |
The Company, as sponsoring management company of the Trust, has agreed to absorb the offering costs of the Trust. Offering costs include legal fees and accounting services related to the initial and ongoing filing of documents necessary for obtaining and maintaining regulatory approval for offering of the Trust to investors, regulatory filing fees, and printing and ancillary costs. Offering costs are expensed as incurred.
Fin. - 54
Table of Contents
3. Related Party Transactions
On April 29, 2005, the Company redeemed $375,000 of its interest in the Currency Series Class 2. On December 22, 2005, the Company added $2,000,000 to its investment in the Currency Series Class 2.
The Company made the following investments and redemptions in the Trust in 2006:
| Date | Series—Class | Amount | ||||
February 24, 2006 | Long Only—2 | $ | 1,000 | |||
February 24, 2006 | Long/Short—2 | 1,000 | ||||
February 24, 2006 | Managed Futures Index—2 | 1,000 | ||||
March 31, 2006 | Balanced—2 | 1,200,000 | ||||
March 31, 2006 | Currency—2 | (1,000,000 | ) | |||
March 31, 2006 | Campbell/Graham—2 | 100,000 | ||||
March 31, 2006 | Long Only—2 | 50,000 | ||||
March 31, 2006 | Long/Short—2 | 50,000 | ||||
March 31, 2006 | Managed Futures Index—2 | 50,000 | ||||
April 28, 2006 | Winton Series | (1,309 | ) | |||
April 28, 2006 | Graham—2 | 1,309 | ||||
May 1, 2006 | Balanced—1a | 200 | ||||
May 1, 2006 | Balanced—2a | 50,000 | ||||
May 31, 2006 | Graham—2 | 260,000 | ||||
May 31, 2006 | Long/Short—2 | 50,000 | ||||
June 30, 2006 | Graham—2 | 130,000 | ||||
June 30, 2006 | Long/Short—2 | 20,000 | ||||
August 11, 2006 | Long/Short—2 | 30,000 | ||||
August 11, 2006 | Winton—1 | 1,000 | ||||
August 11, 2006 | Winton—2 | 100,000 | ||||
September 29, 2006 | Balanced—2 | 500,000 | ||||
September 29, 2006 | Currency—2 | (1,000,000 | ) | |||
September 29, 2006 | Campbell/Graham—2 | 500,000 | ||||
September 29, 2006 | Long/Short—2 | 70,000 | ||||
September 29, 2006 | Winton—2 | 210,000 | ||||
Each Series of the Trust pays to the Company a monthly management fee equal to a certain percentage of such Series’ assets, calculated on a daily basis. The annual rate of the management fee is 0.5% for the Balanced Series, 2.5% for the Campbell/Graham and Graham Series, 2.0% for the Currency Series, Long Only Series, Managed Futures Index Series and Winton Series, and 3.5% for the Long/Short Series. There is no management fee for the Dunn Series. The Company pays all or a portion of such management fees to the trading advisor(s) for such Series. As of September 30, 2006, and December 31, 2005, management fees of $376,585 and $123,884, respectively, were receivable from the Trust.
Each Series pays to the Company a monthly trading fee equal to an annual rate of 0.5% of such Series’ assets, calculated on a daily basis. As of September 30, 2006, and December 31, 2005 trading fees of $139,614 and $68,571, respectively, were receivable from the Trust.
Fin. - 55
Table of Contents
In addition, each Series, except the Long Only Commodity Series and Managed Futures Index Series, pays the Company an incentive fee equal to a certain percentage of new net trading profits generated by such Series, monthly or quarterly. Because the Balanced Series, Currency Series and Long/Short Commodity Series employ multiple trading advisors, these Series pay the Company a monthly incentive fee calculated on a trading advisor by trading advisor basis. The incentive fee is 25% for the Balanced and Dunn Series, and 20% for the Currency, Campbell/Graham, Graham, Long/Short and Winton Series. The Company pays all or a portion of such incentive fees to the trading advisor(s) for such Series. As of September 30, 2006, and December 31, 2005 incentive fees of $68,472 and $555,666, respectively, were receivable from the Trust.
Aggregate interest income of the Trust from all sources, including assets held at clearing brokers, up to 2% (annualized) is paid to the Company from the Balanced Series Classes 1 and 2, Campbell/Graham Series, Currency Series, Graham Series and Winton Series. The Balanced Series Classes 1a and 2a, Long Only Commodity Series, Long/Short Commodity Series and Managed Futures Index Series pay 20% of their interest income from all sources to the Company. As of September 30, 2006, and December 31, 2005 interest income from the Trust of $493,731 and $189,552, respectively, was receivable by the Company.
With respect to Class 1 of each Series, the Series pays monthly to the Company a service fee at an annualized rate of up to 3.0%, which the Company pays to selling agents of the Trust. The initial service fee (for the first 12 months) relating to a sale of the Units is prepaid to the Company by each Series, and paid to the selling agents by the Company in the month following sale. The Company records the prepaid service fees received from the Series as deferred service fee revenue, and recognizes the revenue over the initial service fee period of twelve months. Since the Company is prepaying the initial service fee for the first year and is being reimbursed by the Series monthly in arrears based upon a corresponding percentage of net asset value, it bears the risk and the upside potential of any difference between the amount of the initial service fee prepaid and the amount of the reimbursement thereof as a result of variations in net asset value. As of September 30, 2006, and December 31, 2005 this difference in prepaid service fees resulted in $19,436 payable to the Trust and $1,669 receivable from the Trust, respectively. As of September 30, 2006 initial service fees of $370,003 were receivable from the Trust, and trailing service fees (for the period after the first 12 months) receivable from the Trust were $218,805. As of December 31, 2005 initial service fees of $407,132 were receivable from the Trust, and trailing service fees receivable from the Trust were $21,099.
Bornhoft Group Securities Corporation, an affiliate of the Company, is paid service fees when it acts as selling agent, and may pay some or all of these fees to unrelated sub-agents. Service fees paid to Bornhoft Group Securities Corporation for the nine months ended September 30, 2006 were $15,444, and for the year ended December 31, 2005 were $100.
The Bornhoft Group Corporation, an affiliate of the Company, provides services to the Company in connection with the daily valuation of each Series and class of the Trust. For these services the Company pays The Bornhoft Group Corporation a fee of 0.25% (annualized) of the net asset value of the Trust, calculated daily. These fees were $489,970 for the nine months ended September 30, 2006, and $273,067 for the year ended December 31, 2005. Additionally, The Bornhoft Group Corporation provides office space to the Company, prorates office expenses, and advances certain direct expenses on behalf of the Company. The Company reimbursed The Bornhoft Group Corporation $192,925 for these expenses in the nine months ended September 30, 2006, and $196,400 in the year ended December 31, 2005. As of September 30, 2006, and December 31, 2005 accounts payable to The Bornhoft Group Corporation were $49,952 and $6,475, respectively.
The Company pays to Solon Capital LLC, an affiliate, a monthly fee of 0.75% (annualized) of the net asset value of the Trust, calculated daily, for services in connection with marketing the Trust to the broker/dealer community. During 2005 the rate for this fee was 0.25%. These fees were $1,469,910 for the nine months ended September 30, 2006, and $273,067 for the year ended December 31, 2005. As of September 30, 2006, and December 31, 2005 accounts payable to Solon Capital were $203,699 and $35,079, respectively.
Fin. - 56
Table of Contents
An affiliate of the Company, Plimpton Capital, LLC, loaned $100,000 to the Company on January 6, 2005, bearing interest at 4.5%. As of December 31, 2005, interest of $4,185 is payable to Plimpton Capital, LLC. The note and accrued interest were paid in full on June 12, 2006.
4. Members’ Capital
In 2003, the Company was initially capitalized by Plimpton Capital with $1,756,000 of Class A Member’ Capital and $1,026,000 of Class B Member’ Capital. On September 23, 2004, Plimpton Capital, LLC invested an additional $3,250,000 in Class A and $1,250,000 in Class B. On October 6, 2004, Plimpton Capital invested an additional $452,146 in Class B, and on October 7, 2004, another $250,000 in Class B. There were no capital contributions to any class of capital in 2005 or 2006.
Distributions of Trust Distributable Cash (“TDC” as defined in the Agreement) shall be made to the Class A Member. Distributions of TDC from management operations, other than capital transactions, to the extent available, shall be distributed to the Class B, Class C and Class D Members in the following order of priority: first, one hundred percent (100%) to the Class B Member, until the Class B Member has received cumulative distributions equal to the start-up capital contribution; and thereafter, to the Class B, Class C and Class D Members, pro rata, in accordance with their percentage profits interests. Distributions of TDC from management operations attributable to capital transactions, to the extent available, shall be distributed to the Class B and Class D Members, pro rata, in accordance with their percentage capital interests.
The Company’s net worth is in excess of the minimum net worth requirements of $1,000,000 under the North American Securities Administrators Association Guidelines for Registration of Commodity Pool Programs, or the NASAA Guidelines. The Company has agreed that so long as it remains the Managing Owner of the Trust, it will not take or voluntarily permit to be taken any affirmative action to reduce the Managing Owner’s net worth below any regulation-required amounts.
5. Barrier Option
On September 24, 2004 the Company paid a $5,000,000 premium to purchase a barrier option which effectively leveraged the nominal premium amount into a $20,000,000 investment (the option notional amount), which pursuant to the barrier option terms was used to purchase $20,000,000 of Frontier Fund Balanced Series-2 Units. On November 19, 2004, under terms provided in the barrier option, $4,400,000 of the Balanced Series-2 Units were exchanged for Graham Series-2 Units. The option strike price was $15,000,000 plus 1.00% per month compounded monthly for the first six months and 0.83% per month compounded monthly thereafter until expiration.
Under the terms of the barrier option, the Company retained all profits and losses from the $20,000,000 investment in the Trust and controlled the actions of the counterparty to the barrier option relative to the investment. Because of these conditions, the barrier option had been recorded as a financing activity and the $15,000,000 option strike price had been recorded as a liability to the counterparty. The increase or decrease in net asset value of the counterparty’s investment in the series of the Trust is included in the Company’s Investments in The Frontier Fund, and the net asset value of the series represents fair market value.
Under the original terms of the barrier option, the option’s expiration date was one year after its effective date. On September 20, 2005, the Company and the counterparty extended the term of the option to December 31, 2005. As of December 1, 2005, the option was excercised in full. The counterparty liquidated the entire investment in the Trust and returned $4,561,653 to the Company.
6. Trading Activities and Related Risks
The Company, through its investments in the Trust, engages in the speculative trading of U.S. and foreign futures contracts, options on U.S. and foreign futures contracts, and forward contracts (collectively, derivatives). These derivatives include both financial and non-financial contracts held as part of a
Fin. - 57
Table of Contents
diversified trading strategy. The Company is exposed to both market risk, the risk arising from changes in the market value of the contracts, and credit risk, the risk of failure by another party to perform according to the terms of a contract.
The purchase and sale of futures and options on futures contracts require margin deposits with Futures Commission Merchants (“FCMs”). Additional deposits may be necessary for any loss on contract value. The Commodity Exchange Act required an FCM to segregate all customer transactions and assets from the FCM’s proprietary activities. A customer’s cash and other property (for example, U.S. Treasury bills) deposited with an FCM are considered commingled with all other customer funds subject to the FCM’s segregation requirements. In the event of an FCM’s insolvency, recovery may be limited to a pro rata share of segregated funds available. It is possible that the recovered amount could be less than the total of cash and other property deposited.
For derivatives, risks arise from changes in the market value of the contracts. Theoretically, the Company is exposed to a market risk equal to the value of futures and forward contracts purchased and unlimited liability on such contracts sold short. As both a buyer and seller of options, the Company pays or receives a premium at the outset and then bears the risk of unfavorable changes in the price of the contract underlying the option. Written options expose the Company to potentially unlimited liability; for purchased options the risk of loss is limited to the premiums paid.
In addition to market risk, in entering into commodity interest contracts there is a credit risk that a counterparty will not be able to meet its obligations to the Company. The counterparty for futures and options on futures contracts traded in the United States on most non-U.S. futures exchanges is the clearinghouse associated with such exchange. In general, clearinghouses are backed by the corporate members of the clearinghouse who are required to share any financial burden resulting from the nonperformance by one of their members and, as such, should significantly reduce this credit risk. In cases where the clearinghouse is not backed by the clearing members, like some non-U.S. exchanges, it is normally backed by a consortium of banks or other financial institutions.
The Company is exposed to concentrations of credit risk. The Company maintains cash at several financial institutions. The total cash balance maintained at each financial institution is insured by the Federal Deposit Insurance Corporation (FDIC”) up to $100,000 per depositor, per bank. The Company had cash balances at each such institution at September 30, 2006, and at December 31, 2005, that exceeded the balance insured by the FDIC.
7. Subsequent Events
The Company invested in the Trust $100,000 in Units of the Campbell/Graham Series, Class 2 and $20,000 in Units of the Long/Short Commodity Series, Class 2 on October 31, 2006. On December 14, 2006, the Company exchanged $1,000,000 in Units of the Balanced Series, Class 2, $75,000 in Units of the Currency Series, Class 2 and $100,000 in Units of the Winton Series, Class 2 for Units of the Campbell/Graham Series, Class 2, and additionally invested $150,000 in Units of the Campbell/Graham Series, Class 2.
Fin. - 58
Table of Contents
TO PART I OF THE
PROSPECTUS
OF
THE FRONTIER FUND
(A statutory trust formed under the laws of Delaware)
BALANCED SERIES-1 UNITS
BALANCED SERIES-2 UNITS
BALANCED SERIES-1A UNITS
BALANCED SERIES-2A UNITS
Major Advisors:
Campbell & Company, Inc.
Conquest Capital, LLC
Cornerstone Quantitative Investment Group, Inc.
Meyer Capital Management, Inc.
Winton Capital Management Limited
Non-Major Advisors
Emerging Advisors (allocation of <5%)
Strategic Allocations
This Balanced Series Appendix (the “Balanced Series Appendix”) is dated February 12, 2007.
Table of Contents
THE FRONTIER FUND
BALANCED SERIES-1 UNITS
BALANCED SERIES-2 UNITS
BALANCED SERIES-1A UNITS
BALANCED SERIES-2A UNITS
This Balanced Series Appendix to the prospectus, dated February 12, 2007, including all exhibits thereto as the same may be amended and supplemented from time to time, or the Prospectus, of The Frontier Fund, a statutory trust formed under the laws of the state of Delaware, or the Trust, relates to the units of beneficial interest in the Trust, or the Units, designated as Balanced Series Units. Capitalized terms used in this Balanced Series Appendix and not otherwise expressly defined herein shall have the same respective meanings as set forth in the Prospectus. This Balanced Series Appendix must be accompanied by, and read in conjunction with, the Prospectus.
The Balanced Series Units are being offered in four (4) Classes. The Balanced Series Units in Class 1 (as described in the Prospectus) are designated as the “Balanced Series-1 Units,” the Balanced Series Units in Class 2 (as described in the Prospectus) are designated as the “Balanced Series-2 Units,” the Balanced Series Units in Class 1a (as described in the Prospectus) are designated as the “Balanced Series-1a Units,” and the Balanced Series Units in Class 2a (as described in the Prospectus) are designated as the “Balanced Series-2a Units.” The Trust is offering the Balanced Series-1 Units, the Balanced Series-2 Units, the Balanced Series-1a Units and the Balanced Series-2a Units pursuant to the Prospectus and this Balanced Series Appendix. Prospective purchasers of the Balanced Series-1 Units, the Balanced Series-2 Units, the Balanced Series-1a Units and the Balanced Series-2a Units should carefully review the Prospectus and this Balanced Series Appendix before determining to purchase such Units.
The Balanced Series-1a Units and the Balanced Series-2a Units may only be purchased by residents of certain States. Residents of States where the Balanced Series-1a Units and the Balanced Series-2a Units are not registered may purchase Balanced Series-1 Units and Balanced Series-2 Units.
The Managing Owner intends to contribute funds to the Trust in order to have a 1% interest in the aggregate capital, profits and losses of the Balanced Series-1a Units and the Balanced Series-2a Units and in return will receive Units designated as General Units in such Series.
TRADING ADVISORS
The current Trading Advisors with respect to the assets allocable to the Balanced Series Units are Campbell & Company, Inc., a Maryland Corporation, or Campbell, Chesapeake Capital Corporation, or Chesapeake, an Illinois corporation, Conquest Capital, LLC, or Conquest, a Delaware limited liability company, Cornerstone Quantitative Investment Group, Inc., or Cornerstone, a New York corporation, Dekker Capital Management, LLC, or Dekker, a Delaware limited liability company, Dighton Capital USA, or Dighton, an Illinois limited liability company, Dunn Capital Management, Inc., or Dunn, a Delaware corporation, Forecast Trading Group, LLC, or Forecast, a New Jersey limited liability company, Meyer Capital Management, Inc., or Meyer, an Illinois corporation, Winton Capital Management Limited, or Winton, a United Kingdom company, and one or more Trading Advisors designated as “Emerging Managers.” An “Emerging Manager” is a Trading Advisor that has a limited history in trading managed futures as well as a limited amount of assets under management. The assets allocable to the Balanced Series Units will be contributed to several Trading Companies, which these entities will act as Trading Advisors pursuant to their respective trading programs.
The Trust may allocate greater than ten percent (10%) of the assets allocable to the Balanced Series Units to Campbell, Conquest, Cornerstone, Meyer and Winton. Chesapeake, Dekker, Dighton, Dunn, Forecast and any Emerging Managers will each manage less than 10% of the assets allocable to the Balanced Series Units.
Balanced App. - 2
Table of Contents
Because each of Chesapeake, Dekker, Dighton, Dunn, Forecast and any Emerging Manager initially will be allocated less than ten percent (10%) of the assets allocable to the Balanced Series, each is not considered a “major commodity trading advisor.” See Part II of the Prospectus for certain information regarding a summary description of the performance history of Chesapeake, Dekker, Dighton, Dunn, Forecast and any Emerging Managers, including the following information: (i) monthly return parameters; (ii) historical volatility and degree of leverage; (iii) any material differences between the performance of each Trading Advisor as compared to that of the offered pool’s major trading advisors.
For information regarding Winton, including Winton’s investment program and past performance, please see the Winton Series Appendix which accompanies this Prospectus. For information regarding Campbell, including Campbell’s investment program and past performance, please see the Campbell/Graham Series Appendix which accompanies this Prospectus. For information regarding Conquest, including Conquest’s investment program and past performance, please see the Managed Futures Index Series Appendix which accompanies this Prospectus.
In addition to the allocations to the Trading Advisors of the assets allocable to the Balanced Series Units, one of the Trading Companies to which assets allocable to the Balanced Series Units are contributed may strategically allocate less than ten percent (10%) of such assets to each Trading Company to which assets of the Currency Series, Campbell/Graham Series, Long Only Commodity Series, Long/Short Commodity Series, Managed Futures Index Series, Graham Series and Campbell/Graham Series are contributed. The assets allocable to the Balanced Series Units which are invested in such Trading Companies will be invested pursuant to the trading strategy for such Series. For information regarding the investment program of the Currency Series, please see the Currency Series Appendix which accompanies the Prospectus. For information regarding the investment program of the Long Only Commodity Series, please see the Long Only Commodity Series Appendix which accompanies the Prospectus. For information regarding the investment program of the Long/Short Commodity Series, please see the Long/Short Commodity Series Appendix which accompanies the Prospectus. For information regarding the investment program of the Managed Futures Index Series, please see the Managed Futures Index Series Appendix which accompanies the Prospectus. For information regarding the investment program of the Campbell/Graham Series, please see the Campbell/Graham Series Appendix which accompanies the Prospectus. For information regarding the investment program of the Graham Series, please see the Graham Series Appendix which accompanies the Prospectus.
Since the commencement of trading for the Balanced Series, the Trust allocated greater than ten percent (10%) of the assets allocable to the Balanced Series Units to Beach Capital Management Limited, or Beach. On March 31, 2006, Beach ceased trading its Discretionary Program, which was the trading program used by the Balanced Series, because David Beach made a decision to engage in other pursuits. Therefore, Beach is no longer engaged in trading for the Balanced Series. Since the cessation of trading of Beach’s Discretionary Program, the assets of the Balanced Series that were previously allocated to Beach have been reallocated to the remaining Trading Advisors who trade on behalf of the Balanced Series pursuant to the Managing Owner’s asset allocation methodologies.
Balanced App. - 3
Table of Contents
BALANCED SERIES UNITS
MANAGEMENT AND INCENTIVE FEES
Management Fees
The Balanced Series-1 Units and the Balanced Series-2 Units will pay to the Managing Owner a monthly management fee equal to 1/12th of 0.50% of the Net Asset Value of the Balanced Series-1 Units and the Balanced Series-2 Units (approximately 0.50% annually). The Balanced Series-1a Units and the Balanced Series-2a Units will pay to the Managing Owner a monthly management fee equal to 1/12th of 1.00% of the Net Asset Value of the Balanced Series-1a Units and the Balanced Series-2a Units (approximately 1.00% annually). The Managing Owner will pay a portion of such management fees to the Trading Advisors.
Incentive Fees
The Balanced Series Units will pay to the Managing Owner a monthly or quarterly incentive fee of 25% of New High Net Trading Profits generated by each Trading Advisor, including realized and unrealized gains and losses thereon, as of the close of business on the last day of each calendar month or quarter. The fee will accrue monthly if paid quarterly. The Managing Owner will pay a portion of such incentive fees to the appropriate Trading Advisors. See “RISK FACTORS—Each Series pays substantial fees and expenses regardless of profitability.”
Initial Allocations
In general, the Managing Owner anticipates allocations to the Trading Advisors in the Balanced Series to vary between two percent (2%) and twenty percent (20%). In addition, the Managing Owner anticipates that between ten percent (10%) and twenty percent (20%) of the Balanced Series’ assets will be allocated to each Trading Advisor designated as a “major trading advisor.” The actual allocation of the Balanced Series’ assets will vary based upon the trading performance of the Trading Advisors and the Managing Owner’s asset allocation activities.
The table below sets forth certain of the markets and instruments the Trading Advisors allocated assets from the Balanced Series may trade on behalf of client accounts. Not all markets are part of each program. Each Trading Advisor reserves the right to expand or contract the markets and instruments it trades without giving prior notice.
Balanced App. - 4
Table of Contents
Diversification Summary
The Frontier Fund—THE BALANCED SERIES
In general, the Managing Owner has allocated certain amounts of the Balanced Series to the various Trading Advisors. As stated previously, the allocation to each Trading Advisor will vary between two percent (2%) and twenty percent (20%). In addition, the Managing Owner anticipates that between ten percent (10%) and twenty percent (20%) of the Balanced Series’ assets will be allocated to each Trading Advisor designated as a “major trading advisor.” The ongoing actual allocation of the Balanced Series’ assets will vary based upon the trading performance of the Trading Advisors and the Managing Owner’s asset allocation activities. The diversification summary below is estimated as of November 30, 2006.
Balanced Series Trading Advisors: | Program | Stock Indices | Interest Rates | Currency | Energy | Metals | Agriculturals | Total | |||||||||
Major Advisors: | |||||||||||||||||
Campbell & Company, Inc. | FME Large | 14% | 30% | 29% | 17% | 10% | 0% | 100 | % | ||||||||
Conquest Capital, LLC | MFS | 15% | 31% | 27% | 12% | 7% | 8% | 100 | % | ||||||||
Cornerstone Quantitative Investment Group, Inc. | International Value | 10% | 45% | 25% | 9% | 4% | 7% | 100 | % | ||||||||
Meyer Capital Management, Inc. | Diversified | 15% | 20% | 19% | 11% | 11% | 24% | 100 | % | ||||||||
Winton Capital Management Limited | Diversified | 32% | 30% | 24% | 6% | 4% | 4% | 100 | % | ||||||||
Non-Major Advisors | 12% | 15% | 15% | 16% | 11% | 31% | 100 | % | |||||||||
Emerging Advisors (allocation of <5%) | 51% | 16% | 7% | 6% | 5% | 15% | 100 | % | |||||||||
Strategic Allocations | 9% | 15% | 32% | 17% | 9% | 18% | 100 | % | |||||||||
Balanced Series | N/A | 16% | 25% | 26% | 12% | 8% | 13% | 100 | % |
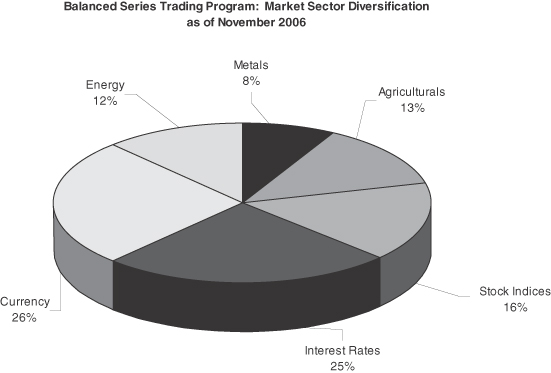
Balanced App. - 5
Table of Contents
BALANCED SERIES UNITS
PROJECTED TWELVE MONTH BREAK EVEN ANALYSIS
The table below shows the estimated amount of all fees and expenses which are anticipated to be incurred by a new investor in the Balanced Series-1 Units and Balanced Series-2 Units during the first twelve months. The total estimated cost and expense load of Balanced Series-1 Units and Balanced Series-2 Units is expressed as a percentage of $1,000, the amount of a minimum investment in the Trust (other than by Plans (including IRAs), employees or family members of an employee of the Managing Owner or its affiliates or charitable organizations). Residents of Texas have a minimum initial subscription requirement of $5,000, or, residents of Texas who are Plans (including IRAs), an employee or family member of an employee of the Managing Owner or its affiliates or a charitable organization, have a minimum initial subscription requirement of $1,000. Although the Managing Owner has used actual numbers and good faith estimates in preparing this table, the actual expenses associated with an investment in the Balanced Series Units may differ.
| Balanced Series-1 | Balanced Series-2 | |||||||
| Amount—$ | Amount—% | Amount—$ | Amount—% | |||||
Initial Selling Price(1) | $1,000 | 100% | $1,000 | 100% | ||||
Syndication and Selling Expenses(2) | $0 | 0% | $0 | 0% | ||||
Trust Operating Expenses(3) | $0 | 0% | $0 | 0% | ||||
Management Fee(4) | $5.00 | 0.50% | $5.00 | 0.50% | ||||
Service Fee(5) | $30.00 | 3.00% | $0 | 0% | ||||
Brokerage Commissions and Trading Fees(6) | $16.40 | 1.64% | $16.40 | 1.64% | ||||
Incentive Fee(7) | $0.30 | 0.03% | $0 | 0% | ||||
Less Interest Income(8) | $(29.00) | (2.90)% | $(29.00) | (2.90)% | ||||
Amount of Trading Income Required for the Trust’s Net Asset Value per Unit (Redemption Value) at the End of One Year to Equal the Selling Price per Unit | $22.70 | 2.27% | $(7.60) | (0.76)% | ||||
Notes
| (1) | The initial selling price per Unit is $100. The amount reflected in the table represents the amount of minimum investment in the Trust (other than Plans (including IRAs), employees or family members of an employee of the Managing Owner or its affiliates or charitable organizations) because the total costs and expenses as set forth in the break-even analysis are the costs and expenses associated with a minimum investment of $1,000. |
| (2) | Expenses incurred in connection with the organization of the Trust and the offering of Units during the Initial Offering Period were paid by the Managing Owner without reimbursement. |
| (3) | The Managing Owner pays for all accounting, auditing, legal and routine operational and administrative expenses without reimbursement. |
| (4) | The Managing Owner will receive a monthly management fee of approximately 0.042% (0.50% annually) of the Net Asset Value of the Balanced Series-1 Units and the Balanced Series-2 Units, which it will use to pay all management fees payable to the Trading Advisors. |
| (5) | With respect to Class 1 of the Balanced Series of Units, as compensation, the Selling Agents will receive an initial service fee at an annual rate of up to 3.0% of the subscription amount of each subscription for Units in Class 1 of the Balanced Series sold by them. The initial service fee will be prepaid by the Managing Owner. If you redeem all or a portion of your Units in Class 1 of the Balanced Series during the first twelve (12) months following the effective date of their purchase, you will be subject to a redemption fee of up to 3.0% of the Net Asset Value at which they are redeemed. The amount of the redemption fee associated with |
Balanced App. - 6
Table of Contents
each Series at any moment equals the amount of unamortized initial service fee prepaid by the Managing Owner for such Series, and as such the aggregate amount of the redemption fee and the initial service fee cannot exceed 3.0%. Therefore the break-even analysis does not include a separate entry for the redemption fee. |
| (6) | The Trust, with respect to the Balanced Series will pay the Clearing Brokers and the Managing Owner a fee of approximately 1.64% of the Balanced Series’ Net Asset Value annually, which will be used to pay all brokerage commissions, plus applicable exchange fees, NFA fees, give up fees and other transaction related fees and expenses charged in connection with the Balanced Series’ trading activities and on-going service fees for certain administrative services payable to certain Selling Agents selling Class 2 Units of the Balanced Series. |
| (7) | The reason there is an incentive fee amount on Class 1, but not on Class 2, is due to the 3% initial service fee (and on-going service fee charged after the expiration of twelve (12) months following the purchase of Class 1 Units) charged on Class 1 only. A portion of the 3% initial service fee and on-going service fee is not deductible on the incentive fee calculation, thereby requiring the Class 1 to make trading profits and to pay a corresponding incentive fee on such trading profits to break even. |
| (8) | Interest income for the Balanced Series-1 Units and the Balanced Series-2 Units is currently estimated at 4.90%. The first 2.0% of interest income earned per annum by the Trust on the Balanced Series-1 Units and the Balanced Series-2 Units will be paid to the Managing Owner. In addition, if interest income falls below 0.75%, the Managing Owner will be paid the difference between the Trust’s annualized interest income and 0.75%. Interest income above 2.0% is retained by the Trust. |
Balanced App. - 7
Table of Contents
BALANCED SERIES CLASS 1A AND CLASS 2A UNITS
PROJECTED TWELVE MONTH BREAK EVEN ANALYSIS
The table below shows the estimated amount of all fees and expenses which are anticipated to be incurred by a new investor in the Balanced Series-1a Units and Balanced Series-2a Units during the first twelve months. The total estimated cost and expense load of Balanced Series-1a Units and Balanced Series-2a Units is expressed as a percentage of $1,000, the amount of a minimum investment in the Trust (other than by Plans (including IRAs), employees or family members of an employee of the Managing Owner or its affiliates or charitable organizations). Residents of Texas have a minimum initial subscription requirement of $5,000, or, residents of Texas who are Plans (including IRAs), an employee or family member of an employee of the Managing Owner or its affiliates or a charitable organization, have a minimum initial subscription requirement of $1,000. Although the Managing Owner has used actual numbers and good faith estimates in preparing this table, the actual expenses associated with an investment in the Balanced Series Units may differ.
| Balanced Series-1a | Balanced Series-2a | |||||||
| Amount—$ | Amount—% | Amount—$ | Amount—% | |||||
Initial Selling Price(1) | $1,000 | 100% | $1,000 | 100% | ||||
Syndication and Selling Expenses(2) | $0 | 0% | $0 | 0% | ||||
Trust Operating Expenses(3) | $0 | 0% | $0 | 0% | ||||
Management Fee(4) | $10.00 | 1.00% | $10.00 | 1.00% | ||||
Service Fee(5) | $30.00 | 3.00% | $0 | 0% | ||||
Brokerage Commissions and Trading Fees(6) | $25.80 | 2.58% | $25.80 | 2.58% | ||||
Incentive Fee(7) | $0.30 | 0.03% | $0 | 0% | ||||
Less Interest Income(8) | $(39.20) | (3.92)% | $(39.20) | (3.92)% | ||||
Amount of Trading Income Required for the Trust’s Net Asset Value per Unit (Redemption Value) at the End of One Year to Equal the Selling Price per Unit | $26.90 | 2.69% | $(3.40) | (0.34)% | ||||
Notes
| (1) | The initial selling price per Unit is $100. The amount reflected in the table represents the amount of minimum investment in the Trust (other than Plans (including IRAs), employees or family members of an employee of the Managing Owner or its affiliates or charitable organizations) because the total costs and expenses as set forth in the break-even analysis are the costs and expenses associated with a minimum investment of $1,000. |
| (2) | Expenses incurred in connection with the organization of the Trust and the offering of Units during the Initial Offering Period were paid by the Managing Owner without reimbursement. |
| (3) | The Managing Owner pays for all accounting, auditing, legal and routine operational and administrative expenses without reimbursement. |
| (4) | The Managing Owner will receive a monthly management fee of approximately 0.083% (1.00% annually) of the Net Asset Value of the Balanced Series-1a Units and the Balanced Series-2a Units, which it will use to pay all management fees payable to the Trading Advisors. |
| (5) | With respect to Class 1 of the Balanced Series of Units, as compensation, the Selling Agents will receive an initial service fee at an annual rate of up to 3.0% of the subscription amount of each subscription for Units in Class 1 of the Balanced Series sold by them. The initial service fee will be prepaid by the Managing Owner. If you redeem all or a portion of your Units in Class 1 of the Balanced Series during the first twelve (12) months following the effective date of their purchase, you will be subject to a redemption fee of up to 3.0% of the Net Asset Value at which they are redeemed. The amount of the redemption fee associated with |
Balanced App. - 8
Table of Contents
each Series at any moment equals the amount of unamortized initial service fee prepaid by the Managing Owner for such Series, and as such the aggregate amount of the redemption fee and the initial service fee cannot exceed 3.0%. Therefore the break-even analysis does not include a separate entry for the redemption fee. |
| (6) | The Trust, with respect to the Balanced Series will pay the Clearing Brokers and the Managing Owner a fee of approximately 2.58% of the Balanced Series’ Net Asset Value annually, which will be used to pay all brokerage commissions, plus applicable exchange fees, NFA fees, give up fees and other transaction related fees and expenses charged in connection with the Balanced Series’ trading activities and on-going service fees for certain administrative services payable to certain Selling Agents selling Class 2 Units of the Balanced Series. |
| (7) | The reason there is an incentive fee amount on Class 1, but not on Class 2, is due to the 3% initial service fee (and on-going service fee charged after the expiration of twelve (12) months following the purchase of Class 1 Units) charged on Class 1 only. A portion of the 3% initial service fee and on-going service fee is not deductible on the incentive fee calculation, thereby requiring the Class 1 to make trading profits and to pay a corresponding incentive fee on such trading profits to break even. |
| (8) | Interest income for the Balanced Series-1a Units and the Balanced Series-2a Units is currently estimated at 4.90%. With respect to the Class 1a and Class 2a of the Balanced Series, twenty percent (20%) of interest income earned per annum by the Trust will be paid to the Managing Owner, and the remaining eighty percent (80%) of interest income earned per annum by the Trust will be retained by the Trust. |
Balanced App. - 9
Table of Contents
PAST PERFORMANCE OF BALANCED SERIES CLASS 1
The Capsule Performance Table which follows sets forth the actual past performance of the Balanced Series Class 1 during the period covered by the table.PAST PERFORMANCE IS NOT NECESSARILY INDICATIVE OF FUTURE RESULTS.
| Month | 2006 | 2005 | 2004 | |||
January | 3.47% | -4.29% | ||||
February | -2.95% | -1.10% | ||||
March | 3.62% | -2.11% | ||||
April | 1.26% | -5.45% | ||||
May | -2.26% | 2.83% | ||||
June | -1.77% | 4.09% | ||||
July | -1.48% | -1.60% | ||||
August | -0.85% | -0.17% | ||||
September | -1.75% | 0.60% | -0.20% | |||
October | 0.22% | -0.79% | 1.57% | |||
November | 2.07% | 8.12% | 5.62% | |||
December | -0.79% | -0.97% | ||||
Year | -0.70% | -1.37% | 6.03% |
Name of pool: | The Frontier Fund | |
| This pool is a multi-advisor advisor pool as defined in CFTC Regulation Section 4.10(d)(2). | ||
Name of Series: | Balanced Series Class 1 | |
Inception of Trading of Balanced Series Class 1: | September 24, 2004 | |
Aggregate Gross Capital Subscriptions for Balanced Series Class 1 as of November 30, 2006: | $227,797,945.56 | |
Net Asset Value of Balanced Series Class 1 as of November 30, 2006: | $215,109,876.18 | |
Worst Monthly Percentage Draw-down: | -5.45% (April 2005) | |
Worst peak-to-valley Draw-down: | -13.24% (November 2004 through April 2005) |
The Balanced Series Class 1 performance table sets forth the actual performance of the Balanced Series Class 1. Actual gross trading performance (gross realized and unrealized gain/loss before deduction for trading commissions and fees, management fees, any other expenses, and before addition of interest income) is adjusted for the trading expenses, management fees, initial service fees, on-going service fees, and interest income of the Balanced Series Class 1 of The Frontier Fund. These items, as an annualized percentage calculated monthly on the adjusted beginning of month net asset value are:
| • | Brokerage commissions and trading fees: 1.64% |
| • | Management fees: 0.5% |
| • | Initial service fees and on-going service fees: 3.0% |
An incentive fee of 25% of New High Net Trading Profits (as defined), earned quarterly, is calculated in the composite performance table. Also, any interest income in excess of an annualized rate of 2%, based upon applying the 90-day Treasury Bill rate for each month to the adjusted beginning of month net asset value, is credited in the composite past performance table.
| * | Draw-down means losses experienced by the pool over a specified period. |
| ** | Worst peak to valley draw-down means the greatest cumulative percentage decline in month-end net asset value due to losses sustained by the pool during any period in which the initial month-end net asset value is not equaled or exceeded by a subsequent month-end net asset value. |
Balanced App. - 10
Table of Contents
PAST PERFORMANCE OF BALANCED SERIES CLASS 2
The Capsule Performance Table which follows sets forth the actual past performance of the Balanced Series Class 2 during the period covered by the table.PAST PERFORMANCE IS NOT NECESSARILY INDICATIVE OF FUTURE RESULTS.
| Month | 2006 | 2005 | 2004 | |||
January | 3.73% | -4.04% | ||||
February | -2.73% | -0.87% | ||||
March | 3.89% | -1.85% | ||||
April | 1.51% | -5.22% | ||||
May | -2.00% | 3.20% | ||||
June | -1.53% | 4.35% | ||||
July | -1.23% | -1.35% | ||||
August | -0.59% | 0.09% | ||||
September | -1.53% | 0.85% | -0.17% | |||
October | 0.49% | -0.54% | 1.81% | |||
November | 2.32% | 8.39% | 5.91% | |||
December | -0.53% | -0.75% | ||||
Year | 2.06% | 1.76% | 6.85% |
Name of pool: | The Frontier Fund | |
This pool is a multi-advisor advisor pool as defined in CFTC Regulation Section 4.10(d)(2). | ||
Name of Series: | Balanced Series Class 2 | |
Inception of Trading of Balanced Series Class 2: | September 24, 2004 | |
Aggregate Gross Capital Subscriptions for Balanced Series Class 2 as of November 30, 2006: | $47,235,790.69 | |
Net Asset Value of Balanced Series Class 2 as of November 30, 2006: | $45,876,147.92 | |
Worst Monthly Percentage Draw-down: | -5.22% (April 2005) | |
Worst peak-to-valley Draw-down: | -12.17% (November 2004 through April 2005) |
The Balanced Series Class 2 performance table sets forth the actual performance of the Balanced Series Class 2. Actual gross trading performance (gross realized and unrealized gain/loss before deduction for trading commissions and fees, management fees, any other expenses, and before addition of interest income) is adjusted for the trading expenses, management fees, initial service fees, on-going service fees, and interest income of the Balanced Series Class 2 of The Frontier Fund. These items, as an annualized percentage calculated monthly on the adjusted beginning of month net asset value are:
| • | Brokerage commissions and trading fees: 1.64% |
| • | Management fees: 0.5% |
An incentive fee of 25% of New High Net Trading Profits (as defined), earned quarterly, is calculated in the composite performance table. Also, any interest income in excess of an annualized rate of 2%, based upon applying the 90-day Treasury Bill rate for each month to the adjusted beginning of month net asset value, is credited in the composite past performance table.
| * | Draw-down means losses experienced by the pool over a specified period. |
| ** | Worst peak to valley draw-down means the greatest cumulative percentage decline in month-end net asset value due to losses sustained by the pool during any period in which the initial month-end net asset value is not equaled or exceeded by a subsequent month-end net asset value. |
Balanced App. - 11
Table of Contents
PAST PERFORMANCE OF BALANCED SERIES CLASS 1A
The Capsule Performance Table which follows sets forth the actual past performance of the Balanced Series Class 1A during the period covered by the table.PAST PERFORMANCE IS NOT NECESSARILY INDICATIVE OF FUTURE RESULTS.
| Month | 2006 | |
January | ||
February | ||
March | ||
April | ||
May | -2.73% | |
June | -1.82% | |
July | -1.55% | |
August | -0.88% | |
September | -1.81% | |
October | 0.17% | |
November | 2.00% | |
December | ||
Year | -6.52% |
Name of pool: | The Frontier Fund | |
This pool is a multi-advisor advisor pool as defined in CFTC Regulation Section 4.10(d)(2). | ||
Name of Series: | Balanced Series Class 1A | |
Inception of Trading of Balanced Series Class 1A: | May 1, 2006 | |
Aggregate Gross Capital Subscriptions for Balanced Series Class 1A as of November 30, 2006: | $3,428,011.77 | |
Net Asset Value of Balanced Series Class 1A as of November 30, 2006: | $3,391,400.50 | |
Worst Monthly Percentage Draw-down: | -2.73% (May 2006) | |
Worst peak-to-valley Draw-down: | -8.51% (May 2006 through September 2006) |
The Balanced Series Class 1A performance table sets forth the actual performance of the Balanced Series Class 1A. Actual gross trading performance (gross realized and unrealized gain/loss before deduction for trading commissions and fees, management fees, any other expenses, and before addition of interest income) is adjusted for the trading expenses, management fees, initial service fees, on-going service fees, and interest income of the Balanced Series Class 1A of The Frontier Fund. These items, as an annualized percentage calculated monthly on the adjusted beginning of month net asset value are:
| • | Brokerage commissions and trading fees: 2.58% |
| • | Management fees: 1.0% |
| • | Initial service fees and on-going service fees: 3.0% |
An incentive fee of 25% of New High Net Trading Profits (as defined), earned quarterly, is calculated in the composite performance table. Also, any interest income in excess of an annualized rate of 2%, based upon applying the 90-day Treasury Bill rate for each month to the adjusted beginning of month net asset value, is credited in the composite past performance table.
| * | Draw-down means losses experienced by the pool over a specified period. |
| ** | Worst peak to valley draw-down means the greatest cumulative percentage decline in month-end net asset value due to losses sustained by the pool during any period in which the initial month-end net asset value is not equaled or exceeded by a subsequent month-end net asset value. |
Balanced App. - 12
Table of Contents
PAST PERFORMANCE OF BALANCED SERIES CLASS 2A
The Capsule Performance Table which follows sets forth the actual past performance of the Balanced Series Class 2A during the period covered by the table.PAST PERFORMANCE IS NOT NECESSARILY INDICATIVE OF FUTURE RESULTS.
| Month | 2006 | |
January | ||
February | ||
March | ||
April | ||
May | -2.50% | |
June | -1.58% | |
July | -1.30% | |
August | -0.63% | |
September | -1.58% | |
October | 0.43% | |
November | 2.26% | |
December | ||
Year | -4.88% |
Name of pool: | The Frontier Fund | |
| This pool is a multi-advisor advisor pool as defined in CFTC Regulation Section 4.10(d)(2). | ||
Name of Series: | Balanced Series Class 2A | |
Inception of Trading of Balanced Series Class 2A: | May 1, 2006 | |
Aggregate Gross Capital Subscriptions for Balanced Series Class 2A as of November 30, 2006: | $512,820.00 | |
Net Asset Value of Balanced Series Class 2A as of | $560,184.16 | |
Worst Monthly Percentage Draw-down: | -2.50% (May 2006) | |
Worst peak-to-valley Draw-down: | -7.38% (May 2006 through September 2006) |
The Balanced Series Class 2A performance table sets forth the actual performance of the Balanced Series Class 2A. Actual gross trading performance (gross realized and unrealized gain/loss before deduction for trading commissions and fees, management fees, any other expenses, and before addition of interest income) is adjusted for the trading expenses, management fees, initial service fees, on-going service fees, and interest income of the Balanced Series Class 2A of The Frontier Fund. These items, as an annualized percentage calculated monthly on the adjusted beginning of month net asset value are:
| • | Brokerage commissions and trading fees: 2.58% |
| • | Management fees: 1.0% |
An incentive fee of 25% of New High Net Trading Profits (as defined), earned quarterly, is calculated in the composite performance table. Also, any interest income in excess of an annualized rate of 2%, based upon applying the 90-day Treasury Bill rate for each month to the adjusted beginning of month net asset value, is credited in the composite past performance table.
| * | Draw-down means losses experienced by the pool over a specified period. |
| ** | Worst peak to valley draw-down means the greatest cumulative percentage decline in month-end net asset value due to losses sustained by the pool during any period in which the initial month-end net asset value is not equaled or exceeded by a subsequent month-end net asset value. |
Balanced App. - 13
Table of Contents
CORNERSTONE
Background of Cornerstone
Cornerstone engages in the management of commodity and currency trading accounts for Balanced Series Units. Cornerstone was incorporated in April 1995 in the State of New York and its main business office is located at One Station Place, 5th Floor North, Stamford, Connecticut 06902. Cornerstone has been registered under the CE Act as a CTA since February 6, 1996 and as a CPO since September 29, 1997. Cornerstone is also a member of the NFA and has been a member since February 6, 1996. Such registrations and membership do not imply that the CFTC or the NFA have endorsed Cornerstone’s qualifications to provide the advisory services described herein.
Principals of Cornerstone
John Eckstein
Mr. Eckstein is the President of Cornerstone. Mr. Eckstein has been registered as a principal and Associated Person of Cornerstone since February 1996. Prior to founding Cornerstone as a principal with Mr. Dunsby in 1995, Mr. Eckstein, born in 1967, worked for Luck Trading Company, Inc., or Luck Trading, with Mr. Henry Luk, as a programmer, researcher and trader from 1991 until 1995. Luck Trading was a registered CTA through June 1994, at which time it withdrew from membership and traded proprietary capital and pursued securities market research. At Luck Trading, Mr. Eckstein developed both the back-office systems used at Luck Trading and the system used to manage and monitor the various technical trading systems employed at Luck Trading. In addition, Mr. Eckstein was the primary co-researcher, with Mr. Luk, of numerous technical trading systems. In addition to Luck Trading, Mr. Eckstein worked variously in 1991 and 1992 as a consultant providing research and operational advice for J. F. Eckstein & Co., Inc., a securities trading firm, and in 1992 and 1993 for Crescent Investment Management, Inc., a registered investment adviser. Mr. Eckstein received a Bachelor of Science degree in Cognitive Science from Brown University in 1990. Mr. Eckstein has been continuously and solely employed by Cornerstone since 1995.
Adam Dunsby
Mr. Dunsby is the Vice President of Cornerstone. Mr. Dunsby has been registered as a principal and Associated Person of Cornerstone since February 1996. Mr. Dunsby, born in 1967, founded Cornerstone as a principal with Mr. Eckstein in 1995. Mr. Dunsby graduatedsumma cum laudefrom the Wharton School of the University of Pennsylvania in 1990 with a B.S. in Economics. He earned his Ph.D. in Finance from Wharton in 1995. Mr. Dunsby has been continuously and solely employed by Cornerstone since 1995.
Both Mr. Dunsby and Mr. Eckstein are responsible for making trading decisions on behalf of Cornerstone.
Cornerstone will conduct its trading for its allocation from the Balanced Series Units through a Trading Company pursuant to Cornerstone’s International Value Program.
CORNERSTONE INVESTMENT STRATEGY
The trading decisions of Cornerstone are based on a systematic analysis of the fixed income, currency and commodity markets. Commodity and currency traders basically rely on one of two types of analysis—“technical” or “fundamental” —for their trading decisions. Technical analysis is based on the theory that a study of the markets themselves will provide a means of anticipating the external factors that affect the supply and demand of a particular commodity in order to predict future prices. On the other hand, fundamental analysis relies on a study of those external factors. Cornerstone uses both a systematic analysis of fundamental factors and technical analysis to make trading decisions.
Balanced App. - 14
Table of Contents
CORNERSTONE’S INTERNATIONAL VALUE PROGRAM
Cornerstone’s International Value Program is a combination of different strategies. Methods employed include a model-based approach to spread trading, asset allocation models, and technical analysis. The positions on any given day depend on Cornerstone’s analysis of expected profit and volatility coupled with the historical relationship between the underlying assets.
In spread trading, Cornerstone uses a proprietary model to make judgments about the relative value of different sectors of yield curves or forward curves. Areas of a curve that are under-valued according to the model are bought and exposure is hedged against areas that are overvalued. Not all markets followed will have a position at all times and the weight given to any one position will vary depending on many factors including the expected profit of the trade, exposure in correlated markets and Cornerstone’s fundamental analysis, among other factors.
The second component of the International Value program is Cornerstone’s proprietary asset allocation models. These are econometric models which use a variety of market based and fundamental data to forecast excess returns of members of an asset class, for example government bond futures. A portfolio of long and short positions is then formed which maximizes return for a predetermined amount of risk. The total amount of long or short exposure will change over time depending on Cornerstone’s analysis of various factors including but not limited to the expected profit of each security, the expected volatility of each security, and Cornerstone’s fundamental analysis.
The third component is a collection of other mechanical trading strategies, including a value-based stock index model, fixed income trend following, a fundamental model to trade the Mexican Peso and a yield curve trading model.
Cornerstone’s International Value Program currently trades in the following markets: CBOT, CME, EUREX, IMM, LME, LIFFE, ME, NYMEX, SFE, SIMEX, TIFFE, TSE and may expand to include trading in other markets.
Instruments Traded
Cornerstone expects to trade only exchange traded futures, but may also trade foreign exchange forwards. In the past this program has had roughly 45% of its exposure in interest rate futures, 25% in currency futures, 20% in commodities, and 10% in a mix of currencies, interest rates, and equity indexes. Exact exposures can vary substantially over time. Exposure is expected to be limited to the following countries/currency areas: US, Canada, Mexico, Japan, Australia New Zealand, Euro Zone, UK, Norway, Sweden and Switzerland.
CORNERSTONE’S REAL COMMODITY ANALYSIS PROGRAM
Real Commodity Analysis combines fundamental and technical information to determine likely directional moves of various real commodities. Commodities traded include energies such as crude oil, natural gas, and heating oil; grains such as corn, soybeans and wheat; base metals such as aluminum and copper; and other commodities such as coffee, sugar, cattle and hogs. New commodities are constantly being evaluated and added to the strategy as is appropriate.
Real Commodity Analysis currently trades in the following markets: CBOT, CME, CSCE, IPE, LME, and NYMEX, and may expand to include trading in other markets.
Balanced App. - 15
Table of Contents
PAST PERFORMANCE OF CORNERSTONE
The Capsule Performance Table which follows sets forth the actual past performance of all client accounts directed by Cornerstone pursuant to the International Value Program during the period covered by the table.PAST PERFORMANCE IS NOT NECESSARILY INDICATIVE OF FUTURE RESULTS.
International Value Program (1)
(Managed Accounts)
| Month | 2006 | 2005 | 2004 | 2003 | 2002 | 2001 | ||||||
January | 0.78% | -1.41% | -1.70% | 3.56% | 0.14% | -1.47% | ||||||
February | 2.12% | -1.00% | 0.31% | 6.53% | 1.74% | 1.08% | ||||||
March | 3.80% | -5.38% | -1.33% | -9.01% | -1.11% | 0.73% | ||||||
April | 3.81% | 1.44% | -0.52% | -0.92% | 9.06% | -0.29% | ||||||
May | 1.12% | -1.51% | 1.44% | 12.78% | 4.38% | -2.11% | ||||||
June | -1.18% | -3.14% | 1.64% | -0.48% | 12.22% | -0.84% | ||||||
July | -3.01% | 2.10% | -1.15% | 0.48% | 11.92% | 10.36% | ||||||
August | -2.60% | -1.42% | 2.22% | 1.08% | 4.72% | 5.33% | ||||||
September | -1.96% | 2.84% | -0.25% | 3.23% | 6.58% | 6.73% | ||||||
October | -1.68% | 5.20% | 0.44% | -4.99% | -3.28% | 10.95% | ||||||
November | -3.57% | 0.60% | 1.91% | 0.20% | 0.18% | -6.32% | ||||||
December | -1.24% | 0.28% | 6.56% | 7.47% | -5.05% | |||||||
Year | -2.69% | -3.32% | 3.24% | 18.72% | 67.42% | 18.88% |
Name of Trading Advisor: | Cornerstone Quantitative Investment Group, Inc | |
Name of Program: | International Value Program (as traded through Managed Accounts) | |
Inception of Client Account Trading by Trading Advisor: | June 1995 | |
Inception of Client Account Trading in Program: | April 1997 | |
Number of Open Accounts: | 17 | |
Aggregate Assets (excluding “notional” equity) Overall: | $301,173,019 | |
Aggregate Assets (including “notional” equity) Overall: | $568,067,168 | |
Aggregate Assets (excluding “notional” equity) in Program: | $219,834,839 | |
Aggregate Assets (including “notional” equity) in Program: | $376,184,087 | |
Worst Monthly Draw-down: | -9.01(March 2003) | |
Worst Peak-to-valley Draw-down: | -15.15% (June 1999 - June 2001) | |
Number of Profitable Closed Accounts: | 20 | |
Number of Unprofitable Closed Accounts: | 21 | |
Leverage Employed: | approximately 10% (Margin/equity ratio) |
(1) The International Value returns are a composite performance of Managed Accounts trading the International Value strategy, reflecting actual returns, net actual management and incentive fees. Prior to April 2002, the returns are based on fully-funded Managed Accounts, plus time-weighted additions and time-weighted withdrawals; except, however, for periods where there were no fully funded accounts, the rates of return reported were based upon a computation which used the nominal values of all the accounts included in the composite table. From April 2002, the returns are based on all Managed Accounts, both nationally and fully-funded, plus time-weighted additions and time-weighted withdrawals.
Monthly Rate of Return is calculated by dividing the sum of the net performance for all accounts by the sum of the monthly beginning nominal net asset values of the accounts plus time- weighted additions and time-weighted withdrawals.
Draw-down means losses experienced by the account over a specified period.
Worst peak-to-valley draw-down means the greatest cumulative percentage decline in month-end net asset value due to losses sustained by the trading program during any period in which the initial month-end net asset value is not equaled or exceeded by a subsequent month-end net asset value.
Balanced App. - 16
Table of Contents
The Capsule Performance Table which follows sets forth the actual past performance of all client accounts directed by Cornerstone pursuant to the Real Commodity Analysis Program during the period covered by the table.PAST PERFORMANCE IS NOT NECESSARILY INDICATIVE OF FUTURE RESULTS.
Real Commodity Analysis Program
| Month | 2006 | 2005 | ||
January | 1.71% | |||
February | 4.45% | |||
March | -1.97% | |||
April | 4.45% | |||
May | 1.76% | |||
June | 0.26% | |||
July | 3.29% | |||
August | 0.43% | |||
September | 5.24% | |||
October | 2.85% | 2.63% | ||
November | -5.63% | 1.63% | ||
December | 0.23% | |||
Year | 17.70% | 4.55% |
Name of Trading Advisor: | Cornerstone Quantitative Investment Group, Inc | |
Name of Program: | Real Commodity Analysis(2), (3) | |
Inception of Client Account Trading by Trading Advisor: | June 1995 | |
Inception of Client Account Trading in Program: | October 2005 | |
Number of Open Accounts | 1 | |
Aggregate Assets (excluding “notional” equity) Overall: | $301,173,019 | |
Aggregate Assets (including “notional” equity) Overall: | $568,067,168 | |
Aggregate Assets in Program: | $7,537,046 | |
Worst Monthly Draw-down: | -5.63% (November 2006) | |
Worst Peak-to-valley Draw-down: | -5.63% (November 2006) | |
Number of Profitable Closed Accounts: | 1 | |
Number of Unprofitable Closed Accounts: | 0 | |
Leverage Employed: | Approximately 7% (Margin/Equity Ratio) |
(2) The Real Commodity Analysis returns are actual returns of Cornerstone Real Commodity Analysis LLC, a US-based fund, and reflect actual fees and interest.
(3) Real Commodity Analysis operates pursuant to the CFTC Regulation 4.7 exemption.
Annual Rates of Return represents the compounded monthly rates of return. The monthly rates represents the net performance divided by the beginning net assets adjusted by the time-weighted value of additions or withdrawals.
Draw-down means losses experienced by the account over a specified period.
Worst peak-to-valley draw-down means the greatest cumulative percentage decline in month-end net asset value due to losses sustained by the trading program during any period in which the initial month-end net asset value is not equaled or exceeded by a subsequent month-end net asset value.
Balanced App. - 17
Table of Contents
PROGRAMS NOT UTILIZED
The following are programs of Cornerstone that are not anticipated to be utilized by The Frontier Fund.
The following summary performance information presents the composite performance results of the International Value Program (Funds) for the period from September 2002 through November 2006.
PAST PERFORMANCE IS NOT NECESSARILY INDICATIVE OF FUTURE RESULTS.
Name of Trading Advisor: | CornerstoneQuantitative Investment Group, Inc | |
Name of Program: | International Value Program (Funds)(4) | |
Inception of Client Account Trading by Trading Advisor: | June 1995 | |
Inception of Client Account Trading in program: | September 2002 | |
Number of Open Accounts: | 2 | |
Aggregate Assets (excluding “notional” equity) Overall: | $301,173,019 | |
Aggregate Assets (including “notional” equity) Overall: | $568,067,168 | |
Aggregate Assets (excluding “notional” equity) in Program: | $63,929,417 | |
Aggregate Assets (including “notional” equity) in Program: | $63,929,417 | |
Worst Monthly Draw-down: | -8.93% (March 2003) | |
Worst Peak-to-valley Draw-down: | -12.53% (June - November 2006) | |
Number of Profitable Closed Accounts: | 0 | |
Number of Unprofitable Closed Accounts: | 0 | |
Leverage Employed: | Approximately 9% (Margin/Equity Ratio) | |
2006 Compound Rate of Return (11 months): | -0.54% | |
2005 Compound Rate of Return: | 0.15% | |
2004 Compound Rate of Return: | 3.97% | |
2003 Compound Rate of Return: | 18.35% | |
2002 Compound Rate of Return (4 months): | 10.33% | |
(4) The International Value Program (Funds) returns are a composite of the actual performance of Cornerstone’s two funds trading the International Value strategy, Cornerstone International Value (Offshore) Fund Ltd and Cornerstone International Value Fund LLC.
Annual Rates of Return represents the compounded monthly rates of return. The monthly rates represents the net performance divided by the beginning net assets adjusted by the time-weighted value of additions or withdrawals.
Draw-down means losses experienced by the account over a specified period.
Worst peak-to-valley draw-down means the greatest cumulative percentage decline in month-end net asset value due to losses sustained by the trading program during any period in which the initial month-end net asset value is not equaled or exceeded by a subsequent month-end net asset value.
Balanced App. - 18
Table of Contents
The following summary performance information presents the composite performance results of the Computerized Trading Program for the period from January 2001 through November 2006.
PAST PERFORMANCE IS NOT NECESSARILY INDICATIVE OF FUTURE RESULTS.
Name of Trading Advisor: | Cornerstone Quantitative Investment Group, Inc | |
Name of Program: | Computerized Trading Program | |
Inception of Client Account Trading by Trading Advisor: | June 1995 | |
Inception of Client Account Trading in program: | June 1995 | |
Number of Open Accounts: | 3 | |
Aggregate Assets (excluding “notional” equity) Overall: | $301,173,019 | |
Aggregate Assets (including “notional” equity) Overall: | $568,067,168 | |
Aggregate Assets (excluding “notional” equity) in Program: | $6,679,724 | |
Aggregate Assets (including “notional” equity) in Program: | $55,181,553 | |
Worst Monthly Draw-down: | -4.62% (October 2002) | |
Worst Peak-to-valley Draw-down: | -13.70% (Feb 1999 - April 2000) | |
Number of Profitable Closed Accounts: | 5 | |
Number of Unprofitable Closed Accounts: | 2 | |
Leverage Employed: | Approximately 9% (Margin/Equity Ratio) | |
2006 Compound Rate of Return (11 months): | 1.16% | |
2005 Compound Rate of Return: | 0.64% | |
2004 Compound Rate of Return: | 0.42% | |
2003 Compound Rate of Return: | 10.45% | |
2002 Compound Rate of Return: | 3.31% | |
2001 Compound Rate of Return: | 10.54% |
The returns for the Computerized Trading Program do not include interest.
Annual Rates of Return represents the compounded monthly rates of return. The monthly rates represents the net performance divided by the beginning net assets adjusted by the time-weighted value of additions or withdrawals.
Draw-down means losses experienced by the account over a specified period.
Worst peak-to-valley draw-down means the greatest cumulative percentage decline in month-end net asset value due to losses sustained by the trading program during any period in which the initial month-end net asset value is not equaled or exceeded by a subsequent month-end net asset value.
Balanced App. - 19
Table of Contents
The following summary performance information presents the composite performance results of the CTC Fund, L.P. for the period from January 2001 through November 2006.
PAST PERFORMANCE IS NOT NECESSARILY INDICATIVE OF FUTURE RESULTS.
Name of Trading Advisor: | Cornerstone Quantitative Investment Group, Inc | |
Name of Fund: | CTC Fund, L.P. | |
Inception of Client Account Trading by Trading Advisor: | June 1995 | |
Inception of Client Account Trading in Fund: | April 1998 | |
Number of Open Accounts: | 1 | |
Aggregate Assets (excluding “notional” equity) Overall: | $301,173,019 | |
Aggregate Assets (including “notional” equity) Overall: | $568,067,168 | |
Aggregate Assets (excluding “notional” equity) in Fund: | $2,281,796 | |
Aggregate Assets (including “notional” equity) in Fund: | $2,281,796 | |
Worst Monthly Draw-down: | -5.73% (October 2002) | |
Worst Peak-to-valley Draw-down: | -11.25% (June - November 2006) | |
Number of Profitable Closed Accounts: | 0 | |
Number of Unprofitable Closed Accounts: | 0 | |
Leverage Employed: | Approximately 11% (Margin/Equity Ratio) | |
2006 Compound Rate of Return (11 months): | 0.48% | |
2005 Compound Rate of Return: | -0.12% | |
2004 Compound Rate of Return: | 2.70% | |
2003 Compound Rate of Return: | 19.36% | |
2002 Compound Rate of Return: | 41.13% | |
2001 Compound Rate of Return: | 23.54% |
Annual Rates of Return represents the compounded monthly rates of return. The monthly rates represents the net performance divided by the beginning net assets adjusted by the time-weighted value of additions or withdrawals.
Draw-down means losses experienced by the account over a specified period.
Worst peak-to-valley draw-down means the greatest cumulative percentage decline in month-end net asset value due to losses sustained by the trading program during any period in which the initial month-end net asset value is not equaled or exceeded by a subsequent month-end net asset value.
Balanced App. - 20
Table of Contents
The following summary performance information presents the composite performance results of the International Value/Computerized Trading Blended Strategy Program for the period from January 2001 through the month such program closed.
PAST PERFORMANCE IS NOT NECESSARILY INDICATIVE OF FUTURE RESULTS.
— This Program is Closed —
Name of Trading Advisor: | Cornerstone Quantitative Investment Group, Inc | |
Name of Program: | International Value / Computerized Trading Blended Strategy | |
Inception of Client Account Trading by Trading Advisor: | June 1995 | |
Inception of Client Account Trading in Program: | September 2002 | |
Number of Open Accounts: | 0 | |
Aggregate Assets (excluding “notional” equity) Overall: | $301,173,019 | |
Aggregate Assets (including “notional” equity) Overall: | $568,067,168 | |
Aggregate Assets (excluding “notional” equity) in Program: | $0 | |
Aggregate Assets (including “notional” equity) in Program: | $0 | |
Worst Monthly Draw-down: | -5.67% (October 2002) | |
Worst Peak-to-valley Draw-down: | -8.01% (Oct 2002 - Nov 2002) | |
Number of Profitable Closed Accounts: | 1 | |
Number of Unprofitable Closed Accounts: | 0 | |
Leverage Employed: | Approximately 11% (Margin/Equity Ratio) | |
2006 Compound Rate of Return (10 months): | 2.56% | |
2005 Compound Rate of Return: | 1.14% | |
2004 Compound Rate of Return: | 2.66% | |
2003 Compound Rate of Return: | 21.36% | |
2002 Compound Rate of Return (4 months): | 2.35% | |
2001 Compound Rate of Return: | N/A |
Annual Rates of Return represents the compounded monthly rates of return. The monthly rates represents the net performance divided by the beginning net assets adjusted by the time-weighted value of additions or withdrawals.
Draw-down means losses experienced by the account over a specified period.
Worst peak-to-valley draw-down means the greatest cumulative percentage decline in month-end net asset value due to losses sustained by the trading program during any period in which the initial month-end net asset value is not equaled or exceeded by a subsequent month-end net asset value.
Balanced App. - 21
Table of Contents
The following summary performance information presents the composite performance results of the International Value (High Leverage) Program for the period from January 2001 through November 2006.
PAST PERFORMANCE IS NOT NECESSARILY INDICATIVE OF FUTURE RESULTS.
Name of Trading Advisor: | Cornerstone Quantitative Investment Group, Inc | |
Name of Program: | International Value (High Leverage) Program | |
Inception of Client Account Trading by Trading Advisor: | June 1995 | |
Inception of Client Account Trading in Program: | April 2002 | |
Number of Open Accounts | 2 | |
Aggregate Assets (excluding “notional” equity) Overall: | $301,173,019 | |
Aggregate Assets (including “notional” equity) Overall: | $568,067,168 | |
Aggregate Assets (excluding “notional” equity) in Program: | $910,196 | |
Aggregate Assets (including “notional” equity) in Program: | $30,068,187 | |
Worst Monthly Draw-down: | -10.08% (March 2005) | |
Worst Peak-to-valley Draw-down: | -25.70 (June - November 2006) | |
Number of Profitable Closed Accounts: | 1 | |
Number of Unprofitable Closed Accounts: | 0 | |
Leverage Employed: | Approximately 19% (Margin/Equity Ratio) | |
2006 Compound Rate of Return (11 months): | -7.16% | |
2005 Compound Rate of Return: | -5.52% | |
2004 Compound Rate of Return: | 9.56% | |
2003 Compound Rate of Return (6 months): | 29.43% | |
2002 Compound Rate of Return (9 months): | 175.15% | |
2001 Compound Rate of Return: | N/A |
The returns for the International Value (High Leverage) Program do not include interest.
Annual Rates of Return represents the compounded monthly rates of return. The monthly rates represents the net performance divided by the beginning net assets adjusted by the time-weighted value of additions or withdrawals.
Balanced App. - 22
Table of Contents
The following summary performance information presents the composite performance results of the Global Program for the period from January 2001 through the month such program closed.
PAST PERFORMANCE IS NOT NECESSARILY INDICATIVE OF FUTURE RESULTS.
— This Program is Closed —
Name of Trading Advisor: | Cornerstone Quantitative Investment Group, Inc | |
Name of Program: | Global Program | |
Inception of Client Account Trading by Trading Advisor: | June 1995 | |
Inception of Client Account Trading in Program: | June 1996 | |
Number of Open Accounts: | 0 | |
Aggregate Assets (excluding “notional” equity) Overall: | $301,173,019 | |
Aggregate Assets (including “notional” equity) Overall: | $568,067,168 | |
Aggregate Assets (excluding “notional” equity) in Program: | $0 | |
Aggregate Assets (including “notional” equity) in Program: | $0 | |
Worst Monthly Draw-down: | -6.48% (August 1999) | |
Worst Peak-to-valley Draw-down: | -20.34% (Feb 1999 - April 2000) | |
Number of Profitable Closed Accounts: | 5 | |
Number of Unprofitable Closed Accounts: | 0 | |
Leverage Employed: | Approximately 12% (Margin/Equity Ratio) | |
2006 Compound Rate of Return: | N/A | |
2005 Compound Rate of Return: | N/A | |
2004 Compound Rate of Return: | N/A | |
2003 Compound Rate of Return: | N/A | |
2002 Compound Rate of Return: | N/A | |
2001 Compound Rate of Return: | 0.34% |
The returns for the Global Program do not include interest.
Annual Rates of Return represents the compounded monthly rates of return. The monthly rates represents the net performance divided by the beginning net assets adjusted by the time-weighted value of additions or withdrawals.
Draw-down means losses experienced by the account over a specified period.
Worst peak-to-valley draw-down means the greatest cumulative percentage decline in month-end net asset value due to losses sustained by the trading program during any period in which the initial month-end net asset value is not equaled or exceeded by a subsequent month-end net asset value.
Balanced App. - 23
Table of Contents
MEYER
Background of Meyer
Meyer was incorporated in January 2001 in the State of Illinois and its main business office is located at 303 East Main Street, Suite 205, Barrington, Illinois 60010. Meyer has been registered under the CE Act as a CTA since February 9, 1999 and as a CPO since January 2001, and as an independent introducing broker since November 1998. Meyer is also a member of the NFA and has been a member since November 25, 1998. Such registrations and membership do not imply that the CFTC or the NFA have endorsed Meyer’s qualifications to provide the advisory services described herein.
Meyer was involved in NFA Case No. 04 ARB 80—Global Market Strategies International, Inc. v. Meyer Capital Management, Inc. In such case, claimant Global Market Strategies International, Inc., or GMS, asserted claims against Meyer for breach of fiduciary duty arising out of the alleged failure to reduce GMS’ trading level in a timely manner. Although Meyer had proceeded in a similar manner for prior trading level changes at the request and with the consent and knowledge of GMS, the panel of arbitrators nonetheless found that the period of time used to reduce the trading level with respect to the written request in question was not timely and awarded $488,015.99. The panel also found that GMS breached its agreement to pay management fees and awarded Meyer $35,824.00.
Principals of Meyer
James J. Meyer
Mr. Meyer, born in 1967, graduated from Loyola University with a Bachelor of Science Degree in Economics in December 1990. Throughout college, Mr. Meyer was employed on the trading floor of the Chicago Mercantile Exchange by Shearson Lehman Brothers and in a similar capacity with Linnco Futures. Upon graduation, Mr. Meyer left the trading floor to take a position as an associated person and research analyst with Martin James & Company, or MJ & Company, an Independent Introducing Broker. Mr. Meyer left MJ & Company in November, 1998 to form his own firm Meyer, which is currently registered as a commodity trading adviser, CPO and a introducing broker. As sole principal and president of Meyer, Mr. Meyer is responsible for all trading decisions as well as the day-to-day operations of the investment firm.
Meyer will conduct its trading for its allocation from the Balanced Series through a Trading Company pursuant to Meyer’s Diversified Program.
MEYER INVESTMENT STRATEGY
In managing the accounts of customers, Meyer employs the trading concepts and strategies developed by Mr. Meyer who is the sole manager for Meyer’s accounts. Since the trading methods to be utilized by Mr. Meyer are proprietary and confidential, the discussion that follows is of a general nature and not intended to be exhaustive. In addition, Meyer may refine or change the implementation of its strategy (including but not limited to technical factors, markets traded and or money management principals) without prior notice to or approval by customers. There can be no assurance that Meyer’s approach to trading will yield the same results as it has in the past.
Balanced App. - 24
Table of Contents
MEYER TRADING PROGRAM
Meyer uses multiple non-correlated technical strategies to manage customer accounts. Meyer believes that future price movements in all markets may be more accurately anticipated by historical price movements through the use of quantitative or technical analysis than by fundamental economic analysis. Since non-directional and limited price directional trading strategies are employed, major long-term price movements are not necessarily needed for the program to be successful. Rather, diverse models that have yielded good risk/reward characteristics in the past are combined with other uncorrelated models to form a robust trading program that is less dependent on any one particular market characteristic.
The trading strategies and systems utilized by Meyer may be revised from time to time by Meyer as a result of on-going research and development, which seeks to devise new trading strategies and systems as well as test methods currently employed. The trading strategies and systems used by Meyer in the future may differ significantly from those presently used, due to the changes, which may result from this research.
Exchanges on which transactions will take place will include, but are not limited to, all exchanges in the United States, as well as non-U.S. exchanges which include, but are not limited to, the London International Financial Futures and Options Exchange Ltd. (LIFFE), the Marche a Terme International de France (France), the Eurex Deutschland (EUREX), the Montreal Exchange (ME), the Tokyo Stock Exchange (TSE), the Singapore International Monetary Exchange (SIMEX), The London Metal Exchange (LME), and the Sydney Futures Exchange Ltd (SFE). Decisions concerning the liquidation of positions, the futures interests contracts to be traded and the size of positions to be taken or maintained require the exercise of judgment by Meyer. A decision not to trade certain futures interest contracts due to lack of liquidity or excessive volatility or for any other reason may result at times in clients missing significant profit opportunities which might otherwise have been captured by Meyer.
Risk Management
In view of the volatile nature of futures trading, Meyer adheres to a number of money management principals in an attempt to increase the likelihood of long-term success of the trading program.
Diversification
By committing equity to multiple markets and to different strategies, diversification reduces the dependence of the program on any one particular market or trading system for trading profits. Due to the importance of diversification across different market groups and trading strategies, Meyer suggests a minimum account size of $3,000,000.
Initial Capital Risk Exposure
Meyer attempts to limit maximum risk per trade to 0.75% of equity. However, there may be circumstances where it is impossible to limit risk as described above. Such a circumstance may be a market that is locked limit up or down, or the occurrence of severe slippage on order execution due to extreme market volatility.
Capital Management
In an attempt to limit client’s exposure to adverse price movements, the average initial margin to equity ratio, at the recommended trading level, is approximately 17%. It is possible that various factors may cause the actual percentage of assets committed to margin at any time to be higher or lower than the expected level.
Instruments Traded
| • | Interest Rate Interests—U.S. Treasury bond, U.S. 10-year note, U.S. 5-year note, Canadian 10-year bond, Euro Bund, U.K. Long Gilt, Japanese Bond, Australian 10-year bond. Eurodollar, Euribor, Short Sterling, Australian Bank Acceptance |
Balanced App. - 25
Table of Contents
| • | Currency Interests—British Pound, Japanese Yen, Euro FX, Swiss Franc, Canadian Dollar, Mexican Peso, Australian dollar. |
| • | Metals—gold, silver, aluminum, copper, aluminum, nickel, zinc. |
| • | Grains—Chicago wheat, Kansas City wheat, corn, soybeans, soybean oil, soybean meal |
| • | Energy Interests—crude oil, unleaded gasoline, natural gas heating oil. |
| • | Other Commodity Interests—cocoa, coffee, sugar, orange juice, live cattle, lean hogs, and cotton. |
Note: The above discussion is of a general nature and is not intended to be exhaustive. Meyer Capital Management may add more markets to its portfolio in the future.
Balanced App. - 26
Table of Contents
PAST PERFORMANCE OF MEYER
The Capsule Performance Tables which follow set forth the actual past performance of all client accounts directed by Meyer during the period covered by such tables.PAST PERFORMANCE IS NOT NECESSARILY INDICATIVE OF FUTURE RESULTS.
Diversified Program
| Month | 2006 | 2005 | 2004 | 2003 | 2002 | 2001 | ||||||
January | 6.18% | -3.44% | 0.89% | 8.94% | -1.21% | 5.02% | ||||||
February | -5.76% | -1.12% | 5.46% | 4.55% | 0.48% | 6.18% | ||||||
March | -1.75% | -6.43% | 3.91% | -9.23% | -5.26% | 4.11% | ||||||
April | -2.21% | -7.26% | -9.28% | 4.56% | -0.77% | -4.95% | ||||||
May | 0.10 | -1.62% | -4.30% | 6.48% | 4.63% | 1.19% | ||||||
June | -3.18% | 3.13% | -3.11% | -4.14% | 4.73% | 3.14% | ||||||
July | -1.69% | -2.53% | -3.86% | 0.07% | 2.92% | 4.10% | ||||||
August | -2.89% | -0.53% | -4.02% | 2.44% | 2.89% | 7.57% | ||||||
September | -0.47% | -1.19% | 10.01% | 3.33% | 4.46% | 2.56% | ||||||
October | -0.96% | -4.42% | -3.05% | 7.55% | -4.14% | 1.62% | ||||||
November | -3.70% | 20.30% | 15.07% | -1.62% | -4.67% | -10.79% | ||||||
December | 8.27% | 1.31% | 2.92% | 11.25% | 3.87% | |||||||
Year | -15.56% | 0.25% | 6.90% | 27.26% | 15.00% | 24.54% |
Name of CTA: | Meyer Capital Management, Inc. | |
Name of Program: | Diversified Program | |
Date CTA Began Trading Client Accounts: | August 1994 | |
Date CTA Began Trading This Program: | January 1999 | |
No. Accounts in Program: | 50 | |
Total Assets Managed by CTA (Actual Funds): | $72,709,634 | |
Total Assets Managed by CTA (Nominal Funds): | $122,205,544 | |
Assets Managed in This Program (Actual Funds): | $72,709,634 | |
Assets Managed in This Program (Nominal Funds): | $122,205,544 | |
Largest Monthly Percentage Drawdown: | 10.79% (Nov 01) | |
Largest Peak to Valley Drawdown: | 25.58% (Mar 04 - Oct 05) | |
Profitable Closed Accounts & Range of Return: | 52 (0.05% to 118.80%) | |
Unprofitable Closed Accounts & Range of Return: | 67 (-0.01% to -37.96%) | |
Leverage Employed: | 17% (average margin to equity ratio) |
The Capsule Performance Table was prepared on the basis of the fully funded subset method from 1/01 to 4/04. The table was prepared on the basis of the nominal account size method from 5/04 to present.
Draw-down means losses experienced by the account over a specified period.
Worst peak-to-valley draw-down means the greatest cumulative percentage decline in month-end net asset value due to losses sustained by the trading program during any period in which the initial month-end net asset value is not equaled or exceeded by a subsequent month-end net asset value.
Balanced App. - 27
Table of Contents
TO PART I OF THE
PROSPECTUS
OF
THE FRONTIER FUND
(A statutory trust formed under the laws of Delaware)
GRAHAM SERIES-1 UNITS
GRAHAM SERIES-2 UNITS
Commodity Trading Advisor:
Graham Capital Management, L.P.
This Graham Series Appendix (the “Graham Series Appendix”) is dated February 12, 2007.
Table of Contents
THE FRONTIER FUND
GRAHAM SERIES-1 UNITS
GRAHAM SERIES-2 UNITS
This Graham Series Appendix to the prospectus, dated February 12, 2007, including all exhibits thereto as the same may be amended and supplemented from time to time, or the Prospectus, of The Frontier Fund, a statutory trust formed under the laws of the state of Delaware, or the Trust, relates to the units of beneficial interest in the Trust, or the Units, designated as Graham Series Units. Capitalized terms used in this Graham Series Appendix and not otherwise expressly defined herein shall have the same respective meanings as set forth in the Prospectus. This Graham Series Appendix must be accompanied by, and read in conjunction with, the Prospectus.
The Graham Series Units are being offered in two (2) Classes. The Graham Series Units in Class 1 (as described in the Prospectus) are designated as the “Graham Series-1 Units,” and the Graham Series Units in Class 2 (as described in the Prospectus) are designated as the “Graham Series-2 Units.” The Trust is offering both the Graham Series-1 Units and the Graham Series-Units pursuant to the Prospectus and this Graham Series Appendix. Prospective Purchasers of the Graham Series-1 Units and Graham Series-2 Units should carefully review the Prospectus and this Graham Series Appendix before determining to purchase such Units.
TRADING ADVISOR
Graham Capital Management, L.P., a Delaware limited partnership, or Graham, acts as the Trading Advisor with respect to the assets allocable to the Graham Series Units. The assets allocable to the Graham Series Units will be contributed to a Trading Company for which Graham will act as the Trading Advisor pursuant to the K-4 Program at 150% Leverage, or K-4 (1.5X) Program, described below. It is contemplated that the Trading Advisor may trade other of its trend-following systems for the Graham Series in the future in addition to its K-4 (1.5X) Program.
Background
Graham was organized as a Delaware limited partnership in May 1994. The general partner of Graham is KGT, Inc., a Delaware corporation of which Kenneth G. Tropin is the President and sole shareholder. The limited partner of Graham is KGT Investment Partners, L.P., a Delaware limited partnership of which KGT, Inc. is also a general partner and in which Mr. Tropin is the principal investor. Graham became registered as a CPO and CTA under the CE Act and a member of the NFA on July 27, 1994.
As of May 1, 2006 Graham has approximately 140 employees and manages assets of over $5 billion. Graham maintains its main business office at Rock Ledge Financial Center, 40 Highland Avenue, Rowayton, CT 06853. Graham’s telephone number is 203-899-3400.
Graham is an investment manager that actively trades worldwide on a 24-hour basis in the equity, fixed income, currency and commodity markets utilizing securities, futures, forwards and other financial instruments. Graham offers clients a broad array of systematic and discretionary global macro trading programs that trade in one or more of those markets as well as strategies that combine two or more of the trading programs. Graham’s systematic trading programs or models produce trading signals on a largely automated basis when applied to market data. In Graham’s discretionary trading programs, trades are determined subjectively on the basis of its traders’ assessment of market conditions rather than through application of an automated system.
Principals
Kenneth G. Tropin is the Chairman, the founder and a Principal of Graham. Mr. Tropin has developed the majority of the firm’s core trading programs and he is responsible for the overall management of the
Graham App. - 2
Table of Contents
organization, including the investment of its proprietary trading capital. Prior to founding Graham in 1994, Mr. Tropin served as President, Chief Executive Officer, and a Director of John W. Henry & Company, Inc., during which the assets under management grew from approximately $200 million to approximately $1.2 billion. Previously, Mr. Tropin was Senior Vice President at Dean Witter Reynolds, where he served as Director of Managed Futures and as President of Demeter Management Corporation and Dean Witter Futures and Currency Management Inc. Mr. Tropin has also served as Chairman of the Managed Funds Association and its predecessor organization, which he was instrumental in founding during the 1980’s.
Paul Sedlack is Chief Executive Officer, the General Counsel and a Principal of Graham. He oversees the operation of the finance and administration departments and is also responsible for all legal and compliance matters. Mr. Sedlack began his career at the law firm of Coudert Brothers in New York in 1986 and was resident in Coudert’s Singapore office from 1988 to 1989. Prior to joining Graham in June 1998, Mr. Sedlack was a Partner at the law firm of McDermott, Will & Emery in New York, focusing on securities and commodities laws pertaining to the investment management and related industries. Mr. Sedlack received a J.D. from Cornell Law School in 1986 and an M.B.A. in Finance in 1983 and B.S. in Engineering in 1982 from State University of New York at Buffalo.
Michael S. Rulle Jr.is the President and a Principal of Graham. As President of Graham, Mr. Rulle oversees the firm’s portfolio managers as well as the risk management department. Prior to joining Graham in February 2002, Mr. Rulle was President of Hamilton Partners Limited, a private investment company that deployed its capital in a variety of internally managed equity and fixed income alternative investment strategies on behalf of its sole investor, Stockton Reinsurance Limited, a Bermuda based insurance company. From 1994 to 1999, Mr. Rulle was Chairman and CEO of CIBC World Markets Corp., the U.S. broker-dealer formerly known as CIBC Oppenheimer Corp. Mr. Rulle served as a member of its Management Committee, Executive Board and Credit Committee and was Co-Chair of its Risk Committee. Business responsibilities included Global Financial Products, Asset Management, Structured Credit and Loan Portfolio Management. Prior to joining CIBC World Markets Corp., Mr. Rulle was a Managing Director of Lehman Brothers and a member of its Executive Committee and held positions of increasing responsibility since 1979. At Lehman, Mr. Rulle founded and headed the firm’s Derivative Division, which grew to a $600 million enterprise by 1994. Mr. Rulle received his M.B.A. from Columbia University in 1979, where he graduated first in his class, and he received his bachelor’s degree from Hobart College in 1972 with a concentration in political science.
Robert E. Murray is the Chief Operating Officer and a Principal of Graham and is responsible for the management and oversight of client services, systematic trading and technology efforts. Prior to joining Graham, from 1984 until June 2003, Mr. Murray held positions of increasing responsibility at various Morgan Stanley entities (and predecessors), including Managing Director of the Strategic Products Group, Chairman of Demeter Management Corporation (a CPO that grew to $2.3 billion in assets under management during Mr. Murray’s tenure) and Chairman of Morgan Stanley Futures & Currency Management Inc. (a CTA). Mr. Murray is currently a member of the Board of Directors of the NFA and serves on its Membership and Finance Committees. Mr. Murray has served as Vice Chairman and a Director of the Board of the Managed Funds Association. Mr. Murray received a Bachelor’s Degree in Finance from Geneseo State University in 1983.
Thomas P. Schneider is an Executive Vice President, the Chief Trader and a Principal of Graham. He is responsible for managing Graham’s systematic futures trading operations, including order execution, formulating policies and procedures, and developing and maintaining relationships with independent executing brokers and futures commission merchants (“FCMs”). Mr. Schneider has also been an NFA arbitrator since 1989 and has served on the MFA’s Trading and Markets Committee. From June 1985 through September 1993, Mr. Schneider held positions of increasing responsibility at ELM Financial, Inc., a CTA in Dallas, Texas, where he was ultimately Chief Trader, Vice President and Principal responsible for 24-hour trading execution, compliance and accounting. In January 1994, Mr. Schneider began working as Chief Trader for Chang Crowell Management Corporation, a CTA in Norwalk, Connecticut, where he was responsible for streamlining operations for more efficient order execution, and for maintaining and developing relationships with over 15 FCMs on a global basis.
Graham App. - 3
Table of Contents
Mr. Schneider graduated from the University of Notre Dame in 1983 with a B.B.A. in Finance and received his Executive M.B.A. from the University of Texas at Austin in 1994.
Robert G. Griffith is an Executive Vice President and a Principal of Graham, responsible for evaluating and implementing research-related initiatives. Prior to joining the Manager, Mr. Griffith’s company, Veridical Methods, Inc., provided computer programming and consulting services to such firms as GE Capital, Lehman Brothers and Morgan Guaranty Trust. He received his B.B.A. in Management Information Systems from the University of Iowa in 1979.
Savvas Savvinidis, C.P.A., joined Graham in April 2003 as Chief Financial Officer and a Principal. He was Chief Operating Officer of Agnos Group, L.L.C. from January 2001-February 2003 and had previously served as Director of Operations of Moore Capital Management, Inc., from October 1994 to June 2000, and of Argonaut Capital Management, Inc., from July 1993 to September 1994. From May 1988 to June 1993, he worked at Lehman Brothers and from July 1986 to April 1988, at the North American Investment Bank of Citibank. Upon graduating from St. John’s University with a B.S. in Accounting, Mr. Savvinidis started his career with Grant Thornton in 1984, where he received his CPA designation in 1986. He is a member of the New York Society of C.P.A.’s.
Fred J. Levin is the Chief Economist, a Senior Discretionary Trader and a Principal of Graham specializing in fixed income markets with particular emphasis on short-term interest rates. Prior to joining Graham in March 1999, Mr. Levin was employed as director of research at Aubrey G. Lanston & Co. Inc. From 1991 to 1998, Mr. Levin was the chief economist and a trader at Eastbridge Capital. From 1988 to 1991, Mr. Levin was the chief economist and a trader at Transworld Oil. From 1982 to 1988, Mr. Levin was the chief economist, North American Investment Bank at Citibank. From 1970 to 1982, Mr. Levin headed the domestic research department and helped manage the open market desk at the Federal Reserve Bank of New York. Mr. Levin received an M.A. in economics from the University of Chicago in 1968 and a B.S. from the University of Pennsylvania, Wharton School in 1964.
Alex Mucelli is an Executive Vice President and a Principal of Graham, specializing in institutional client relationships as well as the development of structured products and portable alpha initiatives. Prior to joining Graham in March 2006, Mr. Mucelli held the positions of Chief Operating Officer and Head of Client Services at Arden Asset Management, LLC, a New York based fund of hedge funds which, at the time of his departure, was a leading absolute return low volatility focused fund provider with a diverse institutionally focused product mix and approximately $10 billion under management. Prior to joining Arden in February 2003, Mr. Mucelli held various positions with Goldman Sachs & Co. from March 1994 to December 2002, including leadership roles within the firm’s sales and trading businesses, Goldman Sachs Wealth Management, and the Investment Banking Division. Mr. Mucelli received a B.A. in History from Hamilton College in 1986.
William Pertusi is the Risk Manager and a Principal of Graham, responsible for identifying, monitoring and acting upon financial risks relative to financial returns in Graham’s diverse trading strategies. Prior to joining Graham in April 2006, Mr. Pertusi held the positions of Director and Risk Manager at SAC Capital Advisors LLC from July 2004 to April 2006. From July 2002 to July 2004 he was employed as a Portfolio Manager at SAC specializing in Mortgage Backed Securities. From March 1999 to July 2002, Mr. Pertusi held various positions with Lehman Brothers Inc. including Senior Vice President and Global Head of Content for e-Commerce. From January 1992 through February 1998 he worked at Lehman as Senior Vice President holding positions in sales, trading, and risk management. Mr. Pertusi worked at Credit Suisse First Boston as a Director from February 1998 through November 1998. He held the position of Vice President in fixed income sales at Salomon Brothers Inc. from June 1990 to January 1992; and Assistant Vice President in fixed income sales at The First Boston Corporation from June 1987 through June 1990. Mr. Pertusi received a B.S. in Electrical Engineering from Lehigh University in 1983, an M.B.A. from Harvard in 1987, and an M.S. in Mathematics from Fairfield University in 2006.
Graham App. - 4
Table of Contents
Steven T. Aibel is a discretionary trader and a Principal of Graham, specializing in global macro markets with a primary focus on foreign exchange. Prior to joining Graham in July 2003, Mr. Aibel worked as a proprietary trader at J.P. Morgan Chase from April 2002 to March 2003 trading foreign exchange. He began his career at Goldman Sachs and Co. in the precious metals area in 1988 until 1993, moving over to the foreign exchange area of Goldman Sachs and Co. until November 1994. Following work in the foreign exchange area of Lehman Brothers from then until June 1995, Mr. Aibel worked at Credit Suisse First Boston as a Deutsche Mark market maker from July 1995 until July 1997 and a proprietary foreign exchange trader from July 1997 until April 2000. Mr. Aibel was a partner at Monroe Capital from May 2000 to January 2001. He worked as a trading sector desk manager at Bank of America from March 2001 through April 2002. Mr. Aibel received an M.B.A. in 1988 with a double major in Finance and International Business and a B.A. in 1987 in Finance, all from George Washington University.
David Ciocca is a discretionary trader and a Principal of Graham, specializing in equity futures. Prior to joining Graham in March 2002, Mr. Ciocca was employed as a portfolio manager at Niederhoffer Investments from April 2001 to February 2002, where he concentrated on the short-term modeling and trading of futures and options. From December 1998 to April 2001, Mr. Ciocca was a principal of DLC Capital Management, Inc., a registered investment advisor that focused on investment portfolio management and trading strategy development. Mr. Ciocca has a Bachelor of Science in Engineering (1993) and a Master of Science in Finance (1998) from Rochester Institute of Technology, Rochester, NY.
Sean D. Duffy is a discretionary trader and a Principal of Graham, specializing in global macro markets with a focus on foreign currency, commodities and securities. Prior to joining Graham in January 2005, Mr. Duffy was a Principal of Briggs Capital Management, LLC, from March 2003 to December 2004. Before founding Briggs, Mr. Duffy traded his own strategy from February 2002 through February 2003. He was employed as a Director in the Global Markets division of Deutsche Bank in New York from April 1997 to January 2002. From January 1995 until April 1997, Mr. Duffy served as a consultant to the CTA community developing proprietary futures trading programs. While working as a consultant, Mr. Duffy was associated with GLT Direct LLP from February 1996 through April 1997. From June 1992 to December 1994, Mr. Duffy was a spot risk arbitrageur in the precious metals markets at the J. Aron division of Goldman Sachs & Co. From June 1990 to June 1992, Mr. Duffy was employed as a financial analyst in the investment banking division at Paine Webber in New York. Mr. Duffy received a B.A. from Harvard University in 1990.
Leslie A. Falconio is a discretionary trader and a Principal of Graham specializing in the U.S. fixed income markets with particular emphasis on relative value in the liquid rates markets, hedging strategies and derivatives. Prior to joining Graham in September of 2005, Ms. Falconio was a founding member of Silex Capital Partners, LP, from 2004 to 2005. For 2003, Ms. Falconio was a Senior Portfolio Manager at Soros Fund Management. From 1995 to 2002, Ms. Falconio was a Senior Portfolio Manager at OppenheimerFunds. From 1992 to 1995, Ms. Falconio was a Portfolio Manager at MetLife. From 1988 to 1990, Ms. Falconio was an auditor for Chase Bank. Ms. Falconio received an M.B.A. in Finance from the William E. Simon Graduate School of Business at the University of Rochester in 1992, and a B.S. in Finance and M.I.S. from the State University of New York at Buffalo in 1988.
Eric C. Fill is a discretionary trader and a Principal of Graham, specializing in foreign currency. Prior to joining Graham in March 2005, Mr. Fill was employed at Commerzbank Securities as a Senior Proprietary Trader from April 2004 through November 2004. From October 1988 to April 2004, Mr. Fill was employed at Commerzbank New York. While at Commerzbank, he worked as a Global Macro Proprietary Trader (1996 to 2004) and a foreign exchange sales trader (1994 to 1996). Between 1991 and 1994, Mr. Fill ran the money market funding desk for Commerzbank Atlanta. From 1989 to 1991 he was a money market trader at Commerzbank New York. Mr. Fill graduated from the University of Rochester with a B.A. in Economics in 1988.
Robert C. Hillis a discretionary trader and a Principal of Graham, specializing in the energy commodity markets. Prior to joining Graham in April 2003, Mr. Hill worked as a consultant at Gerson Lehrman Group. From
Graham App. - 5
Table of Contents
November 1999 to October 2002, he was employed as Director of Trading at Duke Energy. From March 1997 to October 1999, Mr. Hill was an energy trader at Louis Dreyfus Energy Corp. and from May 1994 to March 1997, he worked for Enterprise Products Company as a distribution coordinator for energy products. Mr. Hill received an M.B.A. in 1997 from the University of St. Thomas in Houston, TX and a B.A. in 1992 from Stephen F. Austin State University.
Britton Holland is a discretionary trader and a Principal of Graham, specializing in the energy commodity markets. Prior to joining Graham in March 2004, Mr. Holland worked as Manager, Financial Trading at Duke Energy Corporation. From August 1998 to April 2002, he was employed in various groups at Duke Energy, ranging from Risk Management to Term Deal Origination, before moving to Financial Trading. Mr. Holland received a B.A. in Economics in 1997 from the University of Texas in Austin, Texas.
Peter Jepsen is a discretionary trader and a Principal of Graham, specializing in global macro markets with a focus on fixed income and currencies. Prior to joining Graham in March 2006, Mr. Jepsen was employed as a portfolio manager at Exis Capital Management in New York from March 2002 to March 2006. From February 2001 to February 2002, he worked as a portfolio manager at Argonaut Capital Management in New York. Mr. Jepsen began his career at Bankers Trust/Deutsche Bank Asset Management in June 1993 where he worked on the international fixed income desk and thereafter the domestic fixed income desk until January 2001. He qualified as a Chartered Financial Analyst in 1996. Mr. Jepsen graduated from Bucknell University in June 1993 where he received his B.A. in Economics.
Raymond T. Murphyis a Discretionary Trader and a Principal of Graham specializing in statistical option volatility strategies relating to equity index and individual commodity markets. Prior to joining Graham in September 2006, Mr. Murphy was president, from July 1992 through August 2006, of RTM Management, Inc., a consulting firm he founded concentrating on the development and implementation of trading strategies and index development. Mr. Murphy was the primary architect of the Standard & Poor’s Commodity Indices and served as a consultant to Standard & Poor’s periodically between 2001 and 2005. From June 1986 through June 1992, Mr. Murphy was employed as a portfolio manager at Intermarket Management Inc. At various times during the period he worked at RTM Management, Inc., he was also an associated person with Carter Road (from March 2004 onwards), with Intermarket Brokerage LLC (from September 2002 through March 2004) and with Intermarket Asset Management LLC (from September 2002 through December 2003), where he was also a principal. Mr. Murphy received a B.S. in finance from Fairfield University in 1982.
Gina Palmieriis a discretionary trader and a Principal of Graham specializing in U.S. fixed income markets with particular emphasis in structured finance credit sectors and fixed income hedging instruments. Prior to joining Graham in September of 2005, Ms. Palmieri was a founding partner of Silex Capital Partners, LP, from 2004 to 2005. From 1994 to 2002, Ms. Palmieri was a Senior Portfolio Manager at OppenheimerFunds. From 1992 to 1994, Ms. Palmieri was a structured products analyst and trader at MetLife. From 1986 to 1990, Ms. Palmieri was Graham of SEC Reporting at ITT Hartford. From 1983 to 1985, Ms. Palmieri was a senior auditor at Coopers & Lybrand, during which time she also qualified as a Certified Public Accountant (CPA). Ms. Palmieri received an M.B.A. in Finance from The Wharton School at the University of Pennsylvania in 1992, and a B.S. in Accounting from the University of Connecticut at Storrs in 1983.
Sri Viswanathis a discretionary trader and a Principal of Graham, specializing in options and equity indices. Prior to joining Graham in December 2004, Mr. Viswanath worked as a portfolio manager at Welton Investment Corporation from December 2003 to November 2004. From July 1999 to November 2003, he worked for Niederhoffer Investments as an investment manager; and from November 1998 to June 1999, Mr. Viswanath traded his own strategy. Prior to that, Mr. Viswanath worked as a portfolio manager at Core Capital Management from September 1997 through November 1998. From March 1996 to October 1997, he was the director of research at Logical Information Machines. From June 1993 to July 1995, he worked for Chemical Bank as an interest rate swap trader. Mr. Viswanath received his B.S. in Finance from Central Michigan University in 1989 and his M.B.A. from The University of Texas at Austin in 1993 and did graduate-level coursework in finance at The University of Texas at Austin from August 1995 through October 1996.
Graham App. - 6
Table of Contents
Xin-yun Zhang is a discretionary trader and a Principal of Graham, specializing in the fixed income markets. Prior to joining Graham in September 2003, Mr. Zhang worked at Tudor Investment Corp. from January 2000 to August 2003, where his trading focused on U.S. and Japanese government bonds. From October 1995 to January 2000, he was a fixed-income trader for Greenwich Capital. He worked in fixed-income research for Long-Term Capital Management from October 1993 to October 1995. He received a B.S. from Beijing University in 1983 and a Ph.D. in theoretical physics from University of California, San Diego in 1989. He was a post-doctoral research fellow at Rutgers University from 1989-1993.
KGT, Inc.and KGT Investment Partners, L.P.became registered as principals of Graham on July 27, 1994.
Graham will manage the proceeds of the sale of Graham Series Units pursuant to Graham K-4 (1.5X) Program, which is a diversified portfolio of foreign exchange, global interest rates, stock and commodity futures.
Graham App. - 7
Table of Contents
GRAHAM TRADING POLICIES
Graham trades actively in both U.S. and foreign markets, primarily in futures contracts, forward contracts, spot contracts and associated derivative instruments such as options and swaps. Graham engages in exchange for physical (EFP) transactions, which involve the exchange of a futures position for the underlying physical commodity without making an open, competitive trade on an exchange. Graham also may take long and short positions in equity securities, fixed income securities, hybrid instruments, options, warrants, customized contractual agreements and other financial instruments as it endeavors to achieve superior results for investors and enhanced portfolio diversification. Graham at times will trade certain instruments as a substitute for futures or options traded on futures exchanges. Instruments and contracts not traded on any organized exchange may be entered into with banks, brokerage firms or other financial institutions as counterparties. Graham has complete flexibility in the instruments and markets in which it may invest.
At standard leverage, Graham’s systems like its K-4 strategy normally will commit between 10% and 30% of an account’s equity to meet initial margin requirements, and initial margin requirements over time are expected to average 13% to 20%, except as described below. Since the K-4 Program is being traded at 1.5 times standard leverage, its initial margin requirements over time are expected to average 20% to 30%. Margins required to initiate or maintain open positions are established by brokerage firms selected by Graham clients to perform clearing services. The typical margin levels described above are applicable to brokerage arrangements with competitive terms for major institutional customers. Higher margin requirements may be observed under alternative arrangements or when a broker establishes margins exceeding exchange minimum levels.
Graham reserves the right in extraordinary market conditions to reduce leverage and portfolio risk if it feels in its sole discretion that it is in the potential best interest of its clients to do so. While such actions are anticipated to occur very infrequently, no assurance can be given that Graham’s actions will enhance performance.
Graham also expects to develop additional trading systems and strategies and to modify the systems currently in use over time. As an example of such efforts, Graham has recently incorporated a proprietary multi-factor leverage model within each of its trend-following programs to systematically adjust the program’s exposure to key market sectors based on proprietary factors that assess the potential for prices to trend in the near term. Graham believes strongly in the importance of research and development activities and particularly in the development of new trading strategies. The decision to add or subtract systems or strategies from any investment program shall be at the sole discretion of Graham. Clients will not be informed of these changes as they occur.
In connection with its programs’ systematic trading, Graham may employ discretion in determining the leverage and timing of trades for new accounts and the market weighting and participation. In unusual or emergency market conditions, Graham may also utilize discretion in establishing positions or liquidating positions or otherwise reducing portfolio risk where Graham believes, in its sole discretion, that it is in the potential best interest of its clients to do so. While such actions are anticipated to occur very infrequently, no assurance can be given that Graham’s discretionary actions in these programs will enhance performance.
GRAHAM TRADING PROGRAM
The K4 program was developed in 1998 and commenced trading operations in January 1999. The K4 program uses a mathematical model to identify certain price patterns that have very specific characteristics indicating that there is a high probability that a significant directional move will occur. The K4 program will normally enter or exit a position only when a significant price and volatility spike takes place and is designed to have a high percentage of winning trades. K4 will normally maintain a neutral position in 50% of the markets in the portfolio.
Graham App. - 8
Table of Contents
GRAHAM MARKETS TRADED
Graham trades actively on a 24-hour basis on most global exchanges as well as the 24-hour interbank market for foreign exchange both in the U.S. and abroad. Graham conducts on-going research regarding expanding the number of markets it can trade to further its objective of portfolio diversification. From time to time, Graham adds to or deletes markets from its portfolios as on-going research and future market conditions warrant. Graham may decide to trade certain markets and contracts to the exclusion of others in its trading programs, depending on Graham’s views from time to time. The decision to add or subtract markets from any investment program shall be at the sole discretion of Graham. Clients will not be informed of these changes as they occur.
MANAGEMENT AND INCENTIVE FEES
Management Fees
The Graham Series Units will pay to the Managing Owner a monthly management fee equal to 1/12th of 2.5% of the Graham Series’ Net Asset Value (approximately 2.5% annually). The Managing Owner may pay all or a portion of such management fees to Graham.
Incentive Fees
The Graham Series Units will pay to the Managing Owner a quarterly incentive fee of 20% of New High Net Trading Profits generated by such Series, including realized and unrealized gains and losses thereon, as of the close of business on the last day of each calendar quarter. The fee will accrue monthly. The Managing Owner may pay all or a portion of such incentive fees to Graham.
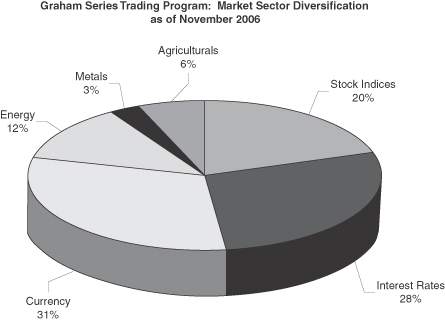
Graham App. - 9
Table of Contents
PROJECTED TWELVE MONTH BREAK EVEN ANALYSIS
The table below shows the estimated amount of all fees and expenses which are anticipated to be incurred by a new investor in the Graham Series-1 Units and Graham Series-2 Units during the first twelve months. The total estimated cost and expense load of Graham Series-1 Units and Graham Series-2 Units is expressed as a percentage of $1,000, the amount of a minimum investment in the Trust (other than by Plans (including IRAs), employees or family members of an employee of the Managing Owner or its affiliates or charitable organizations). Residents of Texas have a minimum initial subscription requirement of $5,000, or, residents of Texas who are Plans (including IRAs), an employee or family member of an employee of the Managing Owner or its affiliates or a charitable organization, have a minimum initial subscription requirement of $1,000. Although the Managing Owner has used actual numbers and good faith estimates in preparing this table, the actual expenses associated with an investment in the Graham Series Units may differ.
| Graham Series-1 | Graham Series-2 | |||||||||||||
| Amount —$ | Amount —% | Amount —$ | Amount —% | |||||||||||
Initial Selling Price(1) | $ | 1,000 | 100 | % | $ | 1,000 | 100 | % | ||||||
Syndication and Selling Expenses(2) | $ | 0 | 0 | % | $ | 0 | 0 | % | ||||||
Trust Operating Expenses(3) | $ | 0 | 0 | % | $ | 0 | 0 | % | ||||||
Management Fee(4) | $ | 25.00 | 2.50 | % | $ | 25.00 | 2.50 | % | ||||||
Service Fee(5) | $ | 30.00 | 3.00 | % | $ | 0 | 0 | % | ||||||
Brokerage Commissions and Trading Fees(6) | $ | 14.90 | 1.49 | % | $ | 14.90 | 1.49 | % | ||||||
Incentive Fee(7) | $ | 0.20 | 0.02 | % | $ | 0 | 0 | % | ||||||
Less Interest Income(8) | $ | (29.00 | ) | (2.90 | )% | $ | (29.00 | ) | (2.90 | )% | ||||
Amount of Trading Income Required for the Trust’s Net Asset Value per Unit (Redemption Value) at the End of One Year to Equal the Selling Price per Unit | $ | 41.10 | 4.11 | % | $ | 10.90 | 1.09 | % | ||||||
Notes
| (1) | The initial selling price per Unit is $100. The amount reflected in the table represents the amount of minimum investment in the Trust (other than Plans (including IRAs), employees or family members of an employee of the Managing Owner or its affiliates or charitable organizations) because the total costs and expenses as set forth in the break-even analysis are the costs and expenses associated with a minimum investment of $1,000. |
| (2) | Expenses incurred in connection with the organization of the Trust and the offering of Units during the Initial Offering Period were paid by the Managing Owner without reimbursement. |
| (3) | The Managing Owner pays for all accounting, auditing, legal and routine operational and administrative expenses without reimbursement. |
| (4) | The Managing Owner will receive a monthly management fee of approximately 0.208% (2.50% annually) of the Graham Series’ Net Asset Value, which it will use to pay all management fees payable to the Trading Advisors. |
| (5) | With respect to Class 1 of the Graham Series of Units, as compensation, the Selling Agents will receive an initial service fee at an annual rate of up to 3.0% of the subscription amount of each subscription for Units in Class 1 of the Graham Series sold by them. The initial service fee will be prepaid by the Managing Owner. If you redeem all or a portion of your Units in Class 1 of the Graham Series during the first twelve (12) months following the effective date of their purchase, you will be subject to a redemption fee of up to 3.0% of the Net Asset Value at which they are redeemed. The amount of the redemption fee associated with each Series at any moment equals the amount of unamortized initial service fee prepaid by the Managing Owner for such Series, and as such the aggregate amount of the redemption fee and the initial service fee cannot exceed 3.0%. Therefore the break-even analysis does not include a separate entry for the redemption fee. |
Graham App. - 10
Table of Contents
| (6) | The Trust, with respect to the Graham Series will pay the Clearing Brokers and the Managing Owner a fee of approximately 1.49% of the Graham Series’ Net Asset Value annually, which will be used to pay all brokerage commissions, plus applicable exchange fees, NFA fees, give up fees and other transaction related fees and expenses charged in connection with the Graham Series’ trading activities and on-going service fees for certain administrative services payable to certain Selling Agents selling Class 2 Units of the Graham Series. |
| (7) | The reason there is an incentive fee amount on Class 1, but not on Class 2, is due to the 3% initial service fee (and on-going service fee charged after the expiration of twelve (12) months following the purchase of Class 1 Units) charged on Class 1 only. A portion of the 3% initial service fee and on-going service fee is not deductible on the incentive fee calculation, thereby requiring the Class 1 to make trading profits and to pay a corresponding incentive fee on such trading profits to break even. |
| (8) | Interest income for the Graham Series-1 Units and the Graham Series-2 Units is currently estimated at 4.90%. The first 2.0% of interest income earned per annum by the Trust on the Graham Series will be paid to the Managing Owner. In addition, if interest income falls below 0.75%, the Managing Owner will be paid the difference between the Trust’s annualized interest income and 0.75%. Interest income above 2.0% is retained by the Trust. |
Graham App. - 11
Table of Contents
PAST PERFORMANCE OF GRAHAM SERIES CLASS 1
The Capsule Performance Table which follows sets forth the actual past performance of the Graham Series Class 1 Units during the period covered by the table.PAST PERFORMANCE IS NOT NECESSARILY INDICATIVE OF FUTURE RESULTS.
| Month | 2006 | 2005 | 2004 | |||
January | 0.67% | -9.45% | ||||
February | -0.72% | -1.69% | ||||
March | 1.44% | -4.94% | ||||
April | 7.12% | -11.12% | ||||
May | -3.37% | 1.47% | ||||
June | -1.29% | 7.47% | ||||
July | -3.18% | -1.90% | ||||
August | -3.73% | -2.63% | ||||
September | 0.69% | 5.57% | ||||
October | 1.29% | -1.26% | ||||
November | 1.74% | 2.38% | 2.13% | |||
December | -4.28% | 1.41% | ||||
Year to date | 0.19% | -19.96% | 3.57% |
| Name of pool: | The Frontier Fund | |
This pool is a multi-advisor advisor pool as defined in CFTC Regulation Section 4.10(d)(2). | ||
| Name of Series: | Graham Series Class 1 | |
| Inception of Trading of Graham Series Class 1: | November 22, 2004 | |
Aggregate Gross Capital Subscriptions for Graham Series Class 1 as of November 30, 2006 | $8,459,505.93 | |
Net Asset Value of Graham Series Class 1 as of November 30, 2006: | $5,881,692.80 | |
| Worst Monthly Percentage Draw-down: | -11.12% (April 2005) | |
| Worst peak-to-valley Draw-down: | -24.79% (December 2004 to April 2005) | |
The Graham Series Class 1 performance table sets forth the actual performance of the Graham Series Class 1. Actual gross trading performance (gross realized and unrealized gain/loss before deduction for trading commissions and fees, management fees, any other expenses, and before addition of interest income) is adjusted for the anticipated trading expenses, management fees, initial service fees, on-going service fees, and interest income of the Graham Series Class 1 of The Frontier Fund. These items, as an annualized percentage calculated monthly on the adjusted beginning of month net asset value are:
| • | Brokerage commissions and trading fees: 1.49% |
| • | Management fees: 2.5% |
| • | Initial service fees and on-going service fees: 3.0% |
An incentive fee of 20% of New High Net Trading Profits (as defined), earned quarterly, is calculated in the composite performance table. Also, any interest income in excess of an annualized rate of 2%, based upon the 90-day Treasury Bill rate for each month to the adjusted beginning of month net asset value, is credited in the pro forma.
| * | Draw-down means losses experienced by the pool over a specified period. |
| ** | Worst peak-to-valley draw-down means the greatest cumulative percentage decline in month-end net asset value due to losses sustained by the pool during any period in which the initial month-end net asset value is not equaled or exceeded by a subsequent month-end net asset value. |
Graham App. - 12
Table of Contents
PAST PERFORMANCE OF GRAHAM SERIES CLASS 2
The Capsule Performance Table which follows sets forth the actual past performance of the Graham Series Class 2 Units during the period covered by the table.PAST PERFORMANCE IS NOT NECESSARILY INDICATIVE OF FUTURE RESULTS.
| Month | 2006 | 2005 | 2004 | |||
January | 0.93% | -9.19% | ||||
February | -0.49% | -1.46% | ||||
March | 1.70% | -4.70% | ||||
April | 7.37% | -10.90% | ||||
May | -3.11% | 1.74% | ||||
June | -1.05% | 7.74% | ||||
July | -2.93% | -1.67% | ||||
August | -3.49% | -2.39% | ||||
September | 0.92% | 5.84% | ||||
October | 1.56% | -1.01% | ||||
November | 1.99% | 2.64% | 2.23% | |||
December | -4.03% | 1.66% | ||||
Year to date | 2.98% | -17.50% | 3.92% |
| Name of pool: | The Frontier Fund | |
This pool is a multi-advisor advisor pool as defined in CFTC Regulation Section 4.10(d)(2). | ||
| Name of Series: | Graham Series Class 2 | |
| Inception of Trading of Graham Series Class 2: | November 22, 2004 | |
Aggregate Gross Capital Subscriptions for Graham Series Class 2 as of November 30, 2006: | $1,953,497.00 | |
Net Asset Value of Graham Series Class 2 as of November 30, 2006: | $1,984,656.09 | |
| Worst Monthly Percentage Draw-down: | -10.90% (April 2005) | |
| Worst peak-to-valley Draw-down: | -24.02% (December 2004 to April 2005) | |
The Graham Series Class 2 performance table sets forth the actual performance of the Graham Series Class 2. Actual gross trading performance (gross realized and unrealized gain/loss before deduction for trading commissions and fees, management fees, any other expenses, and before addition of interest income) is adjusted for the anticipated trading expenses, management fees, initial service fees, on-going service fees, and interest income of the Graham Series Class 2 of The Frontier Fund. These items, as an annualized percentage calculated monthly on the adjusted beginning of month net asset value are:
| • | Brokerage commissions and trading fees: 1.49% |
| • | Management fees: 2.5% |
An incentive fee of 20% of New High Net Trading Profits (as defined), earned quarterly, is calculated in the pro forma. Also, any interest income in excess of an annualized rate of 2%, based upon the 90-day Treasury Bill rate for each month to the adjusted beginning of month net asset value, is credited in the pro forma.
| * | Draw-down means losses experienced by the pool over a specified period. |
| ** | Worst peak-to-valley draw-down means the greatest cumulative percentage decline in month-end net asset value due to losses sustained by the pool during any period in which the initial month-end net asset value is not equaled or exceeded by a subsequent month-end net asset value. |
Graham App. - 13
Table of Contents
PRO FORMA COMPOSITE PERFORMANCE TABLE FOR
K4 PROGRAM AT 150% LEVERAGE
(Deducting The Frontier Fund Graham Series—Class 1 expenses)
The Capsule Performance Table which follows sets forth the actual past performance of all client accounts directed by Graham during the period covered by the table, pro-forma for the Class 1 expenses of The Frontier Fund.PAST PERFORMANCE IS NOT NECESSARILY INDICATIVE OF FUTURE RESULTS.
| Month | 2004 | 2003 | 2002 | 2001 | ||||
January | 0.38% | 7.49% | 0.82% | 2.05% | ||||
February | 7.24% | 8.82% | -1.94% | 6.78% | ||||
March | -0.34% | -6.34% | -1.87% | 11.43% | ||||
April | -8.15% | 1.67% | -9.95% | -10.64% | ||||
May | -2.28% | 5.99% | 5.25% | 2.01% | ||||
June | -4.35% | -5.94% | 13.43% | -0.02% | ||||
July | -4.31% | -2.70% | 16.40% | -5.77% | ||||
August | -0.46% | 3.55% | 7.23% | 5.65% | ||||
September | -0.16% | -13.04% | 8.20% | 16.14% | ||||
October | 4.97% | 11.72% | -6.55% | 9.11% | ||||
November | 4.95% | 2.61% | -2.26% | -7.86% | ||||
December | 6.68% | 7.96% | 2.46% | |||||
Year to date | -3.51% | 18.98% | 38.89% | 31.80% |
Worst Monthly Percentage Draw-down: -13.04% (September 2003)
Worst peak-to-valley Draw-down: -18.64% (February 2004 to September 2004)
The Graham pro forma composite performance was derived from the performance of Graham K-4 (1.5X) Program. Actual gross trading performance (gross realized and unrealized gain/loss before deduction for trading commissions and fees, management fees, any other expenses, and before addition of interest income) is adjusted for the anticipated trading expenses, management fees, initial service fees, on-going service fees, and interest income of the Graham Series Class 1 Units of The Frontier Fund. These items, as an annualized percentage calculated monthly on the adjusted beginning of month net asset value are:
| • | Brokerage commissions and trading fees: 1.49% |
| • | Management fees: 2.5% |
| • | Initial service fees and on-going service fees: 3.0% |
For the actual performance of the Graham Series Class 1 Units, please see the table titled “Past Performance of Graham Series Class 1,” above.
An incentive fee of 20% of New High Net Trading Profits (as defined), earned quarterly, is calculated in the pro forma. Also, any interest income in excess of an annualized rate of 2%, based upon the 90-day Treasury Bill rate for each month to the adjusted beginning of month net asset value, is credited in the pro forma.
The gross trading profit used in this table is taken from the Graham K-4 (1.5X) performance table, except for July, 2000, through December, 2000, during which Graham’s K-4 (1.0X) performance table was utilized.
The pro forma used a simulated adjusted beginning of month net asset value (the Trading Advisor’s net performance divided by rate of return for the month, underlying the preceding composite) in order to replicate the same rate of return from the Trading Advisor’s actual performance, adjusted for the Series’ fees, expenses and interest income.
| * | Draw-down means losses experienced by the account over a specified period. |
| ** | Worst peak-to-valley draw-down means the greatest cumulative percentage decline in month-end net asset value due to losses sustained by the trading program during any period in which the initial month-end net asset value is not equaled or exceeded by a subsequent month-end net asset value. |
Graham App. - 14
Table of Contents
PRO FORMA COMPOSITE PERFORMANCE TABLE FOR
K4 PROGRAM AT 150% LEVERAGE
(Deducting The Frontier Fund Graham Series—Class 2 expenses)
The Capsule Performance Table which follows sets forth the actual past performance of all client accounts directed by Graham during the period covered by the table, pro-forma for the Class 2 expenses of The Frontier Fund.PAST PERFORMANCE IS NOT NECESSARILY INDICATIVE OF FUTURE RESULTS.
| Month | 2004 | 2003 | 2002 | 2001 | ||||
January | 0.63% | 7.76% | 1.08% | 2.30% | ||||
February | 7.52% | 9.10% | -1.69% | 7.05% | ||||
March | -0.09% | -6.11% | -1.62% | 11.72% | ||||
April | -7.92% | 1.92% | -9.72% | -10.41% | ||||
May | -2.04% | 6.26% | 5.52% | 2.26% | ||||
June | -4.11% | -5.71% | 13.72% | 0.23% | ||||
July | -4.07% | -2.45% | 16.70% | -5.54% | ||||
August | -0.21% | 3.81% | 7.51% | 5.92% | ||||
September | 0.09% | -12.82% | 8.48% | 16.44% | ||||
October | 5.24% | 12.00% | -6.31% | 9.39% | ||||
November | 5.24% | 2.87% | -2.02% | -7.64% | ||||
December | 6.96% | 8.23% | 2.72% | |||||
Year to date | -0.78% | 22.63% | 43.21% | 35.83% |
Worst Monthly Percentage Draw-down: -12.82% (September 2003)
Worst peak-to-valley Draw-down: -17.27% (February 2004 to August 2004)
The Graham pro forma composite performance was derived from the performance of Graham K-4 (1.5X) Program. Actual gross trading performance (gross realized and unrealized gain/loss before deduction for trading commissions and fees, management fees, any other expenses, and before addition of interest income) is adjusted for the anticipated trading expenses, management fees, initial service fees, on-going service fees, and interest income of the Graham Series Class 2 Units of The Frontier Fund. These items, as an annualized percentage calculated monthly on the adjusted beginning of month net asset value are:
| • | Brokerage commissions and trading fees: 1.49% |
| • | Management fees: 2.5% |
For the actual performance of the Graham Series Class 2 Units, please see the table titled “Past Performance of Graham Series Class 2,” above.
An incentive fee of 20% of New High Net Trading Profits (as defined), earned quarterly, is calculated in the pro forma. Also, any interest income in excess of an annualized rate of 2%, based upon the 90-day Treasury Bill rate for each month to the adjusted beginning of month net asset value, is credited in the pro forma.
The gross trading profit used in this table is taken from the Graham K-4 (1.5X) performance table, except for July, 2000, through December, 2000, during which Graham’s K-4 (1.0X) performance table was utilized.
The pro forma used a simulated adjusted beginning of month net asset value (the Trading Advisor’s net performance divided by rate of return for the month, underlying the preceding composite) in order to replicate the same rate of return from the Trading Advisor’s actual performance, adjusted for the Series’ fees, expenses and interest income.
| * | Draw-down means losses experienced by the account over a specified period. |
| ** | Worst peak-to-valley draw-down means the greatest cumulative percentage decline in month-end net asset value due to losses sustained by the trading program during any period in which the initial month-end net asset value is not equaled or exceeded by a subsequent month-end net asset value. |
Graham App. - 15
Table of Contents
PAST PERFORMANCE OF GRAHAM
The Capsule Performance Table which follows sets forth the actual past performance of all client accounts directed by Graham during the period covered by the table.PAST PERFORMANCE IS NOT NECESSARILY INDICATIVE OF FUTURE RESULTS.
K4 Program At 150% Leverage
| Month | 2006 | 2005 | 2004 | 2003 | 2002 | 2001 | ||||||
January | 1.33% | -10.16% | 0.71% | 8.02% | 1.59% | 2.72% | ||||||
February | -0.42% | -0.91% | 7.57% | 9.21% | -1.73% | 7.49% | ||||||
March | 1.54% | -4.43% | -0.04% | -6.19% | -1.48% | 12.96% | ||||||
April | 6.95% | -11.10% | -9.79% | 2.08% | -9.59% | -10.15% | ||||||
May | -2.78% | 2.05% | -2.48% | 6.48% | 5.46% | 2.61% | ||||||
June | -0.83% | 8.55% | -5.07% | -5.80% | 15.32% | -0.77% | ||||||
July | -2.47% | -1.87% | -5.02% | -2.44% | 17.43% | -5.34% | ||||||
August | -3.28% | -1.73% | -0.18% | 3.99% | 7.48% | 6.12% | ||||||
September | 0.98% | 5.49% | 0.22% | -12.98% | 8.66% | 19.91% | ||||||
October | 1.96% | -1.05% | 6.67% | 12.01% | -6.09% | 10.32% | ||||||
November | 2.33% | 3.08% | 5.66% | 3.37% | -1.88% | -8.82% | ||||||
December | -3.09% | 3.76% | 7.17% | 8.37% | 3.54% | |||||||
Year | 5.06% | -15.79% | 0.53% | 24.13% | 48.10% | 43.14% | ||||||
THE TABLE SET FORTH ABOVE HAS NOT BEEN ADJUSTED TO REFLECT THE FEES AND EXPENSES OF THE GRAHAM SERIES. THE PRO FORMA COMPOSITE PERFORMANCE TABLES WHICH PRECEDE THIS TABLE SHOW THE SAME PERFORMANCE DATA AS SET FORTH ABOVE BUT CONTAIN PRO FORMA ADJUSTMENTS TO REFLECT THE GRAHAM SERIES FEE STRUCTURE. ACCORDINGLY, SUCH TABLES ARE MORE REPRESENTATIVE OF THE PERFORMANCE OF THIS PROGRAM HAD GRAHAM TRADED IT FOR THE TRUST, DURING THE TIME PERIOD COVERED.
| Name of CTA: | Graham Capital Management, L.P. | |
| Name of Trading Program: | K4 Program at 150% Leverage | |
Inception of Trading by CTA: | February 2, 1995 | |
| Inception of Trading in the Program: | June 1, 1999 | |
| Number of Accounts Open: | 8 | |
| Total Assets Managed by CTA: | $5,013,642,000 | |
| Total Assets Traded According to the Program: | $528,747,000 | |
| Worst Monthly Percentage Drawdown: | September 2003 / 13.62% | |
| Worst Peak-to-Valley Drawdown: | January through April 2005 / 24.37% | |
Number of Profitable Accounts Both Opened and Closed within period 1/1/2001 to 12/1/2006: | 7 | |
Range of Net Lifetime Returns for Such Accounts: | 3.18% to 45.54% | |
| Number of Unprofitable Accounts Both Opened and Closed within period 1/1/2001 to 12/1/2006: | 2 | |
| Range of Net Lifetime Returns for Such Accounts: | -1.66%to -13.02% |
Draw-down means losses experienced by the account over a specified period.
Worst peak-to-valley draw-down means the greatest cumulative percentage decline in month-end net asset value due to losses sustained by the trading program during any period in which the initial month-end net asset value is not equaled or exceeded by a subsequent month-end net asset value.
See Notes to Performance Information Below
Graham App. - 16
Table of Contents
PROGRAMS NOT UTILIZED
The following are programs of Graham that are not anticipated to be utilized by The Frontier Fund.
The following summary performance information presents the composite performance results of the K-4 Program at Standard Leverage for the period from January 2001 through November 2006.
PAST PERFORMANCE IS NOT NECESSARILY INDICATIVE OF FUTURE RESULTS.
Name of CTA: | Graham Capital Management, L.P. | |
Name of Trading Program: | K4 Program at Standard Leverage | |
Inception of Trading by CTA: | February 2, 1995 | |
Inception of Trading in the Program: | January 4, 1999 | |
Number of Accounts Open: | 3 | |
Total Assets Managed by CTA: | $5,013,642,000 | |
Total Assets Traded According to the Program: | $266,642,000 | |
Worst Monthly Percentage Drawdown: | September 2003 / 9.07% | |
Worst Peak-to-Valley Drawdown: | January through April 2005 / 16.76% | |
Number of Profitable Accounts Both Opened and Closed within period 1/1/2001 to 12/1/2006: | 7 | |
Range of Net Lifetime Returns for Such Accounts: | 3.81% to 83.46% | |
Number of Unprofitable Accounts Both Opened and Closed within period 1/1/2001 to 12/1/2006: | 0 | |
Range of Net Lifetime Returns for Such Accounts: | N/A | |
2006 Compound Rate of Return (11 months): | 0.71% | |
2005 Compound Rate of Return: | -12.07% | |
2004 Compound Rate of Return | 0.46% | |
2003 Compound Rate of Return: | 17.05% | |
2002 Compound Rate of Return: | 29.83% | |
2001 Compound Rate of Return: | 29.56% |
Draw-down means losses experienced by the account over a specified period.
Worst peak-to-valley draw-down means the greatest cumulative percentage decline in month-end net asset value due to losses sustained by the trading program during any period in which the initial month-end net asset value is not equaled or exceeded by a subsequent month-end net asset value.
See Notes to Performance Information Below
Graham App. - 17
Table of Contents
The following summary performance information presents the composite performance results of the Global Diversified Program at Standard Leverage for the period from January 2001 through November 2006.
PAST PERFORMANCE IS NOT NECESSARILY INDICATIVE OF FUTURE RESULTS.
Name of CTA: | Graham Capital Management, L.P. | |
Name of Trading Program: | Global Diversified Program at Standard Leverage | |
Inception of Trading by CTA: | February 2, 1995 | |
Inception of Trading in the Program: | February 2, 1995 | |
Number of Accounts Open: | 6 | |
Total Assets Managed by CTA: | $5,013,642,000 | |
Total Assets Traded According to the Program: | $550,398,000 | |
Worst Monthly Percentage Drawdown: | November 2001 / 10.12% | |
Worst Peak-to-Valley Drawdown: | November 2001 through April 2002 / 16.40% | |
Number of Profitable Accounts Both Opened and Closed within period 1/1/2001 to 12/1/2006: | 5 | |
Range of Net Lifetime Returns for Such Accounts: | 0.03% to 31.76% | |
Number of Unprofitable Accounts Both Opened and Closed within period 1/1/2001 to 312/1/2006: | 2 | |
Range of Net Lifetime Returns for Such Accounts: | -0.71% to -1.58% | |
2006 Compound Rate of Return (11 months): | 8.03% | |
2005 Compound Rate of Return: | -5.15% | |
2004 Compound Rate of Return: | 8.92% | |
2003 Compound Rate of Return: | 10.80% | |
2002 Compound Rate of Return: | 18.41% | |
2001 Compound Rate of Return: | 7.02% |
Draw-down means losses experienced by the account over a specified period.
Worst peak-to-valley draw-down means the greatest cumulative percentage decline in month-end net asset value due to losses sustained by the trading program during any period in which the initial month-end net asset value is not equaled or exceeded by a subsequent month-end net asset value.
See Notes to Performance Information Below
Graham App. - 18
Table of Contents
The following summary performance information presents the composite performance results of the Global Diversified Program at 150% Leverage for the period from January 2001 through November 2006.
PAST PERFORMANCE IS NOT NECESSARILY INDICATIVE OF FUTURE RESULTS.
Name of CTA: | Graham Capital Management, L.P. | |
Name of Trading Program: | Global Diversified Program at 150% Leverage | |
Inception of Trading by CTA: | February 2, 1995 | |
Inception of Trading in the Program: | May 1, 1997 | |
Number of Accounts Open: | 8 | |
Total Assets Managed by CTA: | $5,013,642,000 | |
Total Assets Traded According to the Program: | $421,100,000 | |
Worst Monthly Percentage Drawdown: | November 2001 / 15.77% | |
Worst Peak-to-Valley Drawdown: | November 2001 through April 2002 / 24.27% | |
Number of Profitable Accounts Both Opened and Closed within period 1/1/2001 to 12/1/2006: | 7 | |
Range of Net Lifetime Returns for Such Accounts: | 2.79% to 156.54% | |
Number of Unprofitable Accounts Both Opened and Closed within period 1/1/2001 to 12/1/2006: | 0 | |
Range of Net Lifetime Returns for Such Accounts: | N/A | |
2006 Compound Rate of Return (11 months): | 9.06% | |
2005 Compound Rate of Return: | -9.13% | |
2004 Compound Rate of Return: | 12.67% | |
2003 Compound Rate of Return: | 17.82% | |
2002 Compound Rate of Return: | 32.25% | |
2001 Compound Rate of Return: | 12.16% |
Draw-down means losses experienced by the account over a specified period.
Worst peak-to-valley draw-down means the greatest cumulative percentage decline in month-end net asset value due to losses sustained by the trading program during any period in which the initial month-end net asset value is not equaled or exceeded by a subsequent month-end net asset value.
See Notes to Performance Information Below
Graham App. - 19
Table of Contents
The following summary performance information presents the composite performance results of the Graham Selective Trading Program at Standard Leverage for the period from January 2001 through November 2006.
PAST PERFORMANCE IS NOT NECESSARILY INDICATIVE OF FUTURE RESULTS.
Name of CTA: | Graham Capital Management, L.P. | |
Name of Trading Program: | Graham Selective Trading Program at Standard Leverage | |
Inception of Trading by CTA: | February 2, 1995 | |
Inception of Trading in Program: | January 7, 1998 | |
Number of Accounts Open: | 3 | |
Total Assets Managed by CTA: | $5,013,642,000 | |
Total Assets Traded According to the Program: | $241,353,000 | |
Worst Monthly Percentage Drawdown: | November 2001 / 15.60% | |
Worst Peak-to-Valley Drawdown: | March 2004 through August 2004 / 23.64% | |
Number of Profitable Accounts Both Opened and Closed within period 1/1/2001 to 12/1/2006: | 1 | |
Range of Net Lifetime Returns for Such Accounts: | 6.29% | |
Number of Unprofitable Accounts Both Opened and Closed within period 1/1/2001 to 12/1/2006: | 8 | |
Range of Net Lifetime Returns for Such Accounts: | -7.06% to -23.61% | |
2005 Compound Rate of Return (11 months): | 1.89% | |
2005 Compound Rate of Return: | -9.90% | |
2004 Compound Rate of Return: | -6.73% | |
2003 Compound Rate of Return: | 21.82% | |
2002 Compound Rate of Return: | 30.11% | |
2001 Compound Rate of Return: | 0.55% |
Draw-down means losses experienced by the account over a specified period.
Worst peak-to-valley draw-down means the greatest cumulative percentage decline in month-end net asset value due to losses sustained by the trading program during any period in which the initial month-end net asset value is not equaled or exceeded by a subsequent month-end net asset value.
See Notes to Performance Information Below
Graham App. - 20
Table of Contents
The following summary performance information presents the composite performance results of the Graham Selective Trading Program at 150% Leverage for the period from January 2001 through November 2006.
PAST PERFORMANCE IS NOT NECESSARILY INDICATIVE OF FUTURE RESULTS.
Name of CTA: | Graham Capital Management, L.P. | |
Name of Trading Program: | Graham Selective Trading Program at 150% Leverage | |
Inception of Trading by CTA: | February 2, 1995 | |
Inception of Trading in Program: | January 2, 2004 | |
Number of Accounts Open: | 1 | |
Total Assets Managed by CTA: | $5,013,642,000 | |
Total Assets Traded According to the Program: | $33,389,000 | |
Worst Monthly Percentage Drawdown: | April 2004 / 13.93% | |
Worst Peak-to-Valley Drawdown: | March 2004 to August 2004 / 33.37% | |
Number of Profitable Accounts Both Opened and Closed within period 1/1/2001 to 12/1/2006: | 0 | |
Range of Net Lifetime Returns for Such Accounts: | N/A | |
Number of Unprofitable Accounts Both Opened and Closed within period 1/1/2001 to 12/1/2006: | 0 | |
Range of Net Lifetime Returns for Such Accounts: | N/A | |
2006 Compound Rate of Return (11 months): | 7.60% | |
2005 Compound Rate of Return: | -14.05% | |
2004 Compound Rate of Return: | -11.09% | |
2003 Compound Rate of Return: | N/A | |
2002 Compound Rate of Return: | N/A | |
2001 Compound Rate of Return: | N/A |
Draw-down means losses experienced by the account over a specified period.
Worst peak-to-valley draw-down means the greatest cumulative percentage decline in month-end net asset value due to losses sustained by the trading program during any period in which the initial month-end net asset value is not equaled or exceeded by a subsequent month-end net asset value.
See Notes to Performance Information Below
Graham App. - 21
Table of Contents
The following summary performance information presents the composite performance results of the Proprietary Matrix Program for the period from January 2001 through November 2006.
PAST PERFORMANCE IS NOT NECESSARILY INDICATIVE OF FUTURE RESULTS.
Name of CTA: | Graham Capital Management, L.P. | |
Name of Trading Program: | Proprietary Matrix Program | |
Inception of Trading by CTA: | February 2, 1995 | |
Inception of Trading in the Program: | July 1, 1999 | |
Number of Accounts Open: | 1 | |
Total Assets Managed by CTA: | $5,013,642,000 | |
Total Assets Traded According to the Program: | $450,074,000 | |
Worst Monthly Percentage Drawdown: | November 2001 / 11.16% | |
Worst Peak-to-Valley Drawdown: | November 2001 through April 2002 / 15.71% | |
Number of Profitable Accounts Both Opened and Closed within period 1/1/2001 to 12/1/2006: | 0 | |
Range of Net Lifetime Returns for Such Accounts: | N/A | |
Number of Unprofitable Accounts Both Opened and Closed within period 1/1/2001 to 12/1/2006: | 0 | |
Range of Net Lifetime Returns for Such Accounts: | N/A | |
2006 Compound Rate of Return (11 months): | 5.68% | |
2005 Compound Rate of Return: | -3.98% | |
2004 Compound Rate of Return: | -0.29% | |
2003 Compound Rate of Return: | 11.55% | |
2002 Compound Rate of Return: | 28.10% | |
2001 Compound Rate of Return: | 6.77% |
Draw-down means losses experienced by the account over a specified period.
Worst peak-to-valley draw-down means the greatest cumulative percentage decline in month-end net asset value due to losses sustained by the trading program during any period in which the initial month-end net asset value is not equaled or exceeded by a subsequent month-end net asset value.
See Notes to Performance Information Below
Graham App. - 22
Table of Contents
The following summary performance information presents the composite performance results of the Fed Policy Program for the period from January 2001 through November 2006.
PAST PERFORMANCE IS NOT NECESSARILY INDICATIVE OF FUTURE RESULTS.
Name of CTA: | Graham Capital Management, L.P. | |
Name of Trading Program: | Fed Policy Program | |
Inception of Trading by CTA: | February 2, 1995 | |
Inception of Trading in the Program: | August 1, 2000 | |
Number of Accounts Open: | 1 | |
Total Assets Managed by CTA: | $5,013,642,000 | |
Total Assets Traded According to the Program: | $1,902,991,000 | |
Worst Monthly Percentage Drawdown: | January 2002 / 3.41% | |
Worst Peak-to-Valley Drawdown: | March 2006 through July 2006 / 4.84% | |
Number of Profitable Accounts Both Opened and Closed within period 1/1/2001 to 12/1/2006: | 6 | |
Range of Net Lifetime Returns for Such Accounts: | 6.89% to 34.32% | |
Number of Unprofitable Accounts Both Opened and Closed within period 1/1/2001 to 12/1/2006: | 0 | |
Range of Net Lifetime Returns for Such Accounts: | N/A | |
2006 Compound Rate of Return (11 months): | 4.81% | |
2005 Compound Rate of Return: | 14.38% | |
2004 Compound Rate of Return: | 7.71% | |
2003 Compound Rate of Return: | 3.40% | |
2002 Compound Rate of Return: | 17.90% | |
2001 Compound Rate of Return: | 16.88% |
Draw-down means losses experienced by the account over a specified period.
Worst peak-to-valley draw-down means the greatest cumulative percentage decline in month-end net asset value due to losses sustained by the trading program during any period in which the initial month-end net asset value is not equaled or exceeded by a subsequent month-end net asset value.
See Notes to Performance Information Below
Graham App. - 23
Table of Contents
The following summary performance information presents the composite performance results of the Non-Trend Based Program at Standard Leverage for the period from January 2001 through the month such program closed.
PAST PERFORMANCE IS NOT NECESSARILY INDICATIVE OF FUTURE RESULTS.
—This Program is Closed—
Name of CTA: | Graham Capital Management, L.P. | |
Name of Trading Program: | Non-Trend Based Program at Standard Leverage | |
Inception of Trading by CTA: | February 2, 1995 | |
Inception of Trading in the Program: | January 4, 1999 | |
Number of Accounts Open: | 0 | |
Total Assets Managed by CTA: | $5,013,642,000 | |
Total Assets Traded According to the Program: | $0 | |
Worst Monthly Percentage Drawdown: | October 1999 / 5.01% | |
Worst Peak-to-Valley Drawdown: | January 2001 through June 2001 / 9.52% | |
Number of Profitable Accounts Both Opened and Closed within period 1/1/1999 to 9/1/2004: | 1 | |
Range of Net Lifetime Returns for Such Accounts: | 2.18% | |
Number of Unprofitable Accounts Both Opened and Closed within period 1/1/1999 to 9/1/2004: | 0 | |
Range of Net Lifetime Returns for Such Accounts: | N/A | |
2006 Compound Rate of Return: | N/A | |
2005 Compound Rate of Return: | N/A | |
2004 Compound Rate of Return: | N/A | |
2003 Compound Rate of Return: | N/A | |
2002 Compound Rate of Return: | N/A | |
2001 Compound Rate of Return (6 months): | -9.54% |
Draw-down means losses experienced by the account over a specified period.
Worst peak-to-valley draw-down means the greatest cumulative percentage decline in month-end net asset value due to losses sustained by the trading program during any period in which the initial month-end net asset value is not equaled or exceeded by a subsequent month-end net asset value.
See Notes to Performance Information Below
Graham App. - 24
Table of Contents
The following summary performance information presents the composite performance results of the Non-Trend Based Program at 150% Leverage for the period from January 2001 through the month such program closed.
PAST PERFORMANCE IS NOT NECESSARILY INDICATIVE OF FUTURE RESULTS.
—This Program is Closed—
Name of CTA: | Graham Capital Management, L.P. | |
Name of Trading Program: | Non-Trend Based Program at 150% Leverage | |
Inception of Trading by CTA: | February 2, 1995 | |
Inception of Trading in the Program: | June 1, 1999 | |
Number of Accounts Open: | 0 | |
Total Assets Managed by CTA: | $5,013,642,000 | |
Total Assets Traded According to the Program: | $0 | |
Worst Monthly Percentage Drawdown: | October 1999 / 8.42% | |
Worst Peak-to-Valley Drawdown: | June 1999 through October 1999 / 14.33% | |
Number of Profitable Accounts Both Opened and Closed within period 1/1/1999 to 9/1/2004: | 2 | |
Range of Net Lifetime Returns for Such Accounts: | 2.89% to 5.14% | |
Number of Unprofitable Accounts Both Opened and Closed within period 1/1/1999 to 9/1/2004: | 2 | |
Range of Net Lifetime Returns for Such Accounts: | -9.19% to -14.08% | |
2006 Compound Rate of Return: | N/A | |
2005 Compound Rate of Return: | N/A | |
2004 Compound Rate of Return: | N/A | |
2003 Compound Rate of Return: | N/A | |
2002 Compound Rate of Return: | N/A | |
2001 Compound Rate of Return (6 months): | -12.95% |
Draw-down means losses experienced by the account over a specified period.
Worst peak-to-valley draw-down means the greatest cumulative percentage decline in month-end net asset value due to losses sustained by the trading program during any period in which the initial month-end net asset value is not equaled or exceeded by a subsequent month-end net asset value.
See Notes to Performance Information Below
Graham App. - 25
Table of Contents
The following summary performance information presents the composite performance results of the K5 Program at Standard Leverage for the period from January 2001 through November 2006.
PAST PERFORMANCE IS NOT NECESSARILY INDICATIVE OF FUTURE RESULTS.
K5 PROGRAM
Name of CTA: | Graham Capital Management, L.P. | |
Name of Trading Program: | K5 Program at Standard Leverage | |
Inception of Trading by CTA: | February 2, 1995 | |
Inception of Trading in the Program: | October 28, 2002 | |
Number of Accounts Open: | 3 | |
Total Assets Managed by CTA: | $5,013,642,000 | |
Total Assets Traded According to the Program: | $199,034,000 | |
Worst Monthly Percentage Drawdown: | April 2004 / 9.14% | |
Worst Peak-to-Valley Drawdown: | April 2004 through April 2005 / 19.54% | |
Number of Profitable Accounts Both Opened and Closed within period 1/1/2001 to 12/1/2006: | 0 | |
Range of Net Lifetime Returns for Such Accounts: | N/A | |
Number of Unprofitable Accounts Both Opened and Closed within period 1/1/2001 to 12/1/2006: | 4 | |
Range of Net Lifetime Returns for Such Accounts: | -7.50% to -15.42% | |
2006 Compound Rate of Return (11 months): | -1.08% | |
2005 Compound Rate of Return: | -8.60% | |
2004 Compound Rate of Return: | -3.67% | |
2003 Compound Rate of Return (7 months): | -2.13% | |
2002 Compound Rate of Return: | N/A | |
2001 Compound Rate of Return: | N/A |
Draw-down means losses experienced by the account over a specified period.
Worst peak-to-valley draw-down means the greatest cumulative percentage decline in month-end net asset value due to losses sustained by the trading program during any period in which the initial month-end net asset value is not equaled or exceeded by a subsequent month-end net asset value.
*K5 Program at Standard Leverage commenced trading proprietary capital on October 28, 2002, and client trading commenced on June 1, 2003.
See Notes to Performance Information Below
Graham App. - 26
Table of Contents
The following summary performance information presents the composite performance results of the Multi-Trend Program at Standard Leverage for the period from January 2001 through November 2006.
PAST PERFORMANCE IS NOT NECESSARILY INDICATIVE OF FUTURE RESULTS.
MULTI-TREND PROGRAM
Name of CTA: | Graham Capital Management, L.P. | |
Name of Trading Program: | Multi-Trend Program | |
Inception of Trading by CTA: | February 2, 1995 | |
Inception of Trading in the Program: | September 2, 2003 | |
Number of Accounts Open: | 2 | |
Total Assets Managed by CTA: | $5,013,642,000 | |
Total Assets Traded According to the Program: | $33,653,000 | |
Worst Monthly Percentage Drawdown: | April 2004 / 8.05% | |
Worst Peak-to-Valley Drawdown: | March 2004 through August 2004 / 18.41% | |
Number of Profitable Accounts Both Opened and Closed within period 1/1/2001 to 12/1/2006: | 0 | |
Range of Net Lifetime Returns for Such Accounts: | N/A | |
Number of Unprofitable Accounts Both Opened and Closed within period 1/1/2001 to 12/1/2006: | 1 | |
Range of Net Lifetime Returns for Such Accounts: | -1.28% | |
2006 Compound Rate of Return (11 months): | 3.10% | |
2005 Compound Rate of Return: | -9.38% | |
2004 Compound Rate of Return: | -3.14% | |
2003 Compound Rate of Return (4 months): | 3.83% | |
2002 Compound Rate of Return: | N/A | |
2001 Compound Rate of Return: | N/A |
Draw-down means losses experienced by the account over a specified period.
Worst peak-to-valley draw-down means the greatest cumulative percentage decline in month-end net asset value due to losses sustained by the trading program during any period in which the initial month-end net asset value is not equaled or exceeded by a subsequent month-end net asset value.
See Notes to Performance Information Below
Graham App. - 27
Table of Contents
The following summary performance information presents the composite performance results of the New Frontier Program at Standard Leverage for the period from January 2001 through November 2006.
PAST PERFORMANCE IS NOT NECESSARILY INDICATIVE OF FUTURE RESULTS.
NEW FRONTIER PROGRAM
Name of CTA: | Graham Capital Management, L.P. | |
Name of Trading Program: | New Frontier Program | |
Inception of Trading by CTA: | February 2, 1995 | |
Inception of Trading in the Program: | December 1, 2003 | |
Number of Accounts Open: | 2 | |
Total Assets Managed by CTA: | $5,013,642,000 | |
Total Assets Traded According to the Program: | $4,205,000 | |
Worst Monthly Percentage Drawdown: | April 2004 / 4.52% | |
Worst Peak-to-Valley Drawdown: | March 2004 to July 2004 / 7.20% | |
Number of Profitable Accounts Both Opened and Closed within period 1/1/2001 to 12/1/2006: | 2 | |
Range of Net Lifetime Returns for Such Accounts: | 0.62% to 0.62% | |
Number of Unprofitable Accounts Both Opened and Closed within period 1/1/2001 to 12/1/2006: | 0 | |
Range of Net Lifetime Returns for Such Accounts: | N/A | |
2006 Compound Rate of Return (11 months): | 5.12% | |
2005 Compound Rate of Return: | -2.84% | |
2004 Compound Rate of Return: | 3.56% | |
2003 Compound Rate of Return (1 month): | 2.71% | |
2002 Compound Rate of Return: | N/A | |
2001 Compound Rate of Return: | N/A |
Draw-down means losses experienced by the account over a specified period.
Worst peak-to-valley draw-down means the greatest cumulative percentage decline in month-end net asset value due to losses sustained by the trading program during any period in which the initial month-end net asset value is not equaled or exceeded by a subsequent month-end net asset value.
See Notes to Performance Information Below
Graham App. - 28
Table of Contents
The following summary performance information presents the composite performance results of the Global FX Program at Standard Leverage for the period from January 2001 through the month such program closed.
PAST PERFORMANCE IS NOT NECESSARILY INDICATIVE OF FUTURE RESULTS.
GLOBAL FX PROGRAM
—This Program is Closed—
Name of CTA: | Graham Capital Management, L.P. | |
Name of Trading Program: | Global FX Program | |
Inception of Trading by CTA: | February 2, 1995 | |
Inception of Trading in the Program: | May 21, 1997 | |
Number of Accounts Open: | 0 | |
Total Assets Managed by CTA: | $5,013,642,000 | |
Total Assets Traded According to the Program: | $0 | |
Worst Monthly Percentage Drawdown: | July 2001 / 5.84% | |
Worst Peak-to-Valley Drawdown: | January 2001 through October 2001 / 13.62% | |
Number of Profitable Accounts Both Opened and Closed within period 1/1/2001 to 12/1/2001: | 0 | |
Range of Net Lifetime Returns for Such Accounts: | N/A | |
Number of Unprofitable Accounts Both Opened and Closed within period 1/1/2001 to 12/1/2001: | 4 | |
Range of Net Lifetime Returns for Such Accounts: | -0.67% to -14.62% | |
2006 Compound Rate of Return: | N/A | |
2005 Compound Rate of Return: | N/A | |
2004 Compound Rate of Return: | N/A | |
2003 Compound Rate of Return: | N/A | |
2002 Compound Rate of Return: | N/A | |
2001 Compound Rate of Return: | -8.47% |
Draw-down means losses experienced by the account over a specified period.
Worst peak-to-valley draw-down means the greatest cumulative percentage decline in month-end net asset value due to losses sustained by the trading program during any period in which the initial month-end net asset value is not equaled or exceeded by a subsequent month-end net asset value.
See Notes to Performance Information Below
Graham App. - 29
Table of Contents
The following summary performance information presents the composite performance results of the Discretionary Trading Group Program at Standard Leverage for the period from January 2001 through November 2006.
PAST PERFORMANCE IS NOT NECESSARILY INDICATIVE OF FUTURE RESULTS.
DISCRETIONARY TRADING GROUP PROGRAM
Name of CTA: | Graham Capital Management, L.P. | |
Name of Trading Program: | Discretionary Trading Group Program at Standard Leverage | |
Inception of Trading by CTA: | February 2, 1995 | |
Inception of Trading in the Program: | January 4, 1999 | |
Number of Accounts Open: | 1 | |
Total Assets Managed by CTA: | $5,013,642,000 | |
Total Assets Traded According to the Program: | $504,511,000 | |
Worst Monthly Percentage Drawdown: | July 2003/2.54% | |
Worst Peak-to-Valley Drawdown: | July 2003 through August 2003 / 2.85% | |
Number of Profitable Accounts Both Opened and Closed within period 1/1/2001 to 12/1/2006: | 1 | |
Range of Net Lifetime Returns for Such Accounts: | 51.91% | |
Number of Unprofitable Accounts Both Opened and Closed within period 1/1/2001 to 12/1/2006: | 2 | |
Range of Net Lifetime Returns for Such Accounts: | -4.45% to -4.79% | |
2006 Compound Rate of Return (11 months): | 9.05% | |
2005 Compound Rate of Return: | 12.25% | |
2004 Compound Rate of Return | 8.16% | |
2003 Compound Rate of Return: | 2.31% | |
2002 Compound Rate of Return: | 13.58% | |
2001 Compound Rate of Return: | 15.55% |
Draw-down means losses experienced by the account over a specified period.
Worst peak-to-valley draw-down means the greatest cumulative percentage decline in month-end net asset value due to losses sustained by the trading program during any period in which the initial month-end net asset value is not equaled or exceeded by a subsequent month-end net asset value.
See Notes to Performance Information Below
Graham App. - 30
Table of Contents
The following summary performance information presents the composite performance results of the Discretionary Trading Group Program at 2X Leverage for the period from January 2001 through November 2006.
PAST PERFORMANCE IS NOT NECESSARILY INDICATIVE OF FUTURE RESULTS.
DISCRETIONARY TRADING GROUP PROGRAM AT 2X LEVERAGE
Name of CTA: | Graham Capital Management, L.P. | |
Name of Trading Program: | Discretionary Trading Group Program at 2X Leverage | |
Inception of Trading by CTA: | February 2, 1995 | |
Inception of Trading in the Program: | November 1, 2005 | |
Number of Accounts Open: | 1 | |
Total Assets Managed by CTA: | $5,013,642,000 | |
Total Assets Traded According to the Program: | $246,164,000 | |
Worst Monthly Percentage Drawdown: | May 2006 / 1.48% | |
Worst Peak-to-Valley Drawdown: | May 2006 through June 2006 / 1.78% | |
Number of Profitable Accounts Both Opened and Closed within period 1/1/2001 to 12/1/2006: | 0 | |
Range of Net Lifetime Returns for Such Accounts: | N/A | |
Number of Unprofitable Accounts Both Opened and Closed within period 1/1/2001 to 12/1/2006: | 0 | |
Range of Net Lifetime Returns for Such Accounts: | N/A | |
2006 Compound Rate of Return (11 months): | 14.11% | |
2005 Compound Rate of Return (2 months): | 5.36% | |
2004 Compound Rate of Return | N/A | |
2003 Compound Rate of Return: | N/A | |
2002 Compound Rate of Return: | N/A | |
2001 Compound Rate of Return: | N/A |
Draw-down means losses experienced by the account over a specified period.
Worst peak-to-valley draw-down means the greatest cumulative percentage decline in month-end net asset value due to losses sustained by the trading program during any period in which the initial month-end net asset value is not equaled or exceeded by a subsequent month-end net asset value.
See Notes to Performance Information Below
Graham App. - 31
Table of Contents
The following summary performance information presents the composite performance results of the Alternative Investment Program for the period from January 2001 through November 2006.
PAST PERFORMANCE IS NOT NECESSARILY INDICATIVE OF FUTURE RESULTS.
ALTERNATIVE INVESTMENT PROGRAM
Name of CTA: | Graham Capital Management, L.P. | |
Name of Trading Program: | Graham Alternative Investment Fund | |
Inception of Trading by CTA: | February 2, 1995 | |
Inception of Trading in the Program: | August 1, 2006 | |
Number of Accounts Open: | 2 | |
Total Assets Managed by CTA: | $5,013,642,000 | |
Total Assets Traded According to the Program: | $16,413,000 | |
Worst Monthly Percentage Drawdown: | N/A | |
Worst Peak-to-Valley Drawdown: | N/A | |
Number of Profitable Accounts Both Opened and Closed within period 1/1/2001 to 12/1/2006: | 0 | |
Range of Net Lifetime Returns for Such Accounts: | N/A | |
Number of Unprofitable Accounts Both Opened and Closed within period 1/1/2001 to 12/1/2006: | 0 | |
Range of Net Lifetime Returns for Such Accounts: | N/A | |
2006 Compound Rate of Return (4 months): | 6.33% | |
2005 Compound Rate of Return: | N/A | |
2004 Compound Rate of Return | N/A | |
2003 Compound Rate of Return: | N/A | |
2002 Compound Rate of Return: | N/A | |
2001 Compound Rate of Return: | N/A |
Draw-down means losses experienced by the account over a specified period.
Worst peak-to-valley draw-down means the greatest cumulative percentage decline in month-end net asset value due to losses sustained by the trading program during any period in which the initial month-end net asset value is not equaled or exceeded by a subsequent month-end net asset value.
See Notes to Performance Information Below
Graham App. - 32
Table of Contents
The following summary performance information presents the composite performance results of the Proprietary Matrix 2XL Program for the period from January 2001 through November 2006.
PAST PERFORMANCE IS NOT NECESSARILY INDICATIVE OF FUTURE RESULTS.
ALTERNATIVE INVESTMENT PROGRAM
Name of CTA: | Graham Capital Management, L.P. | |
Name of Trading Program: | Proprietary Matrix 2XL Program | |
Inception of Trading by CTA: | February 2, 1995 | |
Inception of Trading in the Program: | September 1, 2006 | |
Number of Accounts Open: | 1 | |
Total Assets Managed by CTA: | $5,013,642,000 | |
Total Assets Traded According to the Program: | $68,074,000 | |
Worst Monthly Percentage Drawdown: | N/A | |
Worst Peak-to-Valley Drawdown: | N/A | |
Number of Profitable Accounts Both Opened and Closed within period 1/1/2001 to 12/1/2006: | 0 | |
Range of Net Lifetime Returns for Such Accounts: | N/A | |
Number of Unprofitable Accounts Both Opened and Closed within period 1/1/2001 to 12/1/2006: | 0 | |
Range of Net Lifetime Returns for Such Accounts: | N/A | |
2006 Compound Rate of Return (3 months): | 7.85% | |
2005 Compound Rate of Return: | N/A | |
2004 Compound Rate of Return | N/A | |
2003 Compound Rate of Return: | N/A | |
2002 Compound Rate of Return: | N/A | |
2001 Compound Rate of Return: | N/A |
Draw-down means losses experienced by the account over a specified period.
Worst peak-to-valley draw-down means the greatest cumulative percentage decline in month-end net asset value due to losses sustained by the trading program during any period in which the initial month-end net asset value is not equaled or exceeded by a subsequent month-end net asset value.
See Notes to Performance Information Below
Graham App. - 33
Table of Contents
Notes to Performance Information
| (1) | The reporting of “total assets” managed by Graham or traded according to a particular program reflects the notional funding of accounts. Clients direct Graham to trade their accounts at a specific notional level of trading and it is not the practice of Graham to require clients to disclose how they fund their brokerage account. Accordingly, Graham generally can not determine the amount of cash committed to client accounts. |
| (2) | The Rate of Return percentage for each month is obtained by dividing the net income for the month by the net asset value as of the beginning of the month (including contributions made at the start of the month). In months where asset changes are made mid-month, rates of return are calculated for each segment of the month and compounded. For this purpose, “net income” represents the gross income for the month in question, net of all expenses and performance allocations. The Rate of Return percentage for each year is determined by calculating the percentage return on an investment made as of the beginning of each year. Specifically, a running index is calculated monthly, compounded by the rate of return, the annual percentage being the change in this index for the year divided by the year’s initial index. |
| (3) | Graham advises exempt accounts for qualified eligible clients the performance of which is not included in the composite performance record. |
Graham App. - 34
Table of Contents
TO PART I OF THE
PROSPECTUS
OF
THE FRONTIER FUND
(A statutory trust formed under the laws of Delaware)
WINTON SERIES-1 UNITS
WINTON SERIES-2 UNITS
Commodity Trading Advisor:
Winton Capital Management Limited
This Winton Series Appendix (the “Winton Series Appendix”) is dated February 12, 2007.
Table of Contents
THE FRONTIER FUND
WINTON SERIES-1 UNITS
WINTON SERIES-2 UNITS
This Winton Series Appendix to the prospectus, dated February 12, 2007, including all exhibits thereto as the same may be amended and supplemented from time to time, or the Prospectus, of The Frontier Fund, or the Trust, a statutory trust formed under the laws of the state of Delaware relates to the units of beneficial interest in the Trust, or the Units, designated as Winton Series Units. Capitalized terms used in this Winton Series Appendix and not otherwise expressly defined herein shall have the same respective meanings as set forth in the Prospectus. This Winton Series Appendix must be accompanied by, and read in conjunction with, the Prospectus.
The Winton Series Units are being offered in two (2) Classes. The Winton Series Units in Class 1 (as described in the Prospectus) are designated as the “Winton Series-1 Units,” and the Winton Series Units in Class 2 (as described in the Prospectus) are designated as the “Winton Series-2 Units.” The Trust is offering both the Winton Series-1 Units and the Winton Series-2 Units pursuant to the Prospectus and this Winton Series Appendix. Prospective purchasers of the Winton Series-1 Units and Winton Series-2 Units should carefully review the Prospectus and this Winton Series Appendix before determining to purchase such Units.
The Winton Series was originally designated the “Beach Series,” and trading for the Winton Series was directed by Beach Capital Management Limited, or Beach. On March 31, 2006, Beach ceased trading its Discretionary Program, which was the trading program used by the Winton Series, because David Beach made a decision to engage in other pursuits. Therefore, Beach is no longer engaged in trading for the Winton Series. As trading for the Series will be directed by Winton, the Series’ name was changed to the “Winton Series.”
TRADING ADVISOR
Winton Capital Management Limited, a United Kingdom company, or Winton, acts as the Trading Advisor with respect to the assets allocable to the Winton Series Units. The assets allocable to the Winton Series Units and Winton’s allocation from the proceeds of the sale of the Balanced Series Units will be contributed to a Trading Company for which Winton will act as the Trading Advisor pursuant to the Winton Diversified Program described below.
Background of Winton
Winton Capital Management Limited, a United Kingdom company, became registered with the CFTC as a CTA in January 1998 and as a CPO in December 1998. It is a member of the NFA. Winton has its principal office and maintains all books and records at 1-5 St. Mary Abbot’s Place, London W8 6LS, United Kingdom. Winton is also regulated by the United Kingdom’s Financial Services Authority. Winton will conduct trading for the Winton Series and its allocation from the Balanced Series through a Trading Company pursuant to Winton’s Diversified Program.
Principals of Winton
David Winton Harding
Mr. Harding, born in 1961, founded Winton in February 1997. Mr. Harding is the Managing Director of Winton. Having graduated from Cambridge University with a First Class Honors Degree, he began his career in the financial industry in 1982. Between September 1982 and December 1984, he held various positions as a UK Gilt trader and salesman at two UK stockbrokers: Wood MacKenzie and Johnson Matthey & Wallace. He then joined Sabre Fund Management Ltd, a CFTC-registered CTA located in London, as an assistant technical trader and researcher, and was later promoted to Director of Research. In December 1986, he moved to Brockham Securities Ltd (“Brockham”), a privately owned sugar trading and managed futures company, to assist in the
Winton App. - 2
Table of Contents
development and marketing of the firm’s futures fund management services. In February 1987, he left Brockham and, together with colleagues Michael Adam and Martin Lueck, founded Adam, Harding and Lueck Ltd. (“AHL”), a computer-driven, research-based CTA. AHL became registered with the CFTC in February 1987. By 1989, this firm had grown into the UK’s largest CTA, with more than $50 million under management. At that time, the principals sold a 51% stake to E D & F Man Group Ltd. (“Man”), one of the largest distributors of futures funds internationally. Between 1989 and 1993, when assets under management rose to $300 million, Mr. Harding headed up AHL’s quantitative research team, supervising about 15 full-time research staff, supported by a software team of around a dozen programmers. This team developed a multiplicity of quantitative trading strategies in addition to AHL’s successful trend-following trading approach. During this time, he was also involved in the company’s international institutional marketing efforts, in particular in Europe, the Middle East, South East Asia, Japan and the U.S. In September 1994, Man bought out the minority shares owned by Mr. Harding and the original partners, and AHL was consolidated into Man’s fund management division. Mr. Harding then formed and headed up a new division of Man, called E D & F Man Quantitative Research, leading a research team that developed quantitative trading models primarily for use by Man’s fund management companies. Mr. Harding left Man in August 1996 to begin preparations for the launch of Winton, which he formed in February 1997. As well as being the founding principal and managing director of Winton, Mr. Harding has been responsible for the development of the research department and in 2005 successfully set up an office in Oxford dedicated entirely to research and development.
Osman Murgian
Mr. Murgian, born in 1934 is a founding director of Winton. Educated in Brighton College in England, Mr. Murgian was also one of the original shareholders and directors of AHL. Mr. Murgian lives in Nairobi, Kenya, and is the owner of or an investor in a number of international businesses ranging from real estate to transportation. Mr. Murgian has a beneficial interest of more than 10% of Winton’s share capital. This interest is held by Saminvest (Jersey) Ltd and Amalco Investments Ltd both of which are investment holding companies ultimately owned by Mr. Murgian’s family foundation.
Martin John Hunt
Mr. Hunt, born in 1962, is a director at Winton. He began his career in the UK managed futures industry in October 1983, at which time he was employed as a trainee trader for a trading advisor, Futures Fund Management Ltd. In January 1986, he was appointed manager of the trading operations for Sabre Fund Management, also a trading advisor. In February 1988, he joined AHL, then a newly established trading advisor, where he was responsible for the company’s trading operations. These trading operations were complex, and Mr. Hunt’s role was to ensure the efficient execution of the firm’s computer-generated futures and interbank orders on over $120 million of assets under management. These orders spanned more than 60 markets, 5 time zones and 15 exchanges worldwide. In August 1991, Mr. Hunt assumed responsibility for marketing and operations at Royston Investments, Ltd, which at the time was a CFTC-registered CTA. In March 1994, he established himself as an independent marketing and compliance consultant to firms in the UK managed futures industry. These consultancy activities continued until February 1997, when he was recruited by David Harding to handle the formation, structuring and subsequent day-to-day running of Winton. At Winton, Mr. Hunt supervises the company’s operations, as well as being directly involved in the marketing of Winton’s investment management approach worldwide. Mr. Hunt also has responsibility for the firm’s regulatory compliance and finance.
Anthony Hamilton Daniell
Mr. Daniell, born in 1954, is a director at Winton and leads the sales and marketing team. After 10 years in the British Army, which included gaining a Civil engineering degree, Mr. Daniell began his career in the financial sector in March 1983 at David Allsopp and Partners, as an equity analyst following US defense companies. He moved to Rowe and Pitman in April 1986 where he became co-head of US Equity sales. From
Winton App. - 3
Table of Contents
March 1994 to December 2001 Mr. Daniell was co-head of Emerging markets and then Head of Latin American Equities. During this time Mr. Daniell was responsible for cash and derivative sales, trading and research and was promoted to Managing Director in January 1999. During the period April 1986 to December 2001, as a result of a series of mergers and acquisitions Rowe and Pitman changed its name a number of times and ultimately became part of UBS. Mr. Daniell left UBS in December 2001. In January 2002 he started at Eday Ltd, an FSA registered private limited company which marketed absolute return funds. In 2003, Eday Ltd began to assist Winton’s marketing. In October 2004 Mr. Daniell became a Winton employee and then became a director in October 2006.
Amalco Investments Ltd.
Amalco Investments Ltd. is a beneficial owner of Winton and has been registered as a Principal of Winton since May 2004.
Saminvest Jersey Ltd.
Saminvest Jersey Ltd. is a beneficial owner of Winton and has been registered as a Principal of Winton since May 2004.
WINTON TRADING PROGRAM
Winton’s investment philosophy is directed towards long-term capital appreciation through compound growth. This is achieved by pursuing a diversified trading scheme without reliance on favorable conditions in any particular market, nor does it depend on the general direction of market prices. An investment with Winton therefore may be appropriate for a portion of the investment portfolio of potential investors whose objective is long-term capital gain. Winton’s investment technique consists of trading a portfolio of more than 120 commodity interests (subject to regulatory and client constraints) on major commodity exchanges and forward markets worldwide, employing a totally computerized, technical, trend-following trading system developed by its principals. This system tracks the daily price movements from these markets around the world, and carries out certain computations to determine each day how long or short the portfolio should be to maximize profit within a certain range of risk. If rising prices are anticipated, a long position will be established; a short position will be established if prices are expected to fall. The trading methods applied by Winton are proprietary, complex and confidential. As a result, the following discussion is of necessity general in nature and not intended to be exhaustive. Winton plans to continue the research and development of its trading methodology and, therefore, retains the right to revise any methods or strategy, including the technical trading factors used, the commodity interests traded and/or the money management principles applied. Such ongoing revisions, unless deemed material, will not be made known to clients.
A Technical Trend-Following System.
Technical analysis refers to analysis based on data intrinsic to a market, such as price and volume. This is to be contrasted with fundamental analysis which relies on factors external to a market, such as supply and demand. The Diversified Program uses no fundamental factors. A trend-following system is one that attempts to take advantage of the observable tendency of the markets to trend, and to tend to make exaggerated movements in both upward and downward directions as a result of such trends. These exaggerated movements are largely explained as a result of the influence of crowd psychology or the herd instinct, amongst market participants. A trend-following system does not anticipate a trend. In fact, trend-following systems are frequently unprofitable for long periods of time in particular markets or market groups, and occasionally they are unprofitable for spells of more than a year, even in large portfolios. However, in the experience of the Principals, over a span of years, such an approach has proven to be consistently profitable. The Winton trading system has been developed by relating the probability of the size and direction of future price movements with certain indicators derived from
Winton App. - 4
Table of Contents
past price movements which characterize the degree of trending of each market at any time. While this is, to some degree, true of all trend-following systems, the unique edge possessed by the Winton system lies in the quality of the analysis underlying this relationship. This enables the system to suffer smaller losses during the inevitable whipsaw periods of market behavior and thus take better advantage of the significant trends when they occur, by focusing more resources on them.
A Non Discretionary System.
Trade selection is not subject to intervention by Winton’s Principals and therefore is not subject to the influences of individual judgment. As a mechanical trading system, the Winton model embodies all the expert knowledge required to analyze market data and direct trades, thus eliminating the risk of basing a trading program on one indispensable person. Equally as important is the fact that mechanical systems can be tested in simulation for long periods of time and the model’s empirical characteristics can be measured. The system’s output is rigorously adhered to in trading the portfolio and intentionally no importance is given to any external or fundamental factors. Whilst it may be seen as unwise to ignore information of obvious value, such as that pertaining to political or economic developments, the disadvantage of this approach is far outweighed by the advantage of the discipline that rigorous adherence to such a system instills. Significant profits are often made by the Winton system, by holding on to positions for much longer than conventional wisdom would dictate. An individual taking trading decisions, and paying attention to day-to-day events, could easily be deflected from the chance of fully capitalizing on such trends, when not adhering to such a system.
Diversification of Markets.
Taking positions in a variety of unrelated markets has been shown, over time, to decrease system volatility. By employing a sophisticated and systematic schema for placing orders in a wide array of markets, it can be demonstrated that there is a high expectation of an overall profit being realized after a sufficient period of time. The trading strategy and account management principles described here are factors upon which Winton will base its trading decisions. Such principles may be revised from time to time by Winton as it deems advisable or necessary. Accordingly, no assurance is given that all of these factors will be considered with respect to every trade or recommendation made on behalf of a Program account or that consideration of any of these factors in a particular situation will lessen a client’s risk of loss or increase the potential for profits.
Winton App. - 5
Table of Contents
Markets Traded
The Winton system trades in all the easily accessible and liquid commodity interests that it practically can. Winton’s portfolio mainly consists of commodity interests which are futures, options and forward contracts in the following areas: stock indices; bonds; short term interest rates; currencies; precious and base metals; grains; livestock; energy and agricultural products. Winton is constantly looking for new opportunities to add additional markets to the portfolio, thus further increasing the portfolio’s diversification.
If the portfolio were fully invested, the Diversified Program would have a 24% exposure to currencies, 30% exposure to interest rates, 32% exposure to stock indices, 4% exposure to agriculturals, 4% exposure to metals and 6% exposure to energy.
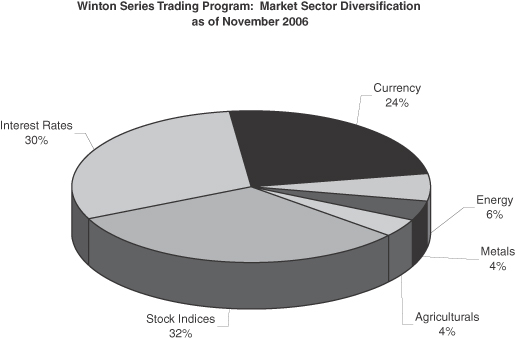
Winton App. - 6
Table of Contents
MANAGEMENT AND INCENTIVE FEES
Management Fees
The Winton Series Units will pay to the Managing Owner a monthly management fee equal to 1/12th of 2.0% of the Winton Series’ Net Asset Value (approximately 2.0% annually). The Managing Owner may pay all or a portion of such management fees to Winton.
Incentive Fees
The Winton Series Units will pay to the Managing Owner a quarterly incentive fee of 20% of New High Net Trading Profits generated by such Series, including realized and unrealized gains and losses thereon, as of the close of business on the last day of each calendar quarter. The fee will accrue monthly. The Managing Owner may pay all or a portion of such incentive fees to Winton.
Winton App. - 7
Table of Contents
PROJECTED TWELVE MONTH BREAK EVEN ANALYSIS
The table below shows the estimated amount of all fees and expenses which are anticipated to be incurred by a new investor in the Winton Series-1 Units and Winton Series-2 Units during the first twelve months. The total estimated cost and expense load of Winton Series-1 Units and Winton Series-2 Units is expressed as a percentage of $1,000, the amount of a minimum investment in the Trust (other than by Plans (including IRAs), employees or family members of an employee of the Managing Owner or its affiliates or charitable organizations). Residents of Texas have a minimum initial subscription requirement of $5,000, or, residents of Texas who are Plans (including IRAs), an employee or family member of an employee of the Managing Owner or its affiliates or a charitable organization, have a minimum initial subscription requirement of $1,000. Although the Managing Owner has used actual numbers and good faith estimates in preparing this table, the actual expenses associated with an investment in the Winton Series Units may differ.
| Winton Series-1 | Winton Series-2 | |||||||||||||
| Amount-$ | Amount-% | Amount-$ | Amount-% | |||||||||||
Initial Selling Price(1) | $ | 1,000 | 100 | % | $ | 1,000 | 100 | % | ||||||
Syndication and Selling Expenses(2) | $ | 0 | 0 | % | $ | 0 | 0 | % | ||||||
Trust Operating Expenses(3) | $ | 0 | 0 | % | $ | 0 | 0 | % | ||||||
Management Fee(4) | $ | 20.00 | 2.00 | % | $ | 20.00 | 2.00 | % | ||||||
Service Fee(5) | $ | 30.00 | 3.00 | % | $ | 0 | 0 | % | ||||||
Brokerage Commissions and Trading Fees(6) | $ | 20.80 | 2.08 | % | $ | 20.80 | 2.08 | % | ||||||
Incentive Fee(7) | $ | 0 | 0 | % | $ | 0 | 0 | % | ||||||
Less Interest Income(8) | $ | (29.00 | ) | (2.90 | )% | $ | (29.00 | ) | (2.90 | )% | ||||
Amount of Trading Income Required for the Trust’s Net Asset Value per Unit (Redemption Value) at the End of One Year to Equal the Selling Price per Unit | $ | 41.80 | 4.18 | % | $ | 11.80 | 1.18 | % | ||||||
Notes
| (1) | The initial selling price per Unit is $100. The amount reflected in the table represents the amount of minimum investment in the Trust (other than Plans (including IRAs), employees or family members of an employee of the Managing Owner or its affiliates or charitable organizations) because the total costs and expenses as set forth in the break-even analysis are the costs and expenses associated with a minimum investment of $1,000. |
| (2) | Expenses incurred in connection with the organization of the Trust and the offering of Units during the Initial Offering Period were paid by the Managing Owner without reimbursement. |
| (3) | The Managing Owner pays for all accounting, auditing, legal and routine operational and administrative expenses without reimbursement. |
| (4) | The Managing Owner will receive a monthly management fee of approximately 0.167% (2.00% annually) of the Winton Series’ Net Asset Value, which it will use to pay all management fees payable to the Trading Advisors. |
| (5) | With respect to Class 1 of the Winton Series of Units, as compensation, the Selling Agents will receive an initial service fee at an annual rate of up to 3.0% of the subscription amount of each subscription for Units in Class 1 of the Winton Series sold by them. The initial service fee will be prepaid by the Managing Owner. If you redeem all or a portion of your Units in Class 1 of the Winton Series during the first twelve (12) months following the effective date of their purchase, you will be subject to a redemption fee of up to 3.0% of the Net Asset Value at which they are redeemed. The amount of the redemption fee associated with each Series at any moment equals the amount of unamortized initial service fee prepaid by the Managing Owner for such Series, and as such the aggregate amount of the redemption fee and the initial service fee cannot exceed 3.0%. Therefore the break-even analysis does not include a separate entry for the redemption fee. |
Winton App. - 8
Table of Contents
| (6) | The Trust, with respect to the Winton Series will pay the Clearing Brokers and the Managing Owner a fee of approximately 2.08% of the Winton Series’ Net Asset Value annually, which will be used to pay all brokerage commissions, plus applicable exchange fees, NFA fees, give up fees, and other transaction related fees and expenses charged in connection with the Winton Series’ trading activities and on-going service fees for certain administrative services payable to certain Selling Agents selling Class 2 Units of the Winton Series. |
| (7) | A portion of the 3% initial service fee and on-going service fee is not deductible on the incentive fee calculation; however, the Class 1 is not required to make trading profits and to pay a corresponding incentive fee on such trading profits to break even. |
| (8) | Interest income for the Winton Series-1 Units and the Winton Series-2 Units is currently estimated at 4.90%. The first 2.0% of interest income earned per annum by the Trust on the Winton Series will be paid to the Managing Owner. In addition, if interest income falls below 0.75%, the Managing Owner will be paid the difference between the Trust’s annualized interest income on 0.75%. Interest income above 2.0% is retained by the Trust. |
Winton App. - 9
Table of Contents
PAST PERFORMANCE OF WINTON SERIES CLASS 1 (WINTON)
The Capsule Performance Table which follows sets forth the actual past performance of the Winton Series Class 1 during the period covered by the table.PAST PERFORMANCE IS NOT NECESSARILY INDICATIVE OF FUTURE RESULTS.
| Month | 2006 | |
January | ||
February | ||
March | ||
April | ||
May | ||
June | ||
July | ||
August | 2.57% | |
September | -2.20% | |
October | 1.24% | |
November | 2.25% | |
December | ||
Year | 3.84% |
Name of pool: | The Frontier Fund | |
This pool is a multi-advisor advisor pool as defined in CFTC Regulation Section 4.10(d)(2). | ||
Name of Series: | Winton Series Class 1 | |
Inception of Trading of Winton Series Class 1: | September 24, 2004 | |
Inception of Trading by Winton on behalf of Winton Series Class 1: | August 23, 2006 | |
Aggregate Gross Capital Subscriptions for Winton Series Class 1 as of November 30, 2006: | $2,557,059.21 | |
Net Asset Value of Winton Series Class 1 as of November 30, 2006: | $24,070.35 | |
Worst Monthly Percentage Draw-down: | -2.20% (September 2006) | |
Worst peak-to-valley Draw-down: | -2.20% (August 2006 through September 2006) | |
The Winton Series Class 1 performance table sets forth the actual performance of the Winton Series Class 1 directed by Winton. Winton commenced trading on behalf of the Winton Series in August 2006. Actual gross trading performance (gross realized and unrealized gain/loss before deduction for trading commissions and fees, management fees, any other expenses, and before addition of interest income) is adjusted for the trading expenses, management fees, initial service fees, on-going service fees, and interest income of the Winton Series Class 1 of The Frontier Fund. These items, as an annualized percentage calculated monthly on the adjusted beginning of month net asset value are:
| • | Brokerage commissions and trading fees: 2.08% |
| • | Management fees: 2.0% |
| • | Initial service fees and on-going service fees: 3.0% |
Winton App. - 10
Table of Contents
An incentive fee of 20% of New High Net Trading Profits (as defined), earned quarterly, is calculated in the pro forma. Also, any interest income in excess of an annualized rate of 2%, based upon applying the 90-day Treasury Bill rate for each month to the adjusted beginning of month net asset value, is credited in the pro forma.
| * | Draw-down means losses experienced by the pool over a specified period. |
| ** | Worst peak to valley draw-down means the greatest cumulative percentage decline in month-end net asset value due to losses sustained by the pool during any period in which the initial month-end net asset value is not equaled or exceeded by a subsequent month-end net asset value. |
Winton App. - 11
Table of Contents
PAST PERFORMANCE OF WINTON SERIES CLASS 2 (WINTON)
The Capsule Performance Table which follows sets forth the actual past performance of the Winton Series Class 2 during the period covered by the table.PAST PERFORMANCE IS NOT NECESSARILY INDICATIVE OF FUTURE RESULTS.
| Month | 2006 | |
January | ||
February | ||
March | ||
April | ||
May | ||
June | ||
July | ||
August | 2.72% | |
September | -1.99% | |
October | 1.50% | |
November | 2.50% | |
December | ||
Year | 4.74% |
Name of pool: | The Frontier Fund | |
This pool is a multi-advisor advisor pool as defined in CFTC Regulation Section 4.10(d)(2). | ||
Name of Series: | Winton Series Class 2 | |
Inception of Trading of Winton Series Class 2: | September 24, 2004 | |
Inception of Trading by Winton on behalf of Winton Series Class 2: | August 23, 2006 | |
Aggregate Gross Capital Subscriptions for Winton Series Class 2 as of November 30, 2006: | $584,573.34 | |
Net Asset Value of Winton Series Class 2 as of November 30, 2006: | $323,210.27 | |
Worst Monthly Percentage Draw-down: | -1.99% (September 2006) | |
Worst peak-to-valley Draw-down: | -1.99% (August 2006 through September 2006) | |
The Winton Series Class 2 performance table sets forth the actual performance of the Winton Series Class 2 directed by Winton. Winton commenced trading on behalf of the Winton Series in August 2006. Actual gross trading performance (gross realized and unrealized gain/loss before deduction for trading commissions and fees, management fees, any other expenses, and before addition of interest income) is adjusted for the trading expenses, management fees, initial service fees, on-going service fees, and interest income of the Winton Series Class 2 of The Frontier Fund. These items, as an annualized percentage calculated monthly on the adjusted beginning of month net asset value are:
| • | Brokerage commissions and trading fees: 2.08% |
| • | Management fees: 2.0% |
Winton App. - 12
Table of Contents
An incentive fee of 20% of New High Net Trading Profits (as defined), earned quarterly, is calculated in the pro forma. Also, any interest income in excess of an annualized rate of 2%, based upon applying the 90-day Treasury Bill rate for each month to the adjusted beginning of month net asset value, is credited in the pro forma.
| * | Draw-down means losses experienced by the pool over a specified period. |
| ** | Worst peak to valley draw-down means the greatest cumulative percentage decline in month-end net asset value due to losses sustained by the pool during any period in which the initial month-end net asset value is not equaled or exceeded by a subsequent month-end net asset value. |
Winton App. - 13
Table of Contents
PAST PERFORMANCE OF WINTON SERIES CLASS 1 (BEACH)
The Capsule Performance Table which follows sets forth the actual past performance of the Winton Series Class 1 Units during the period covered by the table.PAST PERFORMANCE IS NOT NECESSARILY INDICATIVE OF FUTURE RESULTS.
| Month | 2006 | 2005 | 2004 | |||
January | 11.15% | -8.01% | ||||
February | -5.52% | 4.35% | ||||
March | 5.96% | -3.30% | ||||
April | -10.36% | |||||
May | -2.98% | |||||
June | 4.76% | |||||
July | -4.11% | |||||
August | 3.78% | |||||
September | 12.05% | 1.21% | ||||
October | -4.23% | 0.12% | ||||
November | 13.62% | 5.45% | ||||
December | 2.91% | -0.79% | ||||
Year | 11.28% | 5.59% | 6.01% |
Name of pool: | The Frontier Fund | |
This pool is a multi-advisor advisor pool as defined in CFTC Regulation Section 4.10(d)(2). | ||
Name of Series: | Winton Series Class 1 | |
Inception of Trading of Winton Series Class 1: | September 24, 2004 | |
Aggregate Gross Capital Subscriptions for Winton Series Class 1 (Beach) as of March 31, 2006: | $2,533,208.01 | |
Net Asset Value of Winton Series Class 1 (Beach) as of March 31, 2006: | $2,906,723.96 | |
Worst Monthly Draw-down: | -10.36% (April 2005) | |
Worst Peak-to-valley Draw-down: | -19.91% (November 2004 to May 2005) | |
The Winton Series Class 1 performance table sets forth the actual performance of the Winton Series Class 1 directed by Beach. The Winton Series was originally designated as the “Beach Series,” and trading for the Winton Series was directed by Beach. The past performance information presented in the capsule performance table from inception through March 31, 2006, represents the past performance of the Winton Series Class 1 under Beach as the Trading Advisor. Actual gross trading performance (gross realized and unrealized gain/loss before deduction for trading commissions and fees, management fees, any other expenses, and before addition of interest income) is adjusted for the anticipated trading expenses, management fees, initial service fees, on-going service fees, and interest income of the Winton Series Class 1 of The Frontier Fund. These items, as an annualized percentage calculated monthly on the adjusted beginning of month net asset value are:
| • | Brokerage commissions and trading fees: 1.98% |
| • | Management fees: 2.0% |
| • | Initial service fees and on-going service fees: 3.0% |
Winton App. - 14
Table of Contents
An incentive fee of 20% of New High Net Trading Profits (as defined), earned quarterly, is calculated in the pro forma. Also, any interest income in excess of an annualized rate of 2%, based upon applying the 90-day Treasury Bill rate for each month to the adjusted beginning of month net asset value, is credited in the pro forma.
| * | Draw-down means losses experienced by the pool over a specified period. |
| ** | Worst peak to valley draw-down means the greatest cumulative percentage decline in month-end net asset value due to losses sustained by the pool during any period in which the initial month-end net asset value is not equaled or exceeded by a subsequent month-end net asset value. |
Winton App. - 15
Table of Contents
PAST PERFORMANCE OF WINTON SERIES CLASS 2 (BEACH)
The Capsule Performance Table which follows sets forth the actual past performance of the Winton Series Class 2 Units during the period covered by the table.PAST PERFORMANCE IS NOT NECESSARILY INDICATIVE OF FUTURE RESULTS.
| Month | 2006 | 2005 | 2004 | |||
January | 11.44% | -7.76% | ||||
February | -5.31% | 4.59% | ||||
March | 6.23% | -3.06% | ||||
April | -10.14% | |||||
May | -2.73% | |||||
June | 5.02% | |||||
July | -3.86% | |||||
August | 4.04% | |||||
September | 12.32% | 1.24% | ||||
October | -3.98% | 0.36% | ||||
November | 13.90% | 5.73% | ||||
December | 3.17% | -0.54% | ||||
Year | 12.09% | 8.83% | 6.85% |
Name of pool: | The Frontier Fund | |
This pool is a multi-advisor advisor pool as defined in CFTC Regulation Section 4.10(d)(2). | ||
Name of Series: | Winton Series Class 2 | |
Inception of Trading of Winton Series Class 2: | September 24, 2004 | |
Aggregate Gross Capital Subscriptions for Winton Series Class 2 (Beach) as of March 31, 2006: | $274,573.34 | |
Net Asset Value of Winton Series Class 1 (Beach) as of March 31, 2006: | $176,648.55 | |
Worst Monthly Percentage Draw-down: | -10.14% (April 2005) | |
Worst peak-to-valley Draw-down: | -18.69% (November 2004 to May 2005) | |
The Winton Series Class 2 performance table sets forth the actual performance of the Winton Series Class 2 directed by Beach. The Winton Series was originally designated as the “Beach Series,” and trading for the Winton Series was directed by Beach. The past performance information presented in the capsule performance table from inception through March 31, 2006, represents the past performance of the Winton Series Class 1 under Beach as the Trading Advisor. Actual gross trading performance (gross realized and unrealized gain/loss before deduction for trading commissions and fees, management fees, any other expenses, and before addition of interest income) is adjusted for the anticipated trading expenses, management fees, initial service fees, on-going service fees, and interest income of the Winton Series Class 2 of The Frontier Fund. These items, as an annualized percentage calculated monthly on the adjusted beginning of month net asset value are:
| • | Brokerage commissions and trading fees: 1.98% |
| • | Management fees: 2.0% |
Winton App. - 16
Table of Contents
An incentive fee of 20% of New High Net Trading Profits (as defined), earned quarterly, is calculated in the pro forma. Also, any interest income in excess of an annualized rate of 2%, based upon applying the 90-day Treasury Bill rate for each month to the adjusted beginning of month net asset value, is credited in the pro forma.
| * | Draw-down means losses experienced by the pool over a specified period. |
| ** | Worst peak to valley draw-down means the greatest cumulative percentage decline in month-end net asset value due to losses sustained by the pool during any period in which the initial month-end net asset value is not equaled or exceeded by a subsequent month-end net asset value. |
Winton App. - 17
Table of Contents
PRO FORMA COMPOSITE PERFORMANCE TABLE FOR
Winton Diversified Program
(Deducting The Frontier Fund Winton Series—Class 1 expenses)
The Capsule Performance Table which follows sets forth the actual past performance of all client accounts directed by Winton pursuant to the Winton Diversified Program during the period covered by the table, pro-forma for the Class 1 expenses of The Frontier Fund.PAST PERFORMANCE IS NOT NECESSARILY INDICATIVE OF FUTURE RESULTS.
| Month | 2006 | 2005 | 2004 | 2003 | 2002 | 2001 | ||||||
January | 3.67% | -5.61% | 2.47% | 5.12% | -11.03% | 4.68% | ||||||
February | -2.92% | 5.50% | 11.56% | 11.77% | -6.36% | 0.75% | ||||||
March | 3.70% | 4.31% | -0.60% | -11.32% | 11.24% | 7.55% | ||||||
April | 5.66% | -4.48% | -8.45% | 2.29% | -4.86% | -5.57% | ||||||
May | -3.39% | 6.26% | -0.48% | 10.41% | -4.00% | -3.54% | ||||||
June | -1.52% | 2.52% | -3.49% | -5.91% | 7.18% | -3.09% | ||||||
July | -0.80% | -2.60% | 0.54% | -1.52% | 4.66% | 0.82% | ||||||
August | 4.62% | 7.37% | 2.39% | 0.59% | 5.68% | -0.13% | ||||||
September | -6.90% | 4.77% | 0.48% | 7.24% | 4.63% | |||||||
October | -3.50% | 3.44% | 5.42% | -7.94% | 12.27% | |||||||
November | 7.04% | 5.95% | -2.81% | -1.45% | -7.87% | |||||||
December | -4.77% | -0.79% | 9.71% | 13.28% | -4.48% | |||||||
Year | 8.89% | 3.52% | 17.17% | 23.88% | 10.59% | 4.22% |
Worst Monthly Percentage Draw-down: -11.32% (March 2003)
Worst peak-to-valley Draw-down: -26.68% (October 2001 – February 2002)
The Winton pro forma composite performance table was derived from the performance of the Winton Diversified Program. Actual gross trading performance (gross realized and unrealized gain/loss before deduction for trading commissions and fees, management fees, any other expenses, and before addition of interest income) is adjusted for the anticipated trading expenses, management fees, initial service fees, on-going service fees, and interest income of the Winton Series Class 1 Units of The Frontier Fund. These items, as an annualized percentage calculated monthly on the adjusted beginning of month net asset value are:
| • | Brokerage commissions and trading fees: 2.08% |
| • | Management fees: 2.0% |
| • | Initial service fees and on-going service fees: 3.0% |
For the actual performance of the Winton Series Class 1 Units, please see the table titled “Past Performance of Winton Series Class 1,” above.
An incentive fee of 20% of New High Net Trading Profits (as defined), earned quarterly, is calculated in the pro forma. Also, any interest income in excess of an annualized rate of 2%, based upon applying the 90-day Treasury Bill rate for each month to the adjusted beginning of month net asset value, is credited in the pro forma.
The rates of return in this table are representative of the rates of return a composite standard-leverage account would have achieved.
Winton App. - 18
Table of Contents
The pro forma used a simulated adjusted beginning of month net asset value (the Trading Advisor’s net performance divided by rate of return for the month, underlying the preceding composite) in order to replicate the same rate of return from the Trading Advisor’s actual performance, adjusted for the Series’ fees, expenses and interest income.
| * | Draw-down means losses experienced by the account over a specified period. |
| ** | Worst peak to valley draw-down means the greatest cumulative percentage decline in month-end net asset value due to losses sustained by the trading program during any period in which the initial month-end net asset value is not equaled or exceeded by a subsequent month-end net asset value. |
Winton App. - 19
Table of Contents
PRO FORMA COMPOSITE PERFORMANCE TABLE FOR
Winton Diversified Program
(Deducting The Frontier Fund Winton Series—Class 2 expenses)
The Capsule Performance Table which follows sets forth the actual past performance of all client accounts directed by Winton pursuant to the Winton Diversified Program during the period covered by the table, pro-forma for the Class 2 expenses of The Frontier Fund.PAST PERFORMANCE IS NOT NECESSARILY INDICATIVE OF FUTURE RESULTS.
| Month | 2006 | 2005 | 2004 | 2003 | 2002 | 2001 | ||||||
January | 3.93% | -5.37% | 2.68% | 5.33% | -10.80% | 4.89% | ||||||
February | -2.71% | 5.73% | 11.79% | 11.98% | -6.13% | 0.95% | ||||||
March | 3.96% | 4.46% | -0.40% | -11.11% | 11.52% | 7.77% | ||||||
April | 5.52% | -4.24% | -8.24% | 2.09% | -4.62% | -5.33% | ||||||
May | -3.18% | 6.43% | -0.23% | 9.88% | -3.76% | -3.30% | ||||||
June | -1.31% | 2.73% | -3.25% | -5.57% | 7.45% | -2.85% | ||||||
July | -0.59% | -2.36% | 0.79% | -1.27% | 4.92% | 1.07% | ||||||
August | 4.81% | 7.54% | 2.65% | 0.84% | 5.94% | 0.12% | ||||||
September | -6.58% | 5.03% | 0.74% | 7.45% | 4.89% | |||||||
October | -3.25% | 3.42% | 5.34% | -7.73% | 12.48% | |||||||
November | 7.22% | 6.17% | -2.55% | -1.20% | -7.41% | |||||||
December | -4.56% | -0.59% | 9.87% | 13.49% | -4.24% | |||||||
Year | 10.43% | 6.27% | 20.11% | 25.63% | 13.81% | 7.43% |
Worst Monthly Percentage Draw-down: -11.11% (March 2003)
Worst peak-to-valley Draw-down: -25.76% (October 2001 – February 2002)
The Winton pro forma composite performance table was derived from the performance of the Winton Diversified Program. Actual gross trading performance (gross realized and unrealized gain/loss before deduction for trading commissions and fees, management fees, any other expenses, and before addition of interest income) is adjusted for the anticipated trading expenses, management fees, initial service fees, on-going service fees, and interest income of the Winton Series Class 1 Units of The Frontier Fund. These items, as an annualized percentage calculated monthly on the adjusted beginning of month net asset value are:
| • | Brokerage commissions and trading fees: 2.08% |
| • | Management fees: 2.0% |
For the actual performance of the Winton Series Class 2 Units, please see the table titled “Past Performance of Winton Series Class 2,” above.
An incentive fee of 20% of New High Net Trading Profits (as defined), earned quarterly, is calculated in the pro forma. Also, any interest income in excess of an annualized rate of 2%, based upon applying the 90-day Treasury Bill rate for each month to the adjusted beginning of month net asset value, is credited in the pro forma.
The rates of return in this table are representative of the rates of return a composite standard-leverage account would have achieved.
Winton App. - 20
Table of Contents
The pro forma used a simulated adjusted beginning of month net asset value (the Trading Advisor’s net performance divided by rate of return for the month, underlying the preceding composite) in order to replicate the same rate of return from the Trading Advisor’s actual performance, adjusted for the Series’ fees, expenses and interest income.
| * | Draw-down means losses experienced by the account over a specified period. |
| ** | Worst peak to valley draw-down means the greatest cumulative percentage decline in month-end net asset value due to losses sustained by the trading program during any period in which the initial month-end net asset value is not equaled or exceeded by a subsequent month-end net asset value. |
Winton App. - 21
Table of Contents
PAST PERFORMANCE OF WINTON
Winton Diversified Program
The Capsule Performance Table which follows sets forth the actual past performance of the Winton Diversified Program during the period covered by the table.PAST PERFORMANCE IS NOT NECESSARILY INDICATIVE OF FUTURE RESULTS
| Month | 2006 | 2005 | 2004 | 2003 | 2002 | 2001 | ||||||
January | 3.93% | (5.16)% | 2.65% | 5.30% | (10.81)% | 4.58% | ||||||
February | (2.74)% | 5.72% | 11.93% | 11.95% | (6.14)% | 0.57% | ||||||
March | 3.88% | 4.70% | (0.50)% | (11.14)% | 11.44% | 7.48% | ||||||
April | 5.68% | (4.03)% | (8.27)% | 2.07% | (4.66)% | (5.23)% | ||||||
May | (3.21)% | 6.49% | (0.16)% | 10.18% | (3.80)% | (3.32)% | ||||||
June | (1.34)% | 2.85% | (3.12)% | (5.85)% | 7.32% | (2.95)% | ||||||
July | (0.62)% | (2.15)% | 0.88% | (1.15)% | 4.79% | 0.72% | ||||||
August | 4.58% | 7.66% | 2.64% | 0.69% | 5.48% | 0.02% | ||||||
September | (1.43)% | (6.50)% | 4.78% | 0.71% | 7.42% | 4.48% | ||||||
October | 1.43% | (3.02)% | 3.37% | 5.46% | (7.76)% | 12.45% | ||||||
November | *3.24% | 7.05% | 6.40% | (2.68)% | (1.09)% | (7.56)% | ||||||
December | (4.59)% | (0.58)% | 10.00% | 13.46% | (4.02)% | |||||||
Year | *13.68% | 7.66% | 20.31% | 25.52% | 12.86% | 5.56% |
Name of CTA: | Winton Capital Management | |
Name of Portfolio: | Winton Diversified Trading Program | |
Inception of Trading by CTA: | October 1997 | |
Inception of Trading of the Portfolio: | October 1997 | |
Number of Open Accounts at November 30, 2006: | 39 | |
Total Assets Managed by CTA: | *$7,057,205,000 | |
Total Assets Traded According to the Program: | *$6,648,259,000 | |
Worst Monthly Percentage Drawdown: | (12.03)% (March 2003) | |
Worst Peak-to-Valley Drawdown: | (31.09)% (November 2001 to May 2002) | |
Number of Profitable Closed Accounts: | 58 | |
Number of Unprofitable Closed Accounts: | 9 |
Draw-down means losses experienced by the account over a specified period.
Worst peak-to-valley draw-down means the greatest cumulative percentage decline in month-end net asset value due to losses sustained by the trading program during any period in which the initial month-end net asset value is not equaled or exceeded by a subsequent month-end net asset value.
*Estimate
Winton App. - 22
Table of Contents
PROGRAMS NOT UTILIZED
The following are programs of Winton that are not anticipated to be utilized by The Frontier Fund.
The following represents the trading results of one client account managed by Winton Capital Management in the Winton Diversified Trading Program as of November 30, 2006, for the period October 1997 through November 2006, on a monthly and annual basis (year–to-date for partial years). Rate of Return (ROR) is calculated by dividing net performance by nominal account size. Management fee is charged at a rate of 1/12 of 1% (1% annually) of net assets. Incentive fee is charged at a rate of 20% of new net profits.
PAST PERFORMANCE IS NOT NECESSARILY INDICATIVE OF FUTURE RESULTS
Name of CTA: | Winton Capital Management | |
Name of Portfolio: | Winton Futures Fund | |
Inception of Trading by CTA: | October 1997 | |
Inception of Trading of the Portfolio: | October 1997 | |
Number of Open Accounts at November 30, 2006: | 1 | |
Total Assets Managed by CTA: | *$7,057,205,000 | |
Total Assets Traded According to the Program: | *$2,923,000,000 | |
Worst Monthly Percentage Draw-down: | -10.80% (March 2003) | |
Worst Peak-to-Valley Draw-down: | -25.59% (October 2001 – February 2002) | |
Number of Profitable Closed Accounts: | 0 | |
Number of Unprofitable Closed Accounts: | 0 | |
2006 Compound Rate of Return (11 months): | 15.37% | |
2005 Compound Rate of Return: | 9.73% | |
2004 Compound Rate of Return: | 22.62% | |
2003 Compound Rate of Return: | 27.69% | |
2002 Compound Rate of Return: | 18.35% | |
2001 Compound Rate of Return: | 7.12% |
Draw-down means losses experienced by the account over a specified period.
Worst peak-to-valley draw-down means the greatest cumulative percentage decline in month-end net asset value due to losses sustained by the trading program during any period in which the initial month-end net asset value is not equaled or exceeded by a subsequent month-end net asset value.
*Estimate
Winton App. - 23
Table of Contents
The following represents the trading results of Winton Evolution Fund, a client account managed by Winton Capital Management as of August 31, 2006, for the period September 2005 through August 2006, on a monthly and year-to-date basis. Management fee is charged at a rate of 1/12 of 1% (1% annually) of month-end net assets. Incentive fee is charged at a rate of 20% of new net profits. Rate of return (ROR) is calculated by dividing net performance by nominal account size.
PAST PERFORMANCE IS NOT NECESSARILY INDICATIVE OF FUTURE RESULTS
Name of CTA: | Winton Capital Management | |
Name of Portfolio: | Winton Evolution Fund | |
Inception of Trading by CTA: | October 1997 | |
Inception of Trading of the Portfolio: | September 2005 | |
Number of Open Accounts at November 30, 2006: | 1 | |
Total Assets Managed by CTA: | *$7,057,205,000 | |
Total Assets Traded According to the Program: | *$405,718,000 | |
Worst Monthly Percentage Draw-down: | -6.74% (September 2005) | |
Worst Peak-to-Valley Draw-down: | -9.39% (August 2005 – October 2005) | |
Number of Profitable Closed Accounts: | 0 | |
Number of Unprofitable Closed Accounts: | 0 | |
2006 Compound Rate of Return (11 months): | 8.48% | |
2005 Compound Rate of Return (4 months): | -7.71% | |
2004 Compound Rate of Return: | N/A | |
2003 Compound Rate of Return: | N/A | |
2002 Compound Rate of Return: | N/A | |
2001 Compound Rate of Return: | N/A |
Draw-down means losses experienced by the account over a specified period.
Worst peak-to-valley draw-down means the greatest cumulative percentage decline in month-end net asset value due to losses sustained by the trading program during any period in which the initial month-end net asset value is not equaled or exceeded by a subsequent month-end net asset value.
*Estimate
Winton App. - 24
Table of Contents
The following summary performance information presents the composite performance results of the Winton Dollar Hedge Fund for the period from January 2001 through the month such program closed.
PAST PERFORMANCE IS NOT NECESSARILY INDICATIVE OF FUTURE RESULTS
—This Program is Closed—
Name of CTA: | Winton Capital Management | |||
Name of Portfolio: | Winton Dollar Hedge Fund | |||
Inception of Trading by CTA: | October 1997 | |||
Inception of Trading of the Portfolio: | July 2001 | |||
Number of Accounts Open at July 31, 2005: | 0 | |||
Total Assets Under Management at July 31, 2005: | ||||
All Programs - Actual | Client | $2,352,547,000 | ||
Proprietary | $56,000 | |||
- Nominal | Client | $3,017,090,000 | ||
Proprietary | $56,000 | |||
Total Assets Under Management at July 31, 2005: | ||||
This Program - Actual | none | |||
- Nominal | none | |||
Worst Monthly Percentage Draw-down: | -11.60% (September 2002) | |||
Worst Peak-to-Valley Draw-down: | -20.45% (December 2001 to October 2002) | |||
Number of Profitable Closed Accounts: | 1 | |||
Number of Unprofitable Closed Accounts: | 0 | |||
2006 Compound Rate of Return: | N/A | |||
2005 Compound Rate of Return (7 months): | 9.12% | |||
2004 Compound Rate of Return: | 7.20% | |||
2003 Compound Rate of Return: | 25.56% | |||
2002 Compound Rate of Return: | (7.62)% | |||
2001 Compound Rate of Return (6 months): | (5.43)% | |||
This fund was profitable as of June 30, 2005. This program was closed on July 31, 2005.
Draw-down means losses experienced by the account over a specified period.
Worst peak-to-valley draw-down means the greatest cumulative percentage decline in month-end net asset value due to losses sustained by the trading program during any period in which the initial month-end net asset value is not equaled or exceeded by a subsequent month-end net asset value.
Winton App. - 25
Table of Contents
The following represents the trading results of client accounts managed by Winton Capital Management in the Winton Currency Program as of September 30, 2006, for the period February 2005 through September 2006, on a monthly and year-to-date basis. Management fees are charged at rates ranging from 1/12 of 1% to 1/12 of 2% (1% to 2% annually) of net assets. Incentive fees are charged at rates ranging from 15% to 20% of new net profits. Rate of return (ROR) is calculated by dividing net performance by nominal account size. All accounts closed as of September 29, 2006.
PAST PERFORMANCE IS NOT NECESSARILY INDICATIVE OF FUTURE RESULTS
—This Program is Closed—
CTA: | Winton Capital Management | |
Name of Trading Program: | Winton Currency Program | |
Inception of Trading: | October 1997 | |
Inception of this Program: | February 2005 | |
Total Assets Under Management at September 30, 2006: | ||
All Programs -Actual | $4,969,324,000 | |
- Nominal | $6,308,303,000 | |
Total Assets Under Management at September 30, 2006: | ||
This Program -Actual | none | |
- Nominal | none | |
Worst Monthly Percentage Draw-down:* | (7.38)%, 12/05 | |
Worst Peak-to-Valley Draw-down:** | (15.86)%, 12/05 to 2/06 | |
Number of Open Accounts at September 30, 2006: | 0 | |
Number of Accounts Opened and Closed with Positive Net Lifetime ROR: | 1 | |
Number of Accounts Opened and Closed with Negative Net Lifetime ROR: | 2 | |
2006 Compound Rate of Return (9 months): | -0.01% | |
2005 Compound Rate of Return (11 months): | 1.59% | |
2004 Compound Rate of Return: | N/A | |
2003 Compound Rate of Return: | N/A | |
2002 Compound Rate of Return: | N/A | |
2001 Compound Rate of Return: | N/A |
Winton App. - 26
Table of Contents
The following represents the trading results of one client account managed by Winton Capital Management in the Major Markets Program as of February 29, 2004, for the period January 2000 through February 2004, on an annual basis (year-to-date for partial years). For the period January 2000 to December 2003, Winton Capital Management adopted the Fully-Funded Subset method for computing Rate of Return (ROR), pursuant to an Advisory published by the CFTC. The account was 100% notionally funded, therefore, ROR is based on the account at nominal account size. For May 2000 ROR is calculated in accordance with the time-weighting method due to a mid-month 100% increase in the funding level of the program’s only account. Subsequent to December 2003 Winton Capital Management calculates ROR by dividing net performance by nominal account size. Management fee is charged at a rate of 1/6 of 1% (2% annually) of Net Assets, as defined. Incentive fee is charged at a rate of 20% of New Net Profits, as defined. The account closed as of February 24, 2004.
PAST PERFORMANCE IS NOT NECESSARILY INDICATIVE OF FUTURE RESULTS.
—This Program is Closed—
CTA: | Winton Capital Management | |||
Name of Trading Program: | Major Markets Program | |||
Inception of Trading: | October 1997 | |||
Inception of this Program: | January 2000 | |||
Total Assets Under Management at February 29, 2004: | ||||
All Programs -Actual | Client | $327,643,000 | ||
Proprietary | $1,431,000 | |||
- Nominal | Client | $496,524,000 | ||
Proprietary | $1,431,000 | |||
Total Assets Under Management at February 29, 2004: | ||||
This Program -Actual | Client | none | ||
Proprietary | $770,000 | |||
- Nominal | Client | none | ||
Proprietary | $770,000 | |||
Worst Monthly Percentage Draw-down:* | (8.90)%, 7/03 | |||
Worst Peak-to-Valley Draw-down:** | (22.67)%, 1/00 to 9/00 | |||
Number of Open Accounts at February 29, 2004: | 0 | |||
Number of Accounts Opened and Closed with Positive Net Lifetime ROR: | 1 | |||
Number of Accounts Opened and Closed with Negative Net Lifetime ROR: | 0 | |||
2006 Compound Rate of Return: | N/A | |||
2005 Compound Rate of Return: | N/A | |||
2004 Compound Rate of Return (2 months): | 8.40% | |||
2003 Compound Rate of Return: | 24.30% | |||
2002 Compound Rate of Return: | 19.56% | |||
2001 Compound Rate of Return: | 2.16% | |||
Winton App. - 27
Table of Contents
CAMPBELL/GRAHAM SERIES APPENDIX
TO PART I OF THE
PROSPECTUS
OF
THE FRONTIER FUND
(A statutory trust formed under the laws of Delaware)
CAMPBELL/GRAHAM SERIES-1 UNITS
CAMPBELL/GRAHAM SERIES-2 UNITS
Commodity Trading Advisors:
Campbell & Company, Inc.
Graham Capital Management, L.P.
This Campbell/Graham Series Appendix (the “Campbell/Graham Series Appendix”) is dated February 12, 2007.
Table of Contents
THE FRONTIER FUND
CAMPBELL/GRAHAM SERIES-1 UNITS
CAMPBELL/GRAHAM SERIES-2 UNITS
This Campbell/Graham Series Appendix to the prospectus, dated February 12, 2007, including all exhibits thereto as the same may be amended and supplemented from time to time, or the Prospectus, of The Frontier Fund, a statutory trust formed under the laws of the state of Delaware, or the Trust, relates to the units of beneficial interest in the Trust, or the Units, designated as Campbell/Graham Series Units. Capitalized terms used in this Campbell/Graham Series Appendix and not otherwise expressly defined herein shall have the same respective meanings as set forth in the Prospectus. This Campbell/Graham Series Appendix must be accompanied by, and read in conjunction with, the Prospectus.
The Campbell/Graham Series Units are being offered in two (2) Classes. The Campbell/Graham Series Units in Class 1 (as described in the Prospectus) are designated as the “Campbell/Graham Series-1 Units,” and the Campbell/Graham Series Units in Class 2 (as described in the Prospectus) are designated as the “Campbell/Graham Series-2 Units.” The Trust is offering both the Campbell/Graham Series-1 Units and the Campbell/Graham Series-2 Units pursuant to the Prospectus and this Campbell/Graham Series Appendix. Prospective Purchasers of the Campbell/Graham Series-1 Units and Campbell/Graham Series-2 Units should carefully review the Prospectus and this Campbell/Graham Series Appendix before determining to purchase such Units.
TRADING ADVISORS
The current Trading Advisors with respect to the assets allocable to the Campbell/Graham Units are Campbell & Company, Inc., or Campbell, a Maryland Corporation and Graham Capital Management L.P., or Graham, a Delaware limited partnership. The assets allocable to the Campbell/Graham Series Units will be contributed to two Trading Companies for which these entities will act as Trading Advisors pursuant to their respective trading programs. For information regarding Graham, including Graham’s investment program and past performance, please see the Graham Series Appendix which accompanies this Prospectus.
CAMPBELL/GRAHAM SERIES UNITS
MANAGEMENT AND INCENTIVE FEES
Management Fees
The Campbell/Graham Series Units will pay to the Managing Owner a monthly management fee equal to 1/12th of 2.50% of the Campbell/Graham Series’ Net Asset Value (approximately 2.50% annually) allocated to Campbell. The Managing Owner may pay all or a portion of such management fees to Campbell.
The Campbell/Graham Series Units will also pay to the Managing Owner a monthly management fee equal to 1/12th of 2.50% of the Campbell/Graham Series’ Net Asset Value (approximately 2.50% annually) allocated to Graham. The Managing Owner may pay all or a portion of such management fees to Graham.
Incentive Fees
The Campbell/Graham Series Units will pay to the Managing Owner a quarterly incentive fee of 20% of New High Net Trading Profits generated by Graham in trading for such Series, including realized and unrealized gains and losses thereon, as of the close of business on the last day of each calendar quarter. The fee will accrue monthly. The Managing Owner may pay all or a portion of such incentive fees to Graham.
The Campbell/Graham Series Units also will pay to the Managing Owner a quarterly incentive fee of 20% of New High Net Trading Profits generated by Campbell in trading for such Series, including realized and
Campbell/Graham App. - 2
Table of Contents
unrealized gains and losses thereon, as of the close of business on the last day of each calendar quarter. The fee will accrue monthly. The Managing Owner may pay all or a portion of such incentive fees to Campbell.
Because the incentive fee of the Campbell/Graham Series is calculated separately with respect to the assets allocated to each Trading Advisor, it is possible that in any calendar quarter, Unitholders may be charged an incentive fee on gains achieved on one Trading Advisor’s allocation while suffering losses on the other Trading Advisor’s allocation, which may exceed the gains on which such Unitholder has paid an incentive fee.
Initial Allocations
In general, the Managing Owner anticipates a 50-50 allocation to the two Trading Advisors in the Campbell/Graham Series. The actual allocation of the Campbell/Graham Series’ assets will vary based upon the trading performance of the Trading Advisors and the Managing Owner’s asset allocation activities. Since the commencement of trading for the Campbell/Graham Series, the Managing Owner has periodically adjusted the Campbell/Graham Series allocation in order to maintain the approximate 50-50 allocation between Campbell and Graham.
As of May 1, 2006, Campbell no longer accepts new investments into its FME Portfolio. In order to satisfy the long-run desire to have a balanced allocation of the Campbell/Graham Series’ assets to the trading program of each of Campbell and Graham, the Managing Owner moderately increased the Campbell/Graham Series’ weighting to Campbell’s FME Portfolio during the month of April 2006. The Campbell/Graham Series will continue to accept new subscriptions. The Managing Owner anticipates that, as the assets of the Campbell/Graham Series increase as investors continue to acquire Units in the Campbell/Graham Series after May 1, 2006, the allocation will be reduced toward a more equal weighting between Campell and Graham.
Campbell/Graham App. - 3
Table of Contents
The table below sets forth certain of the markets and instruments each of the Trading Advisors allocated assets from the Campbell/Graham Series may trade on behalf of client accounts. Not all markets are part of each program. Each Trading Advisor reserves the right to expand or contract the markets and instruments it trades without giving prior notice.
| Trading Advisor | Program | Stock Indices | Interest Rates | Currencies | Energy | Metals | Agriculturals | Total | |||||||||
Campbell & Company | FME-Large | 14% | 30% | 29% | 17% | 10% | 0% | 100 | % | ||||||||
Graham Capital | K4 Program at 150% | 20% | 28% | 31% | 12% | 3% | 6% | 100 | % | ||||||||
Campbell/Graham Series Program | N.A. | 17% | 29% | 30% | 14% | 6% | 3% | 100 | % |
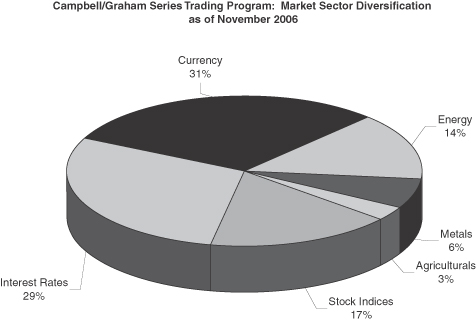
Campbell/Graham App. - 4
Table of Contents
PROJECTED TWELVE MONTH BREAK EVEN ANALYSIS
The table below shows the estimated amount of all fees and expenses which are anticipated to be incurred by a new investor in the Campbell/Graham Series-1 Units and Campbell/Graham Series-2 Units during the first twelve months. The total estimated cost and expense load of Campbell/Graham Series-1 Units and Campbell/Graham Series-2 Units is expressed as a percentage of $1,000, the amount of a minimum investment in the Trust (other than by Plans (including IRAs), employees or family members of an employee of the Managing Owner or its affiliates or charitable organizations). Residents of Texas have a minimum initial subscription requirement of $5,000, or, residents of Texas who are Plans (including IRAs), an employee or family member of an employee of the Managing Owner or its affiliates or a charitable organization, have a minimum initial subscription requirement of $1,000. Although the Managing Owner has used actual numbers and good faith estimates in preparing this table, the actual expenses associated with an investment in the Campbell/Graham Series Units may differ.
| Campbell/Graham Series-1 | Campbell/Graham Series-2 | |||||||||||||
| Amount—$ | Amount—% | Amount—$ | Amount—% | |||||||||||
Initial Selling Price(1) | $ | 1,000 | 100 | % | $ | 1,000 | 100 | % | ||||||
Syndication and Selling Expenses(2) | $ | 0 | 0 | % | $ | 0 | 0 | % | ||||||
Trust Operating Expenses(3) | $ | 0 | 0 | % | $ | 0 | 0 | % | ||||||
Management Fee(4) | $ | 25.00 | 2.50 | % | $ | 25.00 | 2.50 | % | ||||||
Service Fee(5) | $ | 30.00 | 3.00 | % | $ | 0 | 0 | % | ||||||
Brokerage Commissions and Trading Fees(6) | $ | 13.70 | 1.37 | % | $ | 13.70 | 1.37 | % | ||||||
Incentive Fee(7) | $ | 0.20 | 0.02 | % | $ | 0 | 0 | % | ||||||
Less Interest Income(8) | $ | (29.00 | ) | (2.90 | )% | $ | (29.00 | ) | (2.90 | )% | ||||
Amount of Trading Income Required for the Trust’s Net Asset Value per Unit (Redemption Value) at the End of One Year to Equal the Selling Price per Unit | $ | 39.90 | 3.99 | % | $ | 9.70 | 0.97 | % | ||||||
Notes
| (1) | The initial selling price per Unit is $100. The amount reflected in the table represents the amount of minimum investment in the Trust (other than Plans (including IRAs), employees or family members of an employee of the Managing Owner or its affiliates or charitable organizations) because the total costs and expenses as set forth in the break-even analysis are the costs and expenses associated with a minimum investment of $1,000. |
| (2) | Expenses incurred in connection with the organization of the Trust and the offering of Units during the Initial Offering Period were paid by the Managing Owner without reimbursement. |
| (3) | The Managing Owner pays for all accounting, auditing, legal and routine operational and administrative expenses without reimbursement. |
| (4) | The Managing Owner will receive a monthly management fee of approximately 0.21% (2.50% annually) of the Campbell/Graham Series’ Net Asset Value, which it will use to pay all management fees payable to each of Campbell and Graham. |
| (5) | With respect to Class 1 of the Campbell/Graham Series of Units, as compensation, the Selling Agents will receive an initial service fee at an annual rate of up to 3.0% of the subscription amount of each subscription for Units in Class 1 of the Campbell/Graham Series sold by them. The initial service fee will be prepaid by the Managing Owner. If you redeem all or a portion of your Units in Class 1 of the Campbell/Graham Series during the first twelve (12) months following the effective date of their purchase, you will be subject to a redemption fee of up to 3.0% of the Net Asset Value at which they are redeemed. The amount of the |
Campbell/Graham App. - 5
Table of Contents
redemption fee associated with each Series at any moment equals the amount of unamortized initial service fee prepaid by the Managing Owner for such Series, and as such the aggregate amount of the redemption fee and the initial service fee cannot exceed 3.0%. Therefore the break-even analysis does not include a separate entry for the redemption fee. |
| (6) | The Trust, with respect to the Campbell/Graham Series will pay the Clearing Brokers and the Managing Owner a fee of approximately 1.37% of the Campbell/Graham Series’ Net Asset Value annually, which will be used to pay all brokerage commissions, plus applicable exchange fees, NFA fees, give up fees and other transaction related fees and expenses charged in connection with the Campbell/Graham Series’ trading activities and on-going service fees for certain administrative services payable to certain Selling Agents selling Class 2 Units of the Campbell/Graham Series. |
| (7) | The reason there is an incentive fee amount on Class 1, but not on Class 2, is due to the 3% initial service fee (and on-going service fee charged after the expiration of twelve (12) months following the purchase of Class 1 Units) charged on Class 1 only. A portion of the 3% initial service fee and on-going service fee is not deductible on the incentive fee calculation, thereby requiring the Class 1 to make trading profits and to pay a corresponding incentive fee on such trading profits to break even. |
| (8) | Interest income for the Campbell/Graham Series-1 Units and the Campbell/Graham Series-2 Units is currently estimated at 4.90%. The first 2.0% of interest income earned per annum by the Trust on the Campbell/Graham Series will be paid to the Managing Owner. In addition, if interest income falls below 0.75%, the Managing Owner will be paid the difference between the Trust’s annualized interest income and 0.75%. Interest income above 2.0% is retained by the Trust. |
Campbell/Graham App. - 6
Table of Contents
PAST PERFORMANCE OF CAMPBELL/GRAHAM SERIES CLASS 1
The Capsule Performance Table which follows sets forth the actual past performance of the Campbell/Graham Series Class 1 during the period covered by the table.PAST PERFORMANCE IS NOT NECESSARILY INDICATIVE OF FUTURE RESULTS.
Month | 2006 | 2005 | ||
January | 1.24% | |||
February | -1.21% | -4.29% | ||
March | 2.75% | -2.69% | ||
April | 1.11% | -5.65% | ||
May | -2.90% | 2.55% | ||
June | -0.80% | 5.69% | ||
July | -1.83% | -0.80% | ||
August | -2.08% | -3.66% | ||
September | -1.09% | 4.18% | ||
October | 1.20% | 1.00% | ||
November | 1.06% | 1.86% | ||
December | -3.34% | |||
Year | -2.69% | -5.70% |
Name of pool: | The Frontier Fund | |
This pool is a multi-advisor advisor pool as defined in CFTC Regulation Section 4.10(d)(2). | ||
Name of Series: | Campbell/Graham Series Class 1 | |
Inception of Trading of Campbell/Graham Series Class 1: | February 14, 2005 | |
Aggregate Gross Capital Subscriptions for Campbell/Graham Series Class 1 as of November 30, 2006: | $48,721,771.97 | |
Net Asset Value of Campbell/Graham Series Class 1 as of November 30, 2006: | $44,808,346 | |
Worst Monthly Percentage Draw-down: | -5.65% (April 2005) | |
Worst peak-to-valley Draw-down: | -12.13% (February 2005 through April 2005) | |
The Campbell/Graham Series Class 1 performance table sets forth the actual performance of the Campbell/Graham Series Class 1. Actual gross trading performance (gross realized and unrealized gain/loss before deduction for trading commissions and fees, management fees, any other expenses, and before addition of interest income) is adjusted for the trading expenses, management fees, initial service fees, on-going service fees, and interest income of the Campbell/Graham Series Class 1 of The Frontier Fund. These items, as an annualized percentage calculated monthly on the adjusted beginning of month net asset value are:
| • | Brokerage commissions and trading fees: 1.37% |
| • | Management fees: 2.50% |
| • | Initial service fees and on-going service fees: 3.0% |
An incentive fee of 20% of New High Net Trading Profits (as defined), earned quarterly, is calculated in the composite performance table. Also, any interest income in excess of an annualized rate of 2%, based upon applying the 90-day Treasury Bill rate for each month to the adjusted beginning of month net asset value, is credited in the composite past performance table.
| * | Draw-down means losses experienced by the pool over a specified period. |
| ** | Worst peak to valley draw-down means the greatest cumulative percentage decline in month-end net asset value due to losses sustained by the pool during any period in which the initial month-end net asset value is not equaled or exceeded by a subsequent month-end net asset value. |
Campbell/Graham App. - 7
Table of Contents
PAST PERFORMANCE OF CAMPBELL/GRAHAM SERIES CLASS 2
The Capsule Performance Table which follows sets forth the actual past performance of the Campbell/Graham Series Class 2 during the period covered by the table.PAST PERFORMANCE IS NOT NECESSARILY INDICATIVE OF FUTURE RESULTS.
Month | 2006 | 2005 | ||
January | 1.50% | |||
February | -1.00% | -4.15% | ||
March | 3.01% | -2.44% | ||
April | 1.33% | -5.45% | ||
May | -2.64% | 2.82% | ||
June | -0.55% | 5.95% | ||
July | -1.57% | -0.54% | ||
August | -1.81% | -3.42% | ||
September | -0.87% | 4.44% | ||
October | 1.48% | 1.26% | ||
November | 1.31% | 2.11% | ||
December | -3.09% | |||
Year | 0.03% | -3.17% |
Name of pool: | The Frontier Fund | |
This pool is a multi-advisor advisor pool as defined in CFTC Regulation Section 4.10(d)(2). | ||
Name of Series: | Campbell/Graham Series Class 2 | |
Inception of Trading of Campbell/Graham Series Class 2: | February 14, 2005 | |
Aggregate Gross Capital Subscriptions for Campbell/Graham Series Class 2 as of November 30, 2006: | $5,992,907.57 | |
Net Asset Value of Campbell/Graham Series Class 2 as of November 30, 2006: | $5,729,711.16 | |
Worst Monthly Percentage Draw-down: | -5.45% (April 2005) | |
Worst peak-to-valley Draw-down: | -11.58% (February 2005 through April 2005) | |
The Campbell/Graham Series Class 2 performance table sets forth the actual performance of the Campbell/Graham Series Class 2. Actual gross trading performance (gross realized and unrealized gain/loss before deduction for trading commissions and fees, management fees, any other expenses, and before addition of interest income) is adjusted for the trading expenses, management fees, initial service fees, on-going service fees, and interest income of the Campbell/Graham Series Class 2 of The Frontier Fund. These items, as an annualized percentage calculated monthly on the adjusted beginning of month net asset value are:
| • | Brokerage commissions and trading fees: 1.37% |
| • | Management fees: 2.50% |
An incentive fee of 20% of New High Net Trading Profits (as defined), earned quarterly, is calculated in the composite performance table. Also, any interest income in excess of an annualized rate of 2%, based upon applying the 90-day Treasury Bill rate for each month to the adjusted beginning of month net asset value, is credited in the composite past performance table.
| * | Draw-down means losses experienced by the pool over a specified period. |
| ** | Worst peak to valley draw-down means the greatest cumulative percentage decline in month-end net asset value due to losses sustained by the pool during any period in which the initial month-end net asset value is not equaled or exceeded by a subsequent month-end net asset value. |
Campbell/Graham App. - 8
Table of Contents
TRADING ADVISORS
CAMPBELL
Background of Campbell
Campbell was organized in April 1978 as a successor to a partnership originally organized in January 1974. Its offices are located at Court Towers Bldg., 210 West Pennsylvania Avenue #770, Towson, Maryland 21204, and its telephone number is (410) 296-3301. Campbell’s primary business is the trading and management of discretionary futures and forward accounts, including commodity pools. Campbell has been registered with the CFTC as a CPO since 1982 and as a CTA since 1978, and is a member of the NFA in such capacities.
Principals of Campbell
G. William Andrews
G. William Andrews, born in 1972, has been employed by Campbell since April 1997 and has served as Vice President: Director of Research Operations since March 2006. His duties include managing daily research operations, new research product implementation and code management. From 1995 to 1997, Mr. Andrews was employed at Legg Mason as a Research Analyst in the Realty Group. Before immigrating to the United States, he was employed by the Japanese Department of Education in the town of Fujimi, Nagano prefecture. Mr. Andrews holds an M.B.A. in Finance from Loyola College in Maryland and a Bachelor of Social Science from Waikato University, New Zealand.
Theresa D. Becks
Theresa D. Becks, born in 1963, joined Campbell in June 1991 and has served as the Chief Financial Officer and Treasurer since 1992, and Secretary and a Director since 1994. In addition to her role as CFO, Ms. Becks also oversees administration and trade operations. Ms. Becks is also the Chief Financial Officer, Treasurer, and Assistant Secretary of both Campbell & Company Investment Advisor LLC, a wholly-owned subsidiary of Campbell, and The Campbell Multi-Strategy Trust, a registered investment company. Ms. Becks is currently a member of both the Board of Directors of the Managed Funds Association. From 1987 to 1991, she was employed by Bank Maryland Corp, a publicly held company, as a Vice President and Chief Financial Officer. Prior to that time, she worked with Ernst & Young. Ms. Becks is a C.P.A. and has a B.S. in Accounting from the University of Delaware. Ms. Becks is an Associated Person of Campbell.
D. Keith Campbell
D. Keith Campbell, born in 1942, has served as the Chairman of the Board of Directors of Campbell since it began operations, was President until 1994, and was Chief Executive Officer until 1997. Mr. Campbell is the majority voting stockholder of Campbell. From 1971 to 1978, he was a registered representative of a futures commission merchant. Mr. Campbell has acted as a CTA since 1972 when, as general partner of the Campbell Fund, a limited partnership engaged in commodity futures trading, he assumed sole responsibility for trading decisions made on behalf of the Fund. Since then, he has applied various technical trading models to numerous discretionary futures trading accounts. Mr. Campbell is registered with the CFTC and NFA as a CPO. Mr. Campbell is an Associated Person of Campbell.
William C. Clarke, III
William C. Clarke, III, born in 1951, joined Campbell in June 1977 and has served as an Executive Vice President since 1991 and a Director since 1984. Mr. Clarke holds a B.S. in Finance from Lehigh University where he graduated in 1973. Mr. Clarke currently oversees all aspects of research, which involves the development of proprietary trading models and portfolio management methods. Mr. Clarke is an Associated Person of Campbell.
Campbell/Graham App. - 9
Table of Contents
Bruce L. Cleland
Bruce L. Cleland, born in 1947, joined Campbell in January 1993 and has served as President and a Director since 1994, and Chief Executive Officer since 1997. Mr. Cleland is also President and Chief Executive Officer of Campbell & Company Investment Advisor LLC, a wholly-owned subsidiary of Campbell, and Trustee, Chief Executive Officer and President of The Campbell Multi-Strategy Trust, a registered investment company. Mr. Cleland has worked in the international derivatives industry since 1973, and has owned and managed firms engaged in global clearing, floor brokerage, trading and portfolio management. Mr. Cleland is currently a member of the Board of Directors of the NFA, and previously served as a member of the Board of Directors of the Managed Funds Association and as a member of the Board of Governors of the COMEX, in New York. Mr. Cleland is a graduate of Victoria University in Wellington, New Zealand where he earned a Bachelor of Commerce and Administration degree. Mr. Cleland is an Associated Person of Campbell.
Michael S. Harris
Michael S. Harris, born in 1975, has been employed by Campbell since July 2000, was appointed Deputy Manager of Trading in September 2004 and has served as Vice President and Director of Trading since June 2006. His duties include managing daily trade execution for the assets under Campbell’s management. From 1999 to 2000, Mr. Harris worked as a futures and options broker for Refco Inc. (NY). From 1997 to 1999, he worked in the Sales and Product Development groups at Morgan Stanley Managed Futures. Mr. Harris holds a B.A. in Economics and Japanese Studies from Gettysburg College. He also spent time studying abroad at Kansai Gaidai University in Osaka, Japan. Mr. Harris is an Associated Person of Campbell.
Michael J. Hebrank
Michael J. Hebrank, born in 1955, joined Campbell in April 2004 and has served as Chief Technology Officer since then. From February 1999 to April 2004, Mr. Hebrank was the Chief Information Officer at Greater Baltimore Medical Center, the fourth largest healthcare system in Maryland. Mr. Hebrank holds a B.S. in Applied Statistics from the University of Baltimore and an M.S. in Computer Engineering from Loyola College of Maryland.
Kevin M. Heerdt
Kevin M. Heerdt, born in 1958, joined Campbell in March 2003 and has served as Executive Vice President-Research since then and Chief Operating Officer since June 2005. His duties include risk management, research, and the development of quantitatively based hedge fund and options strategies. Mr. Heerdt is also the Vice President and Chief Operating Officer of both Campbell & Company Investment Advisor LLC, a wholly-owned subsidiary of Campbell, and The Campbell Multi-Strategy Trust, a registered investment company. From February 2002 to March 2003, he was self-employed through Integrity Consulting. Previously, Mr. Heerdt worked for twelve years at Moore Capital Management, Inc., where he was a Director until 1999, and a Managing Director from 2000 to 2002. Mr. Heerdt holds a B.A. in Economics and in International Relations from the University of Southern California. Mr. Heerdt is an Associated Person of Campbell.
James L. Little
James M. Little, born in 1946, joined Campbell in April 1990 and has served as Executive Vice President-Business Development and a Director since 1992. Mr. Little is also the Vice President of both Campbell & Company Investment Advisor LLC, a wholly-owned subsidiary of Campbell, and The Campbell Multi-Strategy Trust, a registered investment company. Mr. Little holds a B.S. in Economics and Psychology from Purdue University. From 1989 to 1990, Mr. Little was a registered representative of A.G. Edwards & Sons, Inc. From 1984 to 1989, he was the Chief Executive Officer of James Little & Associates, Inc., a CPO and broker- dealer. Mr. Little is the co-author of The Handbook of Financial Futures, and is a frequent contributor to investment industry publications. Mr. Little is an Associated Person of Campbell.
Campbell/Graham App. - 10
Table of Contents
Thomas P. Lloyd
Thomas P. Lloyd, born in 1959, joined Campbell in September 2005 as General Counsel and Executive Vice President-Legal and Compliance. In this capacity, he is involved in all aspects of legal affairs, compliance and regulatory oversight. Mr. Lloyd is also the Secretary, Chief Compliance Office, and Assistant Treasurer of both Campbell & Company Investment Advisor LLC, a wholly-owned subsidiary of Campbell, and The Campbell Multi-Strategy Trust, a registered investment company. From 1999 to 2005, Mr. Lloyd was employed by Deutsche Bank Securities Inc., or DBSI, in several positions, including Managing Director and head of the legal group for Deutsche Bank Alex. Brown, the Private Client Division of DBSI. From 1997 to 1999, Mr. Lloyd was an attorney in the Enforcement Department of NASD Regulation, Inc., and, from 1995 to 1997, he served as a senior counsel in the Division of Enforcement of the SEC. From 1989 to 1995, he was engaged in the private practice of law. Mr. Lloyd holds a B.A. in Economics from the University of Maryland, and a J.D. from the University of Baltimore School of Law. Mr. Lloyd is a member of the Bars of the State of Maryland and the United States Supreme Court.
Campbell utilizes a systematic, model driven trading approach. Campbell manages client assets based on signals derived from technical trading models, thereby eliminating the “human” element from the day-to-day individual investment decision making process. The Risk Committee, comprised of G. William Andrews, Theresa D. Becks, Bruce L. Cleland, Michael S. Harris and Kevin M. Heerdt, is responsible for overseeing these models.
CAMPBELL TRADING POLICIES
Campbell makes trading decisions for all clients’ accounts using proprietary technical trading models which analyze market statistics. Investors are cautioned that since the trading models are proprietary, it is not possible to determine whether Campbell is following the models or not. There can be no assurance that the trading models currently being used will produce results similar to those produced in the past.
Campbell trades the following two portfolios:
| (i) | The Financial, Metal & Energy Large Portfolio |
| (iv) | The Global Diversified Large Portfolio |
Campbell’s trading models are designed to detect and exploit medium- to long-term price changes, while also applying proven risk management and portfolio management principles. No one market exceeds 15% of a total portfolio allocation. Portfolio composition(s), including contracts traded and percentage allocations to each sector may frequently fluctuate in response to changes in market volatility.
Campbell believes that utilizing multiple trading models for the same client account provides an important level of diversification, and is most beneficial when multiple contracts in each market are traded. Every trading model may not trade every market. It is possible that one trading model may signal a long position while another trading model signals a short position in the same market. It is Campbell’s intention to offset those signals to reduce unnecessary trading, but if the signals are not simultaneous, both trades will be taken and since it is unlikely that both positions would prove profitable, in retrospect, one or both trades will appear to have been unnecessary. It is Campbell’s policy to follow trades signaled by each trading model independently of the other models.
Over the course of a medium- to long-term price change, there are times when the risk of the market does not appear to be justified by the potential reward. In such circumstances, some of Campbell’s trading models may exit a winning position prior to the end of a price move. While there is some risk to this method (for example, being out of the market during a significant portion of a price move), Campbell’s research indicates that this is well compensated for by the decreased volatility of performance that may result.
Campbell/Graham App. - 11
Table of Contents
Campbell’s trading models may include trend-following trading models, counter-trend trading models and trading models that do not seek to identify or follow price trends at all. Campbell expects to develop additional trading models and to modify models currently in use and may or may not employ all such models for all clients’ accounts. The trading models currently used by Campbell may be eliminated from use if Campbell ever believes such action is warranted.
While Campbell normally follows a disciplined systematic approach to trading, on occasion it may override the signals generated by the trading models such as when market conditions dictate otherwise. While such action may be taken for any reason at any time at Campbell’s discretion, it will normally only be taken to reduce risk in the portfolio, and may or may not enhance the results that would otherwise be achieved.
Campbell applies risk management and portfolio management strategies to measure and manage overall portfolio risk. These strategies include portfolio structure, risk balance, capital allocation and risk limitation. One objective of risk and portfolio management is to determine periods of relatively high and low portfolio risk, and when such points are reached, Campbell may reduce or increase position size accordingly. It is possible, however, that this reduction or increase in position size may not enhance the results achieved over time.
From time to time, Campbell may increase or decrease the total number of contracts held based on increases or decreases in an account’s assets, changes in market conditions, perceived changes in portfolio-wide risk factors, or other factors which may be deemed relevant.
Campbell estimates that, based on the amount of margin required to maintain positions in the markets currently traded, aggregate margin for all positions held in a client’s account will range between 5% and 30% of the account’s net assets. From time to time, margin commitments may be above or below this range.
The number of contracts that Campbell believes can be bought or sold in a particular market without unduly influencing price adversely may at times be limited. In such cases, a client’s portfolio would be influenced by liquidity factors because the positions taken in such markets might be substantially smaller than the positions that would otherwise be taken.
CAMPBELL TRADING PROGRAM
The assets allocated to Campbell will be traded pursuant to the FME Large Portfolio.
CAMPBELL MARKETS TRADED
The FME Large Portfolio trades in foreign currencies, precious and base metals, energy products, stock market indices and interest rates.
Campbell/Graham App. - 12
Table of Contents
PAST PERFORMANCE OF CAMPBELL
The Capsule Performance Table which follows presents the composite performance results of the FME Large Portfolio for the period covered by the table.PAST PERFORMANCE IS NOT NECESSARILY INDICATIVE OF FUTURE RESULTS.
FME Large Portfolio
| Month | 2006 | 2005 | 2004 | 2003 | 2002 | 2001 | ||||||
January | 2.01% | -2.16% | 2.36% | 7.75% | -0.71% | -1.09% | ||||||
February | -1.58% | -1.11% | 10.79% | 7.71% | -1.98% | 0.71% | ||||||
March | 4.27% | 0.11% | 0.94% | -4.38% | -1.60% | 6.97% | ||||||
April | -2.76% | 0.50% | -6.67% | 2.77% | -4.03% | -8.09% | ||||||
May | -2.78% | 5.00% | -0.54% | 2.09% | 4.12% | 1.23% | ||||||
June | -0.41% | 6.24% | -3.14% | -0.77% | 7.73% | -1.71% | ||||||
July | -0.10% | 1.00% | -0.62% | -4.56% | 7.64% | 1.45% | ||||||
August | -0.36% | -5.40% | -1.11% | 2.42% | 3.61% | 2.10% | ||||||
September | -2.78% | 3.75% | -1.55% | -1.38% | 3.90% | 6.94% | ||||||
October | 1.76% | 3.85% | 2.40% | 2.84% | -4.75% | 4.96% | ||||||
November | 0.80% | 2.12% | 4.03% | 0.79% | -1.31% | -9.62% | ||||||
December | -2.76% | 0.80% | 4.29% | 3.65% | 3.72% | |||||||
Year | -2.16% | 11.01% | 6.93% | 20.40% | 16.39% | 6.20% |
Name of CTA: | Campbell & Company, Inc. | |
Name of Portfolio: | Financial Metal & Energy Large Portfolio | |
Inception of Trading by CTA: | January 1972 | |
Inception of Trading of the Portfolio: | April 1983 | |
Number of Accounts Open: | 30 | |
Total Assets Managed by CTA: | $11.310 billion estimate | |
Total Assets Traded According to the Program: | $10.186 billion estimate | |
Worst Monthly Percentage Drawdown: | -9.62% (November 2001) | |
Worst Peak-to-Valley Drawdown: | -13.85% (October 2001 – April 2002) | |
Number of Profitable Accounts That Have Opened and Closed: | 11 | |
Range of Returns Experienced by Profitable Accounts: | 2.78% to 60.11% | |
Number of Unprofitable Accounts That Have Opened and Closed: | 4 | |
Range of Returns Experienced by Unprofitable Accounts: | -0.06% to -7.40% |
Worst Monthly Percentage Draw-down is the largest monthly loss experienced by the portfolio during the period presented in any calendar month expressed as a percentage of the total equity in the portfolio and includes the month and year of such draw-down. A small number of accounts in the portfolio composite have experienced monthly draw-downs that are materially larger than the largest composite monthly draw-down. These variances result from such factors as small account size (i.e., accounts with net assets of less than the prescribed portfolio minimum, which therefore trade fewer contracts than the standard portfolio), intra-month account opening or closing, significant intra-month additions or withdrawals, trading commissions in excess of the stated average, and investment restrictions imposed by the client.
Campbell/Graham App. - 13
Table of Contents
Worst Peak-to-Valley Draw-down is the largest cumulative loss experienced by the portfolio during the period presented in any consecutive monthly period on a compounded basis and includes the time frame of such draw-down. A small number of accounts in the portfolio composite have experienced peak-to-valley draw-downs that are materially larger than the largest composite peak-to-valley draw-down. These variances result from such factors as small account size (i.e., accounts with net assets of less than the prescribed portfolio minimum, which therefore trade fewer contracts than the standard portfolio), intra-month account opening or closing, significant intra-month additions or withdrawals, trading commissions in excess of the stated average, and investment restrictions imposed by the client.
Campbell/Graham App. - 14
Table of Contents
PROGRAMS NOT UTILIZED
The following are programs of Campbell that are not anticipated to be utilized by The Frontier Fund.
The following summary performance information presents the composite performance results of the FME Small (Above $5 Million) Portfolio for the period from January 2001 through the month such portfolio closed. The portfolio closed October 2005.
PAST PERFORMANCE IS NOT NECESSARILY INDICATIVE OF FUTURE RESULTS.
— This Portfolio is Closed —
Name of CTA: | Campbell & Company, Inc. | |
Name of Portfolio: | FME Small (Above $5 Million) Portfolio | |
Inception of Trading by CTA: | January 1972 | |
Inception of Trading of the Portfolio: | February 1995 | |
Number of Accounts Open: | 0 | |
Total Assets Managed by CTA: | $11.310 billion estimate | |
Total Assets Traded According to the Program: | $0 | |
Worst Monthly Percentage Draw-down: | -9.94% (November 2001) | |
Worst Peak-to-Valley Draw-down: | -15.41% (October 2001 – April 2002) | |
2006 Compound Rate of Return: | N/A | |
2005 Compound Rate of Return (10 months): | 7.35% | |
2004 Compound Rate of Return: | 5.57% | |
2003 Compound Rate of Return: | 18.45% | |
2002 Compound Rate of Return: | 12.65% | |
2001 Compound Rate of Return: | 1.33% |
Worst Monthly Percentage Draw-down is the largest monthly loss experienced by the portfolio during the period presented in any calendar month expressed as a percentage of the total equity in the portfolio and includes the month and year of such draw-down. A small number of accounts in the portfolio composite have experienced monthly draw-downs that are materially larger than the largest composite monthly draw-down. These variances result from such factors as small account size (i.e., accounts with net assets of less than the prescribed portfolio minimum, which therefore trade fewer contracts than the standard portfolio), intra-month account opening or closing, significant intra-month additions or withdrawals, trading commissions in excess of the stated average, and investment restrictions imposed by the client.
Worst Peak-to-Valley Draw-down is the largest cumulative loss experienced by the portfolio during the period presented in any consecutive monthly period on a compounded basis and includes the time frame of such draw-down. A small number of accounts in the portfolio composite have experienced peak-to-valley draw-downs that are materially larger than the largest composite peak-to-valley draw-down. These variances result from such factors as small account size (i.e., accounts with net assets of less than the prescribed portfolio minimum, which therefore trade fewer contracts than the standard portfolio), intra-month account opening or closing, significant intra-month additions or withdrawals, trading commissions in excess of the stated average, and investment restrictions imposed by the client.
*For the period January 2001 to April 2004, performance has been calculated using the Fully-Funded Subset method in accordance with CFTC guidelines. Performance since May 2004 has been calculated using the Only Accounts Traded (OAT) method. See the discussion of these methods in the Notes following this performance presentation.
Campbell/Graham App. - 15
Table of Contents
The following summary performance information presents the composite performance results of the FME Small (Below $5 Million) Portfolio for the period from January 2001 through the month such portfolio closed. The portfolio closed February 2005.
PAST PERFORMANCE IS NOT NECESSARILY INDICATIVE OF FUTURE RESULTS.
— This Portfolio is Closed —
Name of CTA: | Campbell & Company, Inc. | |
Name of Portfolio: | FME Small (Below $5 Million) Portfolio | |
Inception of Trading by CTA: | January 1972 | |
Inception of Trading of the Portfolio: | July 2000 | |
Number of Accounts Open: | 0 | |
Total Assets Managed by CTA: | $11.310 billion estimate | |
Total Assets Traded According to the Program: | $0 | |
Worst Monthly Percentage Draw-down: | -11.84% (November 2001) | |
Worst Peak-to-Valley Draw-down: | -17.19% (October 2001 – April 2002) | |
2006 Compound Rate of Return: | N/A | |
2005 Compound Rate of Return (2 months): | -4.94% | |
2004 Compound Rate of Return: | 15.03% | |
2003 Compound Rate of Return: | 10.90% | |
2002 Compound Rate of Return: | 25.28% | |
2001 Compound Rate of Return: | -3.76% |
Worst Monthly Percentage Draw-down is the largest monthly loss experienced by the portfolio during the period presented in any calendar month expressed as a percentage of the total equity in the portfolio and includes the month and year of such draw-down. A small number of accounts in the portfolio composite have experienced monthly draw-downs that are materially larger than the largest composite monthly draw-down. These variances result from such factors as small account size (i.e., accounts with net assets of less than the prescribed portfolio minimum, which therefore trade fewer contracts than the standard portfolio), intra-month account opening or closing, significant intra-month additions or withdrawals, trading commissions in excess of the stated average, and investment restrictions imposed by the client.
Worst Peak-to-Valley Draw-down is the largest cumulative loss experienced by the portfolio during the period presented in any consecutive monthly period on a compounded basis and includes the time frame of such draw-down. A small number of accounts in the portfolio composite have experienced peak-to-valley draw-downs that are materially larger than the largest composite peak-to-valley draw-down. These variances result from such factors as small account size (i.e., accounts with net assets of less than the prescribed portfolio minimum, which therefore trade fewer contracts than the standard portfolio), intra-month account opening or closing, significant intra-month additions or withdrawals, trading commissions in excess of the stated average, and investment restrictions imposed by the client.
*For the period January 2001 to April 2004, performance has been calculated using the Fully-Funded Subset method in accordance with CFTC guidelines. Performance since May 2004 has been calculated using the Only Accounts Traded (OAT) method. See discussion of these methods in the Notes following this performance presentation.
Campbell/Graham App. - 16
Table of Contents
The following summary performance information presents the composite performance results of the Global Diversified Large Portfolio for the period from January 2001 through November 2006.
PAST PERFORMANCE IS NOT NECESSARILY INDICATIVE OF FUTURE RESULTS.
Name of CTA: | Campbell & Company, Inc. | |
Name of Portfolio: | Global Diversified Large Portfolio | |
Inception of Trading by CTA: | January 1972 | |
Inception of Trading of the Portfolio: | February 1986 | |
Number of Accounts Open: | 2 | |
Total Assets Managed by CTA: | $11.310 billion estimate | |
Total Assets Traded According to the Program: | $ 1.124 billion estimate | |
Worst Monthly Percentage Draw-down: | -9.95% (November 2001) | |
Worst Peak-to-Valley Draw-down: | -14.59% (October 2001 – April 2002) | |
Number of Profitable Accounts That Have Opened and Closed: | 2 | |
Range of Returns Experienced by Profitable Accounts: | 12.46% - 43.66% | |
Number of Unprofitable Accounts That Have Opened and Closed: | 0 | |
Range of Returns Experienced by Unprofitable Accounts: | N/A | |
2006 Compound Rate of Return (11 months): | -1.44% | |
2005 Compound Rate of Return: | 11.87% | |
2004 Compound Rate of Return: | 8.63% | |
2003 Compound Rate of Return: | 18.81% | |
2002 Compound Rate of Return: | 14.98% | |
2001 Compound Rate of Return: | 5.89% |
Worst Monthly Percentage Draw-down is the largest monthly loss experienced by the portfolio during the period presented in any calendar month expressed as a percentage of the total equity in the portfolio and includes the month and year of such draw-down. A small number of accounts in the portfolio composite have experienced monthly draw-downs that are materially larger than the largest composite monthly draw-down. These variances result from such factors as small account size (i.e., accounts with net assets of less than the prescribed portfolio minimum, which therefore trade fewer contracts than the standard portfolio), intra-month account opening or closing, significant intra-month additions or withdrawals, trading commissions in excess of the stated average, and investment restrictions imposed by the client.
Worst Peak-to-Valley Draw-down is the largest cumulative loss experienced by the portfolio during the period presented in any consecutive monthly period on a compounded basis and includes the time frame of such draw-down. A small number of accounts in the portfolio composite have experienced peak-to-valley draw-downs that are materially larger than the largest composite peak-to-valley draw-down. These variances result from such factors as small account size (i.e., accounts with net assets of less than the prescribed portfolio minimum, which therefore trade fewer contracts than the standard portfolio), intra-month account opening or closing, significant intra-month additions or withdrawals, trading commissions in excess of the stated average, and investment restrictions imposed by the client.
Campbell/Graham App. - 17
Table of Contents
The following summary performance information presents the composite performance results of the Global Diversified Small Portfolio for the period from January 2001 through the month such portfolio closed. The portfolio closed September 2003.
PAST PERFORMANCE IS NOT NECESSARILY INDICATIVE OF FUTURE RESULTS.
— This Portfolio is Closed —
Name of CTA: | Campbell & Company, Inc. | |
Name of Portfolio: | Global Diversified Small Portfolio | |
Inception of Trading by CTA: | January 1972 | |
Inception of Trading of the Portfolio: | June 1997 | |
Number of Accounts Open: | 0 | |
Total Assets Managed by CTA: | $11.310 billion estimate | |
Total Assets Traded According to the Program: | $0 | |
Worst Monthly Percentage Draw-down: | -12.47% (November 2001) | |
Worst Peak-to-Valley Draw-down: | -17.60% (October 2001 – April 2002) | |
2006 Compound Rate of Return: | N/A | |
2005 Compound Rate of Return: | N/A | |
2004 Compound Rate of Return: | N/A | |
2003 Compound Rate of Return (9 months): | 3.91% | |
2002 Compound Rate of Return: | 22.73% | |
2001 Compound Rate of Return: | -1.16% |
Worst Monthly Percentage Draw-down is the largest monthly loss experienced by the portfolio during the period presented in any calendar month expressed as a percentage of the total equity in the portfolio and includes the month and year of such draw-down. A small number of accounts in the portfolio composite have experienced monthly draw-downs that are materially larger than the largest composite monthly draw-down. These variances result from such factors as small account size (i.e., accounts with net assets of less than the prescribed portfolio minimum, which therefore trade fewer contracts than the standard portfolio), intra-month account opening or closing, significant intra-month additions or withdrawals, trading commissions in excess of the stated average, and investment restrictions imposed by the client.
Worst Peak-to-Valley Draw-down is the largest cumulative loss experienced by the portfolio during the period presented in any consecutive monthly period on a compounded basis and includes the time frame of such draw-down. A small number of accounts in the portfolio composite have experienced peak-to-valley draw-downs that are materially larger than the largest composite peak-to-valley draw-down. These variances result from such factors as small account size (i.e., accounts with net assets of less than the prescribed portfolio minimum, which therefore trade fewer contracts than the standard portfolio), intra-month account opening or closing, significant intra-month additions or withdrawals, trading commissions in excess of the stated average, and investment restrictions imposed by the client.
*Performance has been calculated using the Fully-Funded Subset method in accordance with CFTC guidelines. See discussion of this method in the Notes following this performance presentation.
Campbell/Graham App. - 18
Table of Contents
The following summary performance information presents the composite performance results of the Foreign Exchange Portfolio for the period from January 2001 through the month such portfolio closed. The portfolio closed July 2005.
PAST PERFORMANCE IS NOT NECESSARILY INDICATIVE OF FUTURE RESULTS.
— This Portfolio is Closed —
Name of CTA: | Campbell & Company, Inc. | |
Name of Portfolio: | Foreign Exchange Portfolio | |
Inception of Trading by CTA: | January 1972 | |
Inception of Trading of the Portfolio: | November 1990 | |
Number of Accounts Open: | 0 | |
Total Assets Managed by CTA: | $11.310 billion estimate | |
Total Assets Traded According to the Program: | $0 | |
Worst Monthly Percentage Draw-down: | -6.71% (July 2003) | |
Worst Peak-to-Valley Draw-down: | -20.20% (February 2004 – March 2005) | |
2006 Compound Rate of Return: | N/A | |
2005 Compound Rate of Return (7 months): | 9.18% | |
2004 Compound Rate of Return: | -6.90% | |
2003 Compound Rate of Return: | 38.81% | |
2002 Compound Rate of Return: | 10.76% | |
2001 Compound Rate of Return: | 15.92% |
Worst Monthly Percentage Draw-down is the largest monthly loss experienced by the portfolio during the period presented in any calendar month expressed as a percentage of the total equity in the portfolio and includes the month and year of such draw-down. A small number of accounts in the portfolio composite have experienced monthly draw-downs that are materially larger than the largest composite monthly draw-down. These variances result from such factors as small account size (i.e., accounts with net assets of less than the prescribed portfolio minimum, which therefore trade fewer contracts than the standard portfolio), intra-month account opening or closing, significant intra-month additions or withdrawals, trading commissions in excess of the stated average, and investment restrictions imposed by the client.
Worst Peak-to-Valley Draw-down is the largest cumulative loss experienced by the portfolio during the period presented in any consecutive monthly period on a compounded basis and includes the time frame of such draw-down. A small number of accounts in the portfolio composite have experienced peak-to-valley draw-downs that are materially larger than the largest composite peak-to-valley draw-down. These variances result from such factors as small account size (i.e., accounts with net assets of less than the prescribed portfolio minimum, which therefore trade fewer contracts than the standard portfolio), intra-month account opening or closing, significant intra-month additions or withdrawals, trading commissions in excess of the stated average, and investment restrictions imposed by the client.
*Performance through March 2002 was calculated using the Fully-Funded Subset method in accordance with CFTC guidelines. Performance since April 2002 has been calculated using the Only Accounts Traded (OAT) method. See the discussion of these methods in the notes following this performance presentation.
Note: From April 2002 through February 2003 and from April 2005 through July 2005, the Foreign Exchange Portfolio performance results reflect the performance of only one notionally funded account with client-imposed portfolio restrictions, and therefore does not necessarily reflect the results that may have occurred without these restrictions.
Campbell/Graham App. - 19
Table of Contents
The following summary performance information presents the composite performance results of the Interest Rates, Stock Indices & Commodities Portfolio for the period from January 2001 through the month such portfolio closed. The portfolio closed March 2002.
PAST PERFORMANCE IS NOT NECESSARILY INDICATIVE OF FUTURE RESULTS.
— This Portfolio is Closed —
Name of CTA: | Campbell & Company, Inc. | |
Name of Portfolio: | Interest Rates, Stock Indices & Commodities Portfolio | |
Inception of Trading by CTA: | January 1972 | |
Inception of Trading of the Portfolio: | February 1996 | |
Number of Accounts Open: | 0 | |
Total Assets Managed by CTA: | $11.310 billion estimate | |
Total Assets Traded According to the Program: | $0 | |
Worst Monthly Percentage Draw-down: | -16.13% (November 2001) | |
Worst Peak-to-Valley Draw-down: | -21.16% (October 2001 – February 2002) | |
2006 Compound Rate of Return: | N/A | |
2005 Compound Rate of Return: | N/A | |
2004 Compound Rate of Return: | N/A | |
2003 Compound Rate of Return: | N/A | |
2002 Compound Rate of Return (3 months): | 0.48% | |
2001 Compound Rate of Return: | -0.71% |
Worst Monthly Percentage Draw-down is the largest monthly loss experienced by the portfolio during the period presented in any calendar month expressed as a percentage of the total equity in the portfolio and includes the month and year of such draw-down. A small number of accounts in the portfolio composite have experienced monthly draw-downs that are materially larger than the largest composite monthly draw-down. These variances result from such factors as small account size (i.e., accounts with net assets of less than the prescribed portfolio minimum, which therefore trade fewer contracts than the standard portfolio), intra-month account opening or closing, significant intra-month additions or withdrawals, trading commissions in excess of the stated average, and investment restrictions imposed by the client.
Worst Peak-to-Valley Draw-down is the largest cumulative loss experienced by the portfolio during the period presented in any consecutive monthly period on a compounded basis and includes the time frame of such draw-down. A small number of accounts in the portfolio composite have experienced peak-to-valley draw-downs that are materially larger than the largest composite peak-to-valley draw-down. These variances result from such factors as small account size (i.e., accounts with net assets of less than the prescribed portfolio minimum, which therefore trade fewer contracts than the standard portfolio), intra-month account opening or closing, significant intra-month additions or withdrawals, trading commissions in excess of the stated average, and investment restrictions imposed by the client.
Campbell/Graham App. - 20
Table of Contents
The following summary performance information presents the composite performance results of the Ark Portfolio for the period from January 2001 through the month such portfolio closed. The portfolio closed August 2004.
PAST PERFORMANCE IS NOT NECESSARILY INDICATIVE OF FUTURE RESULTS.
— This Portfolio is Closed —
Name of CTA: | Campbell & Company, Inc. | |
Name of Portfolio: | Ark Portfolio | |
Inception of Trading by CTA: | January 1972 | |
Inception of Trading of the Portfolio: | September 1996 | |
Number of Accounts Open: | 0 | |
Total Assets Managed by CTA: | $11.310 billion estimate | |
Total Assets Traded According to the Program: | $0 | |
Worst Monthly Percentage Draw-down: | -11.69% (November 2001) | |
Worst Peak-to-Valley Draw-down: | -21.62% (October 2001 – April 2002) | |
2006 Compound Rate of Return: | N/A | |
2005 Compound Rate of Return: | N/A | |
2004 Compound Rate of Return (8 months): | -6.96% | |
2003 Compound Rate of Return: | 7.88% | |
2002 Compound Rate of Return: | 39.95% | |
2001 Compound Rate of Return: | -4.35% |
Worst Monthly Percentage Draw-down is the largest monthly loss experienced by the portfolio during the period presented in any calendar month expressed as a percentage of the total equity in the portfolio and includes the month and year of such draw-down. A small number of accounts in the portfolio composite have experienced monthly draw-downs that are materially larger than the largest composite monthly draw-down. These variances result from such factors as small account size (i.e., accounts with net assets of less than the prescribed portfolio minimum, which therefore trade fewer contracts than the standard portfolio), intra-month account opening or closing, significant intra-month additions or withdrawals, trading commissions in excess of the stated average, and investment restrictions imposed by the client.
Worst Peak-to-Valley Draw-down is the largest cumulative loss experienced by the portfolio during the period presented in any consecutive monthly period on a compounded basis and includes the time frame of such draw-down. A small number of accounts in the portfolio composite have experienced peak-to-valley draw-downs that are materially larger than the largest composite peak-to-valley draw-down. These variances result from such factors as small account size (i.e., accounts with net assets of less than the prescribed portfolio minimum, which therefore trade fewer contracts than the standard portfolio), intra-month account opening or closing, significant intra-month additions or withdrawals, trading commissions in excess of the stated average, and investment restrictions imposed by the client.
*For the period January 2001 to April 2004, performance has been calculated using the Fully-Funded Subset method in accordance with CFTC guidelines. Performance since May 2004 has been calculated using the Only Accounts Traded (OAT) method. See discussion of these methods in the Notes following this performance presentation.
Campbell/Graham App. - 21
Table of Contents
The following summary performance information presents the composite performance results of the Multi-Strategy Portfolio (Futures and Currencies Portion) for the period from January 2001 through the month such portfolio closed. The portfolio closed December 2005.
PAST PERFORMANCE IS NOT NECESSARILY INDICATIVE OF FUTURE RESULTS.
— This Portfolio is Closed. —
Name of CTA: | Campbell & Company, Inc. | |
Name of Portfolio: | Multi-Strategy Portfolio | |
Inception of Trading by CTA: | January 1972 | |
Inception of Trading of the Portfolio: | February 2005 | |
Number of Accounts Open: | 0 | |
Total Assets Managed by CTA: | $11.310 billion | |
Total Assets Traded According to the Program: | $0 | |
Worst Monthly Percentage Draw-down: | -3.86% (August 2005) | |
Worst Peak-to-Valley Draw-down: | -3.86% (July 2005 – August 2005) | |
2006 Compound Rate of Return (2 months): | N/A | |
2005 Compound Rate of Return: | 19.22% | |
2004 Compound Rate of Return: | N/A | |
2003 Compound Rate of Return: | N/A | |
2002 Compound Rate of Return: | N/A | |
2001 Compound Rate of Return: | N/A |
Worst Monthly Percentage Draw-down is the largest monthly loss experienced by the portfolio during the period presented in any calendar month expressed as a percentage of the total equity in the portfolio and includes the month and year of such draw-down. A small number of accounts in the portfolio composite have experienced monthly draw-downs that are materially larger than the largest composite monthly draw-down. These variances result from such factors as small account size (i.e., accounts with net assets of less than the prescribed portfolio minimum, which therefore trade fewer contracts than the standard portfolio), intra-month account opening or closing, significant intra-month additions or withdrawals, trading commissions in excess of the stated average, and investment restrictions imposed by the client.
Worst Peak-to-Valley Draw-down is the largest cumulative loss experienced by the portfolio during the period presented in any consecutive monthly period on a compounded basis and includes the time frame of such draw-down. A small number of accounts in the portfolio composite have experienced peak-to-valley draw-downs that are materially larger than the largest composite peak-to-valley draw-down. These variances result from such factors as small account size (i.e., accounts with net assets of less than the prescribed portfolio minimum, which therefore trade fewer contracts than the standard portfolio), intra-month account opening or closing, significant intra-month additions or withdrawals, trading commissions in excess of the stated average, and investment restrictions imposed by the client.
Campbell/Graham App. - 22
Table of Contents
NOTE TO TABLES:
Except as noted on the tables, the “Rate of Return” for a period for all tables is calculated by dividing the net profit or loss by the assets at the beginning of such period. Additions and withdrawals occurring during the period are included as an addition to or deduction from beginning net assets in the calculations of rates of return, except for accounts that close on the last day of a period, in which case the withdrawal is not subtracted from beginning net assets for purposes of this calculation. The rate of return is calculated using the Only Accounts Traded (OAT) method of computation. This computation method is one of the methods approved by the CFTC to reduce the distortion caused by significant additions or withdrawals of capital during a month. The OAT method excludes from the calculation of rate of return those accounts which had material intra-month additions or withdrawals and accounts which were open for only part of the month. In this way, the composite rate of return is based on only those accounts whose rate of return is not distorted through intra-month capital changes.
Where noted, Campbell adopted a method of computing rate of return and performance disclosure, referred to as the “Fully-Funded Subset” method, pursuant to an advisory published by the CFTC. The “Rate of Return” is calculated by dividing the net performance of the Fully-Funded Subset (the accounts trading no notional equity) by the beginning net assets of the Fully-Funded Subset (including additions and excluding withdrawals during the month), except in periods of significant additions or withdrawals to the accounts in the Fully-Funded Subset. In such instances, the Fully-Funded Subset is adjusted to exclude accounts with significant additions or withdrawals that would materially distort the rate of return pursuant to the Fully-Funded Subset method.
Campbell/Graham App. - 23
Table of Contents
TO PART I OF THE
PROSPECTUS
OF
THE FRONTIER FUND
(A statutory trust formed under the laws of Delaware)
CURRENCY SERIES-1 UNITS
CURRENCY SERIES-2 UNITS
Commodity Trading Advisors:
C-View International Limited
FX Concepts, Inc.
GAIN Capital Asset Management LLC
This Currency Series Appendix (the “Currency Series Appendix”) is dated February 12, 2007.
Table of Contents
THE FRONTIER FUND
CURRENCY SERIES-1 UNITS
CURRENCY SERIES-2 UNITS
This Currency Series Appendix to the prospectus, dated February 12, 2007, including all exhibits thereto as the same may be amended and supplemented from time to time, or the Prospectus, of The Frontier Fund, a statutory trust formed under the laws of the state of Delaware, or the Trust, relates to the units of beneficial interest in the Trust, or the Units, designated as Currency Series Units. Capitalized terms used in this Currency Series Appendix and not otherwise expressly defined herein shall have the same respective meanings as set forth in the Prospectus. This Currency Series Appendix must be accompanied by, and read in conjunction with, the Prospectus.
The Currency Series Units are being offered in two (2) Classes. The Currency Series Units in Class 1 (as described in the Prospectus) are designated as the “Currency Series-1 Units,” and the Currency Series Units in Class 2 (as described in the Prospectus) are designated as the “Currency Series-2 Units.” The Trust is offering both the Currency Series-1 Units and the Currency Series-2 Units pursuant to the Prospectus and this Currency Series Appendix. Prospective Purchasers of the Currency Series-1 Units and Currency Series-2 Units should carefully review the Prospectus and this Currency Series Appendix before determining to purchase such Units.
The Currency Series was originally a single-advisor Series designated as the “C-View Currency Series.” As the Series is now directed by multiple Trading Advisors, its name was changed to the “Currency Series.”
TRADING ADVISORS
The current Trading Advisors with respect to the assets allocable to the Currency Series Units are C-View International Limited (formerly Phoenix Services International Limited), a British Virgin Island company, or C-View, FX Concepts, Inc., or FX Concepts, a New York corporation, and GAIN Capital Asset Management LLC, or Gain, a Delaware limited liability company. The assets allocable to the Currency Series Units will be contributed to a Trading Company for which these entities will act as Trading Advisors pursuant to their respective trading programs.
FX Concepts and Gain trade only in over-the-counter foreign currencies and therefore are not, and are not required to be, registered with the CFTC as commodity trading advisors or members of the NFA. In preparing the descriptions of FX Concepts and Gain in this Currency Series Appendix, the Managing Owner has relied upon information provided to it by such Trading Advisors. The information received from each of FX Concepts and Gain may not be identical to the information provided by the other CFTC-registered commodity trading advisors which act as Trading Advisors to the Series of The Frontier Fund. Furthermore, the CFTC has not verified or approved the information provided by such Trading Advisors.
Currency App. - 2
Table of Contents
CURRENCY SERIES UNITS
MANAGEMENT AND INCENTIVE FEES
Management Fees
The Currency Series Units will pay to the Managing Owner a monthly management fee equal to 1/12th of 2.00% of the Currency Series’ Net Asset Value (approximately 2.00% annually). The Managing Owner will pay a portion of such management fees to the Trading Advisors.
Incentive Fees
The Currency Series Units will pay to the Managing Owner a monthly or quarterly incentive fee of 20.00% of New High Net Trading Profits generated by each Trading Advisor, including realized and unrealized gains and losses thereon, as of the close of business on the last day of each calendar month or quarter. The fee will accrue monthly if paid quarterly. The Managing Owner will pay a portion of such incentive fees to the appropriate Trading Advisors. See “RISK FACTORS—Each Series pays substantial fees and expenses regardless of profitability.”
Initial Allocations
In general, the Managing Owner anticipates allocations to the Trading Advisors in the Currency Series to vary between ten percent (10%) and fifty percent (50%). The actual allocation of the Currency Series’ assets will vary based upon the trading performance of the Trading Advisors and the Managing Owner’s asset allocation activities.
The list below sets forth a sample of certain currencies the Trading Advisors allocated assets from the Currency Series may trade on behalf of client accounts. Not all markets are part of each program. Each Trading Advisor reserves the right to expand or contract the markets and instruments it trades without giving prior notice.
Sample
Currencies Traded
Major Currencies
Australia (AUD)
Canada (CAN)
Euro (EUR)
Japan (JPY)
Switzerland (CHF)
United Kingdom (GBP)
Minor Currencies
Argentina (ARG)
Brazil (BRA)
China (CNY)
Czech Rep (CZK)
Denmark (DKR)
Greece (GRD)
Hong Kong (HKD)
Hungary (HUF)
India (INR)
Indonesia (IDR)
Israeli Pound (ILS)
Currency App. - 3
Table of Contents
Mexican (MXP)
New Zealand (NZD)
Norway (NOK)
Philippines (PHP)
Poland (PLZ)
Russian Rouble (RUB)
Saudi Arabia (SAR)
Singapore (SGD)
South Africa (ZAR)
South Korea (KRW)
Sweden (SEK)
Taiwan (TWD)
Thailand (THB)
Turkey (TRL)
Diversification Summary
The Frontier Fund—THE CURRENCY SERIES
In general, the Managing Owner has allocated certain amounts of the Currency Series to the various Trading Advisors. As stated previously, the allocation to each Trading Advisor designated as a “major trading advisor” will vary between ten percent (10%) and fifty percent (50%). The ongoing actual allocation of the Currency Series’ assets will vary based upon the trading performance of the Trading Advisors and the Managing Owner’s asset allocation activities. As of November 30, 2006, it is estimated that each of the Trading Advisors for the Currency Series will invest 100% of the assets of the Currency Series allocated to it in the Currencies market sector.
Currency App. - 4
Table of Contents
CURRENCY SERIES UNITS
PROJECTED TWELVE MONTH BREAK EVEN ANALYSIS
The table below shows the estimated amount of all fees and expenses which are anticipated to be incurred by a new investor in the Currency Series-1 Units and Currency Series-2 Units during the first twelve months. The total estimated cost and expense load of Currency Series-1 Units and Currency Series-2 Units is expressed as a percentage of $1,000, the amount of a minimum investment in the Trust (other than by Plans (including IRAs), employees or family members of an employee of the Managing Owner or its affiliates or charitable organizations). Residents of Texas have a minimum initial subscription requirement of $5,000, or, residents of Texas who are Plans (including IRAs), an employee or family member of an employee of the Managing Owner or its affiliates or a charitable organization, have a minimum initial subscription requirement of $1,000. Although the Managing Owner has used actual numbers and good faith estimates in preparing this table, the actual expenses associated with an investment in the Currency Series Units may differ.
| Currency Series-1 | Currency Series-2 | |||||||||||||
| Amount—$ | Amount—% | Amount—$ | Amount—% | |||||||||||
Initial Selling Price(1) | $ | 1,000 | 100 | % | $ | 1,000 | 100 | % | ||||||
Syndication and Selling Expenses(2) | $ | 0 | 0 | % | $ | 0 | 0 | % | ||||||
Trust Operating Expenses(3) | $ | 0 | 0 | % | $ | 0 | 0 | % | ||||||
Management Fee(4) | $ | 20.00 | 2.00 | % | $ | 20.00 | 2.00 | % | ||||||
Service Fee(5) | $ | 30.00 | 3.00 | % | $ | 0 | 0 | % | ||||||
Brokerage Commissions and Trading Fees(6) | $ | 7.50 | 0.75 | % | $ | 7.50 | 0.75 | % | ||||||
Incentive Fee(7) | $ | 0 | 0 | % | $ | 0 | 0 | % | ||||||
Less Interest Income(8) | $ | (29.00 | ) | (2.90 | )% | $ | (29.00 | ) | (2.90 | )% | ||||
Amount of Trading Income Required for the Trust’s Net Asset Value per Unit (Redemption Value) at the End of One Year to Equal the Selling Price per Unit | $ | 28.50 | 2.85 | % | $ | (1.50 | ) | (0.15 | )% | |||||
Notes
| (1) | The initial selling price per Unit is $100. The amount reflected in the table represents the amount of minimum investment in the Trust (other than Plans (including IRAs), employees or family members of an employee of the Managing Owner or its affiliates or charitable organizations) because the total costs and expenses as set forth in the break-even analysis are the costs and expenses associated with a minimum investment of $1,000. |
| (2) | Expenses incurred in connection with the organization of the Trust and the offering of Units during the Initial Offering Period were paid by the Managing Owner without reimbursement. |
| (3) | The Managing Owner pays for all accounting, auditing, legal and routine operational and administrative expenses without reimbursement. |
| (4) | The Managing Owner will receive a monthly management fee of approximately 0.167% (2.00% annually) of the Currency Series’ Net Asset Value, which it will use to pay all management fees payable to the Trading Advisors. |
| (5) | With respect to Class 1 of the Currency Series of Units, as compensation, the Selling Agents will receive an initial service fee at an annual rate of up to 3.0% of the subscription amount of each subscription for Units in Class 1 of the Currency Series sold by them. The initial service fee will be prepaid by the Managing Owner. If you redeem all or a portion of your Units in Class 1 of the Currency Series during the first 12 months following the effective date of their purchase, you will be subject to a redemption fee of up to 3.0% of the Net Asset Value at which they are redeemed. The amount of the redemption fee associated with each |
Currency App. - 5
Table of Contents
Series at any moment equals the amount of unamortized initial service fee prepaid by the Managing Owner for such Series, and as such the aggregate amount of the redemption fee and the initial service fee cannot exceed 3.0%. Therefore the break-even analysis does not include a separate entry for the redemption fee. |
| (6) | The Trust, with respect to the Currency Series will pay the Clearing Brokers and the Managing Owner a fee of approximately 0.75% of the Currency Series’ Net Asset Value annually, which will be used to pay all brokerage commissions, plus applicable exchange fees, NFA fees, give up fees and other transaction related fees and expenses charged in connection with the Series’ trading activities and on-going service fees for certain administrative services payable to certain Selling Agents selling Class 2 Units of the Currency Series. |
| (7) | A portion of the 3% initial service fee and on-going service fee is not deductible on the incentive fee calculation; however, the Class 1 is not required to make trading profits and to pay a corresponding incentive fee on such trading profits to break even. |
| (8) | Interest income for the Currency Series-1 Units and the Currency Series-2 Units is currently estimated at 4.90%. The first 2.0% of interest income earned per annum by the Trust on the Currency Series will be paid to the Managing Owner. In addition, if interest income falls below 0.75%, the Managing Owner will be paid the difference between the Trust’s annualized interest income and 0.75%. Interest income above 2.0% is retained by the Trust. |
Currency App. - 6
Table of Contents
PAST PERFORMANCE OF CURRENCY SERIES CLASS 1
The Capsule Performance Table which follows sets forth the actual past performance of the Currency Series Class 1 during the period covered by the table.PAST PERFORMANCE IS NOT NECESSARILY INDICATIVE OF FUTURE RESULTS.
| Month | 2006 | 2005 | 2004 | |||
January | 0.71% | -0.42% | ||||
February | 0.14% | 0.67% | ||||
March | -0.27% | -1.12% | ||||
April | 0.01% | -1.16% | ||||
May | -2.05% | 0.47% | ||||
June | 0.76% | 0.43% | ||||
July | -0.59% | 0.30% | ||||
August | 2.03% | -0.30% | ||||
September | -1.51% | -0.93% | -0.04% | |||
October | -0.13% | -3.11% | 2.06% | |||
November | 2.49% | -0.61% | 0.23% | |||
December | 0.87% | 0.41% | ||||
Year | 1.51% | -4.87% | 2.67% |
Name of pool: | The Frontier Fund | |
This pool is a multi-advisor advisor pool as defined in CFTC Regulation Section 4.10(d)(2). | ||
Name of Series: | Currency Series Class 1 | |
Inception of Trading of Currency Series Class 1: | September 24, 2004 | |
Aggregate Gross Capital Subscriptions for Currency Series Class 1 as of November 30, 2006: | $6,546,931.59 | |
Net Asset Value of Currency Series Class 1 as of November 30, 2006: | $6,473,434.65 | |
Worst Monthly Percentage Draw-down: | -3.11% (October 2005) | |
Worst peak-to-valley Draw-down: | -6.50% (February 2005 through May 2006) | |
The Currency Series Class 1 performance table sets forth the actual performance of the Currency Series Class 1. The Currency Series was originally a single-advisor Series designated as the “C-View Currency Series.” The past performance information presented in the composite performance table from inception through February 1, 2006, represents the past performance of the Currency Series Class 1 under C-View as the single advisor. Actual gross trading performance (gross realized and unrealized gain/loss before deduction for trading commissions and fees, management fees, any other expenses, and before addition of interest income) is adjusted for the trading expenses, management fees, initial service fees, on-going service fees, and interest income of the Currency Series Class 1 of The Frontier Fund. These items, as an annualized percentage calculated monthly on the adjusted beginning of month net asset value are:
| • | Brokerage commissions and trading fees: 0.75% |
| • | Management fees: 2.0% |
| • | Initial service fees and on-going service fees: 3.0% |
An incentive fee of 20% of New High Net Trading Profits (as defined), earned quarterly, is calculated in the composite performance table. Also, any interest income in excess of an annualized rate of 2%, based upon applying the 90-day Treasury Bill rate for each month to the adjusted beginning of month net asset value, is credited in the composite past performance table.
| * | Draw-down means losses experienced by the pool over a specified period. |
| ** | Worst peak to valley draw-down means the greatest cumulative percentage decline in month-end net asset value due to losses sustained by the pool during any period in which the initial month-end net asset value is not equaled or exceeded by a subsequent month-end net asset value. |
Currency App. - 7
Table of Contents
PAST PERFORMANCE OF CURRENCY SERIES CLASS 2
The Capsule Performance Table which follows sets forth the actual past performance of the Currency Series Class 2 during the period covered by the table.PAST PERFORMANCE IS NOT NECESSARILY INDICATIVE OF FUTURE RESULTS.
| Month | 2006 | 2005 | 2004 | |||
January | 0.97% | -0.17% | ||||
February | 0.37% | 0.91% | ||||
March | -0.01% | -0.87% | ||||
April | 0.24% | -0.93% | ||||
May | -1.79% | 0.73% | ||||
June | 1.01% | 0.68% | ||||
July | -0.34% | 0.55% | ||||
August | 2.29% | -0.05% | ||||
September | -1.29% | -0.69% | -0.01% | |||
October | 0.14% | -2.86% | 2.30% | |||
November | 2.75% | -0.36% | 0.49% | |||
December | 1.12% | 0.67% | ||||
Year | 4.33% | -1.99% | 3.47% |
Name of pool: | The Frontier Fund | |
This pool is a multi-advisor advisor pool as defined in CFTC Regulation Section 4.10(d)(2). | ||
Name of Series: | Currency Series Class 2 | |
Inception of Trading of Currency Series Class 2: | September 24, 2004 | |
Aggregate Gross Capital Subscriptions for Currency Series Class 2 as of November 30, 2006: | $357,000.01 | |
Net Asset Value of Currency Series Class 2 as of November 30, 2006: | $457,839.18 | |
Worst Monthly Percentage Draw-down: | -2.86% (October 2005) | |
Worst peak-to-valley Draw-down: | -3.93% (July 2005 through November 2005) | |
The Currency Series Class 2 performance table sets forth the actual performance of the Currency Series Class 2. The Currency Series was originally a single-advisor Series designated as the “C-View Currency Series.” The past performance information presented in the composite performance table from inception through February 1, 2006, represents the past performance of the Currency Series Class 2 under C-View as the single advisor. Actual gross trading performance (gross realized and unrealized gain/loss before deduction for trading commissions and fees, management fees, any other expenses, and before addition of interest income) is adjusted for the trading expenses, management fees, initial service fees, on-going service fees, and interest income of the Currency Series Class 2 of The Frontier Fund. These items, as an annualized percentage calculated monthly on the adjusted beginning of month net asset value are:
| • | Brokerage commissions and trading fees: 0.75% |
| • | Management fees: 2.0% |
An incentive fee of 20% of New High Net Trading Profits (as defined), earned quarterly, is calculated in the composite performance table. Also, any interest income in excess of an annualized rate of 2%, based upon applying the 90-day Treasury Bill rate for each month to the adjusted beginning of month net asset value, is credited in the composite past performance table.
| * | Draw-down means losses experienced by the pool over a specified period. |
| ** | Worst peak to valley draw-down means the greatest cumulative percentage decline in month-end net asset value due to losses sustained by the pool during any period in which the initial month-end net asset value is not equaled or exceeded by a subsequent month-end net asset value. |
Currency App. - 8
Table of Contents
C-VIEW
Background of C-View
C-View was incorporated in the British Virgin Islands on September 12, 1997. C-View has been a member of the NFA and has been registered with the CFTC as a CTA since April 9, 1998. It has also been registered with the CFTC as a CPO since April 10, 2003. Its main business office is located at International Trust Building, Road Town, Tortola, British Virgin Islands. Such registration and membership do not imply that the CFTC or the NFA have endorsed C-View’s qualifications to provide the advisory services described herein. C-View currently offers a program which trades spot and forward foreign exchange in the interbank market, NDF’s (non deliverable forwards) and OTC currency options.
Principals of C-View
Alan Paul Chappell
Paul Chappell, born in 1954, is the Chief Executive Officer and Senior Trader at C-View and has been involved in the currency market since 1974. Originally employed as a manager at Hambros Bank in London, he became involved initially in foreign exchange marketing and subsequently went into trading. In 1978, he joined Chemical Bank in London as a trader and then assumed responsibility for FX Spot Trading activities. He was later promoted and transferred to Frankfurt as Foreign Exchange Manager.
In 1985 he was hired by Bank of America in London to develop the London Foreign Exchange Trading operations and later was given the responsibility of Head of Foreign Exchange Trading for Europe, Middle East and Africa. In 1994 he was given role of Global Product Manager for Foreign Exchange. In this position he co-ordinated the development, structure and customer service of 23 FX Trading operations in all the major global locations and was directly and indirectly responsible for a total of more than 450 FX operatives world-wide. He was also at the forefront of development of the Electronic Brokering System (“EBS”) in association with a number of other leading banks which today commands 35% of the total of all brokered interbank spot market FX deals.
In September 1996 Mr. Chappell left the banking Industry and set up C-View. C-View is regulated by the Securities and Futures Authority as an Investment Advisory Company.
Quinn Joseph Hebert
Mr. Herbert, born in 1963, is a director at C-View. He was a corporate associate at the law firm of Jones, Walker, Waechter, Poitevent, Carrere and Denegre law firm in New Orleans, Louisiana from 1988 to 1993. He handled general corporate advices and various mergers and acquisitions transactions including initial public offerings, debt offerings and various financial restructuring transactions. Thereafter he joined Ceanic Corporation (formerly American Oilfield Divers, Inc.), or Ceanic, in Houston, Texas., as a V.P. and General Counsel from 1993 to 1998. While at Ceanic, he was a member of a four person Executive Committee responsible for the strategic direction of company. Ceanic was acquired by Stolt Comex Seaway S.A., or SCS, in August 1998. From November 1998 to the present, Mr. Hebert served as the President and CEO for SCS’s North Americas Region, where he handles the traditional duties of President/CEO and is responsible for profit and loss of USD$200 million plus annual revenues, 1,000 plus full time employees and USD$175 million of operating assets.
Mr. Herbert received his B.A.,summa cum laude,from Louisiana State University in 1985 and a Juris Doctor from Boston College Law School in May 1988. While at Boston College Law School, he was the Executive Editor of the Boston College International and Comparative Law Review. Mr. Herbert is admitted to practice law in the State of Louisiana and is a member of American Bar Association and the American Corporate Counsel Association.
Currency App. - 9
Table of Contents
Jim Thomson
Mr. Thomson, a Principal of C-View, has joined C-View as an Investment Advisor from BankOne, where he was responsible for market making in Japanese Yen products. Prior to that he spent 10 years (1992-2002) at AIG Trading Corp, where he had two spells of managing the London Spot desk and proprietary trading, focusing on the provision of services to the diverse customer base and specialising in the risk and liquidity management of significant FX flows. From 1990 to 1992, he was employed by Security Pacific Bank, where he was recruited to build and run a sterling cross currency book. He started his City career at Midland Bank in 1986, after having qualified in Industry as a Chartered Management Accountant, joining Midland as a Financial Analyst, before transferring to the Treasury division to join a Treasury sales team, progressing from there to the Spot desk to trade spot FX.
Pinnacle Trust
Pinnacle Trust is a discretionary trust set up in March 1993 which is the beneficial owner of C-View. Pinnacle Trust has been registered as a Principal of C-View since January 2003.
Mr. Paul Chappell is primarily responsible for making trading decisions on behalf of C-View.
C-VIEW INVESTMENT STRATEGY AND TRADING PROGRAM
The C-View Currency Program (1x & 3x)’s approach is discretionary, based on a combination of fundamental analysis, technical analysis and market psychology. The intention is to capture profits from short to medium-term price trends while maintaining profitability in ranging markets.
The trading methods and strategies utilized by C-View are proprietary and confidential. As a result the following discussion is necessarily of a general nature and is not intended to be exhaustive. C-View reserves the right to alter any trading strategy or method without prior approval by or notice to its clients.
C-View aims to maximize returns through the active trading of foreign exchange in the interbank spot, forward and options markets. Profits are sought from fluctuations in exchange rates, and from the differentials in interest rates reflected in the value of currencies. The approach is discretionary, combining fundamental analysis, technical analysis and an understanding of market psychology. In addition, C-View accesses flow information from major dealing rooms to assist in determining market views.
C-View favors a portfolio approach that enables maximum profits to be generated within a disciplined, low-risk environment. This is accompanied by short term trading in the major currencies from both a portfolio hedging and an opportunistic perspective. C-View will carefully analyze the relative values of a wide range of currencies and construct a portfolio of positions when risk/return ratios appear to be above average. The positions are based on the potential for currencies to appreciate or depreciate. This approach may be supplemented by the running of positions for yield; from time to time there are sizeable differences in interest rates between currencies, but subdued or beneficial exchange rate movements. These positions are taken on an outright basis using forwards and NDF’s (non deliverable forwards) of up to three months. On occasion, C-View will undertake longer dated forwards and options.
Currency options are used sparingly for two purposes. Vanilla options are used to prolong a strategy that has reached its cash objective or to provide protection for a potentially volatile position. Both vanilla and second generation options are used to express a view within a framework of limited risk. Strategies are employed that provide pre-determined maximum profit and loss values and are used so that no option strategy undertaken has an unlimited downside.
C-View supplements the portfolio strategy with shorter term, opportunistic trading of the major currencies. This is not only when currencies are fluctuating within a pre-determined trading range, but may also be when a
Currency App. - 10
Table of Contents
particular short-term trend is identified. C-View may occasionally trade the minor currencies where range characteristics similar to the majors are identified, but this depends on the prevailing liquidity and spread of price.
Positions are usually exited when targets are achieved, the pre-set loss limit is reached, or the market behaves differently from expectations. C-View will sometimes take a contrarian approach, selling into extended rallies, buying in on sell-offs and taking advantage of opportunities when market information indicates overwhelming sentiment in a particular direction.
C-View will undertake exposure in any liquid, convertible currency and also those with spot convertibility and an NDF (non-deliverable forward) market. A series of modifiers are used to determine the maximum position taken in any one currency. The main modifiers applied in both spot and forward markets are those of liquidity, volatility and predictability. C-View will not, however, undertake all available positions at once or put on a sizeable exposure in the same day. The overall risk analysis for the total exposure is the ultimate constraint.
Irrespective of C-View’s overall opinion on a currency, positions are established or reduced primarily on a tactical basis.
There are obvious hedge currencies or relationships that are used alongside each currency. In addition, risk factors may be mitigated by having cross positions, some of which are predominantly for yield; this tends to lead to larger nominal positions. For example, a carry trade involving the holding of a currency against the components of its basket has different risk characteristics to USD/EUR, and may yield returns from the interest differential. In some instances the interest differential may be sufficiently large to offset the risk of anything but reasonably sizeable exchange rate movements, as for example in the case of the Hungarian Forint or the Polish Zloty.
Leverage is used to enhance total returns. The program allows a maximum leverage of 4 times the net assets, however, the actual amount of leverage will be dictated by the use of risk management technology detailed below. Typically, the program is leveraged less than this maximum.
C-View plans to continue the testing and reworking of its trading methodology and, therefore, retains the discretion to revise any method or strategy, including the technical or fundamental trading factors used, forex interests traded and/or the money management principles applied. Such revisions, unless deemed material, will not be made known to clients.
Risk Management Activities
In order to achieve the risk management process C-View maintains a comprehensive risk management facility in order to review daily the currency and currency option exposures which it holds. This facility utilizes what is becoming industry standard volatility analysis assessing value-at-risk, or VAR, or earnings-at-risk, or EAR. The delta values of currency options are incorporated into the process.
Currencies Traded
Major Currencies Australia (AUD) Canada (CAN), Eur (EUR) Japan (JPY) Switzerland (CHF) United Kingdom (GBP)
Minor Currencies Argentina (ARG) Brazil (BRA) China (CNY) Czech Rep (CZK) Denmark (DKR) Greece (GRD) Hong Kong (HKD) Hungary (HUF) India (INR) Indonesia (IDR) Mexican (MXP) New Zealand (NZD), Norway (NOK) Philippines (PHP) Poland (PLZ) Saudi Arabia (SAR) Singapore (SGD) South Africa (ZAR) South Korea (KRW) Sweden (SEK) Taiwan (TWD) Thailand (THB) Turkey (TRL)
Currency App. - 11
Table of Contents
PAST PERFORMANCE OF C-VIEW
The Capsule Performance Table which follows sets forth the actual past performance of all client accounts directed by C-View during the period covered by the table.PAST PERFORMANCE IS NOT NECESSARILY INDICATIVE OF FUTURE RESULTS.
C-View Limited 3X Program
| Month | 2006 | 2005 | 2004 | 2003 | 2002 | 2001 | ||||||||||||
January | 0.99 | % | -0.02 | % | 1.76 | % | -1.66 | % | 0.26 | % | 2.70 | % | ||||||
February | 1.00 | % | 1.22 | % | -0.35 | % | -0.71 | % | -1.93 | % | 1.41 | % | ||||||
March | 1.26 | % | -0.51 | % | 2.17 | % | 0.57 | % | 1.29 | % | -0.57 | % | ||||||
April | 2.47 | % | -0.87 | % | 0.13 | % | 0.72 | % | 0.89 | % | 1.17 | % | ||||||
May | -0.18 | % | 1.09 | % | 1.45 | % | 0.03 | % | 2.33 | % | 2.43 | % | ||||||
June | 0.92 | % | 0.71 | % | -0.54 | % | -1.44 | % | 1.32 | % | 2.55 | % | ||||||
July | 0.10 | % | 0.74 | % | 0.93 | % | 0.44 | % | 1.13 | % | 2.36 | % | ||||||
August | -0.76 | % | 0.39 | % | 0.53 | % | 0.68 | % | -0.18 | % | 1.96 | % | ||||||
September | -0.25 | % | 0.07 | % | -0.35 | % | 1.38 | % | 0.44 | % | 0.56 | % | ||||||
October | 0.37 | % | -1.88 | % | 2.50 | % | 0.12 | % | -0.09 | % | -1.99 | % | ||||||
November | 0.86 | % | -0.13 | 1.76 | % | 1.06 | % | 0.76 | % | 1.24 | % | |||||||
December | 1.78 | % | 0.35 | % | 1.27 | % | 0.14 | % | 0.98 | % | ||||||||
YEAR | 6.92 | % | 2.50 | % | 10.82 | % | 2.51 | % | 6.47 | % | 15.72 | % |
Name of CTA: | C-View International Limited | |
Name of Trading Program: | C-View Limited 3X Program | |
Inception of Trading: | Oct. 1996 | |
Inception of this Program: | Oct. 2000 | |
Current Total Assets under Management as of November 30, 2006: | $607.2 million | |
Current Total Assets in this Program as of November 30, 2006: | $583.6 million | |
Worst Monthly Draw-down: | -1.88% (October 2005) | |
Worst Peak-to-Valley Draw-down: | -2.66% (Feb 2005 to Apr 2005) | |
Number of Accounts Traded Pursuant to Program as of November 30, 2006: | 16 | |
Number Closed with Profit: | 0 | |
Number Closed with Loss: | 1 | |
Leverage Employed: | 1.3 (average) |
Rates of Return are calculated by dividing net performance for the period by beginning net asset value plus the time-weighted value additions and withdrawals for the period. The annual Rates of Return are shown on a compounded basis.
The Capsule Performance Table below was prepared based on notionally funded subset of accounts.
Draw-down means losses experienced by the account over a specified period.
Worst peak-to-valley draw-down means the greatest cumulative percentage decline in month-end net asset value due to losses sustained by the trading program during any period in which the initial month-end net asset value is not equaled or exceeded by a subsequent month-end net asset value.
Currency App. - 12
Table of Contents
PROGRAMS NOT UTILIZED
The following are programs of C-View that are not anticipated to be utilized by The Frontier Fund.
The following summary performance information presents the composite performance results of C-View Limited 1X Program for the period from January 2001 through November 2006.
PAST PERFORMANCE IS NOT NECESSARILY INDICATIVE OF FUTURE RESULTS.
Name of Trading Advisor: | C-View International Limited | |
Name of Program: | C-View Limited 1X Program | |
Inception of Client Account Trading by Trading Advisor: | Oct 1996 | |
Inception of Client Account Trading in Program: | Oct 1996 | |
Number of Open Accounts: | 3 | |
Aggregate Assets (excluding “notional” equity) Overall: | $219,100,000 | |
Aggregate Assets (including “notional” equity) Overall: | $607,200,000 | |
Aggregate Assets in Program: | $23,600,000 | |
Worst Monthly Draw-down: | -0.55% (October 2001) | |
Worst Peak-to-valley Draw-down: | -1.15% (Sept 2005 to Nov 2005) Number of Profitable Closed Accounts: 13 | |
Number of Unprofitable Closed Accounts: | 4 | |
Leverage Employed: | 1.3 (average) | |
2006 Compound Rate of Return (11 months): | 1.19% | |
2005 Compound Rate of Return: | 2.77% | |
2004 Compound Rate of Return: | 4.44% | |
2003 Compound Rate of Return: | 1.52% | |
2002 Compound Rate of Return: | 3.20% | |
2001 Compound Rate of Return: | 7.71% |
Draw-down means losses experienced by the account over a specified period.
Worst peak-to-valley draw-down means the greatest cumulative percentage decline in month-end net asset value due to losses sustained by the trading program during any period in which the initial month-end net asset value is not equaled or exceeded by a subsequent month-end net asset value.
Currency App. - 13
Table of Contents
The following summary performance information presents the composite performance results of C-View Limited 2X Program for the period from January 2001 through the month such program closed.
PAST PERFORMANCE IS NOT NECESSARILY INDICATIVE OF FUTURE RESULTS.
— This Program is Closed —
Name of Trading Advisor: | C-View International Limited | |
Name of Program: | C-View Limited 2X Program | |
Inception of Client Account Trading by Trading Advisor: | Oct 1996 | |
Inception of Client Account Trading in Program: | Oct 2000 | |
Number of Open Accounts: | 0 | |
Aggregate Assets (excluding “notional” equity) Overall: | $219,100,000 | |
Aggregate Assets (including “notional” equity) Overall: | $607,200,0000 | |
Aggregate Assets (excluding “notional” equity) in Program: | N/A | |
Aggregate Assets (including “notional” equity) in Program: | N/A | |
Worst Monthly Draw-down: | -2.05% (October 2001) | |
Worst Peak-to-valley Draw-down: | -2.60% (November 2002 to March 2003) | |
Number of Profitable Closed Accounts: | 8 | |
Number of Unprofitable Closed Accounts: | 4 | |
Leverage Employed: | 1.3 (average) | |
2006 Compound Rate of Return: | N/A | |
2005 Compound Rate of Return: | N/A | |
2004 Compound Rate of Return: | N/A | |
2003 compound rate of return: (11 months): | -2.76% | |
2002 compound rate of return: | 2.06% | |
2001 compound rate of return: | 4.32% |
Draw-down means losses experienced by the account over a specified period.
Worst peak-to-valley draw-down means the greatest cumulative percentage decline in month-end net asset value due to losses sustained by the trading program during any period in which the initial month-end net asset value is not equaled or exceeded by a subsequent month-end net asset value.
Currency App. - 14
Table of Contents
C-VIEW INTERNATIONAL MANAGED ACCOUNT
PAST PERFORMANCE IS NOT NECESSARILY INDICATIVE OF FUTURE RESULTS.
| Accounts | A | B | C | D | E | F | G | H | I | J | K | L | M | N | O | P | Q | R | S | T | ||||||||||||||||||||
| % | % | % | % | % | % | % | % | % | % | % | % | % | % | % | % | % | % | % | % | |||||||||||||||||||||
October 1999 | ||||||||||||||||||||||||||||||||||||||||
November 1999 | -0.07 | -0.13 | ||||||||||||||||||||||||||||||||||||||
December 1999 | 0.91 | 0.53 | ||||||||||||||||||||||||||||||||||||||
January 2000 | 0.86 | 0.68 | ||||||||||||||||||||||||||||||||||||||
February 2000 | 0.56 | 0.40 | ||||||||||||||||||||||||||||||||||||||
March 2000 | -0.31 | 0.03 | ||||||||||||||||||||||||||||||||||||||
April 2000 | -0.39 | 0.13 | ||||||||||||||||||||||||||||||||||||||
May 2000 | 0.09 | -0.67 | 0.12 | |||||||||||||||||||||||||||||||||||||
June 2000 | -0.23 | -1.00 | -0.05 | |||||||||||||||||||||||||||||||||||||
July 2000 | -0.05 | 0.18 | -1.05 | -0.12 | ||||||||||||||||||||||||||||||||||||
August 2000 | 0.29 | 0.28 | -1.01 | |||||||||||||||||||||||||||||||||||||
September 2000 | 0.30 | 0.39 | -0.80 | |||||||||||||||||||||||||||||||||||||
October 2000 | -0.21 | -0.19 | -1.22 | -0.68 | -1.72 | |||||||||||||||||||||||||||||||||||
November 2000 | 0.11 | 0.05 | 0.24 | 0.24 | -1.46 | |||||||||||||||||||||||||||||||||||
December 2000 | 0.07 | 0.21 | 0.03 | 0.13 | ||||||||||||||||||||||||||||||||||||
January 2001 | 0.18 | 0.64 | 0.52 | 0.43 | ||||||||||||||||||||||||||||||||||||
February 2001 | 0.08 | 0.30 | 0.34 | 0.24 | ||||||||||||||||||||||||||||||||||||
March 2001 | -0.04 | -0.38 | -0.52 | -0.59 | ||||||||||||||||||||||||||||||||||||
April 2001 | 0.11 | 0.60 | 0.33 | 0.29 | ||||||||||||||||||||||||||||||||||||
May 2001 | 0.29 | 0.98 | 1.20 | 0.08 | ||||||||||||||||||||||||||||||||||||
June 2001 | 0.68 | 0.52 | 0.14 | 0.36 | ||||||||||||||||||||||||||||||||||||
July 2001 | 0.66 | 0.25 | 0.11 | 0.29 | ||||||||||||||||||||||||||||||||||||
August 2001 | 0.59 | 0.70 | -0.73 | 0.32 | ||||||||||||||||||||||||||||||||||||
September 2001 | 0.08 | 0.16 | -0.07 | -0.22 | ||||||||||||||||||||||||||||||||||||
October 2001 | -0.14 | -0.58 | 0.10 | -0.91 | ||||||||||||||||||||||||||||||||||||
November 2001 | 0.17 | 0.64 | -0.29 | 0.05 | ||||||||||||||||||||||||||||||||||||
December 2001 | 0.34 | 1.08 | -0.10 | 0.02 | ||||||||||||||||||||||||||||||||||||
January 2002 | 0.12 | 0.68 | -0.09 | 0.03 | 0.09 | 0.07 | 0.09 | 0.04 | ||||||||||||||||||||||||||||||||
February 2002 | -0.56 | -0.50 | 0.12 | 0.74 | 0.28 | 0.23 | 0.05 | |||||||||||||||||||||||||||||||||
March 2002 | 0.33 | 0.34 | 0.08 | 0.01 | 0.25 | 0.08 | 0.24 | |||||||||||||||||||||||||||||||||
April 2002 | 0.09 | 0.14 | 0.07 | 0.06 | 0.10 | 0.10 | 0.14 | |||||||||||||||||||||||||||||||||
May 2002 | 0.43 | 0.73 | 0.67 | 0.62 | 0.62 | 0.72 | 0.74 | |||||||||||||||||||||||||||||||||
June 2002 | 0.15 | 0.55 | 0.31 | 0.60 | 0.34 | 0.32 | 0.44 | 0.44 | ||||||||||||||||||||||||||||||||
July 2002 | 0.14 | 0.54 | 0.32 | 0.27 | 0.17 | 0.22 | 0.32 | 0.30 | ||||||||||||||||||||||||||||||||
August 2002 | 0.09 | 0.39 | 0.03 | -0.07 | -0.08 | 0.04 | 0.01 | |||||||||||||||||||||||||||||||||
September 2002 | -0.08 | -0.10 | 0.19 | 0.20 | 0.14 | 0.21 | 0.18 | |||||||||||||||||||||||||||||||||
October 2002 | 0.29 | -0.03 | -0.03 | -0.04 | 0.03 | -0.05 | ||||||||||||||||||||||||||||||||||
November 2002 | -0.03 | 0.13 | 0.21 | 0.19 | 0.13 | 0.18 | ||||||||||||||||||||||||||||||||||
December 2002 | 0.15 | 0.07 | 0.025 | 0.027 | 0.14 | 0.35 | �� | |||||||||||||||||||||||||||||||||
January 2003 | -0.74 | -0.33 | -0.60 | -0.47 | -0.6 | 0.35 | ||||||||||||||||||||||||||||||||||
February 2003 | -0.36 | -0.31 | -0.13 | -0.27 | -0.13 | 0.31 | ||||||||||||||||||||||||||||||||||
March 2003 | 0.03 | 0.08 | 0.05 | 0.19 | -0.05 | 0.25 | ||||||||||||||||||||||||||||||||||
April 2003 | 0.53 | 0.44 | 0.22 | 0.06 | 0.66 | 0.15 | ||||||||||||||||||||||||||||||||||
May 2003 | -0.1 | 0.03 | -0.16 | 0.28 | -0.48 | 0.13 | ||||||||||||||||||||||||||||||||||
June 2003 | -0.55 | -0.33 | -0.45 | -0.48 | -1.35 | 1.79 | ||||||||||||||||||||||||||||||||||
July 2003 | 0.26 | 0.00 | 0.11 | 0.07 | 0.33 | 0.42 | ||||||||||||||||||||||||||||||||||
August 2003 | 0.15 | 0.16 | 0.18 | 0.48 | 0.88 |
Currency App. - 15
Table of Contents
| Accounts | A | B | C | D | E | F | G | H | I | J | K | L | M | N | O | P | Q | R | S | T | ||||||||||||||||||||
| % | % | % | % | % | % | % | % | % | % | % | % | % | % | % | % | % | % | % | % | |||||||||||||||||||||
September 2003 | 0.20 | 0.32 | 1.29 | 0.96 | 1.39 | |||||||||||||||||||||||||||||||||||
October 2003 | -0.16 | 0.03 | 0.05 | 0.09 | 0.08 | |||||||||||||||||||||||||||||||||||
November 2003 | 0.11 | 0.33 | 0.39 | 0.99 | 1.21 | |||||||||||||||||||||||||||||||||||
December 2003 | 0.59 | 0.74 | 1.23 | 1.42 | ||||||||||||||||||||||||||||||||||||
January 2004 | 0.04 | 0.45 | 2.07 | 1.93 | 0.19 | |||||||||||||||||||||||||||||||||||
February 2004 | -0.05 | -0.04 | -0.34 | -0.38 | -0.28 | |||||||||||||||||||||||||||||||||||
March 2004 | 0.88 | 1.14 | 2.06 | 3.39 | 0.65 | |||||||||||||||||||||||||||||||||||
April 2004 | -0.08 | -0.19 | 0.23 | -0.30 | -0.77 | |||||||||||||||||||||||||||||||||||
May 2004 | 0.42 | 0.36 | 1.34 | 1.27 | 1.40 | |||||||||||||||||||||||||||||||||||
June 2004 | -0.29 | -1.31 | -0.71 | -0.80 | -0.65 | |||||||||||||||||||||||||||||||||||
July 2004 | 0.14 | -0.24 | 0.79 | 0.98 | 0.78 | |||||||||||||||||||||||||||||||||||
August 2004 | 0.25 | 0.27 | 0.40 | 0.52 | 0.35 | |||||||||||||||||||||||||||||||||||
September 2004 | -0.16 | -0.30 | -0.43 | -0.94 | -0.50 | |||||||||||||||||||||||||||||||||||
October 2004 | 0.72 | 1.36 | 2.18 | 2.95 | 2.57 | |||||||||||||||||||||||||||||||||||
November 2004 | 0.44 | 1.98 | 1.50 | 1.90 | 2.21 | |||||||||||||||||||||||||||||||||||
December 2004 | 0.08 | -0.76 | 0.37 | 0.47 | 0.52 | |||||||||||||||||||||||||||||||||||
January 2005 | -0.32 | 0.29 | -0.79 | -0.74 | -0.43 | |||||||||||||||||||||||||||||||||||
February 2005 | 0.65 | -0.02 | 1.04 | 1.03 | 0.99 | 0.81 | ||||||||||||||||||||||||||||||||||
March 2005 | -0.75 | 0.04 | -0.83 | -0.61 | -0.84 | -0.68 | ||||||||||||||||||||||||||||||||||
April 2005 | -0.74 | -1.08 | -0.31 | -1.56 | -0.9 | -1.05 | -0.98 | |||||||||||||||||||||||||||||||||
May 2005 | 0.64 | 0.61 | 0.82 | 0.28 | 0.68 | 1.12 | 1.12 | 0.69 | -0.92 | 0.69 | 0.88 | 0.60 | ||||||||||||||||||||||||||||
June 2005 | 0.24 | 0.46 | 0.37 | 0.09 | 1.94 | 0.35 | 0.35 | 0.28 | 0.55 | 0.43 | 0.63 | 0.30 | ||||||||||||||||||||||||||||
July 2005 | 0.53 | 0.49 | 0.51 | 0.14 | -0.05 | 0.62 | 0.62 | 0.49 | 0.59 | 0.58 | 0.22 | 0.54 | ||||||||||||||||||||||||||||
August 2005 | 0.19 | 0.05 | 0.02 | -0.01 | -0.44 | 0.28 | 0.28 | 0.23 | 0.05 | 0.10 | 0.00 | 0.31 | ||||||||||||||||||||||||||||
Sept 2005 | -0.29 | -0.08 | -0.10 | 0.15 | -0.17 | -0.29 | -0.29 | -0.24 | -0.21 | -0.18 | -0.2 | -0.17 | ||||||||||||||||||||||||||||
Oct 2005 | -2.04 | -1.95 | -1.53 | -1.09 | -1.78 | -2.55 | -2.56 | -2.04 | -2.05 | -2.03 | -2.09 | -2.37 | -1.94 | |||||||||||||||||||||||||||
Nov 2005 | -0.39 | -0.53 | -0.37 | -0.01 | -0.57 | -0.44 | -0.44 | -0.32 | -0.42 | -0.67 | -0.45 | -0.56 | -0.68 | -0.28 | ||||||||||||||||||||||||||
Dec 2005 | 1.17 | 1.37 | 1.21 | 0.71 | 1.40 | 1.91 | 1.91 | 1.13 | 1.23 | 0.97 | 1.30 | 1.54 | 0.37 | 1.32 | 0.45 | |||||||||||||||||||||||||
Jan 2006 | 0.48 | 0.40 | 0.51 | 0.94 | 0.62 | 0.8 | 0.80 | 0.58 | 0.56 | 0.55 | - | 0.54 | 0.13 | 0.62 | 0.23 | |||||||||||||||||||||||||
Feb 2006 | 0.63 | 0.62 | 0.57 | 0.53 | 0.70 | 0.83 | 0.87 | 0.64 | 0.73 | 0.82 | - | 0.34 | 0.12 | 0.55 | 0.26 | |||||||||||||||||||||||||
Mar 2006 | 0.83 | 0.47 | 0.44 | 0.73 | 0.42 | 1.18 | 1.18 | 0.44 | 1.64 | 0.69 | 0.58 | 0.18 | 0.82 | 0.16 | ||||||||||||||||||||||||||
April 2006 | 1.80 | 2.07 | 1.81 | 1.50 | 1.63 | 2.63 | 2.63 | 2.02 | 0.76 | 2.46 | 2.18 | 0.65 | 1.86 | 0.66 | 0.72 | |||||||||||||||||||||||||
May 2006 | - | -0.51 | -0.42 | -0.41 | -0.4 | -1.09 | -0.80 | -0.53 | -0.33 | 0.06 | -0.91 | -0.40 | -0.24 | -0.17 | -0.21 | -0.29 | ||||||||||||||||||||||||
June 2006 | - | 0.22 | 0.41 | 0.56 | 0.33 | 0.82 | 0.69 | 0.48 | 0.26 | 0.39 | 0.63 | 0.23 | 0.64 | 0.19 | 0.12 | �� | 0.54 | |||||||||||||||||||||||
July 2006 | - | -0.25 | -0.19 | -0.14 | -0.23 | -0.42 | -0.35 | -0.19 | -0.20 | -0.28 | -0.59 | -0.17 | -0.29 | -0.05 | -0.12 | -2.06 | -0.21 | -0.12 | ||||||||||||||||||||||
Aug 2006 | - | -1.09 | -0.89 | -1.47 | -1.10 | -1.36 | -1.33 | -1.08 | -1.06 | -0.97 | -1.49 | -0.50 | -1.04 | -0.33 | -0.41 | -1.10 | -1.03 | -1.05 | ||||||||||||||||||||||
Sept 2006 | - | -0.71 | -0.59 | -1.37 | -0.72 | -0.87 | -0.85 | -0.69 | -0.76 | -0.84 | -0.75 | -0.32 | -0.65 | -0.29 | -0.28 | -0.39 | -0.79 | -0.68 | -1.05 | |||||||||||||||||||||
Oct 2006 | - | -0.02 | 0.35 | 0.00 | -0.06 | 0.06 | 0.03 | 0.02 | -0.16 | -0.33 | 0.22 | -0.09 | -0.06 | -0.04 | -0.05 | -0.02 | -0.10 | -0.02 | 0.00 | |||||||||||||||||||||
Nov 2006 | - | 0.45 | - | 0.18 | 0.50 | 0.42 | 0.41 | 0.51 | 0.47 | 0.67 | 0.84 | 0.00 | 0.25 | 0.06 | 0.11 | 0.29 | 0.46 | 0.47 | 0.20 | |||||||||||||||||||||
Return 1999 | 0 | 0 | 0 | 0 | 0.84 | 0.40 | 0 | 0 | 0 | 0 | 0 | |||||||||||||||||||||||||||||
Return 2000 | 0.03 | 0.07 | -0.41 | 0.40 | -6.99 | 1.19 | 0 | 0 | 0 | 0 | 0 | |||||||||||||||||||||||||||||
Return 2001 | 2.92 | 4.91 | 1.03 | 0.36 | 0 | 0 | 0 | 0 | 0 | 0 | 0 | |||||||||||||||||||||||||||||
Return 2002 | 0.71 | 3.72 | -0.09 | 2.38 | 0 | 0 | 2.39 | 2.165 | 1.997 | 1.17 | 2.41 | 0.14 | ||||||||||||||||||||||||||||
Return 2003 | 0 | -0.93 | 0 | 0.47 | 0 | 0 | 0 | -0.01 | 1.93 | 0 | -0.94 | 3.53 | ||||||||||||||||||||||||||||
Return 2004 | 2.43 | 2.75 | 8.6 | 13.08 | 2.27 | |||||||||||||||||||||||||||||||||||
Return 2005 | -0.84 | -0.69 | 0.90 | -0.37 | 0.97 | 1.02 | 1.02 | 0.20 | -0.47 | -1.74 | -0.92 | -1.02 | -0.32 | -0.65 | 0.45 | |||||||||||||||||||||||||
Return 2006 | 3.80 | 1.64 | 2.01 | 1.01 | 1.37 | 1.37 | 3.26 | 2.18 | 1.78 | 3.23 | - | 1.64 | -0.17 | 2.44 | 0.68 | -0.83 | -0.11 | -3.57 | -1.48 | -1.78 |
Currency App. - 16
Table of Contents
| Name of CTA: | C-View International Limited | |
| Name of Trading Program: | C-View International Limited Program | |
| Inception of Trading: | Oct. 1996 | |
| Inception of this Program: | Nov. 1999 | |
| Current Total Assets under Management as of November 30, 2006 | $607,200,000 | |
| Current Total Assets in this Program as of November 30, 2006: | $571,492,000 | |
| Worst Monthly Draw-down: | -2.56% (October 2005) | |
| Worst Peak-to-Valley Draw-down: | -3.57% August-November 2005 | |
Number of Accounts Traded Pursuant to Program as of November 30, 2006: | 17 | |
| Number Closed with Profit: | 6 | |
| Number Closed with Loss: | 4 | |
| Leverage Employed: | 1.3 (average) |
Draw-down means losses experienced by the account over a specified period.
Worst peak-to-valley draw-down means the greatest cumulative percentage decline in month-end net asset value due to losses sustained by the trading program during any period in which the initial month-end net asset value is not equaled or exceeded by a subsequent month-end net asset value.
Currency App. - 17
Table of Contents
FX-CONCEPTS
Background of FX Concepts
FX Concepts is a corporation organized under the laws of the State of New York. FX Concepts currently offers two foreign exchange trading programs.
Principals of FX Concepts
John R. Taylor, Jr.
Mr. Taylor is the Chairman, CEO and founder of FX Concepts. He has 35 years of experience in the foreign exchange and related fixed income markets. He is recognized as an expert in the management of foreign exchange and a pioneer in the analysis of cyclicality of foreign exchange and interest rate markets.
Prior to founding FX Concepts, Mr. Taylor was a Vice President at Citibank, where he headed the bank’s marketing and advisory services in foreign exchange.
Mr. Taylor began his career at Chemical Bank, where he founded its Foreign Exchange Advisory Service in 1972. In this capacity he authoredForeign Exchange Exposure Management, published by Chemical Bank. In addition, Mr. Taylor developed the first computer models designed to assist multinational corporations in the management of foreign exchange risk.
Mr. Taylor serves as Chief Investment Officer at FX Concepts where he also provides daily analytical input and is available for client contact. Mr. Taylor is a Director of the Coalition for Hemophilia B and a board member and a former Chairman of Franklin College, Lugano, Switzerland. He is amagna cum laude graduate of Princeton University and has completed his studies for a doctorate in Political Science at the University of North Carolina.
Mr. Taylor has had numerous articles published in investment management journals and is an accomplished speaker, widely noted for his skills in forecasting currency relationships.
Philip Simotas
Mr. Simotas is President and Director of Investment Management at FX Concepts. Mr. Simotas heads up all aspects of FX Concepts’ investment management activities, which include trading, portfolio administration, client servicing, investment research functions and marketing. In addition, he chairs the product development committee, which directs the firm’s research efforts by enhancing and creating new trading strategies.
Mr. Simotas began his career in derivatives at Dean Witter in 1986, where he was Foreign Exchange Strategist. From 1987 to 1993, Mr. Simotas was Assistant Vice President and Senior Trader on Dean Witter’s foreign exchange desk. Mr. Simotas also served as Deputy Chief of the foreign exchange department.
Mr. Simotas is a cum laude graduate of Yale University.
Jonathan H. Clark
Mr. Clark joined FX Concepts in 1984. His responsibilities include managing FX Concepts’ foreign exchange and interest rate research which is sold to 240 institutional clients in forty countries. His duties include writing and editing the firm’s research products, product development, and overseeing research sales in addition to serving on the firm’s Product Development Committee.
Mr. Clark is a graduate of Colgate University and obtained an MBA from New York University. His graduate thesis was on the topic of long-term currency swaps.
Currency App. - 18
Table of Contents
Eric R. Nelson
Mr. Nelson is Senior Portfolio Manager at FX Concepts. He specializes in the inter-bank market and is a member of FX Concepts’ Investment Committee. Mr. Nelson works closely with Mr. Taylor and Mr. Clark, providing daily analysis of market conditions and trade positions.
Mr. Nelson has been involved with the foreign exchange markets since 1973, and the beginning of the floating exchange rate regime. Internationally known and respected, he has been featured in several articles on currency exposure management. He joined FX Concepts in 1988. He had previously been Foreign Exchange Planning Director for Eastman Kodak Company, where he managed US$1.5bn of currency exposure. While still with Eastman Kodak (from 1979 to 1988), he was a subscriber to FX Concepts’ Advisory Service. From 1973 to 1979, Mr. Nelson was a Vice President and foreign exchange trader at Bankers Trust Company in New York City.
Mr. Nelson is a graduate of St. Lawrence University with a BS in Mathematics and German Literature.
Ryan O’Grady
Mr. O’Grady has been the Director of Investment Research since 1999. He joined FX Concepts in 1992 as an Assistant Trader reporting to Eric Nelson. Mr. O’Grady was promoted to Foreign Exchange Manager/ Trader in 1993 and served in this capacity until 1995 when he became the Manager of New Model Research.
Prior to joining FX Concepts, Mr. O’Grady worked in the fixed income department of Neuberger & Berman, where he assisted in the development of a currency management system. He had previously worked at Standard Chartered Bank as a proprietary trader, focusing on emerging market currencies.
Mr. O’Grady is a graduate of Johns Hopkins University. He has also completed an MS in Statistics and Operations Research at New York University.
Hugh Tilney
Hugh Tilney is a member of the Board of Directors and Chairman of the Management Committee at FX Concepts. As Chief Operating Officer all financial, legal, and regulatory functions of the company report to him including the firm’s overseas operations.
Mr. Tilney joined FX Concepts in 1993 following a 28-year career in the insurance industry, both in the United States and the UK.
Mr. Tilney was educated in the UK and France.
FX CONCEPTS INVESTMENT STRATEGY AND TRADING PROGRAM
FX Concepts uses various systematic strategies for its two principal trading programs: the Developed Markets Currency Program and the Global Currency Program. FX Concepts will periodically adjust the allocation of Currency Series trading capital to these and other programs as new trading programs are added.
Developed Markets Currency Program
Program Description
The Developed Markets Currency Program, or the DMC program, is FX Concepts’ longest-running leveraged absolute return program. It is a systematic strategy, which generates returns by managing a diversified portfolio of G10 currencies. It has a continuous track record from dating back to 1989 and has been enhanced
Currency App. - 19
Table of Contents
over the years with the goal of providing the smoothest possible returns with low volatility. In order to do this the program emphasizes maximum diversification of currencies and investment styles. The DMC program is continuously refined with the goal of enhancing returns and lowering volatility by incorporating multiple and uncorrelated return streams generated by systematic models.
The DMC program is based on three modules, each of which exploits a basic currency market inefficiency. They are:
| • | Trend/Direction |
| • | Yield/Carry |
| • | Options/volatility |
DMC also benefits from diversification over multiple currency pairs (over 30), investment horizons (5 days to 6 months) and instruments (OTC spot and forward contracts, OTC currency options). Emphasis on risk management is bottom-up as this is built into each sub-system.
The trend/direction module establishes positions based on price action. Allocation in this module is spread over 1) a trend-based component which uses long, medium and short-term systems to graduate position size based on multiple horizons, 2) a long-term mean-reverting system analyzing overbought and oversold conditions in the forward outright market to build a portfolio of countertrend trades, and 3) an opportunistic short-term breakout system which takes short-term trend and counter-trend positions based on pattern recognition and volatility regime analysis.
The Yield module establishes positions based on interest rates. It is composed of three sub-modules, all of which employ dynamic risk allocation to create an optimized portfolio of carry positions—one of these is based on the interest rate differentials in the short end of the yield curve, another on short-term overbought/oversold conditions in related bond markets and the third on differences in the slope of various yield curves. Position size is determined using a proprietary measure of the market’s risk appetite.
The options module consists of multiple sub-systems, all of which take advantage of inefficiencies in the pricing of implied volatility in currency. All of the systems are designed so that they are uncorrelated with the trend and yield modules and are primarily—although not exclusively—short volatility. As a result, the strategy adds returns, controls risk and diversifies returns by making money during periods of consolidating trading—when other strategies suffer.
Global Currency Program
The Global Currency Program, or the GCP program, is a unique systematic strategy designed to generate superior risk-adjusted returns with a low correlation—not only versus other asset classes, but also versus CTAs and other currency traders who employ primarily directional strategies limited to major currencies. The hallmarks of the GCP program are the use of dynamic allocation to focus on the best market opportunities and the ability to build diverse portfolios by incorporating a large number of currencies.
The GCP program features a large selection universe of over 30 currencies, including major, minor and emerging markets. The program focuses on smart allocation techniques and diversification over a large number of positions—nearly 400 potential currency pairings are systematically analyzed daily. Both price (momentum) and interest rate (carry) data are incorporated into an individual return forecast for each currency pair, which is submitted—along with an individual risk estimate and liquidity analysis—to an optimizer. The resulting portfolio, in which individual concentrations are constrained to a fixed maximum percentage for a given currency, comprises between 30 and 50 forward outright positions at any time. No options are used in this program.
Currency App. - 20
Table of Contents
A key feature of the GCP program is the Lensing process, which applies correlation data for all of the currency pairs to the individual return forecast, thereby removing the inconsistencies inherent in a purely pairs-based analysis. Another is the bottom-up approach to risk management, which limits daily volatility in the portfolio to a fixed budget. The GCP program also incorporates a number of advanced risk forecasting and management techniques designed to account for “event risk” and other one-off “tail” events associated with emerging markets currencies. Recent enhancements to the GCP program include a new module featuring daily analysis of emerging market equity performance and its effect on currency performance.
The GCP program is able to quickly transition between positions in major and emerging markets, different market regimes (divergent versus convergent) and trading styles (directional, carry, relative value). It has a low correlation with FX Concepts’ Developed Markets Currency (DMC) G10 program and is an excellent complement to this program within our own Multi-Strategy Fund structure.
Currency App. - 21
Table of Contents
PAST PERFORMANCE OF FX CONCEPTS
The Capsule Performance Table which follows sets forth the actual past performance of a client account directed by FX Concepts during the period covered by the table.PAST PERFORMANCE IS NOT NECESSARILY INDICATIVE OF FUTURE RESULTS.
FX Concepts Multi-Strategy Fund
| Month | 2006 | 2005 | 2004 | 2003 | 2002 | 2001 | ||||||
January | -1.15% | 0.40% | -0.68% | 4.60% | -1.02% | 0.83% | ||||||
February | 1.00% | 0.34% | 2.73% | -1.43% | -6.20% | -3.22% | ||||||
March | -0.45 | -3.98% | -1.25% | 1.80% | 3.26% | 4.67% | ||||||
April | -0.02 | 0.84% | -2.61% | 9.35% | 1.57% | -7.02% | ||||||
May | -6.19 | 4.70% | -2.26% | 7.50% | 8.47% | 10.47% | ||||||
June | 1.93 | 2.92% | 0.16% | 0.61% | 2.74% | -6.66% | ||||||
July | -0.28 | -0.97% | 0.78% | -4.45% | -0.91% | 0.07% | ||||||
August | 5.86 | -3.68% | -5.68% | -0.30% | -1.42% | 3.82% | ||||||
September | -1.93 | 2.62% | -0.81% | 4.74% | 3.57% | -2.22% | ||||||
October | 1.40 | 2.56% | 2.87% | 5.33% | 1.38% | -3.51% | ||||||
November | 5.37 | 3.96% | 5.30% | 1.92% | 4.28% | -2.77% | ||||||
December | -3.93 | 2.13% | 3.73% | 2.33% | 7.92% | |||||||
YEAR | 5.09 | 5.40% | 0.21% | 37.94% | 18.76% | 0.71% |
Name of CTA: | FX Concepts, Inc. | |
Name of Trading Program: | Developed Markets Currency Program and Global Currency Program | |
Current Total Assets in this Program as of November 30, 2006: | $ 2,767,325,768 |
FX Concepts’ Multi-Strategy Program consists of two different trading strategies with low correlation to each other: our Developed Markets Currency Program (DMC) and our Global Currency Program (GCP). We will periodically adjust the allocation between these two strategies to achieve an optimum balance of risk and return.
Currency App. - 22
Table of Contents
GAIN
Background of Gain
Gain Capital Asset Management LLC, or Gain, is a privately held limited liability corporation formed in October 2004 in the state of Delaware. The head office is located at 550 Hills Drive, Bedminster, NJ 07921. The telephone number is 908-731-0713.
Gain is the asset management subsidiary of Gain Capital Group Inc., or the Gain Group. The Gain Group began managing assets in October 2000 via a managed account program. In October 2004, the Gain Group created a separate entity—Gain—to further develop and manage institutional assets.
The majority of shares of Gain are held by Glenn Stevens—Managing Director and CIO. Minority shareholders of Gain include several key full time employees, the Gain Group and Mark Galant.
Principals of Gain
Glenn Stevens, Managing Director
Glenn brings to Gain over 18 years of FX trading experience with some of Wall Street’s most prestigious financial institutions. Most recently, Glenn was managing director, head of North American sales and trading at Natwest Bank. In this role, Glenn directly managed a staff of over 50 trading and sales professionals, and was additionally responsible for both the proprietary and emerging market desks. Glenn also served as a senior member of Natwest’s North American Management Committee, during which time he spearheaded the bank’s e-commerce initiative in North America and relocated the firm’s entire trading floor.
From 1990 to 1997, Glenn was at Merrill Lynch and Co., hired as a USD/JPY trader and eventually promoted to the bank’s management team as managing director and chief dealer for Spot and Forward FX. While at Merrill Lynch, Glenn developed the investment bank’s emerging markets currency trading desk and increased profitability threefold in 2 years. During this time Glenn also served as the Federal Reserve Bank’s FX representative for investment banks. Glenn’s Wall Street career began at Bankers Trust Company, where in 1984 he was hired onto the corporate sales desk before quickly moving into a trading position on the spot FX desk, and then receiving a promotion to vice president before his departure in 1990. Glenn holds a BS in Finance from Bucknell University and an MBA in Finance from Columbia University.
Thomas Quinn, Chief Operating Officer—Head of Strategic Development
Tom joined Gain in June 2005 to assist with developing the institutional client base. His 20 years of client service and operational expertise on Wall Street round out Gain’s senior team. Most recently Tom ran all US Fixed Income Origination for HSBC, Chaired the Commitments Committee and was an active member of the US Executive Committee. Tom managed over 25 professionals across a broad spectrum of disciplines including—syndicate, coverage, derivatives, documentation, liability management, asset backed securities and private placements. Prior to that Tom ran the non-US debt origination business for both Kidder Peabody and PaineWebber. Tom began his career with JP Morgan in the systems design and development area.
Tom holds a BSEG from Bucknell University and an MBA in Marketing and International Business from NYU Stern School of Business.
Senior Trading Team Profiles
Timothy O’Sullivan, Trading Manager
Tim has over 16 years of experience trading spot and forward FX in the inter-bank market. Tim joined Gain from Merrill Lynch, where he most recently served as a director, managing the Sterling desk in New York. Hired
Currency App. - 23
Table of Contents
in 1994 to establish a presence in Asian Exotic spot & forward currencies, Tim subsequently assumed responsibility for the EMS currencies desk. In 1997, he launched the Mexican Peso desk and provided liquidity to develop customer business. Tim started his career at Standard Chartered Bank, spanning an eight-year tenure that included running forward books in DEM, and trading spot Far East and exotic currencies.
Kenneth Agostino, Senior Trader
Ken brings over 20 years of top tier institutional FX buy- and sell-side experience to Gain. Most recently, Ken was a senior currency trader at hedge fund York Trading, and before that, a senior trader at Newbridge Asset Management. The majority of Ken’s trading career has been spent on the FX desks of several top tier financial institutions. As senior vice president at BNP, Ken was responsible for all FX quoting and managed the bank’s overall position in Euros. Prior to that, Ken managed the DEM business at Tokai Bank, Security Pacific, Lloyds Bank, and First Chicago. Ken started in FX at brokerage house Lassar Marshall in 1981 and first traded at BHF Bank from 1983-1985.
Stephen Reilly, Senior Trader
Stephen’s 20 years of Forex trading experience includes stints at several top brokerage houses. For the past three years, Stephen managed the 14-person Euro desk at Tullett & Tokyo, the world’s largest FX broker. Before that, Stephen spent 10 years at Noonan Astley & Pearce as vice president of foreign exchange. Previously, Stephen traded at Harlow Meyer Savage, and started his FX career in 1982 at Lasser Marshall, leaving four years later at vice president of foreign exchange.
David Leaver, Senior Trader
Dave joined Gain with 11 years of FX trading experience, most recently as an Assistant Vice President, Global Capital Markets at Bank Boston. In that role, he was the bank’s primary EUR/USD dealer, handling both proprietary and customer business. Prior to that, he traded the majors and Euro crosses on the New York FX desk at Credit Commercial de France (CCF), which averaged $1B in daily turnover. Before that, he was at Fuji Bank in New York, trading on the USD/DEM desk. Dave started his career at Exco Noonan, as an FX broker on the USD/DEM desk.
Affiliated Persons
Gain has entered into a management agreement with the Gain Group in order to share operational expenses and senior resources between the businesses. This agreement provides Gain with access to a combination of physical resources (technology, DR site, administrative support, etc.) as well as support personnel. These professionals, although employed by the Gain Group, are available to Gain on as needed basis. Listed below are several of the critical people who have worked with Gain in the past.
Mark Galant, CEO and Founder
Mark has enjoyed a distinguished and diverse 20-year career in and around Wall Street. From 1994 up until the launch of Gain in October 1999, he was the number two executive at FNX Limited, an international provider of trading and risk management systems. Mark was instrumental in transforming FNX into a world-class software and services firm and, according to Inc. Magazine, one of the 500 fastest-growing companies in the U.S. in 1996, 1997 and 1998. During most of his tenure at this now 200-person company, Mark was responsible for sales and marketing, successfully placing the firm’s mission-critical systems into the world’s top financial institutions while consistently exceeding revenue projections. In October 1998, he assumed the role of vice chairman, responsible for overseeing the strategic initiatives of the organization including acquisitions, joint ventures and external relationships.
Before joining FNX in 1994, Mark served as global head of foreign exchange options trading at Credit Suisse. There, he expanded a small regional operation into one of the world’s largest and most respected global
Currency App. - 24
Table of Contents
foreign exchange options trading organizations, trading $4 billion per day. Prior to Credit Suisse, Mark ran the foreign exchange options desk at Chemical Bank. He also traded all financial products as a money manager for Paul Tudor Jones at Tudor Investment Corporation. During his early years on Wall Street, Mark was a floor trader, successfully trading (30 straight quarters without a loss) his own account on several of New York’s commodities exchanges. He holds a BS in Finance from the University of Virginia and an MBA from Harvard Business School.
Chris Calhoun, Chief Operating Officer
Chris joined the Gain Group in November 2000, bringing with him a range of experience working at start-up and growth stage companies. Most recently, Chris was Senior Content Architect at Waxdigital, a NYC-based interactive digital media firm, developing digital content for the financial services market space. Prior to that, Chris was employed at FNX Limited, the trading and risk management systems provider. During his eight-year tenure at FNX, Chris helped grow the firm from an early stage start-up of 10 employees to well over 200 employees located in 7 offices around the world. In his early days at FNX, Chris spearheaded large scale, mission-critical system implementations and managed the support operation for the firm’s largest sales office in New York. Later, as a member of senior management, Chris assumed responsibility for several key roles, including that of COO, Global Head of Sales and Marketing, and Senior Managing Director, Professional Services. Chris holds a BS in Finance and English and an MBA from La Salle University.
Michael Thwaite, Vice-President, Infrastructure
Michael manages the Gain Group’s systems infrastructure, including network and hardware configuration, connectivity, security, and back up/redundancy measures, among others. His 13-year background in information technology spans a range of roles, including systems engineering, technical support, platform/architecture design, and product development. Before joining the Gain Group in August 2001, Michael was Chief Technology Officer at Dene International, a UK-based financial technology software firm. During his six-year tenure at Dene, Michael’s breadth of responsibilities included R&D, programming, project management, implementation, & sales support. From 1989-1995, Michael held MIS/MIS planning and System engineering roles at Syntegra (BT). Michael is a graduate of Kitson College of Technology and is MCSE certified.
Samantha Roady, Senior Vice President, Marketing
Samantha brings to the Gain Group extensive experience marketing products and services in the financial services IT arena. Ms. Roady is responsible for the Gain Group’s worldwide marketing and communications strategies and manages the firm’s tactical marketing programs, including on- and off-line advertising, media and analyst relations, direct response initiatives, promotions and events. Samantha joined Gain in October 1999 from FNX Limited, where she was director of marketing for the international trading and risk management systems provider. In that role, Samantha directed all marketing communications activities worldwide, as well all marketing initiatives related to joint ventures and industry alliances. During her 5-year tenure, FNX grew from a relatively unknown derivatives software firm to a leader in its field, and one of the fastest growing companies in the US. Samantha graduated from James Madison University with a BA in International Affairs.
Robert Monteleone, Vice President, Client Services
Rob’s decade of experience specializing in operations and customer service management includes six years at E*Trade Financial during the firm’s hyper-growth stage. Hired in 1996 as a Brokerage Supervisor, Rob was promoted to Manager of the US Financial Services Division, responsible for launching E*Trade’s first Client Services Support Center in Atlanta. Rob successfully grew the Atlanta support center to over 450 employees, overseeing the day-to-day operations and delivery of client satisfaction and sales metrics. Promoted again to Director of Retail Sales and Operations, Rob headed up the formation of the physical retail division of E*Trade Bank and Brokerage, managing all operations for locations in over 20 cities. Rob holds a BA in Communications Management from State University of New York, New Paltz.
Currency App. - 25
Table of Contents
GAIN TRADING PROGRAM
The strategy of Gain’s Managed Account Program, or the Gain MAC Program, is to generate absolute returns by exploiting market inefficiencies in the spot G-10 foreign exchange (forex) markets. The Gain MAC Program delivers to investors a blended return of multiple forex trading strategies. All strategies within the program are short term and discretionary in nature. The only instrument traded is spot forex (utilizing spot next and tom next rolls for open positions from day to day). The only currencies traded are G-10—the US, EUR, JPY, NZD, CAD, AUD, STG, and CHF. Investors have the ability to select from three levels of financial leverage—Gain MAC (1 times leverage); Gain MAC—2x (2 times leverage); and Gain MAC—4x (4 times leverage). Gain will trade the assets of the Currency Series allocated to it pursuant to its Gain MAC—2x Program.
The Gain MAC Program is designed to allow investors to tailor their specific return streams based on their individual risk appetite. This tailoring is accomplished by investor directed leverage—where appropriate. Prospective clients should consult with their financial advisor before investing in financial instruments that utilizes leverage.
The Gain MAC Program is a combination of multiple independent short term forex trading strategies. At present, there are five major strategies in the portfolio. The goal of the Gain MAC Program is to consistently provide a real rate of return for the investor base irrespective of market conditions. Management at Gain believes that this is best accomplished by creating a portfolio of forex trading strategies. Trading talent availability, assets under management, and current market conditions are several of the key drivers that will determine the number of strategies within the Gain MAC Program.
The traders for the Gain MAC Program execute all trades through the inter-bank markets. Gain does not trade for its accounts through any outside futures commission merchants. Trades may last less than a day. In general, the Gain MAC Program should be considered and described as short term.
Futures and forward traders may be classified generally as either systematic or discretionary. While the traders utilize systematic analysis as a component of their decision making for trades, they should be considered discretionary traders.
The traders perform rigorous analysis and evaluates both technical and non-technical factors to find opportunities in the forex markets. The trading staff utilizes proprietary processes to uncover “mini-trends” that may result in many modest gains over the course of a month. A mini-trend normally encompasses only a few days or may occur intra-day. This approach is contrary to many traders who look for a few or a single mega-trend on which they may base their performance for a quarter or a whole year.
All trade-positions are liquidated at the end of each month to zero position levels. New positions or the re-establishment of previous positions can then be initiated in the subsequent month. This liquidation process is an important component of Gain’s risk management and liquidity management procedures.
The trading staff for the Gain MAC Program is made up of highly qualified and seasoned professionals who:
| • | Have established inter-bank relationships, |
| • | Displayed their ability to execute trades efficiently and |
| • | Are able to offer their judgment to the decision making process for all trading operations. |
Expertly gauging market sentiment is an important factor in optimizing performance. For example, in periods of highest uncertainty or overreaction to a news item, prices may be skewed to a point where an entry or exit may not be advantageous to achieve maximum positive returns. It is these instances where the trading staff optimizes technically based mini-trends by integrating expert judgment. Other times, staff may determine that the
Currency App. - 26
Table of Contents
market conditions or price action warrant a neutral position. These neutral positions will result in funds not being invested as the Gain MAC Program is neither long nor short for such period.
Risk Management
Gain employs risk management procedures at multiple levels within the organization including:
1.Real Time Position Analysis – Trader Level – Each trader can see their respective profit/loss (including both realized and unrealized P & L) in real time. This allows the trader to actively manage all current positions.
2.Real Time Position Analysis – Management Level – Senior trading management have the ability to see all positions and P/L events across the entire program in real time. It is at this level that management implements overall currency pair risk limits (to manage gap risk) as well as other portfolio level risk management techniques.
3.Monthly P/L Limit – Portfolio Level – On a monthly basis, the CIO (Glenn Stevens) will calculate approximately a 5% portfolio loss risk limit in the base program (or approximately 10% in the Gain MAC-2x Program). This dollar amount is then distributed to each senior trader based on our proprietary asset allocation procedures. The procedure includes the following data points:
| • | Individual trader past quarter performance versus Individual trader history |
| • | Individual trader past quarter performance versus desk performance in past quarter |
| • | Individual trader past performance versus other trader performance. |
4.Monthly P/L Limit – Trader Level – On a monthly basis, each senior trader is provided with a loss risk limit. If the trader experiences (both realized and unrealized) losses that meet or exceed this risk limit his/her account is closed for the remainder of the month. Senior management will then have an opportunity to review before trading resumes in the subsequent month.
5.Monthly Portfolio – Loss Limits – If the Gain MAC portfolio experiences a loss of approximately 2.5% or greater (including both realized and unrealized profit/loss) all outstanding individual trader risk limits are cut in half. If the Gain MAC portfolio experiences a loss of approximately 5% or greater (including both realized and unrealized profit/loss) all outstanding individual trader risk limits are cut in half.Note losses experienced in Gain MAC – 2x and Gain MAC –4x will be proportionally greater due to the higher leverage in these programs.
6.Monthly Portfolio – Gain Limits – If the Gain MAC portfolio experiences a gain of approximately 5% or greater (including both realized and unrealized profit/loss) all outstanding individual trader risk limits are cut in half. The purpose of this risk limit reduction is to protect intra-month profitability.Note gains experienced in Gain MAC – 2x and Gain MAC –4x will be proportionally greater due to the higher leverage in these programs.
7.Monthly Portfolio – Liquidity Management – All positions are closed out at the end of every month. This forces traders to re-evaluate positions. Additionally, this process also serves to bring all account balances back to cash which would facilitate any investor liquidity requirements.
Potential Advantages of an Investment in the Gain MAC Program
The Gain MAC Program’s ability to identify mini-trends may be viewed as an alternative to the mega-trend approach, particularly during periods of no recognizable mega-trend. Conversely, in successfully identifying min-trends, Gain may also take advantage of a large portion of a mega-trend. In such instances, staff will re-initiate particular trades as long as the technical analysis process, coupled with the appropriate market sentiment, continue to produce the strongest market signals.
Currency App. - 27
Table of Contents
The process of trade selection and the deliberation and weight given to technical as well as fundamental factors by seasoned, disciplined members of the management and trading teams is noteworthy.
An investment in the Gain MAC Program offers an investor a vehicle for diversification, as the Gain MAC Program trading is uncorrelated with the equity and bond markets and many of the products that comprise both private and public portfolios.
Gain’s ability to grow the business of managed money is supported by:
| • | a well financed parent company (Gain Group) that boasts industry respected investors, |
| • | a business centered on markets that are highly liquid and, for practical purposes, without capacity restraints, |
| • | excellent trading relationships in the inter-bank markets, and |
| • | a complete team of traders that have demonstrated their ability to trade in volume for managed funds, successfully and consistently. |
Contingency Plans, Disaster Recovery
Gain’s headquarters has a fully employed UPS battery backup for all trading functions and a completely functional disaster recovery, or DR, site located within 10 minutes of the head office. The DR site is maintained on a separate power grid and has systems and computer hardware installed. The data from the main office is downloaded to the DR site every 10 minutes. Within the next few months, Gain will be moving to a live/live system which will effectively create an immediate backup of all trading data. There are independent site trading functions as well as main office functions that operate twenty-four hours a day.
Currency App. - 28
Table of Contents
PAST PERFORMANCE OF GAIN
The Capsule Performance Table which follows sets forth the actual past performance of institutional client accounts directed by Gain Capital pursuant to the Gain MAC—2x Program during the period covered by the table.PAST PERFORMANCE IS NOT NECESSARILY INDICATIVE OF FUTURE RESULTS.
Gain MAC—2x Program
| Month | 2006 | 2005 | 2004 | 2003 | ||||
January | -0.01% | -1.81% | -0.61% | |||||
February | 0.00% | 1.64% | 11.93% | |||||
March | -0.33% | 2.58% | 9.63% | |||||
April | 0.04% | 2.67% | 5.93% | |||||
May | -0.62% | 2.87% | -1.58% | |||||
June | 0.03% | 3.80% | -4.34% | 1.79% | ||||
July | -0.25% | 2.28% | -1.77% | 0.76% | ||||
August | -0.89% | -1.29% | -1.89% | -1.38% | ||||
September | -0.60% | -0.09% | -1.47% | 1.71% | ||||
October | -0.55% | -2.43% | 0.35% | 0.53% | ||||
November | 0.02% | 1.97% | 0.78% | -3.37% | ||||
December | -0.24% | 2.27% | 2.31% | |||||
YEAR | -0.34% | 12.81% | 19.45% | 2.24% |
Name of Trading Advisor: | Gain Capital Asset Management LLC | |
Name of Program: | Gain MAC—2x | |
Inception of Client Account Trading by Trading Advisor: | October 2000 | |
Inception of Client Account Trading in Program: | June 2003 | |
Largest Monthly Drawdown: | ||
Since Inception | -4.34% Jun-04 | |
Last 5 years | -4.34% Jun-04 | |
Current Total Assets in this Program as of November 30, 2006: | $31,809,000 |
The results for the Gain MAC—2x Program are presented net of a 2.0% management fee and 20% incentive fee on net new profits. The program does not deposit interest income—no interest was calculated in these performance results.
Currency App. - 29
Table of Contents
LONG ONLY COMMODITY SERIES APPENDIX
TO PART I OF THE
PROSPECTUS
OF
THE FRONTIER FUND
(A statutory trust formed under the laws of Delaware)
LONG ONLY COMMODITY SERIES-1 UNITS
LONG ONLY COMMODITY SERIES-2 UNITS
Reuters/Jefferies CRB Index
Jefferies Commodity Performance Index
This Long Only Commodity Series Appendix (the “Long Only Commodity Series Appendix”) is dated February 12, 2007.
Table of Contents
THE FRONTIER FUND
LONG ONLY COMMODITY SERIES-1 UNITS
LONG ONLY COMMODITY SERIES-2 UNITS
This Long Only Commodity Series Appendix to the prospectus, dated February 12, 2007, including all exhibits thereto as the same may be amended and supplemented from time to time, or the Prospectus, of The Frontier Fund, or the Trust, a statutory trust formed under the laws of the state of Delaware relates to the units of beneficial interest in the Trust, or the Units, designated as Long Only Commodity Series Units. Capitalized terms used in this Long Only Commodity Series Appendix and not otherwise expressly defined herein shall have the same respective meanings as set forth in the Prospectus. This Long Only Commodity Series Appendix must be accompanied by, and read in conjunction with, the Prospectus.
The Long Only Commodity Series Units are being offered in two (2) Classes. The Long Only Commodity Series Units in Class 1 (as described in the Prospectus) are designated as the “Long Only Commodity Series-1 Units,” and the Long Only Commodity Series Units in Class 2 (as described in the Prospectus) are designated as the “Long Only Commodity Series-2 Units.” The Trust is offering both the Long Only Commodity Series-1 Units and the Long Only Commodity Series-2 Units pursuant to the Prospectus and this Long Only Commodity Series Appendix. Prospective purchasers of the Long Only Commodity Series-1 Units and Long Only Commodity Series-2 Units should carefully review the Prospectus and this Long Only Commodity Series Appendix before determining to purchase such Units.
The Managing Owner intends to contribute funds to the Trust in order to have a 1% interest in the aggregate capital, profits and losses of the Long Only Commodity Series and in return will receive Units designated as General Units in such Series.
STRUCTURE OF THE LONG ONLY COMMODITY SERIES
The Managing Owner manages the Long Only Commodity Series pursuant to the limited liability company agreement governing the Trading Company to which the assets of the Long Only Commodity Series will be allocated. The Managing Owner will allocate the assets allocable to the Long Only Commodity Series Units between the Reuters/Jefferies CRB Index, or the RJ/CRB Index, and the Jefferies Commodity Performance Index, or the JCPI. Specifically, the Trading Company, which will hold the assets allocable to the Long Only Commodity Series, will enter into swap transactions linked to the RJ/CRB Index and the JCPI at the direction of the Managing Owner. The Trading Company also may enter into RJ/CRB Index futures contracts on the New York Board of Trade®. The initial swap counterparty to the Trading Company will be Jefferies Financial Products, LLC, or Jefferies.
Jefferies acts only as the swap counterparty to the Trading Company which will hold the assets of the Long Only Commodity Series and therefore is not, and are not required to be, registered with the CFTC as a commodity trading advisor or member of the NFA. In preparing the descriptions of the RJ/CRB Index and the JCPI in this Long Only Commodity Series Appendix, the Managing Owner has relied upon information provided to it by Jefferies. The information received from Jefferies may not be identical to the information provided by the CFTC-registered commodity trading advisors which act as Trading Advisors to the other Series of The Frontier Fund. Furthermore, the CFTC has not verified or approved the information provided by Jefferies.
LONG ONLY COMMODITY SERIES UNITS
MANAGEMENT AND INCENTIVE FEES
Management Fees
The Long Only Commodity Series Units will pay to the Managing Owner a monthly management fee equal to 1/12th of 2.00% of the Long Only Commodity Series’ Net Asset Value (approximately 2.00% annually).
Incentive Fees
The Long Only Commodity Series Units will pay the Managing Owner no incentive fee.
Long Only Commodity App. - 2
Table of Contents
Licensing Fees
The Long Only Commodity Series has a license agreement with Jefferies and Reuters America LLC, or Reuters, under which it licenses the RJ/CRB Index and will pay to Reuters, and Reuters will share with Jefferies, a quarterly licensing fee of approximately 0.005% of the Long Only Commodity Series’ Net Asset Value (0.02% annually). The Long Only Commodity Series has a license agreement with Jefferies under which it licenses the JCPI without a fee.
Initial Allocations
In general, the Managing Owner anticipates that the assets of the Long Only Commodity Series will be allocated equally between the RJ/CRB Index and the JCPI. The actual allocation of the Long Only Commodity Series’ assets will vary based upon the performance of the indices. The Managing Owner intends to cause the Trading Company to rebalance the allocation of the Long Only Series assets periodically to maintain the 50-50 allocation of the Long Only Commodity Series assets between the two indices.
The table below sets forth certain of the markets and instruments that comprise the indices to which the assets from the Long Only Commodity Series will be allocated. With respect to the RJ/CRB Index, Reuters and Jefferies, or the index’s oversight committee, reserve the right to expand or contract the markets and instruments which comprise the index, or otherwise modify the construction or methodology of the index, without giving prior notice. With respect to the JCPI, Jefferies reserves the right to make any such modifications without giving prior notice.
Diversification Summary
The Frontier Fund—THE LONG ONLY COMMODITY SERIES
In general, the Managing Owner has allocated fifty percent (50%) of the Long Only Commodity Series to each of the two indices. The ongoing actual allocation of the Long Only Commodity Series’ assets will vary based upon the performance of the indices and the Managing Owner’s asset allocation activities. The diversification summary below is the target allocation as of November 30, 2006.
| Index | Grains | Livestock | Softs | Energy | Industrial Metals | Precious Metals | Total | |||||||
RJ/CRB Index | 13.00% | 7.00% | 21.00% | 39.00% | 13.00% | 7.00% | 100% | |||||||
JCPI | 14.00% | 7.00% | 6.00% | 45.00% | 18.00% | 10.00% | 100% | |||||||
Long Only Commodity Series | 13.50% | 7.0% | 13.50% | 42.00% | 15.50% | 8.50% | 100% |
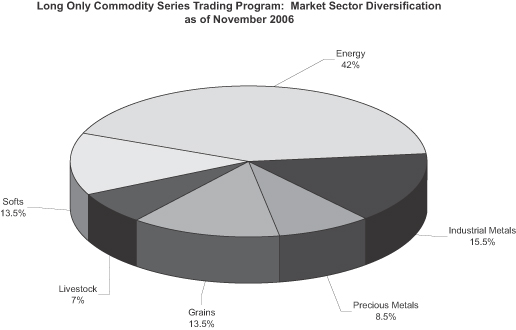
Long Only Commodity App. - 3
Table of Contents
LONG ONLY COMMODITY SERIES
PROJECTED TWELVE MONTH BREAK EVEN ANALYSIS
The table below shows the estimated amount of all fees and expenses which are anticipated to be incurred by a new investor in the Long Only Commodity Series-1 Units and Long Only Commodity Series-2 Units during the first twelve months. The total estimated cost and expense load of Long Only Commodity Series-1 Units and Long Only Commodity Series-2 Units is expressed as a percentage of $1,000, the amount of a minimum investment in the Trust (other than by Plans (including IRAs), employees or family members of an employee of the Managing Owner or its affiliates or charitable organizations). Residents of Texas have a minimum initial subscription requirement of $5,000, or, residents of Texas who are Plans (including IRAs), an employee or family member of an employee of the Managing Owner or its affiliates or a charitable organization, have a minimum initial subscription requirement of $1,000. Although the Managing Owner has used actual numbers and good faith estimates in preparing this table, the actual expenses associated with an investment in the Long Only Commodity Series Units may differ.
| Long Only Commodity Series-1 | Long Only Commodity Series-2 | |||||||||||||
| Amount-$ | Amount-% | Amount-$ | Amount-% | |||||||||||
Initial Selling Price(1) | $ | 1,000 | 100 | % | $ | 1,000 | 100 | % | ||||||
Syndication and Selling Expenses(2) | $ | 0 | 0 | % | $ | 0 | 0 | % | ||||||
Trust Operating Expenses(3) | $ | 0 | 0 | % | $ | 0 | 0 | % | ||||||
Management Fee(4) | $ | 20.00 | 2.00 | % | $ | 20.00 | 2.00 | % | ||||||
Service Fee(5) | $ | 20.00 | 2.00 | % | $ | 0 | 0.00 | % | ||||||
Brokerage Commissions and Trading Fees(6) | $ | 7.50 | 0.75 | % | $ | 7.50 | 0.75 | % | ||||||
License Fees(7) | $ | 0.20 | 0.02 | % | $ | 0.20 | 0.02 | % | ||||||
Less Interest Income(8) | $ | (39.20 | ) | (3.92 | )% | $ | (39.20 | ) | (3.92 | )% | ||||
Amount of Trading Income Required for the Trust’s Net Asset Value per Unit (Redemption Value) at the End of One Year to Equal the Selling Price per Unit | $ | 8.50 | 0.85 | % | $ | (11.50 | ) | (1.15 | )% | |||||
Notes
| (1) | The initial selling price per Unit is $100. The amount reflected in the table represents the amount of minimum investment in the Trust (other than Plans (including IRAs), employees or family members of an employee of the Managing Owner or its affiliates or charitable organizations) because the total costs and expenses as set forth in the break-even analysis are the costs and expenses associated with a minimum investment of $1,000. |
| (2) | Expenses incurred in connection with the organization of the Trust and the offering of Units during the Initial Offering Period were paid by the Managing Owner without reimbursement. |
| (3) | The Managing Owner pays for all accounting, auditing, legal and routine operational and administrative expenses without reimbursement. |
| (4) | The Managing Owner will receive a monthly management fee of approximately 0.167% (2.00% annually) of the Long Only Commodity Series’ Net Asset Value, which it will use to pay all fees and expenses associated with the swap transactions, including swap spreads. |
| (5) | With respect to Class 1 of the Long Only Commodity Series of Units, as compensation, the Selling Agents will receive an initial service fee at an annual rate of up to 2.0% of the subscription amount of each subscription for Units in Class 1 of the Long Only Commodity Series sold by them. The initial service fee will be prepaid by the Managing Owner. If the investor redeems all or a portion of Units in Class 1 of the Long Only Commodity Series during the first twelve (12) months following the effective date of purchase, |
Long Only Commodity App. - 4
Table of Contents
the investor will be subject to a redemption fee of up to 2.0% of the Net Asset Value at which they are redeemed. The amount of the redemption fee associated with each Series at any moment equals the amount of unamortized initial service fee prepaid by the Managing Owner for such Series, and as such the aggregate amount of the redemption fee and the initial service fee cannot exceed 2.0%. Therefore the break-even analysis does not include a separate entry for the redemption fee. |
| (6) | The Trust, with respect to the Long Only Commodity Series will pay the Clearing Brokers and the Managing Owner a fee of approximately 0.75% of the Long Only Commodity Series’ Net Asset Value annually, which will be used to pay all brokerage commissions, plus applicable exchange fees, NFA fees, give up fees, and other transaction related fees and expenses charged in connection with the Long Only Commodity Series’ trading activities and on-going service fees for certain administrative services payable to certain Selling Agents selling Class 2 Units of the Long Only Commodity Series. |
| (7) | Reuters and Jefferies together will receive a quarterly licensing fee, with respect to the RJ/CRB Index, of approximately 0.005% (0.02% annually) of the Long Only Commodity Series’ Net Asset Value. |
| (8) | Interest income for the Long Only Commodity Series-1 Units and the Long Only Commodity Series-2 Units is currently estimated at 3.90%. Twenty percent (20%) of interest income earned per annum by the Trust on the Long Only Commodity Series will be paid to the Managing Owner. The remaining eighty percent (80%) of interest income earned per annum by the Trust on the Long Only Commodity Series will be retained by the Trust. The cash management will utilize a fixed income portfolio manager that will attempt to achieve a higher return with accompanying higher volatility. |
Long Only Commodity App. - 5
Table of Contents
PAST PERFORMANCE OF LONG ONLY COMMODITY SERIES CLASS 1
The Capsule Performance Table which follows sets forth the actual past performance of the Long Only Commodity Series Class 1 during the period covered by the table.PAST PERFORMANCE IS NOT NECESSARILY INDICATIVE OF FUTURE RESULTS.
Month | 2006 | ||
January | |||
February | |||
March | 3.82 | % | |
April | 5.72 | % | |
May | -0.60 | % | |
June | 0.33 | % | |
July | 2.87 | % | |
August | -6.65 | % | |
September | -8.82 | % | |
October | 0.11 | % | |
November | 5.15 | % | |
December | |||
Year | 0.88 | % |
Name of pool: | The Frontier Fund | |
This pool is a multi-advisor advisor pool as defined in CFTC Regulation Section 4.10(d)(2). | ||
Name of Series: | Long Only Commodity Series Class 1 | |
Inception of Trading of Long Only Commodity Series Class 1: | March 1, 2006 | |
Aggregate Gross Capital Subscriptions for Long Only Commodity Series Class 1 as of November 30, 2006: | $4,202,591.30 | |
Net Asset Value of Long Only Commodity Series Class 1 as of November 30, 2006: | $4,045,401.87 | |
Worst Monthly Percentage Draw-down: | -8.82% (September 2006) | |
Worst peak-to-valley Draw-down: | -14.89% (July 2006 through September 2006) | |
The Long Only Commodity Series Class 1 performance table sets forth the actual performance of the Long Only Commodity Series Class 1. Actual gross trading performance (gross realized and unrealized gain/loss before deduction for trading commissions and fees, management fees, any other expenses, and before addition of interest income) is adjusted for the trading expenses, management fees, initial service fees, on-going service fees, and interest income of the Long Only Commodity Series Class 1 of The Frontier Fund. These items, as an annualized percentage calculated monthly on the adjusted beginning of month net asset value are:
• Brokerage commissions and trading fees: | 0.75% | |
• Management fees: | 2.0% | |
• Initial service fees and on-going service fees: | 2.0% | |
Twenty percent (20%) of any interest income, based upon applying the 90-day Treasury Bill rate for each month to the adjusted beginning of month net asset value, is credited in the composite past performance table.
| * | Draw-down means losses experienced by the pool over a specified period. |
| ** | Worst peak to valley draw-down means the greatest cumulative percentage decline in month-end net asset value due to losses sustained by the pool during any period in which the initial month-end net asset value is not equaled or exceeded by a subsequent month-end net asset value. |
Long Only Commodity App. - 6
Table of Contents
PAST PERFORMANCE OF LONG ONLY COMMODITY SERIES CLASS 2
The Capsule Performance Table which follows sets forth the actual past performance of the Long Only Commodity Series Class 2 during the period covered by the table.PAST PERFORMANCE IS NOT NECESSARILY INDICATIVE OF FUTURE RESULTS.
Month | 2006 | ||
January | |||
February | |||
March | 4.06 | % | |
April | 5.88 | % | |
May | -0.42 | % | |
June | 0.49 | % | |
July | 3.04 | % | |
August | -6.49 | % | |
September | -8.68 | % | |
October | 0.29 | % | |
November | 5.33 | % | |
December | |||
Year | 2.48 | % |
Name of pool: | The Frontier Fund | |
This pool is a multi-advisor advisor pool as defined in CFTC Regulation Section 4.10(d)(2). | ||
Name of Series: | Long Only Commodity Series Class 2 | |
Inception of Trading of Long Only Commodity Series Class 2: | March 1, 2006 | |
Aggregate Gross Capital Subscriptions for Long Only Commodity Series Class 2 as of November 30, 2006: | $229,658.76 | |
Net Asset Value of Long Only Commodity Series Class 2 as of November 30, 2006: | $121,783.02 | |
Worst Monthly Percentage Draw-down: | -8.68% (September 2006) | |
Worst peak-to-valley Draw-down: | -14.61% (July 2006 through September 2006) | |
The Long Only Commodity Series Class 2 performance table sets forth the actual performance of the Long Only Commodity Series Class 2. Actual gross trading performance (gross realized and unrealized gain/loss before deduction for trading commissions and fees, management fees, any other expenses, and before addition of interest income) is adjusted for the trading expenses, management fees, initial service fees, on-going service fees, and interest income of the Long Only Commodity Series Class 2 of The Frontier Fund. These items, as an annualized percentage calculated monthly on the adjusted beginning of month net asset value are:
• Brokerage commissions and trading fees: | 0.75% | |
• Management fees: | 2.0% | |
Twenty percent (20%) of any interest income, based upon applying the 90-day Treasury Bill rate for each month to the adjusted beginning of month net asset value, is credited in the composite past performance table.
| * | Draw-down means losses experienced by the pool over a specified period. |
| ** | Worst peak to valley draw-down means the greatest cumulative percentage decline in month-end net asset value due to losses sustained by the pool during any period in which the initial month-end net asset value is not equaled or exceeded by a subsequent month-end net asset value. |
Long Only Commodity App. - 7
Table of Contents
DESCRIPTION OF THE INDICES
The following are descriptions of the RJ/CRB Index and the JCPI, including summaries of the procedures used to calculate these indices. Jefferies and Reuters, which jointly market the RJ/CRB Index, and Jefferies, which markets the JCPI, may change these procedures from time to time. An investor in the Long Only Commodity Series is not entitled to an ownership interest or any other rights in the indices, or in the commodities or futures contracts underlying the indices.
The Reuters/Jefferies CRB Index
The RJ/CRB Index is designed to provide timely and accurate representation of a long-only, broadly diversified investment in commodities through a transparent and disciplined calculation methodology. The history of the RJ/CRB Index dates back to 1957, when the Commodity Research Bureau constructed an index comprised of 28 commodities that made its inaugural appearance in the 1958 CRB Commodity Year Book. Since then, as commodity markets have evolved, the index has undergone periodic updates to remain a leading benchmark for the performance of commodities as an asset class. The index was renamed the Reuters/Jefferies CRB Index in 2005 when it underwent its tenth and most recent revision—as the collaborative effort of Reuters, the global information company, and Jefferies—to maintain its representation of modern commodity markets.
The RJ/CRB Index is calculated daily by Reuters, the index’s official calculation agent. The methodology for determining the composition and weighting of the RJ/CRB Index is subject to modification by Reuters and Jefferies at any time. The RJ/CRB Index is reported on numerous financial information sites, including Reuters page RJCRB01. For a more complete description of the RJ/CRB Index, reference is made to the RJ/CRB Calculation Supplement, which is available at www.jefferies.com.
The RJ/CRB Index currently is composed of futures contracts, or each, an RJ/CRB Component, on 19 physical commodities. A commodity futures contract is a bilateral agreement that provides for the purchase and sale of a specified type and quantity of a commodity during a stated delivery month for a fixed price. The 19 commodities for 2005 that comprise the RJ/CRB Index, or the RJ/CRB Commodities, are aluminum, cocoa, coffee, copper, corn, cotton, crude oil, gold, heating oil, lean hogs, live cattle, natural gas, nickel, orange juice, silver, soybeans, sugar, unleaded gasoline, and wheat. Futures contracts on the RJ/CRB Index are currently listed for trading on the New York Board of Trade®, or the NYBOT®. The RJ/CRB Components currently trade on United States futures exchanges, with the exception of aluminum and nickel, which trade on the London Metal Exchange, or the LME.
The RJ/CRB Index tracks what is known as a rolling futures position, which is a position where, on a periodic basis, futures contracts on physical commodities specifying delivery in a nearby month are sold and futures contracts specifying delivery in a later month are purchased. An investor with a rolling futures position is able to avoid taking delivery of the underlying physical commodity while maintaining exposure to those commodities. This “rolling” process for the RJ/CRB Components occurs over the first four business days of each month according to a fixed schedule.
Long Only Commodity App. - 8
Table of Contents
The RJ/CRB Component corresponding to each of the RJ/CRB Commodities, in each month, is indicated in accordance with the following two tables:
| Commodity | Exchange | Jan | Feb | Mar | Apr | May | Jun | Jul | Aug | Sep | Oct | Nov | Dec | ||||||||||||||
WTI Crude Oil | NYMEX | Feb | Mar | Apr | May | Jun | Jul | Aug | Sep | Oct | Nov | Dec | Jan | ||||||||||||||
Heating Oil | NYMEX | Feb | Mar | Apr | May | Jun | Jul | Aug | Sep | Oct | Nov | Dec | Jan | ||||||||||||||
Unleaded Gas | NYMEX | Feb | Mar | Apr | May | Jun | Jul | Aug | Sep | Oct | Nov | Dec | Jan | ||||||||||||||
Natural Gas | NYMEX | Feb | Mar | Apr | May | Jun | Jul | Aug | Sep | Oct | Nov | Dec | Jan | ||||||||||||||
Corn | CBOT | Mar | Mar | May | May | Jul | Jul | Sep | Sep | Dec | Dec | Dec | Mar | ||||||||||||||
Soybeans | CBOT | Mar | Mar | May | May | Jul | Jul | Nov | Nov | Nov | Nov | Jan | Jan | ||||||||||||||
Live Cattle | CME | Feb | Apr | Apr | Jun | Jun | Aug | Aug | Oct | Oct | Dec | Dec | Feb | ||||||||||||||
Gold | COMEX | Feb | Apr | Apr | Jun | Jun | Aug | Aug | Dec | Dec | Dec | Dec | Feb | ||||||||||||||
Aluminum | LME | Mar | Mar | Jun | Jun | Jun | Sep | Sep | Sep | Dec | Dec | Dec | Mar | ||||||||||||||
Copper | COMEX | Mar | Mar | May | May | Jul | Jul | Sep | Sep | Dec | Dec | Dec | Mar | ||||||||||||||
Sugar | NYBOT | Mar | Mar | May | May | Jul | Jul | Oct | Oct | Oct | Mar | Mar | Mar | ||||||||||||||
Cotton | NYBOT | Mar | Mar | May | May | Jul | Jul | Dec | Dec | Dec | Dec | Dec | Mar | ||||||||||||||
Cocoa | NYBOT | Mar | Mar | May | May | Jul | Jul | Sep | Sep | Dec | Dec | Dec | Mar | ||||||||||||||
Coffee | NYBOT | Mar | Mar | May | May | Jul | Jul | Sep | Sep | Dec | Dec | Dec | Mar | ||||||||||||||
Nickel | LME | Mar | Mar | Jun | Jun | Jun | Sep | Sep | Sep | Dec | Dec | Dec | Mar | ||||||||||||||
Wheat | CBOT | Mar | Mar | May | May | Jul | Jul | Sep | Sep | Dec | Dec | Dec | Mar | ||||||||||||||
Lean Hogs | CME | Feb | Apr | Apr | Jun | Jun | Jul | Aug | Oct | Oct | Dec | Dec | Feb | ||||||||||||||
Orange Juice | NYBOT | Mar | Mar | May | May | Jul | Jul | Sep | Sep | Nov | Nov | Jan | Jan | ||||||||||||||
Silver | COMEX | Mar | Mar | May | May | Jul | Jul | Sep | Sep | Dec | Dec | Dec | Mar |
| Commodity | Index Weight | Contract Months | Exchange | |||||||
| WTI Crude Oil | 23% | Jan-Dec | NYMEX | |||||||
Group I | Heating Oil | 5% | Jan-Dec | NYMEX | ||||||
| ô | Unleaded Gas | 5% | Jan-Dec | NYMEX | ||||||
| Total | 33% | |||||||||
Natural Gas | 6% | Jan-Dec | NYMEX | |||||||
Corn | 6% | Mar, May, Jul, Sep, Dec | CBOT | |||||||
Soybeans | 6% | Jan, Mar, May, Jul, Nov | CBOT | |||||||
Group II | Live Cattle | 6% | Feb, Apr, Jun, Aug, Oct, Dec | CME | ||||||
Gold | 6% | Feb, Apr, Jun, Aug, Dec | COMEX | |||||||
Aluminum | 6% | Mar, Jun, Sep, Dec | LME | |||||||
| ô | Copper | 6% | Mar, May, Jul, Sep, Dec | COMEX | ||||||
| Total | 42% | |||||||||
ô | Sugar | 5% | Mar, May, Jul, Oct | NYBOT | ||||||
| Cotton | 5% | Mar, May, Jul, Dec | NYBOT | |||||||
Group III | Cocoa | 5% | Mar, May, Jul, Sep, Dec | NYBOT | ||||||
| Coffee | 5% | Mar, May, Jul, Sep, Dec | NYBOT | |||||||
| Total | 20% | |||||||||
ô | Nickel | 1% | Mar, Jun, Sep, Dec | LME | ||||||
| Wheat | 1% | Mar, May, Jul, Sep, Dec | CBOT | |||||||
Lean Hogs | 1% | Feb, Apr, Jun, Jul, Aug, Oct, Dec | CME | |||||||
Group IV | Orange Juice | 1% | Jan, Mar, May, Jul, Sep, Nov | NYBOT | ||||||
| Silver | 1% | Mar, May, Jul, Sep, Dec | COMEX | |||||||
| Total | 5% |
Long Only Commodity App. - 9
Table of Contents
The RJ/CRB Components rebalance monthly, generally following the close of business on the sixth Business Day (In the context of the RJ/CRB Index, “Business Day” is any day on which the New York Mercantile Exchange is open for business) of each month, to return to the specified dollar weights, referenced as “Index Weight” in the table above. This rebalancing is achieved by selling RJ/CRB Components that have gained in value relative to other RJ/CRB Components and buying RJ/CRB Components that have lost in value relative to other RJ/CRB Components. This monthly rebalancing helps to maintain the stability and consistency of the RJ/CRB Index and consistent exposure to the underlying RJ/CRB Commodities over time.
Historical Performance and Data
The following table sets forth annualized return and volatility figures for the RJ/CRB Index, as of November 30, 2006, for the indicated time periods. Past performance of the RJ/CRB Index is not necessarily indicative of future results. See “Notes About Historical Data and Performance” below.
RJ/CRB INDEX PERFORMANCE
| Annualized Return | Annualized Std. Deviation | ||||
1 Year | 7.27 | % | 16.63% | ||
2006 (Thru November 30)* | 1.38 | % | 16.38% | ||
| As of November 30, 2006. Figures based on RJ/CRB Index. | |||||
| * The return for 2006 is the compound return for January through November, 2006. This number is not annualized. Source: Bloomberg. | |||||
The following table sets forth month-end closing values of the RJ/CRB Index from June 2005 through November 2006. This historical performance of the RJ/CRB Index is not necessarily indicative of its future values. Any historical upward or downward trend in the index during any period set forth below is not an indication that the index is more or less likely to increase or decrease at any time in the future. See “Notes About Historical Data and Performance” below.
| Date | Index Value | Date | Index Value | |||
06/30/05 | 214.32 | 3/31/06 | 239.95 | |||
07/29/05 | 222.05 | 4/30/06 | 252.50 | |||
08/31/05 | 235.29 | 5/31/06 | 249.55 | |||
09/30/05 | 237.01 | 6/30/06 | 251.25 | |||
10/31/05 | 224.78 | 7/31/06 | 254.44 | |||
11/30/05 | 223.61 | 8/30/06 | 239.32 | |||
12/31/05 | 236.51 | 9/30/06 | 219.27 | |||
1/31/06 | 249.04 | 10/31/06 | 219.90 | |||
2/28/06 | 233.06 | 11/30/06 | 232.24 |
Notes About Historical Performance and Data
The Long Only Commodity Series’ performance is linked to the RJ/CRB Index Total Return. The RJ/CRB Index Total Return is a total return index which, in addition to reflecting the performance of the RJ/CRB Index, also reflects interest that could be earned on cash collateral invested in three-month United States Treasury bills. For a more complete description of the RJ/CRB Index, reference is made to the RJ/CRB Calculation Supplement, which is available at www.jefferies.com.
The performance record of the Index for the period June 2005 through November 2006 has been derived from the performance of the RJ/CRB Index Total Return. Index performance, including interest income, was adjusted for anticipated trading expenses, including management fees, service fees and brokerage expense of the Long Only Commodity Series Class 2 of the Trust.
Long Only Commodity App. - 10
Table of Contents
The performance record of the Index for the period March 2006 through November 2006 has been derived from the performance of the RJ/CRB Index Total Return Swap in the Long-Only Commodity Series. Swap performance was adjusted for interest income and anticipated trading expenses, including management fees, service fees and brokerage expense of the Long Only Commodity Series Class 2 of the Trust.
Index Historical Performance
(Not the basis for the Long Only Commodity Series)
The table below provides historical performance data for what is now known as the RJ/CRB Index. However, for periods prior to June 17, 2005, the data below does not reflect the current index construction and methodology. During the period from 1957 to the present, the index underwent ten modifications. The performance below is the actual performance of the index as it was constructed at the time of reporting performance results. The performance below does not serve as a basis for valuing the Long Only Commodity Series. Instead, the Long Only Commodity Series will be valued based on the RJ/CRB Index as constructed going forward. Past performance is not indicative of future results.
RJ/CRB INDEX HISTORICAL PERFORMANCE
(NOT THE BASIS FOR THE SECURITIES OFFERED)
| Annualized Return | Annualized Std. Deviation | |||||
10 Years | 2.8 | % | 10.7 | % | ||
5 Years | 10.8 | % | 11.5 | % | ||
3 Years | 8.8 | % | 12.9 | % | ||
1 Year | 2.3 | % | 16.6 | % | ||
| Data from September 4, 1956 through November 30, 2006. Past performance is not indicative of future results. Not the basis for the securities offered. Source: Bloomberg. | ||||||
Weighting data and other information contained herein is un-audited and estimated. Information contained in this Long Only Commodity Series Appendix is subject to the quality, timeliness, and completeness of the transaction and data information received by Jefferies from its broker(s), clearer(s), and/or any third party data providers. The data is not guaranteed to be complete or accurate.
Other Notes About the RJ/CRB Index
Information about the RJ/CRB Index and materials relating thereto is the property of Reuters and/or Jefferies or its or their affiliates. It may not be used to create, offer, trade, market or promote any financial products without the express written consent of Jefferies and Reuters.
None of Jefferies, Reuters or any of their subsidiaries or affiliates shall have any liability, contingent or otherwise, to any person or entity for the quality, accuracy, timeliness and/or completeness of the information contained herein, the RJ/CRB Index, or for delays, errors, omissions or interruptions in the publication of the RJ/CRB Index or any related data. Jefferies and Reuters may discontinue operation of the RJ/CRB Index and may discontinue disseminating information about the RJ/CRB Index at any time without prior notice. Reuters and Jefferies may, but are not required to, use agents to perform some or all of the functions relating to operating the RJ/CRB Index, such as but not limited to the functions of calculating and disseminating index values.
See also “General Disclaimers Regarding Reference Indices” below.
Long Only Commodity App. - 11
Table of Contents
The Jefferies Commodity Performance Index
The JCPI, launched in 2003, is intended to outperform standard commodity benchmarks with minimal levels of tracking error. Past performance is not a predictor of future success.
The JCPI is a broadly-diversified, long-only, passive, rules-based index. The JCPI uses proprietary composition, rebalancing and rollover schedules intended to generate improved returns over the price performance of benchmark indices. The methodology for calculating the JCPI will not be made available to investors.
The JCPI is calculated daily and reported live on Bloomberg: JCPI <go>. Daily closing values are also reported at www.jefferies.com.
The JCPI is composed of futures contracts, or each, a JCPI Component, on physical commodities. A commodity futures contract is a bilateral agreement that provides for the purchase and sale of a specified type and quantity of a commodity during a stated delivery month for a fixed price. The commodities that comprise the JCPI are in the energy, agriculture, precious metals, base metals and livestock sectors. The JCPI Components currently trade on United States futures exchanges and the LME.
The JCPI is a “rolling” index, which means that because the index is composed of futures contracts on physical commodities, which specify a delivery month for the underlying physical commodity, futures contracts on physical commodities specifying delivery in a nearby month are periodically sold, and futures contracts specifying delivery in a later delivery month are purchased, in order to avoid taking delivery and while maintaining a long futures position.
Historical Performance
The following table sets forth annualized return and volatility figures for the JCPI Total Return, or the JCPITR, as of November 30, 2006, for the indicated time periods. Past performance is not necessarily indicative of future results. See “Notes About Historical Data and Performance” below.
JCPITR HISTORICAL PERFORMANCE
| Annualized Return | Annualized Std. Deviation | |||||
3 Years | 19.9 | % | 16.1 | % | ||
1 Year | 9.09 | % | 18.57 | % | ||
2006 (Thru November 30)* | 4.15 | % | 18.87 | % | ||
| As of November 30, 2006. Figures based on JCPI. | ||||||
| * The return for 2006 is the compound return for January through November 2006. This number is not annualized. | ||||||
Long Only Commodity App. - 12
Table of Contents
Historical Data
The following table sets forth month-end closing values of the JCPITR from November 2003 through November 2006. This historical performance of the JCPITR is not necessarily indicative of the future values of the JCPITR. Any historical upward or downward trend in the index during any period set forth below is not an indication that the index is more or less likely to increase or decrease at any time in the future. See “Notes About Historical Data and Performance” below.
| Date | Index Value | Date | Index Value | |||
11/26/03 | 334.36 | 06/30/05 | 465.70 | |||
12/31/03 | 360.17 | 07/29/05 | 489.40 | |||
01/30/04 | 366.47 | 08/31/05 | 524.94 | |||
02/27/04 | 395.50 | 09/30/05 | 529.50 | |||
03/31/04 | 409.18 | 10/31/05 | 502.39 | |||
04/30/04 | 407.26 | 11/30/05 | 506.51 | |||
05/28/04 | 420.37 | 12/31/05 | 531.63 | |||
06/30/04 | 406.08 | 1/31/06 | 563.69 | |||
07/30/04 | 424.07 | 2/28/06 | 524.85 | |||
08/31/04 | 416.69 | 3/31/06 | 542.96 | |||
09/30/04 | 454.28 | 4/30/06 | 577.82 | |||
10/29/04 | 464.73 | 5/31/06 | 576.26 | |||
11/30/04 | 453.48 | 6/30/06 | 574.30 | |||
12/30/04 | 428.49 | 7/31/06 | 598.13 | |||
01/31/05 | 438.61 | 8/30/06 | 556.38 | |||
02/28/05 | 465.05 | 9/30/06 | 506.64 | |||
03/31/05 | 480.26 | 10/31/06 | 509.48 | |||
04/29/05 | 450.77 | 11/30/06 | 537.76 | |||
05/31/05 | 451.00 |
Notes About Historical Data and Performance
Jefferies makes no representation as to the accuracy or completeness of historic data.
The Long Only Commodity Series’ performance is linked to the JCPITR. The JCPITR is a total return index which, in addition to reflecting the returns of the JCPI, also reflects interest that could be earned on cash collateral invested in three-month United States Treasury bills.
The performance record of the JCPI for the period November 2003 through November 2006 has been derived from the performance of the JCPITR. Index performance, including interest income, was adjusted for anticipated trading expenses, including management fees, service fees and brokerage expense of the Long Only Commodity Series Class 2 of the Trust.
The performance record of the Index for the period March 2006 through November 2006 has been derived from the performance of the JCPI Total Return Swap in the Long-Only Commodity Series. Swap performance was adjusted for interest income and anticipated trading expenses, including management fees, service fees and brokerage expense of the Long Only Commodity Series Class 2 of the Trust.
Other Notes About the JCPI
Information about the JCPI and materials relating thereto is the property of Jefferies or its affiliates. It may not be used to create, offer, trade, market or promote any financial products without the express written consent of Jefferies.
Long Only Commodity App. - 13
Table of Contents
Jefferies shall have no liability, contingent or otherwise, to any person or entity for the quality, accuracy, timeliness and/or completeness of the information contained herein, the JCPI, other commodity indices, or for delays, errors, omissions or interruptions in the publication of the JCPI, or any related data. Jefferies may discontinue operation of the JCPI and may discontinue disseminating information about the JCPI at any time without prior notice. Jefferies may, but is not required to, use agents to perform some or all of the functions relating to operating the JCPI, such as but not limited to the functions of calculating and disseminating index values. See also “General Disclaimers Regarding Reference Indices” below.
General Disclaimers Regarding Reference Indices
THE TRUST IS NOT SPONSORED, ENDORSED, SOLD OR PROMOTED BY REUTERS, JEFFERIES OR ANY OF THEIR SUBSIDIARIES OR AFFILIATES, OR COLLECTIVELY, THE LICENSORS. THE LICENSORS MAKE NO REPRESENTATION OR WARRANTY, EXPRESS OR IMPLIED, TO THE TRUST, ITS INVESTORS, OR ANY MEMBER OF THE PUBLIC REGARDING THE ADVISABILITY OF INVESTING IN SECURITIES OR COMMODITIES GENERALLY OR IN THE FRONTIER FUND PARTICULARLY OR THE ABILITY OF THE RJ/CRB INDEX OR THE JCPI, OR COLLECTIVELY, THE INDICES, TO TRACK GENERAL COMMODITY MARKET PERFORMANCE. THE LICENSORS’ RELATIONSHIP TO THE TRUST, OR THE LICENSEE, IS THE LICENSING OF THE INDICES, WHICH ARE DETERMINED, COMPOSED AND CALCULATED BY ONE OR MORE LICENSORS WITHOUT REGARD TO THE TRUST OR ITS INVESTORS. THE LICENSORS HAVE NO OBLIGATION TO TAKE THE NEEDS OF THE TRUST OR ITS INVESTORS INTO CONSIDERATION IN DETERMINING, COMPOSING OR CALCULATING THE INDICES. THE LICENSORS ARE NOT RESPONSIBLE FOR AND HAVE NOT PARTICIPATED IN THE DETERMINATION OF THE TIMING OF, PRICES AT, OR QUANTITIES OF TRUST UNITS TO BE ISSUED OR IN THE DETERMINATION OR CALCULATION OF THE EQUATION BY WHICH THE UNITS OF THE LONG ONLY COMMODITY SERIES ARE TO BE CONVERTED INTO CASH. THE LICENSORS HAVE NO OBLIGATION OR LIABILITY IN CONNECTION WITH THE ADMINISTRATION, MARKETING OR TRADING OF THE TRUST.
THE LICENSORS AND THEIR AFFILIATES AND THEIR RESPECTIVE DIRECTORS, OFFICERS, EMPLOYEES AND AGENTS MAY BUY OR SELL SECURITIES OR COMMODITIES MENTIONED OR CONTEMPLATED HEREIN AS AGENT OR AS PRINCIPAL FOR THEIR OWN ACCOUNTS AND MAY HAVE POSITIONS OR ENGAGE IN TRANSACTIONS BASED ON OR INDEXED TO THE INDICES. IT IS POSSIBLE THAT THE LICENSORS’ TRADING ACTIVITY WILL AFFECT THE VALUE OF THE INDICES. WITHOUT LIMITING THE FOREGOING, JEFFERIES MAY ACT AS A SWAP COUNTERPARTY TO THE TRADING COMPANY WITH RESPECT TO SWAPS VALUED IN RELATION TO THE INDICES. THE LICENSORS MAY OPERATE AND MARKET OTHER INDICES THAT MAY COMPETE WITH THE INDICES.
THE LICENSORS DO NOT GUARANTEE THE QUALITY, ACCURACY AND/OR THE COMPLETENESS OF THE INDICES OR ANY DATA INCLUDED THEREIN. THE LICENSORS MAKE NO WARRANTY, EXPRESS OR IMPLIED, AS TO RESULTS TO BE OBTAINED BY THE TRUST OR ITS INVESTORS, OR ANY OTHER PERSON OR ENTITY FROM THE USE OF THE INDICES OR ANY DATA INCLUDED THEREIN IN CONNECTION WITH THE RIGHTS LICENSED AS DESCRIBED HEREIN OR FOR ANY OTHER USE. THE LICENSORS MAKE NO EXPRESS OR IMPLIED WARRANTIES, AND HAVE EXPRESSLY DISCLAIMED ALL WARRANTIES OF MERCHANTABILITY OR FITNESS FOR A PARTICULAR PURPOSE OR USE WITH RESPECT TO THE INDICES OR ANY DATA INCLUDED THEREIN. WITHOUT LIMITING ANY OF THE FOREGOING, IN NO EVENT SHALL THE LICENSORS HAVE ANY LIABILITY FOR ANY SPECIAL, PUNITIVE, INDIRECT, INCIDENTAL OR CONSEQUENTIAL DAMAGES (INCLUDING, WITHOUT LIMITATION, LOST PROFITS), EVEN IF NOTIFIED OF THE POSSIBILITY OF SUCH DAMAGES.
THE LICENSORS ARE NOT ADVISORS TO THE TRUST OR TO ANY INVESTOR AS TO LEGAL, TAXATION, ACCOUNTING, REGULATORY OR FINANCIAL MATTERS IN ANY JURISDICTION, AND ARE NOT PROVIDING ANY ADVICE AS TO ANY SUCH MATTER TO THE RECIPIENT.
Long Only Commodity App. - 14
Table of Contents
THE SWAP
The Trading Company in which the assets of the Long Only Commodity Series will be invested will enter into various total return swap transactions or each, a Swap, with the Swap Counterparty. The Swaps should enable the Long Only Commodity Series to earn returns similar to the returns (less the fees and expenses of the Long Only Commodities Series, including the expenses associated with the Swaps) of the RJ/CRB Index and the JCPI. The Trading Company in which the assets of the Long Only Commodity Series will be invested will not own any of the components of either the RJ/CRB Index or the JCPI.
The documentation for each Swap, or the Swap Documentation, will be based upon a mutually agreed upon, negotiated form of ISDA Master Agreement (Multicurrency—Cross Border) and Credit Support Annex. The Trading Company in which the assets of the Long Only Commodity Series will be invested will pledge, or the Pledge, a portion of the proceeds from the sale of Long Only Commodity Series Units to the Swap Counterparty as margin to secure the Trading Company’s obligations under the Swaps. The Swap Counterparty will have the right to deal with the pledged funds in any manner it chooses subject only to such Trading Company’s right of repayment upon, among other things, fulfillment of all of its obligations under the Swap. The pledged funds will bear interest.
Each Swap will be based on a notional amount to be allocated to the relevant index. As of any business day, the Trading Company in which the assets of the Long Only Commodity Series will be invested will be entitled to terminate each Swap in whole or in part by providing the Swap Counterparty with one Business Days’ prior notice. In the event of a partial termination of a Swap by the Trading Company in which the assets of the Long Only Commodity Series will be invested, the notional amount under such Swap will be correspondingly reduced and, to the extent no longer required under the Swap Documentation, the Swap Counterparty will return the relevant portion of such pledged funds.
Under each Swap, the Trading Company in which the assets of the Long Only Commodity Series will be invested will be obligated to pay the Swap Counterparty, upon settlement or termination, for the decrease in the value of the relevant index multiplied by the notional amount of the swap while the Swap Counterparty will be obligated to pay such Trading Company, upon settlement or termination, the increase in the value of the relevant index multiplied by the notional amount of the swap. In addition, the Trading Company in which the assets of the Long Only Commodity Series will be invested will be obligated to pay the Swap Counterparty a swap spread which the Managing Owner will pay out of its management fees charged to the Long Only Commodity Series.
Each Swap generally will have a termination date of no more than one (1) year from the date the Swap is entered into, or the Termination Date. Upon the Termination Date, the Trading Company in which the assets of the Long Only Commodity Series will be invested will enter into a new Swap. Each Swap may be terminated by the Swap Counterparty prior to the Termination Date in certain circumstances, including (i) a failure of the Trading Company in which the assets of the Long Only Commodity Series will be invested to pay under any Swap (including a failure to pay margin) or certain other breaches on the part of such Trading Company under the Swap Documentation, (ii) the occurrence of certain events of bankruptcy, insolvency or dissolution in relation to such Trading Company or a merger, without the consent of the Swap Counterparty, of such Trading Company with another fund; or (iii) changes to applicable law which have the effect of subjecting the Swap Counterparty to material loss due to the characterization of any payments under the Swap, or of imposing or adversely modifying any material reserve, special deposit or similar requirement against assets or hedges incidental to the Swap, or materially adversely affecting the amount of capital or increasing the amount of regulatory capital required in connection with the Swap.
Payment on early termination of a Swap in the event of an default by, or an early termination event affecting, the Trading Company in which the assets of the Long Only Commodity Series will be invested, will be determined by the Swap Counterparty pursuant to a modified version of the “Loss” method as set forth in the Swap Documentation. This methodology could result in significant losses to the Trading Company in which the assets of the Long Only Commodity Series will be invested.
Long Only Commodity App. - 15
Table of Contents
ADDITIONAL RISK FACTORS
The following are additional risk factors which pertain to the Long Only Commodity Series, and the use of the Indices.
Discontinuation of publication of the Indices.
Although Reuters and Jefferies have licensed the RJ/CRB Index, and Jefferies has licensed the JCPI, for use in connection with the Long Only Commodity Series, neither Reuters nor Jefferies is under any obligation to continue to publish those indices or required to publish any successors to the indices. Should Reuters and Jefferies cease publication of the RJ/CRB Index and fail to publish a successor or substitute index, or should Jefferies cease publication of the JCPI and fail to publish a successor or substitute index, the Long Only Commodity Series could be adversely affected.
Discretion of the calculation agent
Reuters will serve as the calculation agent for the RJ/CRB Index, and Jefferies will serve as the calculation agent for the JCPI. None of Reuters, Jefferies or any of their respective subsidiaries or affiliates has any obligation to take into consideration the needs of investors in the Long Only Commodity Series or any other parties to transactions involving the Indices in determining, composing or calculating the Indices.
Risk of concentrated positions in one or more commodity sectors
The exchange-traded physical commodities underlying the futures contracts included in the Indices from time to time are heavily concentrated in a limited number of sectors, particularly energy and agriculture. An investment in the Long Only Commodity Series Units may therefore carry risks similar to a concentrated securities investment in a limited number of industries or sectors.
The Trust’s right to use the Indices
The Trust has been granted a license to use the Indices. If Reuters terminates the license to use the RJ/CRB Index, or if Jefferies terminates the license to use the RJ/CRB Index or the JCPI, the Long Only Commodity Series could be adversely affected.
No recourse against Reuters and Jefferies
Investors in the Long Only Commodity Series will have no rights against Reuters and Jefferies as sponsors of the RJ/CRB Index, against Jefferies as sponsor of the JCPI, or against Jefferies as initial swap counterparty.
Historical performance of the Indices is not indicative of future performance
The future performance of the Indices cannot be predicted based on historical performance. Results for the RJ/CRB Index prior to June 17, 2005, and for the JCPI prior to November 23, 2003, are simulated by applying the current index construction and methodology to historical futures values. There is no guarantee that the level of the Indices will increase.
Payment on Early Termination
In the event that the Trading Company causes an event of default to occur under the Swap Agreement, Jefferies may proceed to terminate the Swap Agreement, unwind any hedging transactions that it has entered into in connection with the Swap Agreement, declare an early termination date for all outstanding transactions under the Swap Agreement and seize any pledged collateral supporting the Long Only Commodity Series’ obligations to the Swap Counterparty. Upon such early termination date, the Long Only Commodity Series will be obliged to pay the Swap Counterparty the total losses incurred by the Swap Counterparty as a result of such early termination of the Swap Agreement.
Long Only Commodity App. - 16
Table of Contents
The foregoing is not a complete explanation of all the risks involved in purchasing the Long Only Commodity Series Units. An investor should read the entire Prospectus, including the section “Risk Factors” contained therein, before determining to subscribe for Long Only Commodity Series Units.
INITIAL SWAP COUNTERPARTY
Jefferies will be the initial swap counterparty to the Trading Company to which assets of the Long Only Commodity Series will be allocated. Jefferies is not a Trading Advisor to the Long Only Commodity Series. Investors in the Long Only Commodity Series are not a party to, and do not have any rights with respect to, the swaps. Jefferies is a leading market maker in benchmark commodity index products and a licensed provider of swaps, options, and other derivative products linked to leading commodity indices. Jefferies provides innovative financial products and commodity index expertise to pension funds, mutual funds, sovereigns, foundations, endowments and other institutional investors seeking exposure to commodities as an asset class. Operating from Stamford, Connecticut, Jefferies was founded in 2003 by an experienced team of commodity professionals. Jefferies is not a futures commission merchant and is not regulated by the CFTC. Jefferies is a wholly owned subsidiary of Jefferies Group, Inc., or Jefferies Group (NYSE: JEF), a global investment bank and institutional securities firm. Swap transactions with Jefferies are covered by a parent guarantee from Jefferies Group, which has a long-term unsecured debt rating of BBB+ from Standard & Poor’s Corporation and Baa1 from Moody’s Investors Services, Inc.
Jefferies Group controls numerous operating companies including Jefferies and various other US and foreign financial institutions. Many aspects of these businesses involve substantial risks of liability. Certain affiliates are involved in a number of judicial and regulatory matters arising out of the conduct of their businesses. Investors and prospective investors are invited to view the disclosure documents that Jefferies Group has filed with the SEC, which are publicly available on the SEC’s web site.
See also “General Disclaimers Regarding Reference Indices” above.
Long Only Commodity App. - 17
Table of Contents
LONG/SHORT COMMODITY SERIES APPENDIX
TO PART I OF THE
PROSPECTUS
OF
THE FRONTIER FUND
(A statutory trust formed under the laws of Delaware)
LONG/SHORT COMMODITY SERIES-1 UNITS
LONG/SHORT COMMODITY SERIES-2 UNITS
AAA Capital Management, Inc.
AIS Futures Management LLC
Cornerstone Quantitative Investment Group, Inc.
Forecast Trading Group, LLC
Kottke Associates, LLC
Landmark Trading Company
Mississippi River Investments, Inc.
Red Oak Commodity Advisors, Inc.
Strategic Ag Trading
This Long/Short Commodity Series Appendix (the “Long/Short Commodity Series Appendix”) is dated February 12, 2007.
Table of Contents
THE FRONTIER FUND
LONG/SHORT COMMODITY SERIES-1 UNITS
LONG/SHORT COMMODITY SERIES-2 UNITS
This Long/Short Commodity Series Appendix to the prospectus, dated February 12, 2007, including all exhibits thereto as the same may be amended and supplemented from time to time, or the Prospectus, of The Frontier Fund, a statutory trust formed under the laws of the state of Delaware, or the Trust, relates to the units of beneficial interest in the Trust, or the Units, designated as Long/Short Commodity Series Units. Capitalized terms used in this Long/Short Commodity Series Appendix and not otherwise expressly defined herein shall have the same respective meanings as set forth in the Prospectus. This Long/Short Commodity Series Appendix must be accompanied by, and read in conjunction with, the Prospectus.
The Long/Short Commodity Series Units are being offered in two (2) Classes. The Long/Short Commodity Series Units in Class 1 (as described in the Prospectus) are designated as the “Long/Short Commodity Series-1 Units,” and the Long/Short Commodity Series Units in Class 2 (as described in the Prospectus) are designated as the “Long/Short Commodity Series-2 Units.” The Trust is offering both the Long/Short Commodity Series-1 Units and the Long/Short Commodity Series-2 Units pursuant to the Prospectus and this Long/Short Commodity Series Appendix. Prospective purchasers of the Long/Short Commodity Series-1 Units and Long/Short Commodity Series-2 Units should carefully review the Prospectus and this Long/Short Commodity Series Appendix before determining to purchase such Units.
The Managing Owner intends to contribute funds to the Trust in order to have a 1% interest in the aggregate capital, profits and losses of the Long/Short Commodity Series and in return will receive Units designated as General Units in such Series.
TRADING ADVISORS
The initial Trading Advisors with respect to the assets allocable to the Long/Short Commodity Series Units are AAA Capital Management, Inc., or AAA Capital, a Texas corporation; AIS Futures Management LLC, or AIS, a Delaware limited liability company; Cornerstone Quantitative Investment Group, Inc., or Cornerstone, a New York corporation; Forecast Trading Group, LLC, or Forecast, a New Jersey limited liability company; Kottke Associates, LLC, or Kottke, an Illinois limited liability company; Landmark Trading Company, or Landmark, a Colorado corporation; Mississippi River Investments, Inc., or Mississippi River, a Tennessee corporation; Red Oak Commodity Advisors, Inc., or Red Oak, a Delaware corporation; and Skyline Management, Inc. d.b.a. Strategic Ag Trading, or Strategic Ag, a Wyoming corporation. The assets allocable to the Long/Short Commodity Series Units will be contributed to a Trading Company for which these entities will act as Trading Advisors pursuant to their respective trading programs.
The Trust may allocate greater than ten percent (10%) of the assets allocable to the Long/Short Commodity Series Units to Cornerstone. AAA Capital, AIS, Forecast, Kottke, Landmark, Mississippi River, Red Oak and Strategic Ag will each manage less than 10% of the assets allocable to the Long/Short Commodity Series Units. Because each of AAA Capital, AIS, Forecast, Kottke, Landmark, Mississippi River, Red Oak and Strategic Ag initially will be allocated less than ten percent (10%) of the assets allocable to the Long/Short Commodity Series, each is not considered a “major commodity trading advisor.” See Part II of the Prospectus for certain information regarding a summary description of the performance history of AAA Capital, AIS, Forecast, Kottke, Landmark, Mississippi River, Red Oak and Strategic Ag, including the following information: (i) monthly return parameters, (ii) historical volatility and degree of leverage; (iii) any material differences between the performance of each Trading Advisor as compared to that of the offered pool’s major trading advisors. For information regarding Cornerstone, including Cornerstone’s investment program and past performance, please see the Balanced Series Appendix which accompanies this Prospectus.
Cornerstone with trade the assets of the Long/Short Commodity Series allocated to it according to its Real Commodity Analysis program. For information regarding Cornerstone, including Cornerstone’s investment program and past performance, please see the Balanced Series Appendix which accompanies this Prospectus.
Long/Short Commodity App. - 2
Table of Contents
LONG/SHORT COMMODITY SERIES UNITS
MANAGEMENT AND INCENTIVE FEES
Management Fees
The Long/Short Commodity Series Units will pay to the Managing Owner a monthly management fee equal to 1/12th of 3.50% of the Long/Short Commodity Series’ Net Asset Value (approximately 3.50% annually). The Managing Owner will pay a portion of such management fees to the Trading Advisors.
Incentive Fees
The Long/Short Commodity Series Units will pay to the Managing Owner a monthly or quarterly incentive fee of 20% of New High Net Trading Profits generated by each Trading Advisor, including realized and unrealized gains and losses thereon, as of the close of business on the last day of each calendar month or quarter. The fee will accrue monthly if paid quarterly. The Managing Owner will pay a portion of such incentive fees to the appropriate Trading Advisors. See “RISK FACTORS—Each Series pays substantial fees and expenses regardless of profitability.”
Initial Allocations
In general, the Managing Owner anticipates to allocate no more than ten percent (10%) of the assets allocable to the Long/Short Commodity Series Units to any Trading Advisor in the Long/Short Commodity Series. The actual allocation of the Long/Short Commodity Series’ assets will vary based upon the trading performance of the Trading Advisors and the Managing Owner’s asset allocation activities.
The table below sets forth certain of the markets and instruments the Trading Advisors allocated assets from the Long/Short Commodity Series may trade on behalf of client accounts. Not all markets are part of each program. Each Trading Advisor reserves the right to expand or contract the markets and instruments it trades without giving prior notice.
Diversification Summary
The Frontier Fund—THE LONG/SHORT COMMODITY SERIES
In general, the Managing Owner has allocated certain amounts of the Long/Short Commodity Series to the various Trading Advisors. As stated earlier, the allocation to each Trading Advisor will not exceed ten percent (10%). The ongoing actual allocation of the Long/Short Commodity Series’ assets will vary based upon the trading performance of the Trading Advisors and the Managing Owner’s asset allocation activities. The diversification summary below is estimated as of November 30, 2006.
| Trading Advisor | Program | Grains | Livestock | Softs | Energy | Industrial Metals | Precious Metals | Financials | Total | |||||||||
Long/Short Commodity Series | N/A | 27% | 3% | 25% | 26% | 6% | 4% | 9% | 100% |
Long/Short Commodity App. - 3
Table of Contents
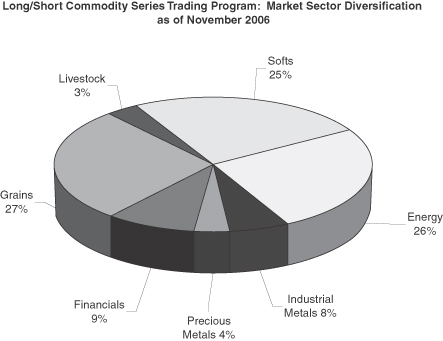
Long/Short Commodity App. - 4
Table of Contents
LONG/SHORT COMMODITY SERIES UNITS
PROJECTED TWELVE MONTH BREAK EVEN ANALYSIS
The table below shows the estimated amount of all fees and expenses which are anticipated to be incurred by a new investor in the Long/Short Commodity Series-1 Units and Long/Short Commodity Series-2 Units during the first twelve months. The total estimated cost and expense load of Long/Short Commodity Series-1 Units and Long/Short Commodity Series-2 Units is expressed as a percentage of $1,000, the amount of a minimum investment in the Trust (other than by Plans (including IRAs), employees or family members of an employee of the Managing Owner or its affiliates or charitable organizations). Residents of Texas have a minimum initial subscription requirement of $5,000, or, residents of Texas who are Plans (including IRAs), an employee or family member of an employee of the Managing Owner or its affiliates or a charitable organization, have a minimum initial subscription requirement of $1,000. Although the Managing Owner has used actual numbers and good faith estimates in preparing this table, the actual expenses associated with an investment in the Long/Short Commodity Series Units may differ.
| Long / Short Commodity Series-1 | Long / Short Commodity Series-2 | |||||||||||||
| Amount-$ | Amount-% | Amount-$ | Amount-% | |||||||||||
Initial Selling Price(1) | $ | 1,000 | 100 | % | $ | 1,000 | 100 | % | ||||||
Syndication and Selling Expenses(2) | $ | 0 | 0 | % | $ | 0 | 0 | % | ||||||
Trust Operating Expenses(3) | $ | 0 | 0 | % | $ | 0 | 0 | % | ||||||
Management Fee(4) | $ | 35.00 | 3.50 | % | $ | 35.00 | 3.50 | % | ||||||
Service Fee(5) | $ | 30.00 | 3.00 | % | $ | 0 | 0.00 | % | ||||||
Brokerage Commissions and Trading Fees(6) | $ | 20.60 | 2.06 | % | $ | 20.60 | 2.06 | % | ||||||
Incentive Fee(7) | $ | 0 | 0 | % | $ | 0 | 0 | % | ||||||
Less Interest Income(8) | $ | (39.20 | ) | (3.92 | )% | $ | (39.20 | ) | (3.92 | )% | ||||
Amount of Trading Income Required for the Trust’s Net Asset Value per Unit (Redemption Value) at the End of One Year to Equal the Selling Price per Unit | $ | 46.40 | 4.64 | % | $ | 16.40 | 1.64 | % | ||||||
Notes
| (1) | The initial selling price per Unit is $100. The amount reflected in the table represents the amount of minimum investment in the Trust (other than Plans (including IRAs), employees or family members of an employee of the Managing Owner or its affiliates or charitable organizations) because the total costs and expenses as set forth in the break-even analysis are the costs and expenses associated with a minimum investment of $1,000. |
| (2) | Expenses incurred in connection with the organization of the Trust and the offering of Units during the Initial Offering Period were paid by the Managing Owner without reimbursement. |
| (3) | The Managing Owner pays for all accounting, auditing, legal and routine operational and administrative expenses without reimbursement. |
| (4) | The Managing Owner will receive a monthly management fee of approximately 0.292% (3.50% annually) of the Long/Short Commodity Series’ Net Asset Value, which it will use to pay all management fees payable to the Trading Advisors. |
| (5) | With respect to Class 1 of the Long/Short Commodity Series of Units, as compensation, the Selling Agents will receive an initial service fee at an annual rate of up to 3.0% of the subscription amount of each subscription for Units in Class 1 of the Long/Short Commodity Series sold by them. The initial service fee will be prepaid by the Managing Owner. If you redeem all or a portion of your Units in Class 1 of the Long/Short Commodity Series during the first twelve (12) months following the effective date of their purchase, |
Long/Short Commodity App. - 5
Table of Contents
you will be subject to a redemption fee of up to 3% of the Net Asset Value at which they are redeemed. The amount of the redemption fee associated with each Series at any moment equals the amount of unamortized initial service fee prepaid by the Managing Owner for such Series, and as such the aggregate amount of the redemption fee and the initial service fee cannot exceed 3%. Therefore the break-even analysis does not include a separate entry for the redemption fee. |
| (6) | The Trust, with respect to the Long/Short Commodity Series will pay the Clearing Brokers and the Managing Owner a fee of approximately 2.06% of the Long/Short Commodity Series’ Net Asset Value annually, which will be used to pay all brokerage commissions, plus applicable exchange fees, NFA fees, give up fees and other transaction related fees and expenses charged in connection with the Long/Short Commodity Series’ trading activities and on-going service fees for certain administrative services payable to certain Selling Agents selling Class 2 Units of the Long/Short Commodity Series. |
| (7) | The 3% initial service fee and on-going service fee is deductible on the incentive fee calculation for most of the Trading Advisors to the Long/Short Commodity Series, thereby resulting in no incentive fee for purposes of calculating the break-even analysis. |
| (8) | Interest income for the Long/Short Commodity Series-1 Units and the Long/Short Commodity Series-2 Units is currently estimated at 4.90%. Twenty percent (20%) of interest income earned per annum by the Trust on the Long/Short Commodity Series will be paid to the Managing Owner. The remaining eighty percent (80%) of interest income earned per annum by the Trust on the Long/Short Commodity Series will be retained by the Trust. |
Long/Short Commodity App. - 6
Table of Contents
PAST PERFORMANCE OF LONG/SHORT COMMODITY SERIES CLASS 1
The Capsule Performance Table which follows sets forth the actual past performance of the Long/Short Commodity Series Class 1 during the period covered by the table.PAST PERFORMANCE IS NOT NECESSARILY INDICATIVE OF FUTURE RESULTS.
Month | 2006 | ||
January | |||
February | |||
March | 0.96 | % | |
April | 2.40 | % | |
May | -2.22 | % | |
June | -2.52 | % | |
July | -0.36 | % | |
August | -1.83 | % | |
September | -1.61 | % | |
October | 4.44 | % | |
November | 1.93 | % | |
December | |||
Year | 0.96 | % |
Name of pool: | The Frontier Fund | |
This pool is a multi-advisor advisor pool as defined in CFTC Regulation Section 4.10(d)(2). | ||
Name of Series: | Long/Short Commodity Series Class 1 | |
Inception of Trading of Long/Short Commodity Series Class 1: | March 6, 2006 | |
Aggregate Gross Capital Subscriptions for Long/Short Commodity Series Class 1 as of November 30, 2006: | $22,271,033.22 | |
Net Asset Value of Long/Short Commodity Series Class 1 as of November 30, 2006: | $19,637,048.91 | |
Worst Monthly Percentage Draw-down: | -2.52% (June 2006) | |
Worst peak-to-valley Draw-down: | -8.26% (April 2006 through September 2006) | |
The Long/Short Commodity Series Class 1 performance table sets forth the actual performance of the Long/Short Commodity Series Class 1. Actual gross trading performance (gross realized and unrealized gain/loss before deduction for trading commissions and fees, management fees, any other expenses, and before addition of interest income) is adjusted for the trading expenses, management fees, initial service fees, on-going service fees, and interest income of the Long/Short Commodity Series Class 1 of The Frontier Fund. These items, as an annualized percentage calculated monthly on the adjusted beginning of month net asset value are:
• Brokerage commissions and trading fees: | 2.06% | |
• Management fees: | 3.5% | |
• Initial service fees and on-going service fees: | 3.0% | |
An incentive fee of 20% of New High Net Trading Profits (as defined), earned quarterly, is calculated in the composite performance table. Also, twenty percent (20%) of any interest income, based upon applying the 90-day Treasury Bill rate for each month to the adjusted beginning of month net asset value, is credited in the composite past performance table.
| * | Draw-down means losses experienced by the pool over a specified period. |
| ** | Worst peak to valley draw-down means the greatest cumulative percentage decline in month-end net asset value due to losses sustained by the pool during any period in which the initial month-end net asset value is not equaled or exceeded by a subsequent month-end net asset value. |
Long/Short Commodity App. - 7
Table of Contents
PAST PERFORMANCE OF LONG/SHORT COMMODITY SERIES CLASS 2
The Capsule Performance Table which follows sets forth the actual past performance of the Long/Short Commodity Series Class 2 during the period covered by the table.PAST PERFORMANCE IS NOT NECESSARILY INDICATIVE OF FUTURE RESULTS.
Month | 2006 | ||
January | |||
February | |||
March | 1.20 | % | |
April | 2.63 | % | |
May | -1.95 | % | |
June | -2.28 | % | |
July | -0.10 | % | |
August | -1.58 | % | |
September | -1.38 | % | |
October | 4.70 | % | |
November | 2.17 | % | |
December | |||
Year | 3.22 | % |
Name of pool: | The Frontier Fund | |
This pool is a multi-advisor advisor pool as defined in CFTC Regulation Section 4.10(d)(2). | ||
Name of Series: | Long/Short Commodity Series Class 2 | |
Inception of Trading of Long/Short Commodity Series Class 2: | March 6, 2006 | |
Aggregate Gross Capital Subscriptions for Long/Short Commodity Series Class 2 as of November 30, 2006: | $2,429,525.38 | |
Net Asset Value of Long/Short Commodity Series Class 2 as of November 30, 2006: | $2,711,151.39 | |
Worst Monthly Percentage Draw-down: | -2.28% (June 2006) | |
Worst peak-to-valley Draw-down: | -7.10% (April 2006 through September 2006) | |
The Long/Short Commodity Series Class 2 performance table sets forth the actual performance of the Long/Short Commodity Series Class 2. Actual gross trading performance (gross realized and unrealized gain/loss before deduction for trading commissions and fees, management fees, any other expenses, and before addition of interest income) is adjusted for the trading expenses, management fees, initial service fees, on-going service fees, and interest income of the Long/Short Commodity Series Class 2 of The Frontier Fund. These items, as an annualized percentage calculated monthly on the adjusted beginning of month net asset value are:
• Brokerage commissions and trading fees: | 2.06% | |
• Management fees: | 3.5% | |
An incentive fee of 20% of New High Net Trading Profits (as defined), earned quarterly, is calculated in the composite performance table. Also, twenty percent (20%) of any interest income, based upon applying the 90-day Treasury Bill rate for each month to the adjusted beginning of month net asset value, is credited in the composite past performance table.
| * | Draw-down means losses experienced by the pool over a specified period. |
| ** | Worst peak to valley draw-down means the greatest cumulative percentage decline in month-end net asset value due to losses sustained by the pool during any period in which the initial month-end net asset value is not equaled or exceeded by a subsequent month-end net asset value. |
Long/Short Commodity App. - 8
Table of Contents
MANAGED FUTURES INDEX SERIES APPENDIX
TO PART I OF THE
PROSPECTUS
OF
THE FRONTIER FUND
(A statutory trust formed under the laws of Delaware)
MANAGED FUTURES INDEX SERIES-1 UNITS
MANAGED FUTURES INDEX SERIES-2 UNITS
Conquest Capital, LLC
This Managed Futures Index Series Appendix (the “Managed Futures Index Series Appendix”) is dated February 12, 2007.
Table of Contents
THE FRONTIER FUND
MANAGED FUTURES INDEX SERIES-1 UNITS
MANAGED FUTURES INDEX SERIES-2 UNITS
This Managed Futures Index Series Appendix to the prospectus, dated February 12, 2007, including all exhibits thereto as the same may be amended and supplemented from time to time, or the Prospectus, of The Frontier Fund, or the Trust, a statutory trust formed under the laws of the state of Delaware relates to the units of beneficial interest in the Trust, or the Units, designated as Managed Futures Index Series Units. Capitalized terms used in this Managed Futures Index Series Appendix and not otherwise expressly defined herein shall have the same respective meanings as set forth in the Prospectus. This Managed Futures Index Series Appendix must be accompanied by, and read in conjunction with, the Prospectus.
The Managed Futures Index Series Units are being offered in two (2) Classes. The Managed Futures Index Series Units in Class 1 (as described in the Prospectus) are designated as the “Managed Futures Index Series-1 Units,” and the Managed Futures Index Series Units in Class 2 (as described in the Prospectus) are designated as the “Managed Futures Index Series-2 Units.” The Trust is offering both the Managed Futures Index Series-1 Units and the Managed Futures Index Series-2 Units pursuant to the Prospectus and this Managed Futures Index Series Appendix. Prospective purchasers of the Managed Futures Index Series-1 Units and Managed Futures Index Series-2 Units should carefully review the Prospectus and this Managed Futures Index Series Appendix before determining to purchase such Units.
The Managing Owner intends to contribute funds to the Trust in order to have a 1% interest in the aggregate capital, profits and losses of the Managed Futures Index Series and in return will receive Units designated as General Units in such Series.
TRADING ADVISOR
Conquest Capital LLC, or Conquest, a limited liability company organized in Delaware, acts as the Trading Advisor with respect to the assets allocable to the Managed Futures Index Series Units. The assets allocable to the Managed Futures Index Series Units will be contributed to a Trading Company for which Conquest will act as the Trading Advisor pursuant to the Conquest Managed Futures Select program described below.
Background of Conquest
Conquest Capital LLC is a Delaware limited liability company, which is registered with the CFTC as a commodity-trading advisor (“CTA”) and is a member in good standing of the NFA. The business address of Conquest is 540 Madison Avenue, 20th Floor, New York, New York 10022.
Conquest was formed on April 13, 2001. Conquest became registered with the CFTC as a CPO and a CTA on May 9, 2001 and became a member of the NFA on May 9, 2001. Such registrations and memberships do not imply that the CFTC or the NFA have endorsed Conquest’s qualifications to provide the advisory services described herein.
Principals of Conquest
Marc H. Malek
Mr. Malek started his career in August 1992 at Salomon Brothers in New York as a financial analyst in the Financial Strategy Group, remaining there until March 1993. From Salomon, he was hired in March 1993 at KB Currency Advisors, or KB, a hedge fund and financial advisory firm. For the next two years, until March 1995, Mr. Malek traded currency options, worked on developing proprietary trend following trading systems, and dealt
Managed Futures Index App. - 2
Table of Contents
with currency overlay customers. Mr. Malek left KB in March 1995 as a Senior Vice President, and in that same month joined the Union Bank of Switzerland in their currency options group. Mr. Malek held various senior level positions within the foreign exchange department at UBS in New York, London, and Tokyo. He was the worldwide head of the Exotic FX Derivatives Group, and at the time he left the bank in January 1999, he held the post of Executive Director in charge of FX Proprietary Trading in Europe. From May 1999 to November 2002, Mr. Malek was a principal and associated person of Avalon Asset Management LLC, a CPO and CTA. From March 2000 through May 2001, he held the same status with Enterprise Asset Management LLC, a CPO and CTA affiliated with Avalon. From April 2001 through August 2002, Mr. Malek was registered as a principal and associated person of Camelot LLC. Mr. Malek co-founded Conquest Capital Group LLC in June of 2001. Mr. Malek has been registered as a principal and associated person of the subsidiaries of Conquest Capital Group LLC: Conquest Capital LLC since May 2001, Condor Capital LLC since May 2001 and CC Asset Management LLC since February 2003.
Richard J. Silver
Mr. Silver has spent 13 years in the investment banking business where he was most recently a senior managing director at the Union Bank of Switzerland. He built and managed businesses in foreign exchange, derivatives and emerging markets in the U.S., Europe and Asia. These businesses generated over $200 million in revenues and employed 120 people globally. Prior to UBS, he managed similar businesses at Bankers Trust in New York, London, and Tokyo. Mr. Silver began his career at O’Connor and Associates, a premier derivatives boutique in Chicago, where he became one of the lead portfolio managers in the currency derivatives business. Mr. Silver received a B.S. in Economics from the Wharton School at the University of Pennsylvania in 1987.
Conquest Capital Group LLC
Conquest Capital Group LLC is a Delaware limited liability company which owns Conquest, Condor Capital LLC (which manages fund of fund portfolios), and CC Asset Management (which serves as managing member of funds managed by Conquest and Condor Capital LLC).
Mr. Malek is primarily responsible for making trading decisions on behalf of Conquest.
Conquest will conduct its trading for the Managed Futures Index Series Units pursuant to the Conquest Managed Futures Select program through a Trading Company.
CONQUEST INVESTMENT STRATEGY
The assets of the Managed Futures Index Series will be invested in the Conquest Managed Futures Select program, a program designed to provide exposure to the “beta” of managed futures as an asset class. The Conquest Managed Futures Benchmark is a managed futures index intended to measure the beta of managed futures.
What is Managed Futures?
The term “Managed Futures” generally refers to an alternative investment style and an asset class that is generally defined by both the markets traded (typically global macro markets: foreign exchange and futures on financial instruments or commodities) and a largely systematic approach.
Access to this asset class is typically achieved via a fund vehicle or a managed account, both of which trade the underlying instruments at the direction of a CTA or CPO. These entities are in turn regulated by the NFA and the CFTC.
Managed Futures Index App. - 3
Table of Contents
Most CTAs’ and CPOs’ strategies are designed to capture the break-out and trending characteristics of global macro markets on a given time frame. The vast bulk (roughly 90%) of Managed Futures funds are long-term trend followers, looking to capture trends that occur over periods in excess of 50 or so days. As a result, they hold positions for several months or even years.
What are the potential benefits and drawbacks of Managed Futures?
Most Managed Futures managers are fairly opaque in terms of disclosing the intricacies of their investment style due to its quantitative, systematic and therefore replicable approach.
CTAs evidence significant degrees of correlation with each other, primarily because many long-term trend followers attempt to capture the same broad trends in the same markets. This in turn makes diversification difficult to achieve unless one is willing to spread the allocation to the asset class across a great number of managers.
Due to the breakout nature of the underlying strategy and the concordant volatility of returns, CTAs are often regarded as high-risk investments. CTAs as a group have, in fact, evidenced lower average annualized standard deviation than the individual firms featured in such indices as the Dow Jones 30 Industrial Index for the period 1990-2003 (27.5% vs. 29.04%).
Potential benefits of investing in Managed Futures include: reduced portfolio risk, potential for enhanced portfolio returns, the ability to profit in different economic environments, the ease of global diversification, as well as lower transaction costs, lower market impact costs, and trading in liquid markets.
Relative to most alternative investment styles or asset classes, CTAs evidence very little overall correlation to traditional asset classes. In fact, when equity returns are negative, managed futures programs tend to be negatively correlated with equity indices; when equity returns are positive, they tend to be slightly positively correlated.
Managed Futures offers an increased return-to-risk ratio when considered as an addition to a widely diversified portfolio. From May 1999-March 2005, the Sharpe ratios of portfolios which include at least a 10% investment in Managed Futures typically exceed those of portfolios including solely traditional stock and bond investments. or stock, bond, and hedge funds.
The Beta of Managed Futures
Due to the limited subset of opportunities (i.e., there are only so many long term trends that exist in any given year) long-term trend followers tend to evidence high positive correlations to each other and provide access to the same, basic trending behavior of markets. This behavior can in turn be considered the “beta” of managed futures.
Not only do long-term trend followers look like each other, they resemble their own CTA indices in return characteristics and correlation profiles. These funds primarily provide basic access to the trending characteristics of Managed Futures as an asset class; put differently, they produce Managed Futures Beta.
Access to the “beta” of an asset class is typically accomplished through investment in an index relating to the asset class. The Conquest Managed Futures Select program is designed to provide this commoditized “Beta” portion of Managed Futures by trading a selection of nth-day time frames that best represent Long-Term trend followers as a group. The Conquest Managed Futures Select program thus allows clients efficient and robust access to Managed Futuresas an asset class.
Managed Futures Index App. - 4
Table of Contents
Conquest Managed Futures Beta (Conquest Managed Futures Index): A Benchmark
The Conquest Managed Futures Beta benchmark consists of twenty systems trading the world’s most liquid currency, fixed income, commodity, and equity index markets. In designing the benchmark, particular care was taken to avoid the danger of optimizing. In general, the more complicated a trading system, the more parameters there are in the trading system, the more possible versions of the system there are and therefore, the greater the ability to fine tune the system to produce specific results from a set of market prices and the greater the susceptibility of the system to optimization. As a corollary to this, the fewer parameters there are, the more likely past performance is to be indicative of future results.
The trend following system at the heart of the benchmark is as simple as possible and contains only a single parameter: enter a market long when its price exceeds its highest price over the time frame being examined and short the market when its price is below its lowest price for that period1. To ensure that all relevant time frames were captured, the system utilizes twenty different time frames from 5 days to 200 days. To minimize the overlap between the systems, the time frames were chosen based on a logarithmic function, which results in systems being more closely spaced near the shorter end and more widely spaced near the longer end of the range. This makes intuitive sense: 5- and 10-day trends look very dissimilar whereas 195- and 200-day trends look nearly identical.
Markets were selected on the basis of liquidity and diversification2. That is, the most liquid markets in the world were selected consistent with having exposure to all asset classes (commodities, equities, fixed income and currencies) and all geographic regions (Asia, Europe and North America). In addition, an effort was made to ensure that the exposure of the benchmark to different asset classes was representative of the exposure of the managed futures space and that the markets traded are representative of those traded by CTAs. Allocations to different sectors were determined by averaging the sector allocations of 26 different long-term trend following managers3. Markets within each sector are equally weighted, except where liquidity conditions dictate otherwise4. The size of positions in a market is based on the thirty day historical standard deviation of closing prices in that market.
CONQUEST MANAGED FUTURES SELECT (MFS)
The Conquest Managed Futures Select program implements and trades the nth day benchmark models:
| • | Diversified across time frames: utilizing 20 different “nth day” models, ranging from 5 to 200 days |
| • | Diversified across geographic regions: trades European, North American and Asian blocks |
| • | Diversified across asset classes and markets: trades 55 markets across six sectors, covering foreign exchange, fixed income, equities, energies, metals and agricultural commodities. |
By implementing and trading a large number of these single variable (nth day breakout) benchmarks and broadly diversifying across time frame and sector, the Conquest Managed Futures Select program will attempt to replicate the exposure and beta returns of managed futures as an asset class.
| 1 | More formally: Where N equals the number of days, go long if the price exceeds the highest price occurring over the past N days and go short if the price goes below the lowest price occurring over the past N days. |
| 2 | 55 markets are included. |
| 3 | This allocation may change in the future based on changes in sector allocation of long-term trend following managers. However, the current allocation was used to generate prior returns of the Conquest Managed Futures Beta benchmark. |
| 4 | For the less liquid markets only the ten systems with the largest values of N were traded. In other words, for these markets only the longer term systems were traded. |
Managed Futures Index App. - 5
Table of Contents
Description of Trading Program
Conquest may invest long or short, on margin or otherwise, in a wide range of listed and unlisted domestic and international futures, forward contracts, and currencies. The foregoing should not be construed to limit in any way the instruments or markets in which Conquest may invest. Conquest seeks to trade in markets that are usually traded by CTAs, while taking liquidity into account. However, there can be no guarantee that the markets traded by Conquest include all of those typically traded by CTAs and do not include any that are not typically traded by CTAs.
The program uses multiple trend-following systems, each of which buys and sells based on whether the price for the relevant instrument is above the highest or below the lowest price of such instrument in a specified number of days. The program will always have a position in each market which it trades. In certain less liquid markets, only a portion of the systems are used. The program may in the future use other or different systems, which might result in changes to the information in this paragraph. Trades will only be entered as a result of a signal if trading on the signal would change a position from long to short or vice versa. Position volatility, at the time a trade is entered, is normalized across markets such that, subject to rounding as a result of contract sizes, an equal dollar amount of risk is taken by each system which trades the market in each trade as determined by the market’s underlying volatility. However, position size is not adjusted for changes in volatility until a new trade is entered.
Markets Traded
The table below sets forth the allocation to various markets anticipated to be traded.
Agriculturals | Energy | Stock Indices | Interest Rates | Currencies | Metals | |||||
8% | 12% | 15% | 31% | 27% | 7% |
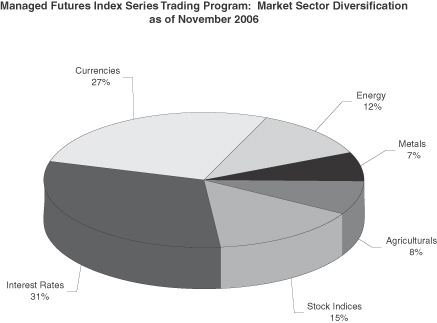
Managed Futures Index App. - 6
Table of Contents
MANAGEMENT AND INCENTIVE FEES
Management Fees
The Managed Futures Index Series Units will pay to the Managing Owner a monthly management fee equal to 1/12th of 2.0% of the Managed Futures Index Series’ Net Asset Value (approximately 2.0% annually). The Managing Owner may pay all or a portion of such management fees to Conquest.
Incentive Fees
The Managed Futures Index Series Units will pay to the Managing Owner no incentive fee.
Managed Futures Index App. - 7
Table of Contents
PROJECTED TWELVE MONTH BREAK EVEN ANALYSIS
The table below shows the estimated amount of all fees and expenses which are anticipated to be incurred by a new investor in the Managed Futures Index Series-1 Units and Managed Futures Index Series-2 Units during the first twelve months. The total estimated cost and expense load of Managed Futures Index Series-1 Units and Managed Futures Index Series-2 Units is expressed as a percentage of $1,000, the amount of a minimum investment in the Trust (other than by Plans (including IRAs), employees or family members of an employee of the Managing Owner or its affiliates or charitable organizations). Residents of Texas have a minimum initial subscription requirement of $5,000, or, residents of Texas who are Plans (including IRAs), an employee or family member of an employee of the Managing Owner or its affiliates or a charitable organization, have a minimum initial subscription requirement of $1,000. Although the Managing Owner has used actual numbers and good faith estimates in preparing this table, the actual expenses associated with an investment in the Managed Futures Index Series Units may differ.
| Managed Futures Index Series-1 | Managed Futures Index Series-2 | |||||||||||||
| Amount-$ | Amount-% | Amount-$ | Amount-% | |||||||||||
Initial Selling Price(1) | $ | 1,000 | 100 | % | $ | 1,000 | 100 | % | ||||||
Syndication and Selling Expenses(2) | $ | 0 | 0 | % | $ | 0 | 0 | % | ||||||
Trust Operating Expenses(3) | $ | 0 | 0 | % | $ | 0 | 0 | % | ||||||
Management Fee(4) | $ | 20.00 | 2.00 | % | $ | 20.00 | 2.00 | % | ||||||
Service Fee(5) | $ | 20.00 | 2.00 | % | $ | 0 | 0.00 | % | ||||||
Brokerage Commissions and Trading Fees(6) | $ | 12.00 | 1.20 | % | $ | 12.00 | 1.20 | % | ||||||
Less Interest Income(7) | $ | (39.20 | ) | (3.92 | )% | $ | (39.20 | ) | (3.92 | )% | ||||
Amount of Trading Income Required for the Trust’s Net Asset Value per Unit (Redemption Value) at the End of One Year to Equal the Selling Price per Unit | $ | 12.80 | 1.28 | % | $ | (7.20 | ) | (0.72 | )% | |||||
Notes
| (1) | The initial selling price per Unit is $100. The amount reflected in the table represents the amount of minimum investment in the Trust (other than Plans (including IRAs), employees or family members of an employee of the Managing Owner or its affiliates or charitable organizations) because the total costs and expenses as set forth in the break-even analysis are the costs and expenses associated with a minimum investment of $1,000. |
| (2) | Expenses incurred in connection with the organization of the Trust and the offering of Units during the Initial Offering Period were paid by the Managing Owner without reimbursement. |
| (3) | The Managing Owner pays for all accounting, auditing, legal and routine operational and administrative expenses without reimbursement. |
| (4) | The Managing Owner will receive a monthly management fee of approximately 0.167% (2.00% annually) of the Managed Futures Index Series’ Net Asset Value, which it will use to pay all management fees payable to the Trading Advisor. |
| (5) | With respect to Class 1 of the Managed Futures Index Series of Units, as compensation, the Selling Agents will receive an initial service fee at an annual rate of up to 2.0% of the subscription amount of each subscription for Units in Class 1 of the Managed Futures Index Series sold by them. The initial service fee will be prepaid by the Managing Owner. If you redeem all or a portion of your Units in Class 1 of the Managed Futures Index Series during the first twelve (12) months following the effective date of their purchase, you will be subject to a redemption fee of up to 2.0% of the Net Asset Value at which they are redeemed. The amount of the redemption fee associated with each Series at any moment equals the amount |
Managed Futures Index App. - 8
Table of Contents
of unamortized initial service fee prepaid by the Managing Owner for such Series, and as such the aggregate amount of the redemption fee and the initial service fee cannot exceed 2.0%. Therefore the break-even analysis does not include a separate entry for the redemption fee. |
| (6) | The Trust, with respect to the Managed Futures Index Series will pay the Clearing Brokers and the Managing Owner a fee of approximately 1.20% of the Managed Futures Index Series’ Net Asset Value annually, which will be used to pay all brokerage commissions, plus applicable exchange fees, NFA fees, give up fees, and other transaction related fees and expenses charged in connection with the Managed Futures Index Series’ trading activities and on-going service fees for certain administrative services payable to certain Selling Agents selling Class 2 Units of the Managed Futures Index Series. |
| (7) | Interest income for the Managed Futures Index Series-1 Units and the Managed Futures Index Series-2 Units is currently estimated at 4.12%. Twenty percent (20%) of interest income earned per annum by the Trust on the Managed Futures Index Series will be paid to the Managing Owner. The remaining eighty percent (80%) of interest income earned per annum by the Trust on the Managed Futures Index Series will be retained by the Trust. |
Managed Futures Index App. - 9
Table of Contents
PAST PERFORMANCE OF MANAGED FUTURES INDEX SERIES CLASS 1
The Capsule Performance Table which follows sets forth the actual past performance of the Managed Futures Index Series Class 1 during the period covered by the table.PAST PERFORMANCE IS NOT NECESSARILY INDICATIVE OF FUTURE RESULTS.
| Month | 2006 | |
January | ||
February | ||
March | ||
April | 2.48% | |
May | 1.51% | |
June | -4.47% | |
July | -3.29% | |
August | 1.99% | |
September | -2.96% | |
October | -0.83% | |
November | 1.66% | |
December | ||
Year | -4.12% |
Name of pool: | The Frontier Fund | |
This pool is a multi-advisor advisor pool as defined in CFTC Regulation Section 4.10(d)(2). | ||
Name of Series: | Managed Futures Index Series Class 1 | |
Inception of Trading of Managed Futures Index Series Class 1: | April 25, 2006 | |
Aggregate Gross Capital Subscriptions for Managed Futures Index Series Class 1 as of November 30, 2006: | $586,719.84 | |
Net Asset Value of Managed Futures Index Series Class 1 as of November 30, 2006: | $479,608.78 | |
Worst Monthly Percentage Draw-down: | -4.47% (June 2006) | |
Worst peak-to-valley Draw-down: | -9.33% (May 2006 through October 2006) | |
The Managed Futures Index Series Class 1 performance table sets forth the actual performance of the Managed Futures Index Series Class 1. Actual gross trading performance (gross realized and unrealized gain/loss before deduction for trading commissions and fees, management fees, any other expenses, and before addition of interest income) is adjusted for the trading expenses, management fees, initial service fees, on-going service fees, and interest income of the Managed Futures Index Series Class 1 of The Frontier Fund. These items, as an annualized percentage calculated monthly on the adjusted beginning of month net asset value are:
| • | Brokerage commissions and trading fees: 1.20% |
| • | Management fees: 2.0% |
| • | Initial service fees and on-going service fees: 2.0% |
Twenty percent (20%) of any interest income, based upon applying the 90-day Treasury Bill rate for each month to the adjusted beginning of month net asset value, is credited in the composite past performance table.
| * | Draw-down means losses experienced by the pool over a specified period. |
| ** | Worst peak to valley draw-down means the greatest cumulative percentage decline in month-end net asset value due to losses sustained by the pool during any period in which the initial month-end net asset value is not equaled or exceeded by a subsequent month-end net asset value. |
Managed Futures Index App. - 10
Table of Contents
PAST PERFORMANCE OF MANAGED FUTURES INDEX SERIES CLASS 2
The Capsule Performance Table which follows sets forth the actual past performance of the Managed Futures Index Series Class 2 during the period covered by the table.PAST PERFORMANCE IS NOT NECESSARILY INDICATIVE OF FUTURE RESULTS.
| Month | 2006 | |
January | ||
February | ||
March | ||
April | 2.63% | |
May | 1.69% | |
June | -4.32% | |
July | -3.13% | |
August | 2.16% | |
September | -2.81% | |
October | -0.66% | |
November | 1.83% | |
December | ||
Year | -2.83% |
Name of pool: | The Frontier Fund | |
This pool is a multi-advisor advisor pool as defined in CFTC Regulation Section 4.10(d)(2). | ||
Name of Series: | Managed Futures Index Series Class 2 | |
Inception of Trading of Managed Futures Index Series Class 2: | April 25, 2006 | |
Aggregate Gross Capital Subscriptions for Managed Futures Index Series Class 2 as of November 30, 2006: | $2,500.00 | |
Net Asset Value of Managed Futures Index Series Class 2 as of November 30, 2006: | $52,047.23 | |
Worst Monthly Percentage Draw-down: | -4.32% (June 2006) | |
Worst peak-to-valley Draw-down: | -8.57% (May 2006 through October 2006) | |
The Managed Futures Index Series Class 2 performance table sets forth the actual performance of the Managed Futures Index Series Class 2. Actual gross trading performance (gross realized and unrealized gain/loss before deduction for trading commissions and fees, management fees, any other expenses, and before addition of interest income) is adjusted for the trading expenses, management fees, initial service fees, on-going service fees, and interest income of the Managed Futures Index Series Class 2 of The Frontier Fund. These items, as an annualized percentage calculated monthly on the adjusted beginning of month net asset value are:
| • | Brokerage commissions and trading fees: 1.20% |
| • | Management fees: 2.0% |
Twenty percent (20%) of any interest income, based upon applying the 90-day Treasury Bill rate for each month to the adjusted beginning of month net asset value, is credited in the composite past performance table.
| * | Draw-down means losses experienced by the pool over a specified period. |
| ** | Worst peak to valley draw-down means the greatest cumulative percentage decline in month-end net asset value due to losses sustained by the pool during any period in which the initial month-end net asset value is not equaled or exceeded by a subsequent month-end net asset value. |
Managed Futures Index App. - 11
Table of Contents
PAST PERFORMANCE OF CONQUEST CAPITAL
The Capsule Performance Table which follows sets forth the actual past performance of all client accounts* directed by Conquest Capital utilizing the Managed Futures Select program during the period covered by the table.PAST PERFORMANCE IS NOT NECESSARILY INDICATIVE OF FUTURE RESULTS.
Conquest Managed Futures Select Program
| Month | 2006 | 2005 | 2004 | |||
January | 2.20% | -5.07% | ||||
February | -3.16% | 2.73% | ||||
March | 2.76% | -0.86% | ||||
April | 10.36% | -2.06% | ||||
May | 0.71% | 0.59% | ||||
June | -4.11% | 1.93% | -4.19% | |||
July | -1.51% | -2.17% | -1.03% | |||
August | 1.09% | 3.18% | -1.78% | |||
September | -2.11% | -0.18% | 2.88% | |||
October | 1.22% | -2.85% | 1.71% | |||
November | 2.14% | 3.38% | 5.64% | |||
December | -0.75% | -0.76% | ||||
Year | 9.23% | -2.48% | 2.17% |
Name of Trading Advisor: | Conquest Capital LLC | |
Name of Program: | Managed Futures Select Program | |
Inception of Client Account Trading by Trading Advisor: | June 2001 | |
Inception of Client Account Trading in Program: | June 2004 | |
Number of Open Accounts: | 3 | |
Aggregate Assets Overall: | 268,000,000 | |
Aggregate Assets in Program: | 136,000,000 | |
Worst Monthly Draw-down: | -5.07% (January 2005) | |
Worst Peak-to-valley Draw-down: | -6.87% (June 2004 to August 2004) | |
Number of Profitable Closed Accounts: | 0 | |
Number of Unprofitable Closed Accounts: | 1 |
| * | The composite performance of the Managed Futures Select Program presented in the Capsule Performance Table above from June 2005 through November 2005 does not include the performance of the account of a “qualified eligible person” which had divergent returns from the other accounts in the Managed Futures Select Program. |
Draw-down means losses experienced by the account over a specified period.
Worst peak-to-valley draw-down means the greatest cumulative percentage decline in month-end net asset value due to losses sustained by the trading program during any period in which the initial month-end net asset value is not equaled or exceeded by a subsequent month-end net asset value.
Managed Futures Index App. - 12
Table of Contents
PROGRAMS NOT UTILIZED
The following are programs of Conquest Capital that are not anticipated to be utilized by The Frontier Fund.
The following summary performance information presents the composite performance results of the Conquest Capital 1X Trading Program for the period from January 2001 through November 2006.
PAST PERFORMANCE IS NOT NECESSARILY INDICATIVE OF FUTURE RESULTS.
Name of Trading Advisor: | Conquest Capital LLC | |
Name of Program: | 1X Trading Program | |
Inception of Client Account Trading: | June 2001 | |
Inception of Client Account Trading in Program: | June 2001 | |
Number of Accounts Open: | 3 | |
Aggregate Assets Overall: | $268,000,000 | |
Aggregate Assets in Program: | $36,000,000 | |
Worst Monthly Draw-down: | -10.22% (April 2003) | |
Worst Peak-to-Valley Draw-down: | -16.19% (October 2003 to March 2005) | |
2006 Compound Rate of Return (11 months): | 7.41% | |
2005 Compound Rate of Return: | 1.68% | |
2004 Compound Rate of Return: | -0.69% | |
2003 Compound Rate of Return: | 0.29% | |
2002 Compound Rate of Return: | 35.31% | |
2001 Compound Rate of Return (7 months): | 1.37% |
Draw-down means losses experienced by the account over a specified period.
Worst peak-to-valley draw-down means the greatest cumulative percentage decline in month-end net asset value due to losses sustained by the trading program during any period in which the initial month-end net asset value is not equaled or exceeded by a subsequent month-end net asset value.
Managed Futures Index App. - 13
Table of Contents
The following summary performance information presents the composite performance results of the Conquest Capital 3X Trading Program for the period from January 2001 through November 2006.
PAST PERFORMANCE IS NOT NECESSARILY INDICATIVE OF FUTURE RESULTS.
Name of Trading Advisor: | Conquest Capital LLC | |
Name of Program: | 3X Trading Program | |
Inception of Client Account Trading: | June 2001 | |
Inception of Client Account Trading in Program: | July 2001 | |
Number of Accounts Open: | 2 | |
Aggregate Assets Overall: | $268,000,000 | |
Aggregate Assets in Program: | $5,500,000 | |
Worst Monthly Draw-down: | -31.45% (April 2003) | |
Worst Peak-to-Valley Draw-down: | -45.19%(October 2003 to March 2005) | |
2006 Compound Rate of Return (11 months): | 10.7% | |
2005 Compound Rate of Return: | -2.82% | |
2004 Compound Rate of Return: | -3.99% | |
2003 Compound Rate of Return: | -9.88% | |
2002 Compound Rate of Return: | 62.62% | |
2001 Compound Rate of Return (6 months): | 13.81% |
Draw-down means losses experienced by the account over a specified period.
Worst peak-to-valley draw-down means the greatest cumulative percentage decline in month-end net asset value due to losses sustained by the trading program during any period in which the initial month-end net asset value is not equaled or exceeded by a subsequent month-end net asset value.
Managed Futures Index App. - 14
Table of Contents
The following summary performance information presents the composite performance results of Enterprise Asset Management, L.L.C. for the period from January 2001 through the month such program closed.
PAST PERFORMANCE IS NOT NECESSARILY INDICATIVE OF FUTURE RESULTS.
—This Program is Closed—
Name of Trading Advisor: | Enterprise Asset Management, L.L.C. | |
Name of Program: | Enterprise Asset Management | |
Inception of Client Account Trading: | May 1999 | |
Inception of Client Account Trading in Program: | May 1999 | |
Number of Accounts Open: | 0 | |
Aggregate Assets Overall: | 0 | |
Aggregate Assets in Program: | 0 | |
Worst Monthly Draw-down: | -6.22% (April 2001) | |
Worst Peak-to-Valley Draw-down: | -11.01% (January 2001 through February 2001) | |
2006 Compound Rate of Return: | N/A | |
2005 Compound Rate of Return: | N/A | |
2004 Compound Rate of Return: | N/A | |
2003 Compound Rate of Return: | N/A | |
2002 Compound Rate of Return: | N/A | |
2001 Compound Rate of Return (7 months): | -5.29% |
Enterprise Asset Management, L.L.C. ceased trading on July 31, 2001.
Draw-down means losses experienced by the account over a specified period.
Worst peak-to-valley draw-down means the greatest cumulative percentage decline in month-end net asset value due to losses sustained by the trading program during any period in which the initial month-end net asset value is not equaled or exceeded by a subsequent month-end net asset value.
Managed Futures Index App. - 15
Table of Contents
STATEMENT OF ADDITIONAL INFORMATION
This statement of additional information (the “Statement of Additional Information”) is not a prospectus and should be read in conjunction with the prospectus dated February 12, 2007 (the “Prospectus”), of The Frontier Fund (the “Trust”). This Statement of Additional Information is incorporated by reference into the Prospectus. A copy of the Prospectus may be obtained free of charge by contacting Equinox Fund Management, LLC, the Trust’s managing owner (the “Managing Owner”). The Managing Owner is located at 1660 Lincoln Street, Suite 100, Denver, Colorado 80264. The Managing Owner’s telephone number is (303) 837-0600, and its facsimile number is (303) 832-9354.
The date of this Statement of Additional Information is February 12, 2007.
Table of Contents
STATEMENT OF ADDITIONAL INFORMATION
Table of Contents
| SAI - 1 | ||
| SAI - 8 | ||
| SAI - 12 | ||
| SAI - 16 | ||
| SAI - 17 | ||
| SAI - 30 | ||
| SAI - 63 |
SAI-ii
Table of Contents
THE NON-MAJOR TRADING ADVISORS
Balanced Series Non-Major Trading Advisors
Chesapeake Capital Corporation, an Illinois corporation (“Chesapeake”), CTS Capital Management, LLC, a Colorado limited liability company (“CTS”), Dekker Capital Management, LLC, a Delaware limited liability company (“Dekker”), Dighton Capital USA, an Illinois limited liability company (“Dighton”), Dunn Capital Management, Inc., a Delaware corporation (“Dunn”), Forecast Trading Group, LLC, a New Jersey limited liability company (“Forecast”), and Phoenix Global Advisors, LLC, a Delaware limited liability company (“Phoenix”), are each considered a non-major Trading Advisor because they each will manage less than 10% of assets allocable to the Balanced Series Units through a Trading Company.
Chesapeake Capital Corporation
Chesapeake was incorporated under the laws of the Commonwealth of Virginia in February 1988 for the purpose of offering advisory and investment portfolio management services to both retail and institutional investors in trading Futures Interest Contracts. On August 19, 1991, Chesapeake was merged into Chesapeake Capital Corporation, an Illinois corporation formed on August 13, 1991. Chesapeake has been registered as a CTA and as a CPO with the CFTC since June 20, 1988, and May 8, 1991, respectively, and has also been a member of the NFA since June 20, 1988. Neither Chesapeake’s registration with the CFTC nor its membership in the NFA should be taken as an indication that any such agency or regulatory body has recommended or approved Chesapeake. Chesapeake’s principal place of business is located at 500 Forest Avenue, Richmond, Virginia 23229.
Chesapeake’s Principals are Chesapeake Holding Company, R. Jerry Parker, Jr., John M. Hoade, Robert S. Parker, Jr., and Warren K. Coleman.
Chesapeake will manage less than 10% of the assets allocable to the Balanced Series. Chesapeake will conduct its trading for its allocation from the Balanced Series through a Trading Company pursuant to Chesapeake’s Diversified 2XL Program. The annual rates of return with respect to the Diversified 2XL Program for the past five years and year-to-date are: 9.83% in 2006 (11 months), -3.75% in 2005, 4.33% in 2004, 44.36% in 2003, 20.83% in 2002, and -18.46% in 2001. The Worst Monthly Percentage Draw-Down of the Diversified 2XL Program is -20.52% in November 2001. The Worst Peak-to-Valley Draw-Down of the Diversified 2XL Program is -38.52% from March 2001 to April 2002. The amount of leverage employed by Chesapeake is 30%-40% (average margin/equity).PAST PERFORMANCE IS NOT NECESSARILY INDICATIVE OF FUTURE RESULTS.
CTS Capital Management, LLC
CTS was formed in 2005. CTS’s main business office is located at 4610 S. Ulster St., Suite 150, Denver CO 80237. CTS was formed in September 2005 for the purpose of offering investment advisory and portfolio management services to both retail and institutional investors in trading futures and options on futures contracts. CTS became registered as a CTA with the CFTC on September 29, 2005, and became a member of the NFA on October 4, 2005. Such registration and membership do not imply that the CFTC or the NFA have endorsed CTS’s qualifications to provide the advisory services described herein.
CTS’s principals are Brian Bell and Custom Trading Solutions, Inc. Mr. Bell is responsible for making trading decisions on behalf of CTS. Mr. Bell is a principal of The Bornhoft Group which is a principal of the Managing Owner. See “Actual and Potential Conflicts of Interest” in the Prospectus.
CTS will manage less than 10% of the assets allocable to the Balanced Series. CTS is considered an “Emerging Manager” to the Balanced Series. CTS will conduct its trading for its allocation from the Balanced
SAI-1
Table of Contents
Series through a Trading Company pursuant to CTS’s Diversified II Program. The annual rates of return with respect to the Diversified II Program since inception are: 0.66% in 2006 (9 months, November 2006 estimated). The Worst Monthly Percentage Draw-Down of the Diversified II Program is -3.19% in October 2006. The Worst Peak-to-Valley Draw-Down of the Diversified 1X Program is -6.90% from June 2006 to November 2006. The amount of leverage employed by CTS is 10% (average margin/equity).PAST PERFORMANCE IS NOT NECESSARILY INDICATIVE OF FUTURE RESULTS.
Dekker Capital Management, LLC
Dekker Capital Management is an Delaware Limited Liability Company established in May 2004. In July 2004, Dekker was registered with the CFTC as a CTA and CPO and became a member of the NFA. Dekker’s place of business is located at 923 Tahoe Blvd., Suite 110, Incline Village, Nevada, 89451.
Jason Dekker is the sole principal of Dekker Capital Management.
Dekker will manage less than 10% of the assets allocable to the Balanced Series. Dekker will conduct its trading for its allocation from the Balanced Series through a Trading Company pursuant to Dekker’s Global Diversified 3X Program. The annual rates of return with respect to the Global Diversified 3X Program for the past five years and year-to-date are: 40.64% in 2006 (11 months), 25.94% in 2005, and 27.37% in 2004 (4 months). The Worst Monthly Percentage Draw-Down of the Global Diversified 3X Program is –11.51% in September 2006. The Worst Peak-to-Valley Draw-Down of the Global Diversified 3X Program is –20.88% from June 2006 to November 2006. The amount of leverage employed by Dekker is 22.72% (average margin/equity).PAST PERFORMANCE IS NOT NECESSARILY INDICATIVE OF FUTURE RESULTS.
Dighton Capital USA
Dighton Capital USA is an Illinois limited liability company established in November 2005. In December 2005, Dighton Capital USA was registered with the CFTC as a CTA and CPO and has also been a member of the NFA as of the same date. Dighton Capital USA’s place of business is located at 2000 Island Blvd., Suite 1609, Aventura, FL 33160.
The Principals of Dighton Capital USA are Alex Moiseyev and Jakob Schneider.
Dighton will manage less than 10% of the assets allocable to the Balanced Series. Dighton will conduct its trading for its allocation from the Balanced Series through a Trading Company pursuant to Dighton’s SFT 2X Program. The annual rates of return with respect to the SFT 2X Program for the past five years and year-to-date are: 46.45% in 2006 (11 months), 43.80% in 2005, 95.44% in 2004, and 43.77% in 2003 (6 months). The Worst Monthly Percentage Draw-Down of the SFT 2X Program is -24.38% in September 2003. The Worst Peak-to-Valley Draw-Down of the SFT 2X Program is -24.38% from August 2003 to September 2003. The amount of leverage employed by Dighton is 20% (average margin/equity).PAST PERFORMANCE IS NOT NECESSARILY INDICATIVE OF FUTURE RESULTS.
Dunn Capital Management, Inc.
Dunn was incorporated in September 1974, in the State of Delaware. Its main business office is located at 309 SE Osceola Street, Suite 208, Stuart, Florida 34994, and it has been registered under the CE Act as a CPO and CTA since February 6, 1976 and is a member of the NFA. Such registration and membership do not imply that the CFTC and the NFA have endorsed Dunn’s qualifications to provide the advisory services described herein.
Dunn’s Principals are William A. Dunn, Ph.D., Daniel E. Dunn, Ph.D., M.D., Douglas W. Wright, Martin H. Bergin, J. Allen Como, Ralph L. Bonsignore, Carlos G. Alvarez, and The William A. Dunn Irrevocable Trust of 2001.
SAI-2
Table of Contents
Dunn will manage less than 10% of the assets allocable to the Balanced Series. Dunn will conduct its trading for its allocation from the Balanced Series through a Trading Company pursuant to Dunn’s Combined Financial, or DCF program, which is a 50-50 combination of its World Monetary & Agriculture, or WMA program and its Targets of Opportunity, or TOPS program, rebalanced monthly. The annual rates of return with respect to the DCF Program for the past five years and year-to-date are: -10.72 % in 2006 (11 months), -15.0% in 2005, -4.50% in 2004, -15.8% in 2003, 47.2% in 2002, and -0.20% in 2001. The Worst Monthly Percentage Draw-Down of the DCF Program is –24.50% in November 2001. The Worst Peak-to-Valley Draw-Down of the DCF Program is -51.80% from February 2003 to October 2006. The amount of leverage employed by Dunn is 19% (average margin/equity).PAST PERFORMANCE IS NOT NECESSARILY INDICATIVE OF FUTURE RESULTS.
Forecast Trading Group, LLC
For information regarding Forecast, please see “Long/Short Commodity Series Non-Major Trading Advisors,” below.
Phoenix Global Advisors, LLC
Phoenix was formed in 2001. Phoenix’s main business office is located at 1000 Skokie Boulevard, Suite 325, Wilmette, Illinois 60091. Phoenix was organized in 2001 as an independent CTA. It has been registered as a CTA with the CFTC since August 29, 2003 and has been a member of the NFA as of the same date. Such registration and membership do not imply that the CFTC or the NFA have endorsed Phoenix’s qualifications to the provide the advisory services described herein.
Phoenix’s principals are William Taki, Jr. and Peter Lacey, both of whom are responsible for making trading decisions on behalf of Phoenix.
Phoenix will manage less than 10% of the assets allocable to the Balanced Series. Phoenix is considered an “Emerging Manager” to the Balanced Series. Phoenix will conduct its trading for its allocation from the Balanced Series through a Trading Company pursuant to Phoenix’s Futures Only Program. The annual rates of return with respect to the Futures Only Program since inception are: -2.58% in 2006 (11 months, November estimated), 1.23% in 2005, 1.88% in 2004, 34.18% in 2003, 49.95% in 2002 and 23.83% in 2001 (7 months). The Worst Monthly Percentage Draw-Down of the Futures Only Program is -4.57% in October 2001. The Worst Peak-to-Valley Draw-Down of the Futures Only Program is -7.80% from August 2001 to October 2001. The amount of leverage employed by Phoenix is 6%-10% (average margin/equity).PAST PERFORMANCE IS NOT NECESSARILY INDICATIVE OF FUTURE RESULTS.
Long/Short Commodity Series Non-Major Trading Advisors
AAA Capital Management, a Texas corporation, (“AAA Capital”), AIS Futures Management LLC, a Delaware limited liability company (“AIS”), Forecast Trading Group, LLC, a New Jersey limited liability company (“Forecast”), Kottke Associates, LLC, an Illinois limited liability company (“Kottke”), Landmark Trading Company, a Colorado corporation (“Landmark”), Mississippi River Investments, Inc., a Tennessee corporation (“Mississippi River”), Red Oak Commodity Advisors, Inc., a Delaware corporation (“Red Oak”) and Skyline Management, Inc. d.b.a. Strategic Ag Trading, a Wyoming corporation (“Strategic Ag”), are each considered a non-major Trading Advisor because they each will manage less than 10% of assets allocable to the Long/Short Commodity Series Units through a Trading Company.
AAA Capital Management, Inc.
AAA Capital became registered under the CE Act as a CTA in May 1997. AAA Capital is also a member of the NFA and the New York Mercantile Exchange. AAA Capital’s main office is located at 1300 Post Oak Blvd.,
SAI-3
Table of Contents
Suite 350, Houston, Texas 77056. Such registration and membership do not imply that the CFTC or the NFA have endorsed AAA Capital’s qualifications to provide the advisory services described herein.
AAA Capital has four trading principals: A. Anthony Annunziato, John Saucer, Denys Thorez and Chad Shimaitis. AAA Capital also has two non-trading principals, Gerard Trevino (COO/CRO) and Angelo Joseph Annunziato, who will neither participate in making trading decisions for a client account of AAA Capital nor supervise or select persons so engaged.
AAA Capital will manage less than 10% of the assets allocable to the Long/Short Commodity Series. AAA Capital will conduct the trading for its allocation from the Long/Short Commodity Series through a Trading Company pursuant to AAA Capital Management’s Energy/Futures Only Program. The annual rates of return with respect to the Energy/Futures Only Program since 2001 are 16.81% in 2006 (11 months, October and November 2006 estimated), 81.17% in 2005, 39.58% in 2004, -20.97% in 2003, 38.34% in 2002, and 47.15% in 2001. The Worst Monthly Percentage Draw-Down of the Energy/Futures Only Program is -15.51% in February 2003. The Worst Peak-to-Valley Draw-Down of the Energy/Futures Only Program is - -27.26% from December 2002 through March 2003. The amount of leverage employed by AAA is 10%-20% (average margin to equity).PAST PERFORMANCE IS NOT NECESSARILY INDICATIVE OF FUTURE RESULTS.
AIS Futures Management LLC
AIS became registered under the CE Act as a CPO in May 1990 and as a CTA in August 1992. AIS is also a member of the NFA since May 1990. Such registration and membership do not imply that the CFTC or the NFA have endorsed AIS’ qualifications to provide the advisory services described herein. AIS’ main office is located at 187 Danbury Road, P.O. Box 806, Wilton, Connecticut 06897.
AIS has three principals, John Hummel, Bradley C. Stern and Robert F. Ward.
AIS will manage less than 10% of the assets allocable to the Long/Short Commodity Series. AIS will conduct the trading for its allocation from the Long/Short Commodity Series through a Trading Company pursuant to AIS’s MAAP 2X-4X Program. The annual rates of return with respect to the MAAP 2X-4X Program since 2001 is 11.65% in 2006 (11 months), 28.49% in 2005, 23.92% in 2004, 34.72% in 2003, -3.65% in 2002, and 3.24% in 2001. The Worst Monthly Percentage Draw-Down of the MAAP 2X-4X Program is -14.42% inMarch 2003. The Worst Peak-to-Valley Draw-Down of the MAAP 2X-4X Program is -20.12% from February 2003 through April 2003. The amount of leverage currently employed by AIS is 15.5% (average margin to equity).PAST PERFORMANCE IS NOT NECESSARILY INDICATIVE OF FUTURE RESULTS.
Forecast Trading Group, LLC
Forecast was established under the laws of the State of New Jersey in June 2001. Forecast is registered as a CTA with the CFTC in November 2001, is registered as a CPO with the CFTC in July 2004, and is a member of the NFA in such capacity effective November 2001. Such registration and membership do not imply that the CFTC or the NFA have endorsed Forecast’s qualifications to provide the advisory services described herein. Forecast’s principal office, and the site where its books and records are maintained, is located at 926 Haverstraw Road, Suffern, NY 10901
James R. Brunn is the sole principal and Managing Director of Forecast. Mr. Brunn is responsible for all trading decisions for Forecast.
Forecast will manage less than 10% of the assets allocable to the Long/Short Commodity Series. Forecast will conduct the trading for its allocation from the Long/Short Commodity Series through a Trading Company pursuant to Forecast’s Forecast Portfolio Program. The annual rates of return with respect to the Forecast Portfolio Program since 2001 are 9.18% in 2006 (11 months), 8.66% in 2005, 18.90% in 2004, 8.45% in 2003, 43.43% in 2002, and
SAI-4
Table of Contents
44.12% in 2001. The Worst Monthly Percentage Draw-Down of the Forecast Portfolio Program is -5.92% in March2003. The Worst Peak-to-Valley Draw-Down of the Forecast Portfolio Program is -11.64% from January 2005 toApril 2005. The amount of leverage employed by Forecast is 5%-10% (average margin to equity).PAST PERFORMANCE IS NOT NECESSARILY INDICATIVE OF FUTURE RESULTS.
Kottke Associates, LLC
Kottke has been in the managed futures business since 1994. Prior to that date, and continuing, Kottke has been a proprietary trading firm and clearing firm for approx. 20+ years. In addition to being registered as a CTA since May 1998, CPO since December 2000 and a futures commission merchant since May 1998 and a member of the NFA in such capacities as of May 1998, Kottke is a clearing member firm of the CBOT, CME and NYMEX. Such registrations and memberships do not imply that the CFTC, NFA, CBOT, CME and NYMEX have endorsed Kottke’s qualifications to provide the advisory services described herein. Kottke’s main office is located at 141 W. Jackson Blvd., #1636, Chicago, Illinois 60604.
Kottke has five principals—Neal Kottke, J. M. Crouch, Michael Maher, Ron Seliga and Carmen Soldato. Neal Kottke is founder and Chairman of Kottke. Other members of the management team are J. M. Crouch, Ron Seliga, and Carmen Soldato.
Kottke will manage less than 10% of the assets allocable to the Long/Short Commodity Series. Kottke will conduct the trading for its allocation from the Long/Short Commodity Series through a Trading Company pursuant to Kottke’s JVPT and/or JVMM Programs. The annual rates of return with respect to the JVPT Program since inception are 2.30% in 2006 (11 months), -11.21% in 2005, 10.98% in 2004, 21.04% in 2003, and 17.77% in 2002. The Worst Monthly Percentage Draw-Down of the JVPT Program is -6.05% in October 2005. The Worst Peak-to-Valley Draw-Down of the JVPT Program is -15.85% from March 2005 through January 2006. The amount of leverage employed by Kottke for the JVPT Program is 7% (average margin to equity). The annual rates of return with respect to the JVMM Program since inception are 3.60% in 2006 (11 months), -6.82% in 2005, 18.50% in 2004, 9.56% in 2003, and 16.16% in 2002. The Worst Monthly Percentage Draw-Down of the JVMM Program is -5.87% in October 2005. The Worst Peak-to-Valley Draw-Down of the JVMM Program is -12.08% from March 2005 through February 2006. The amount of leverage employed by Kottke for the JVMM Program is 7-9% (average margin to equity).PAST PERFORMANCE IS NOT NECESSARILY INDICATIVE OF FUTURE RESULTS.
Landmark Trading Company
Landmark, a Colorado corporation, became active in the managed futures industry in 1998. Landmark has been registered under the CE Act as an introducing broker since October 1998 and as a CTA since September 2005. Landmark has been a member of the NFA since September 1998. Such registrations and memberships do not imply that the CFTC or the NFA have endorsed Landmarks’ qualifications to provide the advisory services described herein. The main office of Landmark is located at 12698 E. Vassar Drive, Aurora, Colorado 80014.
Art Van Dyck is the sole principal, President and sole officer of Landmark.
Landmark will manage less than 10% of the assets allocable to the Long/Short Commodity Series. Landmark will conduct the trading for its allocation from the Long/Short Commodity Series through a Trading Company pursuant to Landmark’s Landmark Trading Program. The annual rates of return with respect to the Landmark Program since 2001 are 15.60% in 2006 (11 months), -1.38% in 2005, 353.64% in 2004, 239.08% in 2003, 38.15% in 2002, and 866.27% in 2001. The Worst Monthly Percentage Draw-Down of the Landmark Program is - -41.59% in June 2001. The Worst Peak-to-Valley Draw-Down of the Landmark Program is -30.08% from Feb 2005 through July 2005. The amount of leverage employed by Landmark is 15%-30% (average margin to equity).PAST PERFORMANCE IS NOT NECESSARILY INDICATIVE OF FUTURE RESULTS.
SAI-5
Table of Contents
Mississippi River Investments, Inc.
Mississippi River is a Tennessee corporation organized in 1978. Mississippi River’s offices are located at 1100 Cotton Exchange Building, 65 Union Avenue, Memphis, Tennessee 38103. Mississippi River has been registered under the CE Act as a CTA since July 31, 1985, and as a CPO since June 28, 2001. Mississippi River is a member of the NFA in such capacity. Such registration and membership do not imply that the CFTC or the NFA have endorsed Mississippi River’s qualifications to provide the advisory services described herein.
The principals of Mississippi River are John R. Bondurant and Carlisle S. Page.
Mississippi River will manage less than 10% of the assets allocable to the Long/Short Commodity Series. Mississippi River will conduct the trading for its allocation from the Long/Short Commodity Series through a Trading Company pursuant to Mississippi River’s Bondurant Program and Martin Program. The annual rates of return with respect to the Bondurant Program since 2001 are -0.15% in 2006 (11 months), -10.41% in 2005, 27.5% in 2004, 11.2% in 2003, 26.8% in 2002, and 15.7% in 2001. The Worst Single Account Monthly Percentage Draw-Down of the Bondurant Program is -17.7% in September 2003. The Worst Single Account Peak-to-Valley Draw-Down of the Bondurant Program is -32.0% from September 2005 through December 2005. The amount of leverage employed by Mississippi River in the Bondurant Program is 5-10% (average margin to equity). The annual rates of return with respect to the Martin Program since 2001 are –0.90% in 2006 (11 months). The Worst Single Account Monthly Percentage Draw-Down of the Martin Program is –1.13% in April 2006. The Worst Single Account Peak-to-Valley Draw-Down of the Martin Program is –1.13% from March 2006 through April 2006. The amount of leverage employed by Mississippi River in the Martin Program is 5-10% (average margin to equity).PAST PERFORMANCE IS NOT NECESSARILY INDICATIVE OF FUTURE RESULTS.
Red Oak Commodity Advisors, Inc.
Red Oak is a Delaware corporation established in 1989. Red Oak was registered under the CE Act as a CTA effective July 1991 and is a member of the NFA since July 1991. Such registration and membership do not imply that the CFTC or the NFA have endorsed Red Oak’s qualifications to provide the advisory services described herein. Red Oak offers commodities and futures trading investment services to qualified investors including public and private pension funds, commodity pools and funds, endowment funds, charitable foundations, and other institutional investors. Red Oak has its main offices at 600 Sylvan Avenue, Englewood Cliffs, New Jersey 07632.
Red Oak is jointly owned by its two principals, Gary A. Gerstein and Phyllis Weaver.
Red Oak will manage less than 10% of the assets allocable to the Long/Short Commodity Series. Red Oak will conduct the trading for its allocation from the Long/Short Commodity Series through a Trading Companypursuant to Red Oak’s Fundamental Trading Program. The annual rates of return with respect to the Fundamental Trading Program since 2001 are 31.70% in 2006 (11 months, November 2006 estimated), 21.16% in 2005, -1.80% in 2004, 75.51% in 2003, 35.07% in 2002, and -18.84% in 2001. The Worst Monthly Percentage Draw-Down of the Fundamental Trading Program is -18.94% in February 2001. The Worst Peak-to-Valley Draw-Down of the Fundamental Trading Program is -34.97% from Jan 2001 through November 2001. The amount of leverage employed by Red Oak is 18% (average margin to equity).PAST PERFORMANCE IS NOT NECESSARILY INDICATIVE OF FUTURE RESULTS.
Skyline Management, Inc. d.b.a. Strategic Ag Trading
Strategic Ag is a Wyoming corporation whose principal office is located at 12744 Road 38, Mancos, Colorado 81328. Strategic Ag maintains one branch office; 175 W. Jackson Blvd. #400, Chicago, IL 60604. Strategic Ag has been registered under the CE Act as a CTA since February 1999 and has been a member of the
SAI-6
Table of Contents
NFA in such capacity since February 1999. Such registration and membership do not imply that the CFTC or the NFA have endorsed Strategic Ag’s qualifications to provide the advisory services described herein.
Robert Wiedeman, Karen Sullivan, Charles Wickens, and William Stevens are the principals of Strategic Ag.
Strategic Ag will manage less than 10% of the assets allocable to the Long/Short Commodity Series. Strategic Ag will conduct the trading for its allocation from the Long/Short Commodity Series through a Trading Company pursuant to Strategic Ag’s Grains Program. The annual rates of return with respect to the Grains Program since 2001 are 10.24% in 2006 (11 months), 12.99% in 2005, 36.08% in 2004, 4.60% in 2003, and 22.25% in 2002 (9 months). The Worst Monthly Percentage Draw-Down of the Grains Program is -12.29% in November 2003. The Worst Peak-to-Valley Draw-Down of the Grains Program is -20.27% from October 2003 through January 2004. The amount of leverage employed by Strategic Ag is 7% (average margin to equity).PAST PERFORMANCE IS NOT NECESSARILY INDICATIVE OF FUTURE RESULTS.
SAI-7
Table of Contents
Futures and Forward Contracts
Futures contracts in the United States can be traded only on approved exchanges and call for the future delivery of various commodities. These contractual obligations may be satisfied either by taking or making physical delivery or by making an offsetting sale or purchase of a futures contract on the same exchange. In certain instances, the S&P 500 contract for example, delivery is made through a cash settlement.
Forward currency contracts are traded off-exchange through banks or dealers. In such instances, the bank or dealer generally acts as principal in the transaction and charges “bid-ask” spreads.
Futures and forward trading is a “zero-sum” risk transfer economic activity. For every gain, there is an equal and offsetting loss.
Options on Futures Contracts
An option on a futures contract gives the purchaser of the option the right but not the obligation to take a position at a specified price (the “striking,” “strike” or “exercise” price) in a futures contract. A “call” option gives the purchaser the right to buy the underlying futures contract, and the purchaser of a “put” option acquires the right to take a sell position in the underlying contract. The purchase price of an option is referred to as its “premium.” The seller (or “writer”) of an option is obligated to take a position at a specified price opposite to the option buyer if the option is exercised. Thus, in the case of a call option, the seller must be prepared to sell the underlying futures contract at the strike price if the buyer should exercise the option. A seller of a put option, on the other hand, stands ready to buy the underlying futures contract at the strike price.
A call option on a futures contract is said to be “in-the-money” if the strike price is below current market levels and “out-of-the-money” if that price is above market. Similarly, a put option on a futures contract is said to be “in-the-money” if the strike price is above current market levels and “out-of-the-money” if the strike price is below current market levels.
Hedgers and Speculators
The two broad classifications of persons who trade futures are “hedgers” and “speculators.” Hedging is designed to minimize the losses that may occur because of price changes, for example, between the time a producer contracts to sell a commodity and the time of delivery. The futures and forward markets enable the hedger to shift the risk of price changes to the speculator. The speculator risks capital with the hope of making profits from such changes. Speculators, such as the Trust, rarely take delivery of the physical commodity but rather close out their futures positions through offsetting futures contracts.
Exchanges; Position and Daily Limits; Margins
Each of the commodity exchanges in the United States has an associated “clearinghouse.” Once trades made between members of an exchange have been cleared, each Clearing Broker looks only to the clearinghouse for all payments in respect of such broker’s open positions. The clearinghouse “guarantee” of performance on open positions does not run to customers. If a member firm goes bankrupt, customers could lose money.
The CFTC and the United States exchanges have established “speculative position limits” on the maximum positions that each Trading Advisor may hold or control in futures contracts on certain commodities.
Most United States exchanges limit the maximum change in futures prices during any single trading day. Once the “daily limit” has been reached, it becomes very difficult to execute trades. Because these limits apply on a day-to-day basis, they do not limit ultimate losses, but may reduce or eliminate liquidity.
SAI-8
Table of Contents
When a position is established, “initial margin” is deposited. On most exchanges, at the close of each trading day, “variation margin,” representing the unrealized gain or loss on the open positions, is either credited to or debited from a trader’s account. If “variation margin” payments cause a trader’s “initial margin” to fall below “maintenance margin” levels, a “margin call” is made, requiring the trader to deposit additional margin or have his position closed out.
We expect each Series to trade on a number of foreign commodity exchanges. Foreign commodity exchanges differ in certain respects from their Unites States counterparts.
No United States agency regulates futures trading on exchanges outside of the United States, which generally involve forward contracts with banks or transactions in physical commodities generally. No regulatory scheme currently exists in relation to the foreign currency forward market, except for regulation of general banking activities and exchange controls in the various jurisdictions where trading occurs or in which the currency originates.
Some foreign exchanges also have no position limits, with each dealer establishing the size of the positions it will permit traders to hold. To the extent that any Series engages in transactions on foreign exchanges, it will be subject to the risk of fluctuations in the exchange rate between the native currencies of any foreign exchange on which it trades and the United States dollar (which risks may be hedged) and the possibility that exchange controls could be imposed in the future.
There is no limitation on daily price moves on forward contracts in foreign currencies traded through banks, brokers or dealers. While margin calls are not required by foreign exchanges, the Clearing Brokers may be subject to daily margin calls in foreign markets.
Trading Methods
Managed futures strategies are generally classified as either (i) technical or fundamental or (ii) systematic or discretionary.
Technical and Fundamental Analysis
Technical analysis operates on the theory that market prices, momentum and patterns at any given point in time reflect all known factors affecting the supply and demand for a particular commodity. Consequently, technical analysis focuses on market data as the most effective means of attempting to predict future prices.
Fundamental analysis, in contrast, focuses on the study of factors external to the markets, for example: weather, the economy of a particular country, government policies, domestic and foreign political and economic events, and changing trade prospects. Fundamental analysis assumes that markets are imperfect and that market mispricings can be identified.
Systematic and Discretionary Trading Approaches
A systematic trader relies on trading programs or models to generate trading signals. Discretionary traders make trading decisions of the basis of their own judgment.
Each approach involves inherent risks. For example, systematic traders may incur substantial losses when fundamental or unexpected forces dominate the markets, while discretionary traders may overlook price trends which would have been signaled by a system.
Trend Following
Trend-following advisors try to take advantage of major price movements, in contrast with traders who focus on making many small profits on short-term trades or through relative value positions. Trend-following
SAI-9
Table of Contents
traders assume that most of their trades will be unprofitable. They look for a few large profits from big trends. During periods with no major price movements, a trend-following trading manager is likely to have big losses.
Risk Control Techniques
Trading managers often adopt risk management principles. Such principles typically restrict the size or positions taken as well as establishing stop-loss points at which losing positions must be liquidated. No risk control technique can assure that big losses will be avoided.
The Programs used by each Series’ Trading Advisors are technical, systematic and trend-following. See the Appendix for each Series attached to this Prospectus.
Managed Futures
A review of the above alerts an investor to the fact that futures trading requires knowledge and expertise. It is for this reason that Managed Futures have increased significantly over time.
Regulation of Markets
Commodity Exchange Act
The United States Congress enacted the CE Act to regulate trading in commodities, the exchanges on which they are traded, the individual brokers who are members of such exchanges, and commodity professionals and commodity brokerage houses that trade in these commodities in the United States.
Commodity Futures Trading Commission
The CFTC is an independent governmental agency that administers the CE Act and is authorized to promulgate rules thereunder. A function of the CFTC is to implement the objectives of the CE Act in preventing price manipulation and excessive speculation and to promote orderly and efficient commodity futures markets. The CFTC has adopted regulations covering, among other things, (a) the designation of contract markets; (b) the monitoring of United States commodity exchange rules; (c) the establishment of speculative position limits; (d) the registration of commodity brokers and brokerage houses, floor brokers, introducing brokers, leverage transaction merchants, CTAs, CPOs and their principal employees engaged in non-clerical commodities activities (“associated persons”), and (e) the segregation of customers’ funds and recordkeeping by, and minimum financial requirements and periodic audits of, such registered commodity brokerage houses and professionals. Under the CE Act, the CFTC is empowered, among other things, to (i) hear and adjudicate complaints of any person (e.g., a Limited Owner) against all individuals and firms registered or subject to registration under the CE Act (reparations), (ii) seek injunctions and restraining orders, (iii) issue orders to cease and desist, (iv) initiate disciplinary proceedings, (v) revoke, suspend or not renew registrations and (vi) levy substantial fines. The CE Act also provides for certain other private rights of action and the possibility of imprisonment for violations.
The CFTC has adopted extensive regulations affecting CPOs (such as the Managing Owner) and CTAs (such as the Trading Advisors) and their associated persons which, among other things, require the giving of disclosure documents to new customers and the retention of current trading and other records, prohibit pool operators from commingling pool assets with those of the operators or their other customers and require pool operators to provide their customers with periodic account statements and an annual report. Upon request by the CFTC, the Managing Owner also will furnish the CFTC with the names and addresses of the Limited Owners, along with copies of all transactions with, and reports and other communications to, the Limited Owners. The CFTC has recently amended its regulations relating to the disclosure, recordkeeping and reporting obligations affecting CPOs. These regulations, as adopted, among other things, streamline the disclosure documents and increase from six to nine months the time period after which such documents must be updated.
SAI-10
Table of Contents
United States Commodity Exchanges
United States commodity exchanges are given certain latitude in promulgating rules and regulations to control and regulate their members and clearing houses, as well as the trading conducted on their floors. Examples of current regulations by an exchange include establishment of initial and maintenance margin levels, size of trading units, daily price fluctuation limits and other contract specifications. Except for those rules relating to margins, all exchange rules and regulations relating to terms and conditions of contracts of sale or to other trading requirements currently must be reviewed and approved by the CFTC.
National Futures Association
Substantially all CPOs, CTAs, futures commission merchants, introducing brokers and their associated persons are members or associated members of the NFA. The NFA’s principal regulatory operations include (i) auditing the financial condition of futures commission merchants, introducing brokers, CPOs and CTAs; (ii) arbitrating commodity futures disputes between customers and NFA members; (iii) conducting disciplinary proceedings; and (iv) registering futures commission merchants, CPOs, CTAs, introducing brokers and their respective associated persons, and floor brokers.
The regulation of commodities transactions in the United States is a rapidly changing area of law and the various regulatory procedures described herein are subject to modification by United States Congressional action, changes in CFTC rules and amendments to exchange regulations and NFA regulations.
SAI-11
Table of Contents
The following glossary may assist prospective investors in understanding the terms used in this Prospectus:
Additional U.S. Seller. Certain selected brokers or dealers retained by the Managing Owner that are members of the National Association of Securities Dealers, Inc.
Affiliate of the Managing Owner. (i) any Person directly or indirectly owning, controlling or holding with power to vote 10% or more of the outstanding voting securities of the Managing Owner; (ii) any Person 10% or more of whose outstanding voting securities are directly or indirectly owned, controlled or held with power to vote, by the Managing Owner; (iii) any Person, directly or indirectly, controlling, controlled by, or under common control of the Managing Owner; (iv) any officer, director or partner of the Managing Owner; or (v) if such Person is an officer, director or partner of the Managing Owner, any Person for which such Person acts in any such capacity.
Business Day. A day other than Saturday, Sunday or other day when banks and/or commodities exchanges in the city of New York or the city of Wilmington are authorized or obligated by law or executive order to close.
Clearing Broker. Any person who engages in the business of effecting transactions in commodities contracts or over-the-counter foreign exchange currency transactions for the account of a Trading Company. UBS Securities, Banc of America Securities, Man Financial and Deutsche Bank act in this capacity for all or some of the Trading Companies.
Code. The Internal Revenue Code of 1986, as amended.
Commodity. Goods, wares, merchandise, produce and in general everything that is bought and sold in commerce. Out of this large class, certain commodities, because of their wide distribution, universal acceptance and marketability in commercial channels, have become the subject of trading on various national and international exchanges located in principal marketing and commercial areas. Traded commodities are sold in predetermined lots and quantities.
Commodity Futures Trading Commission. An independent regulatory commission of the United States Government empowered to regulate commodity futures transactions and other commodity transactions under the CE Act, as amended.
Continuous Offering. The period following the conclusion of the Initial Offering Period and ending on the date when the number of Units permitted to be sold pursuant to Section 3.2(f) of the Trust Agreement are sold, but in no event later than December 31, 2053.
Contract Month. The month in which a futures contract may be satisfied by making or accepting delivery of the underlying commodity.
Contract round-turn. The initial purchase of a long or short contract and the subsequent purchase of an offsetting contract.
Counter-trend liquidations. Closing out a position after significant price move on the assumption that the market is due for a correction.
Daily price fluctuation limit. The maximum permitted fluctuation imposed by commodity exchanges in the price of a commodity futures contract for a given commodity that can occur on a commodity exchange on a given day in relation to the previous day’s settlement price, which maximum permitted fluctuation is subject to change from time to time by the exchange. In the United States these limits, including changes thereto, are subject to CFTC approval. These limits generally are not imposed on option contracts or outside the United States.
SAI-12
Table of Contents
Delivery. The process of satisfying a commodity futures contract, an option on a physical commodity, or forward contract by transferring ownership of a specified quantity and grade of a cash commodity to the purchaser thereof.
Extraordinary Expenses. Pursuant to Section 4.7(a) of the Trust Agreement, Extraordinary Expenses of the Trust and each Series include, but are not limited to, legal claims and liabilities and litigation costs and any permitted indemnification associated therewith.
Forward contract. A cash market transaction in which the buyer and seller agree to the purchase and sale of a specific quantity of a commodity for delivery at some future time under such terms and conditions as the two may agree upon.
Futures contract. A contract providing for the delivery or receipt at a future date of a specified amount and grade of a traded commodity at a specified price and delivery point, or for cash settlement. Such contracts are uniform for each commodity on each exchange and vary only with respect to price and delivery time. A commodity futures contract should be distinguished from the actual physical commodity, which is termed a “cash commodity.” It is important to note that trading in commodity futures contracts involves trading in contracts for future delivery of commodities and not the buying and selling of particular lots of commodities. A contract to buy or sell may be satisfied either by making or taking delivery of the commodity and payment or acceptance of the entire purchase price therefor, or by offsetting the contractual obligation with a countervailing contract on the same on a linked exchange prior to delivery.
Incentive Measurement Date. The close of business on the last day of each calendar month or quarter.
Incentive Measurement Period. The most recent preceding calendar month or quarter for which an incentive fee was earned (or, with respect to the first incentive fee, as of the commencement of operations)
Limited Owner. A Limited Owner is any person or entity acting in his, her or its capacity as a Unitholder in one or more Series of the Trust, and may include the Managing Owner with respect to Units purchased by it.
Limit order. A trading order which sets a limit on either price or time of execution or both. Limit orders (as contrasted with stop orders) do not become market orders.
Long contract. A contract to accept delivery of (buy) a specified amount of a commodity at a future date at a specified price.
Market order. A trading order to execute a trade at the most favorable price as soon as possible.
Margin. A good faith deposit with a broker to assure fulfillment of a purchase or sale of a commodity futures, or, in certain cases, forward or option contract. Commodity margins do not usually involve the payment of interest.
Managing Owner. Equinox Fund Management, LLC or any substitute therefor as provided in the Trust Agreement.
Margin call. A demand for additional funds after the initial good faith deposit required to maintain a customer’s account in compliance with the requirements of a particular commodity exchange or of a commodity broker.
Net Asset Value. See Section 1.1 of the Trust Agreement attached as Exhibit A to the Statement of Additional Information.
New High Net Trading Profits. See the Appendix for each Series of Units, attached to this Prospectus.
SAI-13
Table of Contents
Net Worth. See Section 4.3(i) of the Trust Agreement for the definition of “Net Worth.” Insofar as Net Worth relates to investor suitability, see the heading entitled “State Suitability Requirements” in the Subscription Agreement (Exhibit B to the Statement of Additional Information).
Open Position. A contractual commitment arising under a long contract or a short contract that has not been extinguished by an offsetting trade or by delivery.
Organization and offering expenses. Those expenses incurred in connection with the formation, qualification and initial registration of the Trust and the Units and in initially offering, distributing and processing the Units under applicable Federal and state law, and any other expenses actually incurred and directly or indirectly related to the organization of the Trust or the initial offering of the Units. See Section 4.7(a) of the Trust Agreement attached as Exhibit A to the Statement of Additional Information for a more particular enumeration of such expenses, all of which will be paid by the Managing Owner.
Parameters. A value which can be freely assigned in a trading system in order to vary the timing of signals.
Pattern recognition. The ability to identify patterns that appeared to act as precursors of price advances or declines in the past.
Pit Brokerage Fee. Pit Brokerage Fee shall include floor brokerage clearing fees, NFA fees, and exchange fees.
Position Limit. The maximum number of speculative futures or option contracts in any one commodity (on one contract market), imposed by the CFTC or a United States commodity exchange, that can be held or controlled at one time by one person or a group of persons acting together. These limits generally are not imposed for trading on markets or exchanges outside the United States.
Redemption Date. Means the day of the week after the date the Managing Owner is in receipt of a redemption request for a least one (1) Business Day to be received by the Managing Owner no later than 4:00 PM NYT in order for the redemption to be effective as of the next Business Day.
Secular trend. Intermediate upswings and downswings in price that over a long period of time constitutes a big move.
Series. Means a separate series of the Trust as provided in Sections 3806(b)(2) and 3804 of the Trust Act, the Units of which shall be beneficial interests in the Trust Estate separately identified with and belonging to such Series.
Short contract. A contract to make delivery of (sell) a specified amount of a commodity at a future date at a specified price.
Special Redemption Date. The twentieth (20th) Business Day following the notification by the Managing Owner to the Limited Owners of a decline in the Net Asset Value per Unit of any Series to less than 50% of the Net Asset Value per Unit of such Series as of the immediately preceding day.
Spot contract. A cash market transaction in which buyer and seller agree to the purchase and sale of a specific commodity for immediate delivery.
Spreads or straddles. A transaction involving the simultaneous holding of futures and/or option contracts dealing with the same commodity but involving different delivery dates or different markets, and in which the trader expects to earn profits from a widening or narrowing movement of the prices of the different contracts.
SAI-14
Table of Contents
Stop-loss order. An order to buy or sell at the market when a definite price is reached, either above or below the price of the instrument that prevailed when the order was given.
Stop order. An order given to a broker to execute a trade when the market price for the contract reaches the specified stop order price. Stop orders are utilized to protect gains or limit losses on open positions. Stop orders become market orders when the stop order price is reached.
Support: A previous low. A price level under the market where buying interest is sufficiently strong to overcome selling pressure.
Resistance: A previous high. A price level over the market where selling pressure overcomes buying pressure and a price advance is turned back.
Systematic technical charting systems. A system which is technical in nature and based on chart patterns as opposed to pure mathematical calculations.
Trading Approach. See the Appendix for each Series of Units.
Trading Advisor. Any entity or entities acting in its capacity as a commodity trading advisor to the Trust and any substitute(s) therefor as provided herein.
Trustee. Wilmington Trust Company or any substitute therefor as provided in the Trust Agreement.
Units. Means the beneficial interest of each Unitholder in the profits, losses, distributions, capital and assets of the Trust. The Managing Owner’s Capital Contributions shall be represented by “General” Units and a Limited Owner’s Capital Contributions shall be represented by “Limited” Units. Units will not be represented by certificates.
Unrealized profit or loss. The profit or loss which would be realized on an open position in a futures, forward or option contract if it were closed at the current market value price for such contract.
Valuation Point. The close of business on each Business Day of each day, or such other day as may be determined by the Managing Owner.
SAI-15
Table of Contents
BENEFITS TO INVESTING IN THE TRUST
Investment Diversification
The Trust provides investors with the opportunity to participate in the commodities markets and to diversify an overall portfolio. The Managing Owner believes that portfolio diversification through an investment in the Trust may be advantageous because the profit potential of the Trust does not depend upon favorable general economic conditions and that it may be as profitable during periods of declining stock, bond and real estate markets as at any other time.
Market Diversification
Each Series of the Trust will generally trade a diverse portfolio of commodities. Each Limited Owner should be able to participate in a greater number of commodities markets than would be possible if the Trust’s minimum investment were traded on an individual investor basis. This market diversification may reduce the risk of loss.
Access to Trading Advisors
Through an investment in the Trust, an investor is able to access some of the leading CTAs which that investor otherwise might not be able to access. Because the Trust has a low minimum investment size ($1,000, no minimum in the case of Plans (including IRAs), employees or family members of an employee of the Managing Owner or its affiliates or charitable organizations and $5,000 for investors who are residents of Texas or $1,000 for investors who are residents of Texas and are Plans (including IRAs), employees or family members of an employee of the Managing Owner or its affiliates or charitable organizations) investors can access the Trading Advisors for far less than the minimum account size of such Trading Advisor which typically would be $1,000,000 or more.
SAI-16
Table of Contents
The Value-Added Monthly Index, or VAMI, is an index that tracks the actual monthly performance of a $1000 investment in each trading program to be traded for the Campbell/Graham Series, the Graham Series, or the Winton Series, or that tracks the actual monthly performance of a $1,000 investment in a multi-advisor managed futures index for the Balanced Series, the Jefferies Commodity Performance Index Total Return Index, the Reuters/Jeffereis CRB Total Return Index or the Conquest Managed Futures Benchmark, with performance adjustments to reflect the fees and expenses to be incurred by such Series of the Trust. The calculation for the current month’s VAMI is the previous VAMI x (1 + Current Monthly Rate of Return). The VAMI charts the total return gained from reinvestment through compounding.
PAST PERFORMANCE IS NOT NECESSARILY INDICATIVE OF FUTURE RESULTS.
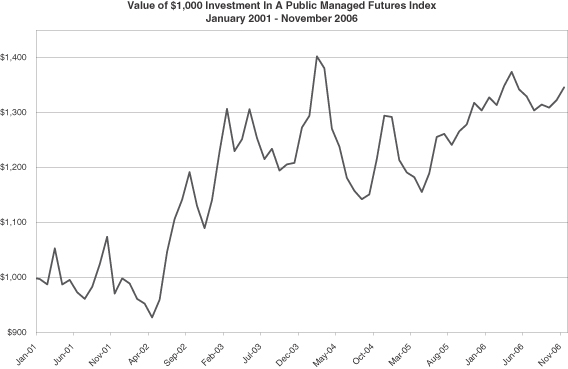
The VAMI chart displayed above was prepared using CISDM Public CPO Asset Weighted Index. For the actual performance of the Balanced Series, please see the Balanced Series Appendix on page Balanced App. – 10.
The chart presented above shows the actual performance of CISDM Public CPO Asset Weighted Index for the period shown and is presented for comparative purposes only. No representation is made that the Balanced Series-1 will achieve similar performance results. The performance information for the CISDM Public CPO Asset Weighted Index presented in the chart above for November 2006 is estimated.
SAI-17
Table of Contents
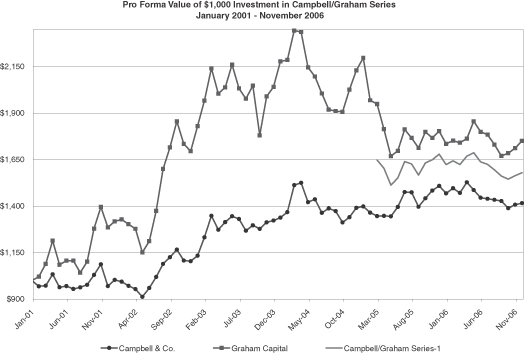
Campbell/Graham Series-1 starts with a $1,603.80 investment as of March 2005, when the Series began trading. For the actual performance of the Campbell/Graham Series-1, please see the Campbell/Graham Series Appendix on page Campbell/Graham Series App. – 6.
SAI-18
Table of Contents
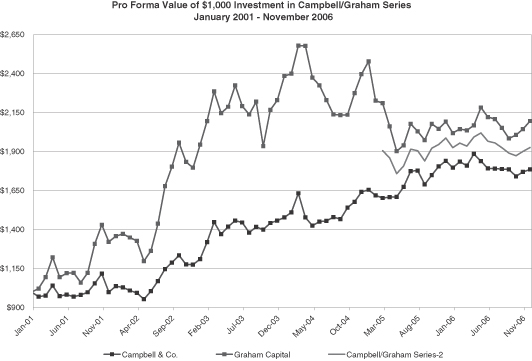
Campbell/Graham Series-2 starts with a $1,860.69 investment as of March 2005, when the Series began trading. For the actual performance of the Campbell/Graham Series-2, please see the Campbell/Graham Series Appendix on page Campbell/Graham Series App. – 7.
SAI-19
Table of Contents
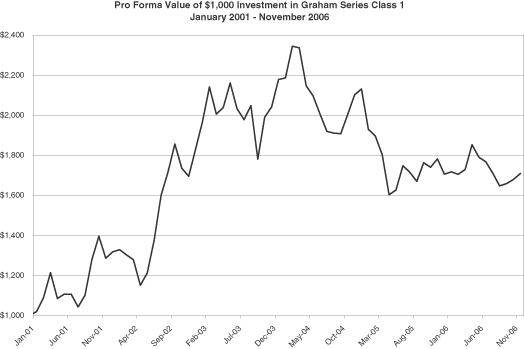
The VAMI chart displayed above was prepared using the trading composite results of Graham’s K-4 Trading Program pro forma for the expenses of the Trust applicable to the Graham Series-1 Units as set forth in the Graham Series Appendix. For the actual performance of Graham’s K-4 Program, please see the Graham Series Appendix on page Graham App. – 10. Trading results from July to December 2000 are based on standard leverage. For the balance of the period reflected by the chart, trading results are based on 1.5 times leverage.
SAI-20
Table of Contents
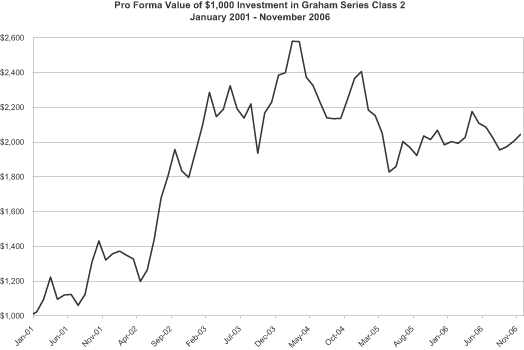
The VAMI chart displayed above was prepared using the trading composite results of Graham’s K-4 Trading Program pro forma for the expenses of the Trust applicable to the Graham Series-2 Units as set forth in the Graham Series Appendix. For the actual performance of Graham’s K-4 Program, please see the Graham Series Appendix on page Graham App. – 11. Trading results from July to December 2000 are based on standard leverage. For the balance of the period reflected by the chart, trading results are based on 1.5 times leverage.
SAI-21
Table of Contents
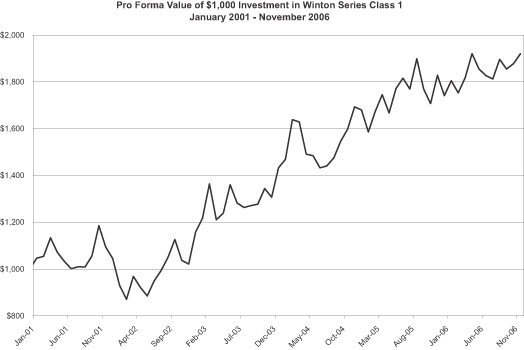
The VAMI chart displayed above was prepared using the trading composite results of Winton’s Diversified Program pro forma for the expenses of the Trust applicable to the Winton Series-1 Units as set forth in the Winton Series Appendix. For the actual performance of Winton’s Diversified Program, please see the Winton Series Appendix on page Winton Series App. – 8.
SAI-22
Table of Contents
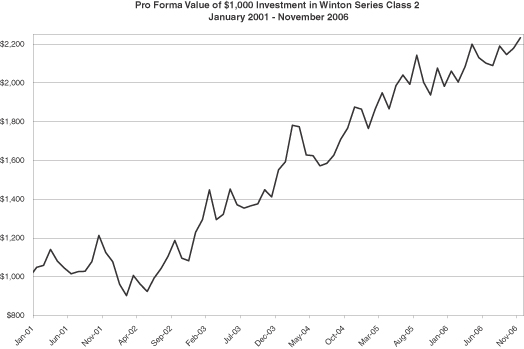
The VAMI chart displayed above was prepared using the trading composite results of Winton’s Diversified Program pro forma for the expenses of the Trust applicable to the Winton Series-2 Units as set forth in the Winton Series Appendix. For the actual performance of Winton’s Diversified Program, please see the Winton Series Appendix on page Winton Series App. – 9.
SAI-23
Table of Contents

The VAMI chart displayed above shows the comparative performance of the CISDM CTA Asset Weighted Physicals Index to the Long/Short Commodity Series. The index shown is “total return” and includes an interest income component. Returns are of the index only, and do not reflect the performance that would have been achieved by an investment in financial products valued in reference to the index.
Long/Short Commodity Series-1 starts with a $1,331 investment as of March 2006, when the Series began trading. For the actual performance of the Long/Short Commodity Series-1, please see the Long/Short Commodity Series Appendix on page Long/Short Commodity Series App. – 6.
SAI-24
Table of Contents
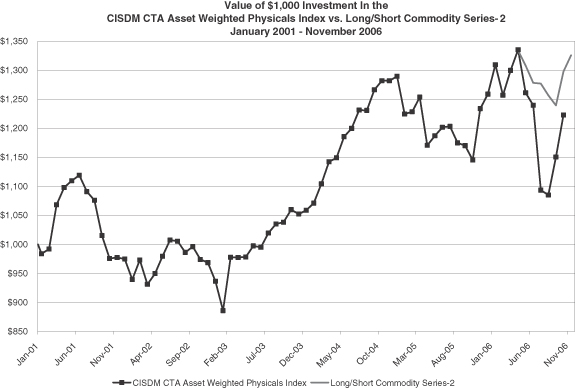
The VAMI chart displayed above shows the comparative performance of the CISDM CTA Asset Weighted Physicals Index to the Long/Short Commodity Series. The index shown is “total return” and includes an interest income component. Returns are of the index only, and do not reflect the performance that would have been achieved by an investment in financial products valued in reference to the index.
Long/Short Commodity Series-2 starts with a $1,334 investment as of March 2006, when the Series began trading. For the actual performance of the Long/Short Commodity Series-2, please see the Long/Short Commodity Series Appendix on page Long/Short Commodity Series App. – 7.
SAI-25
Table of Contents
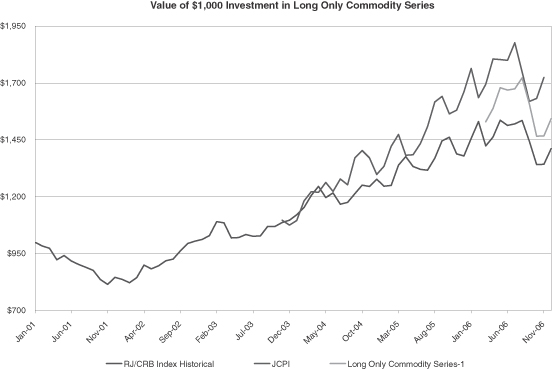
The VAMI chart displayed above shows the comparative performance of the indices to which the assets of The Frontier Fund Long Only Commodity Series will be linked (a 50-50 mix of the RJ/CRB Index and the JCPI) versus an investment in the Long Only Commodity Series-1. All indices shown are “total return” and include an interest income component. Returns are of the indices only, and do not reflect the performance that would have been achieved by an investment in financial products valued in reference to the indices.
Long Only Commodity Series-1 starts with a $1,588 investment as of March 2006, when the Series began trading. For the actual performance of the Long Only Commodity Series-1, please see the Long Only Commodity Series Appendix on page Long Only Commodity Series App. – 6.
SAI-26
Table of Contents

The VAMI chart displayed above shows the comparative performance of the indices to which the assets of The Frontier Fund Long Only Commodity Series will be linked (a 50-50 mix of the RJ/CRB Index and the JCPI) versus an investment in the Long Only Commodity Series-2. All indices shown are “total return” and include an interest income component. Returns are of the indices only, and do not reflect the performance that would have been achieved by an investment in financial products valued in reference to the indices.
Long Only Commodity Series-2 starts with a $1,591 investment as of March 2006, when the Series began trading. For the actual performance of the Long Only Commodity Series-2, please see the Long Only Commodity Series Appendix on page Long Only Commodity Series App. – 7.
SAI-27
Table of Contents
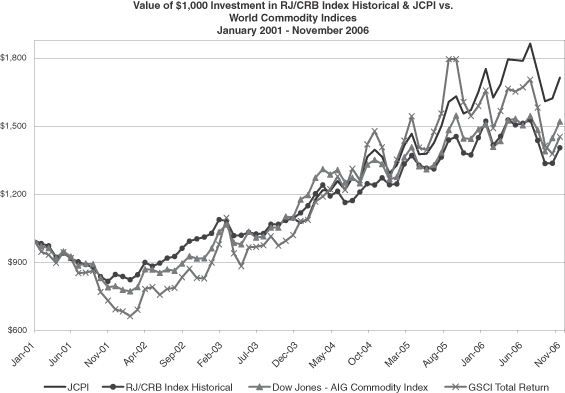
The VAMI chart displayed above shows the comparative performance of the indices to which the assets of The Frontier Fund Long Only Commodity Series will be linked (a 50-50 mix of the RJ/CRB Index and the JCPI) versus the Dow Jones-AIG Commodity Index and the Goldman Sachs Commodity Index. All indices shown are “total return” and include an interest income component. Returns are of the indices only, and do not reflect the performance that would have been achieved by an investment in financial products valued in reference to the indices. The above chart reflects the total return of the corresponding indices only. The fees of the Long Only Commodity Series have not been deducted from the performance displayed above.
The RJ/CRB Index Historical performance presented above represents the historical CRB index until June 17, 2005, when the performance switches to the RJ/CRB Index Excess Returns. Source: Bloomberg.
The JCPI performance presented above represents the performance of the JCPI from its inception in November 2003 forward.
SAI-28
Table of Contents
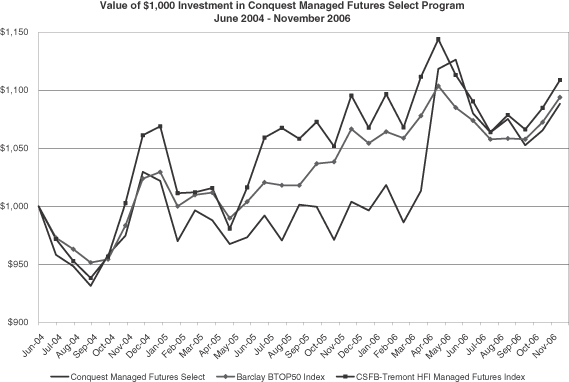
The VAMI chart displayed above shows the comparative performance of the Conquest Managed Futures Select program versus the CSFB Tremont HFI Managed Futures Index and the Barclay BTOP 50 CTA Index. Returns are of the indices only, and do not reflect the performance that would have been achieved by an investment in the Managed Futures Index Series. The above chart reflects the total return of the corresponding indices only. The fees of the Managed Futures Index Series have not been deducted from the performance displayed above.
Correlation Coefficient of Managed Futures Indices
June 2004 – November 20061
| Conquest Managed Futures Select | CSFB Tremont HFI Managed Futures Index | Barclay BTOP 50 CTA Index | ||||||
Conquest Managed Futures Select | 1.00 | |||||||
CSFB Tremont HFI Managed Futures Index | 0.73 | 1.00 | ||||||
Barclay BTOP 50 CTA Index | 0.75 | 0.93 | 1.00 |
The above table reflects the total return of the corresponding indices only. The fees of the Managed Futures Index Series have not been deducted from the performance displayed above.
SAI-29
Table of Contents
SUMMARY PERFORMANCE COMPARISONS
Balanced Series-1 Pro Forma Performance Summary
The comparative chart which follows sets forth the actual annualized rate of return for the Balanced Series-1 Units from the inception of trading, the pro forma actual annualized rate of return for each trading program to be used by the Trading Advisors for the Balanced Series-1 Units from January 2001 through November 2006, as well as the comparative rates of return earned by the managed futures, stock and bond asset classes during the same time periods. The comparative chart should be reviewed in connection with the footnotes which accompany the comparative chart.PAST PERFORMANCE IS NOT NECESSARILY INDICATIVE OF FUTURE RESULTS.
Balanced Series-1 Program (September 24, 2004 – November 2006) |
| ||||||||||
| Annual Performance | |||||||||||
| 2006 | 2005 | 2004 | |||||||||
| -0.70% | -1.37 | % | 6.03 | % | |||||||
Balanced Series-1 Trading Advisors (January 2001 – November 2006) |
| ||||||||||
| Program | Pro Forma Actual Annualized Rate of Return1 | Worst Historical Loss | Standard Deviation | ||||||||
Major Advisors: | |||||||||||
Campbell & Company, Inc. | FME Large | 6.68 | % | -15.52 | % | 13.43 | % | ||||
Conquest Capital, LLC2 | MFS | -0.86 | % | -7.18 | % | 8.49 | % | ||||
Cornerstone Quantitative Investment Group, Inc.3 | International Value | 14.66 | % | -14.04 | % | 16.86 | % | ||||
Meyer Capital Management, Inc. | Diversified | 4.50 | % | -28.91 | % | 18.36 | % | ||||
Winton Capital Management Limited | Diversified | 10.76 | % | -27.17 | % | 20.75 | % | ||||
Non-Major Advisors4 | 14.86 | % | -15.43 | % | 18.31 | % | |||||
Emerging Advisors (allocation of <5%)5 | 14.71 | % | -7.88 | % | 12.31 | % | |||||
Strategic Allocations6 (September 2004-November 2006) | -3.70 | % | -14.75 | % | 8.46 | % | |||||
Benchmark Comparisons: (January 2001 – November 2006) | |||||||||||
Managed Futures7 | 5.15 | % | -18.52 | % | 13.47 | % | |||||
U.S. Stocks | 2.74 | % | -38.87 | % | 13.97 | % | |||||
U.S. Bonds | 5.80 | % | -3.55 | % | 3.80 | % | |||||
Additional information concerning this series and Trading Advisors is contained in the Balanced Series Appendix to the Prospectus of the Trust.
Managed Futures: CISDM Public CPO Asset Weighted Index. Source: Pertrac 2000, product of Strategic Financial Solutions, LLC.
Stocks: S&P 500 Index (dividends reinvested). Source: Pertrac 2000, product of Strategic Financial Solutions, LLC.
Bonds:Lehman Brothers Aggregate Bond Market Index. Source: Pertrac 2000, product of Strategic Financial Solutions, LLC.
SAI-30
Table of Contents
Worst Historical Loss: Measure of risk (also known as Maximum Drawdown) that illustrates the largest peak-to-valley decline, based on monthly rates of return, during a given time period. The time period of analysis is January 2001-November 2006, unless otherwise noted.
Standard Deviation: Measures the degree of variation of monthly returns around the mean (average) return. The higher the volatility of the investment returns, the higher the standard deviation will be.
1. | The actual trading composite results of the Balanced Series Trading Advisors net of fees, pro forma for expenses of the Trust applicable to the Balanced Series-1 Units as set forth in the Break Even Table in the Balanced Series Appendix. The pro forma average annualized rate of return of the Balanced Series-2 Units will be commensurately higher than that of the Balanced Series-1 Units shown above to the extent that the Balanced Series-2 expenses are lower than the Balanced Series-1 expenses as set forth in the Break Even Table. |
2. | The performance of the Conquest MFS program begins in June 2004. |
3. | The International Value returns through September 2002 are actual returns, net actual management and incentive fees, employing the “Fully Funded Subset” method. From October 2002 through April 2004, the returns are actual returns of the Cornerstone International Value Fund LLC, a US-based fund, and reflect actual fees and interest. Starting May 2004, the returns are actual returns, net actual management and incentive fees, based on the nominal assets under management (a combination of actual and notional funding), and include actual interest. |
4. | The actual performance of the Balanced Series Non-Major Advisors adjusted for Balanced Series Class 1 fees and expenses. The composite was calculated using the relative weights of the advisors as they existed on November 30, 2006. Not all of the Balanced Series Non-Major Advisors have track records that go back the full five calendar years; therefore, within the calculation of the pro forma results, such Non-Major Advisors’ program allocations were assumed to be held in cash earning a risk-free interest rate of 4.25%. |
5. | The actual performance of the Balanced Series Emerging Advisors adjusted for Balanced Series Class 1 fees and expenses. The Emerging Advisors’ programs do not have actual track records that go back the full five calendar years; therefore, within the calculation of the pro forma results, such Emerging Advisors’ program allocations were prorated to the other Non-Major Advisors during those months in which their performance was unavailable. The performance of the Emerging Managers begins in June 2001. |
6. | The equally-weighted composite of the Class 2 of the Series to which the Balanced Series makes Strategic Allocations. Because the Currency Series commenced trading in September 2004, the Graham Series commenced trading in November 2004, the Campbell/Graham Series commenced trading in February 2005, the Long Only Commodity Series and Long/Short Commodity Series commenced trading in March 2006, and the Managed Futures Index Series commenced trading in April 2006, the Class 2 of each Series does not have actual track records that goes back the full five calendar years. Therefore, within the calculation of the pro forma results, such Class 2 allocations were prorated to the Class 2 of the other Series during those months in which their performance was unavailable. |
7. | The performance information for the CISDM Public CPO Asset Weighted Index for November 2006 is estimated. |
SAI-31
Table of Contents
Balanced Series-2 Pro Forma Performance Summary
The comparative chart which follows sets forth the actual annualized rate of return for the Balanced Series-2 Units from the inception of trading, the pro forma actual annualized rate of return for each trading program to be used by the Trading Advisors for the Balanced Series-2 Units from January 2001 through November 2006, as well as the comparative rates of return earned by the managed futures, stock and bond asset classes during the same time periods. The comparative chart should be reviewed in connection with the footnotes which accompany the comparative chart.PAST PERFORMANCE IS NOT NECESSARILY INDICATIVE OF FUTURE RESULTS.
Balanced Series-2 Program September 24, 2004 – November 2006 |
| ||||||||||
| Annual Performance | |||||||||||
| 2006 | 2005 | 2004 | |||||||||
| 2.06% | 1.76 | % | 6.85 | % | |||||||
Balanced Series-2 Trading Advisors January 2001 – November 2006: |
| ||||||||||
| Program | Pro Forma Actual Return1 | Worst Historical Loss | Standard Deviation | ||||||||
Major Advisors: | |||||||||||
Campbell & Company, Inc. | FME Large | 9.78 | % | -14.24 | % | 13.43 | % | ||||
Conquest Capital, LLC2 | MFS | 2.16 | % | -5.99 | % | 8.49 | % | ||||
Cornerstone Quantitative Investment Group, Inc.3 | International Value | 18.19 | % | -13.52 | % | 16.89 | % | ||||
Meyer Capital Management, Inc. | Diversified | 7.74 | % | -25.32 | % | 18.39 | % | ||||
Winton Capital Management Limited | Diversified | 14.15 | % | -26.44 | % | 20.80 | % | ||||
Non-Major Advisors4 | 17.36 | % | -14.33 | % | 18.36 | % | |||||
Emerging Advisors (allocation of <5%)5 | 17.90 | % | -7.42 | % | 12.38 | % | |||||
Strategic Allocations6 (September 2004- November 2006) | -1.02 | % | -13.93 | % | 8.47 | % | |||||
Benchmark Comparisons: (January 2001 – November 2006) | |||||||||||
Managed Futures7 | 5.15 | % | -18.52 | % | 13.47 | % | |||||
U.S. Stocks | 2.74 | % | -38.87 | % | 13.97 | % | |||||
U.S. Bonds | 5.80 | % | -3.55 | % | 3.80 | % | |||||
Additional information concerning this series and Trading Advisors is contained in the Balanced Series Appendix to the Prospectus of the Trust.
Managed Futures: CISDM Public CPO Asset Weighted Index. Source: Pertrac 2000, product of Strategic Financial Solutions, LLC.
Stocks: S&P 500 Index (dividends reinvested). Source: Pertrac 2000, product of Strategic Financial Solutions, LLC.
Bonds:Lehman Brothers Aggregate Bond Market Index. Source: Pertrac 2000, product of Strategic Financial Solutions, LLC.
Worst Historical Loss: Measure of risk (also known as Maximum Drawdown) that illustrates the largest peak-to-valley decline, based on monthly rates of return, during a given time period. The time period of analysis is January 2001-November 2006, unless otherwise noted.
SAI-32
Table of Contents
Standard Deviation: Measures the degree of variation of monthly returns around the mean (average) return. The higher the volatility of the investment returns, the higher the standard deviation will be.
1. | The actual trading composite results of the Balanced Series Trading Advisors net of fees, pro forma for expenses of the Trust applicable to the Balanced Series-2 Units as set forth in the Break Even Table in the Balanced Series Appendix. The pro forma average annualized rate of return of the Balanced Series-2 Units will be commensurately higher than that of the Balanced Series-1 Units shown above to the extent that the Balanced Series-2 expenses are lower than the Balanced Series-1 expenses as set forth in the Break Even Table. |
2. | The performance of the Conquest MFS program begins in June 2004. |
3. | The International Value returns through September 2002 are actual returns, net actual management and incentive fees, employing the “Fully Funded Subset” method. From October 2002 through April 2004, the returns are actual returns of the Cornerstone International Value Fund LLC, a US-based fund, and reflect actual fees and interest. Starting May 2004, the returns are actual returns, net actual management and incentive fees, based on the nominal assets under management (a combination of actual and notional funding), and include actual interest. |
4. | The actual performance of the Balanced Series Non-Major Advisors adjusted for Balanced Series Class 2 fees and expenses. The composite was calculated using the relative weights of the advisors as they existed on November 30, 2006. Not all of the Balanced Series Non-Major Advisors have track records that go back the full five calendar years; therefore, within the calculation of the pro forma results, such Non-Major Advisors’ program allocations were assumed to be held in cash earning a risk-free interest rate of 4.25%. |
5. | The actual performance of the Balanced Series Emerging Advisors adjusted for Balanced Series Class 2 fees and expenses. The Emerging Managers’ programs do not have actual track records that go back the full five calendar years; therefore, within the calculation of the pro forma results, such Emerging Managers’ program allocations were prorated to the other Trading Advisors during those months in which their performance was unavailable. The performance of the Emerging Managers begins in June 2001. |
6. | The equally-weighted composite of the Class 2 of the Series to which the Balanced Series makes Strategic Allocations. Because the Currency Series commenced trading in September 2004, the Graham Series commenced trading in November 2004, the Campbell/Graham Series commenced trading in February 2005, the Long Only Commodity Series and Long/Short Commodity Series commenced trading in March 2006, and the Managed Futures Index Series commenced trading in April 2006, the Class 2 of each Series does not have actual track records that goes back the full five calendar years. Therefore, within the calculation of the pro forma results, such Class 2 allocations were prorated to the Class 2 of the other Series during those months in which their performance was unavailable. |
7. | The performance information for the CISDM Public CPO Asset Weighted Index for November 2006 is estimated. |
SAI-33
Table of Contents
Balanced Series-1a Pro Forma Performance Summary
The comparative chart which follows sets forth the actual average annualized rate of return for the Balanced Series-1a of Units from the inception of trading, as well as the comparative rates of return earned by the managed futures, stock and bond asset classes during the same time periods. The comparative chart should be reviewed in connection with the footnotes which accompany the comparative chart.PAST PERFORMANCE IS NOT NECESSARILY INDICATIVE OF FUTURE RESULTS.
Balanced Series-1a Program May 1, 2006 – November 2006 |
| ||||||||||
| Annual Performance | |||||||||||
| 2006 | |||||||||||
| -6.52% | |||||||||||
Balanced Series-1a Trading Advisors January 2001 – November 2006: |
| ||||||||||
| Program | Pro Forma Actual Annualized Rate of Return1 | Worst Historical Loss | Standard Deviation | ||||||||
Major Advisors: | |||||||||||
Campbell & Company, Inc. | FME Large | 6.56 | % | -15.64 | % | 13.43 | % | ||||
Conquest Capital, LLC2 | MFS | -0.98 | % | -7.30 | % | 8.49 | % | ||||
Cornerstone Quantitative Investment Group, Inc.3 | International Value | 14.54 | % | -14.16 | % | 16.86 | % | ||||
Meyer Capital Management, Inc. | Diversified | 4.38 | % | -29.03 | % | 18.36 | % | ||||
Winton Capital Management Limited | Diversified | 10.64 | % | -27.29 | % | 20.75 | % | ||||
Non-Major Advisors4 | 14.74 | % | -15.55 | % | 18.31 | % | |||||
Emerging Advisors (allocation of <5%)5 | 14.59 | % | -8.00 | % | 12.31 | % | |||||
Strategic Allocations6 (September 2004- November 2006) | -3.70 | % | -14.75 | % | 8.46 | % | |||||
Benchmark Comparisons: (January 2001 – November 2006) | |||||||||||
Managed Futures7 | 5.15 | % | -18.52 | % | 13.47 | % | |||||
U.S. Stocks | 2.74 | % | -38.87 | % | 13.97 | % | |||||
U.S. Bonds | 5.80 | % | -3.55 | % | 3.80 | % | |||||
Additional information concerning this series and Trading Advisors is contained in the Balanced Series Appendix to the Prospectus of the Trust.
Managed Futures: CISDM Public CPO Asset Weighted Index. Source: Pertrac 2000, product of Strategic Financial Solutions, LLC.
Stocks: S&P 500 Index (dividends reinvested). Source: Pertrac 2000, product of Strategic Financial Solutions, LLC.
Bonds:Lehman Brothers Aggregate Bond Market Index. Source: Pertrac 2000, product of Strategic Financial Solutions, LLC.
Worst Historical Loss: Measure of risk (also known as Maximum Drawdown) that illustrates the largest peak-to-valley decline, based on monthly rates of return, during a given time period. The time period of analysis is January 2001-November 2006, unless otherwise noted.
SAI-34
Table of Contents
Standard Deviation: Measures the degree of variation of monthly returns around the mean (average) return. The higher the volatility of the investment returns, the higher the standard deviation will be.
1. | The actual trading composite results of the Balanced Series Trading Advisors net of fees, pro forma for expenses of the Trust applicable to the Balanced Series-1a Units as set forth in the Break Even Table in the Balanced Series Appendix. The pro forma average annualized rate of return of the Balanced Series-2a Units will be commensurately higher than that of the Balanced Series-1a Units shown above to the extent that the Balanced Series-2a expenses are lower than the Balanced Series-1a expenses as set forth in the Break Even Table. Additional information, including monthly rates of return, concerning this Series and the Trading Advisors is contained in the Prospectus. |
2. | The performance of the Conquest MFS program begins in June 2004. |
3. | The International Value returns through September 2002 are actual returns, net actual management and incentive fees, employing the “Fully Funded Subset” method. From October 2002 through April 2004, the returns are actual returns of the Cornerstone International Value Fund LLC, a US-based fund, and reflect actual fees and interest. Starting May 2004, the returns are actual returns, net actual management and incentive fees, based on the nominal assets under management (a combination of actual and notional funding), and include actual interest. |
4. | The actual performance of the Balanced Series Non-Major Advisors adjusted for Balanced Series Class 1A fees and expenses. The composite was calculated using the relative weights of the advisors as they existed on November 30, 2006. Not all of the Balanced Series Non-Major Advisors have track records that go back the full five calendar years; therefore, within the calculation of the pro forma results, such Non-Major Advisors’ program allocations were assumed to be held in cash earning a risk-free interest rate of 4.25%. |
5. | The actual performance of the Balanced Series Emerging Advisors adjusted for Balanced Series Class 1A fees and expenses. The Emerging Managers’ programs do not have actual track records that go back the full five calendar years; therefore, within the calculation of the pro forma results, such Emerging Managers’ program allocations were prorated to the other Trading Advisors during those months in which their performance was unavailable. The performance of the Emerging Managers begins in June 2001. |
6. | The equally-weighted composite of the Class 2 of the Series to which the Balanced Series makes Strategic Allocations. Because the Currency Series commenced trading in September 2004, the Graham Series commenced trading in November 2004, the Campbell/Graham Series commenced trading in February 2005, the Long Only Commodity Series and Long/Short Commodity Series commenced trading in March 2006, and the Managed Futures Index Series commenced trading in April 2006, the Class 2 of each Series does not have actual track records that goes back the full five calendar years. Therefore, within the calculation of the pro forma results, such Class 2 allocations were prorated to the Class 2 of the other Series during those months in which their performance was unavailable. |
7. | The performance information for the CISDM Public CPO Asset Weighted Index for November 2006 is estimated. |
SAI-35
Table of Contents
Balanced Series-2a Pro Forma Performance Summary
The comparative chart which follows sets forth the actual average annualized rate of return for the Balanced Series-2a of Units from the inception of trading, as well as the comparative rates of return earned by the managed futures, stock and bond asset classes during the same time periods. The comparative chart should be reviewed in connection with the footnotes which accompany the comparative chart.PAST PERFORMANCE IS NOT NECESSARILY INDICATIVE OF FUTURE RESULTS.
Balanced Series-2a Program May 1, 2006 – November 2006 |
| ||||||||||
| Annual Performance | |||||||||||
| 2006 | |||||||||||
| -4.88% | |||||||||||
Balanced Series-2a Trading Advisors January 2001 – November 2006: |
| ||||||||||
| Program | Pro Forma Actual Annualized Rate of Return1 | Worst Historical Loss | Standard Deviation | ||||||||
Major Advisors: | |||||||||||
Campbell & Company, Inc. | FME Large | 9.66 | % | -14.36 | % | 13.43 | % | ||||
Conquest Capital, LLC2 | MFS | 2.04 | % | -6.11 | % | 8.49 | % | ||||
Cornerstone Quantitative Investment Group, Inc.3 | International Value | 18.07 | % | -13.64 | % | 16.89 | % | ||||
Meyer Capital Management, Inc. | Diversified | 7.62 | % | -25.44 | % | 18.39 | % | ||||
Winton Capital Management Limited | Diversified | 14.03 | % | -26.56 | % | 20.80 | % | ||||
Non-Major Advisors4 | 17.24 | % | -14.45 | % | 18.36 | % | |||||
Emerging Advisors (allocation of <5%)5 | 17.78 | % | -7.54 | % | 12.38 | % | |||||
Strategic Allocations6 (September 2004- November 2006) | -1.02 | % | -13.93 | % | 8.47 | % | |||||
Benchmark Comparisons: (January 2001 – November 2006) | |||||||||||
Public Managed Futures Funds7 | 5.15 | % | -18.52 | % | 13.47 | % | |||||
U.S. Stocks | 2.74 | % | -38.87 | % | 13.97 | % | |||||
U.S. Bonds | 5.80 | % | -3.55 | % | 3.80 | % | |||||
Additional information concerning this series and Trading Advisors is contained in the Balanced Series Appendix to the Prospectus of the Trust.
Managed Futures: CISDM Public CPO Asset Weighted Index. Source: Pertrac 2000, product of Strategic Financial Solutions, LLC.
Stocks: S&P 500 Index (dividends reinvested). Source: Pertrac 2000, product of Strategic Financial Solutions, LLC.
Bonds:Lehman Brothers Aggregate Bond Market Index. Source: Pertrac 2000, product of Strategic Financial Solutions, LLC.
Worst Historical Loss: Measure of risk (also known as Maximum Drawdown) that illustrates the largest peak-to-valley decline, based on monthly rates of return, during a given time period. The time period of analysis is January 2001-November 2006, unless otherwise noted.
SAI-36
Table of Contents
Standard Deviation: Measures the degree of variation of monthly returns around the mean (average) return. The higher the volatility of the investment returns, the higher the standard deviation will be.
1. | The actual trading composite results of the Balanced Series Trading Advisors net of fees, pro forma for expenses of the Trust applicable to the Balanced Series-2a Units as set forth in the Break Even Table in the Balanced Series Appendix. The pro forma average annualized rate of return of the Balanced Series-2a Units will be commensurately higher than that of the Balanced Series-1a Units shown above to the extent that the Balanced Series-2a expenses are lower than the Balanced Series-1a expenses as set forth in the Break Even Table. Additional information, including monthly rates of return, concerning this Series and the Trading Advisors is contained in the Prospectus. |
2. | The performance of the Conquest MFS program begins in June 2004. |
3. | The International Value returns through September 2002 are actual returns, net actual management and incentive fees, employing the “Fully Funded Subset” method. From October 2002 through April 2004, the returns are actual returns of the Cornerstone International Value Fund LLC, a US-based fund, and reflect actual fees and interest. Starting May 2004, the returns are actual returns, net actual management and incentive fees, based on the nominal assets under management (a combination of actual and notional funding), and include actual interest. |
4. | The actual performance of the Balanced Series Non-Major Advisors adjusted for Balanced Series Class 2a fees and expenses. The composite was calculated using the relative weights of the advisors as they existed on November 30, 2006. Not all of the Balanced Series Non-Major Advisors have track records that go back the full five calendar years; therefore, within the calculation of the pro forma results, such Non-Major Advisors’ program allocations were assumed to be held in cash earning a risk-free interest rate of 4.25%. |
5. | The actual performance of the Balanced Series Emerging Advisors adjusted for Balanced Series Class 2a fees and expenses. The Emerging Managers’ programs do not have actual track records that go back the full five calendar years; therefore, within the calculation of the pro forma results, such Emerging Managers’ program allocations were prorated to the other Trading Advisors during those months in which their performance was unavailable. The performance of the Emerging Managers begins in June 2001. |
6. | The equally-weighted composite of the Class 2 of the Series to which the Balanced Series makes Strategic Allocations. Because the Currency Series commenced trading in September 2004, the Graham Series commenced trading in November 2004, the Campbell/Graham Series commenced trading in February 2005, the Long Only Commodity Series and Long/Short Commodity Series commenced trading in March 2006, and the Managed Futures Index Series commenced trading in April 2006, the Class 2 of each Series does not have actual track records that goes back the full five calendar years. Therefore, within the calculation of the pro forma results, such Class 2 allocations were prorated to the Class 2 of the other Series during those months in which their performance was unavailable. |
7. | The performance information for the CISDM Public CPO Asset Weighted Index for November 2006 is estimated. |
SAI-37
Table of Contents
Graham Series-1 Summary Performance Comparison: January 2001 – November 2006
The comparative chart which follows sets forth a composite of the actual annualized rate of return for the Graham Series-1 Units from the inception of trading and the pro forma actual annualized rate of return for the trading program to be used for the Graham Series-1 Units as well as the comparative rates of return earned by the managed futures, stock and bond asset classes during the same time periods. The comparative chart should be reviewed in connection with the footnotes which accompany the comparative chart.PAST PERFORMANCE IS NOT NECESSARILY INDICATIVE OF FUTURE RESULTS.
| Graham Series-11 | U.S. Stocks | U.S. Bonds | Managed Futures | |||||||||
Average Annualized Rate of Return1 | 9.48 | % | 2.74 | % | 5.80 | % | 5.15 | % | ||||
Worst Historical Loss2 | -31.63 | % | -38.87 | % | -3.55 | % | -18.52 | % |
Stocks: S&P 500 Index (dividends reinvested). Source: PerTrac 2000, product of Strategic Financial Solutions, LLC.
Bonds: Lehman Brothers Aggregate Bond Market Index. Source: PerTrac 2000, product of Strategic Financial Solutions, LLC.
Managed Futures: CISDM Public CPO Asset Weighted Index. Source: PerTrac 2000, product of Strategic Financial Solutions, LLC.
1. | The average annualized rate of return is calculated using the actual trading results for the Graham Series-1 Units following the commencement of trading for such Units and, prior to the commencement of trading for the Units the actual trading composite results of Graham’s K4 Trading Program; pro forma for expenses of the Trust applicable to the Graham Series-1 Units as set forth in the Break Even Table in the Graham Series Appendix. The pro forma average annualized rate of return of the Graham Series-2 Units will be commensurately higher than that of the Graham Series-1 Units shown above to the extent that the Graham Series-2 expenses are lower than the Graham Series-1 expenses as set forth in the Break Even Table. |
2. | Worst Historical Loss: measure of risk (also known as Maximum Drawdown) that illustrates the largest peak-to-valley decline, based on monthly rates of return, during a given time period. The time period of analysis isJanuary 2001 – November 2006. |
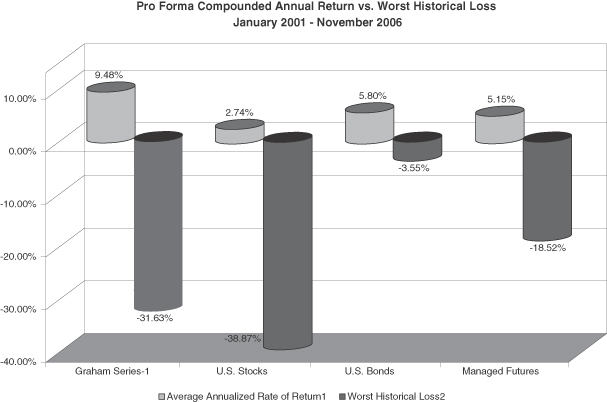
SAI-38
Table of Contents
Graham Series-2 Summary Performance Comparison: January 2001 – November 2006
The comparative chart which follows sets forth a composite of the actual annualized rate of return for the Graham Series-2 Units from the inception of trading and the pro forma actual annualized rate of return for the trading program to be used for the Graham Series-2 Units as well as the comparative rates of return earned by the managed futures, stock and bond asset classes during the same time periods. The comparative chart should be reviewed in connection with the footnotes which accompany the comparative chart.PAST PERFORMANCE IS NOT NECESSARILY INDICATIVE OF FUTURE RESULTS.
| Graham Series-21 | U.S. Stocks | U.S. Bonds | Managed Futures | |||||||||
Average Annualized Rate of Return1 | 12.84 | % | 2.74 | % | 5.80 | % | 5.15 | % | ||||
Worst Historical Loss2 | -29.17 | % | -38.87 | % | -3.55 | % | -18.52 | % |
Stocks: S&P 500 Index (dividends reinvested). Source: PerTrac 2000, product of Strategic Financial Solutions, LLC.
Bonds: Lehman Brothers Aggregate Bond Market Index. Source: PerTrac 2000, product of Strategic Financial Solutions, LLC.
Managed Futures: CISDM Public CPO Asset Weighted Index. Source: PerTrac 2000, product of Strategic Financial Solutions, LLC.
1. | The average annualized rate of return is calculated using the actual trading results for the Graham Series-2 Units following the commencement of trading for such Units and, prior to the commencement of trading for the Units, the actual trading composite results of Graham’s K4 Trading Program; pro forma for expenses of the Trust applicable to the Graham Series-2 Units as set forth in the Break Even Table in the Graham Series Appendix. The pro forma average annualized rate of return of the Graham Series-2 Units will be commensurately higher than that of the Graham Series-1 Units shown above to the extent that the Graham Series-2 expenses are lower than the Graham Series-1 expenses as set forth in the Break Even Table. |
2. | Worst Historical Loss: measure of risk (also known as Maximum Drawdown) that illustrates the largest peak-to-valley decline, based on monthly rates of return, during a given time period. The time period of analysis isJanuary 2001 – November 2006. |
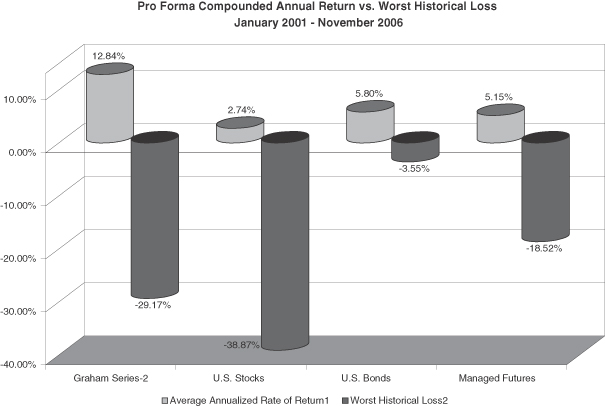
SAI-39
Table of Contents
Winton Series-1 Summary Performance Comparison: January 2001 – November 2006
| Winton Series-11 | U.S. Stocks | U.S. Bonds | Managed Futures | |||||||||
Average Annualized Rate of Return1 | 11.55 | % | 2.74 | % | 5.80 | % | 5.15 | % | ||||
Worst Historical Loss2 | -26.68 | % | -38.87 | % | -3.55 | % | -18.52 | % |
Stocks: S&P 500 Index (dividends reinvested). Source: PerTrac 2000, product of Strategic Financial Solutions, LLC.
Bonds: Lehman Brothers Aggregate Bond Market Index. Source: PerTrac 2000, product of Strategic Financial Solutions, LLC.
Managed Futures: CISDM Public CPO Asset Weighted Index. Source: PerTrac 2000, product of Strategic Financial Solutions, LLC.
1. | The average annualized rate of return is calculated using the actual trading composite results of Winton’s Diversified Program; pro forma for expenses of the Trust applicable to the Winton Series-1 Units as set forth in the Break Even Table in the Winton Series Appendix. The pro forma average annualized rate of return of the Winton Series-2 Units will be commensurately higher than that of the Winton Series-1 Units shown above to the extent that the Winton Series-2 expenses are lower than the Winton Series-1 expenses as set forth in the Break Even Table. |
2. | Worst Historical Loss: measure of risk (also known as Maximum Drawdown) that illustrates the largest peak-to-valley decline, based on monthly rates of return, during a given time period. The time period of analysis isJanuary 2001 – November 2006. |
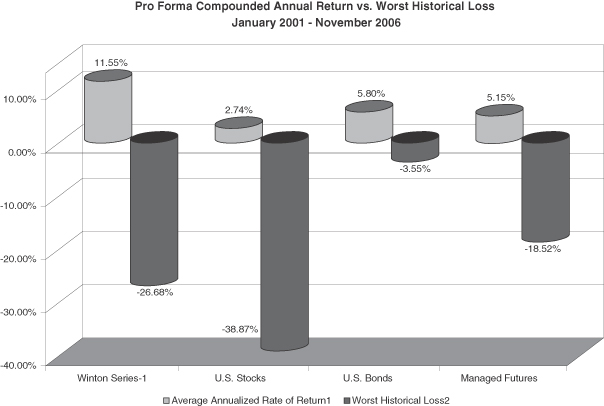
SAI-40
Table of Contents
Winton Series-2 Summary Performance Comparison: January 2001 – November 2006
| Winton Series-11 | U.S. Stocks | U.S. Bonds | Managed Futures | |||||||||
Average Annualized Rate of Return1 | 14.32 | % | 2.74 | % | 5.80 | % | 5.15 | % | ||||
Worst Historical Loss2 | -25.76 | % | -38.87 | % | -3.55 | % | -18.52 | % |
Stocks: S&P 500 Index (dividends reinvested). Source: PerTrac 2000, product of Strategic Financial Solutions, LLC.
Bonds: Lehman Brothers Aggregate Bond Market Index. Source: PerTrac 2000, product of Strategic Financial Solutions, LLC.
Managed Futures: CISDM Public CPO Asset Weighted Index. Source: PerTrac 2000, product of Strategic Financial Solutions, LLC.
1. | The average annualized rate of return is calculated using the actual trading composite results of Winton’s Diversified Program; pro forma for expenses of the Trust applicable to the Winton Series-2 Units as set forth in the Break Even Table in the Winton Series Appendix. The pro forma average annualized rate of return of the Winton Series-2 Units will be commensurately higher than that of the Winton Series-1 Units shown above to the extent that the Winton Series-2 expenses are lower than the Winton Series-1 expenses as set forth in the Break Even Table. |
2. | Worst Historical Loss: measure of risk (also known as Maximum Drawdown) that illustrates the largest peak-to-valley decline, based on monthly rates of return, during a given time period. The time period of analysis isJanuary 2001 – November 2006. |
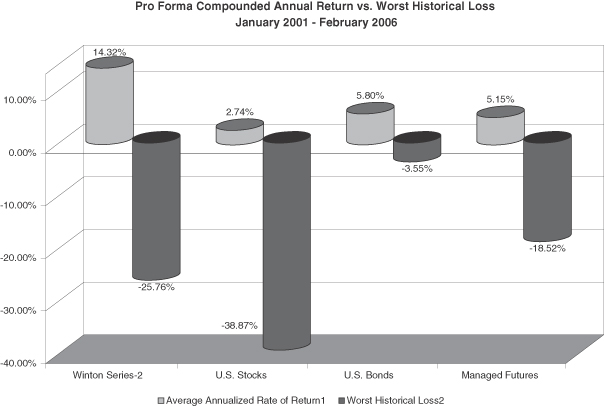
SAI-41
Table of Contents
Campbell/Graham Series-1 Summary Performance Comparison: January 2001 – November 2006
The comparative chart which follows sets forth the actual annualized rate of return for the Campbell/Graham Series-1 Units from the inception of trading, the pro forma actual annualized rate of return for each trading program to be used by the Trading Advisors for the Campbell/Graham Series-1 Units from January 2001 through November 2006, as well as the comparative rates of return earned by the managed futures, stock and bond asset classes during the same time periods. The comparative chart should be reviewed in connection with the footnotes which accompany the comparative chart.PAST PERFORMANCE IS NOT NECESSARILY INDICATIVE OF FUTURE RESULTS.
| Program | Actual Annualized Rate of | Worst Historical Loss | Standard Deviation | ||||||||
Campbell/Graham Series-1 Program (February 14, 2005 – November 2006) | N/A | -4.58 | % | -12.13 | % | 9.95 | % | ||||
| Campbell/Graham Series-1 Trading Advisors: (January 2001 – November 2006) | Program | Pro Forma Actual Annualized Rate of Return1 | Worst Historical Loss | Standard Deviation | |||||||
Campbell & Company, Inc. (pro-forma)2 | FME Large | 6.06 | % | -16.11 | % | 13.78 | % | ||||
Graham Capital Management (pro-forma)3 | K4 (1.5x) | 9.93 | % | -28.82 | % | 21.86 | % | ||||
Benchmark Comparisons: (January 2001 – November 2006) | |||||||||||
Managed Futures | 5.15 | % | -18.52 | % | 13.47 | ||||||
U.S. Stocks | 2.74 | % | -38.87 | % | 13.97 | % | |||||
U.S. Bonds | 5.80 | % | -3.55 | % | 3.80 | % |
Additional information concerning this series and Trading Advisors is contained in the Campbell/Graham Series Appendix to the Prospectus of the Trust.
Managed Futures: CISDM Public CPO Asset Weighted Index. Source: PerTrac 2000, product of Strategic Financial Solutions, LLC.
Stocks: S&P 500 Index (dividends reinvested). Source: PerTrac 2000, product of Strategic Financial Solutions, LLC.
Bonds:Lehman Brothers Aggregate Bond Market Index. Source: PerTrac 2000, product of Strategic Financial Solutions, LLC.
Worst Historical Loss: Measure of risk (also known as Maximum Drawdown) that illustrates the largest peak-to-valley decline, based on monthly rates of return, during a given time period. The time period of analysis is January 2001-November 2006.
Standard Deviation: Measures the degree of variation of monthly returns around the mean (average) return. The higher the volatility of the investment returns, the higher the standard deviation will be.
1. | The actual trading composite results of the Campbell/Graham Series Trading Advisors net of fees, pro forma for expenses of the Trust applicable to the Campbell/Graham Series-1 Units as set forth in the Break Even Table in the Campbell/Graham Series Appendix. The pro forma average annualized rate of return of the Campbell/Graham Series-2 Units will be commensurately higher than that of the Campbell/Graham Series-1 Units shown above to the extent that the Campbell/Graham Series-2 expenses are lower than the Campbell/Graham Series-1 expenses as set forth in the Break Even Table. |
2. | The actual trading composite results of Campbell’s FME Large trading program with pro forma expenses of the Trust applicable to the Campbell/Graham Series-1 Units as set forth in the Break Even Table in the Campbell/Graham Series Appendix. |
3. | The actual trading composite results of Graham’s KF trading program with pro forma expenses of the Trust applicable to the Campbell/Graham Series-1 Units as set forth in the Break Even Table in the Campbell/Graham Series Appendix. |
SAI-42
Table of Contents
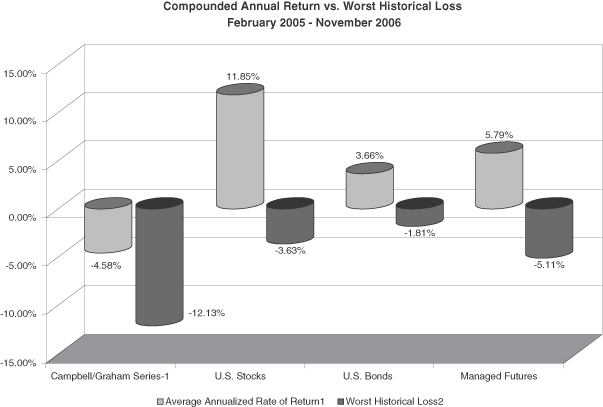
The performance information for U.S. Stocks, U.S. Bonds and Managed Futures presented in the table above is from February 1, 2005, through November 30, 2006. Because the Campbell/Graham Series-1 Units did not commence trading activities until February 14, 2005, the performance information for the Campbell/Graham Series-1 presented in the table above is from February 14, 2005, through November 30, 2006.
SAI-43
Table of Contents
Campbell/Graham Series-2 Summary Performance Comparison: January 2001 – November 2006
The comparative chart which follows sets forth the actual annualized rate of return for the Campbell/Graham Series-2 Units from the inception of trading, the pro forma actual annualized rate of return for each trading program to be used by the Trading Advisors for the Campbell/Graham Series-1 Units from January 2001 through November 2006, as well as the comparative rates of return earned by the managed futures, stock and bond asset classes during the same time periods. The comparative chart should be reviewed in connection with the footnotes which accompany the comparative chart.PAST PERFORMANCE IS NOT NECESSARILY INDICATIVE OF FUTURE RESULTS.
| Program | Actual Return | Worst Historical Loss | Standard Deviation | ||||||||
Campbell/Graham Series-2 Program (February 14, 2005 – November 2006) | N/A | -1.73 | % | -11.58 | % | 10.00 | % | ||||
| Campbell/Graham Series-2 Trading Advisors: (January 2001 – November 2006) | Program | Pro Forma Actual Annualized Rate of Return1 | Worst Historical Loss | Standard Deviation | |||||||
Campbell & Company, Inc. (pro-forma)2 | FME Large | 10.30 | % | -14.67 | % | 13.71 | % | ||||
Graham Capital Management (pro-forma)3 | K4 (1.5x) | 13.33 | % | -26.26 | % | 21.91 | % | ||||
Benchmark Comparisons: (January 2001 – November 2006) | |||||||||||
Managed Futures | 5.15 | % | -18.52 | % | 13.47 | ||||||
U.S. Stocks | 2.74 | % | -38.87 | % | 13.97 | % | |||||
U.S. Bonds | 5.80 | % | -3.55 | % | 3.80 | % |
Additional information concerning this series and Trading Advisors is contained in the Campbell/Graham Series Appendix to the Prospectus of the Trust.
Managed Futures: CISDM Public CPO Asset Weighted Index. Source: PerTrac 2000, product of Strategic Financial Solutions, LLC.
Stocks: S&P 500 Index (dividends reinvested). Source: PerTrac 2000, product of Strategic Financial Solutions, LLC.
Bonds:Lehman Brothers Aggregate Bond Market Index. Source: PerTrac 2000, product of Strategic Financial Solutions, LLC.
Worst Historical Loss: Measure of risk (also known as Maximum Drawdown) that illustrates the largest peak-to-valley decline, based on monthly rates of return, during a given time period. The time period of analysis is January 2001-November 2006.
Standard Deviation: Measures the degree of variation of monthly returns around the mean (average) return. The higher the volatility of the investment returns, the higher the standard deviation will be.
1. | The actual trading composite results of the Campbell/Graham Series Trading Advisors net of fees, pro forma for expenses of the Trust applicable to the Campbell/Graham Series-2 Units as set forth in the Break Even Table in the Campbell/Graham Series Appendix. The pro forma average annualized rate of return of the Campbell/Graham Series-2 Units will be commensurately higher than that of the Campbell/Graham Series-1 Units shown above to the extent that the Campbell/Graham Series-2 expenses are lower than the Campbell/Graham Series-1 expenses as set forth in the Break Even Table. |
2. | The actual trading composite results of Campbell’s FME Large trading program with pro forma expenses of the Trust applicable to the Campbell/Graham Series-2 Units as set forth in the Break Even Table in the Campbell/Graham Series Appendix. |
3. | The actual trading composite results of Graham’s KF trading program with pro forma expenses of the Trust applicable to the Campbell/Graham Series-2 Units as set forth in the Break Even Table in the Campbell/Graham Series Appendix. |
SAI-44
Table of Contents
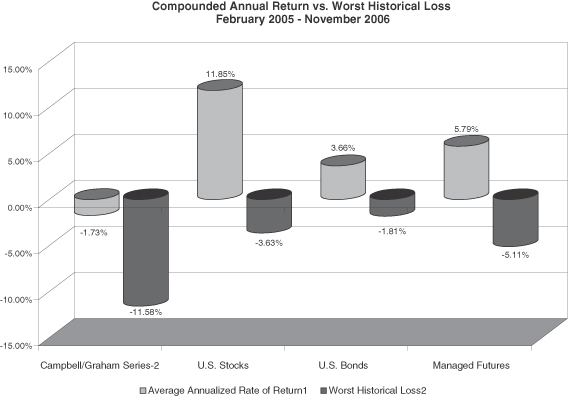
The performance information for U.S. Stocks, U.S. Bonds and Managed Futures presented in the table above is from February 1, 2005, through November 30, 2006. Because the Campbell/Graham Series-2 Units did not commence trading activities until February 14, 2005, the performance information for the Campbell/Graham Series-2 presented in the table above is from February 14, 2005, through November 30, 2006.
SAI-45
Table of Contents
Currency Series-1 Summary Performance Comparison: January 2001 – November 2006
The comparative chart which follows sets forth the actual annualized rate of return for the Currency Series-1 Units from the inception of trading, the pro forma actual annualized rate of return for each trading program to be used by the Trading Advisors for the Currency Series-1 Units from January 2001 through November 2006, as well as the comparative rates of return earned by the managed futures, stock and bond asset classes during the same time periods. The comparative chart should be reviewed in connection with the footnotes which accompany the comparative chart.PAST PERFORMANCE IS NOT NECESSARILY INDICATIVE OF FUTURE RESULTS.
Currency Series-1 Program September 24, 2004 – November 20061 |
| ||||||||||
| Annual Performance | |||||||||||
| 2006 | 2005 | 2004 | |||||||||
| 1.51% | -4.87 | % | 2.67 | % | |||||||
| Actual Annualized Rate of Return2 | Worst Historical Loss | Standard Deviation | |||||||||
| -0.38 | % | -6.50 | % | 4.21 | % | ||||||
Currency Series-1 Trading Advisors January 2001 – November 2006: |
| ||||||||||
| Program | Pro Forma Actual Annualized Rate of Return | Worst Historical Loss | Standard Deviation | ||||||||
C-View International Ltd.3 | Currency | 1.07 | % | -6.66 | % | 4.21 | % | ||||
FX Concepts, Inc.3 | Currency | 12.74 | % | -12.75 | % | 11.37 | % | ||||
GAIN Capital Asset Management LLC3 | Currency | 3.00 | % | -10.04 | % | 6.39 | % | ||||
Benchmark Comparisons: (January 2001 – November 2006) | |||||||||||
Managed Futures | 5.15 | % | -18.52 | % | 13.47 | ||||||
U.S. Stocks | 2.74 | % | -38.87 | % | 13.97 | % | |||||
U.S. Bonds | 5.80 | % | -3.55 | % | 3.80 | % | |||||
Stocks: S&P 500 Index (dividends reinvested). Source: PerTrac 2000, product of Strategic Financial Solutions, LLC.
Bonds:Lehman Brothers Aggregate Bond Market Index. Source: PerTrac 2000, product of Strategic Financial Solutions, LLC.
Managed Futures: CISDM Public CPO Asset Weighted Index. Source: PerTrac 2000, product of Strategic Financial Solutions, LLC.
Worst Historical Loss: Measure of risk (also known as Maximum Drawdown) that illustrates the largest peak-to-valley decline, based on monthly rates of return, during a given time period. The time period of analysis is January 2001-November 2006.
Standard Deviation: Measures the degree of variation of monthly returns around the mean (average) return. The higher the volatility of the investment returns, the higher the standard deviation will be.
1. | Additional information, including monthly rates of return, concerning the Currency Series and the Trading Advisors is contained in the Prospectus and the Currency Series Appendix to the Prospectus. |
2. | Data represents actual performance for Currency Series-1 from September 2004 to November 2006. |
3. | The actual trading composite results of each Currency Series Trading Advisor’s program with pro forma expenses of the Trust applicable to the Currency Series-1 Units as set forth in the Break Even Table in the Currency Series Appendix. |
From the inception of trading on September 24, 2004, the Currency Series was known as the C-View Currency Series and had only one Trading Advisor. In November 2005, the C-View Currency Series was re-designated as the Currency Series and now employs a multi-advisor trading strategy.
SAI-46
Table of Contents
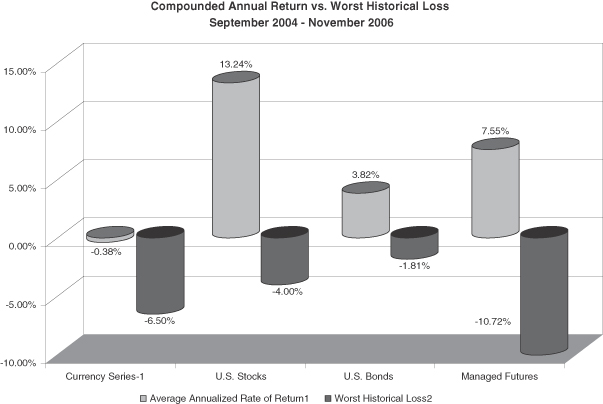
SAI-47
Table of Contents
Currency Series-2 Summary Performance Comparison: January 2001 – November 2006
The comparative chart which follows sets forth the actual annualized rate of return for the Currency Series-2 Units from the inception of trading, the pro forma actual annualized rate of return for each trading program to be used by the Trading Advisors for the Currency Series-2 Units from January 2001 through November 2006, as well as the comparative rates of return earned by the managed futures, stock and bond asset classes during the same time periods. The comparative chart should be reviewed in connection with the footnotes which accompany the comparative chart.PAST PERFORMANCE IS NOT NECESSARILY INDICATIVE OF FUTURE RESULTS.
Currency Series-2 Program September 24, 2004 – November 20061 |
| ||||||||||
| Annual Performance | |||||||||||
| 2006 | 2005 | 2004 | |||||||||
| 4.33% | -1.99 | % | 3.47 | % | |||||||
Actual Annualized Rate of | Worst Historical Loss | Standard Deviation | |||||||||
| 2.54 | % | -3.93 | % | 4.22 | % | ||||||
Currency Series-2 Trading Advisors: January 2001 – November 2006: |
| ||||||||||
| Program | Pro Forma Actual Annualized Rate of Return | Worst Historical Loss | Standard Deviation | ||||||||
C-View International Ltd.3 | Currency | 4.15 | % | -4.05 | % | 4.22 | % | ||||
FX Concepts, Inc.3 | Currency | 16.18 | % | -11.23 | % | 11.39 | % | ||||
GAIN Capital Asset Management LLC3 | Currency | 6.13 | % | -7.44 | % | 6.40 | % | ||||
Benchmark Comparisons: (January 2001 – November 2006) | |||||||||||
Managed Futures5 | 5.15 | % | -18.52 | % | 13.47 | ||||||
U.S. Stocks | 2.74 | % | -38.87 | % | 13.97 | % | |||||
U.S. Bonds | 5.80 | % | -3.55 | % | 3.80 | % | |||||
Stocks: S&P 500 Index (dividends reinvested). Source: PerTrac 2000, product of Strategic Financial Solutions, LLC.
Bonds:Lehman Brothers Aggregate Bond Market Index. Source: PerTrac 2000, product of Strategic Financial Solutions, LLC.
Managed Futures: CISDM Public CPO Asset Weighted Index. Source: PerTrac 2000, product of Strategic Financial Solutions, LLC.
Worst Historical Loss: Measure of risk (also known as Maximum Drawdown) that illustrates the largest peak-to-valley decline, based on monthly rates of return, during a given time period. The time period of analysis is January 2001-November 2006.
Standard Deviation: Measures the degree of variation of monthly returns around the mean (average) return. The higher the volatility of the investment returns, the higher the standard deviation will be.
1. | Additional information, including monthly rates of return, concerning the Currency Series and the Trading Advisors is contained in the Prospectus and the Currency Series Appendix to the Prospectus. |
2. | Data represents actual performance for Currency Series-2 from September 2004 to November 2006. |
3. | The actual trading composite results of each Currency Series Trading Advisor’s program with pro forma expenses of the Trust applicable to the Currency Series-2 Units as set forth in the Break Even Table in the Currency Series Appendix. |
From the inception of trading on September 24, 2004, the Currency Series was known as the C-View Currency Series and had only one Trading Advisor. In November 2005, the C-View Currency Series was re-designated as the Currency Series and now employs a multi-advisor trading strategy.
SAI-48
Table of Contents
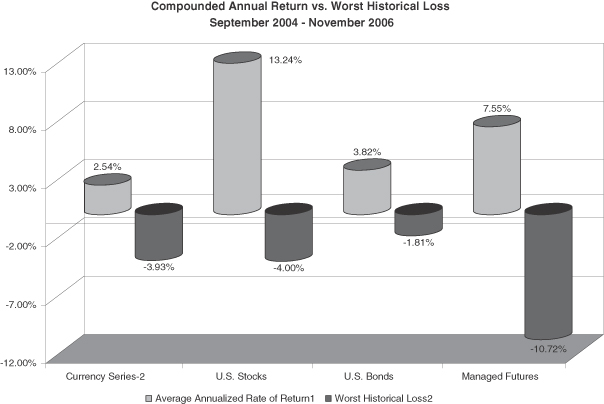
SAI-49
Table of Contents
Long Only Commodity Series-1 Summary Performance Comparison: January 2001 – November 2006
The comparative chart which follows sets forth the actual average annualized rate of return for the Long Only Commodity Series-1 Units from the inception of trading, and the rates of return of each of the Reuters/Jefferies CRB Index and the Jefferies Commodity Performance Index, the RJ/CRB Index Historical, as well as the comparative rates of return earned by the managed futures, stock and bond asset classes during the same time periods. The comparative chart should be reviewed in connection with the footnotes which accompany the comparative chart.PAST PERFORMANCE IS NOT NECESSARILY INDICATIVE OF FUTURE RESULTS.
| Program | Average Return1 | Worst Historical Loss | Standard Deviation | ||||||||
Long Only Commodity Series-1 Program (March 1, 2006 – November 2006) | N/A | 1.18 | % | -14.89 | % | 17.50 | % | ||||
| Long Only Commodity Series-1 Indices: | |||||||||||
RJ/CRB Index Performance (pro-forma) (July 2005 – November 2006) | N/A | 3.72 | % | -14.14 | % | 16.19 | % | ||||
RJ/CRB Index Historical2 (July 2001 – November 2006) | 6.00 | % | -18.51 | % | 11.50 | % | |||||
JCPI (pro-forma) (December 2003 – November 2006) | N/A | 14.85 | % | -15.61 | % | 16.30 | % | ||||
Benchmark Comparisons: | |||||||||||
Managed Futures (January 2001 – November 2006) | 5.15 | % | -18.52 | % | 13.47 | % | |||||
U.S. Stocks | 2.74 | % | -38.87 | % | 13.97 | % | |||||
U.S. Bonds | 5.80 | % | -3.55 | % | 3.80 | % |
Stocks: S&P 500 Index (dividends reinvested). Source: PerTrac 2000, product of Strategic Financial Solutions, LLC.
Bonds:Lehman Brothers Aggregate Bond Market Index. Source: PerTrac 2000, product of Strategic Financial Solutions, LLC.
Managed Futures: CISDM Public CPO Asset Weighted Index. Source: PerTrac 2000, product of Strategic Financial Solutions, LLC.
Worst Historical Loss: Measure of risk (also known as Maximum Drawdown) that illustrates the largest peak-to-valley decline, based on monthly rates of return, during a given time period. The time period of analysis is January 2001-November 2006.
Standard Deviation: Measures the degree of variation of monthly returns around the mean (average) return. The higher the volatility of the investment returns, the higher the standard deviation will be.
1. | The actual trading composite results of the Reuters/Jefferies CRB Index and the Jefferies Composite Performance Index. The average annualized rate of return of the Long Only Commodity Series-2 Units will be commensurately higher than that of the Long Only Commodity Series-1 Units shown above to the extent that the Long Only Commodity Series-2 expenses are lower than the Long Only Commodity Series-1 expenses as set forth in the Break Even Table Additional information, including monthly rates of return, concerning this Series is contained in the Prospectus, including the Long Only Commodity Series Appendix to the Prospectus. |
2. | The RJ/CRB Index Historical performance represents the historical CRB index until June 17, 2005, when the performance switches to the RJ/CRB Index Excess Returns. Source: Bloomberg. |
Additional information, including monthly rates of return, concerning this Series and the indices is contained in the Prospectus.
SAI-50
Table of Contents
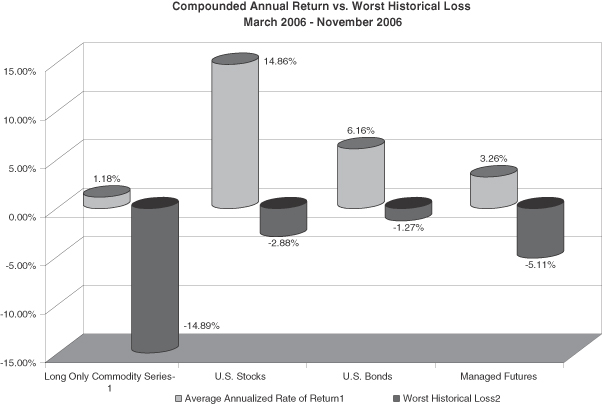
SAI-51
Table of Contents
Long Only Commodity Series-2 Summary Performance Comparison: January 2001 – November 2006
The comparative chart which follows sets forth the actual annualized rate of return for the Long Only Commodity Series-2 Units from the inception of trading, and the rates of return of each of the Reuters/Jefferies CRB Index and the Jefferies Commodity Performance Index, the RJ/CRB Index Historical, as well as the comparative rates of return earned by the managed futures, stock and bond asset classes during the same time periods. The comparative chart should be reviewed in connection with the footnotes which accompany the comparative chart.PAST PERFORMANCE IS NOT NECESSARILY INDICATIVE OF FUTURE RESULTS.
| Program | Average Annualized Rate of Return1 | Worst Historical Loss | Standard Deviation | ||||||||
Long Only Commodity Series-2 Program (March 1, 206 – November 2006) | N/A | 3.32 | % | -14.61 | % | 17.55 | % | ||||
Long Only Commodity Series-2 Indices: | |||||||||||
RJ/CRB Index Performance (July 2005 – November 2006)(pro-forma) | N/A | 5.83 | % | -13.82 | % | 16.19 | % | ||||
RJ/CRB Index Historical2 (July 2001 – November 2006) | 6.00 | % | -18.51 | % | 11.50 | % | |||||
JCPI(December 2003 – November 2006)(pro-forma) | N/A | 17.16 | % | -15.30 | % | 16.32 | % | ||||
Benchmark Comparisons: (January 2001 – November 2006) | |||||||||||
Managed Futures | 5.15 | % | -18.52 | % | 13.47 | % | |||||
U.S. Stocks | 2.74 | % | -38.87 | % | 13.97 | % | |||||
U.S. Bonds | 5.80 | % | -3.55 | % | 3.80 | % |
Stocks: S&P 500 Index (dividends reinvested). Source: PerTrac 2000, product of Strategic Financial Solutions, LLC.
Bonds:Lehman Brothers Aggregate Bond Market Index. Source: PerTrac 2000, product of Strategic Financial Solutions, LLC.
Managed Futures: CISDM Public CPO Asset Weighted Index. Source: PerTrac 2000, product of Strategic Financial Solutions, LLC.
Worst Historical Loss: Measure of risk (also known as Maximum Drawdown) that illustrates the largest peak-to-valley decline, based on monthly rates of return, during a given time period. The time period of analysis is January 2001-November 2006.
Standard Deviation: Measures the degree of variation of monthly returns around the mean (average) return. The higher the volatility of the investment returns, the higher the standard deviation will be.
1. | The actual trading composite results of the Reuters/Jefferies CRB Index and the Jefferies Composite Performance Index. The average annualized rate of return of the Long Only Commodity Series-2 Units will be commensurately higher than that of the Long Only Commodity Series-1 Units shown above to the extent that the Long Only Commodity Series-2 expenses are lower than the Long Only Commodity Series-1 expenses as set forth in the Break Even Table. Additional information, including monthly rates of return, concerning this Series is contained in the Prospectus, including the Long Only Commodity Series Appendix to the Prospectus. |
2. | The RJ/CRB Index Historical performance represents the historical CRB index until June 17, 2005, when the performance switches to the RJ/CRB Index Excess Returns. Source: Bloomberg. |
Additional information, including monthly rates of return, concerning this Series and the indices is contained in the Prospectus.
SAI-52
Table of Contents
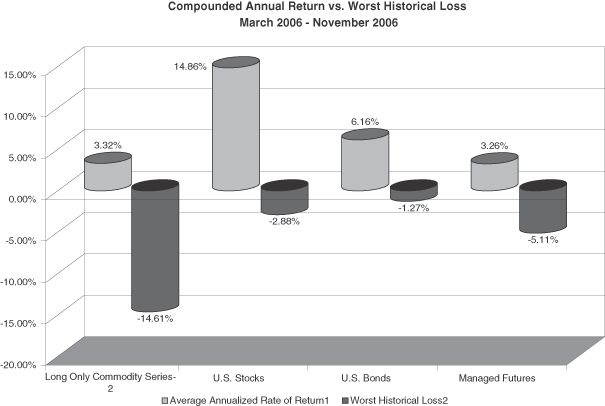
SAI-53
Table of Contents
THE LONG ONLY COMMODITY SERIES IS NOT SPONSORED, ENDORSED, SOLD OR PROMOTED BY REUTERS AMERICA LLC, OR REUTERS, JEFFERIES FINANCIAL PRODUCTS, LLC, OR JEFFERIES, OR ANY OF THEIR SUBSIDIARIES OR AFFILIATES, OR, COLLECTIVELY, THE LICENSORS. THE LICENSORS MAKE NO REPRESENTATION OR WARRANTY, EXPRESS OR IMPLIED, TO THE LONG ONLY COMMODITY SERIES, ITS INVESTORS, OR ANY MEMBER OF THE PUBLIC REGARDING THE ADVISABILITY OF INVESTING IN SECURITIES OR COMMODITIES GENERALLY OR IN THE LONG ONLY COMMODITY SERIES PARTICULARLY OR THE ABILITY OF THE REUTERS/JEFFERIES CRB INDEX, OR THE RJ/CRB INDEX, OR THE JEFFERIES COMMODITY PERFORMANCE INDEX, OR THE JCPI, AND COLLECTIVELY, THE INDICES, TO TRACK GENERAL COMMODITY MARKET PERFORMANCE. THE LICENSORS’ RELATIONSHIP TO THE LONG ONLY COMMODITY SERIES, OR THE LICENSEE, IS THE LICENSING OF THE INDICES, WHICH ARE DETERMINED, COMPOSED AND CALCULATED BY ONE OR MORE LICENSORS WITHOUT REGARD TO THE LONG ONLY COMMODITY SERIES OR ITS INVESTORS. THE LICENSORS HAVE NO OBLIGATION TO TAKE THE NEEDS OF THE LONG ONLY COMMODITY SERIES OR ITS INVESTORS INTO CONSIDERATION IN DETERMINING, COMPOSING OR CALCULATING THE INDICES. THE LICENSORS ARE NOT RESPONSIBLE FOR AND HAVE NOT PARTICIPATED IN THE DETERMINATION OF THE TIMING OF, PRICES AT, OR QUANTITIES OF LONG ONLY COMMODITY SERIES UNITS TO BE ISSUED OR IN THE DETERMINATION OR CALCULATION OF THE EQUATION BY WHICH THE UNITS OF THE LONG ONLY COMMODITY SERIES ARE TO BE CONVERTED INTO CASH. THE LICENSORS HAVE NO OBLIGATION OR LIABILITY IN CONNECTION WITH THE ADMINISTRATION, MARKETING OR TRADING OF THE LONG ONLY COMMODITY SERIES.
THE LICENSORS AND THEIR AFFILIATES AND THEIR RESPECTIVE DIRECTORS, OFFICERS, EMPLOYEES AND AGENTS MAY BUY OR SELL SECURITIES OR COMMODITIES MENTIONED OR CONTEMPLATED HEREIN AS AGENT OR AS PRINCIPAL FOR THEIR OWN ACCOUNTS AND MAY HAVE POSITIONS OR ENGAGE IN TRANSACTIONS BASED ON OR INDEXED TO THE INDICES. IT IS POSSIBLE THAT THE LICENSORS’ TRADING ACTIVITY WILL AFFECT THE VALUE OF THE INDICES. WITHOUT LIMITING THE FOREGOING, JEFFERIES MAY ACT AS A SWAP COUNTERPARTY TO THE TRADING COMPANY WITH RESPECT TO SWAPS VALUED IN RELATION TO THE INDICES. THE LICENSORS MAY OPERATE AND MARKET OTHER INDICES THAT MAY COMPETE WITH THE INDICES.
THE LICENSORS DO NOT GUARANTEE THE QUALITY, ACCURACY AND/OR THE COMPLETENESS OF THE INDICES OR ANY DATA INCLUDED THEREIN. THE LICENSORS MAKE NO WARRANTY, EXPRESS OR IMPLIED, AS TO RESULTS TO BE OBTAINED BY THE LONG ONLY COMMODITY SERIES OR ITS INVESTORS, OR ANY OTHER PERSON OR ENTITY FROM THE USE OF THE INDICES OR ANY DATA INCLUDED THEREIN IN CONNECTION WITH THE RIGHTS LICENSED AS DESCRIBED HEREIN OR FOR ANY OTHER USE. THE LICENSORS MAKE NO EXPRESS OR IMPLIED WARRANTIES, AND HAVE EXPRESSLY DISCLAIMED ALL WARRANTIES OF MERCHANTABILITY OR FITNESS FOR A PARTICULAR PURPOSE OR USE WITH RESPECT TO THE INDICES OR ANY DATA INCLUDED THEREIN. WITHOUT LIMITING ANY OF THE FOREGOING, IN NO EVENT SHALL THE LICENSORS HAVE ANY LIABILITY FOR ANY SPECIAL, PUNITIVE, INDIRECT, INCIDENTAL OR CONSEQUENTIAL DAMAGES (INCLUDING, WITHOUT LIMITATION, LOST PROFITS), EVEN IF NOTIFIED OF THE POSSIBILITY OF SUCH DAMAGES.
THE LICENSORS ARE NOT ADVISORS TO THE LONG ONLY COMMODITY SERIES OR TO ANY INVESTOR AS TO LEGAL, TAXATION, ACCOUNTING, REGULATORY OR FINANCIAL MATTERS IN ANY JURISDICTION, AND ARE NOT PROVIDING ANY ADVICE AS TO ANY SUCH MATTER TO THE RECIPIENT.
SAI-54
Table of Contents
Long/Short Commodity Series-1 Summary Performance Comparison: March 2006 – November 2006
The comparative chart which follows sets forth a composite of the actual average annualized rates of return for the trading programs to be used for the Long/Short Commodity Series-1 of Units from the inception of trading as well as the comparative rates of return earned by the managed futures, stock and bond asset classes during the same time periods. The comparative chart should be reviewed in connection with the footnotes which accompany the comparative chart.PAST PERFORMANCE IS NOT NECESSARILY INDICATIVE OF FUTURE RESULTS.
Long/Short Commodity Series-1 Program March 6, 2006 – November 2006 |
| ||||||||||
| Annual Performance | |||||||||||
| 2006 | |||||||||||
| 0.96% | |||||||||||
Long/Short Commodity Series-1 Trading Advisors January 2001 – November 2006: |
| ||||||||||
| Program | Pro Forma Actual Annualized Rate of Return1 | Worst Historical Loss | Standard Deviation | ||||||||
AAA Capital Management, Inc.2 | Energy/Futures Only | 24.90 | % | -27.25 | % | 18.55 | % | ||||
AIS Futures Management LLC2 | MAAP 2X-4X | 11.45 | % | -27.84 | % | 24.38 | % | ||||
Cornerstone Quantitative Investment Group, Inc.3 | RCA | 10.62 | % | -6.66 | % | 10.34 | % | ||||
Forecast Trading Group, LLC2 | Forecast | 5.62 | % | -14.54 | % | 13.93 | % | ||||
Kottke Associates, LLC2 | JVPT | 2.41 | % | -22.64 | % | 9.23 | % | ||||
Landmark Trading Company2 | Landmark | 28.60 | % | -22.74 | % | 21.38 | % | ||||
Mississippi River Investments, Inc.2,4 | Bondurant | 12.12 | % | -11.98 | % | 10.92 | % | ||||
Red Oak Commodity Advisors, Inc.2 | Fundamental Trading | 15.12 | % | -36.54 | % | 33.18 | % | ||||
Strategic Ag Trading2 | Grains | 13.05 | % | -21.42 | % | 20.91 | % | ||||
Benchmark Comparisons: (January 2001 – November 2006) | |||||||||||
Managed Futures | 5.15 | % | -18.52 | % | 13.47 | % | |||||
U.S. Stocks | 2.74 | % | -38.87 | % | 13.97 | % | |||||
U.S. Bonds | 5.80 | % | -3.55 | % | 3.80 | % | |||||
Stocks: S&P 500 Index (dividends reinvested). Source: PerTrac 2000, product of Strategic Financial Solutions, LLC.
Bonds:Lehman Brothers Aggregate Bond Market Index. Source: PerTrac 2000, product of Strategic Financial Solutions, LLC.
Managed Futures: CISDM Public CPO Asset Weighted Index. Source: PerTrac 2000, product of Strategic Financial Solutions, LLC.
Worst Historical Loss: Measure of risk (also known as Maximum Drawdown) that illustrates the largest peak-to-valley decline, based on monthly rates of return, during a given time period. The time period of analysis is January 2001-November 2006.
SAI-55
Table of Contents
Standard Deviation: Measures the degree of variation of monthly returns around the mean (average) return. The higher the volatility of the investment returns, the higher the standard deviation will be.
1. | The actual trading composite results of Long/Short Series Trading Advisors Programs; are within in the Long/Short Commodity Series Appendix. The actual average annualized rate of return of the Long/Short Commodity Series 2 Units will be commensurately higher than that of the Long/Short Commodity Series 1 Units shown above to the extent that the Long/Short Commodity Series 2 expenses are lower than the Long/Short Commodity Series 1 expenses as set forth in the Break Even Table. |
2. | Pro forma returns through March 2006 are based on adjusting the advisor’s composite track record for the expenses and interest income of The Frontier Fund. Returns after that date are based on the advisor’s returns in The Frontier Fund adjusted for the expenses and interest income of Class 1 and Class 2. |
3. | Pro forma returns through April 2006 are based on adjusting the advisor’s composite track record for the expenses and interest income of The Frontier Fund. Returns after that date are based on the advisor’s returns in The Frontier Fund adjusted for the expenses and interest income of Class 1 and Class 2. |
4. | Represents the Bondurant Program only. The Frontier Fund uses both the Bondurant Program and the Martin Program. |
Additional information, including monthly rates of return, concerning this Series and the Trading Advisors is contained in the Prospectus.
SAI-56
Table of Contents
Long/Short Commodity Series-2 Summary Performance Comparison: March – November 2006
The comparative chart which follows sets forth a composite of the actual average annualized rates of return for the trading programs to be used for the Long/Short Commodity Series-2 of Units from the inception of trading as well as the comparative rates of return earned by the managed futures, stock and bond asset classes during the same time periods. The comparative chart should be reviewed in connection with the footnotes which accompany the comparative chart.PAST PERFORMANCE IS NOT NECESSARILY INDICATIVE OF FUTURE RESULTS.
Long/Short Commodity Series-2 Program March 6, 2006 – November 2006 |
| ||||||||||
| Annual Performance | |||||||||||
| 2006 | |||||||||||
| 3.22% | |||||||||||
Long/Short Commodity Series-2 Trading Advisors January 2001 – November 2006: |
| ||||||||||
| Program | Pro Forma Actual Annualized Rate of Return1 | Worst Historical Loss | Standard Deviation | ||||||||
AAA Capital Management, Inc.2 | Energy/Futures Only | 28.02 | % | -26.70 | % | 18.43 | % | ||||
AIS Futures Management LLC2 | MAAP 2X-4X | 13.99 | % | -26.86 | % | 24.18 | % | ||||
Cornerstone Quantitative Investment Group, Inc.3 | RCA | 13.96 | % | -6.41 | % | 10.34 | % | ||||
Forecast Trading Group, LLC2 | Forecast | 8.55 | % | -12.69 | % | 13.93 | % | ||||
Kottke Associates, LLC2 | JVPT | 5.71 | % | -18.59 | % | 9.24 | % | ||||
Landmark Trading Company2 | Landmark | 32.94 | % | -16.96 | % | 21.26 | % | ||||
Mississippi River Investments, Inc.2,4 | Bondurant | 15.54 | % | -8.27 | % | 10.93 | % | ||||
Red Oak Commodity Advisors, Inc.2 | Fundamental Trading | 17.19 | % | -34.43 | % | 33.02 | % | ||||
Strategic Ag Trading2 | Grains | 16.74 | % | -20.80 | % | 20.95 | % | ||||
Benchmark Comparisons: (January 2001 – November 2006) | |||||||||||
Managed Futures | 5.15 | % | -18.52 | % | 13.47 | % | |||||
U.S. Stocks | 2.74 | % | -38.87 | % | 13.97 | % | |||||
U.S. Bonds | 5.80 | % | -3.55 | % | 3.80 | % | |||||
Stocks: S&P 500 Index (dividends reinvested). Source: PerTrac 2000, product of Strategic Financial Solutions, LLC.
Bonds:Lehman Brothers Aggregate Bond Market Index. Source: PerTrac 2000, product of Strategic Financial Solutions, LLC.
Managed Futures: CISDM Public CPO Asset Weighted Index. Source: PerTrac 2000, product of Strategic Financial Solutions, LLC.
Worst Historical Loss: Measure of risk (also known as Maximum Drawdown) that illustrates the largest peak-to-valley decline, based on monthly rates of return, during a given time period. The time period of analysis is January 2001-November 2006.
SAI-57
Table of Contents
Standard Deviation: Measures the degree of variation of monthly returns around the mean (average) return. The higher the volatility of the investment returns, the higher the standard deviation will be.
1. | The actual trading composite results of Long/Short Series Trading Advisors Programs are within in the Long/Short Commodity Series Appendix. The actual average annualized rate of return of the Long/Short Commodity Series 2 Units will be commensurately higher than that of the Long/Short Commodity Series 1 Units shown above to the extent that the Long/Short Commodity Series 2 expenses are lower than the Long/Short Commodity Series 1 expenses as set forth in the Break Even Table. |
2. | Pro forma returns through March 2006 are based on adjusting the advisor’s composite track record for the expenses and interest income of The Frontier Fund. Returns after that date are based on the advisor’s returns in The Frontier Fund adjusted for the expenses and interest income of Class 1 and Class 2. |
3. | Pro forma returns through April 2006 are based on adjusting the advisor’s composite track record for the expenses and interest income of The Frontier Fund. Returns after that date are based on the advisor’s returns in The Frontier Fund adjusted for the expenses and interest income of Class 1 and Class 2. |
4. | Represents the Bondurant Program only. The Frontier Fund uses both the Bondurant Program and the Martin Program. |
Additional information, including monthly rates of return, concerning this Series and the Trading Advisors is contained in the Prospectus.
SAI-58
Table of Contents
Managed Futures Index Series-1 Summary Performance Comparison: April 2006 – November 2006
The comparative chart which follows sets forth the actual average annualized rate of return for the Managed Futures Index Series-1 Units from the inception of trading as well as the comparative rates of return earned by the managed futures, stock and bond asset classes during the same time periods. The comparative chart should be reviewed in connection with the footnotes which accompany the comparative chart.PAST PERFORMANCE IS NOT NECESSARILY INDICATIVE OF FUTURE RESULTS.
Managed Program1 | U.S. Stocks | U.S. Bonds | Managed Futures | |||||||||
Average Annualized Rate of Return1 | -6.11 | % | 14.71 | % | 8.54 | % | -0.31 | % | ||||
Worst Historical Loss2 | -9.33 | % | -2.88 | % | -0.29 | % | -5.11 | % | ||||
Annualized Standard Deviation | 9.58 | % | 6.69 | % | 2.28 | % | 5.64 | % |
Stocks: S&P 500 Index (dividends reinvested). Source: PerTrac 2000, product of Strategic Financial Solutions, LLC.
Bonds:Lehman Brothers Aggregate Bond Market Index. Source: PerTrac 2000, product of Strategic Financial Solutions, LLC.
Managed Futures: CISDM Public CPO Asset Weighted Index. Source: PerTrac 2000, product of Strategic Financial Solutions, LLC.
1. | The actual trading composite results are within the Managed Futures Index Series Appendix. The actual average annualized rate of return of the Managed Futures Index Series-2 Units will be commensurately higher than that of the Managed Futures Index Series-1 Units shown above to the extent that the Managed Futures Index Series-2 expenses are lower than the Managed Futures Index Series-1 expenses as set forth in the Break Even Table. |
2. | Worst Historical Loss: measure of risk (also known as Maximum Drawdown) that illustrates the largest peak-to-valley decline, based on monthly rates of return, during a given time period. The time period of analysis isApril 2006 – November 2006. |
Additional information, including monthly rates of return, concerning this Series and the Conquest Managed Futures Benchmark is contained in the Prospectus.
SAI-59
Table of Contents
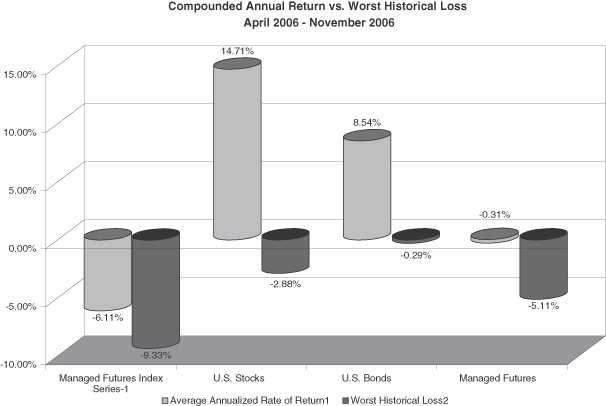
SAI-60
Table of Contents
Managed Futures Index Series-2 Summary Performance Comparison: April 2006 – November 2006
The comparative chart which follows sets forth the actual average annualized rate of return for the Managed Futures Index Series-2 Units from the inception of trading as well as the comparative rates of return earned by the managed futures, stock and bond asset classes during the same time periods. The comparative chart should be reviewed in connection with the footnotes which accompany the comparative chart.PAST PERFORMANCE IS NOT NECESSARILY INDICATIVE OF FUTURE RESULTS.
| Managed Futures Index Program1 | U.S. Stocks | U.S. Bonds | Managed Futures | |||||||||
Average Annualized Rate of Return1 | -4.21 | % | 14.71 | % | 8.54 | % | -0.31 | % | ||||
Worst Historical Loss2 | -8.57 | % | -2.88 | % | -0.29 | % | -5.11 | % | ||||
Annualized Standard Deviation | 9.60 | % | 6.69 | % | 2.28 | % | 5.64 | % |
Stocks: S&P 500 Index (dividends reinvested). Source: PerTrac 2000, product of Strategic Financial Solutions, LLC.
Bonds:Lehman Brothers Aggregate Bond Market Index. Source: PerTrac 2000, product of Strategic Financial Solutions, LLC.
Managed Futures: CISDM Public CPO Asset Weighted Index. Source: PerTrac 2000, product of Strategic Financial Solutions, LLC.
1. | The actual trading composite results are within Managed Futures Index Series Appendix. The pro forma average annualized rate of return of the Managed Futures Index Series-2 Units will be commensurately higher than that of the Managed Futures Index Series-1 Units shown above to the extent that the Managed Futures Index Series-2 expenses are lower than the Managed Futures Index Series-1 expenses as set forth in the Break Even Table. |
2. | Worst Historical Loss: measure of risk (also known as Maximum Drawdown) that illustrates the largest peak-to-valley decline, based on monthly rates of return, during a given time period. The time period of analysis isApril 2006 – November 2006. |
Additional information, including monthly rates of return, concerning this Series and the Conquest Managed Futures Benchmark is contained in the Prospectus.
SAI-61
Table of Contents
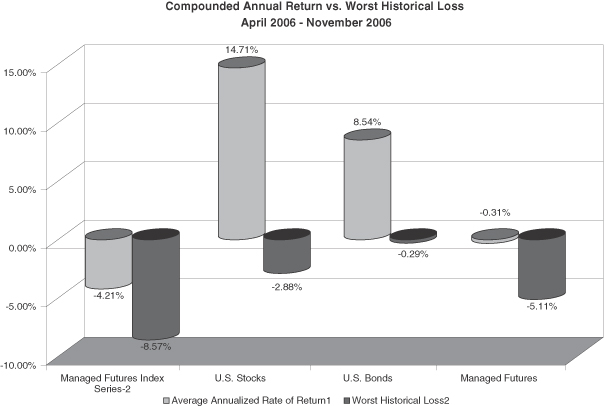
SAI-62
Table of Contents
MANAGED FUTURES INDUSTRY INFORMATION
Sample of Markets Traded
Many Trading Advisors mitigate risk by operating in six sectors. Three sectors are related to financial instruments: Interest Rates, Currencies and Stock Indices. The other three sectors are based on non-financial instruments, including: Metals, Energy and Commodities. Within these six global sectors, as well as the underlying markets traded which are illustrated below, another layer of diversification is added and the potential to further reduce risk.
Please note that not every Trading Advisor trades within all or some of these sectors or markets. These markets have inherent risks and you should read the prospectus. There is no guarantee that managed futures or The Frontier Fund will meet its intended objective; accordingly, investors could lose a substantial portion, or even all, of their investment.
| Financials | Interest Rates | Currencies | Stock Indices | |||
| • Eurodollar | • Australian Dollar | • S&P 500 | ||||
| • U.S. T-Bonds | • British Pound | • Russell 2000 | ||||
| • U.S. T-Notes | • Canadian Dollar | • Dow Jones Industrial | ||||
| • Australian T-Bonds | • Euro | • Nikkei | ||||
| • Japanese Government Bonds | • Japanese Yen | • CAC 40 | ||||
• Swiss Franc | • Hang Seng | |||||
| Non-Financials | Metals | Energy | Agricultural | |||
• Gold | • Heating Oil | • Soybeans | ||||
• Silver | • Gasoline | • Live Cattle | ||||
• Copper | • Crude Oil | • Corn | ||||
• Lead | • Brent Crude Oil | • Cocoa | ||||
• Aluminum | • Natural Gas | • Coffee |
SAI-63
Table of Contents
Various Trading Strategies
Trading Advisors work within the parameters of certain trading strategies. Below is an illustration of the different types of research, trading approaches, trading methodologies, duration of trades and markets traded that Trading Advisors may utilized. These various trading styles offer the opportunity to diversify across trading approaches, methodology and duration, thus potentially reducing risk.
Please note that not every Trading Advisor utilized all or some of these trading strategies. These strategies have inherent risks and you should read the prospectus. There is no guarantee that managed futures or The Frontier Fund will meet its intended objective; accordingly, investors could lose a substantial portion, or even all, of their investment.
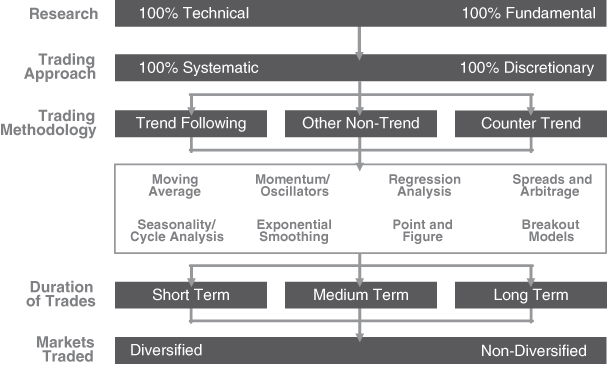
SAI-64
Table of Contents
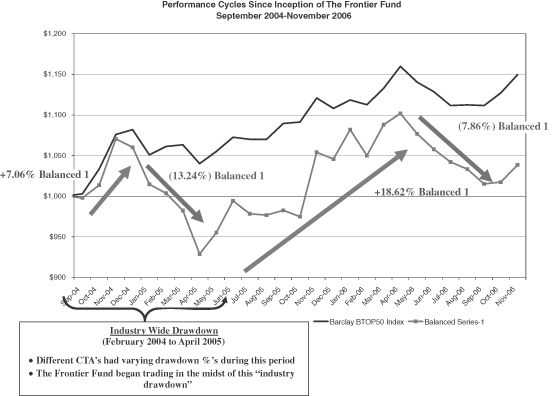
Managed Futures: Barclay BTOP 50 Index. Source: PerTrac 2000, product of Strategic Financial Solutions, LLC.
The performance of the Balanced Series-1 displayed above is the actual performance of the Balanced Series-1, deducting the expenses of the Trust applicable to the Balanced Series-1 Units as set forth in the Balanced Series Appendix.
SAI-65
Table of Contents
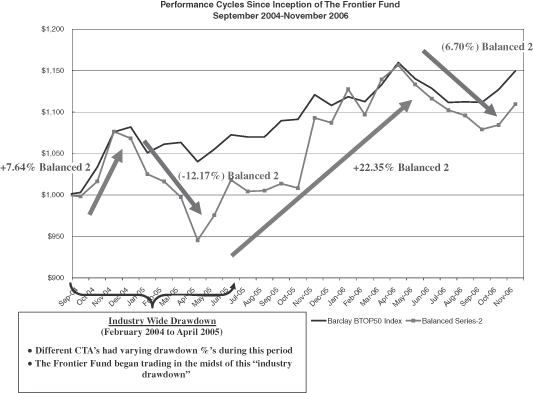
Managed Futures: Barclay BTOP 50 Index. Source: PerTrac 2000, product of Strategic Financial Solutions, LLC.
The performance of the Balanced Series-2 displayed above is the actual performance of the Balanced Series-2, deducting the expenses of the Trust applicable to the Balanced Series-2 Units as set forth in the Balanced Series Appendix.
SAI-66
Table of Contents
Monthly Correlation
Correlation is the statistical measure of how closely two investments move in unison, with the range of coefficients ranging from -1 to 1. A score of 1 indicates that two investments are 100% correlated, while -1 indicates the maximum negative or non-correlation.
Typically due to the diversified sector exposure and various trading strategies employed, managed futures can be non to negatively correlated to stocks and bonds.
There is no guarantee that managed futures or The Frontier Fund will meet its intended objective; accordingly, investors could lose a substantial portion, or even all, of their investment.
| Monthly Correlation January 1990 to November 2006 | CISDM CTA Asset Weighted Index | Barclay BTOP50 Index | S&P 500 Total Return Index | Lehman Aggregate Bond Index | ||||
CISDM CTA Asset Weighted Index | 1.00 | |||||||
Barclay BTOP50 Index | 0.94 | 1.00 | ||||||
S&P 500 Total Return Index | -0.08 | -0.12 | 1.00 | |||||
Lehman Aggregate Bond Index | 0.24 | 0.27 | 0.15 | 1.00 |
Managed Futures: CISDM CTA Asset Weighted Index and Barclay CTA Index Source: PerTrac 2000, product of Strategic Financial Solutions, LLC.
Stocks: S&P 500 Total Return Index. Source: PerTrac 2000, product of Strategic Financial Solutions, LLC.
Bonds:Lehman Brothers Aggregate Bond Market Index. Source: PerTrac 2000, product of Strategic Financial Solutions, LLC.
Summary of Managed Futures Performance and Correlation
| Managed Futures Returns During Significant Financial Market Disruptions | ||||||||
| Period | Event | Stocks | Managed Futures | |||||
Fourth Quarter 1987 | U.S. Stock Market Crash | -22.53 | % | 20.10 | % | |||
Third Quarter 1990 | Invasion of Kuwait by Iraq | -13.75 | % | 15.72 | % | |||
January 1994-December 1994 | Federal Reserve Interest Rate Increases | 1.32 | % | -0.70 | % | |||
Third Quarter 1998 | Russian Debt Default, LTCM Crisis | -9.95 | % | 9.22 | % | |||
November 2000-December 2000 | US Presidential Election Uncertainty | -7.43 | % | 11.74 | % | |||
September 2001 – October 2001 | Terrorist Attacks on U.S. Soil | -6.32 | % | 5.64 | % | |||
October 2001- July 2002 | Enron & WorldCom Bankruptcies | -11.37 | % | 8.43 | % | |||
August 2002-September 2002 | Bear Market Bottom & High Yield Bond Market Turbulance | -10.28 | % | 4.16 | % | |||
January 2000-December 2002 | Technology Bubble Bursts, U.S. Recession | -37.60 | % | 23.84 | % | |||
January 2003-March 2003 | War in Iraq, SARS Crisis, Geopolitical Uncertainty | -3.15 | % | 3.88 | % | |||
Managed Futures: CISDM CTA Asset Weighted Index. Source: PerTrac 2000, product of Strategic Financial Solutions, LLC.
Stocks: S&P 500 Total Return Index. Source: PerTrac 2000, product of Strategic Financial Solutions, LLC.
These selected periods are used for illustrative purposes and may not correspond with the precise starting and ending dates surrounding the suggested events or period of perceived crisis
SAI-67
Table of Contents
Managed Futures 10 Largest Declines and Subsequent 12 Month Return
The below data is a representation of the following 12 months of Managed Futures performance following a significant drawdown in performance. It is evident that following challenging market conditions, historically, managed futures have experienced a positive recovery.
There is no guarantee that managed futures or The Frontier Fund will meet its intended objective; accordingly, investors could lose a substantial portion, or even all, of their investment.
Managed Futures 10 Largest Declines & Subsequent 12 Month Return | ||||||||
| Drawdown Performance | Peak | Trough | Succeeding 12 Month Return | |||||
| -20.39% | Sep-82 | Jul-83 | 21.92% | |||||
| -15.92% | Mar-86 | Dec-86 | 57.78% | |||||
| -13.28% | Jan-81 | Apr-81 | 23.25% | |||||
| -10.69% | Dec-91 | Apr-92 | 35.37% | |||||
| -10.34% | Jun-81 | Oct-81 | 24.05% | |||||
| -10.17% | Jul-89 | Oct-89 | 35.44% | |||||
| -9.67% | Jun-82 | Jul-82 | -9.82% | |||||
| -8.25% | Mar-04 | Aug-04 | 10.18% | |||||
| -7.78% | Dec-87 | Apr-88 | 25.97% | |||||
| -7.33% | Nov-81 | Dec-81 | 5.09% | |||||
Average | -11.38% | 22.92% | ||||||
Managed Futures: CISDM CTA Asset Weighted Index. Source: PerTrac 2000, product of Strategic Financial Solutions, LLC.
SAI-68
Table of Contents
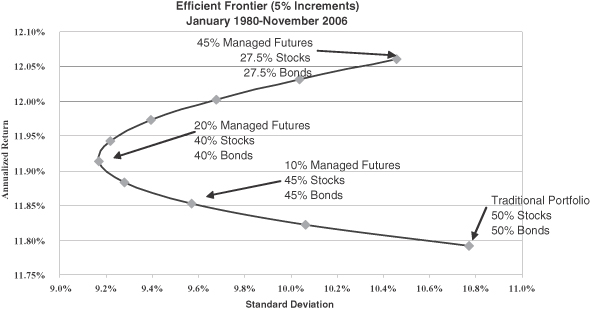
Managed Futures: Barclay CTA Index. Source: Pertrac 2000, product of Strategic Financial Solutions, LLC.
Stocks: Standard & Poor’s 500 Composite Stock Index, with dividends reinvested. Source: Pertrac 2000, product of Strategic Financial Solutions, LLC
Bonds: Lehman Brothers Aggregate Bond Market Index. Source: PerTrac 2000, a product of Strategic Financial Solutions
Annualized Standard Deviation: Measures the degree of variation of monthly returns around the mean (average) return. The higher the volatility of the investment returns, the higher the standard deviation will be
SAI-69
Table of Contents
AMENDED AND RESTATED
DECLARATION OF TRUST
AND
TRUST AGREEMENT
OF
THE FRONTIER FUND
Dated as of August 8, 2003
By and Among
EQUINOX FUND MANAGEMENT, LLC,
WILMINGTON TRUST COMPANY
and
THE UNITHOLDERS
from time to time hereunder
Table of Contents
TABLE OF CONTENTS
| Page | ||||
ARTICLE I DEFINITIONS; THE TRUST | A-1 | |||
SECTION 1.1 | Definitions | A-1 | ||
SECTION 1.2 | Name | A-5 | ||
SECTION 1.3 | Delaware Trustee; Business Offices | A-6 | ||
SECTION 1.4 | Purposes and Powers | A-6 | ||
SECTION 1.5 | Tax Treatment | A-6 | ||
SECTION 1.6 | General Liability of the Managing Owner | A-7 | ||
SECTION 1.7 | Legal Title | A-7 | ||
SECTION 1.8 | Series Trust | A-7 | ||
ARTICLE II THE TRUSTEE | A-7 | |||
SECTION 2.1 | Term; Resignation | A-7 | ||
SECTION 2.2 | Powers | A-8 | ||
SECTION 2.3 | Compensation and Expenses of the Trustee | A-8 | ||
SECTION 2.4 | Indemnification | A-8 | ||
SECTION 2.5 | Successor Trustee | A-8 | ||
SECTION 2.6 | Liability of Trustee | A-9 | ||
SECTION 2.7 | Reliance; Advice of Counsel | A-9 | ||
ARTICLE III UNITS; CAPITAL CONTRIBUTIONS | A-10 | |||
SECTION 3.1 | General | A-10 | ||
SECTION 3.2 | Limited Units | A-11 | ||
SECTION 3.3 | Managing Owner’s Required Contribution | A-25 | ||
SECTION 3.4 | Establishment of Series of Units | A-26 | ||
SECTION 3.5 | Establishment of Classes and Sub-Series | A-26 | ||
SECTION 3.6 | Assets of Series | A-26 | ||
SECTION 3.7 | Liabilities of Series | A-27 | ||
SECTION 3.8 | Series Distributions | A-28 | ||
SECTION 3.9 | Voting Rights | A-29 | ||
SECTION 3.10 | Equality | A-29 | ||
SECTION 3.11 | Exchange of Units | A-29 | ||
ARTICLE IV THE MANAGING OWNER | A-29 | |||
SECTION 4.1 | Management of the Trust | A-29 | ||
SECTION 4.2 | Authority of Managing Owner | A-29 | ||
SECTION 4.3 | Obligations of the Managing Owner | A-31 | ||
SECTION 4.4 | General Prohibitions | A-33 | ||
SECTION 4.5 | Liability of Covered Persons | A-34 | ||
SECTION 4.6 | Indemnification of the Managing Owner | A-34 | ||
SECTION 4.7 | Expenses | A-35 | ||
SECTION 4.8 | Compensation to the Managing Owner | A-36 | ||
SECTION 4.9 | Other Business of Unitholders | A-39 | ||
SECTION 4.10 | Voluntary Withdrawal of the Managing Owner | A-39 | ||
SECTION 4.11 | Authorization of Registration Statements | A-39 | ||
SECTION 4.12 | Litigation | A-39 | ||
ARTICLE V TRANSFERS OF UNITS | A-40 | |||
SECTION 5.1 | General Prohibition | A-40 | ||
SECTION 5.2 | Transfer of Managing Owner’s General Units | A-40 | ||
SECTION 5.3 | Transfer of Limited Units | A-40 | ||
i
Table of Contents
| Page | ||||
ARTICLE VI DISTRIBUTION AND ALLOCATIONS | A-43 | |||
SECTION 6.1 | Capital Accounts | A-43 | ||
SECTION 6.2 | Book Capital Account Allocations | A-43 | ||
SECTION 6.3 | Allocation of Profit and Loss for United States Federal Income Tax Purposes | A-43 | ||
SECTION 6.4 | Allocation of Distributions | A-44 | ||
SECTION 6.5 | Admissions of Unitholders; Transfers | A-45 | ||
SECTION 6.6 | Liability for State and Local and Other Taxes | A-45 | ||
ARTICLE VII REDEMPTIONS | A-45 | |||
SECTION 7.1 | Redemption of Units | A-45 | ||
SECTION 7.2 | Redemption by the Managing Owner | A-47 | ||
SECTION 7.3 | Redemption Fee | A-47 | ||
SECTION 7.4 | Exchange of Units | A-47 | ||
ARTICLE VIII THE LIMITED OWNERS | A-47 | |||
SECTION 8.1 | No Management or Control; Limited Liability | A-47 | ||
SECTION 8.2 | Rights and Duties | A-48 | ||
SECTION 8.3 | Limitation on Liability | A-49 | ||
ARTICLE IX BOOKS OF ACCOUNT AND REPORTS | A-49 | |||
SECTION 9.1 | Books of Account | A-49 | ||
SECTION 9.2 | Annual Reports and Monthly Statements | A-49 | ||
SECTION 9.3 | Tax Information | A-50 | ||
SECTION 9.4 | Calculation of Net Asset Value of a Series | A-50 | ||
SECTION 9.5 | Other Reports | A-50 | ||
SECTION 9.6 | Maintenance of Records | A-50 | ||
SECTION 9.7 | Certificate of Trust | A-50 | ||
SECTION 9.8 | Registration of Units | A-51 | ||
ARTICLE X FISCAL YEAR | A-51 | |||
SECTION 10.1 | Fiscal Year | A-51 | ||
ARTICLE XI AMENDMENT OF TRUST AGREEMENT; MEETINGS | A-51 | |||
SECTION 11.1 | Amendments to the Trust Agreement | A-51 | ||
SECTION 11.2 | Meetings of the Trust | A-52 | ||
SECTION 11.3 | Action Without a Meeting | A-52 | ||
ARTICLE XII TERM | A-53 | |||
SECTION 12.1 | Term | A-53 | ||
ARTICLE XIII TERMINATION | A-53 | |||
SECTION 13.1 | Events Requiring Dissolution of the Trust or any Series | A-53 | ||
SECTION 13.2 | Distributions on Dissolution | A-54 | ||
SECTION 13.3 | Termination; Certificate of Cancellation | A-55 | ||
ARTICLE XIV POWER OF ATTORNEY | A-55 | |||
SECTION 14.1 | Power of Attorney Executed Concurrently | A-55 | ||
SECTION 14.2 | Effect of Power of Attorney | A-55 | ||
SECTION 14.3 | Limitation on Power of Attorney | A-56 | ||
ii
Table of Contents
| Page | ||||
ARTICLE XV MISCELLANEOUS | A-56 | |||
SECTION 15.1 | Governing Law | A-56 | ||
SECTION 15.2 | Provisions In Conflict With Law or Regulations | A-56 | ||
SECTION 15.3 | Construction | A-57 | ||
SECTION 15.4 | Notices | A-57 | ||
SECTION 15.5 | Counterparts | A-57 | ||
SECTION 15.6 | Binding Nature of Trust Agreement | A-57 | ||
SECTION 15.7 | No Legal Title to Trust Estate | A-57 | ||
SECTION 15.8 | Creditors | A-57 | ||
SECTION 15.9 | Integration | A-57 | ||
EXHIBIT A-1 – | CERTIFICATE OF TRUST OF THE FRONTIER FUND | A-59 | ||
UNDER SEPARATE COVER: | ||||
EXHIBIT B – | THE FRONTIER FUND SUBSCRIPTION AGREEMENTS FOR LIMITED UNITS OF BENEFICIAL INTERESTS | B-1 | ||
EXHIBIT C – | EXCHANGE REQUEST | C-1 | ||
EXHIBIT D – | THE FRONTIER FUND REQUEST FOR REDEMPTION | D-1 | ||
EXHIBIT E – | REQUEST FOR ADDITIONAL SUBSCRIPTION | E-1 | ||
EXHIBIT F – | APPLICATION FOR TRANSFER OF OWNERSHIP / RE-REGISTRATION FORM | F-1 | ||
PART II-INFORMATION NOT REQUIRED IN PROSPECTUS | II-1 | |||
iii
Table of Contents
THE FRONTIER FUND
AMENDED AND RESTATED
DECLARATION OF TRUST AND TRUST AGREEMENT
This amended and restated declaration of trust and trust agreement of The Frontier Fund (the “Trust Agreement”) is made and entered into as of the 8th day of August, 2003, by and among EQUINOX FUND MANAGEMENT, LLC, a Delaware limited liability company (the “Managing Owner”), Wilmington Trust Company, a Delaware company, as trustee (the “Trustee”), and the UNITHOLDERS from time to time hereunder.
WHEREAS, the parties hereto desire to provide for the governance of the Trust and to set forth in detail their respective rights and duties relating to the Trust.
NOW, THEREFORE, in consideration of the mutual promises and agreements herein contained, the receipt and sufficiency of which are hereby acknowledged, the parties, intending to be legally bound, hereby agree as follows:
ARTICLE I
DEFINITIONS; THE TRUST
SECTION 1.1 Definitions. These definitions contain certain provisions required by the NASAA Guidelines and, except for minor exceptions, are included verbatim from such Guidelines, and, accordingly, may not, in all cases, be relevant. As used in this Trust Agreement, the following terms shall have the following meanings unless the context otherwise requires:
“Affiliate of the Managing Owner” means: (i) any officer, director, or partner of the Managing Owner, (ii) any corporation, partnership, trust or other entity controlling, controlled by or under common control with the Managing Owner or any Person described in (i) above, (iii) any officer, director, trustee, or general partner of any Person who is a member, other than as limited partner, with any Person described in (i) and (ii) above, in a relationship of joint venture, general partnership or similar form of unincorporated business association. For purposes of this definition the term “control” shall also mean the control or ownership of ten percent (10%) or more of the beneficial interest in the Person referred to.
“Benefit Plan Investors” means employee benefit plans subject to Part 4 of Subtitle B of Title I of ERISA or Section 4975 of the Code and any entity whose underlying assets include plan assets by reason of an ERISA Plan’s investment in such entity.
“Business Day” means a day other than Saturday, Sunday or other day when banks and/or securities exchanges in the City of New York or the City of Wilmington are authorized or obligated by law or executive order to close.
“Capital Contribution” means the amount contributed and agreed to be contributed to the Trust or any Series in the Trust by any subscriber or by the Managing Owner, as applicable, in accordance with Article III hereof.
“CE Act” means the Commodity Exchange Act, as amended.
“Certificate of Trust” means the Certificate of Trust of the Trust in the form attached hereto as Exhibit A-1, filed with the Secretary of State of the State of Delaware pursuant to Section 3810 of the Delaware Statutory Trust Act.
A-1
Table of Contents
“CFTC” means the Commodity Futures Trading Commission.
“Class” means any separate class within any Series of Units of the Trust as provided in Sections 3806(b)(1) of the Delaware Statutory Trust Act, the Units of which will have the rights, duties and privileges with respect to the Trust Estate of such Series as are set forth in this Trust Agreement, any document creating such Class or any Prospectus relating thereto.
“Code” means the Internal Revenue Code of 1986, as amended.
“Commodities” means positions in Commodity Contracts, forward contracts, foreign exchange positions and traded physical commodities, as well as cash commodities resulting from any of the foregoing positions.
“Commodity Broker” means any person who engages in the business of effecting transactions in Commodity Contracts for the account of others or for his or her own account.
“Commodity Contract” means any contract or option thereon providing for the delivery or receipt at a future date of a specified amount and grade of a traded physical commodity at a specified price and delivery point.
“Continuous Offering Period” means the period following the conclusion of the Initial Offering Period and ending on the date when the number of Units permitted to be sold pursuant to Section 3.2 are sold, but in no event later than December 31, 2053.
“Corporate Trust Office” means the principal office at which at any particular time the corporate trust business of the Trustee is administered, which office at the date hereof is located at 1100 N. Market Street, Rodney Square North, Wilmington, Delaware 19890-0001.
“Delaware Statutory Trust Act” means Chapter 38 of Title 12 of the Delaware Code, 12 Del.C. §3801 et seq., as the same may be amended from time to time.
“Disposition Gain” means, with respect to each Series, for each Fiscal Year, the Series’ aggregate recognized gain (including the portion thereof, if any, treated as ordinary income) resulting from each disposition of Series assets during such Fiscal Year with respect to which gain or loss is recognized for federal income tax purposes, including, without limitation, any gain or loss required to be recognized by the Series for federal income tax purposes pursuant to Section 988 or 1256 (or any successor provisions) of the Code.
“Disposition Loss” means, with respect to each Series, for each Fiscal Year, the Series’ aggregate recognized loss (including the portion thereof, if any, treated as ordinary loss) resulting from each disposition of Series assets during such Fiscal Year with respect to which gain or loss is recognized for federal income tax purposes, including, without limitation, any gain or loss required to be recognized by the Series for federal income tax purposes pursuant to Sections 988 or 1256 (or any successor provisions) of the Code.
“DOL” means the United States Department of Labor.
“ERISA” means the Employee Retirement Income Security Act of 1974, as amended.
“Fiscal Quarter” shall mean each period ending on the last day of each March, June, September and December of each Fiscal Year.
“Fiscal Year” shall have the meaning set forth in Article X hereof.
“Initial Offering Period” means the period with respect to the Graham Series, Winton Series and Currency Series and Class 1 and Class 2 of the Balanced Series terminating no later than October 31, 2004, the period with
A-2
Table of Contents
respect to the Campbell/Graham Series terminating no later than March 31, 2005, and the period with respect to the Long Only Commodity Series, the Long/Short Commodity Series and the Managed Futures Index Series and Class 1a and Class 2a of the Balanced Series terminating no later than February 28, 2006, in each case unless extended for up to an additional ninety (90) days at the sole discretion of the Managing Owner.
“Limited Owner” means any person or entity who becomes a holder of Limited Units (as defined in Article III) and who is listed as such on the books and records of the Trust, and may include the Managing Owner with respect to the Limited Units purchased by it.
“IRS” means the Internal Revenue Service.
“Losses” means, with respect to each Series, for each Fiscal Year, losses of the Series as determined for federal income tax purposes, and each item of income, gain, loss or deduction entering into the computation thereof, except that any gain or loss taken into account in determining the Disposition Gain or the Disposition Loss of the Series for such Fiscal Year shall not enter into such computations.
“Managing Owner” means Equinox Fund Management, LLC or any substitute therefor as provided herein.
“Margin Call” means a demand for additional funds after the initial good faith deposit required to maintain a customer’s account in compliance with the requirements of a particular commodity exchange or of a commodity broker.
“NASAA Guidelines” means the North American Securities Administrators Association, Inc. Guidelines for the Registration of Commodity Pool Programs as last amended and restated.
“Net Asset Value of a Series” means the total assets in the Trust Estate of a Series including, but not limited to, all cash and cash equivalents (valued at cost plus accrued interest and amortization of original issue discount) less total liabilities of the Series, each determined on the basis of generally accepted accounting principles in the United States, consistently applied under the accrual method of accounting (“GAAP”), including, but not limited to, the extent specifically set forth below:
(a) Net Asset Value of a Series shall include any unrealized profit or loss on open Commodities positions, and any other credit or debit accruing to the Series but unpaid or not received by the Series.
(b) All open commodity futures contracts and options traded on a United States exchange are calculated at their then current market value, which shall be based upon the settlement price for that particular commodity futures contract and option traded on the applicable United States exchange on the date with respect to which Net Asset Value of a Series is being determined; provided, that if a commodity futures contract or option traded on a United States exchange could not be liquidated on such day, due to the operation of daily limits or other rules of the exchange upon which that position is traded or otherwise, the settlement price on the first subsequent day on which the position could be liquidated shall be the basis for determining the market value of such position for such day. The current market value of all open commodity futures contracts and options traded on a non-United States exchange shall be based upon the liquidating value for that particular commodity futures contract and option traded on the applicable non-United States exchange on the date with respect to which Net Asset Value of a Series is being determined; provided, that if a commodity futures contract or option traded on a non- United States exchange could not be liquidated on such day, due to the operation of rules of the exchange upon which that position is traded or otherwise, the liquidating value on the first subsequent day on which the position could be liquidated shall be the basis for determining the market value of such position for such day. The current market value of all open forward contracts entered into by a Series shall be the mean between the last bid and last asked prices quoted by the bank or financial institution which is a party to the contract on the date with respect to which Net Asset Value of a Series is being determined; provided, that if such quotations are not available on such date, the mean between the last bid and asked prices on the first subsequent day on which such quotations are available shall be the basis for determining the market value of such forward
A-3
Table of Contents
contract for such day. The Managing Owner may in its discretion value any of the Trust Estate pursuant to such other principles as it may deem fair and equitable so long as such principles are consistent with normal industry standards.
(c) Interest earned on a Series commodity brokerage account shall be accrued at least daily.
(d) The amount of any distribution made pursuant to Article VI hereof shall be a liability of the Series from the day when the distribution is declared until it is paid.
“Net Asset Value of a Series per Unit” means the Net Asset Value of a Series divided by the number of Units of a Series outstanding on the date of calculation.
“Net Worth” means the excess of total assets over total liabilities as determined by generally accepted accounting principles. Net Worth shall be determined exclusive of home, home furnishings and automobiles.
“NFA” means the National Futures Association.
“Organization and Offering Expenses” shall have the meaning set forth in Section 4.7 of this Trust Agreement.
“Person” means any natural person, partnership, limited liability company, statutory trust, corporation, business trust, association, Benefit Plan Investor or other legal entity.
“Plan” means pension, profit-sharing, stock bonus, individual retirement accounts, Keogh plans, welfare benefit plans and other employee benefit plans, whether or not subject to ERISA or Section 4975 of the Code.
“Profits” means, with respect to each Series for each Fiscal Year, the income of the Series, as determined for Federal income tax purposes, with each item of income, gain, loss or deduction entering into the computation thereof, except that any gain or loss taken into account in determining the Disposition Gain or the Disposition Loss of the Series for such Fiscal Year shall not enter into such computations.
“Prospectus” means the final prospectus and disclosure document of the Trust and each Series thereof, constituting a part of each Registration Statement, as filed with the Securities and Exchange Commission and declared effective thereby, as the same may at any time and from time to time be amended or supplemented after the effective date(s) of the Registration Statement(s).
“Pyramiding” means the use of unrealized profits on existing Commodities positions to provide margins for additional Commodities positions of the same or a related commodity.
“Redemption Date” means the day of the week after the date the Managing Owner is in receipt of a redemption request for at least one (1) Business Day to be received by the Managing Owner no later than 4:00 PM New York City Time (“NYT”) in order for the redemption of Units held by the Unitholders may be redeemed in accordance with the provisions of Article VII hereof as of the next Business Day.
“Registration Statement” means a registration statement on Form S-1, as amended, filed with the Securities and Exchange Commission pursuant to which the Trust registered the Limited Units of a Series, as the same may at any time and from time to time be further amended or supplemented.
“Series” means a separate series of the Units in the Trust as provided in Sections 3806(b)(2) and 3804 of the Delaware Statutory Trust Act, the Units of which shall be beneficial interests in the Trust Estate separately identified with and belonging to such Series.
“Sponsor” means any person directly or indirectly instrumental in organizing the Trust or any person who will manage or participate in the management of the Trust, including the Managing Owner who pays any portion
A-4
Table of Contents
of the Organizational Expenses of the Trust and any other person who regularly performs or selects the persons who perform services for the Trust. Sponsor does not include wholly independent third parties such as attorneys, accountants, and underwriters whose only compensation is for professional services rendered in connection with the offering of the units. The term “Sponsor” shall be deemed to include its Affiliates.
“Subscription Agreement” means the agreement included as an exhibit to the Prospectus pursuant to which subscribers may subscribe for the purchase of the Limited Units.
“Trading Advisor” means initially AAA Capital Management, Inc., AIS Futures Management, LLC, Campbell & Company, Inc., Chesapeake Capital Corporation, Conquest Capital, LLC, Cornerstone Quantitative Investment Group, Inc., CTS Capital Management, LLC, C-View International Limited, Dekker Capital Management, LLC, Dighton Capital USA, Dunn Capital Management Inc., Forecast Trading Group, LLC, FX Concepts, Inc., GAIN Capital Asset Management LLC, Graham Capital Management L.P., Kottke Associates, LLC, Landmark Trading Company, Meyer Capital Management Inc., Mississippi River Investments, Inc., Phoenix Global Advisors, LLC, Red Oak Commodity Advisors, Inc., Strategic Ag Trading, Winton Capital Management Ltd. and any other entity or entities, acting in its capacity as a commodity trading advisor (i.e., any person who for any consideration engages in the business of advising others, either directly or indirectly, as to the value, purchase, or sale of Commodity Contracts or commodity options) to a Series, and any substitute(s) therefor as provided herein.
“Trust” means The Frontier Fund formed pursuant to this Trust Agreement.
“Trust Agreement” means this Amended and Restated Declaration of Trust and Trust Agreement as the same may at any time or from time to time be amended.
“Trustee” means Wilmington Trust Company or any substitute therefor as provided herein, acting not in its individual capacity but solely as trustee of the Trust.
“Trust Estate” means, with respect to a Series, any cash, commodity futures, forward and option contracts, all funds on deposit in the Series’ accounts, and any other property held by the Series, and all proceeds therefrom, including any rights of the Series pursuant to any Subscription Agreement and any other agreements to which the Trust or a Series thereof is a party.
“Unitholders” means the Managing Owner and all Limited Owners, as holders of Units of a Series, where no distinction is required by the context in which the term is used.
“Units” means the beneficial interest of each Unitholder in the profits, losses, distributions, capital and assets of a Series. The Managing Owner’s Capital Contributions shall be represented by “General” Units and a Limited Owner’s Capital Contributions shall be represented by “Limited” Units. Units need not be represented by certificates.
“Valuation Date” means the date as of which the Net Asset Value of a Series is determined.
“Valuation Period” means a regular period of time between Valuation Dates.
“Valuation Point” means the close of business on each day, or such other day as may be determined by the Managing Owner.
SECTION 1.2 Name.
(a) The name of the Trust is “The Frontier Fund” in which name the Trustee and the Managing Owner may engage in the business of the Trust, make and execute contracts and other instruments on behalf of the Trust and sue and be sued on behalf of the Trust.
A-5
Table of Contents
SECTION 1.3 Delaware Trustee; Business Offices.
(a) The sole trustee of the Trust is Wilmington Trust Company, which is located at the Corporate Trust Office or at such other address in the State of Delaware as the Trustee may designate in writing to the Unitholders. The Trustee shall receive service of process on the Trust in the State of Delaware at the foregoing address. In the event the Trustee resigns or is removed as the trustee, the Trustee of the Trust in the State of Delaware shall be the successor trustee.
(b) The principal office of the Trust, and such additional offices as the Managing Owner may establish, shall be located at such place or places inside or outside the State of Delaware as the Managing Owner may designate from time to time in writing to the Trustee and the Unitholders. Initially, the principal office of the Trust shall be at c/o Equinox Fund Management, LLC, 1660 Lincoln Street, Suite 100, Denver, Colorado 80264.
(c) Declaration of Trust. The Managing Owner, as grantor of the Trust, hereby contributes, and the Trustee hereby acknowledges that the Trust has received, the sum of $1,000 per Series in bank accounts in the name of each Series of the Trust controlled by the Managing Owner, and the Trustee hereby declares that it shall hold such sum in trust, upon and subject to the conditions set forth herein for the use and benefit of the Unitholders. It is the intention of the parties hereto that the Trust shall be a statutory trust under the Delaware Statutory Trust Act and that this Trust Agreement shall constitute the governing instrument of the Trust. It is not the intention of the parties hereto to create a general partnership, limited partnership, joint stock association, corporation, bailment or any form of legal relationship other than a Delaware statutory trust except to the extent that the Trust constitutes a partnership under the Code and applicable state and local tax laws. Nothing in this Trust Agreement shall be construed to make the Unitholders partners or members of a joint stock association except to the extent such Unitholders are deemed to be partners under the Code and applicable state and local tax laws. Notwithstanding the foregoing, it is the intention of the parties that the Trust be treated as a partnership under the Code and applicable state and local tax laws. In furtherance of the foregoing, the Trust shall not elect to be treated as an association taxable as a corporation for federal income tax purposes. Effective as of the date hereof, the Trustee and the Managing Owner shall have all of the rights, powers and duties set forth herein and in the Delaware Statutory Trust Act with respect to accomplishing the purposes of the Trust. The Trustee has filed the certificate of trust required by Section 3810 of the Delaware Statutory Trust Act in connection with the formation of the Trust under the Delaware Statutory Trust Act.
SECTION 1.4 Purposes and Powers. The purposes of the Trust and each Series shall be (a) to trade, buy, sell, spread or otherwise acquire, hold or dispose of commodity futures, forward and option contracts, including foreign futures, forward contracts and foreign exchange positions worldwide; (b) to enter into any lawful transaction and engage in any lawful activities in furtherance of or incidental to the foregoing purposes; and (c) as determined from time to time by the Managing Owner, to engage in any other lawful business or activity for which a statutory trust may be organized under the Delaware Statutory Trust Act. The Trust shall have all of the powers specified in Section 15.1 hereof, including, without limitation, all of the powers which may be exercised by a Managing Owner on behalf of the Trust under this Trust Agreement.
SECTION 1.5 Tax Treatment.
(a) The Tax Matters Partner (as defined in Section 6231 of the Code and any corresponding state and local tax law) of the Trust shall initially be the Managing Owner. The Tax Matters Partner, at the expense of the Trust, (i) shall prepare or cause to be prepared and filed the Trust’s tax returns as a partnership for federal, state and local tax purposes and (ii) shall be authorized to perform all duties imposed by Section 6221 et seq. of the Code, including, without limitation, (A) the power to conduct all audits and other administrative proceedings with respect to the tax items; (B) the power to extend the statute of limitations for all Unitholders with respect to the tax items; (C) the power to file a petition with an appropriate federal court for review of a final administrative adjustment of any tax items; and (D) the power to enter into a settlement with the IRS on behalf of, and binding upon, those Limited Owners having less than one percent (1%) interest in the Trust, unless a Limited Owner shall
A-6
Table of Contents
have notified the IRS and the Managing Owner that the Managing Owner shall not act on such Limited Owner’s behalf. The designation made by each Unitholder in this Section 1.5(a) is hereby approved by each Unitholder as an express condition to becoming a Unitholder. Each Unitholder agrees to take any further action as may be required by regulation or otherwise to effectuate such designation. Subject to Section 4.6, the Trust shall indemnify, to the full extent permitted by law, the Managing Owner from and against any damages or losses (including attorneys’ fees) arising out of or incurred in connection with any action taken or omitted to be taken by it in carrying out its responsibilities as Tax Matters Partner, provided such action taken or omitted to be taken does not constitute fraud, negligence or misconduct.
(b) Each Unitholder shall furnish the Managing Owner and the Trustee with information necessary to enable the Managing Owner to comply with United States federal income tax information reporting requirements in respect of such Unitholder’s Units.
SECTION 1.6 General Liability of the Managing Owner.
(a) Subject to the restrictions set forth in Section 4.6 hereof, the Managing Owner shall be liable for the acts, omissions, obligations and expenses of each Series of the Trust, to the extent not paid out of the assets of the Series, to the same extent the Managing Owner would be so liable if each Series were a partnership under the Delaware Revised Uniform Limited Partnership Act and the Managing Owner were a general partner of such partnership. The foregoing provision shall not, however, limit the ability of the Managing Owner to limit its liability by contract. The obligations of the Managing Owner under this Section 1.6 shall be evidenced by its ownership of the General Units which, solely for purposes of the Delaware Statutory Trust Act, will be deemed to be a separate Class of Units in each Series. Without limiting or affecting the liability of the Managing Owner as set forth in this Section 1.6, notwithstanding anything in this Trust Agreement to the contrary, Persons having any claim against the Trust by reason of the transactions contemplated by this Trust Agreement and any other agreement, instrument, obligation or other undertaking to which the Trust is a party, shall look only to the Trust Estate in accordance with Section 3.7 hereof for payment or satisfaction thereof.
(b) Subject to Sections 8.1 and 8.3 hereof, no Unitholder, other than the Managing Owner, to the extent set forth above, shall have any personal liability for any liability or obligation of the Trust or any Series thereof.
SECTION 1.7 Legal Title. Legal title to all the Trust Estate shall be vested in the Trust as a separate legal entity; except where applicable law in any jurisdiction requires any part of the Trust Estate to be vested otherwise, the Managing Owner may cause legal title to the Trust Estate or any portion thereof to be held by or in the name of the Managing Owner or any other Person as nominee.
SECTION 1.8 Series Trust. The Units of the Trust shall be divided into Series as provided in Section 3806(b)(2) of the Delaware Statutory Trust Act. Accordingly, it is the intent of the parties hereto that Articles IV, V, VI, VII, VIII, IX, X and XIII of this Trust Agreement shall apply also with respect to each such Series as if each such Series were a separate statutory trust under the Delaware Statutory Trust Act, and each reference to the term Trust in such Articles shall be deemed to be a reference to each Series to the extent necessary to give effect to the foregoing intent. The use of the terms Trust or Series in this Trust Agreement shall in no event alter the intent of the parties hereto that the Trust receive the full benefit of the limitation on interseries liability as set forth in Section 3804 of the Delaware Statutory Trust Act.
ARTICLE II
THE TRUSTEE
SECTION 2.1 Term; Resignation.
(a) Wilmington Trust Company has been appointed and hereby agrees to continue to serve as the trustee of the Trust. The Trust shall have only one trustee unless otherwise determined by the Managing Owner. The Trustee shall serve until such time as the Managing Owner removes the Trustee or the Trustee resigns and a successor trustee is appointed by the Managing Owner in accordance with the terms of Section 2.5 hereof.
A-7
Table of Contents
(b) The Trustee may resign at any time upon the giving of at least sixty (60) days’ advance written notice to the Trust; provided, that such resignation shall not become effective unless and until a successor trustee shall have been appointed by the Managing Owner in accordance with Section 2.5 hereof. If the Managing Owner does not act within such sixty (60) day period, the Trustee may apply to the Court of Chancery of the State of Delaware for the appointment of a successor trustee.
SECTION 2.2 Powers. Except to the extent expressly set forth in Section 1.3 and this Article II, the duty and authority of the Trustee to manage the business and affairs of the Trust is hereby delegated to the Managing Owner, which duty and authority the Managing Owner may further delegate as provided herein, all pursuant to Section 3806(b)(7) of the Delaware Statutory Trust Act. The Trustee shall have only the rights, obligations and liabilities specifically provided for herein and in the Delaware Statutory Trust Act and shall have no implied rights, obligations and liabilities with respect to the business and affairs of the Trust. The Trustee shall have the power and authority to execute, deliver, acknowledge and file all necessary documents and to maintain all necessary records of the Trust as required by the Delaware Statutory Trust Act. The Trustee shall provide prompt notice to the Managing Owner of its performance of any of the foregoing. The Managing Owner shall reasonably keep the Trustee informed of any actions taken by the Managing Owner with respect to the Trust that affect the rights, obligations or liabilities of the Trustee hereunder or under the Delaware Statutory Trust Act. Notwithstanding anything set forth herein to the contrary, the Trustee shall have no power, duty or authority to execute in connection with the Trust any documents, reports or certificates required by the Sarbanes-Oxley Act of 2002.
SECTION 2.3 Compensation and Expenses of the Trustee. The Trustee shall be entitled to receive from the Managing Owner or an Affiliate of the Managing Owner (other than the Trust) reasonable compensation for its services hereunder as set forth in a separate fee agreement and shall be entitled to be reimbursed by the Managing Owner or an Affiliate of the Managing Owner for reasonable out-of-pocket expenses incurred by it in the performance of its duties hereunder, including without limitation, the reasonable compensation, out-of-pocket expenses and disbursements of counsel and such other agents as the Trustee may employ in connection with the exercise and performance of its rights and duties hereunder.
SECTION 2.4 Indemnification. The Managing Owner agrees, whether or not any of the transactions contemplated hereby shall be consummated, to assume liability for, and does hereby indemnify, protect, save and keep harmless the Trustee and its successors, assigns, legal representatives, officers, directors, agents and servants (the “Indemnified Parties”) from and against any and all liabilities, obligations, losses, damages, penalties, taxes (excluding any taxes payable by the Trustee on or measured by any compensation received by the Trustee for its services hereunder or any indemnity payments received by the Trustee pursuant to this Section 2.4), claims, actions, suits, costs, expenses or disbursements (including legal fees and expenses) of any kind and nature whatsoever (collectively, “Expenses”), which may be imposed on, incurred by or asserted against the Indemnified Parties in any way relating to or arising out of the formation, operation or termination of the Trust, the execution, delivery and performance of any other agreements to which the Trust is a party or the action or inaction of the Trustee hereunder or thereunder, except for Expenses resulting from the negligence or willful misconduct of the Indemnified Parties. The indemnities contained in this Section 2.4 shall survive the termination of this Trust Agreement or the removal or resignation of the Trustee. The Indemnified Parties shall not be entitled to indemnification from the Trust Estate.
SECTION 2.5 Successor Trustee. Upon the resignation or removal of the Trustee, the Managing Owner shall appoint a successor trustee by delivering a written instrument to the outgoing Trustee. Any successor trustee must satisfy the requirements of Section 3807 of the Delaware Statutory Trust Act. Any resignation or removal of the Trustee and appointment of a successor trustee shall not become effective until a written acceptance of appointment is delivered by the successor trustee to the outgoing Trustee and the Managing Owner and any fees and expenses due to the outgoing Trustee are paid. Following compliance with the preceding sentence, the successor trustee shall become fully vested with all of the rights, powers, duties and obligations of the outgoing Trustee under this Trust Agreement, with like effect as if originally named as Trustee, and the outgoing Trustee shall be discharged of its duties and obligations under this Trust Agreement.
A-8
Table of Contents
SECTION 2.6 Liability of Trustee. Except as otherwise provided in this Article II, in accepting the trust created hereby, Wilmington Trust Company acts solely as Trustee hereunder and not in its individual capacity, and all Persons having any claim against the Trustee by reason of the transactions contemplated by this Trust Agreement and any other agreement to which the Trust is a party shall look only to the Trust Estate in accordance with Section 3.7 hereof for payment or satisfaction thereof; provided, however, that in no event is the foregoing intended to affect or limit the liability of the Managing Owner as set forth in Section 1.6 hereof. The Trustee shall not be liable or accountable hereunder or under any other agreement to which the Trust is a party, except for its own negligence or willful misconduct. In particular, but not by way of limitation:
(a) The Trustee shall have no liability or responsibility for the validity or sufficiency of this Trust Agreement or for the form, character, genuineness, sufficiency, value or validity of the Trust Estate;
(b) The Trustee shall not be liable for any actions taken or omitted to be taken by it in accordance with the instructions of the Managing Owner;
(c) The Trustee shall not have any liability for the acts or omissions of the Managing Owner;
(d) The Trustee shall not be liable for its failure to supervise the performance of any obligations of the Managing Owner, any commodity broker, selling agent or any Trading Advisor(s);
(e) No provision of this Trust Agreement shall require the Trustee to expend or risk funds or otherwise incur any financial liability in the performance of any of its rights or powers hereunder if the Trustee shall have reasonable grounds for believing that repayment of such funds or adequate indemnity against such risk or liability is not reasonably assured or provided to it;
(f) Under no circumstances shall the Trustee be liable for indebtedness evidenced by or other obligations of the Trust arising under this Trust Agreement or any other agreements to which the Trust is a party;
(g) The Trustee shall be under no obligation to exercise any of the rights or powers vested in it by this Trust Agreement, or to institute, conduct or defend any litigation under this Trust Agreement or any other agreements to which the Trust is a party, at the request, order or direction of the Managing Owner or any Unitholders unless the Managing Owner or such Unitholders have offered to the Trustee security or indemnity satisfactory to it against the costs, expenses and liabilities that may be incurred by the Trustee (including, without limitation, the reasonable fees and expenses of its counsel) therein or thereby; and
(h) Notwithstanding anything contained herein to the contrary, the Trustee shall not be required to take any action in any jurisdiction other than in the State of Delaware if the taking of such action will (i) require the consent or approval or authorization or order of or the giving of notice to, or the registration with or taking of any action in respect of, any state or other governmental authority or agency of any jurisdiction other than the State of Delaware, (ii) result in any fee, tax or other governmental charge under the laws of any jurisdiction or any political subdivision thereof in existence as of the date hereof other than the State of Delaware becoming payable by the Trustee or (iii) subject the Trustee to personal jurisdiction, other than in the State of Delaware, for causes of action arising from personal acts unrelated to the consummation of the transactions by the Trustee, as the case may be, contemplated hereby.
SECTION 2.7 Reliance; Advice of Counsel.
(a) In the absence of bad faith, the Trustee may conclusively rely upon certificates or opinions furnished to the Trustee and conforming to the requirements of this Trust Agreement in determining the truth of the statements and the correctness of the opinions contained therein, and shall incur no liability to anyone in acting on any signature, instrument, notice, resolutions, request, consent, order, certificate, report, opinion, bond or other document or paper believed by it to be genuine and believed by it to be signed by the proper party or parties and need not investigate any fact or matter pertaining to or in any such document; provided, however, that the Trustee shall have examined any certificates or opinions so as to determine compliance of the same with the
A-9
Table of Contents
requirements of this Trust Agreement. The Trustee may accept a certified copy of a resolution of the board of directors or other governing body of any corporate party as conclusive evidence that such resolution has been duly adopted by such body and that the same is in full force and effect. As to any fact or matter the method of the determination of which is not specifically prescribed herein, the Trustee may for all purposes hereof rely on a certificate, signed by the president or any vice president or by the treasurer or other authorized officers of the relevant party, as to such fact or matter, and such certificate shall constitute full protection to the Trustee for any action taken or omitted to be taken by it in good faith in reliance thereon.
(b) In the exercise or administration of the Trust hereunder and in the performance of its duties and obligations under this Trust Agreement, the Trustee, at the expense of the Managing Owner or an Affiliate of the Managing Owner (other than the Trust) (i) may act directly or through its agents, attorneys, custodians or nominees pursuant to agreements entered into with any of them, and the Trustee shall not be liable for the conduct or misconduct of such agents, attorneys, custodians or nominees if such agents, attorneys, custodians or nominees shall have been selected by the Trustee with reasonable care and (ii) may consult with counsel, accountants and other skilled professionals to be selected with reasonable care by it. The Trustee shall not be liable for anything done, suffered or omitted in good faith by it in accordance with the opinion or advice of any such counsel, accountant or other such Persons.
ARTICLE III
UNITS; CAPITAL CONTRIBUTIONS
SECTION 3.1 General.
(a) The Managing Owner shall have the power and authority, without Limited Owner approval, to issue Units in one or more Series from time to time as it deems necessary or desirable. Each Series shall be separate from all other Series in respect of the assets and liabilities allocated to that Series and shall represent a separate investment portfolio of the Trust. The Managing Owner shall have exclusive power without the requirement of Limited Owner approval to establish and designate such separate and distinct Series, as set forth in Section 3.4, and to fix and determine the relative rights, duties and preferences as between the Units of the separate Series as to right of redemption, management fees, incentive fees, trading advisers, leverage, special and relative rights as to dividends and other distributions and on liquidation, conversion rights, and conditions under which the Series shall have separate voting rights or no voting rights.
(b) The Managing Owner may, without Limited Owner approval, divide Units of any Series into two or more Classes, Units of each such Class having such preferences and special or relative rights, duties and privileges (including, without limitation, management fees, incentive fees, interest income, trading strategies, leverage and exchange rights and selling commissions) as the Managing Owner may determine as provided in Section 3.5. The fact that a Series shall have been initially established and designated without any specific establishment or designation of Classes, shall not limit the authority of the Managing Owner to divide a Series and establish and designate separate Classes thereof.
(c) The Managing Owner may, without Limited Owner approval, divide Units of any Class into two or more Sub-Classes, Units of each such Sub-Class having such preferences and special or relative rights, duties and privileges (including, without limitation, management fees, incentive fees, interest income, trading strategies, leverage and exchange rights and selling commissions) as the Managing Owner may determine as provided in Section 3.5. The fact that a Class shall have been initially established and designated without any specific establishment or designation of Sub-Classes, shall not limit the authority of the Managing Owner to divide a Class and establish and designate separate Sub-Classes thereof.
(d) The number of Units authorized shall be unlimited, and the Units so authorized may be represented in part by fractional Units of up to five (5) decimal places. All Units will be held in book-entry form
A-10
Table of Contents
and will not be certificated. From time to time, the Managing Owner may divide or combine the Units of any Series, Class or Sub-Class into a greater or lesser number without thereby changing the proportionate beneficial interests in the Series, Class or Sub-Class. The Managing Owner may issue Units of any Series, Class or Sub-Class thereof for such consideration and on such terms as it may determine (or for no consideration if pursuant to an Unit dividend or split-up), all without action or approval of the Limited Owners. All Units when so issued on the terms determined by the Managing Owner shall be fully paid and non-assessable. The Managing Owner may classify or reclassify any unissued Units or any Units previously issued and reacquired of any Series, Class or Sub-Class thereof into one or more Series, Classes or Sub-Classes thereof that may be established and designated from time to time. The Managing Owner may hold as treasury Units, reissue for such consideration and on such terms as it may determine, or cancel, at its discretion from time to time, any Units of any Series, Class or Sub-Class thereof reacquired by the Trust. The Units of each Series shall initially be divided into two Classes: General Units and Limited Units. Furthermore, the Limited Units of each Class shall initially be divided into two Sub-Classes—the Class 1 and the Class 2 (as described in the Prospectus).
(e) By virtue of the initial contribution by the Managing Owner to each initial Series of the Trust as set forth in Section 1.3(c), the Managing Owner has become the holder of ten (10) General Units of each such Series. Upon the termination of the Initial Offering Period pursuant to Section 3.2, the Managing Owner shall receive, if the applicable conditions of Section 3.2 are met, additional General Units (or fractions thereof) in each Series in consideration for the required contributions made to the Trust as of such time by the Managing Owner pursuant to Section 3.3. During the Continuous Offering Period, if any, the Managing Owner shall receive, from time to time, additional General Units (or fractions thereof) in consideration for the required contributions made by the Managing Owner pursuant to Section 3.3 on any day during the Continuous Offering Period in an amount equal to such contributions divided by the Net Asset Value of a Series per Unit calculated as of the close of business on the Business Day on which such contributions were made.
(f) No certificates or other evidence of beneficial ownership of the Units will be issued.
(g) Every Unitholder, by virtue of having purchased or otherwise acquired a Unit, shall be deemed to have expressly consented and agreed to be bound by the terms of this Trust Agreement.
SECTION 3.2 Limited Units.
(a) Offer of Balanced Series Limited Units.
(i) Balanced Series Maximum Offering. During the Initial Offering Period and Continuous Offering Period, the Trust shall offer a maximum of 10,020,000 Balanced Series Limited Units.
(ii) Balanced Series Initial Offering Period. During the Initial Offering Period, the Trust shall offer pursuant to Securities and Exchange Commission Rule 415, at an offering price of $100 per Balanced Series Limited Unit, the maximum amount of Balanced Series Limited Units set forth in Section 3.2(a)(i). The offering shall be made pursuant to and on the terms and conditions set forth in the Prospectus. The Managing Owner shall make such arrangements for the sale of the Balanced Series Limited Units as it deems appropriate.
(iii) Balanced Series Subscription Minimum. The minimum amount of subscription proceeds which must be received by the Balanced Series is $20,000,000 (“Balanced Series Subscription Minimum”). In the event that the Balanced Series Subscription Minimum is achieved, the Managing Owner will admit all accepted subscribers pursuant to the Prospectus into the Trust as Balanced Series Limited Owners, by causing such Limited Owners to execute this Trust Agreement, pursuant to the Power of Attorney set forth in the Subscription Agreement, and by making an entry on the books and records of Balanced Series of the Trust reflecting that such subscribers have been admitted as Limited Owners of Balanced Series Limited Units, as soon as practicable after the termination of the Balanced Series Initial Offering Period. Such accepted subscribers will be deemed Balanced Series Limited Owners at such time as such admission is reflected on the books and records of Balanced Series of the Trust.
A-11
Table of Contents
(iv) Failure to Meet the Balanced Series Subscription Minimum. In the event that the Balanced Series Subscription Minimum is not achieved, all proceeds of the sale of Balanced Series Limited Units will be returned to the payors of such funds no later than ten (10) Business Days after the conclusion of the Initial Offering Period for the Balanced Series Limited Units (or as soon thereafter as practicable if payment cannot be made in such time period).
(v) Offer of Balanced Series Limited Units After Initial Offering Period. In the event that Balanced Series Subscription Minimum is achieved during the Initial Offering Period for the Balanced Series Limited Units, the Trust may continue to offer Balanced Series Limited Units and admit additional Balanced Series Limited Owners and/or accept additional contributions from existing Balanced Series Limited Owners pursuant to the Prospectus.
Each additional Capital Contribution to the Balanced Series during the Balanced Series Continuous Offering Period by an existing Balanced Series Limited Owner must be in a denomination which is an even multiple of $100; however, existing Balanced Series Limited Owners who are Plans (including IRAs), employees or family members of an employee of the Managing Owner or its Affiliates or charitable organizations shall not have any such minimum additional Capital Contribution. During the Balanced Series Continuous Offering Period, each newly admitted Balanced Series Limited Owner, and each existing Balanced Series Limited Owner that makes an additional Capital Contribution to Balanced Series, shall receive Balanced Series Limited Units in an amount equal to such Capital Contribution or additional Capital Contribution, as the case may be, divided by the Balanced Series Net Asset Value per Series per Unit calculated as of the Valuation Point immediately prior to the day on which such Capital Contribution will become effective.
A Subscriber (including existing Balanced Series Limited Owners contributing additional sums) whose subscription is received and accepted by the Managing Owner after the termination of the Initial Offering Period for Balanced Series Limited Units shall be admitted to the Trust and deemed a Balanced Series Limited Owner with respect to that subscription on the day which occurs at least two (2) Business Days after the Subscriber’s Subscription Agreement or Exchange Request is received by the Managing Owner on a timely basis by 4:00 PM NYT, counting the day of receipt by the Managing Owner as one Business Day. The Managing Owner, in its sole and absolute discretion, may change such notice requirement upon written notice to the Subscribers and the Limited Owners.
(vi) Subscription Agreement. Each Balanced Series Limited Owner who purchases any Balanced Series Limited Units offered pursuant to the Prospectus shall contribute to the capital of Balanced Series such amount as he shall state in the Subscription Agreement which he shall execute (as required therein), acknowledge and, together with the Power of Attorney set forth therein, deliver to the Managing Owner as a counterpart of this Trust Agreement. All subscription amounts shall be paid in such form as may be acceptable to the Managing Owner at the time of the execution and delivery of such Subscription Agreement by United States subscribers, and in accordance with local practice and procedure by non-United States subscribers. If the Managing Owner determines to accept subscription funds by check, such funds shall be subject to prompt collection. All subscriptions are subject to acceptance by the Managing Owner.
(vii) Escrow Agreement. All proceeds from the sale of Balanced Series Limited Units offered pursuant to the Prospectus shall be deposited in an interest bearing escrow account at U.S. Bank National Association, in Denver until the conclusion of the Initial Offering Period for the Balanced Series Limited Units. In the event that the Balanced Series Subscription Minimum is achieved during the Initial Offering for the Balanced Series Limited Units, all interest earned on the proceeds of subscriptions from accepted subscribers for Balanced Series Limited Units during its Initial Offering Period will be contributed to Balanced Series, for which the Balanced Series Limited Owners will receive additional Balanced Series Limited Units and allocations of income relating to such interest on a pro rata basis (taking into account time and amount of deposit).
(viii) Optional Purchase of Balanced Series Limited Units by Managing Owner and others. Subject to approval by the Managing Owner, any commodity broker, any Trading Advisor, any
A-12
Table of Contents
principals, stockholders, directors, officers, employees and Affiliates of the Managing Owner, any commodity broker, and any Trading Advisor, may purchase any number of Balanced Series Limited Units and will be treated as Balanced Series Limited Owners with respect to such Units. In addition to the General Units required to be purchased by the Managing Owner under Section 3.3, the Managing Owner also may purchase any number of Balanced Series Limited Units as it determines in its discretion.
(b) Offer of Graham Series Limited Units.
(i) Graham Series Maximum Offering. During the Initial Offering Period and Continuous Offering Period, the Trust shall offer a maximum of 1,100,000 Graham Series Limited Units.
(ii) Graham Series Initial Offering Period. During the Initial Offering Period, the Trust shall offer pursuant to Securities and Exchange Commission Rule 415, at an offering price of $100 per Graham Series Limited Unit, the maximum amount of Graham Series Limited Units set forth in Section 3.2(b)(i). The offering shall be made pursuant to and on the terms and conditions set forth in the Prospectus. The Managing Owner shall make such arrangements for the sale of the Graham Series Limited Units as it deems appropriate.
(iii) Graham Series Subscription Minimum. The minimum amount of subscription proceeds which must be received by the Graham Series is $5,000,000 (“Graham Series Subscription Minimum”). In the event that the Graham Series Subscription Minimum is achieved, the Managing Owner will admit all accepted subscribers pursuant to the Prospectus into the Trust as Graham Series Limited Owners, by causing such Limited Owners to execute this Trust Agreement, pursuant to the Power of Attorney set forth in the Subscription Agreement, and by making an entry on the books and records of Graham Series of the Trust reflecting that such subscribers have been admitted as Limited Owners of Graham Series Limited Units, as soon as practicable after the termination of the Graham Series Initial Offering Period. Such accepted subscribers will be deemed Graham Series Limited Owners at such time as such admission is reflected on the books and records of Graham Series of the Trust.
(iv) Failure to Meet the Graham Series Subscription Minimum. In the event that the Graham Series Subscription Minimum is not achieved, all proceeds of the sale of Graham Series Limited Units will be returned to the payors of such funds no later than ten (10) Business Days after the conclusion of the Initial Offering Period for the Graham Series Limited Units (or as soon thereafter as practicable if payment cannot be made in such time period).
(v) Offer of Graham Series Limited Units After Initial Offering Period. In the event that the Graham Series Subscription Minimum is achieved during the Initial Offering Period for the Graham Series Limited Units, the Trust may continue to offer Graham Series Limited Units and admit additional Graham Series Limited Owners and/or accept additional contributions from existing Graham Series Limited Owners pursuant to the Prospectus.
Each additional Capital Contribution to Graham Series during the Graham Series Continuous Offering Period by an existing Graham Series Limited Owner must be in a denomination which is an even multiple of $100; however, existing Graham Series Limited Owners who are Plans (including IRAs), employees or family members of an employee of the Managing Owner or its Affiliates or charitable organizations shall not have any such minimum additional Capital Contribution. During the Graham Series Continuous Offering Period, each newly admitted Graham Series Limited Owner, and each existing Graham Series Limited Owner that makes an additional Capital Contribution to Graham Series, shall receive Graham Series Limited Units in an amount equal to such Capital Contribution or additional Capital Contribution, as the case may be, divided by the Graham Series Net Asset Value per Series per Unit calculated as of the Valuation Point immediately prior to the day on which such Capital Contribution will become effective.
A Subscriber (including existing Graham Series Limited Owners contributing additional sums) whose subscription is received and accepted by the Managing Owner after the termination of the Initial Offering Period for Graham Series Limited Units shall be admitted to the Trust and deemed a Graham Series Limited Owner with respect to that subscription on the day which occurs at least two (2) Business
A-13
Table of Contents
Days after the Subscriber’s Subscription Agreement or Exchange Request is received by the Managing Owner on a timely basis by 4:00 PM NYT, counting the day of receipt by the Managing Owner as one Business Day. The Managing Owner, in its sole and absolute discretion, may change such notice requirement upon written notice to the Subscribers and the Limited Owners.
(vi) Subscription Agreement. Each Graham Series Limited Owner who purchases any Graham Series Limited Units offered pursuant to the Prospectus shall contribute to the capital of Graham Series such amount as he shall state in the Subscription Agreement which he shall execute (as required therein), acknowledge and, together with the Power of Attorney set forth therein, deliver to the Managing Owner as a counterpart of this Trust Agreement. All subscription amounts shall be paid in such form as may be acceptable to the Managing Owner at the time of the execution and delivery of such Subscription Agreement by United States subscribers, and in accordance with local practice and procedure by non-United States subscribers. If the Managing Owner determines to accept subscription funds by check, such funds shall be subject to prompt collection. All subscriptions are subject to acceptance by the Managing Owner.
(vii) Escrow Agreement. All proceeds from the sale of Graham Series Limited Units offered pursuant to the Prospectus shall be deposited in an interest bearing escrow account at U.S. Bank National Association, in Denver until the conclusion of the Initial Offering Period for the Graham Series Limited Units. In the event that the Graham Series Subscription Minimum is achieved during the Initial Offering for the Graham Series Limited Units, all interest earned on the proceeds of subscriptions from accepted subscribers for Graham Series Limited Units during its Initial Offering Period will be contributed to Graham Series, for which the Graham Series Limited Owners will receive additional Graham Series Limited Units and allocations of income relating to such interest on a pro rata basis (taking into account time and amount of deposit).
(viii) Optional Purchase of Graham Series Limited Units by Managing Owner and others. Subject to approval by the Managing Owner, any commodity broker, any Trading Advisor, any principals, stockholders, directors, officers, employees and Affiliates of the Managing Owner, any commodity broker, and any Trading Advisor, may purchase any number of Graham Series Limited Units and will be treated as Graham Series Limited Owners with respect to such Graham Series Limited Units. In addition to the General Units required to be purchased by the Managing Owner under Section 3.3, the Managing Owner also may purchase any number of Graham Series Limited Units as it determines in its discretion.
(c) Offer of Winton Series Limited Units.
(i) Winton Series Maximum Offering. During the Initial Offering Period and Continuous Offering Period, the Trust shall offer a maximum of 650,000 Winton Series Limited Units.
(ii) Winton Series Initial Offering Period. During the Initial Offering Period, the Trust shall offer pursuant to Securities and Exchange Commission Rule 415, at an offering price of $100 per Winton Series Limited Unit, the maximum amount of Winton Series Limited Units set forth in Section 3.2(c)(i). The offering shall be made pursuant to and on the terms and conditions set forth in the Prospectus. The Managing Owner shall make such arrangements for the sale of the Winton Series Limited Units as it deems appropriate.
(iii) Winton Series Subscription Minimum. There is no minimum amount of subscription proceeds which must be received by the Winton Series. In the event that the Balanced Series achieves the Balanced Series Subscription Minimum, the Managing Owner will admit all accepted subscribers pursuant to the Prospectus into the Trust as Winton Series Limited Owners, by causing such Limited Owners to execute this Trust Agreement, pursuant to the Power of Attorney set forth in the Subscription Agreement, and by making an entry on the books and records of Winton Series of the Trust reflecting that such subscribers have been admitted as Limited Owners of Winton Series Limited Units, as soon as practicable after the termination of the Winton Series Initial Offering Period. Such accepted subscribers will be deemed Winton Series Limited Owners at such time as such admission is reflected on the books and records of Winton Series of the Trust.
A-14
Table of Contents
(iv) Failure to Meet the Balanced Series Subscription Minimum. In the event that the Balanced Series Subscription Minimum is not achieved, all proceeds of the sale of Winton Series Limited Units will be returned to the payors of such funds no later than ten (10) Business Days after the conclusion of the Initial Offering Period for the Winton Series Limited Units (or as soon thereafter as practicable if payment cannot be made in such time period).
(v) Offer of Winton Series Limited Units After Initial Offering Period. In the event that Balanced Series Subscription Minimum is achieved during the Initial Offering Period for the Winton Series Units or the Balanced Series Subscription Minimum is achieved, the Trust may continue to offer Winton Series Limited Units and admit additional Winton Series Limited Owners and/or accept additional contributions from existing Winton Series Limited Owners pursuant to the Prospectus.
Each additional Capital Contribution to Winton Series during the Winton Series Continuous Offering Period by an existing Winton Series Limited Owner must be in a denomination which is an even multiple of $100; however, existing Winton Series Limited Owners who are Plans (including IRAs), employees or family members of an employee of the Managing Owner or its Affiliates or charitable organizations shall not have any such minimum additional Capital Contribution. During the Winton Series Continuous Offering Period, each newly admitted Winton Series Limited Owner, and each existing Winton Series Limited Owner that makes an additional Capital Contribution to Winton Series, shall receive Winton Series Limited Units in an amount equal to such Capital Contribution or additional Capital Contribution, as the case may be, divided by the Winton Series Net Asset Value per Series per Unit calculated as of the Valuation Point immediately prior to the day on which such Capital Contribution will become effective.
A Subscriber (including existing Winton Series Limited Owners contributing additional sums) whose subscription is received and accepted by the Managing Owner after the termination of the Initial Offering Period for Winton Series Limited Units shall be admitted to the Trust and deemed a Winton Series Limited Owner with respect to that subscription on the day which occurs at least two (2) Business Days after the Subscriber’s Subscription Agreement or Exchange Request is received by the Managing Owner on a timely basis by 4:00 PM NYT, counting the day of receipt by the Managing Owner as one Business Day. The Managing Owner, in its sole and absolute discretion, may change such notice requirement upon written notice to the Subscribers and the Limited Owners.
(vi) Subscription Agreement. Each Winton Series Limited Owner who purchases any Limited Units offered pursuant to the Prospectus shall contribute to the capital of Winton Series such amount as he shall state in the Subscription Agreement which he shall execute (as required therein), acknowledge and, together with the Power of Attorney set forth therein, deliver to the Managing Owner as a counterpart of this Trust Agreement. All subscription amounts shall be paid in such form as may be acceptable to the Managing Owner at the time of the execution and delivery of such Subscription Agreement by United States subscribers, and in accordance with local practice and procedure by non-United States subscribers. If the Managing Owner determines to accept subscription funds by check, such funds shall be subject to prompt collection. All subscriptions are subject to acceptance by the Managing Owner.
(vii) Escrow Agreement. All proceeds from the sale of Winton Series Limited Units offered pursuant to the Prospectus shall be deposited in an interest bearing escrow account at U.S. Bank National Association, in Denver until the conclusion of the Initial Offering Period for the Winton Series Limited Units. In the event that the Balanced Series is achieved during the Initial Offering for the Winton Series Limited Units, all interest earned on the proceeds of subscriptions from accepted subscribers for Winton Series Limited Units during its Initial Offering Period will be contributed to Winton Series, for which the Winton Series Limited Owners will receive additional Winton Series Limited Units and allocations of income relating to such interest on a pro rata basis (taking into account time and amount of deposit).
(viii) Optional Purchase of Winton Series Limited Units by Managing Owner and others. Subject to approval by the Managing Owner, any commodity broker, any Trading Advisor, any principals, stockholders, directors, officers, employees and Affiliates of the Managing Owner, any commodity broker, and any Trading Advisor, may purchase any number of Winton Series Limited Units and
A-15
Table of Contents
will be treated as Winton Series Limited Owners with respect to such Winton Series Limited Units. In addition to the General Units required to be purchased by the Managing Owner under Section 3.3, the Managing Owner also may purchase any number of Winton Series Limited Units as it determines in its discretion.
(d) Offer of Campbell/Graham Series Limited Units.
(i) Campbell/Graham Series Maximum Offering. During the Initial Offering Period and Continuous Offering Period, the Trust shall offer a maximum of 3,000,000 Campbell/Graham Series Limited Units.
(ii) Campbell/Graham Series Initial Offering Period. During the Initial Offering Period, the Trust shall offer pursuant to Securities and Exchange Commission Rule 415, at an offering price of $100 per Campbell/Graham Series Limited Unit, the maximum amount of Campbell/Graham Series Limited Units set forth in Section 3.2(d)(i). The offering shall be made pursuant to and on the terms and conditions set forth in the Prospectus. The Managing Owner shall make such arrangements for the sale of the Campbell/Graham Series Limited Units as it deems appropriate.
(iii) Campbell/Graham Series Subscription Minimum. The minimum amount of subscription proceeds which must be received by the Campbell/Graham Series is $1,000 (“Campbell/Graham Series Subscription Minimum”). In the event that the Campbell/Graham Series Subscription Minimum is achieved, the Managing Owner will admit all accepted subscribers pursuant to the Prospectus into the Trust as Campbell/Graham Series Limited Owners, by causing such Limited Owners to execute this Trust Agreement, pursuant to the Power of Attorney set forth in the Subscription Agreement, and by making an entry on the books and records of Campbell/Graham Series of the Trust reflecting that such subscribers have been admitted as Limited Owners of Campbell/Graham Series Limited Units, as soon as practicable after the termination of the Campbell/Graham Series Initial Offering Period. Such accepted subscribers will be deemed Campbell/Graham Series Limited Owners at such time as such admission is reflected on the books and records of Campbell/Graham Series of the Trust.
(iv) Failure to Meet the Campbell/Graham Series Subscription Minimum. In the event that the Campbell/Graham Series Subscription Minimum is not achieved, all proceeds of the sale of Campbell/Graham Series Limited Units will be returned to the payors of such funds no later than ten (10) Business Days after the conclusion of the Initial Offering Period for the Campbell/Graham Series Limited Units (or as soon thereafter as practicable if payment cannot be made in such time period).
(v) Offer of Campbell/Graham Series Limited Units After Initial Offering Period. In the event that the Campbell/Graham Series Subscription Minimum is achieved during the Initial Offering Period for the Campbell/Graham Series Limited Units, the Trust may continue to offer Campbell/Graham Series Limited Units and admit additional Campbell/Graham Series Limited Owners and/or accept additional contributions from existing Campbell/Graham Series Limited Owners pursuant to the Prospectus.
Each additional Capital Contribution to Campbell/Graham Series during the Campbell/Graham Series Continuous Offering Period by an existing Campbell/Graham Series Limited Owner must be in a denomination which is an even multiple of $100; however, existing Campbell/Graham Series Limited Owners who are Plans (including IRAs), employees or family members of an employee of the Managing Owner or its Affiliates or charitable organizations shall not have any such minimum additional Capital Contribution. During the Campbell/Graham Series Continuous Offering Period, each newly admitted Campbell/Graham Series Limited Owner, and each existing Campbell/Graham Series Limited Owner that makes an additional Capital Contribution to Campbell/Graham Series, shall receive Campbell/Graham Series Limited Units in an amount equal to such Capital Contribution or additional Capital Contribution, as the case may be, divided by the Campbell/Graham Series Net Asset Value per Series per Unit calculated as of the Valuation Point immediately prior to the day on which such Capital Contribution will become effective.
A-16
Table of Contents
A Subscriber (including existing Campbell/Graham Series Limited Owners contributing additional sums) whose subscription is received and accepted by the Managing Owner after the termination of the Initial Offering Period for Campbell/Graham Series Limited Units shall be admitted to the Trust and deemed a Campbell/Graham Series Limited Owner with respect to that subscription on the day which occurs at least two (2) Business Days after the Subscriber’s Subscription Agreement or Exchange Request is received by the Managing Owner on a timely basis by 4:00 PM NYT, counting the day of receipt by the Managing Owner as one Business Day. The Managing Owner, in its sole and absolute discretion, may change such notice requirement upon written notice to the Subscribers and the Limited Owners.
(vi) Subscription Agreement. Each Campbell/Graham Series Limited Owner who purchases any Campbell/Graham Series Limited Units offered pursuant to the Prospectus shall contribute to the capital of Campbell/Graham Series such amount as he shall state in the Subscription Agreement which he shall execute (as required therein), acknowledge and, together with the Power of Attorney set forth therein, deliver to the Managing Owner as a counterpart of this Trust Agreement. All subscription amounts shall be paid in such form as may be acceptable to the Managing Owner at the time of the execution and delivery of such Subscription Agreement by United States subscribers, and in accordance with local practice and procedure by non-United States subscribers. If the Managing Owner determines to accept subscription funds by check, such funds shall be subject to prompt collection. All subscriptions are subject to acceptance by the Managing Owner.
(vii) Escrow Agreement. All proceeds from the sale of Campbell/Graham Series Limited Units offered pursuant to the Prospectus shall be deposited in an interest bearing escrow account at U.S. Bank National Association, in Denver until the conclusion of the Initial Offering Period for the Campbell/Graham Series Limited Units. In the event that the Campbell/Graham Series Subscription Minimum is achieved during the Initial Offering for the Campbell/Graham Series Limited Units, all interest earned on the proceeds of subscriptions from accepted subscribers for Campbell/Graham Series Limited Units during its Initial Offering Period will be contributed to Campbell/Graham Series, for which the Campbell/Graham Series Limited Owners will receive additional Campbell/Graham Series Limited Units and allocations of income relating to such interest on a pro rata basis (taking into account time and amount of deposit).
(viii) Optional Purchase of Campbell/Graham Series Limited Units by Managing Owner and others. Subject to approval by the Managing Owner, any commodity broker, any Trading Advisor, any principals, stockholders, directors, officers, employees and Affiliates of the Managing Owner, any commodity broker, and any Trading Advisor, may purchase any number of Campbell/Graham Series Limited Units and will be treated as Campbell/Graham Series Limited Owners with respect to such Campbell/Graham Series Limited Units. In addition to the General Units required to be purchased by the Managing Owner under Section 3.3, the Managing Owner also may purchase any number of Campbell/Graham Series Limited Units as it determines in its discretion.
(e) Offer of Currency Series Limited Units.
(i) Currency Series Maximum Offering. During the Initial Offering Period and Continuous Offering Period, the Trust shall offer a maximum of 230,000 Currency Series Limited Units.
(ii) Currency Series Initial Offering Period. During the Initial Offering Period, the Trust shall offer pursuant to Securities and Exchange Commission Rule 415, at an offering price of $100 per Currency Series Limited Unit, the maximum amount of Currency Series Limited Units set forth in Section 3.2(e)(i). The offering shall be made pursuant to and on the terms and conditions set forth in the Prospectus. The Managing Owner shall make such arrangements for the sale of the Currency Series Limited Units as it deems appropriate.
(iii) Currency Series Subscription Minimum. There is no minimum amount of subscription proceeds which must be received by the Currency Series. In the event that the Balanced Series reaches the Balanced Series Subscription Minimum, the Managing Owner will admit all accepted subscribers pursuant to the Prospectus into the Trust as Currency Series Limited Owners, by causing such Limited Owners to
A-17
Table of Contents
execute this Trust Agreement, pursuant to the Power of Attorney set forth in the Subscription Agreement, and by making an entry on the books and records of Currency Series of the Trust reflecting that such subscribers have been admitted as Limited Owners of Currency Series Limited Units, as soon as practicable after the termination of the Currency Series Initial Offering Period. Such accepted subscribers will be deemed Currency Series Limited Owners at such time as such admission is reflected on the books and records of Currency Series of the Trust.
(iv) Failure to Meet the Balanced Series Subscription Minimum. In the event that the Balanced Series Subscription Minimum is not achieved, all proceeds of the sale of Currency Series Limited Units will be returned to the payors of such funds no later than ten (10) Business Days after the conclusion of the Initial Offering Period for the Currency Series Limited Units (or as soon thereafter as practicable if payment cannot be made in such time period).
(v) Offer of Currency Series Limited Units After Initial Offering Period. In the event that the Balanced Series reaches its subscription minimum, the Trust may continue to offer Currency Series Limited Units and admit additional Currency Series Limited Owners and/or accept additional contributions from existing Currency Series Limited Owners pursuant to the Prospectus.
Each additional Capital Contribution to Currency Series during the Currency Series Continuous Offering Period by an existing Currency Series Limited Owner must be in a denomination which is an even multiple of $100; however, existing Currency Series Limited Owners who are Plans (including IRAs), employees or family members of an employee of the Managing Owner or its Affiliates or charitable organizations shall not have any such minimum additional Capital Contribution. During the Currency Series Continuous Offering Period, each newly admitted Currency Series Limited Owner, and each existing Currency Series Limited Owner that makes an additional Capital Contribution to Currency Series, shall receive Currency Series Limited Units in an amount equal to such Capital Contribution or additional Capital Contribution, as the case may be, divided by the Currency Series Net Asset Value per Series per Unit calculated as of the Valuation Point immediately prior to the day on which such Capital Contribution will become effective.
A Subscriber (including existing Currency Series Limited Owners contributing additional sums) whose subscription is received and accepted by the Managing Owner after the termination of the Initial Offering Period for Currency Series Limited Units shall be admitted to the Trust and deemed a Currency Series Limited Owner with respect to that subscription on the day which occurs at least two (2) Business Days after the Subscriber’s Subscription Agreement or Exchange Request is received by the Managing Owner on a timely basis by 4:00 PM NYT, counting the day of receipt by the Managing Owner as one Business Day. The Managing Owner, in its sole and absolute discretion, may change such notice requirement upon written notice to the Subscribers and the Limited Owners.
(vi) Subscription Agreement. Each Currency Series Limited Owner who purchases any Currency Series Limited Units offered pursuant to the Prospectus shall contribute to the capital of Currency Series such amount as he shall state in the Subscription Agreement which he shall execute (as required therein), acknowledge and, together with the Power of Attorney set forth therein, deliver to the Managing Owner as a counterpart of this Trust Agreement. All subscription amounts shall be paid in such form as may be acceptable to the Managing Owner at the time of the execution and delivery of such Subscription Agreement by United States subscribers, and in accordance with local practice and procedure by non-United States subscribers. If the Managing Owner determines to accept subscription funds by check, such funds shall be subject to prompt collection. All subscriptions are subject to acceptance by the Managing Owner.
(vii) Escrow Agreement. All proceeds from the sale of Currency Series Limited Units offered pursuant to the Prospectus shall be deposited in an interest bearing escrow account at U.S. Bank National Association, in Denver until the conclusion of the Initial Offering Period for the Currency Series Limited Units. In the event that the Balanced Series Subscription Minimum is achieved during the Initial Offering for the Currency Series Limited Units, all interest earned on the proceeds of subscriptions from accepted subscribers for Currency Series Limited Units during its Initial Offering Period will be contributed to
A-18
Table of Contents
Currency Series, for which the Currency Series Limited Owners will receive additional Currency Series Limited Units and allocations of income relating to such interest on a pro rata basis (taking into account time and amount of deposit).
(viii) Optional Purchase of Currency Series Limited Units by Managing Owner and others. Subject to approval by the Managing Owner, any commodity broker, any Trading Advisor, any principals, stockholders, directors, officers, employees and Affiliates of the Managing Owner, any commodity broker, and any Trading Advisor, may purchase any number of Currency Series Limited Units and will be treated as Currency Series Limited Owners with respect to such Units. In addition to the General Units required to be purchased by the Managing Owner under Section 3.3, the Managing Owner also may purchase any number of Currency Series Limited Units as it determines in its discretion.
(f) Offer of Dunn Series Limited Units.
(i) Dunn Series Maximum Offering. During the Initial Offering Period and Continuous Offering Period, the Trust shall offer a maximum of 230,000 Dunn Series Limited Units.
(ii) Dunn Series Initial Offering Period. During the Initial Offering Period, the Trust shall offer pursuant to Securities and Exchange Commission Rule 415, at an offering price of $100 per Dunn Series Limited Unit, the maximum amount of Dunn Series Limited Units set forth in Section 3.2(f)(i). The offering shall be made pursuant to and on the terms and conditions set forth in the Prospectus. The Managing Owner shall make such arrangements for the sale of the Dunn Series Limited Units as it deems appropriate.
(iii) Dunn Series Subscription Minimum. There is no minimum amount of subscription proceeds which must be received by the Dunn Series. In the event that the Balanced Series reaches the Balanced Series Subscription Minimum, the Managing Owner will admit all accepted subscribers pursuant to the Prospectus into the Trust as Dunn Series Limited Owners, by causing such Limited Owners to execute this Trust Agreement, pursuant to the Power of Attorney set forth in the Subscription Agreement, and by making an entry on the books and records of Dunn Series of the Trust reflecting that such subscribers have been admitted as Limited Owners of Dunn Series Limited Units, as soon as practicable after the termination of the Dunn Series Initial Offering Period. Such accepted subscribers will be deemed Dunn Series Limited Owners at such time as such admission is reflected on the books and records of Winton Series of the Trust.
(iv) Failure to Meet the Balanced Series Subscription Minimum. In the event that the Balanced Series Subscription Minimum is not achieved, all proceeds of the sale of Dunn Series Limited Units will be returned to the payors of such funds no later than ten (10) Business Days after the conclusion of the Initial Offering Period for the Dunn Series Limited Units (or as soon thereafter as practicable if payment cannot be made in such time period).
(v) Offer of Dunn Series Limited Units After Initial Offering Period. In the event that the Balanced Series Subscription Minimum is achieved during the Initial Offering Period for the Dunn Series Limited Units, the Trust may continue to offer Dunn Series Limited Units and admit additional Dunn Series Limited Owners and/or accept additional contributions from existing Dunn Series Limited Owners pursuant to the Prospectus.
Each additional Capital Contribution to Dunn Series during the Dunn Series Continuous Offering Period by an existing Dunn Series Limited Owner must be in a denomination which is an even multiple of $100; however, existing Dunn Series Limited Owners who are Plans (including IRAs), employees or family members of an employee of the Managing Owner or its Affiliates or charitable organizations shall not have any such minimum additional Capital Contribution. During the Dunn Series Continuous Offering Period, each newly admitted Dunn Series Limited Owner, and each existing Dunn Series Limited Owner that makes an additional Capital Contribution to Dunn Series, shall receive Dunn Series Limited Units in an amount equal to such Capital Contribution or additional Capital Contribution, as the case may be, divided by the Dunn Series Net Asset Value per Series per Unit calculated as of the Valuation Point immediately prior to the day on which such Capital Contribution will become effective.
A-19
Table of Contents
A Subscriber (including existing Dunn Series Limited Owners contributing additional sums) whose subscription is received and accepted by the Managing Owner after the termination of the Initial Offering Period for Dunn Series Limited Units shall be admitted to the Trust and deemed a Dunn Series Limited Owner with respect to that subscription on the day which occurs at least two (2) Business Days after the Subscriber’s Subscription Agreement or Exchange Request is received by the Managing Owner on a timely basis by 4:00 PM NYT, counting the day of receipt by the Managing Owner as one Business Day. The Managing Owner, in its sole and absolute discretion, may change such notice requirement upon written notice to the Subscribers and the Limited Owners.
(vi) Subscription Agreement. Each Dunn Series Limited Owner who purchases any Dunn Series Limited Units offered pursuant to the Prospectus shall contribute to the capital of Dunn Series such amount as he shall state in the Subscription Agreement which he shall execute (as required therein), acknowledge and, together with the Power of Attorney set forth therein, deliver to the Managing Owner as a counterpart of this Trust Agreement. All subscription amounts shall be paid in such form as may be acceptable to the Managing Owner at the time of the execution and delivery of such Subscription Agreement by United States subscribers, and in accordance with local practice and procedure by non-United States subscribers. If the Managing Owner determines to accept subscription funds by check, such funds shall be subject to prompt collection. All subscriptions are subject to acceptance by the Managing Owner.
(vii) Escrow Agreement. All proceeds from the sale of Dunn Series Limited Units offered pursuant to the Prospectus shall be deposited in an interest bearing escrow account at U.S. Bank National Association, in Denver until the conclusion of the Initial Offering Period for the Dunn Series Limited Units. In the event that the Balanced Series Subscription Minimum is achieved during the Initial Offering for the Dunn Series Limited Units, all interest earned on the proceeds of subscriptions from accepted subscribers for Dunn Series Limited Units during its Initial Offering Period will be contributed to Dunn Series, for which the Dunn Series Limited Owners will receive additional Dunn Series Limited Units and allocations of income relating to such interest on a pro rata basis (taking into account time and amount of deposit).
(viii) Optional Purchase of Dunn Series Limited Units by Managing Owner and others. Subject to approval by the Managing Owner, any commodity broker, any Trading Advisor, any principals, stockholders, directors, officers, employees and Affiliates of the Managing Owner, any commodity broker, and any Trading Advisor, may purchase any number of Dunn Series Limited Units and will be treated as Dunn Series Limited Owners with respect to such Units. In addition to the General Units required to be purchased by the Managing Owner under Section 3.3, the Managing Owner also may purchase any number of Dunn Series Limited Units as it determines in its discretion.
(g) Offer of Long Only Commodity Series Limited Units.
(i) Long Only Commodity Series Maximum Offering. During the Initial Offering Period and Continuous Offering Period, the Trust shall offer a maximum of 350,000 Long Only Commodity Series Limited Units.
(ii) Long Only Commodity Series Initial Offering Period. During the Initial Offering Period, the Trust shall offer pursuant to Securities and Exchange Commission Rule 415, at an offering price of $100 per Long Only Commodity Series Limited Unit, the maximum amount of Long Only Commodity Series Limited Units set forth in Section 3.2(g)(i). The offering shall be made pursuant to and on the terms and conditions set forth in the Prospectus. The Managing Owner shall make such arrangements for the sale of the Long Only Commodity Series Limited Units as it deems appropriate.
(iii) Long Only Commodity Series Subscription Minimum. The minimum amount of subscription proceeds which must be received by the Long Only Commodity Series is $5,000,000 (“Long Only Commodity Series Subscription Minimum”). In the event that the Long Only Commodity Series Subscription Minimum is achieved, the Managing Owner will admit all accepted subscribers pursuant to the Prospectus into the Trust as Long Only Commodity Series Limited Owners, by causing such Limited Owners to execute this Trust Agreement, pursuant to the Power of Attorney set forth in the Subscription
A-20
Table of Contents
Agreement, and by making an entry on the books and records of Long Only Commodity Series of the Trust reflecting that such subscribers have been admitted as Limited Owners of Long Only Commodity Series Limited Units, as soon as practicable after the termination of the Long Only Commodity Series Initial Offering Period. Such accepted subscribers will be deemed Long Only Commodity Series Limited Owners at such time as such admission is reflected on the books and records of Long Only Commodity Series of the Trust.
(iv) Failure to Meet the Long Only Commodity Series Subscription Minimum. In the event that the Long Only Commodity Series Subscription Minimum is not achieved, all proceeds of the sale of Long Only Commodity Series Limited Units will be returned to the payors of such funds no later than ten (10) Business Days after the conclusion of the Initial Offering Period for the Long Only Commodity Series Limited Units (or as soon thereafter as practicable if payment cannot be made in such time period).
(v) Offer of Long Only Commodity Series Limited Units After Initial Offering Period. In the event that the Long Only Commodity Series Subscription Minimum is achieved during the Initial Offering Period for the Long Only Commodity Series Limited Units, the Trust may continue to offer Long Only Commodity Series Limited Units and admit additional Long Only Commodity Series Limited Owners and/or accept additional contributions from existing Long Only Commodity Series Limited Owners pursuant to the Prospectus.
Each additional Capital Contribution to Long Only Commodity Series during the Long Only Commodity Series Continuous Offering Period by an existing Long Only Commodity Series Limited Owner must be in a denomination which is an even multiple of $100; however, existing Long Only Commodity Series Limited Owners who are Plans (including IRAs), employees or family members of an employee of the Managing Owner or its Affiliates or charitable organizations shall not have any such minimum additional Capital Contribution. During the Long Only Commodity Series Continuous Offering Period, each newly admitted Long Only Commodity Series Limited Owner, and each existing Long Only Commodity Series Limited Owner that makes an additional Capital Contribution to Long Only Commodity Series, shall receive Long Only Commodity Series Limited Units in an amount equal to such Capital Contribution or additional Capital Contribution, as the case may be, divided by the Long Only Commodity Series Net Asset Value per Series per Unit calculated as of the Valuation Point immediately prior to the day on which such Capital Contribution will become effective.
A Subscriber (including existing Long Only Commodity Series Limited Owners contributing additional sums) whose subscription is received and accepted by the Managing Owner after the termination of the Initial Offering Period for Long Only Commodity Series Limited Units shall be admitted to the Trust and deemed a Long Only Commodity Series Limited Owner with respect to that subscription on the day which occurs at least two (2) Business Days after the Subscriber’s Subscription Agreement or Exchange Request is received by the Managing Owner on a timely basis by 4:00 PM NYT, counting the day of receipt by the Managing Owner as one Business Day. The Managing Owner, in its sole and absolute discretion, may change such notice requirement upon written notice to the Subscribers and the Limited Owners.
(vi) Subscription Agreement. Each Long Only Commodity Series Limited Owner who purchases any Long Only Commodity Series Limited Units offered pursuant to the Prospectus shall contribute to the capital of Long Only Commodity Series such amount as he shall state in the Subscription Agreement which he shall execute (as required therein), acknowledge and, together with the Power of Attorney set forth therein, deliver to the Managing Owner as a counterpart of this Trust Agreement. All subscription amounts shall be paid in such form as may be acceptable to the Managing Owner at the time of the execution and delivery of such Subscription Agreement by United States subscribers, and in accordance with local practice and procedure by non-United States subscribers. If the Managing Owner determines to accept subscription funds by check, such funds shall be subject to prompt collection. All subscriptions are subject to acceptance by the Managing Owner.
(vii) Escrow Agreement. All proceeds from the sale of Long Only Commodity Series Limited Units offered pursuant to the Prospectus shall be deposited in an interest bearing escrow account at U.S. Bank National Association, in Denver until the conclusion of the Initial Offering Period for the Long Only
A-21
Table of Contents
Commodity Series Limited Units. In the event that the Long Only Commodity Series Subscription Minimum is achieved during the Initial Offering for the Long Only Commodity Series Limited Units, all interest earned on the proceeds of subscriptions from accepted subscribers for Long Only Commodity Series Limited Units during its Initial Offering Period will be contributed to Long Only Commodity Series, for which the Long Only Commodity Series Limited Owners will receive additional Long Only Commodity Series Limited Units and allocations of income relating to such interest on a pro rata basis (taking into account time and amount of deposit).
(viii) Optional Purchase of Long Only Commodity Series Limited Units by Managing Owner and others. Subject to approval by the Managing Owner, any commodity broker, any Trading Advisor, any principals, stockholders, directors, officers, employees and Affiliates of the Managing Owner, any commodity broker, and any Trading Advisor, may purchase any number of Long Only Commodity Series Limited Units and will be treated as Long Only Commodity Series Limited Owners with respect to such Long Only Commodity Series Limited Units. In addition to the General Units required to be purchased by the Managing Owner under Section 3.3, the Managing Owner also may purchase any number of Long Only Commodity Series Limited Units as it determines in its discretion.
(h) Offer of Long/Short Commodity Series Limited Units.
(i) Long/Short Commodity Series Maximum Offering. During the Initial Offering Period and Continuous Offering Period, the Trust shall offer a maximum of 1,450,000 Long/Short Commodity Series Limited Units.
(ii) Long/Short Commodity Series Initial Offering Period. During the Initial Offering Period, the Trust shall offer pursuant to Securities and Exchange Commission Rule 415, at an offering price of $100 per Long/Short Commodity Series Limited Unit, the maximum amount of Long/Short Commodity Series Limited Units set forth in Section 3.2(h)(i). The offering shall be made pursuant to and on the terms and conditions set forth in the Prospectus. The Managing Owner shall make such arrangements for the sale of the Long/Short Commodity Series Limited Units as it deems appropriate.
(iii) Long/Short Commodity Series Subscription Minimum. The minimum amount of subscription proceeds which must be received by the Long/Short Commodity Series is $1,000 (“Long/Short Commodity Series Subscription Minimum”). In the event that the Long/Short Commodity Series Subscription Minimum is achieved, the Managing Owner will admit all accepted subscribers pursuant to the Prospectus into the Trust as Long/Short Commodity Series Limited Owners, by causing such Limited Owners to execute this Trust Agreement, pursuant to the Power of Attorney set forth in the Subscription Agreement, and by making an entry on the books and records of Long/Short Commodity Series of the Trust reflecting that such subscribers have been admitted as Limited Owners of Long/Short Commodity Series Limited Units, as soon as practicable after the termination of the Long/Short Commodity Series Initial Offering Period. Such accepted subscribers will be deemed Long/Short Commodity Series Limited Owners at such time as such admission is reflected on the books and records of Long/Short Commodity Series of the Trust.
(iv) Failure to Meet the Long/Short Commodity Series Subscription Minimum. In the event that the Long/Short Commodity Series Subscription Minimum is not achieved, all proceeds of the sale of Long/Short Commodity Series Limited Units will be returned to the payors of such funds no later than ten (10) Business Days after the conclusion of the Initial Offering Period for the Long/Short Commodity Series Limited Units (or as soon thereafter as practicable if payment cannot be made in such time period).
(v) Offer of Long/Short Commodity Series Limited Units After Initial Offering Period. In the event that the Long/Short Commodity Series Subscription Minimum is achieved during the Initial Offering Period for the Long/Short Commodity Series Limited Units, the Trust may continue to offer Long/Short Commodity Series Limited Units and admit additional Long/Short Commodity Series Limited Owners and/or accept additional contributions from existing Long/Short Commodity Series Limited Owners pursuant to the Prospectus.
A-22
Table of Contents
Each additional Capital Contribution to Long/Short Commodity Series during the Long/Short Commodity Series Continuous Offering Period by an existing Long/Short Commodity Series Limited Owner must be in a denomination which is an even multiple of $100; however, existing Long/Short Commodity Series Limited Owners who are Plans (including IRAs), employees or family members of an employee of the Managing Owner or its Affiliates or charitable organizations shall not have any such minimum additional Capital Contribution. During the Long/Short Commodity Series Continuous Offering Period, each newly admitted Long/Short Commodity Series Limited Owner, and each existing Long/Short Commodity Series Limited Owner that makes an additional Capital Contribution to Long/Short Commodity Series, shall receive Long/Short Commodity Series Limited Units in an amount equal to such Capital Contribution or additional Capital Contribution, as the case may be, divided by the Long/Short Commodity Series Net Asset Value per Series per Unit calculated as of the Valuation Point immediately prior to the day on which such Capital Contribution will become effective.
A Subscriber (including existing Long/Short Commodity Series Limited Owners contributing additional sums) whose subscription is received and accepted by the Managing Owner after the termination of the Initial Offering Period for Long/Short Commodity Series Limited Units shall be admitted to the Trust and deemed a Long/Short Commodity Series Limited Owner with respect to that subscription on the day which occurs at least two (2) Business Days after the Subscriber’s Subscription Agreement or Exchange Request is received by the Managing Owner on a timely basis by 4:00 PM NYT, counting the day of receipt by the Managing Owner as one Business Day. The Managing Owner, in its sole and absolute discretion, may change such notice requirement upon written notice to the Subscribers and the Limited Owners.
(vi) Subscription Agreement. Each Long/Short Commodity Series Limited Owner who purchases any Long/Short Commodity Series Limited Units offered pursuant to the Prospectus shall contribute to the capital of Long/Short Commodity Series such amount as he shall state in the Subscription Agreement which he shall execute (as required therein), acknowledge and, together with the Power of Attorney set forth therein, deliver to the Managing Owner as a counterpart of this Trust Agreement. All subscription amounts shall be paid in such form as may be acceptable to the Managing Owner at the time of the execution and delivery of such Subscription Agreement by United States subscribers, and in accordance with local practice and procedure by non-United States subscribers. If the Managing Owner determines to accept subscription funds by check, such funds shall be subject to prompt collection. All subscriptions are subject to acceptance by the Managing Owner.
(vii) Escrow Agreement. All proceeds from the sale of Long/Short Commodity Series Limited Units offered pursuant to the Prospectus shall be deposited in an interest bearing escrow account at U.S. Bank National Association, in Denver until the conclusion of the Initial Offering Period for the Long/Short Commodity Series Limited Units. In the event that the Long/Short Commodity Series Subscription Minimum is achieved during the Initial Offering for the Long/Short Commodity Series Limited Units, all interest earned on the proceeds of subscriptions from accepted subscribers for Long/Short Commodity Series Limited Units during its Initial Offering Period will be contributed to Long/Short Commodity Series, for which the Long/Short Commodity Series Limited Owners will receive additional Long/Short Commodity Series Limited Units and allocations of income relating to such interest on a pro rata basis (taking into account time and amount of deposit).
(viii) Optional Purchase of Long/Short Commodity Series Limited Units by Managing Owner and others. Subject to approval by the Managing Owner, any commodity broker, any Trading Advisor, any principals, stockholders, directors, officers, employees and Affiliates of the Managing Owner, any commodity broker, and any Trading Advisor, may purchase any number of Long/Short Commodity Series Limited Units and will be treated as Long/Short Commodity Series Limited Owners with respect to such Long/Short Commodity Series Limited Units. In addition to the General Units required to be purchased by the Managing Owner under Section 3.3, the Managing Owner also may purchase any number of Long/Short Commodity Series Limited Units as it determines in its discretion.
A-23
Table of Contents
(i) Offer of Managed Futures Index Series Limited Units.
(i) Managed Futures Index Series Maximum Offering. During the Initial Offering Period and Continuous Offering Period, the Trust shall offer a maximum of 750,000 Managed Futures Index Series Limited Units.
(ii) Managed Futures Index Series Initial Offering Period. During the Initial Offering Period, the Trust shall offer pursuant to Securities and Exchange Commission Rule 415, at an offering price of $100 per Managed Futures Index Series Limited Unit, the maximum amount of Managed Futures Index Series Limited Units set forth in Section 3.2(i)(i). The offering shall be made pursuant to and on the terms and conditions set forth in the Prospectus. The Managing Owner shall make such arrangements for the sale of the Managed Futures Index Series Limited Units as it deems appropriate.
(iii) Managed Futures Index Series Subscription Minimum. The minimum amount of subscription proceeds which must be received by the Managed Futures Index Series is $1,000 (“Managed Futures Index Series Subscription Minimum”). In the event that the Managed Futures Index Series Subscription Minimum is achieved, the Managing Owner will admit all accepted subscribers pursuant to the Prospectus into the Trust as Managed Futures Index Series Limited Owners, by causing such Limited Owners to execute this Trust Agreement, pursuant to the Power of Attorney set forth in the Subscription Agreement, and by making an entry on the books and records of Managed Futures Index Series of the Trust reflecting that such subscribers have been admitted as Limited Owners of Managed Futures Index Series Limited Units, as soon as practicable after the termination of the Managed Futures Index Series Initial Offering Period. Such accepted subscribers will be deemed Managed Futures Index Series Limited Owners at such time as such admission is reflected on the books and records of Managed Futures Index Series of the Trust.
(iv) Failure to Meet the Managed Futures Index Series Subscription Minimum. In the event that the Managed Futures Index Series Subscription Minimum is not achieved, all proceeds of the sale of Managed Futures Index Series Limited Units will be returned to the payors of such funds no later than ten (10) Business Days after the conclusion of the Initial Offering Period for the Managed Futures Index Series Limited Units (or as soon thereafter as practicable if payment cannot be made in such time period).
(v) Offer of Managed Futures Index Series Limited Units After Initial Offering Period. In the event that the Managed Futures Index Series Subscription Minimum is achieved during the Initial Offering Period for the Managed Futures Index Series Limited Units, the Trust may continue to offer Managed Futures Index Series Limited Units and admit additional Managed Futures Index Series Limited Owners and/or accept additional contributions from existing Managed Futures Index Series Limited Owners pursuant to the Prospectus.
Each additional Capital Contribution to Managed Futures Index Series during the Managed Futures Index Series Continuous Offering Period by an existing Managed Futures Index Series Limited Owner must be in a denomination which is an even multiple of $100; however, existing Managed Futures Index Series Limited Owners who are Plans (including IRAs), employees or family members of an employee of the Managing Owner or its Affiliates or charitable organizations shall not have any such minimum additional Capital Contribution. During the Managed Futures Index Series Continuous Offering Period, each newly admitted Managed Futures Index Series Limited Owner, and each existing Managed Futures Index Series Limited Owner that makes an additional Capital Contribution to Managed Futures Index Series, shall receive Managed Futures Index Series Limited Units in an amount equal to such Capital Contribution or additional Capital Contribution, as the case may be, divided by the Managed Futures Index Series Net Asset Value per Series per Unit calculated as of the Valuation Point immediately prior to the day on which such Capital Contribution will become effective.
A Subscriber (including existing Managed Futures Index Series Limited Owners contributing additional sums) whose subscription is received and accepted by the Managing Owner after the termination of the Initial Offering Period for Managed Futures Index Series Limited Units shall be admitted to the Trust and deemed a Managed Futures Index Series Limited Owner with respect to that subscription on the day
A-24
Table of Contents
which occurs at least two (2) Business Days after the Subscriber’s Subscription Agreement or Exchange Request is received by the Managing Owner on a timely basis by 4:00 PM NYT, counting the day of receipt by the Managing Owner as one Business Day. The Managing Owner, in its sole and absolute discretion, may change such notice requirement upon written notice to the Subscribers and the Limited Owners.
(vi) Subscription Agreement. Each Managed Futures Index Series Limited Owner who purchases any Managed Futures Index Series Limited Units offered pursuant to the Prospectus shall contribute to the capital of Managed Futures Index Series such amount as he shall state in the Subscription Agreement which he shall execute (as required therein), acknowledge and, together with the Power of Attorney set forth therein, deliver to the Managing Owner as a counterpart of this Trust Agreement. All subscription amounts shall be paid in such form as may be acceptable to the Managing Owner at the time of the execution and delivery of such Subscription Agreement by United States subscribers, and in accordance with local practice and procedure by non-United States subscribers. If the Managing Owner determines to accept subscription funds by check, such funds shall be subject to prompt collection. All subscriptions are subject to acceptance by the Managing Owner.
(vii) Escrow Agreement. All proceeds from the sale of Managed Futures Index Series Limited Units offered pursuant to the Prospectus shall be deposited in an interest bearing escrow account at U.S. Bank National Association, in Denver until the conclusion of the Initial Offering Period for the Managed Futures Index Series Limited Units. In the event that the Managed Futures Index Series Subscription Minimum is achieved during the Initial Offering for the Managed Futures Index Series Limited Units, all interest earned on the proceeds of subscriptions from accepted subscribers for Managed Futures Index Series Limited Units during its Initial Offering Period will be contributed to Managed Futures Index Series, for which the Managed Futures Index Series Limited Owners will receive additional Managed Futures Index Series Limited Units and allocations of income relating to such interest on a pro rata basis (taking into account time and amount of deposit).
(viii) Optional Purchase of Managed Futures Index Series Limited Units by Managing Owner and others. Subject to approval by the Managing Owner, any commodity broker, any Trading Advisor, any principals, stockholders, directors, officers, employees and Affiliates of the Managing Owner, any commodity broker, and any Trading Advisor, may purchase any number of Managed Futures Index Series Limited Units and will be treated as Managed Futures Index Series Limited Owners with respect to such Managed Futures Index Series Limited Units. In addition to the General Units required to be purchased by the Managing Owner under Section 3.3, the Managing Owner also may purchase any number of Managed Futures Index Series Limited Units as it determines in its discretion.
(j) Termination of the Series. If the minimum number of Units in any Series being offered are not sold during the Initial Offering Period for such Series, then such Series shall be terminated.
SECTION 3.3 Managing Owner’s Required Contribution. The Managing Owner shall be required to contribute in cash to the Trust an amount, which, when added to the total aggregate contributions to all Series of the Trust by Unitholders in all Series, will be not less than one percent (1%) of such total contributions, and in no event shall such contribution be less than that required by the NASAA Guidelines. Such contribution shall be made by the Managing Owner before trading commences and shall be maintained throughout the existence of the Trust. The Managing Owner may, but is not obligated to, make additional Capital Contributions at any time during the Initial Offering Period or the Continuous Offering Period. The Managing Owner will receive General Units in each Series to which it allocates a portion of its capital contribution as provided in Section 3.1(d). The Managing Owner shall, with respect to any Limited Units owned by it, enjoy all of the rights and privileges and be subject to all of the obligations and duties of a Limited Owner, in addition to its rights and privileges as Managing Owner, except as otherwise provided herein. Notwithstanding anything to the contrary in this Trust Agreement, the interest of the Managing Owner (without regard to any Limited Units of the Managing Owner in any Series) in each material item of Series income, gain, loss and deduction shall be equal, in the aggregate, to at least one percent (1%) of each such item at all times during the term of this Trust Agreement.
A-25
Table of Contents
SECTION 3.4 Establishment of Series of Units.
(a) Without limiting the authority of the Managing Owner set forth in Section 3.4(b) to establish and designate any further Series, the Managing Owner hereby establishes and designates nine initial Series (with the relative rights and preferences described herein and in the Registration Statement), as follows:
Balanced Series—Multi-Manager Series
Graham Series—Graham Capital Management, L.P. Series
Winton Series—Winton Capital Management Limited Series
Campbell/Graham Series—Campbell & Company, Inc. and Graham Capital Management, L.P. Series
Currency Series—Multi-Manager Series
Dunn Series—Dunn Capital Management Inc. Series
Long Only Commodity Series—Multi-Index Series
Long/Short Commodity Series—Multi-Manager Series
Managed Futures Index Series—Conquest Capital, LLC
The provisions of this Article III shall be applicable to the above designated Series and any further Series that may from time to time be established and designated by the Managing Owner as provided in Section 3.4(b).
(b) The establishment and designation of any Series of Units other than those set forth above shall be effective upon the execution by the Managing Owner of an instrument setting forth such establishment and designation and the relative rights and preferences of such Series, or as otherwise provided in such instrument. At any time that there are no Units outstanding of any particular Series previously established and designated, the Managing Owner may by an instrument executed by it abolish that Series and the establishment and designation thereof. Each instrument referred to in this paragraph shall have the status of an amendment to this Trust Agreement.
SECTION 3.5 Establishment of Classes and Sub-Classes. The division of any Series into two or more Classes or two or more Sub-Classes and the establishment and designation of such Classes or Sub-Classes shall be effective upon the execution by the Managing Owner of an instrument setting forth such division, and the establishment, designation, and relative rights and preferences of such Classes or Sub-Classes, or as otherwise provided in such instrument. The relative rights and preferences of the Classes of any Series and the Sub-Classes of any Class may differ in such respects as the Managing Owner may determine to be appropriate, provided that such differences are set forth in the aforementioned instrument and that such differences do not alter the allocations described in Article VI. At any time that there are no Units outstanding of any particular Class or Sub-Class previously established and designated, the Managing Owner may by an instrument executed by it abolish that Class or Sub-Class and the establishment and designation thereof. Each instrument referred to in this paragraph shall have the status of an amendment to this Trust Agreement. Without limiting the authority of the Managing Owner set forth in this Section 3.5 to establish and designate any further Classes or Sub-Classes, the Managing Owner hereby establishes and designates the following Classes (with the relative rights and preferences described herein and in the Registration Statement), as follows:
Balanced Series—Class 1, Class 2, Class 1a and Class 2a
Graham Series—Class 1 and Class 2
Winton Series—Class 1 and Class 2
Campbell/Graham Series—Class 1 and Class 2
Currency Series—Class 1 and Class 2
Dunn Series—Class 1 and Class 2
Long Only Commodity Series—Class 1 and Class 2
Long/Short Commodity Series—Class 1 and Class 2
Managed Futures Index Series—Class 1 and Class 2
SECTION 3.6 Assets of Series. All consideration received by the Trust for the issue or sale of Units of a particular Series together with all of the Trust Estate in which such consideration is invested or reinvested, all income, earnings, profits, and proceeds thereof, including any proceeds derived from the sale, exchange or
A-26
Table of Contents
liquidation of such assets, and any funds or payments derived from any reinvestment of such proceeds in whatever form the same may be, shall irrevocably belong to that Series for all purposes, subject only to the rights of creditors of such Series and except as may otherwise be required by applicable tax laws, and shall be so recorded upon the books of account of the Trust. Separate and distinct records shall be maintained for each Series and the assets associated with a Series shall be held and accounted for separately from the other assets of the Trust, or any other Series. In the event that there is any Trust Estate, or any income, earnings, profits, and proceeds thereof, funds, or payments which are not readily identifiable as belonging to any particular Series, the Managing Owner shall allocate them among any one or more of the Series established and designated from time to time in such manner and on such basis as the Managing Owner, in its sole and absolute discretion, deems fair and equitable. Each such allocation by the Managing Owner shall be conclusive and binding upon all Unitholders for all purposes.
SECTION 3.7 Liabilities of Series.
(a) The Trust Estate belonging to each particular Series shall be charged with the liabilities of the Trust in respect of that Series and only that Series; and all expenses, costs, charges and reserves attributable to that Series, and any general liabilities, expenses, costs, charges or reserves of the Trust which are not readily identifiable as belonging to any particular Series, shall be allocated and charged by the Managing Owner to and among any one or more of the Series established and designated from time to time in such manner and on such basis as the Managing Owner in its sole and absolute discretion deems fair and equitable. Each allocation of liabilities, expenses, costs, charges and reserves by the Managing Owner shall be conclusive and binding upon all Unitholders for all purposes. The Managing Owner shall have full discretion, to the extent not inconsistent with applicable law, to determine which items shall be treated as income and which items as capital, and each such determination and allocation shall be conclusive and binding upon the Unitholders. Every written agreement, instrument or other undertaking made or issued by or on behalf of a particular Series shall include a recitation limiting the obligation or claim represented thereby to that Series and its assets.
(b) Without limitation of the foregoing provisions of this Section, but subject to the right of the Managing Owner in its discretion to allocate general liabilities, expenses, costs, charges or reserves as herein provided, the debts, liabilities, obligations and expenses incurred, contracted for or otherwise existing with respect to a particular Series shall be enforceable against the assets of such Series only and against the Managing Owner, and not against the assets (i) of the Trust generally or (ii) of any other Series, and, except as otherwise provided in this Trust Agreement, none of the debts, liabilities, obligations and expenses incurred, contracted for or otherwise existing with respect to the Trust generally or any other Series thereof shall be enforceable against the assets of such Series. Notice of this limitation on interseries liabilities shall be set forth in the Certificate of Trust of the Trust (whether originally or by amendment) as filed or to be filed in the Office of the Secretary of State of the State of Delaware pursuant to the Delaware Statutory Trust Act, and upon the giving of such notice in the Certificate of Trust, the statutory provisions of Section 3804 of the Delaware Statutory Trust Act relating to limitations on interseries liabilities (and the statutory effect under Section 3804 of setting forth such notice in the Certificate of Trust) shall become applicable to the Trust and each Series. Every Unit, note, bond, contract, instrument, certificate or other undertaking made or issued by or on behalf of a particular Series shall include a recitation limiting the obligation on Units represented thereby to the assets of that Series.
(c) (i) Except as set forth below, any debts, liabilities, obligations, indebtedness, expenses, interests and claims of any nature and all kinds and descriptions (collectively, “Claims and Interests”), if any, of the Managing Owner and the Trustee (the “Subordinated Claims”) incurred, contracted for or otherwise existing, arising from, related to or in connection with all Series, any combination of Series or one particular Series and their respective assets (the “Applicable Series”) and the assets of the Trust shall be expressly subordinate and junior in right of payment to any and all other Claims against the Trust and any Series thereof, and any of their respective assets, which may arise as a matter of law or pursuant to any contract, provided, however, that the Claims of each of the Managing Owner and the Trustee (if any) against the Applicable Series shall not be considered Subordinated Claims with respect to enforcement against and distribution and repayment from the assets of the Applicable Series and the Managing Owner and its assets; and provided further that the valid Claims
A-27
Table of Contents
of either the Managing Owner or the Trustee, if any, against the Applicable Series shall be pari passu and equal in right of repayment and distribution with all other valid Claims against the Applicable Series and (ii) the Managing Owner and the Trustee will not take, demand or receive from any Series or the Trust or any of their respective assets (other than the Applicable Series, the Applicable Series’ assets and the Managing Owner and its assets) any payment for the Subordinated Claims;
(ii) The Claims of each of the Managing Owner and the Trustee with respect to the Applicable Series shall only be asserted and enforceable against the Applicable Series’ assets and the Managing Owner and its assets; and such Claims shall not be asserted or enforceable for any reason whatsoever against the assets of any other Series or the Trust generally;
(iii) If the Claims of the Managing Owner or the Trustee against the Applicable Series or the Trust are secured in whole or in part, each of the Managing Owner and the Trustee hereby waives (under section 1111(b) of the Bankruptcy Code (11 U.S.C. S 1111(b)) any right to have any deficiency Claims (which deficiency Claims may arise in the event such security is inadequate to satisfy such Claims) treated as unsecured Claims against the Trust or any Series (other than the Applicable Series), as the case may be;
(iv) In furtherance of the foregoing, if and to the extent that the Managing Owner and the Trustee receive monies in connection with the Subordinated Claims from a Series or the Trust (or their respective assets), other than the Applicable Series, the Applicable Series’ assets and the Managing Owner and its assets, the Managing Owner and the Trustee shall be deemed to hold such monies in trust and shall promptly remit such monies to the Series or the Trust that paid such amounts for distribution by the Series or the Trust in accordance with the terms hereof; and
(v) The foregoing Consent shall apply at all times notwithstanding that the Claims are satisfied, and notwithstanding that the agreements in respect of such Claims are terminated, rescinded or canceled.
(d) Any agreement entered into by the Trust, any Series, or the Managing Owner, on behalf of the Trust generally or any Series, including, without limitation, the Subscription Agreement entered into with each Unitholder, will include language substantially similar to the language set forth in Section 3.7(c).
SECTION 3.8 Series Distributions.
(a) Distributions with respect to Units of a particular Series or any Class or Sub-Class thereof shall be made in accordance with Section 6.4 and may be paid with such frequency as the Managing Owner may determine, which may be daily or otherwise, to the Unitholders in that Series, Class or Sub-Class, from such of the income and capital gains, accrued or realized, from the Trust Estate belonging to that Series, or in the case of a Class, belonging to that Series and allocable to that Class, or in the case of a Sub-Class, belonging to that Class and allocable to that Sub-Class, as the Managing Owner may determine, in its sole and absolute discretion, after providing for actual and accrued liabilities belonging to that Series. Such distributions may be made in cash or Units of that Series, Class or Sub-Class or a combination thereof as determined by the Managing Owner, in its sole and absolute discretion, or pursuant to any program that the Managing Owner may have in effect at the time for the election by each Unitholder of the mode of the making of such dividend or distribution to that Unitholder.
(b) The Units in a Series, a Class or a Sub-Class of the Trust shall represent beneficial interests in the Trust Estate belonging to such Series or in the case of a Class, belonging to such Series and allocable to such Class or in the case of a Sub-Class, belonging to such Class and allocable to such Sub-Class. Each Unitholder in a Series, Class or Sub-Class shall be entitled to receive its pro rata share of distributions of income and capital gains made with respect to such Series, Class or Sub-Class. Upon reduction or withdrawal of its Units or indemnification for liabilities incurred by reason of being or having been a holder of Units in a Series, Class or Sub-Class, such Unitholder shall be paid solely out of the funds and property of such Series or in the case of a Class, the funds and property of such Series and allocable to such Class of the Trust or in the case of a Sub-Class, the funds and property of such Class and allocable to such Sub-Class of the Trust. Upon liquidation or termination of a Series of the Trust, Unitholders in such Series, Class or Sub-Class shall be entitled to receive a pro rata share of the Trust Estate belonging to such Series or in the case of a Class, belonging to such Series and allocable to such Class, or in the case of a Sub-Class, belonging to such Class and allocable to such Sub-Class.
A-28
Table of Contents
SECTION 3.9 Voting Rights. Notwithstanding any other provision hereof, on each matter submitted to a vote of the Unitholders of a Series, each Unitholder shall be entitled to a proportionate vote based upon the product of the Net Asset Value of a Series per Unit multiplied by the number of Units, or fraction thereof, standing in its name on the books of such Series. As to any matter which affects the Units of more than one Series, the Unitholders of each affected Series shall be entitled to vote, and each such Series shall vote as a separate class.
SECTION 3.10 Equality. Except as provided herein or in the instrument designating and establishing any Class, Sub-Class or Series, all Units of each particular Series shall represent an equal proportionate beneficial interest in the assets belonging to that Series subject to the liabilities belonging to that Series, and each Unit of any particular Series, Classes or Sub-Class shall be equal to each other Unit of that Series, Class or Sub-Class; but the provisions of this sentence shall not restrict any distinctions permissible under Section 3.8 that may exist with respect to dividends and distributions on Units of the same Series, Class or Sub-Class. The Managing Owner may from time to time divide or combine the Units of any particular Series, Class or Sub-Class into a greater or lesser number of Units of that Series, Class or Sub-Class without thereby changing the proportionate beneficial interest in the assets belonging to that Series or in any way affecting the rights of Unitholders of any other Series, Class or Sub-Class.
SECTION 3.11 Exchange of Units. Subject to compliance with the requirements of applicable law, the Managing Owner shall have the authority to provide that Unitholders of any Series shall have the right to exchange said Units into one or more other Series in accordance with such requirements and procedures as may be established by the Managing Owner provided, however, that Units in the Class 1 or Class 2 of a Series may be exchanged with Units in the Class 1 or Class 2, as applicable, of another Series;provided,however, that Units in the Class 1 or Class 2, as applicable, of any non-Graham Series may be exchanged for Units in the Class 1 or Class 2, as applicable, of the Graham Series only if such Units were acquired through a Selling Agent which acts as a selling agent for the Graham Series. The Managing Owner shall also have the authority to provide that Unitholders of any Class of a particular Series shall have the right to exchange said Units into one or more other Classes of that particular Series or any other Series in accordance with such requirements and procedures as may be established by the Managing Owner. The Managing Owner shall also have the authority to provide that Unitholders of any Sub-Class of a particular Series shall have the right to exchange said Units into one or more other Sub-Class of that particular Series or any other Series in accordance with such requirements and procedures as may be established by the Managing Owner. Any such exchange shall be treated as a redemption of the Units in one Series or Class followed by an immediate purchase of Units in a second Series or Class.
ARTICLE IV
THE MANAGING OWNER
SECTION 4.1 Management of the Trust. Pursuant to Section 3806 of the Delaware Statutory Trust Act, the Trust shall be managed by the Managing Owner and the conduct of the Trust’s business shall be controlled and conducted solely by the Managing Owner in accordance with this Trust Agreement.
SECTION 4.2 Authority of Managing Owner. In addition to and not in limitation of any rights and powers conferred by law or other provisions of this Trust Agreement, and except as limited, restricted or prohibited by the express provisions of this Trust Agreement or the Delaware Statutory Trust Act, the Managing Owner shall have and may exercise on behalf of the Trust all powers and rights necessary, proper, convenient or advisable to effectuate and carry out the purposes, business and objectives of the Trust, which shall include, without limitation, the following:
(a) To enter into, execute, deliver and maintain contracts, agreements and any or all other documents and instruments, and to do and perform all such things, as may be in furtherance of Trust purposes or necessary or appropriate for the offer and sale of the Units and the conduct of Trust activities, including, but not limited to, contracts with third parties for:
(i) commodity brokerage services, as well as administrative services necessary to the prudent operation of the Trust, provided, however, that in no event shall the fees payable by the Trust for such
A-29
Table of Contents
services exceed any limitations imposed by the NASAA Guidelines as they may be amended from time to time, except to the extent that such limitations are amended to become more restrictive, in which event such fees will not exceed such more restrictive limitations, and provided, further, that such services may be performed by an Affiliate or Affiliates of the Managing Owner so long as the Managing Owner has made a good faith determination that: (A) the Affiliate which it proposes to engage to perform such services is qualified to do so (considering the prior experience of the Affiliate or the individuals employed thereby); (B) the terms and conditions of the agreement pursuant to which such Affiliate is to perform services for the Trust are no less favorable to the Trust than could be obtained from equally-qualified unaffiliated third parties; and (C) the maximum period covered by the agreement pursuant to which such affiliate is to perform services for the Trust shall not exceed one year, and such agreement shall be terminable without penalty upon sixty (60) days’ prior written notice by the Trust; and
(ii) commodity trading advisory services relating to the purchase and sale of all Commodities positions on behalf of the Trust, which services may not be performed by the Managing Owner or an Affiliate(s) of the Managing Owner, provided, however, that in no event shall the fees payable by the Trust for such services exceed any limitations imposed by the NASAA Guidelines as they may be amended from time to time, except to the extent that such limitations are amended to become more restrictive, in which event such fees will not exceed such more restrictive limitations. All advisory services shall be performed by persons with at least three years experience or who can otherwise demonstrate to the Managing Owner that they have sufficient knowledge and experience to carry out the trading in commodity contracts for the Trust and who are also appropriately registered under federal and/or state law (i.e., all commodities advice with respect to commodities transactions shall be given by persons who are registered with the CFTC as a commodity trading advisor and are members of the NFA as a commodity trading advisor), but shall not be performed by any person affiliated with the Trust’s commodity brokers, if any.
(b) To establish, maintain, deposit into, sign checks and/or otherwise draw upon accounts on behalf of the Trust with appropriate banking and savings institutions, and execute and/or accept any instrument or agreement incidental to the Trust’s business and in furtherance of its purposes, any such instrument or agreement so executed or accepted by the Managing Owner in the Managing Owner’s name shall be deemed executed and accepted on behalf of the Trust by the Managing Owner;
(c) To deposit, withdraw, pay, retain and distribute the Trust Estate or any portion thereof in any manner consistent with the provisions of this Trust Agreement;
(d) To supervise the preparation and filing of the Registration Statement and supplements and amendments thereto, and the Prospectus;
(e) To pay or authorize the payment of distributions to the Unitholders and expenses of each Series;
(f) To invest or direct the investment of funds of any Series not then delegated to a Trading Advisor(s) and prohibit any transactions contemplated hereunder which may constitute prohibited transactions under ERISA or the Code;
(g) To make any elections on behalf of the Trust or any Series thereof under the Code, or any other applicable federal or state tax law as the Managing Owner shall determine to be in the best interests of the Trust or any Series thereof;
(h) To redeem mandatorily any Limited Units upon at least two (2) days’ prior written notice acknowledged by the Limited Owner, if (i) the Managing Owner determines that the continued participation of such Limited Owner in the Trust might cause the Trust, a Series in the Trust or any Unitholder to be deemed to be holding “plan assets” under ERISA, (ii) there is an unauthorized assignment pursuant to the provisions of Article V, or (iii) in the event that any transaction would or might violate any law or constitute a prohibited transaction under ERISA or the Code and a statutory, class or individual exemption from the prohibited
A-30
Table of Contents
transaction provisions of ERISA for such transaction or transactions does not apply or cannot be obtained from the DOL (or the Managing Owner determines not to seek such an exemption). In the case of mandatory redemptions, the Redemption Date shall be the close of business on the date written notice of intent to redeem is sent by the Managing Owner to a Limited Owner. A notice may be revoked prior to the payment date by written notice from the Managing Owner to a Limited Owner;
(i) In the sole discretion of the Managing Owner, to admit an Affiliate or Affiliates of the Managing Owner as additional Managing Owners. Notwithstanding the foregoing, the Managing Owner may not admit Affiliate(s) of the Managing Owner as an additional Managing Owner if it has received notice of its removal as a Managing Owner, pursuant to Section 8.2(d) hereof, and if the concurrence of at least a majority in interest (over 50%) of the outstanding Units of all Series (not including Units owned by the Managing Owner) is not obtained;
(j) To override any trading instructions: (i) that the Managing Owner, in its sole discretion, determines in good faith to be in violation of any trading policy or limitation of the Trust, including as set forth in Section 4.2(k) below; (ii) as and to the extent necessary, upon the failure of any Trading Advisor to comply with a request to make the necessary amount of funds available to the Trust within five (5) days of such request, to fund distributions, redemptions (including special redemptions), or reapportionments among Trading Advisors or to pay the expenses of any Series in the Trust; and provided further, that the Managing Owner may make Commodities trading decisions at any time at which any Trading Advisor shall become incapacitated or some other emergency shall arise as a result of which such Trading Advisor shall be unable or unwilling to act and a successor Trading Advisor has not yet been retained;
(k) Monitor the trading activities of the Trading Advisor so that:
(i) Any Series does not establish new Commodities positions for any one contract month or option if such additional Commodities positions would result in a net long or short position for that Commodities position requiring as margin or premium more than fifteen percent (15%) of the Trust Estate of a Series.
(ii) Any Series does not acquire additional Commodities positions in any commodities interest contract or option if such additional Commodities positions would result in the aggregate net long or short Commodities positions requiring as margin or premium for all outstanding Commodities positions more than sixty-six and two-thirds percent (66 2/3%) of the Trust Estate of a Series. Under certain market conditions, such as an abrupt increase in margins required by a commodity exchange or its clearinghouse or an inability to liquidate open Commodities positions because of daily price fluctuation limits or both, a Series may be required to commit as margin in excess of the foregoing limit. In such event the Managing Owner will cause each Trading Advisor to reduce its open futures or options positions to comply with the foregoing limit before initiating new Commodities positions.
SECTION 4.3 Obligations of the Managing Owner. In addition to the obligations expressly provided by the Delaware Statutory Trust Act or this Trust Agreement, the Managing Owner shall:
(a) Devote such of its time to the business and affairs of the Trust as it shall, in its discretion exercised in good faith, determine to be necessary to conduct the business and affairs of the Trust for the benefit of the Trust and the Limited Owners;
(b) Execute, file, record and/or publish all certificates, statements and other documents and do any and all other things as may be appropriate for the formation, qualification and operation of the Trust and each Series of the Trust and for the conduct of its business in all appropriate jurisdictions;
(c) Retain independent public accountants to audit the accounts of each Series in the Trust;
(d) Employ attorneys to represent the Trust or a Series thereof;
A-31
Table of Contents
(e) Use its best efforts to maintain the status of the Trust as a “statutory trust” for state law purposes and as a partnership that is not a publicly traded partnership for federal income tax purposes;
(f) Monitor the trading policies and limitations of each Series, as set forth in the Prospectus, and the activities of the Trust’s Trading Advisor(s) in carrying out those policies in compliance with the Prospectus;
(g) Monitor the brokerage fees charged to each Series, and the services rendered by futures commission merchants to each Series, to determine whether the fees paid by, and the services rendered to, each Series for futures brokerage are at competitive rates and are the best price and services available under the circumstances, and if necessary, renegotiate the brokerage fee structure to obtain such rates and services for each Series. In making this determination the Managing Owner shall not rely solely on the brokerage rates paid by other major commodity pools. No material change related to brokerage fees shall be made except upon twenty (20) Business Days’ prior notice to the Limited Owners, which notice shall include a description of the Limited Owners’ voting rights as set forth in Section 8.2 hereof and redemption rights as set forth in Section 7.1 hereof, and no increase in such fees shall take effect except at the beginning of a Fiscal Quarter following the consent of Limited Owners holding Units representing at least a majority (over 50%) in Net Asset Value of the Series affected (excluding Units held by the Managing Owner);
(h) Have fiduciary responsibility for the safekeeping and use of the Trust Estate of each Series, whether or not in the Managing Owner’s immediate possession or control, and the Managing Owner will not employ or permit others to employ such funds or assets of each Series (including any interest earned thereon) in any manner except as and to the extent permitted by the NASAA Guidelines for the benefit of each Series in the Trust, including, among other things, the utilization of any portion of the Trust Estate as compensating balances for the exclusive benefit of the Managing Owner. The Managing Owner shall at all times act with integrity and good faith and exercise due diligence in all activities relating to the conduct of the business of the Trust and in resolving conflicts of interest. The Trust shall not permit any Limited Owner to contract away the fiduciary duty owed to the Limited Owners by the Managing Owner under this Agreement or the Delaware Statutory Trust Act. Subject to the restrictions set forth in Section 4.6 hereof, to the extent that, at law or in equity, the Managing Owner or any officer, director, employee or agent thereof or any Affiliate of the Managing Owner (collectively, the “Covered Persons”), has duties (including fiduciary duties) and liabilities relating thereto to the Trust, any other Unitholder or Covered Person or the Trustee, such Covered Person acting under the Trust Agreement shall not be liable to the Trust, any other Unitholder or Covered Person or the Trustee for such Covered Person’s good faith reliance on the provisions of the Trust Agreement; and the duties and liabilities of such Covered Person may be expanded or restricted by the provisions of this Trust Agreement.
(i) Agree that, at all times from and after the sale of at least the Subscription Minimum (as defined in the Prospectus), for so long as it remains a Managing Owner of the Trust, it shall have a minimum “net worth” (as defined below) and not take any affirmative action to reduce its “net worth” below an amount imposed by the NASAA Guidelines as they may be amended from time to time. “Net Worth” is defined in the NASAA Guidelines as requiring the financial condition of the sponsor of an issuance of securities to be in no case less than $50,000 nor be in excess of $1,000,000;
(j) Admit substituted Limited Owners in accordance with this Trust Agreement;
(k) Refuse to recognize any attempted transfer or assignment of a Unit that is not made in accordance with the provisions of Article V; and
(l) Maintain a current list in alphabetical order, of the names and last known addresses and, if available, business telephone numbers of, and number of Units owned by, each Unitholder and the other Trust documents described in Section 9.6 at the Trust’s principal place of business, which documents shall be made available thereat at reasonable times during ordinary business hours for inspection by any Limited Owner or his representative for any purpose reasonably related to the Limited Owner’s interest as a beneficial owner of the
A-32
Table of Contents
Trust. Such list shall be printed on white paper in clearly legible print and shall be updated quarterly. Upon request, for any purpose reasonably related to the Limited Owner’s interest as a beneficial owner of the Trust, including without limitation, matters relating to a Unitholder’s voting rights hereunder or the exercise of a Limited Owner’s rights under federal proxy law, either in person or by mail, the Managing Owner will furnish a copy of such list to a Limited Owner or his representative within ten (10) days of a request therefor, upon payment of the cost of reproduction and mailing; provided, however, that the Limited Owner requesting such list shall give written assurance that the list will not, in any event, be used for commercial purposes. Subject to applicable law, a Limited Owner shall give the Managing Owner at least ten (10) Business Days’ prior written notice for any inspection and copying permitted pursuant to this Section 4.3(l) by the Limited Owner or his authorized attorney or agent.
SECTION 4.4 General Prohibitions. The Trust shall not:
(a) Borrow money from or loan money to any Unitholder or other Person, except that the foregoing is not intended to prohibit (i) the deposit on margin with respect to the initiation and maintenance of the Trust’s Commodities positions or (ii) obtaining lines of credit for the trading of forward contracts; provided, however, that the Trust is prohibited from incurring any indebtedness on a non- recourse basis;
(b) Create, incur, assume or suffer to exist any lien, mortgage, pledge conditional sales or other title retention agreement, charge, security interest or encumbrance, except (i) the right and/or obligation of a commodity broker to close out sufficient commodities positions of each Series so as to restore the Series’ account to proper margin status in the event that the Series fails to meet a Margin Call, (ii) liens for taxes not delinquent or being contested in good faith and by appropriate proceedings and for which appropriate reserves have been established, (iii) deposits or pledges to secure obligations under workmen’s compensation, social security or similar laws or under unemployment insurance, (iv) deposits or pledges to secure contracts (other than contracts for the payment of money), leases, statutory obligations, surety and appeal bonds and other obligations of like nature arising in the ordinary course of business, or (v) mechanic’s, warehousemen’s, carrier’s, workmen’s, materialmen’s or other like liens arising in the ordinary course of business with respect to obligations which are not due or which are being contested in good faith, and for which appropriate reserves have been established if required by generally accepted accounting principles, and liens arising under ERISA;
(c) Commingle its assets with those of any other Person, except to the extent permitted under the CE Act and the regulations promulgated thereunder;
(d) Directly or indirectly pay or award any finder’s fees, commissions or other compensation to any Persons engaged by a potential Limited Owner for investment advice as an inducement to such advisor to advise the potential Limited Owner to purchase Limited Units in the Trust;
(e) Engage in Pyramiding of its Commodities positions; provided, however, that a Trading Advisor(s) may take into account the Series’ open trade equity on existing positions in determining generally whether to acquire additional Commodities positions on behalf of the Series;
(f) Permit rebates to be received by the Managing Owner or any Affiliate of the Managing Owner, or permit the Managing Owner or any Affiliate of the Managing Owner to engage in any reciprocal business arrangements which would circumvent the foregoing prohibition;
(g) Permit the Trading Advisor(s) to share in any portion of brokerage fees related to commodity brokerage services paid with respect to a Series with respect to its commodity trading activities;
(h) Enter into any contract with the Managing Owner or an Affiliate of the Managing Owner (except for selling agreements for the sale of Units, subscription agreements for the purchase of Units and this Trust Agreement) (i) which has a term of more than one year and which does not provide that it may be canceled by
A-33
Table of Contents
the Trust without penalty on sixty (60) days prior written notice or (ii) for the provision of goods and services, except at rates and terms at least as favorable as those which may be obtained from third parties in arms-length negotiations;
(i) Permit churning of its Commodity trading account(s) for the purpose of generating excess brokerage commissions;
(j) Enter into any exclusive brokerage contract;
(k) Operate the Trust in any manner so as to contravene section 3804 of the Delaware Statutory Trust Act; and
(l) Cause the Trust to elect to be treated as an association taxable as a corporation for federal income tax purposes.
SECTION 4.5 Liability of Covered Persons. A Covered Person shall have no liability to the Trust or to any Unitholder or other Covered Person for any loss suffered by the Trust which arises out of any action or inaction of such Covered Person if such Covered Person, in good faith, determined that such course of conduct was in the best interest of the Trust and such course of conduct did not constitute negligence or misconduct of such Covered Person. Subject to the foregoing, neither the Managing Owner nor any other Covered Person shall be personally liable for the return or repayment of all or any portion of the capital or profits of any Limited Owner or assignee thereof, it being expressly agreed that any such return of capital or profits made pursuant to this Trust Agreement shall be made solely from the assets of the Trust without any rights of contribution from the Managing Owner or any other Covered Person.
SECTION 4.6 Indemnification of the Managing Owner.
(a) To the fullest extent permitted by applicable law, the Managing Owner shall be indemnified and held harmless by the Trust against any liability or loss suffered by the Managing Owner in connection with its activities for each Series of the Trust, provided that (i) the Managing Owner was acting on behalf of or performing services for the Trust and has determined, in good faith, that such course of conduct was in the best interests of the Trust and such liability or loss was not the result of negligence, misconduct, or a breach of this Trust Agreement on the part of the Managing Owner and (ii) any such indemnification will only be recoverable from the Trust Estate.
(b) Notwithstanding the provisions of Section 4.6(a) above, the Managing Owner and any Person acting as broker-dealer for the Trust or any Series thereof shall not be indemnified for any losses, liabilities or expenses arising from or out of an alleged violation of federal or state securities laws unless (i) there has been a successful adjudication on the merits of each count involving alleged securities law violations as to the particular indemnitee, (ii) such claims have been dismissed with prejudice on the merits by a court of competent jurisdiction as to the particular indemnitee or (iii) a court of competent jurisdiction approves a settlement of the claims against a particular indemnitee and finds that indemnification of the settlement and related costs should be made.
(c) In any claim for indemnification for federal or state securities law violations, the party seeking indemnification shall place before the court the position of the Securities and Exchange Commission, the position of the Tennessee Securities Division, the position of the Securities Division of the Commonwealth of Massachusetts and the position of any other applicable state securities division which requires disclosure with respect to the issue of indemnification for securities law violations.
(d) The Trust shall not incur the cost of that portion of any insurance which insures any party against any liability, the indemnification of which is herein prohibited.
A-34
Table of Contents
(e) Expenses incurred in defending a threatened or pending civil, administrative or criminal action suit or proceeding against the Managing Owner shall be paid by the Trust in advance of the final disposition of such action, suit or proceeding, if (i) the legal action relates to acts or omissions with respect to the performance of duties or services by the Managing Owner on behalf of the Trust or a particular Series of the Trust; (ii) the legal action is initiated by a third party who is not a Limited Owner or the legal action is initiated by a Limited Owner and a court of competent jurisdiction specifically approves such advance; and (iii) the Managing Owner undertakes to repay the advanced funds with the applicable legal rate of interest to the Trust in cases in which it is not entitled to indemnification under this Section 4.6.
(f) The term “Managing Owner” as used only in this Section 4.6 shall include, in addition to the Managing Owner, any other Covered Person performing services on behalf of the Trust or any Series thereof and acting within the scope of the Managing Owner’s authority as set forth in this Trust Agreement.
(g) The payment of any amount pursuant to this Section shall be subject to Section 3.7 with respect to the allocation of liabilities and other amounts, as appropriate, among the Series of the Trust.
SECTION 4.7 Expenses.
(a) The Managing Owner or an Affiliate of the Managing Owner shall be responsible for the payment of all Organization and Offering Expenses incurred in the creation of the Trust and each Series thereof and sale of Units, except for the initial service fee, if any. Organization and Offering Expenses shall mean those expenses incurred in connection with the formation, qualification and registration of the Trust and the Units and in offering, distributing and processing the Units under applicable federal and state law, and any other expenses actually incurred and, directly or indirectly, related to the organization of the Trust or the initial and continuous offering of the Units, including, but not limited to, expenses such as: (i) initial and on-going registration fees, filing fees, escrow fees and taxes, (ii) costs of preparing, printing (including typesetting), amending, supplementing, mailing and distributing the Registration Statement, the Exhibits thereto and the Prospectus during the Initial and Continuous Offering Periods, (iii) the costs of qualifying, printing, (including typesetting), amending, supplementing, mailing and distributing sales materials used in connection with the offering and issuance of the Units during the Initial and Continuous Offering Periods, (iv) travel, telegraph, telephone and other expenses in connection with the offering and issuance of the Units during the Initial and Continuous Offering Periods, and (v) accounting, auditing and legal fees (including disbursements related thereto) incurred in connection therewith.
(b) All on-going charges, costs and expenses of the Trust’s operation, including, but not limited to, the routine expenses associated with (i) preparation of monthly, annual and other reports required by applicable federal and state regulatory authorities; (ii) Trust meetings and preparing, printing and mailing of proxy statements and reports to Unitholders; (iii) the payment of any distributions related to redemption of Units; (iv) routine services of the Trustee, legal counsel, auditors and accountants, whether employed directly or by Affiliates of the Managing Owner; (v) postage, insurance and filing fees; (vi) client relations and services and (vii) computer equipment and system development shall be billed to and paid by the Managing Owner or an Affiliate of the Managing Owner. All on-going expenses associated with (i) the fixed fee to be paid to the Trust’s commodity brokers, if any, (ii) required payments to the Trust’s Trading Advisors and (iii) extraordinary expenses (including, but not limited to, legal claims and liabilities and litigation costs and any indemnification related thereto) shall be billed to and/or paid out of the assets of the appropriate Series of the Trust subject to such other limitations as are set forth herein concerning the limitations on the Series’ liability for the liabilities of another Series.
(c) The Managing Owner or any Affiliate of the Managing Owner may only be reimbursed for the actual cost to the Managing Owner or such Affiliate of any expenses which it advances on behalf of the Trust for which payment the Trust is responsible. In addition, payment to the Managing Owner or such Affiliate for indirect expenses incurred in performing services for the Trust, such as salaries and fringe benefits of officers and directors, rent or depreciation, utilities and other administrative items generally falling within the category of the Managing Owner’s “overhead,” is prohibited.
A-35
Table of Contents
(d) The Trust shall pay any extraordinary fees and expenses affecting the Trust generally (including, but not limited to, legal claims and liabilities and litigation costs and any permitted indemnification payments related thereto). Except as otherwise set forth in this Trust Agreement, all Trust expenses which are specific to a particular Series of Units will be allocated to such Series. All general expenses of the Trust will be allocatedpro rataamong all Series of Units according to their respective Net Asset Values and taking into account the timing of such Unit purchases.
SECTION 4.8 Compensation to the Managing Owner.
(a) Management Fee.
(i) The assets attributable to each Series of Units shall be used to pay to the Managing Owner a monthly management fee equal to the following percentage of such Series’ assets:
(A) the assets attributable to the Balanced Series Class 1 Units and the Balanced Series Class 2 Units shall be used to pay to the Managing Owner a monthly management fee equal to 1/12th of 0.50% of the assets attributable to the Balanced Series Class 1 Units and Class 2 Units (approximately 0.50% annually), and the assets attributable to the Balanced Series Class 1a Units and the Balanced Series Class 2a Units shall be used to pay to the Managing Owner a monthly management fee equal to 1/12th of 1.00% of the assets attributable to the Balanced Series Class 1a Units and Class 2a Units (approximately 1.00% annually);
(B) the assets attributable to the Graham Series Units shall be used to pay to the Managing Owner a monthly management fee equal to 1/12th of 2.50% of the assets attributable to the Graham Series Units (approximately 2.50% annually);
(C) the assets attributable to the Winton Series Units shall be used to pay to the Managing Owner a monthly management fee equal to 1/12th of 2.0% of the assets attributable to the Winton Series Units (approximately 2.0% annually);
(D) the assets attributable to the Campbell/Graham Series Units shall be used to pay to the Managing Owner a monthly management fee equal to 1/12th of 2.50% of the assets attributable to the Campbell/Graham Series Units (approximately 2.50% annually);
(E) the assets attributable to the Currency Series Units shall be used to pay to the Managing Owner a monthly management fee equal to 1/12th of 2.0% of the assets attributable to the Currency Series Units (approximately 2.0% annually);
(F) the assets attributable to the Currency Series Units shall be used to pay to the Managing Owner no monthly management fee;
(G) the assets attributable to the Long Only Commodity Series Units shall be used to pay to the Managing Owner a monthly management fee equal to 1/12th of 2.00% of the assets attributable to the Long/Short Commodity Series Units (approximately 2.00% annually);
(H) the assets attributable to the Long/Short Commodity Series Units shall be used to pay to the Managing Owner a monthly management fee equal to 1/12th of 3.50% of the assets attributable to the Long/Short Commodity Series Units (approximately 3.50% annually);
(I) the assets attributable to the Managed Futures Index Series Units shall be used to pay to the Managing Owner a monthly management fee equal to 1/12th of 2.00% of the assets attributable to the Long/Short Commodity Series Units (approximately 2.00% annually);and
(ii) For purposes of calculating the management fee payable to the Managing Owner, the Net Asset Value of a Series shall be determined before reduction for any management fees accrued or paid, incentive fees made or makeable or extraordinary fees and expenses accrued or paid as of such day-end and before giving effect to any capital contributions made and any distributions or redemptions accrued or paid as of such day-end.
(iii) The Managing Owner shall pay each Trading Advisor’s management fees out of such management fee.
A-36
Table of Contents
(iv) Investments made by the Managing Owner, a Trading Advisor or their respective employees, family members and affiliates may, in the sole and absolute discretion of the Managing Owner, be charged management fees at reduced rates.
(b) Incentive Fee
(i) Each Series (other than the Balanced Series, the Campbell/Graham Series, the Currency Series and the Long/Short Commodity Series) shall pay to the Managing Owner an incentive fee of a certain percentage of “New High Net Trading Profits” (as hereinafter defined) generated by such Series, including realized and unrealized gains and losses thereon, as of the close of business on the last day of each calendar quarter (the “Incentive Measurement Date”). Because the Balanced Series, the Campbell/Graham Series, the Currency Series and the Long/Short Commodity Series will each employ multiple Trading Advisors, such Series shall pay the Managing Owner an incentive fee calculated on a Trading Advisor by Trading Advisor basis. It is therefore possible that in any given period the Balanced Series, the Campbell/Graham Series, the Currency Series and the Long/Short Commodity Series may pay incentive fees to one or more Trading Advisors while such Series as a whole experiences losses. The fee shall accrue monthly. The percentage of New High Net Trading Profits that each Series shall pay to the Managing Owner is as follows:
(A) the Balanced Series Units shall pay to the Managing Owner an incentive fee of 25% of New High Net Trading Profits;
(B) the Graham Series Units shall pay to the Managing Owner an incentive fee of 20% of New High Net Trading Profits;
(C) the Winton Series Units shall pay to the Managing Owner an incentive fee of 20% of New High Net Trading Profits;
(D) the Campbell/Graham Series Units shall pay to the Managing Owner an incentive fee of 20% of New High Net Trading Profits;
(E) the Currency Series Units shall pay to the Managing Owner an incentive fee of 20% of New High Net Trading Profits;
(F) the Dunn Series Units shall pay to the Managing Owner an incentive fee of 25% of New High Net Trading Profits;
(G) the Long Only Commodity Series Units shall pay to the Managing Owner no incentive fee;
(H) the Long/Short Commodity Series Units shall pay to the Managing Owner an incentive fee of 20% of New High Net Trading Profits;
(I) Managed Futures Index Series Units shall pay to the Managing Owner no incentive fee; and
(ii) “New High Net Trading Profits” (for purposes of calculating the Managing Owner’s incentive fees) shall be computed as of the Incentive Measurement Date and will include such profits (as outlined below) since the Incentive Measurement Date of the most recent preceding calendar month or quarter for which an incentive fee was earned (or, with respect to the first Incentive Fee, as of the commencement of operations) (the “Incentive Measurement Period”). New High Net Trading Profits for any Incentive Measurement Period shall be the net profits, if any, from the Series’ (or in the case of the Balanced Series, the Campbell/Graham Series, the Currency Series and the Long/Short Commodity Series, the Trading Advisor’s) trading during such period (including (i) gross realized trading profit (loss) plus or minus (ii) the change in unrealized trading profit (loss) on open positions) minus (iii) the fees charged to the Series (or in the case of the Balanced Series, the Campbell/Graham Series, the Currency Series and the Long/Short Commodity Series, such Trading Advisor) by the Managing Owner and the Clearing Brokers for brokerage commissions, exchange fees, NFA fees, give up fees and other transaction related fees and expenses charged in connection with the Series’ (or in the case of the Balanced Series, the Campbell/Graham Series, the Currency Series and the Long/Short Commodity Series, such Trading Advisor’s) trading
A-37
Table of Contents
activities and on-going service fees for certain administrative services payable to certain Selling Agents and will be calculated after the determination of the Managing Owner’s management fee, but before deduction of any incentive fees payable during the Incentive Measurement Period minus (iv) the “Carryforward Loss” (as defined in the next sentence), if any, as of the beginning of the Incentive Measurement Period. If the total of items (i) through (iv), above, is negative at the end of an Incentive Measurement Period, such amount shall be the Carryforward Loss for the next month or quarter. Carryforward Losses shall (v) be proportionately reduced to reflect reductions in allocated assets. Such proportional reduction shall be based upon the ratio that the reduction of assets allocated away from the Trading Advisor bears to the then current amount of Allocated Assets which the Trading Advisor is managing prior to giving effect to such reduction in the Allocated Assets. New High Net Trading Profits will not include interest earned or credited. New High Net Trading Profits shall be generated only to the extent that the Series’ (or in the case of the Balanced Series, the Campbell/Graham Series, the Currency Series and the Long/Short Commodity Series, the Trading Advisor’s) cumulative New High Net Trading Profits exceed the highest level of cumulative New High Net Trading Profits achieved by such Series (or in the case of the Balanced Series, the Campbell/Graham Series, the Currency Series and the Long/Short Commodity Series, such Trading Advisor’s) as of a previous Incentive Measurement Date. Except as set forth below, net losses after proportional reduction under clause (v), above from prior quarters must be recouped before New High Net Trading Profits can again be generated. If a withdrawal or distribution occurs at any date that is not an Incentive Measurement Date, the date of the date of the withdrawal or distribution will be treated as if it were an Incentive Measurement Date, but any Incentive Fee accrued in respect of the withdrawn assets on such date shall not be paid to the Managing Owner until the next scheduled Incentive Measurement Date. New High Net Trading Profits for an Incentive Measurement Period shall exclude capital contributions to the Series (or in the case of the Balanced Series, the Campbell/Graham Series, the Currency Series and the Long/Short Commodity Series, such Trading Advisor’s) in an Incentive Measurement Period, distributions or redemptions payable by the Series (or in the case of the Balanced Series, the Campbell/Graham Series, the Currency Series and the Long/Short Commodity Series, such Trading Advisor’s) during an Incentive Measurement Period, as well as losses, if any, associated with redemptions during the Incentive Measurement Period and prior to the Incentive Measurement Date. In calculating New High Net Trading Profits, incentive fees paid for a previous Incentive Measurement Period will not reduce cumulative New High Net Trading Profits in subsequent periods.
(iii) The Managing Owner shall pay each Trading Advisor’s incentive fees out of such fees.
(iv) Investments made by the Managing Owner, a Trading Advisor or their respective employees, family members and affiliates may, in the sole and absolute discretion of the Managing Owner, be charged incentive fees at reduced rates.
(c) With respect to the Graham Series, Winton Series, Currency Series, Campbell/Graham Series and the Class 1 and Class 2 of the Balanced Series, the first two percent (2.0%) of interest income earned per annum by the Trust on each Series shall be paid to the Managing Owner. In addition, if interest rates fall below 0.75% (calculated daily based on each Series’ Net Asset Value), the Managing Owner shall be paid the difference between the Trust’s annualized income interest and 0.75%. Interest income above two percent (2.0%) per Series (calculated daily based on each Series’ Net Asset Value) shall be retained by the Trust. With respect to the Long Only Commodity Series, Long/Short Commodity Series, Managed Futures Index Series and the Class 1a and Class 2a of the Balanced Series, twenty percent (20%) of interest income earned per annum by the Trust shall be paid to the Managing Owner, and the remaining eighty percent (80%) of interest income earned per annum by the Trust shall be retained by the Trust.
(d) The Trust, with respect to each Series, will pay a fee of a certain percentage of the Series’ Net Asset Value annually which will be used to pay all brokerage commissions, plus applicable exchange fees, NFA fees, give up fees and other transaction related fees and expenses charged in connection with each Series’ trading activities and on-going service fees for certain administrative services payable to certain Selling Agents selling Class 2 Units or Class 2a Units of any Series.
A-38
Table of Contents
(e) With respect to strategic investors who purchase at least $2,000,000 of Class 2 Units of the Balanced Series during the Initial Offering Period for such Series and agree to maintain such investment for at least one hundred and twenty (120) days following the commencement of trading activities for the Balanced Series, the Managing Owner shall rebate to such investors one hundred percent (100%) of the interest income and twenty percent (20%) of the incentive fees earned by the Managing Owner with respect to such investments over such one hundred and twenty (120) day period or such longer period of up to twelve (12) months during which such investors agree to maintain such investment.
(f) With respect to strategic investors who purchase at least $2,000,000 of Class 2 Units of the Campbell/Graham Series during the Initial Offering Period for such Series and agree to maintain such investment for at least one hundred and twenty (120) days following the commencement of trading activities for the Campbell/Graham Series, the Managing Owner shall rebate to such investors one hundred percent (100%) of the interest income earned by the Managing Owner with respect to such investments over such one hundred and twenty (120) day period or such longer period of up to twelve (12) months during which such investors agree to maintain such investment.
SECTION 4.9 Other Business of Unitholders. Except as otherwise specifically provided herein, any of the Unitholders and any shareholder, officer, director, employee or other person holding a legal or beneficial interest in an entity which is a Unitholder, may engage in or possess an interest in other business ventures of every nature and description, independently or with others, and the pursuit of such ventures, even if competitive with the business of the Trust, shall not be deemed wrongful or improper. The Managing Owner and Affiliates of the Managing Owner shall not engage in a venture competitive with the Trust except as described in the Prospectus.
SECTION 4.10 Voluntary Withdrawal of the Managing Owner. The Managing Owner may withdraw voluntarily as the Managing Owner of the Trust only upon one hundred twenty (120) days’ prior written notice to all Limited Owners and the Trustee and the prior approval of Limited Owners holding Units equal to at least a majority (over 50%) of the Net Asset Value of each Series (excluding Units held by the withdrawing Managing Owner). If the withdrawing Managing Owner is the last remaining Managing Owner, Limited Owners holding Units equal to at least a majority (over 50%) of the Net Asset Value of each Series (not including Units held by the Managing Owner) may vote to elect and appoint, effective as of a date on or prior to the withdrawal, a successor Managing Owner who shall carry on the business of the Trust. If the Managing Owner withdraws as Managing Owner and the Limited Owners or remaining Managing Owner elect to continue the Trust, the withdrawing Managing Owner shall pay all expenses incurred as a result of its withdrawal. In the event of its removal or withdrawal, the Managing Owner shall be entitled to a redemption of its Unit at the Net Asset Value of a Series thereof on the next Redemption Date following the date of removal or withdrawal.
SECTION 4.11 Authorization of Registration Statements. Each Limited Owner (or any permitted assignee thereof) hereby agrees that the Managing Owner is authorized to execute, deliver and perform the agreements, acts, transactions and matters contemplated hereby or described in or contemplated by the Registration Statements or any securities laws on behalf of the Trust without any further act, approval or vote of the Limited Owners of the Trust, notwithstanding any other provision of this Trust Agreement, the Delaware Statutory Trust Act or any applicable law, rule or regulation.
SECTION 4.12 Litigation. The Managing Owner is hereby authorized to prosecute, defend, settle or compromise actions or claims at law or in equity as may be necessary or proper to enforce or protect the Trust’s interests. The Managing Owner shall satisfy any judgment, decree or decision of any court, board or authority having jurisdiction or any settlement of any suit or claim prior to judgment or final decision thereon, first, out of any insurance proceeds available therefor, next, out of the Trust’s assets and, thereafter, out of the assets (to the extent that it is permitted to do so under the various other provisions of this Agreement) of the Managing Owner.
A-39
Table of Contents
ARTICLE V
TRANSFERS OF UNITS
SECTION 5.1 General Prohibition. A Limited Owner may not sell, assign, transfer or otherwise dispose of, or pledge, hypothecate or in any manner encumber any or all of his Units or any part of his right, title and interest in the capital or profits of any Series in the Trust except as permitted in this Article V and any act in violation of this Article V shall not be binding upon or recognized by the Trust (regardless of whether the Managing Owner shall have knowledge thereof), unless approved in writing by the Managing Owner.
SECTION 5.2 Transfer of Managing Owner’s General Units.
(a) Upon an Event of Withdrawal (as defined in Section 13.1), the Managing Owner’s General Units shall be purchased by the Trust for a purchase price in cash equal to the Net Asset Value thereof. The Managing Owner will not cease to be a Managing Owner of the Trust merely upon the occurrence of its making an assignment for the benefit of creditors, filing a voluntary petition in bankruptcy, filing a petition or answer seeking for itself any reorganization, arrangement, composition, readjustment, liquidation, dissolution or similar relief under any statute, law or regulation, filing an answer or other pleading admitting or failing to contest material allegations of a petition filed against it in any proceeding of this nature or seeking, consenting to or acquiescing in the appointment of a trustee, receiver or liquidator for itself or of all or any substantial part of its properties.
(b) To the full extent permitted by law, nothing in this Trust Agreement shall be deemed to prevent the merger of the Managing Owner with another corporation, the reorganization of the Managing Owner into or with any other corporation, the transfer of all the capital stock of the Managing Owner or the assumption of the Units, rights, duties and liabilities of the Managing Owner by, in the case of a merger, reorganization or consolidation, the surviving corporation by operation of law.
(c) Upon assignment of all of its Units, the Managing Owner shall not cease to be a Managing Owner of the Trust, or to have the power to exercise any rights or powers as a Managing Owner, or to have liability for the obligations of the Trust under Section 1.6 hereof, until an additional Managing Owner, who shall carry on the business of the Trust, has been admitted to the Trust.
SECTION 5.3 Transfer of Limited Units.
(a) Permitted assignees of the Limited Owners shall be admitted as substituted Limited Owners, pursuant to this Article V, only upon the consent of the Managing Owner. The parties hereto hereby agree that such restrictions are necessary and desirable in order to maintain the Trust’s tax classification as a partnership, to avoid having the Trust classified as a publicly traded partnership or to avoid adverse legal consequence to the Trust. There will be no restrictions on transferability other than the restrictions necessary and desirable in order to maintain the Trust’s tax classification as a partnership, to avoid having the Trust classified as a publicly traded partnership, and to avoid adverse legal consequences to the Trust.
(i) A substituted Limited Owner is a permitted assignee that has been admitted to any Series as a Limited Owner with all the rights and powers of a Limited Owner hereunder. If all of the conditions provided in Section 5.3(b) below are satisfied, the Managing Owner shall admit permitted assignees into the Trust as Limited Owners by making an entry on the books and records of the Series reflecting that such permitted assignees have been admitted as Limited Owners, and such permitted assignees will be deemed Limited Owners at such time as such admission is reflected on the books and records of the Series.
(ii) A permitted assignee is a Person to whom a Limited Owner has assigned his Limited Units with the consent of the Managing Owner, as provided below in Section 5.3(d), but who has not become a substituted Limited Owner. A permitted assignee shall have no right to vote, to obtain any information on or account of the Series’ transactions or to inspect the Trust’s or Series’ books, but shall only be entitled to
A-40
Table of Contents
receive the share of the profits, or the return of the Capital Contribution, to which his assignor would otherwise be entitled as set forth in Section 5.3(d) below to the extent of the Limited Units assigned. Each Limited Owner agrees that any permitted assignee may become a substituted Limited Owner without the further act or consent of any Limited Owner, regardless of whether his permitted assignee becomes a substituted Limited Owner.
(iii) A Limited Owner shall bear all extraordinary costs (including attorneys’ and accountants’ fees), if any, related to any transfer, assignment, pledge or encumbrance of his Limited Units.
(b) No permitted assignee of the whole or any portion of a Limited Owner’s Limited Units shall have the right to become a substituted Limited Owner in place of his assignor unless all of the following conditions are satisfied:
(i) The written consent of the Managing Owner to such substitution shall be obtained.
(ii) A duly executed and acknowledged written instrument of assignment has been filed with the Trust setting forth the intention of the assignor that the permitted assignee become a substituted Limited Owner in his place;
(iii) The assignor and permitted assignee execute and acknowledge and/or deliver such other instruments as the Managing Owner may deem necessary or desirable to effect such admission, including his execution, acknowledgment and delivery to the Managing Owner, as a counterpart to this Trust Agreement, of a Power of Attorney in the form set forth in the Subscription Agreement; and
(iv) Upon the request of the Managing Owner, an opinion of the Trust’s independent legal counsel is obtained to the effect that (A) the assignment will not jeopardize the Trust’s tax classification as a partnership and (B) the assignment does not violate this Trust Agreement or the Delaware Statutory Trust Act.
(c) Any Person admitted to any Series as a Unitholder shall be subject to all of the provisions of this Trust Agreement as if an original signatory hereto.
(d) (i) Subject to the provisions of Section 5.3(e) below, compliance with the suitability standards imposed by the Trust for the purchase of new Units, applicable federal securities and state “Blue Sky” laws and the rules of any other applicable governmental authority, a Limited Owner shall have the right to assign all or any of his Limited Units to any assignee by a written assignment (on a form acceptable to the Managing Owner) the terms of which are not in contravention of any of the provisions of this Trust Agreement, which assignment has been executed by the assignor and received by the Trust and recorded on the books thereof. An assignee of a Limited Unit (or any interest therein) will not be recognized as a permitted assignee without the consent of the Managing Owner, which consent the Managing Owner shall withhold only if necessary, in the judgment of the Managing Owner (and upon receipt of an opinion of counsel to this effect), to preserve the classification of the Trust as a partnership for federal income tax purposes or to preserve the characterization or treatment of any Series’ income or loss. The Managing Owner shall withhold its consent to assignments made under the foregoing circumstance, and shall exercise such right by taking any actions as it seems necessary or appropriate in its reasonable discretion so that such transfers or assignments of rights are not in fact recognized, and the assignor or transferor continues to be recognized by the Trust as a Unitholder for all purposes hereunder, including the payment of any cash distribution. The Managing Owner shall incur no liability to any investor or prospective investor for any action or inaction by it in connection with the foregoing, provided it acted in good faith.
(ii) Except as specifically provided in this Trust Agreement, a permitted assignee of a Unit shall be entitled to receive distributions from the Series attributable to the Unit acquired by reason of such assignment from and after the effective date of the assignment of such Unit to him. The “effective date” of an assignment of a Limited Unit as used in this clause shall be the Business Day two (2) days after the date on which the Managing Owner shall have been in receipt of the written instrument of assignment for at least two (2) Business Days prior thereto. If the assignee is (A) an ancestor or descendant of the Limited Owner,
A-41
Table of Contents
(B) the personal representative or heir of a deceased Limited Owner, (C) the trustee of a trust whose beneficiary is the Limited Owner or another person to whom a transfer could otherwise be made or (D) the shareholders, partners, or beneficiaries of a corporation, partnership or trust upon its termination or liquidation, then the “effective date” of an assignment of a Unit in the Trust shall be the first Business Day immediately following the Business Day in which the written instrument of assignment is received by the Managing Owner.
(iii) Anything herein to the contrary notwithstanding, the Trust and the Managing Owner shall be entitled to treat the permitted assignor of such Unit as the absolute owner thereof in all respects, and shall incur no liability for distributions made in good faith to him, until such time as the written assignment has been received by, and recorded on the books of, the Trust.
(e) (i) No assignment or transfer of a Unit may be made which would result in the Limited Owners and permitted assignees of the Limited Owners owning, directly or indirectly, individually or in the aggregate, five percent (5%) or more of the stock of the Managing Owner or any related person as defined in Sections 267(b) and 707(b)(1) of the Code. If any such assignment or transfer would otherwise be made by bequest, inheritance of operation of law, the Unit transferred shall be deemed sold by the transferor to the Series immediately prior to such transfer in the same manner as provided in Section 5.3(e)(iii).
(ii) No assignment or transfer of an interest in any Series may be made which would contravene the NASAA Guidelines, as adopted in any state in which the proposed transferor and transferee reside including, without limitation, the restriction set forth in Paragraph F(2) of Article V thereof, which precludes any assignment (except for assignments by gift, inheritance, intra family assignment, family dissolutions and transfers to Affiliates), which would result in either the assignee or the assignor holding Units in any combination of Series valued at less than $1,000 (with no minimum in the case of Plans (including IRAs), employees or family members of an employee of the Managing Owner or its Affiliates or charitable organizations), and $5,000 in the case of assignees or assignors who are residents of Texas (with a minimum of $1,000 in the case of residents of Texas who are Plans (including IRAs), employees or family members of an employee of the Managing Owner or its Affiliates or charitable organizations), provided, however, that this limitation shall not apply in respect of a Limited Owner wishing to assign its or his entire interest in all Series of the Trust.
(iii) Anything else to the contrary contained herein notwithstanding: (A) In any particular twelve (12) consecutive month period no assignment or transfer of a Unit may be made which would result in increasing the aggregate total of Units previously assigned and/or transferred in said period to forty-nine percent (49%) or more of the total interest in the Trust’s capital and profits, as determined by the Managing Owner. This limitation is hereinafter referred to as the “forty-nine percent (49%) limitation”; (B) Clause (ii)(A) hereof shall not apply to a transfer by gift, bequest or inheritance, or a transfer to the Trust, and, for purposes of the forty-nine percent (49%) limitation, any such transfer shall not be treated as such; (C) If, after the forty-nine percent (49%) limitation is reached in any consecutive twelve (12) month period, a transfer of a Unit would otherwise take place by operation of law (but not including any transfer referred to in clause (iii)(B) hereof) and would cause a violation of the forty-nine percent (49%) limitation, then said Unit(s) shall be deemed to have been sold by the transferor to the Trust in liquidation of said Unit(s) immediately prior to such transfer for a liquidation price equal to the Net Asset Value of a Series of said Unit(s) on such date of transfer. The liquidation price shall be paid within ninety (90) days after the date of the transfer.
(f) The Managing Owner, in its sole discretion, may cause the Trust to make, refrain from making, or once having made, to revoke, the election referred to in Section 754 of the Code, and any similar election provided by state or local law, or any similar provision enacted in lieu thereof.
(g) The Managing Owner, in its sole discretion, may cause the Trust to make, refrain from making, or once having made, to revoke the election by a qualified fund under Section 988(c)(1)(E)(V), and any similar election provided by state or local law, or any similar provision enacted in lieu thereof.
A-42
Table of Contents
(h) Each Limited Owner hereby agrees to indemnify and hold harmless the Trust and each other Unitholder against any and all losses, damages, liabilities or expense (including, without limitation, tax liabilities or loss of tax benefits) arising, directly or indirectly, as a result of any transfer or purported transfer by such Limited Owner in violation of any provision contained in this Section 5.3.
ARTICLE VI
DISTRIBUTION AND ALLOCATIONS
SECTION 6.1 Capital Accounts. A capital account shall be established for each Unitholder on the books of the Series in which a Unit is owned (such account sometimes hereinafter referred to as a “book capital account”). The initial balance of each Unitholder’s book capital account with respect to any Series shall be the amount of his initial Capital Contribution to that Series.
SECTION 6.2 Book Capital Account Allocations. As of the close of business (as determined by the Managing Owner) on each Business Day during each Fiscal Year of the Trust, the following determinations and allocations shall be made:
(a) First, any increase or decrease in the Net Asset Value of a Series as of such date as compared to the next previous determination of Net Asset Value of a Series shall be credited or charged to the book capital accounts of the Unitholders in the ratio that the balance of each Unitholder’s book capital account bears to the balance of all Unitholders’ book capital accounts; and
(b) Next, the amount of any distribution to be made to a Unitholder and any amount to be paid to a Unitholder upon redemption of his Units shall be charged to that Unitholder’s book capital account as of the applicable record date and Redemption Date, respectively.
SECTION 6.3 Allocation of Profit and Loss for United States Federal Income Tax Purposes. As of the end of each Fiscal Year, the recognized profit and loss of a Series shall be allocated among the Unitholders of that Series (and among Classes of a Series as appropriate) pursuant to the following subparagraphs for federal income tax purposes. Except as otherwise provided herein, such allocations of profit and loss shall be pro rata from Disposition Gain (or Disposition Loss) and Profits (or Losses).
(a) First, the Profits or Losses of the Trust shall be allocated pro rata among the Unitholders based on their respective book capital accounts as of the end of any Business Day.
(b) Next, Disposition Gain or Disposition Loss from the Trust’s trading activities for each Fiscal Year of the Trust shall be allocated among the Unitholders as follows:
(i) There shall be established a tax capital account with respect to each outstanding Unit. The initial balance of each tax capital account shall be the amount paid by the Unitholder to the Trust for the Unit. Tax capital accounts shall be adjusted as of the end of each Fiscal Year as follows: (A) Each tax capital account shall be increased by the amount of income (Profits or Disposition Gain) which shall have been allocated to the Unitholder who shall hold the Unit pursuant to Section 6.3(a) above and Sections 6.3(b)(ii), 6.3(b)(iii) and 6.3(b)(iv) below; (B) Each tax capital account shall be decreased by the amount of expense or loss (Losses or Disposition Losses) which shall have been allocated to the Unitholder who shall hold the Unit pursuant to Section 6.3(a) above and Sections 6.3(b)(v), 6.3(b)(vi) and 6.3(b)(vii) below and by the amount of any distribution which shall have been received by the Unitholder with respect to the Unit (other than on redemption of Units); and (C) If a Unit is redeemed, the tax capital account with respect to such Unit shall be eliminated on the Redemption Date.
(ii) Disposition Gain shall be allocated first to each Unitholder, if any, who redeemed or exchanged all or a portion of his, her or its Units up to the amount of the excess, if any, of the amount such
A-43
Table of Contents
Unitholder received in respect of the redeemed Units or the value of the Units received in the exchange over the portion of the balance of such Unitholder’s tax capital account attributable to such redeemed or exchanged Units (the “Gain Disparity”); provided, however, that if such Disposition Gain is insufficient to cover all such allocations, it shall be allocated among such Unitholders in the ratio that the Gain Disparity of each such Unitholder bears to the sum of the Gain Disparities of all such Unitholders.
(iii) Disposition Gain that remains after the allocation pursuant to Section 6.3(b)(ii) above shall be allocated first among all Unitholders whose book capital accounts shall be in excess of their Units’ tax capital accounts (after making the adjustments, other than adjustments resulting from the allocations to be made pursuant to this Section 6.3(b)(iii), described in Section 6.3(b)(i) above) in the ratio that each such Unitholder’s excess shall bear to all such Unitholder’s excesses.
(iv) Disposition Gain that remains after the allocation pursuant to Section 6.3(b)(iii) above shall be allocated to the Unitholders in the ratio that each Unitholder’s book capital account bears to all Unitholders’ book capital accounts.
(v) Disposition Loss shall be allocated first to each Unitholder, if any, who redeemed or exchanged all or a portion of his, her or its Units up to the amount of the excess, if any, of the portion of the balance of such Unitholder’s tax capital account attributable to the redeemed or exchanged Units over the amount such Unitholder received in respect of the redeemed Units or the value of the Units received in the exchange (the “Loss Disparity”); provided, however, that if such Disposition Loss is insufficient to cover all such allocations, it shall be allocated among such Unitholders in the ratio that the Loss Disparity of each such Unitholder bears to the sum of the Loss Disparities of all such Unitholders.
(vi) Disposition Loss that remains after the allocation pursuant to Section 6.3(b)(v) above shall be allocated first among all Unitholders whose Units’ tax capital accounts shall be in excess of their book capital accounts (after making the adjustments, other than adjustments resulting from the allocations to be made pursuant to this Section 6.3(b)(vi), described in Section 6.3(b)(i) above) in the ratio that each such Unitholder’s excess shall bear to all such Unitholders’ excesses.
(vii) Disposition Loss that remains after the allocation pursuant to Section 6.3(b)(vi) above shall be allocated to the Unitholders in the ratio that Unitholder’s book capital account bears to all Unitholders’ book capital accounts.
(c) The tax allocations prescribed by this Section 6.3 shall be made to each holder of a Unit whether or not the holder is a substituted Limited Owner. For purposes of this Section 6.3, tax allocations shall be made to the Managing Owner’s Units on a Unit-equivalent basis.
(d) The allocation of income and loss (and items thereof) for federal income tax purposes set forth in this Section 6.3 is intended to allocate taxable income and loss among Unitholders generally in the ratio and to the extent that net profit and net loss shall be allocated to such Unitholders under Section 6.2 so as to eliminate, to the extent possible, any disparity between a Unitholder’s book capital account and his tax capital account, consistent with the principles set forth in Sections 704(b) and (c)of the Code. Notwithstanding Section 6.3(b), if the allocations in Section 6.3(b)(ii) and 6.3(b)(v) fail to allocate Disposition Gain or Disposition Loss sufficient to eliminate the relevant Gain Disparity or Loss Disparity, the Managing Owner shall first allocate Disposition Gain or Disposition Loss in later periods to eliminate such Gain Disparity or Loss Disparity.
(e) Notwithstanding this Section 6.3, if after taking into account any distributions to be made with respect to such Unit for the relevant period pursuant to Section 6.4 herein, any allocation would produce a deficit in the book capital account of a Unit, the portion of such allocation that would create such a deficit shall instead be allocated pro rata to the book capital accounts of the other Units held by the same Unitholder (subject to the same limitation) and, as to any balance, shall be allocated pro rata to the book capital accounts of all the remaining Unitholders (subject to the same limitation).
SECTION 6.4 Allocation of Distributions. Initially, distributions shall be made by the Managing Owner, and the Managing Owner shall have sole discretion in determining the amount and frequency of distributions,
A-44
Table of Contents
other than redemptions, which the Trust shall make with respect to the Units; provided, however, that the Trust shall not make any distribution that violates the Delaware Statutory Trust Act. The aggregate distributions made in a Fiscal Year (other than distributions on termination, which shall be allocated in the manner described in Section 13.2) shall be made to the holders of record of Units in the ratio in which the number of Units held of record by each of them bears to the number of Units held of record by all of the Unitholders as of the record date of such distribution; provided, further, however, that any distribution made in respect of a Unit shall not exceed the book capital account for such Unit.
SECTION 6.5 Admissions of Unitholders; Transfers. For purposes of this Article VI, Unitholders shall be deemed admitted, and a tax and book capital account shall be established in respect of the Units acquired by such Unitholder or in respect of additional Units acquired by an existing Unitholder, as of the Business Day falling two (2) Business Days after the date on which such Unitholder’s Subscription Agreement or Exchange Request, as the case may be, is received, provided the Managing Owner shall have been in receipt of such Subscription Agreement or Exchange Request for at least two (2) Business Days, or in which the transfer of Units to such Unitholder is recognized, except that persons accepted as subscribers to the Trust pursuant to Section 3.2 shall be deemed admitted on the date determined pursuant to such Section. Any Unitholder shall provide the Managing Owner with a Subscription Agreement or Exchange Request, as the case may be, by 4:00 PM NYT. The Managing Owner, in its sole and absolute discretion, may change such notice requirement upon written notice to the Unitholder. Any Unitholder to whom a Unit had been transferred shall succeed to the tax and book capital accounts attributable to the Unit transferred.
SECTION 6.6 Liability for State and Local and Other Taxes. In the event that the Trust or any Series shall be separately subject to taxation by any state or local or by any foreign taxing authority, the Trust or the Series shall be obligated to pay such taxes to such jurisdiction. In the event that the Trust or the Series shall be required to make payments to any Federal, state or local or any foreign taxing authority in respect of any Unitholder’s allocable share of Trust income, the amount of such taxes shall be considered a loan by the Trust to such Unitholder, and such Unitholder shall be liable for, and shall pay to the Trust, any taxes so required to be withheld and paid over by the Trust within ten (10) days after the Managing Owner’s request therefor. Such Unitholder shall also be liable for (and the Managing Owner shall be entitled to redeem additional Units of the foreign Unitholder as necessary to satisfy) interest on the amount of taxes paid over by the Trust to the IRS or other taxing authority, from the date of the Managing Owner’s request for payment to the date of payment or the redemption, as the case may be, at the rate of two percent (2%) over the prime rate charged from time to time by U.S. Bank National Association. The amount, if any, payable by the Trust to the Unitholder in respect of its Units so redeemed, or in respect of any other actual distribution by the Trust to such Unitholder, shall be reduced by any obligations owed to the Trust by the Unitholder, including, without limitation, the amount of any taxes required to be paid over by the Trust to the IRS or other taxing authority and interest thereon as aforesaid. Amounts, if any, deducted by the Trust from any actual distribution or redemption payment to such Unitholder shall be treated as an actual distribution to such Unitholder for all purposes of this Trust Agreement.
ARTICLE VII
REDEMPTIONS
SECTION 7.1 Redemption of Units. The Unitholders recognize that the profitability of any Series depends upon long-term and uninterrupted investment of capital. It is agreed, therefore, that Series profits and gains may be automatically reinvested, and that distributions, if any, of profits and gains to the Unitholders will be on a limited basis. Nevertheless, the Unitholders contemplate the possibility that one or more of the Limited Owners may elect to realize and withdraw profits, or withdraw capital through the redemption of Units prior to the dissolution of a Series. In that regard and subject to the provisions of Section 4.2(h):
(a) Subject to the conditions set forth in this Article VII, each Limited Owner (or any permitted assignee thereof) shall have the right to redeem a Limited Unit or portion thereof on the Business Day falling two
A-45
Table of Contents
(2) Business Days following the date the Managing Owner is in receipt of an acceptable form of written notice of redemption for at least one (1) Business Day (a “Redemption Date”) to be received by the Managing Owner prior to 4:00 PM NYT in order for the redemption to be effective as of the next Business Day. The Managing Owner, in its sole and absolute discretion, may change the notice requirement upon written notice to such redeeming Unitholder. Units will be redeemed on a “first in, first out” basis based on time of receipt of redemption requests at a redemption price equal to the Net Asset Value of a Series per Unit calculated as of the Valuation Point immediately preceding the applicable Redemption Date. If a Unitholder (or permitted assignee thereof) is permitted to redeem any or all of his Units as of a date other than a Redemption Date, such adjustments in the determination and allocation among the Unitholders of Disposition Gain, Disposition Loss, Profits, Losses and items of income or deduction for tax accounting purposes shall be made as are necessary or appropriate to reflect and give effect to the redemption.
(b) The value of a Unit for purposes of redemption shall be the book capital account balance of such Unit at the Valuation Point immediately preceding the Redemption Date, less any amount owing by such Limited Owner (and his permitted assignee, if any) to the Trust pursuant to Sections 4.6(g), 5.3(h) or 6.6 of this Trust Agreement. If redemption of a Unit shall be requested by a permitted assignee, all amounts which shall be owed to the Trust under Sections 4.6(g), 5.3(h) or 6.6 hereof by the Unitholder of record, as well as all amounts which shall be owed by all permitted assignees of such Units, shall be deducted from the Net Asset Value of a Series of such Units upon redemption.
(c) The effective date of redemption shall be the Redemption Date, and payment of the value of the redeemed Units (except for Units redeemed as part of an Exchange as provided in Section 7.4) generally shall be made within seven (7) Business Days following the Redemption Date; provided, that all liabilities, contingent or otherwise, of the Trust or any Series in the Trust, except any liability to Unitholders on account of their Capital Contributions, have been paid or there remains property of the Series sufficient to pay them; and provided further, that under extraordinary circumstances as may be determined by the Managing Owner in its sole discretion, including, but not limited to, the inability to liquidate Commodity positions as of such Redemption Date, or default or delay in payments due the Trust from commodity brokers, banks or other Persons, or significant administrative hardship, the Trust may in turn delay payment to Limited Owners requesting redemption of Units of the proportionate part of the value of redeemed Units represented by the sums which are the subject of such default or delay, in which event payment for redemption of such Units will be made to Limited Owners as soon thereafter as is practicable. A Limited Owner may revoke his notice of intent to redeem on or prior to the Redemption Date by written instructions to the Managing Owner. If a Limited Owner revokes his notice of intent to redeem and thereafter wishes to redeem, such Limited Owner will be required to submit written notice thereof in accordance with Section 7.1(d) and will be redeemed on the first Redemption Date to occur after the Managing Owner shall have been in receipt of such written notice for at least one (1) Business Day; provided, however, that the Managing Owner must receive such written notice by 4:00 PM NYT in order for the redemption to be effective as of the next Business Day. The Managing Owner, in its sole and absolute discretion, may change such notice requirement upon written notice to such Limited Owner.
(d) A Limited Owner (or any permitted assignee thereof) wishing to redeem Units must provide the Managing Owner with written notice of his intent to redeem, which notice shall specify the name and address of the redeeming Limited Owner and the amount of Limited Units sought to be redeemed. The notice of redemption shall be in the form annexed to the Prospectus or in any other form acceptable to the Managing Owner and shall be mailed or delivered to the principal place of business of the Managing Owner. Such notice must include representations and warranties that the redeeming Limited Owner (or any permitted assignee thereof) is the lawful and beneficial owner of the Units to be redeemed and that such Units are not subject to any pledge or otherwise encumbered in any fashion. In certain circumstances, the Trust may require additional documents, such as, but not limited to, trust instruments, death certificates, appointments as executor or administrator or certificates of corporate authority. Limited Owners requesting redemption shall be notified in writing within seven (7) Business Days following the Redemption Date whether or not their Units will be redeemed, unless payment for the redeeming Units is made within that seven (7) Business Day period, in which case the notice of acceptance of the redemption shall not be required.
A-46
Table of Contents
(e) The Managing Owner may suspend temporarily any redemption for up to 30 days if the effect of such redemption, either alone or in conjunction with other redemptions, would be to impair the Trust’s ability to operate in pursuit of its objectives. The Managing Owner may also suspend temporarily any redemption for up to 30 days in the event of a natural disaster, force majeure, act of war, terrorism or other event which results in the closure of financial markets. In addition, the Managing Owner may mandatorily redeem Units pursuant to Section 4.2(h).
(f) Units that are redeemed shall be extinguished and shall not be retained or reissued by the Trust or any Series.
(g) Except as discussed above, all requests for redemption in proper form will be honored, and the Series’ positions will be liquidated to the extent necessary to discharge its liabilities on the Redemption Date.
SECTION 7.2 Redemption by the Managing Owner. Notwithstanding any provision in this Trust Agreement to the contrary, for so long as it shall act as the Trust’s Managing Owner, the Managing Owner shall not transfer or redeem any of its General Units to the extent that any such transfer or redemption would result in its having less than a one percent (1%) interest in the aggregate of all Series of the Trust.
SECTION 7.3 Redemption Fee. Limited Owners who redeem all or a portion of their Units in the Class 1 of any Series during the first twelve (12) months following the effective date of their purchase shall be subject to a redemption fee of up to 3.0% of the Net Asset Value at which they are redeemed; provided, however, that the amount of the redemption fee shall be reduced pro rata on a daily basis by approximately 1/365th each day following the end of the month in which the Limited Owner purchased such Units. This redemption fee will not be charged if a Limited Owner simultaneously exchanges the redeemed Units thereof for Units of aggregate equal value in another Series. Such redemption fees shall be payable to the Managing Owner.
SECTION 7.4 Exchange of Units. Units in one Series may be exchanged, without applicability of redemption fees, for Units of equivalent value of any other Series (an “Exchange”) on any Business Day, subject to the conditions on Redemptions in this Article VII, provided, however, that Units in the Class 1 or Class 2, as applicable, of a Series may only be exchanged with Units in the Class 1 or Class 2, as applicable, of another Series;provided,however, that Units in the Class 1 or Class 2, as applicable, of any non-Graham Series may be exchanged for Units in the Class 1 or Class 2, as applicable, of the Graham Series only if such Units were acquired through a Selling Agent which acts as a selling agent for the Graham Series. With respect to Limited Owners who Exchange all or a portion of their Class 1 Units of the Balanced Series, Winton Series, Campbell/Graham Series, Currency Series, Graham Series or Long/Short Commodity Series or their Class 1a Units of the Balanced Series for Class 1 Units of the Long Only Commodity Series or the Managed Futures Index Series on or before the end of twelve (12) full months following the effective date of the purchase of the Units being Exchanged, the Long Only Commodity Series or the Managed Futures Index Series, as applicable, shall charge such Limited Owners an exchange equalization fee for switching into the Long Only Commodity Series or the Managed Futures Index Series of 1.0% of the Net Asset Value at which such Units are Exchanged. Such exchange equalization fee shall be payable to the Managing Owner.
ARTICLE VIII
THE LIMITED OWNERS
SECTION 8.1 No Management or Control; Limited Liability. The Limited Owners shall not participate in the management or control of the Trust’s business nor shall they transact any business for the Trust or any Series thereof or have the power to sign for or bind the Trust or any Series thereof, said power being vested solely and exclusively in the Managing Owner. Except as provided in Section 8.3 hereof, no Limited Owner shall be bound by, or be personally liable for, the expenses, liabilities or obligations of the Trust in excess of his
A-47
Table of Contents
Capital Contribution plus his share of the Trust Estate of any Series in which such Limited Owners owns a Unit and profits remaining in the Series, if any. Except as provided herein, each Limited Unit owned by a Limited Owner shall be fully paid and no assessment shall be made against any Limited Owner. No salary shall be paid to any Limited Owner in his capacity as a Limited Owner, nor shall any Limited Owner have a drawing account or earn interest on his contribution.
SECTION 8.2 Rights and Duties. The Limited Owners shall have the following rights, powers, privileges, duties and liabilities:
(a) The Limited Owners shall have the right to obtain information of all things affecting the Trust (or any Series thereof in which it holds a Unit), provided that such is for a purpose reasonably related to the Limited Owner’s interest as a beneficial owner of the Trust, including, without limitation, such reports as are set forth in Article IX and such information as is set forth in Section 4.3(l) hereof. In the event that the Managing Owner neglects or refuses to produce or mail to a Limited Owner a copy of the information set forth in Section 4.3(l) hereof, the Managing Owner shall be liable to such Limited Owner for the costs, including reasonable attorney’s fees, incurred by such Limited Owner to compel the production of such information, and for any actual damages suffered by such Limited Owner as a result of such refusal or neglect; provided, however, it shall be a defense of the Managing Owner that the actual purpose of the Limited Owner’s request for such information was not reasonably related to the Limited Owner’s interest as a beneficial owner in the Trust (e.g., to secure such information in order to sell it, or to use the same for a commercial purpose unrelated to the participation of such Limited Owner in the Trust). The foregoing rights are in addition to, and do not limit, other remedies available to Limited Owners under federal or state law.
(b) The Limited Owners shall receive from the assets of the Series in which they hold Units, the share of the distributions provided for in this Trust Agreement in the manner and at the times provided for in this Trust Agreement.
(c) Except for the Limited Owners’ redemption rights set forth in Article VII hereof or upon a mandatory redemption effected by the Managing Owner pursuant to Section 4.2(h) hereof, Limited Owners shall have the right to demand the return of their capital account only upon the dissolution and winding up of the Series in which they hold Units and only to the extent of funds available therefor. In no event shall a Limited Owner be entitled to demand or receive property other than cash. Except with respect to Series, Class or Sub-Class differences, no Limited Owner shall have priority over any other Limited Owner either as to the return of capital or as to profits, losses or distributions. No Limited Owner shall have the right to bring an action for partition against the Trust.
(d) Limited Owners holding Units representing at least a majority (over 50%) in Net Asset Value of each affected Series (not including Units held by the Managing Owner and its Affiliates, including the commodity broker) voting separately as a class may vote to (i) continue the Trust as provided in Section 13.1(b), (ii) approve the voluntary withdrawal of the Managing Owner and elect a successor Managing Owner as provided in Section 4.10, (iii) remove the Managing Owner on reasonable prior written notice to the Managing Owner, (iv) elect and appoint one or more additional Managing Owners, (v) approve a material change in the trading policies of a Series, or the brokerage fees paid by a Series, as set forth in the Prospectus, which change shall not be effective without the prior written approval of such majority, (vi) approve the termination of any agreement entered into between the Trust and the Managing Owner or any Affiliate of the Managing Owner for any reason, without penalty, (vii) approve amendments to this Trust Agreement as set forth in Section 11.1 hereof, and (viii) terminate the Series as provided in Section 13.1(g), and in the case of (iv), (v) and (vi) in each instance on sixty (60) days’ prior written notice.
Except as set forth above, the Limited Owners shall have no voting or other rights with respect to the Trust. Prior to the exercise by the Limited Owners of the rights set forth in Section 8.2(d), the Trust will, if practicable, provide the Limited Owners with an opinion of independent legal counsel in each state where the Trust may be
A-48
Table of Contents
deemed to be conducting its business with respect to whether or not such exercise would constitute such participation in the control of the Trust business as would adversely affect the Limited Owners limited liability under the laws of such state.
SECTION 8.3 Limitation on Liability.
(a) Except as provided in Sections 4.6(g), 5.3(h) and 6.6 hereof, and as otherwise provided under Delaware law, the Limited Owners shall be entitled to the same limitation of personal liability extended to stockholders of private corporations for profit organized under the general corporation law of Delaware and no Limited Owner shall be liable for claims against, or debts of the Trust in excess of his Capital Contribution to the Trust and his share of the Trust Estate and undistributed profits, except in the event that the liability is founded upon misstatements or omissions contained in such Limited Owner’s Subscription Agreement delivered in connection with his purchase of Units. In addition, and subject to the exceptions set forth in the immediately preceding sentence, the Trust shall not make a claim against a Limited Owner with respect to amounts distributed to such Limited Owner or amounts received by such Limited Owner upon redemption unless, under Delaware law, such Limited Owner is liable to repay such amount.
(b) The Trust shall indemnify, on a pro rata basis among Series, to the full extent permitted by law and the other provisions of this Agreement, and to the extent of the Trust Estate, each Limited Owner (excluding the Managing Owner to the extent of its ownership of any Limited Units) against any claims of liability asserted against such Limited Owner solely because he is a beneficial owner of one or more Series’ Units (other than for taxes for which such Limited Owner is liable under Section 6.6 hereof).
(c) Every written note, bond, contract, instrument, certificate or undertaking made or issued by the Managing Owner shall give notice to the effect that the same was executed or made by or on behalf of the Trust and that the obligations of such instrument are not binding upon the Limited Owners individually but are binding only upon the assets and property of the Trust, and no resort shall be had to the Limited Owners’ personal property for satisfaction of any obligation or claim thereunder, and appropriate references may be made to this Trust Agreement and may contain any further recital which the Managing Owner deems appropriate, but the omission thereof shall not operate to bind the Limited Owners individually or otherwise invalidate any such note, bond, contract, instrument, certificate or undertaking. Nothing contained in this Section 8.3 shall diminish the limitation on the liability of each Series to the extent set forth in Section 3.6 and 3.7 hereof.
ARTICLE IX
BOOKS OF ACCOUNT AND REPORTS
SECTION 9.1 Books of Account. Proper books of account for the Trust and each Series shall be kept and shall be audited annually by an independent certified public accounting firm selected by the Managing Owner in its sole discretion, and there shall be entered therein all transactions, matters and things relating to the Trust’s business as are required by the CE Act and regulations promulgated thereunder, and all other applicable rules and regulations, and as are usually entered into books of account kept by Persons engaged in a business of like character. The books of account shall be kept at the principal office of the Trust and each Limited Owner (or any duly constituted designee of a Limited Owner) shall have, at all times during normal business hours, free access to and the right to inspect and copy the same for any purpose reasonably related to the Limited Owner’s interest as a beneficial owner of any Series, including such access as is required under CFTC rules and regulations. Such books of account shall be kept, and the Trust shall report its Profits and Losses on, the accrual method of accounting for financial accounting purposes on a Fiscal Year basis as described in Article X.
SECTION 9.2 Annual Reports and Monthly Statements.
(a) Each Limited Owner shall be furnished with an annual report within 120 days after the close of the fiscal year containing the following information: (i) a balance sheet as of the end of the Fiscal Year and
A-49
Table of Contents
statements of income and Limited Owners’ equity and cash flows for the year then ended, all of which shall be prepared in accordance with GAAP and accompanied by an auditor’s report containing an opinion of an independent certified public accountant or independent public accountant, (ii) a statement showing the total fees, compensation, brokerage commissions and expenses paid by the Trust, segregated as to type, and stated both in aggregate dollar term and as a percentage of Net Asset Value, (iii) the average round turn rate for the Fiscal Year.
(b) Each Limited Owner shall be furnished as of the end of each month and as of the end of each Fiscal Year with (i) such reports (in such detail) as are required to be given to Limited Owners by the CFTC and the NFA, (ii) any other reports (in such detail) required by any other governmental authority which has jurisdiction over the activities of the Trust and (iii) any other reports or information which the Managing Owner, in its discretion, determines to be necessary or appropriate.
(c) The Managing Owner shall ensure the calculation of the Net Asset Value of the Trust daily and shall make available upon the request of a Limited Owner, the Net Asset Value per Series per Unit.
SECTION 9.3 Tax Information. Appropriate tax information (adequate to enable each Limited Owner to complete and file his federal tax return) shall be delivered to each Limited Owner as soon as practicable following the end of each Fiscal Year but generally no later than March 15.
SECTION 9.4 Calculation of Net Asset Value of a Series. Net Asset Value of a Series will be estimated as required. Upon request, on any Business Day, the Managing Owner shall make available to any Limited Owner the estimated Net Asset Value of a Series per Unit. Each Limited Owner shall be notified of any decline in the estimated Net Asset Value of a Series per Unit to less than 50% of the Net Asset Value of a Series per Unit as of the preceding Valuation Point within seven (7) Business Days of such occurrence. Included in such notification shall be a description of the Limited Owners’ voting rights as set forth in Section 8.2 hereof.
SECTION 9.5 Other Reports. The Managing Owner shall send such other reports and information, if any, to the Limited Owners as it may deem necessary or appropriate. Each Limited Owner shall be notified of (a) any material change in the terms of the Advisory Agreement, including any change in the Trading Advisor or any modification in connection with the method of calculating the incentive fee; (b) any change of Trustee; (c) any other material change affecting the compensation of any party within seven (7) Business Days of such occurrence; and (d) a description of any material effect on the Units such changes may have. Included in such notification shall be a description of the Limited Owners’ voting rights as set forth in Section 8.2 hereof and redemption rights as set forth in Section 7.1 hereof. In addition, the Managing Owner shall submit to the Securities Administrator of any State having jurisdiction over the Trust any information required to be filed with such Administrator, including, but not limited to, reports and statements required to be distributed to the Limited Owners.
SECTION 9.6 Maintenance of Records. The Managing Owner shall maintain (a) for a period of at least eight (8) Fiscal Years all books of account required by Section 9.1 hereof; a list of the names and last known address of, and number of Units owned by, all Unitholders, a copy of the Certificate of Trust and all certificates of amendment thereto, together with executed copies of any powers of attorney pursuant to which any certificate has been executed; copies of the Series’ federal, state and local income tax returns and reports, if any; and a record of the information obtained to indicate that a Limited Owner meets the investor suitability standards set forth in the Prospectus, and (b) for a period of at least six (6) Fiscal Years copies of any effective written trust agreements, subscription agreements and any financial statements of the Trust.
SECTION 9.7 Certificate of Trust. Except as otherwise provided in the Delaware Statutory Trust Act or this Trust Agreement, the Managing Owner shall not be required to mail a copy of any Certificate of Trust filed with the Secretary of State of the State of Delaware to each Limited Owner; however, such certificates shall be maintained at the principal office of the Trust and shall be available for inspection and copying by the Limited Owners in accordance with this Trust Agreement. The Certificate of Trust shall not be amended in any respect if the effect of such amendment is to diminish the limitation on interseries liability under Section 3804 of the Delaware Statutory Trust Act.
A-50
Table of Contents
SECTION 9.8 Registration of Units. Subject to Section 4.3(l) hereof, the Managing Owner shall keep, at the Trust’s principal place of business, a Unit Register in which, subject to such reasonable regulations as it may provide, it shall provide for the registration of Units and of transfers of Units. Subject to the provisions of Article V, the Managing Owner may treat the Person in whose name any Unit shall be registered in the Unit Register as the Unitholder of such Unit for the purpose of receiving distributions pursuant to Article VI and for all other purposes whatsoever.
ARTICLE X
FISCAL YEAR
SECTION 10.1 Fiscal Year. The fiscal year of the Trust (“Fiscal Year”) shall begin on the 1st day of January and end on the 31st day of December of each year. The first Fiscal Year shall commence on August 8, 2003, and end on the 31st day of December, 2003.
ARTICLE XI
AMENDMENT OF TRUST AGREEMENT; MEETINGS
SECTION 11.1 Amendments to the Trust Agreement.
(a) Amendments to this Trust Agreement may be proposed by the Managing Owner or by Limited Owners holding Units equal to at least ten percent (10%) of the Net Asset Value of each Series of the Trust, unless the proposed amendment affects only certain Series, in which case such amendment may be proposed by Limited Owners holding Units equal to at least ten percent (10%) of Net Asset Value of a Series of each affected Series. Following such proposal, the Managing Owner shall submit to the Limited Owners of each affected Series a verbatim statement of any proposed amendment, and statements concerning the legality of such amendment and the effect of such amendment on the limited liability of the Limited Owners. The Managing Owner shall include in any such submission its recommendations as to the proposed amendment. The amendment shall become effective only upon the written approval or affirmative vote of Limited Owners holding Units equal to at least a majority (over 50%) of the Net Asset Value of a Series (excluding Units held by the Managing Owner and its Affiliates) of the Trust or, if the proposed amendment affects only certain Series, of each affected Series, or such higher percentage as may be required by applicable law, and upon receipt of an opinion of independent legal counsel as set forth in Section 8.2 hereof and to the effect that the amendment is legal, valid and binding and will not adversely affect the limitations on liability of the Limited Owners as described in Section 8.3 of this Trust Agreement. Notwithstanding the foregoing, where any action taken or authorized pursuant to any provision of this Trust Agreement requires the approval or affirmative vote of Limited Owners holding a greater interest in Limited Units than is required to amend this Trust Agreement under this Section 11.1, and/or the approval or affirmative vote of the Managing Owners, an amendment to such provision(s) shall be effective only upon the written approval or affirmative vote of the minimum number of Unitholders which would be required to take or authorize such action, or as may otherwise be required by applicable law, and upon receipt of an opinion of independent legal counsel as set forth above in this Section 11.1. In addition, except as otherwise provided below, reduction of the capital account of any assignee or modification of the percentage of Profits, Losses or distributions to which an assignee is entitled hereunder shall not be affected by amendment to this Trust Agreement without such assignee’s approval.
(b) Notwithstanding any provision to the contrary contained in Section 11.1(a) hereof, the Managing Owner may, without the approval of the Limited Owners, make such amendments to this Trust Agreement which (i) are necessary to add to the representations, duties or obligations of the Managing Owner or surrender any right or power granted to the Managing Owner herein, for the benefit of the Limited Owners, (ii) are necessary to cure any ambiguity, to correct or supplement any provision herein which may be inconsistent with any other
A-51
Table of Contents
provision herein or in the Prospectus, or to make any other provisions with respect to matters or questions arising under this Trust Agreement or the Prospectus which will not be inconsistent with the provisions of the Trust Agreement or the Prospectus, or (iii) the Managing Owner deems advisable, provided, however, that no amendment shall be adopted pursuant to this clause (iii) unless the adoption thereof (A) is not adverse to the interests of the Limited Owners; (B) is consistent with Section 4.1 hereof; (C) except as otherwise provided in Section 11.1(c) below, does not affect the allocation of Profits and Losses among the Limited Owners or between the Limited Owners and the Managing Owner; and (D) does not adversely affect the limitations on liability of the Limited Owners, as described in Article VIII hereof or the status of the each Series as a partnership for federal income tax purposes.
(c) Notwithstanding any provision to the contrary contained in Sections 11.1(a) and (b) hereof, the Managing Owner may, without the approval of the Limited Owners, amend the provisions of Article VI of this Trust Agreement relating to the allocations of Profits, Losses, Disposition Gain, Disposition Loss and distributions among the Unitholders if the Trust is advised at any time by the Trust’s accountants or legal counsel that the allocations provided in Article VI of this Trust Agreement are unlikely to be respected for federal income tax purposes, either because of the promulgation of new or revised Treasury Regulations under Section 704 of the Code or other developments in the law. The Managing Owner is empowered to amend such provisions to the minimum extent necessary in accordance with the advice of the accountants and counsel to effect the allocations and distributions provided in this Trust Agreement. New allocations made by the Managing Owner in reliance upon the advice of the accountants or counsel described above shall be deemed to be made pursuant to the obligation of the Managing Owner to the Trust and the Limited Owners, and no such new allocation shall give rise to any claim or cause of action by any Limited Owner.
(d) Upon amendment of this Trust Agreement, the Certificate of Trust shall also be amended, if required by the Delaware Statutory Trust Act, to reflect such change.
(e) No amendment shall be made to this Trust Agreement without the consent of the Trustee if such amendment adversely affects any of the rights, duties or liabilities of the Trustee; provided, however, that the Trustee may not withhold its consent for any action which the Limited Owners are permitted to take under Section 8.2(d) above. The Trustee shall execute and file any amendment to the Certificate of Trust if so directed by the Managing Owner or if such amendment is required in the opinion of the Trustee.
(f) No provision of this Agreement may be amended, waived or otherwise modified orally but only by a written instrument adopted in accordance with this Section.
SECTION 11.2 Meetings of the Trust. Meetings of the Unitholders of the Trust or any Series thereof may be called by the Managing Owner and will be called by it upon the written request of Limited Owners holding Units equal to at least ten percent (10%) of the Net Asset Value of a Series of the Trust or any Series thereof. Such call for a meeting shall be deemed to have been made upon the receipt by the Managing Owner of a written request from the requisite percentage of Limited Owners. The Managing Owner shall deposit in the United States mails, within fifteen (15) days after receipt of said request, written notice to all Unitholders of the Trust or any Series thereof of the meeting and the purpose of the meeting, which shall be held on a date, not less than thirty (30) nor more than sixty (60) days after the date of mailing of said notice, at a reasonable time and place. Any notice of meeting shall be accompanied by a description of the action to be taken at the meeting and an opinion of independent counsel as to the effect of such proposed action on the liability of Limited Owners for the debts of the Trust. Unitholders may vote in person or by proxy at any such meeting.
SECTION 11.3 Action Without a Meeting. Any action required or permitted to be taken by Unitholders by vote may be taken without a meeting by written consent setting forth the actions so taken. Such written consents shall be treated for all purposes as votes at a meeting. If the vote or consent of any Unitholder to any action of the Trust or any Unitholder, as contemplated by this Agreement, is solicited by the Managing Owner, the solicitation shall be effected by notice to each Unitholder given in the manner provided in Section 15.4. The
A-52
Table of Contents
vote or consent of each Unitholder so solicited shall be deemed conclusively to have been cast or granted as requested in the notice of solicitation, whether or not the notice of solicitation is actually received by that Unitholder, unless the Unitholder expresses written objection to the vote or consent by notice given in the manner provided in Section 15.4 below and actually received by the Trust within 20 days after the notice of solicitation is effected. The Managing Owner and all persons dealing with the Trust shall be entitled to act in reliance on any vote or consent which is deemed cast or granted pursuant to this Section and shall be fully indemnified by the Trust in so doing. Any action taken or omitted in reliance on any such deemed vote or consent of one or more Unitholders shall not be void or voidable by reason of timely communication made by or on behalf of all or any of such Unitholders in any manner other than as expressly provided in Section 15.4.
ARTICLE XII
TERM
SECTION 12.1 Term. The term for which the Trust and each Series is to exist shall commence on the date of the filing of the Certificate of Trust, and shall expire on December 31, 2053, unless sooner terminated pursuant to the provisions of Article XIII hereof or as otherwise provided by law.
ARTICLE XIII
TERMINATION
SECTION 13.1 Events Requiring Dissolution of the Trust or any Series. The Trust or, as the case may be, any Series thereof shall dissolve at any time upon the happening of any of the following events:
(a) The expiration of the Trust term as provided in Article XII hereof.
(b) The filing of a certificate of dissolution or revocation of the Managing Owner’s charter (and the expiration of ninety (90) days after the date of notice to the Managing Owner of revocation without a reinstatement of its charter) or upon the withdrawal, removal, adjudication or admission of bankruptcy or insolvency of the Managing Owner (each of the foregoing events an “Event of Withdrawal”) unless (i) at the time there is at least one remaining Managing Owner and that remaining Managing Owner carries on the business of the Trust or (ii) within ninety (90) days of such Event of Withdrawal all the remaining Unitholders agree in writing to continue the business of the Trust and to select, effective as of the date of such event, one or more successor Managing Owners. If the Trust is terminated as the result of an Event of Withdrawal and a failure of all remaining Unitholders to continue the business of the Trust and to appoint a successor Managing Owner as provided in clause (b)(ii) above, within one hundred twenty (120) days of such Event of Withdrawal, Limited Owners holding Units representing at least a majority (over 50%) of the Net Asset Value of each Series (not including Units held by the Managing Owner and its Affiliates) may elect to continue the business of the Trust thereof by forming a new statutory trust (the “Reconstituted Trust”) on the same terms and provisions as set forth in this Trust Agreement (whereupon the parties hereto shall execute and deliver any documents or instruments as may be necessary to reform the Trust). Any such election must also provide for the election of a Managing Owner to the Reconstituted Trust. If such an election is made, all Limited Owners of the Trust shall be bound thereby and continue as Limited Owners of the Reconstituted Trust.
(c) The occurrence of any event which would make unlawful the continued existence of the Trust or any Series thereof, as the case may be.
(d) With respect to the Trust, the failure to sell the Subscription Minimums of all Series or, with respect to a Series, the failure to sell the Subscription Minimum during the Initial Offering Period.
A-53
Table of Contents
(e) In the event of the suspension, revocation or termination of the Managing Owner’s registration as a commodity pool operator under the CE Act, or membership as a commodity pool operator with the NFA unless at the time there is at least one remaining Managing Owner whose registration or membership has not been suspended, revoked or terminated.
(f) The Trust or, as the case may be, any Series becomes insolvent or bankrupt.
(g) The Limited Owners holding Units representing at least a majority (over 50%) of the Net Asset Value of a Series (which excludes the Units of the Managing Owner) vote to dissolve the Series, notice of which is sent to the Managing Owner not less than ninety (90) Business Days prior to the effective date of such Series’ termination.
(h) The Limited Owners of each Series holding Units representing at least a majority (over 50%) of the Net Asset Value of the Series (which excludes the Units of the Managing Owner) vote to dissolve the Trust, notice of which is sent to the Managing Owner not less than ninety (90) Business Days prior to the effective date of such terminations.
(i) The decline of the Net Asset Value of a Series of the Trust Estate by fifty percent (50%) from the Net Asset Value of a Series of the Trust Estate (i) at the commencement of the Series’ trading activities or (ii) on the first day of a fiscal year, in each case after appropriate adjustment for distributions, additional capital contributions and redemptions.
(j) The determination of the Managing Owner that the Series’ aggregate net assets in relation to the operating expenses of the Series make it unreasonable or imprudent to continue the business of the Series.
The death, legal disability, bankruptcy, insolvency, dissolution, or withdrawal of any Limited Owner (as long as such Limited Owner is not the sole Limited Owner of the Trust) shall not result in the termination of the Trust or any Series thereof, and such Limited Owner, his estate, custodian or personal representative shall have no right to withdraw or value such Limited Owner’s Units except as provided in Section 7.1 hereof. Each Limited Owner (and any assignee thereof) expressly agrees that in the event of his death, he waives on behalf of himself and his estate, and he directs the legal representative of his estate and any person interested therein to waive the furnishing of any inventory, accounting or appraisal of the assets of the Series in which they own a Unit and any right to an audit or examination of the books of the Series in which they own a Unit, except for such rights as are set forth in Article IX hereof relating to the Books of Account and reports of the Series.
SECTION 13.2 Distributions on Dissolution. Upon the dissolution of the Trust or any Series, the Managing Owner (or in the event there is no Managing Owner, such person (the “Liquidating Trustee”) as the majority in interest of the Limited Owners may propose and approve) shall take full charge of the Trust’s or Series’ assets and liabilities. Any Liquidating Trustee so appointed shall have and may exercise, without further authorization or approval of any of the parties hereto, all of the powers conferred upon the Managing Owner under the terms of this Trust Agreement, subject to all of the applicable limitations, contractual and otherwise, upon the exercise of such powers, and provided that the Liquidating Trustee shall not have general liability for the acts, omissions, obligations and expenses of the Trust. Thereafter, the business and affairs of the Trust or Series shall be wound up and all assets shall be liquidated as promptly as is consistent with obtaining the fair value thereof, and the proceeds therefrom shall be applied and distributed in the following order of priority: (a) to the expenses of liquidation and termination and to creditors, including Unitholders who are creditors, to the extent otherwise permitted by law, in satisfaction of liabilities of the Trust or Series of the Trust (whether by payment or the making of reasonable provision for payment thereof) other than liabilities for distributions to Unitholders, and (b) to the Managing Owner and each Limited Owner pro rata in accordance with his positive book capital account balance, less any amount owing by such Unitholder to the Trust or Series, after giving effect to all adjustments made pursuant to Article VI and all distributions theretofore made to the Unitholders pursuant to Article VI. After the distribution of all remaining assets of the Trust or Series, the Managing Owner will
A-54
Table of Contents
contribute to the Trust or Series an amount equal to the lesser of (i) the deficit balance, if any, in its book capital account, and (ii) the excess of 1.01% of the total Capital Contributions of the Limited Owners over the capital previously contributed by the Managing Owner. Any Capital Contributions made by the Managing Owner pursuant to this Section shall be applied first to satisfy any amounts then owed by the Trust or Series to its creditors, and the balance, if any, shall be distributed to those Unitholders in the Trust or Series whose book capital account balances (immediately following the distribution of any liquidation proceeds) were positive, in proportion to their respective positive book capital account balances.
SECTION 13.3 Termination; Certificate of Cancellation. Following the dissolution and distribution of the assets of all Series of the Trust, the Trust shall terminate and Managing Owner or Liquidating Trustee, as the case may be, shall execute and cause such certificate of cancellation of the Certificate of Trust to be filed in accordance with the Delaware Statutory Trust Act. Notwithstanding anything to the contrary contained in this Trust Agreement, the existence of the Trust as a separate legal entity shall continue until the filing of such certificate of cancellation.
ARTICLE XIV
POWER OF ATTORNEY
SECTION 14.1 Power of Attorney Executed Concurrently. Concurrently with the written acceptance and adoption of the provisions of this Trust Agreement, each Limited Owner shall execute and deliver to the Managing Owner a Power of Attorney as part of the Subscription Agreement, or in such other form as may be prescribed by the Managing Owner. Each Limited Owner, by its execution and delivery hereof, irrevocably constitutes and appoints the Managing Owner and its officers and directors, with full power of substitution, as the true and lawful attorney-in-fact and agent for such Limited Owner with full power and authority to act in his name and on his behalf in the execution, acknowledgment, filing and publishing of Trust documents, including, but not limited to, the following:
(a) Any certificates and other instruments, including but not limited to, any applications for authority to do business and amendments thereto, which the Managing Owner deems appropriate to qualify or continue the Trust as a statutory trust in the jurisdictions in which the Trust may conduct business, so long as such qualifications and continuations are in accordance with the terms of this Trust Agreement or any amendment hereto, or which may be required to be filed by the Trust or the Unitholders under the laws of any jurisdiction;
(b) Any instrument which may be required to be filed by the Trust under the laws of any state or by any governmental agency, or which the Managing Owner deems advisable to file; and
(c) This Trust Agreement and any documents which may be required to effect an amendment to this Trust Agreement approved under the terms of the Trust Agreement, and the continuation of the Trust, the admission of the signer of the Power of Attorney as a Limited Owner or of others as additional or substituted Limited Owners, or the termination of the Trust, provided such continuation, admission or termination is in accordance with the terms of this Trust Agreement.
SECTION 14.2 Effect of Power of Attorney. The Power of Attorney concurrently granted by each Limited Owner to the Managing Owner:
(a) Is a special, irrevocable Power of Attorney coupled with an interest, and shall survive and not be affected by the death, disability, dissolution, liquidation, termination or incapacity of the Limited Owner;
(b) May be exercised by the Managing Owner for each Limited Owner by a facsimile signature of one of its officers or by a single signature of one of its officers acting as attorney-in-fact for all of them; and
A-55
Table of Contents
(c) Shall survive the delivery of an assignment by a Limited Owner of the whole or any portion of his Limited Units; except that where the assignee thereof has been approved by the Managing Owner for admission to the Trust as a substituted Limited Owner, the Power of Attorney of the assignor shall survive the delivery of such assignment for the sole purpose of enabling the Managing Owner to execute, acknowledge and file any instrument necessary to effect such substitution. Each Limited Owner agrees to be bound by any representations made by the Managing Owner and by any successor thereto, determined to be acting in good faith pursuant to such Power of Attorney and not constituting negligence or misconduct.
SECTION 14.3 Limitation on Power of Attorney. The Power of Attorney concurrently granted by each Limited Owner to the Managing Owner shall not authorize the Managing Owner to act on behalf of Limited Owners in any situation in which this Trust Agreement requires the approval of Limited Owners unless such approval has been obtained as required by this Trust Agreement. In the event of any conflict between this Trust Agreement and any instruments filed by the Managing Owner or any new Managing Owner pursuant to this Power of Attorney, this Trust Agreement shall control.
ARTICLE XV
MISCELLANEOUS
SECTION 15.1 Governing Law. The validity and construction of this Trust Agreement and all amendments hereto shall be governed by the laws of the State of Delaware, and the rights of all parties hereto and the effect of every provision hereof shall be subject to and construed according to the laws of the State of Delaware without regard to the conflict of laws provisions thereof; provided, however, that causes of action for violations of federal or state securities laws shall not be governed by this Section 15.1, and provided, further, that the parties hereto intend that the provisions hereof shall control over any contrary or limiting statutory or common law of the State of Delaware (other than the Delaware Statutory Trust Act) and that, to the maximum extent permitted by applicable law, there shall not be applicable to the Trust, the Trustee, the Managing Owner, the Unitholders or this Trust Agreement any provision of the laws (statutory or common) of the State of Delaware (other than the Delaware Statutory Trust Act) pertaining to trusts which relate to or regulate in a manner inconsistent with the terms hereof: (a) the filing with any court or governmental body or agency of trustee accounts or schedules of trustee fees and charges, (b) affirmative requirements to post bonds for trustees, officers, agents, or employees of a trust, (c) the necessity for obtaining court or other governmental approval concerning the acquisition, holding or disposition of real or personal property, (d) fees or other sums payable to trustees, officers, agents or employees of a trust, (e) the allocation of receipts and expenditures to income or principal, (f) restrictions or limitations on the permissible nature, amount or concentration of trust investments or requirements relating to the titling, storage or other manner of holding of trust assets, or (g) the establishment of fiduciary or other standards or responsibilities or limitations on the acts or powers of trustees or managers that are inconsistent with the limitations on liability or authorities and powers of the Trustee or the Managing Owner set forth or referenced in this Trust Agreement. Section 3540 of Title 12 of the Delaware Code shall not apply to the Trust. The Trust shall be of the type commonly called a “statutory trust,” and without limiting the provisions hereof, the Trust may exercise all powers that are ordinarily exercised by such a trust under Delaware law. The Trust specifically reserves the right to exercise any of the powers or privileges afforded to statutory trusts and the absence of a specific reference herein to any such power, privilege or action shall not imply that the Trust may not exercise such power or privilege or take such actions.
SECTION 15.2 Provisions In Conflict With Law or Regulations.
(a) The provisions of this Trust Agreement are severable, and if the Managing Owner shall determine, with the advice of counsel, that any one or more of such provisions (the “Conflicting Provisions”) are in conflict with the Code, the Delaware Statutory Trust Act or other applicable federal or state laws, the Conflicting Provisions shall be deemed never to have constituted a part of this Trust Agreement, even without any amendment of this Trust Agreement pursuant to this Trust Agreement; provided, however, that such
A-56
Table of Contents
determination by the Managing Owner shall not affect or impair any of the remaining provisions of this Trust Agreement or render invalid or improper any action taken or omitted prior to such determination. No Managing Owner or Trustee shall be liable for making or failing to make such a determination.
(b) If any provision of this Trust Agreement shall be held invalid or unenforceable in any jurisdiction, such holding shall not in any manner affect or render invalid or unenforceable such provision in any other jurisdiction or any other provision of this Trust Agreement in any jurisdiction.
SECTION 15.3 Construction. In this Trust Agreement, unless the context otherwise requires, words used in the singular or in the plural include both the plural and singular and words denoting any gender include all genders. The title and headings of different parts are inserted for convenience and shall not affect the meaning, construction or effect of this Trust Agreement.
SECTION 15.4 Notices. All notices or communications under this Trust Agreement (other than requests for redemption of Units, notices of assignment, transfer, pledge or encumbrance of Units, and reports and notices by the Managing Owner to the Limited Owners) shall be in writing and shall be effective upon personal delivery, or if sent by mail, postage prepaid, or if sent electronically, by facsimile or by overnight courier; and addressed, in each such case, to the address set forth in the books and records of the Trust or such other address as may be specified in writing, of the party to whom such notice is to be given, upon the deposit of such notice in the United States mail, upon transmission and electronic confirmation thereof or upon deposit with a representative of an overnight courier, as the case may be. Requests for redemption, notices of assignment, transfer, pledge or encumbrance of Units shall be effective upon timely receipt by the Managing Owner in writing.
SECTION 15.5 Counterparts. This Trust Agreement may be executed in several counterparts, and all so executed shall constitute one agreement, binding on all of the parties hereto, notwithstanding that all the parties are not signatory to the original or the same counterpart.
SECTION 15.6 Binding Nature of Trust Agreement. The terms and provisions of this Trust Agreement shall be binding upon and inure to the benefit of the heirs, custodians, executors, estates, administrators, personal representatives, successors and permitted assigns of the respective Unitholders. For purposes of determining the rights of any Unitholder or assignee hereunder, the Trust and the Managing Owner may rely upon the Trust records as to who are Unitholders and permitted assignees, and all Unitholders and assignees agree that the Trust and the Managing Owner, in determining such rights, shall rely on such records and that Limited Owners and assignees shall be bound by such determination.
SECTION 15.7 No Legal Title to Trust Estate. The Unitholders shall not have legal title to any part of the Trust Estate.
SECTION 15.8 Creditors. No creditors of any Unitholders shall have any right to obtain possession of, or otherwise exercise legal or equitable remedies with respect to the Trust Estate.
SECTION 15.9 Integration. This Trust Agreement constitutes the entire agreement among the parties hereto pertaining to the subject matter hereof and supersedes all prior agreements and understandings pertaining thereto.
A-57
Table of Contents
IN WITNESS WHEREOF, the undersigned have duly executed this Declaration of Trust and Trust Agreement as of the day and year first above written.
| WILMINGTON TRUST COMPANY, | ||
as Trustee | ||
By: |
| |
Name: | ||
Title: | ||
| EQUINOX FUND MANAGEMENT, LLC, | ||
as Managing Owner | ||
By: |
| |
Name: | ||
Title: | ||
| All Limited Owners now and hereafter admitted as Limited Owners of the Trust, pursuant to powers of attorney now and hereafter executed in favor of, and granted and delivered to, the Managing Owner | ||
By: |
| |
| Attorney-in fact |
A-58
Table of Contents
EXHIBIT A-1
CERTIFICATE OF TRUST
OF
THE FRONTIER FUND
This Certificate of Trust is filed in accordance with the provisions of the Delaware Statutory Trust Act (12 Del. C. Section 3801 et seq.) and sets forth the following:
FIRST: The name of the trust is The Frontier Fund (the “Trust”).
SECOND: The name and the business address of the Delaware trustee is Wilmington Trust Company, 1100 N. Market Street, Rodney Square North, Wilmington, Delaware 19805.
THIRD: Pursuant to Section 3806(b)(2) of the Delaware Statutory Trust Act, the Trust shall issue one or more series of beneficial interests having the rights, powers and duties as set forth in the Declaration of Trust and Trust Agreement of the Trust dated August 8, 2003`, as the same may be amended from time to time (each a “Series”).
FOURTH: Notice of Limitation of Liability of each Series: Pursuant to Section 3804 of the Delaware Statutory Trust Act, there shall be a limitation on liability of each particular Series such that the debts, liabilities, claims, obligations and expenses incurred, contracted for or otherwise existing with respect to, in connection with or arising under a particular Series shall be enforceable against the assets of that Series only, and not against the assets of the Trust generally or the assets of any other Series.
| WILMINGTON TRUST COMPANY, Trustee | ||
By |
| |
A-59
Table of Contents
THE FRONTIER FUND
SUBSCRIPTION INFORMATION
All capitalized and other defined terms used herein and not expressly defined herein shall have the same respective meaning as are assigned such terms in the final prospectus and disclosure document of The Frontier Fund (the “Trust”) and each Series thereof, as the same may at any time and from time to time be amended or supplemented (the “Prospectus”).
| 1. | REPRESENTATIONS AND WARRANTIES |
I (we) hereby represent and warrant to the Managing Owner and the Trust as follows:
| (1) | I (we) satisfy one of the following financial standards outlined below for subscription in the Trust. I (we) am (are) not acting on behalf of a Plan and I (we) have either (A) a net worth (exclusive of home, home furnishings, and automobiles) of at least $150,000 or (B) a net worth (similarly calculated) of at least $45,000 and an annual gross income of at least $45,000 and not more than 10% of my net worth is invested in the Trust. If I (we) am (are) acting on behalf of a Plan that is an IRA or a Keogh Plan which covers no common law employees or a Plan that is not subject to ERISA, each Participant meets and, if I (we) am (are) a participant in such a Plan, it meets the net worth and gross income requirement in (A) or (B) above, and not more than 10% of my net worth is invested in the Trust. If I (we) am (are) acting on behalf of a Plan subject to ERISA, the assets of the Plan are at least $150,000 and its investment in the Trust does not exceed 10% of the assets of such Plan at the time of investment. If I (we) am (are) a resident(s) of one of those states listed under “State Suitability Requirements”, I (we) meet the more restrictive suitability requirements imposed by the State in which I (we) reside and not more than 10% of my net worth is invested in the Trust. |
| (2) | The address set forth on the signature page of this Subscription Agreement is my (our) true and correct address and I (we) have no present intention of becoming a resident of any other state or country. The information provided under that caption is true, correct, and complete as of the date of this Subscription Agreement and if there should be any material change in such information prior to my (our) admission to the Trust as a Limited Owner, I (we) will immediately furnish such revised or corrected information to the Managing Owner. I (we) will furnish the Managing Owner with such other documents as it may request to evaluate this subscription. |
| (3) | If I (we) am (are) an individual(s), I (we) am (are) over 21 years old and am (are) legally competent and am (are) permitted by applicable law to execute and deliver this Subscription Agreement. |
| (4) | If I (we) am (are) a trust or custodian under a Benefit Plan Investor (or otherwise is an entity which holds plan assets), none of the Trustee, Managing Owner, the Trading Advisors, any Selling Agent, or Clearing Broker, or any of their affiliates either: (i) has investment discretion with respect to the investment of the assets of such entity being used to purchase Units; (ii) has authority or responsibility to give or regularly gives investment advice with respect to such assets for a fee and pursuant to an agreement or understanding that such advice will serve as a primary basis for investment decisions with respect to such assets and that such advice will be based on the particular investment needs of the trust or custodian; or (iii) is an employer maintaining or contributing to the trust. The purchase, holding and disposition of Units will not constitute a non-exempt prohibited transaction under ERISA or Section 4975 of the Code. |
| (5) | To my (our) best knowledge, I (we) am (are) independent of the Trust and any of the parties identified in paragraph 4(a) above and the decision to invest in the Units was made entirely independently of such parties, and was not part of a coordinated or joint investment effort with one or more other investors. |
| (6) | I (we) have received a Prospectus of each Series which constitutes its Commodity Futures Trading Commission (“CFTC”) Disclosure Document. |
| (7) | I (we) am (are) purchasing the Units for our own account. |
B-1
Table of Contents
| (8) | If trading for the applicable Series has commenced, I (we) have received a copy of its most recent monthly report as required by the CFTC. |
| (9) | I (we) acknowledge that as a holder or holders of any interests in, or claims of any kind against, any Series, I (we) will seek to recover any debts, liabilities, obligations and expenses incurred or otherwise existing with respect to that Series solely from, or to assert such claims solely against, (i) the assets of that Series (and not the assets of any other Series or the Trust generally) or (ii) the Managing Owner. |
| (10) | I (we) represent that all of the information which I (we) has (have) provided to the Trust in connection with this Subscription Agreement and Power of Attorney is true and correct. |
| (11) | I (we) agree to provide any information deemed necessary by the Trust to comply with its anti-money laundering program and related responsibilities from time to time. |
| (12) | I (we) represent that I (we) and each beneficial owner of the me (us), am (are) (i) not an individual, entity or organization identified on any U.S. Office of Foreign Assets Control “watch list” and do not have any affiliation of any kind with such an individual, entity or organization; (ii) not a foreign shell bank; and (iii) not a person or entity resident in or whose subscription funds are transferred from or through a jurisdiction identified as non-cooperative by the U.S. Financial Action Task Force. |
| (13) | I (we) represent that I (we) am (are) not, and no beneficial owner of me (us) is, a senior foreign political figure,1 an immediate family member of a senior foreign political figure2 or a close associate of a senior foreign political figure.3 |
| (14) | I (we) represent that the funds to be invested in the Trust were not derived from activities that may contravene U.S. or non-U.S. anti-money laundering laws or regulations. |
| (15) | I (we) am (are) acquiring the Units for which I (we) has (have) subscribed for my (our) own account, as principal, for investment and not with a view to the resale or distribution of all or a portion of such Units or, if I (we) am (are) an intermediary subscribing for Units as a record owner on behalf of one or more investors or beneficial owners (“Owners”), I (we) agree that the representations made in items (10)–(14) herein are made by me (us) on behalf of and with respect to both me (us) and all such Owners. |
| (16) | I (we) acknowledge that, if, following my (our) investment in the Trust, the Trust or the Managing Owner reasonably believes that I (we) am (are) a Prohibited Investor or have otherwise breached my (our) representations and covenants hereunder, the Trust may be obligated to freeze my (our) investment, either by prohibiting additional investments, declining any redemption requests and/or segregating the assets constituting the investment in accordance with applicable regulations, or my (our) investment may immediately be redeemed by the Trust, and I (we) shall have no claim against the Trust or the Managing Owner for any form of damages as a result of any of the aforementioned actions. |
| (17) | I (we) acknowledge and agree that any redemption proceeds paid to me (us) will be paid to the same account from which my (our) investment in the Trust was originally remitted, unless the Trust agrees otherwise. |
| (18) | At least five (5) Business Days prior to the date of my (our) subscription, I (we) have received a copy of the Prospectus of The Frontier Fund, including the accompanying appendices dated February 12, 2007 (the “Prospectus”), and the Prospectus’ supplement, if any, accompanying the Prospectus. |
1 A “senior foreign political figure” is defined as a official in the executive, legislative, administrative, military or judicial branches of a foreign government (whether elected or not), a senior official of a major foreign political party, or a senior executive of a foreign government-owned corporation. In addition, a “senior foreign political figure” includes any corporation, business or other entity that has been formed by, or for the benefit of, a senior foreign political figure.
2 “Immediate family” of a senior foreign political figure typically includes the figure’s parents, siblings, spouse, children and in-laws.
3 A “close associate” of a senior foreign political figure is a person who is widely and publicly known to maintain an unusually close relationship with the senior foreign political figure, and includes a person who is in a position to conduct substantial domestic and international financial transactions on behalf of the senior foreign political figure.
B-2
Table of Contents
By making these representations and warranties, Subscribers are not waiving any rights of action which they may have under applicable federal or state securities laws. Federal securities law provides that any such waiver would be unenforceable. Subscribers should be aware, however, that the representations and warranties set forth herein may be asserted in the defense of the Trust or others in any subsequent litigation or other proceeding.
| 2. | CONSENT TO ELECTRONIC DELIVERY OF REPORTS |
If you have checked the box under Item 10 of the preceding signature page, you are consenting to the delivery of periodic reports by the Trust to you electronically. These reports include:
| • | annual reports that contain audited financial statements; and |
| • | monthly reports containing unaudited condensed financial statements. |
You agree to download these reports from our website once you have notified by e-mail that they have been posted. You must have an e-mail address to use this service, and you must provide your e-mail address in Item 10 of the preceding signature page. If you elect to receive these reports electronically, you will not receive paper copies of the reports in the mail, unless you later revoke your consent. You may revoke your consent and receive paper copies at any time by notifying the Managing Owner in writing at 1660 Lincoln Street, Suite 100, Denver, Colorado 80264. Furthermore, if your e-mail address changes, you must immediately advise the Trust at the address above.
| 3. | SUBSCRIBER’S CONSENT AND SUBORDINATION AGREEMENT |
I (we), a Subscriber(s) who is(are) purchasing Units in the Series that is the subject of this agreement (the “Contracting Series”), agrees and consents (the “Consent”) to look solely to the assets (the “Contracting Series Assets”) of the Contracting Series and to the Managing Owner and its assets for payment. The Contracting Series Assets include only those funds and other assets that are paid, held or distributed to the Trust on account of and for the benefit of the Contracting Series, including, without limitation, funds delivered to the Trust for the purchase of Units in a Series.
In furtherance of the Consent, the Subscriber agrees that (i) any debts, liabilities, obligations, indebtedness, expenses and claims of any nature and of all kinds and descriptions (collectively, “Claims”) incurred, contracted for or otherwise existing and (ii) any Units, beneficial interests or equity ownership of any kind (collectively, “Units”), arising from, related to or in connection with the Trust and its assets and the Contracting Series and the Contracting Series Assets, shall be subject to the following limitations:
| (a) | Subordination of certain claims and rights. (i) except as set forth below, the Claims and Units, if any, of the Subscriber (collectively, the “Subordinated Claims and Units”) shall be expressly subordinate and junior in right of payment to any and all other Claims against and Units in the Trust and any Series thereof, and any of their respective assets, which may arise as a matter of law or pursuant to any contract; provided, however, that the Subscriber’s Claims (if any) against and Units (if any) in the Contracting Series shall not be considered Subordinated Claims and Units with respect to enforcement against and distribution and repayment from the Contracting Series, the Contracting Series Assets and the Managing Owner and its assets; and provided further that (1) the Subscriber’s valid Claims, if any, against the Contracting Series shall be pari passu and equal in right of repayment and distribution with all other valid Claims against the Contracting Series and (2) the Subscriber’s Units, if any, in the Contracting Series shall be pari passu and equal in right of repayment and distribution with all other Units in the Contracting Series; and (ii) the Subscriber will not take, demand or receive from any Series or the Trust or any of their respective assets (other than the Contracting Series, the Contracting Series Assets and the Managing Owner and its assets) any payment for the Subordinated Claims and Units; |
| (b) | the Claims and Units of the Subscriber with respect to the Contracting Series shall only be asserted and enforceable against the Contracting Series, the Contracting Series Assets and the Managing Owner and its assets; and such Claims and Units shall not be asserted or enforceable for any reason whatsoever against any other Series, the Trust generally or any of their respective assets; |
B-3
Table of Contents
| (c) | if the Claims of the Subscriber against the Contracting Series or the Trust are secured in whole or in part, the Subscriber hereby waives {under section 1111(b) of the Bankruptcy Code [11 U.S.C. S 1111(b)]} any right to have any deficiency Claims (which deficiency Claims may arise in the event such security is inadequate to satisfy such Claims) treated as unsecured Claims against the Trust or any Series (other than the Contracting Series), as the case may be; |
| (d) | in furtherance of the foregoing, if and to the extent that the Subscriber receives monies in connection with the Subordinated Claims and Units from a Series or the Trust (or their respective assets), other than the Contracting Series, the Contracting Series Assets and the Managing Owner and its assets, the Subscriber shall be deemed to hold such monies in trust and shall promptly remit such monies to the Series or the Trust that paid such amounts for distribution by the Series or the Trust in accordance with the terms hereof; and |
| (e) | the foregoing Consent shall apply at all times notwithstanding that the Claims are satisfied, the Units are sold, transferred, redeemed or in any way disposed of and notwithstanding that the agreements in respect of such Claims and Units are terminated, rescinded or canceled. |
| 4. | STATE SUITABILITY REQUIREMENTS |
All states except as listed below.
The general suitability requirement for subscribers to the Series of the Trust is that subscribers have a net worth (exclusive of home, home furnishings and automobiles) of at least $150,000 or, failing that standard, have a net worth (similarly calculated) of at least $45,000 and an annual gross income of at least $45,000. In addition, the minimum aggregate purchase is $1,000, no minimum in the case of Plans (including IRAs), employees or family members of an employee of the Managing Owner or its affiliates or charitable organizations or $5,000 in the case of subscribers who are residents of Texas or $1,000 in the case of subscribers who are residents of Texas who are Plans (including IRAs), employees or family members of an employee of the Managing Owner or its affiliates or charitable organizations.
B-4
Table of Contents
Higher Suitability Requirement.
The States listed below have more restrictive suitability requirements. Please read the following list to make sure that you meet the suitability and/or investment requirements for the State in which you reside. (As used below, “NW” means net worth exclusive of home, home furnishings and automobiles; “AI” means annual gross income; and “TI” means annual taxable income for federal income tax purposes).
Alaska | (a) $225,000 NW, or (b) $60,000 NW and $60,000 AI. | |
Arizona | (a) $225,000 NW, or (b) $60,000 NW and $60,000 AI. | |
Arkansas | (a) $225,000 NW, or (b) $60,000 NW and $60,000 AI. | |
California | (a) $225,000 NW, or (b) $60,000 NW and $60,000 AI. | |
Iowa | (a) $225,000 NW, or (b) $60,000 NW and $60,000 TI. | |
Maine | (a) $225,000 NW, or (b) $100,000 NW and $100,000 AI. | |
Massachusetts | (a) $225,000 NW, or (b) $60,000 NW and $60,000 TI. | |
Michigan | (a) $225,000 NW, or (b) $60,000 NW and $60,000 TI. | |
Minnesota | Must be an “accredited investor” as defined by Rule 501(a) of the Securities Act. All residents of Minnesota must also complete and submit the Supplement to the Subscription Agreement which accompanies the Subscription Agreement. | |
Mississippi | (a) $225,000 NW, or (b) $60,000 NW and $60,000 AI. | |
Missouri | (a) $225,000 NW, or (b) $60,000 NW and $60,000 AI. | |
Nebraska | (a) $225,000 NW, or (b) $60,000 NW and $60,000 TI. | |
New Hampshire | (a) $225,000 NW, or (b) $60,000 NW and $60,000 TI. | |
New Mexico | (a) $225,000 NW, or (b) $60,000 NW and $60,000 AI. | |
North Carolina | (a) $225,000 NW, or (b) $60,000 NW and $60,000 TI. | |
Ohio | (a) $250,000 NW, or (b) $70,000 NW and $70,000 TI. | |
Oklahoma | (a) $225,000 NW, or (b) $60,000 NW and $60,000 AI. | |
Oregon | (a) $225,000 NW, or (b) $60,000 NW and $60,000 AI. | |
Pennsylvania | (a) $175,000 NW, or (b) $100,000 NW and $50,000 TI. | |
South Dakota | (a) $225,000 NW, or (b) $60,000 NW and $60,000 AI. | |
Tennessee | (a) $250,000 NW, or (b) $60,000 NW and $60,000 TI. | |
Texas | (a) $225,000 NW, or (b) $60,000 NW and $60,000 TI; Minimum subscription for investors is $5,000 (with a minimum subscription of $1,000 in the case of residents of Texas who are Plans (including IRAs), employees or family members of an employee of the Managing Owner or its Affiliates or charitable organizations). All residents of Texas must also complete and submit the Supplement to the Subscription Agreement which accompanies the Subscription Agreement. |
AN INVESTMENT IN THE TRUST MAY NOT EXCEED 10% OF NW.
B-5
Table of Contents
FOR USE WITH CLASS 1
THE FRONTIER FUND
SUBSCRIPTION AGREEMENT FOR
CLASS 1 LIMITED UNITS OF BENEFICIAL INTERESTS
Any person considering subscribing for the Class 1 Units should carefully
read and review a current Prospectus. The Prospectus should be
accompanied by the most recent monthly report of the Trust.
The top of this Subscription Agreement and the front of the Prospectus are dated February 12, 2007. This material will expire no later than 9 months following that date. It may expire prior to the end of that 9-month period. Before using these documents you should confirm with your financial advisor or your Selling Agent (your “Financial Advisor”) that the document date is current. Subscriptions using expired documents CANNOT be accepted.
INSTRUCTIONS (Please read carefully)
| A. | All capitalized and other defined terms used herein and not expressly defined herein shall have the same respective meaning as are assigned such terms in the final prospectus and disclosure document of the Trust and each Series thereof, as the same may at any time and from time to time be amended or supplemented (See the “Prospectus”). |
| B. | Using a typewriter or printing in ink, check the appropriate box(es) and fill in the blanks on the signature page of this Subscription Agreement and Power of Attorney as directed herein. |
Number 1 | Check the applicable boxes: | |
| New Subscriber(s): Complete the entire signature page, as applicable; sign the signature page at Number 11; and have the Financial Advisor complete Numbers 13 and 14. | ||
| Existing Owner(s) of Units purchasing Units: | ||
(i) If your registration information is the same as in your original Subscription Agreement and Power of Attorney, complete Numbers 1, 2, 3 and 4 (only Social Security # or Taxpayer ID # necessary); complete Numbers 6; sign the signature page at Number 11; and have the Financial Advisor complete Numbers 13 and 14. | ||
(ii) If your registration information has changed from the original Subscription Agreement and Power of Attorney, follow the instructions for New Subscriber(s), above. | ||
Number 2 | Please insert the total dollar amount of the subscription for each Series of Units, as applicable. The minimum subscription for any one Series is $1,000. For Plans (including IRAs), employees or family members of an employee of the Managing Owner or its affiliates, or charitable organizations, there is no minimum initial subscription for such Series. The minimum initial subscription requirement for residents of Texas who are not Plans is $5,000. The minimum initial subscription requirement for residents of Texas who are Plans (including IRAs), employees or family members of an employee of the Managing Owner or its affiliates or charitable organizations is $1,000. Once the minimum is met, additional purchases may be made in $100 increments, (unless prohibited in certain states). For Plans (including IRAs), employees or family members of an employee of the Managing Owner or its affiliates, or charitable organizations, there is no minimum additional subscription. New Subscription Agreements and Powers of Attorney are required with each additional purchase. See “STATE SUITABILITY REQUIREMENTS” in “ADDITIONAL INFORMATION.” Fractional Units will be issued to five (5) decimal places. | |
Number 3 | Enter Broker Dealer (“B/D”) Investor Account Number. | |
B-6
Table of Contents
Number 4 | Enter your Social Security Numberor Taxpayer ID Number, as applicable, and check the appropriate box to indicate ownership type. For IRAs, the Taxpayer ID Number of the Custodian should be entered, as well as the Social Security Number of the investor. Please also initial the statements printed underneath box 4 regarding organizational transaction authority and trustee documentation, if applicable. | |
Number 5 | Check the appropriate box(es) if you are, or are not, a Benefit Plan Investor (or otherwise an entity which holds plan assets). | |
Number 6 | Enter your full registration name. For UGMA/UTMA (Minor), enter the Minor name in Number 6, followed by “Minor,” and enter the custodian name in Number 9. For Trusts, enter the Trust name in Number 6 and the Trustee(s) name(s) in Number 9. For Corporations, Partnerships and Estates, enter the entity name in Number 6 and the name of an officer or contact person in Number 9. | |
Number 7 | Enter your residence or legal address and telephone number. | |
Number 8 | Enter your mailing address, and telephone number,if such information is different from the information provided in Number 7. | |
Number 9 | Enter the address, and telephone number of the custodian, if applicable. | |
Number 10 | If you consent to receive delivery of reports of the Trust by electronic means, check the box in Number 10 and provide your e-mail address in the area indicated. | |
Number 11 | Sign and date the signature page. Do not sign without reading “REPRESENTATIONS AND WARRANTIES” under “ADDITIONAL INFORMATION” and familiarizing yourself with the Prospectus. | |
Number 12 | Check the box regarding backup withholding, if applicable. You are subject to backup withholding if you have been notified by Internal Revenue Services that you are currently subject to backup withholding because you have failed to report all interest and dividends on your tax return. Please also review the statement under “UNITED STATES INVESTORS ONLY” or “NON-UNITED STATES INVESTORS ONLY,” as applicable, to ensure that you comply with the certification you are making by signing the signature page | |
Number 13 | To be completed and signed by the Financial Advisor (“F.A.”). | |
Number 14 | The name of the Selling Agent, F.A. name, F.A. phone number, F.A. fax number, F.A. e-mail address, F.A. Branch ID, F.A. number and address must be entered in Number 14. | |
B-7
Table of Contents
You should return this Subscription Agreement and payment to your Financial Advisor’s office address.
| C. | The Subscriber’s admission as a Limited Owner of a Series will be determined based on the date on which a fully completed, dated, and signed Subscription Agreement is delivered to the Trust by the Financial Advisor during the Continuous Offering Period. A Subscriber maynot deliver his Subscription Agreement to the Trust’s offices. If such delivery is made, the Subscription Agreement will be returned to the Subscriber to be forwarded to the Financial Advisor. |
| D. | Payment of the subscription must be submitted with this Subscription Agreement in the form of a check or a wire transfer to U.S. Bank National Association in accordance with the Trust’s wire transfer instructions. |
B-8
Table of Contents
THE FRONTIER FUND CLASS 1
UNITS OF BENEFICIAL INTEREST BY SERIES
BY EXECUTING THIS SUBSCRIPTION AGREEMENT AND POWER OF ATTORNEY
SUBSCRIBERS ARE NOT WAIVING ANY RIGHTS UNDER
THE SECURITIES ACT OF 1933 OR
THE SECURITIES EXCHANGE ACT OF 1934
SUBSCRIPTION AGREEMENT AND
POWER OF ATTORNEY
The Frontier Fund
c/o Equinox Fund Management, LLC
Dear Sir/Madam:
1. Subscription for Units. I hereby subscribe for the dollar amount of units of beneficial interest (“Units”) in Class 1 of the Balanced Series, Campbell/Graham Series, Graham Series, Winton Series, Currency Series, Long Only Commodity Series, Long/Short Commodity Series or Managed Futures Index Series of The Frontier Fund (the “Trust”) or in Units in Class 1a of the Balanced Series of the Trust as set forth in the Subscription Agreement and Power of Attorney Signature Page attached hereto at a purchase price per Unit of $100 during the Initial Offering Period and Series Net Asset Value per Unit during the Continuous Offering Period. The terms of the offering of the Units are described in the Prospectus. I acknowledge that I must submit my subscription payment on but not before the settlement date for my purchase of Units. My Financial Advisor shall inform me of such settlement date, by which date I must send my subscription payment by check or effectuate a wire transfer of such funds to “U.S. Bank National Association, Denver, Colorado, as Escrow Agent for each Series of The Frontier Fund,” directly to the Escrow Agent. Equinox Fund Management, LLC (the “Managing Owner”) may, in its sole and absolute discretion, accept or reject this subscription in whole or in part.
2. Representations and Warranties of Subscriber. I have received the Prospectus together with the most recent Monthly Report of the Trust, if trading has commenced for the Series in which I am investing. By submitting this Subscription Agreement and Power of Attorney, I am making the representations and warranties set forth under “REPRESENTATIONS AND WARRANTIES” in “Additional Information” immediately following this Subscription Agreement and Power of Attorney, including, without limitation, those representations and warranties relating to my net worth and annual income set forth therein.
3. Power of Attorney. In connection with my purchase of Units, I do hereby irrevocably constitute and appoint the Managing Owner and its successors and assigns, as my true and lawful Attorney-in-Fact, with full power of substitution, in my name, place and stead, to (i) file, prosecute, defend, settle or compromise litigation, claims or arbitrations on behalf of the Trust and Series and (ii) make, execute, sign, acknowledge, swear to, deliver, record and file any documents or instruments which may be considered necessary or desirable by the Managing Owner to carry out fully the provisions of the Declaration of Trust and Trust Agreement of the Trust, including, without limitation, the execution of the said Agreement itself, the execution of all amendments permitted by the terms thereof and the payment to the Managing Owner of the management fees and incentive fees provided for therein. The Power of Attorney granted hereby shall be deemed to be coupled with an interest, shall be irrevocable, shall survive, and shall not be affected by, my subsequent death, incapacity, disability, insolvency or dissolution or any delivery by me of an assignment of the whole or any portion of my Units.
4. Governing Law. Subscriber hereby acknowledges and agrees that this Subscription Agreement and Power of Attorney shall be governed by and be interpreted in accordance with the laws of the State of Delaware, without regard to principles of conflicts of laws.
PLEASE COMPLETE THE SIGNATURE PAGE ON THE REVERSE SIDE.
B-9
Table of Contents
Revised 2/12/07
Exhibit B
Signature Page
FOR USE WITH CLASS 1
THE FRONTIER FUND CLASS 1
SUBSCRIPTION AGREEMENT AND POWER OF ATTORNEY
IMPORTANT: READ REVERSE SIDE BEFORE SIGNING
The Subscriber named below, by execution and delivery of this Subscription Agreement and Power of Attorney, by payment of the purchase price for Units in The Frontier Fund (the “Trust”) and by either (i) enclosing a check payable to “The Frontier Fund,” or (ii) sending a wire transfer to U.S. Bank National Association in accordance with the Trust’s wire transfer instructions, hereby subscribes for the purchase of Units in the amount set forth below.
| 1) Status of Subscriber(s) (Check one): | 2) Specify Series of Units (check appropriate box(es)) and Total Dollar Amount of Subscription: | |||||||
¨ New Subscriber(s) | ¨ Balanced Series-1 | $ | ¨ Winton Series -1 | $ | ||||
¨ Existing Owner(s) | ¨ Balanced Series-1a | $ | ¨ Currency Series -1 ¨ Long Only Commodity Series -1 | $ $ | ||||
¨ Campbell/Graham Series - 1 | $ | ¨ Long/Short Commodity Series -1 | $ | |||||
¨ Graham Series -1 | $ | ¨ Managed Futures Index Series -1 | $ | |||||
| 3) | TOTAL | $ | ||||||
| B/D Investor Account Number: | ||||||||
4) Social Security # — — or | Taxpayer ID# | |||||
Taxable Investors (check one): | ||||||
¨ Individual Ownership | ¨ Tenants in Common/Entirety | ¨ Estate* | ¨ UGMA/UTMA (Minor) | |||
¨ Partnership* | ¨ Joint Tenants with Right of Survivorship | ¨ Trust* | ¨ Corporation | |||
Non-Taxable Investors (check one) | ||||||
¨ IRA/SEP/Roth | ¨ Profit Sharing* | ¨ Pension* | ¨ Other (specify) | |||
| ¨ Defined Benefit* | ||||||
| *The undersigned investor(s) herby certifies by signing below that the investor(s) subscribing to purchase Units in the Trust has the power, under its applicable charter or organization documents to enter into transactions in each of the following types of securities: (1) units of beneficial interest in a Trust; (2) U.S. government securities; and (3) managed futures (i.e., futures, forward, option, spot, swap, and security futures contracts).Please initial. | ||
*The undersigned investor(s) acknowledges that the Trust’s Managing Owner, Equinox Fund Management, LLC, has not been provided the investor’s charter or organizational documents as a part of the Subscription document, and that, accordingly, neither the Trust nor the Managing Owner will make a review or interpretation of such documents.Please initial. | ||
5) | ¨ Check here if the Subscriber(s) is (are) a Benefit Plan Investor. ¨ Check here if the Subscriber(s) is (are) not a Benefit Plan Investor. *If this box is checked, the Subscriber(s) certify(ies) that it (they) will not become a Benefit Plan Investor until such time as the Managing Owner notifies the Subscriber(s) that such Series is intended to be qualified as publicly traded securitiesPlease initial. |
6) |
| |
Full Registration Name of Subscriber(s) (No Initials): including Individuals, Partnerships, Joint Partnership, Estates, Trusts, and Corporations |
7) | Resident Address of Subscriber | |
Street (P.O. Box not acceptable) City State Zip Code Telephone Number | ||
8) | Mailing Address (if different) | |
Street (P.O. Box acceptable) City State Zip Code Telephone Number | ||
9) | Custodian Name | |
Street (P.O. Box not acceptable) City State Zip Code Telephone Number | ||
10) | ¨ Consent to Electronic Delivery of Reports (please check and provide e-mail address above): Your reports may be e-mailed to you or posted on the Trust’s website. Email: |
11) | SUBSCRIBER(S) MUST SIGN |
X | X | |||||||||
| Signature of Subscriber Date | Signature of Joint Subscriber (if any) or Custodian Date |
Executing and delivering this Subscription Agreement and Power of Attorney shall in no respect be deemed to constitute a waiver of any rights under the Securities Act of 1933, as amended, or under the Securities and Exchange Act of 1934, as amended.
12) | UNITED STATES INVESTORS ONLY |
I have checked the following box if I am subject to backup withholding under the provisions of Section 3406(a)(1)(C) of the Internal Revenue Code:¨ (See directions for definition of subjectivity to backup withholdings).
Under penalties of perjury, by signature above I hereby certify that the Social Security Number or Taxpayer ID Number next to my name is my true, correct and complete Social Security or Taxpayer ID Number and that the information given in the immediately preceding sentence is true, correct and complete.¨
NON-UNITED STATES INVESTORS ONLY
Under penalties of perjury, by signature above I hereby certify that (a) I am not a citizen of the United States or (b) (in the case of an investor, which is not any individual) the investor is not a United States corporation, partnership, estate or trust.¨
13) | FINANCIAL ADVISOR MUST SIGN |
I hereby certify that I have informed the Subscriber of all pertinent facts relating to the liquidity and marketability of the Units as set forth in the Prospectus dated February 12, 2007, and I have reasonable grounds to believe (on the basis of information obtained from the person(s) named above concerning such the age, investment objectives, investment experience, income, net worth, financial situation and needs, other investments of the person and any other information known by me) that (a) the purchase of Units is a suitable and appropriate investment for such person(s); (b) such person(s) meet(s) the minimum income and net worth standards; (c) such person(s) can benefit from the investment based on such person(s) overall investment objectives and portfolio structure (d) such person(s) can bear the economic risk of the investment; and (e) such person(s) has (have) an understanding of the fundamental risks of the investment, the risk that an investor may lose its entire investment, the restriction on the liquidity of the Units, the restrictions on the transferability of the Units and the background and qualifications of the Selling Agent.
I have ensured that a current Prospectus, together with the most recent Monthly Report for the applicable Series, if such Series has commenced trading, has been furnished to the person(s) named above.
I have received all documents required to accept this subscription and acknowledge the suitability of the Subscriber and the amount of the subscription for each Series. If the Subscriber is other than an individual subscriber, I acknowledge that my review of the Subscriber’s governing documents indicates that such documents permit investment in commodities funds whose principal business is speculative futures trading.
| X | X | |||||||||
| Financial Advisor Signature Date | Office Manager Signature Date (if required by Selling Agent procedures) |
| 14) Selling Firm | F.A. Name | |||
| (print clearly for proper credit) | ||||
| F.A. Phone F.A. Fax | F.A. Email Address Branch ID | FA. Number | ||
| F.A. Address | ||||
| (for confirmations) StreetAddress | ||||
B-10
Table of Contents
THE FRONTIER FUND
SUPPLEMENT TO THE SUBSCRIPTION AGREEMENT FOR
CLASS 1 LIMITED UNITS OF BENEFICIAL INTEREST
(FOR RESIDENTS OF MINNESOTA ONLY)
Any person considering subscribing for the Class 1 Units should carefully read and review a
current Prospectus of the Trust, including the Subscription Information and Subscription
Agreement attached thereto.
INSTRUCTIONS (Please read carefully)
All capitalized and other defined terms used herein and not expressly defined herein shall have the same respective meaning as are assigned such terms in the final prospectus and disclosure document of the Trust and each Series thereof, as the same may at any time and from time to time be amended or supplemented (the “Prospectus”).
I (we) certify that the category or categories of accredited investor indicated by the placement of my (our) initials on the line(s) preceding the appropriate category or categories below are applicable to me (us).
| Category 1. A bank, as defined in Section 3(a)(2) of the Act, whether acting in its individual or fiduciary capacity; or |
| Category 2. A savings and loan association or other institution as defined in Section 3(a)(5)(A) of the Act, whether acting in its individual or fiduciary capacity; or |
| Category 3. A broker or dealer registered pursuant to Section 15 of the Securities Exchange Act of 1934; or |
| Category 4. An insurance company as defined in Section 2(13) of the Act; or |
| Category 5. An investment company registered under the Investment Company Act of 1940; or |
| Category 6. A business development company as defined in Section 2(a)(48) of the Investment Company Act of 1940; or |
| Category 7. A small business investment company licensed by the U.S. Small Business Administration under Section 301(c) or (d) of the Small Business Investment Act of 1958; or |
| Category 8. A plan established and maintained by a state, its political subdivisions or any agency or instrumentality of a state or its political subdivisions, for the benefit of its employees, with total assets in excess of $5,000,000; or |
| Category 9. An employee benefit plan within the meaning of the Employee Retirement Income Security Act of 1974 in which the investment decision is made by a plan fiduciary, as defined in Section 3(21) of such Act, which is either a bank, savings and loan association, insurance company or registered investment adviser, or an employee benefit plan with total assets in excess of $5,000,000 or, if a self-directed plan, with investment decisions made solely by persons who are accredited investors; or |
| Category 10. A private business development company as defined in Section 202(a)(22) of the Investment Advisers Act of 1940; or |
| Category 11. An organization described in Section 501(c)(3) of the Internal Revenue Code, a corporation, a Massachusetts or similar business trust, or a partnership, not formed for the specific purpose of acquiring the securities offered, with total assets in excess of $5,000,000; or |
| Category 12. A director or executive officer of the Managing Owner; or |
B-11
Table of Contents
| Category 13. A natural person whose individual net worth, or joint net worth (in each case not including homes, home furnishings or automobiles) with that person’s spouse, at the time of this purchase exceeds $1,000,000; or |
| Category 14. A natural person who had an individual income in excess of $200,000 in each of the two most recent years or joint income with that person’s spouse in excess of $300,000 in each of those years and has a reasonable expectation of reaching the same income level in the current year; or |
| Category 15. A trust, with total assets in excess of $5,000,000, not formed for the specific purpose of acquiring the securities offered, whose purchase is directed by a sophisticated person as described in Rule 506(b)(2)(ii) under the Act; or |
| Category 16. An entity in which all of the equity owners are accredited investors. |
I (we) agree to cooperate with and furnishing such additional information to the Trust as may be requested in order to verify my (our) status as an accredited investor.
Dated:
Name | ||
Individual Signature (if applicable) | ||
Entity Name: | ||
| By: |
| |
| Name: |
| |
| Title: |
| |
B-12
Table of Contents
THE FRONTIER FUND
SUPPLEMENT TO THE SUBSCRIPTION AGREEMENT FOR
CLASS 1 LIMITED UNITS OF BENEFICIAL INTEREST
(FOR RESIDENTS OF TEXAS ONLY)
Any person considering subscribing for the Class 1 Units should carefully read and
review a current Prospectus of the Trust, including the
Subscription Information and Subscription Agreement attached thereto.
INSTRUCTIONS (Please read carefully)
| A. | All capitalized and other defined terms used herein and not expressly defined herein shall have the same respective meaning as are assigned such terms in the final prospectus and disclosure document of the Trust and each Series thereof, as the same may at any time and from time to time be amended or supplemented (the “Prospectus”). |
| B. | Please initial the space preceding the representations below after you have carefully read such representations. |
| ¨ | I (we) meet the minimum income and net worth standards set forth in the Prospectus, including the Subscription Information in Exhibit B attached thereto. |
| ¨ | I (we) am (are) purchasing Class 1 Units for my (our) own account. |
| ¨ | I (we) have received a current copy of the Prospectus. |
| ¨ | I (we) acknowledge that an investment in the Trust is not liquid except for the redemption provisions as set forth in the Prospectus. |
| ¨ | I (we) am aware that my (our) minimum initial subscription requirement is $5,000, unless I (we) am (are) a Plan (including an IRA), an employee or family member of an employee of the Managing Owner or its affiliates or a charitable organization, in which case my (our) minimum initial subscription requirement is $1,000. |
Signature of Subscriber:
Name of Subscriber:
Date:
B-13
Table of Contents
FOR USE
WITH
CLASS 2
FEE
BASED
THE FRONTIER FUND
SUBSCRIPTION AGREEMENT FOR
CLASS 2 LIMITED UNITS OF BENEFICIAL INTERESTS
Any person considering subscribing for the Class 2 Units should carefully
read and review a current Prospectus. The Prospectus should be
accompanied by the most recent monthly report of the Trust.
The top of this Subscription Agreement and the front of the Prospectus are dated February 12, 2007. This material will expire no later than 9 months following that date. It may expire prior to the end of that 9-month period. Before using these documents you should confirm with your financial advisor or your Selling Agent (your “Financial Advisor”) that the document date is current. Subscriptions using expired documents CANNOT be accepted.
INSTRUCTIONS (Please read carefully)
| E. | All capitalized and other defined terms used herein and not expressly defined herein shall have the same respective meaning as are assigned such terms in the final prospectus and disclosure document of the Trust and each Series thereof, as the same may at any time and from time to time be amended or supplemented (See the “Prospectus”). |
| F. | Using a typewriter or printing in ink, check the appropriate box(es) and fill in the blanks on the signature page of this Subscription Agreement and Power of Attorney as directed herein. |
Number 1 | Check the applicable boxes: | |
| New Subscriber(s): Complete the entire signature page, as applicable; sign the signature page at Number 11; and have the Financial Advisor complete Numbers 13 and 14. | ||
| Existing Owner(s) of Units purchasing Units: | ||
(iii) If your registration information is the same as in your original Subscription Agreement and Power of Attorney, complete Numbers 1, 2, 3 and 4 (only Social Security # or Taxpayer ID # necessary); complete Numbers 6; sign the signature page at Number 11; and have the Financial Advisor complete Numbers 13 and 14. | ||
(iv) If your registration information has changed from the original Subscription Agreement and Power of Attorney, follow the instructions for New Subscriber(s), above. | ||
Number 2 | Please insert the total dollar amount of the subscription for each Series of Units, as applicable. The minimum subscription for any one Series is $1,000. For Plans (including IRAs), employees or family members of an employee of the Managing Owner or its affiliates, or charitable organizations, there is no minimum initial subscription for such Series. The minimum initial subscription requirement for residents of Texas who arenot Plans is $5,000. The minimum initial subscription requirement for residents of Texas who are Plans (including IRAs), employees or family members of an employee of the Managing Owner or its affiliates or charitable organizations is $1,000. Once the minimum is met, additional purchases may be made in $100 increments, (unless prohibited in certain states). For Plans (including IRAs), employees or family members of an employee of the Managing Owner or its affiliates, or charitable organizations, there is no minimum additional subscription. New Subscription Agreements and Powers of Attorney are required with each additional purchase. See “STATE SUITABILITY REQUIREMENTS” in “ADDITIONAL INFORMATION.” Fractional Units will be issued to five (5) decimal places. | |
Number 3 | Enter Broker Dealer (“B/D”) Investor Account Number. | |
B-14
Table of Contents
Number 4 | Enter your Social Security Numberor Taxpayer ID Number, as applicable, and check the appropriate box to indicate ownership type. For IRAs, the Taxpayer ID Number of the Custodian should be entered, as well as the Social Security Number of the investor. Please also initial the statements printed underneath box 4 regarding organizational transaction authority and trustee documentation, if applicable. | |
Number 5 | Check the appropriate box(es) if you are, or are not, a Benefit Plan Investor. | |
Number 6 | Enter your full registration name. For UGMA/UTMA (Minor), enter the Minor name in Number 6, followed by “Minor,” and enter the custodian name in Number 9. For Trusts, enter the Trust name in Number 6 and the Trustee(s) name(s) in Number 9. For Corporations, Partnerships and Estates, enter the entity name in Number 6 and the name of an officer or contact person in Number 9. | |
Number 7 | Enter your residence or legal address and telephone number. | |
Number 8 | Enter your mailing address, telephone number and e-mail address,if such information is different from the information provided in Number 7. | |
Number 9 | Enter the address, telephone number and e-mail address of the custodian, if applicable. | |
Number 10 | If you consent to receive delivery of reports of the Trust by electronic means, check the box in Number 10 and provide your e-mail address in the area indicated. | |
Number 11 | Sign and date the signature page. Do not sign without reading “REPRESENTATIONS AND WARRANTIES” under “ADDITIONAL INFORMATION” and familiarizing yourself with the Prospectus. | |
Number 12 | Check the box regarding backup withholding, if applicable. You are subject to backup withholding if you have been notified by Internal Revenue Services that you are currently subject to backup withholding because you have failed to report all interest and dividends on your tax return. Please also review the statement under “UNITED STATES INVESTORS ONLY” or “NON-UNITED STATES INVESTORS ONLY,” as applicable, to ensure that you comply with the certification you are making by signing the signature page | |
Number 13 | To be completed and signed by the Financial Advisor (“F.A.”). | |
Number 14 | The name of the Selling Agent, F.A. name, F.A. phone number, F.A. fax number, F.A. e-mail address, F.A. Branch ID, F.A. number and address must be entered in Number 14. | |
B-15
Table of Contents
You should return this Subscription Agreement and payment to your Financial Advisor’s office address.
| G. | The Subscriber’s admission as a Limited Owner of a Series will be determined based on the date on which a fully completed, dated, and signed Subscription Agreement is delivered to the Trust by the Financial Advisor during the Continuous Offering Period. A Subscriber maynot deliver his Subscription Agreement to the Trust’s offices. If such delivery is made, the Subscription Agreement will be returned to the Subscriber to be forwarded to the Financial Advisor. |
| H. | Payment of the subscription must be submitted with this Subscription Agreement in the form of a check or a wire transfer to U.S. Bank National Association in accordance with the Trust’s wire transfer instructions. |
B-16
Table of Contents
THE FRONTIER FUND CLASS 2
UNITS OF BENEFICIAL INTEREST BY SERIES
BY EXECUTING THIS SUBSCRIPTION AGREEMENT AND POWER OF ATTORNEY
SUBSCRIBERS ARE NOT WAIVING ANY RIGHTS UNDER
THE SECURITIES ACT OF 1933 OR
THE SECURITIES EXCHANGE ACT OF 1934
SUBSCRIPTION AGREEMENT AND
POWER OF ATTORNEY
The Frontier Fund
c/o Equinox Fund Management, LLC
Dear Sir/Madam:
1. Subscription for Units. I hereby subscribe for the dollar amount of units of beneficial interest (“Units”) in Class 2 of the Balanced Series, Campbell/Graham Series, Graham Series, Winton Series, Currency Series, Long Only Commodity Series, Long/Short Commodity Series or Managed Futures Index Series of The Frontier Fund (the “Trust”) or in Units in Class 2a of the Balanced Series of the Trust as set forth in the Subscription Agreement and Power of Attorney Signature Page attached hereto at a purchase price per Unit of $100 during the Initial Offering Period and Series Net Asset Value per Unit during the Continuous Offering Period. The terms of the offering of the Units are described in the Prospectus. I acknowledge that I must submit my subscription payment on but not before the settlement date for my purchase of Units. My Financial Advisor shall inform me of such settlement date, by which date I must send my subscription payment by check or effectuate a wire transfer of such funds to “U.S. Bank National Association, Denver, Colorado, as Escrow Agent for each Series of The Frontier Fund,” directly to the Escrow Agent. Equinox Fund Management, LLC (the “Managing Owner”) may, in its sole and absolute discretion, accept or reject this subscription in whole or in part.
2. Representations and Warranties of Subscriber. I have received the Prospectus together with the most recent Monthly Report of the Trust, if trading has commenced for the Series in which I am investing. By submitting this Subscription Agreement and Power of Attorney, I am making the representations and warranties set forth under “REPRESENTATIONS AND WARRANTIES” in “Additional Information” immediately following this Subscription Agreement and Power of Attorney, including, without limitation, those representations and warranties relating to my net worth and annual income set forth therein.
3. Power of Attorney. In connection with my purchase of Units, I do hereby irrevocably constitute and appoint the Managing Owner and its successors and assigns, as my true and lawful Attorney-in-Fact, with full power of substitution, in my name, place and stead, to (i) file, prosecute, defend, settle or compromise litigation, claims or arbitrations on behalf of the Trust and Series and (ii) make, execute, sign, acknowledge, swear to, deliver, record and file any documents or instruments which may be considered necessary or desirable by the Managing Owner to carry out fully the provisions of the Declaration of Trust and Trust Agreement of the Trust, including, without limitation, the execution of the said Agreement itself, the execution of all amendments permitted by the terms thereof and the payment to the Managing Owner of the management fees and incentive fees provided for therein. The Power of Attorney granted hereby shall be deemed to be coupled with an interest, shall be irrevocable, shall survive, and shall not be affected by, my subsequent death, incapacity, disability, insolvency or dissolution or any delivery by me of an assignment of the whole or any portion of my Units.
4. Governing Law. Subscriber hereby acknowledges and agrees that this Subscription Agreement and Power of Attorney shall be governed by and be interpreted in accordance with the laws of the State of Delaware, without regard to principles of conflicts of laws.
PLEASE COMPLETE THE SIGNATURE PAGE ON THE REVERSE SIDE.
B-17
Table of Contents
Revised 2/12/07
Exhibit B Signature Page | THE FRONTIER FUND CLASS 2 SUBSCRIPTION AGREEMENT AND POWER OF ATTORNEY IMPORTANT: READ REVERSE SIDE BEFORE SIGNING | FOR USE WITH CLASS 2 FEE BASED |
The Subscriber named below, by execution and delivery of this Subscription Agreement and Power of Attorney, by payment of the purchase price for Units in The Frontier Fund (the “Trust”) and by either (i) enclosing a check payable to “The Frontier Fund,” or (ii) sending a wire transfer to U.S. Bank National Association in accordance with the Trust’s wire transfer instructions, hereby subscribes for the purchase of Units in the amount set forth below.
| 1) Status of Subscriber(s) (Check one): | 2) Specify Series of Units (check appropriate box(es)) and Total Dollar Amount of Subscription: | |||||||
¨ Balanced Series-2 | $ | ¨ Winton Series -2 | $ | |||||
¨ New Subscriber(s) | ¨ Balanced Series-2a (MA, | ¨ Currency Series -2 | $ | |||||
MI, OH residents only) | $ | ¨ Long Only Commodity Series - 2 | $ | |||||
¨ Existing Owner(s) | ¨ Campbell/Graham Series -2 | $ | ¨ Long/Short Commodity Series -2 | $ | ||||
¨ Graham Series -2 | $ | ¨ Managed Futures Index Series -2 | $ | |||||
| 3) | TOTAL | $ | ||||||
| B/D Investor Account Number: | ||||||||
4) Social Security # — — or | Taxpayer ID# | |||||
Taxable Investors (check one): | ||||||
¨ Individual Ownership | ¨ Tenants in Common/Entirety | ¨ Estate* | ¨ UGMA/UTMA (Minor) | |||
¨ Partnership* | ¨ Joint Tenants with Right of Survivorship | ¨ Trust* | ¨ Corporation | |||
Non-Taxable Investors (check one) | ||||||
¨ IRA/SEP/Roth ¨ Defined Benefit* ¨ Profit Sharing* ¨ Pension* ¨ Other (specify) | ||||||
*The undersigned investor(s) herby certifies by signing below that the investor(s) subscribing to purchase Units in the Trust has the power, under its applicable charter or organization documents to enter into transactions in each of the following types of securities: (1) units of beneficial interest in a Trust; (2) U.S. government securities; and (3) managed futures (i.e., futures, forward, option, spot, swap, and security futures contracts).Please initial. | ||||||
*The undersigned investor(s) acknowledges that the Trust’s Managing Owner, Equinox Fund Management, LLC, has not been provided the investor’s charter or organizational documents as a part of the Subscription document, and that, accordingly, neither the Trust nor the Managing Owner will make a review or interpretation of such documents.Please initial. | ||||||
5) | ¨ Check here if the Subscriber(s) is (are) a Benefit Plan Investor. ¨ Check here if the Subscriber(s) is (are) not a Benefit Plan Investor. *If this box is checked, the Subscriber(s) certify(ies) that it (they) will not become a Benefit Plan Investor until such time as the Managing Owner notifies the Subscriber(s) that such Series is intended to be qualified as publicly traded securitiesPlease initial. | |
6) |
| |
Full Registration Name of Subscriber(s) (No Initials): including Individuals, Partnerships, Joint Partnership, Estates, Trusts, and Corporations | ||
7) | Resident Address of Subscriber | |
Street (P.O. Box not acceptable) City State Zip Code Telephone Number | ||
8) | Mailing Address (if different) | |
Street (P.O. Box acceptable) City State Zip Code Telephone Number | ||
9) | Custodian Name | |
Street (P.O. Box not acceptable) City State Zip Code Telephone Number | ||
10) | ¨ Consent to Electronic Delivery of Reports (please check and provide e-mail address above): Your reports may be e-mailed to you or posted on the Trust���s website. Email: |
11) | SUBSCRIBER(S) MUST SIGN |
| X | X | |||||||||
| Signature of Subscriber Date | Signature of Joint Subscriber (if any) or Custodian Date |
Executing and delivering this Subscription Agreement and Power of Attorney shall in no respect be deemed to constitute a waiver of any rights under the Securities Act of 1933, as amended, or under the Securities and Exchange Act of 1934, as amended.
12) | UNITED STATES INVESTORS ONLY |
I have checked the following box if I am subject to backup withholding under the provisions of Section 3406(a)(1)(C) of the Internal Revenue Code: ¨ (see directions for definition of subjectivity to backup withholdings)
Under penalties of perjury, by signature above I hereby certify that the Social Security Number or Taxpayer ID Number next to my name is my true, correct and complete Social Security or Taxpayer ID Number and that the information given in the immediately preceding sentence is true, correct and complete.¨
NON-UNITED STATES INVESTORS ONLY
Under penalties of perjury, by signature above I hereby certify that (a) I am not a citizen of the United States or (b) (in the case of an investor, which is not any individual) the investor is not a United States corporation, partnership, estate or trust.¨
13) | FINANCIAL ADVISOR MUST SIGN |
I hereby certify that I have informed the Subscriber of all pertinent facts relating to the liquidity and marketability of the Units as set forth in the Prospectus dated February 12, 2007, and I have reasonable grounds to believe (on the basis of information obtained from the person(s) named above concerning such the age, investment objectives, investment experience, income, net worth, financial situation and needs, other investments of the person and any other information known by me) that (a) the purchase of Units is a suitable and appropriate investment for such person(s); (b) such person(s) meet(s) the minimum income and net worth standards; (c) such person(s) can benefit from the investment based on such person(s) overall investment objectives and portfolio structure (d) such person(s) can bear the economic risk of the investment; and (e) such person(s) has (have) an understanding of the fundamental risks of the investment, the risk that an investor may lose its entire investment, the restriction on the liquidity of the Units, the restrictions on the transferability of the Units and the background and qualifications of the Selling Agent.
I have ensured that a current Prospectus, together with the most recent Monthly Report for the applicable Series, if such Series has commenced trading, has been furnished to the person(s) named above.
I have received all documents required to accept this subscription and acknowledge the suitability of the Subscriber and the amount of the subscription for each Series. If the Subscriber is other than an individual subscriber, I acknowledge that my review of the Subscriber’s governing documents indicates that such documents permit investment in commodities funds whose principal business is speculative futures trading.
| X | X | |||||||||
| Financial Advisor Signature Date | Office Manager Signature Date (if required by Selling Agent procedures) |
| 14) Selling Firm | F.A. Name | |||
| (print clearly for proper credit) | ||||
| F.A. Phone F.A. Fax | F.A. Email Address Branch ID | FA. Number | ||
| F.A. Address | ||||
| (for confirmations) StreetAddress City | State Zip Code | |||
B-18
Table of Contents
THE FRONTIER FUND
SUPPLEMENT TO THE SUBSCRIPTION AGREEMENT FOR
CLASS 2 LIMITED UNITS OF BENEFICIAL INTEREST
(FOR RESIDENTS OF MINNESOTA ONLY)
Any person considering subscribing for the Class 2 Units should carefully read and review a
current Prospectus of the Trust, including the Subscription Information and Subscription
Agreement attached thereto.
INSTRUCTIONS (Please read carefully)
All capitalized and other defined terms used herein and not expressly defined herein shall have the same respective meaning as are assigned such terms in the final prospectus and disclosure document of the Trust and each Series thereof, as the same may at any time and from time to time be amended or supplemented (the “Prospectus”).
I (we) certify that the category or categories of accredited investor indicated by the placement of my (our) initials on the line(s) preceding the appropriate category or categories below are applicable to me (us).
| Category 1. A bank, as defined in Section 3(a)(2) of the Act, whether acting in its individual or fiduciary capacity; or |
| Category 2. A savings and loan association or other institution as defined in Section 3(a)(5)(A) of the Act, whether acting in its individual or fiduciary capacity; or |
| Category 3. A broker or dealer registered pursuant to Section 15 of the Securities Exchange Act of 1934; or |
| Category 4. An insurance company as defined in Section 2(13) of the Act; or |
| Category 5. An investment company registered under the Investment Company Act of 1940; or |
| Category 6. A business development company as defined in Section 2(a)(48) of the Investment Company Act of 1940; or |
| Category 7. A small business investment company licensed by the U.S. Small Business Administration under Section 301(c) or (d) of the Small Business Investment Act of 1958; or |
| Category 8. A plan established and maintained by a state, its political subdivisions or any agency or instrumentality of a state or its political subdivisions, for the benefit of its employees, with total assets in excess of $5,000,000; or |
| Category 9. An employee benefit plan within the meaning of the Employee Retirement Income Security Act of 1974 in which the investment decision is made by a plan fiduciary, as defined in Section 3(21) of such Act, which is either a bank, savings and loan association, insurance company or registered investment adviser, or an employee benefit plan with total assets in excess of $5,000,000 or, if a self-directed plan, with investment decisions made solely by persons who are accredited investors; or |
| Category 10. A private business development company as defined in Section 202(a)(22) of the Investment Advisers Act of 1940; or |
| Category 11. An organization described in Section 501(c)(3) of the Internal Revenue Code, a corporation, a Massachusetts or similar business trust, or a partnership, not formed for the specific purpose of acquiring the securities offered, with total assets in excess of $5,000,000; or |
| Category 12. A director or executive officer of the Managing Owner; or |
| Category 13. A natural person whose individual net worth, or joint net worth (in each case not including homes, home furnishings or automobiles) with that person’s spouse, at the time of this purchase exceeds $1,000,000; or |
| Category 14. A natural person who had an individual income in excess of $200,000 in each of the two most recent years or joint income with that person’s spouse in excess of $300,000 in each of those years and has a reasonable expectation of reaching the same income level in the current year; or |
| Category 15. A trust, with total assets in excess of $5,000,000, not formed for the specific purpose of acquiring the securities offered, whose purchase is directed by a sophisticated person as described in Rule 506(b)(2)(ii) under the Act; or |
| Category 16. An entity in which all of the equity owners are accredited investors. |
B-19
Table of Contents
I (we) agree to cooperate with and furnishing such additional information to the Trust as may be requested in order to verify my (our) status as an accredited investor.
Dated:
Name | ||
Individual Signature (if applicable) | ||
| Entity Name: | ||
| By: |
| |
| Name: |
| |
| Title: |
| |
B-20
Table of Contents
THE FRONTIER FUND
SUPPLEMENT TO THE SUBSCRIPTION AGREEMENT FOR
CLASS 2 LIMITED UNITS OF BENEFICIAL INTEREST
(FOR RESIDENTS OF TEXAS ONLY)
Any person considering subscribing for the Class 2 Units should carefully read and
review a current Prospectus of the Trust, including the
Subscription Information and Subscription Agreement attached thereto.
INSTRUCTIONS (Please read carefully)
| A. | All capitalized and other defined terms used herein and not expressly defined herein shall have the same respective meaning as are assigned such terms in the final prospectus and disclosure document of the Trust and each Series thereof, as the same may at any time and from time to time be amended or supplemented (the “Prospectus”). |
| B. | Please initial the space preceding the representations below after you have carefully read such representations. |
| ¨ | I (we) meet the minimum income and net worth standards set forth in the Prospectus, including the Subscription Information in Exhibit B attached thereto. |
| ¨ | I (we) am (are) purchasing Class 2 Units for my (our) own account. |
| ¨ | I (we) have received a current copy of the Prospectus. |
| ¨ | I (we) acknowledge that an investment in the Trust is not liquid except for the redemption provisions as set forth in the Prospectus. |
| ¨ | I (we) am aware that my (our) minimum initial subscription requirement is $5,000, unless I (we) am (are) a Plan (including an IRA), an employee or family member of an employee of the Managing Owner or its affiliates or a charitable organization, in which case my (our) minimum initial subscription requirement is $1,000. |
Signature of Subscriber:
Name of Subscriber:
Date:
B-21
Table of Contents
EXCHANGE REQUEST FOR
CLASS 1 UNITS OF BENEFICIAL INTEREST
To: | THE FRONTIER FUND | 20 | |||
c/o Equinox Fund Management, LLC | (Please date | ) |
Dear Sir/Madam: | B/D Investor Account #: |
Please accept my exchange request from the indicated Frontier Fund Series to the designated Frontier Fund Series. I certify that all of the statements made in my original Subscription Agreement remain accurate and I have received and read the Trust’s Prospectus.
Amount to beRedeemed Upon Exchange | Specify (ü) Series to bePurchased Upon Exchange*: | |||||||
| Subscriber Status: | New | Existing | ||||||
$/Units or All Units of – Balanced Series – 1 | Balanced Series – 1 | ¨ | ¨ | |||||
$/Units or All Units of – Balanced Series – 1a | Balanced Series – 1a | ¨ | ¨ | |||||
(Balanced Series – 1a for MA, MI, OH residents only) | (Balanced Series – 1a for MA, MI, OH residents only) | |||||||
$/Units or All Units of – Campbell/Graham Series – 1 | Campbell/Graham Series – 1 | ¨ | ¨ | |||||
$/Units or All Units of – Graham Series – 1 | Graham Series – 1 | ¨ | ¨ | |||||
$/Units or All Units of – Winton Series – 1 | Winton Series – 1 | ¨ | ¨ | |||||
$/Units or All Units of – Currency Series – 1 | Currency Series – 1 | ¨ | ¨ | |||||
$/Units or All Units of – Long Only Commodity Series – 1 | Long Only Commodity Series – 1 | ¨ | ¨ | |||||
$/Units or All Units of – Long/Short Commodity Series – 1 | Long/Short Commodity Series – 1 | ¨ | ¨ | |||||
$/Units or All Units of – Managed Futures Index Series – 1 | Managed Futures Index Series – 1 | ¨ | ¨ | |||||
| * | If you are exchanging Units of one Series for Units of more than one Series, please complete a separate Exchange Request for each Series being exchanged into. |
Type or Print Current Account Name(s) | Social Security or Taxpayer ID | |||||
Street | City | State | Zip Code | |||
Selling Firm | FA Name | Branch ID | FA Number | |||
SIGNATURE(S)
SIGNATURES MUST BE IDENTICAL TO NAME(S) IN WHICH UNITS OF TRUST ARE REGISTERED
Printed Name: | Individual Owner(s) or Assignee(s), Entity1 Owner(s) or Assignee(s),or Plan Participant | Signature(s): Owner(s) or Assignee(s), Entity Owner(s) or Assignee(s),or Plan Participant | ||
| NOTE: | If the entity owner is a trustee, custodian, or fiduciary of a Plan that is an Individual Retirement Account, Keogh Plan without common law employees or Plan under which a plan participant may exercise control over assets in his account, the signature of the plan participant must also be supplied. |
IF SUBMITTED IN ACCORDANCE WITH REQUIRED PROCEDURES, THE EXCHANGE REQUEST HEREIN WILL BE EFFECTIVE AS OF TWO (2) BUSINESS DAYS AFTER THE DATE ON WHICH THIS EXCHANGE REQUEST WAS RECEIVED BY THE MANAGING OWNER, PURSUANT TO THE PROSPECTUS.
| 1 | Includes trustee, partner, or authorized officer |
C-1
Table of Contents
On back of triplicate form
I hereby request the following exchange of Units as of two (2) Business Days after your receipt of this Exchange Request, upon the terms and conditions described in the Prospectus for The Frontier Fund dated February 12, 2007. I certify that all of the statements made in my original Subscription Agreement remain accurate. I (either in my individual capacity or as an authorized representative of an entity, if applicable) hereby represent and warrant that I am the true, lawful, and beneficial owner of the Units to which this Exchange Request relates, with full power and authority to request an Exchange of such Units. Such Units are not subject to any pledge or otherwise encumbered in any fashion. I (either in my individual capacity or as an authorized representative of an entity, if applicable) hereby represent and warrant that I have received and read the applicable Appendix or Appendices to the Prospectus for the Series of Units, which are being purchased in connection with this Exchange Request. All capitalized and other defined terms used herein and not expressly defined herein shall have the same respective meaning as are assigned such terms in the final Prospectus and disclosure document of the Trust and each Series thereof, constituting a part of each registration statement on Form S-1, as amended, filed with the Securities and Exchange Commission pursuant to which the Trust registered the Limited Units of a Series, as the same may at any time and from time to time be further amended or supplemented, as the same may at any time and from time to time be amended or supplemented after the effective date(s) of such registration statement(s) (the “Prospectus”). I understand that the Managing Owner, in its sole and absolute discretion, may reject this Exchange Request.
C-2
Table of Contents
FOR USE WITH CLASS 2 WRAP ACCOUNTS | EXCHANGE REQUEST FOR CLASS 2 UNITS OF BENEFICIAL INTEREST |
To: | THE FRONTIER FUND | 20 | ||
c/o Equinox Fund Management, LLC | (Please date) |
Dear Sir/Madam: | B/D Investor Account #: |
Please accept my exchange request from the indicated Frontier Fund Series to the designated Frontier Fund Series. I certify that all of the statements made in my original Subscription Agreement remain accurate and I have received and read the Trust’s Prospectus.
Amount to beRedeemed Upon Exchange | Specify (ü) Series to bePurchased Upon Exchange*: | |||||||
| Subscriber Status: | New | Existing | ||||||
$/Units or All Units of – Balanced Series – 2 | Balanced Series – 2 | ¨ | ¨ | |||||
$/Units or All Units of – Balanced Series – 2a | Balanced Series – 2a | ¨ | ¨ | |||||
(Balanced Series – 2a for MA, MI, OH residents only) | (Balanced Series – 2a for MA, MI, OH residents only) | |||||||
$/Units or All Units of – Campbell/Graham Series – 2 | Campbell/Graham Series – 2 | ¨ | ¨ | |||||
$/Units or All Units of – Graham Series – 2 | Graham Series – 2 | ¨ | ¨ | |||||
$/Units or All Units of – Winton Series – 2 | Winton Series – 2 | ¨ | ¨ | |||||
$/Units or All Units of – Currency Series – 2 | Currency Series – 2 | ¨ | ¨ | |||||
$/Units or All Units of – Long Only Commodity Series – 2 | Long Only Commodity Series – 2 | ¨ | ¨ | |||||
$/Units or All Units of – Long/Short Commodity Series – 2 | Long/Short Commodity Series – 2 | ¨ | ¨ | |||||
$/Units or All Units of – Managed Futures Index Series – 2 | Managed Futures Index Series – 2 | ¨ | ¨ | |||||
| * | If you are exchanging Units of one Series for Units of more than one Series, please complete a separate Exchange Request for each Series being exchanged into. |
Type or Print Current Account Name(s) | Social Security or Taxpayer ID | |||||
Street | City | State | Zip Code | |||
Selling Firm | FA Name | Branch ID | FA Number | |||
SIGNATURE(S)
SIGNATURES MUST BE IDENTICAL TO NAME(S) IN WHICH UNITS OF TRUST ARE REGISTERED
Printed Name: | Individual Owner(s) or Assignee(s), Entity1 Owner(s) or Assignee(s),or Plan Participant | Signature(s): Owner(s) or Assignee(s), Entity Owner(s) or Assignee(s),or Plan Participant (Made one signature line) | ||
| NOTE: | If the entity owner is a trustee, custodian, or fiduciary of a Plan that is an Individual Retirement Account, Keogh Plan without common law employees or Plan under which a plan participant may exercise control over assets in his account, the signature of the plan participant must also be supplied. |
IF SUBMITTED IN ACCORDANCE WITH REQUIRED PROCEDURES, THE EXCHANGE REQUEST HEREIN WILL BE EFFECTIVE AS OF TWO (2) BUSINESS DAYS AFTER THE DATE ON WHICH THIS EXCHANGE REQUEST WAS RECEIVED BY THE MANAGING OWNER, PURSUANT TO THE PROSPECTUS.
| 1 | Includes trustee, partner, or authorized officer |
C-3
Table of Contents
On back of triplicate form
I hereby request the following exchange of Units as of two (2) Business Days after your receipt of this Exchange Request, upon the terms and conditions described in the Prospectus for The Frontier Fund dated February 12, 2007. I certify that all of the statements made in my original Subscription Agreement remain accurate. I (either in my individual capacity or as an authorized representative of an entity, if applicable) hereby represent and warrant that I am the true, lawful, and beneficial owner of the Units to which this Exchange Request relates, with full power and authority to request an Exchange of such Units. Such Units are not subject to any pledge or otherwise encumbered in any fashion. I (either in my individual capacity or as an authorized representative of an entity, if applicable) hereby represent and warrant that I have received and read the applicable Appendix or Appendices to the Prospectus for the Series of Units, which are being purchased in connection with this Exchange Request. All capitalized and other defined terms used herein and not expressly defined herein shall have the same respective meaning as are assigned such terms in the final Prospectus and disclosure document of the Trust and each Series thereof, constituting a part of each registration statement on Form S-1, as amended, filed with the Securities and Exchange Commission pursuant to which the Trust registered the Limited Units of a Series, as the same may at any time and from time to time be further amended or supplemented, as the same may at any time and from time to time be amended or supplemented after the effective date(s) of such registration statement(s) (the “Prospectus”). I understand that the Managing Owner, in its sole and absolute discretion, may reject this Exchange Request.
C-4
Table of Contents
THE FRONTIER FUND
CLASS 1 UNITS REQUEST FOR REDEMPTION
, 20
(Please date)
THE FRONTIER FUND
c/o Equinox Fund Management, LLC
1660 Lincoln Street, Suite 100
Denver, Colorado 80264
Dear Sir/Madam: | B/D Investor Account #: |
Please accept my request for redemption from the indicated Frontier Fund Series.
$/Units/% in Balanced Series-1
$/Units/% in Balanced Series-1a (MA, MI, OH residents only)
$/Units/% in Campbell/Graham Series-1
$/Units/% in Graham Series-1
$/Units/% in Winton Series-1
$/Units/% in Currency Series-1
$/Units/% in Long Only Commodity Series-1
$/Units/% in Long/Short Commodity Series-1
$/Units/% in Managed Futures Index Series-1
(specify number of $/Units to be redeemed in each Series;if no dollar amount or number of Units is specified, it will be assumed that you wish to redeem ALL of your Units.)
Type or Print Current Account Name(s) | Social Security or Taxpayer ID | |||
Street | City | State | Zip Code |
Selling Firm | FA Name | Branch ID | FA Number |
SIGNATURE(S)
SIGNATURES MUST BE IDENTICAL TO NAME(S) IN WHICH UNITS OF TRUST ARE REGISTERED
Printed Name: | Individual Owner(s) or Assignee(s), Entity1 Owner(s) or Assignee(s),or Plan Participant | Signature(s): Owner(s) or Assignee(s), Entity Owner(s) or Assignee(s),or Plan Participant |
| NOTE: | If the entity owner is a trustee, custodian, or fiduciary of a Plan that is an Individual Retirement Account, Keogh Plan without common law employees or Plan under which a plan participant may exercise control over assets in his account, the signature of the plan participant must also be supplied. |
IF SUBMITTED IN ACCORDANCE WITH REQUIRED PROCEDURES, THE REDEMPTION REQUESTED HEREIN WILL BE EFFECTIVE AS OF ONE (1) BUSINESS DAYS AFTER THE DATE ON WHICH THIS REDEMPTION REQUEST WAS RECEIVED BY THE MANAGING OWNER, PURSUANT TO THE PROSPECTUS.
1 | Includes trustee, partner, or authorized officer |
D-1
Table of Contents
On back of triplicate form
All capitalized and other defined terms used herein and not expressly defined herein shall have the same respective meaning as are assigned such terms in the final Prospectus and disclosure document of the Trust and each Series thereof, constituting a part of each registration statement on Form S-1, as amended, filed with the Securities and Exchange Commission pursuant to which the Trust registered the Limited Units of a Series, as the same may at any time and from time to time be further amended or supplemented, as the same may at any time and from time to time be amended or supplemented after the effective date(s) of such registration statement(s) (the “Prospectus”). I hereby request a redemption of the dollar amount or number of Units specified below, in the Series of the Trust indicated below, subject to all of the conditions set forth in the Trust Agreement, as described in the Prospectus dated February 12, 2007.
The redemption will be effective as of the Business Day falling one (1) Business Day after receipt of the Request for Redemption by the Managing Owner (the “Redemption Date”), assuming that this Request for Redemption is received by the Managing Owner prior to 4:00 PM New York City Time on the Business Day immediately preceding the Redemption Date. The first permissible Redemption date shall be the end of the first full week of trading activity by the Series in which the Units are owned (“Units”). I understand if I am redeeming all or a portion of my Units in the Class 1 of any Series during the first twelve (12) months following the effective date of their purchase, I will be subject to a redemption fee of up to 3.0% of the Net Asset Value at which they are being redeemed; provided, however, that the amount of the redemption fee shall be reduced pro rata on a daily basis by approximately 1/365th each day following the end of the month in which I purchased such Units. I (either in my individual capacity or as an authorized representative of an entity, if applicable) hereby represent and warrant that I am the true, lawful, and beneficial owner of the Units to which this Request for Redemption relates, with full power and authority to request Redemption of such Units. Such Units are not subject to any pledge or otherwise encumbered in any fashion.
United States Taxable Limited Owners Only:
Under the penalties of perjury, I hereby certify that the Social Security Number or Taxpayer ID Number indicated on this Request for Redemption is my true, correct and complete Social Security Number or Taxpayer ID Number and that I am not subject to backup withholding under the provisions of Section 3406(a)(1)(C) of the Internal Revenue Code.
Non-United States Limited Owners Only:
Under penalties of perjury I hereby certify that (a) I am not a citizen or resident of the United States and have not been present in the United States for 183 days or more during any calendar year or (b) I am a non-United States corporation, partnership, estate or trust.
D-2
Table of Contents
EXHIBIT D
THE FRONTIER FUND
CLASS 2 UNITS REQUEST FOR REDEMPTION
, 20
(Please date)
THE FRONTIER FUND
c/o Equinox Fund Management, LLC
1660 Lincoln Street, Suite 100
Denver, Colorado 80264
Dear Sir/Madam: | B/D Investor Account #: |
Please accept my request for redemption from the indicated Frontier Fund Series.
$/Units/% in Balanced Series-2
$/Units/% in Balanced Series-2a (MA, MI, OH residents only)
$/Units/% in Campbell/Graham Series-2
$/Units/% in Graham Series-2
$/Units/% in Winton Series-2
$/Units/% in Currency Series-2
$/Units/% in Long Only Commodity Series-2
$/Units/% in Long/Short Commodity Series-2
$/Units/% in Managed Futures Index Series-2
(specify number of $/Units to be redeemed in each Series;if no dollar amount or number of Units is specified, it will be assumed that you wish to redeem ALL of your Units.)
Type or Print Current Account Name(s) | Social Security or Taxpayer ID | |||
Street | City | State | Zip Code |
Selling Firm | FA Name | Branch ID | FA Number |
SIGNATURE(S)
SIGNATURES MUST BE IDENTICAL TO NAME(S) IN WHICH UNITS OF TRUST ARE REGISTERED
Printed Name: | Individual Owner(s) or Assignee(s), Entity1 Owner(s) or Assignee(s),or Plan Participant | Signature(s): Owner(s) or Assignee(s), Entity Owner(s) or Assignee(s),or Plan Participant |
| NOTE: | If the entity owner is a trustee, custodian, or fiduciary of a Plan that is an Individual Retirement Account, Keogh Plan without common law employees or Plan under which a plan participant may exercise control over assets in his account, the signature of the plan participant must also be supplied. |
IF SUBMITTED IN ACCORDANCE WITH REQUIRED PROCEDURES, THE REDEMPTION REQUESTED HEREIN WILL BE EFFECTIVE AS OF ONE (1) BUSINESS DAYS AFTER THE DATE ON WHICH THIS REDEMPTION REQUEST WAS RECEIVED BY THE MANAGING OWNER, PURSUANT TO THE PROSPECTUS.
1 | Includes trustee, partner, or authorized officer |
D-3
Table of Contents
On back of triplicate form
All capitalized and other defined terms used herein and not expressly defined herein shall have the same respective meaning as are assigned such terms in the final Prospectus and disclosure document of the Trust and each Series thereof, constituting a part of each registration statement on Form S-1, as amended, filed with the Securities and Exchange Commission pursuant to which the Trust registered the Limited Units of a Series, as the same may at any time and from time to time be further amended or supplemented, as the same may at any time and from time to time be amended or supplemented after the effective date(s) of such registration statement(s) (the “Prospectus”). I hereby request a redemption of the dollar amount or number of Units specified below, in the Series of the Trust indicated below, subject to all of the conditions set forth in the Trust Agreement, as described in the Prospectus dated February 12, 2007.
The redemption will be effective as of the Business Day falling one (1) Business Day after receipt of the Request for Redemption by the Managing Owner (the “Redemption Date”), assuming that this Request for Redemption is received by the Managing Owner prior to 4:00 PM New York City Time on the Business Day immediately preceding the Redemption Date. The first permissible Redemption date shall be the end of the first full week of trading activity by the Series in which the Units are owned (“Units”).
United States Taxable Limited Owners Only:
Under the penalties of perjury, I hereby certify that the Social Security Number or Taxpayer ID Number indicated on this Request for Redemption is my true, correct and complete Social Security Number or Taxpayer ID Number and that I am not subject to backup withholding under the provisions of Section 3406(a)(1)(C) of the Internal Revenue Code.
Non-United States Limited Owners Only:
Under penalties of perjury I hereby certify that (a) I am not a citizen or resident of the United States and have not been present in the United States for 183 days or more during any calendar year or (b) I am a non-United States corporation, partnership, estate or trust.
D-4
Table of Contents
THE FRONTIER FUND CLASS 1
REQUEST FOR ADDITIONAL SUBSCRIPTION
, 20
(Please date)
THE FRONTIER FUND
c/o Equinox Fund Management, LLC
Dear Sir/Madam: | Existing B/D Investor Account #: |
Please accept my additional investment into the indicated Frontier Fund Series. I certify that all of the statements made in my original Subscription Agreement remain accurate and I have received and read the Trust’s Prospectus.
Specify Series and $ to bePurchased: | $ in Winton Series-1 | |
$ in Balanced Series-1 | $ in Currency Series-1 | |
$ in Balanced Series-1a (MA, MI, OH residents only) | $ in Long Only Commodity Series-1 | |
$ in Campbell/Graham Series -1 | $ in Long/Short Commodity Series-1 | |
$ in Graham Series-1 | $ in Managed Futures Index Series-1 | |
Total |
Type or Print Current Account Name(s) | Social Security or Taxpayer ID | |||||
Street (if different) | City | State | Zip Code | |||
Selling Firm | FA Name | Branch ID | FA Number | |||
SIGNATURE(S)
SIGNATURES MUST BE IDENTICAL TO NAME(S) IN WHICH UNITS OF TRUST ARE REGISTERED
| Printed Name: | Individual Owner(s) or Assignee(s), Entity1 Owner(s) or Assignee(s),or Plan Participant | Signature(s): Owner(s) or Assignee(s), Entity Owner(s) or Assignee(s),or Plan Participant |
| NOTE: | If the entity owner is a trustee, custodian, or fiduciary of a Plan that is an Individual Retirement Account, Keogh Plan without common law employees or Plan under which a plan participant may exercise control over assets in his account, the signature of the plan participant must also be supplied. |
IF SUBMITTED IN ACCORDANCE WITH REQUIRED PROCEDURES, THE ADDITIONAL SUBSCRIPTION REQUESTED HEREIN WILL BE EFFECTIVE AS TWO (2) BUSINESS DAYS AFTER THE DATE ON WHICH THIS ADDITIONAL SUBSCRIPTION REQUEST WAS RECEIVED BY THE MANAGING OWNER, PURSUANT TO THE PROSPECTUS
Existing Owner(s) of Units purchasing Units:
| (i) | If your registration information is the same as in your original Subscription Agreement and Power of Attorney, complete the above to purchase additional Units into an already exiting Series or a new Series. |
| (ii) | If your registration information has changed from the original Subscription Agreement and Power of Attorney, please complete a new Subscription Agreement. |
| 1 | Includes trustee, partner, or authorized officer |
E-1
Table of Contents
THE FRONTIER FUND CLASS 2
REQUEST FOR ADDITIONAL SUBSCRIPTION
, 20
(Please date)
THE FRONTIER FUND
c/o Equinox Fund Management, LLC
Dear Sir/Madam: | Existing B/D Investor Account #: |
Please accept my additional investment into the indicated Frontier Fund Series. I certify that all of the statements made in my original Subscription Agreement remain accurate and I have received and read the Trust’s Prospectus.
Specify Series and $ to bePurchased: | $ in Winton Series-2 | |
$ in Balanced Series-2 | $ in Currency Series-2 | |
$ in Balanced Series-2a (MA, MI, OH residents only) | $ in Long Only Commodity Series-2 | |
$ in Campbell/Graham Series -2 | $ in Long/Short Commodity Series-2 | |
$ in Graham Series-2 | $ in Managed Futures Index Series-2 | |
Total |
Type or Print Current Account Name(s) | Social Security or Taxpayer ID | |||||
Street (if different) | City | State | Zip Code | |||
Selling Firm | FA Name | Branch ID | FA Number | |||
SIGNATURE(S)
SIGNATURES MUST BE IDENTICAL TO NAME(S) IN WHICH UNITS OF TRUST ARE REGISTERED
| Printed Name: | Individual Owner(s) or Assignee(s), Entity1 Owner(s) or Assignee(s),or Plan Participant | Signature(s): Owner(s) or Assignee(s), Entity Owner(s) or Assignee(s),or Plan Participant |
| NOTE: | If the entity owner is a trustee, custodian, or fiduciary of a Plan that is an Individual Retirement Account, Keogh Plan without common law employees or Plan under which a plan participant may exercise control over assets in his account, the signature of the plan participant must also be supplied. |
IF SUBMITTED IN ACCORDANCE WITH REQUIRED PROCEDURES, THE ADDITIONAL SUBSCRIPTION REQUESTED HEREIN WILL BE EFFECTIVE AS TWO (2) BUSINESS DAYS AFTER THE DATE ON WHICH THIS ADDITIONAL SUBSCRIPTION REQUEST WAS RECEIVED BY THE MANAGING OWNER, PURSUANT TO THE PROSPECTUS
Existing Owner(s) of Units purchasing Units:
| (i) | If your registration information is the same as in your original Subscription Agreement and Power of Attorney, complete the above to purchase additional Units into an already exiting Series or a new Series. |
| (ii) | If your registration information has changed from the original Subscription Agreement and Power of Attorney, please complete a new Subscription Agreement. |
| 1 | Includes trustee, partner, or authorized officer |
E-2
Table of Contents
THE FRONTIER FUND
CLASS 1 APPLICATION FOR TRANSFER OF OWNERSHIP / RE-REGISTRATION FORM
Consistent with Section 5.3 of the amended and restated declaration of trust and trust agreement (the “Trust Agreement”) of The Frontier Fund (the “Trust”), Equinox Fund Management, LLC, the managing owner of the Trust (the “Managing Owner”), will not honor transfers of Units unless certain conditions are met. Please refer to page 2 for further clarification. (â) The Original Form must be completed entirely and returned to Equinox Fund Management, LLC, to be processed
CURRENT ACCOUNT INFORMATION Investor Account Name
| Specify Series of Units being Transferred (check appropriate box(es)) and Total $/Units or % Amount: | ||||||||||||||||||||||||||||||||||||||||
| B/D Investor Account Number | ||||||||||||||||||||||||||||||||||||||||
| ¨ Balanced Series-1 | $/Units/% | ¨ Winton Series -1 | $/Units/% | |||||||||||||||||||||||||||||||||||||
| ¨ Balanced Series-1a (MA, MI, OH residents only) | $/Units/% | ¨ Currency Series -1 ¨ Long Only Series -1 | $/Units/% $/Units/% | |||||||||||||||||||||||||||||||||||||
| ¨ Campbell/Graham Series -1 | $/Units/% | ¨ Long/Short Commodity Series - -1 | $/Units/% | |||||||||||||||||||||||||||||||||||||
| ¨ Graham Series -1 | $/Units/% | ¨ Managed Futures Index Series - -1 | $/Units/% | |||||||||||||||||||||||||||||||||||||
| TOTAL | $/Units/% | |||||||||||||||||||||||||||||||||||||||
Current F.A. Name | Branch ID | FA. Number | ||||||||||||||||||||||||||||||||||||||
The transferor hereby makes application to transfer and assign, subject to the Managing Owner’s rights, to the transferee all Units, as set forth above, and for the transferee to succeed to such Units as a Substitute Limited Owner thereof. The transferor hereby certifies and represents possession of valid title and all requisite power to assign such Units and that the assignment is in accordance with applicable laws and regulations and further certifies, under penalty of law, the following:
REASON FOR TRANSFER (Check One)
Change of Financial Advisor Re-registration Death** Gift Other (please specify)
**Please include a death certificate, as well as evidence of bequest, such as IRA beneficiary form or probate certificate
Must be signed by the registered holder(s) / Custodian, exactly as names appear on original subscription agreement.
Signature Guaranteed by: DATE1
** Signature must be guaranteed by a bank or broker-dealer. **
Current Investors Signature | Date | |||||||||||||
Current Joint Investor’s Signature/ Custodian Signature | Date | |||||||||||||
Current Selling Firm Signature | Date | |||||||||||||
Current Financial Advisor Signature | Date | |||||||||||||
NEW ACCOUNT INFORMATION ¨ New Subscriber(s) ¨ Existing Owner(s)
The transferee hereby makes application to accept, subject to the Managing Owner’s rights, from the transferor all Units and intends to succeed the transferor as a Substitute Limited Owner and agrees to accept all the terms and conditions of the Prospectus and related documents.
B/D Investor Account Number | Social Security # — — or | |
| Taxpayer ID# |
Full Registration Name of Subscriber(s) (No Initials): including Individuals, Partnerships, Joint Partnership, Estates, Trusts, and Corporations | ||
Resident Address of Subscriber | ||
Street (P.O. Box not acceptable) City State Zip Code Telephone Number | ||
Mailing Address | ||
(if different) Street (P.O. Box acceptable) City State Zip Code Telephone Number | ||
Custodian Name Street (P.O. Box not acceptable) City State Zip Code Telephone Number | ||
REGISTRATION TYPE ***For certain types of transfers additional documentation may be required.***
As you want it to appear in the partnership record (check one)
| Taxable Investors (check one): | ||||||
¨ Individual Ownership | ¨ Tenants in Common | ¨ Estate | ¨ UGMA/UTMA (Minor) | |||
¨ Partnership | ¨ Joint Tenants with Right of Survivorship | ¨ Grantor or Other Revocable Trust | ¨ Community Property | |||
¨ Corporation | ¨ Tenants in Entirety | ¨ Trust other than a Grantor or Revocable Trust | ||||
Non-Taxable Investors (check one) | ||||||
¨ IRA | ¨ Profit Sharing | ¨ Pension | ¨ Other (specify) | |||
¨ IRA Rollover | ¨ Defined Benefit | ¨ SEP | ||||
By signing, Investor (transferee) makes the representations and agreements written on the reverse side of this form.
New Investors Signature | Date | |
New Joint Investor Signature/ Custodian Signature | Date |
Must be signed by the transferee as indicated in the Registration section of this form. If signature is by trustee(s), executor(s), administrator(s), guardian(s), attorney(s)-in-fact, agent(s), officers(s) of a corporation or another acting in a fiduciary or representative capacity, please indicate capacity.
NEW FINANCIAL ADVISOR / SELLING FIRM INFORMATION (Mandatory)
New Selling Firm New F.A. Name (print clearly for proper credit) F.A. Signature |
F.A. Phone F.A. Fax F.A. Email Address Branch ID FA. Number |
F.A. Address(for confirmations) Street Address City State Zip Code |
1 | Not necessary if only changing Financial Advisor |
F-1
Table of Contents
**The Original Form must be Completed Entirely and Returned to Equinox Fund Management, LLC, to be processed.**
Transfers
Please be advised that the Managing Owner is presently unable to honor the transfer request of a limited owner that does not meet the criteria stated in the Trust Agreement (Section 5.3.), which include, but are not limited to, the following:
It is the Managing Owner’s policy, consistent with Section 5.3 of the Trust Agreement, to prohibit transfers of Units unless the following conditions are met:
(a) the written consent of the Managing Owner to such substitution is obtained;
(b) a duly executed and acknowledged written instrument of assignment has been filed with the Trust setting forth the intention of the assignor that the permitted assignee become a substituted Limited Owner in his place;
(c) the assignor and permitted assignee execute and acknowledge and/or deliver such other instruments as the Managing Owner may deem necessary or desirable to effect such admission, including his execution, acknowledgment and delivery to the Managing Owner, as a counterpart to the Trust Agreement, of a Power of Attorney in the form set forth in the Subscription Agreement; and
(d) upon the request of the Managing Owner, an opinion of the Trust’s legal counsel is obtained to the effect that (i) the assignment will not jeopardize the Trust’s tax classification as a partnership and (ii) the assignment does not violate the Trust Agreement or the Delaware Statutory Trust Act.
In the alternative, the Limited Owner may redeem his or her Units in accordance with the Prospectus.
Please review Section 5.3 of the Trust Agreement to ensure that the assignment is in compliance with the requirements set forth therein.
California Residents:
It is unlawful to consummate a transfer or sale of Units, or to receive any compensation therefore, without the pre-written consent of the Commissioner of Corporation of the State of California, except as permitted by the Commissioner’s rules.
In connection with my acceptance of this transfer of Units, I do hereby irrevocably constitute and appoint the Managing Owner and its successors and assigns, as my true and lawful Attorney-in-Fact, with full power of substitution, in my name, place and stead, to (i) file, prosecute, defend, settle or compromise litigation, claims or arbitrations on behalf of the Trust and Series and (ii) make, execute, sign, acknowledge, swear to, deliver, record and file any documents or instruments which may be considered necessary or desirable by the Managing Owner to carry out fully the provisions of the Declaration of Trust and Trust Agreement of the Trust, including, without limitation, the execution of the said Agreement itself, the execution of all amendments permitted by the terms thereof and the payment to the Managing Owner of the management fees and incentive fees provided for therein. The Power of Attorney granted hereby shall be deemed to be coupled with an interest, shall be irrevocable, shall survive, and shall not be affected by, my subsequent death, incapacity, disability, insolvency or dissolution or any delivery by me of an assignment of the whole or any portion of my Units.
F-2
Table of Contents
THE FRONTIER FUND
CLASS 2 APPLICATION FOR TRANSFER OF OWNERSHIP / RE-REGISTRATION FORM
Consistent with Section 5.3 of amended and restated declaration of trust and trust agreement (the “Trust Agreement”) of The Frontier Fund (the “Trust”), Equinox Fund Management, LLC, the managing owner of the Trust (the “Managing Owner”) will not honor transfers of Units unless certain conditions are met. Please refer to page 2 for further clarification. (â) The Original Form must be completed entirely and returned to Equinox Fund Management, LLC, to be processed
CURRENT ACCOUNT INFORMATION Investor Account Name
| Specify Series of Units being Transferred (check appropriate box(es)) and Total $/Units or % Amount: | ||||||||||||||||||||||||||||||||||||||||
| B/D Investor Account Number | ||||||||||||||||||||||||||||||||||||||||
| ¨ Balanced Series-2 | $/Units/% | ¨ Winton Series -2 | $/Units/% | |||||||||||||||||||||||||||||||||||||
| ¨ Balanced Series-2a (MA, MI, OH residents only) | $/Units/% | ¨ Currency Series -2 ¨ Long Only Series -2 | $/Units/% $/Units/% | |||||||||||||||||||||||||||||||||||||
| ¨ Campbell/Graham Series -2 | $/Units/% | ¨ Long/Short Commodity Series - -2 | $/Units/% | |||||||||||||||||||||||||||||||||||||
| ¨ Graham Series -2 | $/Units/% | ¨ Managed Futures Index Series - -2 | $/Units/% | |||||||||||||||||||||||||||||||||||||
| TOTAL | $/Units/% | |||||||||||||||||||||||||||||||||||||||
Current F.A. Name | Branch ID | FA. Number | ||||||||||||||||||||||||||||||||||||||
The transferor hereby makes application to transfer and assign, subject to the Managing Owner’s rights, to the transferee all Units, as set forth above, and for the transferee to succeed to such Units as a Substitute Limited Owner thereof. The transferor hereby certifies and represents possession of valid title and all requisite power to assign such Units and that the assignment is in accordance with applicable laws and regulations and further certifies, under penalty of law, the following:
REASON FOR TRANSFER (Check One)
Change of Financial Advisor Re-registration Death** Gift Other (please specify)
**Please include a death certificate, as well as evidence of bequest, such as IRA beneficiary form or probate certificate
Must be signed by the registered holder(s) / Custodian, exactly as names appear on original subscription agreement.
Signature Guaranteed by: DATE2
** Signature must be guaranteed by a bank or broker-dealer. **
Current Investors Signature | Date | |||||||||||||
Current Joint Investor’s Signature/ Custodian Signature | Date | |||||||||||||
Current Selling Firm Signature | Date | |||||||||||||
Current Financial Advisor Signature | Date | |||||||||||||
NEW ACCOUNT INFORMATION ¨ New Subscriber(s) ¨ Existing Owner(s)
The transferee hereby makes application to accept, subject to the Managing Owner’s rights, from the transferor all Units and intends to succeed the transferor as a Substitute Limited Owner and agrees to accept all the terms and conditions of the Prospectus and related documents.
B/D Investor Account Number | Social Security # — — or | |
| Taxpayer ID# |
Full Registration Name of Subscriber(s) (No Initials): including Individuals, Partnerships, Joint Partnership, Estates, Trusts, and Corporations | ||||
Resident Address of Subscriber | ||||
Street (P.O. Box not acceptable) City State Zip Code Telephone Number | ||||
Mailing Address | ||||
(if different) Street (P.O. Box acceptable) City State Zip Code Telephone Number | ||||
Custodian Name Street (P.O. Box not acceptable) City State Zip Code Telephone Number | ||||
REGISTRATION TYPE ***For certain types of transfers additional documentation may be required.***
As you want it to appear in the partnership record (check one)
| Taxable Investors (check one): | ||||||
¨ Individual Ownership | ¨ Tenants in Common | ¨ Estate | ¨ UGMA/UTMA (Minor) | |||
¨ Partnership | ¨ Joint Tenants with Right of Survivorship | ¨ Grantor or Other Revocable Trust | ¨ Community Property | |||
¨ Corporation | ¨ Tenants in Entirety | ¨ Trust other than a Grantor or Revocable Trust | ||||
Non-Taxable Investors (check one) | ||||||
¨ IRA | ¨ Profit Sharing | ¨ Pension | ¨ Other (specify) | |||
¨ IRA Rollover | ¨ Defined Benefit | ¨ SEP | ||||
By signing, Investor (transferee) makes the representations and agreements written on the reverse side of this form.
New Investors Signature | Date | |
New Joint Investor Signature/ Custodian Signature | Date |
Must be signed by the transferee as indicated in the Registration section of this form. If signature is by trustee(s), executor(s), administrator(s), guardian(s), attorney(s)-in-fact, agent(s), officers(s) of a corporation or another acting in a fiduciary or representative capacity, please indicate capacity.
NEW FINANCIAL ADVISOR / SELLING FIRM INFORMATION (Mandatory)
New Selling Firm New F.A. Name (print clearly for proper credit) F.A. Signature |
F.A. Phone F.A. Fax F.A. Email Address Branch ID FA. Number |
F.A. Address(for confirmations) Street Address City State Zip Code |
2 | Not necessary if only changing Financial Advisor |
F-3
Table of Contents
**The Original Form must be Completed Entirely and Returned to Equinox Fund Management, LLC, to be processed.**
Transfers
Please be advised that the Managing Owner is presently unable to honor the transfer request of a limited owner that does not meet the criteria stated in the Trust Agreement (Section 5.3.), which include, but are not limited to, the following:
It is the Managing Owner’s policy, consistent with Section 5.3 of the Trust Agreement, to prohibit transfers of Units unless the following conditions are met:
(a) the written consent of the Managing Owner to such substitution is obtained;
(b) a duly executed and acknowledged written instrument of assignment has been filed with the Trust setting forth the intention of the assignor that the permitted assignee become a substituted Limited Owner in his place;
(c) the assignor and permitted assignee execute and acknowledge and/or deliver such other instruments as the Managing Owner may deem necessary or desirable to effect such admission, including his execution, acknowledgment and delivery to the Managing Owner, as a counterpart to the Trust Agreement, of a Power of Attorney in the form set forth in the Subscription Agreement; and
(d) upon the request of the Managing Owner, an opinion of the Trust’s legal counsel is obtained to the effect that (i) the assignment will not jeopardize the Trust’s tax classification as a partnership and (ii) the assignment does not violate the Trust Agreement or the Delaware Statutory Trust Act.
In the alternative, the Limited Owner may redeem his or her Units in accordance with the Prospectus.
Please review Section 5.3 of the Trust Agreement to ensure that the assignment is in compliance with the requirements set forth therein.
California Residents:
It is unlawful to consummate a transfer or sale of Units, or to receive any compensation therefore, without the pre-written consent of the Commissioner of Corporation of the State of California, except as permitted by the Commissioner’s rules.
In connection with my acceptance of this transfer of Units, I do hereby irrevocably constitute and appoint the Managing Owner and its successors and assigns, as my true and lawful Attorney-in-Fact, with full power of substitution, in my name, place and stead, to (i) file, prosecute, defend, settle or compromise litigation, claims or arbitrations on behalf of the Trust and Series and (ii) make, execute, sign, acknowledge, swear to, deliver, record and file any documents or instruments which may be considered necessary or desirable by the Managing Owner to carry out fully the provisions of the Declaration of Trust and Trust Agreement of the Trust, including, without limitation, the execution of the said Agreement itself, the execution of all amendments permitted by the terms thereof and the payment to the Managing Owner of the management fees and incentive fees provided for therein. The Power of Attorney granted hereby shall be deemed to be coupled with an interest, shall be irrevocable, shall survive, and shall not be affected by, my subsequent death, incapacity, disability, insolvency or dissolution or any delivery by me of an assignment of the whole or any portion of my Units.
F-4
Table of Contents
PRIVACY NOTICE
The importance of protecting the investors’ privacy is recognized by The Frontier Fund (the “Trust”) and Equinox Fund Management, LLC (the “Managing Owner”). The Trust and the Managing Owner protect personal information they collect about you by maintaining physical, electronic and procedural safeguards to maintain the confidentiality and security of such information.
Categories Of Information Collected. In the normal course of business, the Trust and the Managing Owner may collect the following types of information concerning investors in the Trust who are natural persons:
| • | Information provided in the Subscription Agreements and other forms (including name, address, social security number, income and other financial-related information); and |
| • | Data about investor transactions (such as the types of investments the investors have made and their account status). |
How the Collected Information is Used. Any and all nonpublic personal information received by the Trust or the Managing Owner with respect to the investors who are natural persons, including the information provided to the Trust by such an investor in the Subscription Agreement, will not be shared with nonaffiliated third parties which are not service providers to the Trust or the Managing Owner without prior notice to such investors. Such service providers include but are not limited to the Selling Agents, Clearing Broker, administrators, auditors and the legal advisers of the Trust. Additionally, the Trust and/or the Managing Owner may disclose such nonpublic personal information as required by applicable laws, statutes, rules and regulations of any government, governmental agency or self-regulatory organization or a court order. The same privacy policy will also apply to the former Limited Owners.
For questions about this privacy policy, please contact the Trust.
G-1
Table of Contents
Until May 13, 2007, (90 days after the date of this Prospectus), all dealers effecting transactions in the registered securities whether or not participating in the distribution, may be required to deliver a Prospectus. This requirement is in addition to the obligation of dealers to deliver a Prospectus when acting as underwriters.