UNITED STATES
SECURITIES AND EXCHANGE COMMISSION
Washington, D.C. 20549
FORM 10-K
| |
☑ | ANNUAL REPORT PURSUANT TO SECTION 13 OR 15(d) OF THE SECURITIES EXCHANGE ACT OF 1934 |
For the fiscal year ended December 31, 2024
OR
| |
☐ | TRANSITION REPORT PURSUANT TO SECTION 13 OR 15(d) OF THE SECURITIES EXCHANGE ACT OF 1934 |
For the transition period from _____ to _____
Commission File Number: 001-34991

TARGA RESOURCES CORP.
(Exact name of registrant as specified in its charter)
| | |
Delaware |
| 20-3701075 |
(State or other jurisdiction of incorporation or organization) |
| (I.R.S. Employer Identification No.) |
|
|
|
811 Louisiana Street, Suite 2100, Houston, Texas |
| 77002 |
(Address of principal executive offices) |
| (Zip Code) |
(713) 584-1000
(Registrant’s telephone number, including area code)
Securities registered pursuant to section 12(b) of the Act:
| | | | |
Title of each class | | Trading Symbol(s) | | Name of each exchange on which registered |
Common Stock | | TRGP | | New York Stock Exchange |
Securities registered pursuant to section 12(g) of the Act: None
Indicate by check mark if the registrant is a well-known seasoned issuer, as defined in Rule 405 of the Securities Act. Yes ☑ No ☐
Indicate by check mark if the registrant is not required to file reports pursuant to Section 13 or Section 15(d) of the Act. Yes ☐ No ☑
Indicate by check mark whether the registrant (1) has filed all reports required to be filed by Section 13 or 15(d) of the Securities Exchange Act of 1934 during the preceding 12 months (or for such shorter period that the registrant was required to file such reports), and (2) has been subject to such filing requirements for the past 90 days. Yes ☑ No ☐
Indicate by check mark whether the registrant has submitted electronically every Interactive Data File required to be submitted pursuant to Rule 405 of Regulation S-T (§232.405 of this chapter) during the preceding 12 months (or for such shorter period that the registrant was required to submit such files). Yes ☑ No ☐
Indicate by check mark whether the registrant is a large accelerated filer, an accelerated filer, a non-accelerated filer, a smaller reporting company, or an emerging growth company. See the definitions of “large accelerated filer,” “accelerated filer,” “smaller reporting company” and “emerging growth company” in Rule 12b-2 of the Exchange Act.
| | | | |
| | | | |
Large accelerated filer | ☑ |
| Accelerated filer | ☐ |
Non-accelerated filer | ☐ | | Smaller reporting company | ☐ |
| | | Emerging growth company | ☐ |
If an emerging growth company, indicate by check mark if the registrant has elected not to use the extended transition period for complying with any new or revised financial accounting standards provided pursuant to Section 13(a) of the Exchange Act. ☐
Indicate by check mark whether the registrant has filed a report on and attestation to its management’s assessment of the effectiveness of its internal control over financial reporting under Section 404(b) of the Sarbanes-Oxley Act (15 U.S.C. 7262(b)) by the registered public accounting firm that prepared or issued its audit report. ☑
If securities are registered pursuant to Section 12(b) of the Act, indicate by check mark whether the financial statements of the registrant included in the filing reflect the correction of an error to previously issued financial statements. ☐
Indicate by check mark whether any of those error corrections are restatements that required a recovery analysis of incentive-based compensation received by any of the registrant’s executive officers during the relevant recovery period pursuant to §240.10D-1(b). ☐
Indicate by check mark whether the registrant is a shell company (as defined in Rule 12b-2 of the Exchange Act). Yes ☐ No ☑
The aggregate market value of the common stock held by non-affiliates of the registrant was $27,824.1 million on June 30, 2024, based on $128.78 per share, the closing price of the common stock as reported on the New York Stock Exchange (NYSE) on such date.
As of February 14, 2025, there were 218,106,765 shares of the registrant’s common stock, $0.001 par value, outstanding.
DOCUMENTS INCORPORATED BY REFERENCE
Portions of the registrant’s definitive proxy statement for the 2025 Annual Meeting of Stockholders, to be filed no later than 120 days after the end of the fiscal year to which this Annual Report on Form 10-K relates, are incorporated by reference into Part III of this Annual Report on Form 10-K.
Total number of pages (excluding Exhibits): 137
TABLE OF CONTENTS
CAUTIONARY STATEMENT ABOUT FORWARD-LOOKING STATEMENTS
Targa Resources Corp.’s (together with its subsidiaries, including Targa Resources Partners LP (the “Partnership”), “we,” “us,” “our,” “Targa,” “TRGP,” or the “Company”) reports, filings and other public announcements may from time to time contain statements that do not directly or exclusively relate to historical facts. Such statements are “forward-looking statements.” You can typically identify forward-looking statements within the meaning of Section 27A of the Securities Act of 1933, as amended, and Section 21E of the Securities Exchange Act of 1934, as amended, by the use of forward-looking statements, such as “may,” “could,” “project,” “believe,” “anticipate,” “expect,” “estimate,” “potential,” “plan,” “forecast” and other similar words.
All statements that are not statements of historical facts, including statements regarding our future financial position, business strategy, budgets, projected costs and plans and objectives of management for future operations, are forward-looking statements.
These forward-looking statements reflect our intentions, plans, expectations, assumptions and beliefs about future events and are subject to risks, uncertainties and other factors, many of which are outside our control. Important factors that could cause actual results to differ materially from the expectations expressed or implied in the forward-looking statements include known and unknown risks. Known risks and uncertainties include, but are not limited to, the following risks and uncertainties:
•the level and success of crude oil and natural gas drilling around our assets, our success in connecting natural gas supplies to our gathering and processing systems, oil supplies to our gathering systems and natural gas liquid supplies to our logistics and transportation facilities and our success in connecting our facilities to transportation services and markets;
•actions taken by other countries with significant hydrocarbon production;
•the timing and extent of changes in natural gas, natural gas liquids, crude oil and other commodity prices, interest rates and demand for our services;
•our ability to grow through internal growth capital projects or acquisitions and the successful integration and future performance of such assets;
•the timing and success of business development efforts;
•our ability to timely obtain and maintain necessary licenses, permits and other approvals;
•industry changes, including the impact of consolidation, changes in competition and the addition of alternative forms of energy for oil, gas and NGLs;
•downside commodity price volatility from a variety of potential factors that can result in lower activity in our areas of operation;
•our success in risk management activities, including the use of derivative instruments to hedge commodity price risks;
•general economic, market and business conditions;
•the potential impact of significant public health crises and their impact on demand for oil, gas and NGLs;
•weather and other natural phenomena, and related impacts;
•our ability to access the capital markets, which will depend on general market conditions, including the impact of interest rates, associated Federal Reserve policies, the economy, our credit ratings and leverage levels, and demand for our common equity, senior notes and commercial paper;
•the amount of collateral required to be posted from time to time in our transactions;
•the level of creditworthiness of counterparties to various transactions with us;
•the impact of disruptions in the bank and capital markets, and our ability to obtain capital or financing on favorable terms, or at all;
•changes in laws and regulations, particularly with regard to taxes, tariffs and international trade, safety and the protection of the environment; and
•the risks described elsewhere in “Item 1A. Risk Factors” in this Annual Report and our reports and registration statements filed from time to time with the United States Securities and Exchange Commission (“SEC”).
Although we believe that the assumptions underlying our forward-looking statements are reasonable, any of the assumptions could be inaccurate, and, therefore, we cannot assure you that the forward-looking statements included in this Annual Report will prove to be
accurate. Some of these and other risks and uncertainties that could cause actual results to differ materially from such forward-looking statements are more fully described in “Item 1A. Risk Factors” in this Annual Report. Except as may be required by applicable law, we undertake no obligation to publicly update or advise of any change in any forward-looking statement, whether as a result of new information, future events or otherwise.
As generally used in the energy industry and in this Annual Report, the identified terms have the following meanings:
| | |
Bbl | | Barrels (equal to 42 U.S. gallons) |
BBtu | | Billion British thermal units |
Bcf | | Billion cubic feet |
Btu | | British thermal units, a measure of heating value |
/d | | Per day |
FERC | | Federal Energy Regulatory Commission |
GAAP | | Accounting principles generally accepted in the United States of America |
gal | | U.S. gallons |
LPG | | Liquefied petroleum gas |
MBbl | | Thousand barrels |
MMBbl | | Million barrels |
MMBtu | | Million British thermal units |
MMcf | | Million cubic feet |
MMgal | | Million U.S. gallons |
NGL(s) | | Natural gas liquid(s) |
NYMEX | | New York Mercantile Exchange |
NYSE | | New York Stock Exchange |
SCOOP | | South Central Oklahoma Oil Province |
SOFR | | Secured Overnight Financing Rate |
STACK | | Sooner Trend, Anadarko, Canadian and Kingfisher |
VLGC | | Very large gas carrier |
PART I
Item 1. Business
The following section of this Form 10-K generally refers to business developments during the year ended December 31, 2024. Discussion of prior period business developments that are not included in this Form 10-K can be found in “Part I, Item 1. Business” of our Annual Report on Form 10-K for the year ended December 31, 2023.
Overview
Targa Resources Corp. (NYSE: TRGP) is a publicly traded Delaware corporation formed in October 2005. Targa is a leading provider of midstream services and is one of the largest independent infrastructure companies in North America. We own, operate, acquire, and develop a diversified portfolio of complementary domestic infrastructure assets.
Our Operations
We are engaged primarily in the business of:
•gathering, compressing, treating, processing, transporting, and purchasing and selling natural gas;
•transporting, storing, fractionating, treating, and purchasing and selling NGLs and NGL products, including services to LPG exporters; and
•gathering, storing, terminaling, and purchasing and selling crude oil.
To provide these services, we operate in two primary segments: (i) Gathering and Processing, and (ii) Logistics and Transportation (also referred to as our Downstream Business).
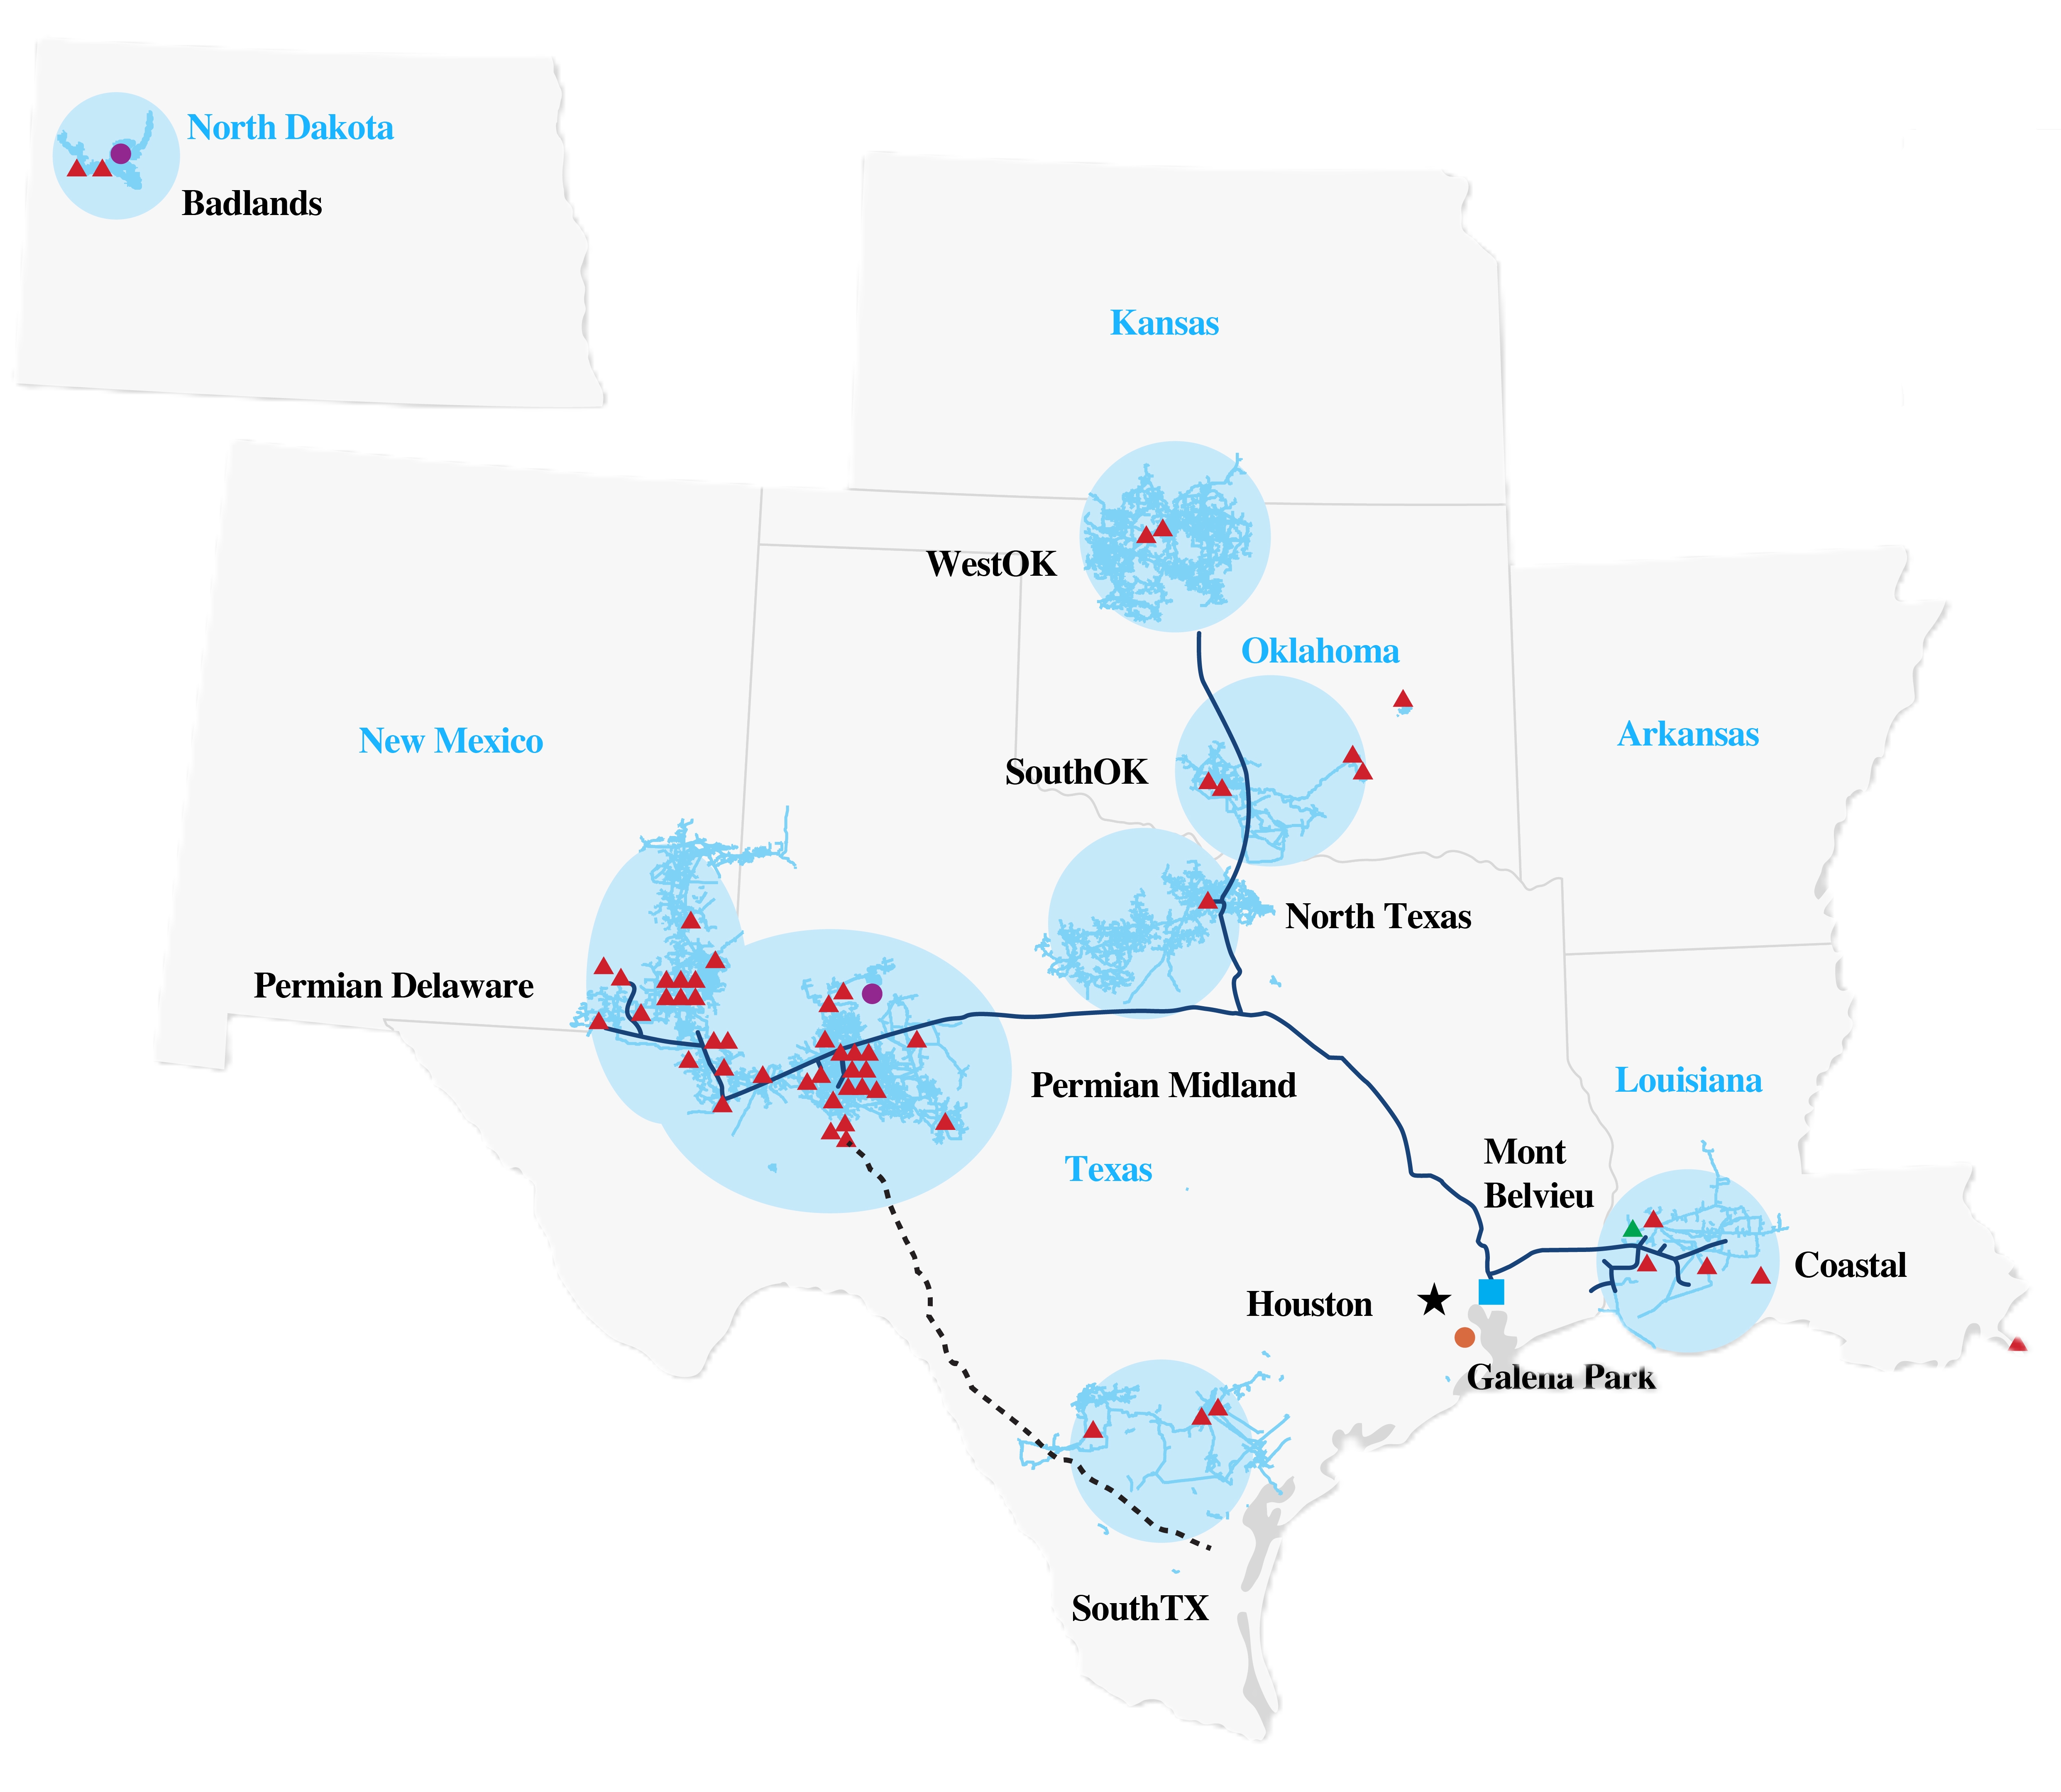
Our Gathering and Processing segment includes assets used in the gathering and/or purchase and sale of natural gas produced from oil and gas wells, removing impurities and processing this raw natural gas into merchantable natural gas by extracting NGLs; and assets used for the gathering and terminaling and/or purchase and sale of crude oil. The Gathering and Processing segment’s assets are located in the Permian Basin of West Texas and Southeast New Mexico (including the Midland, Central and Delaware Basins); the Eagle Ford Shale in South Texas; the Barnett Shale in North Texas; the Anadarko, Ardmore, and Arkoma Basins in Oklahoma (including the SCOOP and STACK) and South Central Kansas; the Williston Basin in North Dakota (including the Bakken and Three Forks plays); and the onshore and near offshore regions of the Louisiana Gulf Coast.
Our Logistics and Transportation segment includes the activities and assets necessary to convert mixed NGLs into NGL products and also includes other assets and value-added services such as transporting, storing, fractionating, terminaling, and marketing of NGLs and NGL products, including services to LPG exporters and certain natural gas supply and marketing activities in support of our other businesses. The Logistics and Transportation segment also includes the Grand Prix NGL Pipeline (“Grand Prix”), which connects our gathering and processing positions in the Permian Basin, Southern Oklahoma and North Texas with our Downstream facilities in Mont Belvieu, Texas. Our Downstream facilities are located predominantly in Mont Belvieu and Galena Park, Texas, and in Lake Charles, Louisiana.
Other contains the unrealized mark-to-market gains/losses related to derivative contracts that were not designated as cash flow hedges.
The map below highlights our more significant assets as of December 31, 2024:
Recent Developments
In response to increasing production and to meet the infrastructure needs of producers and our downstream customers, our major expansion projects include the following:
Permian Midland Processing Expansions
•In August 2023, we announced the construction of a new 275 MMcf/d cryogenic natural gas processing plant in Permian Midland (the “Greenwood II plant”). The Greenwood II plant commenced operations early in the fourth quarter of 2024.
•In May 2024, we announced the construction of a new 275 MMcf/d cryogenic natural gas processing plant in Permian Midland (the “Pembrook II plant”). The Pembrook II plant is expected to begin operations in the fourth quarter of 2025.
•In August 2024, we announced the construction of a new 275 MMcf/d cryogenic natural gas processing plant in Permian Midland (the “East Pembrook plant”). The East Pembrook plant is expected to begin operations in the second quarter of 2026.
•In November 2024, we announced the construction of a new 275 MMcf/d cryogenic natural gas processing plant in Permian Midland (the “East Driver plant”). The East Driver plant is expected to begin operations in the third quarter of 2026.
Permian Delaware Processing Expansions
•In February 2023, we announced the transfer of an existing cryogenic natural gas processing plant acquired in the purchase of Southcross Energy Operating LLC and its subsidiaries to the Permian Delaware. The plant was installed as a new 230 MMcf/d cryogenic natural gas processing plant (the “Roadrunner II plant”). The Roadrunner II plant commenced operations in the second quarter of 2024.
•In August 2023, we announced the construction of a new 275 MMcf/d cryogenic natural gas processing plant in Permian Delaware (the “Bull Moose plant”). The Bull Moose plant commenced operations in the first quarter of 2025.
•In August 2024, we announced the construction of a new 275 MMcf/d cryogenic natural gas processing plant in Permian Delaware (the “Bull Moose II plant”). The Bull Moose II plant is expected to begin operations in the first quarter of 2026.
•In November 2024, we announced the construction of a new 275 MMcf/d cryogenic natural gas processing plant in Permian Delaware (the “Falcon II plant”). The Falcon II plant is expected to begin operations in the second quarter of 2026.
Fractionation Expansions
•In August 2022, we announced plans to construct a new 120 MBbl/d fractionation train in Mont Belvieu, Texas (“Train 9”). Train 9 commenced operations in the second quarter of 2024.
•In January 2023, we reached an agreement with our partners in Gulf Coast Fractionators (“GCF”) to reactivate GCF’s 135 MBbl/d fractionation facility. We expect the reactivation of GCF to be complete and the facility to be operational in the first quarter of 2025.
•In May 2023, we announced plans to construct a new 120 MBbl/d fractionation train in Mont Belvieu, Texas (“Train 10”). Train 10 commenced operations in the fourth quarter of 2024.
•In May 2024, we announced plans to construct a new 150 MBbl/d fractionation train in Mont Belvieu, Texas (“Train 11”). Train 11 is expected to begin operations in the third quarter of 2026.
•In February 2025, we announced plans to construct a new 150 MBbl/d fractionation train in Mont Belvieu, Texas (“Train 12”). Train 12 is expected to begin operations in the first quarter of 2027.
NGL Pipeline Expansions
•In November 2022, we announced plans to construct a new NGL pipeline (the “Daytona NGL Pipeline”) as an addition to our common carrier Grand Prix system. The pipeline transports NGLs from the Permian Basin and connects to the 30-inch diameter segment of Grand Prix in North Texas, where volumes are transported to our fractionation and storage complex in the NGL market hub at Mont Belvieu, Texas. The Daytona NGL Pipeline commenced operations in the third quarter of 2024 and is operating in conjunction with Grand Prix.
•In February 2025, we announced an intra-Delaware Basin expansion of our Grand Prix pipeline system in the Permian Delaware. The expansion is expected to begin operations in the third quarter of 2026.
LPG Export Expansion
•In February 2025, we announced an expansion of our LPG export capabilities at our Galena Park Marine Terminal. With the addition of a new pipeline from Mont Belvieu to Galena Park and additional refrigeration, our effective export capacity will increase up to 19 MMBbl per month, depending upon the mix of propane and butane demand, vessel size and availability of supply, among other factors. The expansion is expected to be completed in the third quarter of 2027.
Joint Ventures
On July 31, 2024, we entered into an agreement with WPC Parent, LLC (“WPC”) to move forward with the construction of the Blackcomb pipeline. The Blackcomb pipeline is designed to transport up to 2.5 Bcf/d of natural gas through approximately 365 miles of 42-inch pipeline from the Permian Basin in West Texas to the Agua Dulce area in South Texas, and is expected to be in service in the second half of 2026, pending the receipt of customary regulatory and other approvals. The Blackcomb pipeline is held by a joint venture (“Blackcomb”), which is owned 70.0% by WPC, 17.5% by Targa, and 12.5% by MPLX LP. WPC is a joint venture owned 50.6% by WhiteWater Midstream, LLC, 30.4% by MPLX LP, and 19.0% by Enbridge Inc. During 2024, we made capital contributions of $28.7 million to Blackcomb.
On December 16, 2024, we completed the acquisition of the remaining 12% membership interest in Cedar Bayou Fractionators, L.P. (“CBF”) from our joint venture partner for cash consideration of $111.6 million (the “CBF Acquisition”).
On February 18, 2025, we entered into an agreement with funds managed by Blackstone to acquire their 45% interest in Targa Badlands LLC (“Targa Badlands”) for aggregate consideration of approximately $1.8 billion (the “Badlands Transaction”). Following the closing of the Badlands Transaction, we will own 100% of the interest in Targa Badlands.
For additional information, see Note 4 – Acquisitions and Divestitures to our Consolidated Financial Statements.
Capital Allocation
In April 2024, we declared an increase to our quarterly common dividend to $0.75 per common share or $3.00 per common share annualized effective for the first quarter of 2024.
In May 2023, our Board of Directors approved a $1.0 billion common share repurchase program (the “2023 Share Repurchase Program”). In July 2024, our Board of Directors approved a new $1.0 billion common share repurchase program (the “2024 Share Repurchase Program” and, together with the 2023 Share Repurchase Program, the “Share Repurchase Programs”). The amount authorized under the 2024 Share Repurchase Program was in addition to the amount remaining under the 2023 Share Repurchase Program. We are not obligated to repurchase any specific dollar amount or number of shares under the Share Repurchase Programs and may discontinue these programs at any time.
In the fourth quarter of 2024 and for the year ended December 31, 2024, we repurchased 610,683 and 5,933,050 shares of our common stock at a weighted average per share price of $176.86 and $127.20 for a total net cost of $108.0 million and $754.7 million, respectively. As of December 31, 2024, there was $1,015.4 million remaining under the Share Repurchase Programs.
Financing Activities
In August 2024, we completed an underwritten public offering of $1.0 billion aggregate principal amount of our 5.500% Senior Unsecured Notes due 2035 (the “5.500% Notes”), resulting in net proceeds of approximately $990.1 million. We used the net proceeds from the issuance to repay borrowings under the Commercial Paper Program, a portion of which were incurred to repay the remaining balance under the $1.5 billion unsecured term loan facility due July 2025 (the “Term Loan Facility”), and for general corporate purposes.
In August 2024, the Partnership amended its $600.0 million accounts receivable securitization facility (the “Securitization Facility”) to, among other things, extend the termination date of the Securitization Facility to August 29, 2025.
In February 2024, Standard & Poor’s Financial Services LLC (“S&P”) upgraded our corporate investment grade credit rating to ‘BBB’ from ‘BBB-’. In August 2024, Fitch Ratings Inc. (“Fitch”) upgraded our corporate investment grade credit rating to ‘BBB’ from ‘BBB-’. In October 2024, Moody’s Ratings (“Moody’s”) upgraded our corporate investment grade credit rating to ‘Baa2’ from ‘Baa3’.
In February 2025, we entered into a Credit Agreement with Bank of America, N.A., as the Administrative Agent and Swing Line Lender, the letter of credit issuers party thereto and the other lenders party thereto (the “New TRGP Revolver”). The New TRGP Revolver provides for a revolving credit facility in an initial aggregate principal amount up to $3.5 billion and matures on February 18, 2030. The maturity date is extendable, subject to the lenders’ consent, by one year up to two times. In connection with our entry into the New TRGP Revolver, we terminated our existing revolving credit facility (the “Existing TRGP Revolver”).
For additional information about our recent debt-related transactions, see Note 8 – Debt Obligations to our Consolidated Financial Statements.
Organization Structure
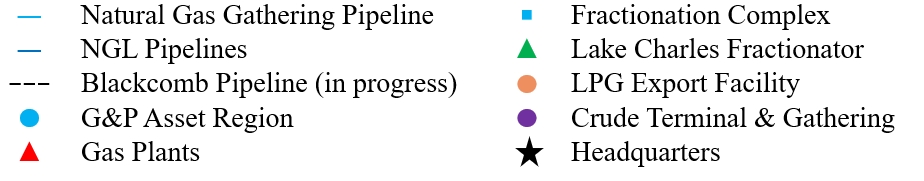
The diagram below shows our corporate structure as of February 20, 2025:
(1)Common shares outstanding as of February 14, 2025.
Growth Drivers, Competitive Strengths and Strategies
While we believe that we are well positioned to execute our business strategies based on our growth drivers, competitive strengths and strategies outlined below, our business involves numerous risks and uncertainties which may prevent us from executing our strategies. These risks include the adverse impact of changes in natural gas, NGL and condensate/crude oil prices, the supply of, or demand for, these commodities, and our inability to access sufficient additional supplies to replace natural declines in production. For a more complete description of the risks associated with an investment in us, see “Item 1A. Risk Factors.”
Comprehensive package of midstream services
We provide a comprehensive package of services to natural gas and crude oil producers. These services are essential to gather, process, treat, purchase and sell and transport wellhead gas to meet pipeline standards; extract, transport and fractionate NGLs for sale into petrochemical, industrial, commercial and export markets; and gather and/or purchase and sell crude oil. We believe that our ability to offer these integrated services provides us with an advantage in competing for new supplies because we can provide substantially all of the services that producers, marketers and others require for moving natural gas, NGLs and crude oil from wellhead to market on a cost-effective basis. Additionally, we believe that the significant investment we have made to construct and acquire assets in key strategic positions and the expertise we have in operating such assets make us well-positioned to remain a leading provider of integrated services in the midstream sector.
Our transportation assets further enhance our integrated midstream service offerings across the NGL and natural gas value chain by linking supply to key markets. Grand Prix connects many of our gathering and processing positions, including the Permian Basin, with our Downstream facilities in Mont Belvieu, Texas, the major U.S. NGL market hub. Additionally, our integrated Mont Belvieu and Galena Park Marine Terminal assets allow us to provide the raw product, fractionation, storage, interconnected terminaling, refrigeration and ship loading capabilities to support exports by third-party customers.
Strategically located and leading infrastructure positions
We believe our assets are not easily replicated, are located in many attractive and active areas of exploration and production activity and are near key markets and logistics centers. Our gathering and processing infrastructure is located in attractive oil and gas producing basins and is well positioned within each of those basins. Activity in the shale resource plays underlying our gathering assets is driven by the economics of oil, NGL, gas and condensate production from the particular reservoirs in each play impacting the volumes of natural gas and crude oil available to us for gathering, processing and/or purchase and sale on our systems. Producers continue to focus drilling activity on their most attractive acreage, especially in the Permian Basin where we have a large, well-positioned and interconnected footprint, benefiting from rig activity in and around our systems.
As drilling in these areas continues, the supply of NGLs requiring transportation to market hubs and fractionation is expected to continue to grow. Continued demand for transportation, fractionation and export capacity is expected to lead to increased demand for other related fee-based services provided by our logistics and transportation assets as well as provide other growth opportunities. The connectivity of our gathering and processing and Downstream operations provided by Grand Prix further allows us to capture these growth opportunities. Additionally, we are one of the largest fractionators of NGLs along the Gulf Coast. Our fractionation assets are primarily located in key NGL market centers and are near and connected to key consumers of NGL products, including the petrochemical and industrial markets. Our logistics assets, including fractionation facilities, storage wells, our low ethane propane de-ethanizers, and our Galena Park Marine Terminal and related pipeline systems and interconnects, include connections to a number of mixed NGL (“mixed NGLs” or “Y-grade”) supply pipelines, storage, interconnection and takeaway pipelines and other transportation infrastructure. The location and interconnectivity of these assets are not easily replicated, and we have additional capability to expand their capacity.
High quality and efficient assets
Our gathering and processing systems and logistics and transportation assets consist of high-quality, well-maintained facilities, resulting in low-cost, efficient operations. Advanced technologies have been implemented for processing plants (primarily cryogenic units utilizing centralized control systems), measurement systems (essentially all electronic and electronically linked to a central database) and operations and maintenance management systems to manage work orders and implement preventative maintenance schedules (computerized maintenance management systems). These applications have allowed proactive management of our operations resulting in lower costs and minimal downtime. We have established a reputation in the midstream industry as a reliable and cost-effective supplier of services to our customers and have a track record of safe, efficient and reliable operation of our facilities. We will continue to pursue new contracts, cost efficiencies and operating improvements of our assets. In the past, such improvements have included new production and acreage commitments, reducing fuel gas and flare volumes and improving facility capacity and NGL recoveries. We will also continue to optimize existing plant assets to improve and maximize capacity and throughput.
In addition to routine annual maintenance expenses, our maintenance capital expenditures have averaged approximately $217 million per year over the last three years. We believe that our assets are well-maintained, and we are focused on continuing to operate both our existing and new assets in a prudent, safe and cost-effective manner.
Financial flexibility
We have historically maintained sufficient liquidity and have funded our growth investments with a mix of cash flow from operations, equity, debt, asset sales and joint ventures over time in order to manage our leverage ratio. Disciplined management of liquidity, leverage and commodity price volatility allow us to be flexible in our long-term growth strategy, as well as allocating our free cash flow after dividends and share repurchases in a manner that maintains a strong credit profile.
Experienced and long-term focused management team
Our current executive management team possesses breadth and depth of experience working in the midstream energy business, including certain members of our executive management team managing our businesses prior to acquisition by Targa. Other officers and key employees have significant experience in the industry, including extensive experience in operating our current assets and developing, permitting and constructing new assets.
Attractive cash flow characteristics, with large diverse business mix with favorable contracts and increasing fee-based business
We believe that our strategy, combined with our high-quality asset portfolio, allows us to generate attractive cash flows. Geographic, business and customer diversity enhances our cash flow profile. We provide our services under predominantly fee-based contract terms to a diverse mix of customers across our areas of operation. Our Gathering and Processing segment contract mix has increasing components of fee-based margin driven by: (i) fees added to percent-of-proceeds contracts for natural gas treating and compression, (ii) new/amended contracts with a combination of percent-of-proceeds and fee-based components, including fee floors, and (iii) fee-based gas gathering and processing and crude oil gathering contracts. Contracts for the Coastal portion of our Gathering and Processing segment are primarily hybrid contracts (percent-of-liquids with a fee floor) or percent-of-liquids contracts (whereby we receive an agreed upon percentage of the actual proceeds of the NGLs).
Contracts for our assets in the Downstream Business are predominantly fee-based (based on volumes and contracted rates). Our contract mix, along with our commodity hedging program, serves to mitigate the impact of commodity price movements on cash flow.
We have hedged the commodity price risk associated with a portion of our expected natural gas, NGL and condensate equity volumes, future commodity purchases and sales, and transportation basis risk by entering into financially settled derivative transactions. We have intentionally tailored our hedges to approximate specific NGL products and to approximate our actual NGL and residue natural gas delivery points. Although the degree of hedging will vary, we intend to continue to manage some of our exposure to commodity prices by entering into hedge transactions. We also monitor and manage our inventory levels with a view to mitigate losses related to downward price exposure.
Our Business Operations
Our operations are reported in two segments: (i) Gathering and Processing, and (ii) Logistics and Transportation (also referred to as the Downstream Business).
Gathering and Processing Segment
Our Gathering and Processing segment consists of gathering, compressing, treating, processing, transporting, and purchasing and selling natural gas and gathering, storing, terminaling and purchasing and selling crude oil. The gathering or purchasing of natural gas consists of aggregating natural gas produced from various wells through varying diameter gathering lines to processing plants. Natural gas has a widely varying composition depending on the field, the formation and the reservoir from which it is produced. The processing of natural gas consists of the extraction of embedded NGLs and the removal of water vapor and other contaminants to form (i) a stream of marketable natural gas, commonly referred to as residue gas, and (ii) a stream of mixed NGLs. Once processed, the residue gas is transported to markets through residue gas pipelines. End-users of residue gas include large commercial and industrial customers, as well as natural gas and electric utilities serving individual consumers. We sell our residue gas either directly to such end-users or to marketers into intrastate or interstate pipelines, which are typically located in close proximity or with ready access to our facilities. The gathering or purchasing of crude oil consists of aggregating crude oil production through our pipeline gathering systems, which deliver crude oil to a combination of other pipelines, rail and truck.
We continually seek new supplies of natural gas and crude oil, both to offset the natural decline in production from connected wells and to increase throughput volumes. We obtain additional natural gas and crude oil supply in our operating areas by contracting for production from new wells or by capturing existing production currently gathered by others. Competition for new natural gas and crude oil supplies is based primarily on location of assets, commercial terms including pre-existing contracts, service levels and access to markets. The commercial terms of natural gas gathering and processing arrangements and crude oil gathering are driven, in part, by capital costs, which are impacted by the proximity of systems to the supply source and by operating costs, which are impacted by operational efficiencies, facility design and economies of scale.
The Gathering and Processing segment’s assets are located in the Permian Basin of West Texas and Southeast New Mexico (including the Midland, Central and Delaware Basins); the Eagle Ford Shale in South Texas; the Barnett Shale in North Texas; the Anadarko, Ardmore, and Arkoma Basins in Oklahoma (including the SCOOP and STACK) and South Central Kansas; the Williston Basin in North Dakota (including the Bakken and Three Forks plays) and in the onshore and near offshore regions of the Louisiana Gulf Coast. The natural gas processed in this segment is supplied through our gathering systems which, in aggregate, consist of approximately 31,200 miles of natural gas pipelines and include 53 owned and operated processing plants.
The Gathering and Processing segment’s operations consist of (i) Permian Midland and Permian Delaware (also referred to as “Permian”), (ii) SouthTX, North Texas, SouthOK, WestOK (also referred to as “Central”), (iii) Coastal and (iv) Badlands, each as described below:
Permian Midland
The Permian Midland system consists of approximately 7,600 miles of natural gas gathering pipelines and 19 processing plants with an aggregate processing capacity of 3,844 MMcf/d, all located within the Permian Basin in West Texas. Eleven of these plants and approximately 5,300 miles of gathering pipelines belong to a joint venture (“WestTX”), in which we have an approximate 72.8% ownership. Exxon Mobil Corporation (“ExxonMobil”) owns the remaining interest in the WestTX system.
In response to increasing production and to meet the infrastructure needs of producers, we are constructing the Pembrook II plant, East Pembrook plant and East Driver plant, each a 275 MMcf/d cryogenic natural gas processing plant, which are expected to begin operations in the fourth quarter of 2025, the second quarter of 2026 and the third quarter of 2026, respectively.
Permian Delaware
The Permian Delaware system consists of approximately 7,400 miles of natural gas gathering pipelines and 17 processing plants with an aggregate capacity of 3,285 MMcf/d, within the Delaware Basin and Central Basin in West Texas and Southeastern New Mexico, and includes aggregate gas treating capacity of 2,337 MMcf/d in addition to six acid gas injection wells.
In response to increasing production and to meet the infrastructure needs of producers, we are constructing the Bull Moose II plant and the Falcon II plant, each a 275 MMcf/d cryogenic natural gas processing plant, which are expected to begin operations in the first quarter of 2026 and the second quarter of 2026, respectively.
SouthTX
The South Texas system contains approximately 2,100 miles of high-pressure and low-pressure gathering and transmission pipelines and three natural gas processing plants in the Eagle Ford Shale with an aggregate processing capacity of 660 MMcf/d. The South Texas system processes natural gas through the Silver Oak I, Silver Oak II and Raptor gas processing plants.
North Texas
North Texas includes the Chico gathering system in the Fort Worth Basin, which consists of approximately 4,700 miles of pipelines gathering wellhead natural gas from the Barnett Shale and Marble Falls plays for processing at the Chico plant with a processing capacity of 265 MMcf/d.
SouthOK
The SouthOK gathering system consists of approximately 1,600 miles of pipelines in 12 counties in the Ardmore and Anadarko Basins and includes the Golden Trend, SCOOP, and Woodford Shale areas of southern Oklahoma.
The SouthOK gathering system includes five separate processing plants with an aggregate processing capacity of 630 MMcf/d, including: the Stonewall, Hickory Hills and Tupelo facilities, which are owned by our Centrahoma Joint Venture (“Centrahoma”), and
our wholly-owned Velma and Velma V-60 plants. We have a 60% ownership interest in Centrahoma. The remaining 40% ownership interest in Centrahoma is owned by MPLX, LP.
WestOK
The WestOK gathering system consists of approximately 6,500 miles of pipelines in 14 counties in north central Oklahoma and southern Kansas’ Anadarko Basin and includes the Woodford shale and STACK.
The WestOK system has an aggregate processing capacity of 400 MMcf/d with two separate cryogenic natural gas processing plants known as the Waynoka I and Waynoka II facilities.
Coastal
Our Coastal assets consist of approximately 1,000 miles of onshore gathering system pipelines located in Louisiana to gather and process natural gas produced from shallow-water central and western Gulf of Mexico natural gas wells, and from deep shelf and deep-water Gulf of Mexico production via connections to third-party pipelines or through pipelines owned by us. The Coastal system has an aggregate processing capacity of 2,025 MMcf/d and 11 MBbl/d of integrated fractionation capacity. The processing plants are comprised of three wholly-owned and operated plants, one partially owned and operated plant, and one partially owned, non-operated plant. Our Coastal plants have access to markets across the U.S. through the interstate natural gas pipelines to which they are interconnected. The industry continues to rationalize gas processing capacity along the western Louisiana Gulf Coast with most of the producer volumes going to more efficient plants, such as our Lowry and Gillis plants.
Badlands
Our Badlands operations are located in the Bakken and Three Forks Shale plays of the Williston Basin in North Dakota. Targa owns 55% of Targa Badlands through a joint venture with Blackstone. Targa Badlands pays a minimum quarterly distribution (“MQD”) to Blackstone and Targa, with Blackstone having a priority right to the MQDs. Additionally, Blackstone’s capital contributions have a liquidation preference upon a sale of Targa Badlands. Targa Badlands is a discrete entity and the assets and credit of Targa Badlands are not available to satisfy the debts and other obligations of Targa or its other subsidiaries. Following the closing of the Badlands Transaction, we will own 100% of the interest in Targa Badlands.
Targa Badlands includes approximately 500 miles of crude oil gathering pipelines, 120 MBbl of operational crude oil storage capacity at the Johnsons Corner Terminal, 30 MBbl of operational crude oil storage capacity at the Alexander Terminal, 30 MBbl of operational crude oil storage capacity at New Town and 25 MBbl of operational crude oil storage capacity at Stanley. Our Targa Badlands assets also include approximately 300 miles of natural gas gathering pipelines and the Little Missouri I-III natural gas processing plants, which have a processing capacity of 90 MMcf/d. Additionally, Targa operates the 200 MMcf/d Little Missouri 4 plant (“LM4 plant”), in which Targa Badlands and Hess Midstream Partners LP each own a 50% interest.
The following table lists the Gathering and Processing segment’s processing plants and related volumes for the year ended December 31, 2024:
| | | | | | | | | | | | | | | | | | | | | | |
Facility | | Process
Type (1) | | Operated
/Non-Operated | | % Owned | | | Location | | Processing
Capacity (MMcf/d) (2) | | | Plant Natural Gas
Inlet Throughput
Volume (MMcf/d) (3) (4) (5) | | | NGL
Production
(MBbl/d)
(3) (4) (5) | |
Permian Midland | | | | | | | | | | | | | | | | | | |
Consolidator (6) | | Cryo | | Operated | | | 72.8 | | | Reagan County, TX | | | 150.0 | | | | | | | |
Midkiff (6) | | Cryo | | Operated | | | 72.8 | | | Reagan County, TX | | | 70.0 | | | | | | | |
Driver (6) | | Cryo | | Operated | | | 72.8 | | | Midland County, TX | | | 220.0 | | | | | | | |
Benedum (6) | | Cryo | | Operated | | | 72.8 | | | Upton County, TX | | | 35.0 | | | | | | | |
Edward (6) | | Cryo | | Operated | | | 72.8 | | | Upton County, TX | | | 220.0 | | | | | | | |
Buffalo (6) | | Cryo | | Operated | | | 72.8 | | | Martin County, TX | | | 220.0 | | | | | | | |
Joyce (6) | | Cryo | | Operated | | | 72.8 | | | Upton County, TX | | | 220.0 | | | | | | | |
Johnson (6) | | Cryo | | Operated | | | 72.8 | | | Midland County, TX | | | 220.0 | | | | | | | |
Hopson (6) | | Cryo | | Operated | | | 72.8 | | | Midland County, TX | | | 275.0 | | | | | | | |
Pembrook (6) | | Cryo | | Operated | | | 72.8 | | | Upton County, TX | | | 275.0 | | | | | | | |
Gateway (6) | | Cryo | | Operated | | | 72.8 | | | Reagan County, TX | | | 275.0 | | | | | | | |
Mertzon | | Cryo | | Operated | | | 100.0 | | | Irion County, TX | | | 52.0 | | | | | | | |
Sterling | | Cryo | | Operated | | | 100.0 | | | Sterling County, TX | | | 92.0 | | | | | | | |
High Plains | | Cryo | | Operated | | | 100.0 | | | Midland County, TX | | | 220.0 | | | | | | | |
Heim (7) | | Cryo | | Operated | | | 100.0 | | | Reagan County, TX | | | 200.0 | | | | | | | |
Legacy (7) | | Cryo | | Operated | | | 100.0 | | | Midland County, TX | | | 275.0 | | | | | | | |
Legacy II (7) | | Cryo | | Operated | | | 100.0 | | | Midland County, TX | | | 275.0 | | | | | | | |
Greenwood (7) | | Cryo | | Operated | | | 100.0 | | | Midland County, TX | | | 275.0 | | | | | | | |
Greenwood II (7) (8) | | Cryo | | Operated | | | 100.0 | | | Midland County, TX | | | 275.0 | | | | | | | |
| | | | | | | | | Area Total | | | 3,844.0 | | | | 2,933.1 | | | | 428.4 | |
Permian Delaware | | | | | | | | | | | | | | | | | | |
Eunice | | Cryo | | Operated | | | 100.0 | | | Lea County, NM | | | 110.0 | | | | | | | |
Monument (9) | | Cryo | | Operated | | | 100.0 | | | Lea County, NM | | | 85.0 | | | | | | | |
Loving | | Cryo | | Operated | | | 100.0 | | | Loving County, TX | | | 70.0 | | | | | | | |
Oahu | | Cryo | | Operated | | | 100.0 | | | Pecos County, TX | | | 60.0 | | | | | | | |
Wildcat | | Cryo | | Operated | | | 100.0 | | | Winkler County, TX | | | 250.0 | | | | | | | |
Wildcat II | | Cryo | | Operated | | | 100.0 | | | Winkler County, TX | | | 275.0 | | | | | | | |
Falcon | | Cryo | | Operated | | | 100.0 | | | Culberson County, TX | | | 275.0 | | | | | | | |
Peregrine | | Cryo | | Operated | | | 100.0 | | | Culberson County, TX | | | 275.0 | | | | | | | |
Roadrunner | | Cryo | | Operated | | | 100.0 | | | Eddy County, NM | | | 230.0 | | | | | | | |
Roadrunner II (10) | | Cryo | | Operated | | | 100.0 | | | Eddy County, NM | | | 230.0 | | | | | | | |
Red Hills I | | Cryo | | Operated | | | 100.0 | | | Lea County, NM | | | 60.0 | | | | | | | |
Red Hills II | | Cryo | | Operated | | | 100.0 | | | Lea County, NM | | | 200.0 | | | | | | | |
Red Hills III | | Cryo | | Operated | | | 100.0 | | | Lea County, NM | | | 200.0 | | | | | | | |
Red Hills IV | | Cryo | | Operated | | | 100.0 | | | Lea County, NM | | | 230.0 | | | | | | | |
Red Hills V | | Cryo | | Operated | | | 100.0 | | | Lea County, NM | | | 230.0 | | | | | | | |
Red Hills VI | | Cryo | | Operated | | | 100.0 | | | Lea County, NM | | | 230.0 | | | | | | | |
Midway | | Cryo | | Operated | | | 100.0 | | | Crane County, TX | | | 275.0 | | | | | | | |
| | | | | | | | | Area Total | | | 3,285.0 | | | | 2,837.3 | | | | 359.9 | |
SouthTX | | | | | | | | | | | | | | | | | | |
Silver Oak I | | Cryo | | Operated | | | 100.0 | | | Bee County, TX | | | 200.0 | | | | | | | |
Silver Oak II | | Cryo | | Operated | | | 100.0 | | | Bee County, TX | | | 200.0 | | | | | | | |
Raptor | | Cryo | | Operated | | | 100.0 | | | La Salle County, TX | | | 260.0 | | | | | | | |
| | | | | | | | | Area Total | | | 660.0 | | | | 325.9 | | | | 32.8 | |
North Texas | | | | | | | | | | | | | | | | | | |
Chico | | Cryo | | Operated | | | 100.0 | | | Wise County, TX | | | 265.0 | | | | | | | |
| | | | | | | | | Area Total | | | 265.0 | | | | 186.9 | | | | 22.6 | |
SouthOK | | | | | | | | | | | | | | | | | | |
Stonewall | | Cryo | | Operated | | | 60.0 | | | Coal County, OK | | | 200.0 | | | | | | | |
Tupelo | | Cryo | | Operated | | | 60.0 | | | Coal County, OK | | | 120.0 | | | | | | | |
Hickory Hills | | Cryo | | Operated | | | 60.0 | | | Hughes County, OK | | | 150.0 | | | | | | | |
Velma | | Cryo | | Operated | | | 100.0 | | | Stephens County, OK | | | 100.0 | | | | | | | |
Velma V-60 (11) | | Cryo | | Operated | | | 100.0 | | | Stephens County, OK | | | 60.0 | | | | | | | |
| | | | | | | | | Area Total | | | 630.0 | | | | 351.7 | | | | 35.0 | |
WestOK | | | | | | | | | | | | | | | | | | |
Waynoka I | | Cryo | | Operated | | | 100.0 | | | Woods County, OK | | | 200.0 | | | | | | | |
Waynoka II | | Cryo | | Operated | | | 100.0 | | | Woods County, OK | | | 200.0 | | | | | | | |
| | | | | | | | | Area Total | | | 400.0 | | | | 212.8 | | | | 15.1 | |
Coastal | | | | | | | | | | | | | | | | | | |
Gillis (12) | | Cryo | | Operated | | | 100.0 | | | Calcasieu Parish, LA | | | 180.0 | | | | | | | |
Big Lake (11) | | Cryo | | Operated | | | 100.0 | | | Calcasieu Parish, LA | | | 180.0 | | | | | | | |
VESCO | | Cryo | | Operated | | | 76.8 | | | Plaquemines Parish, LA | | | 750.0 | | | | | | | |
Lowry (11) | | Cryo | | Operated | | | 100.0 | | | Cameron Parish, LA | | | 265.0 | | | | | | | |
Sea Robin (13) | | Cryo | | Non-operated | | | 1.2 | | | Vermillion Parish, LA | | | 650.0 | | | | | | | |
| | | | | | | | | Area Total | | | 2,025.0 | | | | 449.6 | | | | 35.8 | |
Badlands | | | | | | | | | | | | | | | | | | |
Little Missouri I-III (14) | | Cryo/RA | | Operated | | | 55.0 | | | McKenzie County, ND | | | 90.0 | | | | | | | |
Little Missouri IV (15) | | Cryo | | Operated | | | 27.5 | | | McKenzie County, ND | | | 200.0 | | | | | | | |
| | | | | | | | | Area Total | | | 290.0 | | | | 136.3 | | | | 16.6 | |
| | | | | | | | | Segment System Total | | | 11,399.0 | | | | 7,433.6 | | | | 946.2 | |
(1)Cryo – Cryogenic Processing; RA – Refrigerated Absorption Processing.
(2)Processing capacity represents all parties’ ownership.
(3)Plant natural gas inlet represents the volume of natural gas passing through the meter located at the inlet of the natural gas processing plant, except for Badlands which represents the total wellhead volume.
(4)Plant natural gas inlet and NGL production volumes represent our ownership share of volumes for partially owned plants that we proportionately consolidate based on our ownership interest, including our 72.8% undivided interest in our WestTX joint venture, as well as 100% of ownership interests for our consolidated VESCO joint venture, Stonewall, Tupelo, and Hickory Hills plants.
(5)Per day plant natural gas inlet and NGL production statistics for plants listed above are based on the number of calendar days during 2024.
(6)Plant natural gas inlet throughput volumes and NGL production volumes for WestTX are presented on a pro-rata net basis representing our undivided ownership interest in WestTX, which we proportionately consolidate in our consolidated financial statements.
(7)As a result of a non-consent election made by the joint owner in our WestTX Permian Basin assets, the Heim, Legacy, Legacy II, Greenwood and Greenwood II plants are 100% owned and consolidated by Targa until each plant achieves the payout event related to the non-consent election.
(8)The Greenwood II plant commenced operations early in the fourth quarter of 2024.
(9)The Monument plant has fractionation capacity of approximately 1.8 MBbl/d.
(10)The Roadrunner II plant commenced operations in the second quarter of 2024.
(11)Plant is available and operates subject to market conditions, including availability of natural gas.
(12)The Gillis plant has fractionation capacity of approximately 11 MBbl/d.
(13)The Sea Robin plant is temporarily shut down.
(14)Little Missouri Trains I and II are refrigeration plants and Little Missouri Train III is a Cryo plant.
(15)Targa owns 55% of Targa Badlands, which owns 50% of the LM4 plant, resulting in a 27.5% interest. Following the closing of the Badlands Transaction, we will own 100% of the interest in Targa Badlands, resulting in a 50% interest in the LM4 plant.
Logistics and Transportation Segment
Our Logistics and Transportation segment includes the activities and assets necessary to transport and convert mixed NGLs into NGL products and also includes other assets and value-added services described below. The Logistics and Transportation segment also includes Grand Prix and associated assets, which are generally connected to and supplied in part by our Gathering and Processing segment. Our Downstream facilities are located predominantly in Mont Belvieu and Galena Park, Texas, and in Lake Charles, Louisiana. Our fractionation, pipeline transportation, storage and terminaling businesses include 2,600 miles of company-owned pipelines to transport mixed NGLs and specification products.
The Logistics and Transportation segment also transports, distributes, purchases, sells, and markets NGLs via terminals and transportation assets across the U.S. We own or market products at terminal facilities in a number of states, including Alabama, Arizona, California, Florida, Indiana, Kentucky, Louisiana, Mississippi, New Jersey, North Carolina, Pennsylvania, Tennessee, Texas and Washington. The geographic diversity of our assets provides direct access to many NGL customers as well as markets via trucks, barges, ships, rail cars and open-access regulated NGL pipelines owned by third parties.
Transportation Pipelines
Our primary pipeline asset is Grand Prix, which connects our gathering and processing positions throughout the Permian Basin, North Texas, and Southern Oklahoma (as well as third-party positions) to our fractionation and storage complex in the NGL market hub at Mont Belvieu, Texas. Grand Prix has the capacity to transport up to 1,000 MBbl/d of NGLs into Mont Belvieu. Our new Daytona NGL Pipeline is an addition to Grand Prix. In January 2023, we announced and closed on the acquisition of Blackstone Energy Partners’ 25% interest in Grand Prix Pipeline LLC (the “Grand Prix Transaction”). Following the closing of the Grand Prix Transaction, we own 100% of Grand Prix.
Through our 50% ownership interest in Cayenne Pipeline, LLC (“Cayenne”), we operate the Cayenne pipeline, which transports mixed NGLs from VESCO in Venice, Louisiana, to an interconnection with a third-party NGL pipeline in Toca, Louisiana.
Fractionation
After being extracted in the field, mixed NGLs are typically transported to a centralized facility for fractionation where the mixed NGLs are separated into discrete NGL products: ethane, ethane-propane mix, propane, normal butane, iso-butane and natural gasoline.
We believe that sufficient volumes of mixed NGLs will be available for fractionation in commercially viable quantities for the foreseeable future due to historical increases in NGL production from shale plays and other shale-technology-driven resource plays in areas of the U.S. that include Texas, New Mexico, Oklahoma and the Rockies and certain other basins accessed by pipelines to Mont Belvieu, as well as from conventional production of NGLs in areas such as the Permian Basin, Mid-Continent, East Texas, South Louisiana and shelf and deep-water Gulf of Mexico.
Although competition for NGL fractionation services is primarily based on the fractionation fee, the ability of an NGL fractionator to obtain mixed NGLs and distribute NGL products is also an important competitive factor. This ability is a function of the existence of storage infrastructure and supply and market connectivity necessary to conduct such operations. We believe that the location, scope and
capability of our logistics assets, including our transportation and distribution systems, give us access to both substantial sources of mixed NGLs and a large number of end-use markets.
At our Mont Belvieu operated facility, we have nine wholly-owned fractionation trains, representing an aggregate capacity of 963.0 MBbl/d and Train 7, a 120 MBbl/d fractionation train, which is a joint venture between Targa and The Williams Companies, Inc., where Targa owns an 80% equity interest. Certain fractionation-related infrastructure for Train 7, such as storage caverns and brine handling, were funded and are owned 100% by Targa. Our fractionation trains are fully integrated with our existing Gulf Coast NGL storage, terminaling and delivery infrastructure, which includes an extensive network of connections to key petrochemical and industrial customers as well as our LPG export terminal at Galena Park on the Houston Ship Channel.
We are constructing Trains 11 and 12, both of which are wholly-owned 150 MBbl/d fractionation trains, at our Mont Belvieu operated facility, which are expected to begin operations in the third quarter of 2026 and the first quarter of 2027, respectively.
We additionally have a wholly-owned and operated fractionation facility in Lake Charles, Louisiana, representing a capacity of 55.0 MBbl/d.
We hold an equity investment in GCF, also located at Mont Belvieu. In January 2021, the GCF facility was temporarily idled. We assumed operatorship of GCF in the first half of 2021. We expect the reactivation of GCF to be complete and the facility to be operational in the first quarter of 2025.
We also own fractionation assets in Monument, New Mexico, and Gillis, Louisiana, which are included in our Gathering and Processing segment. In addition, we have a natural gasoline hydrotreater at Mont Belvieu, Texas, with a capacity of 35.0 MBbl/d that removes sulfur from natural gasoline, allowing customers to meet stringent fuel content standards.
The following table details the Logistics and Transportation segment’s fractionation and treating facilities:
| | | | | | | | | | | | | | |
Facility | | Location | | % Owned | | | Capacity
(MBbl/d) (1) | | | Throughput 2024 (MBbl/d) | |
Cedar Bayou Fractionators (2) | | Mont Belvieu, TX | | | 100.0 | | | | 493.0 | | | | |
Train 6 Fractionator | | Mont Belvieu, TX | | | 100.0 | | | | 110.0 | | | | |
Train 7 Fractionator | | Mont Belvieu, TX | | | 80.0 | | | | 120.0 | | | | |
Train 8 Fractionator | | Mont Belvieu, TX | | | 100.0 | | | | 120.0 | | | | |
Train 9 Fractionator | | Mont Belvieu, TX | | | 100.0 | | | | 120.0 | | | | |
Train 10 Fractionator | | Mont Belvieu, TX | | | 100.0 | | | | 120.0 | | | | |
Lake Charles Fractionator (3) | | Lake Charles, LA | | | 100.0 | | | | 55.0 | | | | |
Fractionation Total | | | | | | | | 1,138.0 | | | | 936.1 | |
| | | | | | | | | | | |
Gulf Coast Fractionator (4) | | Mont Belvieu, TX | | | 38.8 | | | | 135.0 | | | | — | |
Targa LSNG Hydrotreater | | Mont Belvieu, TX | | | 100.0 | | | | 35.0 | | | | 36.9 | |
(1)Actual fractionation capacities may vary due to the composition of the NGLs being processed and does not contemplate ethane rejection.
(2)CBF includes five fractionation trains. Prior to the CBF Acquisition, we owned an 88% interest in CBF.
(3)Lake Charles Fractionator runs in a mode of ethane/propane splitting for the local petrochemical market and is configured to also handle raw product.
(4)The GCF facility was temporarily idled in January 2021. We expect the reactivation of GCF to be complete and the facility to be operational in the first quarter of 2025.
NGL Storage and Terminaling
In general, our NGL storage assets provide warehousing of mixed NGLs, NGL products and petrochemical products in underground wells, which allows for the injection and withdrawal of such products at various times in order to meet supply and demand cycles. Similarly, our terminaling operations provide the inbound/outbound logistics and warehousing of mixed NGLs, NGL products and petrochemical products in above-ground storage tanks. Our NGL underground storage and terminaling facilities serve single markets, such as propane, as well as multiple products and markets. For example, the Mont Belvieu and Galena Park facilities have extensive pipeline connections for mixed NGL supply and delivery of component NGLs, including Grand Prix. In addition, some of our facilities are connected to marine, rail and truck loading and unloading facilities that provide services and products to our customers. We provide long and short-term storage and terminaling services and throughput capability to third-party customers for a fee.
Across the Logistics and Transportation segment, we own 35 storage wells at our facilities with a gross NGL storage capacity of approximately 81 MMBbl and operate seven non-owned wells. The usage of these wells may be limited by brine handling capacity, which is utilized to displace NGLs from storage.
We operate our storage and terminaling facilities to support our key fractionation facilities at Mont Belvieu and Lake Charles for receipt of mixed NGLs and storage of fractionated NGLs to service the petrochemical, refinery, export and heating customers/markets as well as our wholesale domestic terminals that focus on logistics to service the heating market customer base. Our international export assets
include our facilities at both Mont Belvieu and the Galena Park Marine Terminal near Houston, Texas, which have the capability to load propane, butanes and international grade low ethane propane. The export facilities have an effective export capacity of approximately 13.5 MMBbl per month, subject to a mix of propane and butane demand, vessel size and availability of supply, and a variety of other factors. We have the capability to load VLGC vessels, alongside small and medium sized export vessels. We continue to experience demand growth for U.S.-based NGLs (both propane and butane) for export into international markets.
The following table details the Logistics and Transportation segment’s NGL storage and terminaling facilities:
| | | | | | | | | | | | | | | | |
Facility | | % Owned | | Location | | Description | | Throughput for 2024 (MMgal) | | | Number of Operational Wells | | Storage Capacity (MMBbl) | |
Galena Park Marine Terminal (1) | | 100 | | Harris County, TX | | NGL import/export terminal | | | 8,375.2 | | | N/A | | | 0.7 | |
Mont Belvieu Terminal & Storage | | 100 | | Chambers County, TX | | Transport and storage terminal | | | 36,934.7 | | | 23 | (2) | | 58.8 | |
Hackberry Terminal & Storage | | 100 | | Cameron Parish, LA | | Storage terminal | | | 748.0 | | | 12 | (3) | | 22.5 | |
(1)Volumes reflect total import and export across the dock/terminal and may include (i) volumes bound for domestic redeliveries to customer’s receipt points along the Houston Ship Channel, or elsewhere in the United States, and (ii) volumes that have also been handled primarily at the Mont Belvieu Terminal.
(2)Excludes seven non-owned wells which we operate on behalf of Chevron Phillips Chemical Company LP. One additional well has been drilled and is being prepared for operations.
(3)Five of 12 owned wells are leased to Citgo Petroleum Corporation under a long-term lease.
NGL Distribution and Marketing
We market our own NGL production and also purchase component NGL products from other NGL producers and marketers for resale. We also purchase NGL products for resale in our Logistics and Transportation segment.
We generally purchase mixed NGLs at a monthly pricing index less applicable fractionation, transportation and marketing fees and resell these component products to petrochemical manufacturers, refiners and other marketing and retail companies. This is primarily a physical settlement business in which we earn margins from purchasing and selling NGL products from customers under contract. We also earn margins by purchasing and reselling NGL products in the spot and forward physical markets.
Wholesale Domestic Marketing
Our wholesale domestic propane marketing operations primarily sell propane and related logistics services to major multi-state retailers, independent retailers and other end-users. Our propane supply originates from both our refinery/gas supply contracts and our other owned or managed Logistics and Transportation assets. We sell propane at a fixed posted price or at a market index basis at the time of delivery and in some circumstances, we earn margins on a netback basis.
The wholesale domestic propane marketing business is significantly impacted by seasonal and weather-driven demand, particularly in the winter, which can impact the price and volume of propane sold in the markets we serve.
Refinery Services
In our refinery services business, we typically provide NGL balancing services through contractual arrangements with refiners in several locations to purchase and/or market propane and to supply butanes. We use our commercial transportation assets (discussed below) and contract for and use the storage, transportation and distribution assets included in our Logistics and Transportation segment to assist refinery customers in managing their NGL product demand and production schedules. This includes both feedstocks consumed in refinery processes and the excess NGLs produced by other refining processes. Under typical netback purchase contracts, we retain a portion of the resale price of NGL sales or receive a fixed minimum fee per gallon on products sold. Under netback sales contracts, fees are earned for locating and supplying NGL feedstocks to the refineries based on a percentage of the cost to obtain such supply or a minimum fee per gallon.
Key factors impacting the results of our refinery services business include production volumes, prices of propane and butanes, as well as our ability to perform receipt, delivery and transportation services in order to meet refinery demand.
Commercial Transportation
Our NGL transportation and distribution infrastructure includes a wide range of assets supporting both third-party customers and the delivery requirements of our marketing and asset management business. We provide fee-based transportation services to refineries and petrochemical companies throughout the Gulf Coast area. Our assets are also deployed to serve our wholesale domestic distribution terminals, fractionation facilities, underground storage facilities and pipeline injection terminals. These distribution assets provide a variety of ways to transport products to and from our customers.
As of December 31, 2024, we lease and manage 531 railcars and 131 tractors, and own eight tractors, six vacuum trucks, and two pressurized NGL barges.
The following table details the Logistics and Transportation segment’s propane terminaling facilities:
| | | | | | | | | | | | | | | | |
Facility | | % Owned | | | Location | | Description | | Throughput
for 2024 (MMgal) (1) | | | Usable Storage
Capacity
(MMgal) | |
Greenville Terminal | | | 100 | | | Washington County, MS | | Marine propane terminal | | | 20.1 | | | | 1.5 | |
Port Everglades Terminal | | | 100 | | | Broward County, FL | | Marine propane terminal | | | 25.3 | | | | 1.6 | |
Calvert City Terminal | | | 100 | | | Marshall County, KY | | Propane terminal | | | 18.2 | | | | 0.1 | |
Chattanooga Terminal | | | 100 | | | Hamilton County, TN | | Propane terminal | | | 12.5 | | | | 0.9 | |
Hattiesburg Terminal (2) | | | 50 | | | Forrest County, MS | | Propane terminal | | | 382.0 | | | | 190.1 | |
Sparta Terminal | | | 100 | | | Sparta County, NJ | | Propane terminal | | | 12.6 | | | | 0.2 | |
Tyler Terminal | | | 100 | | | Smith County, TX | | Propane terminal | | | 15.7 | | | | 0.2 | |
Winona Terminal | | | 100 | | | Flagstaff County, AZ | | Propane terminal | | | 15.5 | | | | 0.3 | |
Eagle Lake Transload (3) | | | 100 | | | Polk County, FL | | Propane transload | | | 7.1 | | | | — | |
(1)Throughputs include volumes related to exchange agreements and third-party storage agreements.
(2)Throughput volume reflects 100% of the facility activity.
(3)Rail-to-truck transload equipment.
Natural Gas Marketing
We also market natural gas available to us from the Gathering and Processing segment, purchase and resell natural gas in selected U.S. markets and manage the scheduling and logistics for these activities.
Seasonality
Parts of our business are impacted by seasonality. Our Downstream marketing business can be significantly impacted by seasonal and weather-driven demand, which can impact the price and volume of product sold in the markets we serve, as well as the level of inventory we hold in order to meet anticipated demand. See further discussion of the extent to which our business is affected by seasonality in “Item 1A. Risk Factors.”
Operational Risks and Insurance
We are subject to all risks inherent in the midstream natural gas, NGLs and crude oil businesses. These risks include, but are not limited to, explosions, fires, mechanical failure, cyberattacks, terrorist attacks, product spillage, weather, nature and inadequate maintenance of rights of way. These risks could result in damage to or destruction of operating assets and other property, or could result in personal injury, loss of life or environmental pollution, as well as curtailment or suspension of operations at the affected facility. We maintain, on behalf of ourselves and our subsidiaries, general public liability, property, boiler and machinery and business interruption insurance in amounts that we consider to be appropriate for such risks. Such insurance is subject to deductibles or self-insured retentions that we consider reasonable and not excessive given the insurance market environment.
The occurrence of a significant loss that is not insured, fully insured or indemnified against, or the failure of a party to meet its indemnification obligations, could materially and adversely affect our operations and financial condition. While we currently maintain levels and types of insurance that we believe to be prudent under current insurance industry market conditions, our inability to secure these levels and types of insurance in the future could negatively impact our business operations and financial stability, particularly if an uninsured loss were to occur. No assurance can be given that we will be able to maintain these levels of insurance in the future at rates considered commercially reasonable, particularly named windstorm coverage and contingent business interruption coverage for our onshore operations, and potentially excess liability insurance given the current insurance market environment.
Competition
We face strong competition in acquiring new natural gas or crude oil supplies. Competition for natural gas and crude oil supplies is primarily based on the location and available capacity of gathering and processing facilities, pricing arrangements, reputation, efficiency, flexibility, treating capabilities (as applicable), reliability and access to end-use markets or liquid marketing hubs. Our gathering and processing operations competitors are other natural gas gatherers and processors, such as major interstate and intrastate pipeline companies, master limited partnerships and oil and gas producers.
We also compete for NGL supplies for Grand Prix. Competition for NGL supplies is primarily based on the proximity of gathering and processing facilities in relation to one or more NGL pipelines, their connectivity to NGL pipeline takeaway options, access to end-use markets or liquid marketing hubs, pricing and contractual arrangements, available capacity, reputation, efficiency, flexibility, and reliability. Our NGL pipeline competitors are other midstream providers with NGL transportation capabilities, such as major interstate and intrastate pipeline companies, master limited partnerships and midstream natural gas and NGL companies.
Additionally, we face competition for mixed NGLs supplies at our fractionation facilities. The fractionators in which we own an interest in the Mont Belvieu region compete for volumes of mixed NGLs with other fractionators also located in the Mont Belvieu region. In addition, certain producers fractionate mixed NGLs for their own account in captive facilities. The fractionators in the Mont Belvieu region also compete on a more limited basis with fractionators in Conway, Kansas and a number of decentralized, smaller fractionation facilities in Texas, Louisiana and New Mexico. Our other fractionation facilities compete for mixed NGLs with the fractionators at Mont Belvieu as well as other fractionation facilities located in Louisiana. Our customers who are significant producers of mixed NGLs and NGL products or consumers of NGL products may develop their own fractionation facilities in lieu of using our services.
We also face strong competition for NGL supply, logistics and export services in our Logistics and Transportation segment. Our competitors include major oil and gas producers who market NGL products for their own account and for others. Additionally, we compete with several other NGL marketing companies, trading organizations and petrochemical operators.
Human Capital
We believe that our employees are the foundation to fostering the safe operation of our assets and delivery of services to our customers. We foster a collaborative, inclusive, and safety-minded work environment, focused on working safely every day. We seek to identify qualified internal and external talent for our organization, enabling us to execute on our strategic objectives.
As of December 31, 2024, we employed approximately 3,370 people that primarily support our operations through a wholly-owned subsidiary of ours. None of these employees are covered by collective bargaining agreements, and we consider our employee relations to be good.
Employee Health and Safety
Safety is a core value of ours and begins with the protection and safety of our employees, contractors and communities where we operate. We value people above all else and remain committed to making safety and health our top priority. We believe that “Zero is Achievable”, and our goal is to operate and deliver our products without any injuries. We continually seek to maintain and deepen our safety culture by providing a safe working environment that encourages active employee engagement, including implementing safety programs to achieve improvements in our safety culture.
To protect our employees, contractors, and surrounding community from workplace hazards and risks, we implement and maintain an integrated system of policies, practices, and controls, including requirements to complete regular detailed safety and regulatory compliance training for all applicable individuals. For more information on the laws and regulations we are subject to with regard to employee, contractor, and community safety, please see our section below titled Environmental and Occupational Health and Safety Matters.
Employee Experience
We are committed to fostering a work environment in which all employees treat each other with dignity and respect. This commitment extends to providing equal employment and advancement opportunities based on merit and experience. We believe this to be a fundamental principle and is defined in our Equal Employment Opportunity Policy and our Code of Conduct.
Employee Talent Development and Retention
As an infrastructure operator, we understand the importance of developing and fostering talent to ensure a skilled and talented diverse workforce both now and in the future. We value and provide opportunities for cross training and increased responsibilities, including leadership learning and formal coaching. These efforts allow us to recruit from within our organization for future vocational and occupational opportunities.
Our management promotes formal and informal learning and development throughout the organization. Candid feedback is provided to employees through our annual performance review process as well as informal meetings throughout the year.
We offer developmental programs focused on building the skills of our employees and to help advance employee careers, knowledge, and skillsets through training and related programs.
To help plan and predict succession needs, we perform annual succession planning, which is discussed and reviewed with management and, for certain levels and positions, with the board of directors. We additionally monitor employee turnover rates and conduct exit interviews with employees who voluntarily leave the company to better understand their reasons for leaving the company.
Regulation of Operations
Regulation of pipeline gathering and transportation services, natural gas, NGL and crude oil sales, and transportation of natural gas, NGLs and crude oil may affect certain aspects of our business and the market for our products and services.
Natural Gas Gathering and Processing Regulation
Our natural gas gathering operations are typically subject to open access ratable take and/or common purchaser statutes and implementing rules and regulations in the states in which we operate, which generally require us to give pipeline access or to purchase, process, or take gas without undue discrimination. These statutes, rules, and regulations can restrict our ability as an owner of gathering and processing facilities to decide with whom (and on what terms) we contract to gather or process natural gas with similarly situated customers (subject, in each case, to the limitations and requirements of each jurisdiction). In addition, the states in which we operate have adopted complaint-based regulation of natural gas gathering activities, which allows natural gas producers and shippers to file complaints with state regulators in an effort to resolve grievances relating to access and rate discrimination. Currently, Targa is contesting a discrimination complaint filed as Cause No. 28550 by Enerplus Resources (USA) Corporation with the Industrial Commission of the State of North Dakota. We cannot predict whether any additional complaints will be filed against us in the future. Failure to comply with state regulations can result in the imposition of administrative, civil and, in certain cases, criminal penalties.
Section 1(b) of the Natural Gas Act of 1938 (“NGA”) exempts natural gas gathering facilities from regulation as a natural gas company by FERC under the NGA. We believe that our gathering systems meet the traditional tests FERC has used to establish a pipeline’s status as a gatherer not subject to regulation as a natural gas company. However, to the extent our gathering systems buy and sell natural gas, such gatherers, in their capacity as buyers and sellers of natural gas, are subject to Order No. 704. See “—Regulation of Operations—FERC Market Transparency Rules.”
Sales of Natural Gas, NGLs and Crude Oil
The price at which we buy and sell natural gas, NGLs and crude oil is currently not subject to federal rate regulation and, for the most part, is not subject to state rate regulation. However, with regard to our physical purchases and sales of these energy commodities and any related hedging activities that we undertake, we are required to observe anti-market manipulation laws and related regulations enforced by FERC and/or the Commodities Futures Trading Commission (“CFTC”). See “—Regulation of Operations—EP Act of 2005.” We are required to report to FERC information regarding natural gas sale and purchase transactions for some of our operations, depending on the volume of natural gas transacted during the prior calendar year. See “—Regulation of Operations—FERC Market Transparency Rules.” Should we violate the anti-market manipulation laws and regulations, in addition to civil penalties, we could also be subject to related third-party damage claims by, among others, market participants, sellers, royalty owners and taxing authorities.
Interstate Natural Gas
We own (in conjunction with ExxonMobil) and operate the Driver Residue Pipeline, a gas transmission pipeline extending from our Driver processing plant in West Texas approximately 10 miles to points of interconnection with intrastate and interstate natural gas transmission pipelines. We have obtained a certificate of public convenience and necessity from FERC waiving certain of the Commission’s tariff and rate regulations. If, however, we receive a bona fide request for firm service on the Driver Residue Pipeline from a third party, FERC would reexamine the waivers it has granted us and would require us to file for authorization to offer “open access” transportation under its regulations, which would impose additional costs upon us.
Interstate Liquids
Targa NGL Pipeline Company LLC (“Targa NGL”), Targa Gulf Coast NGL Pipeline LLC (“Targa Gulf Coast”), and Grand Prix Pipeline LLC (“Grand Prix Pipeline”) have interstate NGL pipelines that are considered common carrier pipelines subject to regulation by FERC under the Interstate Commerce Act (the “ICA”). Targa Gulf Coast leases from Targa NGL certain pipelines that run between Mont Belvieu, Texas, and Galena Park, Texas and between Mont Belvieu, Texas, and Lake Charles, Louisiana. Each of these pipelines is part of an extensive mixed NGL and purity NGL pipeline receipt and delivery system that provides services to domestic and foreign export customers.
Unless covered by a waiver, as described below, the ICA requires that we maintain tariffs on file with FERC for interstate movements of liquids on our pipelines. Those tariffs set forth the rates we charge for providing transportation services as well as the rules and regulations governing these services. The ICA requires that tariff rates for liquids pipelines, which include crude oil pipelines, refined products pipelines and NGL pipelines, be just and reasonable and non-discriminatory. Many FERC-regulated liquids pipelines, including our pipelines discussed above, use the FERC indexing methodology to change their rates. Pursuant to the FERC indexing methodology, FERC reviews the index formula every five years to determine whether a change in the methodology is required or, if not, to determine the appropriate index for the subsequent five-year period. On July 26, 2024, the D.C. Circuit Court of Appeals vacated a FERC January 2022 Rehearing Order that had reduced the oil pricing index factor for oil pipelines to use for the current five-year period. On September 17, 2024, FERC issued an order reinstating the higher oil pricing index factor and indicated FERC will address additional issues related to the D.C. Circuit Court of Appeal’s decision in a subsequent order. On October 1, 2024, Targa filed to revise its rates for Targa NGL, and on October 15, 2024, Targa filed to revise its rates for Targa Gulf Coast and Grand Prix Pipeline, in each case, in accordance with the September 17, 2024, FERC order. The revised rates became effective on November 1, 2024. On October 17, 2024, FERC issued a supplemental notice of proposed rulemaking in which FERC proposed to prospectively adopt the index that was vacated by the D.C. Circuit Court of Appeals and instituted a notice-and-comment process. Subject to a final FERC order following the notice-and-comment period, the lower index of PPI-FG-0.21% may become effective for the remainder of the current five-year period starting from the date of a final FERC order and lasting through June 30, 2026. If the proposed index change becomes effective, then our FERC-regulated liquids pipelines would need to re-file their rates on a prospective basis. The comment period ended on December 20, 2024, with a possible FERC order coming in 2025.
Targa has multiple NGL pipelines that are also considered common carrier pipelines but have qualified for a waiver of applicable FERC regulatory requirements under the ICA based on current circumstances. Additionally, the crude oil pipeline system that is part of the Badlands assets operates under such a waiver, but this waiver is subject to a pending FERC proceeding as described below.
All such waivers are subject to revocation, however, should a particular pipeline’s circumstances change. FERC could, either at the request of other entities or on its own initiative, assert that some or all of these pipelines no longer qualify for a waiver. In the event that FERC were to determine that one or more of these pipelines no longer qualified for a waiver, we would likely be required to file a tariff with FERC for the applicable pipeline(s) and delivery point(s), provide a cost justification for the transportation charge, and provide regulated services to all potential shippers without undue discrimination. For example, on December 16, 2022, FERC initiated an investigation and established hearing procedures in FERC Docket No. OR23-2-000 to determine whether Targa’s Badlands assets continue to qualify for the waiver of applicable FERC regulatory requirements and whether Targa is providing jurisdictional transportation service on this system. An initial decision was issued by an administrative law judge on March 26, 2024, which found that Targa’s Badlands assets no longer qualify for a waiver of FERC regulatory requirements and such assets are providing jurisdictional transportation service. FERC has not yet ruled on the initial decision. If FERC affirms the initial decision, then Targa will be required to file a tariff setting the rates as well as the rules and regulations governing transportation service on these assets.
Tribal Lands
Our intrastate natural gas pipelines in North Dakota are subject to the various regulations of the State of North Dakota. In addition, various federal agencies within the U.S. Department of the Interior, particularly the federal Bureau of Land Management (“BLM”), Office of Natural Resources Revenue (formerly the Minerals Management Service) and the Bureau of Indian Affairs, as well as the
Three Affiliated Tribes, promulgate and enforce regulations pertaining to operations on the Fort Berthold Indian Reservation. Please see “Other State and Local Regulation of Operations” below.
Intrastate Natural Gas
Though our natural gas intrastate pipelines are not subject to regulation by FERC as natural gas companies under the NGA, our intrastate pipelines may be subject to certain FERC-imposed reporting requirements depending on the volume of natural gas purchased or sold in a given year. See “—Regulation of Operations—FERC Market Transparency Rules.”
Our intrastate natural gas pipelines located in Texas are regulated by the Railroad Commission of Texas (the “RRC”) and may be required to have tariffs on file with the RRC. Some of these Texas intrastate pipelines also transport natural gas in interstate commerce pursuant to Section 311 of the Natural Gas Policy Act of 1978 (“NGPA”). Under Sections 311 and 601 of the NGPA, an intrastate pipeline may transport natural gas in interstate commerce without becoming subject to FERC regulation as a “natural-gas company” under the NGA, but must file the terms and conditions of transportation of natural gas under authority of Section 311 with FERC, and these terms and conditions must be “fair and equitable.” Specifically, during 2024, TPL SouthTex Transmission Company LP, Midland-Permian Pipeline LLC, Delaware-Permian Pipeline LLC and Targa SouthTex Mustang Transmission Ltd. provided NGPA Section 311 service. On December 12, 2023, Targa Midland Gas Pipeline LLC, which had previously provided NGPA section 311 service, filed to cancel its Statement of Operating Conditions for Section 311 transportation because it no longer provides NGPA Section 311 service.
Our Louisiana intrastate pipeline, Targa Louisiana Intrastate LLC, and the rates and terms of service on the pipeline may be subject to regulation by the Office of Conservation of the Louisiana Department of Natural Resources (“DNR”).
We also operate natural gas pipelines that extend from the tailgate of our processing plants to interconnections with both intrastate and interstate natural gas pipelines. We believe these pipelines are exempt from FERC’s jurisdiction under the Natural Gas Act under FERC’s “stub” line exemption. Texas and Louisiana have adopted complaint-based regulation of intrastate natural gas transportation activities, which allows natural gas producers and shippers to file complaints with state regulators in an effort to resolve grievances relating to pipeline access and rate discrimination. The rates we charge for intrastate transportation are deemed just and reasonable unless challenged in a complaint. A complaint also can be filed with FERC regarding the rates, terms, and conditions of service on our pipelines providing service pursuant to Section 311 of the NGPA. We cannot predict whether such a complaint will be filed against us in the future. Failure to comply with state or FERC regulations can result in the imposition of administrative, civil and criminal penalties.
Intrastate Liquids
We operate intrastate NGL common carrier pipelines in Texas. Targa Gulf Coast operates pipelines that transport mixed and purity NGL streams between Targa’s Mont Belvieu and Galena Park, Texas facilities and certain third-party facilities. Grand Prix Pipeline and Targa NGL provide transportation of mixed NGLs from points within Texas to other points within Texas, including Mont Belvieu, Texas. Targa SouthTex NGL Pipeline Ltd. operates intrastate NGL pipelines providing services between various points in Nueces, San Patricio and Refugio Counties. Further, we operate crude gathering pipelines in the Permian Basin. With respect to intrastate movements, these pipelines are not subject to FERC regulation, but are subject to rate regulation by the RRC.
Our intrastate NGL pipelines in Louisiana gather mixed NGLs streams that we own from processing plants in Louisiana and deliver such streams to the Gillis and Lake Charles fractionators in Lake Charles, Louisiana. We deliver mixed and purity NGL streams out of our fractionators to and from Targa-owned storage, and to other third-party facilities and pipelines in Louisiana. Additionally, through our 50% ownership interest in Cayenne, we operate the Cayenne pipeline, which transports mixed NGLs from the Venice gas plant in Venice, Louisiana, to an interconnection with a third-party NGL pipeline in Toca, Louisiana. These pipelines are not subject to FERC regulation or rate regulation by the DNR. On May 9, 2019, the Louisiana Public Service Commission (“LPSC”) approved applications to register certain pipelines of Cayenne and Targa Downstream LLC in accordance with the LPSC 2015 General Order, Docket No. R-33390. LPSC regulations require that common carrier pipelines charge rates that are just and reasonable, and not unreasonably discriminatory.
EP Act of 2005
The EP Act of 2005 amended the NGA to add an anti-market manipulation provision which makes it unlawful for any entity to engage in prohibited behavior to be prescribed by FERC, and furthermore provides FERC with additional civil penalty authority. The EP Act of 2005 provides FERC with the power to assess civil penalties up to a maximum amount that is adjusted annually for inflation, which for 2025 equals approximately $1.6 million per violation per day for violations of the NGA or NGPA. The civil penalty provisions are applicable to entities that engage in the sale of natural gas for resale in interstate commerce as well as entities that are otherwise subject to the NGA or NGPA. In 2006, FERC issued Order No. 670 to implement the anti-market manipulation provision of the EP Act of 2005. Order No. 670 does not apply to activities that relate only to intrastate or other non-jurisdictional sales or gathering, but does apply to activities of gas pipelines and storage companies that provide interstate services, as well as otherwise non-jurisdictional entities to the extent the activities are conducted “in connection with” gas sales, purchases or transportation subject to FERC jurisdiction, which includes the annual reporting requirements under a final rule on the annual natural gas transaction reporting requirements, as amended by subsequent orders on rehearing (Order No. 704), and the quarterly reporting requirement under Order No. 735.
FERC Market Transparency Rules
Under Order No. 704, wholesale buyers and sellers of more than 2.2 Bcf of physical natural gas in the previous calendar year, including interstate and intrastate natural gas pipelines, natural gas gatherers, natural gas processors and natural gas marketers, are now required to report, on May 1 of each year, aggregate volumes of natural gas purchased or sold at wholesale in the prior calendar year to the extent such transactions utilize, contribute to, or may contribute to the formation of price indices.
Under Order No. 735, intrastate pipelines providing transportation services under Section 311 of the NGPA and Hinshaw pipelines operating under Section 1(c) of the NGA are required to report on a quarterly basis more detailed transportation and storage transaction information, including: rates charged by the pipeline under each contract; receipt and delivery points and zones or segments covered by each contract; the quantity of natural gas the shipper is entitled to transport, store, or deliver; the duration of the contract; and whether there is an affiliate relationship between the pipeline and the shipper. As currently written, this rule does not apply to our Hinshaw pipelines.
Additional proposals and proceedings that might affect the natural gas industry are pending before Congress, FERC and the courts. We cannot predict the ultimate impact of these or the above regulatory changes to our natural gas operations. We do not believe that we would be affected by any such FERC action materially differently than other midstream natural gas companies with whom we compete.
Other State and Local Regulation of Operations
Our business activities are subject to various state and local laws and regulations, as well as orders of regulatory bodies pursuant thereto, governing a wide variety of matters, including operations, marketing, production, pricing, community right-to-know, protection of the environment, safety, marine traffic and other matters. In addition, the Three Affiliated Tribes promulgate and enforce regulations pertaining to operations on the Fort Berthold Indian Reservation, on which we operate a significant portion of our Badlands gathering and processing assets. The Three Affiliated Tribes is a sovereign nation having the right to enforce certain laws and regulations independent from federal, state and local statutes and regulations. For additional information regarding the potential impact of federal, state, tribal or local regulatory measures on our business, see “Risk Factors—Risks Related to Regulatory Matters.”
Environmental and Occupational Health and Safety Matters
Our business operations are subject to numerous environmental and occupational health and safety laws and regulations that may be imposed at the federal, regional, state, tribal and local levels. The activities that we conduct in connection with (i) gathering, compressing, treating, processing, transporting, and purchasing and selling natural gas; (ii) storing, fractionating, treating, transporting, and purchasing and selling NGLs and NGL products, including services to LPG exporters; and (iii) gathering, storing, terminaling, and purchasing and selling crude oil are subject to or may become subject to stringent environmental regulation. We have implemented programs and policies designed to monitor and pursue operation of our pipelines, plants and other facilities in a manner consistent with existing environmental and occupational health and safety laws and regulations, and have incurred and will continue to incur operating and capital expenditures, some of which may be material, to comply with these laws and regulations. Historically, our environmental compliance costs have not had a material adverse effect on our results of operations; however, there can be no assurance that such costs will not be material in the future or that such future compliance will not have a material adverse effect on our business and operational results.
The more significant of these existing environmental and occupational health and safety laws and regulations include the following U.S. legal standards, as amended from time to time:
•the Clean Air Act (“CAA”), which restricts the emission of air pollutants from many sources and imposes various pre-construction, operational, monitoring and reporting requirements, and that the EPA has relied upon as authority for adopting climate change regulatory initiatives relating to greenhouse gas (“GHG”) emissions;
•the Federal Water Pollution Control Act, also known as the Clean Water Act, which regulates discharges of pollutants to state and federal waters and establishes the extent to which waterways are subject to federal jurisdiction and rulemaking as protected waters of the United States;
•the Comprehensive Environmental Response, Compensation and Liability Act of 1980 (“CERCLA”), which imposes liability on generators, transporters, and arrangers of hazardous substances at sites where hazardous substance releases have occurred or are threatening to occur;
•the Resource Conservation and Recovery Act (“RCRA”), which governs the generation, treatment, storage, transport, and disposal of solid wastes, including hazardous wastes;
•the Oil Pollution Act of 1990, which subjects owners and operators of onshore facilities, pipelines and other facilities, as well as lessees or permittees of areas in which offshore facilities are located, that are the site of an oil spill in waters of the United States, to liability for removal costs and damages;
•the Safe Drinking Water Act, which ensures the quality of the nation’s public drinking water through adoption of drinking water standards and controlling the injection of waste fluids into below-ground formations that may adversely affect drinking water sources;
•the Endangered Species Act, which restricts activities that may affect federally identified endangered and threatened species or their habitats through the implementation of operating restrictions or a temporary, seasonal, or permanent ban in affected areas;
•the National Environmental Policy Act, which requires federal agencies to evaluate major agency actions having the potential to impact the environment and that may require the preparation of environmental assessments and more detailed environmental impact statements that may be made available for public review and comment; and
•the Occupational Safety and Health Act, which establishes workplace standards for the protection of the health and safety of employees, including the implementation of hazard communications programs designed to inform employees about hazardous substances in the workplace, potential harmful effects of these substances, and appropriate control measures.
These environmental and occupational health and safety laws and regulations generally restrict the level of substances generated as a result of our operations that may be emitted to ambient air, discharged to surface water, and disposed or released to surface and below-ground soils and ground water. Additionally, there exist tribal, state and local jurisdictions in the United States where we operate that also have, or are developing or considering developing, similar environmental and occupational health and safety laws and regulations governing many of these same types of activities. Any failure by us to comply with these laws and regulations may result in the assessment of sanctions, including administrative, civil, and criminal fines or penalties; the imposition of investigatory, remedial, and corrective action obligations or the incurrence of capital expenditures; the occurrence of restrictions, delays or cancellations in the permitting, development or expansion of projects; and the issuance of injunctions restricting or prohibiting some or all of our activities in a particular area. Certain environmental laws also provide for citizen suits, which allow environmental organizations to act in place of the government and sue operators for alleged violations of environmental law. The ultimate financial impact arising from environmental laws and regulations is neither clearly known nor determinable as existing standards are subject to change and new standards continue to evolve.
We own, lease and/or operate numerous properties that have been used for crude oil and natural gas midstream services for many years. Additionally, some of our properties have been operated by third parties or by previous owners or operators whose treatment and disposal of hazardous substances, wastes, or petroleum hydrocarbons was not under our control. Under environmental laws such as CERCLA and RCRA, we could incur strict joint and several liability for remediating hydrocarbons, hazardous substances or wastes disposed of or released by us or prior owners or operators. We also could incur costs related to the clean-up of third-party sites to which we sent regulated substances for disposal or to which we sent equipment for cleaning, and for damages to natural resources or other claims related to releases of regulated substances at or from such third-party sites.
Over time, the trend in environmental and occupational health and safety regulation is to typically place more restrictions and limitations on activities that may adversely affect the environment or expose workers to injury and thus, any changes in environmental or occupational health and safety laws and regulations or reinterpretation of enforcement policies that may arise in the future and result in more stringent or costly waste management or disposal, pollution control, remediation or occupational health and safety-related requirements could have a material adverse effect on our business, results of operations and financial position. We may not have insurance or be fully covered by insurance against all environmental and occupational health and safety risks, and we may be unable to pass on increased compliance costs arising out of such risks to our customers. We review regulatory and environmental issues as they pertain to us and we consider regulatory and environmental issues as part of our general risk management approach. For more information on environmental and occupational health and safety matters, see the following Risk Factors under Part I, Item 1A. of this Form 10-K: “Our operations are subject to environmental laws and regulations and a failure to comply or an accidental release into the environment may cause us to incur significant costs and liabilities,” “We could incur significant costs in complying with stringent occupational safety and health requirements,” “Laws, regulations and executive orders limiting hydraulic fracturing activities could result in restrictions, delays or cancellations in drilling and completing new oil and natural gas wells by our customers, which could adversely impact our revenues by decreasing the volumes of natural gas, NGLs or crude oil through our facilities and reducing the utilization of our assets,” “Our and our customers’ operations are subject to a number of risks arising out of the threat of climate change, including the potential for increasingly stringent regulations for methane and other GHG emissions from the oil and gas sectors, that could result in increased operating costs, limit the areas in which oil and natural gas production may occur, and reduce demand for the products and services we provide, and reduce our or our customer's ability to access capital,” and “Stakeholder and market attention to sustainability matters and disclosure obligations may impact our business.”
Pipeline Safety Matters
Many of our natural gas, NGL and crude oil pipelines are subject to regulation by the federal Pipeline and Hazardous Materials Safety Administration (“PHMSA”), an agency of the U.S. Department of Transportation (“DOT”), under the Natural Gas Pipeline Safety Act of 1968, as amended (“NGPSA”), with respect to natural gas, and the Hazardous Liquids Pipeline Safety Act of 1979, as amended (“HLPSA”), with respect to crude oil, NGLs and condensates. The NGPSA and HLPSA govern the design, installation, testing, construction, operation, replacement and management of natural gas, crude oil, NGL and condensate pipeline facilities. Pursuant to these acts, PHMSA has promulgated regulations requiring pipeline operators to develop and implement integrity management programs to comprehensively evaluate certain relatively higher risk areas, known as high consequence areas (“HCAs”) and moderate consequence areas (“MCAs”), along pipelines and take additional safety measures to protect people and property in these areas. Recently, PHMSA finalized adjustments to the repair criteria for pipelines in HCAs, created new criteria for pipelines in non-HCAs, and strengthened integrity management assessment requirements. Various states have also adopted regulations, similar to existing PHMSA regulations for, and may have established agencies analogous to PHMSA to regulate, intrastate gathering and transmission lines. We currently estimate an average annual cost of approximately $12 million between 2025 and 2027 to continue our pipeline integrity management program inspections along certain segments of our natural gas and hazardous liquids pipelines. This estimate also includes the costs, if any, of repair, remediation, or preventative and mitigative actions that may be determined to be necessary as a result of the discovery of conditions during the ongoing inspection program. Additional unforeseen costs for repair, remediation, or preventative and mitigative actions could be material. At this time, we cannot predict the ultimate cost of compliance with applicable pipeline integrity management regulations, as the cost will vary significantly depending on the number and extent of any repairs found to be necessary as a result of the pipeline integrity inspections. Historically, our pipeline safety compliance costs have not had a material adverse effect on our results of operations; however, there can be no assurance that such costs will not be material in the future or that such future compliance will not have a material adverse effect on our business, financial condition or results of operations. See Risk Factor “We may incur significant costs and liabilities resulting from performance of pipeline testing integrity programs and related repairs as well as from initiatives relating to pipeline safety that require the use of new or more stringent safety controls or result in more rigorous enforcement of applicable legal requirements.” under Item 1A. of this Form 10-K for further discussion on pipeline safety standards, including integrity management requirements.
Title to Properties and Rights of Way
Our real property falls into two categories: (i) parcels that we own in fee and (ii) parcels in which our interest derives from leases, easements, rights of way, permits or licenses from landowners or governmental authorities permitting the use of such land for our operations. Portions of the land on which our plants and other major facilities are located are owned by us in fee title and we believe that we have satisfactory title to these lands. The remainder of the land on which our plant sites and major facilities are located are held by us pursuant to ground leases or easements between us, as lessee or grantee, and the fee owner of the lands, as lessors or grantors. We and our predecessors have leased or held easements on these lands for many years without any material challenge known to us relating to the title to the land upon which the assets are located, and we believe that we have satisfactory leasehold or easement estates to such lands. We have no knowledge of any challenge to the underlying fee title of any material lease, easement, rights of way, permit, lease or license, and we believe that we have satisfactory title to all of our material leases, easements, rights of way, permits, leases and licenses.
Corporation Tax Matters
As of December 31, 2024, Internal Revenue Service (the “IRS”) examinations are currently in process for the 2019, 2020 and 2022 taxable years of certain wholly-owned and consolidated subsidiaries that are treated as partnerships for U.S. federal income tax purposes. We are responding to information requests from the IRS with respect to these audits. We do not expect there to be any audit adjustments that would materially change our taxable income.
Federal statutes of limitations for returns filed in 2021 (for calendar year 2020) have expired. The 2019 returns under examination have a statute extension to December 2025. The statute of limitations expired on substantially all 2020 state income tax returns that were filed prior to October 15, 2021. For Texas, the statute of limitations has expired for 2020 returns (for calendar year 2019). However, tax authorities could review and adjust carryover attributes (e.g., net operating losses (“NOLs”)) generated in a closed tax year if utilized in an open tax year.
On August 16, 2022, President Biden signed into law the Inflation Reduction Act of 2022 (the “IRA”) which, among other things, introduced a corporate alternative minimum tax (the “CAMT”), imposed a 1% excise tax on stock buybacks, and provided tax incentives to promote clean energy. Under the CAMT, a 15% minimum tax will be imposed on certain financial statement income of “applicable corporations.” The IRA treats a corporation as an applicable corporation in any taxable year in which the “average annual adjusted financial statement income” of such corporation for the three taxable year period ending prior to such taxable year exceeds $1 billion.
The U.S. Department of the Treasury and the IRS have issued guidance on the application of the CAMT, including proposed regulations issued in September 2024, which may be relied upon until final regulations are released. Based on our interpretation of the IRA, the CAMT and related guidance, and several operational, economic, accounting and regulatory assumptions, we are currently not an “applicable corporation”, but we are likely to become one in a subsequent year, potentially as early as 2026. If we become an applicable corporation and our CAMT liability is greater than our regular U.S. federal income tax liability for any particular tax year, the CAMT liability would effectively accelerate our future U.S. federal income tax obligations, reducing our cash available for distribution in that year, but provide an offsetting credit against our regular U.S. federal income tax liability for the future. As a result, our current expectation is that the impact of the CAMT is limited to timing differences in future tax years. Given the complexities of the IRA, CAMT and the possibility that CAMT will be reduced or eliminated by the new Presidential administration, we will continue to monitor and evaluate the potential future impact to our financial statements.
Financial Information by Reportable Segment
See “Segment Information” included under Note 22 of the “Consolidated Financial Statements” for a presentation of financial results by reportable segment and see “Item 7. Management’s Discussion and Analysis of Financial Condition and Results of Operations—By Reportable Segment” for a discussion of our financial results by segment.
Available Information
We make certain filings with the SEC, including our Annual Report on Form 10-K, quarterly reports on Form 10-Q, current reports on Form 8-K, and all amendments and exhibits to those reports. We make such filings available free of charge through our website, http://www.targaresources.com, as soon as reasonably practicable after they are filed with the SEC. Our press releases and recent analyst presentations are also available on our website. The SEC also maintains an internet website at http://www.sec.gov that contains reports, proxy and information statements and other information regarding issuers, including us, that file electronically with the SEC. The information contained on the websites referenced in this Annual Report on Form 10-K is not incorporated herein by reference.
Item 1A. Risk Factors
The nature of our business activities subjects us to certain hazards and risks. You should consider carefully the following risk factors together with all the other information contained in this report. If any of the following risks were to occur, then our business, financial condition, cash flows and results of operations could be materially adversely affected.
Summary Risk Factors
Risks Related to our Results of Operations
•Our cash flow is affected by supply and demand for natural gas, NGL products and crude oil and by natural gas, NGL, crude oil and condensate prices, and decreases in commodity prices and/or activity levels could adversely affect our results of operations and financial condition.
•A reduction in demand for NGL products by the petrochemical, refinery or other industries or by the fuel or export markets, or a significant increase in NGL product supply relative to this demand, could materially adversely affect our business, results of operations and financial condition.
•The natural decline in production in our operating regions and in other regions from which we source NGL supplies means our long-term success depends on our ability to obtain new sources of supplies of natural gas, NGLs and crude oil, which depends on certain factors beyond our control. Any decrease in supplies of natural gas, NGLs or crude oil could adversely affect our business and operating results.
•Our industry is highly competitive and increased competitive pressure could adversely affect our business and operating results.
•We operate in areas of high industry activity, which may affect our ability to hire, train or retain qualified personnel needed to manage and operate our business.
•If third-party pipelines and other facilities interconnected to our natural gas and crude oil gathering systems, terminals and processing facilities or to our NGL pipelines, fractionators and storage facilities become partially or fully unavailable to transport natural gas, NGLs and crude oil, our revenues could be adversely affected.
•We typically do not obtain independent evaluations of natural gas or crude oil reserves dedicated to our gathering pipeline systems; therefore, volumes on our systems in the future could be less than we anticipate.
•We do not own most of the land on which our pipelines, terminals and compression facilities are located, which could disrupt our operations.
•If we lose any of our named executive officers, our business may be adversely affected.
•Weather events may damage our pipelines and other facilities, limit our ability or increase the costs to operate our business and adversely impact our customers on whom we rely on for throughput as well as third party vendors from whom we receive goods, which developments could cause us to incur significant costs and adversely affect our business, results of operations and financial condition.
•Our business involves many hazards and operational risks, some of which may not be insured or fully covered by insurance. If a significant accident or event occurs for which we are not fully insured, if we fail to recover all anticipated insurance proceeds for significant accidents or events for which we are insured, or if we fail to rebuild facilities damaged by such accidents or events, our operations and financial results could be adversely affected.
•Unexpected volume changes due to production variability or to gathering, plant or pipeline system disruptions may increase our exposure to commodity price movements.
•Portions of our pipeline systems may require increased expenditures for maintenance and repair owing to the age of some of our systems, which expenditures or resulting loss of revenue due to pipeline age or condition could have a material adverse effect on our business and results of operations.
•Terrorist attacks and the threat of terrorist attacks have resulted in increased costs to our business. Continued global and domestic hostilities may adversely impact our results of operations.
•We face opposition to operation and expansion of our pipelines and facilities from various individuals and groups.
•We may incur significant costs and liabilities resulting from performance of pipeline integrity testing programs and related repairs, as well as from initiatives relating to pipeline safety that require the use of new or more stringent safety controls or result in more rigorous enforcement of applicable legal requirements.
•We are subject to cybersecurity risks. A cyber incident could occur and result in information theft, data corruption, operational disruption, disclosure of business sensitive, confidential or personally identifiable information, misdirected wire transfers, reputational harm, and financial loss.
•The widespread outbreak of illnesses or any other public health crises that impacts operations and/or the global demand for energy commodities may have material adverse effects on our business, financial position, results of operations and/or cash flows.
Risks Related to our Capital Projects and Future Growth
•Our expansion or modification of existing assets or the construction of new assets may not result in revenue increases and are subject to regulatory, environmental, political, legal and economic risks, which could adversely affect our results of operations and financial condition.
•If we do not develop growth projects and/or make acquisitions for expanding existing assets or constructing new assets on economically acceptable terms, or fail to efficiently and effectively integrate developed or acquired assets with our asset base, our future growth will be limited. In addition, any acquisitions we complete are subject to substantial risks that could adversely affect our financial condition and results of operations and reduce our ability to pay dividends to stockholders. In addition, we may not achieve the expected results of any acquisitions and any adverse conditions or developments related to such acquisitions may have a negative impact on our operations and financial condition.
•We may be unable to cause our joint ventures to take or not to take certain actions unless some or all of our joint venture participants agree.
Risks Related to our Financial Condition
•If we fail to maintain an effective system of internal controls, we may not be able to accurately report our financial results or prevent fraud. In addition, potential changes in accounting standards might cause us to revise our financial results and disclosure in the future.
•We are exposed to credit risks of our customers, and any material nonpayment or nonperformance by our key customers could adversely affect our cash flow and results of operations.
•Inflationary issues and associated changes in monetary policy have resulted in and may result in additional increases to the cost of our goods, services and personnel, which in turn cause our capital expenditures and operating costs to rise.
•Changes in future business conditions could have a negative impact on the demand for our services and could cause recorded long-lived assets to become further impaired, and our financial condition and results of operations could suffer if there is a negative impact on the demand for our services and an additional impairment of long-lived assets.
•Our hedging activities may not be effective in reducing the variability of our cash flows and may, in certain circumstances, increase the variability of our cash flows. Moreover, our hedges may not fully protect us against volatility in basis differentials. Finally, the percentage of our expected equity commodity volumes that are hedged decreases substantially over time.
•If we fail to balance our purchases and sales of the commodities we handle, our exposure to commodity price risk will increase.
•The amounts we pay in dividends may vary from anticipated amounts and circumstances may arise that lead to conflicts between using funds to pay anticipated dividends or to invest in our business.
•Our future tax liability may be greater than expected if our NOL carryforwards are limited, we do not generate expected deductions, tax authorities successfully challenge certain of our tax positions or from changes in tax laws.
•Changes in tax laws or the interpretation thereof or the imposition of new or increased taxes may adversely affect our financial condition, results of operations and cash flows.
•Derivatives legislation and its implementing regulations could have a material adverse effect on our ability to use derivative instruments to reduce the effect of commodity price, interest rate and other risks associated with our business.
Risks Related to the Ownership of our Common Stock
•Future sales of our common stock could lower our stock price, and any additional capital raised by us through the sale of equity or convertible securities may dilute your ownership in us.
•Our amended and restated certificate of incorporation and amended and restated bylaws, as well as Delaware law, contain provisions that could discourage acquisition bids or merger proposals, which may adversely affect the market price of our common stock.
•We may issue preferred stock whose terms could adversely affect the voting power or value of our common stock.
Risks Related to our Indebtedness
•Increases in interest rates, due to associated Federal Reserve policies or otherwise, could adversely affect our cost of capital, which could increase our funding costs and reduce the overall profitability of our business.
•We have a substantial amount of indebtedness which may adversely affect our financial position and we may still be able to incur substantially more debt, which could collectively increase the risks associated with compliance with our financial covenants.
•The terms of our debt agreements may restrict our current and future operations, particularly our ability to respond to changes in business or to take certain actions, including to pay dividends to our stockholders.
Risks Related to Regulatory Matters
•Our and our customers’ operations are subject to a number of risks arising out of the threat of climate change, including the potential for increasingly stringent regulations for methane and other GHG emissions from the oil and gas sector, that could result in increased operating costs, limit the areas in which oil and natural gas production may occur, reduce demand for the products and services we provide, and reduce our or our customers’ ability to access capital.
•Stakeholder and market attention to sustainability matters and disclosure obligations may impact our business.
•We could incur significant costs in complying with more stringent occupational safety and health requirements.
•State laws and regulations limiting hydraulic fracturing activities could result in restrictions, delays or cancellations in drilling and completing new oil and natural gas wells by our customers, which could adversely impact our revenues by decreasing the volumes of natural gas, NGLs or crude oil through our facilities and reducing the utilization of our assets.
•Our operations are subject to environmental laws and regulations and a failure to comply or an accidental release into the environment may cause us to incur significant costs and liabilities.
•A change in the jurisdictional characterization of some of our assets by federal, state, tribal or local regulatory agencies or a change in policy by those agencies may result in increased regulation of our assets, which may (i) cause our revenues to decline and operating expenses to increase or (ii) delay or increase the cost of expansion projects.
•Should we fail to comply with all applicable FERC-administered statutes, rules, regulations and orders, we could be subject to substantial penalties and fines.
•We are subject to cybersecurity and data privacy laws and regulations, and we may become subject to litigation and directives relating to our processing of personal information.
Risks Related to our Results of Operations
Our cash flow is affected by supply and demand for natural gas, NGL products and crude oil and by natural gas, NGL, crude oil and condensate prices, and decreases in commodity prices and/or activity levels could adversely affect our results of operations and financial condition.
Our operations can be affected by the level of natural gas, NGL and crude oil prices and the relationship between these prices. The prices of natural gas, NGLs and crude oil have been historically volatile, and we expect this volatility to continue which impacts production activity levels. Our future cash flows may be materially adversely affected if we experience significant, prolonged price deterioration that also decreases production activity levels in our areas of operation. The markets and prices for natural gas, NGLs and crude oil depend upon factors beyond our control. These factors include supply and demand for these commodities, which fluctuates with changes in market and economic conditions, and other factors, including:
•the impact of seasonality and weather, including severe weather conditions and other natural disasters, such as flooding, droughts and winter storms, the frequency, severity and impact of which could be increased by the effects of climate change;
•general economic conditions and economic conditions impacting our primary markets, including the impact of proposed tariffs, inflation and increases in interest rates and associated changes in monetary policy;
•the economic conditions of our customers;
•the level of domestic crude oil and natural gas production and consumption;
•the availability of imported natural gas, liquefied natural gas, NGLs and crude oil;
•actions taken by major foreign oil and gas producing nations;
•the availability of local, intrastate and interstate transportation systems and storage for residue natural gas and NGLs;
•the availability of domestic storage for crude oil;
•the availability and marketing of competitive fuels and/or feedstocks;
•the impact of energy conservation efforts, including the promotion of the transition to a low carbon economy;
•stockholder activism and activities by non-governmental organizations to limit certain sources of funding for the energy sector or restrict the exploration, development and production of crude oil and natural gas; and
•the extent and nature of governmental regulation and taxation, including those related to the prorationing of oil and gas production.
Our commercial agreements across our Gathering and Processing and Logistics and Transportation businesses with our customers are predominantly fee-based arrangements, whereby we charge a fee for unit of throughput. Some of the commercial agreements in our natural gas gathering and processing business are percent-of-proceeds arrangements that expose us to commodity price risk. Certain of these have commodity price protection features. Under our percentage-of-proceeds arrangements, we generally process natural gas from producers and remit to the producers an agreed percentage of the proceeds from the sale of residue gas and NGL products at market prices or a percentage of residue gas and NGL products at the tailgate of our processing facilities. In some percent-of-proceeds arrangements, we remit to the producer a percentage of an index-based price for residue gas and NGL products, less agreed adjustments, rather than remitting a portion of the actual sales proceeds. Under these types of arrangements, our revenues and cash flows increase or decrease, whichever is applicable, as the prices of natural gas, NGLs and crude oil fluctuate, to the extent our exposure to these prices is unhedged. See “Item 7A. Quantitative and Qualitative Disclosures About Market Risk.”
A reduction in demand for NGL products by the petrochemical, refinery or other industries or by the fuel or export markets, or a significant increase in NGL product supply relative to this demand, could materially adversely affect our business, results of operations and financial condition.
The NGL products we produce have a variety of applications, including heating fuels, petrochemical feedstocks and refining blend stocks. A reduction in demand for NGL products, whether because of general or industry-specific economic conditions, government
regulations, global competition, reduced demand by consumers for products made with NGL products (for example, reduced petrochemical demand observed due to lower activity in the automobile and construction industries), reduced demand for propane or butane exports whether for price or other reasons, increased competition from petroleum-based feedstocks due to pricing differences, mild winter weather for some NGL applications or other reasons, could result in a decline in the volume of NGL products we handle or reduce the fees we charge for our services. Also, increased supply of NGL products could reduce the value of NGLs handled by us and reduce the margins realized. Our NGL products and their demand are affected as follows:
Ethane. Ethane is typically supplied as purity ethane and as part of an ethane-propane mix. Ethane is primarily used in the petrochemical industry as feedstock for ethylene, one of the basic building blocks for a wide range of plastics and other chemical products. Although ethane is typically extracted as part of the mixed NGL stream at gas processing plants, if natural gas prices increase significantly in relation to NGL product prices or if the demand for ethylene falls, it may be more profitable for natural gas processors to leave the ethane in the natural gas stream, thereby reducing the volume of NGLs delivered for fractionation and marketing.
Propane. Propane is used as a petrochemical feedstock in the production of ethylene and propylene, as a heating, engine and industrial
fuel, and in agricultural applications such as crop drying. Changes in demand for ethylene and propylene could adversely affect demand for propane. The demand for propane as a heating fuel is significantly affected by weather conditions. The volume of propane sold is increasingly driven by international exports supplying a growing global demand for the product. Domestically in the U.S., propane is at its highest during the six-month peak heating season of October through March. Demand for our propane may be reduced during periods of slow global economic growth and warmer-than-normal weather.
Normal Butane. Normal butane is used in the production of isobutane, as a refined petroleum product blending component, as a fuel gas (either alone or in a mixture with propane) and in the production of ethylene and propylene. Changes in the composition of refined petroleum products resulting from governmental regulation, changes in feedstocks, products and economics, and demand for heating fuel, ethylene and propylene could adversely affect demand for normal butane. The volume of butane sold is increasingly driven by international exports supplying a growing demand for the product.
Isobutane. Isobutane is predominantly used in refineries to produce alkylates to enhance octane levels. Accordingly, any action that reduces demand for motor gasoline or demand for isobutane to produce alkylates for octane enhancement might reduce demand for isobutane.
Natural Gasoline. Natural gasoline is used as a blending component for certain refined petroleum products and as a feedstock used in the production of ethylene and propylene. Changes in the mandated composition of motor gasoline resulting from governmental regulation, and in demand for ethylene and propylene, could affect demand for natural gasoline.
NGLs and products produced from NGLs also compete with products from global markets. Any reduced demand or increased supply for ethane, propane, normal butane, isobutane or natural gasoline in the markets we access for any of the reasons stated above could adversely affect both demand for the services we provide and NGL prices, which could negatively impact our results of operations and financial condition.
The natural decline in production in our operating regions and in other regions from which we source NGL supplies means our long-term success depends on our ability to obtain new sources of supplies of natural gas, NGLs and crude oil, which depends on certain factors beyond our control. Any decrease in supplies of natural gas, NGLs or crude oil could adversely affect our business and operating results.
Our gathering systems are connected to crude oil and natural gas wells from which production will naturally decline over time, which means that the cash flows associated with these sources of natural gas and crude oil will likely also decline over time. Our logistics assets are similarly impacted by declines in NGL supplies in the regions in which we operate as well as other regions from which we source NGLs. To maintain or increase throughput levels on our gathering systems and the utilization rate at our processing plants and our treating and fractionation facilities, we must continually obtain new natural gas, NGL and crude oil supplies. A material decrease in natural gas or crude oil production from producing areas on which we rely, as a result of depressed commodity prices or otherwise, could result in a decline in the volume of natural gas or crude oil that we gather and process, NGLs that we transport or NGL products delivered to our fractionation facilities. Our ability to obtain additional sources of natural gas, NGLs and crude oil depends, in part, on the level of successful drilling and production activity near our gathering systems and, in part, on the level of successful drilling and production in other areas from which we source NGL and crude oil supplies. We have no control over the level of such activity in the areas of our operations, the amount of reserves associated with the wells or the rate at which production from a well will decline. In addition, we have no control over producers or their drilling, completion or production decisions, which are affected by, among other things, prevailing and projected energy prices, demand for hydrocarbons, the level of reserves, geological considerations, governmental regulations, the availability of drilling rigs, other production and development costs and the availability and cost of capital.
Fluctuations in energy prices can greatly affect production rates and investments by third parties in the development of new oil and natural gas reserves. Even if new natural gas or crude oil reserves are discovered in areas served by our assets, producers may choose not to develop those reserves. In response to depressed commodity prices, operators may engage in curtailment or shut-ins or substantially reduce their estimated capital expenditures, rig count and completion crews. Reductions in exploration and production activity, competitor actions or shut-ins by producers in the areas in which we operate may prevent us from obtaining supplies of natural gas or crude oil to replace the natural decline in volumes from existing wells, which could result in reduced volumes through our facilities and reduced utilization of our gathering, treating, processing, transportation and fractionation assets.
Our industry is highly competitive and increased competitive pressure could adversely affect our business and operating results.
We compete with similar enterprises in our respective areas of operation. Some of our competitors are large crude oil, natural gas and NGL companies that have greater financial resources and access to supplies of natural gas, NGLs and crude oil than we do. Some of these competitors may expand or construct gathering, processing, storage, terminaling and transportation systems that would create additional competition for the services we provide to our customers. In addition, customers who are significant producers of natural gas may develop their own gathering, processing, storage, terminaling and transportation systems in lieu of using those operated by us. Our ability to renew or replace existing contracts with our customers at rates sufficient to maintain current revenues and cash flows could be adversely affected by the activities of our competitors and our customers. All of these competitive pressures could have a material adverse effect on our business, results of operations and financial condition.
We operate in areas of high industry activity, which may affect our ability to hire, train or retain qualified personnel needed to manage and operate our business.
We operate in areas in which industry activity has increased rapidly. As a result, demand for qualified personnel in these areas, particularly those related to our Permian and Badlands assets, and the cost to attract and retain such personnel, has increased over the past few years due to competition, and may increase substantially in the future. Moreover, our competitors may be able to offer better compensation packages to attract and retain qualified personnel than we are able to offer.
Any delay or inability to secure the personnel necessary for us to continue or complete our current and planned development projects, or any significant increases in costs with respect to the hiring, training or retention of qualified personnel, could have a material adverse effect on our business, financial condition and results of operations.
If third-party pipelines and other facilities interconnected to our natural gas and crude oil gathering systems, terminals and processing facilities or to our NGL pipelines, fractionators and storage facilities become partially or fully unavailable to transport natural gas, NGLs and crude oil, our revenues could be adversely affected.
We depend upon third-party pipelines, storage and other facilities that provide delivery options to and from our gathering and processing facilities and our NGL pipelines, fractionators and storage facilities. Since we do not own or operate these pipelines or other facilities, their continuing operation in their current manner is not within our control. If any of these third-party facilities become partially or fully unavailable, or if the quality specifications for their facilities change so as to restrict our ability to utilize them, our revenues could be adversely affected.
We typically do not obtain independent evaluations of natural gas or crude oil reserves dedicated to our gathering pipeline systems; therefore, volumes on our systems in the future could be less than we anticipate.
We typically do not obtain independent evaluations of natural gas or crude oil reserves connected to our gathering systems due to the unwillingness of producers to provide reserve information as well as the cost of such evaluations. Accordingly, we do not have independent estimates of total reserves dedicated to our gathering systems or the anticipated life of such reserves. If the total reserves or estimated life of the reserves connected to our gathering systems is less than we anticipate and we are unable to secure additional sources of supply, then the volumes of natural gas or crude oil transported on our gathering systems in the future could be less than we anticipate. A decline in the volumes on our systems could have a material adverse effect on our business, results of operations and financial condition.
We do not own most of the land on which our pipelines, terminals and compression facilities are located, which could disrupt our operations.
We do not own most of the land on which our pipelines, terminals and compression facilities are located, and we are therefore subject to the possibility of more onerous terms and/or increased costs to retain necessary land use if we do not have valid rights of way or leases or if such rights of way or leases lapse or terminate. We sometimes obtain the rights to land owned by third parties and governmental agencies for a specific period of time. Additionally, the federal Tenth Circuit Court of Appeals has held that tribal
ownership of even a very small fractional interest in an allotted land, that is, tribal land owned or at one time owned by an individual Indian landowner, bars condemnation of any interest in the allotment. Consequently, the inability to condemn such allotted lands under circumstances where an existing pipeline rights of way may soon lapse or terminate serves as an additional impediment for pipeline operators. We cannot guarantee that we will always be able to renew existing rights of way or obtain new rights of way without experiencing significant costs. Any loss of rights with respect to our real property, through our inability to renew rights of way contracts or leases, or otherwise, could cause us to cease operations on the affected land, increase costs related to continuing operations elsewhere and reduce our revenue.
If we lose any of our named executive officers, our business may be adversely affected.
Our success is dependent upon the efforts of our named executive officers. Our named executive officers are responsible for executing our business strategies. There is substantial competition for qualified personnel in the midstream oil and gas industry. We may not be able to retain our existing named executive officers or fill new positions or vacancies created by expansion or turnover. We have not entered into employment agreements with any of our named executive officers. In addition, we do not maintain “key man” life insurance on the lives of any of our named executive officers. A loss of one or more of our named executive officers could harm our business and prevent us from implementing our business strategies.
Weather events may damage our pipelines and other facilities, limit our ability or increase the costs to operate our business and adversely impact our customers on whom we rely on for throughput as well as third party vendors from whom we receive goods, which developments could cause us to incur significant costs and adversely affect our business, results of operations and financial condition.
Weather events in the areas in which we or our customers operate can cause disruptions and in some cases suspension of our operations and development activities. For example, unseasonably wet weather, extended periods of below freezing weather, or hurricanes, among other disruptive weather patterns, may cause a loss of throughput from temporary cessation of activities or lost, damaged or ineffective equipment. Our planning for normal climatic variation, insurance programs and emergency recovery plans may inadequately mitigate the effects of such weather conditions, and not all such effects can be predicted, eliminated or insured against. Potential climatic changes may have significant physical effects, such as increased frequency and severity of storms, floods, droughts, extreme temperatures, wildfires and wintry conditions and could have an adverse effect on our infrastructure or continued operations as well as the operations of our oil and gas exploration and production customers that deliver natural gas to us for processing and throughput, our third party vendors that supply us with goods, utilities necessary for our, our suppliers’, or our customers’ continued operations, and third party insurance providers that make insuring products available to defray our costs or offset any damages and losses we incur. Any unusual or prolonged severe weather events or increased frequency thereof, such as freezing weather or rain, earthquakes, hurricanes, droughts, extreme temperatures, wildfires or floods in our oil and gas exploration and production customers’ or our third party vendors’ areas of operations or markets, whether due to climatic change or otherwise, could have a material adverse effect on our business, results of operations and financial condition.
Our operations along the Gulf Coast, in offshore waters and at major river crossings in particular could be adversely impacted by changing climatic conditions, as rising sea levels, subsidence and erosion are potential causes for serious damage to our pipelines and other facilities, which could affect our ability to provide services. These damages could result in leakage, migration, releases or spills from our operations to surface or subsurface soils, surface water, groundwater or to the Gulf of Mexico and could result in liability, remedial obligations or otherwise have a negative impact on continued operations. Additionally, rising sea levels, subsidence and erosion processes could impact our oil and gas exploration and production customers who operate along the Gulf Coast, and they may be unable to utilize our services. Adverse climatic impacts, whether inland or along the coast or offshore, could also affect our third-party suppliers, which could limit their ability to provide us with the necessary products and services enabling us to maintain operation of our pipelines and other facilities. As a result, we may incur significant costs to repair, preserve or make more efficient our pipeline infrastructure and other facilities. Such costs could adversely affect our business, financial condition, results of operations and cash flows.
Moreover, we could incur significant costs to weatherize or upgrade weatherization of our facility equipment in anticipation of future weather events. For example, following Texas Governor Greg Abbott’s direction to adopt rules related to weather resiliency, in August 2022, the Texas Railroad Commission adopted the Weather Emergency Preparedness Standards rule, which requires critical gas facilities on the state’s Electricity Supply Chain Map (including gas pipelines that directly serve electricity generation) to (i) weatherize to help ensure sustained operations during a weather emergency, (ii) correct known issues that caused weather-related forced stoppages and (iii) contact the Texas Railroad Commission if a facility sustains a weather-related forced stoppage during a weather emergency. If we are required to further weatherize or update weatherization of certain facilities, we may incur significant costs to complete any additional weatherization. Additionally, issues beyond our control, such as grid reliability or the severity of any such weather event, might undermine any winterization or emergency weather preparedness efforts we make. Furthermore, our operations in western Texas and New Mexico may be sensitive to drought and restrictions on water use.
Our business involves many hazards and operational risks, some of which may not be insured or fully covered by insurance. If a significant accident or event occurs for which we are not fully insured, if we fail to recover all anticipated insurance proceeds for significant accidents or events for which we are insured, or if we fail to rebuild facilities damaged by such accidents or events, our operations and financial results could be adversely affected.
Our operations are subject to many hazards inherent in gathering, compressing, treating, processing, transporting, purchasing and selling natural gas; transporting, storing, fractionating, treating and purchasing and selling NGLs and NGL products, including services to LPG exporters; and gathering, storing, terminaling and purchasing and selling crude oil, including:
•damage to pipelines and plants, related equipment and surrounding properties caused by hurricanes, earthquakes, tornadoes, floods, fires, extreme temperatures, and other natural disasters, explosions, cyberattacks, and acts of terrorism;
•inadvertent damage from third parties, including from motor vehicles and construction, farm or utility equipment;
•damage that is the result of our negligence or any of our employees’ negligence;
•leaks of natural gas, NGLs, crude oil and other hydrocarbons or losses of natural gas or NGLs as a result of the malfunction of equipment or facilities;
•spills or other unauthorized releases of natural gas, NGLs, crude oil, other hydrocarbons or waste materials that contaminate the environment, including soils, surface water and groundwater, and otherwise adversely impact natural resources; and
•other hazards that could also result in personal injury, loss of life, pollution and/or suspension of operations.
These risks could result in substantial losses due to personal injury, loss of life, severe damage to and destruction of property and equipment, and pollution or other environmental or natural resource damage, and may result in delay, curtailment or suspension of our related operations. A natural disaster or other hazard affecting the areas in which we operate could have a material adverse effect on our operations. We are not fully insured against all risks inherent to our business. Additionally, while we are insured against pollution resulting from environmental accidents that occur on a sudden and accidental basis, we may not be insured against all environmental accidents that might occur, some of which may result in toxic tort claims. If a significant accident or event occurs that is not fully insured, if we fail to recover all anticipated insurance proceeds for significant accidents or events for which we are insured, or if we fail to rebuild facilities damaged by such accidents or events, our operations and financial condition could be adversely affected. In addition, we may not be able to maintain or obtain insurance of the type and amount we desire at reasonable rates. As a result of market conditions, premiums and deductibles for certain of our insurance policies have increased substantially, and could escalate further. For example, following the occurrence of severe hurricanes along the U.S. Gulf Coast, insurance premiums, deductibles and co-insurance requirements increased substantially, and terms were generally less favorable than terms that could be obtained prior to such hurricanes, with some coverage unavailable at any cost. Further, due to the impacts of recent weather events, certain major insurance companies are either reducing, or no longer offering, certain coverages in Texas, among other states. If a significant accident or event occurs for which we are not fully insured or if we fail to acquire insurance for certain of our operations generally, our operations and financial results could be adversely affected.
Unexpected volume changes due to production variability or to gathering, plant or pipeline system disruptions may increase our exposure to commodity price movements.
We sell processed natural gas at plant tailgates or at pipeline pooling points. Sales made to natural gas marketers and end-users may be interrupted by disruptions to volumes anywhere along the system. We attempt to balance sales with volumes supplied from processing operations, but unexpected volume variations due to production variability or to gathering, plant or pipeline system disruptions may expose us to volume imbalances, which, in conjunction with movements in commodity prices, could materially impact our income from operations and cash flow.
Portions of our pipeline systems may require increased expenditures for maintenance and repair owing to the age of some of our systems, which expenditures or resulting loss of revenue due to pipeline age or condition could have a material adverse effect on our business and results of operations.
Some portions of the pipeline systems that we operate have been in service for several decades prior to our purchase of them. Consequently, there may be historical occurrences or latent issues regarding our pipeline systems that our executive management may be unaware of and that may have a material adverse effect on our business and results of operations. The age and condition of some of our pipeline systems could also result in increased maintenance or repair expenditures, and any downtime associated with increased maintenance and repair activities could materially reduce our revenue. Any significant increase in maintenance and repair expenditures or loss of revenue due to the age or condition of some portions of our pipeline systems could adversely affect our business and results of operations.
Terrorist attacks and the threat of terrorist attacks have resulted in increased costs to our business. Continued global and domestic hostilities may adversely impact our results of operations.
The long-term impact of terrorist attacks and the threat of future terrorist attacks on our industry in general and on us in particular is not known at this time. However, resulting regulatory requirements and/or related business decisions associated with security are likely to increase our costs. Increased security measures taken by us as a precaution against possible terrorist attacks have resulted in increased costs to our business. Uncertainty surrounding continued global and domestic hostilities may affect our operations in unpredictable ways, including disruptions of crude oil supplies and markets for our products, and the possibility that infrastructure facilities could be direct targets, or indirect casualties, of an act of terror.
Changes in the insurance markets attributable to terrorist attacks may make certain types of insurance more difficult for us to obtain. Moreover, the insurance that may be available to us may be significantly more expensive than our existing insurance coverage or coverage may be reduced or unavailable. Instability in the financial markets as a result of terrorism or war could also affect our ability to raise capital.
We face opposition to operation and expansion of our pipelines and facilities from various individuals and groups.
We have experienced, and may encounter from time to time, opposition to the operation and expansion of our pipelines and facilities from governmental officials, non-governmental environmental organizations and groups, landowners, tribal groups, local groups and other advocates. In some instances, we encounter opposition which disfavors hydrocarbon-based energy supplies regardless of practical implementation or financial considerations. Opposition to our operation and expansion can take many forms, including the delay, denial or termination of required governmental permits or approvals, organized protests, attempts to block or sabotage our operations, intervention in regulatory or administrative proceedings involving our assets or lawsuits or other actions designed to prevent, disrupt, delay or terminate the operation or expansion of our assets and business. Similar actions pursued against our oil and gas customers could result in interruptions or limitations to their businesses, which could reduce demand for our services. Any such event that restricts, delays or prevents the expansion of our or our customers’ businesses, interrupts the revenues generated by our or our customers’ operations or causes us or our customers to make significant expenditures not covered by insurance could adversely affect our business, results of operations, and financial condition, as well as reduce the demand for our services. Regulatory attention to environmental justice matters at the federal and state level may also provide communities opposed to our operations with greater opportunities to challenge or delay the permitting approval process.
We may incur significant costs and liabilities resulting from performance of pipeline integrity testing programs and related repairs, as well as from initiatives relating to pipeline safety that require the use of new or more stringent safety controls or result in more rigorous enforcement of applicable legal requirements.
Pursuant to the authority under the NGPSA and HLPSA, PHMSA has established rules requiring pipeline operators to develop and implement integrity management programs for certain natural gas and hazardous liquids pipelines located where a pipeline leak or rupture could affect higher and moderate consequence risk areas, known as HCAs and MCAs, which are areas where a release could have the most significant adverse consequences. Among other things, these regulations require operators of covered pipelines to:
•perform ongoing assessments of pipeline integrity;
•identify and characterize applicable threats to pipeline segments that could impact an HCA, MCA or Class 3 or 4 area;
•maintain processes for data collection, integration and analysis;
•repair and remediate pipelines as necessary; and
•implement preventive and mitigating actions.
The Pipeline Safety, Regulatory Certainty, and Job Creation Act of 2011 (“2011 Pipeline Safety Act”), the Protecting our Infrastructure of Pipelines and Enhancing Safety Act of 2016 (“2016 Pipeline Safety Act”) and the Protecting Our Infrastructure of Pipelines and Enhancing Safety (“PIPES”) Act of 2020, require PHMSA to impose more stringent pipeline safety standards on pipeline operators. As a result of those legislative enactments, PHMSA has issued several significant rulemakings. In August 2022, PHMSA finalized the last of three rules known collectively as the “Gas Mega Rule,” which collectively, among other items, imposed safety regulations on previously unregulated onshore gas gathering lines, required updated inspection and maintenance plans for the elimination of hazardous leaks and minimization of natural gas released from pipeline facilities and adjusted and strengthened repair, maintenance and integrity management assessment criteria for pipelines in HCAs and non-HCAs. The rule has been subject to litigation, and in August 2024, the D.C. Circuit Court agreed with the challengers that PHMSA had failed to conduct an adequate cost-benefit analysis of four of the new standards, vacating those aspects of the rules. The integrity-related requirements and other provisions of the 2011 Pipeline Safety Act, the 2016 Pipeline Safety Act, and the PIPES Act of 2020, as well as any implementation of PHMSA rules thereunder, could require us to pursue additional capital projects or conduct integrity or maintenance programs on an accelerated basis and incur increased operating costs that could have a material adverse effect on our costs of transportation services as well as our business, results of operations and financial condition.
In addition, certain states, including Texas, Louisiana, Oklahoma, New Mexico, and North Dakota, where we conduct operations, have adopted regulations similar to existing PHMSA regulations for certain intrastate natural gas and hazardous liquids pipelines. We plan to continue our pipeline integrity inspection programs to assess and maintain the integrity of our pipelines. The results of these inspections may cause us to incur material and unanticipated capital and operating expenditures for repairs or upgrades deemed necessary to ensure the continued safe and reliable operation of our pipelines.
The imposition of new or enhanced safety requirements, or any issuance or reinterpretation of guidance by PHMSA or any other state or federal agencies with respect thereto, may require us to install new or modified safety controls, pursue additional capital projects or conduct maintenance programs on an accelerated basis, any or all of which could result in increased operating costs that could have an adverse effect on our results of operations or financial position.
We are subject to cybersecurity risks. A cyber incident could occur and result in information theft, data corruption, operational disruption, disclosure of business sensitive, confidential or personally identifiable information, misdirected wire transfers, reputational harm, and financial loss.
The oil and natural gas industry has become increasingly dependent on digital technologies to conduct business. For example, we depend on digital technologies to operate our facilities, serve our customers and record financial data. At the same time, cyber incidents, including deliberate attacks, have increased. Our technologies, systems, networks, including our operational technology systems, and those of our business partners may become the target of cyberattacks or security breaches. The U.S. government has issued public warnings that indicate that energy assets might be specific targets of cybersecurity threats. Our technologies, systems and networks, and those of our vendors, suppliers, customers and other business partners, may become the target of cyberattacks or information security breaches that could result in the unauthorized release, gathering, monitoring, misuse, loss or destruction of proprietary and other information, or could adversely disrupt our business operations. In addition, certain cyber incidents, such as surveillance, may remain undetected for an extended period. Our systems for protecting against cybersecurity risks may not be sufficient, and no security measure is infallible. As cyber incidents continue to evolve, we will be required to expend additional resources to enhance our security posture and cybersecurity defenses or to investigate and remediate any vulnerability to or consequences of cyber incidents. Advances in computer capabilities, rapid changes and innovation in the field of artificial intelligence, cryptography, inadequate facility security or other developments may result in a compromise or breach of the technology we use to safeguard confidential, personal, or otherwise protected information. As the breadth and complexity of the technologies we use continue to grow, including as a result of the use of artificial intelligence, mobile devices, cloud computing, open source software, social media and the increased reliance on devices connected to the internet, the potential risk of security breaches and cybersecurity attacks also increases. Despite ongoing efforts to improve our ability to protect data from compromise, we may not be able to protect all data across our diverse systems. Our efforts to improve security and protect data may also identify previously undiscovered instances of security breaches or other cyber incidents. Our insurance coverages may not be sufficient to cover all the losses we may experience as a result of a cyber incident.
The widespread outbreak of illnesses or any other public health crises that impacts operations and/or the global demand for energy commodities may have material adverse effects on our business, financial position, results of operations and/or cash flows.
We face risks related to major public health crises that are outside of our control and could significantly disrupt our operations and demand for our services, which could adversely affect our financial condition.
Risks Related to our Capital Projects and Future Growth
Our expansion or modification of existing assets or the construction of new assets may not result in revenue increases and are subject to regulatory, environmental, political, legal and economic risks, which could adversely affect our results of operations and financial condition.
The construction of additions or modifications to our existing systems and the construction of new midstream assets involve numerous regulatory, environmental, political and legal uncertainties beyond our control and may require the expenditure of significant amounts of capital. If we undertake these projects, they may not be completed on schedule, at the budgeted cost or at all. For example, the construction of additional systems may be delayed or require greater capital investment if the commodity prices of certain supplies, such as steel pipe, increase due to imposed tariffs. Moreover, our revenues may not increase immediately upon the expenditure of funds on a particular project. For instance, if we build a new pipeline, fractionation facility or gas processing plant, the construction may occur over an extended period of time and we will not receive any material increases in revenues until the project is completed. Moreover, we may construct pipelines or facilities to capture anticipated future growth in production in a region in which such growth does not materialize. Since we are not engaged in the exploration for and development of natural gas and oil reserves, we do not possess reserve expertise and we often do not have access to third-party estimates of potential reserves in an area prior to constructing pipelines or facilities in such area. To the extent we rely on estimates of future production in any decision to construct additions to our systems, such estimates may prove to be inaccurate because there are numerous uncertainties inherent in estimating quantities of future production. As a result, new pipelines or facilities may not be able to attract enough throughput to achieve our expected investment return, which could adversely affect our results of operations and financial condition. In addition, the construction of additions to our existing gathering and transportation assets may require us to obtain new rights of way prior to constructing new pipelines. We may be unable to obtain or renew such rights of way to connect new natural gas and crude oil supplies to our existing gathering lines or capitalize on other attractive expansion opportunities. Additionally, it may become more expensive for us to obtain new rights of way or to renew existing rights of way. If the cost of renewing or obtaining new rights of way increases, our cash flows could be adversely affected.
If we do not develop growth projects and/or make acquisitions for expanding existing assets or constructing new assets on economically acceptable terms, or fail to efficiently and effectively integrate developed or acquired assets with our asset base, our future growth will be limited. In addition, any acquisitions we complete are subject to substantial risks that could adversely affect our financial condition and results of operations and reduce our ability to pay dividends to stockholders. In addition, we may not achieve the expected results of any acquisitions and any adverse conditions or developments related to such acquisitions may have a negative impact on our operations and financial condition.
Our ability to grow depends, in part, on our ability to develop growth projects and/or make acquisitions that result in an increase in cash generated from operations. If we are unable to develop accretive growth projects or make accretive acquisitions because we are unable to (i) develop growth projects economically or identify attractive acquisition candidates and negotiate acceptable acquisition agreements, (ii) obtain financing for these projects or acquisitions on economically acceptable terms, or (iii) compete successfully for growth projects or acquisitions, then our future growth and ability to return increasing capital to our shareholders may be limited.
Any growth project or acquisition involves potential risks, including, among other things:
•operating a significantly larger combined organization and adding new or expanded operations;
•difficulties in the assimilation of the assets and operations of the growth projects or acquired businesses, especially if the assets developed or acquired are in a new business segment and/or geographic area;
•the risk that crude oil and natural gas reserves expected to support the acquired assets may not be of the anticipated magnitude or may not be developed as anticipated;
•the failure to realize expected volumes, revenues, profitability or growth;
•the failure to realize any expected synergies and cost savings;
•coordinating geographically disparate organizations, systems and facilities;
•the assumption of environmental and other unknown liabilities;
•limitations on rights to indemnity from the seller in an acquisition or the contractors and suppliers in growth projects;
•the failure to attain or maintain compliance with environmental and other governmental regulations;
•inaccurate assumptions about the overall costs of equity or debt or the tightening of capital markets and access to new capital;
•the diversion of management’s and employees’ attention from other business concerns;
•challenges associated with joint venture relationships and minority investments, including dependence on joint venture partners, controlling shareholders or management who may have business interests, strategies or goals that are inconsistent with ours; and
•customer or key employee losses at the acquired businesses or to a competitor.
If these risks materialize, any growth project or acquired assets may inhibit our growth, fail to deliver expected benefits and/or add further unexpected costs. Challenges may arise whenever businesses with different operations or management are combined, and we may experience unanticipated delays in realizing the benefits of a growth project or acquisition if we fail to successfully integrate such businesses with our operations. If we consummate any future growth project or acquisition, our capitalization and results of operations may change significantly and you may not have the opportunity to evaluate the economic, financial and other relevant information that we will consider in evaluating future growth projects or acquisitions.
A reduction in divestitures of energy assets by industry participants or a decrease in opportunities for industry expansion could limit our opportunities for future growth projects or acquisitions and could adversely affect our operations and cash flows available to pay cash dividends to our stockholders.
Growth projects may increase our concentration in a line of business or geographic region and acquisitions may significantly increase our size and diversify the geographic areas in which we operate. In addition, we may not achieve the desired effect from any future growth projects or acquisitions.
We may be unable to cause our joint ventures to take or not to take certain actions unless some or all of our joint venture participants agree.
We participate in several joint ventures whose corporate governance structures require at least a majority in interest vote to authorize many basic activities and require a greater voting interest (sometimes up to 100%) to authorize more significant activities. Examples of these more significant activities include, among others, large expenditures or contractual commitments, the construction or acquisition of assets, borrowing money or otherwise raising capital, making distributions, transactions with affiliates of a joint venture participant, litigation and transactions not in the ordinary course of business. Without the concurrence of joint venture participants holding sufficient voting interests, we may be unable to cause our joint ventures to take or not take certain actions, even though taking or preventing those actions may be in the best interests of the particular joint venture or us.
In addition, subject to certain conditions, any joint venture owner may sell, transfer or otherwise modify its ownership interest in a joint venture, whether in a transaction involving third parties or the other joint owners. Any such transaction could result in our partnering with different or additional parties.
As is common in the midstream industry, we may operate one or more of our properties with one or more joint venture partners where we own a minority interest and/or contract with a third party to control operations. These relationships could require us to share operational and other control, such that we may no longer have the flexibility to control completely the development of these properties. If we do not timely meet our financial commitments in such circumstances, our rights to participate may be adversely affected. If a joint venture partner is unable or fails to pay its portion of development costs or if a third-party operator does not operate in accordance with our expectations, our costs of operations could be increased. We could also incur liability as a result of actions taken by a joint venture partner or third-party operator. Disputes between us and the other party may result in litigation or arbitration that would increase our expenses, delay or terminate projects and distract our officers and directors from focusing their time and effort on our business.
Risks Related to our Financial Condition
If we fail to maintain an effective system of internal controls, we may not be able to accurately report our financial results or prevent fraud. In addition, potential changes in accounting standards might cause us to revise our financial results and disclosure in the future.
Effective internal controls are necessary for us to provide timely and reliable financial reports and effectively prevent fraud. If we cannot provide timely and reliable financial reports or prevent fraud, our reputation and operating results would be harmed. We continue to enhance our internal controls and financial reporting capabilities. These enhancements require a significant commitment of resources,
personnel and the development and maintenance of formalized internal reporting procedures to ensure the reliability of our financial reporting. Our efforts to update and maintain our internal controls may not be successful, and we may be unable to maintain adequate controls over our financial processes and reporting now or in the future, including future compliance with the obligations under Section 404 of the Sarbanes-Oxley Act of 2002.
Any failure to maintain effective controls or difficulties encountered in the effective improvement of our internal controls could prevent us from timely and reliably reporting our financial results and may harm our operating results. Ineffective internal controls could also cause investors to lose confidence in our reported financial information. In addition, the Financial Accounting Standards Board or the SEC could enact new accounting standards that might impact how we are required to record revenues, expenses, assets and liabilities. Any significant change in accounting standards or disclosure requirements could have a material effect on our results of operations, financial condition and ability to comply with our debt obligations.
We are exposed to credit risks of our customers, and any material nonpayment or nonperformance by our key customers could adversely affect our cash flow and results of operations.
Many of our customers may experience financial problems that could have a significant effect on their creditworthiness, especially in a depressed commodity price environment. A decline in natural gas, NGL and crude oil prices may adversely affect the business, financial condition, results of operations, creditworthiness, cash flows and prospects of some of our customers. Severe financial problems encountered by our customers could limit our ability to collect amounts owed to us, or to enforce performance of obligations under contractual arrangements. In addition, many of our customers finance their activities through cash flow from operations, the incurrence of debt or the issuance of equity. The combination of reduction of cash flow resulting from a decline in commodity prices, a reduction in borrowing bases under reserve-based credit facilities and the lack of availability of debt or equity financing may result in a significant reduction of our customers’ liquidity and limit their ability to make payment or perform on their obligations to us. Additionally, a decline in the share price of some of our public customers may place them in danger of becoming delisted from a public securities exchange, limiting their access to the public capital markets and further restricting their liquidity. Furthermore, some of our customers may be highly leveraged and subject to their own operating and regulatory risks, which increases the risk that they may default on their obligations to us. To the extent one or more of our key customers is in financial distress or commences bankruptcy proceedings, contracts with these customers may be subject to renegotiation or rejection under applicable provisions of the United States Bankruptcy Code. Furthermore, some bankruptcy courts have found that, in certain cases, oil, gas and water gathering agreements do not create covenants running with the land under governing law and are thus subject to rejection in Chapter 11 proceedings. Whether a particular contract is subject to rejection depends on the wording of the contract, the governing law and the forum where a particular bankruptcy case is filed. Financial problems experienced by our customers could result in the impairment of our long-lived assets, reduction of our operating cash flows and may also reduce or curtail their future use of our products and services, which could reduce our revenues. Any material nonpayment or nonperformance by our key customers or our derivative counterparties could reduce our ability to pay cash dividends to our stockholders.
Inflationary issues and associated changes in monetary policy have resulted in and may result in additional increases to the cost of our goods, services and personnel, which in turn cause our capital expenditures and operating costs to rise.
The rate of inflation in the U.S. began to increase significantly beginning in the second half of 2021. Although the rate of inflation has generally declined since the second half of 2022, inflationary pressures remain volatile and have resulted in and may result in additional increases to the costs of our goods, services and personnel, which in turn cause our capital expenditures and operating costs to rise. Sustained levels of high inflation likewise caused the U.S. Federal Reserve and other central banks to increase interest rates multiple times in 2022 and 2023. The U.S. Federal Reserve made cuts to benchmark interest rates in 2024; however, there is no guarantee that additional cuts will occur. To the extent elevated inflation levels exist, we may experience further cost increases for our operations, including services, labor and equipment cost increases, and any subsequent increases in benchmark interest rates could have the effect of raising the cost of capital and depressing economic growth, either of which (or the combination thereof) could negatively impact the financial and operating results of our business. Additionally, there is uncertainty about the trade policies of the new Presidential administration, particularly when pertaining to treaties, tariffs and other limitations on international trade. We may experience increases in operating costs as a result of such policies.
Higher oil and natural gas prices may cause the costs of materials and services to continue to rise. We cannot predict any future trends in the rate of inflation and U.S. international trade policies, or any resultant changes in monetary policy, and a significant increase in inflation, to the extent we are unable to recover higher costs through higher prices and revenues, and/or higher interest rates would negatively impact our business, financial condition and results of operations.
Changes in future business conditions could have a negative impact on the demand for our services and could cause recorded long-lived assets to become further impaired, and our financial condition and results of operations could suffer if there is a negative impact on the demand for our services and an additional impairment of long-lived assets.
We evaluate long-lived assets, including related intangibles, for impairment when events or changes in circumstances indicate, in management’s judgment, that the carrying value of such assets may not be recoverable. Asset recoverability is measured by comparing the carrying value of the asset or asset group with its expected future pre-tax undiscounted cash flows. These cash flow estimates require us to make projections and assumptions for many years into the future for pricing, demand, competition, operating cost and other factors. Global oil and natural gas commodity prices, particularly crude oil, remain volatile. Decreases in commodity prices have previously had, and could continue to have, a negative impact on the demand for our services and our market capitalization.
Should energy industry conditions deteriorate, there is a possibility that long-lived assets may be impaired in a future period. Any impairment charges that we may take in the future could be material to our financial statements. We cannot accurately predict the amount and timing of any impairment of long-lived assets.
Our hedging activities may not be effective in reducing the variability of our cash flows and may, in certain circumstances, increase the variability of our cash flows. Moreover, our hedges may not fully protect us against volatility in basis differentials. Finally, the percentage of our expected equity commodity volumes that are hedged decreases substantially over time.
We have entered into derivative transactions related to only a portion of our equity volumes, future commodity purchases and sales, and transportation basis risk. As a result, we will continue to have direct commodity price risk to the unhedged portion. Our actual future volumes may be significantly higher or lower than we estimated at the time we entered into the derivative transactions for that period. If the actual amount is higher than we estimated, we will have greater commodity price risk than we intended. If the actual amount is lower than the amount that is subject to our derivative financial instruments, we might be forced to satisfy all or a portion of our derivative transactions without the benefit of the cash flow from our sale of the underlying physical commodity. The percentages of our expected equity volumes that are covered by our hedges decrease over time. To the extent we hedge our commodity price risk, we may forego the benefits we would otherwise experience if commodity prices were to change in our favor. The derivative instruments we utilize for these hedges are based on posted market prices, which may be higher or lower than the actual natural gas, NGL and condensate prices that we realize in our operations. These pricing differentials may be substantial and could materially impact the prices we ultimately realize. Market and economic conditions may adversely affect our hedge counterparties’ ability to meet their obligations. Given volatility in the financial and commodity markets, we may experience defaults by our hedge counterparties. In addition, our exchange traded futures are subject to margin requirements, which creates variability in our cash flows as commodity prices fluctuate.
As a result of these and other factors, our hedging activities may not be as effective as we intend in reducing the variability of our cash flows, and in certain circumstances may actually increase the variability of our cash flows. See “Item 7A. Quantitative and Qualitative Disclosures About Market Risk.”
If we fail to balance our purchases and sales of the commodities we handle, our exposure to commodity price risk will increase.
We may not be successful in balancing our purchases and sales of the commodities we handle. In addition, a producer could fail to deliver promised volumes to us or deliver in excess of contracted volumes, or a purchaser could purchase less than contracted volumes. Any of these actions could cause an imbalance between our purchases and sales. If our purchases and sales are not balanced, we will face increased exposure to commodity price risks and could have increased volatility in our operating income.
The amounts we pay in dividends may vary from anticipated amounts and circumstances may arise that lead to conflicts between using funds to pay anticipated dividends or to invest in our business.
The determination of the amounts of cash dividends, if any, to be declared and paid will depend upon our financial condition, results of operations, cash flow, the level of our capital expenditures, future business prospects and any other matters that our board of directors, in consultation with management, deems relevant. Many of these matters are affected by factors beyond our control and therefore, the actual amount of cash that is available for dividends to our stockholders may vary from anticipated amounts.
Additionally, as events present themselves or become reasonably foreseeable, our board of directors, which determines our business strategy and our dividends, may decide to address those matters by utilizing capital that may otherwise be used for our dividend. If we issue additional shares of common or preferred stock or we incur debt, the payment of dividends on those additional shares or interest on that debt could increase the risk that we will be unable to maintain or increase our cash dividend levels.
Further, dividends to our common stockholders are not cumulative. Consequently, if dividends on our shares of common stock are not paid with respect to any fiscal quarter, our stockholders will not be entitled to receive that quarter’s payments in the future.
Our future tax liability may be greater than expected if our NOL carryforwards are limited, we do not generate expected deductions, tax authorities successfully challenge certain of our tax positions or from changes in tax laws.
As of December 31, 2024, we have U.S. federal NOL carryforwards of $4.7 billion, which do not expire under current tax laws. Subject to the CAMT discussed below, we expect to be able to utilize these NOL carryforwards and generate deductions to offset all or a portion of our future taxable income. This expectation is based upon assumptions we have made regarding, among other things, our income, capital expenditures and net working capital, and the current expectation that our NOL carryforwards will not become subject to future limitations under Section 382 of the Internal Revenue Code of 1986, as amended (“Section 382”).
Section 382 generally imposes an annual limitation on the amount of NOLs that may be used to offset taxable income when a corporation has undergone an “ownership change” (as determined under Section 382). An ownership change generally occurs if one or more stockholders (or groups of stockholders) who are each deemed to own at least 5% of our stock change their ownership by more than 50 percentage points over their lowest ownership percentage within a rolling three-year period. In the event that an ownership change was to occur, utilization of our NOL carryforwards would be subject to an annual limitation under Section 382, determined by multiplying the value of our stock at the time of the ownership change by the applicable long-term tax-exempt rate as defined in Section 382, subject to certain adjustments.
While we expect to be able to utilize our NOL carryforwards and generate deductions to offset all or a portion of our future taxable income (subject to the CAMT discussed below), in the event that deductions are not generated as expected, one or more of our tax positions are successfully challenged by the IRS (in a tax audit or otherwise) or our NOL carryforwards are subject to future limitations under Section 382, our future tax liability may be greater than expected. We cannot predict our future cash tax payments and tax liabilities given the recent change in Presidential administrations.
Changes in tax laws or the interpretation thereof or the imposition of new or increased taxes may adversely affect our financial condition, results of operations and cash flows.
U.S. federal and state legislation is periodically proposed that would, if enacted into law, make significant changes to tax laws and could materially increase our tax obligations, adversely affecting our financial condition, results of operations and cash flows. For example, on August 16, 2022, President Biden signed into law the IRA which includes, among other things, the CAMT. Under the CAMT, a 15% minimum tax will be imposed on certain financial statement income of “applicable corporations.” The IRA treats a corporation as an applicable corporation in any taxable year in which the “average annual adjusted financial statement income” of such corporation for the three taxable year period ending prior to such taxable year exceeds $1 billion.
Based on our current interpretation of the IRA, the CAMT and related guidance, and several operational, economic, accounting and regulatory assumptions, we are currently not an “applicable corporation”, but we are likely to become one in a subsequent year, potentially as early as 2026. If we become an applicable corporation and our CAMT liability is greater than our regular U.S. federal income tax liability for any particular tax year, the CAMT liability would effectively accelerate our future U.S. federal income tax obligations, reducing our cash available for distribution in that year, but provide an offsetting credit against our regular U.S. federal income tax liability for a future year. As a result, our current expectation is that the impact of the CAMT is limited to timing differences in future tax years.
The foregoing analysis is based upon our current interpretation of the provisions contained in the IRA, the CAMT and related guidance. In the future, the U.S. Department of the Treasury and the IRS are expected to release regulations and additional interpretive guidance relating to such legislation, and any significant variance from our current interpretation could result in a change in our analysis of the application of the CAMT to us.
Derivatives legislation and its implementing regulations could have a material adverse effect on our ability to use derivative instruments to reduce the effect of commodity price, interest rate and other risks associated with our business.
The Dodd-Frank Wall Street Reform and Consumer Protection Act (the “Dodd-Frank Act”), enacted in July 2010, established federal oversight and regulation of the over-the-counter derivatives market and entities, such as us, that participate in that market. The Dodd-Frank Act required the CFTC and the SEC to promulgate rules and regulations implementing the Dodd-Frank Act, and most of these regulations have been finalized.
In October 2020, the CFTC adopted new rules that will place limits on positions in certain core futures and equivalent swaps contracts for or linked to certain physical commodities, subject to exceptions for certain bona fide hedging transactions. The new rules required general compliance by January 1, 2022 for covered future positions and by January 1, 2023 for covered swaps positions. We have not experienced a material impediment to, and do not expect these regulations to materially impede, our hedging activity at this time.
The CFTC has designated certain interest rate swaps and credit default swaps for mandatory clearing and the associated rules also will require us, in connection with covered derivative activities, to comply with clearing and trade-execution requirements or take steps to qualify for an exemption to such requirements. Although we qualify for the end-user exception from the mandatory clearing requirements for swaps entered to hedge our commercial risks, the application of the mandatory clearing and trade execution requirements to other market participants, such as swap dealers, may change the cost and availability of the swaps that we use for hedging. The CFTC and the federal banking regulators have adopted regulations requiring certain counterparties to swaps to post initial and variation margin. However, our current hedging activities would qualify for the non-financial end user exemption from the margin requirements.
The Dodd-Frank Act and any new regulations could increase the cost of derivative contracts or potentially reduce the availability of derivatives to protect against risks we encounter. If we reduce our use of derivatives as a result of the Dodd-Frank Act and regulations implementing the Dodd-Frank Act, our results of operations may become more volatile and our cash flows may be less predictable, which could adversely affect our ability to plan for and fund capital expenditures.
Any of these consequences could have a material adverse effect on us, our financial condition and our results of operations.
The European Union (the “EU”) and other non-U.S. jurisdictions are also implementing regulations with respect to the derivatives market. To the extent we enter into swaps with counterparties in foreign jurisdictions or counterparties with other businesses that subject them to regulation in foreign jurisdictions, we may be impacted by such regulations. The implementing regulations adopted by the EU and by other non-U.S. jurisdictions could have a material adverse effect on us, our financial condition and our results of operations.
Risks Related to the Ownership of our Common Stock
Future sales of our common stock could lower our stock price, and any additional capital raised by us through the sale of equity or convertible securities may dilute your ownership in us.
We or our stockholders may sell shares of common stock in subsequent public offerings and/or private transactions. We may also issue additional shares of common stock or convertible securities. As of December 31, 2024, we had 217,763,821 outstanding shares of common stock. We cannot predict the size of future issuances of our common stock or the effect, if any, that future issuances and sales of shares of our common stock will have on the market price of our common stock. Sales of substantial amounts of our common stock (including shares issued in connection with an acquisition), or the perception that such sales could occur, may adversely affect prevailing market prices of our common stock.
Our amended and restated certificate of incorporation and amended and restated bylaws, as well as Delaware law, contain provisions that could discourage acquisition bids or merger proposals, which may adversely affect the market price of our common stock.
Our amended and restated certificate of incorporation authorizes our board of directors to issue preferred stock without stockholder approval. If our board of directors elects to issue preferred stock, it could be more difficult for a third party to acquire us. In addition, some provisions of our amended and restated certificate of incorporation and amended and restated bylaws could make it more difficult for a third party to acquire control of us, even if the change of control would be beneficial to our stockholders, including provisions which require:
•a classified board of directors, so that only approximately one-third of our directors are elected each year;
•limitations on the removal of directors; and
•limitations on the ability of our stockholders to call special meetings and establish advance notice provisions for stockholder proposals and nominations for elections to the board of directors to be acted upon at meetings of stockholders.
Delaware law prohibits us from engaging in any business combination with any “interested stockholder,” meaning generally that a stockholder who beneficially owns more than 15% of our stock cannot acquire us for a period of three years from the date this person became an interested stockholder, unless various conditions are met, such as approval of the transaction by our board of directors.
We may issue preferred stock whose terms could adversely affect the voting power or value of our common stock.
Our amended and restated certificate of incorporation authorizes us to issue, without the approval of our stockholders, one or more classes or series of preferred stock having such designations and powers, preferences, including preferences over our common stock respecting dividends and distributions, rights, qualifications, limitations and restrictions as our board of directors may determine. The terms of one or more classes or series of preferred stock could adversely impact the voting power or value of our common stock. For
example, we might grant holders of preferred stock the right to elect some number of our directors in all events or on the happening of specified events or the right to veto specified transactions. Similarly, the repurchase or redemption rights or liquidation preferences we might assign to holders of preferred stock could affect the residual value of our common stock.
Risks Related to Our Indebtedness
Increases in interest rates, due to associated Federal Reserve policies or otherwise, could adversely affect our cost of capital, which could increase our funding costs and reduce the overall profitability of our business.
We have significant exposure to increases in interest rates. As of December 31, 2024, certain of our and the Partnership’s debt were at variable interest rates. As a result of the variable interest rates on our debt, our results of operations could be adversely affected by increases in interest rates, due to associated Federal Reserve policies or otherwise. See “Item 7A. Quantitative and Qualitative Disclosures About Market Risk.”
Additionally, like all equity investments, an investment in our equity securities is subject to certain risks. In exchange for accepting these risks, investors may expect to receive a higher rate of return than would otherwise be obtainable from lower-risk investments. Accordingly, as interest rates rise, the ability of investors to obtain higher risk-adjusted rates of return by purchasing government-backed debt securities may cause a corresponding decline in demand for riskier investments generally, including yield-based equity investments. Reduced demand for our common stock resulting from investors seeking other more favorable investment opportunities may cause the trading price of our common stock to decline.
We have a substantial amount of indebtedness which may adversely affect our financial position and we may still be able to incur substantially more debt, which could collectively increase the risks associated with compliance with our financial covenants.
Our substantial level of indebtedness increases the possibility that we may be unable to generate cash sufficient to pay, when due, the principal of, interest on or other amounts due in respect of indebtedness. This substantial indebtedness, combined with lease and other financial obligations and contractual commitments, could have other important consequences to us, including the following:
•our ability to obtain additional financing, if necessary, for working capital, capital expenditures, acquisitions or other purposes may be impaired or such financing may not be available on favorable terms;
•satisfying our obligations with respect to indebtedness may be more difficult and any failure to comply with the obligations of any debt instruments could result in an event of default under the agreements governing such indebtedness;
•we will need a portion of cash flow to make interest payments on debt, reducing the funds that would otherwise be available for operations and future business opportunities;
•our debt level may influence how counterparties view our creditworthiness, which could limit our ability to enter into commercial transactions at favorable rates or require us to post additional collateral in commercial transactions;
•our debt level will make us more vulnerable to competitive pressures or a downturn in our business or the economy generally; and
•our debt level may limit flexibility in planning for, or responding to, changing business and economic conditions.
Our long-term unsecured debt is currently rated by Fitch, Moody’s and S&P. As of December 31, 2024, Targa’s senior unsecured debt was rated “BBB” by Fitch, “Baa2” by Moody’s and “BBB” by S&P. Any future downgrades in our credit ratings could negatively impact our cost of raising capital, and a downgrade could also adversely affect our ability to effectively execute aspects of our strategy and to access capital in the public markets.
Our International Swaps and Derivatives Association agreements (“ISDAs”) contain credit-risk related contingent features. As of December 31, 2024, we have outstanding net derivative positions that contain credit-risk related contingent features that are in a net liability position of $138.2 million. Our derivative positions are unsecured. If our credit rating was to be downgraded one notch below investment grade by both Moody’s and S&P, as defined in our ISDAs, we estimate that as of December 31, 2024, we would not be required to post collateral to any counterparties per the terms of our ISDAs.
Our ability to service our debt will depend upon, among other things, our future financial and operating performance, which will be affected by prevailing economic conditions and financial, business, regulatory and other factors, some of which are beyond our control. If our operating results are not sufficient to service our current or future indebtedness, we will be forced to take actions such as reducing
or delaying business activities, investments or capital expenditures, acquisitions, selling assets, restructuring or refinancing debt, or seeking additional equity capital, and such results may adversely affect our ability to make cash dividends. We may not be able to affect any of these actions on satisfactory terms, or at all.
We may be able to incur substantial additional indebtedness in the future. The New TRGP Revolver provides an available commitment of $3.5 billion, with a requirement to maintain a minimum available borrowing capacity equal to the aggregate amount outstanding under our Commercial Paper Program, and allows us to request increases in commitments up to an additional $500.0 million. Although our debt agreements contain restrictions on the incurrence of additional indebtedness, these restrictions are subject to a number of significant qualifications and exceptions, and any indebtedness incurred in compliance with these restrictions could be substantial. If we incur additional debt, this could increase the risks associated with compliance with our financial covenants.
The terms of our debt agreements may restrict our current and future operations, particularly our ability to respond to changes in business or to take certain actions, including to pay dividends to our stockholders.
The agreements governing our outstanding indebtedness contain, and any future indebtedness we incur will likely contain, a number of restrictive covenants that impose significant operating and financial restrictions, including restrictions on our ability to engage in acts that may be in our best long-term interests, such as:
•incur or guarantee additional indebtedness or issue additional preferred stock;
•pay dividends on our equity securities or to our equity holders or redeem, repurchase or retire our equity securities or subordinated indebtedness;
•make investments and certain acquisitions;
•sell or transfer assets, including equity securities of our subsidiaries;
•engage in affiliate transactions;
•prepay, redeem and repurchase certain debt, subject to certain exceptions;
•enter into sale and lease-back transactions or take-or-pay contracts; and
•change business activities conducted by us.
In addition, certain of our debt agreements require us to satisfy and maintain specified financial ratios and other financial condition tests. Our ability to meet those financial ratios and tests can be affected by events beyond our control, and we cannot assure you that we will meet those ratios and tests.
A breach of any of these covenants could result in an event of default under our debt agreements. Upon the occurrence of such an event of default, all amounts outstanding under the applicable debt agreements could be declared to be immediately due and payable and all applicable commitments to extend further credit could be terminated. If we are unable to repay the accelerated debt under the Securitization Facility, the lenders under the Securitization Facility could proceed against the collateral granted to them to secure the indebtedness. We have pledged the accounts receivables of Targa Receivables LLC under the Securitization Facility. If the indebtedness under our debt agreements is accelerated, we cannot assure you that we will have sufficient assets to repay the indebtedness. The operating and financial restrictions and covenants in these debt agreements and any future financing agreements may adversely affect our ability to finance future operations or capital needs or to engage in other business activities.
Risks Related to Regulatory Matters
Our and our customers’ operations are subject to a number of risks arising out of the threat of climate change, including the potential for increasingly stringent regulations for methane and other GHG emissions from the oil and gas sector, that could result in increased operating costs, limit the areas in which oil and natural gas production may occur, reduce demand for the products and services we provide, and reduce our or our customers’ ability to access capital.
Numerous proposals have been made and could continue to be made at the international, national, regional and state levels of government to monitor and limit emissions of GHGs. As a result, our operations as well as the operations of our oil and natural gas exploration and production customers, are subject to a series of regulatory, political, litigation, and financial risks associated with the production and processing of fossil fuels and emission of GHGs.
In the United States, no comprehensive climate change legislation has been implemented at the federal level, though laws such as the IRA advance numerous climate-related objectives. However, because the U.S. Supreme Court has held that GHG emissions constitute a pollutant under the CAA, the EPA has adopted rules that, among other things, establish construction and operating permit reviews for GHG emissions from certain large stationary sources, require the monitoring and annual reporting of GHG emissions from certain petroleum and natural gas system sources, implement New Source Performance Standards directing the reduction of methane from certain new, modified, or reconstructed facilities in the oil and natural gas sector, and together with the DOT, implement GHG emissions limits on vehicles manufactured for operation in the United States. Additionally, in August 2022, the IRA was signed into law, which appropriates significant federal funding for renewable energy initiatives and amends the CAA to impose a first-time fee on the emission of methane from sources required to report their GHG emissions to the EPA, including those sources in the onshore petroleum and natural gas production and gathering and boosting source categories. The methane emissions fee began in calendar year 2024 at $900 per ton of methane, increasing to $1,200 in 2025, and $1,500 for 2026 and each year after. Calculation of the fee is based on certain thresholds established in the IRA. In order to support implementation of the methane emissions fee, including exemptions from the same, the EPA finalized revisions to its Greenhouse Gas Reporting Rule in May 2024. The revisions amend requirements applicable to the petroleum and natural gas systems source category to ensure reporting is based on empirical data and accurately reflects total methane and waste emissions. The methane emissions fee and renewable and low carbon energy funding provisions of the law could increase our and our customers’ operating costs and accelerate the transition away from fossil fuels, which could in turn reduce demand for our products and services and adversely affect our business and results of operations. However, at this time, it remains uncertain whether the new Presidential administration will take any action to revise or repeal the methane emissions fee or if Congress may take action to repeal or revise the IRA, including with respect to the methane emissions fee.
In recent years, there has been considerable focus on the regulation of methane emissions from the oil and gas sector. In response to President Biden’s executive order calling on the EPA to revisit federal regulations regarding methane, the EPA finalized more stringent methane rules for new, modified, and reconstructed facilities, known as OOOOb, as well as standards for existing sources known as OOOOc, in December 2023. Fines and penalties for violations of these rules can be substantial. The rules have been subject to legal challenge, and may also be repealed or modified by the Presidential administration or Congress, though we cannot predict the substance or timing of such changes, if any. Moreover, compliance with the new rules may affect the amount we owe under the IRA’s methane fee described above because compliance with EPA’s methane rules would exempt an otherwise covered facility from the requirement to pay the methane fee. To the extent not repealed or modified by the Presidential administration or Congress, the requirements of the EPA’s final methane rules have the potential to increase our operating costs and thus may adversely affect our financial results and cash flows. Moreover, failure to comply with these CAA requirements can result in the imposition of substantial fines and penalties as well as costly injunctive relief.
Various states and groups of states have also adopted or are considering adopting legislation, regulations or other regulatory initiatives that are focused on areas of coverage similar to what the federal government has or may consider, including GHG cap and trade programs, carbon taxes, reporting and tracking programs, and restriction of emissions. At the international level, there exists the United Nations-sponsored “Paris Agreement,” which is an agreement for nations to submit non-binding targets to limit their GHG emissions through individually-determined reduction goals every five years after 2020. President Biden announced in April 2021 a new, more rigorous nationally determined emissions reduction level of 50-52% reduction from 2005 levels in economy-wide net GHG emissions by 2030. However, in January 2025, an executive order withdrew the United States from the Paris Agreement and from any commitments made under the United Nations Framework Convention on Climate Change. Additionally, the executive order revokes any purported financial commitment made by the United States pursuant to the same. It is unclear what participation, if any, the United States will have in future United Nations climate-related efforts, and the full impact of these developments is uncertain at this time.
Governmental, scientific, and public concern from sources in the United States and across the world over the threat of climate change arising from GHG emissions has resulted in political risks that may limit hydraulic fracturing of oil and natural gas wells, restrict flaring and venting during natural gas production on government-owned properties, and ban or restrict new or existing leases for production of minerals on government-owned properties. For instance, in the United States, the prior Presidential administration issued several
executive orders focused on addressing climate change, including items that may impact costs to produce, or demand for, oil and gas. The use of executive orders in the United States to advance political objectives of Presidential administrations increases regulatory uncertainty for us. Other administrations may issue executive orders that are more favorable to the development and consumption of hydrocarbons. Regulations may be focused on addressing climate change and may impact the costs to produce, or demand for, oil and gas. Additionally, in April 2024, the BLM finalized a rule that would limit flaring from well sites on federal lands, as well as require an operator to submit a waste minimization plan or a self-certification statement committing the operator to capturing 100% of the gas produced from a well and pay royalties on lost gas as part of the permit application process. This rule is currently subject to litigation and its implementation has been halted in North Dakota, Texas, Utah, Montana and Wyoming. The U.S. Department of the Interior’s comprehensive review of the federal leasing program resulted in a reduction in the volume of onshore land held for lease and an increased royalty rate. Any regulatory changes that restrict or require modifications to our or our suppliers’ existing operations or future expansions plans could reduce the demand for the products and services we provide, increase our operating costs and may have a negative impact on our financial condition.
Litigation risks exist from certain cities, local governments, and other plaintiffs who may bring suit against large oil and natural gas companies in state or federal court, alleging, among other things, that such companies created public nuisances by producing fuels that contributed to global warming effects, such as rising sea levels, and therefore are responsible for roadway and infrastructure damages as a result, or alleging that the companies have been aware of the adverse effects of climate change for some time but defrauded their investors or consumers by failing to adequately disclose those impacts. Should we be targeted by such litigation, involvement in such a case could have adverse financial and reputational impacts and an unfavorable ruling could significantly impact our operations and adversely impact our financial condition.
Additionally, from time to time, certain stockholders and bondholders currently invested in fossil fuel energy companies but concerned about the potential effects of climate change may elect in the future to shift some or all of their investments into non-fossil fuel energy related sectors. Institutional investors who provide financing to fossil fuel energy companies have been attentive to sustainability lending, requesting additional action relating to the management of GHG emissions, and some of them may elect not to provide funding for fossil fuel energy companies. Any material reduction in the capital available to the fossil fuel industry could make it more difficult to secure funding for exploration, development, production, transportation, and processing activities, which could impact our and our suppliers’ and customers’ businesses and operations. In addition, in March 2024, the SEC finalized a rule that would establish a framework for the reporting of climate risks, targets, and metrics. However, implementation of the rule has been stayed pending the outcome of legal challenges, and the future of the rule is uncertain at this time following the change in Presidential administrations. Separately, the State of California adopted several laws that require similar, or in some situations more extensive, disclosure. While implementing rules on certain of these laws are outstanding, both the California laws and the SEC rule, to the extent implemented, may result in increased legal, accounting and financial compliance costs for us and our suppliers and customers to comply, including the implementation of significant additional internal controls processes and procedures regarding matters that have not been subject to such controls in the past, and impose increased oversight obligations on our management and board of directors. We may also face increased litigation risks related to disclosures made pursuant to these requirements.
The potential adoption and implementation of international, federal or state legislation, regulations or other regulatory initiatives in the future that impose more stringent standards for GHG emissions from the oil and natural gas sector or otherwise restrict the areas in which this sector may produce oil and natural gas or generate GHG emissions could result in increased costs of compliance or costs of consuming, and thereby reduce demand for, oil and natural gas, which could reduce demand for our services and products. Additionally, potential political, litigation, and financial risks may result in our oil and natural gas customers restricting or cancelling production activities, incurring potential liability for infrastructure damages as a result of climatic changes, or impairing their ability to continue to operate in an economic manner, which also could reduce demand for our services and products. One or more of these developments could have a material adverse effect on our business, financial condition and results of operation.
Increasing concentrations of GHGs in the Earth’s atmosphere may produce climate changes that have significant physical effects, such as increased frequency and severity of storms, droughts, floods, rising sea levels and other extreme weather events, as well as chronic shifts in temperature and precipitation patterns. For further discussion, please see Weather events may damage our pipelines and other facilities, limit our ability or increase the costs to operate our business and adversely impact our customers on whom we rely on for throughput as well as third party vendors from whom we receive goods, which developments could cause us to incur significant costs and adversely affect our business, results of operations and financial condition.
Stakeholder and market attention to sustainability matters and disclosure obligations may impact our business.
Companies across industries face scrutiny from a variety of stakeholders related to their sustainability practices. Societal expectations regarding sustainability initiatives and disclosures and potential consumer use of substitutes to energy commodities may result in increased costs, reduced demand for our customers’ products and our services, reduced profits, increased investigations and litigation, and negative impacts on our stock price and access to capital markets. Attention to climate change, for example, may result in demand
shifts for our or our customers’ hydrocarbon products and additional governmental investigations and private litigation against us or those customers.
As part of our ongoing effort to enhance our sustainability practices, our Board of Directors has established a Sustainability Committee. Committee members oversee management’s implementation of sustainability policies and procedures in coordination with other committees of the Board as appropriate. We also have a vice president of sustainability, who reports directly to our CEO and also regularly provides reports on relevant sustainability matters to our Board of Directors. We published our 2023 Sustainability Report, which provides updates on our performance related to certain sustainability topics and sets certain sustainability goals, such as reductions in methane intensity in line with the ONE Future goals. While we may elect to seek out various additional voluntary sustainability targets now or in the future, such targets are often aspirational. Moreover, despite our governance oversight in place, many of our sustainability targets and goals are ambitious, and we may not be able to adequately identify sustainability-related risks and opportunities and, further, may not be able to meet our sustainability targets and goals in the manner or on such a timeline as initially contemplated, or at all, including as a result of unforeseen costs or technical difficulties associated with achieving such results. Moreover, even if we are to achieve our targets and goals or complete other sustainability initiatives, there is no guarantee that doing so will have the desired effect. Sustainability-related actions or statements that we may make or take are sometimes based on expectations, assumptions, or third-party information that we currently believe to be reasonable, but which may subsequently be determined to be erroneous or be subject to misinterpretation. For example, methodologies regarding the monitoring and calculation of climate risks and GHG emissions are evolving, and it is possible that stakeholders, either currently or at some point in future, may not agree with our approach. Moreover, to the extent we elected to pursue such targets and were able to achieve the desired target levels, such achievement may have been accomplished as a result of entering into various contractual arrangements, including the purchase of various credits or offsets that may be deemed to mitigate our sustainability impact instead of actual changes in our sustainability performance. However, we cannot guarantee that there will be sufficient offsets for purchase or that, notwithstanding our reliance on any reputable third party registries, that the offsets we do purchase will successfully achieve the emissions reductions they represent. Notwithstanding our election to pursue aspirational targets now or in the future, we may receive pressure from investors, lenders or other groups to adopt more aggressive climate or other sustainability-related goals, but we cannot guarantee that we will be able to pursue or implement such goals because of potential costs or technical or operational obstacles. If we fail to, or are perceived to fail to, comply with or advance certain sustainability initiatives (including the timeline and manner in which we complete such initiatives), we may be subject to various adverse impacts, including reputational damage and potential stakeholder engagement and/or litigation, even if such initiatives are currently voluntary.
In addition, organizations that provide information to investors on corporate governance and related matters have developed ratings processes for evaluating companies on their approach to sustainability matters. Additionally, we and other companies in our industry publish sustainability reports that are made available to investors. Such ratings and reports are used by some investors to inform their investment and voting decisions. Certain lenders may decide not to provide funding to us or our customers’ companies based on sustainability concerns, which could adversely affect our financial condition and access to capital for potential growth projects. Investors, lenders, and other stakeholders that focus on issues related to environmental justice and natural capital may result in increased scrutiny of our processes on such issues.
Public statements with respect to sustainability matters, such as emissions reduction goals, other environmental targets, or other commitments addressing certain social issues, such as diversity initiatives, are becoming increasingly subject to heightened scrutiny from public and governmental authorities related to the risk of potential “greenwashing,” i.e., misleading information or false claims overstating potential sustainability benefits. For example, the SEC has recently taken enforcement action against companies for ESG-related misconduct, including alleged greenwashing. Certain non-governmental organizations and other private actors have also filed lawsuits under various securities and consumer protection laws alleging that certain sustainability statements, goals, or standards were misleading, false, or otherwise deceptive. As a result, we may face increased litigation risks from private parties and governmental authorities related to our sustainability efforts. In addition, any alleged claims of greenwashing against us or others in our industry may lead to further negative sentiment and diversion of investments. Many of our customers and suppliers may be subject to similar expectations and challenges, which may augment or create additional risks, including risks that may not be known to us.
We could incur significant costs in complying with more stringent occupational safety and health requirements.
We are subject to stringent federal and state laws and regulations, including the federal Occupational Safety and Health Act and comparable state statutes, whose purpose is to protect the health and safety of workers, both generally and within the pipeline industry. In addition, the federal Occupational Safety and Health Administration’s (“OSHA”) hazard communication standard, the EPA community right-to-know regulations under Title III of the Federal Superfund Amendment and Reauthorization Act and comparable state statutes require that information be maintained concerning hazardous materials used or produced in our operations and that this information be provided to employees, state and local government authorities and citizens. We and the entities in which we own an interest are subject to OSHA Process Safety Management regulations, which are designed to prevent or minimize the consequences of catastrophic releases of toxic, reactive, flammable or explosive chemicals. Failure to comply with these laws and regulations or any newly adopted laws or regulations may result in assessment of sanctions including administrative, civil and criminal penalties, the imposition of investigatory, remedial and corrective action obligations or the incurrence of capital expenditures, any of which could have a material adverse effect on our business, financial condition and results of operations.
State laws and regulations limiting hydraulic fracturing activities could result in restrictions, delays or cancellations in drilling and completing new oil and natural gas wells by our customers, which could adversely impact our revenues by decreasing the volumes of natural gas, NGLs or crude oil through our facilities and reducing the utilization of our assets.
While we do not conduct hydraulic fracturing, many of our oil and gas exploration and production customers do perform such activities. Hydraulic fracturing is typically regulated by state oil and gas commissions and many states have adopted legal requirements that have imposed new or more stringent permitting, public disclosure or well construction requirements on hydraulic fracturing activities, including in states where we or our customers conduct operations. States could further elect to suspend or prohibit hydraulic fracturing activities in the future. While governments may also seek to adopt ordinances within their jurisdictions regulating the time, place and manner of drilling activities in general or hydraulic fracturing activities in particular, non-governmental organizations may also seek to restrict hydraulic fracturing through ballot initiatives, such as those that have been pursued in Colorado. New or more stringent laws, regulations or regulatory or ballot initiatives relating to the hydraulic fracturing process could lead to our customers reducing crude oil and natural gas drilling activities using hydraulic fracturing techniques, while increased public opposition to activities using such techniques may result in operational delays, restrictions, cessations, or increased litigation. Any one or more of such developments could reduce demand for our gathering, processing and fractionation services and have a material adverse effect on our business, financial condition and results of operations.
Our operations are subject to environmental laws and regulations and a failure to comply or an accidental release into the environment may cause us to incur significant costs and liabilities.
Our operations are subject to numerous federal, tribal, state and local environmental laws and regulations governing occupational health and safety, the discharge of pollutants into the environment or otherwise relating to environmental protection. These laws and regulations may impose numerous obligations that are applicable to our operations including acquisition of a permit or other approval before conducting regulated activities, restrictions on the types, quantities and concentration of materials that can be released into the environment; limitation or prohibition of construction and operating activities in environmentally sensitive areas such as wetlands, urban areas, wilderness regions and other protected areas; requiring capital expenditures to comply with pollution control requirements, and imposition of substantial liabilities for pollution resulting from our operations. Numerous governmental authorities, such as the EPA and BLM, and analogous state agencies, have the power to enforce compliance with these laws and regulations and the permits and approvals issued under them, which can often require difficult and costly actions. Failure to comply with these laws and regulations or any newly adopted laws or regulations may result in assessment of sanctions including administrative, civil and criminal penalties, the imposition of investigatory, remedial and corrective action obligations or the incurrence of capital expenditures; the occurrence of restrictions, delays or cancellations in the permitting or performance of projects, and the issuance of orders enjoining or conditioning performance of some or all of our operations in a particular area. Certain environmental laws impose strict, joint and several liability for costs required to clean up and restore sites where hazardous substances, hydrocarbons or waste products have been released, even under circumstances where the substances, hydrocarbons or wastes have been released by a predecessor operator or the activities conducted and from which a release emanated complied with applicable law. Moreover, it is not uncommon for neighboring landowners and other third parties to file claims for personal injury and property damage allegedly caused by noise, odor, or the release of hazardous substances, hydrocarbons or wastes into the environment.
The risk of incurring environmental costs and liabilities in connection with our operations is significant due to our handling of natural gas, NGLs, crude oil and other petroleum products, because of air emissions and product-related discharges arising out of our operations, and as a result of historical industry operations and waste disposal practices. For example, an accidental release from one of our facilities could subject us to substantial liabilities arising from environmental cleanup and restoration costs, claims made by neighboring landowners and other third parties for personal injury, natural resource and property damages and fines or penalties for related violations of environmental laws or regulations.
Moreover, stricter laws, regulations or enforcement policies could significantly increase our operational or compliance costs and the cost of any remediation that may become necessary. For example, in March 2023, the EPA issued its Good Neighbor Plan rule, which imposes emissions-related requirements on fossil fuel-fired power plants and other industrial users in 22 states, including Texas and Louisiana, which could reduce demand for our products and accelerate the transition away from oil and gas to other sources of energy. The Good Neighbor Plan has been stayed by the U.S. Supreme Court, although the EPA is pursuing a supplemental final action concerning the rule; in December 2024, for example, the EPA issued a notice addressing a particular concern that the U.S. Supreme Court preliminary finding had not been adequately explained upon the granting of applications to stay enforcement of the Good Neighbor Plan. While the new Presidential administration may decline to pursue the rule or take other modifying actions, such actions and their timing cannot be predicted.
There continues to be uncertainty on the federal government’s applicable jurisdictional reach under the Clean Water Act over waters of the United States, including wetlands, as the EPA and the U.S. Army Corps of Engineers (“Corps”) under the Obama, Trump and Biden Administrations have pursued multiple rulemakings since 2015 in an attempt to determine the scope of such reach. Following legal challenges, the implementation of the most recent September 2023 rule currently varies by state, with 27 states interpreting the definition consistent with the pre-2015 regulatory regime and the changes made by the Sackett v. EPA decision, and the remaining 23 states implementing the September 2023 rule. Additionally, we cannot predict what actions the new Presidential administration may take with respect to these regulations and the timing of any such actions. As a result, there is significant uncertainty with respect to wetlands regulations under the Clean Water Act at this time. The implementation of the final rule, results of the litigation and any further expansion of the scope of the Clean Water Act’s jurisdiction in areas where we or our customers conduct operations, could lead to delays, restrictions or cessation of the development of projects, result in longer permitting timelines, or increased compliance expenditures or mitigation costs for our and our oil and natural gas customers’ operations, which may reduce the rate of production of natural gas or crude oil from operators with whom we have a business relationship and, in turn, have a material adverse effect on our business, results of operations and cash flows.
Separately, Nationwide Permit (“NWP”) 12, which is available under the Clean Water Act for certain oil and gas activities, has been subject to legal challenges and regulatory revision in recent years. The Corps has been engaged in a formal review of NWP 12 as a result of these actions. However, while this review is ongoing, the Corps has resumed permitting decisions. Although we cannot predict what actions the new Presidential administration may take to revise NWP 12, any disruption in our ability to obtain coverage under NWP 12 or other general permits may result in increased costs and project delays if we are forced to seek individual permits from the Corps. This in turn could have an adverse effect on our business, financial condition and results of operation.
A change in the jurisdictional characterization of some of our assets by federal, state, tribal or local regulatory agencies or a change in policy by those agencies may result in increased regulation of our assets, which may (i) cause our revenues to decline and operating expenses to increase or (ii) delay or increase the cost of expansion projects.
With the exception of the Driver Residue Pipeline, TPL SouthTex Transmission Company LP, Midland-Permian Pipeline LLC, Delaware-Permian Pipeline LLC, and Targa SouthTex Mustang Transmission Ltd., which are each subject to FERC regulation under the NGPA or limited FERC regulation under the NGA, our natural gas pipeline operations are generally exempt from FERC regulation, but FERC regulation still affects our non-FERC jurisdictional businesses and the markets for products derived from these businesses, including certain FERC reporting and posting requirements in a given year. We believe that the natural gas pipelines in our gathering systems meet the traditional tests FERC has used to establish a pipeline’s status as a gatherer not subject to regulation as a natural gas company. However, the distinction between FERC-regulated transmission services and federally unregulated gathering services is the subject of substantial, ongoing litigation, so the classification and regulation of our gathering facilities are subject to change based on future determinations by FERC, the courts or Congress. We also operate natural gas pipelines that extend from some of our processing plants to interconnections with both intrastate and interstate natural gas pipelines. Those facilities, known in the industry as “plant tailgate” pipelines, typically operate at transmission pressure levels and may transport “pipeline quality” natural gas. Because our plant tailgate pipelines are relatively short, we treat them as “stub” lines, which are exempt from FERC’s jurisdiction under the Natural Gas Act.
Targa NGL, Targa Gulf Coast, and Grand Prix Pipeline have pipelines that are considered common carrier pipelines subject to regulation by FERC under the ICA. The ICA requires that we maintain tariffs on file with FERC for each of the Targa NGL, Targa Gulf Coast and Grand Prix Pipeline common carrier pipelines that have not been granted a waiver. Those tariffs set forth the rates we charge for providing transportation services as well as the rules and regulations governing these services. The ICA requires, among other things, that rates on interstate common carrier pipelines be “just and reasonable” and non-discriminatory. With respect to pipelines that have been granted a waiver of the ICA and related regulations by FERC, should a particular pipeline’s circumstances change, FERC could, either at the request of other entities or on its own initiative, assert that such pipeline no longer qualifies for a waiver. In the event that FERC were to determine that one or more of these pipelines no longer qualified for a waiver, we would likely be required to file a tariff with FERC for the applicable pipeline(s), provide a cost justification for the transportation charge, and provide regulated services to all potential shippers without undue discrimination. Such a change in the jurisdictional status of transportation on these pipelines could adversely affect our results of operations.
The classification of some of our gathering facilities, transportation pipelines, and purchase and sale transactions as FERC-jurisdictional or non-jurisdictional may be subject to change based on future determinations by FERC, the courts or Congress, in which case, our operating costs could increase and we could be subject to enforcement actions under the EP Act of 2005.
Various federal agencies within the U.S. Department of the Interior, particularly the BLM, Office of Natural Resources Revenue (formerly the Minerals Management Service) and the Bureau of Indian Affairs, along with the Three Affiliated Tribes, promulgate and enforce regulations pertaining to operations on the Fort Berthold Indian Reservation, on which we operate a significant portion of our Badlands gathering and processing assets. The Three Affiliated Tribes is a sovereign nation having the right to enforce certain laws and regulations independent from federal, state and local statutes and regulations. These tribal laws and regulations include various taxes, fees and other conditions that apply to lessees, operators and contractors conducting operations on Native American tribal lands. Lessees and operators conducting operations on tribal lands can generally be subject to the Native American tribal court system. One or more of these factors may increase our costs of doing business on the Fort Berthold Indian Reservation and may have an adverse impact on our ability to effectively transport products within the Fort Berthold Indian Reservation or to conduct our operations on such lands.
Other FERC regulations may indirectly impact our businesses and the markets for products derived from these businesses. FERC’s policies and practices across the range of its natural gas and liquids regulatory activities, including, for example, its policies on open access transportation, gas quality, ratemaking, capacity release and market center promotion, may indirectly affect the natural gas and liquids markets. In recent years, FERC has pursued pro-competitive policies in its regulation of interstate natural gas and liquids pipelines. However, we cannot assure you that FERC will continue this approach as it considers matters such as pipeline rates and rules and policies that may affect rights of access to transportation capacity. For more information regarding the regulation of our operations, see “Item 1. Business—Regulation of Operations.”
Should we fail to comply with all applicable FERC-administered statutes, rules, regulations and orders, we could be subject to substantial penalties and fines.
Under the EP Act of 2005, FERC has civil penalty authority under the NGA and NGPA to impose penalties for violations of the NGA or NGPA up to a maximum amount that is adjusted annually for inflation, which for 2025 equals approximately $1.6 million per violation per day, as well as authority to order disgorgement of profits associated with any violation. While our systems other than the Driver Residue Pipeline, TPL SouthTex Transmission Company LP, TPL SouthTex Pipeline Company LLC, Midland-Permian Pipeline LLC, Delaware-Permian Pipeline LLC, and Targa SouthTex Mustang Transmission Ltd., have not been regulated by FERC under the NGA or NGPA, FERC has adopted regulations that may subject certain of our otherwise non-FERC jurisdictional facilities to FERC annual reporting and daily scheduled flow and capacity posting requirements. In addition, FERC has civil penalty authority under the ICA to impose penalties for violations under the ICA up to a maximum amount that is adjusted annually for inflation, which for 2025 was up to approximately $16,590 per violation per day, and failure to comply with the ICA and regulations implementing the ICA could subject us to civil penalty liability. For more information regarding regulation of our operations, see “Item 1. Business—Regulation of Operations.” Additional rules and legislation pertaining to those and other matters may be considered or adopted by FERC from time to time.
We are subject to cybersecurity and data privacy laws and regulations, and we may become subject to litigation and directives relating to our processing of personal information.
The jurisdictions in which we operate (including the United States) have laws governing how we must respond to a cyber incident that results in the unauthorized access, disclosure, or loss of personal information. Additionally, laws and regulations governing data privacy and unauthorized disclosure of personal information and imposing certain cybersecurity-related requirements pose increasingly complex compliance challenges. For example, Texas has enacted data privacy legislation. Some or all of such legislation will elevate our compliance costs over time. Our business involves collection, use, and other processing of personal information and personally identifiable information of our employees, investors, contractors, suppliers, and customer contacts. As legislation continues to develop and cyber incidents continue to evolve, we will likely be required to expend significant resources to continue to modify or enhance our protective measures to comply with such legislation and to detect, investigate and remediate vulnerabilities to cyber incidents. Any failure by us, or a company we acquire, to comply with such laws and regulations could result in reputational harm, loss of goodwill, penalties, liabilities, remediation costs, or mandated changes in our business practices. Each has the potential to materially impact our financial condition.
None.
Item 1C. Cybersecurity
Description of Processes for Assessing, Identifying, and Managing Cybersecurity Risks
Cybersecurity risk is an area of focus for Targa, particularly as our operations become increasingly dependent on digital technologies. Across the world, cybersecurity incidents are occurring more frequently, use increasingly sophisticated methods and could pose serious risks to the Company’s data integrity, reputation, operations and revenue. The Company has a cybersecurity program, which uses technology and processes to help mitigate cybersecurity risks, with our Security Operations team working to monitor, assess, identify, and respond to potential cybersecurity incidents that threaten the Company. The program also focuses on security awareness and training for employees and contractors with access to Company facilities or systems.
We utilize the National Institute of Standards and Technology Cybersecurity Framework as well as supplemental guidance for information and operational technologies to assess current risks against deployed current countermeasures. We seek to follow federal and state statutory and regulatory guidance and have adopted internal policies and standards that we believe are in alignment with these requirements. Our cybersecurity program covers Targa’s general corporate information and operational technology systems, which support our various lines of business.
Our cybersecurity program also follows defense in depth principles, which aim to implement various layered access control, detection, prevention, and response measures. Targa has formal disaster recovery and business continuity plans, as well as a Cyber Incident Response Plan, which is periodically tested using tabletop exercises.
We regularly engage with independent third parties to assess our vulnerabilities and help us mitigate cybersecurity-related risks. Targa’s security posture is also tested by internal Targa personnel and independent third parties to gauge its effectiveness.
Our cybersecurity program includes a formally documented process for oversight of cybersecurity risks associated with our third-party service providers. This process begins prior to engagement. Third-party service providers are evaluated using independent assessment tools to gauge their security posture.
The above cybersecurity risk management processes are integrated into our overall risk management program. While we seek to continually evaluate cybersecurity risks based upon emerging threats as a part of the Company’s risk management processes, overall cybersecurity risks to the Company are also evaluated annually by independent consultants and learnings are incorporated into the overall Company risk matrices.
Our Code of Conduct communicates our expectation that employees and contractors will maintain the security of our information technology systems. All employees are presented with Code of Conduct training annually. Each employee’s and contractor’s ability to recognize and report cyber threats is an important component of our cybersecurity program. As a result, security awareness and training are provided to employees and contractors with access to our facilities or systems. We focus on increasing employee awareness of phishing attempts and train employees to be aware of cyber risks.
We recognize that cybersecurity risks continue to emerge and evolve. Assessment and enhancement of our security posture in predicting and responding to the changing threat landscape are core goals of our cybersecurity program. Targa maintains relationships with various cybersecurity industry subject matter experts, governmental agencies, law enforcement research and benchmarking organizations, and industry peers as part of our effort to improve our program based on threat information and available countermeasures.
We continue to make investments in new technologies to protect our facilities, users, and stakeholders, and to protect the personally identifiable information we maintain.
Board of Directors’ Oversight of Risks from Cybersecurity Risks
Cybersecurity risks are overseen at the board level through the Audit Committee. As part of this oversight, the Audit Committee, with several key members of management, meets quarterly to discuss ongoing initiatives and seek to ensure coordination between enterprise stakeholders. At these meetings, our Vice President of Security Operations and Senior Vice President of Technology, who oversee the Company’s cybersecurity program, review with our Audit Committee current and emerging cybersecurity-related threats as well as key performance indicators for cybersecurity process maturity, operational performance, and enterprise performance in countering these threats. Our Vice President of Security Operations and Senior Vice President of Technology also annually review our Company's cybersecurity program with our full board. Based on the information provided through these various processes, our board evaluates the risks facing us and provides guidance as to the appropriate risk management strategy.
Management’s Role in Assessing and Managing Cybersecurity Risks
The Vice President of Security Operations and Senior Vice President of Technology are primarily responsible for assessing and managing Targa’s material risks from cybersecurity threats, and work to monitor the effectiveness of our cybersecurity detection and response processes in countering current threats and to provide updates to our executive team. Our Vice President of Security Operations has more than 25 years of experience working in the field of cybersecurity, including numerous years directing enterprise-level cybersecurity programs.
No Previous Material Cybersecurity Incidents
As of the date of this report, though the Company and our service providers have experienced certain cybersecurity incidents, we are not aware of any previous cybersecurity incidents that have materially affected or are reasonably likely to materially affect the Company. We acknowledge that cybersecurity threats are continually evolving, and the possibility of future cybersecurity incidents remains. Despite the security and risk management measures that we have implemented and any additional measures we may implement or adopt in the future, our facilities and systems, and those of our third-party service providers, vendors, suppliers, customers and other business partners, have been and are vulnerable to security breaches, computer viruses, lost or misplaced data, programming errors, scams, burglary, human errors, acts of vandalism, misdirected wire transfers, or other malicious or criminal activities. A successful attack on our information or operational technology systems could have material consequences to the Company. While we devote resources to our security measures to protect our systems and information, these measures cannot provide absolute security. See “Item 1A. Risk Factors” for additional information about the risks to our business associated with a breach or compromise to our information technology systems.
Item 2. Properties
A description of our properties is contained in “Item 1. Business” in this Annual Report.
Our principal executive offices are located at 811 Louisiana Street, Suite 2100, Houston, Texas 77002 and our telephone number is 713-584-1000.
Item 3. Legal Proceedings
On December 26, 2018, Vitol Americas Corp. (“Vitol”) filed a lawsuit in the 80th District Court of Harris County (the “District Court”), Texas against Targa Channelview LLC, then a subsidiary of the Company (“Targa Channelview”), seeking recovery of $129.0 million in payments made to Targa Channelview, additional monetary damages, attorneys’ fees and costs. Vitol alleged that Targa Channelview breached an agreement, dated December 27, 2015, for crude oil and condensate between Targa Channelview and Noble Americas Corp. (the “Splitter Agreement”), which provided for Targa Channelview to construct a crude oil and condensate splitter (the “Splitter”) adjacent to a barge dock owned by Targa Channelview to provide services contemplated by the Splitter Agreement. In January 2018, Vitol acquired Noble Americas Corp. and on December 23, 2018, Vitol voluntarily elected to terminate the Splitter Agreement claiming that Targa Channelview failed to timely achieve start-up of the Splitter. Vitol’s lawsuit also alleged Targa Channelview made a series of misrepresentations about the capability of the barge dock that would service crude oil and condensate volumes to be processed by the Splitter and Splitter products. Vitol sought return of $129.0 million in payments made to Targa Channelview prior to the start-up of the Splitter, as well as additional damages. On the same date that Vitol filed its lawsuit, Targa Channelview filed a lawsuit against Vitol seeking a judicial determination that Vitol’s sole and exclusive remedy was Vitol’s voluntarily termination of the Splitter Agreement and, as a result, Vitol was not entitled to the return of any prior payments under the Splitter Agreement or other damages as alleged. Targa also sought recovery of its attorneys’ fees and costs in the lawsuit.
On October 15, 2020, the District Court awarded Vitol $129.0 million (plus interest) following a bench trial. In addition, the District Court awarded Vitol $10.5 million in damages for losses and demurrage on crude oil that Vitol purchased for start-up efforts. The Company appealed the award in the Fourteenth Court of Appeals in Houston, Texas. In October 2020, we sold Targa Channelview, but under the agreements governing the sale, we retained the liabilities associated with the Vitol proceedings. On September 13, 2022, the Fourteenth Court of Appeals upheld the trial court’s judgment in part with regard to the return of Vitol’s prior payments, but modified the judgment to delete Vitol’s ability to recover any damages related to losses or demurrage on crude oil. We filed a petition for review with the Supreme Court of Texas which was denied on October 20, 2023. We then filed a petition for rehearing with the Supreme Court of Texas, which was denied on April 19, 2024. On April 26, 2024, as a result of the final determination of Targa’s appeal to the Texas Supreme Court related to the Splitter Agreement, we made a cash payment of $184.8 million which included cumulative interest on the award of $55.8 million to Vitol in satisfaction of the Texas state court judgment.
Additional information required for this item is provided in Note 17 – Contingencies, under the heading “Legal Proceedings” included in the Notes to Consolidated Financial Statements included under Part II, Item 8 of this Annual Report, which is incorporated by reference into this item.
Item 4. Mine Safety Disclosures
Not applicable.
PART II
Item 5. Market for Registrant’s Common Equity, Related Stockholder Matters and Issuer Purchases of Equity Securities
Market Information
Our common stock is listed on the NYSE under the symbol “TRGP.” As of December 31, 2024, there were 154 stockholders of record of our common stock. This number does not include stockholders whose shares are held in trust by other entities. The actual number of stockholders is greater than the number of holders of record. As of February 14, 2025, there were 218,106,765 shares of common stock outstanding.
Stock Performance Graph
The graph below compares the cumulative total return to holders of Targa Resources Corp.’s common stock, the Standard & Poor's 500 Stock Index (“S&P 500”) and the Alerian US Midstream Energy Index (“AMUS”) during the period beginning on December 31, 2019 and ending on December 31, 2024. The performance graph was prepared based on the following assumptions: (i) $100 was invested in our common stock and in each of the indices at the beginning of the period, and (ii) dividends were reinvested on the relevant payment dates. The stock price performance included in this graph is historical and not necessarily indicative of future stock price performance.
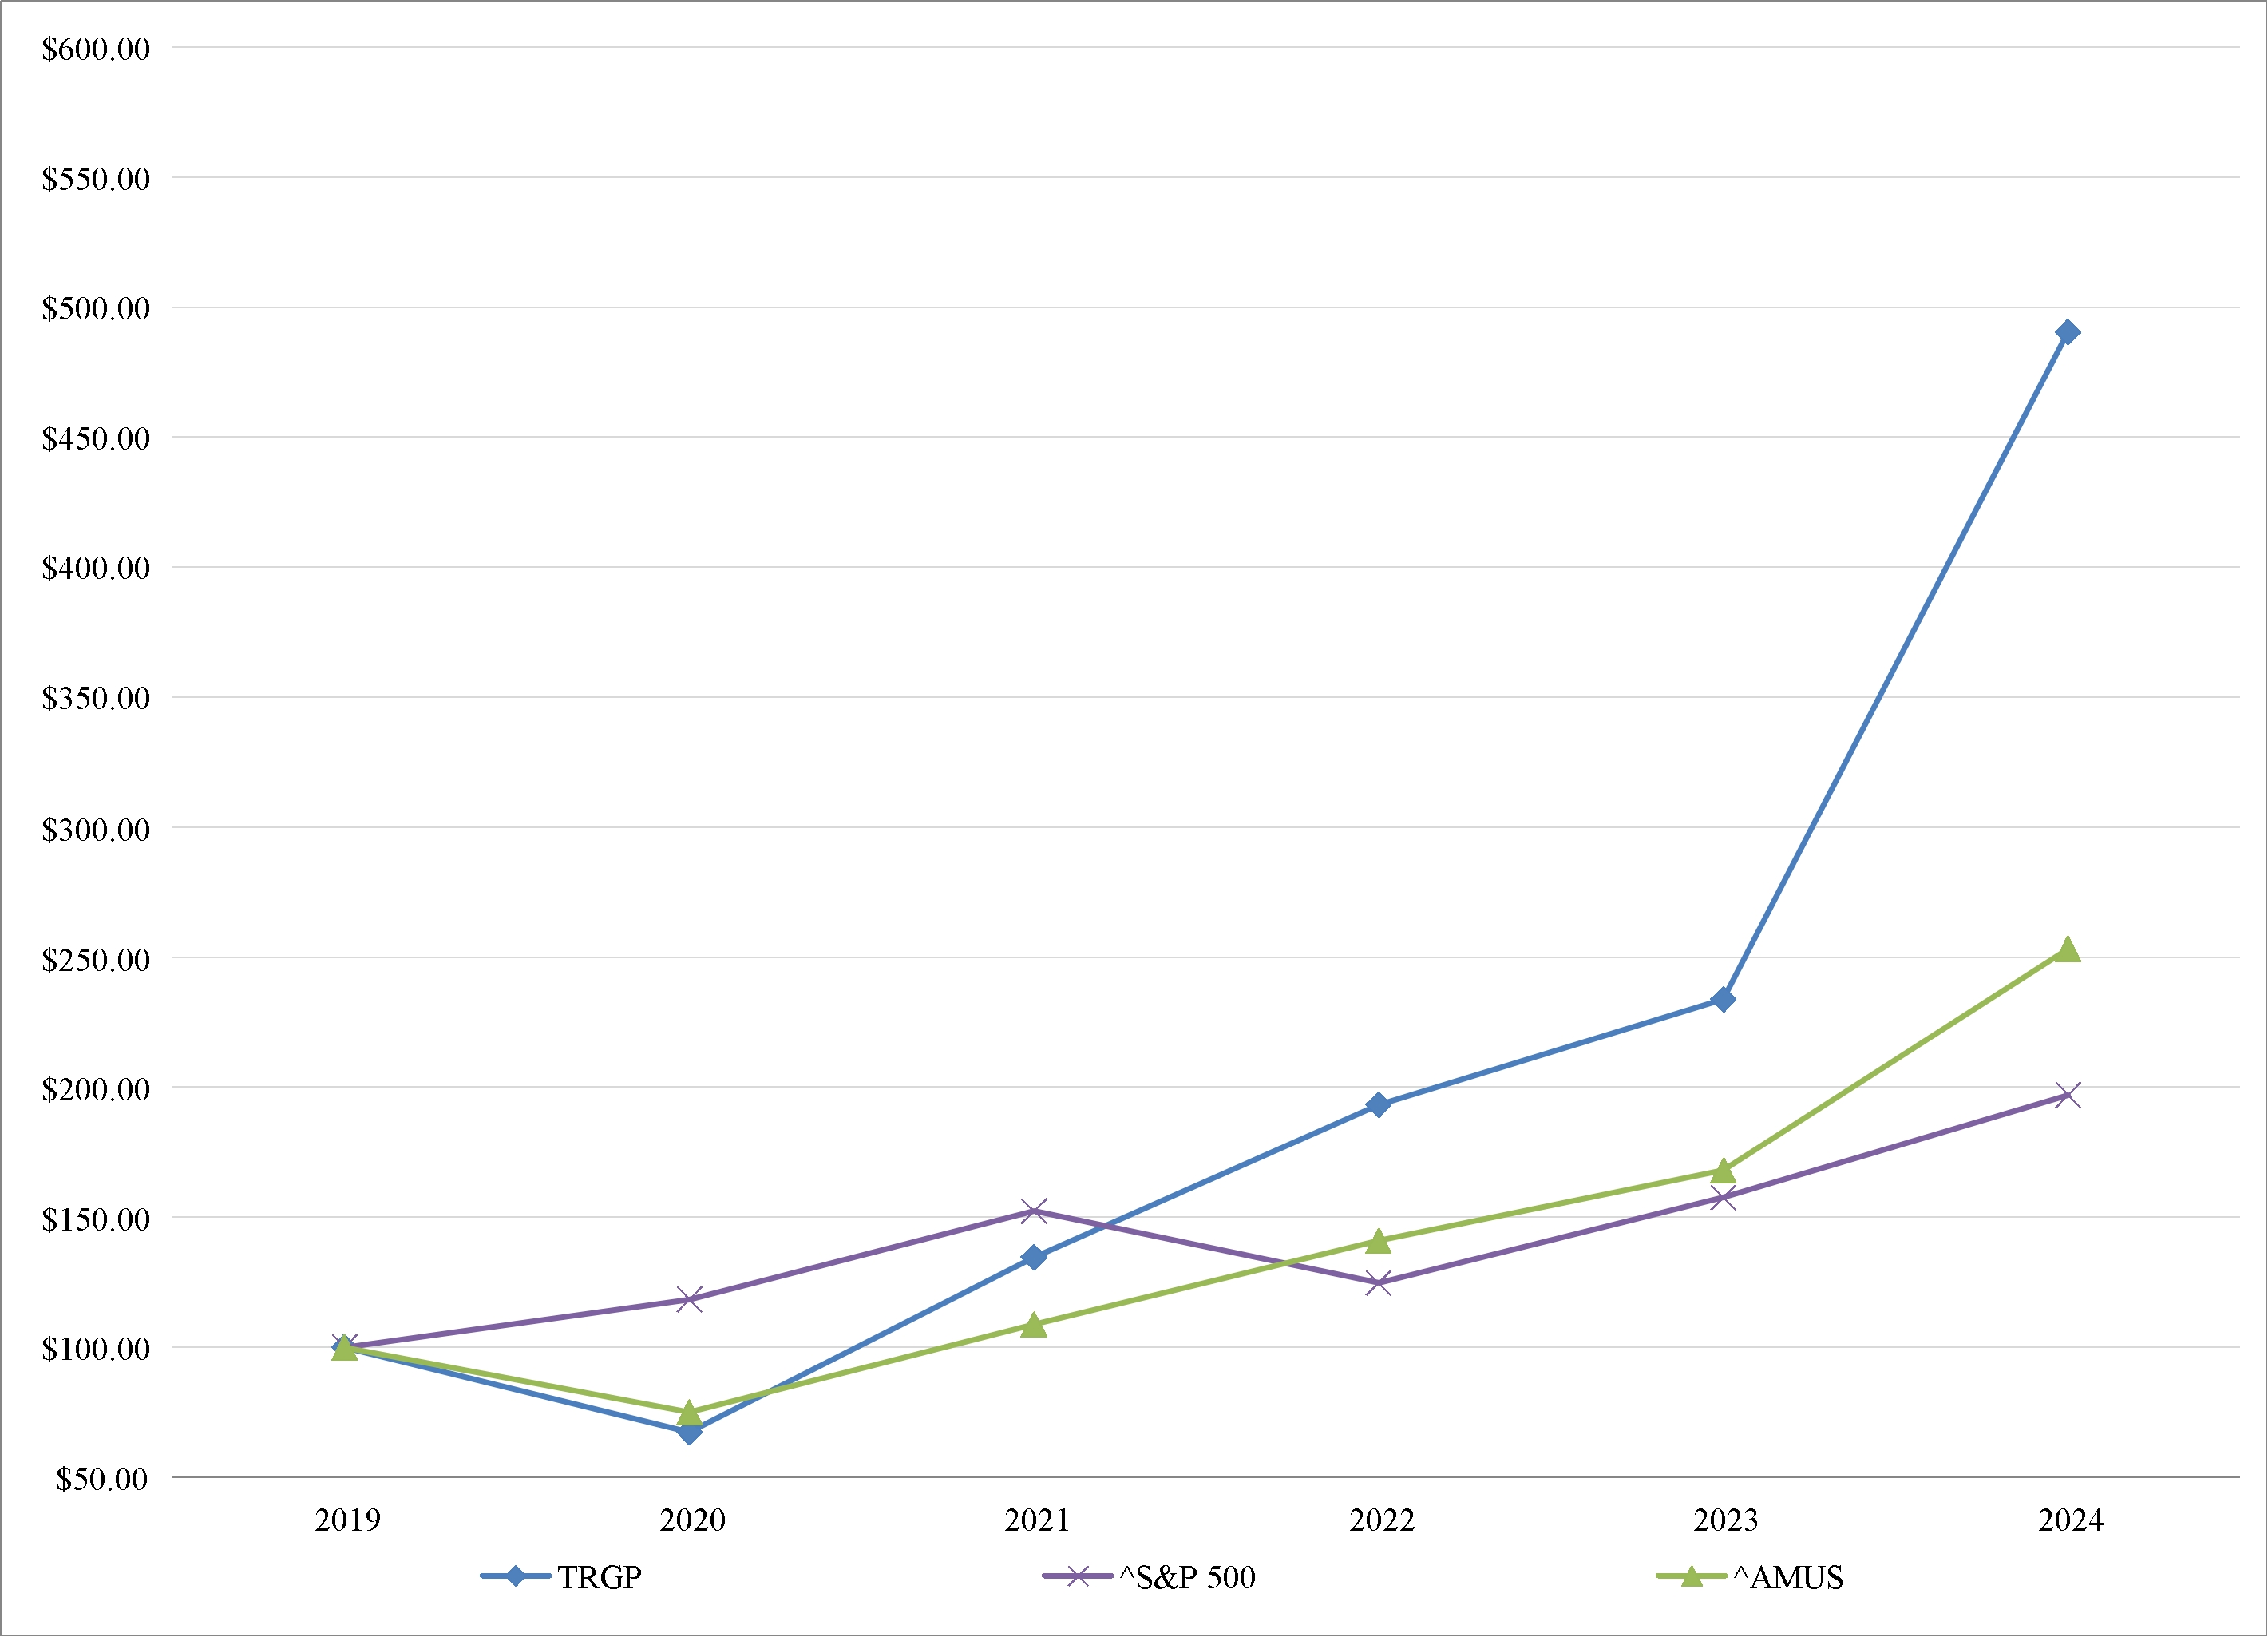
| | | | | | | | | | | | | | | | | | | | | | | | |
| | Year Ended December 31, | |
| | 2019 | | | 2020 | | | 2021 | | | 2022 | | | 2023 | | | 2024 | |
Targa Resources Corp. | | $ | 100.00 | | | $ | 67.30 | | | $ | 134.60 | | | $ | 193.25 | | | $ | 233.78 | | | $ | 490.51 | |
S&P 500 Index | | $ | 100.00 | | | $ | 118.40 | | | $ | 152.39 | | | $ | 124.79 | | | $ | 157.59 | | | $ | 197.02 | |
AMUS Index | | $ | 100.00 | | | $ | 75.04 | | | $ | 108.82 | | | $ | 140.99 | | | $ | 168.00 | | | $ | 253.25 | |
Pursuant to Instruction 7 to Item 201(e) of Regulation S-K, the above stock performance graph and related information is being furnished and is not being filed with the SEC, and as such shall not be deemed to be incorporated by reference into any filing that incorporates this Annual Report by reference.
Our Dividend Policy
We intend to continue to pay a quarterly dividend to our common stockholders; however, any payment of future dividends is dependent upon our financial condition, results of operations, cash flows, the level of our capital expenditures, future business prospects and any other matters that our board of directors, in consultation with management, deems relevant. Covenants contained in our debt agreements could limit the payment of dividends. For a discussion of restrictions on our and our subsidiaries’ ability to pay dividends or make distributions, please see Note 8 – Debt Obligations in our Consolidated Financial Statements.
Recent Sales of Unregistered Equity Securities
There were no sales of unregistered equity securities for the year ended December 31, 2024.
Repurchase of Equity by Targa Resources Corp, or Affiliated Purchasers
| | | | | | | | | | | | | | | | |
Period | | Total number of shares purchased (1) | | | Average price per share | | | Total number of shares purchased as part of publicly announced plans (2) | | | Maximum approximate dollar value of shares that may yet be purchased under the plan (in thousands) (2) | |
October 1, 2024 - October 31, 2024 | | | 325,129 | | | $ | 156.30 | | | | 306,520 | | | $ | 1,075,390 | |
November 1, 2024 - November 30, 2024 | | | 181,192 | | | $ | 200.06 | | | | 179,702 | | | $ | 1,039,389 | |
December 1, 2024 - December 31, 2024 | | | 124,610 | | | $ | 192.82 | | | | 124,461 | | | $ | 1,015,387 | |
_________________________________
(1)Includes 610,683 shares purchased under our 2023 Share Repurchase Program, as well as 20,248 shares that were withheld by us to satisfy tax withholding obligations of certain of our officers, directors and key employees that arose upon the lapse of restrictions on restricted stock. See Note 21 – Compensation Plans for a discussion of our compensation plans.
(2)In May 2023, our Board of Directors approved the 2023 Share Repurchase Program for the repurchase of up to $1.0 billion of our outstanding common stock. In July 2024, our Board of Directors approved the 2024 Share Repurchase Program for the repurchase of up to $1.0 billion of our outstanding common stock. We are not obligated to repurchase any specific dollar amount or number of shares under the Share Repurchase Programs and may discontinue these programs at any time.
Item 6. Reserved
Item 7. Management’s Discussion and Analysis of Financial Condition and Results of Operations
The following discussion and analysis of our financial condition and results of operations should be read in conjunction with our consolidated financial statements and the notes included in Part IV of this Annual Report. Additional sections in this Annual Report should be helpful to the reading of our discussion and analysis, including the following: (i) a description of our business strategy found in “Item 1. Business–Overview”; (ii) a description of recent developments, found in “Item 1. Business–Recent Developments”; and (iii) a description of risk factors affecting us and our business, found in “Item 1A. Risk Factors.” Discussions of 2022 items and year-to-year comparisons between 2023 and 2022 that are not included in this Annual Report can be found in Part II, Item 7. “Management’s Discussion and Analysis of Financial Condition and Results of Operations” of our Annual Report on Form 10-K for the year ended December 31, 2023.
General Trends and Outlook
We expect our results of operations to continue to be affected by the following key trends: commodity prices, volume throughput and demand for our products and services, contract terms and mix, the impact of our hedging activities, the cost to operate and support assets, volatile capital markets and competition. These expectations are based on assumptions made by us and information currently available to us. To the extent our underlying assumptions about or interpretations of available information prove to be incorrect, our actual results may vary materially from our expected results.
Commodity Prices
There has been, and we believe there will continue to be, volatility in commodity prices and in the relationships among natural gas, NGL and crude oil prices. The volatility and uncertainty of natural gas, NGL and crude oil prices impact drilling, completion and other investment decisions by producers and ultimately supply to our systems. See “Item 1A. Risk Factors – Our cash flow is affected by supply and demand for natural gas, NGL products, and crude oil, and by natural gas, NGL, crude oil and condensate prices, and decreases in supply, demand or these prices could adversely affect our results of operations and financial condition.”
Our operating income generally improves in an environment of higher natural gas, NGL and condensate prices. Our processing profitability is largely dependent upon pricing and the supply of and market demand for natural gas, NGLs and condensate, both of which are beyond our control. In a declining commodity price environment, without taking into account our hedges, we will realize a reduction in cash flows under our percent-of-proceeds contracts proportionate to average price declines. While we have a significant level of margin that we derive from fee-based arrangements across our operations and particularly for our assets in the Downstream Business, our contract mix, along with our commodity hedging program, serves to mitigate the impact of commodity price movements on our cash flows. For additional information regarding our hedging activities, see “Item 7A. Quantitative and Qualitative Disclosures about Market Risk — Commodity Price Risk.”
The following table presents selected average annual and quarterly industry index prices for natural gas, selected NGL products and crude oil for the periods presented:
| | | | | | | | | | | |
| Natural Gas $/MMBtu (1) | | | Illustrative Targa NGL $/gal (2) | | | Crude Oil $/Bbl (3) | |
2024 | | | | | | | | |
4th Quarter | $ | 2.80 | | | $ | 0.65 | | | $ | 69.40 | |
3rd Quarter | | 2.16 | | | | 0.59 | | | | 78.71 | |
2nd Quarter | | 1.89 | | | | 0.61 | | | | 79.97 | |
1st Quarter | | 2.24 | | | | 0.65 | | | | 75.61 | |
2024 Average | | 2.27 | | | | 0.63 | | | | 75.92 | |
| | | | | | | | |
2023 | | | | | | | | |
4th Quarter | $ | 2.88 | | | $ | 0.60 | | | $ | 78.33 | |
3rd Quarter | | 2.54 | | | | 0.62 | | | | 82.18 | |
2nd Quarter | | 2.09 | | | | 0.56 | | | | 73.75 | |
1st Quarter | | 3.45 | | | | 0.70 | | | | 76.11 | |
2023 Average | | 2.74 | | | | 0.62 | | | | 77.59 | |
(1)Natural gas prices are based on average first of month prices from Henry Hub Inside FERC commercial index prices.
(2)“Illustrative Targa NGL” pricing is weighted using average quarterly prices from Mont Belvieu Non-TET monthly commercial index and represents the following composition for the periods noted:
2024: 44% ethane, 32% propane, 11% normal butane, 4% isobutane and 9% natural gasoline
2023: 44% ethane, 32% propane, 11% normal butane, 4% isobutane and 9% natural gasoline
(3)Crude oil prices are based on average quarterly prices of West Texas Intermediate crude oil as measured on the NYMEX.
Volumes and Demand for our Services
Fluctuations in energy prices can greatly affect production rates and investments by third parties in the development and production of new oil and natural gas reserves. Our operations are affected by the level of crude, natural gas and NGL prices, the relationship among these prices and related activity levels from our customers. In our gathering and processing operations, plant inlet volumes, crude oil volumes and capacity utilization rates generally are driven by wellhead production and our competitive and contractual position on a regional basis and more broadly by the impact of prices for crude oil, natural gas and NGLs on exploration and production activity in the areas of our operations. Drilling and production activity generally decreases as crude oil and natural gas prices decrease below commercially acceptable levels. Producers generally focus their drilling activity on certain basins depending on commodity price fundamentals. Our asset systems are predominantly located in some of the most economic basins in the United States.
The factors that impact the gathering and processing volumes also impact the total volumes that flow to our Downstream Business. Accordingly, increased producer activity will drive demand for our midstream services and may result in incremental growth capital expenditures. Demand for our transportation, fractionation and other fee-based services is largely correlated with producer activity levels. Demand for our international export, storage and terminaling services has remained relatively constant, as demand for these services is based on a number of domestic and international factors.
Contract Terms, Contract Mix and the Impact of Commodity Prices
Across our operations and particularly in our Downstream Business, we benefit from long-term fee-based arrangements for our services. Our Gathering and Processing segment contract mix also has components of fee-based margin, such as fee floors and other fee-based services which mitigate against low commodity prices. The significant level of margin we derive from fee-based arrangements combined with our hedging arrangements helps to mitigate our exposure to commodity price movements. Volatility in commodity prices can have a significant impact on our profitability, especially those percent-of-proceeds contracts that create direct exposure to changes in energy prices by paying us for gathering and processing services with a portion of proceeds from the commodities handled (“equity volumes”).
Contract terms in the Gathering and Processing segment are based upon a variety of factors, including natural gas and crude quality, geographic location, competitive dynamics and the pricing environment at the time the contract is executed, and customer requirements. Our gathering and processing contract mix and, accordingly, our exposure to crude, natural gas and NGL prices may change as a result of producer preferences, competition and changes in production as wells decline at different rates or are added, our expansion into regions where different types of contracts are more common and other market factors.
The contract terms and contract mix of our Downstream Business can also have a significant impact on our results of operations. Transportation and fractionation services are supported by fee-based contracts whose rates and terms are driven by NGL supply and transportation and fractionation capacity. Export services are supported by fee-based contracts whose rates and terms are driven by global LPG supply and demand fundamentals. The Logistics and Transportation segment includes predominantly fee-based contracts.
Impact of Our Commodity Price Hedging Activities
We have hedged the commodity price risk associated with a portion of our expected natural gas, NGL and condensate equity volumes, future commodity purchases and sales, and transportation basis risk by entering into financially settled derivative transactions. These transactions include swaps, futures, and purchased puts (or floors) and calls (or caps) to hedge additional expected equity commodity volumes without creating volumetric risk. We intend to continue managing our exposure to commodity prices in the future by entering into derivative transactions. We actively manage the Downstream Business product inventory and other working capital levels to reduce exposure to changing prices. For additional information regarding our hedging activities, see “Item 7A. Quantitative and Qualitative Disclosures About Market Risk–Commodity Price Risk.”
Operating Expenses
Variable costs such as service and repairs can impact our results. Continued expansion of existing assets will also give rise to additional operating expenses, which will affect our results. The employees supporting our operations are employees of Targa Resources LLC, a Delaware limited liability company, and a wholly-owned subsidiary of ours.
Volatile Capital Markets and Competition
We continuously consider and enter into discussions regarding potential growth projects and acquisitions and may contemplate external funding for potential growth projects and acquisitions. Any limitations on our access to capital may impair our ability to execute this strategy. If the cost of such capital becomes too expensive, our ability to develop or acquire strategic and accretive assets may be limited. We may not be able to raise the necessary funds on satisfactory terms, if at all. The primary factors influencing our cost of borrowing include interest rates, credit spreads, covenants, underwriting or loan origination fees and similar charges we pay to lenders. These factors may impair our ability to execute our growth and acquisition strategy.
Current economic conditions and competition for asset purchases and development opportunities could limit our ability to fully execute our growth strategy. Due to increased volatility in commodity prices and the broader market, the ability of companies in the oil and gas industry to seek financing and access the capital markets on favorable terms or at all has been negatively impacted. We believe we have sufficient access to financial resources and liquidity necessary to meet our requirements for working capital, debt service payments and capital expenditures in 2025 and beyond. For additional information regarding our financing activities, see “Item 7. Management’s Discussion and Analysis of Financial Condition and Results of Operations — Our Liquidity and Capital Resources.”
How We Evaluate Our Operations
The profitability of our business is a function of the difference between: (i) the revenues we receive from our operations, including fee-based revenues from services and revenues from the natural gas, NGLs, crude oil and condensate we sell, and (ii) the costs associated with conducting our operations, including the costs of wellhead natural gas, crude oil and mixed NGLs that we purchase as well as operating, general and administrative costs and the impact of our commodity hedging activities. Because commodity price movements tend to impact both revenues and costs, increases or decreases in our revenues alone are not necessarily indicative of increases or decreases in our profitability. Our contract portfolio, the prevailing pricing environment for crude oil, natural gas and NGLs, the impact of our commodity hedging program and its ability to mitigate exposure to commodity price movements, and the volumes of crude oil, natural gas and NGL throughput on our systems are important factors in determining our profitability. Our profitability is also affected by the NGL content in gathered wellhead natural gas, supply and demand for our products and services, utilization of our assets and changes in our customer mix.
Our profitability is also impacted by fee-based contracts. Our growing capital expenditures for pipelines and gathering and processing assets underpinned by fee-based margin, expansion of our Downstream facilities, continued focus on adding fee-based margin to our existing and future gathering and processing contracts, as well as third-party acquisitions of businesses and assets, will continue to increase the number of our contracts that are fee-based. Fixed fees for services such as gathering and processing, transportation, fractionation, storage, terminaling and crude oil gathering are not directly tied to changes in market prices for commodities. Nevertheless, a change in market dynamics such as available commodity throughput does affect profitability.
Management uses a variety of financial measures and operational measurements to analyze our performance. These include: (i) throughput volumes, facility efficiencies and fuel consumption, (ii) operating expenses, (iii) capital expenditures and (iv) the following non-GAAP measures: adjusted EBITDA, adjusted cash flow from operations, adjusted free cash flow and adjusted operating margin (segment).
Throughput Volumes, Facility Efficiencies and Fuel Consumption
Our profitability is impacted by our ability to add new sources of natural gas supply and crude oil supply to offset the natural decline of existing volumes from oil and natural gas wells that are connected to our gathering and processing systems. This is achieved by connecting new wells and adding new volumes in existing areas of production, as well as by capturing crude oil and natural gas supplies currently gathered by third parties. Similarly, our profitability is impacted by our ability to add new sources of mixed NGL supply, connected by third-party transportation and Grand Prix, to our Downstream Business fractionation facilities and at times to our export facilities. We fractionate NGLs generated by our gathering and processing plants, as well as by contracting for mixed NGL supply from third-party facilities.
In addition, we seek to increase adjusted operating margin by limiting volume losses, reducing fuel consumption and by increasing efficiency. With our gathering systems’ extensive use of remote monitoring capabilities, we monitor the volumes received at the wellhead or central delivery points along our gathering systems, the volume of natural gas received at our processing plant inlets and the volumes of NGLs and residue natural gas recovered by our processing plants. We also monitor the volumes of NGLs received, stored, fractionated and delivered across our logistics assets. This information is tracked through our processing plants and Downstream Business facilities to determine customer settlements for sales and volume related fees for service and helps us increase efficiency and reduce fuel consumption.
As part of monitoring the efficiency of our operations, we measure the difference between the volume of natural gas received at the wellhead or central delivery points on our gathering systems and the volume received at the inlet of our processing plants as an indicator of fuel consumption and line loss. We also track the difference between the volume of natural gas received at the inlet of the processing plant and the NGLs and residue gas produced at the outlet of such plant to monitor the fuel consumption and recoveries of our facilities. Similar tracking is performed for our crude oil gathering and logistics assets and our NGL pipelines. These volume, recovery and fuel consumption measurements are an important part of our operational efficiency analysis and safety programs.
Operating Expenses
Operating expenses are costs associated with the operation of specific assets. Labor, contract services, repair and maintenance and ad valorem taxes comprise the most significant portion of our operating expenses. These expenses remain relatively stable and independent of the volumes through our systems, but may increase with system expansions and inflation, and will fluctuate depending on the scope of the activities performed during a specific period.
Capital Expenditures
Our capital expenditures are classified as growth capital expenditures and maintenance capital expenditures. Growth capital expenditures improve the service capability of the existing assets, extend asset useful lives, increase capacities from existing levels, add capabilities, and reduce costs or enhance revenues. Maintenance capital expenditures are those expenditures that are necessary to maintain the service capability of our existing assets, including the replacement of system components and equipment, which are worn, obsolete or completing their useful life and expenditures to remain in compliance with environmental laws and regulations.
Capital spending associated with growth and maintenance projects is closely monitored. Return on investment is analyzed before a capital project is approved, spending is closely monitored throughout the development of the project, and the subsequent operational performance is compared to the assumptions used in the economic analysis performed for the capital investment approval.
Non-GAAP Measures
We utilize non-GAAP measures to analyze our performance. Adjusted EBITDA, adjusted cash flow from operations, adjusted free cash flow and adjusted operating margin (segment) are non-GAAP measures. The GAAP measures most directly comparable to these non-GAAP measures are income (loss) from operations, Net income (loss) attributable to Targa Resources Corp. and segment operating margin. These non-GAAP measures should not be considered as an alternative to GAAP measures and have important limitations as analytical tools. Investors should not consider these measures in isolation or as a substitute for analysis of our results as reported under GAAP. Additionally, because our non-GAAP measures exclude some, but not all, items that affect income and segment operating margin, and are defined differently by different companies within our industry, our definitions may not be comparable with similarly titled measures of other companies, thereby diminishing their utility. Management compensates for the limitations of our non-GAAP measures as analytical tools by reviewing the comparable GAAP measures, understanding the differences between the measures and incorporating these insights into our decision-making processes.
Adjusted Operating Margin
We define adjusted operating margin for our segments as revenues less product purchases and fuel. It is impacted by volumes and commodity prices as well as by our contract mix and commodity hedging program.
Gathering and Processing adjusted operating margin consists primarily of:
•service fees related to natural gas and crude oil gathering, treating and processing; and
•revenues from the sale of natural gas, condensate, crude oil and NGLs less producer settlements, fuel and transport and our equity volume hedge settlements.
Logistics and Transportation adjusted operating margin consists primarily of:
•service fees (including the pass-through of energy costs included in certain fee rates);
•system product gains and losses; and
•NGL and natural gas sales, less NGL and natural gas purchases, fuel, third-party transportation costs and the net inventory change.
The adjusted operating margin impacts of mark-to-market hedge unrealized changes in fair value are reported in Other.
Adjusted operating margin for our segments provides useful information to investors because it is used as a supplemental financial measure by management and by external users of our financial statements, including investors and commercial banks, to assess:
•the financial performance of our assets without regard to financing methods, capital structure or historical cost basis;
•our operating performance and return on capital as compared to other companies in the midstream energy sector, without regard to financing or capital structure; and
•the viability of capital expenditure projects and acquisitions and the overall rates of return on alternative investment opportunities.
Management reviews adjusted operating margin and operating margin for our segments monthly as a core internal management process. We believe that investors benefit from having access to the same financial measures that management uses in evaluating our operating results. The reconciliation of our adjusted operating margin to the most directly comparable GAAP measure is presented under “Management’s Discussion and Analysis of Financial Condition and Results of Operations – Results of Operations – By Reportable Segment.”
Adjusted EBITDA
We define adjusted EBITDA as Net income (loss) attributable to Targa Resources Corp. before interest, income taxes, depreciation and amortization, and other items that we believe should be adjusted consistent with our core operating performance. The adjusting items are detailed in the adjusted EBITDA reconciliation table and its footnotes. Adjusted EBITDA is used as a supplemental financial measure by us and by external users of our financial statements such as investors, commercial banks and others to measure the ability of our assets to generate cash sufficient to pay interest costs, support our indebtedness and pay dividends to our investors.
Adjusted Cash Flow from Operations and Adjusted Free Cash Flow
We define adjusted cash flow from operations as adjusted EBITDA less cash interest expense on debt obligations and cash taxes. We define adjusted free cash flow as adjusted cash flow from operations less maintenance capital expenditures (net of any reimbursements of project costs) and growth capital expenditures, net of contributions from noncontrolling interest and including contributions to investments in unconsolidated affiliates. Adjusted cash flow from operations and adjusted free cash flow are performance measures used by us and by external users of our financial statements, such as investors, commercial banks and research analysts, to assess our ability to generate cash earnings (after servicing our debt and funding capital expenditures) to be used for corporate purposes, such as payment of dividends, retirement of debt or redemption of other financing arrangements.
Our Non-GAAP Financial Measures
The following table reconciles the non-GAAP financial measures used by management to the most directly comparable GAAP measures for the periods indicated:
| | | | | | | |
| Year Ended December 31, | |
| 2024 | | | 2023 | |
| (In millions) | |
Reconciliation of Net income (loss) attributable to Targa Resources Corp. to Adjusted EBITDA, Adjusted Cash Flow from Operations and Adjusted Free Cash Flow | | | | | |
Net income (loss) attributable to Targa Resources Corp. | $ | 1,312.0 | | | $ | 1,345.9 | |
Interest (income) expense, net | | 767.2 | | | | 687.8 | |
Income tax expense (benefit) | | 384.5 | | | | 363.2 | |
Depreciation and amortization expense | | 1,423.0 | | | | 1,329.6 | |
(Gain) loss on sale or disposition of assets | | (3.1 | ) | | | (5.3 | ) |
Write-down of assets | | 6.2 | | | | 6.9 | |
(Gain) loss from financing activities | | 0.8 | | | | 2.1 | |
Equity (earnings) loss | | (9.4 | ) | | | (9.0 | ) |
Distributions from unconsolidated affiliates | | 25.3 | | | | 18.6 | |
Compensation on equity grants | | 63.2 | | | | 62.4 | |
Risk management activities | | 164.6 | | | | (275.4 | ) |
Noncontrolling interests adjustments (1) | | 3.9 | | | | (3.7 | ) |
Litigation expense (2) | | 4.1 | | | | 6.9 | |
Adjusted EBITDA | $ | 4,142.3 | | | $ | 3,530.0 | |
Interest expense on debt obligations (3) | | (752.4 | ) | | | (675.8 | ) |
Cash taxes | | (17.5 | ) | | | (13.6 | ) |
Adjusted Cash Flow from Operations | $ | 3,372.4 | | | $ | 2,840.6 | |
Maintenance capital expenditures, net (4) | | (231.9 | ) | | | (223.4 | ) |
Growth capital expenditures, net (4) | | (3,000.4 | ) | | | (2,224.5 | ) |
Adjusted Free Cash Flow | $ | 140.1 | | | $ | 392.7 | |
(1)Represents adjustments related to our subsidiaries with noncontrolling interests, including depreciation and amortization expense as well as earnings for certain plants within our WestTX joint venture not subject to noncontrolling interest.
(2)Litigation expense includes charges related to litigation resulting from the major winter storm in February 2021 that we consider outside the ordinary course of our business and/or not reflective of our ongoing core operations. We may incur such charges from time to time, and we believe it is useful to exclude such charges because we do not consider them reflective of our ongoing core operations and because of the generally singular nature of the claims underlying such litigation.
(3)Excludes amortization of interest expense. The year ended December 31, 2024 includes $55.8 million of interest expense associated with the Splitter Agreement ruling.
(4)Represents capital expenditures, net of contributions from noncontrolling interests and includes contributions to investments in unconsolidated affiliates.
Consolidated Results of Operations
The following table and discussion is a summary of our consolidated results of operations:
| | | | | | | | | | | | | | |
| Year Ended December 31, | | | | | | |
| 2024 | | | 2023 | | | 2024 vs. 2023 | |
| (In millions) | |
Revenues: | | | | | | | | | | |
Sales of commodities | $ | 13,891.8 | | | $ | 13,962.1 | | | $ | (70.3 | ) | | (1 | %) |
Fees from midstream services | | 2,489.7 | | | | 2,098.2 | | | | 391.5 | | | 19 | % |
Total revenues | | 16,381.5 | | | | 16,060.3 | | | | 321.2 | | | 2 | % |
Product purchases and fuel | | 10,703.0 | | | | 10,676.4 | | | | 26.6 | | | — | |
Operating expenses | | 1,175.6 | | | | 1,077.9 | | | | 97.7 | | | 9 | % |
Depreciation and amortization expense | | 1,423.0 | | | | 1,329.6 | | | | 93.4 | | | 7 | % |
General and administrative expense | | 384.9 | | | | 348.7 | | | | 36.2 | | | 10 | % |
Other operating (income) expense | | (0.4 | ) | | | 1.5 | | | | (1.9 | ) | NM | |
Income (loss) from operations | | 2,695.4 | | | | 2,626.2 | | | | 69.2 | | | 3 | % |
Interest expense, net | | (767.2 | ) | | | (687.8 | ) | | | (79.4 | ) | | 12 | % |
Equity earnings (loss) | | 9.4 | | | | 9.0 | | | | 0.4 | | | 4 | % |
Gain (loss) from financing activities | | (0.8 | ) | | | (2.1 | ) | | | 1.3 | | | 62 | % |
Other, net | | 1.2 | | | | (2.8 | ) | | | 4.0 | | NM | |
Income tax (expense) benefit | | (384.5 | ) | | | (363.2 | ) | | | (21.3 | ) | | 6 | % |
Net income (loss) | | 1,553.5 | | | | 1,579.3 | | | | (25.8 | ) | | (2 | %) |
Less: Net income (loss) attributable to noncontrolling interests | | 241.5 | | | | 233.4 | | | | 8.1 | | | 3 | % |
Net income (loss) attributable to Targa Resources Corp. | | 1,312.0 | | | | 1,345.9 | | | | (33.9 | ) | | (3 | %) |
Premium on repurchase of noncontrolling interests, net of tax | | 32.9 | | | | 510.1 | | | | (477.2 | ) | | (94 | %) |
Net income (loss) attributable to common shareholders | $ | 1,279.1 | | | $ | 835.8 | | | $ | 443.3 | | | 53 | % |
Financial data: | | | | | | | | | | |
Adjusted EBITDA (1) | $ | 4,142.3 | | | $ | 3,530.0 | | | $ | 612.3 | | | 17 | % |
Adjusted cash flow from operations (1) | | 3,372.4 | | | | 2,840.6 | | | | 531.8 | | | 19 | % |
Adjusted free cash flow (1) | | 140.1 | | | | 392.7 | | | | (252.6 | ) | | (64 | %) |
(1)Adjusted EBITDA, adjusted cash flow from operations and adjusted free cash flow are non-GAAP financial measures and are discussed under “Management’s Discussion and Analysis of Financial Condition and Results of Operations–How We Evaluate Our Operations.”
NM Due to a low denominator, the noted percentage change is disproportionately high and as a result, considered not meaningful.
2024 Compared to 2023
Commodity sales are relatively flat reflecting lower natural gas and condensate prices ($1,242.8 million) and the unfavorable impact of hedges ($686.5 million), offset by higher NGL, natural gas and condensate volumes ($1,607.2 million), and higher NGL prices ($251.6 million).
The increase in fees from midstream services is primarily due to higher gas gathering and processing fees, higher transportation and fractionation fees, and higher export volumes.
Product purchases and fuel are relatively flat reflecting higher NGL and natural gas volumes, offset by lower natural gas prices.
The increase in operating expenses is primarily due to higher labor, maintenance, rental and chemical costs as a result of increased activity and system expansions, partially offset by lower taxes.
See “—Results of Operations—By Reportable Segment” for additional information on a segment basis.
The increase in depreciation and amortization expense is primarily due to the impact of system expansions on our asset base, partially offset by the shortening of depreciable lives of certain assets that were idled in 2023.
The increase in general and administrative expense is primarily due to higher compensation and benefits and professional fees.
The increase in interest expense, net, is due to recognition of cumulative interest on a 2024 legal ruling associated with the Splitter Agreement and higher borrowings, partially offset by higher capitalized interest. Higher capitalized interest is due to system expansions and higher interest rates. See Note 17 – Contingencies for additional information related to the legal ruling.
The increase in income tax expense is primarily due to the release of state valuation allowance in 2023.
The premium on repurchase of noncontrolling interests, net of tax is primarily due to the CBF Acquisition in 2024 and the Grand Prix Transaction in 2023.
Results of Operations—By Reportable Segment
Our operating margins by reportable segment are:
| | | | | | | | | | | | |
| | Gathering and Processing | | | Logistics and Transportation | | | Other | |
| | (In millions) | |
Year Ended: | | | | | | | | | |
December 31, 2024 | | $ | 2,312.4 | | | $ | 2,355.1 | | | $ | (164.6 | ) |
December 31, 2023 | | | 2,082.2 | | | | 1,948.7 | | | | 275.5 | |
Gathering and Processing Segment
| | | | | | | | | | | | | | | | | | |
| Year Ended December 31, | | | | | | | | |
| 2024 | | | 2023 | | | 2024 vs. 2023 | |
| (In millions, except operating statistics and price amounts) | |
Operating margin | $ | | 2,312.4 | | | $ | | 2,082.2 | | | $ | | 230.2 | | | | 11 | % |
Operating expenses | | | 814.6 | | | | | 746.6 | | | | | 68.0 | | | | 9 | % |
Adjusted operating margin | $ | | 3,127.0 | | | $ | | 2,828.8 | | | $ | | 298.2 | | | | 11 | % |
Operating statistics (1): | | | | | | | | | | | | | | |
Plant natural gas inlet, MMcf/d (2) (3) | | | | | | | | | | | | | | |
Permian Midland (4) | | | 2,933.1 | | | | | 2,535.2 | | | | | 397.9 | | | | 16 | % |
Permian Delaware | | | 2,837.3 | | | | | 2,526.5 | | | | | 310.8 | | | | 12 | % |
Total Permian | | | 5,770.4 | | | | | 5,061.7 | | | | | 708.7 | | | | 14 | % |
| | | | | | | | | | | | | | |
SouthTX | | | 325.9 | | | | | 367.4 | | | | | (41.5 | ) | | | (11 | %) |
North Texas | | | 186.9 | | | | | 205.9 | | | | | (19.0 | ) | | | (9 | %) |
SouthOK (5) | | | 351.7 | | | | | 385.0 | | | | | (33.3 | ) | | | (9 | %) |
WestOK | | | 212.8 | | | | | 207.1 | | | | | 5.7 | | | | 3 | % |
Total Central | | | 1,077.3 | | | | | 1,165.4 | | | | | (88.1 | ) | | | (8 | %) |
| | | | | | | | | | | | | | |
Badlands (5) (6) | | | 136.3 | | | | | 130.0 | | | | | 6.3 | | | | 5 | % |
Total Field | | | 6,984.0 | | | | | 6,357.1 | | | | | 626.9 | | | | 10 | % |
| | | | | | | | | | | | | | |
Coastal | | | 449.6 | | | | | 541.1 | | | | | (91.5 | ) | | | (17 | %) |
| | | | | | | | | | | | | | |
Total | | | 7,433.6 | | | | | 6,898.2 | | | | | 535.4 | | | | 8 | % |
NGL production, MBbl/d (3) | | | | | | | | | | | | | | |
Permian Midland (4) | | | 428.4 | | | | | 367.7 | | | | | 60.7 | | | | 17 | % |
Permian Delaware | | | 359.9 | | | | | 321.6 | | | | | 38.3 | | | | 12 | % |
Total Permian | | | 788.3 | | | | | 689.3 | | | | | 99.0 | | | | 14 | % |
| | | | | | | | | | | | | | |
SouthTX (5) | | | 32.8 | | | | | 40.9 | | | | | (8.1 | ) | | | (20 | %) |
North Texas | | | 22.6 | | | | | 24.0 | | | | | (1.4 | ) | | | (6 | %) |
SouthOK (5) | | | 35.0 | | | | | 43.1 | | | | | (8.1 | ) | | | (19 | %) |
WestOK | | | 15.1 | | | | | 12.5 | | | | | 2.6 | | | | 21 | % |
Total Central | | | 105.5 | | | | | 120.5 | | | | | (15.0 | ) | | | (12 | %) |
| | | | | | | | | | | | | | |
Badlands (5) | | | 16.6 | | | | | 15.5 | | | | | 1.1 | | | | 7 | % |
Total Field | | | 910.4 | | | | | 825.3 | | | | | 85.1 | | | | 10 | % |
| | | | | | | | | | | | | | |
Coastal | | | 35.8 | | | | | 39.2 | | | | | (3.4 | ) | | | (9 | %) |
| | | | | | | | | | | | | | |
Total | | | 946.2 | | | | | 864.5 | | | | | 81.7 | | | | 9 | % |
Crude oil, Badlands, MBbl/d | | | 106.6 | | | | | 105.5 | | | | | 1.1 | | | | 1 | % |
Crude oil, Permian, MBbl/d | | | 27.9 | | | | | 27.4 | | | | | 0.5 | | | | 2 | % |
Natural gas sales, BBtu/d (3) | | | 2,780.5 | | | | | 2,685.8 | | | | | 94.7 | | | | 4 | % |
NGL sales, MBbl/d (3) | | | 558.2 | | | | | 495.8 | | | | | 62.4 | | | | 13 | % |
Condensate sales, MBbl/d | | | 19.3 | | | | | 18.5 | | | | | 0.8 | | | | 4 | % |
Average realized prices (7): | | | | | | | | | | | | | | |
Natural gas, $/MMBtu | | | 0.67 | | | | | 1.94 | | | | | (1.27 | ) | | | (65 | %) |
NGL, $/gal | | | 0.46 | | | | | 0.46 | | | | | — | | | | — | |
Condensate, $/Bbl | | | 73.35 | | | | | 74.35 | | | | | (1.00 | ) | | | (1 | %) |
(1)Segment operating statistics include the effect of intersegment amounts, which have been eliminated from the consolidated presentation. For all volume statistics presented, the numerator is the total volume sold during the period and the denominator is the number of calendar days during the period.
(2)Plant natural gas inlet represents our undivided interest in the volume of natural gas passing through the meter located at the inlet of a natural gas processing plant, other than Badlands.
(3)Plant natural gas inlet volumes and gross NGL production volumes include producer take-in-kind volumes, while natural gas sales and NGL sales exclude producer take-in-kind volumes.
(4)Permian Midland includes operations in WestTX, of which we own a 72.8% undivided interest, and other plants that are owned 100% by us. Operating results for the WestTX undivided interest assets are presented on a pro-rata net basis in our reported financials.
(5)Operations include facilities that are not wholly owned by us. For more information regarding our joint ventures and jointly owned facilities, see “Item 1. Business—Our Business Operations.”
(6)Badlands natural gas inlet represents the total wellhead volume and includes the Targa volumes processed at the LM4 plant.
(7)Average realized prices, net of fees, include the effect of realized commodity hedge gain/loss attributable to our equity volumes. The price is calculated using total commodity sales plus the hedge gain/loss as the numerator and total sales volume as the denominator, net of fees.
The following table presents the realized commodity hedge gain (loss) attributable to our equity volumes that are included in the adjusted operating margin of the Gathering and Processing segment:
| | | | | | | | | | | | | | | | | | | | | | | | |
| | Year Ended December 31, 2024 | | | Year Ended December 31, 2023 | |
| | (In millions, except volumetric data and price amounts) | |
| | Volume
Settled | | | Price
Spread (1) | | | Gain
(Loss) | | | Volume
Settled | | | Price
Spread (1) | | | Gain
(Loss) | |
Natural gas (BBtu) | | | 43.7 | | | $ | 1.92 | | | $ | 84.1 | | | | 63.2 | | | $ | 1.22 | | | $ | 77.4 | |
NGL (MMgal) | | | 449.8 | | | | 0.04 | | | | 15.8 | | | | 680.3 | | | | 0.07 | | | | 49.9 | |
Crude oil (MBbl) | | | 2.1 | | | | (2.05 | ) | | | (4.3 | ) | | | 2.4 | | | | (6.92 | ) | | | (16.6 | ) |
| | | | | | | | $ | 95.6 | | | | | | | | | $ | 110.7 | |
(1)The price spread is the differential between the contracted derivative instrument pricing and the price of the corresponding settled commodity transaction.
2024 Compared to 2023
The increase in adjusted operating margin was predominantly due to higher natural gas inlet volumes which drove higher fee-based income in the Permian, partially offset by lower natural gas and condensate prices. The increase in natural gas inlet volumes was attributable to the addition of the Legacy II plant during the first quarter of 2023, the Midway plant during the second quarter of 2023, the Greenwood I and Wildcat II plants during the fourth quarter of 2023, the Roadrunner II plant during the second quarter of 2024, the Greenwood II plant during the fourth quarter of 2024, and continued strong producer activity.
The increase in operating expenses was primarily due to higher volumes and multiple plant additions in the Permian.
Logistics and Transportation Segment
| | | | | | | | | | | | | | | | | |
| | Year Ended December 31, | | | | | | | |
| | 2024 | | | 2023 | | | 2024 vs. 2023 |
| (In millions, except operating statistics) |
Operating margin | | $ | | 2,355.1 | | | $ | | 1,948.7 | | | $ | | 406.4 | | | 21% |
Operating expenses | | | | 362.3 | | | | | 332.0 | | | | | 30.3 | | | 9% |
Adjusted operating margin | | $ | | 2,717.4 | | | $ | | 2,280.7 | | | $ | | 436.7 | | | 19% |
Operating statistics MBbl/d (1): | | | | | | | | | | | | | | |
NGL pipeline transportation volumes (2) | | | | 800.8 | | | | | 635.5 | | | | | 165.3 | | | 26% |
Fractionation volumes | | | | 936.1 | | | | | 798.1 | | | | | 138.0 | | | 17% |
Export volumes (3) | | | | 423.6 | | | | | 365.2 | | | | | 58.4 | | | 16% |
NGL sales | | | | 1,159.1 | | | | | 1,019.8 | | | | | 139.3 | | | 14% |
(1)Segment operating statistics include intersegment amounts, which have been eliminated from the consolidated presentation. For all volume statistics presented, the numerator is the total volume sold during the period and the denominator is the number of calendar days during the period.
(2)Represents the total quantity of mixed NGLs that earn a transportation margin.
(3)Export volumes represent the quantity of NGL products delivered to third-party customers at our Galena Park Marine Terminal that are destined for international markets.
2024 Compared to 2023
The increase in adjusted operating margin was due to higher pipeline transportation and fractionation margin, higher marketing margin, and higher LPG export margin. Pipeline transportation and fractionation volumes benefited from higher supply volumes primarily from our Permian Gathering and Processing systems, the addition of Train 9 during the second quarter of 2024, the in-service of the Daytona NGL Pipeline during the third quarter of 2024, and the addition of Train 10 during the fourth quarter of 2024. Marketing margin increased due to greater optimization opportunities. LPG export margin increased due to higher volumes as we benefited from the completion of the export expansion project during the third quarter of 2023 and the Houston Ship Channel allowing night-time vessel transits, partially offset by maintenance and required inspections.
The increase in operating expenses was due to higher system volumes, higher compensation and benefits, higher taxes, higher repairs and maintenance and the addition of two trains during 2024.
Other
| | | | | | | | | | | | |
| | Year Ended December 31, | | | | |
| | 2024 | | | 2023 | | | 2024 vs. 2023 | |
| (In millions) | |
Operating margin | | $ | (164.6 | ) | | $ | 275.5 | | | $ | (440.1 | ) |
Adjusted operating margin | | $ | (164.6 | ) | | $ | 275.5 | | | $ | (440.1 | ) |
Other contains the results of commodity derivative activity mark-to-market gains/losses related to derivative contracts that were not designated as cash flow hedges. We have entered into derivative instruments to hedge the commodity price associated with a portion of our future commodity purchases and sales and natural gas transportation basis risk within our Logistics and Transportation segment. See further details of our risk management program in “Item 7A. – Quantitative and Qualitative Disclosures About Market Risk.”
Our Liquidity and Capital Resources
As of December 31, 2024, inclusive of our consolidated joint venture accounts, we had $157.3 million of Cash and cash equivalents on our Consolidated Balance Sheets. On a consolidated basis, our main sources of liquidity and capital resources are internally generated cash flows from operations, borrowings under the New TRGP Revolver, Commercial Paper Program, Securitization Facility, and access to debt and equity capital markets. We supplement these sources of liquidity with joint venture arrangements and proceeds from asset sales. Our exposure to adverse credit conditions includes our credit facilities, cash investments, hedging abilities, customer performance risks and counterparty performance risks.
We believe our sources of liquidity and capital resources are sufficient to meet our anticipated cash requirements for at least the next twelve months to satisfy our obligations. Our ability to generate cash is subject to a number of factors, some of which are beyond our control. These include commodity prices and ongoing efforts to manage operating costs and maintenance capital expenditures, as well as general economic, financial, competitive, legislative, regulatory and other factors. For additional discussion on recent factors impacting our liquidity and capital resources, see “Recent Developments.”
Short-term Liquidity
Our principal sources of short-term liquidity consist of internally generated cash flow, borrowings available under the New TRGP Revolver, as well as our right to request additional commitment increases under the New TRGP Revolver, our Commercial Paper Program, the Securitization Facility, proceeds from debt and equity offerings, and joint ventures and/or asset sales. Based on anticipated levels of operations and absent any disruptive events, we believe our liquidity is sufficient to finance our operations, capital expenditures, quarterly cash dividends and obligations, as discussed further below, for at least the next twelve months.
Our short-term liquidity on a consolidated basis as of February 18, 2025 was:
| | | | |
| | Consolidated Total | |
| | (In millions) | |
Cash on hand (1) | | $ | 254.5 | |
Total availability under the Securitization Facility | | | 600.0 | |
Total availability under the New TRGP Revolver and Commercial Paper Program | | | 3,500.0 | |
| | | 4,354.5 | |
| | | |
Outstanding borrowings under the Securitization Facility | | | (600.0 | ) |
Outstanding borrowings under the New TRGP Revolver and Commercial Paper Program | | | (881.0 | ) |
Outstanding letters of credit under the New TRGP Revolver | | | (9.4 | ) |
Total liquidity | | $ | 2,864.1 | |
(1)Includes cash held in our consolidated joint venture accounts.
Other potential capital resources associated with our existing arrangements include our right to request an additional $500.0 million in commitment increases under the New TRGP Revolver, subject to the terms therein. The New TRGP Revolver matures on February 18, 2030. The maturity date is extendable, subject to the lenders’ consent, by one year up to two times.
In August 2024, the Partnership amended the Securitization Facility to, among other things, extend the termination date of the Securitization Facility to August 29, 2025.
A portion of our capital resources are allocated to letters of credit to satisfy certain counterparty credit requirements. As of December 31, 2024, we had $17.6 million in letters of credit outstanding under the Existing TRGP Revolver. The letters of credit also reflect certain
counterparties’ views of our financial condition and ability to satisfy our performance obligations, as well as commodity prices and other factors.
Working Capital
Working capital is the amount by which current assets exceed current liabilities. On a consolidated basis, at the end of any given month, accounts receivable and payable tied to commodity sales and purchases are relatively balanced, with receivables from customers being offset by plant settlements payable to producers. The factors that typically cause overall variability in our reported total working capital are: (i) our cash position; (ii) liquids inventory levels, which we closely manage, as well as liquids valuations; (iii) changes in payables and accruals related to major growth capital projects; (iv) changes in the fair value of the current portion of derivative contracts; (v) monthly swings in borrowings under the Securitization Facility; and (vi) major structural changes in our asset base or business operations, such as certain organic growth capital projects and acquisitions or divestitures.
Working capital as of December 31, 2024 decreased $310.0 million compared to December 31, 2023. The decrease was primarily due to higher accounts payable related to capital spending on growth projects, higher product purchases and fuel payables resulting from higher NGL volumes and prices, and higher net liabilities for hedging activities, partially offset by higher receivables resulting from higher NGL volumes and prices, and a lower outstanding balance on the Securitization Facility.
Long-term Financing
Our long-term financing consists of potentially raising funds through long-term debt obligations, the issuance of common stock, preferred stock, or joint venture arrangements. The majority of our debt is fixed rate borrowings; however, we have some exposure to the risk of changes in interest rates, primarily as a result of the variable rate borrowings under the New TRGP Revolver, the Securitization Facility, and the Commercial Paper Program. We may enter into interest rate hedges with the intent to mitigate the impact of changes in interest rates on cash flows. As of December 31, 2024, we did not have any interest rate hedges.
In August 2024, we completed an underwritten public offering of the 5.500% Notes, resulting in net proceeds of approximately $990.1 million. We used the net proceeds from the issuance to repay borrowings under the Commercial Paper Program, a portion of which were incurred to repay the remaining balance under the Term Loan Facility, and for general corporate purposes.
In the future, we or the Partnership may redeem, purchase or exchange certain of our and/or the Partnership’s outstanding debt through redemption calls, cash purchases and/or exchanges for other debt, in open market purchases, privately negotiated transactions or otherwise. Such calls, repurchases, exchanges or redemptions, if any, will depend on prevailing market conditions, our liquidity requirements, contractual restrictions and other factors. The amounts involved may be material.
To date, our debt balances and our subsidiaries’ debt balances have not adversely affected our operations, ability to grow or ability to repay or refinance indebtedness.
For information about our debt obligations, see Note 8 – Debt Obligations to our consolidated financial statements. For information about our interest rate risk, see “Item 7A. Quantitative and Qualitative Disclosures About Market Risk—Interest Rate Risk.”
Compliance with Debt Covenants
As of December 31, 2024, both we and the Partnership were in compliance with the covenants contained in our various debt agreements.
Cash Flow Analysis
Cash Flows from Operating Activities
| | | | | | | | | | |
Year Ended December 31, | | | | |
2024 | | | 2023 | | | 2024 vs. 2023 | |
(In millions) | |
$ | 3,649.7 | | | $ | 3,211.6 | | | $ | 438.1 | |
The primary drivers of cash flows from operating activities are: (i) the collection of cash from customers from the sale of NGLs and natural gas, as well as fees for processing, gathering, export, fractionation, terminaling, storage and transportation; (ii) the payment of amounts related to the purchase of NGLs and natural gas; and (iii) the payment of other expenses, primarily field operating costs, general and administrative expense and interest expense. In addition, we use derivative instruments to manage our exposure to commodity price risk. Changes in the prices of the commodities we hedge impact our derivative settlements as well as our margin deposit requirements on unsettled futures contracts.
The increase in net cash provided by operating activities was primarily due to higher collections from customers resulting from increased revenues during 2024 compared to 2023, partially offset by an increase in payments for product purchases and fuel, lower settlements on our hedging transactions, an increase in interest payments, and a nonrecurring one-time payment associated with the Splitter Agreement ruling.
Cash Flows from Investing Activities
| | | | | | | | | | |
Year Ended December 31, | | | | |
2024 | | | 2023 | | | 2024 vs. 2023 | |
(In millions) | |
$ | (3,021.3 | ) | | $ | (2,400.8 | ) | | $ | (620.5 | ) |
The increase in net cash used in investing activities was due to higher outlays for major growth capital projects in 2024 primarily related to construction activities in the Permian region and Mont Belvieu, Texas.
Cash Flows from Financing Activities
| | | | | | | |
| Year Ended December 31, | |
| 2024 | | | 2023 | |
| (In millions) | |
Source of Financing Activities, net | | | | | |
Debt, including financing costs | $ | 1,149.9 | | | $ | 1,300.0 | |
Repurchase of noncontrolling interests | | (112.9 | ) | | | (1,118.9 | ) |
Dividends | | (615.5 | ) | | | (427.3 | ) |
Contributions from (distributions to) noncontrolling interests | | (220.6 | ) | | | (212.4 | ) |
Repurchase of shares | | (813.7 | ) | | | (429.5 | ) |
Net cash provided by (used in) financing activities | $ | (612.8 | ) | | $ | (888.1 | ) |
The decrease in net cash used in financing activities was due to lower repurchases of noncontrolling interests primarily due to the Grand Prix Transaction in 2023, partially offset by higher repurchases of common stock, higher dividends paid and lower borrowings of debt in 2024. This decrease in debt borrowing activity was due to lower proceeds from senior unsecured notes, partially offset by higher net borrowings under the Commercial Paper Program, lower repayments under the Term Loan Facility in 2024, and repayments under the Existing TRGP Revolver in 2023.
Summarized Combined Financial Information for Guarantee of Securities of Subsidiaries
Our subsidiaries that guaranteed our obligations under the Existing TRGP Revolver (the “Obligated Group”) also fully and unconditionally guaranteed, jointly and severally, the payment of TRGP’s senior unsecured notes, subject to certain limited exceptions.
In lieu of providing separate financial statements for the Obligated Group, we have presented the following supplemental summarized Combined Balance Sheet and Statement of Operations information for the Obligated Group based on Rule 13-01 of the SEC’s Regulation S-X.
All significant intercompany items among the Obligated Group have been eliminated in the supplemental summarized combined financial information. The Obligated Group’s investment balances in our non-guarantor subsidiaries have been excluded from the supplemental summarized combined financial information. Significant intercompany balances and activity for the Obligated Group with other related parties, including our non-guarantor subsidiaries (referred to as “affiliates”), are presented separately in the following supplemental summarized combined financial information.
Summarized Combined Balance Sheet and Statement of Operations information for the Obligated Group as of the end of the most recent period presented follows:
| | | | | | | | |
Summarized Combined Balance Sheet Information | | | | | | |
| | December 31, 2024 | | | December 31, 2023 | |
| | (In millions) | |
ASSETS | |
Current assets | | $ | 986.9 | | | $ | 966.3 | |
Current assets - affiliates | | | 1.1 | | | | 11.2 | |
Long-term assets | | | 16,574.0 | | | | 15,267.6 | |
Total assets | | $ | 17,562.0 | | | $ | 16,245.1 | |
| | | | |
| |
LIABILITIES AND OWNERS’ EQUITY (DEFICIT) | |
Current liabilities | | $ | 2,763.0 | | | $ | 2,107.9 | |
Current liabilities - affiliates | | | 36.7 | | | | 26.2 | |
Long-term liabilities | | | 15,120.9 | | | | 13,278.8 | |
Targa Resources Corp. stockholders’ equity (deficit) | | | (358.6 | ) | | | 832.2 | |
Total liabilities and owners’ equity (deficit) | | $ | 17,562.0 | | | $ | 16,245.1 | |
| | | | | | |
Summarized Combined Statement of Operations Information | | | | | | |
| | Year Ended December 31, | |
| | 2024 | | | 2023 | |
| | (In millions) | |
Revenues | | $ | 15,939.3 | | | $ | 15,737.0 | |
Operating income | | | 2,031.3 | | | | 2,134.2 | |
Net income | | | 888.7 | | | | 1,100.1 | |
Common Stock Dividends
The following table details the dividends declared and/or paid by us to common shareholders for 2024:
| | | | | | | | | | | | | | | | | | |
Three Months Ended | | Date Paid or
To Be Paid | | Total Common
Dividends Declared | | | Amount of Common
Dividends Paid or
To Be Paid | | | Dividends on
Share-Based Awards | | | Dividends Declared per Share of Common Stock | |
(In millions, except per share amounts) | |
December 31, 2024 | | February 14, 2025 | | $ | 165.1 | | | $ | 163.6 | | | $ | 1.5 | | | $ | 0.75000 | |
September 30, 2024 | | November 15, 2024 | | | 165.2 | | | | 163.5 | | | | 1.7 | | | | 0.75000 | |
June 30, 2024 | | August 15, 2024 | | | 166.1 | | | | 164.3 | | | | 1.8 | | | | 0.75000 | |
March 31, 2024 | | May 15, 2024 | | | 168.1 | | | | 166.3 | | | | 1.8 | | | | 0.75000 | |
The actual amount we declare as dividends in the future depends on our consolidated financial condition, results of operations, cash flow, the level of our capital expenditures, future business prospects, compliance with our debt covenants and any other matters that our Board of Directors deems relevant.
Capital Expenditures
The following table details cash outlays for capital projects for the years ended December 31, 2024 and 2023:
| | | | | | | | |
| | Year Ended December 31, | |
| | 2024 | | | 2023 | |
| | (In millions) | |
Capital expenditures: | | | | | | |
Growth (1) | | $ | 2,950.1 | | | $ | 2,211.0 | |
Maintenance (2) | | | 241.7 | | | | 232.6 | |
Gross capital expenditures | | | 3,191.8 | | | | 2,443.6 | |
Change in capital project payables and accruals, net | | | (226.0 | ) | | | (58.2 | ) |
Cash outlays for capital projects | | $ | 2,965.8 | | | $ | 2,385.4 | |
(1)Growth capital expenditures, net of contributions from noncontrolling interests and including contributions to investments in unconsolidated affiliates, were $3,000.4 million and $2,224.5 million for the years ended December 31, 2024 and 2023.
(2)Maintenance capital expenditures, net of contributions from noncontrolling interests, were $231.9 million and $223.4 million for the years ended December 31, 2024 and 2023.
The increase in total growth capital expenditures was primarily due to system expansions in the Permian region in response to forecasted production growth and higher activity levels, and expansions in our downstream business. The increase in total maintenance capital expenditures was primarily due to our growing infrastructure footprint. Future capital expenditures may vary based on investment opportunities and maintenance capital requirements.
Off-Balance Sheet Arrangements
As of December 31, 2024, there were $73.8 million in surety bonds outstanding related to various performance obligations. These are in place to support various performance obligations as required by (i) statutes within the regulatory jurisdictions where we operate and (ii) counterparty support. Obligations under these surety bonds are not normally called, as we typically comply with the underlying performance requirement.
We have invested in entities that are not consolidated in our financial statements. For information on our obligations with respect to these investments, as well as our obligations with respect to related letters of credit, see Note 7 – Investments in Unconsolidated Affiliates and Note 8 – Debt Obligations.
Contractual Obligations
We believe we have sufficient liquidity to fund our operations and meet our short-term and long-term cash obligations. The following is a summary of our material future contractual obligations:
| | | | | | | | | | |
Contractual Obligations: | | Total | | | Within 12 Months | |
| (in millions) | |
Long-term debt obligations (1) | | $ | | 13,664.9 | | | $ | | — | |
Interest on debt obligations (2) | | | | 7,031.9 | | | | | 758.3 | |
Operating leases (3) | | | | 134.1 | | | | | 22.2 | |
Finance leases (4) | | | | 335.3 | | | | | 70.3 | |
Land site lease and rights of way (5) | | | | 333.1 | | | | | 9.3 | |
Purchase obligations (6) | | | | 2,736.9 | | | | | 1,316.3 | |
Other long-term liabilities (7) | | | | 123.2 | | | | | 17.9 | |
Total | | $ | | 24,359.4 | | | $ | | 2,194.3 | |
(1)Represents scheduled future maturities of long-term debt obligation and excludes the Securitization Facility. See Note 8 - Debt Obligations for more information.
(2)Represents interest expense on long-term debt obligations based on both fixed debt interest rates and prevailing December 31, 2024 rates for floating debt. See Note 8 - Debt Obligations for more information.
(3)Includes minimum payments on operating lease obligations for compressors, office space and railcars. See Note 10 - Leases for more information.
(4)Includes minimum payments on finance lease obligations for compressors, substations, vehicles and tractors. See Note 10 - Leases for more information.
(5)Land site lease and rights of way provide for surface and underground access for gathering, processing and distribution assets that are located on property not owned by us. These agreements expire at various dates with varying terms, some of which are perpetual. See Note 16 - Commitments for more information.
(6)Includes commitments for pipeline capacity payments for firm transportation and throughput and deficiency agreements, purchase of natural gas and NGLs, capital expenditures, operating expenses and service contracts. Contracts that will be settled at future spot prices are valued using prices as of December 31, 2024.
(7)Includes long-term liabilities of which we are certain of the amount and timing, including certain arrangements that resulted in deferred revenue and other liabilities pertaining to accrued dividends. See Note 9 - Other Long-term Liabilities for more information.
Critical Accounting Policies and Estimates
The accounting policies and estimates discussed below are considered by management to be critical to an understanding of our financial statements because their application requires the most significant judgments from management in estimating matters for financial reporting that are inherently uncertain. See the description of our accounting policies in the notes to the financial statements for additional information about our critical accounting policies and estimates.
Business Acquisitions
For business acquisitions, we recognize the identifiable assets acquired, the liabilities assumed and any noncontrolling interest in the acquiree at their estimated fair values on the acquisition date. Goodwill results when the cost of a business acquisition exceeds the fair value of the net identifiable assets of the acquired business. Determining fair value requires management’s judgment and involves the use of significant estimates and assumptions with respect to projections of future production volumes, pricing and cash flows, benchmark analysis of comparable public companies, discount rates, expectations regarding customer contracts and relationships, and other management estimates. The judgments made in the determination of the estimated fair value assigned to the assets acquired, liabilities assumed and any noncontrolling interest in the investee, the duration of each liability, and any resulting goodwill can materially impact the financial statements in periods after acquisition. See Note 4 – Acquisitions and Divestitures in our Consolidated Financial Statements.
Depreciation of Property, Plant and Equipment and Amortization of Intangible Assets
Depreciation of our property, plant and equipment is computed using the straight-line method over the estimated useful lives of the assets. Our estimate of depreciation incorporates assumptions regarding the useful economic lives and residual values of our assets. The determination of useful lives of property, plant and equipment requires us to make various assumptions, including our expected use of the asset and the supply of and demand for hydrocarbons in the markets served, normal wear and tear of facilities, and the extent and frequency of maintenance programs.
We amortize the costs of our intangible assets in a manner that closely resembles the expected benefit pattern of the intangible assets or on a straight-line basis where such pattern is not readily determinable, over the periods in which we benefit from services provided to customers. At the time assets are placed in service or acquired, we believe such assumptions are reasonable; however, circumstances may develop that would cause us to change these assumptions, which would change our depreciation/amortization amounts prospectively.
Impairment of Long-Lived Assets, including Intangible Assets
We evaluate long-lived assets, including intangible assets, for impairment when events or changes in circumstances indicate our carrying amount of an asset may not be recoverable, including changes to our estimates that could have an impact on our assessment of asset recoverability. Asset recoverability is measured by comparing the carrying value of the asset or asset group with its expected future pre-tax undiscounted cash flows. Individual assets are grouped at the lowest level for which the related identifiable cash flows are largely independent of the cash flows of other assets and liabilities. These cash flow estimates require us to make judgments and assumptions related to operating and cash flow results, economic obsolescence, the business climate, contractual, legal and other factors.
If the carrying amount exceeds the expected future undiscounted cash flows, we recognize a non-cash pre-tax impairment charge equal to the excess of net book value over fair value. The estimated cash flows used to assess recoverability of our long-lived assets and measure fair value of our asset groups are derived from current business plans, which are developed using near-term price and volume projections reflective of the current environment and management's projections for long-term average prices and volumes. In addition to near and long-term price assumptions, other key assumptions include volume projections, operating costs, timing of incurring such costs and the use of an appropriate terminal value and discount rate. Any changes we make to these projections and assumptions could result in significant revisions to our evaluation of recoverability of our long-lived assets and the recognition of additional impairments.
Price Risk Management (Hedging)
Our net income and cash flows are subject to volatility stemming from changes in commodity prices and interest rates. In an effort to reduce the volatility of our cash flows, we have entered into derivative financial instruments to hedge the commodity price associated with a portion of our expected natural gas, NGL, and condensate equity volumes, future commodity purchases and sales, and transportation basis risk.
One of the factors that can affect our operating results each period is the price assumptions used to value our derivative financial instruments, which are reflected at their fair values on the balance sheet. We determine the fair value of our derivative instruments using
present value methods or standard option valuation models with assumptions about commodity prices based on those observed in underlying markets. Changes in the methods or assumptions we use to calculate the fair value of our derivative instruments could have a material effect on our consolidated financial statements.
Recent Accounting Pronouncements
For a discussion of recent accounting pronouncements that will affect us, see Note 3 – Significant Accounting Policies in our Consolidated Financial Statements.
Item 7A. Quantitative and Qualitative Disclosures About Market Risk
Our principal market risks are our exposure to changes in commodity prices, particularly to the prices of natural gas, NGLs and crude oil, changes in interest rates, as well as nonperformance by our risk management counterparties and customers.
Risk Management
We evaluate counterparty risks related to our commodity derivative contracts and trade credit. All of our commodity derivatives are with major financial institutions or major energy companies. Should any of these financial counterparties not perform, we may not realize the benefit of some of our hedges under lower commodity prices, which could have a material adverse effect on our results of operations. We sell our natural gas, NGLs and condensate to a variety of purchasers. Non-performance by a trade creditor could result in losses.
Crude oil, NGL and natural gas prices are volatile. In an effort to reduce the variability of our cash flows, we have entered into derivative instruments to hedge the commodity price associated with a portion of our expected natural gas, NGL and condensate equity volumes, future commodity purchases and sales, and transportation basis risk through 2028. Market conditions may also impact our ability to enter into future commodity derivative contracts.
Commodity Price Risk
A portion of our revenues are derived from percent-of-proceeds contracts under which we receive a portion of the proceeds from the sale of commodities as payment for services. The prices of natural gas, NGLs and crude oil are subject to fluctuations in response to changes in supply, demand, market uncertainty and a variety of additional factors beyond our control. We monitor these risks and enter into hedging transactions designed to mitigate the impact of commodity price fluctuations on our business. Cash flows from a derivative instrument designated as a hedge are classified in the same category as the cash flows from the item being hedged.
The primary purpose of our commodity risk management activities is to hedge some of the exposure to commodity price risk and reduce fluctuations in our operating cash flow due to fluctuations in commodity prices. In an effort to reduce the variability of our cash flows, as of December 31, 2024, we have hedged the commodity price associated with a portion of our expected (i) natural gas, NGL, and condensate equity volumes in our Gathering and Processing operations that result from our percent-of-proceeds processing arrangements, (ii) future commodity purchases and sales in our Logistics and Transportation segment and (iii) natural gas transportation basis risk in our Logistics and Transportation segment. We hedge a higher percentage of our expected equity volumes in the current year compared to future years, for which we hedge incrementally lower percentages of expected equity volumes. We also enter into commodity financial instruments to help manage other short-term commodity-related business risks of our ongoing operations and in conjunction with marketing opportunities available to us in the operations of our logistics and transportation assets. With swaps, we typically receive an agreed fixed price for a specified notional quantity of commodities and we pay the hedge counterparty a floating price for that same quantity based upon published index prices. Since we receive from our customers substantially the same floating index price from the sale of the underlying physical commodity, these transactions are designed to effectively lock-in the agreed fixed price in advance for the volumes hedged. In order to avoid having a greater volume hedged than our actual equity volumes, we typically limit our use of swaps to hedge the prices of less than our expected equity volumes. We utilize purchased puts (or floors) and calls (or caps) to hedge additional expected equity commodity volumes without creating volumetric risk. We may buy calls in connection with swap positions to create a price floor with upside. We intend to continue to manage our exposure to commodity prices in the future by entering into derivative transactions using swaps, collars, purchased puts (or floors), futures or other derivative instruments as market conditions permit.
When entering into new hedges, we intend to generally match the NGL product composition and the NGL and natural gas delivery points to those of our physical equity volumes. The NGL hedges cover specific NGL products based upon the expected equity NGL composition. We believe this strategy avoids uncorrelated risks resulting from employing hedges on crude oil or other petroleum products as “proxy” hedges of NGL prices. The fair values of our natural gas and NGL hedges are based on published index prices for
delivery at various locations, which closely approximate the actual natural gas and NGL delivery points. A portion of our condensate sales are hedged using crude oil hedges that are based on the NYMEX futures contracts for West Texas Intermediate light, sweet crude.
A majority of these commodity price hedges are documented pursuant to a ISDA with customized credit and legal terms. The principal counterparties (or, if applicable, their guarantors) have investment grade credit ratings. While we have no current obligation to post cash, letters of credit or other additional collateral to secure these hedges so long as we maintain our current credit rating, we could be obligated to post collateral to secure the hedges in the event of an adverse change in our creditworthiness where a counterparty’s exposure to our credit increases over the term of the hedge as a result of higher commodity prices. A purchased put (or floor) transaction does not expose our counterparties to credit risk, as we have no obligation to make future payments beyond the premium paid to enter into the transaction; however, we are exposed to the risk of default by the counterparty, which is the risk that the counterparty will not honor its obligation under the put transaction.
We also enter into commodity price hedging transactions using futures contracts on futures exchanges. Exchange traded futures are subject to exchange margin requirements, so we may have to increase our cash deposit due to a rise in natural gas, NGL or crude oil prices. Unlike bilateral hedges, we are not subject to counterparty credit risks when using futures on futures exchanges.
These contracts may expose us to the risk of financial loss in certain circumstances. Generally, our hedging arrangements provide us protection on the hedged volumes if prices decline below the prices at which these hedges are set. If prices rise above the prices at which they have been hedged, we will receive less revenue on the hedged volumes than we would receive in the absence of hedges (other than with respect to purchased calls).
To analyze the risk associated with our derivative instruments, we utilize a sensitivity analysis. The sensitivity analysis measures the change in fair value of our derivative instruments based on a hypothetical 10% change in the underlying commodity prices, but does not reflect the impact that the same hypothetical price movement would have on the related hedged items. The financial statement impact on the fair value of a derivative instrument resulting from a change in commodity price would normally be offset by a corresponding gain or loss on the hedged item under hedge accounting. The fair values of our derivative instruments are also influenced by changes in market volatility for option contracts and the discount rates used to determine the present values.
The following table shows the effect of hypothetical price movements on the estimated fair value of our derivative instruments as of December 31, 2024:
| | | | | | | | | | | |
| Fair Value | | | Result of 10% Price Decrease | | | Result of 10% Price Increase | |
| (In millions) | |
Natural gas | $ | (162.8 | ) | | $ | (105.6 | ) | | $ | (219.9 | ) |
NGLs | | (20.4 | ) | | | 33.1 | | | | (74.0 | ) |
Crude oil | | 11.0 | | | | 51.7 | | | | (29.7 | ) |
Total | $ | (172.2 | ) | | $ | (20.8 | ) | | $ | (323.6 | ) |
The table above contains all derivative instruments outstanding as of the stated date for the purpose of hedging commodity price risk, which we are exposed to due to our equity volumes and future commodity purchases and sales, as well as basis differentials related to our gas transportation arrangements.
During the years ended December 31, 2024 and 2023, our operating revenues increased (decreased) by $(245.4) million and $441.1 million as a result of transactions accounted for as derivatives. The estimated fair value of our risk management position has moved from a net asset position of $74.4 million at December 31, 2023 to a net liability position of $172.2 million at December 31, 2024. The net liability position on our derivative contracts is primarily attributable to unfavorable movement in natural gas forward basis prices.
Interest Rate Risk
We are exposed to the risk of changes in interest rates, primarily as a result of variable rate borrowings under the New TRGP Revolver, the Commercial Paper Program and the Securitization Facility. As of December 31, 2024, we do not have any interest rate hedges. However, we may enter into interest rate hedges in the future with the intent to mitigate the impact of changes in interest rates on cash flows. To the extent that interest rates increase, interest expense for the New TRGP Revolver, the Commercial Paper Program and the Securitization Facility will also increase. As of December 31, 2024, we had $1.5 billion in outstanding variable rate borrowings. A hypothetical change of 100 basis points in the rate of our variable interest rate debt would impact our consolidated annual interest expense by $14.6 million based on our December 31, 2024 debt balances.
Counterparty Credit Risk
We are subject to risk of losses resulting from nonpayment or nonperformance by our counterparties. The credit exposure related to commodity derivative instruments is represented by the fair value of the asset position (i.e. the fair value of expected future receipts) at the reporting date. Our futures contracts have limited credit risk since they are cleared through an exchange and are margined daily. Should the creditworthiness of one or more of the counterparties decline, our ability to mitigate nonperformance risk is limited to a counterparty agreeing to either a voluntary termination and subsequent cash settlement or a novation of the derivative contract to a third party. In the event of a counterparty default, we may sustain a loss and our cash receipts could be negatively impacted. We have master netting provisions in the ISDA agreements with our derivative counterparties. These netting provisions allow us to net settle asset and liability positions with the same counterparties within the same Targa entity, and would reduce our maximum loss due to counterparty credit risk by $13.4 million as of December 31, 2024. The range of losses attributable to our individual counterparties as of December 31, 2024 would be between $0.0 million and $3.8 million, depending on the counterparty in default.
Customer Credit Risk
We extend credit to customers and other parties in the normal course of business. We have established various procedures to manage our credit exposure, including performing initial and subsequent credit risk analyses, setting maximum credit limits and terms and requiring credit enhancements when necessary. We use credit enhancements including (but not limited to) letters of credit, prepayments, parental guarantees and rights of offset to limit credit risk to ensure that our established credit criteria are followed and financial loss is mitigated or minimized.
We have an active credit management process, which is focused on controlling loss exposure due to bankruptcies or other liquidity issues of counterparties. Our allowance for credit losses was $2.5 million as of both December 31, 2024 and 2023.
During the years ended December 31, 2024 and 2023, no customer comprised 10% or greater of our consolidated revenues.
Item 8. Financial Statements and Supplementary Data
Our “Consolidated Financial Statements,” together with the report of our independent registered public accounting firm, begin on page F-1 in this Annual Report.
Item 9. Changes in and Disagreements With Accountants on Accounting and Financial Disclosure
None.
Item 9A. Controls and Procedures
Evaluation of Disclosure Controls and Procedures
Management, with the participation of our Chief Executive Officer and President – Finance and Administration (Principal Financial Officer), has evaluated the design and effectiveness of our disclosure controls and procedures, as such term is defined in Rules 13a-15(e) and 15d-15(e) under the Securities Exchange Act of 1934, as amended (the “Exchange Act”) as of the end of the period covered in this Annual Report. Based on such evaluation, our Chief Executive Officer and President – Finance and Administration (Principal Financial Officer) have concluded that, as of December 31, 2024, our disclosure controls and procedures were effective to provide reasonable assurance that information required to be disclosed in our reports filed or submitted under the Exchange Act is (i) recorded, processed, summarized and reported within the time periods specified in the rules and forms of the SEC and (ii) accumulated and communicated to management, including our Chief Executive Officer and President – Finance and Administration (Principal Financial Officer), as appropriate, to allow for timely decisions regarding required disclosure.
Internal Control Over Financial Reporting
(a)Management’s Report on Internal Control Over Financial Reporting
Our Management’s Report on Internal Control Over Financial Reporting is included on page F-2 of this Annual Report and is incorporated herein by reference. Management concluded that our internal control over financial reporting was effective as of December 31, 2024.
(b)Changes in Internal Control Over Financial Reporting
There have been no changes in our internal control over financial reporting during the quarter ended December 31, 2024, that have materially affected, or are reasonably likely to materially affect, our internal control over financial reporting.
Item 9B. Other Information
As discussed elsewhere in this Annual Report, on February 18, 2025, we entered into the New TRGP Facility, the obligations under which are guaranteed by each of Targa Resources GP LLC, Targa Energy GP LLC, Targa Resources LLC, Targa Resources Partners LP, Targa Energy LP, Targa GP Inc., Targa LP Inc., and Targa Resources Finance Corporation. In connection with the concurrent termination of the Existing TRGP Facility, the guarantees of our subsidiary guarantors, other than those of the aforementioned guarantors of the New TRGP Facility, were each released with respect to TRGP’s senior unsecured notes, the Partnership’s unsecured notes and the Commercial Paper Program.
Certain of the lenders under the New TRGP Facility, or their respective affiliates, have performed investment banking, financial advisory and commercial banking services for us and certain of our affiliates, for which they have received customary compensation, and they may continue to do so in the future. Our affiliates have entered into derivative financial transactions with affiliates of Bank of America, N.A., and certain of the other lenders on terms it believes to be customary in connection with these transactions.
Rule 10b-5 Trading Plans
None.
Item 9C. Disclosure Regarding Foreign Jurisdictions that Prevent Inspections
None.
PART III
Item 10. Directors, Executive Officers and Corporate Governance
The Board of Directors of the Company and the executive officers of the Company are:
| | |
Name | Age (1) | Position |
Matthew J. Meloy | 46 | Chief Executive Officer and Director |
Patrick J. McDonie | 64 | President – Gathering and Processing |
D. Scott Pryor | 61 | President – Logistics and Transportation |
Jennifer R. Kneale | 46 | President – Finance and Administration |
Robert M. Muraro | 48 | Chief Commercial Officer |
William A. Byers | 48 | Chief Financial Officer |
Gerald R. Shrader | 65 | Executive Vice President, General Counsel and Secretary |
Julie H. Boushka | 61 | Senior Vice President and Chief Accounting Officer |
J. Christopher Eklof (2) | 55 | Vice President – Financial Controller |
Paul W. Chung | 64 | Chairman of the Board of Directors |
Joe Bob Perkins | 64 | Director |
Rene R. Joyce | 77 | Director |
Charles R. Crisp | 77 | Director |
Laura C. Fulton | 61 | Director |
Waters S. Davis, IV | 71 | Director |
Beth A. Bowman | 68 | Director |
Lindsey M. Cooksen | 42 | Director |
R. Keith Teague | 60 | Director |
Caron A. Lawhorn | 63 | Director |
__________________________
(1)Ages as of December 31, 2024.
(2)Mr. Eklof was not an executive officer of the Company as of December 31, 2024. Mr. Eklof is designated as Senior Vice President and Chief Accounting Officer of the Company effective March 1, 2025.
Matthew J. Meloy has served as Chief Executive Officer and a director of the Company since March 1, 2020. He also served as a director of Targa Resources GP LLC (the “General Partner”), the general partner of the Partnership between March 2020 and May 2021. Mr. Meloy has also served as Chief Executive Officer of the General Partner since March 2020. Mr. Meloy previously served as President of the Company and the General Partner between March 2018 and March 2020. Mr. Meloy also served as Executive Vice President and Chief Financial Officer of the Company and the General Partner between May 2015 and February 2018. He also served as Treasurer of the Company and the General Partner until December 2015. Mr. Meloy previously served as Senior Vice President, Chief Financial Officer and Treasurer of the Company between October 2010 and May 2015 and of the General Partner between December 2010 and May 2015. He also served as Vice President—Finance and Treasurer of the Company between April 2008 and October 2010, and as Director, Corporate Development of the Company between March 2006 and March 2008 and of the General Partner between March 2006 and March 2008. He served as Vice President—Finance and Treasurer of the General Partner between April 2008 and December 15, 2010. Mr. Meloy was with The Royal Bank of Scotland in the structured finance group, focusing on the energy sector from October 2003 to March 2006. Mr. Meloy’s extensive knowledge of the Company’s operational and strategic initiatives and capital investment program, attained from his service as President for two years and Chief Financial Officer for eight years, combined with his experience in the finance industry, brings operational, financial and capital markets experience to the Board.
Patrick J. McDonie has served as President—Gathering and Processing of the Company and the General Partner since March 2018. Mr. McDonie previously served as Executive Vice President—Southern Field Gathering and Processing of the Company and the General Partner between November 2015 and February 2018. He also served as President of Atlas Pipeline Partners GP LLC (“Atlas”), which was acquired by the Partnership in February 2015, between October 2013 and February 2015. He also served as Chief Operating Officer of Atlas between July 2012 and October 2013 and as Senior Vice President of Atlas between July 2012 and October 2013. He served as President of ONEOK Energy Services Company, a natural gas transportation, storage, supplier and marketing company between May 2008 and July 2012.
D. Scott Pryor has served as President—Logistics and Transportation of the Company and the General Partner, since March 2018. Mr. Pryor previously served as Executive Vice President—Logistics and Marketing of the Company and the General Partner between November 2015 and February 2018. He also served as Senior Vice President—NGL Logistics & Marketing of Targa Resources Operating LLC (“Targa Operating”) and various other subsidiaries of the Partnership between June 2014 and November 2015. He also served as Vice President of Targa Operating between July 2011 and May 2014 and has held officer positions with other Partnership subsidiaries since 2005.
Jennifer R. Kneale has served as President—Finance and Administration of the Company and the General Partner since July 2024. Ms. Kneale previously served as the Chief Financial Officer of the Company and the General Partner between March 2018 and July 2024. She also served as Treasurer of the Company between September 2022 and April 2023 and of the General Partner between August 2022 and April 2023. Ms. Kneale previously served as Vice President—Finance of the Company and the General Partner between December 2015 and February 2018. She also served as Senior Director, Finance of the Company and the General Partner between March 2015 and December 2015. She also served as Director, Finance of the Company and the General Partner between May 2013 and February 2015. Prior to that, Ms. Kneale spent more than eleven years in the financial services industry, primarily in roles in private equity, asset management and investment banking, most recently with Tudor, Pickering, Holt & Co. in its energy private equity group, TPH Partners.
Robert M. Muraro has served as Chief Commercial Officer of the Company and the General Partner since March 2018. Mr. Muraro previously served as Executive Vice President—Commercial of the Company and the General Partner between February 2017 and February 2018. He also served as Senior Vice President—Commercial and Business Development of Targa Midstream Services LLC (“Targa Midstream”) and various other subsidiaries of the Partnership between March 2016 and February 2017. He also served as Vice President—Commercial Development of Targa Midstream and various other subsidiaries of the Partnership between January 2013 and March 2016. He held the position of Director of Business Development between August 2004 and January 2013.
William A. Byers has served as the Chief Financial Officer of the Company and the General Partner since July 2024. Mr. Byers previously served as Chief Financial Officer at Manchester Energy, LLC between June 2022 and June 2024. He also served as Executive Vice President and Chief Financial Officer at Navitas Midstream Partners, LLC between August 2014 and February 2022. Prior to that, Mr. Byers worked in investment banking focused on the energy sector for 14 years and was most recently a Managing Director for Barclays.
Gerald R. Shrader has served as Executive Vice President, General Counsel and Secretary of the Company since December 2023. Prior to his appointment, Mr. Shrader served in various roles with subsidiaries of the Company beginning in March 2015, most recently serving as Senior Vice President, General Counsel - Southern Field G&P and Secretary of those subsidiaries. Prior to joining Targa, Mr. Shrader served as Chief Legal Officer and Secretary of Atlas Pipeline Partners GP, LLC from October 2009 until March 2015 and, prior to that time, served in various roles with affiliates of Atlas beginning in July 2007. Prior to Atlas, Mr. Shrader worked both for publicly traded energy companies and in private practice (including the provision of legal services to private and publicly traded energy companies).
Julie H. Boushka has served as Senior Vice President and Chief Accounting Officer of the Company and the General Partner since March 2019. Ms. Boushka previously served as Vice President—Controller of the Company, the General Partner and various subsidiaries of the Company between February 2017 and February 2019. She also served as Assistant Controller—Financial Accounting of the Company and the General Partner between November 2016 and February 2017. Ms. Boushka served as a Senior Vice President for Financial Planning and the Chief Risk Officer for Columbia Pipeline Group (“CPG”) between June 2015 and August 2016, where she was responsible for the financial planning function and managing enterprise risk. She also served as the Business Unit Chief Financial Officer of CPG between May 2013 and June 2015, where she was responsible for the accounting and financial planning functions. Prior to that, Ms. Boushka spent approximately 18 years in various roles at El Paso Corporation (and its predecessor, Tenneco, Inc.), including accounting, financial reporting and business development.
J. Christopher Eklof will serve as Senior Vice President and Chief Accounting Officer of the Company and the General Partner effective March 1, 2025. Mr. Eklof has served as Vice President – Financial Controller of the Company and the General Partner since May 2022 and for various subsidiaries of the Company since December 2021. Mr. Eklof previously served as Vice President - Operational Controller of the Company between May 2019 and May 2022 and for various subsidiaries of the Company between April 2019 and December 2021. He also served in various roles with the Company’s subsidiaries between July 2010 and April 2019, including leading the financial reporting and technical accounting functions. Prior to joining the Company, Mr. Eklof served as Vice President of Accounting for J.P. Morgan’s energy trading business from October 2007 to June 2010 and served in the audit practice of PricewaterhouseCoopers LLP for eight years. Mr. Eklof will replace Ms. Boushka as Senior Vice President and Chief Accounting Officer of the Company on the effective date of his appointment.
Paul W. Chung has served as a director and Chairman of the Board of the Company since January 1, 2021. Mr. Chung previously served as a director and Chairman of the Board of the General Partner between January 2021 and May 2021. From March 2020 until December 31, 2020, he served as Executive Vice President and Senior Legal Advisor of the Company. From May 2004 to March 2020, Mr. Chung served as Executive Vice President, General Counsel and Secretary of the Company and its predecessor entities and of the General Partner since its formation. From 1999 to May 2004, he served as Executive Vice President and General Counsel of various Shell Oil Company affiliates, including Coral Energy, LLC and Shell Trading North America Company. In these positions, Mr. Chung was responsible for all legal and regulatory affairs. From 1996 to 1999, he served as Vice President and Assistant General Counsel of Tejas Gas Corporation. Prior to 1996, Mr. Chung held a number of legal positions with different companies, including the law firm of Vinson & Elkins L.L.P. Mr. Chung’s knowledge of the Company, together with his background in the energy industry and his legal and
regulatory experience, enable Mr. Chung to provide a valuable and distinct perspective to the Board on a range of business and management matters.
Joe Bob Perkins has served as a director of the Company since January 2012. Mr. Perkins previously served as Executive Chairman of the Board of the Company and the General Partner between March 2020 and December 2020, as Chief Executive Officer of the Company and the General Partner between January 2012 and March 2020, and as a director of the General Partner between January 2012 and May 2021. He also served as President of the Company between the date of its formation in October 2005 and December 2011. Prior to 2005, Mr. Perkins served predecessor Targa companies as President since their founding in 2003. Prior to that, Mr. Perkins served in various leadership roles within the energy industry across several different companies, had employment experience with companies operating in both the midstream and upstream sectors, and was a management consultant with McKinsey & Company working primarily in energy. Mr. Perkins’ intimate knowledge of all facets of the Company, derived from his past services as Executive Chairman of the Board and as President and Chief Executive Officer, coupled with his broad experience in the energy industry, and specifically in the midstream sector, his engineering and business educational background, his experience with the investment community, and experiences on other boards enable Mr. Perkins to provide a valuable and unique perspective to the Board on a range of business and management matters.
Rene R. Joyce has served as a director of the Company since its formation in October 2005. Mr. Joyce previously served as Executive Chairman of the Board of the Company and the General Partner between January 2012 and December 2014 and as a director of the General Partner between October 2005 and May 2021. He also served as Chief Executive Officer of the Company between October 2005 and December 2011 and the General Partner between October 2006 and December 2011. He also served as an officer and director of an affiliate of the Company during 2004 and 2005 and was a consultant for the affiliate during 2003. Mr. Joyce served as a director of Apache Corporation between May 2017 and May 2021. Mr. Joyce served as a consultant in the energy industry from 2000 through 2003 providing advice to various energy companies and investors regarding their operations, acquisitions and dispositions. Mr. Joyce served as President of onshore pipeline operations of Coral Energy, LLC, a subsidiary of Shell from 1998 through 1999 and President of energy services of Coral, a subsidiary of Shell which was the gas and power marketing joint venture between Shell and Tejas, during 1999. Mr. Joyce served as President of various operating subsidiaries of Tejas, a natural gas pipeline company, from 1990 until 1998 when Tejas was acquired by Shell. As the founding Chief Executive Officer of the Company, Mr. Joyce brings deep experience in the midstream business, expansive knowledge of the oil and gas industry, as well as relationships with chief executives and other senior management at peer companies, customers and other oil and natural gas companies throughout the world. His experience and industry knowledge, complemented by an engineering and legal educational background, enable Mr. Joyce to provide the Board with executive counsel on the full range of business, technical, and professional matters.
Charles R. Crisp has served as a director of the Company since its formation in October 2005. He also served as a director of the General Partner between March 2016 and May 2021 and a director of an affiliate of the Company during 2004 and 2005. Mr. Crisp was President and Chief Executive Officer of Coral Energy, LLC, a subsidiary of Shell from 1999 until his retirement in November 2000, and was President and Chief Operating Officer of Coral from January 1998 through February 1999. Prior to this, Mr. Crisp served as President of the power generation group of Houston Industries, between 1996 and 1998, and as President and Chief Operating Officer of Tejas from 1988 to 1996. Mr. Crisp is a director of EOG Resources Inc. He was also a director of Intercontinental Exchange Inc. from 2002 until May 2022 and Southern Company Gas (formerly known as AGL Resources Inc.), a subsidiary of The Southern Company, from 2003 until April 2023. Mr. Crisp brings extensive energy experience, a vast understanding of many aspects of our industry and experience serving on the boards of other public companies in the energy industry. His leadership and business experience and deep knowledge of various sectors of the energy industry bring a crucial insight to the Board.
Laura C. Fulton has served as a director of the Company since February 2013. Ms. Fulton previously served as a director of the General Partner between February 2013 and May 2021. Ms. Fulton has served as the Senior Vice President and Chief Financial Officer of the American Bureau of Shipping since July 2021 and previously served as the Vice President of Finance from January 2020 until July 2021. Ms. Fulton served as the Chief Financial Officer of Hi-Crush Proppants LLC from April 2012 until December 2019 and Hi-Crush GP LLC, the general partner of Hi-Crush Partners LP, from May 2012 until May 2019 and its successor, Hi-Crush Inc., from May 2019 to December 2019. During July 2020, Hi-Crush Inc. and each of its direct and indirect wholly-owned domestic subsidiaries (including Hi-Crush Proppants LLC) (collectively, “Hi-Crush”) filed for protection under Chapter 11 of the Federal Bankruptcy Code. During October 2020, Hi-Crush’s Chapter 11 Plan of Reorganization was confirmed. From March 2008 to October 2011, Ms. Fulton served as Executive Vice President, Accounting and then Executive Vice President, Chief Financial Officer of AEI Services, LLC (“AEI”), an owner and operator of essential energy infrastructure assets in emerging markets. Prior to AEI, Ms. Fulton spent 12 years with Lyondell Chemical Company in various capacities, including as general auditor responsible for internal audit and the Sarbanes-Oxley certification process, and as the assistant controller. Prior to that, she spent 11 years with Deloitte & Touche in public accounting, with a focus on audit and assurance. As a chief financial officer, general auditor and external auditor, Ms. Fulton brings to the company extensive financial, accounting and compliance process experience. Ms. Fulton’s experience as a financial executive in the energy industry, including her positions with a publicly-traded company and master limited partnership, also brings industry and capital markets experience to the Board.
Waters S. Davis, IV has served as director of the Company since July 2015. Mr. Davis previously served as a director of the General Partner between March 2016 and May 2021 and as President of National Christian Foundation, Houston from July 2014 until December 2020. Mr. Davis was Executive Vice President of NuDevco LLC (“NuDevco”) from December 2009 to December 2013. Prior to his employment with NuDevco, he served as President of Reliant Energy Retail Services from June 1999 to January 2002 and as Executive Vice President of Spark Energy from April 2007 to November 2009. He previously served as a senior executive at several private companies and as an advisor to a private equity firm, providing operational and strategic guidance. Mr. Davis also serves as a director of Milacron Holdings Corp. Mr. Davis brings expertise in the retail energy, midstream and services industries, which enhances his contributions to the Board.
Beth A. Bowman has served as a director of the Company since September 2018. Ms. Bowman previously served as a director of the General Partner between September 2018 and May 2021. Ms. Bowman served as a director of Sprague Resources GP LLC, the general partner of Sprague Resources LP (“Sprague”), from October 2014 until November 2022. Ms. Bowman held management positions at Shell Energy North America (US) L.P. (“Shell Energy”) for 17 years until her retirement in September 2015. While at Shell Energy, she held the roles of Senior Vice President of the West and Mexico and later as the Senior Vice President of Sales and Origination for Shell’s North America business. Prior to joining Shell Energy, Ms. Bowman held management positions at Sempra Energy Trading and Sempra’s San Diego Gas & Electric utility in various areas including trading and marketing, risk management, fuel and power supply, regulatory, finance and engineering. Ms. Bowman also served on the board of the California Power Exchange and the board of the California Foundation of Energy and Environment from 2004 until 2015. Ms. Bowman’s extensive energy industry background, including her experience in origination, commodities markets and risk management enhances the knowledge of the Board in these areas of the oil and gas industry.
Lindsey M. Cooksen has served as a director of the Company since June 2020. Ms. Cooksen previously served as a director of the General Partner between June 2020 and May 2021. Ms. Cooksen has served as the founder and managing director of Cooksen Wealth, LLC, a wealth management firm, since April 2019. She previously held various positions with Morgan Stanley Private Wealth Management (“Morgan Stanley”) from August 2009 to April 2019. While at Morgan Stanley she held the roles of Private Wealth Advisor, Family Wealth Director and Portfolio Management Director. She also previously worked for Citigroup Global Investment Bank between July 2005 and August 2007. Ms. Cooksen’s extensive corporate experience in the financial services industry, including wealth management and portfolio construction, tax planning and analysis and risk mitigation brings financial experience and an investor’s perspective to the Board.
R. Keith Teague has served as a director of the Company since February 2024. Mr. Teague served as the Chief Operating Officer of Tellurian, Inc. and its predecessors from October 2016 to July 2022. Prior to joining Tellurian Investments LLC, Mr. Teague served in various leadership roles at Cheniere Energy Inc. (“Cheniere”), including Executive Vice President, Asset Group from February 2014 to September 2016, Senior Vice President – Asset Group from April 2008 to February 2014, Vice President – Pipeline Operations from May 2006 to April 2008, and Director of Facility Planning from February 2004 to May 2006. From December 2001 to September 2003, Mr. Teague served as the Director of Strategic Planning for the CMS Panhandle Companies. He began his career with Texas Eastern Transmission Corporation, where he managed pipeline operations and facility expansion projects. Mr. Teague previously served as a director on the Board of Cheniere Energy Partners, L.P., a publicly traded subsidiary partnership of Cheniere, from April 2008 to October 2016 and previously served on the Board of Directors for the Interstate Natural Gas Association of America (INGAA), and the Board and Executive Committee of the INGAA Foundation. Mr. Teague’s engineering and business educational background, his experience on a publicly traded partnership Board, and his extensive project execution experience provide the Board with valued perspective related to energy infrastructure development and operations.
Caron A. Lawhorn has served as a director of the Company since March 2024. Ms. Lawhorn served as Senior Vice President and Chief Financial Officer of ONE Gas, Inc. (NYSE: OGS) from March 2019 until her retirement in December 2023. Prior to that role, Ms. Lawhorn served at OGS as Senior Vice President, Commercial, responsible for the commercial activities of OGS’ three natural gas distribution utilities, as well as overseeing the company’s information technology and cybersecurity function, from OGS’ separation from ONEOK, Inc. (NYSE: OKE) into a standalone, publicly traded company in January 2014. Ms. Lawhorn served in the same role at OKE prior to the separation. Before that, she served as President of OKE’s natural gas distribution segment. From July 2009 until March 2011, she served as Senior Vice President, Corporate Planning and Development of OKE and ONEOK Partners, responsible for business development, strategic and long-range planning, and capital investment. Ms. Lawhorn became Senior Vice President and Chief Accounting Officer for OKE in 2007, adding responsibility for ONEOK Partners in 2008. Prior to that, she served as Senior Vice President of Financial Services and Treasurer of OKE. Ms. Lawhorn joined OKE in 1998, after serving as a Senior Manager at KPMG and Chief Financial Officer of Emergency Medical Services Authority in Tulsa. She also serves as a director of AAON, Inc. (NASDAQ: AAON), where she has chaired the audit committee since 2019. Ms. Lawhorn’s extensive background in various accounting, finance, operational and executive positions, including her experience as a financial executive of a publicly traded energy company, provides the Board with significant accounting and financial expertise. Additionally, Ms. Lawhorn’s previous experience in overseeing information technology and cybersecurity matters also provides the Board with valuable cybersecurity experience.
The information required in response to this item not otherwise provided herein will be set forth in our definitive proxy statement for the 2025 annual meeting of stockholders and is incorporated herein by reference.
Item 11. Executive Compensation
The information required in response to this item will be set forth in our definitive proxy statement for the 2025 annual meeting of stockholders and is incorporated herein by reference.
Item 12. Security Ownership of Certain Beneficial Owners and Management and Related Stockholder Matters
The information required in response to this item will be set forth in our definitive proxy statement for the 2025 annual meeting of stockholders and is incorporated herein by reference.
Item 13. Certain Relationships and Related Transactions, and Director Independence
The information required in response to this item will be set forth in our definitive proxy statement for the 2025 annual meeting of stockholders and is incorporated herein by reference.
Item 14. Principal Accounting Fees and Services
The information required in response to this item will be set forth in our definitive proxy statement for the 2025 annual meeting of stockholders and is incorporated herein by reference.
PART IV
Item 15. Exhibits, Financial Statement Schedules
(a)(1) Financial Statements
Our Consolidated Financial Statements are included under Part II, Item 8 of the Annual Report. For a listing of these statements and accompanying footnotes, see “Index to Consolidated Financial Statements” on Page F-1 in this Annual Report.
(a)(2) Financial Statement Schedules
All schedules have been omitted because they are either not applicable, not required or the information called for therein appears in the consolidated financial statements or notes thereto.
(a)(3) Exhibits
| | |
2.1 | | Purchase and Sale Agreement, dated as of June 16, 2022 by and among Lucid Energy Group II Holdings, LLC, Lasso Acquiror LLC and Lucid Energy Group II LLC (incorporated by reference to Exhibit 2.1 to Targa Resources Corp.’s Current Report on Form 8-K filed June 17, 2022 (File No. 001-34991)). |
|
|
|
3.1 |
| Amended and Restated Certificate of Incorporation of Targa Resources Corp. (incorporated by reference to Exhibit 3.1 to Targa Resources Corp.’s Current Report on Form 8-K filed December 16, 2010 (File No. 001-34991)). |
|
|
|
3.2 | | Certificate of Amendment to the Amended and Restated Certificate of Incorporation of Targa Resources Corp. (incorporated by reference to Exhibit 3.1 to Targa Resources Corp.’s Current Report on Form 8-K filed May 26, 2021 (File No. 001-34991)). |
| | |
3.3 |
| Certificate of Designations of Series A Preferred Stock of Targa Resources Corp., filed with the Secretary of State of the State of Delaware on March 16, 2016 (incorporated by reference to Exhibit 3.1 to Targa Resources Corp.’s Current Report on Form 8-K/A filed March 17, 2016 (File No. 001-34991)). |
|
|
|
3.4 |
| Third Amended and Restated Bylaws of Targa Resources Corp. (incorporated by reference to Exhibit 3.1 to Targa Resources Corp.’s Current Report on Form 8-K filed December 12, 2023 (File No. 001-34991)). |
|
|
|
4.1 |
| Specimen Common Stock Certificate (incorporated by reference to Exhibit 4.1 to Targa Resources Corp.’s Registration Statement on Form S-1/A filed November 12, 2010 (File No. 333-169277)). |
|
|
|
4.2 |
| Registration Rights Agreement, dated March 16, 2016, by and among Targa Resources Corp. and the purchasers named on Schedule A thereto (incorporated by reference to Exhibit 4.2 to Targa Resources Corp.’s Current Report on Form 8-K/A filed March 17, 2016 (File No. 001-34991)). |
|
|
|
4.3 |
| Amendment No. 1 to the Registration Rights Agreement dated March 16, 2016, dated September 13, 2016, among Targa Resources Corp. and Stonepeak Target Holdings, LP and Stonepeak Target Upper Holdings LLC (incorporated by reference to Exhibit 4.2 to Targa Resources Corp.’s Quarterly Report on Form 10-Q filed November 4, 2016 (File No. 001-34991)). |
|
|
|
4.4* | | Description of Securities Registered Under Section 12 of the Exchange Act. |
| | |
4.5 | | Parent Guarantee dated as of February 18, 2022, by and among Targa Resources Corp. and certain of its subsidiaries (incorporated by reference to Exhibit 4.1 to Targa Resources Corp.’s Current Report on Form 8-K filed February 23, 2022 (File No. 001-34991)). |
| | |
4.6 | | Indenture dated as of October 17, 2017 among the Issuers and the Guarantors and U.S. Bank National Association, as trustee (incorporated by reference to Exhibit 4.1 to Targa Resources Partners LP’s Current Report on Form 8-K filed October 17, 2017 (File No. 001-33303)). |
| | |
4.7 | | Supplemental Indenture dated December 18, 2017 to Indenture dated October 17, 2017, among the Guaranteeing Subsidiary, Targa Resources Partners LP, Targa Resources Partners Finance Corporation, the other Subsidiary Guarantors and U.S. Bank National Association (incorporated by reference to Exhibit 10.66 to Targa Resources Corp.’s Annual Report on Form 10-K filed February 16, 2018 (File No. 001-34991)). |
| | |
| | |
4.8 | | Supplemental Indenture dated January 9, 2018 to Indenture dated October 17, 2017, among the Guaranteeing Subsidiary, Targa Resources Partners LP, Targa Resources Partners Finance Corporation, the other Subsidiary Guarantors and U.S. Bank National Association (incorporated by reference to Exhibit 10.67 to Targa Resources Corp.’s Annual Report on Form 10-K filed February 16, 2018 (File No. 001-34991)). |
| | |
4.9 | | Supplemental Indenture dated July 24, 2018 to Indenture dated October 17, 2017, among the Guaranteeing Subsidiary, Targa Resources Partners LP, Targa Resources Partners Finance Corporation, the other Subsidiary Guarantors and U.S. Bank National Association (incorporated by reference to Exhibit 10.9 to Targa Resources Corp.’s Quarterly Report on Form 10-Q filed August 9, 2018 (File No. 001-34991)). |
| | |
4.10 | | Supplemental Indenture dated July 19, 2019 to Indenture dated October 17, 2017, among the Guaranteeing Subsidiary, Targa Resources Partners LP, Targa Resources Partners Finance Corporation, the other Subsidiary Guarantors and U.S. Bank National Association (incorporated by reference to Exhibit 10.6 to Targa Resources Corp.’s Quarterly Report on Form 10-Q filed August 9, 2019 (File No. 001-34991)). |
| | |
4.11 | | Supplemental Indenture dated February 20, 2020 to Indenture dated October 17, 2017, among the Guaranteeing Subsidiary, Targa Resources Partners LP, Targa Resources Partners Finance Corporation, the other Subsidiary Guarantors and U.S. Bank National Association (incorporated by reference to Exhibit 10.5 to Targa Resources Corp.’s Quarterly Report on Form 10-Q filed May 7, 2020 (File No. 001-34991)). |
| | |
4.12 | | Supplemental Indenture dated September 17, 2020 to Indenture dated October 17, 2017, among the Guaranteeing Subsidiary, Targa Resources Partners LP, Targa Resources Partners Finance Corporation, the other Subsidiary Guarantors and U.S. Bank National Association (incorporated by reference to Exhibit 10.6 to Targa Resources Corp.’s Quarterly Report on Form 10-Q filed November 5, 2020 (File No. 001-34991)). |
| | |
4.13 | | Supplemental Indenture dated September 17, 2021 to Indenture dated October 17, 2017, among the Guaranteeing Subsidiary, Targa Resources Partners LP, Targa Resources Partners Finance Corporation, the other Subsidiary Guarantors and U.S. Bank National Association (incorporated by reference to Exhibit 10.2 to Targa Resources Corp.’s Quarterly Report on Form 10-Q filed November 4, 2021 (File No. 001-34991)). |
| | |
4.14 | | Supplemental Indenture dated November 30, 2021 to Indenture dated October 17, 2017, among the Guaranteeing Subsidiary, Targa Resources Partners LP, Targa Resources Partners Finance Corporation, the other Subsidiary Guarantors and U.S. Bank National Association (incorporated by reference to Exhibit 10.42 to Targa Resources Corp.’s Annual Report on Form 10-K filed February 24, 2022 (File No. 001-34991)). |
| | |
4.15 | | Supplemental Indenture dated January 28, 2022 to Indenture dated October 17, 2017, among the Guaranteeing Subsidiary, Targa Resources Partners LP, Targa Resources Partners Finance Corporation, the other Subsidiary Guarantors and U.S. Bank National Association (incorporated by reference to Exhibit 10.43 to Targa Resources Corp.’s Annual Report on Form 10-K filed February 24, 2022 (File No. 001-34991)). |
| | |
4.16 | | Supplemental Indenture dated June 17, 2022 to Indenture dated October 17, 2017 among the Guaranteeing Subsidiary, Targa Resources Partners LP, Targa Resources Partners Finance Corporation, the other Subsidiary Guarantors and U.S. Bank National Association (incorporated by reference to Exhibit 10.1 to Targa Resources Corp.’s Quarterly Report on Form 10-Q filed August 4, 2022 (File No. 001-34991)). |
| | |
4.17 | | Supplemental Indenture dated August 2, 2022 to Indenture dated October 17, 2017 among the Guaranteeing Subsidiary, Targa Resources Partners LP, Targa Resources Partners Finance Corporation, the other Subsidiary Guarantors and U.S. Bank National Association (incorporated by reference to Exhibit 10.1 to Targa Resources Corp.’s Quarterly Report on Form 10-Q filed November 3, 2022 (File No. 001-34991)). |
| | |
4.18 | | Supplemental Indenture dated April 12, 2023 to Indenture dated October 17, 2017 among the Guaranteeing Subsidiary, Targa Resources Partners LP, Targa Resources Partners Finance Corporation, the other Subsidiary Guarantors and U.S. Bank National Association (incorporated by reference to Exhibit 4.5 to Targa Resources Corp.’s Quarterly Report on Form 10-Q filed May 4, 2023 (File No. 001-34991)). |
| | |
4.19 | | Supplemental Indenture dated June 27, 2024 to Indenture dated October 17, 2017 among the Guaranteeing Subsidiary, Targa Resources Partners LP, Targa Resources Partners Finance Corporation, the other Subsidiary Guarantors and U.S. Bank National Association (incorporated by reference to Exhibit 4.3 to Targa Resources Corp.’s Quarterly Report on Form 10-Q filed August 1, 2024 (File No. 001-34991)). |
| | |
4.20 | | Indenture dated as of January 17, 2019 among the Issuers, the Guarantors and U.S. Bank National Association, as trustee (incorporated by reference to Exhibit 4.1 to Targa Resources Partners LP’s Current Report on Form 8-K filed January 23, 2019 (File No. 001-33303)). |
| | |
| | |
4.21 | | Supplemental Indenture dated July 19, 2019 to Indenture dated January 17, 2019, among the Guaranteeing Subsidiary, Targa Resources Partners LP, Targa Resources Partners Finance Corporation, the other Subsidiary Guarantors and U.S. Bank National Association (incorporated by reference to Exhibit 10.8 to Targa Resources Corp.’s Quarterly Report on Form 10-Q filed August 9, 2019 (File No. 001-34991)). |
| | |
4.22 | | Supplemental Indenture dated February 20, 2020 to Indenture dated January 17, 2019, among the Guaranteeing Subsidiary, Targa Resources Partners LP, Targa Resources Partners Finance Corporation, the other Subsidiary Guarantors and U.S. Bank National Association (incorporated by reference to Exhibit 10.7 to Targa Resources Corp.’s Quarterly Report on Form 10-Q filed May 7, 2020 (File No. 001-34991)). |
| | |
4.23 | | Supplemental Indenture dated September 17, 2020 to Indenture dated January 17, 2019, among the Guaranteeing Subsidiary, Targa Resources Partners LP, Targa Resources Partners Finance Corporation, the other Subsidiary Guarantors and U.S. Bank National Association (incorporated by reference to Exhibit 10.8 to Targa Resources Corp.’s Quarterly Report on Form 10-Q filed November 5, 2020 (File No. 001-34991)). |
| | |
4.24 | | Supplemental Indenture dated September 17, 2021 to Indenture dated January 17, 2019, among the Guaranteeing Subsidiary, Targa Resources Partners LP, Targa Resources Partners Finance Corporation, the other Subsidiary Guarantors and U.S. Bank National Association (incorporated by reference to Exhibit 10.4 to Targa Resources Corp.’s Quarterly Report on Form 10-Q filed November 4, 2021 (File No. 001-34991)). |
| | |
4.25 | | Supplemental Indenture dated November 30, 2021 to Indenture dated January 17, 2019, among the Guaranteeing Subsidiary, Targa Resources Partners LP, Targa Resources Partners Finance Corporation, the other Subsidiary Guarantors and U.S. Bank National Association (incorporated by reference to Exhibit 10.60 to Targa Resources Corp.’s Annual Report on Form 10-K filed February 24, 2022 (File No. 001-34991)). |
| | |
4.26 | | Supplemental Indenture dated January 28, 2022 to Indenture dated January 17, 2019, among the Guaranteeing Subsidiary, Targa Resources Partners LP, Targa Resources Partners Finance Corporation, the other Subsidiary Guarantors and U.S. Bank National Association (incorporated by reference to Exhibit 10.61 to Targa Resources Corp.’s Annual Report on Form 10-K filed February 24, 2022 (File No. 001-34991)). |
| | |
4.27 | | Supplemental Indenture dated June 17, 2022 to Indenture dated January 17, 2019 among the Guaranteeing Subsidiary, Targa Resources Partners LP, Targa Resources Partners Finance Corporation, the other Subsidiary Guarantors and U.S. Bank National Association (incorporated by reference to Exhibit 10.2 to Targa Resources Corp.’s Quarterly Report on Form 10-Q filed August 4, 2022 (File No. 001-34991)). |
| | |
4.28 | | Supplemental Indenture dated August 2, 2022 to Indenture dated January 17, 2019 among the Guaranteeing Subsidiary, Targa Resources Partners LP, Targa Resources Partners Finance Corporation, the other Subsidiary Guarantors and U.S. Bank National Association (incorporated by reference to Exhibit 10.2 to Targa Resources Corp.’s Quarterly Report on Form 10-Q filed November 3, 2022 (File No. 001-34991)). |
| | |
4.29 | | Supplemental Indenture dated April 12, 2023 to Indenture dated January 17, 2019 among the Guaranteeing Subsidiary, Targa Resources Partners LP, Targa Resources Partners Finance Corporation, the other Subsidiary Guarantors and U.S. Bank National Association (incorporated by reference to Exhibit 4.6 to Targa Resources Corp.’s Quarterly Report on Form 10-Q filed May 4, 2023 (File No. 001-34991)). |
| | |
4.30 | | Supplemental Indenture dated June 27, 2024 to Indenture dated January 17, 2019 among the Guaranteeing Subsidiary, Targa Resources Partners LP, Targa Resources Partners Finance Corporation, the other Subsidiary Guarantors and U.S. Bank National Association (incorporated by reference to Exhibit 4.4 to Targa Resources Corp.’s Quarterly Report on Form 10-Q filed August 1, 2024 (File No. 001-34991)). |
| | |
4.31 | | Indenture dated as of November 27, 2019 among the Issuers, the Guarantors and U.S. Bank National Association, as trustee (incorporated by reference to Exhibit 4.1 to Targa Resources Partners LP’s Current Report on Form 8-K filed December 3, 2019 (File No. 001-33303)). |
| | |
4.32 | | Supplemental Indenture dated February 20, 2020 to Indenture dated November 27, 2019, among the Guaranteeing Subsidiary, Targa Resources Partners LP, Targa Resources Partners Finance Corporation, the other Subsidiary Guarantors and U.S. Bank National Association (incorporated by reference to Exhibit 10.8 to Targa Resources Corp.’s Quarterly Report on Form 10-Q filed May 7, 2020 (File No. 001-34991)). |
| | |
4.33 | | Supplemental Indenture dated September 17, 2020 to Indenture dated November 27, 2019, among the Guaranteeing Subsidiary, Targa Resources Partners LP, Targa Resources Partners Finance Corporation, the other Subsidiary Guarantors and U.S. Bank National Association (incorporated by reference to Exhibit 10.9 to Targa Resources Corp.’s Quarterly Report on Form 10-Q filed November 5, 2020 (File No. 001-34991)). |
| | |
| | |
4.34 | | Supplemental Indenture dated September 17, 2021 to Indenture dated November 27, 2019, among the Guaranteeing Subsidiary, Targa Resources Partners LP, Targa Resources Partners Finance Corporation, the other Subsidiary Guarantors and U.S. Bank National Association (incorporated by reference to Exhibit 10.5 to Targa Resources Corp.’s Quarterly Report on Form 10-Q filed November 4, 2021 (File No. 001-34991)). |
| | |
4.35 | | Supplemental Indenture dated November 30, 2021 to Indenture dated November 27, 2019, among the Guaranteeing Subsidiary, Targa Resources Partners LP, Targa Resources Partners Finance Corporation, the other Subsidiary Guarantors and U.S. Bank National Association (incorporated by reference to Exhibit 10.67 to Targa Resources Corp.’s Annual Report on Form 10-K filed February 24, 2022 (File No. 001-34991)). |
| | |
4.36 | | Supplemental Indenture dated January 28, 2022 to Indenture dated November 27, 2019, among the Guaranteeing Subsidiary, Targa Resources Partners LP, Targa Resources Partners Finance Corporation, the other Subsidiary Guarantors and U.S. Bank National Association (incorporated by reference to Exhibit 10.68 to Targa Resources Corp.’s Annual Report on Form 10-K filed February 24, 2022 (File No. 001-34991)). |
| | |
4.37 | | Supplemental Indenture dated June 17, 2022 to Indenture dated November 27, 2019 among the Guaranteeing Subsidiary, Targa Resources Partners LP, Targa Resources Partners Finance Corporation, the other Subsidiary Guarantors and U.S. Bank National Association (incorporated by reference to Exhibit 10.3 to Targa Resources Corp.’s Quarterly Report on Form 10-Q filed August 4, 2022 (File No. 001-34991)). |
| | |
4.38 | | Supplemental Indenture dated August 2, 2022 to Indenture dated November 27, 2019 among the Guaranteeing Subsidiary, Targa Resources Partners LP, Targa Resources Partners Finance Corporation, the other Subsidiary Guarantors and U.S. Bank National Association (incorporated by reference to Exhibit 10.3 to Targa Resources Corp.’s Quarterly Report on Form 10-Q filed November 3, 2022 (File No. 001-34991)). |
| | |
4.39 | | Supplemental Indenture dated April 12, 2023 to Indenture dated November 27, 2019 among the Guaranteeing Subsidiary, Targa Resources Partners LP, Targa Resources Partners Finance Corporation, the other Subsidiary Guarantors and U.S. Bank National Association (incorporated by reference to Exhibit 4.7 to Targa Resources Corp.’s Quarterly Report on Form 10-Q filed May 4, 2023 (File No. 001-34991)). |
| | |
4.40 | | Supplemental Indenture dated June 27, 2024 to Indenture dated November 27, 2019 among the Guaranteeing Subsidiary, Targa Resources Partners LP, Targa Resources Partners Finance Corporation, the other Subsidiary Guarantors and U.S. Bank National Association (incorporated by reference to Exhibit 4.5 to Targa Resources Corp.’s Quarterly Report on Form 10-Q filed August 1, 2024 (File No. 001-34991)). |
| | |
4.41 | | Indenture dated as of August 18, 2020 among the Issuers, the Guarantors and U.S. Bank National Association, as trustee (incorporated by reference to Exhibit 4.1 to Targa Resources Partners LP’s Current Report on Form 8-K filed August 21, 2020 (File No. 001-33303)). |
| | |
4.42 | | Supplemental Indenture dated September 17, 2020 to Indenture dated August 18, 2020, among the Guaranteeing Subsidiary, Targa Resources Partners LP, Targa Resources Partners Finance Corporation, the other Subsidiary Guarantors and U.S. Bank National Association (incorporated by reference to Exhibit 10.10 to Targa Resources Corp.’s Quarterly Report on Form 10-Q filed November 5, 2020 (File No. 001-34991)). |
| | |
4.43 | | Supplemental Indenture dated September 17, 2021 to Indenture dated August 18, 2020, among the Guaranteeing Subsidiary, Targa Resources Partners LP, Targa Resources Partners Finance Corporation, the other Subsidiary Guarantors and U.S. Bank National Association (incorporated by reference to Exhibit 10.6 to Targa Resources Corp.’s Quarterly Report on Form 10-Q filed November 4, 2021 (File No. 001-34991)). |
| | |
4.44 | | Supplemental Indenture dated November 30, 2021 to Indenture dated August 18, 2020, among the Guaranteeing Subsidiary, Targa Resources Partners LP, Targa Resources Partners Finance Corporation, the other Subsidiary Guarantors and U.S. Bank National Association (incorporated by reference to Exhibit 10.73 to Targa Resources Corp.’s Annual Report on Form 10-K filed February 24, 2022 (File No. 001-34991)). |
| | |
4.45 | | Supplemental Indenture dated January 28, 2022 to Indenture dated August 18, 2020, among the Guaranteeing Subsidiary, Targa Resources Partners LP, Targa Resources Partners Finance Corporation, the other Subsidiary Guarantors and U.S. Bank National Association (incorporated by reference to Exhibit 10.74 to Targa Resources Corp.’s Annual Report on Form 10-K filed February 24, 2022 (File No. 001-34991)). |
| | |
4.46 | | Supplemental Indenture dated June 17, 2022 to Indenture dated August 18, 2020 among the Guaranteeing Subsidiary, Targa Resources Partners LP, Targa Resources Partners Finance Corporation, the other Subsidiary Guarantors and U.S. Bank National Association (incorporated by reference to Exhibit 10.4 to Targa Resources Corp.’s Quarterly Report on Form 10-Q filed August 4, 2022 (File No. 001-34991)). |
| | |
| | |
4.47 | | Supplemental Indenture dated August 2, 2022 to Indenture dated August 18, 2020 among the Guaranteeing Subsidiary, Targa Resources Partners LP, Targa Resources Partners Finance Corporation, the other Subsidiary Guarantors and U.S. Bank National Association (incorporated by reference to Exhibit 10.4 to Targa Resources Corp.’s Quarterly Report on Form 10-Q filed November 3, 2022 (File No. 001-34991)). |
| | |
4.48 | | Supplemental Indenture dated April 12, 2023 to Indenture dated August 18, 2020 among the Guaranteeing Subsidiary, Targa Resources Partners LP, Targa Resources Partners Finance Corporation, the other Subsidiary Guarantors and U.S. Bank National Association (incorporated by reference to Exhibit 4.8 to Targa Resources Corp.’s Quarterly Report on Form 10-Q filed May 4, 2023 (File No. 001-34991)). |
| | |
4.49 | | Supplemental Indenture dated June 27, 2024 to Indenture dated August 18, 2020 among the Guaranteeing Subsidiary, Targa Resources Partners LP, Targa Resources Partners Finance Corporation, the other Subsidiary Guarantors and U.S. Bank National Association (incorporated by reference to Exhibit 4.6 to Targa Resources Corp.’s Quarterly Report on Form 10-Q filed August 1, 2024 (File No. 001-34991)). |
| | |
4.50 | | Indenture dated as of February 2, 2021 among the Issuers, the Guarantors and U.S. Bank National Association, as trustee (incorporated by reference to Exhibit 4.1 to Targa Resources Partners LP’s Current Report on Form 8-K filed February 5, 2021 (File No. 001-33303)). |
| | |
4.51 | | Supplemental Indenture dated September 17, 2021 to Indenture dated February 2, 2021 among the Guaranteeing Subsidiary, Targa Resources Partners LP, Targa Resources Partners Finance Corporation, the other Subsidiary Guarantors and U.S. Bank National Association (incorporated by reference to Exhibit 10.7 to Targa Resources Corp.’s Quarterly Report on Form 10-Q filed November 4, 2021 (File No. 001-34991)). |
| | |
4.52 | | Supplemental Indenture dated November 30, 2021 to Indenture dated February 2, 2021, among the Guaranteeing Subsidiary, Targa Resources Partners LP, Targa Resources Partners Finance Corporation, the other Subsidiary Guarantors and U.S. Bank National Association (incorporated by reference to Exhibit 10.79 to Targa Resources Corp.’s Annual Report on Form 10-K filed February 24, 2022 (File No. 001-34991)). |
| | |
4.53 | | Supplemental Indenture dated January 28, 2022 to Indenture dated February 2, 2021, among the Guaranteeing Subsidiary, Targa Resources Partners LP, Targa Resources Partners Finance Corporation, the other Subsidiary Guarantors and U.S. Bank National Association (incorporated by reference to Exhibit 10.80 to Targa Resources Corp.’s Annual Report on Form 10-K filed February 24, 2022 (File No. 001-34991)). |
| | |
4.54 | | Supplemental Indenture dated June 17, 2022 to Indenture dated February 2, 2021 among the Guaranteeing Subsidiary, Targa Resources Partners LP, Targa Resources Partners Finance Corporation, the other Subsidiary Guarantors and U.S. Bank National Association (incorporated by reference to Exhibit 10.5 to Targa Resources Corp.’s Quarterly Report on Form 10-Q filed August 4, 2022 (File No. 001-34991)). |
| | |
4.55 | | Supplemental Indenture dated August 2, 2022 to Indenture dated February 2, 2021 among the Guaranteeing Subsidiary, Targa Resources Partners LP, Targa Resources Partners Finance Corporation, the other Subsidiary Guarantors and U.S. Bank National Association (incorporated by reference to Exhibit 10.5 to Targa Resources Corp.’s Quarterly Report on Form 10-Q filed November 3, 2022 (File No. 001-34991)). |
| | |
4.56 | | Supplemental Indenture dated April 12, 2023 to Indenture dated February 2, 2021 among the Guaranteeing Subsidiary, Targa Resources Partners LP, Targa Resources Partners Finance Corporation, the other Subsidiary Guarantors and U.S. Bank National Association (incorporated by reference to Exhibit 4.9 to Targa Resources Corp.’s Quarterly Report on Form 10-Q filed May 4, 2023 (File No. 001-34991)). |
| | |
4.57 | | Supplemental Indenture dated June 27, 2024 to Indenture dated February 2, 2021 among the Guaranteeing Subsidiary, Targa Resources Partners LP, Targa Resources Partners Finance Corporation, the other Subsidiary Guarantors and U.S. Bank National Association (incorporated by reference to Exhibit 4.7 to Targa Resources Corp.’s Quarterly Report on Form 10-Q filed August 1, 2024 (File No. 001-34991)). |
| | |
4.58 | | Indenture, dated as of April 6, 2022, among Targa Resources Corp., as issuer, the guarantors named therein and U.S. Bank Trust Company, National Association, as trustee (incorporated by reference to Exhibit 4.1 to Targa Resources Corp.’s Current Report on Form 8-K filed April 6, 2022 (File No. 001-34991)). |
| | |
4.59 | | First Supplemental Indenture, dated as of April 6, 2022, among Targa Resources Corp., as issuer, the guarantors named therein and U.S. Bank Trust Company, National Association, as trustee (incorporated by reference to Exhibit 4.2 to Targa Resources Corp.’s Current Report on Form 8-K filed April 6, 2022 (File No. 001-34991)). |
| | |
4.60 | | Form of Notes (included in Exhibit 4.59 hereto) (incorporated by reference to Exhibit 4.3 to Targa Resources Corp.’s Current Report on Form 8-K filed April 6, 2022 (File No. 001-34991)). |
| | |
| | |
4.61 | | Second Supplemental Indenture dated as of June 22, 2022, among Targa Resources Corp., as issuer, the guarantors named therein and U.S. Bank Trust Company, National Association, as trustee (incorporated by reference to Exhibit 4.9 to Targa Resources Corp.’s Post-Effective Amendment No. 1 to Form S-3 filed June 22, 2022 (Registration No. 333-263730)). |
| | |
4.62 | | Third Supplemental Indenture, dated as of July 7, 2022, among Targa Resources Corp., as issuer, the guarantors named therein and U.S. Bank Trust Company, National Association, as trustee (incorporated by reference to Exhibit 4.2 to Targa Resources Corp.’s Current Report on Form 8-K filed July 7, 2022 (File No. 001-34991)). |
| | |
4.63 | | Form of Notes (included in Exhibit 4.62 hereto) (incorporated by reference to Exhibit 4.3 to Targa Resources Corp.’s Current Report on Form 8-K filed July 7, 2022 (File No. 001-34991)). |
| | |
4.64 | | Fourth Supplemental Indenture dated as of August 2, 2022, among Targa Resources Corp., as issuer, the guarantors named therein and U.S. Bank Trust Company, National Association, as trustee (incorporated by reference to Exhibit 10.6 to Targa Resources Corp.’s Quarterly Report on Form 10-Q filed November 3, 2022 (File No. 001-34991)). |
| | |
4.65 | | Fifth Supplemental Indenture, dated as of January 9, 2023, among Targa Resources Corp., as issuer, the guarantors named therein and U.S. Bank Trust Company, National Association, as trustee (incorporated by reference to Exhibit 4.2 to Targa Resources Corp.’s Current Report on Form 8-K filed January 9, 2023 (File No. 001-34991)). |
| | |
4.66 | | Form of Notes (included in Exhibit 4.65 hereto) (incorporated by reference to Exhibit 4.3 to Targa Resources Corp.’s Current Report on Form 8-K filed January 9, 2023 (File No. 001-34991)). |
| | |
4.67 | | Sixth Supplemental Indenture, dated as of April 12, 2023, among Targa Resources Corp., as issuer, the guarantors named therein and U.S. Bank Trust Company, National Association, as trustee (incorporated by reference to Exhibit 4.4 to Targa Resources Corp.’s Quarterly Report on Form 10-Q filed May 4, 2023 (File No. 001-34991)). |
| | |
4.68 | | Seventh Supplemental Indenture, dated as of November 9, 2023, among Targa Resources Corp., as issuer, the guarantors named therein and U.S. Bank Trust Company, National Association, as trustee (incorporated by reference to Exhibit 4.2 to Targa Resources Corp.’s Current Report on Form 8-K filed November 9, 2023 (File No. 001-34991)). |
| | |
4.69 | | Form of Notes (included in Exhibit 4.68 hereto) (incorporated by reference to Exhibit 4.3 to Targa Resources Corp.’s Current Report on Form 8-K filed November 9, 2023 (File No. 001-34991)). |
| | |
4.70 | | Eighth Supplemental Indenture, dated as of June 27, 2024, among Targa Resources Corp., as issuer, the guarantors named therein and U.S. Bank Trust Company, National Association, as trustee (incorporated by reference to Exhibit 4.11 to Targa Resource Corp.’s Post-Effective Amendment No. 3 to Form S-3 filed July 26, 2024). |
| | |
4.71 | | Ninth Supplemental Indenture, dated as of August 9, 2024, among Targa Resources Corp., as issuer, the guarantors named therein and U.S. Bank Trust Company, National Association, as trustee (incorporated by reference to Exhibit 4.2 to Targa Resource Corp.’s Current Report on Form 8-K filed August 9, 2024 (File No. 001-34991)). |
| | |
4.72 | | Form of Notes (included in Exhibit 4.71 hereto) (incorporated by reference to Exhibit 4.3 to Targa Resources Corp.’s Current Report on Form 8-K filed August 9, 2024 (File No. 001-34991)). |
| | |
10.1* | | Credit Agreement dated as of February 18, 2025, by and among Targa Resources Corp., Bank of America, N.A., and the other parties signatory thereto. |
| | |
10.2+ |
| Second Amended and Restated Targa Resources Corp. 2010 Stock Incentive Plan, as amended and restated effective August 1, 2023 (incorporated by reference to Exhibit 10.1 to Targa Resources Corp.’s Quarterly Report on Form 10-Q filed August 3, 2023 (File No. 001-34991)). |
| | |
10.3+ |
| Form of Restricted Stock Agreement for Directors, dated as of January 17, 2018 (incorporated by reference to Exhibit 10.13 to Targa Resources Corp.’s Annual Report on Form 10-K filed February 16, 2018 (File No. 001-34991)). |
| |
|
10.4+ |
| Form of Restricted Stock Agreement under Targa Resources Corp. 2010 Stock Incentive Plan (incorporated by reference to Exhibit 10.3 to Targa Resources Corp.’s Quarterly Report on Form 10-Q filed May 10, 2016 (File No. 001-34991)). |
| | |
10.5+ | | Form of Performance Share Unit Grant Agreement, dated as of January 20, 2022 under Targa Resources Corp. 2010 Stock Incentive Plan (incorporated by reference to Exhibit 10.12 to Targa Resources Corp.’s Annual Report on Form 10-K filed February 24, 2022 (File No. 001-34991)). |
| | |
10.6+* | | Form of Performance Share Unit Grant Agreement, dated as of January 16, 2025 under Targa Resources Corp. 2010 Stock Incentive Plan. |
| | |
| | |
10.7+ | | Omnibus Amendment to Restricted Stock Unit Grant Agreements, dated March 29, 2023 (incorporated by reference to Exhibit 10.1 to Targa Resources Corp.’s Quarterly Report on Form 10-Q filed May 4, 2023 (File No. 001-34991)). |
| | |
10.8+ | | Form of Restricted Stock Unit Agreement, dated as of January 18, 2024 under Targa Resources Corp. 2010 Stock Incentive Plan (incorporated by reference to Exhibit 10.12 to Targa Resources Corp.’s Annual Report on Form 10-K filed February 15, 2024 (File No. 001-34991)). |
| | |
10.9+ | | Form of Restricted Stock Unit Agreement under Targa Resources Corp. 2010 Stock Incentive Plan (incorporated by reference to Exhibit 10.13 to Targa Resources Corp.’s Annual Report on Form 10-K filed February 15, 2024 (File No. 001-34991)). |
| | |
10.10+ | | Targa Resources Corp. 2020 Annual Incentive Compensation Plan (incorporated by reference to Exhibit 10.1 to Targa Resources Corp.’s Current Report on Form 8-K filed January 23, 2020 (File No. 001-34991)). |
| | |
10.11+ |
| Targa Resources Executive Officer Change in Control Severance Program (incorporated by reference to Exhibit 10.3 to Targa Resources Corp.’s Current Report on Form 8-K filed January 19, 2012 (File No. 001-34991)). |
|
|
|
10.12+ |
| First Amendment to the Targa Resources Executive Officer Change in Control Severance Program, dated December 3, 2015 (incorporated by reference to Exhibit 10.1 to Targa Resources Corp.’s Current Report on Form 8-K filed December 8, 2015 (File No. 001-34991)). |
| | |
10.13 |
| Form of Indemnification Agreement between Targa Resources Investments Inc. and each of the directors and officers thereof (incorporated by reference to Exhibit 10.4 to Targa Resources Corp.’s Registration Statement on Form S-1/A filed November 8, 2010 (File No. 333-169277)). |
| | |
10.14 |
| Receivables Purchase Agreement, dated January 10, 2013, by and among Targa Receivables LLC, the Partnership, as initial Servicer, the various conduit purchasers from time to time party thereto, the various committed purchasers from time to time party thereto, the various purchaser agents from time to time party thereto, the various LC participants from time to time party thereto and PNC Bank, National Association as Administrator and LC Bank (incorporated by reference to Exhibit 10.1 to Targa Resources Partners LP’s Current Report on Form 8-K filed January 14, 2013 (File No. 001-33303)). |
|
|
|
10.15 |
| Purchase and Sale Agreement, dated January 10, 2013, between the originators from time to time party thereto as Originators and Targa Receivables LLC (incorporated by reference to Exhibit 10.2 to Targa Resources Partners LP’s Current Report on Form 8-K filed January 14, 2013 (File No. 001-33303)). |
|
|
|
10.16 |
| Second Amendment to Receivables Purchase Agreement, dated December 13, 2013, by and among Targa Receivables LLC, as seller, the Partnership, as servicer, the various conduit purchasers, committed purchasers, purchaser agents and LC participants party thereto and PNC Bank, National Association, as administrator and LC Bank (incorporated by reference to Exhibit 10.1 to Targa Resources Partners LP’s Current Report on Form 8-K filed December 17, 2013 (File No. 001-33303)). |
|
|
|
10.17 |
| Fourth Amendment to Receivables Purchase Agreement, dated December 11, 2015, by and among Targa Receivables LLC, as seller, the Partnership, as servicer, the various conduit purchasers, committed purchasers, purchaser agents and LC participants party thereto and PNC Bank, National Association, as administrator and LC Bank (incorporated by reference to Exhibit 10.1 to Targa Resources Partners LP’s Current Report on Form 8-K filed December 15, 2015 (File No. 001-33303)). |
|
|
|
10.18 |
| Fifth Amendment to Receivables Purchase Agreement, dated December 9, 2016, by and among Targa Receivables LLC, as seller, the Partnership, as servicer, the various conduit purchasers, committed purchasers, purchaser agents and LC participants party thereto and PNC Bank, National Association, as administrator and LC Bank (incorporated by reference to Exhibit 10.1 to Targa Resources Partners LP’s Current Report on Form 8-K filed January 6, 2017 (File No. 001-33303)). |
|
|
|
10.19 |
| Seventh Amendment to Receivables Purchase Agreement, dated December 7, 2018, by and among Targa Receivables LLC, as seller, the Partnership, as servicer, the various conduit purchasers, committed purchasers, purchaser agents and LC participants party thereto and PNC Bank, National Association, as administrator and LC Bank (incorporated by reference to Exhibit 10.1 to Targa Resources Partners LP’s Current Report on Form 8-K filed December 10, 2018 (File No. 001-33303)). |
|
| |
10.20 | | Eighth Amendment to Receivables Purchase Agreement, dated December 6, 2019, by and among Targa Receivables LLC, as seller, the Partnership, as servicer, the various conduit purchasers, committed purchasers, purchaser agents and LC participants party thereto and PNC Bank, National Association, as administrator and LC Bank (incorporated |
| | |
| | by reference to Exhibit 10.1 to Targa Resources Corp.’s Current Report on Form 8-K filed December 10, 2019 (File No. 001-34991)). |
| | |
10.21+ | | Ninth Amendment to Receivables Purchase Agreement, dated April 22, 2020, by and among Targa Receivables LLC, as seller, Targa Resources Partners LP, as servicer, the various conduit purchasers, committed purchasers, purchaser agents and LC participants party thereto and PNC Bank, National Association, as administrator and LC Bank (incorporated by reference to Exhibit 10.1 to Targa Resources Corp.’s Current Report on Form 8-K filed April 24, 2020 (File No. 001-34991)). |
| | |
10.22 | | Tenth Amendment to Receivables Purchase Agreement, dated April 21, 2021, by and among Targa Receivables LLC, as seller, Targa Resources Partners LP, as servicer, the various conduit purchasers, committed purchasers, purchaser agents and LC participants party thereto and PNC Bank, National Association, as administrator and LC Bank (incorporated by reference to Exhibit 10.1 to Targa Resources Corp.’s Current Report on Form 8-K filed April 23, 2021 (File No. 001-34991)). |
| | |
10.23 | | Eleventh Amendment to Receivables Purchase Agreement, dated December 13, 2021, by and among Targa Receivables LLC, as seller, Targa Resources Partners LP, as servicer, the various conduit purchasers, committed purchasers, purchaser agents and LC participants party thereto and PNC Bank, National Association, as administrator and LC Bank (incorporated by reference to Exhibit 10.104 to Targa Resources Corp.’s Annual Report on Form 10-K filed February 24, 2022 (File No. 001-34991)). |
| | |
10.24 | | Twelfth Amendment to Receivables Purchase Agreement, dated April 19, 2022, by and among Targa Receivables LLC, as seller, Targa Resources Partners LP, as servicer, the various conduit purchasers, committed purchasers, purchaser agents and LC participants party thereto and PNC Bank, National Association, as administrator and LC Bank (incorporated by reference to Exhibit 10.1 to Targa Resources Corp.’s Current Report on Form 8-K filed April 22, 2022 (File No. 001-34991)). |
| | |
10.25 | | Thirteenth Amendment to Receivables Purchase Agreement, dated as of September 2, 2022, by and among Targa Receivables LLC, as seller, Targa Resources Partners LP, as servicer, the various conduit purchasers, committed purchasers, purchaser agents and LC participants party thereto and PNC Bank, National Association, as administrator and LC Bank (incorporated by reference to Exhibit 10.1 to Targa Resources Corp.’s Current Report on Form 8-K filed September 6, 2022 (File No. 001-34991)). |
| | |
10.26 | | Fourteenth Amendment to Receivables Purchase Agreement, dated as of August 30, 2023, by and among Targa Receivables LLC, as seller, the Partnership, as servicer, the various conduit purchasers, committed purchasers, purchaser agents and LC participants party thereto and PNC Bank, National Association, as administrator and LC Bank (incorporated by reference to Exhibit 10.1 to Targa Resources Corp.’s Current Report on Form 8-K filed August 31, 2023 (File No. 001-34991)). |
| | |
10.27 | | Fifteenth Amendment to Receivables Purchase Agreement, dated as of August 26, 2024, by and among Targa Receivables LLC, as seller, the Partnership, as servicer, the various conduit purchasers, committed purchasers, purchaser agents and LC participants party thereto and PNC Bank, National Association, as administrator and LC Bank (incorporated by reference to Exhibit 10.1 to Targa Resources Corp.’s Current Report on Form 8-K filed August 27, 2024 (File No. 001-34991)). |
| | |
10.28 | | Commitment Increase Request, dated February 23, 2017, by and among Targa Receivables LLC, as seller, the Partnership, as servicer, and PNC Bank, National Association, as administrator, purchaser agent and LC Bank (incorporated by reference to Exhibit 10.1 to Targa Resources Partners LP’s Current Report on Form 8-K filed February 24, 2017 (File No. 001-33303)). |
| | |
10.29 | | Commitment Increase Request, dated December 11, 2020, by and among Targa Receivables LLC, as seller, the Partnership, as servicer, and PNC Bank, National Association, as administrator, purchaser agent and LC Bank, and Wells Fargo Bank, National Association, as purchaser agent and LC Participant (incorporated by reference to Exhibit 10.1 to Targa Resources Corp.’s Current Report on Form 8-K filed December 14, 2020 (File No. 001-34991)). |
| | |
19.1* | | Targa Resources Corp. Insider Trading Policy. |
| | |
21.1* |
| List of Significant Subsidiaries of Targa Resources Corp. |
| | |
22.1* | | List of Subsidiary Guarantors. |
| | |
23.1* | | Consent of Independent Registered Public Accounting Firm. |
| | |
31.1* | | Certification of Chief Executive Officer pursuant to Rule 13a-14(a)/15d-14(a) of the Securities Exchange Act of 1934. |
| | |
* Filed herewith
** Furnished herewith
+ Management contract or compensatory plan or arrangement
Item 16. Form 10-K Summary
None.
SIGNATURES
Pursuant to the requirements of Section 13 or 15(d) of the Securities Exchange Act of 1934, the registrant has duly caused this report to be signed on its behalf by the undersigned, thereunto duly authorized.
| | | |
| Targa Resources Corp. |
| (Registrant) |
| | | |
Date: February 20, 2025 | By: | | /s/ Jennifer R. Kneale |
| | | Jennifer R. Kneale |
| | | President – Finance and Administration |
| | | (Principal Financial Officer) |
Pursuant to the requirements of the Securities Exchange Act of 1934, this report has been signed by the following persons on behalf of the registrant and in the capacities indicated on February 20, 2025.
| | |
Signature |
| Title (Position with Targa Resources Corp.) |
|
|
|
/s/ Matthew J. Meloy |
| Chief Executive Officer and Director |
Matthew J. Meloy |
| (Principal Executive Officer) |
|
|
|
/s/ Jennifer R. Kneale |
| President – Finance and Administration |
Jennifer R. Kneale |
| (Principal Financial Officer) |
|
|
|
/s/ Julie H. Boushka |
| Senior Vice President and Chief Accounting Officer |
Julie H. Boushka |
| (Principal Accounting Officer) |
|
|
|
/s/ Paul W. Chung |
| Chairman of the Board and Director |
Paul W. Chung |
|
|
|
|
|
/s/ Beth A. Bowman |
| Director |
Beth A. Bowman |
|
|
|
|
|
/s/ Lindsey M. Cooksen |
| Director |
Lindsey M. Cooksen |
|
|
|
|
|
/s/ Charles R. Crisp |
| Director |
Charles R. Crisp |
|
|
|
|
|
/s/ Waters S. Davis, IV |
| Director |
Waters S. Davis, IV |
|
|
|
|
|
/s/ Laura C. Fulton |
| Director |
Laura C. Fulton |
|
|
| | |
/s/ Rene R. Joyce | | Director |
Rene R. Joyce | | |
| | |
/s/ Caron A. Lawhorn | | Director |
Caron A. Lawhorn | | |
| | |
/s/ Joe Bob Perkins | | Director |
Joe Bob Perkins | | |
| | |
/s/ R. Keith Teague | | Director |
R. Keith Teague | | |
INDEX TO CONSOLIDATED FINANCIAL STATEMENTS
TARGA RESOURCES CORP. AUDITED CONSOLIDATED FINANCIAL STATEMENTS
| |
Management’s Report on Internal Control Over Financial Reporting | F-2 |
|
|
Report of Independent Registered Public Accounting Firm (PCAOB ID: 238) | F-3 |
|
|
Consolidated Balance Sheets as of December 31, 2024 and December 31, 2023 | F-5 |
|
|
Consolidated Statements of Operations for the Years Ended December 31, 2024, 2023 and 2022 | F-6 |
|
|
Consolidated Statements of Comprehensive Income (Loss) for the Years Ended December 31, 2024, 2023 and 2022 | F-7 |
|
|
Consolidated Statements of Cash Flows for the Years Ended December 31, 2024, 2023 and 2022 | F-8 |
| |
Consolidated Statements of Changes in Owners’ Equity and Series A Preferred Stock for the Years Ended December 31, 2024, 2023 and 2022 | F-9 |
|
|
Notes to Consolidated Financial Statements | F-11 |
Note 1 ― Organization and Operations | F-11 |
Note 2 ― Basis of Presentation | F-11 |
Note 3 ― Significant Accounting Policies | F-11 |
Note 4 ― Acquisitions and Divestitures | F-20 |
Note 5 ― Property, Plant and Equipment and Intangible Assets | F-23 |
Note 6 ― Goodwill | F-23 |
Note 7 ― Investments in Unconsolidated Affiliates | F-24 |
Note 8 ― Debt Obligations | F-25 |
Note 9 ― Other Long-term Liabilities | F-30 |
Note 10 ― Leases | F-32 |
Note 11 ― Common Stock and Related Matters | F-33 |
Note 12 ― Earnings Per Common Share | F-34 |
Note 13 ― Derivative Instruments and Hedging Activities | F-35 |
Note 14 ― Fair Value Measurements | F-38 |
Note 15 ― Related Party Transactions | F-40 |
Note 16 ― Commitments | F-40 |
Note 17 ― Contingencies | F-40 |
Note 18 ― Revenue | F-42 |
Note 19 ― Income Taxes | F-42 |
Note 20 ― Supplemental Cash Flow Information | F-44 |
Note 21 ― Compensation Plans | F-44 |
Note 22 ― Segment Information | F-46 |
MANAGEMENT’S REPORT ON INTERNAL CONTROL OVER FINANCIAL REPORTING
Management is responsible for establishing and maintaining adequate internal control over financial reporting. Our internal control over financial reporting is a process designed to provide reasonable assurance regarding the reliability of financial reporting and the preparation of financial statements for external purposes in accordance with generally accepted accounting principles.
Internal control over financial reporting cannot provide absolute assurance of achieving financial reporting objectives because of its inherent limitations. Internal control over financial reporting is a process that involves human diligence and compliance and is subject to lapses in judgment and breakdowns resulting from human failures. Internal control over financial reporting also can be circumvented by collusion or improper management override. Because of such limitations, there is a risk that material misstatements may not be prevented or detected on a timely basis by internal control over financial reporting. However, these inherent limitations are known features of the financial reporting process. Therefore, it is possible to design into the process safeguards to reduce, though not eliminate, this risk.
Management has used the framework set forth in the report entitled “Internal Control—Integrated Framework” issued by the Committee of Sponsoring Organizations of the Treadway Commission (“COSO”) in 2013 to evaluate the effectiveness of the internal control over financial reporting. Based on that evaluation, management has concluded that the internal control over financial reporting was effective as of December 31, 2024.
The effectiveness of our internal control over financial reporting as of December 31, 2024 has been audited by PricewaterhouseCoopers LLP, an independent registered public accounting firm, as stated in their report which appears on page F-3.
/s/ Matthew J. Meloy
Matthew J. Meloy
Chief Executive Officer
(Principal Executive Officer)
/s/ Jennifer R. Kneale
Jennifer R. Kneale
President – Finance and Administration
(Principal Financial Officer)
Report of Independent Registered Public Accounting Firm
To the Board of Directors and Stockholders of Targa Resources Corp.
Opinions on the Financial Statements and Internal Control over Financial Reporting
We have audited the accompanying consolidated balance sheets of Targa Resources Corp. and its subsidiaries (the “Company”) as of December 31, 2024 and 2023, and the related consolidated statements of operations, of comprehensive income (loss), of changes in owners’ equity and series A preferred stock and of cash flows for each of the three years in the period ended December 31, 2024, including the related notes (collectively referred to as the “consolidated financial statements”). We also have audited the Company’s internal control over financial reporting as of December 31, 2024, based on criteria established in Internal Control - Integrated Framework (2013) issued by the Committee of Sponsoring Organizations of the Treadway Commission (COSO).
In our opinion, the consolidated financial statements referred to above present fairly, in all material respects, the financial position of the Company as of December 31, 2024 and 2023, and the results of its operations and its cash flows for each of the three years in the period ended December 31, 2024 in conformity with accounting principles generally accepted in the United States of America. Also in our opinion, the Company maintained, in all material respects, effective internal control over financial reporting as of December 31, 2024, based on criteria established in Internal Control - Integrated Framework (2013) issued by the COSO.
Basis for Opinions
The Company’s management is responsible for these consolidated financial statements, for maintaining effective internal control over financial reporting, and for its assessment of the effectiveness of internal control over financial reporting, included in the accompanying Management’s Report on Internal Control over Financial Reporting. Our responsibility is to express opinions on the Company’s consolidated financial statements and on the Company’s internal control over financial reporting based on our audits. We are a public accounting firm registered with the Public Company Accounting Oversight Board (United States) (PCAOB) and are required to be independent with respect to the Company in accordance with the U.S. federal securities laws and the applicable rules and regulations of the Securities and Exchange Commission and the PCAOB.
We conducted our audits in accordance with the standards of the PCAOB. Those standards require that we plan and perform the audits to obtain reasonable assurance about whether the consolidated financial statements are free of material misstatement, whether due to error or fraud, and whether effective internal control over financial reporting was maintained in all material respects.
Our audits of the consolidated financial statements included performing procedures to assess the risks of material misstatement of the consolidated financial statements, whether due to error or fraud, and performing procedures that respond to those risks. Such procedures included examining, on a test basis, evidence regarding the amounts and disclosures in the consolidated financial statements. Our audits also included evaluating the accounting principles used and significant estimates made by management, as well as evaluating the overall presentation of the consolidated financial statements. Our audit of internal control over financial reporting included obtaining an understanding of internal control over financial reporting, assessing the risk that a material weakness exists, and testing and evaluating the design and operating effectiveness of internal control based on the assessed risk. Our audits also included performing such other procedures as we considered necessary in the circumstances. We believe that our audits provide a reasonable basis for our opinions.
Definition and Limitations of Internal Control over Financial Reporting
A company’s internal control over financial reporting is a process designed to provide reasonable assurance regarding the reliability of financial reporting and the preparation of financial statements for external purposes in accordance with generally accepted accounting principles. A company’s internal control over financial reporting includes those policies and procedures that (i) pertain to the maintenance of records that, in reasonable detail, accurately and fairly reflect the transactions and dispositions of the assets of the company; (ii) provide reasonable assurance that transactions are recorded as necessary to permit preparation of financial statements in accordance with generally accepted accounting principles, and that receipts and expenditures of the company are being made only in accordance with authorizations of management and directors of the company; and (iii) provide reasonable assurance regarding prevention or timely detection of unauthorized acquisition, use, or disposition of the company’s assets that could have a material effect on the financial statements.
Because of its inherent limitations, internal control over financial reporting may not prevent or detect misstatements. Also, projections of any evaluation of effectiveness to future periods are subject to the risk that controls may become inadequate because of changes in conditions, or that the degree of compliance with the policies or procedures may deteriorate.
Critical Audit Matters
The critical audit matter communicated below is a matter arising from the current period audit of the consolidated financial statements that was communicated or required to be communicated to the audit committee and that (i) relates to accounts or disclosures that are material to the consolidated financial statements and (ii) involved our especially challenging, subjective, or complex judgments. The communication of critical audit matters does not alter in any way our opinion on the consolidated financial statements, taken as a whole, and we are not, by communicating the critical audit matter below, providing a separate opinion on the critical audit matter or on the accounts or disclosures to which it relates.
Valuation of Derivative Instruments and Hedging Activities
As described in Note 13 to the consolidated financial statements, the primary purpose of management’s commodity risk management activities is to manage the Company’s exposure to commodity price risk and reduce volatility in operating cash flow due to fluctuations in commodity prices. Management has entered into derivative instruments to hedge the commodity price risks. As of December 31, 2024, there were $87.1 million of assets from risk management activities and $259.3 million of liabilities from risk management activities. The fair value of the derivative instruments was determined by the use of present value methods with assumptions about commodity prices based on those observed in underlying markets.
The principal considerations for our determination that performing procedures relating to the valuation of derivative instruments and hedging activities is a critical audit matter are (i) the significant judgment by management when developing the fair value estimate of the assets and liabilities from risk management activities; (ii) a high degree of auditor judgment and effort in performing procedures and evaluating management’s significant assumptions related to commodity prices; and (iii) the audit effort involved the use of professionals with specialized skill and knowledge.
Addressing the matter involved performing procedures and evaluating audit evidence in connection with forming our overall opinion on the consolidated financial statements. These procedures included testing the effectiveness of controls relating to the valuation of the assets and liabilities from risk management activities, including controls over management’s model, data and assumptions. These procedures also included, among others, (i) the involvement of professionals with specialized skill and knowledge to assist in developing independent fair value estimates for a sample of the assets and liabilities from risk management activities and (ii) comparing the independent fair value estimates to management’s fair value estimates to evaluate the reasonableness of management’s fair value estimates. Developing the independent fair value estimates involved testing the completeness and accuracy of data provided by management and independently developing the commodity prices assumption.
/s/ PricewaterhouseCoopers LLP
Houston, Texas
February 20, 2025
We have served as the Company’s auditor since 2005.
PART I – FINANCIAL INFORMATION
Item 1. Financial Statements.
TARGA RESOURCES CORP.
CONSOLIDATED BALANCE SHEETS
| | | | | | | |
| December 31, 2024 | | | December 31, 2023 | |
| (In millions) | |
ASSETS | |
Current assets: | | | | | |
Cash and cash equivalents | $ | 157.3 | | | $ | 141.7 | |
Trade receivables, net of allowances of $2.5 million and $2.5 million as of December 31, 2024 and 2023 | | 1,618.3 | | | | 1,471.0 | |
Inventories | | 334.3 | | | | 371.5 | |
Assets from risk management activities | | 61.8 | | | | 111.9 | |
Other current assets | | 124.6 | | | | 98.5 | |
Total current assets | | 2,296.3 | | | | 2,194.6 | |
Property, plant and equipment, net | | 18,062.7 | | | | 15,806.4 | |
Intangible assets, net | | 1,977.4 | | | | 2,350.6 | |
Long-term assets from risk management activities | | 25.3 | | | | 33.3 | |
Investments in unconsolidated affiliates | | 193.3 | | | | 146.3 | |
Other long-term assets | | 179.1 | | | | 140.6 | |
Total assets | $ | 22,734.1 | | | $ | 20,671.8 | |
| | | | | |
LIABILITIES AND OWNERS’ EQUITY | |
Current liabilities: | | | | | |
Accounts payable | $ | 2,012.5 | | | $ | 1,574.9 | |
Accrued liabilities | | 336.0 | | | | 281.7 | |
Interest payable | | 269.1 | | | | 229.6 | |
Liabilities from risk management activities | | 167.3 | | | | 54.0 | |
Current debt obligations | | 387.7 | | | | 620.7 | |
Total current liabilities | | 3,172.6 | | | | 2,760.9 | |
Long-term debt | | 13,786.9 | | | | 12,333.2 | |
Long-term liabilities from risk management activities | | 92.0 | | | | 16.8 | |
Deferred income taxes, net | | 872.1 | | | | 535.8 | |
Other long-term liabilities | | 392.3 | | | | 415.1 | |
Commitments and Contingencies (see Notes 16 and 17) | | | | | |
Owners’ equity: | | | | | |
Targa Resources Corp. stockholders’ equity: | | | | | |
Common Stock ($0.001 par value, 450,000,000 shares authorized as of December 31, 2024 and 2023) | | 0.2 | | | | 0.2 | |
Issued Outstanding | | | | | |
December 31, 2024 241,764,105 217,763,821 | | | | | |
December 31, 2023 240,095,699 222,611,259 | | | | | |
Additional paid-in capital | | 3,089.1 | | | | 3,058.8 | |
Retained earnings (deficit) | | 1,190.0 | | | | 492.0 | |
Accumulated other comprehensive income (loss) | | 27.5 | | | | 85.6 | |
Treasury stock, at cost (24,000,284 shares and 17,484,440 shares as of December 31, 2024 and 2023) | | (1,714.4 | ) | | | (896.9 | ) |
Total Targa Resources Corp. stockholders’ equity | | 2,592.4 | | | | 2,739.7 | |
Noncontrolling interests | | 1,825.8 | | | | 1,870.3 | |
Total owners’ equity | | 4,418.2 | | | | 4,610.0 | |
Total liabilities and owners’ equity | $ | 22,734.1 | | | $ | 20,671.8 | |
See notes to consolidated financial statements.
TARGA RESOURCES CORP.
CONSOLIDATED STATEMENTS OF OPERATIONS
| | | | | | | | | | | |
| Year Ended December 31, | |
| 2024 | | | 2023 | | | 2022 | |
| (In millions, except per share amounts) | |
Revenues: | | | | | | | | |
Sales of commodities | $ | 13,891.8 | | | $ | 13,962.1 | | | $ | 19,066.0 | |
Fees from midstream services | | 2,489.7 | | | | 2,098.2 | | | | 1,863.8 | |
Total revenues | | 16,381.5 | | | | 16,060.3 | | | | 20,929.8 | |
Costs and expenses: | | | | | | | | |
Product purchases and fuel | | 10,703.0 | | | | 10,676.4 | | | | 16,882.1 | |
Operating expenses | | 1,175.6 | | | | 1,077.9 | | | | 912.8 | |
Depreciation and amortization expense | | 1,423.0 | | | | 1,329.6 | | | | 1,096.0 | |
General and administrative expense | | 384.9 | | | | 348.7 | | | | 309.7 | |
Other operating (income) expense | | (0.4 | ) | | | 1.5 | | | | 0.2 | |
Income (loss) from operations | | 2,695.4 | | | | 2,626.2 | | | | 1,729.0 | |
Other income (expense): | | | | | | | | |
Interest expense, net | | (767.2 | ) | | | (687.8 | ) | | | (446.1 | ) |
Equity earnings (loss) | | 9.4 | | | | 9.0 | | | | 9.1 | |
Gain (loss) from financing activities | | (0.8 | ) | | | (2.1 | ) | | | (49.6 | ) |
Gain (loss) from sale of equity method investment | | — | | | | — | | | | 435.9 | |
Other, net | | 1.2 | | | | (2.8 | ) | | | (15.1 | ) |
Income (loss) before income taxes | | 1,938.0 | | | | 1,942.5 | | | | 1,663.2 | |
Income tax (expense) benefit | | (384.5 | ) | | | (363.2 | ) | | | (131.8 | ) |
Net income (loss) | | 1,553.5 | | | | 1,579.3 | | | | 1,531.4 | |
Less: Net income (loss) attributable to noncontrolling interests | | 241.5 | | | | 233.4 | | | | 335.9 | |
Net income (loss) attributable to Targa Resources Corp. | | 1,312.0 | | | | 1,345.9 | | | | 1,195.5 | |
Premium on repurchase of noncontrolling interests, net of tax | | 32.9 | | | | 510.1 | | | | 53.2 | |
Dividends on Series A Preferred Stock | | — | | | | — | | | | 30.0 | |
Deemed dividends on Series A Preferred Stock | | — | | | | — | | | | 215.5 | |
Net income (loss) attributable to common shareholders | $ | 1,279.1 | | | $ | 835.8 | | | $ | 896.8 | |
| | | | | | | | |
Net income (loss) per common share - basic | $ | 5.77 | | | $ | 3.69 | | | $ | 3.95 | |
Net income (loss) per common share - diluted | $ | 5.74 | | | $ | 3.66 | | | $ | 3.88 | |
Weighted average shares outstanding - basic | | 220.2 | | | | 224.6 | | | | 227.3 | |
Weighted average shares outstanding - diluted | | 221.3 | | | | 226.0 | | | | 231.1 | |
See notes to consolidated financial statements.
TARGA RESOURCES CORP.
CONSOLIDATED STATEMENTS OF COMPREHENSIVE INCOME (LOSS)
| | | | | | | | | | | | | | | | | | | | | | | | | | | | | | | | | | | | |
| | Year Ended December 31, | |
| | 2024 | | | 2023 | | | 2022 | |
| | Pre-Tax | | | Related Income Tax | | | After Tax | | | Pre-Tax | | | Related Income Tax | | | After Tax | | | Pre-Tax | | | Related Income Tax | | | After Tax | |
| | (In millions) | |
| | | | | | | | | | | | | | | | | | | | | | | | | | | |
Net income (loss) | | | | | | | | $ | 1,553.5 | | | | | | | | | $ | 1,579.3 | | | | | | | | | $ | 1,531.4 | |
Other comprehensive income (loss): | | | | | | | | | | | | | | | | | | | | | | | | | | | |
Commodity hedging contracts: | | | | | | | | | | | | | | | | | | | | | | | | | | | |
Change in fair value | | $ | (7.5 | ) | | $ | 1.7 | | | | (5.8 | ) | | $ | 193.4 | | | $ | (44.3 | ) | | | 149.1 | | | $ | (5.6 | ) | | $ | 1.3 | | | | (4.3 | ) |
Settlements reclassified to revenues | | | (67.8 | ) | | | 15.5 | | | | (52.3 | ) | | | (153.4 | ) | | | 35.2 | | | | (118.2 | ) | | | 373.0 | | | | (83.1 | ) | | | 289.9 | |
Other comprehensive income (loss) | | | (75.3 | ) | | | 17.2 | | | | (58.1 | ) | | | 40.0 | | | | (9.1 | ) | | | 30.9 | | | | 367.4 | | | | (81.8 | ) | | | 285.6 | |
Comprehensive income (loss) | | | | | | | | | 1,495.4 | | | | | | | | | | 1,610.2 | | | | | | | | | | 1,817.0 | |
Less: Comprehensive income (loss) attributable to noncontrolling interests | | | | | | | | | 241.5 | | | | | | | | | | 233.4 | | | | | | | | | | 335.9 | |
Comprehensive income (loss) attributable to Targa Resources Corp. | | | | | | | | $ | 1,253.9 | | | | | | | | | $ | 1,376.8 | | | | | | | | | $ | 1,481.1 | |
See notes to consolidated financial statements.
TARGA RESOURCES CORP.
CONSOLIDATED STATEMENTS OF CASH FLOWS
| | | | | | | | | | | | |
| | Year Ended December 31, | |
| | 2024 | | | 2023 | | | 2022 | |
| | (In millions) | |
Cash flows from operating activities | | | | | | | | | |
Net income (loss) | | $ | 1,553.5 | | | $ | 1,579.3 | | | $ | 1,531.4 | |
Adjustments to reconcile net income (loss) to net cash provided by (used in) operating activities: | | | | |
| | | | |
Amortization in interest expense | | | 14.8 | | | | 13.2 | | | | 10.5 | |
Compensation on equity grants | | | 63.2 | | | | 62.4 | | | | 57.5 | |
Depreciation and amortization expense | | | 1,423.0 | | | | 1,329.6 | | | | 1,096.0 | |
(Gain) loss on sale or disposition of assets | | | (3.1 | ) | | | (5.3 | ) | | | (9.6 | ) |
Write-downs of assets | | | 6.2 | | | | 6.9 | | | | 9.8 | |
Accretion of asset retirement obligations | | | 10.6 | | | | 5.9 | | | | 4.8 | |
Deferred income tax expense (benefit) | | | 367.0 | | | | 349.6 | | | | 125.1 | |
Equity (earnings) loss of unconsolidated affiliates | | | (9.4 | ) | | | (9.0 | ) | | | (9.1 | ) |
Distributions of earnings received from unconsolidated affiliates | | | 19.8 | | | | 13.1 | | | | 12.2 | |
Risk management activities | | | 164.6 | | | | (275.4 | ) | | | 302.5 | |
(Gain) loss from financing activities | | | 0.8 | | | | 2.1 | | | | 49.6 | |
(Gain) loss from sale of equity method investment | | | — | | | | — | | | | (435.9 | ) |
Changes in operating assets and liabilities, net of acquisitions: | | | | | | | | | |
Receivables and other assets | | | (75.0 | ) | | | (20.6 | ) | | | 219.7 | |
Inventories | | | 33.5 | | | | 36.0 | | | | (236.2 | ) |
Accounts payable, accrued liabilities and other liabilities | | | 40.7 | | | | 68.2 | | | | (383.0 | ) |
Interest payable | | | 39.5 | | | | 55.6 | | | | 35.5 | |
Net cash provided by (used in) operating activities | | | 3,649.7 | | | | 3,211.6 | | | | 2,380.8 | |
Cash flows from investing activities | | | | |
| | | | |
Outlays for property, plant and equipment | | | (2,965.8 | ) | | | (2,385.4 | ) | | | (1,334.3 | ) |
Outlays for business acquisition, net of cash acquired | | | — | | | | — | | | | (3,503.9 | ) |
Outlays for asset acquisition, net of cash acquired | | | — | | | | — | | | | (205.2 | ) |
Proceeds from sale of assets | | | 3.3 | | | | 4.7 | | | | 23.0 | |
Investments in unconsolidated affiliates | | | (62.9 | ) | | | (24.6 | ) | | | (1.5 | ) |
Proceeds from sale of equity method investment | | | — | | | | — | | | | 857.0 | |
Return of capital from unconsolidated affiliates | | | 5.5 | | | | 5.5 | | | | 16.8 | |
Other, net | | | (1.4 | ) | | | (1.0 | ) | | | (1.6 | ) |
Net cash provided by (used in) investing activities | | | (3,021.3 | ) | | | (2,400.8 | ) | | | (4,149.7 | ) |
Cash flows from financing activities | | | | |
| | | | |
Debt obligations: | | | | |
| | | | |
Proceeds from borrowings under credit facilities | | | — | | | | — | | | | 5,845.0 | |
Repayments of credit facilities | | | — | | | | (290.0 | ) | | | (5,555.0 | ) |
Proceeds from borrowings of commercial paper notes | | | 85,430.5 | | | | 59,002.8 | | | | 30,504.3 | |
Repayments of commercial paper notes | | | (84,475.0 | ) | | | (59,836.5 | ) | | | (29,495.6 | ) |
Proceeds from borrowings under term loan facility | | | — | | | | — | | | | 1,500.0 | |
Repayments of term loan facility | | | (500.0 | ) | | | (1,000.0 | ) | | | — | |
Proceeds from borrowings under accounts receivable securitization facility | | | 775.0 | | | | 143.1 | | | | 1,230.0 | |
Repayments of accounts receivable securitization facility | | | (1,020.0 | ) | | | (368.1 | ) | | | (580.0 | ) |
Proceeds from issuance of senior unsecured notes | | | 999.4 | | | | 3,727.7 | | | | 2,741.4 | |
Redemption of senior unsecured notes | | | — | | | | — | | | | (1,473.2 | ) |
Principal payments of finance leases | | | (50.1 | ) | | | (42.9 | ) | | | (19.7 | ) |
Costs incurred in connection with financing arrangements | | | (9.9 | ) | | | (36.1 | ) | | | (45.7 | ) |
Repurchases of common stock | | | (754.7 | ) | | | (373.7 | ) | | | (224.8 | ) |
Shares tendered for tax withholding obligations | | | (56.4 | ) | | | (55.8 | ) | | | (35.8 | ) |
Contributions from noncontrolling interests | | | 12.0 | | | | 9.7 | | | | 26.1 | |
Distributions to noncontrolling interests | | | (232.6 | ) | | | (222.1 | ) | | | (316.4 | ) |
Repurchase of noncontrolling interests | | | (112.9 | ) | | | (1,118.9 | ) | | | (926.3 | ) |
Redemption of Series A Preferred Stock | | | — | | | | — | | | | (965.2 | ) |
Dividends paid to common and Series A Preferred shareholders | | | (615.5 | ) | | | (427.3 | ) | | | (379.7 | ) |
Other, net | | | (2.6 | ) | | | — | | | | — | |
Net cash provided by (used in) financing activities | | | (612.8 | ) | | | (888.1 | ) | | | 1,829.4 | |
Net change in cash and cash equivalents | | | 15.6 | | | | (77.3 | ) | | | 60.5 | |
Cash and cash equivalents, beginning of period | | | 141.7 | | | | 219.0 | | | | 158.5 | |
Cash and cash equivalents, end of period | | $ | 157.3 | | | $ | 141.7 | | | $ | 219.0 | |
See notes to consolidated financial statements.
TARGA RESOURCES CORP.
CONSOLIDATED STATEMENTS OF CHANGES IN OWNERS’ EQUITY AND SERIES A PREFERRED STOCK
| | | | | | | | | | | | | | | | | | | | | | | | | | | | | | | |
| | | | | | | | Retained | | Accumulated | | | | | | | | | | | |
| | | | | | Additional | | Earnings | | Other | | Treasury | | | | Total | | Series A | |
| | Common Stock | | Paid in | | (Accumulated | | Comprehensive | | Shares | | Noncontrolling | | Owners’ | | Preferred | |
| | Shares | | Amount | | Capital | | Deficit) | | Income (Loss) | | Shares | | Amount | | Interests | | Equity | | Stock | |
| | (In millions, except shares in thousands) | |
| | | | | | | | | | | | | | | | | | | | | |
Balance, December 31, 2021 | | | 228,221 | | $ | 0.2 | | $ | 4,268.9 | | $ | (1,822.3 | ) | $ | (230.9 | ) | | 7,884 | | $ | (204.1 | ) | $ | 3,166.9 | | $ | 5,178.7 | | $ | 749.7 | |
Compensation on equity grants | | | — | | | — | | | 57.5 | | | — | | | — | | | — | | | — | | | — | | | 57.5 | | | — | |
Dividend equivalent rights | | | — | | | — | | | (7.1 | ) | | — | | | — | | | — | | | — | | | — | | | (7.1 | ) | | — | |
Shares issued under compensation program | | | 1,834 | | | — | | | — | | | — | | | — | | | — | | | — | | | — | | | — | | | — | |
Shares tendered for tax withholding obligations | | | (601 | ) | | — | | | — | | | — | | | — | | | 601 | | | (35.8 | ) | | — | | | (35.8 | ) | | — | |
Repurchases of common stock | | | (3,412 | ) | | — | | | — | | | — | | | — | | | 3,412 | | | (224.8 | ) | | — | | | (224.8 | ) | | — | |
Series A Preferred Stock dividends | |
| |
| |
| |
| |
| |
| |
| |
| | | |
| |
Dividends - $47.50 per share | | | — | | | — | | | — | | | (30.0 | ) | | — | | | — | | | — | | | — | | | (30.0 | ) | | — | |
Dividends in excess of retained earnings | | | — | | | — | | | (30.0 | ) | | 30.0 | | | — | | | — | | | — | | | — | | | — | | | — | |
Deemed dividends - redemption of Series A Preferred Stock | | | — | | | — | | | (215.5 | ) | | — | | | — | | | — | | | — | | | — | | | (215.5 | ) | | — | |
Common stock dividends | |
| |
| �� |
| |
| |
| |
| |
| |
| | | | | |
Dividends - $1.40 per share | | | — | | | — | | | — | | | (318.3 | ) | | — | | | — | | | — | | | — | | | (318.3 | ) | | — | |
Dividends in excess of retained earnings | | | — | | | — | | | (318.3 | ) | | 318.3 | | | — | | | — | | | — | | | — | | | — | | | — | |
Redemption of Series A Preferred Stock | | | — | | | — | | | — | | | — | | | — | | | — | | | — | | | — | | | — | | | (749.7 | ) |
Distributions to noncontrolling interests | | | — | | | — | | | — | | | — | | | — | | | — | | | — | | | (354.5 | ) | | (354.5 | ) | | — | |
Contributions from noncontrolling interests | | | — | | | — | | | — | | | — | | | — | | | — | | | — | | | 26.1 | | | 26.1 | | | — | |
Repurchase of noncontrolling interests, net of tax | | | — | | | — | | | (53.2 | ) | | — | | | — | | | — | | | — | | | (857.9 | ) | | (911.1 | ) | | — | |
Other comprehensive income (loss) | | | — | | | — | | | — | | | — | | | 285.6 | | | — | | | — | | | — | | | 285.6 | | | — | |
Net income (loss) | | | — | | | — | | | — | | | 1,195.5 | | | — | | | — | | | — | | | 335.9 | | | 1,531.4 | | | — | |
Balance, December 31, 2022 | | | 226,042 | | | 0.2 | | | 3,702.3 | | | (626.8 | ) | | 54.7 | | | 11,897 | | | (464.7 | ) | | 2,316.5 | | | 4,982.2 | | | — | |
Compensation on equity grants | | | — | | | — | | | 62.4 | | | — | | | — | | | — | | | — | | | — | | | 62.4 | | | — | |
Dividend equivalent rights | | | — | | | — | | | (2.3 | ) | | (1.6 | ) | | — | | | — | | | — | | | — | | | (3.9 | ) | | — | |
Shares issued under compensation program | | | 2,156 | | | — | | | — | | | — | | | — | | | — | | | — | | | — | | | — | | | — | |
Shares tendered for tax withholding obligations | | | (716 | ) | | — | | | — | | | — | | | — | | | 716 | | | (55.8 | ) | | — | | | (55.8 | ) | | — | |
Repurchases of common stock | | | (4,871 | ) | | — | | | — | | | — | | | — | | | 4,871 | | | (373.7 | ) | | — | | | (373.7 | ) | | — | |
Excise tax on repurchases of common stock | | | — | | | — | | | — | | | — | | | — | | | — | | | (2.7 | ) | | — | | | (2.7 | ) | | — | |
Common stock dividends | |
| |
| |
| |
| |
| |
| |
| |
| | | | | |
Dividends - $1.85 per share | | | — | | | — | | | — | | | (419.0 | ) | | — | | | — | | | — | | | — | | | (419.0 | ) | | — | |
Dividends in excess of retained earnings | | | — | | | — | | | (193.5 | ) | | 193.5 | | | — | | | — | | | — | | | — | | | — | | | — | |
Distributions to noncontrolling interests | | | — | | | — | | | — | | | — | | | — | | | — | | | — | | | (230.0 | ) | | (230.0 | ) | | — | |
Contributions from noncontrolling interests | | | — | | | — | | | — | | | — | | | — | | | — | | | — | | | 9.7 | | | 9.7 | | | — | |
Repurchase of noncontrolling interests, net of tax | | | — | | | — | | | (510.1 | ) | | — | | | — | | | — | | | — | | | (459.3 | ) | | (969.4 | ) | | — | |
Other comprehensive income (loss) | | | — | | | — | | | — | | | — | | | 30.9 | | | — | | | — | | | — | | | 30.9 | | | — | |
Net income (loss) | | | — | | | — | | | — | | | 1,345.9 | | | — | | | — | | | — | | | 233.4 | | | 1,579.3 | | | — | |
Balance, December 31, 2023 | | | 222,611 | | $ | 0.2 | | $ | 3,058.8 | | $ | 492.0 | | $ | 85.6 | | | 17,484 | | $ | (896.9 | ) | $ | 1,870.3 | | $ | 4,610.0 | | $ | — | |
See notes to consolidated financial statements.
TARGA RESOURCES CORP.
CONSOLIDATED STATEMENTS OF CHANGES IN OWNERS’ EQUITY AND SERIES A PREFERRED STOCK
| | | | | | | | | | | | | | | | | | | | | | | | | | | | | | | |
| | | | | | | | Retained | | Accumulated | | | | | | | | | | | |
| | | | | | Additional | | Earnings | | Other | | Treasury | | | | Total | | Series A | |
| | Common Stock | | Paid in | | (Accumulated | | Comprehensive | | Shares | | Noncontrolling | | Owners’ | | Preferred | |
| | Shares | | Amount | | Capital | | Deficit) | | Income (Loss) | | Shares | | Amount | | Interests | | Equity | | Stock | |
| | (In millions, except shares in thousands) | |
Balance, December 31, 2023 | | | 222,611 | | $ | 0.2 | | $ | 3,058.8 | | $ | 492.0 | | $ | 85.6 | | | 17,484 | | $ | (896.9 | ) | $ | 1,870.3 | | $ | 4,610.0 | | $ | — | |
Compensation on equity grants | | | — | | | — | | | 63.2 | | | — | | | — | | | — | | | — | | | — | | | 63.2 | | | — | |
Dividend equivalent rights | | | — | | | — | | | — | | | (3.8 | ) | | — | | | — | | | — | | | — | | | (3.8 | ) | | — | |
Shares issued under compensation program | | | 1,669 | | | — | | | — | | | — | | | — | | | — | | | — | | | — | | | — | | | — | |
Shares tendered for tax withholding obligations | | | (583 | ) | | — | | | — | | | — | | | — | | | 583 | | | (56.4 | ) | | — | | | (56.4 | ) | | — | |
Repurchases of common stock | | | (5,933 | ) | | — | | | — | | | — | | | — | | | 5,933 | | | (754.7 | ) | | — | | | (754.7 | ) | | — | |
Excise tax on repurchases of common stock | | | — | | | — | | | — | | | — | | | — | | | — | | | (6.4 | ) | | — | | | (6.4 | ) | | — | |
Common stock dividends | | | | | | | | | | | | | | | | | | | | | |
Dividends - $2.75 per share | | | — | | | — | | | — | | | (610.2 | ) | | — | | | — | | | — | | | — | | | (610.2 | ) | | — | |
Distributions to noncontrolling interests | | | — | | | — | | | — | | | — | | | — | | | — | | | — | | | (229.0 | ) | | (229.0 | ) | | — | |
Contributions from noncontrolling interests | | | — | | | — | | | — | | | — | | | — | | | — | | | — | | | 12.0 | | | 12.0 | | | — | |
Repurchase of noncontrolling interests, net of tax | | | — | | | — | | | (32.9 | ) | | — | | | — | | | — | | | — | | | (69.0 | ) | | (101.9 | ) | | — | |
Other comprehensive income (loss) | | | — | | | — | | | — | | | — | | | (58.1 | ) | | — | | | — | | | — | | | (58.1 | ) | | — | |
Net income (loss) | | | — | | | — | | | — | | | 1,312.0 | | | — | | | — | | | — | | | 241.5 | | | 1,553.5 | | | — | |
Balance, December 31, 2024 | | | 217,764 | | $ | 0.2 | | $ | 3,089.1 | | $ | 1,190.0 | | $ | 27.5 | | | 24,000 | | $ | (1,714.4 | ) | $ | 1,825.8 | | $ | 4,418.2 | | $ | — | |
See notes to consolidated financial statements.
TARGA RESOURCES CORP.
NOTES TO CONSOLIDATED FINANCIAL STATEMENTS
Except as noted within the context of each footnote disclosure, the dollar amounts presented in the tabular data within these footnote disclosures are stated in millions of dollars.
Note 1 — Organization and Operations
Our Organization
Targa Resources Corp. (NYSE: TRGP) owns, operates, acquires, and develops a diversified portfolio of complementary domestic infrastructure assets.
In this Annual Report, unless the context requires otherwise, references to “we,” “us,” “our,” “the Company,” “Targa” or “TRGP” are intended to mean our consolidated business and operations. TRGP controls the general partner of and owns all of the outstanding common units representing limited partner interests in Targa Resources Partners LP, referred to herein as the “Partnership”. Targa consolidates the Partnership and its subsidiaries under accounting principles generally accepted in the United States of America (“GAAP”), and the accompanying consolidated financial statements have been prepared under the rules and regulations of the SEC. Targa’s consolidated financial statements include differences from the consolidated financial statements of the Partnership. The most noteworthy differences are:
•the inclusion of the TRGP senior revolving credit facility and term loan facility;
•the inclusion of the TRGP senior unsecured notes;
•the inclusion of the TRGP commercial paper notes; and
•the impacts of TRGP’s treatment as a corporation for U.S. federal income tax purposes.
Our Operations
The Company is primarily engaged in the business of:
•gathering, compressing, treating, processing, transporting, and purchasing and selling natural gas;
•transporting, storing, fractionating, treating, and purchasing and selling NGLs and NGL products, including services to LPG exporters; and
•gathering, storing, terminaling, and purchasing and selling crude oil.
See Note 22 – Segment Information for certain financial information regarding our business segments.
Note 2 — Basis of Presentation
These accompanying financial statements and related notes present our consolidated financial position as of December 31, 2024 and 2023, and the results of operations, comprehensive income (loss), cash flows, and changes in owners’ equity for the years ended December 31, 2024, 2023 and 2022. We have prepared these consolidated financial statements in accordance with GAAP. All significant intercompany balances and transactions have been eliminated in consolidation. Certain amounts in prior periods have been reclassified to conform to the current year presentation.
Note 3 — Significant Accounting Policies
Consolidation Policy
Our consolidated financial statements include the accounts of all entities that we control and our proportionate interest in the accounts of certain gas gathering and processing facilities in which we own an undivided interest and are responsible for our proportionate share of the costs and expenses of the facilities. Third party ownership interests in our controlled subsidiaries are presented as noncontrolling interests within the equity section of our Consolidated Balance Sheets, except in the case of undivided interest ownership. In our Consolidated Statements of Operations and Consolidated Statements of Comprehensive Income (Loss), noncontrolling interests reflect the attribution of results to third-party investors. All intercompany balances and transactions have been eliminated in consolidation.
As of December 31, 2024, our consolidated joint ventures include the following:
Gathering and Processing Segment
•60% ownership interest in Centrahoma Processing LLC;
•55% ownership interest in Targa Badlands (see Note 4 – Acquisitions and Divestitures for additional information related to Targa Badlands);
•72.8% undivided interest in the assets of Targa Pipeline Mid-Continent WestTex LLC; and
•76.8% ownership interest in Venice Energy Services Company, LLC.
Logistics and Transportation Segment
•80% ownership interest in Targa Train 7 LLC.
We apply the equity method of accounting to investments over which we exercise significant influence over the operating and financial policies of our investee, but do not exercise control. We evaluate our equity investments for impairment when evidence indicates the carrying amount of our investment is no longer recoverable. Evidence of a loss in value might include, but would not necessarily be limited to, absence of an ability to recover the carrying amount of the investment or inability of the equity method investee to sustain an earnings capacity that would justify the carrying amount of the investment. When the estimated fair value of an equity investment is less than its carrying value and the loss in value is determined to be other than temporary, we recognize the excess of the carrying value over the estimated fair value as a non-cash pre-tax impairment loss within Equity earnings (loss) in our Consolidated Statements of Operations.
As of December 31, 2024, our investments in unconsolidated affiliates include the following:
Gathering and Processing Segment
•50% ownership interest in Little Missouri 4 LLC (“Little Missouri 4”).
Logistics and Transportation Segment
•50% ownership interest in Cayenne Pipeline, LLC (“Cayenne”);
•38.8% ownership interest in Gulf Coast Fractionators (“GCF”); and
•17.5% ownership interest in Blackcomb as defined in Note 4 – Acquisitions and Divestitures.
Use of Estimates
The preparation of financial statements in conformity with GAAP requires management to make estimates and assumptions that affect the amounts reported in these financial statements and accompanying notes. Estimates and judgments are based on information available at the time such estimates and judgments are made. Changes in facts and circumstances may result in revised estimates and actual results could differ materially from those estimates. Estimates and judgments are used in, among other things, (i) estimating unbilled revenues, product purchases, property, plant and equipment, operating and general and administrative cost accruals, (ii) developing fair value assumptions, including estimates of future cash flows and discount rates, (iii) analyzing long-lived assets for possible impairment, (iv) estimating the useful lives of assets and (v) estimating contingencies, guarantees and indemnifications.
Cash and Cash Equivalents
Cash and cash equivalents include all cash on hand, demand deposits, and short-term, highly liquid investments that are readily convertible into cash, and have original maturities of three months or less.
Allowance for Credit Losses
Estimated losses on accounts receivable are provided through an allowance for credit losses. We estimate the allowance for credit losses through various procedures, including extensive review of our trade receivable balances by counterparty, assessing economic events and conditions, our historical experience with counterparties, the counterparty’s financial condition and the amount and age of past due accounts.
We continuously evaluate our ability to collect amounts owed to us. Receivables are considered past due if full payment is not received by the contractual due date. Our evaluation procedures also include performing account reconciliations, dispute resolution and payment confirmation.
As the financial condition of any counterparty changes, circumstances develop or additional information becomes available, adjustments to our allowance may be required.
Inventories
Our inventories consist primarily of NGL product inventories, which are valued at the lower of cost or net realizable value, using the average cost method. Most NGL product inventories turn over monthly, but some inventory, primarily propane, is acquired and held during the year to meet anticipated heating season requirements of our customers. Commodity inventories that are not physically or contractually available for sale under normal operations (“deadstock”) are included in Property, plant and equipment.
Product Exchanges
Exchanges of NGL products are executed to satisfy timing and logistical needs of the exchange parties. Volumes received and delivered under exchange agreements are recorded as inventory. If the locations of receipt and delivery are in different markets, an exchange differential may be billed or owed. The exchange differential is recorded as either accounts receivable or accrued liabilities.
Derivative Instruments
We utilize derivative instruments to manage the volatility of our cash flows due to fluctuating energy commodity prices. For balance sheet classification purposes, we analyze the fair values of the derivative instruments on a contract by contract basis and report the related fair values and any related collateral by counterparty on a gross basis. Cash flows from derivative instruments designated as hedges are recognized in the same financial statement line item as the cash flows from the respective item being hedged.
We formally document all relationships between hedging instruments and hedged items, as well as its risk management objectives and strategy for undertaking the hedge. This documentation includes the specific identification of the hedging instrument and the hedged item, the nature of the risk being hedged and the manner in which the hedging instrument’s effectiveness will be assessed. At the inception of the cash flow hedging relationship and on an ongoing basis, we assess whether the derivatives used in hedging transactions are highly effective in achieving the offset of changes in cash flows attributable to the hedged risk.
We record all derivative instruments at fair value with the exception of those that we apply the normal purchases and normal sales election.
The table below summarizes the accounting treatment for our derivative instruments, and the impact on our consolidated financial statements:
| | |
Recognition and Measurement |
Derivative Treatment | Balance Sheet | Income Statement |
Normal Purchases and Normal Sales | Fair value not recorded | Earnings recognized when volumes are physically delivered or received |
Mark-to-Market | Recorded at fair value | Change in fair value recognized currently in earnings |
Cash Flow Hedge | Recorded at fair value with changes in fair value deferred in Accumulated Other Comprehensive Income (“AOCI”) | The gain/loss on the derivative instrument is reclassified out of AOCI into earnings when the forecasted transaction occurs |
We will discontinue cash flow hedge accounting on a prospective basis when a hedge instrument is terminated, ceases to be highly effective or the forecasted transaction is no longer probable to occur. Gains and losses deferred in AOCI related to cash flow hedges for which hedge accounting has been discontinued remain deferred until the forecasted transaction occurs. If it is probable that a hedged forecasted transaction will not occur, deferred gains or losses on the hedging instrument in AOCI are reclassified to earnings immediately.
Fair Value Measurements
We categorize the inputs to the fair value measurements of financial assets and liabilities at each balance sheet reporting date using a three-tier fair value hierarchy that prioritizes the significant inputs used in measuring fair value:
•Level 1 – observable inputs such as quoted prices in active markets;
•Level 2 – inputs other than quoted prices in active markets that we can directly or indirectly observe to the extent that the markets are liquid for the relevant settlement periods; and
•Level 3 – unobservable inputs in which little or no market data exists, therefore we must develop our own assumptions.
For valuations that include both observable and unobservable inputs, if the unobservable input is determined to be significant to the overall inputs, the entire valuation is categorized in Level 3. This includes derivatives valued using indicative price quotations whose contract length extends into unobservable periods.
Swaps that do not have observable market prices or implied volatilities for substantially the full term of the derivative asset or liability are reported at fair value using Level 3 inputs. The fair value of these swaps is determined using a discounted cash flow valuation technique based on a commodity forward curve, which is based on observable or public data sources and extrapolated when observable prices are not available.
Property, Plant and Equipment
Property, plant and equipment is recorded at acquisition cost less accumulated depreciation. Depreciation is computed using the straight-line method over the estimated useful lives of the assets. The determination of the useful lives of property, plant and equipment requires us to make various assumptions, including our expected use of the asset and the supply of, and demand for, hydrocarbons in the markets served, normal wear and tear of the facilities, and the extent and frequency of maintenance programs. Upon disposition or retirement of property, plant and equipment, any gain or loss is recorded to Other operating (income) expense in the Consolidated Statements of Operations.
Expenditures for routine maintenance and repairs are expensed as incurred. Expenditures to refurbish an asset that increases its existing service potential or prevents environmental contamination are capitalized and depreciated over the remaining useful life of the asset or major asset component. Certain costs directly related to the construction of assets, including internal labor costs, interest and engineering costs, are capitalized.
Impairment of Long-Lived Assets
We evaluate long-lived assets, including intangible assets, for impairment when events or changes in circumstances indicate our carrying amount of an asset may not be recoverable, including changes to our estimates that could have an impact on our assessment of asset recoverability. Asset recoverability is measured by comparing the carrying value of the asset or asset group with its expected future pre-tax undiscounted cash flows. Individual assets are grouped at the lowest level for which the related identifiable cash flows are largely independent of the cash flows of other assets and liabilities. These cash flow estimates require us to make judgments and assumptions related to operating and cash flow results, economic obsolescence, the business climate, contractual, legal and other factors.
If the carrying amount exceeds the expected future undiscounted cash flows, we recognize a non-cash pre-tax impairment loss equal to the excess of net book value over fair value. The estimated cash flows used to assess recoverability of our long-lived assets and measure fair value of our asset groups are derived from current business plans, which are developed using near-term price and volume projections reflective of the current environment and management's projections for long-term average prices and volumes. In addition to near and long-term price assumptions, other key assumptions include volume projections, operating costs, timing of incurring such costs, and the use of an appropriate terminal value and discount rate. Any changes we make to these projections and assumptions could result in significant revisions to our evaluation of recoverability of our long-lived assets and the recognition of additional impairments. We believe our estimates and models used to determine fair value are similar to what a market participant would use.
Goodwill
Goodwill is a residual intangible asset that results when the cost of an acquisition exceeds the fair value of the net identifiable assets of the acquired business. Goodwill is not subject to amortization but is tested for impairment at least annually. This test requires us to attribute goodwill to an appropriate reporting unit, which is an operating segment or one level below an operating segment (also known as a component). We evaluate goodwill for impairment on November 30 of each year, or whenever impairment indicators are present. If applicable, prior to us conducting the goodwill impairment test, we complete a review of the carrying values of our long-lived assets, including property, plant and equipment and other intangible assets. If it is determined that the carrying values are not recoverable, we reduce the carrying values of the long-lived assets pursuant to our policy on impairment of long-lived assets.
As part of our goodwill impairment test, we may first assess qualitative factors to determine if the quantitative goodwill impairment test is necessary. If we choose to bypass this qualitative assessment or determine that a goodwill impairment test is required, our annual goodwill impairment test is performed by comparing the fair value of a reporting unit with its carrying amount (including attributed goodwill). We recognize an impairment loss in our Consolidated Statements of Operations and a corresponding reduction of goodwill on our Consolidated Balance Sheets for the amount by which the carrying amount exceeds the reporting unit’s fair value. The goodwill impairment loss will not exceed the total amount of goodwill allocated to that reporting unit. Additionally, when measuring goodwill, we consider income tax effects from any tax-deductible goodwill on the carrying amount of the reporting unit, if applicable.
Intangible Assets
Our intangible assets include producer dedications under long-term contracts and customer relationships associated with business and asset acquisitions. The fair value of these acquired intangible assets were determined at the date of acquisition based on the present values of estimated future cash flows. We amortize the costs of our assets in a manner that closely resembles the expected benefit pattern of the intangible assets or on a straight-line basis, where such pattern is not readily determinable, over the periods in which we benefit from services provided to customers.
Asset Retirement Obligations
Asset retirement obligations (“AROs”) are legal obligations associated with the retirement of tangible long-lived assets that result from their acquisition, construction, development and/or normal operation. We record a liability and increase the basis in the underlying asset for the present value of each expected ARO when there is a legal obligation to settle under existing or enacted law, statute, written or oral contract or by legal construction.
For certain assets, we cannot reasonably estimate the fair value of the ARO because the associated assets have indeterminate lives based on our expected continued use of the assets with proper maintenance. Assets with indeterminate useful lives include: (i) assets constructed on land owned by Targa, and (ii) active pipelines. Our intent and practice is to maintain our assets to prolong their useful lives. Management expects demand for hydrocarbons, both domestically and internationally, to exist for the foreseeable future. We record AROs for these assets in the period in which sufficient information becomes available for us to reasonably estimate the settlement dates.
Our obligations are estimated based on discounted cash flow (“DCF”) estimates. Over time, the ARO liability is accreted to its present value as a period cost and the capitalized amount is depreciated over the asset’s respective useful life. At least annually, we review the projected timing and amount of AROs and reflect revisions as an increase or decrease in the carrying amount of the liability and the basis in the underlying asset. Upon settlement, we recognize any difference between the recorded amount and the actual settlement cost as a gain or loss.
Debt Issuance Costs
Costs incurred in connection with the issuance of long-term debt and any original issue discount or premium are deferred and charged to interest expense over the term of the related debt. Debt issuance costs related to revolving credit facilities and the $1.5 billion unsecured term loan facility due July 2025 (the “Term Loan Facility”) are amortized on a straight-line basis and those related to long-term debt are amortized using the effective-interest method. Debt issuance costs related to revolving credit facilities are presented as other long-term assets, and debt issuance costs related to long-term debt obligations with scheduled maturities are reflected as a deduction to the carrying amount of long-term debt on the Consolidated Balance Sheets. Gains or losses on debt repurchases, redemptions and debt extinguishments include the write-off of any associated unamortized debt issuance costs.
Accounts Receivable Securitization Facility
Proceeds from the sale or contribution of certain receivables under the Partnership’s accounts receivable securitization facility (the “Securitization Facility”) are treated as collateralized borrowings in our financial statements. Proceeds and repayments under the Securitization Facility are reflected as cash flows from financing activities in our Consolidated Statements of Cash Flows.
Commercial Paper Program
Under the terms of the unsecured commercial paper note program (the “Commercial Paper Program”), we may issue, from time to time, unsecured commercial paper notes with varying maturities of less than one year. Amounts available under the Commercial Paper Program may be issued, repaid, and re-issued from time to time, with the maximum aggregate face or principal amount outstanding at any one time not to exceed $3.5 billion, subject to documentation requirements of the Commercial Paper Program. We maintain a minimum available borrowing capacity under the $3.5 billion TRGP senior revolving credit facility (the “New TRGP Revolver” as defined in Note 8 – Debt Obligations) equal to the aggregate amount outstanding under the Commercial Paper Program to support our issued commercial paper notes. The Commercial Paper Program is guaranteed by each subsidiary that guarantees the New TRGP Revolver.
The outstanding borrowings of the commercial paper program are classified as noncurrent because we have the intent and ability to refinance the borrowings on a long-term basis through the New TRGP Revolver. We confirm, on a quarterly basis, that there is sufficient liquidity under the New TRGP Revolver to refinance outstanding borrowings of the Commercial Paper Program and such liquidity is not overcommitted for other anticipated uses.
As the outstanding borrowings of the Commercial Paper Program are included as part of long-term debt (i.e., classified as noncurrent), we report Commercial Paper Program borrowings and repayments gross on the Consolidated Statements of Cash Flows (consistent with the presentation of cash flows associated with the revolving credit facility).
Environmental Liabilities and Other Loss Contingencies
We accrue a liability for loss contingencies, including environmental remediation costs arising from claims, assessments, litigation, fines, penalties and other sources, when the loss is probable and reasonably estimable.
Income Taxes
We file many income tax returns with the U.S. Department of the Treasury, as well as numerous states. We are required to estimate our income taxes in each of the jurisdictions in which we operate. This process involves estimating our actual current tax payable and related tax expense, together with assessing temporary differences resulting from differing treatment of certain items, such as depreciation, for tax and accounting purposes. These differences can result in deferred tax assets and liabilities, which are reported on a net basis by jurisdiction within our Consolidated Balance Sheets. We report these timing differences based on statutory tax rates applicable to the scheduled timing difference reversal periods.
We assess the likelihood that we will recover our deferred tax assets from future taxable income. We establish a valuation allowance if we believe that it is more likely than not (a likelihood of more than 50 percent) that some portion or all of the deferred tax assets will not be realized. Any change in the valuation allowance would impact our income tax provision and net income in the period in which such a determination is made. We consider all available evidence to determine whether, based on the weight of the evidence, we need a valuation allowance. Evidence used includes information about our current financial position and our results of operations for the current and preceding years, as well as all currently available information about future years, including our anticipated future performance, the reversal of deferred tax liabilities and tax planning strategies.
Dividends
Preferred and common dividends declared are recorded as a reduction of retained earnings to the extent that retained earnings was available at the close of the prior quarter, with any excess recorded as a reduction of additional paid-in capital.
Comprehensive income includes net income and other comprehensive income (loss) (“OCI”), which includes changes in the fair value of derivative instruments that are designated as cash flow hedges.
Revenue Recognition
Our operating revenues are primarily derived from the following activities:
•sales of natural gas, NGLs, condensate and crude oil;
•services related to compressing, gathering, treating, and processing of natural gas; and
•services related to NGL fractionation, terminaling and storage, transportation and treating.
We have multiple types of contracts with commercial counterparties and many of these contracts contain embedded fees with settlement provisions that deduct these fees from the sales price paid by Targa in exchange for commodities. The commercial relationship of the counterparty in such contracts is inherently one of a supplier, rather than a customer, and therefore, such contracts are excluded from the provisions of the revenue recognition guidance in Topic 606, Revenue from Contracts with Customers. Any cash inflows or fees that are realized on these supply type contracts are reported as a reduction of Product purchases and fuel.
Our revenues, therefore, are measured based on consideration specified in a contract with parties designated as customers. We recognize revenue when we satisfy a performance obligation by transferring control over a commodity or service to a customer. Sales and other taxes we collect, that are both imposed on and concurrent with revenue-producing activities, are excluded from revenues.
We generally report sales revenues on a gross basis in our Consolidated Statements of Operations, as we typically act as the principal in the transactions where we receive and control commodities. However, buy-sell transactions that involve purchases and sales of inventory with the same counterparty, which are legally contingent or in contemplation of one another, as well as other instances where we do not control the commodities, but rather are acting as an agent to the supplier, are reported as a single revenue transaction on a combined net basis.
Our commodity sales contracts typically contain multiple performance obligations, whereby each distinct unit of commodity to be transferred to the customer is a separate performance obligation. Under such contracts, revenue is recognized at the point in time each unit is transferred to the customer because the customer is able to direct the use of, and obtain substantially all of the remaining benefits from, the commodity at that time. In certain instances, it may be determinable that the customer receives and consumes the benefits of each unit as it is transferred. Under such contracts, we have a single performance obligation comprised of a series of distinct units of commodity; and in such instance, revenue is recognized over time using the units delivered output method, as each distinct unit is transferred to the customer. Our commodity sales contracts are typically priced at a market index, but may also be set at a fixed price. When our sales are priced at a market index, we apply the allocation exception for variable consideration and allocate the market price to each distinct unit when it is transferred to the customer. The fixed price in our commodity sales contracts generally represents the standalone selling price, and therefore, when each distinct unit is transferred to the customer, we recognize revenue at the fixed price.
Our service contracts typically contain a single performance obligation. The underlying activities performed by us are considered inputs to an integrated service and not separable because such activities in combination are required to successfully transfer the single overall service that the customer has contracted for and expects to receive. Therefore, the underlying activities in such contracts are not considered to be distinct services. However, in certain instances, the customer may contract for additional distinct services and therefore additional performance obligations may exist. In such instances, the transaction price is allocated to the multiple performance obligations based on their relative standalone selling prices. The performance obligation(s) in our service contracts is a series of distinct days of the applicable service over the life of the contract (fundamentally a stand-ready service), whereby we recognize revenue over time using an output method of progress based on the passage of time (i.e., each day of service). This output method is appropriate because it directly relates to the value of service transferred to the customer to date, relative to the remaining days of service promised under the contract.
The transaction price for our service contracts is typically comprised of variable consideration, which is primarily dependent on the volume and composition of the commodities delivered and serviced. The variable consideration is generally commensurate with our efforts to perform the service and the terms of the variable payments relate specifically to our efforts to satisfy each day of distinct service. Therefore, the variable consideration is typically not estimated at contract inception, but rather the allocation exception for variable consideration is applied, whereby the variable consideration is allocated to each day of service and recognized as revenue when each day of service is provided. When we are entitled to noncash consideration in the form of commodities, the variability related to the form of consideration (market price) and reasons other than form (volume and composition) are interrelated to the service, and therefore, we measure the noncash consideration at the point in time when the volume, mix and market price related to the commodities retained in-kind are known. This results in the recognition of revenue based on the market price of the commodity when the service is performed. In addition, if the transaction price includes a fixed component (i.e., a fixed capacity reservation fee), the fixed component is recognized ratably on a straight-line basis over the contract term, as each day of service has elapsed, which is consistent with the output method of progress selected for the performance obligation.
Our customers are typically billed on a monthly basis, or earlier, if final delivery and sale of commodities is made prior to month-end, and payment is typically due within 10 to 30 days. As a practical matter, we define the unit of account for revenue recognition purposes based on the passage of time ranging from one month to one quarter, rather than each day. This is because the financial reporting outcome is the same regardless of whether each day or month/quarter is treated as the distinct service in the series. That is, at the end of each month or quarter, the variability associated with the amount of consideration for which we are entitled to, is resolved, and can be included in that month or quarter’s revenue.
We have certain long-term contractual arrangements under which we have received consideration, but for which all conditions for revenue recognition have not been met. These arrangements result in deferred revenue, which will be recognized over the periods that performance will be provided.
We also have certain contracts that contain provisions in which customers provide contributions in aid of construction in exchange for Targa constructing assets to fulfill the services in the contract. In general, these arrangements result in deferred revenue, which will be recognized over the contract term.
We classify our contract assets as receivables because we generally have an unconditional right to payment for the commodities sold or services performed at the end of the reporting period.
We enter into various contractual arrangements that result in the transfer of assets for no upfront compensation or cash payments, resulting in more favorable long-term contractual terms. The fair value of the assets transferred is reflected as long-term contract assets. These deferred amounts are amortized over the term of the related contract into the appropriate revenue or cost of sales accounts.
Share-Based Compensation
We award share-based compensation to employees and non-employee directors in the form of restricted stock, restricted stock units and performance share units. Compensation expense on our equity-classified awards is recorded at grant-date fair value. Compensation expense is recognized in general and administrative expense over the requisite service period of each award, and forfeitures are recognized as they occur. We may purchase a portion of the shares issued to satisfy employees’ tax withholding obligations on vested awards. These shares are recorded in treasury stock, at cost, and cash paid is classified as a financing activity in our Consolidated Statements of Cash Flows. All excess tax benefits and tax deficiencies related to share-based compensation are recognized as income tax benefit or expense in our Consolidated Statements of Operations, with the tax effects of exercised or vested awards treated as discrete items in the reporting period which they occur. Excess tax benefits are classified as an operating activity in our Consolidated Statements of Cash Flows.
Earnings per Share
We calculate basic earnings (loss) per common share (“EPS”) using the two-class method, which is an earnings allocation formula that determines net income (loss) per share for each class of common stock and participating security according to dividends declared and participation rights in undistributed earnings. Our participating securities consist of unvested restricted stock units that vest no later than three years following grant date as well as certain four-year retention awards that participate in nonforfeitable dividends with the common equity owners.
EPS is net income (loss) attributable to common shareholders less earnings allocated to participating securities divided by the sum of the weighted-average number of common shares outstanding. Earnings are allocated to common stock and participating securities based on the amount of dividends paid in the current period plus an allocation of the undistributed earnings to the extent that each security participates in earnings. Diluted EPS includes any dilutive effect of preferred stock, unvested restricted stock, restricted stock units and performance share units. The dilutive effect is calculated through the application of the two-class method. During a period of net loss or negative undistributed earnings, the two-class method is not applicable.
Leases
We recognize the following for all leases (with the exception of short-term leases) at the commencement date:
•A lease liability, which is a lessee’s obligation to make lease payments arising from a lease.
•A right-of-use asset, which is an asset that represents the lessee’s right to use, or control the use of, a specified asset for the lease term.
We determine if an arrangement is or contains a lease at inception. Leases with an initial term of twelve months or less are considered short-term leases, which are excluded from the balance sheet. Right-of-use assets and lease liabilities are recognized at the
commencement date based on the present value of future lease payments over the lease term. The right-of-use asset also includes any lease prepayments and excludes lease incentives. We made an accounting policy election to combine lease and non-lease components for both arrangements in which Targa is the lessee or lessor. As most of the Company’s leases do not provide an implicit interest rate, we use our incremental borrowing rate as the discount rate to compute the present value of our lease liability. The discount rate applied is determined based on information available on the date of adoption for all leases existing as of that date, and on the date of lease commencement for all subsequent leases.
Our lease arrangements may include variable lease payments based on an index or market rate, or may be based on performance. For variable lease payments based on an index or market rate, we estimate and apply a rate based on information available at the commencement date. Variable lease payments based on performance are excluded from the calculation of the right-of-use asset and lease liability, and are recognized in our Consolidated Statements of Operations when the contingency underlying such variable lease payments is resolved. Our lease terms may include options to extend or terminate the lease. Such options are included in the measurement of our right-of-use asset and liability at commencement, provided we determine that we are reasonably certain to exercise the option.
45Q Tax Credits
We earn tax credits under Internal Revenue Code Section 45Q through our carbon capture and sequestration activities. We recognize 45Q tax credits by analogy to the grant model within International Accounting Standard 20, Accounting for Government Grants and Disclosure Assistance, as other operating income in our Consolidated Statements of Operations based on the volume of captured carbon sequestered and dollar value of the tax credit during the period in which captured carbon is sequestered underground. We recognize realized 45Q tax credits as a reduction to income taxes payable because the tax credits reduce Targa’s future quarterly estimated cash tax payments.
Recent Accounting Pronouncements
Recently Adopted Accounting Pronouncements
Improvements to Reportable Segment Disclosures
In November 2023, the FASB issued ASU 2023-07, Segment Reporting (Topic 280): Improvements to Reportable Segment Disclosures. The amendments in this update require, among other items, that public entities disclose, on an annual and interim basis, significant segment expenses that are regularly provided to the chief operating decision maker (“CODM”) and included within each reported measure of segment profit or loss.
These amendments are effective for fiscal years beginning after December 15, 2023, and for interim periods within fiscal years beginning after December 15, 2024, with early adoption permitted. The disclosures required in the amendments apply retrospectively to all prior periods presented in the financial statements. We adopted this ASU on October 1, 2024, and applied the amendments to all prior periods presented in our consolidated financial statements. See Note 22 – Segment Information.
Recently issued accounting pronouncements not yet adopted
Improvements to Income Tax Disclosures
In December 2023, the FASB issued ASU 2023-09, Income Taxes (Topic 740): Improvements to Income Tax Disclosures. The amendments in this update require, among other items, that public entities disclose, on an annual and interim basis, (i) specific categories of income taxes in the rate reconciliation, and (ii) a disaggregation of income taxes paid by federal, state, and foreign taxes.
These amendments are effective for fiscal years beginning after December 15, 2024, with early adoption permitted. The amendments are required to be applied prospectively with retrospective application permitted. We are evaluating the effect of the amendments on our consolidated financial statements and expect to disclose the required information beginning in the Annual Report on Form 10-K for the year ended December 31, 2025. The impact of the adoption will be limited to disclosure in the notes to consolidated financial statements.
Disaggregation - Income Statement Expenses
In November 2024, the FASB issued ASU 2024-03, Comprehensive income (Topic 220): Disaggregation of Income Statement Expenses. The amendments in this update require, among other items, that public entities disclose, on an annual and interim basis, in tabular format in the footnotes to the financial statements, disaggregated information about specific categories underlying certain income statement expense line items that contain any of the following expense categories (i) purchases of inventory, (ii) employee compensation, (iii) depreciation, (iv) intangible asset amortization, and (v) depletion. Additionally, the amendments require disclosure of the total amount of selling expenses and an annual disclosure of the definition of selling expenses.
These amendments are effective for fiscal years beginning after December 15, 2026, and for interim periods within fiscal years beginning after December 15, 2027, with early adoption permitted. The disclosures may be applied either prospectively or retrospectively to any or all prior periods presented in the financial statements. We are evaluating the effect of the amendments on our notes to consolidated financial statements and expect to disclose the required information for fiscal years beginning in the Annual Report on Form 10-K for the year ended December 31, 2027 and for interim periods beginning in the Quarterly Report on Form 10-Q for the quarter ended March 31, 2028. The impact of the adoption will be limited to disclosure in the notes to consolidated financial statements.
Note 4 — Acquisitions and Divestitures
Delaware Basin Acquisition
In July 2022, we completed the acquisition of all of the interests in Lucid Energy Delaware, LLC (“Lucid”) from Riverstone Holdings LLC and Goldman Sachs Asset Management for approximately $3.5 billion in cash (the “Delaware Basin Acquisition”), subject to customary closing adjustments. We received a final net working capital adjustment payment of approximately $11.4 million in the fourth quarter of 2022. We funded the acquisition with (i) $1.5 billion in proceeds drawn under the Term Loan Facility, which was terminated in May 2024, (ii) $750.0 million in aggregate principal amount of our 5.200% Senior Unsecured Notes due 2027 (the “5.200% Notes”) and $500.0 million in aggregate principal amount of our 6.250% Senior Unsecured Notes due 2052 (the “6.250% Notes”) pursuant to an underwritten public offering that closed in July 2022 and (iii) $800.0 million drawn on the $2.75 billion senior revolving credit facility entered into with Bank of America, N.A., as the Administrative Agent, Collateral Agent, and Swing Line Lender, and the other lenders party thereto in February 2022 (the “Existing TRGP Revolver”). We recorded $16.9 million of debt issuance costs related to the Term Loan Facility, the 5.200% Notes and the 6.250% Notes in our Consolidated Balance Sheets. See Note 8 – Debt Obligations for further details on our financing activities.
The assets acquired in the Delaware Basin Acquisition provide natural gas gathering, treating, and processing services in the Delaware Basin, through owning and operating approximately 1,050 miles of natural gas pipelines and approximately 1.4 billion cubic feet per day (“Bcf/d”) of cryogenic natural gas processing capacity primarily in Eddy and Lea counties of New Mexico. The Delaware Basin Acquisition assets increased our footprint in the Delaware Basin and are integrated into our Permian Delaware operations.
The Delaware Basin Acquisition was accounted for under the acquisition method in accordance with ASC 805, Business Combinations, which requires, among other things, assets acquired and liabilities assumed to be recorded at their fair value on the acquisition date. The valuation of the acquired assets and liabilities was prepared using fair value methods and assumptions, including projections of future production volumes, commodity prices, and other cash flows, market-participant assumptions (e.g., discount rate and exit multiple), expectations regarding customer contracts and relationships, tangible asset replacement costs, and other management estimates. The fair value measurements of assets acquired and liabilities assumed are based on inputs that are not observable in the market and therefore represent Level 3 inputs, as defined in Note 14 – Fair Value Measurements. These inputs require judgments and estimates at the time of a fair value assessment is required.
The following table summarizes the purchase price allocation based on the final fair values assigned to assets acquired and liabilities assumed (in millions):
| | | |
Cash and cash equivalents | $ | 9.9 | |
Trade receivables, net of allowances (1) | | 211.0 | |
Other current assets | | 3.5 | |
Property, plant and equipment, net | | 1,669.0 | |
Intangible assets, net | | 1,882.0 | |
Other long-term assets | | 57.3 | |
Current liabilities | | (236.7 | ) |
Other long-term liabilities | | (100.7 | ) |
Purchase price | $ | 3,495.3 | |
(1)The fair value of the assets acquired included trade receivables of $211.0 million. The gross amount due under contract was $213.4 million, of which $2.4 million was expected to be uncollectible. Trade receivables, net of allowances, excluded $18.5 million that was due from Targa. We reflected this settlement of a preexisting relationship as a reduction of the purchase price in accordance with ASC 805.
The value of property, plant and equipment is determined using the cost approach and is primarily comprised of Gathering and Processing assets that will be depreciated on a straight-line basis over an estimated weighted-average useful life of 20 years. The associated useful lives of property, plant and equipment were based on the period over which the assets are expected to contribute directly or indirectly to our future cash flows.
The value of intangible assets is comprised of customer relationships, which represent estimated value of long-term contracts with customers that will be amortized in a manner that closely resembles the expected benefit pattern of the intangible assets over an estimated useful life of 14 years. The associated useful lives of intangible assets were based on the period over which the assets are expected to contribute directly or indirectly to our future cash flows. The fair value of customer relationships was determined at the date of acquisition based on the present value of estimated future cash flows using the multi-period excess earnings method. The significant assumptions used by management in determining the fair value of customer relationships intangible assets include future revenues, discount rate, and customer attrition rates.
The fair values of the tangible and intangible assets are Level 3 measurements in the fair value hierarchy. The fair value of the intangible assets was determined by applying a discounted cash flow approach, which utilized a discount rate of approximately 19% based on our estimate of the risk that a theoretical market participant would assign to the intangible assets, and customer attrition rates of approximately 5%.
The results of operations attributable to the assets and liabilities acquired in the Delaware Basin Acquisition have been included in our consolidated financial statements as part of our Permian Delaware operations in the Gathering and Processing segment since the date of the acquisition. Revenue and Net Income attributable to the assets acquired for the period August 1, 2022 through December 31, 2022 were $374.1 million and $7.9 million, respectively. As of December 31, 2022, we had incurred $14.4 million of acquisition-related costs.
Unaudited Pro Forma Financial Information
The following unaudited pro forma summary presents the consolidated results of operations for the year ended December 31, 2022 as if the Delaware Basin Acquisition had occurred on January 1, 2021. The unaudited pro forma financial information is presented for informational purposes only and is not necessarily indicative of our results of operations that would have occurred had the transaction been consummated at the beginning of the period presented, nor is it necessarily indicative of future results.
| | | |
| Year Ended December 31, 2022 | |
| Pro Forma | |
Revenues | $ | 21,268.9 | |
Net income | | 1,477.4 | |
The summarized unaudited pro forma information has been calculated after applying our accounting policies and reflects adjustments for the following:
•Reflects depreciation and amortization based on the fair values of property, plant and equipment and intangible assets, respectively. Property, plant and equipment are depreciated utilizing a straight-line approach. Intangible assets are amortized in a manner that closely resembles their expected benefit pattern;
•Excludes $14.4 million of acquisition-related costs incurred as of December 31, 2022 from pro forma net income for the year ended December 31, 2022;
•Excludes the impact of operations previously sold by Lucid, prior to Targa’s acquisition of Lucid;
•Excludes the impact of historical activity between Targa and Lucid, prior to Targa’s acquisition of Lucid;
•Excludes general and administrative expense related to Lucid’s former parent company, which Targa did not acquire;
•Excludes amortization of interest expense and debt issuance costs associated with Lucid’s debt, which was not assumed by Targa;
•Includes interest expense and debt issuance cost amortization associated with Targa’s borrowings to finance the Delaware Basin Acquisition; and
•Reflects the income tax effects of the above pro forma adjustments.
South Texas Acquisition
In April 2022, we completed the acquisition of Southcross Energy Operating LLC and its subsidiaries (“Southcross”) for a purchase price of $201.9 million (the “South Texas Acquisition”), subject to customary closing adjustments. We made a final net working capital adjustment payment of approximately $1.5 million in the fourth quarter of 2022. We acquired a portfolio of complementary midstream
infrastructure assets and associated contracts that have been integrated into our SouthTX Gathering and Processing operations, including the remaining interests in the two joint ventures in South Texas that we previously held as investments in unconsolidated affiliates and that have been consolidated beginning in the second quarter of 2022. We accounted for the purchase as an asset acquisition and capitalized $1.8 million of acquisition-related costs and assumed liabilities of $1.8 million as components of the cost of assets acquired. We allocated $28.1 million to our purchase of Southcross’ interest in the two joint ventures for purposes of consolidation and $169.7 million, $3.9 million and $5.3 million of the residual cost to property, plant and equipment, current assets and liabilities, net and other non-current assets, respectively. See Note 7 – Investments in Unconsolidated Affiliates for further discussion on South Texas Acquisition.
Joint Ventures Acquisitions and Divestitures
In February 2018, we formed three development joint ventures (“DevCo JVs”) with investment vehicles affiliated with Stonepeak Infrastructure Partners (“Stonepeak”) to fund portions of Grand Prix NGL Pipeline (“Grand Prix”), Gulf Coast Express Pipeline (“GCX”) and a 110 MBbl/d fractionator in Mont Belvieu, Texas (“Train 6”). For a four-year period beginning on the date that all three projects commenced commercial operations, we had the option to acquire all or part of Stonepeak’s interests in the DevCo JVs (the “DevCo JV Call Right”). The purchase price payable for such partial or full interests was based on a predetermined fixed return or multiple on invested capital, including distributions received by Stonepeak from the DevCo JVs.
In January 2022, we exercised the DevCo JV Call Right and closed on the purchase of all of Stonepeak’s interests in the DevCo JVs for $926.3 million (the “DevCo JV Repurchase”). Following the DevCo JV Repurchase, we owned a 75% interest in the Permian to Mont Belvieu segment of Grand Prix through Grand Prix Pipeline LLC (the “Grand Prix Joint Venture”) (prior to the Grand Prix Transaction, as defined below), a 100% interest in Train 6 and a 25% equity interest in GCX (prior to the GCX Sale as defined below in February 2022). The changes in our ownership interests were accounted for as equity transactions representing the acquisitions of noncontrolling interests. The amount of the redemption price in excess of the carrying amount, net of tax was $53.2 million, which was accounted for as a premium on repurchase of noncontrolling interests, and resulted in a reduction to Net income (loss) attributable to common shareholders.
In May 2022, we completed the sale of Targa GCX Pipeline LLC, which held a 25% equity interest in GCX, to a third party for $857.0 million (the “GCX Sale”). As a result of the GCX Sale, we recognized a gain of $435.9 million in Gain (loss) from sale of equity method investment in our Consolidated Statements of Operations in 2022. See Note 7 – Investments in Unconsolidated Affiliates for further discussion on the GCX Sale.
In January 2023, we completed the acquisition of Blackstone Energy Partners’ 25% interest in the Grand Prix Joint Venture (the “Grand Prix Transaction”) for aggregate consideration of $1.05 billion in cash and a final closing adjustment of $41.9 million. Following the closing of the Grand Prix Transaction, we own 100% of the interest in Grand Prix. The change in our ownership interests was accounted for as an equity transaction representing the acquisition of noncontrolling interests. The amount of the redemption price in excess of the carrying amount, net of tax, was $490.7 million, which was accounted for as a premium on repurchase of noncontrolling interests, and resulted in a reduction to Net income (loss) attributable to common shareholders.
In December 2023, we completed the acquisition of the remaining 50% membership interest in Carnero G&P LLC (“Carnero”) from our joint venture partner for cash consideration of $27.0 million (the “Carnero Acquisition”). The change in our ownership interests was accounted for as an equity transaction representing the acquisition of noncontrolling interests. The amount of the consideration in excess of the carrying amount, net of tax, was $20.1 million, which was accounted for as a premium on repurchase of noncontrolling interests, and resulted in a reduction to Net income (loss) attributable to common shareholders.
On July 31, 2024, we entered into an agreement with WPC Parent, LLC (“WPC”) to move forward with the construction of the Blackcomb pipeline. The Blackcomb pipeline is designed to transport up to 2.5 Bcf/d of natural gas through approximately 365 miles of 42-inch pipeline from the Permian Basin in West Texas to the Agua Dulce area in South Texas, and is expected to be in service in the second half of 2026, pending the receipt of customary regulatory and other approvals. The Blackcomb pipeline is held by a joint venture (“Blackcomb”), which is owned 70.0% by WPC, 17.5% by Targa, and 12.5% by MPLX LP. WPC is a joint venture owned 50.6% by WhiteWater Midstream, LLC, 30.4% by MPLX LP, and 19.0% by Enbridge Inc. We apply the equity method of accounting for Blackcomb. During 2024, we made capital contributions of $28.7 million to Blackcomb and paid $1.6 million in associated professional and legal fees. For additional information see Note 7 – Investments in Unconsolidated Affiliates.
On December 16, 2024, we completed the acquisition of the remaining 12% membership interest in Cedar Bayou Fractionators, L.P. (“CBF”) from our joint venture partner for cash consideration of $111.6 million (the “CBF Acquisition”). The change in our ownership interests was accounted for as an equity transaction representing the acquisition of noncontrolling interests. The amount of the consideration in excess of the carrying amount, net of tax, was $32.9 million, which was accounted for as a premium on repurchase of noncontrolling interests, and resulted in a reduction to Net income (loss) attributable to common shareholders.
On February 18, 2025, we entered into an agreement with funds managed by Blackstone to acquire their 45% interest in Targa Badlands LLC (“Targa Badlands”) for aggregate consideration of approximately $1.8 billion (the “Badlands Transaction”). Following the closing of the Badlands Transaction, we will own 100% of the interest in Targa Badlands.
Note 5 — Property, Plant and Equipment and Intangible Assets
Property, Plant and Equipment and Intangible Assets
| | | | | | | | | | |
| | December 31, 2024 | | | December 31, 2023 | | | Estimated Useful Lives (In Years) |
Gathering systems | | $ | 11,575.0 | | | $ | 10,858.3 | | | 5 to 20 |
Processing and fractionation facilities | | | 9,543.3 | | | | 8,285.5 | | | 5 to 25 |
Terminaling and storage facilities | | | 1,469.1 | | | | 1,403.9 | | | 5 to 25 |
Transportation assets | | | 4,131.5 | | | | 3,294.0 | | | 10 to 50 |
Other property, plant and equipment | | | 537.7 | | | | 430.5 | | | 3 to 50 |
Land | | | 198.6 | | | | 185.0 | | | — |
Construction in progress | | | 1,702.9 | | | | 1,456.1 | | | — |
Finance lease right-of-use assets | | | 401.3 | | | | 351.9 | | | 5 to 14 |
Property, plant and equipment | | | 29,559.4 | | | | 26,265.2 | | | |
Accumulated depreciation, amortization and impairment | | | (11,496.7 | ) | | | (10,458.8 | ) | | |
Property, plant and equipment, net | | $ | 18,062.7 | | | $ | 15,806.4 | | | |
| | | | | | | | |
Intangible assets | | | 4,378.0 | | | | 4,378.0 | | | 10 to 20 |
Accumulated amortization and impairment | | | (2,400.6 | ) | | | (2,027.4 | ) | | |
Intangible assets, net | | $ | 1,977.4 | | | $ | 2,350.6 | | | |
For each of the years ended December 31, 2024, 2023 and 2022 depreciation expense was $1,049.8 million, $945.6 million and $853.8 million, respectively.
Intangible Assets
Intangible assets consist of customer contracts and customer relationships acquired in prior business combinations. The fair value of these acquired intangible assets were determined at the date of acquisition based on the present values of estimated future cash flows. Amortization expense attributable to these assets is recorded over the periods in which we benefit from services provided to customers.
For each of the years ended December 31, 2024, 2023 and 2022 amortization expense was $373.2 million, $384.0 million and $242.2 million, respectively.
The estimated annual amortization expense for intangible assets is approximately $326.0 million, $279.8 million, $252.2 million, $234.0 million and $214.1 million for each of the years 2025 through 2029. As of December 31, 2024, the weighted average amortization period for our intangible assets was approximately 10 years.
The changes in our intangible assets are as follows:
| | | | | | | | |
| | December 31, 2024 | | | December 31, 2023 | |
Balance at beginning of period | | $ | 2,350.6 | | | $ | 2,734.6 | |
Amortization | | | (373.2 | ) | | | (384.0 | ) |
Balance at end of period | | $ | 1,977.4 | | | $ | 2,350.6 | |
Note 6 — Goodwill
As of December 31, 2024, we had $45.2 million of goodwill included in Other long-term assets on the Consolidated Balance Sheets related to the March 2017 acquisition of gas gathering and processing and crude oil gathering assets in the Permian Basin.
| | | | | | | | |
| | December 31, 2024 | | | December 31, 2023 | |
Permian Midland | | $ | 23.2 | | | $ | 23.2 | |
Permian Delaware | | | 22.0 | | | | 22.0 | |
Goodwill | | $ | 45.2 | | | $ | 45.2 | |
The future cash flows and resulting fair values of these reporting units are sensitive to changes in crude oil, natural gas and NGL prices. The direct and indirect effects of significant declines in commodity prices from the date of acquisition would likely cause the fair values of these reporting units to fall below their carrying values, and could result in an impairment of goodwill.
As described in Note 3 – Significant Accounting Policies, we evaluate goodwill for impairment at least annually on November 30, or more frequently if we believe necessary based on events or changes in circumstances. For our 2024, 2023 and 2022 annual evaluations, we performed a qualitative assessment, which indicated that it is not more likely than not that the fair values of the Permian Midland and Permian Delaware reporting units were less than their carrying amounts, and therefore, a quantitative goodwill impairment test was not necessary. Our qualitative assessment considered, among other things, the overall financial performance and future outlook of the Permian Midland and Permian Delaware reporting units, industry and market considerations, and other relevant entity-specific events.
The fair value measurements utilized for the evaluation of goodwill for impairment are based on inputs that are not observable in the market and therefore represent Level 3 inputs, as defined in Note 14 – Fair Value Measurements. These inputs require significant judgments and estimates at the time a fair value assessment is required.
Note 7 — Investments in Unconsolidated Affiliates
Our investments in unconsolidated affiliates consist of the following:
Gathering and Processing Segment
•50% operated ownership interest in Little Missouri 4.
Logistics and Transportation Segment
•38.8% operated ownership interest in GCF;
•50% operated ownership interest in Cayenne; and
•17.5% non-operated ownership interest in Blackcomb.
The terms of these joint venture agreements do not afford us the degree of control required for consolidating the entities in our consolidated financial statements, but do afford us the significant influence required to employ the equity method of accounting.
In April 2022, we completed the South Texas Acquisition. Prior to closing the South Texas Acquisition, we had two operated joint ventures in South Texas: a 75% interest in T2 LaSalle Gathering Company L.L.C. (“T2 LaSalle”) and a 50% interest in T2 Eagle Ford Gathering Company L.L.C. (“T2 Eagle Ford” and, together with T2 LaSalle, the “T2 Joint Ventures”). Following the closing of the South Texas Acquisition, we own 100% of the interest in the T2 Joint Ventures.
In May 2022, we completed the GCX Sale. Prior to the GCX Sale, we owned a 25% non-operated ownership interest in GCX. Following the announcement of the GCX Sale in February 2022, we ceased recognizing equity earnings (loss) due to the terms of the sales agreement. As a result of the GCX Sale, we recognized a gain of $435.9 million in Gain (loss) from sale of equity method investment in our Consolidated Statements of Operations in 2022.
In July 2024, we entered into an agreement with WPC to move forward with the construction of the Blackcomb pipeline.
See Note 4 – Acquisitions and Divestitures for additional information related to the above transactions.
The following table shows the activity related to our investments in unconsolidated affiliates:
| | | | | | | | | | | | | | | | | | | | | | | | |
| | Balance at December 31, 2021 | | | Equity Earnings (Loss) | | | Cash Distributions | | | Disposition/
Consolidation | | | Contributions | | | Balance at December 31, 2022 | |
GCX | | $ | 421.0 | | | $ | 5.7 | | | $ | (14.3 | ) | | $ | (412.4 | ) | | $ | — | | | $ | — | |
Little Missouri 4 | | | 98.1 | | | | 5.5 | | | | (12.9 | ) | | | — | | | | — | | | | 90.7 | |
GCF (1) | | | 28.8 | | | | (3.2 | ) | | | — | | | | — | | | | 1.5 | | | | 27.1 | |
T2 Eagle Ford (2) | | | 21.9 | | | | (0.6 | ) | | | (0.8 | ) | | | (20.5 | ) | | | — | | | | — | |
T2 LaSalle (2) | | | 4.2 | | | | (0.3 | ) | | | — | | | | (3.9 | ) | | | — | | | | — | |
Cayenne | | | 12.5 | | | | 2.0 | | | | (1.0 | ) | | | — | | | | — | | | | 13.5 | |
Total | | $ | 586.5 | | | $ | 9.1 | | | $ | (29.0 | ) | | $ | (436.8 | ) | | $ | 1.5 | | | $ | 131.3 | |
| | | | | | | | | | | | | | | | | | |
| | Balance at December 31, 2022 | | | Equity Earnings (Loss) | | | Cash Distributions | | | Disposition/
Consolidation | | | Contributions | | | Balance at December 31, 2023 | |
Little Missouri 4 | | $ | 90.7 | | | $ | 7.7 | | | $ | (11.3 | ) | | $ | — | | | $ | — | | | $ | 87.1 | |
GCF (1) | | | 27.1 | | | | (4.1 | ) | | | (2.0 | ) | | | — | | | | 24.6 | | | | 45.6 | |
Cayenne | | | 13.5 | | | | 5.4 | | | | (5.3 | ) | | | — | | | | — | | | | 13.6 | |
Total | | $ | 131.3 | | | $ | 9.0 | | | $ | (18.6 | ) | | $ | — | | | $ | 24.6 | | | $ | 146.3 | |
| | | | | | | | | | | | | | | | | | |
| | Balance at December 31, 2023 | | | Equity Earnings (Loss) | | | Cash Distributions | | | Disposition/
Consolidation | | | Contributions | | | Balance at December 31, 2024 | |
Little Missouri 4 | | $ | 87.1 | | | $ | 14.4 | | | $ | (17.2 | ) | | $ | — | | | $ | — | | | $ | 84.3 | |
GCF (1) | | | 45.6 | | | | (11.8 | ) | | | — | | | | — | | | | 32.6 | | | | 66.4 | |
Cayenne | | | 13.6 | | | | 6.8 | | | | (8.1 | ) | | | — | | | | — | | | | 12.3 | |
Blackcomb | | | — | | | | — | | | | — | | | | — | | | | 30.3 | | | | 30.3 | |
Total | | $ | 146.3 | | | $ | 9.4 | | | $ | (25.3 | ) | | $ | — | | | $ | 62.9 | | | $ | 193.3 | |
(1)In January 2021, the GCF facility was temporarily idled and Targa assumed operatorship in the first half of 2021. In January 2023, we reached an agreement with our partners to reactivate the GCF facility. We expect the reactivation of GCF to be complete and the facility to be operational in the first quarter of 2025.
(2)Following the closing of the South Texas Acquisition in April 2022, the T2 Joint Ventures are 100% owned and consolidated by Targa.
Note 8 — Debt Obligations
| | | | | | | | |
| | December 31, 2024 | | | December 31, 2023 | |
Current: | | | | | | |
Partnership accounts receivable securitization facility, due August 2025 (1) | | $ | 330.0 | | | $ | 575.0 | |
Finance lease liabilities | | | 57.7 | | | | 45.7 | |
Current debt obligations | | | 387.7 | | | | 620.7 | |
| | | | | | |
Long-term: | | | | | | |
Term loan facility, variable rate, due July 2025 (2) | | | — | | | | 500.0 | |
TRGP senior revolving credit facility, variable rate, due February 2027 (3) | | | 1,130.5 | | | | 175.0 | |
Senior unsecured notes issued by TRGP: | | | | | | |
5.200% fixed rate, due July 2027 | | | 750.0 | | | | 750.0 | |
6.150% fixed rate, due March 2029 | | | 1,000.0 | | | | 1,000.0 | |
4.200% fixed rate, due February 2033 | | | 750.0 | | | | 750.0 | |
6.125% fixed rate, due March 2033 | | | 900.0 | | | | 900.0 | |
6.500% fixed rate, due March 2034 | | | 1,000.0 | | | | 1,000.0 | |
5.500% fixed rate, due February 2035 | | | 1,000.0 | | | | — | |
4.950% fixed rate, due April 2052 | | | 750.0 | | | | 750.0 | |
6.250% fixed rate, due July 2052 | | | 500.0 | | | | 500.0 | |
6.500% fixed rate, due February 2053 | | | 850.0 | | | | 850.0 | |
Unamortized discount | | | (29.4 | ) | | | (29.5 | ) |
Senior unsecured notes issued by the Partnership: (4) | | | | | | |
6.500% fixed rate, due July 2027 | | | 705.2 | | | | 705.2 | |
5.000% fixed rate, due January 2028 | | | 700.3 | | | | 700.3 | |
6.875% fixed rate, due January 2029 | | | 679.3 | | | | 679.3 | |
5.500% fixed rate, due March 2030 | | | 949.6 | | | | 949.6 | |
4.875% fixed rate, due February 2031 | | | 1,000.0 | | | | 1,000.0 | |
4.000% fixed rate, due January 2032 | | | 1,000.0 | | | | 1,000.0 | |
| | | 13,635.5 | | | | 12,179.9 | |
Debt issuance costs, net of amortization | | | (89.0 | ) | | | (90.8 | ) |
Finance lease liabilities | | | 240.4 | | | | 244.1 | |
Long-term debt | | | 13,786.9 | | | | 12,333.2 | |
Total debt obligations | | $ | 14,174.6 | | | $ | 12,953.9 | |
Irrevocable standby letters of credit: (3) | | | | | | |
Letters of credit outstanding under the TRGP senior revolving credit facility | | $ | 17.6 | | | $ | 22.3 | |
(1)As of December 31, 2024, the Partnership had $330.0 million of qualifying receivables under its $600.0 million accounts receivable securitization facility (the “Securitization Facility”), resulting in $270.0 million of availability.
(2)On May 21, 2024, we repaid the remaining balance and subsequently terminated the Term Loan Facility. As a result of the repayment, we recorded a loss due to debt extinguishment of $0.8 million.
(3)We maintain the Commercial Paper Program, the borrowings of which are supported through maintaining a minimum available borrowing capacity under the New TRGP Revolver equal to the aggregate amount outstanding under the Commercial Paper Program. As of December 31, 2024, the Existing TRGP Revolver had no borrowings outstanding and the Commercial Paper Program had $1,130.5 million in borrowings outstanding, resulting in approximately $1,601.9 million of available liquidity, after accounting for outstanding letters of credit.
(4)We guarantee all of the Partnership’s outstanding senior unsecured notes.
The following table shows the range of interest rates and weighted average interest rate incurred on our variable-rate debt obligations during the year ended December 31, 2024:
| | | | |
| | Range of Interest Rates Incurred | | Weighted Average Interest Rate Incurred |
Existing TRGP Revolver and Commercial Paper Program | | 4.8% - 6.2% | | 5.7% |
Securitization Facility | | 5.2% - 6.4% | | 6.1% |
Term Loan Facility (1) | | 6.7% - 6.8% | | 6.7% |
(1)Interest rates were calculated through the redemption date of May 21, 2024.
Compliance with Debt Covenants
As of December 31, 2024, we were in compliance with the covenants contained in our various debt agreements.
We and certain of our subsidiaries are parties to a parent guarantee whereby each party to the agreement unconditionally guarantees, jointly and severally, the payment of all of the obligations of the Partnership and Targa Resources Partners Finance Corporation (together with the Partnership, the “Partnership Issuers”) under the respective indentures governing the Partnership Issuers’ senior unsecured notes.
Debt Obligations
Partnership’s Accounts Receivable Securitization Facility
The Securitization Facility provides up to $600.0 million of borrowing capacity at SOFR rates plus a margin. In August 2024, the Partnership amended the Securitization Facility to, among other things, extend the termination date of the Securitization Facility to August 29, 2025. Under the Securitization Facility, certain Partnership subsidiaries sell or contribute certain qualifying receivables, without recourse, to another of its consolidated subsidiaries (Targa Receivables LLC or “TRLLC”), a special purpose consolidated subsidiary created for the sole purpose of the Securitization Facility. TRLLC, in turn, sells an undivided percentage ownership in the eligible receivables to third-party financial institutions. Sold or contributed receivables up to the amount of the outstanding debt under the Securitization Facility are not available to satisfy the claims of the creditors of the selling or contributing subsidiaries or the Partnership. Any excess receivables are eligible to satisfy the claims.
New TRGP Credit Agreement
In February 2025, the Company entered into a Credit Agreement with Bank of America, N.A., as the Administrative Agent and Swing Line Lender, the letter of credit issuers party thereto and the other lenders party thereto (the “New TRGP Revolver”). The New TRGP Revolver provides for a revolving credit facility in an initial aggregate principal amount up to $3.5 billion (with an option to increase such maximum aggregate principal amount by up to $500.0 million in the future, subject to the terms of the New TRGP Revolver) and a swing line sub-facility of up to $150.0 million. The New TRGP Revolver matures on February 18, 2030. We will be able to extend the maturity date, subject to the required lenders’ consent, by one year up to two times.
The revolving credit facility bears interest at the Company’s option at: (a) the Base Rate (as such term is defined in the New TRGP Revolver), which is the highest of Bank of America’s prime rate, the federal funds rate plus 0.5% and the Term SOFR (as such term is defined in the New TRGP Revolver) rate plus 1.0% (subject in each case to a floor of 0.0%), plus an applicable margin ranging from 0.0% to 0.625%, dependent on the Company’s non-credit-enhanced senior unsecured long-term debt ratings (or, if no such debt is outstanding at such time, then the corporate, issuer or similar rating with respect to the Company that has been most recently announced) (the “Debt Rating”), or (b) Term SOFR (which is subject to a floor of 0.0% and includes, for Term SOFR loans, a SOFR adjustment of plus 0.10%) plus an applicable margin ranging from 1.00% to 1.625%, dependent on the Company’s Debt Rating.
The Company is required to pay a commitment fee equal to an applicable rate ranging from 0.10% to 0.275% (dependent on the Company’s Debt Rating), in each case times the actual daily unused portion of the revolving credit facility.
The obligations under the New TRGP Revolver are guaranteed by Targa Resources GP LLC, Targa Energy GP LLC, Targa Resources LLC, Targa Resources Partners LP, Targa Energy LP, Targa GP Inc., Targa LP Inc., and Targa Resources Finance Corporation. The New TRGP Revolver shall also be guaranteed by each existing and future direct and indirect wholly-owned subsidiary of the Company that is an obligor on or otherwise guarantees the obligations in respect of the existing notes indebtedness of Targa Resources Partners LP.
The New TRGP Revolver requires the Company to maintain a Consolidated Leverage Ratio (as such term is defined in the New TRGP Revolver), determined as of the last day of each quarter for the four-fiscal quarter period ending on the date of determination, of no more than 5.50 to 1.00. For any four-fiscal-quarter-period during which a material acquisition occurs, the total leverage ratio may, at the Company’s option, be determined on a pro forma basis as though such event had occurred as of the first day of such four-fiscal-quarter-period.
The New TRGP Revolver restricts the Company’s ability to make dividends to stockholders if an event of default (as defined in the New TRGP Revolver) exists or would result from such distribution. In addition, the New TRGP Revolver contains various covenants that may limit, among other things, the Company’s ability to grant liens, merge or consolidate, and engage in transactions with affiliates and the ability of the Company’s non-guarantor subsidiaries to incur indebtedness.
The New TRGP Revolver also contains various customary events of default, the occurrence of which could result in a termination of the lenders’ commitments and the acceleration of all of our obligations thereunder.
Existing TRGP Credit Agreement
In February 2022, the Company entered into the Existing TRGP Revolver with Bank of America, N.A., as the Administrative Agent, Collateral Agent and Swing Line Lender, the Letter of Credit issuers party thereto and the lenders party thereto. The Existing TRGP Revolver provided for a revolving credit facility in an initial aggregate principal amount up to $2.75 billion (with an option to increase such maximum aggregate principal amount by up to $500.0 million in the future, subject to the terms of the Existing TRGP Revolver) and a swing line sub-facility of up to $100.0 million. The Existing TRGP Revolver was scheduled to mature on February 17, 2027. In connection with entering into the New TRGP Revolver, we terminated the Existing TRGP Revolver.
In February 2022, TRGP and the Partnership received a corporate investment grade credit rating from Standard & Poor’s Financial Services LLC (“S&P”) and Fitch Ratings Inc., and in March 2022, the Partnership received a corporate investment grade credit rating from Moody’s Ratings (“Moody’s”). As a result, in accordance with the Existing TRGP Revolver, the collateral under the Existing TRGP Revolver was released from the liens securing our obligations thereunder.
The revolving credit facility bore interest at the Company’s option at: (a) the Base Rate (as such term is defined in the Existing TRGP Revolver), which is the highest of Bank of America’s prime rate, the federal funds rate plus 0.5% and the Term SOFR (as such term is defined in the Existing TRGP Revolver) rate plus 1.0% (subject in each case to a floor of 0.0%), plus an applicable margin ranging from 0.125% to 0.75%, dependent on the Company’s non-credit-enhanced senior unsecured long-term debt ratings (or, if no such debt was outstanding at such time, then the corporate, issuer or similar rating with respect to the Company that had been most recently announced) (the “Debt Rating”), or (b) Term SOFR (which included, for Term SOFR loans, a SOFR adjustment of plus 0.10%) plus an applicable margin ranging from 1.125% to 1.75%, dependent on the Company’s Debt Rating.
The Company was required to pay a commitment fee equal to an applicable rate ranging from 0.125% to 0.35% (dependent on the Company’s Debt Rating), in each case times the actual daily unused portion of the revolving credit facility.
The obligations under the Existing TRGP Revolver were guaranteed by certain of the domestic subsidiaries of the Company, including by the Partnership.
The Existing TRGP Revolver required the Company to maintain a ratio of consolidated funded indebtedness to consolidated adjusted EBITDA (the “Consolidated Leverage Ratio”), determined as of the last day of each quarter for the four-fiscal quarter period ending on the date of determination, of no more than 5.50 to 1.00.
The Existing TRGP Revolver restricted the Company’s ability to make dividends to stockholders if an event of default (as defined in the Existing TRGP Revolver) existed or would have resulted from such distribution. In addition, the Existing TRGP Revolver contained various covenants that may have limited, among other things, the Company’s ability to incur subsidiary indebtedness, grant liens, make
investments, repay or amend the terms of certain other indebtedness, merge or consolidate, sell assets, and engage in transactions with affiliates.
Commercial Paper Program
In July 2022, we established the Commercial Paper Program. Under the terms of the Commercial Paper Program, we may issue, from time to time, unsecured commercial paper notes with varying maturities of less than one year. Amounts available under the Commercial Paper Program may be issued, repaid and re-issued from time to time, with the maximum aggregate face or principal amount outstanding at any one time not to exceed $3.5 billion, subject to documentation requirements of the Commercial Paper Program. We maintain a minimum available borrowing capacity under the New TRGP Revolver equal to the aggregate amount outstanding under the Commercial Paper Program to support our issued commercial paper notes. The Commercial Paper Program is guaranteed by each subsidiary that guarantees the New TRGP Revolver. The commercial paper notes are presented in Long-term debt on our Consolidated Balance Sheets.
TRGP’s Senior Unsecured Notes
All issues of our senior unsecured notes (the “TRGP Notes”) rank pari passu with our existing and future senior indebtedness, including debt issued under the New TRGP Revolver and the Commercial Paper Program, and rank senior in right of payment to any of our future subordinated indebtedness. The TRGP Notes are unconditionally guaranteed by certain of our subsidiaries that guarantee the New TRGP Revolver. Each guarantee ranks equally in right of payment with all of such guarantor’s existing and future unsecured senior debt and other unsecured guarantees of senior debt. The notes and the guarantees are effectively junior to any secured indebtedness of ours or any guarantor to the extent of the value of the assets securing such indebtedness and structurally subordinated to all indebtedness and other obligations of our subsidiaries that do not guarantee the notes. Interest on all issues of TRGP Notes is payable semi-annually.
The indenture governing the TRGP Notes restricts (i) our ability and the ability of our subsidiaries to incur liens and (ii) TRGP’s ability to merge or consolidate with or sell, lease, convey, transfer or otherwise dispose of all or substantially all of its assets to another company. These covenants are subject to a number of important exceptions and qualifications.
We may redeem the TRGP Notes, in whole or in part, at any time prior to the applicable par call date at a redemption price equal to the principal amount plus an applicable make-whole premium, plus accrued and unpaid interest, to the redemption date, as specified in the indenture of each series. After the applicable par call date, the TRGP Notes may be redeemed at a price equal to par, plus accrued and unpaid interest to the redemption date, as specified in the indenture of each series.
In the future, we may redeem, purchase or exchange certain of our outstanding debt through redemption calls, cash purchases and/or exchanges for other debt, in open market purchases, privately negotiated transactions or otherwise. Such calls, repurchases or exchanges, if any, will depend on prevailing market conditions, our liquidity requirements, contractual restrictions and other factors. The amounts involved may be material.
Partnership’s Senior Unsecured Notes
All issues of the Partnership’s senior unsecured notes are pari passu with the Partnership’s existing and future senior indebtedness. They are senior in right of payment to any of the Partnership’s future subordinated indebtedness and are unconditionally guaranteed by the Partnership’s restricted subsidiaries. These notes are effectively subordinated to all secured indebtedness under the Securitization Facility, which is secured by accounts receivable pledged under the facility, to the extent of the value of the collateral securing that indebtedness. Interest on all issues of senior unsecured notes is payable semi-annually in arrears.
The Partnership’s senior unsecured notes and associated indenture agreements restrict, among other things, (i) the Partnership’s ability and the ability of certain of its subsidiaries to incur liens and (ii) the Partnership’s ability to merge or consolidate with or sell, lease, convey, transfer or otherwise dispose of all or substantially all of its assets to another company. These covenants are subject to a number of important exceptions and qualifications.
The Partnership may redeem its senior unsecured notes, in whole or in part, at any time prior to their applicable maturity at a redemption price equal to the principal amount plus an applicable make-whole premium, plus accrued and unpaid interest and liquidation damages, if any, to the redemption date, as specified in the indenture of each series.
The Partnership may also redeem up to 35% of the aggregate principal amount of each series of its senior unsecured notes at the redemption dates and prices set forth in the indenture governing such series plus accrued and unpaid interest and liquidation damages, if any, to the redemption date with the net cash proceeds of one or more equity offerings, provided that: (i) at least 65% of the aggregate principal amount of each such notes (excluding notes held by the Partnership and its subsidiaries) remains outstanding immediately after the occurrence of such redemption; and (ii) the redemption occurs within 180 days of the date of the closing of such equity offering.
In the future, we or the Partnership may redeem, purchase or exchange certain of our and the Partnership’s outstanding debt through redemption calls, cash purchases and/or exchanges for other debt, in open market purchases, privately negotiated transactions or otherwise. Such calls, repurchases or exchanges, if any, will depend on prevailing market conditions, our liquidity requirements, contractual restrictions and other factors. The amounts involved may be material.
Senior Unsecured Notes Issuances
In April 2022, we completed an underwritten public offering of (i) $750.0 million aggregate principal amount of our 4.200% Senior Unsecured Notes due 2033 (the “4.200% Notes”) and (ii) $750.0 million aggregate principal amount of our 4.950% Senior Unsecured Notes due 2052 (the “4.950% Notes”), resulting in net proceeds of approximately $1.5 billion. The 4.200% Notes and the 4.950% Notes are fully and unconditionally guaranteed, jointly and severally, on a senior unsecured basis by our subsidiaries that guarantee the New TRGP Revolver, so long as such subsidiary guarantors satisfy certain conditions. The 4.200% Notes and the 4.950% Notes were issued pursuant to the Indenture, dated as of April 6, 2022, as supplemented by that certain First Supplemental Indenture, dated as of April 6, 2022, among us, such subsidiary guarantors and U.S. Bank Trust Company, National Association, as trustee. A portion of the net proceeds from the issuance was used to fund the concurrent cash tender offer (the “March Tender Offer”) and the subsequent redemption of the Partnership’s 5.875% Senior Unsecured Notes due April 2026 (the “5.875% Notes”), with the remainder of the net proceeds used for repayment of the outstanding borrowings under the Existing TRGP Revolver. See “Debt Repurchases and Extinguishments” for further details of the March Tender Offer.
In July 2022, we completed an underwritten public offering of the 5.200% Notes and the 6.250% Notes, resulting in net proceeds of approximately $1.2 billion. The 5.200% Notes and the 6.250% Notes are fully and unconditionally guaranteed, jointly and severally, on a senior unsecured basis by our subsidiaries that guarantee the New TRGP Revolver, so long as such subsidiary guarantors satisfy certain conditions. The 5.200% Notes and the 6.250% Notes were issued pursuant to the Indenture, dated as of April 6, 2022, as supplemented by that certain Third Supplemental Indenture, dated as of July 7, 2022, among us, such subsidiary guarantors and U.S. Bank Trust Company, National Association, as trustee. We used the net proceeds from the issuance to fund a portion of the Delaware Basin Acquisition.
In January 2023, we completed an underwritten public offering of (i) $900.0 million aggregate principal amount of our 6.125% Senior Unsecured Notes due 2033 (the “6.125% Notes”) and (ii) $850.0 million aggregate principal amount of our 6.500% Senior Unsecured Notes due 2053 (the “January 2023 6.500% Notes”), resulting in net proceeds of approximately $1.7 billion. The 6.125% Notes and the January 2023 6.500% Notes are fully and unconditionally guaranteed, jointly and severally, on a senior unsecured basis by our subsidiaries that guarantee the New TRGP Revolver, so long as such subsidiary guarantors satisfy certain conditions. The 6.125% Notes and the January 2023 6.500% Notes were issued pursuant to the Indenture, dated as of April 6, 2022, as supplemented by that certain Fifth Supplemental Indenture, dated as of January 9, 2023, among us, such subsidiary guarantors and U.S. Bank Trust Company, National Association, as trustee. We used a portion of the net proceeds from the issuance to fund the Grand Prix Transaction and the remaining proceeds for general corporate purposes, including to reduce borrowings under the Existing TRGP Revolver and the Commercial Paper Program.
In November 2023, we completed an underwritten public offering of (i) $1.0 billion aggregate principal amount of our 6.150% Senior Unsecured Notes due 2029 (the “2023 6.150% Notes”) and (ii) $1.0 billion aggregate principal amount of our 6.500% Senior Unsecured Notes due 2034 (the “November 2023 6.500% Notes”), resulting in net proceeds of approximately $2.0 billion. The 2023 6.150% Notes and the November 2023 6.500% Notes are fully and unconditionally guaranteed, jointly and severally, on a senior unsecured basis by our subsidiaries that guarantee the New TRGP Revolver, so long as such subsidiary guarantors satisfy certain conditions. The 2023 6.150% Notes and the November 2023 6.500% Notes were issued pursuant to the Indenture, dated as of April 6, 2022, as supplemented by that certain Seventh Supplemental Indenture, dated as of November 9, 2023, among us, such subsidiary guarantors and U.S. Bank Trust Company, National Association, as trustee. We used a portion of the net proceeds to repay $1.0 billion in borrowings under the Term Loan Facility and the remaining net proceeds for general corporate purposes, including to repay borrowings under the Commercial Paper Program.
In August 2024, we completed an underwritten public offering of $1.0 billion aggregate principal amount of our 5.500% Senior Unsecured Notes due 2035 (the “5.500% Notes”), resulting in net proceeds of approximately $990.1 million. The 5.500% Notes are fully and unconditionally guaranteed, jointly and severally, on a senior unsecured basis by our subsidiaries that guarantee the New TRGP Revolver, so long as such subsidiary guarantors satisfy certain conditions. The 5.500% Notes were issued pursuant to the Indenture, dated as of April 6, 2022, as supplemented by that certain Ninth Supplemental Indenture, dated as of August 9, 2024, among us, each subsidiary guarantor and U.S. Bank Trust Company, National Association, as trustee. We used the net proceeds from the issuance to repay borrowings under the Commercial Paper Program, a portion of which were incurred to repay the remaining balance under the Term Loan Facility, and for general corporate purposes.
Debt Repurchases & Extinguishments
In February 2022, in connection with entering into the Existing TRGP Revolver, we terminated the previous TRGP senior secured revolving credit facility (the “Previous TRGP Revolver”) and the Partnership’s senior secured revolving credit facility (the “Partnership Revolver”). As a result of the termination of the Previous TRGP Revolver and the Partnership Revolver, we recorded a loss of $0.8 million due to a write-off of debt issuance costs.
The Partnership redeemed all of the outstanding 5.375% Senior Unsecured Notes due 2027 (the “5.375% Notes”) in March 2022 with available liquidity under the Existing TRGP Revolver. As a result of the redemption of the 5.375% Notes, we recorded a loss due to debt extinguishment of $15.0 million comprised of $12.6 million of premiums paid and a write-off of $2.4 million of debt issuance costs.
Concurrent with the 4.200% Notes and the 4.950% Notes offering, we commenced the March Tender Offer to redeem subject to certain terms and conditions, any and all of the Partnership’s outstanding 5.875% Notes. As a result of the March Tender Offer and the subsequent redemption of the 5.875% Notes, we recorded a loss due to debt extinguishment of $33.8 million comprised of $29.3 million of premiums paid and a write-off of $4.5 million of debt issuance costs in April 2022.
In November 2023, in connection with the 2023 6.150% Notes and November 2023 6.500% Notes, we repaid borrowings under the Term Loan Facility and the Commercial Paper Program. As a result of the repayment of borrowings under the Term Loan Facility, we recorded a loss of $2.1 million due to a write-off of debt issuance costs.
In May 2024, we repaid the Term Loan Facility, which bore interest at the Company’s option at: (a) the Base Rate (as defined in the Term Loan Facility), which was the highest of the (i) federal funds rate plus 0.5%, (ii) Mizuho’s prime rate, and (iii) the Term SOFR (as defined in the Term Loan Facility) rate plus 1.0% (subject in each case to a floor of 0.0%), plus an applicable margin ranging from 0.125% to 0.75% dependent on the Company’s non-credit-enhanced senior unsecured long-term debt ratings (or, if no such debt is outstanding at such time, then the Debt Rating), or (b) Term SOFR plus 0.10% plus an applicable margin ranging from 1.125% to 1.75% dependent on the Debt Rating. As a result of the repayment, we recorded a loss due to debt extinguishment of $0.8 million.
The following table shows the contractually scheduled maturities of our debt obligations outstanding at December 31, 2024, for the next five years, and in total thereafter:
| | | | | | | | | | | | | | | | | | | | | | | | | | | | |
| | Scheduled Maturities of Debt | |
| | Total | | | 2025 | | | 2026 | | | 2027 | | | 2028 | | | 2029 | | | Thereafter | |
| | | | | | | | | | | | | | | | | | | | | |
Existing TRGP Revolver and Commercial Paper Program | | $ | 1,130.5 | | | $ | — | | | $ | — | | | $ | 1,130.5 | | | $ | — | | | $ | — | | | $ | — | |
TRGP Senior unsecured notes | | | 7,500.0 | | | | — | | | | — | | | | 750.0 | | | | — | | | | 1,000.0 | | | | 5,750.0 | |
Partnership’s Senior unsecured notes | | | 5,034.4 | | | | — | | | | — | | | | 705.2 | | | | 700.3 | | | | 679.3 | | | | 2,949.6 | |
Securitization Facility | | | 330.0 | | | | 330.0 | | | | — | | | | — | | | | — | | | | — | | | | — | |
Total | | $ | 13,994.9 | | | $ | 330.0 | | | $ | — | | | $ | 2,585.7 | | | $ | 700.3 | | | $ | 1,679.3 | | | $ | 8,699.6 | |
Note 9 — Other Long-term Liabilities
Other long-term liabilities are comprised of the following obligations:
| | | | | | | | |
| | December 31, 2024 | | | December 31, 2023 | |
Deferred revenue | | $ | 119.9 | | | $ | 248.8 | |
Asset retirement obligations | | | 177.7 | | | | 103.0 | |
Operating lease liabilities | | | 90.4 | | | | 56.5 | |
Other liabilities | | | 4.3 | | | | 6.8 | |
Total other long-term liabilities | | $ | 392.3 | | | $ | 415.1 | |
Deferred Revenue
Deferred revenue as of December 31, 2024 and 2023 was $119.9 million and $248.8 million, respectively. Deferred revenue as of December 31, 2023 included $129.0 million in payments received from Vitol Americas Corp. (“Vitol”) (formerly known as Noble Americas Corp.), a subsidiary of Vitol US Holding Co., in 2016, 2017, and 2018 as part of an agreement (the “Splitter Agreement”) related to the construction and operation of a crude oil and condensate splitter. In December 2018, Vitol elected to terminate the Splitter Agreement. As a result of a legal ruling in April 2024, the $129.0 million in payments from Vitol were reclassified to Accrued liabilities on our Consolidated Balance Sheets during the first quarter of 2024. On April 26, 2024, we made a cash payment of $184.8 million which included cumulative interest on the award of $55.8 million to Vitol in satisfaction of the Texas state court judgment. See Note 17 - Contingencies for more information.
Deferred revenue includes contributions in aid of construction received from customers for which revenue is recognized over the expected contract term and contributions received for other construction activities of facilities connected to our systems. Deferred revenue also includes consideration received in 2015 and 2017 amendments to a gas gathering and processing agreement. The deferred revenue related to these amendments is being recognized through the end of the agreement’s term in 2035.
For the years ended December 31, 2024, 2023 and 2022, we recognized $19.6 million, $17.4 million and $7.5 million of revenue related to these transactions, respectively.
The following table shows the components of deferred revenue:
| | | | | | | | |
| | December 31, 2024 | | | December 31, 2023 | |
Contributions in aid of construction | | $ | 91.1 | | | $ | 86.4 | |
Gas contract amendment | | | 27.3 | | | | 29.8 | |
Splitter agreement | | | — | | | | 129.0 | |
Other | | | 1.5 | | | | 3.6 | |
Total deferred revenue | | $ | 119.9 | | | $ | 248.8 | |
The following table shows the changes in deferred revenue:
| | | | | | | | |
| | 2024 | | | 2023 | |
Balance at beginning of period | | $ | 248.8 | | | $ | 198.8 | |
Additions | | | 19.7 | | | | 67.4 | |
Revenue recognized | | | (19.6 | ) | | | (17.4 | ) |
Reclassification to accrued liabilities | | | (129.0 | ) | | | — | |
Balance at end of period | | $ | 119.9 | | | $ | 248.8 | |
Asset Retirement Obligations
Our AROs primarily relate to certain processing facilities, compressor stations and inactive pipelines. The changes in our ARO liability are as follows:
| | | | | | | | |
| | 2024 | | | 2023 | |
Beginning of period | | $ | 103.0 | | | $ | 97.9 | |
Additions | | | 23.8 | | | | — | |
Accretion expense | | | 10.6 | | | | 5.9 | |
Retirements | | | — | | | | (5.7 | ) |
Change in cash flow estimate | | | 40.3 | | | | 4.9 | |
End of period | | $ | 177.7 | | | $ | 103.0 | |
Note 10 — Leases
We have non-cancellable operating leases primarily associated with our office facilities, compressors, rail assets, land, storage and terminal assets. We have finance leases primarily associated with our substations, compressors, tractors and vehicles. Our leases have remaining lease terms of 1 to 8 years, some of which include options to extend the lease term for up to 20 years.
The balances of right-of-use assets and liabilities of finance leases and operating leases, and their locations on our Consolidated Balance Sheets are as follows:
| | | | | | | | | | |
| | | | December 31, | |
| | Balance Sheet Location | | 2024 | | | 2023 | |
Operating leases: | | | | | | | | |
Lease right-of-use assets, net | | Other long-term assets | | $ | 103.7 | | | $ | 64.2 | |
Current liabilities | | Accrued liabilities | | | 25.2 | | | | 21.8 | |
Non-current liabilities | | Other long-term liabilities | | | 90.4 | | | | 56.5 | |
| | | | | | | | |
Finance leases: | | | | | | | | |
Lease right-of-use assets, net | | Property, plant and equipment, net | | $ | 285.1 | | | $ | 281.5 | |
Current liabilities | | Current debt obligations | | | 57.7 | | | | 45.7 | |
Non-current liabilities | | Long-term debt | | | 240.4 | | | | 244.1 | |
Operating lease costs and short-term lease costs are included in Operating expenses or General and administrative expense in our Consolidated Statements of Operations, depending on the nature of the leases. Finance lease costs are included in Depreciation and amortization expense and Interest expense, net in our Consolidated Statements of Operations. The components of lease expense were as follows:
| | | | | | | | | | | | | | |
| | | | Year Ended December 31, | |
| | | | 2024 | | | 2023 | | | 2022 | |
Lease cost | | | | | | | | | | | |
Operating lease cost | | | | $ | 30.6 | | | $ | 18.3 | | | $ | 17.7 | |
Short-term lease cost | | | | | 45.2 | | | | 56.7 | | | | 35.0 | |
Variable lease cost | | | | | 46.0 | | | | 26.0 | | | | 17.9 | |
Finance lease cost | | | | | | | | | | | |
Amortization of right-of-use assets | | | | | 55.3 | | | | 48.2 | | | | 20.3 | |
Interest expense | | | | | 14.5 | | | | 14.0 | | | | 3.5 | |
Total lease cost | | | | $ | 191.6 | | | $ | 163.2 | | | $ | 94.4 | |
Other supplemental information related to our leases are as follows:
| | | | | | | | | | | | | | |
| | | | Year Ended December 31, | |
| | | | 2024 | | | 2023 | | | 2022 | |
Cash paid for amounts included in the measurement of lease liabilities | | | | | | | | | | | |
Operating cash flows for operating leases | | | | $ | 32.4 | | | $ | 21.4 | | | $ | 18.8 | |
Operating cash flows for finance leases | | | | | 14.2 | | | | 13.9 | | | | 2.7 | |
Financing cash flows for finance leases | | | | | 50.1 | | | | 42.9 | | | | 19.7 | |
The weighted-average remaining lease terms for operating leases and finance leases are 5 years and 5 years, respectively. The weighted-average discount rates for operating leases and finance leases are 5.1% and 5.0%, respectively.
The following table presents the maturities of our lease liabilities under non-cancellable leases as of December 31, 2024:
| | | | | | | | |
| | Operating Leases | | | Finance Leases | |
| | | | | | |
2025 | | $ | 22.2 | | | $ | 70.3 | |
2026 | | | 24.9 | | | | 68.6 | |
2027 | | | 24.5 | | | | 61.5 | |
2028 | | | 19.9 | | | | 53.4 | |
2029 | | | 16.1 | | | | 44.3 | |
Thereafter | | | 26.5 | | | | 37.2 | |
Total undiscounted cash flows | | | 134.1 | | | | 335.3 | |
Less imputed interest | | | (18.5 | ) | | | (37.2 | ) |
Total lease liabilities | | $ | 115.6 | | | $ | 298.1 | |
Note 11 — Common Stock and Related Matters
Public Offerings of Common Stock
On May 9, 2017, we entered into an equity distribution agreement under the May 2016 Shelf (the “May 2017 EDA”), pursuant to which we may sell through our sales agents, at our option, up to an aggregated amount of $750.0 million of our common stock (“2017 ATM Program”).
On September 20, 2018, we entered into an equity distribution agreement under the May 2016 Shelf (the “September 2018 EDA”), pursuant to which we may sell through our sales agents, at our option, up to an aggregated amount of $750.0 million of our common stock (“2018 ATM Program”).
In March 2022, we filed with the SEC a universal shelf registration statement on Form S-3 that registers the issuance and sale of certain debt and equity securities from time to time in one or more offerings (the “March 2022 Shelf”). The March 2022 Shelf will expire in March 2025.
During 2024, 2023 and 2022, no shares of common stock were issued under either the May 2017 EDA or the September 2018 EDA. As a result, we have $382.1 million and $750.0 million remaining under the May 2017 EDA and September 2018 EDA, respectively, as of December 31, 2024.
Common Share Repurchase Program
In October 2020, our Board of Directors approved a share repurchase program (the “2020 Share Repurchase Program”) for the repurchase of up to $500.0 million of our outstanding common stock. During the second quarter of 2023, we exhausted the 2020 Share Repurchase Program.
In May 2023, our Board of Directors approved a share repurchase program (the “2023 Share Repurchase Program”) for the repurchase of up to $1.0 billion of our outstanding common stock. In July 2024, our Board of Directors approved a new share repurchase program (the “2024 Share Repurchase Program” and, together with the 2023 Share Repurchase Program, the “Share Repurchase Programs”) for the repurchase of up to $1.0 billion of our outstanding common stock. The amount authorized under the 2024 Share Repurchase Program was in addition to the amount remaining under the 2023 Share Repurchase Program. We are not obligated to repurchase any specific dollar amount or number of shares under the Share Repurchase Programs and may discontinue these programs at any time.
For the year ended December 31, 2024, we repurchased 5,933,050 shares of our common stock at a weighted average price per share of $127.20 for a total net cost of $754.7 million. For the year ended December 31, 2023, we repurchased 4,870,559 shares of our common stock at a weighted average price per share of $76.72 for a total net cost of $373.7 million. For the year ended December 31, 2022, we repurchased 3,412,354 shares of our common stock at a weighted average price per share of $65.87 for a total net cost of $224.8 million.
As of December 31, 2024, there was $1,015.4 million remaining under the Share Repurchase Programs.
Common Stock Dividends
In April 2024, we declared an increase to our common dividend to $0.75 per common share or $3.00 per common share annualized effective for the first quarter of 2024.
The following table details the dividends declared and/or paid by us to common shareholders for the years ended December 31, 2024, 2023 and 2022:
| | | | | | | | | | | | | | | | | | |
Three Months Ended | | Date Paid or
To Be Paid | | Total Common
Dividends Declared | | | Amount of Common
Dividends Paid or
To Be Paid | | | Dividends on
Share-Based Awards | | | Dividends Declared per Share of Common Stock | |
(In millions, except per share amounts) | |
2024 | | | | | | | | | | | | | | |
December 31, 2024 | | February 14, 2025 | | $ | 165.1 | | | $ | 163.6 | | | $ | 1.5 | | | $ | 0.75000 | |
September 30, 2024 | | November 15, 2024 | | | 165.2 | | | | 163.5 | | | | 1.7 | | | | 0.75000 | |
June 30, 2024 | | August 15, 2024 | | | 166.1 | | | | 164.3 | | | | 1.8 | | | | 0.75000 | |
March 31, 2024 | | May 15, 2024 | | | 168.1 | | | | 166.3 | | | | 1.8 | | | | 0.75000 | |
| | | | | | | | | | | | | | |
2023 | | | | | | | | | | | | | | |
December 31, 2023 | | February 15, 2024 | | $ | 112.8 | | | $ | 111.6 | | | $ | 1.2 | | | $ | 0.50000 | |
September 30, 2023 | | November 15, 2023 | | | 113.0 | | | | 111.5 | | | | 1.5 | | | | 0.50000 | |
June 30, 2023 | | August 15, 2023 | | | 113.6 | | | | 111.8 | | | | 1.8 | | | | 0.50000 | |
March 31, 2023 | | May 15, 2023 | | | 114.7 | | | | 113.0 | | | | 1.7 | | | | 0.50000 | |
| | | | | | | | | | | | | | |
2022 | | | | | | | | | | | | | | |
December 31, 2022 | | February 15, 2023 | | $ | 80.5 | | | $ | 79.3 | | | $ | 1.2 | | | $ | 0.35000 | |
September 30, 2022 | | November 15, 2022 | | | 80.5 | | | | 79.2 | | | | 1.3 | | | | 0.35000 | |
June 30, 2022 | | August 15, 2022 | | | 80.7 | | | | 79.3 | | | | 1.4 | | | | 0.35000 | |
March 31, 2022 | | May 16, 2022 | | | 81.2 | | | | 79.8 | | | | 1.4 | | | | 0.35000 | |
Preferred Stock Redemption
In May 2022, we redeemed all of our issued and outstanding shares of Series A Preferred Stock (“Series A Preferred”) at a redemption price of $1,050.00 per share, plus $8.87 per share, which is the amount of accrued and unpaid dividends from April 1, 2022 up to, but not including, the redemption date of May 3, 2022. The difference between the consideration paid of $973.4 million (including unpaid dividends of $8.2 million) and the net carrying value of the shares redeemed was $223.7 million, of which $215.5 million was recorded as deemed dividends in our Consolidated Statements of Operations in the second quarter of 2022. Following the redemption, we have no Series A Preferred outstanding and all rights of the holders of shares of Series A Preferred were terminated.
Preferred Stock Dividends
During the year ended December 31, 2022, we paid $51.8 million of dividends to Series A Preferred Shareholders.
Note 12 — Earnings per Common Share
In March 2023, the Compensation Committee amended the Restricted Stock Units Grant Agreements that govern the Restricted Stock Unit awards (“RSUs”) that vest no later than three years following the RSUs’ grant date. The amendment resulted in quarterly cash dividend payments to RSU holders beginning with the common stock dividend paid in May 2023. As the amended RSUs and certain four-year retention awards participate in nonforfeitable dividends with the common equity owners of the Company, they are considered participating securities.
We calculate earnings per share using the two-class method. Earnings are allocated to common stock and participating securities based on the amount of dividends paid in the current period plus an allocation of the undistributed earnings to the extent that each security participates in earnings.
The following table sets forth a reconciliation of net income and weighted average shares outstanding used in computing basic and diluted net income per common share:
| | | | | | | | | | | | |
| | Year Ended December 31, | |
| | 2024 | | | 2023 | | | 2022 | |
| | (In millions, except per share amounts) | |
Net income (loss) attributable to Targa Resources Corp. | | $ | 1,312.0 | | | $ | 1,345.9 | | | $ | 1,195.5 | |
Less: Premium on repurchase of noncontrolling interests, net of tax (1) | | | 32.9 | | | | 510.1 | | | | 53.2 | |
Less: Dividends on Series A Preferred Stock (2) | | | — | | | | — | | | | 30.0 | |
Less: Deemed dividends on Series A Preferred Stock (3) | | | — | | | | — | | | | 215.5 | |
Net income (loss) attributable to common shareholders | | | 1,279.1 | | | | 835.8 | | | | 896.8 | |
Less: Participating share-based earnings (4) | | | 9.6 | | | | 7.6 | | | | — | |
Net income (loss) allocated to common shareholders for basic earnings per share | | $ | 1,269.5 | | | $ | 828.2 | | | $ | 896.8 | |
| | | | | | | | | |
Weighted average shares outstanding - basic | | | 220.2 | | | | 224.6 | | | | 227.3 | |
Dilutive effect of unvested restricted stock awards | | | 1.1 | | | | 1.4 | | | | 3.8 | |
Weighted average shares outstanding - diluted | | | 221.3 | | | | 226.0 | | | | 231.1 | |
| | | | | | | | | |
Net income (loss) available per common share - basic | | $ | 5.77 | | | $ | 3.69 | | | $ | 3.95 | |
Net income (loss) available per common share - diluted | | $ | 5.74 | | | $ | 3.66 | | | $ | 3.88 | |
(1)Represents premium paid on the CBF Acquisition, Grand Prix Transaction, Carnero Acquisition and the DevCo JV Repurchase. See Note 4 – Acquisitions and Divestitures.
(2)Includes $8.2 million attributable to the dividends paid upon the full redemption of Series A Preferred in 2022. See Note 11 – Common Stock and Related Matters for further discussion.
(3)Includes $215.5 million attributable to the full redemption of Series A Preferred in 2022. See Note 11 – Common Stock and Related Matters for further discussion.
(4)Represents the distributed and undistributed earnings of the Company attributable to the participating securities. The dilutive effect of the reallocation of participating securities to diluted net income attributable to common shareholders was immaterial.
The following potential common stock equivalents are excluded from the determination of diluted earnings per share because the inclusion of such shares would have been anti-dilutive (in millions on a weighted-average basis):
| | | | | | | | | | | | |
| | Year Ended December 31, | |
| | 2024 | | | 2023 | | | 2022 | |
Unvested restricted stock awards | | | 1.2 | | | | 1.5 | | | | — | |
Series A Preferred Stock (1) | | | — | | | | — | | | | 14.9 | |
(1)The Series A Preferred had no mandatory redemption date, but was redeemable at our election for a 5% premium to the liquidation preference subsequent to March 16, 2022. In May 2022, we redeemed all of our issued and outstanding Series A Preferred at a redemption price of $1,050.00 per share, plus $8.87 per share, which is the amount of accrued and unpaid dividends from April 1, 2022 up to, but not including, the redemption date of May 3, 2022. See Note 11 – Common Stock and Related Matters for further discussion.
Note 13 — Derivative Instruments and Hedging Activities
The primary purpose of our commodity risk management activities is to manage our exposure to commodity price risk and reduce volatility in our operating cash flow due to fluctuations in commodity prices. We have entered into derivative instruments to hedge the commodity price risks associated with a portion of our expected (i) natural gas, NGL, and condensate equity volumes in our Gathering and Processing operations that result from percent-of-proceeds processing arrangements, (ii) future commodity purchases and sales in our Logistics and Transportation segment and (iii) natural gas transportation basis risk in our Logistics and Transportation segment. The hedge positions associated with (i) and (ii) above will move favorably in periods of falling commodity prices and unfavorably in periods of rising commodity prices and are primarily designated as cash flow hedges for accounting purposes.
The hedges generally match the NGL product composition and the NGL delivery points of our physical equity volumes. Our natural gas hedges are a mixture of specific gas delivery points and Henry Hub. The NGL hedges may be transacted as specific NGL hedges or as baskets of ethane, propane, normal butane, isobutane and natural gasoline based upon our expected equity NGL composition. We believe this approach avoids uncorrelated risks resulting from employing hedges on crude oil or other petroleum products as “proxy” hedges of NGL prices. Our natural gas and NGL hedges are settled using published index prices for delivery at various locations.
We hedge a portion of our condensate equity volumes using crude oil hedges that are based on the NYMEX futures contracts for West Texas Intermediate light, sweet crude, which approximates the prices received for condensate. This exposes us to a market differential risk if the NYMEX futures do not move in exact parity with the sales price of our underlying condensate equity volumes.
We also enter into derivative instruments to help manage other short-term commodity-related business risks and take advantage of market opportunities. We have not designated these derivatives as hedges and record changes in fair value and cash settlements to revenues in current earnings.
At December 31, 2024, the notional volumes of our commodity derivative contracts were:
| | | | | | | | | | | | | | |
Commodity | Instrument | Unit | 2025 | | 2026 | | 2027 | | 2028 | |
Natural Gas | Swaps | MMBtu/d | | 82,428 | | | 81,604 | | | 12,971 | | | — | |
Natural Gas | Basis Swaps | MMBtu/d | | 482,370 | | | 242,500 | | | 208,329 | | | 55,000 | |
NGL | Swaps | Bbl/d | | 29,695 | | | 28,753 | | | 3,770 | | | — | |
NGL | Futures | Bbl/d | | 10,422 | | | 411 | | | — | | | — | |
Condensate | Swaps | Bbl/d | | 7,814 | | | 8,249 | | | 1,208 | | | — | |
Our derivative contracts are subject to netting arrangements that permit our contracting subsidiaries to net cash settle offsetting asset and liability positions with the same counterparty within the same Targa entity. The master netting provisions reduced our maximum loss due to counterparty credit risk by $13.4 million as of December 31, 2024. The range of losses attributable to our individual counterparties would be between $0.0 million and $3.8 million, depending on the counterparty in default. We record derivative assets and liabilities on our Consolidated Balance Sheets on a gross basis, without considering the effect of master netting arrangements.
The following table reflects the fair value of our derivative instruments and their location on our Consolidated Balance Sheets as of the periods presented:
| | | | | | | | | | | | | | | | | | |
| | | | Fair Value as of December 31, 2024 | | | Fair Value as of December 31, 2023 | |
| | Balance Sheet | | Derivative | | | Derivative | | | Derivative | | | Derivative | |
| | Location | | Assets | | | Liabilities | | | Assets | | | Liabilities | |
Derivatives designated as hedging instruments | | | | | | | | | | | | | | |
Commodity contracts | | Current | | $ | 50.8 | | | $ | (29.0 | ) | | $ | 103.5 | | | $ | (16.4 | ) |
| | Long-term | | | 20.8 | | | | (11.7 | ) | | | 29.0 | | | | (3.0 | ) |
Total derivatives designated as hedging instruments | | | | $ | 71.6 | | | $ | (40.7 | ) | | $ | 132.5 | | | $ | (19.4 | ) |
Derivatives not designated as hedging instruments | | | | | | | | | | | | | | |
Commodity contracts | | Current | | $ | 11.0 | | | $ | (138.3 | ) | | $ | 8.4 | | | $ | (37.6 | ) |
| | Long-term | | | 4.5 | | | | (80.3 | ) | | | 4.3 | | | | (13.8 | ) |
Total derivatives not designated as hedging instruments | | | | $ | 15.5 | | | $ | (218.6 | ) | | $ | 12.7 | | | $ | (51.4 | ) |
Total current position | | | | $ | 61.8 | | | $ | (167.3 | ) | | $ | 111.9 | | | $ | (54.0 | ) |
Total long-term position | | | | | 25.3 | | | | (92.0 | ) | | | 33.3 | | | | (16.8 | ) |
Total derivatives | | | | $ | 87.1 | | | $ | (259.3 | ) | | $ | 145.2 | | | $ | (70.8 | ) |
The following table reflects the pro forma impact of reporting derivatives on our Consolidated Balance Sheets on a net basis as of the periods presented:
| | | | | | | | | | | | | | | | | | | | | |
| | | Gross Presentation | | | Pro Forma Net Presentation | |
December 31, 2024 | | Asset | | | Liability | | | Collateral | | | Asset | | | Liability | |
Current Position | | | | | | | | | | | | | | | |
| Counterparties with offsetting positions or collateral | | $ | 61.7 | | | $ | (167.3 | ) | | $ | 37.1 | | | $ | 9.2 | | | $ | (77.7 | ) |
| Counterparties without offsetting positions - assets | | | 0.1 | | | | — | | | | — | | | | 0.1 | | | | — | |
| Counterparties without offsetting positions - liabilities | | | — | | | | — | | | | — | | | | — | | | | — | |
| | | | 61.8 | | | | (167.3 | ) | | | 37.1 | | | | 9.3 | | | | (77.7 | ) |
Long-Term Position | | | | | | | | | | | | | | | |
| Counterparties with offsetting positions or collateral | | | 24.2 | | | | (91.5 | ) | | | 9.0 | | | | 4.2 | | | | (62.5 | ) |
| Counterparties without offsetting positions - assets | | | 1.1 | | | | — | | | | — | | | | 1.1 | | | | — | |
| Counterparties without offsetting positions - liabilities | | | — | | | | (0.5 | ) | | | — | | | | — | | | | (0.5 | ) |
| | | | 25.3 | | | | (92.0 | ) | | | 9.0 | | | | 5.3 | | | | (63.0 | ) |
Total Derivatives | | | | | | | | | | | | | | | |
| Counterparties with offsetting positions or collateral | | | 85.9 | | | | (258.8 | ) | | | 46.1 | | | | 13.4 | | | | (140.2 | ) |
| Counterparties without offsetting positions - assets | | | 1.2 | | | | — | | | | — | | | | 1.2 | | | | — | |
| Counterparties without offsetting positions - liabilities | | | — | | | | (0.5 | ) | | | — | | | | — | | | | (0.5 | ) |
| | | $ | 87.1 | | | $ | (259.3 | ) | | $ | 46.1 | | | $ | 14.6 | | | $ | (140.7 | ) |
| | | | | | | | | | | | | | | | |
| | | Gross Presentation | | | Pro Forma Net Presentation | |
December 31, 2023 | | Asset | | | Liability | | | Collateral | | | Asset | | | Liability | |
Current Position | | | | | | | | | | | | | | | |
| Counterparties with offsetting positions or collateral | | $ | 111.7 | | | $ | (54.0 | ) | | $ | 3.6 | | | $ | 69.2 | | | $ | (7.9 | ) |
| Counterparties without offsetting positions - assets | | | 0.2 | | | | — | | | | — | | | | 0.2 | | | | — | |
| Counterparties without offsetting positions - liabilities | | | — | | | | — | | | | — | | | | — | | | | — | |
| | | | 111.9 | | | | (54.0 | ) | | | 3.6 | | | | 69.4 | | | | (7.9 | ) |
Long-Term Position | | | | | | | | | | | | | | | |
| Counterparties with offsetting positions or collateral | | | 31.7 | | | | (16.8 | ) | | | (0.1 | ) | | | 17.0 | | | | (2.2 | ) |
| Counterparties without offsetting positions - assets | | | 1.6 | | | | — | | | | — | | | | 1.6 | | | | — | |
| Counterparties without offsetting positions - liabilities | | | — | | | | — | | | | — | | | | — | | | | — | |
| | | | 33.3 | | | | (16.8 | ) | | | (0.1 | ) | | | 18.6 | | | | (2.2 | ) |
Total Derivatives | | | | | | | | | | | | | | | |
| Counterparties with offsetting positions or collateral | | | 143.4 | | | | (70.8 | ) | | | 3.5 | | | | 86.2 | | | | (10.1 | ) |
| Counterparties without offsetting positions - assets | | | 1.8 | | | | — | | | | — | | | | 1.8 | | | | — | |
| Counterparties without offsetting positions - liabilities | | | — | | | | — | | | | — | | | | — | | | | — | |
| | | $ | 145.2 | | | $ | (70.8 | ) | | $ | 3.5 | | | $ | 88.0 | | | $ | (10.1 | ) |
Some of our hedges are futures contracts executed through brokers that clear the hedges through an exchange. We maintain a margin deposit with the brokers in an amount sufficient to cover the fair value of our open futures positions. The margin deposit is considered collateral, which is located within Other current assets on our Consolidated Balance Sheets and is not offset against the fair value of our derivative instruments. Our derivative instruments other than our futures contracts are executed under International Swaps and Derivatives Association agreements (“ISDAs”), which govern the key terms with our counterparties. Our ISDAs contain credit-risk related contingent features. Following the release of the collateral securing our Existing TRGP Revolver, our derivative positions are no longer secured. As of December 31, 2024, we have outstanding net derivative positions that contain credit-risk related contingent features that are in a net liability position of $138.2 million. We have not been required to post any collateral related to these positions due to our credit rating. If our credit rating was to be downgraded one notch below investment grade by both Moody’s and S&P, as defined in our ISDAs, we estimate that as of December 31, 2024, we would not be required to post collateral to any counterparties and that no counterparty could request immediate, full settlement per the terms of our ISDAs.
The fair value of our derivative instruments, depending on the type of instrument, was determined by the use of present value methods or standard option valuation models with assumptions about commodity prices based on those observed in underlying markets. The estimated fair value of our derivative instruments was a net liability of $172.2 million as of December 31, 2024. The estimated fair value is net of an adjustment for credit risk based on the default probabilities as indicated by market quotes for our counterparties’ credit default swap rates. The credit risk adjustment was immaterial for all periods presented. Our futures contracts that are cleared through an exchange are margined daily and do not require any credit adjustment.
The following tables reflect amounts recorded in OCI and amounts reclassified from OCI to revenue:
| | | | | | | | | | | | |
| | Gain (Loss) Recognized in OCI on Derivatives (Effective Portion) | |
Derivatives in Cash Flow | | Year Ended December 31, | |
Hedging Relationships | | 2024 | | | 2023 | | | 2022 | |
Commodity contracts | | $ | (7.5 | ) | | $ | 193.4 | | | $ | (5.6 | ) |
| | | | | | | | | |
| | Gain (Loss) Reclassified from OCI into Income (Effective Portion) | |
| | Year Ended December 31, | |
Location of Gain (Loss) | | 2024 | | | 2023 | | | 2022 | |
Revenues | | $ | 67.8 | | | $ | 153.4 | | | $ | (373.0 | ) |
As of December 31, 2024, we expect to reclassify commodity hedge related deferred gains of $19.1 million included in accumulated other comprehensive income (loss) into earnings before income taxes over the next twelve months. However, actual amounts reclassified into earnings could be greater or less than the net amount reported in accumulated other comprehensive income. Based on valuations as of December 31, 2024, the maximum length of time over which we have hedged our exposure to the variability in future cash flows is through December 2027.
Our consolidated earnings are also affected by the use of the mark-to-market method of accounting for derivative instruments that do not qualify for hedge accounting or that have not been designated as hedges. The changes in fair value of these instruments are recorded on our Consolidated Balance Sheets and through earnings in our Consolidated Statements of Operations rather than being deferred until the anticipated transaction settles. The use of mark-to-market accounting for financial assets and liabilities (“financial instruments”) can cause non-cash earnings volatility due to changes in the underlying commodity price indices. For the year ended December 31, 2024, the unrealized mark-to-market losses are primarily attributable to unfavorable movements in natural gas forward basis prices, as compared to our positions.
| | | | | | | | | | | | | | |
| | Location of Gain (Loss) | | Gain (Loss) Recognized in Income on Derivatives | |
Derivatives Not Designated | | Recognized in Income on | | Year Ended December 31, | |
as Hedging Instruments | | Derivatives | | 2024 | | | 2023 | | | 2022 | |
Commodity contracts | | Revenue | | $ | (313.2 | ) | | $ | 287.7 | | | $ | (381.7 | ) |
See Note 14 – Fair Value Measurements and Note 22 – Segment Information for additional disclosures related to derivative instruments and hedging activities.
Note 14 — Fair Value Measurements
Under GAAP, our Consolidated Balance Sheets reflect a mixture of measurement methods for financial instruments. Derivative financial instruments are reported at fair value on our Consolidated Balance Sheets. Other financial instruments are reported at historical cost or amortized cost on our Consolidated Balance Sheets. The following are additional qualitative and quantitative disclosures regarding fair value measurements of our financial instruments.
Fair Value of Derivative Financial Instruments
Our derivative instruments consist of financially settled commodity swaps, futures, option contracts and fixed-price forward commodity contracts with certain counterparties. We determine the fair value of our derivative instruments using present value methods or standard option valuation models with assumptions about commodity prices based on those observed in underlying markets. We have consistently applied these valuation techniques in all periods presented and we believe we have obtained the most accurate information available for the types of derivative instruments we hold.
The fair values of our derivative instruments are sensitive to changes in forward pricing on natural gas, NGLs and crude oil. The derivatives at December 31, 2024, represent a net liability position of $172.2 million, and reflects the present value, adjusted for counterparty credit risk, of the amount we expect to receive or pay in the future on our derivative instruments. If forward pricing on natural gas, NGLs and crude oil were to increase by 10%, the result would be a fair value reflecting a net liability of $323.6 million. If forward pricing on natural gas, NGLs and crude oil were to decrease by 10%, the result would be a fair value reflecting a net liability of $20.8 million.
Fair Value of Other Financial Instruments
Due to their cash or near-cash nature, the carrying value of other financial instruments included in working capital (i.e., cash and cash equivalents, accounts receivable, accounts payable) approximates their fair value. Long-term debt is primarily the other financial instrument for which carrying value could vary significantly from fair value. We determined the supplemental fair value disclosures for our current and long-term debt as follows:
•the Existing TRGP Revolver, commercial paper notes, Securitization Facility and Term Loan Facility are based on carrying value, which approximates fair value as their interest rates are based on prevailing market rates; and
•the TRGP senior unsecured notes and the Partnership’s senior unsecured notes are based on quoted market prices derived from trades of the debt.
Fair Value Hierarchy
The following table shows a breakdown by fair value hierarchy category for (i) financial instruments measurements included on our Consolidated Balance Sheets at fair value and (ii) supplemental fair value disclosures for other financial instruments:
| | | | | | | | | | | | | | | | | | | | |
| | December 31, 2024 | |
| | Carrying | | | Fair Value | |
| | Value | | | Total | | | Level 1 | | | Level 2 | | | Level 3 | |
Financial Instruments Recorded on Our
Consolidated Balance Sheets at Fair Value: | | | | | | | | | | | | | | | |
Assets from commodity derivative contracts (1) | | $ | 87.0 | | | $ | 87.0 | | | $ | — | | | $ | 87.0 | | | $ | — | |
Liabilities from commodity derivative contracts (1) | | | 259.2 | | | | 259.2 | | | | — | | | | 259.2 | | | | — | |
Financial Instruments Recorded on Our
Consolidated Balance Sheets at Carrying Value: | | | | | | | | | | | | | | | |
Cash and cash equivalents | | | 157.3 | | | | 157.3 | | | | — | | | | — | | | | — | |
Existing TRGP Revolver and Commercial Paper Program | | | 1,130.5 | | | | 1,130.5 | | | | — | | | | 1,130.5 | | | | — | |
TRGP Senior unsecured notes | | | 7,470.6 | | | | 7,438.6 | | | | — | | | | 7,438.6 | | | | — | |
Partnership’s Senior unsecured notes | | | 5,034.4 | | | | 4,928.0 | | | | — | | | | 4,928.0 | | | | — | |
Securitization Facility | | | 330.0 | | | | 330.0 | | | | — | | | | 330.0 | | | | — | |
| | | | | | | | | | | | | | | | | | | | |
| | December 31, 2023 | |
| | Carrying | | | Fair Value | |
| | Value | | | Total | | | Level 1 | | | Level 2 | | | Level 3 | |
Financial Instruments Recorded on Our
Consolidated Balance Sheets at Fair Value: | | | | | | | | | | | | | | | |
Assets from commodity derivative contracts (1) | | $ | 144.6 | | | $ | 144.6 | | | $ | — | | | $ | 144.6 | | | $ | — | |
Liabilities from commodity derivative contracts (1) | | | 70.2 | | | | 70.2 | | | | — | | | | 70.2 | | | | — | |
Financial Instruments Recorded on Our
Consolidated Balance Sheets at Carrying Value: | |
| | | | | | | | |
| | |
| |
Cash and cash equivalents | | | 141.7 | | | | 141.7 | | | | — | | | | — | | | | — | |
Existing TRGP Revolver and Commercial Paper Program | | | 175.0 | | | | 175.0 | | | | — | | | | 175.0 | | | | — | |
TRGP Senior unsecured notes | | | 6,470.5 | | | | 6,598.7 | | | | — | | | | 6,598.7 | | | | — | |
Term Loan Facility | | | 500.0 | | | | 500.0 | | | | — | | | | 500.0 | | | | — | |
Partnership’s Senior unsecured notes | | | 5,034.4 | | | | 4,945.1 | | | | — | | | | 4,945.1 | | | | — | |
Securitization Facility | | | 575.0 | | | | 575.0 | | | | — | | | | 575.0 | | | | — | |
(1)The fair value of derivative contracts in this table is presented on a different basis than the Consolidated Balance Sheets presentation as disclosed in Note 13 – Derivative Instruments and Hedging Activities. The above fair values reflect the total value of each derivative contract taken as a whole, whereas the Consolidated Balance Sheets presentation is based on the individual maturity dates of estimated future settlements. As such, an individual contract could have both an asset and liability position when segregated into its current and long-term portions for Consolidated Balance Sheets classification purposes.
Note 15 — Related Party Transactions
Transactions with Unconsolidated Affiliates
The following table summarizes our transactions with unconsolidated affiliates:
| | | | | | | | | | | | | | | | | | | | | | | | |
| | GCF | | | T2 Joint Ventures (1) | | | Cayenne | | | GCX (2) | | | Little Missouri 4 | | | Total | |
2024: | | | | | | | | | | | | | | | | | | |
Product purchases and fuel | $ | | — | | $ | | — | | $ | | 6.4 | | $ | | — | | $ | | 14.0 | | $ | | 20.4 | |
Operating expenses | | | (11.6 | ) | | | — | | | | (0.9 | ) | | | — | | | | (2.2 | ) | | | (14.7 | ) |
General and administrative expenses | | | — | | | | — | | | | — | | | | — | | | | (0.9 | ) | | | (0.9 | ) |
2023: | | | | | | | | | | | | | | | | | | |
Product purchases and fuel | $ | | — | | $ | | — | | $ | | 6.4 | | $ | | — | | $ | | 8.1 | | $ | | 14.5 | |
Operating expenses | | | (5.6 | ) | | | — | | | | (0.9 | ) | | | — | | | | (2.2 | ) | | | (8.7 | ) |
General and administrative expenses | | | — | | | | — | | | | — | | | | — | | | | (0.9 | ) | | | (0.9 | ) |
2022: | | | | | | | | | | | | | | | | | | |
Product purchases and fuel | $ | | — | | $ | | — | | $ | | 4.7 | | $ | | 25.0 | | $ | | 7.9 | | $ | | 37.6 | |
Operating expenses | | | (1.7 | ) | | | 1.0 | | | | (0.9 | ) | | | — | | | | (3.0 | ) | | | (4.6 | ) |
General and administrative expenses | | | — | | | | — | | | | — | | | | — | | | | (0.9 | ) | | | (0.9 | ) |
(1)Following the closing of the South Texas Acquisition in April 2022, the T2 Joint Ventures are 100% owned and consolidated by Targa.
(2)Following the closing of the GCX Sale in May 2022, Targa no longer has an ownership interest in GCX.
Note 16 — Commitments
Future non-cancelable commitments related to certain contractual obligations are presented below for each of the next five fiscal years and in aggregate thereafter:
| | | | | | | | | | | | | | | | | | | | | | | | | | | |
| In Aggregate | | | 2025 | | | 2026 | | | 2027 | | | 2028 | | | 2029 | | | Thereafter | |
Land sites and rights of way (1) | $ | 333.1 | | | $ | 9.3 | | | $ | 11.1 | | | $ | 12.5 | | | $ | 17.7 | | | $ | 8.5 | | | $ | 274.0 | |
(1)Leases related to land sites and rights of way provide for surface and underground access for gathering, processing and distribution assets that are located on property not owned by us. These agreements expire at various dates, with varying terms, some of which are perpetual.
Total expenses incurred under the above non-cancelable commitments were:
| | | | | | | | | | | |
| 2024 | | | 2023 | | | 2022 | |
Land sites and rights of way | $ | 7.2 | | | $ | 9.0 | | | $ | 5.8 | |
Note 17 — Contingencies
Legal Proceedings
We and the Partnership are parties to various legal, administrative and regulatory proceedings that have arisen in the ordinary course of our business. We and the Partnership are also parties to various proceedings with governmental environmental agencies, including, but not limited to the U.S. Environmental Protection Agency (the “EPA”), Texas Commission on Environmental Quality, Oklahoma Department of Environmental Quality, New Mexico Environment Department, Louisiana Department of Environmental Quality and North Dakota Department of Environmental Quality, which assert monetary sanctions for alleged violations of environmental regulations, including air emissions, discharges into the environment and reporting deficiencies, related to events that have arisen at certain of our facilities in the ordinary course of our business.
On December 26, 2018, Vitol filed a lawsuit in the 80th District Court of Harris County (the “District Court”), Texas against Targa Channelview LLC, then a subsidiary of the Company (“Targa Channelview”), seeking recovery of $129.0 million in payments made to Targa Channelview, additional monetary damages, attorneys’ fees and costs. Vitol alleged that Targa Channelview breached the Splitter Agreement, which provided for Targa Channelview to construct a crude oil and condensate splitter (the “Splitter”) adjacent to a barge dock owned by Targa Channelview to provide services contemplated by the Splitter Agreement. In January 2018, Vitol acquired Noble Americas Corp. and on December 23, 2018, Vitol voluntarily elected to terminate the Splitter Agreement claiming that Targa Channelview failed to timely achieve start-up of the Splitter. Vitol’s lawsuit also alleged Targa Channelview made a series of misrepresentations about the capability of the barge dock that would service crude oil and condensate volumes to be processed by the Splitter and Splitter products. Vitol sought return of $129.0 million in payments made to Targa Channelview prior to the start-up of the Splitter, as well as additional damages. On the same date that Vitol filed its lawsuit, Targa Channelview filed a lawsuit against Vitol seeking a judicial determination that Vitol’s sole and exclusive remedy was Vitol’s voluntarily termination of the Splitter Agreement and, as a result, Vitol was not entitled to the return of any prior payments under the Splitter Agreement or other damages as alleged. Targa also sought recovery of its attorneys’ fees and costs in the lawsuit.
On October 15, 2020, the District Court awarded Vitol $129.0 million (plus interest) following a bench trial. In addition, the District Court awarded Vitol $10.5 million in damages for losses and demurrage on crude oil that Vitol purchased for start-up efforts. The Company appealed the award in the Fourteenth Court of Appeals in Houston, Texas. In October 2020, we sold Targa Channelview but, under the agreements governing the sale, we retained the liabilities associated with the Vitol proceedings. On September 13, 2022, the Fourteenth Court of Appeals upheld the trial court’s judgment in part with regard to the return of Vitol’s prior payments, but modified the judgment to delete Vitol’s ability to recover any damages related to losses or demurrage on crude oil. We filed a petition for review with the Supreme Court of Texas, which was denied on October 20, 2023. We then filed a petition for rehearing with the Supreme Court of Texas, which was denied on April 19, 2024. As a result of the April 2024 ruling, the $129.0 million in payments from Vitol were reclassified from Other long-term liabilities to Accrued liabilities on our Consolidated Balance Sheets during the first quarter of 2024.
The cumulative interest on the award of $55.8 million was recorded in Interest expense, in our Consolidated Statement of Operations for the year ended December 31, 2024. On April 26, 2024 as a result of the final determination of Targa’s appeal to the Texas Supreme Court related to the Splitter Agreement, we made a cash payment of $184.8 million to Vitol in satisfaction of the Texas state court judgment. See Note 9 – Other Long-term Liabilities.
On July 24, 2023, we received a Notice of Violation (“NOV”) from the New Mexico Environment Department (“NMED”), Air Quality Bureau, relating to alleged air permit violations at the Red Hills gas processing facility. The alleged air permit violations occurred primarily between August 1, 2021 and June 30, 2022, while these facilities were owned by Lucid, an entity we acquired in July 2022 and whose assets are now integrated into Targa Northern Delaware LLC, a wholly-owned subsidiary of the Company. On December 5, 2024, we received a proposed Administrative Compliance Order (“ACO”) from the NMED relating to the violation identified in the NOV and certain other alleged violations. The ACO includes a proposed civil penalty of approximately $47.8 million and requires certain capital improvements to address the operations and excess air emissions at the Red Hills processing facility. These capital improvements, totaling approximately $140 million, were substantially completed by December 31, 2024.
On January 3, 2025, we filed a Request for Hearing with the NMED with respect to the ACO. We have cooperated with the NMED in identifying and correcting legacy environmental issues since our acquisition of Lucid, and we expect to continue to engage with the NMED to resolve this matter. Although this matter is ongoing and we cannot predict its ultimate outcome, we believe we have valid defenses to many of the NMED allegations and intend to vigorously defend this matter.
On October 26, 2023, we received a final judgment in a lawsuit alleging a breach of contract related to the major winter storm in February 2021. The damages awarded against us are approximately $6.9 million, not including pre-judgment interest. Both parties are appealing the judgment.
We were named as defendants in other breach of contract cases related to force majeure events arising during the major winter storm in February 2021. While it is not possible to predict the total ultimate losses with respect to these cases, we believe that aggregate losses up to $10.0 million are reasonably possible.
In April 2024, we received an administrative NOV from the EPA and a request for the production of documents from the United States Attorney’s Office for North Dakota relating to alleged violations of the Clean Air Act (“CAA”), at certain Targa Badlands LLC compressor stations. The NOV and subpoena stem from inspections the EPA conducted at the compressor stations on June 15, 2023, as well as related records reviews. In October 2024, we began negotiations with the U.S. Attorney’s Office with respect to resolution of a single-count information alleging a violation of the CAA related to untimely installation of monitoring equipment at one compressor station, which carries a maximum fine of $500,000, and we entered into a Plea Agreement on December 16, 2024 reflecting these terms. We have also entered into discussions with the EPA with respect to a proposed Consent Agreement and Final Order that would resolve
the allegations contained in the NOV by requiring, among other things, payment of an administrative penalty. Although these matters are ongoing and we cannot predict their ultimate outcome, we do not expect resolution of these matters will be material to our consolidated financial statements.
Note 18 — Revenue
Fixed consideration allocated to remaining performance obligations
The following table presents the estimated minimum revenue related to unsatisfied performance obligations at the end of the reporting period, and is comprised of fixed consideration primarily attributable to contracts with minimum volume commitments, for which a guaranteed amount of revenue can be calculated. These contracts are comprised primarily of gathering and processing, fractionation, export, terminaling and storage agreements, with remaining contract terms ranging from 1 to 15 years.
| | | | | | | | | | | | | |
| | | 2025 | | | 2026 | | | 2027 and after | |
Fixed consideration to be recognized as of December 31, 2024 | | | $ | 442.1 | | | $ | 411.7 | | | $ | 2,045.5 | |
Based on the optional exemptions that we elected to apply, the amounts presented in the table above exclude remaining performance obligations for (i) variable consideration for which the allocation exception is met and (ii) contracts with an original expected duration of one year or less.
For additional information on our revenue recognition policy, see Note 3 – Significant Accounting Policies, and for disclosures related to disaggregated revenue, see Note 22 – Segment Information.
Note 19 — Income Taxes
Components of the federal and state income tax provisions for the periods indicated are as follows:
| | | | | | | | | | | |
| Year Ended December 31, | |
| 2024 | | | 2023 | | | 2022 | |
Current expense (benefit) | $ | 17.5 | | | $ | 13.6 | | | $ | 6.7 | |
Deferred expense (benefit) | | 367.0 | | | | 349.6 | | | | 125.1 | |
Total income tax expense (benefit) | $ | 384.5 | | | $ | 363.2 | | | $ | 131.8 | |
Our deferred income tax assets and liabilities as of the periods indicated consist of recognition differences related to certain types of costs as follows:
| | | | | | | |
| December 31, 2024 | | | December 31, 2023 | |
Deferred tax assets: | | | | | |
Net operating loss and tax credit carryforwards | $ | 1,094.9 | | | $ | 1,282.9 | |
Disallowed business interest expense carryforward | | 113.5 | | | | 79.3 | |
Property, plant and equipment | | 1.9 | | | | — | |
Other | | 10.1 | | | | — | |
Deferred tax assets before valuation allowance | | 1,220.4 | | | | 1,362.2 | |
Valuation allowance | | (5.9 | ) | | | (7.1 | ) |
Deferred tax assets | | 1,214.5 | | | | 1,355.1 | |
Deferred tax liabilities: | | | | | |
Investments (1) | | (2,086.6 | ) | | | (1,867.9 | ) |
Property, plant, and equipment | | — | | | | (3.0 | ) |
Other | | — | | | | (20.0 | ) |
Deferred tax liabilities | | (2,086.6 | ) | | | (1,890.9 | ) |
Net deferred tax asset (liability) | $ | (872.1 | ) | | $ | (535.8 | ) |
| | | | | |
Net deferred tax asset (liability) | | | | | |
Federal | $ | (826.7 | ) | | $ | (507.0 | ) |
State | | (45.4 | ) | | | (28.8 | ) |
Long-term deferred tax liability, net | $ | (872.1 | ) | | $ | (535.8 | ) |
(1)Our deferred tax liability attributable to investments reflects the differences between the book and tax carrying values of our investment in the Partnership.
We are subject to tax in the U.S. and various state jurisdictions, and we are subject to periodic audits and reviews by taxing authorities. As of December 31, 2024, Internal Revenue Service (“IRS”) examinations are currently in process for the 2019, 2020 and 2022 taxable years of certain wholly-owned and consolidated subsidiaries that are treated as partnerships for U.S. federal income tax purposes. We
are responding to information requests from the IRS with respect to these audits. We do not expect there to be any audit adjustments that would materially change our taxable income.
Federal statutes of limitations for returns filed in 2021 (for calendar year 2020) have expired. The 2019 returns under examination have a statute extension to December 2025. The statute of limitations expired on substantially all 2020 state income tax returns that were filed prior to October 15, 2021. For Texas, the statute of limitations has expired for 2020 returns (for calendar year 2019). However, tax authorities could review and adjust carryover attributes (e.g., net operating losses (“NOLs”)) generated in a closed tax year if utilized in an open tax year.
As of December 31, 2024, we have total U.S. federal NOL carryforwards of $4.7 billion and tax credit carryforwards of $3.9 million. The NOL carryforwards do not expire, but are limited to offsetting 80% of taxable income per year. The tax credit carryforwards expire in 2044. As of December 31, 2024, our tax effected valuation allowance was $5.9 million, a decrease of $1.2 million from December 31, 2023. Of this valuation allowance, $5.2 million is federal and the remaining $0.7 million is state.
Set forth below is the reconciliation between our Income tax provision (benefit) computed at the United States statutory rate on income before income taxes and the income tax provision (benefit) in our Consolidated Statements of Operations for the periods indicated:
| | | | | | | | | | | |
| Year Ended December 31, | |
Income tax reconciliation: | 2024 | | | 2023 | | | 2022 | |
Income (loss) before income taxes | $ | 1,938.0 | | | $ | 1,942.5 | | | $ | 1,663.2 | |
Less: Net income attributable to noncontrolling interest | | (241.5 | ) | | | (233.4 | ) | | | (335.9 | ) |
Income attributable to Targa Resources Corp. before income taxes | | 1,696.5 | | | | 1,709.1 | | | | 1,327.3 | |
Federal statutory income tax rate | | 21 | % | | | 21 | % | | | 21 | % |
Provision for federal income taxes | | 356.3 | | | | 358.9 | | | | 278.7 | |
Valuation allowance | | (1.2 | ) | | | (29.8 | ) | | | (177.5 | ) |
State income taxes, net of federal tax benefit | | 36.4 | | | | 37.8 | | | | 33.6 | |
Return-to-provision | | 2.4 | | | | (5.7 | ) | | | (0.6 | ) |
Change in income tax rate | | (12.4 | ) | | | 11.5 | | | | (1.7 | ) |
Permanent adjustments | | 7.7 | | | | 6.2 | | | | 5.6 | |
Stock compensation shortfall/(windfall) | | (13.5 | ) | | | (15.8 | ) | | | (6.3 | ) |
Other, net | | 8.8 | | | | 0.1 | | | | — | |
Income tax provision (benefit) | $ | 384.5 | | | $ | 363.2 | | | $ | 131.8 | |
We have not identified any uncertain tax positions. We believe that our income tax filing positions and deductions will be sustained on audit and do not anticipate any adjustments that will result in a material adverse effect on our financial condition, results of operations or cash flow. Therefore, no reserves for uncertain income tax positions have been recorded.
On August 16, 2022, President Biden signed into law the Inflation Reduction Act of 2022 (the “IRA”) which, among other things, introduced a corporate alternative minimum tax (the “CAMT”), imposed a 1% excise tax on stock buybacks and tax incentives to promote clean energy. Under the CAMT, a 15% minimum tax will be imposed on certain financial statement income of “applicable corporations.” The IRA treats a corporation as an applicable corporation in any taxable year in which the “average annual adjusted financial statement income” of such corporation for the three taxable year period ending prior to such taxable year exceeds $1 billion.
The U.S. Department of the Treasury and the IRS have issued guidance on the application of the CAMT, including proposed regulations issued in September 2024, which may be relied upon until final regulations are issued. Based on our interpretation of the IRA, the CAMT and related guidance, and several operational, economic, accounting and regulatory assumptions, we are currently not an “applicable corporation”, but we are likely to become one in a subsequent year, potentially as early as 2026. If we become an applicable corporation and our CAMT liability is greater than our regular U.S. federal income tax liability for any particular tax year, the CAMT liability would effectively accelerate our future U.S. federal income tax obligations, reducing our cash available for distribution in that year, but provide an offsetting credit against our regular U.S. federal income tax liability for the future. As a result, our current expectation is that the impact of the CAMT is limited to timing differences in future tax years. Given the complexities of the IRA and the CAMT, we will continue to monitor and evaluate the potential future impact to our financial statements.
Note 20 — Supplemental Cash Flow Information
| | | | | | | | | | | | | | |
| Year Ended December 31, | |
| 2024 | | | 2023 | | | 2022 | |
Cash: |
| | | | | | | | | | |
Interest paid, net of capitalized interest (1) | $ | | 712.7 | | | $ | | 618.6 | | | $ | | 401.3 | |
Income taxes paid, net of refunds |
| | 16.7 | | | | | 8.5 | | | | | 1.6 | |
Non-cash investing activities: |
| | | | | | | | | | |
Change in deadstock commodity inventory | $ | | 3.7 | | | $ | | (13.7 | ) | | $ | | (3.8 | ) |
Impact of net accruals on capital expenditures | | | 221.7 | | | | | 58.2 | | | | | 60.1 | |
Change in ARO liability and property, plant and equipment, net due to revised cash flow estimate and additions | | | 64.1 | | | | | 4.9 | | | | | 0.8 | |
Non-cash financing activities: | | | | | | | | | |
| |
Changes in accrued distributions to noncontrolling interests | $ | | (3.6 | ) | | $ | | 8.9 | | | $ | | (26.1 | ) |
Reduction of owner's equity related to accrued dividends on unvested equity awards under share compensation arrangements | | | 3.8 | | | | | 3.9 | | | | | 7.1 | |
Non-cash distributions to noncontrolling interests (2) | | | — | | | | | — | | | | | 64.2 | |
Lease liabilities arising from recognition of right-of-use assets: | | | | | | | | | | | |
Operating lease | $ | | 66.8 | | | $ | | 53.1 | | | $ | | 9.7 | |
Finance lease (3) | | | 59.8 | | | | | 104.8 | | | | | 220.7 | |
(1)Interest capitalized on major projects was $74.8 million, $41.1 million and $16.3 million for the years ended December 31, 2024, 2023 and 2022.
(2)Represents the transfer of an undivided interest in certain gas gathering and processing facilities to a joint owner upon Targa’s recovery of a specified payout amount for our initial full funding of the facilities.
(3)The December 31, 2022 amount includes $171.2 million related to compressor leases from the Delaware Basin Acquisition that were subsequently amended and extended.
Note 21 — Compensation Plans
2010 Targa Resources Corp. Stock Incentive Plan
In December 2010, we adopted the Targa Resources Corp. 2010 Stock Incentive Plan (the “2010 TRGP Plan”) for employees, consultants and non-employee directors of the Company. In May 2017, the 2010 TRGP Plan was amended and restated. In August 2023, the 2010 TRGP Plan was amended and restated for a second time. Total authorized shares of common stock under the plan is 15,000,000, comprised of 5,000,000 shares originally available and an additional 10,000,000 shares that became available in May 2017. The 2010 TRGP Plan allows for the grant of (i) incentive stock options qualified as such under U.S. federal income tax laws (“Incentive Options”), (ii) stock options that do not qualify as Incentive Options (“Non-statutory Options,” and together with Incentive Options, “Options”), (iii) stock appreciation rights granted in conjunction with Options or Phantom Stock Awards, (iv) restricted stock awards, (v) phantom stock awards, (vi) bonus stock awards, (vii) performance unit awards, or (viii) any combination of such awards.
Unless otherwise specified, the compensation costs for the awards listed below were recognized as expense over related vesting periods based on the grant-date fair values, reduced by forfeitures incurred.
Restricted Stock Awards - Restricted stock entitles the recipient to cash dividends. Dividends on unvested restricted stock will be accrued when declared and recorded as short-term or long-term liabilities, dependent on the time remaining until payment of the dividends, and paid in cash when the award vests. Upon issuance, the restricted stock awards will be included in the outstanding shares of our common stock. The Compensation Committee of the Targa board of directors (the “Compensation Committee”) awarded our common stock to our outside directors. In 2024, 2023 and 2022, we issued 23,984, 23,518 and 31,117 shares of director grants with weighted average grant-date fair values of $85.70, $74.13 and $56.32, respectively.
Restricted Stock Units Awards – RSUs are similar to restricted stock, except that shares of common stock are not issued until the RSUs vest. The vesting periods generally vary from one to six years. In March 2023, the Compensation Committee amended the Restricted Stock Units Grant Agreements that govern the RSUs that vest no later than three years following the RSUs’ grant date. The amendment resulted in quarterly cash dividend payments to RSU holders beginning with the common stock dividend paid in May 2023. In 2024, 2023 and 2022, we issued 415,467, 587,326 and 943,352 shares of RSUs with weighted average grant-date fair values of $117.95, $78.69 and $63.87, respectively.
The following table summarizes the restricted stock awards and RSUs under the 2010 TRGP Plan in shares and in dollars for the year indicated.
| | | | | | | | |
| | Number
of shares | | | Weighted Average
Grant-Date Fair Value | |
Outstanding at December 31, 2023 | | | 2,307,796 | | | $ | 57.84 | |
Granted | | | 439,451 | | | | 116.19 | |
Forfeited | | | (74,733 | ) | | | 67.55 | |
Vested | | | (902,462 | ) | | | 42.06 | |
Outstanding at December 31, 2024 | | | 1,770,052 | | | | 79.96 | |
Performance Share Units
During 2024, 2023 and 2022, we granted 131,816, 140,020 and 173,011 performance share units (“PSUs”) to executive management for the 2024, 2023 and 2022 compensation cycle that will vest/have vested in January 2027, January 2026 and January 2025. The PSUs granted under the 2010 TRGP Plan are three-year equity-settled awards linked to the performance of shares of our common stock. The awards also include dividend equivalent rights (“DERs”) that are based on the notional dividends accumulated during the vesting period.
The vesting of the PSUs is dependent on the satisfaction of a combination of certain service-related conditions and the Company’s total shareholder return (“TSR”) relative to the TSR of the members of a specified comparator group of publicly-traded midstream companies (the “LTIP Peer Group”) measured over designated periods. For the PSUs granted in 2022, 2023 and 2024, the TSR performance factor is determined by the Compensation Committee based on relative TSR over a cumulative three-year performance period. The Compensation Committee determines a guideline performance percentage for the performance period and the percentage may then be decreased or increased by the Compensation Committee at its discretion. The grantee will become vested in a number of PSUs equal to the target number awarded multiplied by the TSR performance factor, and vested PSUs will be settled by the issuance of Company common stock. The value of DERs will be paid in cash when the awards vest.
Compensation cost for equity-settled PSUs was recognized as an expense over the performance period based on fair value at the grant date. The compensation cost will be reduced if forfeitures occur. Fair value was calculated using a simulated share price that incorporates peer ranking. DERs associated with equity-settled PSUs were accrued over the performance period as a reduction of owners’ equity. We evaluated the grant date fair value using a Monte Carlo simulation model and historical volatility assumption with an expected term of three years. The expected volatilities were 34%, 38% and 80% for PSUs granted in 2024, 2023 and 2022.
The following table summarizes the PSUs under the 2010 TRGP Plan in shares and in dollars for the years indicated.
| | | | | | | | |
| | Number
of shares | | | Weighted Average
Grant-Date Fair Value | |
Outstanding at December 31, 2023 | | | 596,300 | | | $ | 85.78 | |
Granted | | | 131,816 | | | | 147.66 | |
Forfeited | | | (4,625 | ) | | | 143.14 | |
Vested | | | (310,397 | ) | | | 56.36 | |
Outstanding at December 31, 2024 | | | 413,094 | | | | 126.99 | |
Stock Compensation Expense
Stock compensation expense under our plans totaled $63.2 million, $62.4 million and $57.5 million for the years ended December 31, 2024, 2023 and 2022, respectively. As of December 31, 2024, we have $89.0 million of unrecognized compensation expense associated with share-based awards and an approximate remaining weighted average vesting period of 2.2 years related to our various compensation plans.
The fair values of share-based awards vested in 2024, 2023 and 2022 were $87.2 million, $96.8 million and $93.0 million, respectively. Cash dividends paid for the vested awards were $5.3 million, $8.3 million and $9.6 million for 2024, 2023 and 2022, respectively.
In relation to our equity compensation plans, we recognized $14.2 million, $17.0 million and $6.7 million in windfall tax benefits for the years ended December 31, 2024, 2023 and 2022, respectively.
Subsequent Events
In January 2025, the Compensation Committee made the following awards under the 2010 TRGP Plan:
•9,479 shares of restricted stock to our outside directors that will vest in January 2026;
•77,114 shares of RSUs to executive management for the 2025 compensation cycle that will vest in January 2028; and
•77,114 shares of PSUs to executive management for the 2025 compensation cycle that will vest in January 2028.
In January 2025, the following shares vested:
•23,984 shares of director grants with no shares withheld to satisfy tax withholding obligations;
•155,895 shares of RSUs with 62,089 shares withheld to satisfy tax withholding obligations; and
•389,476 shares of 2022 PSUs with 149,865 shares withheld to satisfy tax withholding obligations.
Targa 401(k) Plan
We have a 401(k) plan whereby we match 100% of up to 5% of an employee’s contribution (subject to certain limitations in the plan). We also contribute an amount equal to 3% of each employee’s eligible compensation to the plan as a retirement contribution and may make additional contributions at our sole discretion. All Targa contributions are made 100% in cash. We made contributions to the 401(k) plan totaling $35.1 million, $32.3 million and $26.6 million during the years ended December 31, 2024, 2023 and 2022, respectively.
Note 22 — Segment Information
We operate in two primary segments: (i) Gathering and Processing, and (ii) Logistics and Transportation (also referred to as the Downstream Business). Our reportable segments include operating segments that have been aggregated based on the nature of the products and services provided.
Our Gathering and Processing segment includes assets used in the gathering and/or purchase and sale of natural gas produced from oil and gas wells, removing impurities and processing this raw natural gas into merchantable natural gas by extracting NGLs; and assets used for the gathering and terminaling and/or purchase and sale of crude oil. The Gathering and Processing segment’s assets are located in the Permian Basin of West Texas and Southeast New Mexico (including the Midland, Central and Delaware Basins); the Eagle Ford Shale in South Texas; the Barnett Shale in North Texas; the Anadarko, Ardmore, and Arkoma Basins in Oklahoma (including the SCOOP and STACK) and South Central Kansas; the Williston Basin in North Dakota (including the Bakken and Three Forks plays); and the onshore and near offshore regions of the Louisiana Gulf Coast.
Our Logistics and Transportation segment includes the activities and assets necessary to convert mixed NGLs into NGL products and also includes other assets and value-added services such as transporting, storing, fractionating, terminaling, and marketing of NGLs and NGL products, including services to LPG exporters and certain natural gas supply and marketing activities in support of our other businesses. The Logistics and Transportation segment also includes Grand Prix, which connects our gathering and processing positions in the Permian Basin, Southern Oklahoma and North Texas with our Downstream facilities in Mont Belvieu, Texas. Our Downstream facilities are located predominantly in Mont Belvieu and Galena Park, Texas, and in Lake Charles, Louisiana.
Other contains the unrealized mark-to-market gains/losses related to derivative contracts that were not designated as cash flow hedges. Elimination of inter-segment transactions are reflected in the corporate and eliminations column.
The Company’s chief operating decision maker (“CODM”) is the Chief Executive Officer. The Company’s CODM assesses the segments’ performance by using each segment’s operating margin. The CODM uses segment operating margin for the annual budget and forecasting process and to make informed decisions about the allocation of resources.
Reportable segment information is shown in the following tables:
| | | | | | | | | | | | | | | | | | | | | | | | |
| | Year Ended December 31, 2024 | |
| | Gathering and Processing | | | Logistics and Transportation | | | Total Reportable Segments | | | Other | | | Corporate
and
Eliminations | | | Total | |
Revenues | | | | | | | | | | | | | | | | | | |
Sales of commodities | | $ | 1,032.8 | | | $ | 13,023.6 | | | $ | 14,056.4 | | | $ | (164.6 | ) | | $ | — | | | $ | 13,891.8 | |
Fees from midstream services | | | 1,656.7 | | | | 833.0 | | | | 2,489.7 | | | | — | | | | — | | | | 2,489.7 | |
| | | 2,689.5 | | | | 13,856.6 | | | | 16,546.1 | | | | (164.6 | ) | | | — | | | | 16,381.5 | |
Intersegment revenues | | | | | | | | | | | | | | | | | | |
Sales of commodities | | | 4,118.5 | | | | 146.1 | | | | 4,264.6 | | | | — | | | | (4,264.6 | ) | | | — | |
Fees from midstream services | | | 0.4 | | | | 27.7 | | | | 28.1 | | | | — | | | | (28.1 | ) | | | — | |
| | | 4,118.9 | | | | 173.8 | | | | 4,292.7 | | | | — | | | | (4,292.7 | ) | | | — | |
Revenues | | $ | 6,808.4 | | | $ | 14,030.4 | | | $ | 20,838.8 | | | $ | (164.6 | ) | | $ | (4,292.7 | ) | | $ | 16,381.5 | |
Operating expenses | | | 814.6 | | | | 362.3 | | | | 1,176.9 | | | | — | | | | | | | |
Other segment items (1) | | | 3,681.4 | | | | 11,313.0 | | | | 14,994.4 | | | | — | | | | | | | |
Operating margin | | $ | 2,312.4 | | | $ | 2,355.1 | | | $ | 4,667.5 | | | $ | (164.6 | ) | | | | | | |
Other financial information: | | | | | | | | | | | | | | | | | | |
Total assets (2) | | $ | 13,576.6 | | | $ | 8,921.6 | | | $ | 22,498.2 | | | $ | 1.9 | | | $ | 234.0 | | | $ | 22,734.1 | |
Goodwill | | $ | 45.2 | | | $ | — | | | $ | 45.2 | | | $ | — | | | $ | — | | | $ | 45.2 | |
Capital expenditures | | $ | 1,955.3 | | | $ | 1,216.6 | | | $ | 3,171.9 | | | $ | — | | | $ | 19.9 | | | $ | 3,191.8 | |
| | | | | | | | | | | | | | | | | | | | | | | | |
| | Year Ended December 31, 2023 | |
| | Gathering and Processing | | | Logistics and Transportation | | | Total Reportable Segments | | | Other | | | Corporate
and
Eliminations | | | Total | |
Revenues | | | | | | | | | | | | | | | | | | |
Sales of commodities | | $ | 1,076.1 | | | $ | 12,610.5 | | | $ | 13,686.6 | | | $ | 275.5 | | | $ | — | | | $ | 13,962.1 | |
Fees from midstream services | | | 1,366.5 | | | | 731.7 | | | | 2,098.2 | | | | — | | | | — | | | | 2,098.2 | |
| | | 2,442.6 | | | | 13,342.2 | | | | 15,784.8 | | | | 275.5 | | | | — | | | | 16,060.3 | |
Intersegment revenues | | | | | | | | | | | | | | | | | | |
Sales of commodities | | | 4,786.3 | | | | 267.9 | | | | 5,054.2 | | | | — | | | | (5,054.2 | ) | | | — | |
Fees from midstream services | | | 2.6 | | | | 45.7 | | | | 48.3 | | | | — | | | | (48.3 | ) | | | — | |
| | | 4,788.9 | | | | 313.6 | | | | 5,102.5 | | | | — | | | | (5,102.5 | ) | | | — | |
Revenues | | $ | 7,231.5 | | | $ | 13,655.8 | | | $ | 20,887.3 | | | $ | 275.5 | | | $ | (5,102.5 | ) | | $ | 16,060.3 | |
Operating expenses | | | 746.6 | | | | 332.0 | | | | 1,078.6 | | | $ | — | | | | | | | |
Other segment items (1) | | | 4,402.7 | | | | 11,375.1 | | | | 15,777.8 | | | | — | | | | | | | |
Operating margin | | $ | 2,082.2 | | | $ | 1,948.7 | | | $ | 4,030.9 | | | $ | 275.5 | | | | | | | |
Other financial information: | | | | | | | | | | | | | | | | | | |
Total assets (2) | | $ | 12,685.2 | | | $ | 7,777.8 | | | $ | 20,463.0 | | | $ | 4.2 | | | $ | 204.6 | | | $ | 20,671.8 | |
Goodwill | | $ | 45.2 | | | $ | — | | | $ | 45.2 | | | $ | — | | | $ | — | | | $ | 45.2 | |
Capital expenditures | | $ | 1,514.7 | | | $ | 910.0 | | | $ | 2,424.7 | | | $ | — | | | $ | 18.9 | | | $ | 2,443.6 | |
| | | | | | | | | | | | | | | | | | | | | | | | |
| | Year Ended December 31, 2022 | |
| | Gathering and Processing | | | Logistics and Transportation | | | Total Reportable Segments | | | Other | | | Corporate
and
Eliminations | | | Total | |
Revenues | | | | | | | | | | | | | | | | | | |
Sales of commodities | | $ | 919.7 | | | $ | 18,448.7 | | | $ | 19,368.4 | | | $ | (302.4 | ) | | $ | — | | | $ | 19,066.0 | |
Fees from midstream services | | | 1,157.3 | | | | 706.5 | | | | 1,863.8 | | | | — | | | | — | | | | 1,863.8 | |
| | | 2,077.0 | | | | 19,155.2 | | | | 21,232.2 | | | | (302.4 | ) | | | — | | | | 20,929.8 | |
Intersegment revenues | | | | | | | | | | | | | | | | | | |
Sales of commodities | | | 9,169.4 | | | | 541.7 | | | | 9,711.1 | | | | — | | | | (9,711.1 | ) | | | — | |
Fees from midstream services | | | 0.6 | | | | 45.2 | | | | 45.8 | | | | — | | | | (45.8 | ) | | | — | |
| | | 9,170.0 | | | | 586.9 | | | | 9,756.9 | | | | — | | | | (9,756.9 | ) | | | — | |
Revenues | | $ | 11,247.0 | | | $ | 19,742.1 | | | $ | 30,989.1 | | | $ | (302.4 | ) | | $ | (9,756.9 | ) | | $ | 20,929.8 | |
Operating expenses | | | 611.8 | | | | 300.2 | | | | 912.0 | | | $ | — | | | | | | | |
Other segment items (1) | | | 8,654.2 | | | | 17,985.6 | | | | 26,639.8 | | | | — | | | | | | | |
Operating margin | | $ | 1,981.0 | | | $ | 1,456.3 | | | $ | 3,437.3 | | | $ | (302.4 | ) | | | | | | |
Other financial information: | | | | | | | | | | | | | | | | | | |
Total assets (2) | | $ | 12,133.6 | | | $ | 7,175.7 | | | $ | 19,309.3 | | | $ | — | | | $ | 250.7 | | | $ | 19,560.0 | |
Goodwill | | $ | 45.2 | | | $ | — | | | $ | 45.2 | | | $ | — | | | $ | — | | | $ | 45.2 | |
Capital expenditures | | $ | 918.1 | | | $ | 453.0 | | | $ | 1,371.1 | | | $ | — | | | $ | 23.3 | | | $ | 1,394.4 | |
(1)“Other segment items” represents Product purchases and fuel.
(2)Assets in the Corporate and Eliminations column primarily include tax-related assets, cash, prepaids and debt issuance costs for our revolving credit facilities.
The following table shows our consolidated revenues disaggregated by product and service for the periods presented:
| | | | | | | | | | | | |
| | Year Ended December 31, | |
| | 2024 | | | 2023 | | | 2022 | |
Sales of commodities: | | | | | | | | | |
Revenue recognized from contracts with customers: | | | | | | | | | |
Natural gas | | $ | 1,241.1 | | | $ | 2,421.3 | | | $ | 5,470.2 | |
NGL | | | 12,372.5 | | | | 10,580.2 | | | | 13,785.2 | |
Condensate and crude oil | | | 523.6 | | | | 519.5 | | | | 565.3 | |
| | | 14,137.2 | | | | 13,521.0 | | | | 19,820.7 | |
Non-customer revenue: | | | | | | | | | |
Derivative activities - Hedge | | | 67.8 | | | | 153.4 | | | | (373.0 | ) |
Derivative activities - Non-hedge (1) | | | (313.2 | ) | | | 287.7 | | | | (381.7 | ) |
| | | (245.4 | ) | | | 441.1 | | | | (754.7 | ) |
Total sales of commodities | | | 13,891.8 | | | | 13,962.1 | | | | 19,066.0 | |
| | | | | | | | | |
Fees from midstream services: | | | | | | | | | |
Revenue recognized from contracts with customers: | | | | | | | | | |
Gathering and processing | | | 1,632.8 | | | | 1,342.8 | | | | 1,137.2 | |
NGL transportation, fractionation and services | | | 298.4 | | | | 261.1 | | | | 285.1 | |
Storage, terminaling and export | | | 497.9 | | | | 440.7 | | | | 372.2 | |
Other | | | 60.6 | | | | 53.6 | | | | 69.3 | |
Total fees from midstream services | | | 2,489.7 | | | | 2,098.2 | | | | 1,863.8 | |
| | | | | | | | | |
Total revenues | | $ | 16,381.5 | | | $ | 16,060.3 | | | $ | 20,929.8 | |
(1)Represents derivative activities that are not designated as hedging instruments under ASC 815.
The following table shows a reconciliation of reportable segment Operating margin to Income (loss) before income taxes for the periods presented:
| | | | | | | | | | | | |
| | Year Ended December 31, | |
| | 2024 | | | 2023 | | | 2022 | |
Reconciliation of reportable segment operating
margin to income (loss) before income taxes: | | | | | | | | | |
Total reportable segments operating margin | | $ | 4,667.5 | | | $ | 4,030.9 | | | $ | 3,437.3 | |
Other operating margin | | | (164.6 | ) | | | 275.5 | | | | (302.4 | ) |
Depreciation and amortization expense | | | (1,423.0 | ) | | | (1,329.6 | ) | | | (1,096.0 | ) |
General and administrative expense | | | (384.9 | ) | | | (348.7 | ) | | | (309.7 | ) |
Other operating income (expense) | | | 0.4 | | | | (1.5 | ) | | | (0.2 | ) |
Interest expense, net | | | (767.2 | ) | | | (687.8 | ) | | | (446.1 | ) |
Equity earnings (loss) | | | 9.4 | | | | 9.0 | | | | 9.1 | |
Gain (loss) from financing activities | | | (0.8 | ) | | | (2.1 | ) | | | (49.6 | ) |
Gain (loss) from sale of equity method investment | | | — | | | | — | | | | 435.9 | |
Other, net | | | 1.2 | | | | (3.2 | ) | | | (15.1 | ) |
Income (loss) before income taxes | | $ | 1,938.0 | | | $ | 1,942.5 | | | $ | 1,663.2 | |