PURSUANT TO RULE 13a-16 OR 15d-16 OF THE
For the month of June, 2019
(Commission File No. 001-33356),
Indicate by check mark whether the registrant files or will file
annual reports under cover Form 20-F or Form 40-F.
Form 20-F ___X___ Form 40-F ______
the Form 6-K in paper as permitted by Regulation S-T Rule 101(b)(1)
Yes ______ No ___X___
Indicate by check mark if the registrant is submitting
the Form 6-K in paper as permitted by Regulation S-T Rule 101(b)(7):
Yes ______ No ___X___
Indicate by check mark whether by furnishing the information contained in this Form,
the Registrant is also thereby furnishing the information to the Commission pursuant
to Rule 12g3-2(b) under the Securities Exchange Act of 1934:
Yes ______ No ___X___
If “Yes” is marked, indicate below the file number assigned
to the registrant in connection with Rule 12g3-2(b):N/A
GAFISA S.A.
Independent auditor’s review report
Individual and consolidated interim financial information
As at March 31, 2019
Company data | |
Capital Composition | 3 |
Individual financial statements | |
Balance sheet - Assets | 4 |
Balance sheet - Liabilities | 5 |
Statement of income | 6 |
Statement of comprehensive income (loss) | 7 |
Statement of cash flow | 8 |
Statements of changes in equity | |
01/01/2019 to 03/31/2019 | 9 |
01/01/2018 to 03/31/2018 | 10 |
Statement of value added | 11 |
Consolidated financial statements | |
Balance sheet - Assets | 12 |
Balance sheet - Liabilities | 13 |
Statement of income | 14 |
Statement of comprehensive income (loss) | 15 |
Statement of cash flow | 16 |
Statements of changes in equity | |
01/01/2019 to 03/31/2019 | 17 |
01/01/2018 to 03/31/2018 | 18 |
Statement of value added | 19 |
Comments on performance | 20 |
Notes to the quarterly information | 39 |
Other information deemed relevant by the Company | 70 |
Reports and statements | |
Report on review of interim financial information | 73 |
Management statement of interim financial information | 76 |
Management statement on the report on review of interim financial information | 77 |
COMPANY DATA / CAPITAL COMPOSITION
Number of Shares | CURRENT QUARTER | |
(in thousands) | 03/31/2019 | |
Paid-in Capital |
| |
Common | 43,358 | |
Preferred | - | |
Total | 43,358 | |
Treasury shares |
| |
Common | 2,704 | |
Preferred | - | |
Total | 2,704 | |
3
INDIVIDUAL FINANCIAL STATEMENTS - BALANCE SHEET - ASSETS (in thousands of Brazilian Reais) | |||
CODE | DESCRIPTION | ACTUAL QUARTER 03/31/2019 | PRIOR YEAR 12/31/2018 |
1 | Total Assets | 3,032,908 | 3,219,767 |
1.01 | Current Assets | 1,208,421 | 1,367,727 |
1.01.01 | Cash and cash equivalents | 6,225 | 29,180 |
1.01.02 | Short-term investments | 48,047 | 102,827 |
1.01.02.01 | Fair value of short-term investments | 48,047 | 102,827 |
1.01.03 | Accounts receivable | 404,053 | 391,557 |
1.01.03.01 | Trade accounts receivable | 404,053 | 391,557 |
1.01.03.01.01 | Receivables from clients of developments | 390,802 | 376,211 |
1.01.03.01.02 | Receivables from clients of construction and services rendered | 13,251 | 15,346 |
1.01.04 | Inventory | 640,757 | 705,123 |
1.01.04.01 | Properties for sale | 640,757 | 705,123 |
1.01.07 | Prepaid expenses | 1,990 | 2,183 |
1.01.08 | Other current assets | 107,349 | 136,857 |
1.01.08.01 | Noncurrent assets held for sale | 35,376 | 74,842 |
1.01.08.03 | Other | 71,973 | 62,015 |
1.01.08.03.01 | Other assets | 45,359 | 35,396 |
1.01.08.03.03 | Receivables from related parties | 26,614 | 26,619 |
1.02 | Noncurrent assets | 1,824,487 | 1,852,040 |
1.02.01 | Noncurrent assets | 397,826 | 416,241 |
1.02.01.04 | Accounts receivable | 107,483 | 155,421 |
1.02.01.04.01 | Receivables from clients of developments | 107,483 | 155,421 |
1.02.01.05 | Inventory | 169,074 | 139,804 |
1.02.01.05.01 | Properties for sale | 169,074 | 139,804 |
1.02.01.10 | Other noncurrent assets | 121,269 | 121,016 |
1.02.01.10.03 | Other assets | 92,021 | 92,607 |
1.02.01.10.04 | Receivables from related parties | 29,248 | 28,409 |
1.02.02 | Investments | 1,397,582 | 1,407,516 |
1.02.03 | Property and equipment | 19,135 | 17,284 |
1.02.03.01 | Operating property and equipment | 19,135 | 17,284 |
1.02.04 | Intangible assets | 9,944 | 10,999 |
1.02.04.01 | Intangible assets | 9,944 | 10,999 |
4
INDIVIDUAL FINANCIAL STATEMENTS - BALANCE SHEET - LIABILITIES AND EQUITY (in thousands of Brazilian Reais) | |||
CODE | DESCRIPTION | ACTUAL QUARTER 03/31/2019 | PRIOR YEAR 12/31/2018 |
2 | Total Liabilities | 3,032,908 | 3,219,767 |
2.01 | Current liabilities | 1,948,649 | 1,819,565 |
2.01.01 | Social and labor obligations | 5,362 | 6,128 |
2.01.01.02 | Labor obligations | 5,362 | 6,128 |
2.01.02 | Suppliers | 107,799 | 116,948 |
2.01.03 | Tax obligations | 46,910 | 45,667 |
2.01.03.01 | Federal tax obligations | 46,910 | 45,667 |
2.01.04 | Loans and financing | 416,167 | 315,702 |
2.01.04.01 | Loans and financing | 282,531 | 252,919 |
2.01.04.01.01 | Loans and financing in local currency | 282,531 | 252,919 |
2.01.04.02 | Debentures | 133,636 | 62,783 |
2.01.05 | Other obligations | 1,181,845 | 1,196,919 |
2.01.05.01 | Payables to related parties | 933,658 | 939,603 |
2.01.05.02 | Other | 248,187 | 257,316 |
2.01.05.02.04 | Obligations related to purchases of properties and advances from customers | 85,286 | 82,264 |
2.01.05.02.06 | Other payables | 144,395 | 156,498 |
2.01.05.02.07 | Obligations assumed on the assignment of receivables | 18,506 | 18,554 |
2.01.06 | Provisions | 190,566 | 138,201 |
2.01.06.01 | Tax, labor and civil lawsuits | 190,566 | 138,201 |
2.01.06.01.01 | Tax lawsuits | 637 | 637 |
2.01.06.01.02 | Labor lawsuits | 21,731 | 20,729 |
2.01.06.01.04 | Civil lawsuits | 168,198 | 116,835 |
2.02 | Noncurrent liabilities | 636,080 | 908,885 |
2.02.01 | Loans and financing | 330,655 | 510,563 |
2.02.01.01 | Loans and financing | 215,049 | 307,680 |
2.02.01.01.01 | Loans and financing in local currency | 215,049 | 307,680 |
2.02.01.02 | Debentures | 115,606 | 202,883 |
2.02.02 | Other liabilities | 155,482 | 196,087 |
2.02.02.02 | Other | 155,482 | 196,087 |
2.02.02.02.03 | Obligations related to purchase of properties and advances from customers | 111,699 | 151,835 |
2.02.02.02.04 | Other liabilities | 19,072 | 18,162 |
2.02.02.02.06 | Obligations assumed on the assignment of receivables | 24,711 | 26,090 |
2.02.03 | Deferred taxes | 49,372 | 49,372 |
2.02.03.01 | Deferred income tax and social contribution | 49,372 | 49,372 |
2.02.04 | Provisions | 100,571 | 152,863 |
2.02.04.01 | Tax, labor and civil lawsuits | 100,571 | 152,863 |
2.02.04.01.01 | Tax lawsuits | 1,313 | - |
2.02.04.01.02 | Tax and labor lawsuits | 32,825 | 34,404 |
2.02.04.01.04 | Civil lawsuits | 66,433 | 118,459 |
2.03 | Equity | 448,179 | 491,317 |
2.03.01 | Capital | 2,521,319 | 2,521,319 |
2.03.02 | Capital Reserves | 298,327 | 278,401 |
2.03.02.05 | Treasury shares | (39,185) | (58,950) |
2.03.02.07 | Constitution of capital reserve | 250,599 | 250,599 |
2.03.02.09 | Reserve for granting stock options | 86,913 | 86,752 |
2.03.05 | Retained earnings/accumulated losses | (2,371,467) | (2,308,403) |
5
INDIVIDUAL FINANCIAL STATEMENTS - INCOME - (in thousands of Brazilian Reais) | |||
CODE | DESCRIPTION | YEAR TO DATE 01/01/2019 to 03/31/2019 | YEAR TO DATE FROM PREVIOUS YEAR 01/01/2018 to 03/31/2018 |
3.01 | Gross Sales and/or Services | 80,695 | 223,628 |
3.01.01 | Revenue from real estate development | 88,127 | 244,090 |
3.01.03 | Taxes on real estate sales and services | (7,432) | (20,462) |
3.02 | Cost of sales and/or services | (71,591) | (191,362) |
3.02.01 | Cost of real estate development | (71,591) | (191,362) |
3.03 | Gross profit | 9,104 | 32,266 |
3.04 | Operating expenses/income | (43,739) | (65,562) |
3.04.01 | Selling expenses | (5,383) | (20,912) |
3.04.02 | General and administrative expenses | (6,042) | (14,739) |
3.04.05 | Other operating expenses | (26,009) | (16,063) |
3.04.05.01 | Depreciation and amortization | (4,002) | (3,603) |
3.04.05.02 | Other operating expenses | (22,007) | (12,460) |
3.04.06 | Income from equity method investments | (6,305) | (13,848) |
3.05 | Income (loss) before financial results and income taxes | (34,635) | (33,296) |
3.06 | Financial | (11,719) | (20,220) |
3.06.01 | Financial income | 3,191 | 5,229 |
3.06.02 | Financial expenses | (14,910) | (25,449) |
3.07 | Income before income taxes | (46,354) | (53,516) |
3.09 | Income (loss) from continuing operation | (46,354) | (53,516) |
3.11 | Income (loss) for the period | (46,354) | (53,516) |
3.99 | Earnings per Share – (Brazilian Reais / Share) | - | - |
3.99.01 | Basic Earnings per Share | - | - |
3.99.01.01 | ON | (1.17596) | (1.41110) |
3.99.02 | Diluted Earnings per Share | - | - |
3.99.02.01 | ON | (1.17596) | (1.41110) |
6
INDIVIDUAL FINANCIAL STATEMENTS - COMPREHENSIVE INCOME (LOSS) - (in thousands of Brazilian Reais)
| |||
CODE | DESCRIPTION | YEAR TO DATE 01/01/2019 to 03/31/2019 | YEAR TO DATE FROM PREVIOUS YEAR 01/01/2018 to 03/31/2018 |
4.01 | Income (loss) for the period | (46,354) | (53,516) |
4.03 | Comprehensive income (loss) for the period | (46,354) | (53,516) |
7
INDIVIDUAL FINANCIAL STATEMENTS - CASH FLOWS - INDIRECT METHOD - (in thousands of Brazilian Reais) | |||
CODE | DESCRIPTION | YEAR TO DATE 01/01/2019 to 03/31/2019 | YEAR TO DATE FROM PREVIOUS YEAR 01/01/2018 to 03/31/2018 |
6.01 | Net cash from operating activities | (56,299) | (77,011) |
6.01.01 | Cash generated in the operations | (35,557) | (55,329) |
6.01.01.01 | Income (loss) before income and social contribution taxes | (46,354) | (53,516) |
6.01.01.02 | Income from equity method investments | 6,305 | 13,849 |
6.01.01.03 | Stock options expenses | (2,460) | (91) |
6.01.01.04 | Unrealized interest and finance charges, net | (770) | 1,354 |
6.01.01.05 | Financial instruments | - | (20) |
6.01.01.06 | Depreciation and amortization | 4,002 | 3,603 |
6.01.01.07 | Provision for legal claims | 22,030 | 11,776 |
6.01.01.08 | Provision for profit sharing | - | 1,231 |
6.01.01.09 | Warranty provision | (338) | (834) |
6.01.01.11 | Allowance for expected credit losses | (18,539) | (23,505) |
6.01.01.12 | Provision for realization of non-financial assets - properties for sale | (841) | (9,176) |
6.01.01.13 | Provision for penalties due to delay in construction works | 1,408 | - |
6.01.02 | Variation in assets and liabilities | (20,742) | (21,682) |
6.01.02.01 | Trade accounts receivable | 52,554 | (62,944) |
6.01.02.02 | Properties for sale | 75,403 | 109,839 |
6.01.02.03 | Other accounts receivable | (10,208) | (6,968) |
6.01.02.04 | Prepaid expenses | 193 | 394 |
6.01.02.05 | Obligations related to purchases of properties and advances from customers | (37,112) | (29,948) |
6.01.02.06 | Taxes and contributions | 1,242 | 8,184 |
6.01.02.07 | Suppliers | (4,698) | 250 |
6.01.02.08 | Salaries and charges payable | (766) | 560 |
6.01.02.09 | Transactions with related parties | 78 | (9,917) |
6.01.02.10 | Other obligations | (97,428) | (31,132) |
6.02 | Net cash from investment activities | 57,156 | (69,114) |
6.02.01 | Purchase of property and equipment and intangible assets | (341) | (4,316) |
6.02.02 | Increase in investments | - | (499) |
6.02.03 | Redemption of short-term investments | 75,267 | 454,562 |
6.02.04 | Purchase of short-term investments | (20,487) | (518,861) |
6.02.05 | Equity instruments | 2,717 | - |
6.03 | Net cash from financing activities | (23,810) | 153,051 |
6.03.01 | Capital increase | - | 167 |
6.03.02 | Increase in loans, financing and debentures | 12,250 | 40,390 |
6.03.03 | Payment of loans, financing and debentures | (90,922) | (137,654) |
6.03.06 | Loan transactions with related parties | 42 | (451) |
6.03.08 | Disposal of treasury shares | 148 | - |
6.03.09 | Transactions related to the treasury shares repurchase program, net | 54,672 | - |
6.03.12 | Subscription and payment of common shares | - | 250,599 |
6.05 | Net increase (decrease) of cash and cash equivalents | (22,953) | 6,926 |
6.05.01 | Cash and cash equivalents at the beginning of the period | 29,179 | 7,461 |
6.05.02 | Cash and cash equivalents at the end of the period | 6,226 | 14,387 |
8
INDIVIDUAL STATEMENT OF CHANGES IN EQUITY FROM 01/01/2019 TO 03/31/2019 (in thousands of Brazilian Reais) | |||||||
CODE | DESCRIPTION | Capital | Capital reserves, stock options and treasury shares | Profit reserves | Retained earnings | Other comprehensive income | Total Equity |
5.01 | Opening balance | 2,521,319 | 278,401 | - | (2,308,403) | - | 491,317 |
5.03 | Opening adjusted balance | 2,521,319 | 278,401 | - | (2,308,403) | - | 491,317 |
5.04 | Capital transactions with shareholders | - | 19,926 | - | (16,710) | - | 3,216 |
5.04.03 | Stock option plan | - | 162 | - | - | - | 162 |
5.04.05 | Treasury shares sold | - | 141 | - | 7 | - | 148 |
5.04.09 | Share repurchase program | - | 19,623 | - | (16.717) | - | 2,906 |
5.05 | Total of comprehensive income (loss) | - | - | - | (46,354) | - | (46,354) |
5.05.01 | Net income (loss) for the period | - | - | - | (46,354) | - | (46,354) |
5.07 | Closing balance | 2,521,319 | 298,327 | - | (2,371,467) | - | 448,179 |
9
INDIVIDUAL STATEMENT OF CHANGES IN EQUITY FROM 01/01/2018 TO 03/31/2018 (in thousands of Brazilian Reais) | |||||||
CODE | DESCRIPTION | Capital | Capital reserves, stock options and treasury shares | Profit reserves | Retained earnings | Other comprehensive income | Total Equity |
5.01 | Opening balance | 2,521,152 | 56,359 | - | (1,866,289) | - | 711,222 |
5.03 | Opening adjusted balance | 2,521,152 | 56,359 | - | (1,866,289) | - | 711,222 |
5.04 | Capital transactions with shareholders | 167 | 251,305 | - | - | - | 251,472 |
5.04.01 | Capital increase | 167 | 250,599 | - | - | - | 250,766 |
5.04.03 | Stock option plan | - | 706 | - | - | - | 706 |
5.05 | Total of comprehensive income (loss) | - | - | - | (53,516) | - | (53,516) |
5.05.01 | Net income (loss) for the period | - | - | - | (53,516) | - | (53,516) |
5.07 | Closing balance | 2,521,319 | 307,664 | - | (1,919,805) | - | 909,178 |
10
INDIVIDUAL STATEMENT OF VALUE ADDED (in thousands of Brazilian Reais) | |||
CODE | DESCRIPTION | YEAR TO DATE 01/01/2019 to 03/31/2019 | YEAR TO DATE FROM PREVIOUS YEAR 01/01/2018 to 03/31/2018 |
7.01 | Revenues | 88,127 | 244,090 |
7.01.01 | Real estate development, sales and services | 69,588 | 220,585 |
7.01.04 | Allowance for expected credit losses | 18,539 | 23,505 |
7.02 | Inputs acquired from third parties | (87,701) | (186,297) |
7.02.01 | Cost of Sales and/or Services | (63,774) | (158,645) |
7.02.02 | Materials, energy, outsourced labor and other | (23,927) | (27,652) |
7.03 | Gross value added | 426 | 57,793 |
7.04 | Retentions | (4,002) | (3,603) |
7.04.01 | Depreciation and amortization | (4,002) | (3,603) |
7.05 | Net value added produced by the Company | (3,576) | 54,190 |
7.06 | Added value received on transfer | (3,114) | (8,619) |
7.06.01 | Income from equity method investments | (6,305) | (13,848) |
7.06.02 | Financial income | 3,191 | 5,229 |
7.07 | Value added total to be distributed | (6,690) | 45,571 |
7.08 | Value added distribution | (6,690) | 45,571 |
7.08.01 | Personnel and payroll charges | 5,922 | 15,982 |
7.08.01.01 | Direct remuneration | 5,922 | 15,982 |
7.08.02 | Taxes and contributions | 9,372 | 23,765 |
7.08.02.01 | Federal | 9,372 | 23,765 |
7.08.03 | Compensation – Interest | 24,370 | 59,340 |
7.08.03.01 | Interest | 22,727 | 58,166 |
7.08.03.02 | Rent | 1,643 | 1,174 |
7.08.04 | Compensation – Company capital | (46,354) | (53,516) |
7.08.04.03 | Net income (Retained losses) | (46,354) | (53,516) |
11
CONSOLIDATED FINANCIAL STATEMENTS - BALANCE SHEET - ASSETS (in thousands of Brazilian Reais) | |||
CODE | DESCRIPTION | ACTUAL QUARTER 03/31/2019 | PRIOR YEAR 12/31/2018 |
1 | Total Assets | 2,321,399 | 2,526,280 |
1.01 | Current Assets | 1,506,864 | 1,683,371 |
1.01.01 | Cash and cash equivalents | 12,402 | 32,304 |
1.01.02 | Short-term investments | 50,666 | 104,856 |
1.01.02.01 | Fair value of short-term investments | 50,666 | 104,856 |
1.01.03 | Accounts receivable | 475,820 | 467,992 |
1.01.03.01 | Trade accounts receivable | 475,820 | 467,992 |
1.01.03.01.01 | Receivables from clients of developments | 452,728 | 442,877 |
1.01.03.01.02 | Receivables from clients of construction and services rendered | 23,092 | 25,115 |
1.01.04 | Inventory | 819,458 | 890,460 |
1.01.04.01 | Properties for sale | 819,458 | 890,460 |
1.01.07 | Prepaid expenses | 2,466 | 2,668 |
1.01.08 | Other current assets | 146,052 | 185,091 |
1.01.08.01 | Noncurrent assets for sale | 38,682 | 78,148 |
1.01.08.03 | Other | 107,370 | 106,943 |
1.01.08.03.01 | Other accounts receivable and others | 52,093 | 42,283 |
1.01.08.03.02 | Receivables from related parties | 55,277 | 64,660 |
1.02 | Noncurrent assets | 814,535 | 842,909 |
1.02.01 | Noncurrent assets | 472,597 | 496,561 |
1.02.01.04 | Accounts receivable | 120,614 | 174,017 |
1.02.01.04.01 | Receivables from clients of developments | 120,614 | 174,017 |
1.02.01.05 | Inventory | 228,228 | 198,941 |
1.02.01.05.01 | Properties for sale | 228,228 | 198,941 |
1.02.01.10 | Other noncurrent assets | 123,755 | 123,603 |
1.02.01.10.03 | Other assets | 94,507 | 95,194 |
1.02.01.10.04 | Receivables from related parties | 29,248 | 28,409 |
1.02.02 | Investments | 309,668 | 314,505 |
1.02.02.01 | Interest in associates and affiliates | 309,668 | 314,505 |
1.02.03 | Property and equipment | 21,615 | 20,073 |
1.02.03.01 | Operating property and equipment | 21,615 | 20,073 |
1.02.04 | Intangible assets | 10,655 | 11,770 |
1.02.04.01 | Intangible assets | 10,655 | 11,770 |
12
CONSOLIDATED FINANCIAL STATEMENTS - BALANCE SHEET - LIABILITIES AND EQUITY (in thousands of Brazilian Reais) | |||
CODE | DESCRIPTION | ACTUAL QUARTER 03/31/2019 | PRIOR YEAR 12/31/2018 |
2 | Total Liabilities | 2,321,399 | 2,526,280 |
2.01 | Current liabilities | 1,164,560 | 1,039,015 |
2.01.01 | Social and labor obligations | 5,746 | 6,780 |
2.01.01.02 | Labor obligations | 5,746 | 6,780 |
2.01.02 | Suppliers | 115,114 | 119,847 |
2.01.03 | Tax obligations | 57,445 | 57,276 |
2.01.03.01 | Federal tax obligations | 57,445 | 57,276 |
2.01.04 | Loans and financing | 441,191 | 348,395 |
2.01.04.01 | Loans and financing | 307,555 | 285,612 |
2.01.04.01.01 | In Local Currency | 307,555 | 285,612 |
2.01.04.02 | Debentures | 133,636 | 62,783 |
2.01.05 | Other obligations | 354,498 | 368,516 |
2.01.05.01 | Payables to related parties | 52,634 | 56,164 |
2.01.05.02 | Others | 301,864 | 312,352 |
2.01.05.02.04 | Obligations related to purchases of properties and advances from customers | 114,237 | 113,355 |
2.01.05.02.06 | Other payables | 162,728 | 173,951 |
2.01.05.02.07 | Obligations assumed on the assignment of receivables | 24,899 | 25,046 |
2.01.06 | Provisions | 190,566 | 138,201 |
2.01.06.01 | Tax, labor and civil lawsuits | 190,566 | 138,201 |
2.01.06.01.01 | Tax lawsuits | 637 | 637 |
2.01.06.01.02 | Labor lawsuits | 21,731 | 20,729 |
2.01.06.01.04 | Civil lawsuits | 168,198 | 116,835 |
2.02 | Noncurrent liabilities | 707,384 | 994,074 |
2.02.01 | Loans and financing | 348,981 | 541,018 |
2.02.01.01 | Loans and financing | 233,375 | 338,135 |
2.02.01.01.01 | Loans and financing in local currency | 233,375 | 338,135 |
2.02.01.02 | Debentures | 115,606 | 202,883 |
2.02.02 | Other obligations | 205,427 | 248,076 |
2.02.02.02 | Others | 205,427 | 248,076 |
2.02.02.02.03 | Obligations related to purchase of properties and advances from customers | 153,947 | 196,076 |
2.02.02.02.04 | Other payables | 20,996 | 19,860 |
2.02.02.02.06 | Obligations assumed on the assignment of receivables | 30,484 | 32,140 |
2.02.03 | Deferred taxes | 49,372 | 49,372 |
2.02.03.01 | Deferred income tax and social contribution | 49,372 | 49,372 |
2.02.04 | Provisions | 103,604 | 155,608 |
2.02.04.01 | Tax, labor and civil lawsuits | 103,604 | 155,608 |
2.02.04.01.01 | Tax lawsuits | 1,313 | - |
2.02.04.01.02 | Labor lawsuits | 35,670 | 36,961 |
2.02.04.01.04 | Civil lawsuits | 66,621 | 118,647 |
2.03 | Equity | 449,455 | 493,191 |
2.03.01 | Capital | 2,521,319 | 2,521,319 |
2.03.02 | Capital Reserves | 298,327 | 278,401 |
2.03.02.05 | Treasury shares | (39,185) | (58,950) |
2.03.02.07 | Constitution of capital reserve | 250,599 | 250,599 |
2.03.02.09 | Reserve for granting stock options | 86,913 | 86,752 |
2.03.05 | Retained earnings/accumulated losses | (2,371,467) | (2,308,403) |
2.03.09 | Non-controlling interest | 1,276 | 1,874 |
13
CONSOLIDATED FINANCIAL STATEMENTS - INCOME - (in thousands of Brazilian Reais) | |||
CODE | DESCRIPTION | YEAR TO DATE 01/01/2019 to 03/31/2019 | YEAR TO DATE FROM PREVIOUS YEAR 01/01/2018 to 03/31/2018 |
3.01 | Gross Sales and/or Services | 95,421 | 233,949 |
3.01.01 | Revenue from real estate development | 103,362 | 255,036 |
3.01.03 | Taxes on real estate sales and services | (7,941) | (21,087) |
3.02 | Cost of sales and/or services | (88,974) | (208,679) |
3.02.01 | Cost of real estate development | (88,974) | (208,679) |
3.03 | Gross profit | 6,447 | 25,270 |
3.04 | Operating expenses/income | (42,683) | (59,783) |
3.04.01 | Selling expenses | (6,502) | (24,279) |
3.04.02 | General and administrative expenses | (7,900) | (18,696) |
3.04.05 | Other operating expenses | (26,599) | (16,190) |
3.04.05.01 | Depreciation and amortization | (4,373) | (3,985) |
3.04.05.02 | Other operating expenses | (22,226) | (12,205) |
3.04.06 | Income from equity method investments | (1,682) | (618) |
3.05 | Income (loss) before financial results and income taxes | (36,236) | (34,513) |
3.06 | Financial | (9,959) | (19,950) |
3.06.01 | Financial income | 3,365 | 5,344 |
3.06.02 | Financial expenses | (13,324) | (25,294) |
3.07 | Income before income taxes | (46,195) | (54,463) |
3.08 | Income and social contribution taxes | (404) | (232) |
3.08.01 | Current | (404) | (232) |
3.09 | Income (loss) from continuing operation | (46,599) | (54,695) |
3.11 | Income (loss) for the period | (46,599) | (54,695) |
3.11.01 | Income (loss) attributable to the Company | (46,354) | (53,516) |
3.11.02 | Net income attributable to non-controlling interests | (245) | (1,179) |
3.99 | Earnings per Share – (Brazilian Reais / Share) | - | - |
3.99.01 | Basic Earnings per Share | - | - |
3.99.01.01 | ON | (1,17596) | (1,41110) |
3.99.02 | Diluted Earnings per Share | - | - |
3.99.02.01 | ON | (1,17596) | (1,41110) |
14
CONSOLIDATED FINANCIAL STATEMENTS - COMPREHENSIVE INCOME (LOSS) - (in thousands of Brazilian Reais) | |||
CODE | DESCRIPTION | YEAR TO DATE 01/01/2019 to 03/31/2019 | YEAR TO DATE FROM PREVIOUS YEAR 01/01/2018 to 03/31/2018 |
4.01 | Consolidated Income (loss) for the period | (46,599) | (54,695) |
4.03 | Consolidated comprehensive income (loss) for the period | (46,599) | (54,695) |
4.03.01 | Income (loss) attributable to the Company | (46,354) | (53,516) |
4.03.02 | Net income attributable to the noncontrolling interests | (245) | (1,179) |
15
CONSOLIDATED FINANCIAL STATEMENTS - CASH FLOWS - INDIRECT METHOD - (in thousands of Brazilian Reais) | |||
CODE | DESCRIPTION | YEAR TO DATE 01/01/2019 to 03/31/2019 | YEAR TO DATE FROM PREVIOUS YEAR 01/01/2018 to 03/31/2018 |
6.01 | Net cash from operating activities | (31,884) | (62,761) |
6.01.01 | Cash generated in the operations | (38,481) | (66,947) |
6.01.01.01 | Income (loss) before income and social contribution taxes | (46,195) | (54,463) |
6.01.01.02 | Income from equity method investments | 1,682 | 618 |
6.01.01.03 | Stock options expenses | (2,460) | (91) |
6.01.01.04 | Unrealized interest and finance charges, net | 204 | 3,781 |
6.01.01.05 | Financial instruments | - | (20) |
6.01.01.06 | Depreciation and amortization | 4,373 | 3,985 |
6.01.01.07 | Provision for legal claims | 22,225 | 11,527 |
6.01.01.08 | Provision for profit sharing | - | 1,231 |
6.01.01.09 | Warranty provision | (338) | (834) |
6.01.01.11 | Allowance for expected credit losses | (18,539) | (23,505) |
6.01.01.12 | Provision for realization of non-financial assets - properties for sale | (841) | (9,176) |
6.01.02 | Variation in assets and liabilities | 6,597 | 4,188 |
6.01.02.01 | Trade accounts receivable | 62,313 | (31,059) |
6.01.02.02 | Properties for sale | 82,022 | 99,612 |
6.01.02.03 | Other accounts receivable | (9,995) | (4,509) |
6.01.02.04 | Prepaid expenses | 202 | 399 |
6.01.02.05 | Obligations related to purchase of properties and adv. from customers | (41,248) | (31,144) |
6.01.02.06 | Taxes and contributions | 168 | 5,586 |
6.01.02.07 | Suppliers | 323 | 110 |
6.01.02.08 | Salaries and charge payables | (1,034) | 494 |
6.01.02.09 | Transactions with related parties | 10,851 | (5,269) |
6.01.02.10 | Other obligations | (96,601) | (29,803) |
6.01.02.11 | Income tax and social contribution payable | (404) | (232) |
6.02 | Net cash from investment activities | 56,565 | (67,216) |
6.02.01 | Purchase of property and equipment and intangible assets | (343) | (4,368) |
6.02.02 | Increase in investments | - | (499) |
6.02.03 | Redemption of short-term investments | 77,456 | 469,903 |
6.02.04 | Purchase of short-term investments | (23,265) | (532,252) |
6.02.05 | Equity instruments | 2.717 | - |
6.03 | Net cash from financing activities | (44,583) | 125,104 |
6.03.01 | Capital increase | - | 167 |
6.03.02 | Increase in loans, financing and debentures | 16,659 | 51,938 |
6.03.03 | Payment of loans, financing and debentures | (116,104) | (177,149) |
6.03.06 | Loan transactions with related parties | 42 | (451) |
6.03.08 | Disposal of treasury shares | 148 | - |
6.03.09 | Transactions related to the share repurchase program | 54.672 | - |
6.03.12 | Subscription and payment of common shares | - | 250,599 |
6.05 | Net increase (decrease) of cash and cash equivalents | (19,902) | (4,873) |
6.05.01 | Cash and cash equivalents at the beginning of the period | 32,304 | 28,527 |
6.05.02 | Cash and cash equivalents at the end of the period | 12,402 | 23,654 |
16
CONSOLIDATED STATEMENT OF CHANGES IN EQUITY FROM 01/01/2019 TO 03/31/2019 (in thousands of Brazilian Reais) |
| ||||||||
CODE | DESCRIPTION | Capital | Capital reserves, stock options and treasury shares | Profit reserves | Retained earnings | Other comprehensive income | Total Shareholders’ equity | Noncontrolling interest | Total equity Consolidated |
5.01 | Opening balance | 2,521,319 | 278,401 | - | (2,308,403) | - | 491,317 | 1,874 | 493,191 |
5.03 | Opening adjusted balance | 2,521,319 | 278,401 | - | (2,308,403) | - | 491,317 | 1,874 | 493,191 |
5.04 | Capital transactions with shareholders | - | 19,926 | - | (16,710) | - | 3,216 | - | 3,216 |
5.04.03 | Stock option plan | - | 162 | - | - | - | 162 | - | 162 |
5.04.05 | Treasury shares sold | - | 141 | - | 7 | - | 148 | - | 148 |
5.04.09 | Share repurchase program |
| 19,623 |
| (16,717) |
| 2,906 | - | 2,906 |
5.05 | Total of comprehensive income (loss) | - | - | - | (46,354) | - | (46,354) | (245) | (46,599) |
5.05.01 | Net income (loss) for the period | - | - | - | (46,354) | - | (46,354) | (245) | (46,599) |
5.06 | Internal changes in equity | - | - | - | - | - | - | (353) | (353) |
5.06.01 | Constitution of reserves | - | - | - | - | - | - | (353) | (353) |
5.07 | Closing balance | 2,521,319 | 298,327 | - | (2,371,467) | - | 448,179 | 1,276 | 449,455 |
17
CONSOLIDATED STATEMENT OF CHANGES IN EQUITY FROM 01/01/2018 TO 03/31/2018 (in thousands of Brazilian Reais) | |||||||||
CODE | DESCRIPTION | Capital | Capital reserves, stock options and treasury shares | Profit reserves | Retained earnings | Other comprehensive income | Total Shareholders’ equity | Noncontrolling interest | Total equity Consolidated |
5.01 | Opening balance | 2,521,152 | 56,359 | - | (1,866,289) | - | 711,222 | 3,847 | 715,069 |
5.03 | Opening adjusted balance | 2,521,152 | 56,359 | - | (1,866,289) | - | 711,222 | 3,847 | 715,069 |
5.04 | Capital transactions with shareholders | 167 | 251,305 | - | - | - | 251,472 | - | 251,472 |
5.04.01 | Capital increase | 167 | 250,599 | - | - | - | 250,766 | - | 250,768 |
5.04.03 | Stock option plan | - | 706 | - | - | - | 706 | - | 706 |
5.05 | Total of comprehensive income (loss) | - | - | - | (53,516) | - | (53,516) | (1,179) | (54,695) |
5.05.01 | Net income (loss) for the period | - | - | - | (53,516) | - | (53,516) | (1,179) | (54,695) |
5.07 | Closing balance | 2,521,319 | 307,664 | - | (1,919,805) | - | (909,178) | 2,668 | (911,846) |
18
CONSOLIDATED STATEMENT OF VALUE ADDED (in thousands of Brazilian Reais) | |||
CODE | DESCRIPTION | YEAR TO DATE 01/01/2019 to 03/31/2019 | YEAR TO DATE FROM PREVIOUS YEAR 01/01/2018 to 03/31/2018 |
7.01 | Revenues | 103,362 | 255,036 |
7.01.01 | Real estate development, sales and services | 84,823 | 231,531 |
7.01.04 | Allowance for expected credit losses | 18,539 | 23,505 |
7.02 | Inputs acquired from third parties | (103,523) | (202,128) |
7.02.01 | Cost of Sales and/or Services | (77,657) | (172,407) |
7.02.02 | Materials, energy, outsourced labor and other | (25,866) | (29,721) |
7.03 | Gross value added | (161) | 52,908 |
7.04 | Retentions | (4,373) | (3,985) |
7.04.01 | Depreciation and amortization | (4,373) | (3,985) |
7.05 | Net value added produced by the Company | (4,534) | 48,923 |
7.06 | Value added received on transfer | 1,683 | 4,726 |
7.06.01 | Income from equity method investments | (1,682) | (618) |
7.06.02 | Financial income | 3,365 | 5,344 |
7.07 | Total value added to be distributed | (2,851) | 53,649 |
7.08 | Value added distribution | (2,851) | 53,649 |
7.08.01 | Personnel and payroll charges | 6,453 | 18,808 |
7.08.01.01 | Direct remuneration | 6,453 | 18,808 |
7.08.02 | Taxes and contributions | 10,422 | 25,276 |
7.08.02.01 | Federal | 10,422 | 25,276 |
7.08.03 | Compensation – Interest | 26,628 | 63,081 |
7.08.03.01 | Interest | 24,641 | 61,566 |
7.08.03.02 | Rent | 1,987 | 1,515 |
7.08.04 | Compensation – Company capital | (46,354) | (53,516) |
7.08.04.03 | Net income (Retained losses) | (46,354) | (53,516) |
19

FOR IMMEDIATE RELEASE -São Paulo, May 14, 2019 – Gafisa S.A. (B3: GFSA3; OTC: GFASY), a leading Brazilian homebuilder focused on the upper-middle and high-income segments, announced today its operational and financial results for the first quarter of 2019 ended March 31, 2019.
GAFISA ANNOUNCES
1Q19 RESULTS
Conference Call May 15, 2019 In Portuguese ► 5:00 p.m. Brasília time +55 (11) 3137-8076 (Brazil) Code: Gafisa
► 4:00 p.m. US EST In English (simultaneous translation from Portuguese) +1 786 209-1795 (USA) Code: Gafisa
Webcast: www.gafisa.com.br/ri
Replay: +55 (11) 3137-8031 Portuguese: 8875| #270 English: 8876| #732
Shares GFSA3 – B3 GFASY – OTC Total outstanding shares: 44,757,9141 Average Daily Traded Volume (1Q19): R$22.7 million. (1) including 3,566,012 treasury shares.
| In 2019, Gafisa will focus heavily on the process of rebuilding the Company. To guarantee shareholders’ interests are truly represented, we will take a management ownership approach that ensures the Board of Directors and Board of Executive Officers are integrated and in line with strategic and operational endeavors. To support Management, we will form audit, restructuring, and compensation/governance committees. Although significant challenges lie ahead, we remain confident that we will be able to reinforce our team and set up an experienced team capable of leading Gafisa to a new cycle. Our rebuilding process began in early April when we summoned shareholders for an Extraordinary Shareholders’ Meeting. During the meeting, we developed a restructuring and management plan to facilitate growth and improve our capitalization. Shareholders approved measures to i) hire a consulting firm to help develop our strategic plan and assess new areas of operation; ii) reissue treasury shares canceled by former management that may be sold in the future to generate inflows for Gafisa; and iii) increase capital by 26,273,962 shares, which should equal a total capitalization of R$130-R$134 million. Funds raised will be used to tackle short/medium term cash needs, regularize activities, and deleverage the Company. At the Extraordinary Shareholders’ Meeting held on April 23, the Company’s Bylaws were amended and the authorized capital was increased from 71,031,876 common shares to up to 120,000,000 common shares, giving the Company the flexibility to increase capital in the future. The Board of Directors was also asked to assess the best funding alternatives via issue of securities convertible or not into shares to couple with the strategic plan. We are also considering raising funds of up to US$150 million to place in the domestic or international market. We believe this strategy will pave the way to sustainable growth, with satisfied clients, restoring the company’s position as a highly credible leader in the Brazilian real estate sector and capable of meeting its obligations. We count on the confidence of our investors to forge ahead on this path to success. The first quarter of 2019 results still do not reflect the impact of new Management elected on March 27, 2019, but they are related to decisions made by former Management.
Roberto Luz Portella Chief Executive Officer |

20
Table 1 – Operational Performance (R$ 000)
1Q19 | 4Q18 | Q/Q (%) | 1Q18 | Y/Y (%) | |
Launches | - | 118,936 | -100.0% | 138,715 | -100.0% |
Gross Sales | 91,270 | 153,406 | -40.5% | 293,460 | -68.9% |
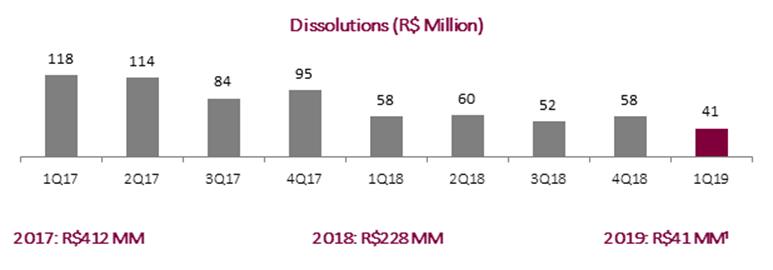
Dissolutions | (41,363) | (58,401) | -29.2% | (57,702) | -28.3% |
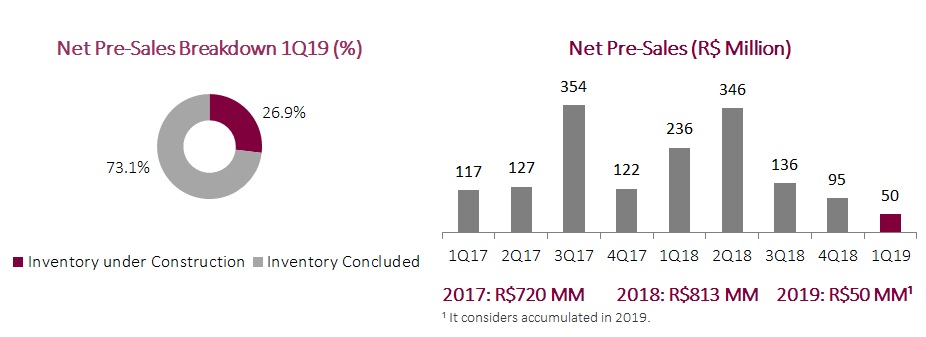
Pre-sales | 49,907 | 95,005 | -47.5% | 235,757 | -78.8% |
Speed of Sales (SoS) | 4.3% | 7.2% | -2.9 p.p. | 14.4% | -10.1 p.p. |
Delivered PSV | 80,079 | 263,254 | -69.6% | - | - |
*The amounts reported are net of swap and brokerage.
Table 2 – Financial Performance (R$ 000)
1Q19 | 4Q18 | Q/Q (%) | 1Q187 | Y/Y (%) | |
Net Revenue | 95,421 | 192,917 | -51% | 233,949 | -59% |
Recurring Adjusted Gross Profit¹ | 17,764 | 46,941 | -62% | 61,542 | -74% |
Recurring Adjusted Gross Margin¹ | 18.6% | 24.3% | -572 bps | 26.3% | -769 bps |
Adjusted EBITDA² | (23,006) | (98,421) | -76.6% | 5,653 | -507% |
Adjusted EBITDA Margin² | -24.1% | -51.0% | 2,691 bps | 2.4% | -2,653 bps |
Net Income (ex- AUSA)³ | (46,353) | (121,072) | -62% | (53,516) | -13% |
Backlog Revenues | 533,503 | 551,270 | -3% | 625,251 | -15% |
Backlog Results4 5 | 193,016 | 196,812 | -2% | 231,253 | -17% |
Backlog Results Margin4 5 | 36.2% | 35.7% | 48 bps | 37.0% | -81 bps |
Net Debt | 727,104 | 752,253 | -3% | 778,530 | -7% |
Cash and Cash Equivalents6 | 63,068 | 137,160 | -54% | 204,938 | -69% |
Equity + Minority Shareholders | 449,455 | 493,191 | -9% | 936,904 | -52% |
(Net Debt. – Proj. Fin.) / (Equity + Minority.) | 51.1% | 45.4% | 569 bps | 9.8% | 4,133 bps |
¹ Adjusted by capitalized interests and impairmentof inventories and land.
² Adjusted by impairments of inventories and land, capitalized interest, stock option plan (non-cash), minority shareholders, and the goodwill write-off in the acquisition of Alphaville.
³ Adjusted by impairment of inventories, land, and goodwill of interest in Alphaville.
4Backlog results net of PIS/COFINS taxes (3.65%) and excluding the impact of the PVA (Present Value Adjustment) method according to Law No. 11.638.
5Backlogresultscomprisetheprojectsrestrictedbyconditionprecedent.
6Cash and cash equivalents and marketable securities.
7Restatement due to the adoption of IFRS 15 and IFRS 9.
21
Launches
In light of the review of launches pipeline projects and the company’s transition process this quarter, Gafisa decided to postpone project launches and focus efforts on inventory sales in 1Q19.

Sales
Gross sales totaled R$91.3 million in 1Q19, down 40.5% q-o-q and 68.9% y-o-y. 1Q19 is seasonally a weaker period because household expenditures increase due to school vacation/Carnival. Sales performance in the period was also affected by the still-fragile economy along with our ongoing restructuring process.
Dissolutions prolonged the downward trend of previous periods, reaching R$41.4 million in 1Q19, 28.3% lower than in 1Q18, despite a delivered PSV volume R$80.1 million higher than in the same period of the previous year.
¹ It considers accumulated in 2019.
22
Net pre-sales totaled R$49.9 million in 1Q19 versus R$235.7 million in 1Q18.
Sales Over Supply (SoS)
SoS was 4.3% in 1Q19. SoS in the last 12 months reached 35.8%, down 1.7 p.p. y-o-y. As previously mentioned, both metrics were affected by the postponement of launches in the period and the current restructuring process of the Company.

Inventory (Property for Sale)
Inventory at market value totaled R$1.12 billion in 1Q19, down 8.3% q-o-q.
It is worth mentioning the denunciation of 3Q18’s Vision Pinheiros project launch development, with a PSV, net of swaps and brokerage, of R$71.1 million. The decision to cancel this development is due to the product’s incompatibility with the profile sought in the region. This project will be reviewed and relaunched in the future.
Table 3 - Inventory at Market Value 4Q18 x 1Q19 (R$ 000)
| Inventories 4Q18 | Launches | Dissolutions | Gross Sales | Adjustments¹ | Inventories 1Q19 | Q/Q(%) |
São Paulo | 1,034,013 | - | 31,985 | (79,515) | (69,044) | 917,439 | -11.3% |
Rio de Janeiro | 143,163 | - | 8,773 | (9,602) | (5,881) | 136,453 | -4.7% |
Other Markets | 47,890 | - | 606 | (2,153) | 23,339 | 69,681 | 45.5% |
Total | 1,225,066 | - | 41,363 | (91,270) | (51,586) | 1,123,573 | -8.3% |
¹Adjustments in the period reflect the updates related to the project scope, launch date, and pricing update.
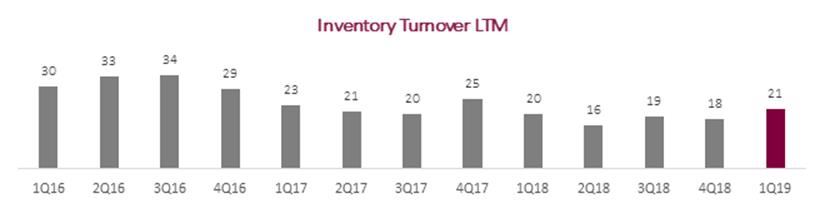
Inventory turnover was 21 months in 1Q19, in line with inventory turnover of 20 months in 1Q18.
23
Currently, approximately 70% of inventory is composed of residential units located in the state of São Paulo, with higher liquidity than commercial units.
Table 4 – Inventory at Market Value – Financial Progress – POC - (R$ 000)
| Not Initiated | Up to 30% built | 30% to 70% built | More than 70% built | Finished Units | Total 1Q19 |
São Paulo | 102,140 | 78,209 | 365,061 | 116,422 | 255,606 | 917,439 |
Rio de Janeiro | - | - | - | - | 136,453 | 136,453 |
Other Markets | - | - | 13,106 | - | 56,575 | 69,681 |
Total | 102,140 | 78,209 | 378,167 | 116,422 | 448,634 | 1,123,573 |
* % POC does not necessarily reveal the status of construction works, but the project’s financial progress.
Table 5 - Inventory at Market Value– Commercial x Residential Breakdown (R$ 000)
GFSA Inventory % | Residential | Commercial | Total |
São Paulo | 780,530 | 136,908 | 917,439 |
Rio de Janeiro | 34,878 | 101,575 | 136,453 |
Other | 69,681 | - | 69,681 |
Total | 885,090 | 238,483 | 1,123,573 |
Delivered Projects and Transfer
In 1Q19, Gafisa delivered the project Like Aclimação, totaling 136 units, net of swap, with PSVs totaling R$80.1 million, net of brokerage. Currently, Gafisa manages the construction of 14 projects, and 4 projects will start works soon.
Table 6 – Deliveries
Project | Delivery Date | Launch Date | Location | % Share | Units 100%¹ | PSV % R$000² |
Like Aclimação | Feb/19 | Mar/16 | São Paulo/SP | 100% | 136 | 80,079 |
Total 1Q19 |
|
|
|
| 136 | 80,079 |
Total 2019 |
|
|
|
| 136 | 80,079 |
¹ Number of units corresponding to 100% share in projects, net of swaps;
² PSV = Potential Sales Value of units, net of brokerage and swap.
24
PSV transferred in 1Q19 totaled R$64.8 million, up 9.9% y-o-y, boosted by the delivery of project Like Aclimação in the quarter.
Table 7 – Transfer and Delivery - (R$ 000)
| 1Q19 | 4Q18 | Q/Q (%) | 1Q18 | Y/Y (%) |
PSV Transferred¹ | 64,821 | 82,400 | -21.3% | 58,998 | 9.9% |
Delivered Projects | 1 | 4 | -75.0% | - | - |
Delivery Units² | 136 | 519 | -73.8% | - | - |
Delivered PSV³ | 80,079 | 263,254 | -69.6% | - | - |
¹ PSV transferred refers to the effective cash inflow from units transferred to financial institutions;
² Number of units corresponding to 100% share in projects, net of swaps;
³ PSV = Potential Sales Value of units, net of brokerage and swap.
Landbank
The Company’s landbank, with an estimated PSV of R$3.83 billion, represents 33 projects/phases totaling 6,782 units. Approximately 70% of land was acquired through swaps, most of it located in the city of São Paulo.
Table 8 - Landbank (R$ 000)
| PSV | % Swap Total ² | % Swap Units | % Swap Financial | Potential Units | Potential Units Total |
São Paulo | 2,486,753 | 79.9% | 71.4% | 8.5% | 4,978 | 5,331 |
Rio de Janeiro | 748,745 | 60.1% | 60.1% | 0.0% | 755 | 892 |
Other | 594,327 | 30.0% | 30.0% | 0.0% | 1,050 | 1,320 |
Total | 3,829,825 | 69.8% | 66.2% | 3.6% | 6,782 | 7,543 |
¹ The PSV (% Gafisa) reported is net of swap and brokerage fee.
²The swap percentage is measured compared to the historical cost of land acquisition.
³Potential units are net of swap and refer to the Gafisa’s and/or its partners’ interest in the project.
The adjustments to landbank include the denunciation of the Vision Pinheiros project development previously mentioned.
Table 9 – Changes in the Landbank (1Q19 x 4Q18 - R$ 000)
| Initial Landbank | Land Acquisition | Launches | Dissolutions | Adjustments | Final Landbank |
São Paulo | 2,410,522 | - | - | - | 76,231 | 2,486,753 |
Rio de Janeiro | 748,745 | - | - | - | - | 748,745 |
Other | 594,327 | - | - | - | - | 594,327 |
Total | 3,753,594 | - | - | - | 76,231 | 3,829,825 |
* The amounts reported are net swap and brokerage.
Approximately 58.3% of land was acquired through swaps in the quarter. In 3Q18, Gafisa acquired three new land areas in its strategic market (São Paulo), with potential PSV of R$324.4 million. The physical swap of these land acquisitions accounted for 79% of total purchase.
25
Table 8 - Landbank (R$ 000)
| PSV | % Swap Total | % Swap Units | % Swap Financial | Potential Units | Potential |
São Paulo | 2,645,527 | 55.5% | 51.2% | 4.3% | 5,804 | 6,470 |
Rio de Janeiro | 1,273,603 | 62.5% | 62.5% | 0.0% | 1,712 | 1,712 |
Total | 3,919,130 | 58.3% | 55.7% | 2.6% | 7,516 | 8,182 |
¹The swap percentage is measured compared to the historical cost of land acquisition.
²Potential units are net of swaps and refer to Gafisa’s and/or its partners’ interest in the project.
Table 9 – Changes in the Landbank (3Q18 x 2Q18 - R$ 000)
| Initial Landbank | Land Acquisition | Launches | Cancellations | Adjustments | Final Landbank |
São Paulo | 2,386,018 | 324,439 | 71,144 | - | 6,214 | 2,645,527 |
Rio de Janeiro | 1,353,466 | - | - | 79,863 | - | 1,273,603 |
Total | 3,739,484 | 324,439 | 71,144 | 79,863 | 6,214 | 3,919,130 |
26
FINANCIAL RESULTS
Revenue
Net revenues totaled R$95.4 million in 1Q19, down 59% from 1Q18, driven by lower sales volume and work evolution in the period.
Table 10 – Revenue Recognition (R$ 000)
| 1Q19 | 1Q18¹ | ||||||
Launches | Pre-Sales | % | Revenue | % Revenue | Pre-Sales | % | Revenue | % Revenue |
2018 | 5,222 | 10.5% | 7,549 | 7.9% | 107,028 | 45.4% | - | - |
2017 | 3,126 | 6.3% | 14,682 | 15.4% | 22,264 | 9.4% | 75,983 | 32.5% |
2016 | 9,037 | 18.1% | 32,733 | 34.3% | 19,038 | 8.1% | 84,273 | 36.0% |
2015 | 27,141 | 54.4% | 27,310 | 28.6% | 62,030 | 26.3% | 11,713 | 5.0% |
<2014 | 5,381 | 10.8% | 13,147 | 13.8% | 25,398 | 10.8% | 61,980 | 26.5% |
Total | 49,907 | 100% | 95,421 | 100.0% | 235,757 | 100% | 233,949 | 100.0% |
¹Restatement due to the adoption of IFRS 15 and IFRS 9.
Gross Profit & Margin
Gafisa’s recurring adjusted gross profit came to R$17.8 million versus R$46.9 million in 4Q18 and R$61.5 million in 1Q18. Adjusted gross margin stood at 18.6%, down 7.69 p.p. from 1Q18. This y-o-y gross margin decrease is chiefly due to discounts granted in the sale of previous years finished units.
Table 11 – Gross Margin (R$ 000)
| 1Q19 | 4Q18 | Q/Q(%) | 1Q18³ | Y/Y (%) |
Net Revenue | 95,421 | 192,917 | -51% | 233,949 | -59% |
Gross Profit | 6,447 | (29,710) | 122% | 25,270 | -74% |
Gross Margin | 6.8% | -15.4% | 2,216 bps | 10.8% | -405 bps |
(-) Financial Costs | (11,317) | (13,506) | -16% | (36,272) | -69% |
Adjusted Gross Profit ¹ | 17,764 | (16,204) | -210% | 61,542 | -71% |
Adjusted Gross Margin¹ | 18.6% | -8.4% | 2,702 bps | 26.3% | -769 bps |
(-) Inventory and landbank adjustment | - | (63,145) | -100% | - | - |
Recurring Adjusted Gross Profit ² | 17,764 | 46,941 | -62% | 61.542 | -71% |
Recurring Adjusted Gross Margin² | 18.6% | 24.3% | -572 bps | 26.3% | -769 bps |
¹ Adjusted by capitalized interests.
² Adjusted byimpairment of land and inventories.
³ Restatement due to the adoption of IFRS 15 and IFRS 9.
Selling, General and Administrative Expenses (SG&A)
Selling, general and administrative expenses totaled R$14.4 million, 66% below 1Q18.
Selling expenses totaled R$6.5 million in 1Q19, down 43% q-o-q, due to lower marketing, condominium, IPTU (Urban Property Tax) and sales commission expenses, reflecting lower sales volume in the period. Y-o-y, selling expenses declined 73%.
27
General and administrative expenses totaled R$7.9 million, down 58% from 1Q18. This significant decrease was mainly due to (i) a review of services and IT agreements, which reduced expenses by R$3 million y-o-y, and (ii) a 50% cut in headcount in the second half of 2018, which resulted in approximate savings of R$4 million. Q-o-q, the positive amount of R$4.7 million recorded in 4Q18 was due to a net reversal of provisions for bonus from previous years totaling R$14.8 million in 2018.
Table 12 – SG&A Expenses (R$ 000)
| 1Q19 | 4Q18 | Q/Q(%) | 1Q18 | Y/Y (%) |
Selling Expenses | (6,502) | (11,389) | -43% | (24,279) | -73% |
G&A Expenses | (7,900) | 4,752 | -266% | (18,696) | -58% |
Total SG&A Expenses | (14,402) | (6,637) | 117% | (42,975) | -66% |
Other Operating Income/Expenses came to R$22.2 million in 1Q19, down 83% from 4Q18, impacted by impairment referring to Alphaville goodwill; and provisions for four relevant contingencies totaling R$106.9 million.
Y-o-y, other operating income/expenses surged 89% from R$11.8 million recorded in 1Q18. Main contingencies accrued in the period refer to i) construction work delay in previous years’ projects totaling R$4.5 million; and ii) a construction defect in a project launched in May 2005, totaling R$3.1 million.
Table 13 – Other Operating Income/Expenses (R$ 000)
| 1Q19 | 4Q18 | Q/Q(%) | 1Q18 | Y/Y (%) |
Litigation Expenses | (22,225) | (127,668) | -83% | (11,776) | 89% |
Loss on realization of investment valued at fair value | - | (112,800) | -100% | - | - |
Other | (1) | (10,966) | -100% | (429) | -100% |
Total | (22,226) | (251,434) | -91% | (12,205) | 82% |
28
Adjusted EBITDA
Recurring adjusted EBITDA came negative at R$23 million in 1Q19, down 77% from negative R$98.4 million in 4Q18.
Table 14 – Adjusted EBITDA (R$ 000)
| 1Q19 | 4Q18 | Q/Q(%) | 1Q18³ | Y/Y (%) |
Net Income (Loss) | (46,354) | (297,017) | -84% | (53,516) | -13% |
(+) Inventory and Landbank Adjustment | - | 63,145 | -100% | - | - |
Adjusted Net Income¹ | (46,354) | (233,872) | -80% | (53,516) | -13% |
(+) Financial Results | 9,959 | 22,310 | -55% | 19,950 | -50% |
(+) Income Tax / Social Contribution | 404 | (24,085) | -102% | 232 | 74% |
(+) Depreciation and Amortization | 4,373 | 5,772 | -24% | 3,985 | 10% |
(+) Capitalized Interest | 11,317 | 13,506 | -16% | 36,272 | -69% |
(+) Expenses w/ Stock Option Plan | (2,460) | 15 | -16,500% | (91) | 2,603% |
(+) Minority Shareholders | (245) | 170 | -244% | (1,179) | -79% |
(+) AUSA loss on Investment realization Effect | - | 112,800 | -100% | - | - |
(+)Impairment of Software | - | 4,963 | -100% | - | - |
Recurring Adjusted EBITDA² | (23,006) | (98,421) | -77% | 5,653 | -507% |
¹ Adjusted by impairments of inventories and land.
² Adjusted by impairments of inventories and land, capitalized interest, stock option plan (non-cash), minority shareholders, and goodwill write-off in the acquisition of Alphaville.
³Restatement due to the adoption of IFRS 15 and IFRS 9.
Financial Result
In 1Q19, financial results totaled R$3.4 million, down 23% and 37% from 4Q18 and 1Q18, respectively, reflecting a lower balance of cash and cash equivalents in the period. Financial expenses reached R$13.3 million in 1Q19, 50% lower than in 4Q18, due to reduced interest rates on funding in view of a lower level of indebtedness.
In 1Q19, net financial result was negative R$10 million, versus a net loss of R$22.3 million in 4Q18 and R$20.0 million in 1Q18.
Net Result
1Q19 recorded a negative adjusted net result of R$46 million, compared to a net loss of R$121 million and R$53.5 million in 4Q18 and 1Q18, respectively.
29
Tale 15 – Net Result (R$ 000)
| 1Q19 | 4Q18 | Q/Q(%) | 1Q18 ² | Y/Y (%) |
Net Result | (46,354) | (297,017) | -84% | (53,516) | -13% |
(-) Inventory and landbank adjustment | - | (63,145) | -100% | - | - |
(-) Loss of investment in Alphaville | (1) | (112,800) | -100% | - | - |
Adjusted Net Result1 | (46,353) | (121,072) | -62% | (53,516) | -13% |
1Adjusted by impairment of inventories, land, and goodwill of interest in Alphaville.
² Restatement due to the adoption of IFRS 15 and IFRS 9.
Backlog of Revenues and Results
In 1Q19, the balance of backlog revenues by the PoC method totaled R$193.0 million, with a margin of 36.2% to be recognized, 0.48 p.p. above 4Q18, reflecting recent launches assertiveness.
Table 16 – Backlog Results (REF) (R$ 000)
| 1Q19 | 4Q18 | Q/Q(%) | 1Q18 | Y/Y (%) |
Backlog Revenues | 533,503 | 551,270 | -3% | 625,251 | -15% |
Backlog Costs (units sold) | (340,487) | (354,458) | -4% | (393,999) | -14% |
Backlog Results | 193,016 | 196,812 | -2% | (231,253) | -17% |
Backlog Margin | 36.2% | 35.7% | 48 bps | 37.0% | -81 bps |
Notes:Backlog results net ofPIS/COFINStaxes(3.65%) and excluding the impact ofPVA (PresentValueAdjustment) methodaccording toLaw No. 11.638.
Backlogresultscomprisetheprojectsrestrictedbyconditionprecedent.
30
BALANCE SHEET
Cash and Cash Equivalents and Marketable Securities
On March 31, 2019, cash and cash equivalents and marketable securities totaled R$63.1 million.
Receivables
At the end of 1Q19, total accounts receivable totaled R$1.15 billion, down 5% from 4Q18. Of this amount, R$596.4 million were already recognized in the balance sheet, and R$342 million are expected to be received in 2019.
Table 17 – Total Receivables (R$ 000)
| 1Q19 | 4Q18 | Q/Q(%) | 1Q18¹ | Y/Y (%) |
Receivables from developments (off balance sheet) | 553,713 | 572,154 | -3% | 648,938 | -15% |
Receivables from PoC-ST (on balance sheet) | 475,820 | 467,993 | 2% | 511,536 | -7% |
Receivables from PoC-LT (on balance sheet) | 120,614 | 174,017 | -31% | 186,897 | -35% |
Total | 1,150,147 | 1,214,164 | -5% | 1,347,371 | -15% |
¹ Restatement due to the adoption of IFRS 15 and IFRS 9.
Notes: ST – Short term | LT-Long term | PoC – Percentage of Completion Method.
Receivables from developments: Accounts receivable not yet recognized according to PoC and BRGAAP.
Receivables from PoC: Accounts receivable already recognized according to PoC and BRGAAP.
Table 18 – Receivables Schedule (R$ 000)
| Total | 2019 | 2020 | 2021 | 2022 | 2023 – and after |
Receivables from PoC | 596,434 | 342,003 | 187,579 | 61,531 | 1,347 | 3,974 |
Cash Generation
The Company ended the first quarter of 2019 with a positive cash generation of R$25.1 million, the second consecutive quarter of cash generation, as a result of disciplined expense management.
Table 19 – Cash Generation (R$ 000)
| 4Q18 | 1Q19 |
Availabilities1 | 137,160 | 63,068 |
Change in Availabilities (1) | (57,285) | (74,092) |
Total Debt + Investor Obligations | 889,413 | 790,172 |
Change in Total Debt + Investor Obligations (2) | (70,931) | (99,241) |
Cash Generation in the period (1) - (2) | 13,646 | 25,149 |
Final Accumulated Cash Generation | (45,583) | 25,149 |
¹ Cash and cash equivalents and marketable securities.
31
Liquidity
In 1Q19, Net Debt/Shareholders’ Equity ratio stood at 161.8%, an effect of losses accumulated over the last periods, higher than lower indebtedness. Excluding project finance, the Net Debt/Shareholders’ Equity ratio stood at 51.1%.
Net debt in 1Q19 totaled R$727.1 million, down 7% y-o-y.
Table 20 – Debt and Investor Obligations (R$ 000)
| 1Q19 | 4Q18 | Q/Q(%) | 1Q18 | Y/Y (%) |
Debentures – Working Capital (A) | 249,242 | 265,666 | -6% | 168,041 | 48% |
Project Financing SFH – (B) | 497,307 | 528,140 | -6% | 686,728 | -28% |
Working Capital (C) | 43,623 | 95,607 | -54% | 128,699 | -66% |
Total Debt (A)+(B)+(C)= (D) | 790,172 | 889,413 | -11% | 983,468 | -20% |
Cash and Availabilities¹ (E) | 63,068 | 137,160 | -54% | 204,938 | -69% |
Net Debt (D)-(E) = (F) | 727,104 | 752,253 | -3% | 778,530 | -7% |
Equity + Minority Shareholders (G) | 449,455 | 493,191 | -9% | 936,904 | -52% |
(Net Debt) / (Equity) (F)/(G) = (H) | 161.8% | 152.5% | 925 bps | 83.1% | 7,868 bps |
(Net Debt – Proj. Fin.) / Equity ((F)-(B))/(G) = (I) | 51.1% | 45.4% | 569 bps | 9.8% | 4,133 bps |
¹ Cash and cash equivalents and marketable securities.
The Company ended 1Q19 with R$283.8 million total short-term debt, 36% of total debt versus 39% at the end of 4Q18. On March 31, 2019, the consolidated debt average cost was 11.57% p.a., or 180.8% of CDI. We also emphasize that during 1Q19, the Company amortized nearly R$116.1 million of contracted debt principal balance.
Table 21 – Debt Maturity (R$ 000)
Average cost (p.a.) | Total | Until Mar/20 | Until Mar/21 | Until Mar/22 | Until Mar/23 | ||
Debentures – Working Capital (A) | CDI + 3% / CDI + 3.75% / CDI + 5.25% / IPCA + 8.37% | 249,242 | 52,596 | 153,504 | 41,541 | 1,601 | |
Project Financing SFH (B) | TR + 8.30% a 14.19% / 12.87% / 143% CDI | 497,307 | 231,047 | 193,011 | 73,249 | - | |
Working Capital (C) | 135% CDI / CDI + 2.5% / CDI + 3% / CDI + 3.70% / CDI + 4.25% | 43,623 | 188 | 198 | 43,237 | - | |
Total (A)+(B)+(C) = (D) |
| 790,172 | 283,831 | 346,713 | 158,027 | 1,601 | |
Obligations with investors (E) |
| - | - | - | - | - | |
Total Debt (D)+(E) = (F) | 790,172 | 283,831 | 346,713 | 158,027 | 1,601 | ||
% of Total Maturity per period | 36% | 44% | 20% | 0.2% | |||
Project debt maturing as % of total debt (C)/ (F) | 81% | 56% | 46% | - | |||
Corporate debt maturing as % of total debt ((A)+(C) + (E))/ (F) | 19% | 44% | 54% | 100% | |||
Ratio Corporate Debt / Mortgage | 37% / 63% | ||||||
32
SUBSEQUENT EVENTS
Elaboration of a Long-Term Strategic Plan
At the Extraordinary Shareholders’ Meeting held on April 15, 2019, the Board of Directors was authorized to hire a first-tier bank or consulting firm to elaborate a long-term strategic plan for the Company, aiming at resuming the path to growth, taking into account, besides Gafisa’s area of operation, potential opportunities to expand to other segments and new markets.
The Extraordinary Shareholders’ Meeting also approved the hiring of the consulting firm Falconi which will give support to the restructuring plan, focused on change of culture, review of structure, processes and expenses optimization; as well as the implementation of the zero-based budget.
Capital Increase
On April 15, 2019, a capital increase was approved by means of the issue of26,273,962non-par, registered, book-entryshares.
The issue reference price shall be R$6.02 per share, defined based on Article 170, Paragraph 1, items I and III of Law No. 6.404/76, applying a scheduled bonus: (i) 15% applied over the issue reference price in theexercise of preemptive right at a price of R$5.12 per common share ON; and (ii) an additional 3% in the amount ofR$4.96 per common share ON in unsold shares subscription.
The Company’s shareholders shall be ensured the preemptive right to subscribe for new shares based on their ownership position at the closing of the B3 trading session on April 23, 2019.
The term to exercise the preemptive right shall be 30 consecutive days as of April 24, 2019 (inclusive) until May 23, 2019 (inclusive).
Authorized Capital Increase
The Extraordinary Shareholders’ Meeting held on April 23, 2019, approved to increase the limit of the Company’s Authorized Capital from 71,031,876 common shares to 120,000,000 common shares.
Reissue of Shares
On April 24, 2019, the Company announced to its shareholders and to the market in general that, in compliance with decision made by the Board of Directors on a meeting held on April 15, 2019,shares were reissuedon April 23, 2019, totaling one million, four hundred thousand, three hundred and twenty-five(1,400,325) Company’s shares, referring to shares previously canceled by former management. Therefore, the Company’s capital stock is now divided into 44,757,914 non-par, registered, book-entry, common shares.
33
São Paulo, May 14, 2019. |
|

Alphaville Urbanismo SA released its results for the first quarter of 2019.
Financial Results
In 1Q19, net revenue came negative at R$23 million and net loss totaled R$185 million.
|
|
| |
|
|
| |
1Q19 | 1Q18 | 1Q19 vs. 1Q18 | |
Net revenue | -23 | 86 | -126% |
Net income | -185 | -92 | 101% |
|
|
|
|
It is worth mentioning that Gafisa discontinued the recognition of its share in future losses after reducing the accounting balance of its 30% stake in Alphaville's share capital to zero.
For further information, please contact our Investor Relations team atri@alphaville.com.br or +55 11 3038-7131.
34
Consolidated Income Statement
| 1Q19 | 4Q18 | Q/Q (%) | 1Q18¹ | Y/Y (%) |
Net Revenue | 95,421 | 192,917 | -51% | 233,949 | -59% |
Operating Costs | (88,974) | (222,627) | -60% | (208,679) | -57% |
Gross Profit | 6,447 | (29,710) | -122% | 25,270 | -74% |
Gross Margin | 6.8% | -15.4% | 2,216 bps | 10.8% | -405 bps |
Operating Expenses | (42,683) | (268,912) | -84% | (59,783) | -29% |
Selling Expenses | (6,502) | (11,389) | -43% | (24,279) | -73% |
General and Administrative Expenses | (7,900) | 4,752 | -266% | (18,696) | -58% |
Other Operating Revenue/Expenses | (22,226) | (251,434) | -91% | (12,205) | 82% |
Depreciation and Amortization | (4,373) | (5,772) | -24% | (3,985) | 10% |
Equity Income | (1,682) | (5,069) | -67% | (618) | 172% |
Operational Result | (36,236) | (298,622) | -88% | (34,513) | 5% |
Financial Income | 3,365 | 4,342 | -23% | 5,344 | -37% |
Financial Expenses | (13,324) | (26,652) | -50% | (25,294) | -47% |
Net Income Before Taxes on Income | (46,195) | (320,932) | -86% | (54,463) | -15% |
Deferred Taxes | - | 25,100 | -100% | - | - |
Income Tax and Social Contribution | (404) | (1,015) | -60% | (232) | 74% |
Net Income After Taxes on Income | (46,599) | (296,847) | -84% | (54,695) | -15% |
Continued Op. Net Income | (46,599) | (296,847) | -84% | (54,695) | -15% |
Minority Shareholders | 245 | (170) | -244% | 1.179 | -79% |
Net Income | (46,354) | (297,017) | -84% | (53,516) | -13% |
¹ Restatement due to the adoption of IFRS 15 and IFRS 9.
35
Consolidated Balance Sheet
| 1Q19 | 4Q18 | Q/Q (%) | 1Q18¹ | Y/Y (%) |
Current Assets |
|
|
|
|
|
Cash and Cash equivalents | 12,402 | 32,304 | -62% | 23,654 | 48% |
Securities | 50,666 | 104,856 | -52% | 181,284 | -72% |
Receivables from clients | 475,820 | 467,993 | 2% | 511,536 | -7% |
Properties for sale | 819,458 | 890,460 | -8% | 831,593 | -1% |
Other accounts receivable | 107,370 | 106,943 | 0% | 115,928 | -7% |
Prepaid expenses and other | 2,466 | 2,668 | -8% | 5,136 | -52% |
Land for sale | 38,682 | 78,148 | -51% | 65,798 | -41% |
Subtotal | 1,506,864 | 1,683,372 | -10% | 1,734,929 | -13% |
|
|
|
|
|
|
Long-term Assets |
|
|
|
|
|
Receivables from clients | 120,614 | 174,017 | -31% | 186,897 | -35% |
Properties for sale | 228,228 | 198,941 | 15% | 336,511 | -32% |
Other | 123,755 | 123,602 | 0% | 91,568 | 35% |
Subtotal | 472,597 | 496,560 | -5% | 614,976 | -23% |
Intangible, Property and Equipment | 32,270 | 31,843 | 1% | 41,005 | -21% |
Investments | 309,668 | 314,505 | -2% | 479,445 | -35% |
|
|
|
|
|
|
Total Assets | 2,321,399 | 2,526,280 | -8% | 2,870,355 | -19% |
|
|
|
|
|
|
Current Liabilities |
|
|
|
|
|
Loans and financing | 307,555 | 285,612 | 8% | 324,376 | -5% |
Debentures | 133,636 | 62,783 | 113% | 11,408 | 1,071% |
Obligations for purchase of land advances from customers | 114,237 | 113,355 | 1% | 142,766 | -20% |
Material and service suppliers | 115,114 | 119,847 | -4% | 99,165 | 16% |
Taxes and contributions | 57,445 | 57,276 | 0% | 52,016 | 10% |
Other | 436,573 | 400,142 | 9% | 308,323 | 42% |
Subtotal | 1,164,560 | 1,039,015 | 12% | 938,054 | 24% |
|
|
|
|
|
|
Long-term liabilities |
|
|
|
|
|
Loans and financings | 233,375 | 338,135 | -31% | 491,051 | -52% |
Debentures | 115,606 | 202,883 | -43% | 156,633 | -26% |
Obligations for Purchase of Land and advances from customers | 153,947 | 196,076 | -21% | 134,924 | 14% |
Deferred taxes | 49,372 | 49,372 | 0% | 74,473 | -34% |
Provision for Contingencies | 103,604 | 155,608 | -33% | 78,293 | 32% |
Other | 51,480 | 52,000 | -1% | 57,615 | -11% |
Subtotal | 707,384 | 994,074 | -29% | 992,989 | -29% |
|
|
|
|
|
|
Shareholders’ Equity |
|
|
|
|
|
Shareholders’ Equity | 448,179 | 491,317 | -9% | 936,644 | -52% |
Minority Interest | 1,276 | 1,874 | -32% | 2,668 | -52% |
Subtotal | 449,455 | 493,191 | -9% | 939,312 | -52% |
Total liabilities and Shareholders’ Equity | 2,321,399 | 2,526,280 | -8% | 2,870,355 | -19% |
¹ Restatement due to the adoption of IFRS 15 and IFRS 9.
36
Consolidated Cash Flow
| 1Q19 | 1Q18¹ |
Net Income (Loss) before taxes | (46,195) | (54,463) |
Expenses/revenues that do not impact working capital | (7,714) | (12,486) |
Depreciation and amortization | 4,373 | 3,985 |
Impairment | (841) | (9,176) |
Expense with stock option plan | (2,460) | (91) |
Unrealized interest and fees, Net | 204 | 3,781 |
Equity Income | 1,682 | 617 |
Provision for guarantee | (338) | (834) |
Provision for contingencies | 22,225 | 11,527 |
Profit Sharing provision | - | 1,231 |
Provision (reversal) for doubtful accounts | (18,539) | (23,505) |
Gain / Loss of financial instruments | - | (21) |
Provision for fine due to construction work delay | 1,408 | - |
Clients | 62,313 | (31,059) |
Properties held for sale | 82,022 | 99,612 |
Other accounts receivable | (9,995) | (4,509) |
Prepaid expenses and deferred sale selling expenses | 202 | 399 |
Obligations on land property acquisitions | (41,248) | (31,144) |
Taxes and contributions | 168 | 5,586 |
Suppliers | 323 | 110 |
Payroll, charges, and provision for bonuses | (1,034) | 494 |
Other accounts payable | (96,601) | (29,800) |
Related party operations | 10,851 | (5,269) |
Taxes paid | (404) | (232) |
Cash used in operating activities | (31,884) | (62,761) |
Investment Activities | - | - |
Acquisition of properties and equipment | (343) | (4,368) |
Capital contribution to parent company | - | (499) |
Redemption of securities, collaterals, and credits | 77,456 | 469,903 |
Investment in marketable securities and restricted credits | (23,265) | (532,252) |
Equity instruments | 2,717 | - |
Cash used in investment activities | 56,565 | (67,216) |
Funding Activities | - | - |
Related party contributions | - | - |
Increase in Addition of loans and financing | 16,659 | 51,938 |
Amortization of loans and financing | (116,104) | (177,149) |
Assignment of credit receivables, Net | - | - |
Loan operations | 42 | (451) |
Sale of treasury shares | 148 | - |
Cash used in financing activities/ discontinued | - | - |
Movements related to the share buyback program | 54,672 | - |
Capital Increase | - | 167 |
Subscription and payment of common shares | - | 250,599 |
Net cash from financing activities | (44,583) | 125,104 |
Net cash variation for sales operations | - | - |
Increase (decrease) in cash and cash equivalents | (19,902) | (4,873) |
Beginning of the period | 32,304 | 28,527 |
End of the period | 12,402 | 23,654 |
Increase (decrease) in cash and cash equivalents | (19,902) | (4,873) |
¹ Restatement due to the adoption of IFRS 15 and IFRS 9.
37
This release contains forward-looking statements about business prospects, estimates for operating and financial results, and Gafisa’s growth prospects. These are merely projections and, as such, are based exclusively on the expectations of management concerning the future of the business and its continued access to capital to fund the Company’s business plan. Such forward-looking statements depend, substantially, on changes in market conditions, government regulations, competitive pressures, the performance of the Brazilian economy, and the industry, among other factors; therefore, they are subject to change without prior notice. |
IR Contacts
Media Relations Nancy Campos / Rodrigo Garcia
|
38
(A free translation of the original report in Portuguese as published in Brazil)
Gafisa S.A.
Notes to the quarterly information
March 31, 2019
(Amounts in thousands of Brazilian Reais, except as otherwise stated)
1. Operations
Gafisa S.A. ("Gafisa" or "Company") is a publicly traded company with registered office at Avenida Presidente Juscelino Kubitschek, nº 1.830, conjunto comercial nº 32, 3oandar, Bloco 2, in the city and state of São Paulo, Brazil, and began its operations in 1997 with the objectives of: (i) promoting and managing all forms of real estate ventures on its own behalf or for third parties (in the latter case, as construction company or proxy); (ii) selling and purchasing real estate properties; (iii) providing civil construction and civil engineering services; (iv) developing and implementing marketing strategies related to its own and third party real estate ventures; and (v) investing in other companies who share similar objectives.
The Company has stocks traded at B3 S.A. – Brasil, Bolsa, Balcão (former BM&FBovespa), reporting its information to the Brazilian Securities and Exchange Commission (CVM) and the U.S. Securities and Exchange Commission (SEC).
On November 26, 2018, the Board of Directors approved the delisting of shares on the New York Stock Exchange (NYSE), aimed to perform the migration of the American Depositary Receipts (ADR) Program from Level 3 to Level 1, and the cancellation of the registry with the SEC. On December 7, 2018, Form25 was filed with the SEC, with copy to the NYSE, for voluntary delisting of the American Depositary Shares (ADSs), represented by the ADRs of the NYSE. The ADSs were delisted on the NYSE on December 17, 2018, and are currently traded Over the Counter (OTC). In the Extraordinary Shareholders’ Meeting held on April 15, 2019, the measures taken for the voluntary delisting of the shares on the NYSE and changing the ADR program from Level 3 to Level 1 were rejected (Note 31 (iii)).
The Company enters into real estate development projects with third parties through specific purpose partnerships (“Sociedades de Propósito Específico” or “SPEs”) or through the formation of consortia and condominiums. Such companies significantly share the managerial and operating structures, and corporate, managerial and operating costs with the Company. The SPEs, condominiums and consortia operate solely in the real estate industry and are linked to specific ventures.
1.1 Change in Shareholding Structure
On February 14, 2019, 14,600,000 shares held by the group of its majority shareholder, GWI Asset Management S.A., corresponding to 33.67% stake in the Company, were auctioned. As a result of this auction, Planner Corretora de Valores S.A., by means of the investment funds it manages, started to hold 8,000,000 common shares, corresponding to 18.45% of total common shares issued by the Company.
39
(A free translation of the original report in Portuguese as published in Brazil)
Gafisa S.A.
Notes to the quarterly information
March 31, 2019
(Amounts in thousands of Brazilian Reais, except as otherwise stated)
2. Presentation of quarterly informationandsummary of significant accounting policies
2.1. Basis of presentation and preparation of individual and consolidated quarterly information
On May 14, 2019, the Company’s Board of Directors approved these individual and consolidated quarterly information of the Company and authorized its disclosure.
The Individual Quarterly Information (ITR) was prepared in accordance with the Accounting Pronouncements Committee (CPC) Technical Pronouncement (CPC) 21 (R1) – Interim Financial Reporting, and the consolidated quarterly information was prepared according to the Technical Pronouncement (CPC) 21 (R1) – Interim Financial Reporting and the International Accounting Standard (IAS) 34 – Interim Financial Reporting, applicable to real estate development entities in Brazil, registered with the Brazilian Securities and Exchange Commission (CVM). The aspects related to the transfer of control in the sale of real estate units follow the understanding of the company’s management, aligned with that issued by the CVM in the Circular Letter /CVM/SNC/SEP 02/18 on the application of the Technical Pronouncement NBC TG 47 (IFRS 15), consistently with the rules issued by the CVM, applicable to the preparation of Quarterly Information (ITR).
Except for the changes described in Note 3, the quarterly information was prepared using the same accounting practices, judgments, estimates and assumptions adopted in the presentation and preparation of the financial statements for the year ended December 31, 2018. Therefore, the corresponding quarterly information shall be read together with the financial statements as of December 31, 2018.
The individual quarterly information of the Company is not considered in compliance with the International Financial Reporting Standards (IFRS), once it considers the capitalization of interest on qualifying assets of investees in the individual quarterly information of the Company.
The quarterly information was prepared on a going concern basis. Management periodically assesses the Company’s ability to continue as going concern when preparing the quarterly information.
All amounts reported in the accompanying quarterly information are in thousands of Brazilian Reais, except as otherwise stated.
The other explanations related to this note were not subject to material changes in relation to the disclosures in Note 2.1 to the individual and consolidated financial statements as of December 31, 2018.
2.1.1. Consolidated quarterly information
The accounting practices were uniformly adopted in all subsidiaries included in the consolidated quarterly information and the fiscal year of these companies is the same of the Company. See further details in Note 9.
The other explanations related to this note were not subject to material changes in relation to the disclosures in Note 2.1.1 to the individual and consolidated financial statements as of December 31, 2018.
40
(A free translation of the original report in Portuguese as published in Brazil)
Gafisa S.A.
Notes to the quarterly information
March 31, 2019
(Amounts in thousands of Brazilian Reais, except as otherwise stated)
2.2. Restatement of Quarterly Information as of March 31, 2018
In line with the adoption of CPC 47 – Revenue from Contracts with Customers on January 1, 2017, for comparability purposes, the information on the statements of Profit or Loss and Added Value as of March 31, 2018 are being presented on the same base of the current period and its retrospective effects are shown below. The impact on the statements of change in equity is the same one shown in the statement of profit or loss. The statements of cash flows were restated, without showing, however, the changes in the total amounts of operating, investing and financing activities.
| Company | Consolidated | ||||
Statement of profit or loss | Originally reported balances | Impact from applying the CPC 47 | Balances after applying the CPC 47 as of 03/31/2018 | Originally reported balances | Impact from applying the CPC 47 | Balances after applying the CPC 47 as of 03/31/2018 |
Net operating revenue | 203,076 | 20,552 | 223,628 | 213,397 | 20,552 | 233,949 |
Operating costs | (173,218) | (18,144) | (191,362) | (190,535) | (18,144) | (208,679) |
Operating (expenses) / income | (65,562) | - | (65,562) | (59,783) | - | (59,783) |
Financial income (expense) | (20,220) | - | (20,220) | (19,950) | - | (19,950) |
Income tax and social contribution | - | - | - | (232) | - | (232) |
Profit from (loss on) continued operations | (55,924) | 2,408 | (53,516) | (57,103) | 2,408 | (54,695) |
Non-controlling interests | - | - | - | (1,179) | - | (1,179) |
Net profit (loss) for the year | (55,924) | 2,408 | (53,516) | (55,924) | 2,408 | (53,516) |
|
|
|
|
|
|
|
Statement of value added |
|
|
|
|
|
|
Net value added produced by the entity | 51,782 | 2,408 | 54,190 | 46,515 | 2,408 | 48,923 |
Value added received as transfer | (8,619) | - | (8,619) | 4,726 | - | 4,726 |
Total value added to be distributed | 43,163 | 2,408 | 45,571 | 51,241 | 2,408 | 53,649 |
|
|
|
|
|
|
|
|
|
|
|
|
|
|
|
|
|
|
|
|
|
41
(A free translation of the original report in Portuguese as published in Brazil)
Gafisa S.A.
Notes to the quarterly information
March 31, 2019
(Amounts in thousands of Brazilian Reais, except as otherwise stated)
3. New standards, changes and interpretation of standards issued and not yet adopted
Beginning on January 1st, 2019, the following standard is in effect:
(i) The IFRS 16 – Leases (CPC 06 R2)
This standard replaces the previous lease standard, IAS 17/CPC 06 (R1) – Leases, and related interpretation, and establishes the principles for the recognition, measurement, presentation and disclosure of leases for both parties to a contract, that is, the customers (lessees) and providers (lessors). Lessees are required to recognize a lease liability reflecting the future lease payments and a “right-of-use assets” for practically all lease contracts, except certain short-term leases and contracts of low-value assets. For lessors, the criteria for recognition and measurement of leases in the financial statements are substantially maintained.
The impact of the first-time adoption on the opening balance as of January 1st, 2019 is as follows:
| Company | Consolidated | ||||
Originally reported balances | Impact from applying the CPC 06 R2 (Note 10) | Balances after applying the CPC 06 (R2) as of 01/01/2019 | Originally reported balances | Impact from applying the CPC 06 R2 (Note 10) | Balances after applying the CPC 06 (R2) as of 01/01/2019 | |
Statement of financial position | ||||||
Assets |
|
|
|
|
|
|
Total current assets | 1,367,727 | - | 1,367,727 | 1,683,371 | - | 1,683,371 |
Total non-current assets | 1,852,040 | 4,457 | 1,856,497 | 842,909 | 4,457 | 847,366 |
Total Assets | 3,219,767 | 4,457 | 3,224,224 | 2,526,280 | 4,457 | 2,530,737 |
|
|
|
|
|
|
|
Liabilities |
|
|
|
|
|
|
Total current liabilities | 1,819,565 | 1,118 | 1,820,683 | 1,039,015 | 1,118 | 1,040,133 |
Total non-current liabilities | 908,885 | 3,339 | 912,224 | 994,074 | 3,339 | 997,413 |
Total equity | 491,317 | - | 491,317 | 493,191 | - | 493,191 |
Total liabilities and equity | 3,219,767 | 4,457 | 3,224,224 | 2,526,280 | 4,457 | 2,530,737 |
|
|
|
|
|
|
|
The other explanations related to this note were not subject to material changes in relation to the disclosures in Note 3 to the individual and consolidated financial statements as of December 31, 2018.
42
(A free translation of the original report in Portuguese as published in Brazil)
Gafisa S.A.
Notes to the quarterly information
March 31, 2019
(Amounts in thousands of Brazilian Reais, except as otherwise stated)
4. Cash and cash equivalents and short-term investments
4.1. Cash and cash equivalents
| Company | Consolidated | ||
| 03/31/2019 | 12/31/2018 | 03/31/2019 | 12/31/2018 |
|
|
|
|
|
Cash and banks | 6,226 | 8,282 | 12,402 | 11,406 |
Government bonds (LFT) | - | 20,898 | - | 20,898 |
Total cash and cash equivalents (Note 20.i.d, 20.ii.a and 20.iii) | 6,226 | 29,180 | 12,402 | 32,304 |
4.2. Short-term investments
| Company | Consolidated |
| |
| 03/31/2019 | 12/31/2018 | 03/31/2019 | 12/31/2018 |
|
|
|
|
|
Fixed-income funds (a) | 22,147 | 33,186 | 22,252 | 33,245 |
Equity securities (d) | - | 14,101 | - | 14,101 |
Securities purchased under resale agreements (b) | 443 | 1,524 | 443 | 1,524 |
Bank certificates of deposit (c) | 8,998 | 47,950 | 9,599 | 49,025 |
Restricted credits | 16,458 | 6,066 | 18,372 | 6,961 |
|
|
|
|
|
Total short-term investments (Note 20.i.d, 20.ii.a and 20.iii) | 48,046 | 102,827 | 50,666 | 104,856 |
(a) Exclusive and open-end funds whose purpose is to invest in financial assets and/or fixed-income investment modalities that follow the fluctuations in interest rates in the interbank deposit market (CDI), by investing its funds mostly in investment fund shares and/or investment funds comprising investment fund shares.
(b) As of March 31, 2019 and December 31, 2018, the IOF-exempt securities purchased under resale agreement include earned interests of 73% of Interbank Deposit Certificates (CDI).
(c) As of March 31, 2019, Certificates of Bank Deposit (CDBs) include interest earned through the statement of financial position’s reporting date, ranging from 90% to 100.5% (from 90% to 101.2% in 2018) of Interbank Deposit Certificates (CDI).
(d) Equity securities are represented by investments in the shares of companies listed onNovo Mercadoof B3, and which make up the IBrX index. These transactions were settled in the period ended February 8, 2019, and reported a gain of R$2,846.
The other explanations related to this note were not subject to material changes in relation to the disclosures in Note 4.2 to the financial statements as of December 31, 2018.
5. Trade accounts receivable of development and services
| Company | Consolidated | ||
| 03/31/2019 | 12/31/2018 | 03/31/2019 | 12/31/2018 |
|
|
|
|
|
Real estate development and sales | 594,278 | 650,535 | 670,705 | 737,291 |
( - ) Allowance for expected credit losses | (19,300) | (18,159) | (19,300) | (18,159) |
( - ) Allowance for cancelled contracts | (63,167) | (82,847) | (63,167) | (82,847) |
( - ) Present value adjustments | (13,526) | (17,897) | (14,896) | (19,391) |
Services and construction and other receivables | 13,251 | 15,346 | 23,092 | 25,115 |
|
|
|
|
|
Total trade accounts receivable of development and services (Note 20.i.d and 20.ii.a) | 511,536 | 546,978 | 596,434 | 642,009 |
|
|
|
|
|
Current | 404,053 | 391,557 | 475,820 | 467,993 |
Non-current | 107,483 | 155,421 | 120,614 | 174,016 |
|
|
|
|
|
43
(A free translation of the original report in Portuguese as published in Brazil)
Gafisa S.A.
Notes to the quarterly information
March 31, 2019
(Amounts in thousands of Brazilian Reais, except as otherwise stated)
5. Trade accounts receivable of development and services --Continued
The current and non-current portions have the following maturities:
| Company | Consolidated | ||
Maturity | 03/31/2019 | 12/31/2018 | 03/31/2019 | 12/31/2018 |
|
|
|
|
|
Past due: |
|
|
|
|
Up to 90 days | 63,198 | 46,777 | 72,255 | 64,177 |
From 91 to 180 days | 15,897 | 20,716 | 22,893 | 21,832 |
Over 180 days | 77,461 | 71,384 | 95,744 | 90,818 |
| 156,556 | 138,877 | 190,892 | 176,827 |
|
|
|
|
|
Maturity: |
|
|
|
|
2019 | 216,049 | 357,216 | 233,436 | 396,266 |
2020 | 175,982 | 107,945 | 199,890 | 118,400 |
2021 | 53,139 | 55,922 | 63,099 | 64,392 |
2022 | 1,536 | 1,568 | 1,718 | 1,727 |
2023 onwards | 4,267 | 4,353 | 4,762 | 4,794 |
| 450,973 | 527,004 | 502,905 | 585,579 |
|
|
|
|
|
( - ) Present value adjustment | (13,526) | (17,897) | (14,896) | (19,391) |
( - ) Allowance for expected credit losses and cancelled contracts | (82,467) | (101,006) | (82,467) | (101,006) |
|
|
|
|
|
| 511,536 | 546,978 | 596,434 | 642,009 |
The change in the allowance for doubtful items for the period ended March 31, 2019 is as follows:
|
| |
| Receivables | Properties for sale (Note 6) |
|
|
|
Balance at December 31, 2018 | (101,006) | 83,842 |
Additions (Note 22) | (1,328) | - |
Write-offs / Reversals (Note 22) | 19,867 | (20,052) |
Balance at March 31, 2019 | (82,467) | 63,790 |
The other explanations related to this note were not subject to material changes in relation to the disclosures in Note 5 to the financial statements as of December 31, 2018.
44
(A free translation of the original report in Portuguese as published in Brazil)
Gafisa S.A.
Notes to the quarterly information
March 31, 2019
(Amounts in thousands of Brazilian Reais, except as otherwise stated)
6. Properties for sale
| Company | Consolidated | ||
| 03/31/2019 | 12/31/2018 | 03/31/2019 | 12/31/2018 |
|
|
|
|
|
Land | 332,045 | 293,626 | 442,132 | 403,524 |
( - ) Provision for loss on realization of land | (96,636) | (96,972) | (96,636) | (96,972) |
( - ) Present value adjustment | (7,479) | (14,416) | (7,588) | (14,570) |
Property under construction(Note 29) | 285,280 | 327,980 | 361,435 | 403,732 |
Completed units | 298,431 | 316,973 | 351,678 | 377,477 |
( - ) Provision for loss on realization of properties under construction and completed units | (65,600) | (66,106) | (67,125) | (67,632) |
Allowance for cancelled contracts | 63,790 | 83,842 | 63,790 | 83,842 |
|
|
|
|
|
Total properties for sale | 809,831 | 844,972 | 1,047,686 | 1,089,401 |
|
|
|
|
|
Current portion | 640,757 | 705,123 | 819,458 | 890,460 |
Non-current portion | 169,074 | 139,804 | 228,228 | 198,941 |
In the period ended March 31, 2019, thechange in the provision for loss on realization is summarized as follows:
| Company | Consolidated |
Balance at December 31, 2018 | (163,078) | (164,603) |
Write-offs (a) | 841 | 841 |
|
|
|
Balance at March 31, 2019 | (162,236) | (163,761) |
(a) The amount of write-offs refers to the respective units sold in the period.
The amount of properties for sale offered as guarantee for financial liabilities is described in Note 12.
The other explanations related to this note were not subject to material changes in relation to the disclosures in Note 6 to the financial statements as of December 31, 2018.
7. Other assets
| Company | Consolidated | ||
| 03/31/2019 | 12/31/2018 | 03/31/2019 | 12/31/2018 |
|
|
|
|
|
Advances to suppliers | 8,177 | 6,735 | 8,877 | 7,424 |
Recoverable taxes (IRRF, PIS, COFINS, among other) | 15,569 | 17,567 | 20,990 | 23,260 |
Judicial deposit (Note 16.a) | 113,634 | 103,701 | 116,733 | 106,793 |
Total other assets | 137,380 | 128,003 | 146,600 | 137,477 |
|
|
|
|
|
Current portion | 45,359 | 35,396 | 52,093 | 42,283 |
Non-current portion | 92,021 | 92,607 | 94,507 | 95,194 |
45
(A free translation of the original report in Portuguese as published in Brazil)
Gafisa S.A.
Notes to the quarterly information
March 31, 2019
(Amounts in thousands of Brazilian Reais, except as otherwise stated)
8. Non-current assets held for sale
8.1Land available for sale
The changes in land available for sale are summarized as follows:
| Company |
| Consolidated | ||||
| Cost | Provision for impairment | Net balance |
| Cost | Provision for impairment | Net balance |
|
|
|
|
|
|
|
|
Balance at December 31, 2018 | 146,182 | (71,340) | 74,842 |
| 149,488 | (71,340) | 78,148 |
Reversal/Write-offs (a) | (49,833) | 10,367 | (39,466) |
| (49,833) | 10,367 | (39,466) |
Balance at March 31, 2019 | 96,349 | (60,973) | 35,376 |
| 99,655 | (60,973) | 38,682 |
(a) The amount of write-offs over the period mainly refers to the cancelled contract of land in January 2019,located in the city of Rio de Janeiro, state of Rio de Janeiro.
46
(A free translation of the original report in Portuguese as published in Brazil)
Gafisa S.A.
Notes to the quarterly information
March 31, 2019
(Amounts in thousands of Brazilian Reais, except as otherwise stated)
9. Investments in ownership interests
(i) Information on subsidiaries, associates and jointly-controlled investees
|
|
|
|
|
|
|
|
|
|
| Company | Consolidated | ||||||
|
| Interest in capital - % | Total assets | Total liabilities | Equity and advance for future capital increase | Profit (loss) for the year | Investments | Income from equity method investments | Investments | Income from equity method investments | ||||||||
Subsidiaries: |
| 03/31/2019 | 12/31/2018 | 03/31/2019 | 03/31/2019 | 03/31/2019 | 12/31/2018 |
| 03/31/2019 | 03/31/2018 | 03/31/2019 | 12/31/2018 | 03/31/2019 | 03/31/2018 | 03/31/2019 | 12/31/2018 | 03/31/2019 | 03/31/2018 |
|
|
|
|
|
|
|
|
|
|
|
|
|
|
|
|
|
|
|
Gafisa SPE- 130 Emp. Imob. Ltda. | - | 100% | 100% | 76,449 | 9,321 | 67,128 | 67,400 |
| (272) | (1,160) | 67,128 | 67,400 | (272) | (1,160) | - | - | - | - |
Gafisa SPE-111 Emp. Imob. Ltda. | - | 100% | 100% | 64,644 | 3,279 | 61,366 | 61,520 |
| (155) | (182) | 61,366 | 61,520 | (155) | (182) | - | - | - | - |
Maraville Gafisa SPE Emp. Imob. Ltda. | - | 100% | 100% | 58,136 | 1,690 | 56,447 | 56,156 |
| 291 | (17) | 56,447 | 56,156 | 291 | (17) | - | - | - | - |
Gafisa SPE-89 Emp. Imob. Ltda. | - | 100% | 100% | 109,169 | 58,142 | 51,027 | 51,031 |
| (3) | (184) | 51,027 | 51,031 | (3) | (184) | - | - | - | - |
Gafisa SPE - 104 Emp. Imob. Ltda. | - | 100% | 100% | 104,051 | 55,597 | 48,453 | 48,467 |
| (14) | 2,027 | 48,453 | 48,467 | (14) | 2,027 | - | - | - | - |
Gafisa SPE-51 Emp. Imob. Ltda. | - | 100% | 100% | 48,471 | 2,485 | 45,986 | 45,997 |
| (12) | (24) | 45,986 | 45,997 | (12) | (24) | - | - | - | - |
Gafisa SPE - 127 Emp. Imob. Ltda. | - | 100% | 100% | 46,298 | 399 | 45,899 | 45,905 |
| (6) | (185) | 45,899 | 45,905 | (6) | (185) | - | - | - | - |
Gafisa SPE - 72 Emp. Imob. Ltda. | - | 100% | 100% | 44,158 | 465 | 43,693 | 43,703 |
| (10) | (74) | 43,693 | 43,703 | (10) | (74) | - | - | - | - |
Gafisa SPE 121 Emp. Imob. Ltda. | - | 100% | 100% | 45,535 | 1,980 | 43,555 | 43,612 |
| (58) | (1) | 43,555 | 43,612 | (58) | (1) | - | - | - | - |
Gafisa SPE-122 Emp. Imob. Ltda. | - | 100% | 100% | 46,515 | 3,614 | 42,901 | 42,843 |
| 58 | (5,721) | 42,901 | 42,843 | 58 | (5,721) | - | - | - | - |
Gafisa SPE-110 Emp. Imob. Ltda. | - | 100% | 100% | 40,707 | 775 | 39,932 | 39,933 |
| (1) | (186) | 39,932 | 39,933 | (1) | (186) | - | - | - | - |
Gafisa SPE - 120 Emp. Imob. Ltda. | - | 100% | 100% | 37,939 | 493 | 37,447 | 37,447 |
| - | (41) | 37,447 | 37,447 | - | (41) | - | - | - | - |
Gafisa SPE-107 Emp. Imob. Ltda. | - | 100% | 100% | 29,526 | 5 | 29,520 | 29,520 |
| - | (1) | 29,520 | 29,520 | - | (1) | - | - | - | - |
SPE Parque Ecoville Emp. Imob. Ltda. | - | 100% | 100% | 38,114 | 9,449 | 28,665 | 29,019 |
| (354) | (377) | 28,665 | 29,019 | (354) | (377) | - | - | - | - |
Gafisa SPE-137 Emp. Imob. Ltda. | - | 100% | 100% | 28,287 | - | 28,287 | 28,287 |
| - | - | 28,287 | 28,287 | - | - | - | - | - | - |
Gafisa SPE- 129 Emp. Imob. Ltda. | - | 100% | 100% | 27,461 | 622 | 26,839 | 26,855 |
| (16) | 42 | 26,839 | 26,855 | (16) | 42 | - | - | - | - |
Gafisa SPE-41 Emp. Imob. Ltda. | - | 100% | 100% | 26,612 | 8 | 26,604 | 26,605 |
| (1) | 9 | 26,604 | 26,605 | (1) | 9 | - | - | - | - |
Gafisa SPE- 134 Emp. Imob. Ltda. | - | 100% | 100% | 26,072 | 1,556 | 24,515 | 25,169 |
| (653) | (966) | 24,515 | 25,169 | (653) | (966) | - | - | - | - |
Gafisa SPE- 132 Emp. Imob. Ltda. | - | 100% | 100% | 38,765 | 14,670 | 24,095 | 24,095 |
| - | (88) | 24,095 | 24,095 | - | (88) | - | - | - | - |
Verdes Pracas Incorp. Imobi. SPE Ltda. | - | 100% | 100% | 25,650 | 2,982 | 22,668 | 22,686 |
| (18) | (1) | 22,668 | 22,686 | (18) | (1) | - | - | - | - |
Gafisa SPE - 112 Emp. Imob. Ltda. | - | 100% | 100% | 21,923 | 94 | 21,828 | 21,828 |
| - | (1) | 21,828 | 21,828 | - | (1) | - | - | - | - |
Gafisa SPE - 126 Emp. Imob. Ltda. | - | 100% | 100% | 19,508 | 3 | 19,506 | 19,506 |
| (1) | (19) | 19,506 | 19,506 | (1) | (19) | - | - | - | - |
Gafisa SPE 46 Emp. Imob. Ltda. | - | 100% | 100% | 17,781 | 149 | 17,632 | 17,648 |
| (17) | 30 | 17,632 | 17,648 | (17) | 30 | - | - | - | - |
Edsp 88 Participações S.A. | - | 100% | 100% | 29,187 | 12,682 | 16,506 | 16,512 |
| (6) | 39 | 16,506 | 16,512 | (6) | 39 | - | - | - | - |
Gafisa SPE 30 Emp. Imob. Ltda. | - | 100% | 100% | 16,226 | 1 | 16,225 | 16,228 |
| (3) | 1 | 16,225 | 16,228 | (3) | 1 | - | - | - | - |
Gafisa SPE-92 Emp. Imob. Ltda. | - | 100% | 100% | 15,805 | 122 | 15,683 | 15,694 |
| (11) | (25) | 15,683 | 15,694 | (11) | (25) | - | - | - | - |
Gafisa SPE-106 Emp. Imob. Ltda. | - | 100% | 100% | 15,596 | 5 | 15,591 | 15,591 |
| - | (12) | 15,591 | 15,591 | - | (12) | - | - | - | - |
Manhattan Square Em. Im. Res. 02 Ltda. | - | 100% | 100% | 16,894 | 1,248 | 15,646 | 15,456 |
| 190 | - | 15,646 | 15,456 | 190 | - | - | - | - | - |
Gafisa SPE 33 Emp. Imob. Ltda. | - | 100% | 100% | 196,400 | 183,344 | 13,056 | 13,014 |
| 42 | 349 | 13,056 | 13,014 | 42 | 349 | - | - | - | - |
Gafisa SPE 71 Emp. Imob. Ltda. | - | 100% | 100% | 12,665 | 178 | 12,487 | 12,500 |
| (13) | (5) | 12,487 | 12,500 | (13) | (5) | - | - | - | - |
Gafisa SPE 65 Emp. Imob. Ltda. | - | 100% | 100% | 11,372 | 286 | 11,085 | 11,091 |
| (6) | 9 | 11,085 | 11,091 | (6) | 9 | - | - | - | - |
Gafisa SPE 36 Emp. Imob. Ltda. | - | 100% | 100% | 9,138 | 294 | 8,844 | 8,845 |
| - | (14) | 8,844 | 8,845 | - | (14) | - | - | - | - |
Gafisa SPE-81 Emp. Imob. Ltda. | - | 100% | 100% | 9,187 | 836 | 8,350 | 8,360 |
| (10) | 6 | 8,350 | 8,360 | (10) | 6 | - | - | - | - |
Manhattan Square Em. Im. Com. 02 Ltda. | - | 100% | 100% | 8,854 | 601 | 8,254 | 8,254 |
| - | - | 8,254 | 8,254 | - | - | - | - | - | - |
Gafisa Vendas Interm. Imobiliaria Ltda. | - | 100% | 100% | 10,705 | 4,211 | 6,494 | 8,049 |
| (1,555) | (3,531) | 6,494 | 8,049 | (1,555) | (3,531) | - | - | - | - |
Gafisa SPE-38 Emp. Imob. Ltda. | - | 100% | 100% | 7,946 | - | 7,946 | 7,946 |
| - | (1) | 7,946 | 7,946 | - | (1) | - | - | - | - |
Gafisa SPE-109 Emp. Imob. Ltda. | - | 100% | 100% | 7,205 | 47 | 7,158 | 7,162 |
| (3) | - | 7,158 | 7,162 | (3) | - | - | - | - | - |
Gafisa SPE-37 Emp. Imob. Ltda. | - | 100% | 100% | 7,120 | 704 | 6,416 | 6,559 |
| (143) | (10) | 6,416 | 6,559 | (143) | (10) | - | - | - | - |
Gafisa SPE-90 Emp. Imob. Ltda. | - | 100% | 100% | 8,205 | 1,779 | 6,426 | 6,426 |
| - | (44) | 6,426 | 6,426 | - | (44) | - | - | - | - |
OCPC01 Adjustment – capitalized interests | (a) |
|
| - | - | - | - |
| - | - | 21,628 | 22,005 | - | 388 | - | - | - | - |
Other (*) |
|
|
| 124,286 | 80,210 | 44,076 | 47,918 |
| (1,592) | (3,173) | 44,063 | 46,040 | (922) | (1,983) | - | - | - | - |
Subtotal Subsidiaries |
|
|
| 1,528,562 | 454,326 | 1,074,236 | 1,080,837 |
| (4,352) | (13,531) | 1,095,851 | 1,100,964 | (3,682) | (11,953) | - | - | - | - |
47
(A free translation of the original report in Portuguese as published in Brazil)
Gafisa S.A.
Notes to the quarterly information
March 31, 2019
(Amounts in thousands of Brazilian Reais, except as otherwise stated)
9. Investments in ownership interests --Continued
(i) Information on subsidiaries, associates and jointly-controlled investees --Continued
|
|
|
|
|
|
|
|
|
|
| Company | Consolidated | ||||||
|
| Interest in capital - % | Total assets | Total liabilities | Equity and advance for future capital increase | Profit (loss) for the year | Investments | Income from equity method investments | Investments | Income from equity method investments | ||||||||
Jointly-controlled investees: |
| 03/31/2019 | 12/31/2018 | 03/31/2019 | 03/31/2019 | 03/31/2019 | 12/31/2018 |
| 03/31/2019 | 03/31/2018 | 03/31/2019 | 12/31/2018 | 03/31/2019 | 03/31/2018 | 03/31/2019 | 12/31/2018 | 03/31/2019 | 03/31/2018 |
|
|
|
|
|
|
|
|
|
|
|
|
|
|
|
|
|
|
|
Gafisa E Ivo Rizzo SPE-47 Emp.Imob. Ltda. | - | 80% | 80% | 33,290 | 948 | 32,342 | 32,340 |
| 3 | 3 | 25,874 | 25,872 | 2 | 2 | 25,874 | 25,872 | 2 | 2 |
Parque Arvores Empr. Imob. Ltda. | (b) | 50% | 50% | 35,086 | 3,826 | 31,260 | 31,153 |
| 417 | 1,356 | 15,630 | 15,577 | 53 | 569 | 15,630 | 15,577 | 53 | 569 |
Sitio Jatiuca Emp. Imob. SPE Ltda. | - | 50% | 50% | 32,549 | 2,998 | 29,552 | 29,413 |
| 138 | 404 | 14,776 | 14,707 | 69 | 202 | 14,776 | 14,707 | 69 | 202 |
Varandas Grand Park Emp. Im. Spe Ltda. | (b) | 50% | 50% | 49,732 | 23,609 | 26,124 | 24,989 |
| 270 | 98 | 13,062 | 12,495 | 567 | 157 | 13,062 | 12,495 | 567 | 157 |
Gafisa SPE-116 Emp. Imob. Ltda. | - | 50% | 50% | 32,445 | 8,976 | 23,469 | 22,537 |
| 932 | (802) | 11,735 | 11,268 | 466 | (401) | 11,735 | 11,268 | 466 | (401) |
FIT 13 SPE Emp. Imobiliários Ltda. | - | 50% | 50% | 21,951 | 2,214 | 19,738 | 19,706 |
| 30 | 71 | 9,869 | 9,853 | 16 | 35 | 9,869 | 9,853 | 16 | 35 |
Atins Emp. Imob.s Ltda. | - | 50% | 50% | 25,291 | 5,956 | 19,335 | 17,729 |
| 1,607 | 422 | 9,668 | 8,864 | 804 | 211 | 9,668 | 8,864 | 804 | 211 |
Performance Gafisa General Severiano Ltda. | - | 50% | 50% | 11,788 | 32 | 11,755 | 11,701 |
| 57 | 15 | 5,878 | 5,850 | 28 | 7 | 5,878 | 5,850 | 28 | 7 |
Other (*) | (b) | 50% | 50% | 123,788 | 81,307 | 42,479 | 56,340 |
| (2,203) | (589) | 29,181 | 30,223 | (1,042) | (843) | 39,389 | 40,450 | (1,050) | (801) |
Subtotal Jointly-controlled investees |
|
|
| 365,920 | 129,866 | 236,054 | 245,908 |
| 1,251 | 978 | 135,673 | 134,709 | 963 | (61) | 145,881 | 144,936 | 955 | (19) |
|
|
|
|
|
|
|
|
|
|
|
|
|
|
|
|
|
|
|
Associates: |
|
|
|
|
|
|
|
|
|
|
|
|
|
|
|
|
|
|
Alphaville Urbanismo S.A. | (e) | 30% | 30% | 1,798,935 | 2,909,322 | (1,110,388) | (937,369) |
| (184,998) | (92,382) | - | - | - | - | - | - | - | - |
Citta Ville SPE Emp. Imob. Ltda. | - | 50% | 50% | 5,853 | 2,901 | 2,952 | 14,465 |
| 249 | (246) | 1,475 | 7,233 | 125 | (123) | 1,475 | 7,233 | 125 | (123) |
Other (*) |
|
|
| 1,115 | 38 | 1,077 | 1,131 |
| (55) | 6 | 483 | 510 | (25) | - | 1,212 | 1,236 | (24) | 2 |
Subtotal Associates |
|
|
| 1,805,903 | 2,912,261 | (1,106,359) | (921,773) |
| (184,804) | (92,622) | 1,958 | 7,743 | 100 | (123) | 2,687 | 8,469 | 101 | (121) |
|
|
|
|
|
|
|
|
|
|
|
|
|
|
|
|
|
|
|
Subtotal subsidiaries, Jointly-controlled investees and associates | 3,700,385 | 3,496,453 | 203,931 | 404,972 |
| (187,905) | (105,175) | 1,233,482 | 1,243,416 | (2,619) | (12,137) | 148,568 | 153,405 | 1,056 | (140) | |||
|
|
|
|
|
|
|
|
|
|
|
|
|
|
|
|
|
|
|
Goodwill based on inventory surplus | - |
|
|
|
|
|
|
|
|
| 3,000 | 3,000 |
|
| - | - |
|
|
Goodwill from remeasurement of investment in associate | (c) |
|
|
|
|
|
|
|
|
| 161,100 | 161,100 |
|
| 161,100 | 161,100 |
|
|
|
|
|
|
|
|
|
|
|
|
|
|
|
|
|
|
|
|
|
Totalinvestments |
|
|
|
|
|
|
|
|
|
| 1,397,582 | 1,407,516 | (2,619) | (12,137) | 309,668 | 314,505 | 1,056 | (140) |
(*)Includes companies with investment balances below R$ 5,000. |
|
|
|
|
|
|
|
|
|
|
|
|
|
| ||||
|
|
|
|
|
|
|
|
|
| Company | Consolidated | ||||||
| Interest in capital - % | Total assets | Total liabilities | Equity and advance for future capital increase | Profit (loss) for the period | Investments | Income from equity method investments | Investments | Income from equity method investments | ||||||||
Provision for net capital deficiency (d): | 03/31/2019 | 12/31/2018 | 03/31/2019 | 03/31/2019 | 03/31/2019 | 12/31/2018 |
| 03/31/2019 | 03/31/2018 | 03/31/2019 | 12/31/2018 | 03/31/2019 | 03/31/2018 | 03/31/2019 | 12/31/2018 | 03/31/2019 | 03/31/2018 |
|
|
|
|
|
|
|
|
|
|
|
|
|
|
|
|
|
|
Reserva das Palmeiras Incorp. SPE Ltda. | 100% | 100% | (624) | 2,986 | (3,610) | (3,598) |
| (12) | - | (3,610) | (3,598) | (12) | (4) | - | - | - | - |
Manhattan Square Em. Im. Res. 01 Ltda. | 50% | 50% | 2,936 | 9,288 | (6,352) | (4,225) |
| (97) | (102) | (3,176) | (2,113) | (1,064) | (225) | (3,176) | (2,113) | (1,064) | (225) |
Manhattan Square Em. Im. Com. 01 Ltda. | 50% | 50% | 3,645 | 10,009 | (6,364) | (2,247) |
| (100) | (91) | (3,182) | (1,124) | (2,058) | (267) | (3,182) | (1,124) | (2,058) | (267) |
Gafisa SPE 69 Emp. Imob. Ltda. | 100% | 100% | 1 | 1,197 | (1,196) | (1,013) |
| (183) | (132) | (1,196) | (1,013) | (183) | (132) | - | - | - | - |
Other (*) |
|
| 612 | 1,791 | (1,179) | (1,219) |
| 45 | (1,093) | (531) | (575) | (369) | (1,083) | (327) | (298) | 384 | 14 |
Total provision for net capital deficiency |
|
| 6,570 | 25,271 | (18,701) | (12,302) |
| (347) | (1,418) | (11,695) | (8,423) | (3,686) | (1,711) | (6,685) | (3,535) | (2,738) | (478) |
|
|
|
|
|
|
|
|
|
|
|
|
|
|
|
|
|
|
TotalIncome from equity method investments |
|
|
|
|
|
|
|
|
|
|
| (6,305) | (13,848) |
|
| (1,682) | (618) |
(*)Includes companies with investment balances below R$ 5,000.
48
(A free translation of the original report in Portuguese as published in Brazil)
Gafisa S.A.
Notes to the quarterly information
March 31, 2019
(Amounts in thousands of Brazilian Reais, except as otherwise stated)
9. Investments in ownership interests --Continued
(a) Financial charges of the Company not recorded in the profit or loss of subsidiaries, as required by paragraph 6 of OCPC01.
(b) The Company recorded expense of R$2,295 in Income from equity method investments for the period ended March 31, 2019 related to the recognition, by jointly-controlled entities, of prior year adjustments, in accordance with the ICPC09 (R2) - Individual, Separate and Consolidated Financial Statements and the Equity Method of Accounting.
(c) Amount related to the goodwill arising from the remeasurement of the portion of the remaining investment of 30% in the associate AUSA, in the amount of R$161,100.
(d) The provision for net capital deficiency is recorded in the heading “Other payables” (Note 15).
(e) In view of the net capital deficiency of AUSA, and in line with CPC 18 (R2) – Investment in Associates, Subsidiaries and Joint Ventures, the Company discontinued the recognition of its interest in future losses after reducing to zero the carrying amount of the 30% interest
(ii) Information on significant investees
| Significant investee: |
| Other investees: | ||||||
| Alphaville Urbanismo S.A. |
| Subsidiaries | Jointly-controlled investees | Associates | ||||
| 03/31/2019 | 12/31/2018 |
| 03/31/2019 | 12/31/2018 | 03/31/2019 | 12/31/2018 | 03/31/2019 | 12/31/2018 |
|
|
|
|
|
|
|
|
|
|
Cash and cash equivalents | Not available | 11,282 |
| 8,210 | 989 | 30,518 | 33,193 | 1,951 | 1,511 |
Current assets | Not available | 974,853 |
| 1,259,411 | 1,278,206 | 316,606 | 322,413 | 6,913 | 18,253 |
Non-current assets | Not available | 908,617 |
| 269,151 | 275,032 | 49,314 | 47,892 | 55 | 43 |
Current liabilities | Not available | 594,844 |
| 426,650 | 433,047 | 105,540 | 95,864 | 2,017 | 1,782 |
Non-current liabilities | Not available | 2,255,091 |
| 27,676 | 39,357 | 24,326 | 28,533 | 922 | 915 |
|
|
|
|
|
|
|
|
|
|
| 03/31/2019 | 03/31/2018 |
| 03/31/2019 | 03/31/2018 | 03/31/2019 | 03/31/2018 | 03/31/2019 | 03/31/2018 |
Net revenue | (22,604) | 86,081 |
| 16,939 | 16,116 | 15,621 | 9,541 | 216 | 10 |
Operating costs | Not available | Not available |
| (14,962) | (15,147) | (12,639) | (6,191) | (25) | (8) |
Depreciation and Amortization | Not available | Not available |
| (370) | (380) | (21) | (2) | - | - |
Financial income (expenses) | Not available | Not available |
| (362) | (2,093) | 384 | (1,346) | 142 | - |
Income tax and social contribution | Not available | Not available |
| (398) | (269) | (411) | (220) | (55) | - |
Profit (loss) from Continued Operations | (184,998) | (92,382) |
| (4,352) | (13,531) | 1,251 | 978 | 194 | (240) |
(iii) Change in investments
|
|
|
|
|
| Company | Consolidated |
|
|
|
|
Balance at December 31, 2018 |
| 1,407,516 | 314,505 |
Income from equity method investments |
| (2,619) | 1,056 |
Capital contribution (decrease) |
| (5,861) | (5,882) |
Transfer of investments with net capital deficiency |
| 12 | - |
Dividends receivable |
| (1,040) | - |
Other investments |
| (426) | (11) |
Balance at March 31, 2019 |
| 1,397,582 | 309,668 |
The other explanations related to this note were not subject to material changes in relation to the disclosures in Note 9 to the financial statements as of December 31, 2018.
49
(A free translation of the original report in Portuguese as published in Brazil)
Gafisa S.A.
Notes to the quarterly information
March 31, 2019
(Amounts in thousands of Brazilian Reais, except as otherwise stated)
10. Property and equipment
During the period ended March 31, 2019, the changes in property and equipment items are summarized below.
|
|
| Company |
| Consolidated |
| ||||||
Type | 12/31/2018 | First-time adoption CPC 06 (R2) (Note 3) | Addition | Write-off | 100% depreciated items | 03/31/2019 | 12/31/2018 | First-time adoption CPC 06 (R2) (Note 3) | Addition | Write-off | 100% depreciated items | 03/31/2019 |
Cost |
|
|
|
|
|
|
|
|
|
|
|
|
Hardware | 10,108 | - | 318 | - | - | 10,426 | 10,297 | - | 318 | - | - | 10,615 |
Leasehold improvements and installations | 785 | - | - | (266) | - | 519 | 834 | - | - | (266) | (63) | 505 |
Furniture and fixtures | 637 | - | - | - | - | 637 | 764 | - | - | - | - | 764 |
Machinery and equipment | 2,640 | - | - | - | (79) | 2,561 | 2,640 | - | - | - | (79) | 2,561 |
Right-of-use assets | - | 4,457 | - | - | - | 4,457 | 4,457 | 4,457 | - | - | - | 4,457 |
Sales stands | 11,001 | - | 142 | (1,727) | - | 9,416 | 16,541 | - | 144 | (1,727) | - | 14,958 |
| 25,171 | 4,457 | 460 | (1,993) | (79) | 28,016 | 31,076 | 4,457 | 462 | (1,993) | (142) | 33,860 |
|
|
|
|
|
|
|
|
|
|
| ||
Accumulated depreciation |
|
|
|
|
|
|
|
|
|
|
| |
Hardware | (2,100) | - | (832) | - | - | (2,932) | (2,129) | - | (845) | - | - | (2,974) |
Leasehold improvements and installations | (427) | - | (89) | - | - | (516) | (436) | - | (94) | - | 63 | (467) |
Furniture and fixtures | (447) | - | (16) | - | - | (463) | (563) | - | (16) | - | - | (579) |
Machinery and equipment | (2,136) | - | (66) | - | 79 | (2,123) | (2,136) | - | (66) | - | 79 | (2,123) |
Right-of-use assets | - | (347) | - | - | - | (347) | - | (347) | (347) | - | - | (347) |
Sales stands | (2,777) | - | (1,419) | 1,696 | - | (2,500) | (5,739) | - | (1,712) | 1,696 | - | (5,755) |
| (7,887) | (347) | (2,769) | 1,696 | 79 | (8,881) | (11,003) | (347) | (3,080) | 1,696 | 142 | (12,245) |
|
|
|
|
|
|
|
|
|
|
|
|
|
Total property and equipment | 17,284 | 4,110 | (2,309) | (297) | - | 19,135 | 20,073 | 4,110 | (2,618) | (297) | - | 21,615 |
The other explanations related to this note were not subject to material changes in relation to the disclosures in Note 10 to the financial statements as of December 31, 2018.
11. Intangible assets
During the period ended March 31, 2019, the changes in intangible asset items are summarized below.
| Company | |||||
| 12/31/2018 |
|
|
|
| 03/31/2019 |
| Balance | Addition | Write-down | Amortization | 100% amortized items | Balance |
|
|
|
|
|
|
|
Software – Cost | 24,885 | 178 | - | - | (5,305) | 19,758 |
Software – Depreciation | (13,886) |
|
| (1,233) | 5,305 | (9,814) |
Other | - |
|
|
|
|
|
Total intangible assets | 10,999 | 178 | - | (1,233) | - | 9,944 |
|
|
|
|
| ||
| Consolidated | |||||
| 12/31/2018 |
|
|
|
| 03/31/2019 |
| Balance | Addition | Write-down | Amortization | 100% amortized items | Balance |
|
|
|
|
|
|
|
Software – Cost | 26,285 | 178 | - | - | (5,305) | 21,158 |
Software – Depreciation | (14,515) | - |
| (1,293) | 5,305 | (10,503) |
Other | - |
|
|
|
|
|
Total intangible assets | 11,770 | 178 | - | (1,293) | - | 10,655 |
|
|
|
| |||
The other explanations related to this note were not subject to material changes in relation to the disclosures in Note 11 to the financial statements as of December 31, 2018.
12.Loans and financing
|
|
| Company | Consolidated | ||
Type | Maturity | Annual interest rate | 03/31/2019 | 12/31/2018 | 03/31/2019 | 12/31/2018 |
|
|
|
|
|
|
|
National Housing System - SFH /SFI (i) | April 2019 to July 2021 | 8.30% to 14.30% + TR 12.87% and 143% of CDI | 453,957 | 464,992 | 497,307 | 528,140 |
Certificate of Bank Credit - CCB (ii)
| January 2021 to August 2021
|
135% of CDI 2.5%/ 3%/ 3.70%/ 4.25%+CDI
| 43,623
| 95,607
| 43,623
| 95,607
|
|
|
|
|
|
| |
Total loans and financing(Note 20.i.d, 20.ii.a and 20.iii) | 497,580 | 560,599 | 540,930 | 623,747 | ||
|
|
|
|
|
|
|
Current |
|
| 250,004 | 180,702 | 257,028 | 213,395 |
Current – reclassification for breach of covenant |
| 32,527 | 72,217 | 32,527 | 72,217 | |
Current portion |
|
| 282,531 | 252,919 | 307,555 | 285,612 |
Non-current portion |
|
| 215,049 | 307,680 | 233,375 | 338,135 |
(i) In the period endedMarch 31, 2019, the Company made payments in the total amount ofR$45,163, of which R$43,512 related to principal and R$1,651 related to the interest payable.
50
(A free translation of the original report in Portuguese as published in Brazil)
Gafisa S.A.
Notes to the quarterly information
March 31, 2019
(Amounts in thousands of Brazilian Reais, except as otherwise stated)
The current and non-current loans have the following maturities:
| Company | Consolidated | ||
Maturity | 03/31/2019 | 12/31/2018 | 03/31/2019 | 12/31/2018 |
|
|
|
|
|
2019 | 216,350 | 252,919 | 231,235 | 285,612 |
2020 | 164,743 | 186,163 | 193,208 | 216,618 |
2021 | 116,487 | 121,517 | 116,487 | 121,517 |
497,580 | 560,599 | 540,930 | 623,747 | |
The Company and its subsidiaries have restrictive covenants under certain loans and financing that limit their ability to perform certain actions, such as issuing debt, and that could require the acceleration or refinancing of loans if the Company does not fulfill certain restrictive convents. In the period ended March 31, 2019, the amount of R$32,527 was reclassified into short term in view of the need to re-establish guarantees with the financial institution. The Company analyzed other debt contracts and did not identify any impact on the cross restrictive covenants in relation to the aforementioned breach.
51
(A free translation of the original report in Portuguese as published in Brazil)
Gafisa S.A.
Notes to the quarterly information
March 31, 2019
(Amounts in thousands of Brazilian Reais, except as otherwise stated)
The ratios and minimum and maximum amounts required under restrictive covenants for loan and financing transactions are as follows:
| 03/31/2019 | 12/31/2018 |
|
|
|
|
|
|
Loans and financing |
|
|
Net debt cannot exceed 100% of equity plus noncontrolling interests (a) | Settled debt | 152.53% |
Total accounts receivable(1) plus inventory required to be below zero or 2.0 times over venture debt(2) | 4.50 times | 4.51 times |
Total accounts receivable(1) plus inventory of completed units required to be below zero or 2.0 times over net debt less venture debt(2) | 6.52 times | 7.09 times |
Total debt, less venture debt, less cash and cash equivalents and short-term investments(3), cannot exceed 75% of equity plus non-controlling interests | 51.12% | 45.44% |
Total receivables(1) plus unappropriated income plus total inventories of completed units required to be 1.5 time over the net debt plus payable for purchase of properties plus unappropriated cost | 1.80 time | 1.81 time |
Total accounts receivable(1)plus total inventories required to be below zero or 2.0 times over net debt | 3.08 times | 3.17 times |
|
|
|
(1) Total receivables, whenever mentioned, refers to the amount reflected in the Statement of Financial Position plus the amount not shown in the Statement of Financial Position.
(2) Venture debt and secured guarantee debt refer to SFH debts, defined as the sum of all disbursed borrowing contracts which funds were provided by the SFH.
(3) Cash and cash equivalents and short-term investments refer to cash and cash equivalents and marketable securities.
(a) For the year ended December 31, 2018, the covenant limit is 100%, according to the waiver obtained from the creditor.
12.Loans and financing --Continued
The following table shows the summary of financial expenses and charges and the capitalized portion in the line item properties for sale.
| Company | Consolidated | ||
| 03/31/2019 | 03/31/2018 | 03/31/2019 | 03/31/2018 |
|
|
|
|
|
Total financial charges for the year | 17,511 | 25,195 | 18,759 | 29,451 |
Capitalized financial charges (Note 30) | (5,559) | (5,549) | (8,658) | (10,865) |
Subtotal (Note 24) | 11,952 | 19,646 | 10,101 | 18,586 |
|
|
|
|
|
Financial charges included in “Properties for sale”: |
|
|
|
|
|
|
|
|
|
Opening balance | 211,465 | 290,631 | 223,807 | 301,025 |
Capitalized financial charges | 5,559 | 5,549 | 8,658 | 10,865 |
Financial charges related to cancelled land contract (Note 8.1) | (8,955) | - | (8,955) | - |
Charges recognized in profit or loss (Note 23) | (7,817) | (32,717) | (11,317) | (36,273) |
Closing balance | 200,252 | 263,463 | 212,193 | 275,617 |
The recorded amount of properties for sale offered as guarantee for loans, financing and debentures is R$490,312(R$552,752 as of December 31, 2018).
The other explanations related to this note were not subject to material changes in relation to the disclosures in Note 12 to the financial statements as of December 31, 2018.
13. Debentures
|
|
|
| Company and Consolidated | |
Program/placement | Principal - R$ | Annual interest | Final maturity | 03/31/2019 | 12/31/2018 |
|
|
|
|
|
|
Tenth placement (i) | 36,667 | IPCA + 8.37% | January 2021 | 46,953 | 49,299 |
Eleventh placement – 1st series A (ii) | 70,305 | CDI + 5.25% | February 2020 | 66,410 | 69,831 |
Twelfth placement (iii) | 66,668 | CDI + 3.75% | July 2020 | 63,662 | 65,714 |
Thirteenth placement (iv) | 80,793 | CDI + 3.00% | June 2022 | 72,217 | 80,822 |
Total debentures (Note 20.i.d, 20.ii.a, 20.iii and 30.ii) | 249,242 | 265,666 | |||
|
|
|
|
|
|
Current portion |
|
|
| 133,636 | 62,783 |
Non-current portion |
|
|
| 115,606 | 202,883 |
In the period ended March 31, 2019, the Company made the following payments:
Face Value placement | Interest payable | Total amortization | |
(i) | - | 3,787 | 3,787 |
(ii) | 2,350 | 2,432 | 4,782 |
(iii) | 2,247 | 1,559 | 3,806 |
(iv) | 8,603 | 1,732 | 10,335 |
| 13,200 | 9,510 | 22,710 |
52
(A free translation of the original report in Portuguese as published in Brazil)
Gafisa S.A.
Notes to the quarterly information
March 31, 2019
(Amounts in thousands of Brazilian Reais, except as otherwise stated)
The maturities of current and non-current installments are as follows:
| Company and Consolidated | |
Maturity | 03/31/2019 | 31/122018 |
|
|
|
2019 | 52,596 | 62,783 |
2020 | 153,504 | 157,700 |
2021 | 41,541 | 43,391 |
2022 | 1,601 | 1,792 |
249,242 | 265,666 | |
13. Debentures--Continued
The Company has complied with the restrictive covenants of debentures at the reporting date of this quarterly information. The ratios and minimum and maximum amounts required under such restrictive covenants are as follows:
| 03/31/2019 | 12/31/2018 |
|
|
|
|
|
|
Tenth placement |
|
|
Total account receivable (1)plus inventory required to be below zero or 2.0 times over net debt less venture debt (2) | 9.73 times | 12.87 times |
Total debt less venture debt (2), less cash and cash equivalents and short-term investments( (3), cannot exceed 75% of equity plus noncontrolling interests | 51.12% | 22.73% |
|
|
|
|
|
|
|
|
|
(1) Total receivables, whenever mentioned, refers to the amount reflected in the Statement of Financial Position plus the amount not shown in the Statement of Financial Position.
(2) Venture debt and secured guarantee debt refer to SFH debts, defined as the sum of all disbursed borrowing contracts which funds were provided by SFH.
(3) Cash and cash equivalents and short-term investments refer to cash and cash equivalents and marketable securities.
The other explanations related to this note were not subject to material changes in relation to the disclosures in Note 13 to the financial statements as of December 31, 2018.
14.Obligations assumed on assignment of receivables
The transactions of assignment of the receivable portfolio are as follows:
| Company | Consolidated | ||
| 03/31/2019 | 12/31/2018 | 03/31/2019 | 12/31/2018 |
|
|
|
|
|
Obligation CCI June/2011 | 412 | 376 | 904 | 882 |
Obligation CCI December/2011 | 255 | 363 | 255 | 372 |
Obligation CCI July/2012 | 4 | 10 | 4 | 10 |
Obligation CCI November/2012 | - | - | 2,511 | 2,547 |
Obligation CCI December/2012 | 2,899 | 3,151 | 2,899 | 3,151 |
Obligation CCI November/2013 | 341 | 348 | 1,829 | 1,877 |
Obligation CCI November/2014 | 1,274 | 1,299 | 1,852 | 1,895 |
Obligation CCI December/2015 | 3,420 | 3,569 | 7,565 | 7,797 |
Obligation CCI March/2016 | 9,036 | 8,863 | 9,848 | 9,645 |
Obligation CCI May/2016 | 4,540 | 5,064 | 6,078 | 6,790 |
Obligation CCI August/2016 | 3,039 | 2,985 | 3,120 | 3,075 |
Obligation CCI December/2016 | 7,064 | 7,158 | 7,332 | 7,441 |
Obligation CCI March/2017 | 10,933 | 11,458 | 11,186 | 11,704 |
Obligation FIDC |
| - |
| - |
Total obligations assumed on assignment of receivables (Note 20.i.d and 20.ii.a) | 43,217 | 44,644 | 55,383 | 57,186 |
|
|
|
|
|
Current portion | 18,506 | 18,554 | 24,899 | 25,046 |
Non-current potion | 24,711 | 26,090 | 30,484 | 32,140 |
The current and non-current portions had the following maturities:
| Company |
| Consolidated | ||
Maturity | 03/31/2019 | 12/31/2018 |
| 03/31/2019 | 12/31/2018 |
|
|
|
|
|
|
2019 | 15,287 | 18,554 |
| 21,086 | 25,046 |
2020 | 10,350 | 10,326 |
| 13,139 | 12,381 |
2021 | 6,635 | 5,366 |
| 8,563 | 7,791 |
2022 | 3,259 | 2,629 |
| 3,833 | 3,092 |
2023 onwards | 7,686 | 7,769 |
| 8,762 | 8,876 |
43,217 | 44,644 |
| 55,383 | 57,186 | |
The other explanations related to this note were not subject to material changes in relation to the disclosures in Note 14 to the financial statements as of December 31, 2018.
53
(A free translation of the original report in Portuguese as published in Brazil)
Gafisa S.A.
Notes to the quarterly information
March 31, 2019
(Amounts in thousands of Brazilian Reais, except as otherwise stated)
15.Other payables
| Company | Consolidated | ||
| 03/31/2019 | 12/31/2018 | 03/31/2019 | 12/31/2018 |
|
|
|
|
|
Cancelled contract payable and allowance for cancelled contracts | 67,717 | 71,065 | 86,853 | 89,461 |
Warranty provision | 21,602 | 21,940 | 21,602 | 21,940 |
Long-term PIS and COFINS (deferred and payable) | 6,401 | 8,284 | 7,650 | 9,622 |
Provision for net capital deficiency (Note 9.i.d) | 11,695 | 8,423 | 6,685 | 3,535 |
Long-term suppliers(Note 20.i.d) | 16,502 | 12,049 | 19,791 | 14,734 |
Forward transactions–Share Repurchase Program (Note 20.ii a and 20.iii) | 30,634 | 38,879 | 30,634 | 38,879 |
Share-based payment - Phantom Shares (Note 18.4) | 1,863 | 4,602 | 1,863 | 4,602 |
Other liabilities | 7,053 | 9,418 | 8,646 | 11,038 |
Total other payables | 163,467 | 174,660 | 183,724 | 193,811 |
|
|
|
|
|
Current portion | 144,395 | 156,498 | 162,728 | 173,951 |
Non-current portion | 19,072 | 18,162 | 20,996 | 19,860 |
16.Provisions for legal claims and commitments
In the period ended March 31, 2019, the changes in the provision are summarized as follows:
Company | Civil lawsuits | Tax proceedings | Labor claims | Total |
Balance at December 31, 2018 | 235,294 | 637 | 55,133 | 291,064 |
Additional provision (Note 23) (i) | 15,145 | 1,313 | 5,572 | 22,030 |
Payment and reversal of provision not used | (15,808) | - | (6,149) | (21,957) |
Balance at March 31, 2019 | 234,631 | 1,950 | 54,556 | 291,137 |
|
|
|
|
|
Current portion | 168,198 | 637 | 21,731 | 190,566 |
Non-current portion | 66,433 | 1,313 | 32,825 | 100,571 |
Consolidated | Civil lawsuits | Tax proceedings | Labor claims | Total |
Balance at December 31, 2018 | 235,482 | 637 | 57,690 | 293,809 |
Additional provision (Note 23) (i) | 15,145 | 1,313 | 5,767 | 22,225 |
Payment and reversal of provision not used | (15,808) | - | (6,056) | (21,864) |
Balance at March 31, 2019 | 234,819 | 1,950 | 57,401 | 294,170 |
|
|
|
|
|
Current portion | 168,198 | 637 | 21,731 | 190,566 |
Non-current portion | 66,621 | 1,313 | 35,670 | 103,604 |
(i) Of this amount: (a) R$ 4,520 refers to the provision for civil lawsuits due to late delivery of units; (b) R$ 3,104 refers to the provision for a lawsuit that claims damages, due to the supposed construction defect in a venture located in Rio de Janeiro, state of Rio de Janeiro.
(a) Civil lawsuits, tax proceedings and labor claims
As of March 31, 2019, the Company and its subsidiaries have deposited in court the amount of R$113,634 (R$103,701 in 2018) in the Company’s balance, and R$116,733 (R$106,793 in 2018) in the consolidated balance (Note 7).
Company | Consolidated | ||||
|
| 03/31/2019 | 12/31/2018 | 03/31/2019 | 12/31/2018 |
|
|
|
|
|
|
Civil lawsuits |
| 51,107 | 48,411 | 51,521 | 48,992 |
Tax proceedings |
| 38,549 | 38,859 | 45,543 | 40,031 |
Labor claims | 23,978 | 16,431 | 19,669 | 17,770 | |
Total (Note 7) | 113,634 | 103,701 | 116,733 | 106,793 | |
(i) Lawsuits in which likelihood of loss is rated as possible
As of March 31, 2019the Company and its subsidiaries are aware of other civil, labor and tax claims and risks. Based on thehistory of probable lawsuits and the specific analysis of main claims, the measurement of the claims withlikelihood of loss considered possible amounted toR$366,370 (R$318,322 in 2018) in theCompany’s statementand R$367,341 (R$319,902 in 2018) in the consolidatedstatement,based on average past outcomes adjusted to current estimates, for which the Company’s Management believes it is not necessary to recognize a provision for occasional losses.
54
(A free translation of the original report in Portuguese as published in Brazil)
Gafisa S.A.
Notes to the quarterly information
March 31, 2019
(Amounts in thousands of Brazilian Reais, except as otherwise stated)
|
| Company | Consolidated | ||
|
| 03/31/2019 | 12/31/2018 | 03/31/2019 | 12/31/2018 |
|
|
|
|
|
|
Civil lawsuits |
| 247,992 | 197,090 | 248,032 | 197,142 |
Tax proceedings |
| 94,818 | 94,341 | 95,053 | 94,541 |
Labor claims | 23,560 | 26,891 | 24,256 | 28,219 | |
Total | 366,370 | 318,322 | 367,341 | 319,902 | |
(b) Payables related to the completion of real estate ventures
There was no material change in relation to the information disclosed in Note 16(i)(b) to the financial statements as of December 31, 2018.
(c) Other commitments
In addition to the commitments mentioned in Notes 6, 12 and 13, the Company currently has commitments related to the rental of a commercial property where its facilities are located, at a monthly cost of R$88 (rent, condominium fees, and IPTU), indexed to the IGP-M/FGV change and the contract expires in January 2024.
The estimate of minimum future rent payments totals R$5,259, considering the above-mentioned contract expiration, as follows
| Consolidated |
Estimate of payment | 03/31/2019 |
|
|
2019 | 502 |
2020 | 1,095 |
2021 | 1,139 |
2022 | 1,184 |
2023onwards | 1,339 |
5,259 |
The other explanations related to this note were not subject to material changes in relation to the disclosures in Note 16 to the financial statements as of December 31, 2018.
17.Payables for purchase of properties and advances from customers
|
| Company | Consolidated | ||
| Maturity | 03/31/2019 | 12/31/2018 | 03/31/2019 | 12/31/2018 |
|
|
|
|
|
|
Payables for purchase of properties | April 2019 to November 2022 | 82,841 | 122,072 | 97,962 | 137,170 |
Present value adjustment |
| (7,515) | (14,455) | (8,097) | (15,075) |
Advances from customers |
|
|
|
|
|
Development and sales |
| 6,480 | 9,337 | 6,474 | 12,069 |
Barter transaction - Land (Note 30 (i)) |
| 115,179 | 117,145 | 171,845 | 175,267 |
|
|
|
|
|
|
Total payables for purchase of properties and advance from customers (Notes 20.i.d and 20.ii.a) |
| 196,985 | 234,099 | 268,184 | 309,431 |
|
|
|
|
|
|
Current portion |
| 85,286 | 82,264 | 114,237 | 113,355 |
Non-current portion |
| 111,699 | 151,835 | 153,947 | 196,076 |
The current and non-current portions have the following maturities:
| Company |
| Consolidated | ||
Maturity | 03/31/2019 | 12/31/2018 |
| 03/31/2019 | 12/31/2018 |
|
|
|
|
|
|
2019 | 85,285 | 82,265 |
| 114,237 | 113,354 |
2020 | 51,849 | 56,591 |
| 73,461 | 85,504 |
2021 | 39,472 | 44,203 |
| 50,707 | 50,954 |
2022 | 18,927 | 50,130 |
| 28,317 | 58,696 |
2023 onwards | 1,452 | 910 |
| 1,462 | 923 |
196,985 | 234,099 |
| 268,184 | 309,431 | |
55
(A free translation of the original report in Portuguese as published in Brazil)
Gafisa S.A.
Notes to the quarterly information
March 31, 2019
(Amounts in thousands of Brazilian Reais, except as otherwise stated)
18.Equity
18.1. Capital
As of March 31, 2019 and December 31, 2018, the Company's authorized and paid-in capital amounted to R$ 2,521,319, represented by 43,357,589 registered common shares, with no par value, of which 2,704,187 (3,943,420 in 2018) where held in treasury.
According to the Company’s Articles of Incorporation, capital may be increased without need of making amendment to it, upon resolution of the Board of Directors, which shall set the conditions for issuance within the limit of 71,031,876 (seventy one million thirty one thousand eight hundred seventy six) common shares.
In the period ended March 31, 2019, the Company transferred 9,174 shares (13,319 in 2018), in the total amount of R$141 (R$530 in 2018) related to the exercise of options under the stock option plan of common shares by the beneficiaries, for which it received the total amount of R$148 (R$418 in 2018).
| Treasury shares |
|
| |||||
| Type | GFSA3 | R$ | % | Market value (*) R$ thousand | Carrying value R$ thousand | ||
Acquisition date | Number (i) | Weighted average price | % - on shares outstanding | 03/31/2019 | 12/31/2018 | 03/31/2019 | 12/31/2018 | |
2001 | 11/20/2001 | 44,462 | 38.9319 | 0.11% | 380 | 751 | 1,731 | 1,731 |
|
|
|
|
|
|
|
|
|
2013 | Acquisition | 1,372,096 | 51.9927 | 3.35% | 11,718 | 23,188 | 71,339 | 71,339 |
|
|
|
|
|
|
|
|
|
2014 | Acquisition | 3,243,947 | 35.5323 | 7.92% | 27,703 | 54,823 | 115,265 | 115,265 |
2014 | Transfer | (405,205) | 43.3928 | -0.99% | (3,460) | (6,848) | (17,583) | (17,583) |
2014 | Cancellation | (2,039,086) | 44.9677 | -4.98% | (17,414) | (34,461) | (91,693) | (91,693) |
|
|
|
|
|
|
|
|
|
2015 | Acquisition | 884,470 | 27.3124 | 2.16% | 7,553 | 14,948 | 24,157 | 24,157 |
2015 | Transfer | (90,622) | 33.3473 | -0.22% | (774) | (1,531) | (3,022) | (3,022) |
2015 | Cancellation | (2,225,020) | 33.3543 | -5.43% | (19,002) | (37,603) | (74,214) | (74,214) |
|
|
|
|
|
|
|
|
|
2016 | Acquisition | 334,020 | 26.0254 | 0.82% | 2,853 | 5,645 | 8,693 | 8,693 |
2016 | Transfer | (68,814) | 31.2290 | -0.17% | (588) | (1,163) | (2,149) | (2,149) |
|
|
|
|
|
|
|
|
|
2017 | Transfer | (112,203) | 30.6320 | -0.27% | (958) | (1,896) | (3,435) | (3,435) |
|
|
|
|
|
|
|
|
|
2018 | Acquisition | 13,221,300 | 13.4953 | 32.26% | 112,910 | 223,440 | 178,425 | 178,425 |
2018 | Transfer | (17,319) | 30.6022 | -0.04% | (148) | (293) | (530) | (530) |
2018 | Cancellation | (1,030,326) | 14.4847 | -2.51% | (8,799) | (17,412) | (14,924) | (14,924) |
2018 | Disposal | (9,168,280) | 16.1463 | -22.37% | (78,297) | (154,944) | (133,110) | (133,110) |
|
|
|
|
|
|
|
|
|
2019 | Acquisition | 5,393,686 | 13.6521 | 13.16% | 46,062 | - | 79,439 | - |
2019 | Transfer | (9,174) | 15.3695 | -0.02% | (78) | - | (141) | - |
2019 | Cancellation | (370,000) | 15.5324 | -0.90% | (3,159) | - | (5,747) | - |
2019 | Disposal | (6,253,744) | 13.9935 | -15.26% | (53,407) | - | (93,316) | - |
|
| 2,704,187 | 14.4905 | 6.60% | 23,095 | 66,644 | 39,185 | 58,950 |
(*) Market value calculated based on the closing share price on March 31, 2019 of R$8.54(R$16.90 in 2018) not considering the effect of occasional volatilities.
(i) Amount shown adjusted by the reverse split of shares at the ratio of 13.483023074 to 1 performed on March 23, 2017.
The Company holds shares in treasury acquired in 2001 in order to guarantee the performance of lawsuits (Note 16(a)(i)).
The change in the number of outstanding shares is as follows:
| Common shares - In thousands |
Outstanding shares as of December 31, 2018 | 38,599 |
Transfer related to the stock option plan | 9 |
Repurchase of shares | (5,394) |
Disposal of shares | 6,254 |
Cancellation of treasury shares | 370 |
Change in shares held by the management members of the Company | 1,140 |
Outstanding shares as of March 31, 2019 | 40,978 |
|
|
Weighted average shares outstanding (Note 27) | 39,418 |
56
(A free translation of the original report in Portuguese as published in Brazil)
Gafisa S.A.
Notes to the quarterly information
March 31, 2019
(Amounts in thousands of Brazilian Reais, except as otherwise stated)
18. Equity--Continued
18.2. Stock option plan
Expenses incurred in relation to the granting of stock options are recorded in the line item “General and administrative expenses” (Note 23) and presented the following effects on profit or loss in the periods ended March 31, 2019 and 2018:
| Company and Consolidated | |
03/31/2019 | 03/31/2018 | |
|
| |
Equity-settled stock option plans | 162 | 707 |
Phantom Shares | (2,622) | (798) |
Total option grant expenses (Note 23) | (2,460) | (91) |
The Company has a total of six stock option plans comprising common shares, launched in 2012, 2013, 2014, 2015, 2016 and 2018 which follows the rules established in the Stock Option Plan of the Company.
The granted options entitle their holders (beneficiaries) to purchase common shares of the Company’s capital, after periods that range from one to four years of employment (essential condition to exercise the option), and expire six to ten years after the grant date.
The fair value of options is set on the grant date, and it is recognized as expense in profit or loss (as contra-entry to equity) during the grace period of the plan, to the extent the services are provided by employees and management members.
Changes in the stock options outstanding in the period endedMarch 31, 2019 and year ended December 31, 2018, including the respective weighted average exercise prices are as follows:
| 2019 | 2018 | ||
| Number of options | Weighted average exercise price (Brazilian Reais) | Number of options | Weighted average exercise price (Brazilian Reais) |
Options outstanding at the beginning of the year | 1,239,557 | 15.58 | 841,172 | 16.99 |
Options granted | - | - | 2,685,474 | 15.00 |
Options exercised (i) | (9,174) | (16.16) | (21,079) | (16.25) |
Options cancelled for forfeiture | - | - | (2,252,076) | (15.00) |
Options cancelled and adjustment to the number due to the discontinued operations of Tenda, net | - | - | (13,934) | (0.09) |
Options outstanding at the end of the year | 1,230,383 | 15.58 | 1,239,557 | 15.58 |
(i)In the year ended March 31, 2019, the amount received through exercised options was R$148 (R$418 in 2018).
As of March 31, 2019, the stock options outstanding and exercisable are as:
Outstanding options | Exercisable options | |||
Number of options | Weighted average remaining contractual life (years) | Weighted average exercise price (R$) | Number of options | Weighted average exercise price (R$) |
|
|
|
|
|
1,230,383 | 8.06 | 15.58 | 519,064 | 19.47 |
57
(A free translation of the original report in Portuguese as published in Brazil)
Gafisa S.A.
Notes to the quarterly information
March 31, 2019
(Amounts in thousands of Brazilian Reais, except as otherwise stated)
18. Equity --Continued
18.2. Stock option plan -- Continued
During the period ended March 31, 2019, the Company did not grant options in connection with its stock option plans of common shares (2,685,474 options granted in 2018).
The models used by the Company for pricing granted options are the Binomial model for traditional options and the MonteCarlo model for options in the Restricted Stock Option format.
18.3. Share-based payment – Phantom Shares
The Company has a total of two cash-settled share-based payment plans with fixed terms and conditions, according to the plans approved by the Company, launched in 2015 and 2016.
As of March 31, 2019, the amount of R$1,863 (R$4,602 in 2018), related to the fair value of the phantom shares granted, is recognized in the line item “Other payables” (Note 15).
The other explanations related to this note were not subject to material changes in relation to the disclosures in Note 18 to the financial statements as of December 31, 2018.
19.Income tax and social contribution
The reconciliation of the effective tax rate for the periods ended March31, 2019 and 2018 is as follows:
| Company | Consolidated | ||
| 03/31/2019 | 03/31/2018 | 03/31/2019 | 03/31/2018 |
|
|
|
|
|
Profit (loss) before income tax and social contribution, and statutory interest | (46,354) | (53,516) | (46,195) | (54,463) |
Income tax calculated at the applicable rate - 34 % | 15,760 | 18,196 | 15,706 | 18,518 |
|
|
|
|
|
Net effect of subsidiaries taxed by presumed profit and RET | - | - | (1,542) | (4,206) |
Income from equity method investments | (2,276) | (4,841) | (704) | (343) |
Stock option plan | (55) | (240) | (55) | (240) |
Other permanent differences | (199) | - | (199) | - |
Charges on payables to venture partners | - | (71) | - | 283 |
Unrecognized tax credits | (13,230) | (13,044) | (13,610) | 14,244) |
| - | - | (404) | (232) |
|
|
|
|
|
Tax expenses - current | - | - | (404) | (232) |
Tax income (expenses) – deferred | - | - | - | - |
(i) Deferred income tax and social contribution
As of March 31, 2019 and December 31, 2018, deferred income tax and social contribution are from the following sources:
| Company | Consolidated | ||
| 03/31/2019 | 12/31/2018 | 03/31/2019 | 12/31/2018 |
Assets |
|
|
|
|
Provisions for legal claims | 98,987 | 98,962 | 100,018 | 99,895 |
Temporary differences – Deferred PIS and COFINS | 15,146 | 15,722 | 15,146 | 15,722 |
Provisions for realization of non-financial assets | 262,979 | 264,022 | 262,979 | 264,022 |
Temporary differences – CPC adjustment | 18,743 | 22,796 | 18,743 | 22,796 |
Other provisions | 20,296 | 11,838 | 20,296 | 11,838 |
Income tax and social contribution loss carryforwards | 370,554 | 356,474 | 389,369 | 375,007 |
| 786,705 | 769,814 | 806,551 | 789,280 |
|
|
|
|
|
Unrecognized tax credits of continued operations | (699,630) | (686,400) | (719,476) | (705,866) |
| (699,630) | (686,400) | (719,476) | (705,866) |
Liabilities |
|
|
|
|
Discounts | (2,069) | (2,069) | (2,069) | (2,069) |
Temporary differences –CPC adjustment | (64,683) | (67,170) | (64,683) | (67,170) |
Income taxed between cash and accrual basis | (69,695) | (63,547) | (69,695) | (63,547) |
| (136,447) | (132,786) | (136,447) | (132,786) |
|
|
|
|
|
Total net | (49,372) | (49,372) | (49,372) | (49,372) |
58
(A free translation of the original report in Portuguese as published in Brazil)
Gafisa S.A.
Notes to the quarterly information
March 31, 2019
(Amounts in thousands of Brazilian Reais, except as otherwise stated)
The balances of income tax and social contribution loss carryforwards for offsetting were as follows:
|
Company | ||||||
| 03/31/2019 |
| 12/31/2018 | ||||
| Income tax | Social contribution |
Total |
| Income tax | Social contribution |
Total |
Balance of income tax and social contribution loss carryforwards | 1,089,862 | 1,089,862 | - |
| 1,048,452 | 1,048,452 | - |
Deferred tax asset (25%/9%) | 272,466 | 98,088 | 370,554 |
| 262,113 | 94,361 | 356,474 |
Recognized deferred tax asset | 23,468 | 8,449 | 31,917 |
| 15,273 | 5,498 | 20,771 |
Unrecognized deferred tax asset | 248,998 | 89,639 | 338,637 |
| 246,840 | 88,863 | 335,703 |
|
Consolidated | ||||||
| 03/31/2019 |
| 12/31/2018 | ||||
| Income tax | Social contribution |
Total |
| Income tax | Social contribution |
Total |
Balance of income tax and social contribution loss carryforwards | 1,145,684 | 1,145,684 | - |
| 1,104,648 | 1,104,648 | - |
Deferred tax asset (25%/9%) | 286,421 | 103,112 | 389,533 |
| 276,162 | 99,418 | 375,580 |
Recognized deferred tax asset | 23,468 | 8,449 | 31,917 |
| 15,273 | 5,498 | 20,771 |
Unrecognized deferred tax asset | 262,953 | 94,663 | 357,616 |
| 260,889 | 93,920 | 354,809 |
The other explanations related to this note were not subject to material changes in relation to the disclosures in Note 19 to the financial statements as of December 31, 2018.
20.Financial instruments
The Company and its subsidiaries engage in operations involving financial instruments. These instruments are managed through operational strategies and internal controls aimed at providing liquidity, return and safety. The use of financial instruments for hedging purposes is achieved through a periodical analysis of exposure to the risk that the management intends to cover (exchange, interest rate, etc.) which is submitted to the corresponding Management bodies for approval and performance of the proposed strategy. The control policy consists of ongoing monitoring of the contracted conditions in relation to the prevailing market conditions. The Company and its subsidiaries do not use derivatives or any other risky assets for speculative purposes. The result from these operations is consistent with the policies and strategies devised by the Company’s Management. The Company and its subsidiaries operations are subject to the risk factors described below:
(i) Risk considerations
a) Credit risk
There was no significant change in relation to the credit risks disclosed in Note 20(i)(a) to the financial statements as of December 31, 2018.
b) Derivative financial instruments
As of March 31, 2019, the Company did not have any derivative instrument to mitigate the risk arising from its exposure to index and interest volatility recognized at their fair value in profit or loss for the year.
During the period ended March 31, 2019, there was no income amount (R$20 in 2018) in the Company’s and Consolidated statements, related to the net proceeds of interest swap transaction.
c) Interest rate risk
There was no significant change in relation to the interest rate risks disclosed in Note 20(i)(c) to the financial statements as of December 31, 2018.
d) Liquidity risk
There was no significant change in relation to the liquidity risks disclosed in Note 20(i)(d) to the financial statements as of December 31, 2018.
59
(A free translation of the original report in Portuguese as published in Brazil)
Gafisa S.A.
Notes to the quarterly information
March 31, 2019
(Amounts in thousands of Brazilian Reais, except as otherwise stated)
The maturities of financial instruments of loans, financing, suppliers, debentures, forward transactions, obligations assumed on assignment of receivables, suppliers, payables for purchase of properties and advance from customers are as follows:
Period ended March 31, 2019 | Company | ||||
Liabilities | Less than 1 year | 1 to 3 years | 4 to 5 years | Over 5 years | Total |
Loans and financing(Note 12) | 282,531 | 215,049 | - | - | 497,580 |
Debentures (Note 13) | 133,636 | 115,606 | - | - | 249,242 |
Forward transactions (Note 15) | 30,634 | - | - | - | 30,634 |
Obligations assumed on assignment of receivables (Note 14) | 18,506 | 16,076 | 4,529 | 4,106 | 43,217 |
Suppliers(Note 15 and Note 20.ii.a) | 107,799 | 16,502 | - | - | 124,301 |
Payables for purchase of properties and advance from customers (Note 17) | 85,286 | 91,320 | 20,379 | - | 196,985 |
| 658,392 | 454,553 | 24,908 | 4,106 | 1,141,959 |
Assets |
|
|
|
|
|
Cash and cash equivalents and short-term investments (Notes 4.1 and 4.2) | 54,272 | - | - | - | 54,272 |
Trade account receivable (Note 5) | 404,053 | 102,838 | 4,645 | - | 511,536 |
| 458,325 | 102,838 | 4,645 | - | 565,808 |
Period ended March 31, 2019 | Consolidated | ||||
Liabilities | Less than 1 year | 1 to 3 years | 4 to 5 years | Over 5 years | Total |
Loans and financing (Note 12) | 307,555 | 233,375 | - | - | 540,930 |
Debentures (Note 13) | 133,636 | 115,606 | - | - | 249,242 |
Forward transactions (Note 15) | 30,634 | - | - | - | 30,634 |
Obligations assumed on assignment of receivables (Note 14) | 24,899 | 21,827 | 5,394 | 3,263 | 55,383 |
Suppliers (Note 15 and Note 20.ii.a) | 115,114 | 19,791 | - | - | 134,905 |
Payables for purchase of properties and advance from customers (Note 17) | 114,237 | 73,461 | 80,486 | - | 268,184 |
| 726,075 | 464,060 | 85,880 | 3,263 | 1,279,278 |
Assets |
|
|
|
|
|
Cash and cash equivalents and short-term investments (Notes 4.1 and 4.2) | 63,068 | - | - | - | 63,068 |
Trade account receivable (Note 5) | 475,820 | 115,293 | 5,321 | - | 596,434 |
| 538,888 | 115,293 | 5,321 | - | 659,502 |
20.Financial instruments --Continued
(i) Risk considerations --Continued
d) Liquidity risk --Continued
Fair value classification
The Company uses the same classification disclosed in Note 20(i)(d) to the financial statements as of December 31, 2018 to determine and disclose the fair value of financial instruments by valuation technique.
The classification level of fair value for financial instruments measured at fair value through profit or loss of the Company as of March 31, 2019 and December 31, 2018 is as follows:
| Company | Consolidated | ||||
| Fair value classification | |||||
As of March 31, 2019 | Level 1 | Level 2 | Level 3 | Level 1 | Level 2 | Level 3 |
|
|
|
|
|
|
|
Financial assets |
|
|
|
|
|
|
Short-term investments (Note 4.2) | - | 48,046 | - | - | 50,666 | - |
| Company | Consolidated | ||||
| Fair value classification | |||||
As of December 31, 2018 | Level 1 | Level 2 | Level 3 | Level 1 | Level 2 | Level 3 |
|
|
|
|
|
|
|
Financial assets |
|
|
|
|
|
|
Short-term investments (Note 4.2) | - | 102,827 | - | - | 104,856 | - |
During the period ended March 31, 2019, there were no transfers between the Levels 1 and 2 fair value classifications, nor were transfers between Levels 3 and 2 fair value classifications.
60
(A free translation of the original report in Portuguese as published in Brazil)
Gafisa S.A.
Notes to the quarterly information
March 31, 2019
(Amounts in thousands of Brazilian Reais, except as otherwise stated)
(ii) Fair value of financial instruments
a) Fair value measurement
The Company uses the same methods and assumptions disclosed in Note 20(ii)(a) to the financial statements as of December 31, 2018 to estimate the fair value of each financial instrument class for which the estimate of value is practicable.
The most significant carrying values and fair values of financial assets and liabilities as of March 31, 2019 and December 31, 2018, classified into Level 2 of the fair value classification, are as follows:
20.Financial instruments — Continued
(ii) Fair value of financial instruments --Continued
a) Fair value measurement --Continued
| Company |
| |||
| 03/31/2019 | 12/31/2018 |
| ||
| Carrying value | Fair value | Carrying value | Fair value | Classification |
|
|
|
|
| |
Financial assets |
|
|
|
|
|
Cash and cash equivalents (Note 4.1) | 6,226 | 6,226 | 29,180 | 29,180 | (*) |
Short-term investments (Note 4.2) | 48,046 | 48,046 | 102,827 | 102,827 | (*) |
Trade accounts receivable (Note 5) | 511,536 | 511,536 | 546,978 | 546,978 | (**) |
Loans receivable(Note 21.1) | 29,248 | 29,248 | 28,409 | 28,409 | (**) |
|
|
|
|
|
|
Financial liabilities |
|
|
|
|
|
Loans and financing (Note 12) | 497,580 | 494,434 | 560,598 | 491,198 | (**) |
Debentures (Note 13) | 249,242 | 283,142 | 265,666 | 302,126 | (**) |
Forward transactions – Share repurchase program (Note 15) | 30,634 | 30,634 | 38,879 | 38,879 | (**) |
Suppliers | 124,301 | 124,301 | 128,997 | 128,997 | (**) |
Obligations assumed on assignment of receivables(Note 14) | 43,217 | 43,217 | 44,644 | 44,644 | (**) |
Payables for purchase of properties and advance from customers (Note 17) | 196,985 | 196,985 | 234,099 | 234,099 | (**) |
Loans payables (Note 21.1) | 16,334 | 16,334 | 15,451 | 15,451 | (**) |
| Consolidated |
| |||
| 03/31/2019 | 12/31/2018 |
| ||
| Carrying value | Fair value | Carrying value | Fair value | Classification |
|
|
|
|
| |
Financial assets |
|
|
|
|
|
Cash and cash equivalents (Note 4.1) | 12,402 | 12,402 | 32,304 | 32,304 | (*) |
Short-term investments (Note 4.2) | 50,666 | 50,666 | 104,856 | 104,856 | (*) |
Trade accounts receivable (Note 5) | 596,434 | 596,434 | 642,009 | 642,009 | (**) |
Loans receivable (Note 21.1) | 29,248 | 29,248 | 28,409 | 28,409 | (**) |
|
|
|
|
|
|
Financial liabilities |
|
|
|
|
|
Loans and financing (Note 12) | 540,930 | 494,434 | 623,747 | 555,855 | (**) |
Debentures (Note 13) | 249,242 | 283,142 | 265,666 | 302,126 | (**) |
| 30,634 | 30,634 | 38,879 | 38,879 | (**) |
Suppliers | 134,905 | 134,905 | 134,581 | 134,581 | (**) |
Obligations assumed on assignment of receivables (Note 14) | 55,383 | 55,383 | 57,186 | 57,186 | (**) |
Payables for purchase of properties and advance from customers (Note 17) | 268,184 | 268,184 | 309,431 | 309,431 | (**) |
Loans payables (Note 21.1) | 16,334 | 16,334 | 15,451 | 15,451 | (**) |
(*) Fair value through profit or loss
(**) Amortized cost
There was no significant change in relation to the other information disclosed in Note 20(ii)(a) to the financial statements as of December 31, 2018.
61
(A free translation of the original report in Portuguese as published in Brazil)
Gafisa S.A.
Notes to the quarterly information
March 31, 2019
(Amounts in thousands of Brazilian Reais, except as otherwise stated)
(b) Risk of debt acceleration
As of March 31, 2019, the Company has loans and financing, with restrictive covenants related to cash generation, indebtedness ratios, capitalization, debt coverage, maintenance of shareholding position, and others. The breach of such obligations by the Company may give rise to the acceleration of its debts and/or acceleration of other debts of the Company, including due to the performance of any cross default or cross acceleration clauses, which may negatively impact the profit or loss of the Company and the value of its shares.
20.Financial instruments --Continued
(b) Risk of debt acceleration --Continued
As mentioned in Note 12, the balance of certain bank loan contracts was reclassified into short term, because of the assignment, in 2016 and 2017, of receivables provided in guarantee to financing contracts.
The Company analyzed other debt contracts and did not identify any impact on the cross restrictive covenants in relation to the aforementioned breach.
(iii) Capital stock management
The explanations related to this note were not subject to material changes in relation to the disclosures in Note 20(iii) to the financial statements as of December 31, 2018.
The Company included in its net debt structure: loans and financing, debentures, less cash and cash equivalents and short-term investments:
| Company | Consolidated | ||
| 03/31/2019 | 12/31/2018 | 03/31/2019 | 12/31/2018 |
|
|
|
|
|
Loans and financing (Note 12) | 497,580 | 560,599 | 540,930 | 623,747 |
Debentures (Note 13) | 249,242 | 265,666 | 249,242 | 265,666 |
( - ) Cash and cash equivalents and short-term investments (Note 4.1 and 4.2) | (54,272) | (132,007) | (63,068) | (137,160) |
Net debt | 692,550 | 694,258 | 727,104 | 752,253 |
Equity | 448,179 | 491,317 | 449,455 | 493,191 |
(iv) Sensitivity analysis
The sensitivity analysis of financial instruments for the period ended March 31, 2019 describes the risks that may incur material losses on the Company’s profit or loss, as provided for by CVM, through Rule 475/08, in order to show a 10%, 25% and 50% increase/decrease in the risk variable considered.
As of March 31, 2019, the Company has the following financial instruments:
a) Short-term investments, loans and financing, and debentures linked to Interbank Deposit Certificates (CDI);
b) Loans and financing and debentures linked to the Referential Rate (TR) and CDI, and debentures indexed to the CDI and IPCA;
c) Accounts receivable and payable for purchase of property, linked to the National Civil Construction Index (INCC) and General Market Price Index (IGP-M).
For the sensitivity analysis in the period ended March 31, 2019, the Company considered the interest rates of investments, loans and accounts receivables, the CDI rate at 6.40%, TR at 0%, INCC at 4.06%, IPCA at 4.58% and IGP-M at 8.28%. The scenarios considered were as follows:
62
(A free translation of the original report in Portuguese as published in Brazil)
Gafisa S.A.
Notes to the quarterly information
March 31, 2019
(Amounts in thousands of Brazilian Reais, except as otherwise stated)
20.Financial instruments --Continued
(iv) Sensitivity analysis --Continued
Scenario I –Probable: 10% increase/decrease in the risk variables used for pricing
Scenario II –Possible: 25% increase/decrease in the risk variables used for pricing
Scenario III – Remote: 50% increase/decrease in the risk variables used for pricing
The Company presents in the following chart the sensitivity to risks to which the Company is exposed, taking into account that the possible effects would impact the future results, based on the exposures shown at March 31, 2019. The effects on equity are basically the same of the profit or loss ones.
Scenario | |||||||
I | II | III | III | II | I | ||
Transaction | Risk | Increase 10% | Increase 25% | Increase 50% | Decrease 50% | Decrease 25% | Decrease 10% |
|
|
|
|
| |||
Financial investments | Increase/decrease of CDI | 192 | 480 | 960 | (960) | (480) | (192) |
Loans and financing | Increase/decrease of CDI | (1,509) | (3,773) | (7,547) | 7,547 | 3,773 | 1,509 |
Debentures | Increase/decrease of CDI | (1,217) | (3,042) | (6,084) | 6,084 | 3,042 | 1,217 |
|
|
|
|
|
| ||
Net effect of CDI variation | (2,534) | (6,335) | (12,671) | 12,671 | 6,335 | 2,534 | |
|
|
|
|
|
| ||
Loans and financing | Increase/decrease of TR | - | - | - | - | - | - |
|
|
|
|
|
| ||
Net effect of TR variation | - | - | - | - | - | - | |
|
|
|
|
|
| ||
Debentures | Increase/decrease of IPCA | (205) | (514) | (1,027) | 1,027 | 514 | 205 |
|
|
|
|
|
|
|
|
Net effect of IPCA variation | (205) | (514) | (1,027) | 1,027 | 514 | 205 | |
|
|
|
|
|
| ||
Accounts receivable | Increase/decrease of INCC | 1,354 | 3,384 | 6,769 | (6,769) | (3,384) | (1,354) |
Payables for purchase of properties | Increase/decrease of INCC | (1,046) | (2,616) | (5,232) | 5,232 | 2,616 | 1,046 |
|
|
|
|
|
|
|
|
Net effect of INCC variation | 308 | 768 | 1,537 | (1,537) | (768) | (308) | |
|
|
|
|
|
|
|
|
Accounts receivable | Increase/decrease of IGP-M | 1,907 | 4,768 | 9,536 | (9,536) | (4,768) | (1,907) |
|
|
|
|
|
|
|
|
Net effect of IGP-M variation |
| 1,907 | 4,768 | 9,536 | (9,536) | (4,768) | (1,907) |
63
(A free translation of the original report in Portuguese as published in Brazil)
Gafisa S.A.
Notes to the quarterly information
March 31, 2019
(Amounts in thousands of Brazilian Reais, except as otherwise stated)
21.Related parties
21.1. Balances with related parties
The transactions between the Company and related companies are made under conditions and prices established between the parties.
| Company | Consolidated | ||
Current account | 03/31/2019 | 12/31/2018 | 03/31/2019 | 12/31/2018 |
|
|
|
|
|
Assets |
|
|
|
|
Current account(a): |
|
|
|
|
Total SPEs | 604 | 606 | 42,244 | 51,624 |
Subsidiaries | - | - | 33,626 | 43,004 |
Jointly-controlled investees | 571 | 573 | 8,585 | 8,587 |
Associates | 33 | 33 | 33 | 33 |
Condominium and consortia (b) and thirty party’s works (c) | 13,033 | 13,036 | 13,033 | 13,036 |
Loan receivable (d)(Note 20.ii.a) | 29,248 | 28,409 | 29,248 | 28,409 |
Dividends receivable | 12,977 | 12,977 | - | - |
| 55,862 | 55,028 | 84,525 | 93,069 |
|
|
|
|
|
Current portion | 26,614 | 26,619 | 55,277 | 64,660 |
Non-current | 29,248 | 28,409 | 29,248 | 28,409 |
|
|
|
|
|
Liabilities |
|
|
|
|
Current account (a): |
|
|
|
|
Total SPEs and Tenda | (917,324) | (924,152) | (36,300) | (40,713) |
Subsidiaries | (897,105) | (899,219) | (16,081) | (15,780) |
Jointly-controlled investees | (17,700) | (16,532) | (17,700) | (16,532) |
Associates | (2,519) | (8,401) | (2,519) | (8,401) |
Loan payable(d)(Note 20.ii.a) | (16,334) | (15,451) | (16,334) | (15,451) |
| (933,658) | (939,603) | (52,634) | (56,164) |
|
|
|
|
|
Current portion | (933,658) | (939,603) | (52,634) | (56,164) |
Non-current portion | - | - | - | - |
The composition, nature and conditions of the loans receivable and payable thus far by the Company are as presented below. Loans have maturity from April 2019 and are tied to the cash flows of the related ventures.
| Company and Consolidated |
|
| |
03/31/2019 | 12/31/2018 | Nature | Interest rate risk | |
|
|
|
|
|
Lagunas - Tembok Planej. E Desenv. Imob. Ltda. | 5,637 | 5,486 | Construction | 12% p.a. + IGPM |
Manhattan Residencial I | 447 | 685 | Construction | 10% p.a. + TR |
Target Offices & Mall | 23,164 | 22,238 | Construction | 12% p.a. + IGPM |
Total receivable | 29,248 | 28,409 | ||
|
|
|
|
|
Dubai Residencial | 4,858 | 4,787 | Construction | 6% p.a. |
Parque Árvores | 8,646 | 7,877 | Construction | 6% p.a. |
Parque Águas | 2,830 | 2,787 | Construction | 6% p.a. |
Totalpayable | 16,334 | 15,451 |
|
|
In the period ended March 31, 2019 the recognized financial income from interest on loans amounted to R$746 (R$1,172 in 2018) in the Company’s and Consolidated statement (Note 24).
The information regarding management transactions and compensation is described in Note 25.
The other explanations related to this note were not subject to material changes in relation to the disclosures in Note 21 to the financial statements as of December 31, 2018.
21.2. Endorsements, guarantees and sureties
The financial transactions of the subsidiaries are guaranteed by the endorsement or surety in proportion to the interest of the Company in the capital stock of such companies, in the amount ofR$189,528 as of March 31, 2019 (R$218,344 as of December 31, 2018).
64
(A free translation of the original report in Portuguese as published in Brazil)
Gafisa S.A.
Notes to the quarterly information
March 31, 2019
(Amounts in thousands of Brazilian Reais, except as otherwise stated)
22.Net operating revenue
Company | Consolidated | |||
03/31/2019 | 03/31/2018 | 03/31/2019 | 03/31/2018 | |
Gross operating revenue |
|
|
|
|
Real estate development, sale, barter transactions and construction services | 69,588 | 220,585 | 84,822 | 231,531 |
(Recognition) Reversal of allowance for expected credit losses and cancelled contracts (Note 5) | 18,538 | 23,505 | 18,538 | 23,505 |
Taxes on sale of real estate and services | (7,431) | (20,462) | (7,939) | (21,087) |
Net operating revenue | 80,695 | 223,628 | 95,421 | 233,949 |
23.Costs and expenses by nature
These are represented by the following:
Company | Consolidated | |||
03/31/2019 | 03/31/2018 | 03/31/2019 | 03/31/2018 | |
Cost of real estate development and sale: |
|
|
|
|
Construction cost | (46,507) | (115,055) | (56,573) | (124,107) |
Land cost | (12,974) | (34,789) | (16,349) | (38,336) |
Development cost | (1,129) | (6,338) | (1,571) | (7,499) |
Capitalized financial charges (Note 12) | (7,817) | (32,717) | (11,317) | (36,273) |
Maintenance / warranty | (3,164) | (2,463) | (3,164) | (2,464) |
Total cost of real estate development and sale | (71,591) | (191,362) | (88,974) | (208,679) |
|
|
|
|
|
Selling expenses: |
|
|
|
|
Product marketing | (2,170) | (10,736) | (2,285) | (12,107) |
Brokerage and sale commission | (1,956) | (6,990) | (2,642) | (8,647) |
Customer Relationship Management (CRM) and corporate marketing | (1,180) | (3,275) | (1,496) | (3,611) |
Other | (77) | 89 | (79) | 86 |
Total selling expenses | (5,383) | (20,912) | (6,502) | (24,279) |
|
|
|
|
|
General and administrative expenses: |
|
|
|
|
Salaries and payroll charges | (3,411) | (6,352) | (4,126) | (8,200) |
Employee benefits | (419) | (642) | (506) | (828) |
Travel and utilities | - | (78) | - | (101) |
Services | (1,792) | (3,250) | (2,167) | (4,195) |
Rents and condominium fees | (1,643) | (1,174) | (1,987) | (1,515) |
IT | (1,503) | (2,143) | (1,818) | (2,766) |
Stock option plan (Note 18.2) | 2,460 | 91 | 2,460 | 91 |
Reversal (Expense) of reserve for profit sharing (Note 25.iii) | - | (1,231) | - | (1,231) |
Other | 266 | 40 | 244 | 49 |
Total general and administrative expenses | (6,042) | (14,739) | (7,900) | (18,696) |
|
|
|
|
|
Other income (expenses), net: |
|
|
|
|
Expenses with lawsuits (Note 16) | (22,030) | (11,776) | (22,225) | (11,776) |
Other | 23 | (684) | (1) | (429) |
Total other income/(expenses), net | (22,007) | (12,460) | (22,226) | (12,205) |
24.Financial income (expenses)
| Company | Consolidated | ||
| 03/31/2019 | 03/31/2018 | 03/31/2019 | 03/31/2018 |
Financial income |
|
|
|
|
Income from financial investments | 877 | 3,952 | 879 | 4,016 |
Derivative transactions (Note 20.i.b) | - | 20 | - | 20 |
Financial income on loans (Note 21.i) | 746 | 1,172 | 746 | 1,172 |
Other financial income | 1,568 | 85 | 1,740 | 136 |
Total financial income | 3,191 | 5,229 | 3,365 | 5,344 |
|
|
|
|
|
Financial expenses |
|
|
|
|
Interest on funding, net of capitalization (Note 12) | (11,952) | (19,646) | (10,101) | (18,586) |
Amortization of transaction cost | (1,721) | (955) | (1,721) | (955) |
Banking expenses | (1,195) | (1,502) | (1,287) | (1,773) |
Offered discount and other financial expenses | (42) | (3,346) | (215) | (3,980) |
Total financial expenses | (14,910) | (25,449) | (13,324) | (25,294) |
65
(A free translation of the original report in Portuguese as published in Brazil)
Gafisa S.A.
Notes to the quarterly information
March 31, 2019
(Amounts in thousands of Brazilian Reais, except as otherwise stated)
25.Transactions with management and employees
(i) Management compensation
In the periods ended March 31, 2019 and 2018, the amounts recorded in the line item “General and administrative expenses”, related to the compensation of the Company’s Management and Fiscal Council were as follows:
| Management compensation |
| |
Period ended March 31, 2019 | Board of Directors | Executive Management | Fiscal Council |
|
|
|
|
Number of members | 3 | 2 | 1,7 |
Annual fixed compensation(in R$) |
|
|
|
Salary / Fees | 152 | 360 | 45 |
Direct and indirect benefits | - | 6 | - |
Others (INSS) | 30 | 72 | 9 |
Monthly compensation(in R$) | 61 | 144 | 18 |
Total compensation | 182 | 438 | 54 |
Profit sharing (Note 25.iii) | - | - | - |
Total compensation and profit sharing | 182 | 438 | 54 |
|
|
| ||
| Management compensation |
| ||
Period ended March 31, 2018 | Board of Directors | Executive Management | Fiscal Council | |
|
|
|
| |
Number of members | 7 | 6 | 3 | |
Annual fixed compensation(in R$) |
|
|
| |
Salary / Fees | 423 | 1,063 | 54 | |
Direct and indirect benefits | - | 57 | - | |
Others (INSS) | 85 | 213 | 11 | |
Monthly compensation(in R$) | 169 | 444 | 22 | |
Total compensation | 508 | 1,332 | 65 | |
Profit sharing (Note 25 (iii)) | - | 265 | - | |
Total compensation and profit sharing | 508 | 1,597 | 65 | |
There is no amount related to expenses with option grant to current management members of the Company in the period ended March 31, 2019 (reversal of R$61 in 2018).
The maximum aggregate compensation of the Company’s management members for the year 2019 was established at R$7,782 (R$23,599 in 2018), as fixed and variable compensation, as approved at the Annual Shareholders’ Meeting held on April 30, 2019 (Note 31 (iv)).
(ii) Sales transactions
In the period ended March 31, 2019 and the year ended December 31, 2018, no transaction of sale of units to the current Management was carried out.
(iii) Profit sharing
In the period ended March 31, 2019, the Company did not record a profit sharing expense (R$1,231 in 2018) in the line item “General and Administrative Expenses" (Note 23).
| Company and Consolidated | |
| 03/31/2019 | 03/31/2018 |
|
|
|
Executive officers (Note 25.i) | - | 265 |
Other employees | - | 966 |
Total profit sharing | - | 1,231 |
The other explanations related to this note were not subject to material changes in relation to the disclosures in Note 25 to the financial statements as of December 31, 2018.
66
(A free translation of the original report in Portuguese as published in Brazil)
Gafisa S.A.
Notes to the quarterly information
March 31, 2019
(Amounts in thousands of Brazilian Reais, except as otherwise stated)
26.Insurance
The liabilities covered by insurance and the respective amounts as of March 31, 2019 are as follows:
Insurance type | Coverage – R$ |
Engineering risks and completion bond | 761,405 |
Civil liability (Directors and Officers – D&O) | 155,868 |
| 917,273 |
The other explanations related to this note were not subject to material changes in relation to the disclosures in Note 26 to the financial statements as of December 31, 2018.
27. Earnings (loss) per share
The following table presents the calculation of basic and diluted earnings and loss per share. In view of the loss for the periods ended March 31, 2019 and 2018, shares with dilutive potential are not considered, because the impact would be antidilutive.
|
| |
| 03/31/2019 | 03/31/2018 |
Basic numerator |
|
|
Undistributed loss from continued operations | (46,354) | (53,516) |
Undistributed profitfrom discontinued operations | - | - |
Undistributed loss, available for the holders of common shares | (46,354) | (53,516) |
|
|
|
Basic denominator (in thousands of shares) |
|
|
Weighted average number of shares (Note 18.1) | 39,418 | 37,935 |
|
|
|
Basic earnings (loss) per share in Brazilian Reais |
|
|
From continued operations | (1,176) | (1,411) |
From discontinued operations | - | - |
Diluted numerator |
|
|
Undistributed lossfrom continued operations | (46,354) | (53,516) |
Undistributed profitfrom discontinued operations | - | - |
Undistributed loss, available for the holders of common shares | (46,354) | (53,516) |
|
|
|
Diluted denominator (in thousands of shares) |
|
|
Weighted average number of shares (Note 18.1) | 39,418 | 37,935 |
Stock options | 226 | 582 |
Anti-dilution effect | (226) | (582) |
Diluted weighted average number of shares | 39,418 | 37,935 |
|
|
|
|
|
|
Diluted earnings (loss) per share in Brazilian Reais |
|
|
From continued operations | (1,176) | (1,411) |
From discontinued operations | - | - |
The other explanations related to this note were not subject to material changes in relation to the disclosures in Note 27 to the financial statements as of December 31, 2018.
28. Segment information
The reports used for making decisions are the consolidated quarterly information and no longer the analysis by operating segments. Therefore, in line with CPC 22 – Operating Segments, the Company understands that there is no reportable segment to be disclosed in the periods ended March 31, 2019 and 2018.
67
(A free translation of the original report in Portuguese as published in Brazil)
Gafisa S.A.
Notes to the quarterly information
March 31, 2019
(Amounts in thousands of Brazilian Reais, except as otherwise stated)
29. Real estate ventures under construction – information and commitments
In compliance with Circular Letter CVM/SNC/SEP 02/2018, related to the recognition of revenue from contracts for purchase and sale of real estate units not yet completed in Brazilian real estate development companies, theCompany reports information on the ventures under construction as of March 31, 2019:
|
| Consolidated |
|
| 03/31/2019 |
|
|
|
Unappropriated sales revenue of units sold |
| 503,741 |
Unappropriated estimated cost of units sold |
| (310,271) |
Unappropriated estimated cost of units in inventory |
| (160,382) |
|
|
|
(i) Unappropriated sales revenue of units sold |
|
|
Ventures under construction: |
|
|
(a) Contracted sales revenue |
| 1,330,411 |
Appropriated sales revenue: |
|
|
Appropriated revenue |
| 848,233 |
Cancelled contracts – reversed revenue |
| (21,563) |
(b) Net appropriated sales revenue |
| 826,670 |
Unappropriated sales revenue (a+b) (a) |
| 503,741 |
|
|
|
(ii) Income from damages for cancelled contracts |
| 561 |
|
|
|
(iii) Unappropriated sales revenue of contracts not eligible to revenue recognition |
| 33,141 |
(iv) Allowance for cancelled contracts (liabilities) |
|
|
Adjustments in appropriated revenues |
| 105,978 |
Adjustments in trade accounts receivable |
| 63,168 |
Income from damages for cancelled contracts |
| (17,124) |
Liabilities – return due to cancelled contracts |
| 25,686 |
|
|
|
(v) Unappropriated estimated costs of units sold |
|
|
Ventures under construction: |
|
|
(a) Estimated cost of units |
|
|
Incurred cost of units: |
| (828,549) |
Construction cost |
|
|
Cancelled contracts – construction costs |
| (531,732) |
(b) Net incurred cost |
| 13,454 |
Cost to be incurred of units sold (a+b) (b) |
| (518,278) |
(iii) Unappropriated estimated cost of units in inventory |
| |
Ventures under construction: |
| |
Estimated cost of units |
| (521,817) |
Incurred cost of units (Note 6) |
| 361,435 |
Unappropriated estimated cost |
| (160,382) |
(a) The unappropriated sales revenue of units sold are measured by the face value of contracts, plus the contract adjustments and deducted for cancellations, not considering the effects of the levied taxes and adjustment to present value, and do not include ventures that are subject to restriction due to a suspensive clause (legal period of 180 days in which the Company can cancel a development), and therefore is not appropriated to profit or loss.
(b) The estimated cost of units sold and in inventory to be incurred do not include financial charges, which are appropriated to properties for sale and profit or loss (cost of real estate sold) in proportion to the real estate units sold as they are incurred.
As of March 31, 2019, the percentage of assets consolidated in the quarterly information related to ventures included in the equity segregation structure of the development stood at 25.5% (25.1% in 2018).
68
(A free translation of the original report in Portuguese as published in Brazil)
Gafisa S.A.
Notes to the quarterly information
March 31, 2019
(Amounts in thousands of Brazilian Reais, except as otherwise stated)
30. Additional Information on the Statement of Cash Flows
(i) Transactions that did not affect Cash and Cash Equivalents
The Company and its subsidiaries performed the following investing and financing activities that did not affect cash and cash equivalents, which were not included in the statements of cash flows:
|
| Company | Consolidated | ||
|
| 03/31/2019 | 03/31/2018 | 03/31/2019 | 03/31/2018 |
|
|
|
|
|
|
Capital contribution (reduction) |
|
| (9) | - | (9) |
Capitalized financial charges (Note 12) |
| (5,559) | (5,549) | (8,658) | (10,865) |
Physical barter – Land (Note 17) |
| (1,966) | (5,122) | (3,422) | (5,141) |
|
| (7,525) | (10,680) | (12,080) | (16,015) |
(ii)Reconciliation of the asset and liability changes with the cash flows from financing activities
|
|
| Transactions affecting cash |
| Transactions not affecting cash |
| ||
Company |
| Opening balance 12/31/2018 | Funding/ Receipt | Interest Payment | Principal Payment |
| Interests and inflation adjustment | Closing balance 03/31/2019 |
|
|
|
|
|
|
|
|
|
Loans, financing and debentures (Notes 12 and 13) |
| (826,264) | (2,821) | 1,706 | 79,787 |
| 770 | (746,822) |
Loans (Note 21.1) |
| 12,958 | - | - | (905) |
| 861 | 12,914 |
Paid-in capital (Note 18.1) |
| (2,521,319) | - | - | - |
| - | (2,521,319) |
Capital reserve |
| (250,599) | - | - | - |
| - | (250,599) |
|
| (3,585,224) | (2,821) | 1,706 | 78,882 |
| 1,631 | (3,505,826) |
|
|
| Transactions affecting cash |
| Transactions not affecting cash |
| ||
Consolidated |
| Opening balance 12/31/2018 | Funding/ Receipt | Interest Payment | Principal Payment |
| Interests and inflation adjustment | Closing balance 03/31/2019 |
|
|
|
|
|
|
|
|
|
Loans, financing and debentures (Notes 12 and 13) |
| (889,412) | (7,011) | 2,904 | 103,551 |
| (204) | (790,172) |
Loans (Note 21.1) |
| 12,958 | - | - | (905) |
| 861 | 12,914 |
Paid-in capital (Note 18.1) |
| (2,521,319) | - | - | - |
| - | (2,521,319) |
Capital reserve (Note 18.1) |
| (250,599) | - | - | - |
| - | (250,599) |
|
| (3,648,372) | (7,011) | 2,904 | 102,646 |
| 657 | (3,549,176) |
31. Subsequent events
(i) Capital Increase
In the Board of Director’s meeting held on April 9, 2019, the increase in the Company’s capital by issuing new common shares within the authorized capital limit of 71,031,876 was approved. Such capital increase will be made by private subscription for issuing new shares, until the authorized capital limit.
The Company’s Board of Directors also approved the following details of such capital increase: (a) Price per share of R$6.02 (six Brazilian Reais and two cents), as validated by specialized company; (b) The shareholders who hold the Company’s common shares on April 23, 2019 will have (i) 30 (thirty)-day period to exercise their preemptive rights counted as from the publication date of the respective Notice by the Company, (ii) right to a discount of 15% (fifteen per cent) on the share price in the subscription of such capital increase within the 30 (thirty)-day period of preemptive rights, and (iii) preemptive right in the apportionment of the remaining shares and a discount of 3% (three per cent) on the subscription price of the apportionment of such remaining shares.
69
(A free translation of the original report in Portuguese as published in Brazil)
Gafisa S.A.
Notes to the quarterly information
March 31, 2019
(Amounts in thousands of Brazilian Reais, except as otherwise stated)
31. Subsequent events --Continued
(ii) 14th Debenture Issue
On April 14, 2019, the Company approved the 14th Private Placement of Non-convertible Debentures, with general guarantee, in sole series in the total amount of up to R$40,000, with final maturity in October 2020. The proceeds from the placement will be fully and solely used in the development of real estate ventures called “Gafisa Square Ipiranga” and “Moov Espaço Cerâmica”, and their guarantees are represented by the conditional sale of real estate receivables. The face value of the Placement will accrue interest corresponding to the cumulative variation of Interbank Deposit (DI) plus a surcharge equivalent to 5%p.a.
(iii) Extraordinary Shareholders’ Meeting
On April 15, 2019, the Extraordinary Shareholders’ Meeting of the Company was held, in which the following main resolutions were taken: (a) Suspension of the exercise of the shareholder rights of GWI Asset Management S.A. and other members of the GWI Group; (b) Authorization to the Board of Directors to commission a top-notch Bank or Consulting Company to prepare a new long-term Strategic Plan for the Company; (c) Establishment of the number of members to the Board of Directors at seven effective members; (d) Election of the members to the Board of Directors; (e) Proceed with the appropriate measures to issue cancelled shares; (f) Authorize the Board of Directors to approve the issue of new shares up to the current authorized capital limit, and evaluate the best funding options by issuing convertible or non-convertible securities to support the Strategic Plan to be prepared, and (g) Rejection of the measures taken for the voluntary delisting of shares on the New York Stock Exchange (NYSE) and of change to the American Depositary Shares program from Level 3 to Level 1.
On April 23, 2019, another Extraordinary Shareholders’ Meeting of the Company was held, in which the following resolution was taken: (a) Increase in the Company’s authorized capital limit from the current 71,031,876 common shares to 120,000,000 common shares.
(iv) Annual Shareholders’ Meeting
On April 27, 2018, the Annual Shareholders’ Meeting of the Company was held, in which the following main resolutions were taken: (a) Approval of the accounts of management members and the financial statements for the fiscal year ended December 31, 2018; and (b) Setting of the maximum aggregate compensation of management members for the year 2019.
(v) Re-issue of shares
On April 24, 2019, the Company disclosed a Notice to the Market informing about the re-issue of 1,400,325 shares of the Company, related to the previously cancelled shares, of which (i) 1,030,325 shares had been cancelled in the meeting of the Board of Directors on December 19, 2018; and (ii) 370,000 shares had been cancelled on January 22, 2019.
***
70
(A free translation of the original report in Portuguese as published in Brazil)
Gafisa S.A.
Quarterly information - March 31, 2019
Other information deemed relevant by the Company
1. SHAREHOLDERS HOLDING MORE THAN 5% OF THE VOTING CAPITAL AND TOTAL NUMBER OF OUTSTANDING SHARES
03/31/2019 | ||
Common shares | ||
Shareholder | Shares | % |
Outstanding shares | 32,978,902 | 75.42% |
Planner | 8,044,500 | 18.40% |
Treasury shares | 2,704,187 | 6.18% |
|
| |
Total shares | 43,727,589 | 100.00% |
03/31/2018 | ||
Common shares | ||
Shareholder | Shares | % |
Outstanding shares | 7,058,442 | 25.17% |
Citibank N.A. ADR Department | 6,749,056 | 24.07% |
GWI Asset Management S.A. | 6,283,496 | 22.41% |
Wishbone Management, LP | 4,825,000 | 17.21% |
River and Mercantille Management, LLP | 2,186,124 | 7.80% |
Treasury shares | 938,044 | 3.35% |
|
| |
Total shares | 28,040,162 | 100.00% |
71
(A free translation of the original report in Portuguese as published in Brazil)
Gafisa S.A.
Quarterly information - March 31, 2019
Other information deemed relevant by the Company
2. SHARES HELD BY PARENT COMPANIES, MANAGEMENT AND BOARD
03/31/2019 | ||
Common shares | ||
Shareholder | Shares | % |
Shareholders holding effective control of the Company | 0 | 0.00% |
Board of Directors | 44,758 | 0.10% |
Executive directors | 0 | 0.00% |
Executive control, board members, officers and fiscal council | 44,758 | 0.10% |
Treasury shares | 2,704,187 | 6.18% |
Outstanding shares in the market (*) | 40,978,144 | 93.71% |
|
| |
Total shares | 43,727,589 | 100.00% |
03/31/2018 | ||
Common shares | ||
Shareholder | Shares | % |
Shareholders holding effective control of the Company | 20,043,676 | 71.48% |
Board of Directors | 18,067 | 0.06% |
Executive directors | 111,372 | 0.40% |
Executive control, board members, officers and fiscal council | 21,173,115 | 71.94% |
Treasury shares | 938,044 | 3.35% |
Outstanding shares in the market (*) | 6,929,003 | 24.71% |
|
| |
Total shares | 28,040,162 | 100.00% |
(*) Excludes shares of effective control, management, board and in treasury.
72
(A free translation of the original report in Portuguese as published in Brazil)
Gafisa S.A.
Quarterly information - March 31, 2019
Other relevant information
3 – COMMITMENT CLAUSE
The Company, its shareholders, directors and board members undertake to settle, through arbitration, any and all disputes or controversies that may arise between them, related to or originating from, particularly, the application, validity, effectiveness, interpretation, breach and the effects thereof, of the provisions of Law No. 6404/76, the Company's By-Laws, the rules determined by the Brazilian Monetary Council (CMN), by the Central Bank of Brazil and by The Brazilian Securities and Exchange Commission (CVM) as well as the other rules that apply to the operations of the capital market in general, in addition to those established in the New Market Listing Regulation, Participation in the New Market Contract and in the Arbitration Regulations of the Chamber of Market Arbitration.
73
(A free translation of the original report in Portuguese as published in Brazil)
Gafisa S.A.
Quarterly information - March 31, 2019
INDEPENDENT AUDITOR’S REVIEW REPORT ON THE INTERIM FINANCIAL INFORMATION
To the Shareholders and Management of
Gafisa S.A.
São Paulo - SP
Introduction
We have reviewed the individual and consolidated interim financial information ofGafisa S.A. (“Company”), included in the Quarterly Information for the quarter ended March 31, 2019, which comprises the statement of financial position as at March 31, 2019 and the respective statements of operations, comprehensive income (loss), changes in equity, and cash flows for the quarter then ended, including the notes to the financial statements.
The Company’s management is responsible for the preparation of the individual interim financial information in accordance with Technical Pronouncement CPC 21 (R1) – Interim Statements and of the consolidated interim financial information in accordance with Technical Pronouncement CPC 21 (R1) – Interim Statements and with international standard IAS 34 - Interim Financial Reporting, applicable to entities of real estate development in Brazil registered with the Brazilian Securities and Exchange Commission (CVM), as well as for the presentation of this information in accordance with the standards issued by CVM, applicable to the preparation of the Quarterly Information. Our responsibility is to express a conclusion on this interim financial information based on our review.
Scope of the review
We conducted our review in accordance with Brazilian and international standards for reviewing interim information (NBC TR 2410 and ISRE 2410-ReviewofInterim FinancialInformationPerformedbytheIndependentAuditoroftheEntity). An interim review consists principally of applying analytical and other review procedures, and making enquiries of and having discussions with persons responsible for financial and accounting matters.An interim review is substantially less in scope than an audit conducted in accordance with auditing standards. An interim review does not provide assurance that we would become aware of any or all significant matters that might be identified in an audit.Accordingly, we do not express such an audit opinion.
Conclusion on the individual interim financial information
Based on our review, we are not aware of any fact that would lead us to believe that the individual interim financial information included in the Quarterly Information referred to above has not been prepared, in all material respects, in accordance with Technical Pronouncement CPC 21 (R1) – Interim Statements, applicable to entities of real estate development in Brazil registered with the CVM, as well as for the presentation of this information in accordance with the standards issued by CVM, applicable to the preparation of the Quarterly Information.
74
(A free translation of the original report in Portuguese as published in Brazil)
Gafisa S.A.
Quarterly information - March 31, 2019
Conclusion on the consolidated interim financial information
Based on our review, we are not aware of any fact that would leads us to believe that the consolidated interim financial information included in the Quarterly Information referred to above has not been prepared, in all material respects, in accordance with Technical Pronouncement CPC 21 (R1) – Interim Statements, and with the international standard IAS 34 - Interim Financial Reporting, applicable to entities of real estate development in Brazil registered with the CVM, as well as for the presentation of this information in accordance with the standards issued by CVM, applicable to the preparation of the Quarterly Information.
Emphasis
As described in Note 2.1, the individual interim financial information included in the Quarterly Information has been prepared in accordance with Technical Pronouncement CPC 21 (R1) – Interim Statements, and the consolidated interim financial information included in the Quarterly Information has been prepared in accordance with Technical Pronouncement CPC 21 (R1) – Interim Statements, and with the international standard IAS 34 - Interim Financial Reporting, applicable to entities of real estate development in Brazil registered with CVM. Accordingly, the determination of the accounting policy adopted by the Company for the recognition of revenue in sale and purchase contracts of non-completed real estate units, related to aspects of the transfer of control, follow the understanding of the Company’s management as for the compliance with CPC 47 in line with that established by CVM in Circular Letter CVM/SNC/SEP/No. 02/2018. Our opinion is not qualified in respect of this matter.
Other matters
Review of the amounts for the quarter ended March 31, 2018
The individual and consolidated interim financial information ofGafisa S.A., included in the Quarterly Information, mentioned in the first paragraph includes the financial information corresponding to the statements of operations, comprehensive income (loss), changes in equity, cash flows and value added for the quarter ended March 31, 2018, obtained from its quarterly information for that quarter, presented for comparison purposes. The review of the Quarterly Information for the quarter ended March 31, 2018, was conducted under the responsibility of other independent auditors, and their report thereon, dated May 10, 2018, was unmodified.
In view of the adjustments related to the recognition of the provision for cancellation of contracts upon the adoption of Circular Letter/CVM/SNC/SEP/No. 02/2018, which addresses the procedures for revenue recognition in sale and purchase agreements of non-completed real estate units in Brazilian real estate public companies, retrospectively adopted by the Company, as described in Note 2.2 to the interim financial information, certain balances of the statements of operations, comprehensive income (loss), changes in equity and cash flows, individual and consolidated, for the quarter ended March 31, 2018, presented for comparison purposes, were modified.
75
(A free translation of the original report in Portuguese as published in Brazil)
Gafisa S.A.
Quarterly information - March 31, 2019
The amounts corresponding to the Statements of Value Added (DVA), individual and consolidated, for the quarter ended March 31, 2018, originally prepared before the adjustments described in Note 2.2, were submitted to the same review procedures by those independent auditors and based on their review, they were not aware of any fact that would lead them to believe that the DVA has not been fairly stated, in all material respects, consistently in relation to the individual and consolidated interim financial information taken as a whole.
As part of our review of the interim financial information for the quarter ended March 31, 2019, we have also reviewed the adjustments described in Note 2.2 to the interim financial information, and we are not aware of any fact that would leads us to believe that such adjustments have not been made accordingly. We were not engaged to audit, review or apply any other procedures on the individual and consolidated interim financial information ofGafisa S.A., included in the Quarterly Information for the quarter ended March 31, 2018 and, accordingly, we do not issue an opinion or provide any form of assurance on the mentioned interim financial information taken as a whole.
Statements of value added
The quarterly information referred to above includes the individual and consolidated statements of value added for the quarter ended March 31, 2019, prepared under the responsibility of the Company's Management and presented as supplementary information for the purposes of IAS 34 applicable to entities of real estate development in Brazil registered with the CVM. These statements were submitted to review procedures carried out along with the review of the quarterly information, aiming to conclude if they are in accordance with the interim financial information and accounting records, as applicable, and if its form and contents are in accordance with the criteria established in Technical Pronouncement 09 – Statement of value added. Based on our review, we are not aware of any fact that would lead us to believe that these statements were not prepared in all material respects in accordance with the criteria established in this Technical Pronouncement and consistently with the individual and consolidated interim financial information taken as whole.
São Paulo, May 14, 2019.
|
|
BDO RCSAuditoresIndependentes SS CRC 2 SP 013846/O-1 |
|
|
|
Julian Clemente |
|
Accountant CRC 1 SP 197232/O-6 |
|

76
(A free translation of the original report in Portuguese as published in Brazil)
Gafisa S.A.
Quarterly information - March 31, 2019
Reports and statements / Management statement of interim financial information
Management statement of interim financial information
STATEMENT
The management of Gafisa S.A., CNPJ 01.545.826/0001-07, located at Av. Presidente Juscelino Kubitschek, nº 1.830, conjunto comercial nº 32, 3o andar, Bloco 2, in the city and state of São Paulo, Brazil, states as per Article 25 of CVM Instruction 480 issued on December 7, 2009 that:
i) Management has reviewed, discussed and agreed with the auditor’s conclusion expressed on the report on review interim financial Information for the period ended March 31, 2019; and
ii) Management has reviewed and agreed with the interim information for the period ended March 31, 2019.
São Paulo, May 14, 2019.
GAFISA S.A.
Management
77
(A free translation of the original report in Portuguese as published in Brazil)
Gafisa S.A.
Quarterly information - March 31, 2019
Reports and Statements / Management statement on the report on review of interim financial information
Management Statement on the Review Report
STATEMENT
The management of Gafisa S.A., CNPJ 01.545.826/0001-07, located at Av. Presidente Juscelino Kubitschek, nº 1.830, conjunto comercial nº 32, 3o andar, Bloco 2, in the city and state of São Paulo, Brazil, states as per Article 25 of CVM Instruction 480 issued in December 7, 2009 that:
i) Management has reviewed, discussed and agreed with the auditor’s conclusion expressed on the report on review interim financial Information for the period ended March 31, 2019; and
ii) Management has reviewed and agreed with the interim information for the period ended March 31, 2019.
São Paulo, May 14, 2019.
GAFISA S.A.
Management
78
SIGNATURE
Gafisa S.A. | |
| By: | /s/ Roberto Portella |
Name: Roberto Portella Title: Chief Executive Officer | |