SECURITIES AND EXCHANGE COMMISSION
Washington, D.C. 20549
FORM 6-K
REPORT OF FOREIGN ISSUER
PURSUANT TO RULE 13a-16 OR 15d-16 OF THE
SECURITIES EXCHANGE ACT OF 1934
For the month of December, 2020
(Commission File No. 001-33356),
Gafisa S.A.
(Translation of Registrant's name into English)
Av. Juscelino Kubitschek 1830 |03º andar| Conj. 32 Torre 2 - Cond. São Luiz
São Paulo, SP, 04543- 000
Federative Republic of Brazil
(Address of principal executive office)
Indicate by check mark whether the registrant files or will file
annual reports under cover Form 20-F or Form 40-F.
Form 20-F ___X___ Form 40-F ______
Indicate by check mark if the registrant is submitting
the Form 6-K in paper as permitted by Regulation S-T Rule 101(b)(1)
Yes ______ No ___X___
Indicate by check mark if the registrant is submitting
the Form 6-K in paper as permitted by Regulation S-T Rule 101(b)(7):
Yes ______ No ___X___
Indicate by check mark whether by furnishing the information contained in this Form,
the Registrant is also thereby furnishing the information to the Commission pursuant
to Rule 12g3-2(b) under the Securities Exchange Act of 1934:
Yes ______ No ___X___
If “Yes” is marked, indicate below the file number assigned
to the registrant in connection with Rule 12g3-2(b): N/A
Gafisa S.A.
Quarterly information
September 30, 2020
(A free translation of the original report in Portuguese as published in
Brazil containing Quarterly Information (ITR) prepared in
accordance with the accounting practices adopted in Brazil).
| Company data | ||
| Capital Composition | 3 | |
| Individual financial statements | ||
| Balance sheet - Assets | 4 | |
| Balance sheet - Liabilities | 5 | |
| Statement of income | 6 | |
| Statement of comprehensive income (loss) | 7 | |
| Statement of cash flow | 8 | |
| Statements of changes in equity | ||
| 01/01/2020 to 09/30/2020 | 9 | |
| 01/01/2019 to 09/30/2019 | 10 | |
| Statement of value added | 11 | |
| Consolidated financial statements | ||
| Balance sheet - Assets | 12 | |
| Balance sheet - Liabilities | 13 | |
| Statement of income | 15 | |
| Statement of comprehensive income (loss) | 16 | |
| Statement of cash flow | 17 | |
| Statements of changes in equity | ||
| 01/01/2020 to 09/30/2020 | 18 | |
| 01/01/2019 to 09/30/2019 | 19 | |
| Statement of value added | 20 | |
| Comments on performance | 21 | |
| Notes to the quartely information | 43 | |
| Other information deemed relevant by the Company | 74 | |
| Reports and statements | ||
| Independent auditors' report on the review of the quarterly information | 77 | |
| 80 | ||
| Management statement of interim financial information | ||
| Management statement on the report n review of interim financial information | 81 |
COMPANY DATA / CAPITAL COMPOSITION
| Number of Shares | CURRENT QUARTER | |
| (in thousands) | 09/30/2020 | |
| Paid-in Capital | ||
| Common | 290,732 | |
| Preferred | 0 | |
| Total | 290,732 | |
| Treasury shares | ||
| Common | 342 | |
| Preferred | 0 | |
| Total | 342 | |
INDIVIDUAL FINANCIAL STATEMENTS - BALANCE SHEET - LIABILITIES AND EQUITY (in thousands of Brazilian Reais)
CODE | DESCRIPTION | ACTUAL QUARTER 9/30/2020 | PRIOR YEAR 12/31/2019 |
| 1 | Total Assets | 2,954,304 | 2,504,512 |
| 1.01 | Current Assets | 1,652,693 | 1,334,900 |
| 1.01.01 | Cash and cash equivalents | 43 | 810 |
| 1.01.01.01 | Cash and banks | 43 | 810 |
| 1.01.02 | Short-term investments | 619,025 | 401,243 |
| 1.01.02.01 | Fair value of short-term investments | 619,025 | 401,243 |
| 1.01.03 | Accounts receivable | 340,903 | 361,649 |
| 1.01.03.01 | Trade accounts receivable | 340,903 | 361,649 |
| 1.01.03.01.01 | Receivables from clients of developments | 304,312 | 347,158 |
| 1.01.03.01.02 | Receivables from clients of construction and services rendered | 36,591 | 14,491 |
| 1.01.04 | Inventories | 528,437 | 490,419 |
| 1.01.04.01 | Properties for sale | 528,437 | 490,419 |
| 1.01.07 | Prepaid expenses | 416 | 1,227 |
| 1.01.07.01 | Prepaid expenses and others | 416 | 1,227 |
| 1.01.08 | Other current assets | 162,869 | 79,552 |
| 1.01.08.01 | Non current assets held for sale | 3,709 | 3,709 |
| 1.01.08.03 | Others | 159,160 | 75,843 |
| 1.01.08.03.01 | Other assets | 65,760 | 52,455 |
| 1.01.08.03.03 | Receivables from related parties | 93,400 | 23,388 |
| 1.02 | Non current assets | 1,302,611 | 1,169,612 |
| 1.02.01 | Non current assets | 348,567 | 469,268 |
| 1.02.01.04 | Accounts receivable | 73,142 | 98,368 |
| 1.02.01.04.01 | Receivables from clients of developments | 73,142 | 98,368 |
| 1.02.01.05 | Inventories | 116,194 | 230,049 |
| 1.02.01.05.01 | Properties for sale | 116,194 | 230,049 |
| 1.02.01.10 | Others non current assets | 159,231 | 140,851 |
| 1.02.01.10.03 | Other assets | 118,160 | 107,435 |
| 1.02.01.10.04 | Receivables from related parties | 41,071 | 33,416 |
| 1.02.02 | Investments | 942,229 | 681,645 |
| 1.02.02.01 | Investments | 942,229 | 681,645 |
| 1.02.03 | Property and equipment | 6,805 | 12,147 |
| 1.02.03.01 | Operation property and equipment | 6,805 | 12,147 |
| 1.02.04 | Intangible assets | 5,010 | 6,552 |
| 1.02.04.01 | Intangible assets | 5,010 | 6,552 |
INDIVIDUAL FINANCIAL STATEMENTS - BALANCE SHEET - LIABILITIES AND EQUITY (in thousands of Brazilian Reais)
CODE | DESCRIPTION | ACTUAL QUARTER 9/30/2020 | PRIOR YEAR 12/31/2019 |
| 2 | Total Liabilities | 2,954,304 | 2,504,512 |
| 2.01 | Current liabilities | 1,153,854 | 1,237,207 |
| 2.01.01 | Social and labor obligations | 10,342 | 11,963 |
| 2.01.01.02 | Labor obligations | 10,342 | 11,963 |
| 2.01.02 | Suppliers | 65,995 | 79,106 |
| 2.01.03 | Tax obligations | 62,217 | 58,556 |
| 2.01.03.01 | Federal tax obligations | 62,217 | 58,556 |
| 2.01.04 | Loans and financing | 427,681 | 541,826 |
| 2.01.04.01 | Loans and financing | 300,534 | 383,647 |
| 2.01.04.01.01 | Loans and financing in local currency | 300,534 | 383,647 |
| 2.01.04.02 | Debentures | 127,147 | 158,179 |
| 2.01.05 | Other obligations | 396,987 | 406,133 |
| 2.01.05.01 | Payables to related parties | 186,301 | 191,364 |
| 2.01.05.02 | Others | 210,686 | 214,769 |
| 2.01.05.02.04 | Obligations for purchase of properties and advances from customers | 66,660 | 89,825 |
| 2.01.05.02.06 | Other payables | 132,183 | 110,189 |
| 2.01.05.02.07 | Obligations assumed on the assignment of receivables | 11,843 | 14,755 |
| 2.01.06 | Provisions | 190,632 | 139,623 |
| 2.01.06.01 | Tax, labor and civil lawsuits | 190,632 | 139,623 |
| 2.01.06.01.01 | Tax lawsuits | 44 | 1,995 |
| 2.01.06.01.02 | Labor lawsuits | 25,096 | 30,699 |
| 2.01.06.01.04 | Civil lawsuits | 165,492 | 106,929 |
| 2.02 | Non current liabilities | 290,826 | 373,597 |
| 2.02.01 | Loans and financing | 145,698 | 146,375 |
| 2.02.01.01 | Loans and financing | 120,118 | 107,029 |
| 2.02.01.01.01 | Loans and financing in local currency | 120,118 | 107,029 |
| 2.02.01.02 | Debentures | 25,580 | 39,346 |
| 2.02.02 | Other liabilities | 55,788 | 91,250 |
| 2.02.02.02 | Others | 55,788 | 91,250 |
| 2.02.02.02.03 | Obligations for purchase of properties and advances from customers | 40,692 | 68,515 |
| 2.02.02.02.04 | Other liabilities | 4,484 | 6,272 |
| 2.02.02.02.06 | Obligations assumed on the assignment of receivables | 10,612 | 16,463 |
| 2.02.03 | Deferred taxes | 12,114 | 12,114 |
| 2.02.03.01 | Deferred income tax and social contribution | 12,114 | 12,114 |
| 2.02.04 | Provisions | 77,226 | 123,858 |
| 2.02.04.01 | Tax, labor and civel lawsuits | 77,226 | 123,858 |
| 2.02.04.01.01 | Tax lawsuits | 1 | 687 |
| 2.02.04.01.02 | Tax and labor lawsuits | 4,478 | 3,149 |
| 2.02.04.01.04 | Civil lawsuits | 72,747 | 120,022 |
| 2.03 | Equity | 1,509,624 | 893,708 |
| 2.03.01 | Capital | 1,041,248 | 2,926,280 |
| 2.03.02 | Capital Reserves | 335,162 | 294,094 |
| 2.03.02.05 | Treasury shares | (2,634) | (43,517) |
| 2.03.02.07 | Constitution of capital reserve | 250,599 | 250,599 |
| 2.03.02.09 | Reserve for granting stock options | 87,197 | 87,012 |
| 2.03.05 | Retained earnings/accumulated losses | 133,214 | (2,326,666) |
INDIVIDUAL FINANCIAL STATEMENTS - INCOME - (in thousands of Brazilian Reais)
CODE | DESCRIPTION | ACTUAL QUARTER 07/01/2020 to 09/30/2020 | YEAR TO DATE 01/01/2020 to 09/30/2020 | SAME QUARTER FROM PREVIOUS YEAR 07/01/2019 to 09/30/2019 | YEAR TO DATE FROM PREVIOUS YEAR 01/01/2019 to 09/30/2019 |
| 3.01 | Gross Sales and/or Services | 96,026 | 215,419 | 69,329 | 235,665 |
| 3.01.01 | Revenue from real estate development | 105,150 | 235,487 | 75,946 | 256,393 |
| 3.01.03 | Taxes on real estate sales and services | (9,124) | (20,068) | (6,617) | (21,728) |
| 3.02 | Cost of sales and/or services | (71,322) | (157,819) | (41,009) | (162,614) |
| 3.02.01 | Cost of real estate development | (71,322) | (157,819) | (41,009) | (162,614) |
| 3.03 | Gross profit | 24,704 | 57,600 | 28,320 | 73,051 |
| 3.04 | Operating expenses/income | (52,607) | (122,562) | (7,206) | (86,612) |
| 3.04.01 | Selling expenses | (2,022) | (6,158) | (1,633) | (9,585) |
| 3.04.02 | General and administrative expenses | (19,543) | (51,136) | (11,053) | (26,136) |
| 3.04.05 | Other operating expenses | (26,394) | (61,608) | (2,607) | (55,877) |
| 3.04.05.01 | Depreciation and amortization | (1,610) | (5,373) | (2,848) | (10,625) |
| 3.04.05.02 | Other operating expenses | (24,784) | (56,235) | 178 | (45,252) |
| 3.04.06 | Income from equity method investments | (4,648) | (3,660) | 8,150 | (4,986) |
| 3.05 | Income (loss) before financial results and income taxes | (27,903) | (64,962) | 21,114 | (13,561) |
| 3.06 | Financial | (28,590) | (40,538) | (22,782) | (47,185) |
| 3.06.02 | Financial expenses, net | (28,590) | (40,538) | (22,782) | (47,185) |
| 3.06.02.01 | Financial expenses, net | (28,590) | (40,538) | (22,782) | (47,185) |
| 3.07 | Income before income taxes | (56,493) | (105,500) | (1,668) | (60,746) |
| 3.09 | Income (loss) from continuing operation | (56,493) | (105,500) | (1,668) | (60,746) |
| 3.11 | Income (loss) for the period | (56,493) | (105,500) | (1,668) | (60,746) |
| 3.99 | Earnings per Share – (Reais / Share) | - | - | - | - |
| 3.99.01 | Basic Earnings per Share | - | - | - | - |
| 3.99.01.01 | ON | (0,39011) | (0,72852) | (0,03189) | (1,16151) |
| 3.99.02 | Diluted Earnings per Share | - | - | - | - |
| 3.99.02.01 | ON | (0,39011) | (0,72852) | (0,03189) | (1,16151) |
INDIVIDUAL FINANCIAL STATEMENTS - COMPREHENSIVE INCOME (LOSS) - (in thousands of Brazilian Reais)
CODE | DESCRIPTION | ACTUAL QUARTER 0701/2020 to 09/30/2020 | YEAR TO DATE 01/01/2020 to 09/30/2020 | SAME QUARTER FROM PREVIOUS YEAR 07/01/2019 to 09/30/2019 | YEAR TO DATE FROM PREVIOUS YEAR 01/01/2019 to 09/30/2019 |
| 4.01 | Income (loss) for the period | (56,493) | (105,500) | (1,668) | (60,746) |
| 4.03 | Comprehensive income (loss) for the period | (56,493) | (105,500) | (1,668) | (60,746) |
INDIVIDUAL FINANCIAL STATEMENTS - CASH FLOWS - INDIRECT METHOD - (in thousands of Brazilian Reais)
CODE | DESCRIPTION | YEAR TO DATE 01/01/2020 to 09/30/2020 | YEAR TO DATE FROM PREVIOUS YEAR 01/01/2019 to 09/30/2019 |
| 6.01 | Net cash from operating activities | (84,850) | (32,500) |
| 6.01.01 | Cash generated in the operations | (21,780) | (59,275) |
| 6.01.01.01 | Income (loss) before income and social contribution taxes | (105,500) | (60,746) |
| 6.01.01.02 | Income from equity method investments | (3,660) | (4,986) |
| 6.01.01.03 | Stock options expenses | (362) | (2,698) |
| 6.01.01.04 | Unrealized interest and finance charges, net | 1,382 | 1,902 |
| 6.01.01.06 | Depreciation and amortization | 5,373 | 10,625 |
| 6.01.01.07 | Provision for legal claims | 51,127 | 45,378 |
| 6.01.01.08 | Provision for profit sharing | 6,194 | 500 |
| 6.01.01.09 | Warranty provision | 1,102 | (3,918) |
| 6.01.01.11 | Allowance for doubtful accounts | 15,347 | (17,116) |
| 6.01.01.12 | Provision for realization of non-financial assets - properties for sale | (921) | (28,222) |
| 6.01.01.13 | Provision for penalties due to delay in construction works | 832 | 754 |
| 6.01.01.15 | Payable for sale of shares | 0 | (748) |
| 6.01.02 | Variation in assets and liabilities | (63,070) | 91,775 |
| 6.01.02.01 | Trade accounts receivable | 21,862 | 117,528 |
| 6.01.02.02 | Properties for sale | 76,758 | 129,393 |
| 6.01.02.03 | Other accounts receivable | (17,806) | (32,574) |
| 6.01.02.04 | Prepaid expenses | 811 | 677 |
| 6.01.02.05 | Obligations for purchase of properties and adv. from customers | (50,988) | (51,007) |
| 6.01.02.06 | Taxes and contributions | 3,660 | 8,734 |
| 6.01.02.07 | Suppliers | (12,981) | (13,126) |
| 6.01.02.08 | Salaries and payable charges | (7,816) | (1,898) |
| 6.01.02.09 | Transactions with related parties | 380 | 4,763 |
| 6.01.02.10 | Other obligations | (76,950) | (70,715) |
| 6.02 | Net cash from investing activities | (216,217) | (281,653) |
| 6.02.01 | Purchase of property and equipment and intangible assets | 1,511 | (4,333) |
| 6.02.03 | Redemption of short-term investments | 262,076 | 34,040 |
| 6.02.04 | Purchase of short-term investments | (479.858) | (311,360) |
| 6.03 | Net cash from financing activities | 300,354 | 224,086 |
| 6.03.01 | Capital increase | 477.900 | 132,266 |
| 6.03.02 | Increase in loans, financing and debentures | 80,333 | 81,163 |
| 6.03.03 | Payment of loans, financing and debentures | (196,523) | (193,285) |
| 6.03.06 | Loan transactions with related parties | (80,607) | (10,117) |
| 6.03.08 | Disposal of treasury shares | 0 | 148 |
| 6.03.09 | Result of the disposal of treasury shares | 19,251 | 6,984 |
| 6.03.12 | Constitution of reserves | 0 | 206,927 |
| 6.05 | Net increase (decrease) of cash and cash equivalents | (767) | (22,935) |
| 6.05.01 | Cash and cash equivalents at the beginning of the period | 810 | 29,180 |
| 6.05.02 | Cash and cash equivalents at the end of the period | 43 | 4,112 |
| INDIVIDUAL STATEMENT OF CHANGES IN EQUITY FROM 01/01/2020 TO 09/30/2020 (in thousands of Brazilian reais) |
CODE | DESCRIPTION | Capital | Capital reserves, stock options and treasury shares | Profit reserves | Retained earnings | Other comprehensive income | Total Equity |
| 5.01 | Opening balance | 2,926,280 | 294,094 | - | (2,326,666) | - | 893,708 |
| 5.03 | Opening adjusted balance | 2,926,280 | 294,094 | - | (2,326,666) | - | 893,708 |
| 5.04 | Capital transactions with shareholders | (1,885,032) | 41,068 | - | 2,565,380 | - | 721,416 |
| 5.04.01 | Capital increase | 700,001 | - | - | - | - | 700,001 |
| 5.04.03 | Stock option plan | - | 184 | - | - | - | 184 |
| 5.04.05 | Treasury shares sold | - | 40,884 | - | (19,635) | - | 21,231 |
| 5.04.08 | Capital reduction | (2,585,033) | - | - | 2,585,033 | - | - |
| 5.05 | Total of comprehensive income (loss) | - | - | - | (105,500) | - | (105,500) |
| 5.05.01 | Net income (loss) for the period | - | - | - | (105,500) | - | (105,500) |
| 5.07 | Closing balance | 1,041,248 | 355,162 | - | 133,214 | - | 1,509,624 |
INDIVIDUAL STATEMENT OF CHANGES IN EQUITY FROM 01/01/2019 TO 09/30/2019 (in thousands of Brazilian reais)
CODE | DESCRIPTION | Capital | Capital reserves, stock options and treasury shares | Profit reserves | Retained earnings | Other comprehensive income | Total Equity |
| 5.01 | Opening balance | 2,521,319 | 278,401 | 0 | (2,308,403) | 0 | 491,317 |
| 5.03 | Opening adjusted balance | 2,521,319 | 278,401 | 0 | (2,308,403) | 0 | 491,317 |
| 5.04 | Capital transactions with shareholders | 132,265 | 220,590 | 0 | (3,267) | 0 | 349,588 |
| 5.04.01 | Capital increase | 132,265 | 0 | 0 | - | 0 | 132,265 |
| 5.04.03 | Stock option plan | 0 | 355 | 0 | - | 0 | 355 |
| 5.04.05 | Treasury shares sold | 0 | 141 | 0 | 7 | 0 | 148 |
| 5.04.08 | Treasury shares cancelled | 0 | 5,747 | 0 | (5,747) | 0 | - |
| 5.04.09 | Treasury shares reissued | 0 | (20,671) | 0 | 20,671 | 0 | - |
| 5.04.10 | Share repurchase program | 0 | 28,091 | 0 | (18,198) | 0 | 9,893 |
| 5.04.11 | Advance for future capital increase | 0 | 206,927 | 0 | (59,078) | 0 | 206,927 |
| 5.05 | Total of comprehensive income (loss) | 0 | 0 | 0 | (60,746) | 0 | (60,746) |
| 5.05.01 | Net income (loss) for the period | 0 | 0 | 0 | (60,746) | 0 | (60,746) |
| 5.07 | Closing balance | 2,653,584 | 498,991 | 0 | (2,372,416) | 0 | 780,159 |
INDIVIDUAL STATEMENT OF VALUE ADDED (in thousands of Brazilian Reais)
CODE | DESCRIPTION | YEAR TO DATE 01/01/2020 to 09/30/2020 | YEAR TO DATE FROM PREVIOUS YEAR 01/01/2019 to 09/30/2019 |
| 7.01 | Revenue | 235,487 | 257,393 |
| 7.01.01 | Real estate development, sales and services | 250,834 | 240,277 |
| 7.01.04 | Allowance for doubtful accounts | (15,347) | 17,116 |
| 7.02 | Inputs acquired from third parties | (218,867) | (191,772) |
| 7.02.01 | Cost of Sales and/or Services | (141,109) | (140,857) |
| 7.02.02 | Materials, energy, outsourced labor and other | (77,758) | (50,915) |
| 7.03 | Gross value added | 16,620 | 65,621 |
| 7.04 | Retentions | (5,373) | (10,625) |
| 7.04.01 | Depreciation and amortization | (5,373) | (10,625) |
| 7.05 | Net value added produced by the Company | 11,247 | 54,996 |
| 7.06 | Added value received on transfer | 17,962 | 16,448 |
| 7.06.01 | Income from equity method investments | (3,660) | 4,986 |
| 7.06.02 | Financial income | 21,622 | 11,462 |
| 7.07 | Value added total to be distributed | 29,209 | 71,444 |
| 7.08 | Value added distribution | 29,209 | 71,444 |
| 7.08.01 | Personnel and payroll charges | 27.972 | 22,139 |
| 7.08.01.01 | Direct remuneration | 27.972 | 22,139 |
| 7.08.02 | Taxes and contributions | 25,686 | 26,971 |
| 7.08.02.01 | Federal | 25,686 | 26,971 |
| 7.08.03 | Compensation – Interest | 81.051 | 83,080 |
| 7.08.03.01 | Interest | 78.870 | 80,404 |
| 7.08.03.02 | Rent | 2,181 | 2,676 |
| 7.08.04 | Compensation – Company capital | (105,500) | (60,746) |
| 7.08.04.03 | Net income (Retained losses) | (105,500) | (60,746) |
CONSOLIDATED FINANCIAL STATEMENTS - BALANCE SHEET - ASSETS (in thousands of Brazilian Reais)
CODE | DESCRIPTION | ACTUAL QUARTER 9/30/2020 | PRIOR YEAR 12/31/2019 | |||
| 1 | Total Assets | 3,445,750 | 2,551,887 | |||
| 1.01 | Current Assets | 2,648,455 | 1,800,168 | |||
| 1.01.01 | Cash and cash equivalents | 6,705 | 12,435 | |||
| 1.01.01.01 | Cash and banks | 6,705 | 12,435 | |||
| 1.01.02 | Short-term investments | 623,995 | 401,895 | |||
| 1.01.02.01 | Fair value of short-term investments | 623,995 | 401,895 | |||
| 1.01.03 | Accounts receivable | 544,147 | 445,303 | |||
| 1.01.03.01 | Trade accounts receivable | 544,147 | 445,303 | |||
| 1.01.03.01.01 | Receivables from clients of developments | 507,399 | 430,664 | |||
| 1.01.03.01.02 | Receivables from clients of construction and services rendered | 36,748 | 14,639 | |||
| 1.01.04 | Inventories | 1,317,144 | 786,660 | |||
| 1.01.04.01 | Properties for sale | 1,317,144 | 786,660 | |||
| 1.01.07 | Prepaid expenses | 1,405 | 1,860 | |||
| 1.01.07.01 | Prepaid expenses and others | 1,405 | 1,860 | |||
| 1.01.08 | Other current assets | 155,449 | 152,015 | |||
| 1.01.08.01 | Non current assets for sale | 7,014 | 7,014 | |||
| 1.01.08.03 | Others | 148,435 | 145,001 | |||
| 1.01.08.03.01 | Other accounts receivable and others | 146,125 | 67,395 | |||
| 1.01.08.03.03 | Derivative financial instruments | 2,310 | 77,606 | |||
| 1.02 | Non current assets | 797,305 | 751,719 | |||
| 1.02.01 | Non current assets | 503,511 | 591,674 | |||
| 1.02.01.04 | Accounts receivable | 86,843 | 112,135 | |||
| 1.02.01.04.01 | Receivables from clients of developments | 86,843 | 112,135 | |||
| 1.02.01.05 | Inventories | 191,985 | 279,207 | |||
| 1.02.01.05.01 | Properties for sale | 191,985 | 279,207 | |||
| 1.02.01.10 | Others non current assets | 224,683 | 200,332 | |||
| 1.02.01.10.03 | Other assets | 124,946 | 166,916 | |||
| 1.02.01.10.04 | Receivables from related parties | 99,737 | 33,416 | |||
| 1.02.02 | Investments | 272,497 | 138,802 | |||
| 1.02.02.01 | Interest in associates and affiliates | 272,497 | 138,802 | |||
| 1.02.03 | Property and equipment | 15,935 | 14,159 | |||
| 1.02.03.01 | Operation property and equipment | 15,935 | 14,159 | |||
| 1.02.04 | Intangible assets | 5,362 | 7,084 | |||
| 1.02.04.01 | Intangible assets | 5,362 | 7,084 | |||
CONSOLIDATED FINANCIAL STATEMENTS - BALANCE SHEET - LIABILITIES AND EQUITY (in thousands of Brazilian Reais)
CODE | DESCRIPTION | ACTUAL QUARTER 9/30/2020 | PRIOR YEAR 12/31/2019 |
| 2 | Total Liabilities | 3,445,750 | 2,551,887 |
| 2.01 | Current liabilities | 1,440,307 | 1,252,402 |
| 2.01.01 | Social and labor obligations | 10,774 | 12,291 |
| 2.01.01.02 | Labor obligations | 10,774 | 12,291 |
| 2.01.02 | Suppliers | 1331,054 | 95,450 |
| 2.01.03 | Tax obligations | 82,979 | 69,868 |
| 2.01.03.01 | Federal tax obligations | 82,979 | 69,868 |
| 2.01.04 | Loans and financing | 476,495 | 584,303 |
| 2.01.04.01 | Loans and financing | 349,348 | 426,124 |
| 2.01.04.01.01 | In Local Currency | 349,348 | 426,124 |
| 2.01.04.02 | Debentures | 127,147 | 158,179 |
| 2.01.05 | Other obligations | 545,648 | 349,755 |
| 2.01.05.01 | Payables to related parties | 92,228 | 64,384 |
| 2.01.05.02 | Others | 453,420 | 285,371 |
| 2.01.05.02.04 | Obligations for purchase of properties and advances from customers | 259,336 | 129,353 |
| 2.01.05.02.06 | Other payables | 178,550 | 135,492 |
| 2.01.05.02.07 | Obligations assumed on the assignment of receivables | 15,534 | 20,526 |
| 2.01.06 | Provisions | 193,357 | 140,735 |
| 2.01.06.01 | Tax, labor and civel lawsuits | 193,357 | 140,735 |
| 2.01.06.01.01 | Tax lawsuits | 2,131 | 1,995 |
| 2.01.06.01.02 | Labor lawsuits | 25,096 | 31,593 |
| 2.01.06.01.04 | Civel lawsuits | 166,130 | 107,147 |
| 2.02 | Non current liabilities | 491,553 | 404,342 |
| 2.02.01 | Loans and financing | 269,003 | 146,375 |
| 2.02.01.01 | Loans and financing | 153,340 | 107,029 |
| 2.02.01.01.01 | Loans and financing in local currency | 153,340 | 107,029 |
| 2.02.01.02 | Debentures | 115,663 | 39,346 |
| 2.02.02 | Other obligations | 124,186 | 121,975 |
| 2.02.02.02 | Others | 124,186 | 121,975 |
| 2.02.02.02.03 | Obligations for purchase of properties and advances from customers | 87,942 | 93,075 |
| 2.02.02.02.04 | Other payables | 21,884 | 9,065 |
| 2.02.02.02.06 | Obligations assumed on the assignment of receivables | 14,360 | 19,835 |
| 2.02.03 | Deferred taxes | 12,114 | 12,114 |
| 2.02.03.01 | Deferred income tax and social contribution | 12,114 | 12,114 |
| 2.02.04 | Provisions | 86,250 | 123,878 |
| 2.02.04.01 | Tax, labor and civel lawsuits | 86,250 | 123,878 |
| 2.02.04.01.01 | Tax lawsuits | 98 | 707 |
| 2.02.04.01.02 | Labor lawsuits | 7,280 | 3,149 |
| 2.02.04.01.04 | Civel lawsuits | 78,872 | 120,022 |
| 2.03 | Equity | 1,513,890 | 895,143 |
| 2.03.01 | Capital | 1,041,248 | 2,926,280 |
| 2.03.01.01 | Share Capital | 1,041,248 | 2,926,280 |
| 2.03.02 | Capital Reserves | 2225,162 | 294,094 |
| 2.03.02.05 | Treasury shares | (2,634) | (43,517) |
| 2.03.02.07 | Constitution of capital reserve | 250,599 | 250,599 |
| 2.03.02.09 | Reserve for granting stock options | 87,197 | 87,012 |
CONSOLIDATED FINANCIAL STATEMENTS - BALANCE SHEET - LIABILITIES AND EQUITY (in thousands of Brazilian Reais) |
| CODE | DESCRIPTION | ACTUAL QUARTER 9/30/2020 | PRIOR YEAR 12/31/2019 |
| 2.03.05 | Retained earnings/accumulated losses | 133,214 | (2,326,666) |
| 2.03.09 | Non-controlling interest | 4,266 | 1,435 |
CONSOLIDATED FINANCIAL STATEMENTS - INCOME - (in thousands of Brazilian Reais)
CODE | DESCRIPTION | ACTUAL QUARTER 07/01/2020 to 09/30/2020 | YEAR TO DATE 01/01/2020 to 09/30/2020 | SAME QUARTER FROM PREVIOUS YEAR 07/01/2019 to 09/30/2019 | YEAR TO DATE FROM PREVIOUS YEAR 01/01/2019 to 09/30/2019 |
| 3.01 | Gross Sales and/or Services | 148,632 | 304,135 | 89,212 | 284,292 |
| 3.01.01 | Revenue from real estate development | 159,579 | 327,637 | 96,438 | 307,534 |
| 3.01.03 | Taxes on real estate sales and services | (10,947) | (23,502) | (7,226) | (23,242) |
| 3.02 | Cost of sales and/or services | (124,220) | (112,327) | (51,108) | (202,770) |
| 3.02.01 | Cost of real estate development | (124,220) | (112,327) | (51,108) | (202,770) |
| 3.03 | Gross profit | 24,412 | 43,176 | 38,104 | 81,522 |
| 3.04 | Operating expenses/income | (51,952) | (79,516) | (17,597) | (98,950) |
| 3.04.01 | Selling expenses | (3,909) | (6,840) | (2,170) | (11,683) |
| 3.04.02 | General and administrative expenses | (19,543) | (31,593) | (12,678) | (31,918) |
| 3.04.05 | Other operating expenses | (28,393) | (36,807) | (3,054) | (57,438) |
| 3.04.05.01 | Depreciation and amortization | (1,936) | (4,048) | (3,223) | (11,739) |
| 3.04.05.02 | Other operating expenses | (26,457) | (32,759) | 169 | (45.699) |
| 3.04.06 | Income from equity method investments | (107) | (4,276) | 305 | 2,089 |
| 3.05 | Income (loss) before financial results and income taxes | (27,540) | (36,340) | 20,507 | (17,428) |
| 3.06 | Financial | (28,049) | (10,750) | (21,548) | (41,976) |
| 3.07 | Income before income taxes | (55,589) | (47,090) | (1,041) | (59,404) |
| 3.08 | Income and social contribution taxes | (1,064) | (2,015) | (508) | (1,221) |
| 3.08.01 | Current | (1,064) | (2,015) | (508) | (1,221) |
| 3.09 | Income (loss) from continuing operation | (57,193) | (49,105) | (1,549) | (60,625) |
| 3.11 | Income (loss) for the period | (57,193) | (49,105) | (1,549) | (60,625) |
| 3.11.01 | Income (loss) attributable to the Company | (56,493) | (49,007) | (1,668) | (60,746) |
| 3.11.02 | Net income attributable to non-controlling interests | (700) | (98) | 119 | 121 |
| 3.99 | Earnings per Share – (Reais / Share) | - | - | - | - |
| 3.99.01 | Basic Earnings per Share | - | - | - | - |
| 3.99.01.01 | ON | (0,39011) | (0,72852) | (0,03189) | (1,16151) |
| 3.99.02 | Diluted Earnings per Share | - | - | - | - |
| 3.99.02.01 | ON | (0,39011) | (0,72852) | (0,03189) | (1,16151) |
| CONSOLIDATED FINANCIAL STATEMENTS - COMPREHENSIVE INCOME (LOSS) - (in thousands of Brazilian Reais) |
CODE | DESCRIPTION | ACTUAL QUARTER 07/01/2020 to 09/30/2020 | YEAR TO DATE 01/01/2020 to 09/30/2020 | SAME QUARTER FROM PREVIOUS YEAR 07/01/2019 to 09/30/2019 | YEAR TO DATE FROM PREVIOUS YEAR 01/01/2019 to 09/30/2019 |
| 4.01 | Consolidated Income (loss) for the period | (57,193) | (106,299) | (1,549) | (60,625) |
| 4.03 | Consolidated comprehensive income (loss) for the period | (57,193) | (106,299) | (1,549) | (60,625) |
| 4.03.01 | Income (loss) attributable to the Company | (56,493) | (105,500) | (1,668) | (60,746) |
| 4.03.02 | Net income attributable to the noncontrolling interests | (700) | (799) | 119 | 121 |
CONSOLIDATED FINANCIAL STATEMENTS - CASH FLOWS - INDIRECT METHOD - (in thousands of Brazilian Reais)
| |||
CODE | DESCRIPTION | YEAR TO DATE 01/01/2020 to 09/30/2020 | YEAR TO DATE FROM PREVIOUS YEAR 01/01/2019 to 09/30/2019 |
| 6.01 | Net cash from operating activities | (218,444) | 68,098 |
| 6.01.01 | Cash generated in the operations | 6,005 | (47,507) |
| 6.01.01.01 | Income (loss) before income and social contribution taxes | (102,681) | (59,404) |
| 6.01.01.02 | Income from equity method investments | 4,383 | (2,089) |
| 6.01.01.03 | Stock options expenses | (362) | (2,698) |
| 6.01.01.04 | Unrealized interest and finance charges, net | 2,130 | 4,302 |
| 6.01.01.06 | Depreciation and amortization | 5,984 | 11,739 |
| 6.01.01.07 | Provision for legal claims | 52,708 | 45,885 |
| 6.01.01.08 | Provision for profit sharing | 6,194 | 500 |
| 6.01.01.09 | Warranty provision | 1,102 | (3,918) |
| 6.01.01.11 | Allowance for doubtful accounts | 34,197 | (17,116) |
| 6.01.01.12 | Provision for realization of non-financial assets - properties for sale | (1,044) | (28,221) |
| 6.01.01.13 | Provision for penalties due to delay in construction works | 3.394 | 754 |
| 6.01.01.15 | Payable for sale of shares | 0 | 2,759 |
| 6.01.02 | Variation in assets and liabilities | (224,449) | 115,605 |
| 6.01.02.01 | Trade accounts receivable | (83,182) | 127,949 |
| 6.01.02.02 | Properties for sale | (27,289) | 145,244 |
| 6.01.02.03 | Other accounts receivable | (88,096) | (35,981) |
| 6.01.02.04 | Prepaid expenses | 815 | 509 |
| 6.01.02.05 | Obligations for purchase of properties and adv. from customers | (32,744) | (56,461) |
| 6.01.02.06 | Taxes and contributions | 7,794 | 7,610 |
| 6.01.02.07 | Suppliers | 33,726 | (2,189) |
| 6.01.02.08 | Salaries and payable charges | (7,721) | (12,366) |
| 6.01.02.09 | Transactions with related parties | 47,135 | 26,045 |
| 6.01.02.10 | Other obligations | (71,268) | (93,534) |
| 6.01.02.11 | Income tax and social contribution payable | (3,619) | (1,221) |
| 6.02 | Net cash from investing activities | (228,193) | (280,902) |
| 6.02.01 | Purchase of property and equipment and intangible assets | (4,618) | (4,361) |
| 6.02.03 | Redemption of short-term investments | (287,594) | 50,445 |
| 6.02.04 | Purchase of short-term investments | (511,169) | (326,986) |
| 6.03 | Net cash from financing activities | (439,392) | 193,319 |
| 6.03.01 | Capital increase | 477,900 | 132,266 |
| 6.03.02 | Increase in loans, financing and debentures | 310,900 | 89,672 |
| 6.03.03 | Payment of loans, financing and debentures | (359,646) | (232,561) |
| 6.03.06 | Loan transactions with related parties | (9,013) | (10,117) |
| 6.03.08 | Disposal of treasury shares | 0 | 148 |
| 6.03.09 | Result of the disposal of treasury shares | 19,251 | 6,984 |
| 6.03.12 | Constitution of reserves | 0 | 206,927 |
| 6.04 | Foreign Exchange Gains and Losses on Cash and Cash Equivalents | 1,515 | 0 |
| 6.05 | Net increase (decrease) of cash and cash equivalents | (5,730) | (19,485) |
| 6.05.01 | Cash and cash equivalents at the beginning of the period | 12,435 | 32,304 |
| 6.05.02 | Cash and cash equivalents at the end of the period | 6,705 | 12,819 |
CONSOLIDATED STATEMENT OF CHANGES IN EQUITY FROM 07/01/2020 TO 09/30/2020 (in thousands of Brazilian reais)
CODE | DESCRIPTION | Capital | Capital reserves, stock options and treasury shares | Profit reserves | Retained earnings | Other comprehensive income | Total Shareholders equity | Non Controlling interest | Total equity Consolidated |
5.01 | Opening balance | 2,926,280 | 294,094 | 0 | (2,326,666) | 0 | 893,708 | 1,435 | 895.143 |
| 5.03 | Opening adjusted balance | 2,926,280 | 294,094 | 0 | (2,326,666) | 0 | 893,708 | 1,435 | 895.143 |
| 5.04 | Capital transactions with shareholders | (1,885,032) | 41,068 | 0 | 2,565,380 | 0 | 721,416 | 3,630 | 725,046 |
| 5.04.01 | Capital increase | 700,001 | 0 | 0 | 0 | 0 | 700,001 | 0 | 700,001 |
| 5.04.03 | Stock option plan | 0 | 184 | 0 | 0 | 0 | 184 | 0 | 184 |
| 5.04.05 | Treasury shares sold | 0 | 40,884 | 0 | (19,653) | 0 | 21,231 | 0 | 21,231 |
| 5.04.08 | Capital reduction | (2,585,033) | 0 | 0 | 2,585,033 | 0 | 0 | 0 | 0 |
| 5.04.10 | Low discontinued operation | 0 | 0 | 0 | 0 | 0 | 0 | 3,630 | 3,630 |
| 5.05 | Total of comprehensive income (loss) | 0 | 0 | 0 | (105,500) | 0 | (105,500) | (799) | (106,299) |
| 5.05.01 | Net income (loss) for the period | 0 | 0 | 0 | (105,500) | 0 | (105,500) | (799) | (106,299) |
| 5.07 | Closing balance | 1,041,248 | 355,162 | 0 | 133,214 | 0 | 1,509,624 | 4,266 | 1,513,890 |
CONSOLIDATED STATEMENT OF CHANGES IN EQUITY FROM 07/01/2019 TO 09/30/2019 (in thousands of Brazilian reais)
CODE | DESCRIPTION | Capital | Capital reserves, stock options and treasury shares | Profit reserves | Retained earnings | Other comprehensive income | Total Shareholders equity | Non Controlling interest | Total equity Consolidated |
| 5.01 | Opening balance | 2,521,319 | 278,401 | 0 | (2,308,403) | 0 | 491,317 | 1,847 | 493,191 |
| 5.03 | Opening adjusted balance | 2,521,319 | 278,401 | 0 | (2,308,403) | 0 | 491,317 | 1,847 | 493,191 |
| 5.04 | Capital transactions with shareholders | 132,265 | 220,590 | 0 | (3,267) | 0 | 349,588 | 0 | 349,588 |
| 5.04.01 | Capital increase | 132,265 | - | 0 | 0 | 0 | 132,265 | 0 | 132,265 |
| 5.04.03 | Stock option plan | - | 355 | 0 | 0 | 0 | 355 | 0 | 355 |
| 5.04.05 | Treasury shares sold | - | 141 | 0 | 7 | 0 | 148 | 0 | 148 |
| 5.04.08 | Treasury shares cancelled | - | 5,747 | 0 | (5,747) | 0 | 0 | 0 | 0 |
| 5.04.09 | Treasury shares reissued | - | (20,671) | 0 | 20,671 | 0 | 0 | 0 | 0 |
| 5.04.10 | Share repurchase program | - | 28.091 | 0 | (18,198) | 0 | 9,893 | 0 | 9,893 |
| 5.04.11 | Advance for Future Increase of capital | - | 206,927 | 0 | 0 | 0 | (206,927) | 0 | 206,927 |
| 5.05 | Total of comprehensive income (loss) | - | 0 | 0 | (60,746) | 0 | (60,746) | 121 | (60,625) |
| 5.05.01 | Net income (loss) for the period | - | 0 | 0 | (60,746) | 0 | (60,746) | 121 | (60,625) |
| 5.06 | Reserves | - | 0 | 0 | - | 0 | 9 | (80) | (80) |
| 5.06.01 | Constitution of reserves | - | 0 | 0 | - | 0 | 0 | (80) | (80) |
| 5.07 | Closing balance | 2,653,584 | 298,991 | 0 | (2,372,418) | 0 | 780,159 | 1,915 | 782,074 |
CONSOLIDATED STATEMENT OF VALUE ADDED (in thousands of Brazilian Reais) | |||
CODE | DESCRIPTION | YEAR TO DATE 01/01/2020 to 09/30/2020 | YEAR TO DATE FROM PREVIOUS YEAR 01/01/2019 to 09/30/2019 |
| 7.01 | Revenues | 327,637 | 307,534 |
| 7.01.01 | Real estate development, sales and services | 361,834 | 290,418 |
| 7.01.04 | Allowance for doubtful accounts | (34,197) | 17,116 |
| 7.02 | Inputs acquired from third parties | (293,587) | (229,328) |
| 7.02.01 | Cost of Sales and/or Services | (211,240) | (172,414) |
| 7.02.02 | Materials, energy, outsourced labor and other | (82,347) | (56,914) |
| 7.03 | Gross value added | 34,050 | 78,206 |
| 7.04 | Retentions | (5,984) | (11,739) |
| 7.04.01 | Depreciation and amortization | (5,984) | (11,739) |
| 7.05 | Net value added produced by the Company | 28,066 | 66,467 |
| 7.06 | Value added received on transfer | 18,195 | 14,052 |
| 7.06.01 | Income from equity method investments | (4,383) | 2,089 |
| 7.06.02 | Financial income | 22,587 | 11,963 |
| 7.07 | Total value added to be distributed | 46,261 | 80,519 |
| 7.08 | Value added distribution | 46,261 | 80,519 |
| 7.08.01 | Personnel and payroll charges | 29,807 | 23,717 |
| 7.08.01.01 | Direct remuneration | 29,807 | 23,717 |
| 7.08.02 | Taxes and contributions | 33,089 | 30,022 |
| 7.08.02.01 | Federal | 33,089 | 30,022 |
| 7.08.03 | Compensation – Interest | 88,865 | 87,526 |
| 7.08.03.01 | Interest | 88,865 | 84,295 |
| 7.08.03.02 | Rent | 2,181 | 3,231 |
| 7.08.04 | Compensation – Company capital | (105,500) | (60,746) |
| 7.08.04.03 | Net income (Retained losses) | (105,500) | (60,746) |

 |
FOR IMMEDIATE RELEASE - São Paulo, November 16, 2020 – Gafisa S.A. (B3: GFSA3; OTC: GFASY), a leading Brazilian homebuilder, announced today its operational and financial results for the third quarter ended September 30, 2020.
GAFISA ANNOUNCES
3Q20 RESULTS
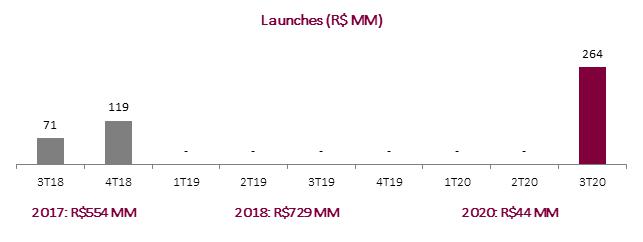
Gafisa’s growth upturn is a reality, with 253% higher sales volume, R$1.1 billion in launches in 2020, and R$1 billion PSV in new acquisitions
The third quarter of 2020 was marked by Gafisa’s consistent recovery of operational performance, highlighting sales, launches, construction works delivery, and land acquisition. We recorded the best sales performance over the past two years, totaling R$144 million sales, reflecting a 253% quarter-on-quarter increase.
After two years without new launches, we resumed launches in the third quarter of 2020, with Chez Perdizes, High Line Jardins, and Normandie Moema projects, totaling a PSV of R$264 million, all of them located in high-valued regions, with good liquidity in the city of São Paulo. Subsequently to the end of the third quarter, all these three launches today report healthy levels of sales, 20% in Chez Perdizes, 45% in High Line Jardins, and 60% in Normandie Moema. For the fourth quarter, we have other three launches totaling R$875 million, highlighting the Cyano Barra project with R$570 million PSV and a project in Campo Belo, SP, with R$262 million PSV.
Again, we evidence the consistency of the Company’s planning and delivery capacity, with two other projects delivered, with a total PSV of R$140 million, the 7th project delivered in 2020. We obtained the occupancy permit for the 8th and 9th projects, now we have achieved 94% of PSV estimated to be delivered in 2020. With the conclusion of the Upcon acquisition, we added two projects to be delivered in 2020, reaching a total of 10 projects with nearly R$1 billion PSV and 1,474 units.
The evolution of construction works was maintained, as well as projects and sales, even during the pandemic. The Company, through its Management Committee – COVID-19, upheld the prevention measures necessary to ensure everyone’s safety, evidencing the focus and discipline of Gafisa’s new management, even amidst a more challenging international scenario.
Still referring to our operational performance, it is worth noting that we acquired in the quarter two excellent plots of land in the city of São Paulo, one in Vila Mariana district, with an estimated PSV of R$116 million and another in the Butantã district, with an estimated PSV of R$162 million. Upcon also brought to our landbank an estimated PSV of R$900 million. We also concluded negotiations to acquire four projects from Calçada S.A., with an approximate PSV of R$747 million, and the acquisition of the last plot of land at Av. Delfim Moreira, definitively sets Gafisa’s return to the city of Rio de Janeiro, through differentiated projects.
Concerning financial results, it is worth noting that we maintained the REF margin (backlog results) at approximately 35%. This evidences that backlog result sustains the Company’s margin at healthy levels in a continued and consistent improvement, despite a temporary reduction of adjusted gross margin (no financial cost), due to our conservative approach when recording provision for dissolutions and repricing of older inventories during the pandemic.
| |
We also should point out a continuous improvement of the Company’s balance sheet and deleverage. Within one year, we went from a Net Debt/Shareholders’ Equity ratio of 162% in 1Q19 to current 7.6% in 3Q20, with a capital increase approved on August 7, 2020, injecting R$218.2 million into the Company’s cash.
We are confident that we are reaching a new cycle of high growth in the real estate market, with interest rates nearing the lowest historical levels, unparalleled credit market growth, and development. Furthermore, as fixed-income investments have very low yield, or even negative, real estate investment has increasingly become relevant in the investment portfolio of individuals and institutional investors.
Within this virtuous context of growth in the real estate market and the assertive actions in its real estate development core business, Gafisa is executing its transformation to become a real estate platform to go beyond its core activity of real estate development. From its solid balance sheet and strategic planning, Gafisa set up a new line of business, the Gafisa Properties. We are also developing partnerships and investments in startups to bring innovation, technology, and new services for Gafisa and its clients. Gafisa Properties will own real estate assets to become profitable through leasing flows across the real estate spectrum, such as offices, residential units, shopping malls, and hotels, and its portfolio will be composed of Gafisa’s built assets or under construction (e.g., offices, stores, and small residential units of up 50 m2)and new acquisitions with a focus on non-replicable locations and/or assets with turnaround opportunities. As far as innovation is concerned, we will apply our background and market expertise to pursue synergies and new business models according to a real estate Ecosystem vision that transforms Gafisa’s real estate assets into business platforms to be explored throughout real estate asset’s life cycle, whether assets held Gafisa Properties or sold by Gafisa to its end clients. We are confident that these actions will allow the Company to capture value for its shareholders.
Gafisa relies on a traditional brand and is recognized as a benchmark in the Brazilian market. We are refining our new management model with dynamism and discipline, to prepare the Company for a new development and growth cycle that will restore Gafisa’s history of success and value creation for our shareholders.
Ian Andrade
Chief Financial and Investor Relations Officer
| |
OPERATIONAL RESULTS
Table 1 – Operational Performance (R$ 000)
| 3Q20 | 2Q20 | Q/Q (%) | 3Q19 | A/A (%) | 9M20 | 9M19 | Y/Y (%) | |
| Launches | 263,789 | - | - | - | - | 263,789 | - | - |
| Gross sales | 143,878 | 41,383 | 247.7% | 39,963 | 260.0% | 185,260 | 219,127 | (15.5%) |
| Dissolutions | (26,224) | (21,543) | 21.7% | (10,210) | 156.8% | (47,767) | (83,245) | (42.6%) |
| Net Sales | 117,654 | 19,840 | 493.0% | 29,753 | 295.4% | 137,494 | 135,881 | 1.2% |
| Speed of Sales (SoS) | 10.57% | 2.39% | 8.2 p.p. | 3.00% | 7.6 p.p. | 12.13% | 11.60% | 0.5 p.p. |
| Delivered PSV | 140,255 | 543,720 | (74.2%) | - | - | 683,975 | 171,648 | 298.5% |
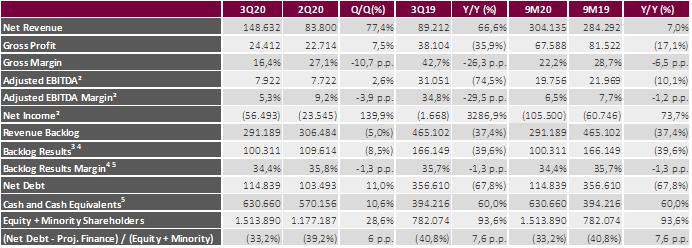
Table 2 – Financial Performance (R$ 000)
1Adjusted by capitalized interest with stock option plan (non-cash) and minority shareholders.
2 Backlog results net of PIS/COFINS taxes (3.65%), excluding the impact of the PVA (Present Value Adjustment) method according to Law No. 11.638.
3 Backlog results comprise the projects restricted by a condition precedent.
4 Cash and cash equivalents and marketable securities.
Launches
In 3Q20, Gafisa resumed launches, three projects with an estimated total PSV of R$264 million. These launches are a result of a relevant restructuring process. It is worth noting that the social distancing rules inflicted by the pandemic of Covid-19, suspended the operation of sales stands, affecting the economic activity in the country. The Company also postponed for a few months the launches foreseen early in the year, evidencing our focus and commitment to the Company’s turnaround. As subsequent events, we already launched for 4Q20, other two projects, highlighting the Cyano Barra with R$570 million PSV, and we are already in the pre-launch of another project in Campo Belo, with an estimated PSV of R$262 million.
| |
Sales
Gross sales soared 247.7% to R$143.8 million in 3Q20 versus 2Q20, even during the pandemic, sales grew by 260.0% year-on-year. The quarter-on-quarter increase reflects the restructuring of the sales area, with Gafisa Sales’ improved structure. The higher speed of sales compared to 3Q19 also reflects greater sales options available, with a resumption of launches and pre-launches in 3Q20.
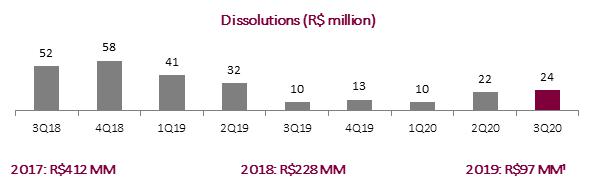
Dissolutions reached R$24.2 million in 3Q20, surging 12.4% from 2Q20 and 156% year-on-year. The quarter-on-quarter increase partially stems from a higher volume of deliveries in the period (not a concern for Management) and the pandemic of COVID-19. Efforts endeavored in the 2019 restructuring process advanced, resulting in renegotiations with Gafisa’s clients, a more accurate credit analysis of potential clients, as well as the recovery of client confidence in the Company.
¹ It considers LTM.
| |
Net sales totaled R$117.7 million in 3Q20.

¹ It considers LTM.
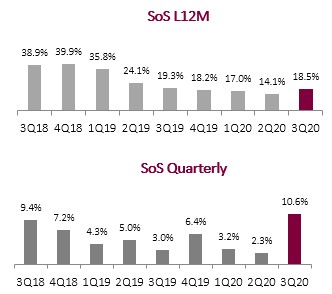
Sales Over Supply (SoS)
Sales Over Supply (SoS) reached 10.6% in 3Q20, an increase of 8.3 p.p. from 2Q20 and 7.6 p.p. from 3Q19. This increase reflects a higher volume of sales and launches in the quarter. We believe that this figure should improve with the Company’s next launches, which besides making available new products, usually has a significant impact on inventory units sale.
| |
Inventory (Property for Sale)
The Company’s inventory at market value consolidated with projects acquired from Upcon totaled R$995.9 million in 3Q20.
Table 3 – Inventory at Market Value 2Q20 x 3Q20 (R$ 000)
| Inventories 2Q20 | Launches | Dissolutions | Gross Sales | UPCON | Adjustments | Inventories 3Q20 | % Q/Q | ||||||
| São Paulo | 686,125 | 45,553 | 22,749 | (132,434) | 215,563 | 4,193 | 841,749 | 22.7% | |||||
| Rio de Janeiro | 120,572 | - | 3,021 | (5,134) | - | 5,225 | 123,684 | 2.6% | |||||
| Other markets | 35,032 | - | 454 | (6,310) | - | 1,256 | 30,433 | -13.1% | |||||
| Total | 841,729 | - | 26,224 | (143,878) | 215,563 | 10,675 | 995,866 | 18.3% | |||||
¹ Adjustments in the period reflect the updates related to the project scope, launch date, and pricing.
Inventory turnover in the last 12 months dropped from 73 months in 2Q20 to 53 months in 3Q20, 27.7% lower than in the previous quarter, owing to higher sales volume in the period.

| |
Approximately 73% of inventory is composed of residential units located in the State of São Paulo and with higher liquidity.
Table 4 – Inventory at Market Value– Financial Progress – POC - (R$ 000)
| Not initiated | Up to 30% built | 30% to 70% built | More than 70% built | Finished units | Total 3Q20 | |
| São Paulo | 129,376 | 72,461 | 229,018 | 168,826 | 242,069 | 841,749 |
| Rio de Janeiro | - | - | - | - | 123,684 | 123,684 |
| Other markets | - | - | - | 8,599 | 21,834 | 30,433 |
| Total | 129,376 | 72,461 | 229,018 | 177,425 | 387,587 | 995,866 |
* % POC does not necessarily reveal the status of construction works, but the project’s financial progress.
Table 5 – Inventory at Market Value – Commercial x Residential Breakdown- (R$ 000)~
| Residential | Comercial | Total | |
| SP | 723,513 | 118,236 | 841,749 |
| RJ | 15,641 | 108,043 | 123,684 |
| Others | 30,433 | - | 30,433 |
| Total | 769,587 | 226,279 | 995,866 |
Delivered Projects and Transfer
In 3Q20, we delivered two projects, totaling 421 units, and a total PSV of R$140.3 million. It is also worth noting that besides delivering these two projects, in the third quarter, the Company obtained the occupancy permit for two projects with 160 units and PSV of R$166 million, besides projects delivered in 1H20 with 775 units and PSV of R$608.9 million. Total deliveries foreseen for 2020 is 10 projects with a PSV of R$971.8 million and 1,474 units. Therefore, out of the total, we already delivered/obtained occupancy permit for 9 projects or 94% of PSV.
| |
Table 6 – Deliveries
| Project | Delivery date | Launch date | Location | % share | Units 100% (Ex. swap units) | PSV % R$000 |
| Vila Rica | feb/20 | 2016 | Santos/SP | 50% | 69 | 65,168 |
| Total 1Q20 | 69 | 65,168 | ||||
| Moov Estação Vila Prudente | abr/20 | ago/16 | São Paulo | 100% | 150 | 72,097 |
| Gafisa Like Alto da Boa Vista | mai/20 | ago/16 | São Paulo | 100% | 220 | 158,676 |
| Gafisa Square Ipiranga | mai/20 | out/16 | São Paulo | 100% | 224 | 263,490 |
| Marquês 2900 | mai/20 | dez/16 | São Paulo | 50% | 112 | 49,455 |
| Total 2Q20 | 706 | 543,719 | ||||
| Moov Freguesia | ago/20 | set/16 | São Paulo | 100% | 307 | 91,893 |
| Uplife Interlagos | ago/20 | mai/15 | São Paulo | 100% | 114 | 48,361 |
| Total 3Q20 | 421 | 140,255 | ||||
| Total 2020 | 1,196 | 749,142 |
¹ Number of units corresponding to a 100% share in projects, net of swaps;
PSV transferred in 3Q20 was R$73.5 million, 3.6% lower than in 2Q20, and 48.7% higher than in 3Q19. The lower volume of transfer reflects a smaller amount of projects delivered this quarter compared to the previous quarter. We highlight that this result was achieved even amidst a pandemic, with restricted business hours at notary offices, banks, people’s movement, and our team in home office most of the time. We again reiterate the Company’s expectation of a significant increase in PSV transferred during 2020, due to the expected delivery of 10 projects in total.
Table 7 – Transfer and Delivery - (R$ 000)
| 3Q20 | 2Q20 | Q/Q (%) | 3Q19 | A/A (%) | 9M20 | 9M19 | Y/Y (%) | |
| PSV Transferred¹ | 70,468 | 76,244 | -7.6% | 49,426 | 42.6% | 146,711 | 158,449 | -7.4% |
| Delivered Projects | 2 | 4 | -50.0% | - | - | 6 | 2 | 200.0% |
| Delivered Units² | 421 | 716 | -41.2% | - | - | 1,137 | 365 | 211.5% |
| PSV delivered³ | 140,255 | 543,719 | -74.2% | - | - | 683,974 | 171,648 | 298.5% |
¹ PSV transferred refers to the effective cash inflow from units transferred to financial institutions;
² Number of units corresponding to a 100% share in projects, net of swaps;
³ PSV = Potential Sales Value of units, net of brokerage, and swap.
| |
Landbank
With an estimated PSV of R$4.8 billion, the Company’s landbank represents potential 40 projects/phases totaling 9,599 units. Approximately 49% of the acquisition value of our land consists of most of which are located in the city of São Paulo. This quarter, the Company acquired two plots of land in São Paulo, in Vila Mariana and Butantã districts, with an estimated PSV of R$255 million.
Table 8 - Landbank (R$ 000)
| PSV¹ (%Cia.) | % Swap Total | % Swap Units | %Swap Finan. | Potential Units (%Cia.) | Potential Units (100%) | |||
| São Paulo | 2,901,083 | 38.7% | 32.5% | 6.2% | 6,111 | 6,339 | ||
| Rio de Janeiro | 1,282,715 | 72.2% | 72.2% | 0.0% | 1,641 | 1,895 | ||
| Others | 593,614 | 38.1% | 38.1% | 0.0% | 1,089 | 1,366 | ||
| Total | 4,777,412 | 48.6% | 44.6% | 4.0% | 8,840 | 9,599 |
¹ The PSV (% Gafisa) reported is net of swap and brokerage fee.
² The swap percentage is measured compared to the historical cost of land acquisition.
³ Potential units are net of swap and refer to the Gafisa’s and/or its partners’ interest in the project.
Table 9 – Changes in the Landbank (2Q20 vs. 3Q20 - R$ 000)
| Initial Landbank | Land Acquisition | Launches | Dissolutions | UPCON | Adj. | Final Landbank | |
| São Paulo | 2,015,053 | 255,265 | 45,553 | (232,755) | 879,345 | (61,378) | 2,901,083 |
| Rio de Janeiro | 1,282,715 | - | - | - | - | - | 1,282,715 |
| Others | 593,614 | - | - | - | - | - | 593,614 |
| Total | 3,891,382 | 255,265 | 45,553 | (232,755) | 879,345 | (61,378) | 4,777,412 |
FINANCIAL RESULTS
Revenue
Net revenue amounted to R$148.6 million in the third quarter of 2020, 77.4% higher than in 2Q20, reflecting higher sales and works in progress in the period. Year-on-year, net revenue soared 66.6%, due to higher sales volume and construction works evolution.
| |
Table 10 – Revenue Recognition (R$ 000)
| 3Q20 | 3Q19 | |||||||
| Launches | Contracted Sales1 | % Sales | Revenue | % Revenue | Contracted Sales | % Sales | Revenue | % Revenue |
| 2018 | 52,326 | 45.9% | 50,769 | 34.2% | (1,354) | (4.5%) | 3,057 | 3.4% |
| 2017 | 27,241 | 23.9% | 44,396 | 29.9% | (472) | (1.6%) | 13,794 | 15.5% |
| 2016 | 6,450 | 5.7% | 10,739 | 7.2% | 13,091 | 44.0% | 39,625 | 44.4% |
| 2015 | 18,260 | 16.0% | 25,271 | 17.0% | 13,021 | 43.8% | 21,488 | 24.1% |
| <2014 | 9,671 | 8.5% | 17,457 | 11.7% | 5,467 | 18.4% | 11,247 | 12.6% |
| Total | 113,947 | 100.0% | 148,632 | 100.0% | 29,753 | 100.0% | 89,211 | 100.0% |
¹ Contracted sales exclude UPCON sales, as it does not have revenue recognized in the quarter
Gross Profit & Margin
Gafisa’s adjusted gross profit reached R$36.6 million in 3Q20, versus R$29.6 million in 2Q20 and R$45.3 million in 3Q19. The adjusted gross margin declined 10.7p.p. in the quarter to 24.6%, on the back of a greater conservative approach when recording provision for dissolutions, expected losses, and price variation in the period, amidst a challenging scenario of Covi-19 pandemic. Adjusted gross margin in 3Q20, excluding non-recurring items was 29.4%, higher than the margin of 2.3 p.p. recorded in 2Q20.
| 3Q20 | 2Q20 | Q/Q (%) | 3Q19 | Y/Y (%) | 9M20 | 9M19 | Y/Y (%) | |
| Net Revenue | 148,632 | 83,800 | 77.4% | 89,212 | 66.6% | 304,135 | 284,292 | 7.0% |
| Gross Profit | 24,412 | 22,714 | 7.5% | 38,104 | (35.9%) | 67,588 | 81,522 | -17% |
| Gross Margin | 16.4% | 27.1% | -10.7p.p. | 42.7% | -26.3p.p. | 22.2% | 28.7% | -6.5p.p. |
| (-) Financial Costs | (12,175) | (6,857) | 77.6% | (7,147) | 70.4% | (25,307) | (30,356) | -17% |
| Adjusted Gross Profit ¹ | 36,587 | 29,571 | 23.7% | 45,251 | (19.1%) | 92,895 | 111,878 | -17% |
| Adjusted Gross Profit Margin | 24.6% | 35.3% | -10.7p.p. | 50.7% | -26.1p.p. | 30.5% | 39.4% | -8.8p.p. |
Table 11 – Gross Margin (R$ 000)
¹ Adjusted by capitalized interests.
Selling, General and Administrative Expenses (SG&A)
Selling, general and administrative expenses totaled R$23.5 million in 3Q20, 22.3% higher than in 2Q20, and 57.9% higher than in 3Q19.
General and administrative expenses came to R$19.5 million, 29.1% higher than the previous quarter, due to a provision for a bonus of R$3.0 million in the period. In 3Q20, recurring general and administrative expenses totaled R$12.1 million, 18% lower than the R$14.2 million recorded in 2Q20.
| |
Table 12 – SG&A Expenses (R$ 000)
| 3Q20 | 2Q20 | Q/Q (%) | 3Q19 | Y/Y (%) | 9M20 | 9M19 | Y/Y (%) | |
| Selling Expenses | (3,909) | (4,047) | -3.4% | (2,170) | 80.1% | (10,749) | (11,683) | -8% |
| G&A Expenses | (19,543) | (15,133) | 29.1% | (12,678) | 54.1% | (51,136) | (31,918) | 60% |
| Total SG&A Expenses | (23,452) | (19,180) | 22.3% | (14,848) | 57.9% | (61,885) | (43,601) | 42% |
Other Operating Income/Expenses totaled expenses of R$26.5 million. Out of this amount, R$21.3 million refers to the provision for litigation and settlements made by the Company, as part of its project to settle contingent liabilities.
Table 13 – Other Operating Income/Expenses (R$ 000)
| 3Q20 | 2Q20 | Q/Q (%) | 3Q19 | Y/Y (%) | 9M20 | 9M19 | Y/Y (%) | |
| Litigation Expenses | (21,357) | (19,353) | 10.4% | - | 0.0% | (52,708) | (45,769) | 15.2% |
| Others | (5,100) | (662) | 670.4% | 169 | -3117.8% | (6,509) | 70 | -9398.6% |
| Total | (26,457) | (20,015) | 32.2% | 169 | -15755.0% | (59,217) | (45,699) | 29.6% |
Adjusted EBITDA
Adjusted EBITDA came to R$7.9 million in 3Q20, 2.6% higher than the R$7.7 million reported in the previous quarter. Year-on-year, Adjusted EBITDA declined compared to R$31.1 million.
Table 14 – Adjusted EBITDA (R$ 000)
| 3Q20 | 2Q20 | Q/Q (%) | 3Q19 | Y/Y (%) | 9M20 | 9M19 | Y/Y (%) | |
| Net Income (Loss) | (56,493) | (23,545) | 139.9% | (1,668) | 3286.9% | (105,500) | (60,746) | 73.7% |
| (+) Financial Results | 28,049 | 2,354 | 1091.5% | 21,548 | 30.2% | 38,799 | 41,976 | -7.6% |
| (+) Income Tax / Social Contribution | 1,604 | 886 | 81.0% | 508 | 215.7% | 3,619 | 1,221 | 196.4% |
| (+) Depreciation and Amortization | 1,936 | 1,882 | 2.9% | 3,223 | -39.9% | 5,984 | 11,739 | -49.0% |
| (+) Capitalized Interest | 12,175 | 6,857 | 77.6% | 7,147 | 70.4% | 25,307 | 30,356 | -16.6% |
| (+) Expenses w/ Stock Options Plans | (6) | 47 | (112.7%) | 174 | -103.4% | (362) | (2,698) | -86.6% |
| (+) Minority Shareholders | (700) | (112) | 525.0% | 119 | -688.2% | (799) | 121 | -760.3% |
| (+) Litigation Expenses | 21,357 | 19,353 | 10.4% | - | 0.0% | 52,708 | 45,769 | 15.2% |
| Adjusted EBITDA¹ | 7,922 | 7,722 | 2.6% | 31,051 | -74.5% | 19,756 | 67,738 | -70.8% |
¹ Adjusted by capitalized interests, with a stock option plan (non-cash) and minority shareholders.
Financial Result
Net financial result totaled (R$28.1) million in 3Q20 from (R$2.4) million in 2Q20, reflecting the volatility of certain securities in the period and the effect of swap operation contracted.
| |
Net Result
Net result in 3Q20 came negative at R$56.5 million, compared to net losses of R$23.5 million and R$1.7 million recorded in 2Q20 and 3Q19, respectively.
Table 15 – Net Result (R$ 000)
| 3Q20 | 2Q20 | Q/Q (%) | 3Q19 | Y/Y (%) | 9M20 | 9M19 | Y/Y (%) | |
| Net Revenue | 148,632 | 83,800 | 77.4% | 89,212 | 66.6% | 304,135 | 284,292 | 7.0% |
| Gross Result | 24,412 | 22,714 | 7.5% | 38,104 | -35.9% | 67,588 | 81,522 | -17.1% |
| Gross Margin | 16.4% | 27.1% | -39.4% | 42.7% | -61.5% | 22.2% | 28.7% | -22.5% |
| (-) Financial Costs | 12,175 | 6,857 | 77.6% | (7,147) | -270.4% | 25,307 | (30,356) | -183.4% |
| Recurring Adjusted Gross Result¹ | 36,587 | 15,857 | 130.7% | 45,251 | -19.1% | 92,895 | 111,878 | -17.0% |
| Recurring Adjusted Gross Margin¹ | 24.6% | 18.9% | 30.1% | 50.7% | -51.5% | 30.5% | 39.4% | -22.4% |
| Adjusted EBITDA² | 7,922 | 7,722 | 2.6% | 31,051 | -74.5% | 19.756 | 21.969 | -10.1% |
| Adjusted EBITDA Margin² | 5.3% | 9.2% | -42.2% | 34.8% | -84.7% | 6.5% | 7.7% | -15.9% |
| Adjusted Net Result³ | (56,493) | (23,545) | 139.9% | (1,668) | 3286.9% | (105,500) | (60,746) | 73.7% |
| ( - ) Litigation Expenses | (21,357) | (19,353) | 10.4% | - | 0.0% | (52,708) | (45,769) | 15.2% |
| Net Result (ex-Litigation Expenses) | (35,136) | (4,192) | 738.2% | (1,668) | 2006.5% | (52,792) | (14,977) | 252.5% |
1 Adjusted by capitalized interests.
2 Adjusted by capitalized interests, with a stock option plan (non-cash) and minority shareholders.
Revenue Backlog and Results
At the end of 3Q20, the balance of revenue backlog according to the PoC method totaled R$100.3 million, compared to R$109.6 million and R$166.1 million reported in the previous quarter and the same period last year, respectively. Margin to be recognized was 34.4%, in line with 2Q20.
Table 16 – Backlog Results (REF) (R$ 000)
| 3Q20 | 2Q20 | Q/Q (%) | 3Q19 | Y/Y (%) | |
| Revenue Backlog | 291,189 | 306,484 | -5% | 465,102 | -37% |
| Backlog Costs (units sold) | (190,878) | (196,870) | -3% | (298,953) | -36% |
| Backlog Results | 100,311 | 109,614 | -8% | 166,149 | -40% |
| Backlog Margin | 34.4% | 35.8% | -132bps | 35.7% | -127bps |
Notes: Backlog results net of PIS/COFINS taxes (3.65%) and excluding the impact of the PVA (Present Value Adjustment) method according to Law No. 11.638.
Backlog results comprise the projects restricted by a condition precedent.
| |
BALANCE SHEET
Cash and Cash Equivalents and Marketable Securities
On September 30, 2020, cash and cash equivalents and marketable securities totaled R$630.7 million, compared to R$570.2 million in 2Q20, reflecting the inflow of funds from a capital increase of R$218.2 million and debt amortization in the period, so that to sustain a liquidity cushion and enable our growth resumption. The Company believes that disciplined cost control and the maintenance of a liquidity reserve are essential for the operation. This business vision and team’s readiness allowed the company to go through this period of uncertainty very consistently and smoothly.
Receivables
At the end of 3Q20, total accounts receivable came to R$933.2 million. Of this amount, R$630.9 million were already recognized in the balance sheet.
Table 17 – Total Receivables (R$ 000)
| 3Q20 | 2Q20 | Q/Q(%) | 3Q19 | Y/Y (%) | |
| Receivables from developments - backlog | 302,220 | 318,095 | -5% | 482,721 | -37% |
| Receivables PoC - ST (on balance sheet) | 544,147 | 445,811 | 22% | 409,212 | 33% |
| Receivables PoC - LT (on balance sheet) | 86,843 | 93,529 | -7% | 119,765 | -27% |
| Total | 933,210 | 857,435 | 9% | 1,011,698 | -8% |
Notes: ST – Short term | LT- Long term | PoC – Percentage of Completion Method.
Receivables from developments: Accounts receivable not yet recognized according to PoC and BRGAAP.
Receivables from PoC: Accounts receivable already recognized according to PoC and BRGAAP.
Table 18 – Receivables Schedule (R$ 000)
| Total | 2020 | 2021 | 2022 | 2023 | 2024 – Onwards | |
| Receivables Backlog | 302,222 | 106,367 | 105,594 | 76,631 | 3,690 | 9,940 |
| Receivables PoC | 630,990 | 260,387 | 360,332 | 5,334 | 1,310 | 3,627 |
| Total | 933,212 | 366,754 | 465,926 | 81,965 | 5,000 | 13,567 |
Cash Generation
Table 19 – Cash Generation (R$ 000)
| 1Q19 | 2Q19 | 3Q19 | 4Q19 | 1Q20 | 2Q20 | 3Q20 | |
| Cash 1 | 63,068 | 182,817 | 394,216 | 414,330 | 363,337 | 570,156 | 630,660 |
| Change in Cash Available (1) | (74,092) | 119,749 | 211,399 | 20,114 | (50,993) | 206,819 | 60,504 |
| Total Debt | 790,172 | 770,715 | 750,826 | 730,678 | 710,169 | 673,649 | 745,499 |
| Change in Total Debt (2) | (99,241) | (19,457) | (19,889) | (20,148) | (20,509) | (36,520) | 71,850 |
| Capital Increase (3) | - | 132,265 | 206,927 | 65,768 | - | 259,729 | 218,171 |
| Cash Generation in the Period (1) - (2) - (3) | 25,149 | 6,941 | 24,361 | (25,506) | (30,484) | (16,390) | (229,517) |
| Final Accumulated Cash Generation ² | 25,149 | 32,090 | 56,451 | 30,945 | 461 | (15,929) | (245,446) |
| |
¹ Cash and cash equivalents and marketable securities.
² It considers LTM.
Liquidity
Advancing the work of strengthening the Company’s balance sheet, the Net Debt/Shareholders’ Equity ratio reached 7.6% at the end of 3Q20, compared to 8.8% reported in 2Q20, due to higher cash deriving from capital increase. Within one year, we went from a Net Debt/Shareholders’ Equity ratio of 45.6% in 3Q19 to current 7.6% in 3Q20. Net debt increased to R$123.5 million from R$114.8 million reported in the previous quarter.
Table 20 – Debt and Investor Obligation (R$ 000)
| 3Q20 | 2Q20 | Q/Q(%) | 3Q19 | Y/Y (%) | |
| Housing Financial System - SFH | 259,432 | 266,210 | -2.5% | 267,923 | -3.2% |
| Real Estate Financial System - SFI | 126,340 | 146,613 | -13.8% | 175,565 | -28.0% |
| Debentures (Projects) | 172,578 | 112,338 | 53.6% | 194,625 | -11.3% |
| Bank Credit Notes (Projects) | 59,696 | 40,219 | 48.4% | 37,794 | 58.0% |
| Subtotal Project Debt (A) | 618,046 | 565,380 | 9.3% | 675,907 | -8.6% |
| Debentures (Working Capital) | 70,232 | 33,529 | 109.5% | 49,646 | 41.5% |
| Bank Credit Notes (Working Capital) | 40,922 | 62,799 | -34.8% | 14,899 | 174.7% |
| Other operations (Working Capital) | 16,299 | 11,941 | 36.5% | 10,374 | 57.1% |
| Subtotal Working Capital Debt (B) | 127,453 | 108,269 | 17.7% | 74,919 | 70.1% |
| Total Debt (A)+(B)= (C) | 745,499 | 673,649 | 10.7% | 750,826 | -0.7% |
| Cash and Cash Equivalents1 (D) | 630,660 | 570,156 | 10.6% | 394,216 | 60.0% |
| Net Debt (C) - (D) = (E) | 114,839 | 103,493 | 11.0% | 356,610 | -67.8% |
| Shareholders’ Equity + Minority (F) | 1,513,890 | 1,177,187 | 34.3% | 782,074 | 93.6% |
| (Net Debt) / (SE) (E)/(F)=(G) | 7.6% | 8.8% | -121bps | 45.6% | -3801bps |
| (Net Debt - Proj. Fin.) / (SE) ((E)-(A))/(F)=(H) | (33.2%) | (39.2%) | 600bps | (40.8%) | 759bps |
¹Cash and cash equivalents and marketable securities.
The Company ended 3Q20 with R$332.6 million indebtedness falling due this year, accounting for 44.6% of total debt. Note that approximately 82.9% of the Company’s debt is linked to projects, therefore, maturities are connected with the delivery of projects to still occur in 2020, and we already delivered or obtained the occupancy permit for 9 projects, or 94% of PSV estimated for this year’s deliveries. On September 30, 2020, the consolidated average cost of debt was 9,5% p.a.
| |
Table 21– Debt Maturity (R$ 000)
| Average cost (a.a.) | Total | Until Dec/20 | Until Dec/21 | Until Dec/22 | Until Dec/23 | After Dec/23 | |
| Housing Financial System - SFH | TR + 7,00% a 14,20% | 259,432 | 187,455 | - | - | - | 71,977 |
| Real Estate Financial System - SFI | Pre +13,66% / 143% CDI | 126,340 | 519 | 77,298 | 7,800 | 7,800 | 32,923 |
| Debentures (Projects) | CDI + 3% / CDI + 3,75% / CDI + 5,00% / CDI + 6,00% | 172,578 | 73,669 | 8,361 | 465 | - | 90,083 |
| Bank Credit Notes (Projects) | CDI + 3,50% / Pre + 16,77% | 59,696 | 12,292 | 23,027 | 19,660 | 4,717 | - |
| Subtotal Project Debt (A) | 618,046 | 273,935 | 108,686 | 27,925 | 12,517 | 194,983 | |
| Debentures (Working Capital) | IPCA + 7,8% | 70,232 | 42,279 | 11,426 | 10,670 | 5,857 | - |
| Bank Credit Notes (Working Capital) | CDI + 3,7%/ 4,25% | 40,922 | 62 | 40,860 | - | - | - |
| Other operations (Working Capital) | Pre + 11,36% | 16,299 | 16,299 | - | - | - | - |
| Subtotal Working Capital Debt (B) | 127,453 | 58,640 | 52,286 | 10,670 | 5,857 | - | |
| Total Debt (A)+(B)= (C) | 745,499 | 332,575 | 160,972 | 38,595 | 18,374 | 194,983 | |
| Total maturity per period % | - | 44.6% | 21.6% | 5.2% | 2.5% | ||
| Project debt maturity as % of total debt (B)/ (E) | - | - | 82.4% | 67.5% | 72.4% | 68.1% | |
| Working capital maturity as % of total debt ((A)+(C))/ (E) | 44.6% | 44.6% | 17.6% | 32.5% | 27.6% | 31.9% | |
| |
Consolidated Income Statement
| 3Q20 | 2Q20 | Q/Q (%) | 3Q19 | Y/Y (%) | 9M20 | 9M19 | Y/Y (%) | |
| Net Revenue | 148,632 | 83,800 | 77.4% | 89,212 | 66.6% | 304,135 | 284,292 | 7.0% |
| Operational Costs | (124,220) | (61,086) | 103.4% | (51,108) | 143.1% | (236,547) | (202,770) | 16.7% |
| Gross Result | 24,412 | 22,714 | 7.5% | 38,104 | (35.9%) | 67,588 | 81,522 | -17.1% |
| Gross Margin | 16,4% | 27,1% | -10.7p.p. | 42,7% | -26.3p.p. | 22,2% | 28,7% | -244.9% |
| Operational Expenses | (51,952) | (43,131) | 20.5% | (17,597) | 195.2% | (131,469) | (98,950) | -277.0% |
| Selling Expenses | (3,909) | (4,047) | (3.4%) | (2,170) | 80.1% | (10,749) | (11,683) | -8.0% |
| General and Administrative Expenses | (19,543) | (15,133) | 29.1% | (12,678) | 54.1% | (51,136) | (31,918) | 60.2% |
| Other Operating Revenue/Expenses | (26,457) | (20,015) | 32.2% | 169 | (15755.0%) | (59,217) | (45,699) | 29.6% |
| Depreciation and Amortization | (1,936) | (1,882) | 2.9% | (3,223) | (39.9%) | (5,984) | (11,739) | -49.0% |
| Equity Income | (107) | (2,054) | (94.8%) | 305 | (135.1%) | (4,383) | 2,089 | -309.8% |
| Operational Result | (27,540) | (20,417) | 34.9% | 20,507 | (234.3%) | (63,881) | (17,428) | -294.1% |
| Net Financial Result | (28,049) | (2,354) | 1091.5% | (21,548) | 30.2% | (38,799) | (41,976) | -252.9% |
| Financial Income | (6,512) | 21,091 | (130.9%) | 3,229 | (301.7%) | 22,578 | 11,963 | 88.7% |
| Financial Expenses | (21,537) | (23,445) | (8.1%) | (24,777) | (13.1%) | (61,377) | (53,939) | 13.8% |
| Net Income Before Taxes on Income | (55,589) | (22,771) | 144.1% | (1,041) | 5240.0% | (102,680) | (59,404) | -191.6% |
| Deferred Taxes | - | - | - | - | - | - | - | - |
| Income Tax and Social Contribution | (1,604) | (886) | 81.0% | (508) | 215.7% | (3,619) | (1,221) | 196.4% |
| Net Income After Taxes on Income | (57,193) | (23,657) | 141.8% | (1,549) | 3592.3% | (106,299) | (60,625) | 75.3% |
| Minority Shareholders | (700) | (112) | 525.0% | 119 | (688.2%) | (799) | 121 | -760.3% |
| Net Income | (56,493) | (23,545) | 139.9% | (1,668) | 3286.9% | (105,500) | (60,746) | 73.7% |
| |
Consolidated Balance Sheet
| 3Q20 | 2Q20 | Q/Q (%) | 3Q19 | Y/Y (%) | |
| Current assets | |||||
| Cash and Cash Equivalents | 6,705 | 19,512 | -66% | 12,819 | -48% |
| Securities | 623,955 | 550,644 | 13% | 381,397 | 64% |
| Receivables from clients | 544,147 | 445,811 | 22% | 409,212 | 33% |
| Properties for sales | 1,317,144 | 855,315 | 54% | 820,892 | 60% |
| Other account receivable | 148,435 | 178,058 | -17% | 119,897 | 24% |
| Prepaid expenses and other | 1,045 | 1,131 | -8% | 2,159 | -52% |
| Land for sale | 7,014 | 7,014 | 0% | 38,681 | -82% |
| Subtotal | 2,648,445 | 2,057,485 | 29% | 1,785,057 | 48% |
| Non current assets | |||||
| Receivables from clients | 86,843 | 93,529 | -7% | 119,765 | -27% |
| Properties for sales | 191,985 | 293,573 | -35% | 190,953 | 1% |
| Other account receivable | 224,683 | 221,739 | 1% | 145,232 | 55% |
| Subtotal | 503,511 | 608,841 | -17% | 455,950 | 10% |
| Intangible, property and equipment | 21,297 | 17,444 | 22% | 24,465 | -13% |
| Investments | 272,497 | 138,566 | 97% | 300,726 | -9% |
| Total Asset | 3,445,750 | 2,822,336 | 22% | 2,566,198 | 34% |
| Current liabilities | |||||
| Loans and financing | 349,348 | 283,923 | 23% | 364,766 | -4% |
| Debentures | 127,147 | 119,367 | 7% | 179,423 | -29% |
| Obligation for purchase of land | 259,336 | 111,790 | 132% | 105,823 | 145% |
| Material and service suppliers | 131,054 | 131,941 | -1% | 129,825 | 1% |
| Taxes and contributions | 82,979 | 83,689 | -1% | 64,886 | 28% |
| Provision for contingencies | 193,357 | 184,084 | 5% | 179,681 | 8% |
| Other liabilities | 297,086 | 253,603 | 17% | 207,540 | 43% |
| Subtotal | 1,440,307 | 1,168,397 | 23% | 1,231,944 | 17% |
| Non current liabilities | |||||
| Loans and financing | 153,340 | 243,859 | -37% | 141,789 | 8% |
| Debentures | 115,663 | 26,500 | 336% | 64,848 | 78% |
| Obligation for purchase of land | 87,942 | 92,998 | -5% | 147,147 | -40% |
| Deferred taxes | 12,114 | 12,114 | 0% | 49,372 | -75% |
| Provision for contingencies | 86,250 | 78,809 | 9% | 110,564 | -22% |
| Other liabilities | 36,244 | 22,472 | 61% | 38,460 | -6% |
| Subtotal | 491,553 | 476,752 | 3% | 552,180 | -11% |
| Shareholders’ Equity | |||||
| Shareholders’ equity | 1,509,624 | 1,175,852 | 28% | 780,159 | 94% |
| Minority Interest | 4,266 | 1,335 | 220% | 1,915 | 123% |
| Subtotal | 1,513,890 | 1,177,187 | 29% | 782,074 | 94% |
| Total Liabilities and Shareholders’ Equity | 3,445,750 | 2,822,336 | 22% | 2,566,198 | 34% |
| |
Balance Sheet by brand - Consolidated 3Q20
| Gafisa | Upcon | Consolidated | |
| Current assets | |||
| Cash and Cash Equivalents | 5,190 | 1,515 | 6,705 |
| Securities | 623,955 | - | 623,955 |
| Receivables from clients | 512,367 | 31,780 | 544,147 |
| Properties for sales | 902,215 | 414,929 | 1,317,144 |
| Other account receivable | 210,381 | 9,656 | 148,435 |
| Prepaid expenses and other | 1,045 | - | 1,045 |
| Land for sale | 7,014 | - | 7,014 |
| Subtotal | 2,262,167 | 457,880 | 2,648,445 |
| Non current assets | |||
| Receivables from clients | 83,588 | 3,255 | 86,843 |
| Properties for sales | 191,985 | - | 191,985 |
| Other account receivable | 223,848 | 835 | 224,683 |
| Subtotal | 499,421 | 4,090 | 503,511 |
| Intangible, property and equipment | 19,877 | 1,420 | 21,297 |
| Investments | 270,123 | 2,374 | 272,497 |
| Total Asset | 3,051,588 | 465,764 | 3,445,750 |
| Current liabilities | |||
| Loans and financing | 312,371 | 108,579 | 349,348 |
| Debentures | 127,147 | - | 127,147 |
| Obligation for purchase of land | 128,280 | 131,056 | 259,336 |
| Material and service suppliers | 128,777 | 2,277 | 131,054 |
| Taxes and contributions | 77,662 | 5,317 | 82,979 |
| Provision for contingencies | 193,357 | - | 193,357 |
| Other liabilities | 280,023 | 17,063 | 297,086 |
| Subtotal | 1,247,617 | 264,292 | 1,440,307 |
| Non current liabilities | |||
| Loans and financing | 128,881 | 24,459 | 153,340 |
| Debentures | 115,663 | - | 115,663 |
| Obligation for purchase of land | 61,404 | 26,538 | 87,942 |
| Deferred taxes | 12,114 | - | 12,114 |
| Provision for contingencies | 77,226 | 9,024 | 86,250 |
| Other liabilities | 20,686 | 15,558 | 36,244 |
| Subtotal | 415,974 | 75,579 | 491,553 |
| Shareholders’ Equity | |||
| Shareholders’ equity | 1,387,362 | 122,262 | 1,509,624 |
| Minority Interest | 635 | 3,631 | 4,266 |
| Subtotal | 1,387,997 | 125,893 | 1,513,890 |
| Total Liabilities and Shareholders’ Equity | 3,051,588 | 465,764 | 3,445,750 |
| |
Consolidated Cash Flow
| 3T20 | 3T19 | 9M20 | 9M19 | |
| Net Income (Loss) before taxes | (55,589) | (1,041) | (102,681) | (59,404) |
| Expenses/revenues that do not impact working capital | 31,713 | 1,522 | 108,686 | 11,897 |
| Depreciation and amortization | 1,936 | 3,223 | 5,984 | 11,739 |
| Impairment | - | (2) | (1,044) | (28,221) |
| Expenses with stock option plans | (5) | 174 | (362) | (2,698) |
| Unrealized interest and fees, net | (4) | 1,216 | 2,130 | 4,302 |
| Equity income | 107 | (305) | 4,383 | (2,089) |
| Warranty provision | 1,998 | (2,136) | 1,102 | (3,918) |
| Provision for contingencies | 21,358 | - | 52,708 | 45,885 |
| Profit sharing provision | 3,107 | - | 6,194 | 500 |
| Provision (reversal) for doubtful accounts | 2,833 | (5,342) | 34,197 | (17,116) |
| Provision for fine due to construction work delay | 383 | 1,935 | 3,394 | 754 |
| Quotas assignment | 2,759 | 2,759 | ||
| Receivables | (62,895) | 42,139 | (83,182) | 127,949 |
| Properties for sale | 54,688 | 14,765 | (27,289) | 145,244 |
| Other receivables | (22,053) | (11,886) | (88,096) | (35,981) |
| Prepaid expenses | 86 | 159 | 815 | 509 |
| Obligations for purchase of land | (15,104) | (1,590) | (32,744) | (56,461) |
| Taxes and contribution | (6,027) | 4,528 | 7,794 | 7,610 |
| Suppliers | (2,960) | (39,327) | 33,726 | (2,189) |
| Payroll, charges and bônus provision | (2,834) | (546) | (7,721) | (2,366) |
| Other accounts payable | (110,900) | 62,090 | (71,268) | (93,534) |
| Transactions with related parties | 25,623 | 7,765 | 47,135 | 26,045 |
| Paid taxes | (1,604) | (508) | (3,619) | (1,221) |
| Cash used in operating activities | (167,856) | 78,070 | (218,444) | 68,098 |
| Acquisition of properties and equipment | (4,369) | 1,656 | (4,618) | (4,361) |
| Redemption of securities, collaterals, and credits | 151,192 | 2,311 | 287,594 | 50,445 |
| Investment in marketable securities and restricted credits | (226,018) | (209,548) | (511,169) | (326,986) |
| Equity Securities | - | (2,717) | - | - |
| Cash used in investing activities | (79,195) | (208,298) | (228,193) | (280,902) |
| Increase of loans and financing | 192,447 | 37,885 | 310,900 | 89,672 |
| Amortization of loans and financing | (182,030) | (58,990) | (359,646) | (232,561) |
| Loan operations | (3,464) | (759) | (9,013) | (10,117) |
| Sale of treasury shares | - | - | - | 148 |
| Proceeds from sale of treasury shares | 7,605 | (53,389) | 19,251 | 6,984 |
| Capital increase | 218,171 | - | 477,900 | 132,266 |
| Subscription and payment of common shares | - | 206,927 | - | 206,927 |
| Cash acquired from Upcon | 1,515 | - | 1,515 | - |
| Cash Flow from Financing Activities | 234,244 | 131,674 | 440,907 | 193,319 |
| Increase (Decrease) in cash and cash equivalents | (12,807) | 1,446 | (5,730) | (19,485) |
| Beginning of the period | 19,512 | 11,373 | 12,435 | 32,304 |
| End of the period | 6,705 | 12,819 | 6,705 | 12,819 |
| |
| This release contains forward-looking statements about business prospects, estimates for operating and financial results, and Gafisa’s growth prospects. Readers can identify many of these statements when reading words such as “estimates,” “believes,” “expects,” and “will,” as well as similar words or their respective negatives. Although management believes the expectations conveyed in such statements to be reasonable, it is unable to guarantee that such expectations will come to fruition, and they should not be deemed as projections. By their nature, forward-looking statements require us to make assumptions and, as such, are subject to risks and uncertainties. They are mere expectations and therefore are based exclusively on what management expects concerning the future of the business and its continued access to capital to fund the Company’s business plan. Such forward-looking statements depend, substantially, on changes in market conditions, government regulations, competitive pressures, the performance of the Brazilian economy, and the industry, among other factors; therefore, they are subject to change without prior notice. The forward-looking statements included in this release are based on the assumption that our plans and operations will not be affected by such risks, but if our plans and operations happen to be affected by these risks, the forward-looking statements might become inaccurate. We do not commit to revising these forward-looking statements unless it is explicitly required by the applicable securities regulation. |  |
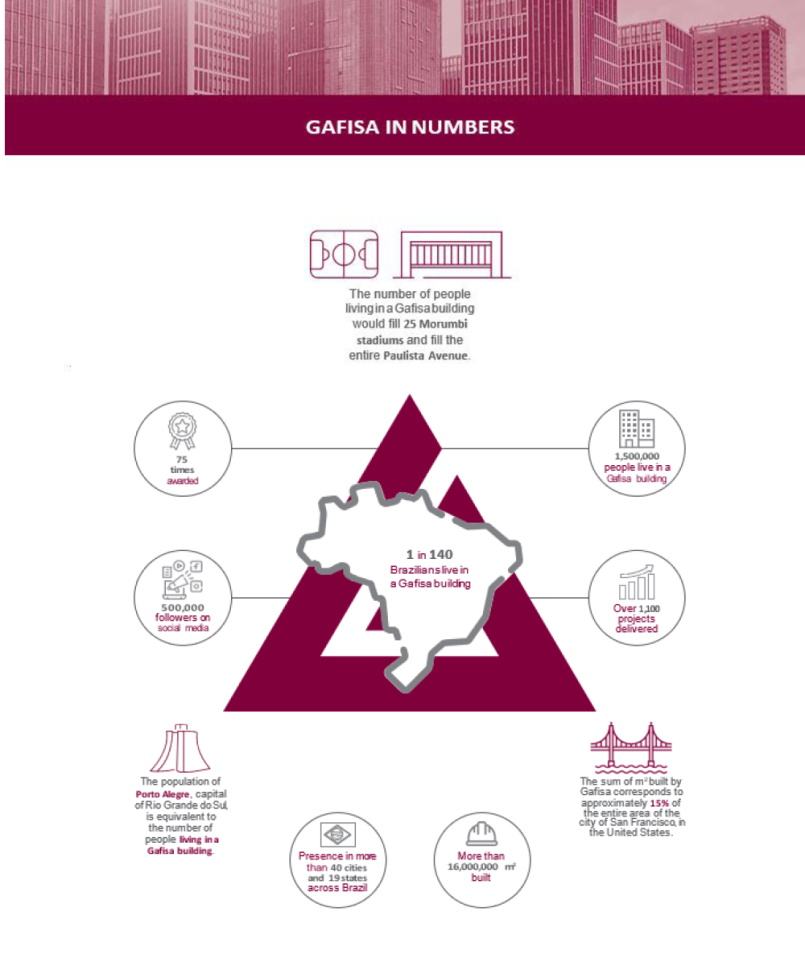
(A free translation of the original report in Portuguese as published in Brazil)
Gafisa S.A.
Notes to the quarterly financial information
September 30, 2020
(Amounts in thousands of Brazilian Reais, except as otherwise stated)
| 1. | Operations |
Gafisa S.A. ("Gafisa" or "Company") is a publicly-traded company with registered office at Presidente Juscelino Kubitschek, 1.830, conjunto comercial 32, 3o andar, Bloco 2, in the city and state of São Paulo, Brazil, and began its operations in 1997 with the objectives of: (i) promoting and managing all forms of real estate ventures on its own behalf or for third parties (in the latter case, as construction company or proxy); (ii) selling and purchasing real estate properties; (iii) providing civil construction and civil engineering services; (iv) developing and implementing marketing strategies related to its own and third party real estate ventures; and (v) investing in other companies who share similar objectives.
The Company enters into real estate development projects with third parties through special purpose entities (SPE) or through the formation of consortia and condominiums. Subsidiaries significantly share the managerial and operating structures, and corporate, managerial and operating costs with the Company. The SPEs, condominiums and consortia operate solely in the real estate industry and are linked to specific ventures.
The Company has stocks traded on B3 S.A. – Brasil, Bolsa, Balcão (former BM&FBovespa), reporting its information to the Brazilian Securities and Exchange Commission (CVM) and the U.S. Securities and Exchange Commission (SEC). The ADSs were delisted on the NYSE on December 17, 2018, and are currently traded Over the Counter (OTC).
| 1.1 | Coronavirus – COVID-19 |
In the period ended September 30, 2020, there has not been any significant impact from the outbreak of Coronavirus on the Company’s operations. A Crisis Management Committee has been created that holds daily meetings and total availability for discussing and taking important disease prevention measures.
Awareness campaigns to promote actions that mitigate transmission (frequent hygiene, distancing, meeting through virtual platforms, exclusive service channel, among others) have been created. We have implemented a series of educative and preventative measures targeted at our construction site employees, reducing the staff considered to be in the risk group. The sales activities have focused on digital interactions with prospective customers.
The Company will keep following the implementation of the necessary actions with the Government Authorities, Ministry of Health, and trade associations.
Until the disclosure date of this quarterly information, the Company has not noted a significant increase in customer default and contract cancellation or reduction in sales volume. Moreover, the construction of ventures has been according to the original schedule.
Also, due to the Covid-19 pandemic, the Company has postponed the launches planned for the second quarter to the second half of this year.
The Company has opted for deferring the payment of the federal taxes related to March, April and May 2020, collected later on, pursuant to Ordinances 139, 150 and 245. Under the terms of Provisional Measure 927, of March 22, 2020, the Company has also opted for deferring the FGTS deposits by employers, related to March, April and May 2020, with collection in six monthly installments from July 2020. Pursuant to Provisional Measure 936, of March 31, 2020, converted into Law 14,020 of 2020, the Company has reduced salaries by 25%, with proportional reduction in working hours, of a certain group of employees over a 90-day period. Additionally, there has been a voluntary 50% reduction in the salary of the Board of Director’s members over a 180-day period.
Thus far, there is a high volatility in the Company’s stock price traded on the stock exchange as a result of the global concern for this pandemic and its developments.
Management understands that at present, the projections used in the analysis of realization of its assets shall not suffer significant changes in the face of this event, and keeps the adopted assumptions.
(A free translation of the original report in Portuguese as published in Brazil)
Gafisa S.A.
Notes to the quarterly financial information
September 30, 2020
(Amounts in thousands of Brazilian Reais, except as otherwise stated)
| 2. | Presentation of quarterly information and summary of significant accounting policies |
| 2.1. | Basis of presentation and preparation of individual and consolidated quarterly information |
On November 16, 2020, the Company’s Board of Directors has approved the individual and consolidated quarterly financial information of the Company and authorized its disclosure.
The individual Quarterly Financial Information (ITR) has been prepared in accordance with the Accounting Pronouncements Committee (CPC) Technical Pronouncement 21 (R1) – Interim Financial Reporting, and the consolidated Quarterly Financial Information (ITR) has been prepared in accordance with such pronouncement and the International Accounting Standard (IAS) 34 – Interim Financial Reporting, applicable to the real estate development entities in Brazil, registered with the Brazilian Securities and Exchange Commission (CVM). The aspects related to the transfer of control in the sale of real estate units follow the understanding of the company’s management, aligned with that issued by the CVM in the Circular Letter /CVM/SNC/SEP 02/18 on the application of the Technical Pronouncement NBC TG 47 (IFRS 15), consistently with the rules issued by the CVM, applicable to the preparation of the ITR.
The quarterly financial information has been prepared using the same accounting practices, judgments, estimates and assumptions adopted in the presentation and preparation of the financial statements for the year ended December 31, 2019. Therefore, the corresponding quarterly financial information shall be read together with the financial statements as of December 31, 2019.
The individual quarterly financial information of the Company is not considered in compliance with the International Financial Reporting Standards (IFRS), once it considers the capitalization of interest on qualifying assets of investees in the individual quarterly financial information of the Company.
The quarterly financial information has been prepared on a going concern basis. Management periodically assesses the Company’s ability to continue as going concern when preparing the quarterly financial information.
All amounts reported in the accompanying quarterly financial information are in thousands of reais, except as otherwise stated.
The other explanations related to this note were not subject to material changes in relation to the disclosures in Note 2.1 to the individual and consolidated financial statements as of December 31, 2019.
All material information characteristic of the quarterly financial information, and only it, is being evidenced, and corresponds to those used by Management in its administration.
| 2.1.1. | Consolidated quarterly financial information |
The accounting practices were uniformly adopted in all subsidiaries included in the consolidated quarterly financial information, and the fiscal year of these companies is the same of the Company. See further details in Note 9.
The other explanations related to this note were not subject to material changes in relation to the disclosures in Note 2.1.1 to the individual and consolidated financial statements as of December 31, 2019.
(A free translation of the original report in Portuguese as published in Brazil)
Gafisa S.A.
Notes to the quarterly financial information
September 30, 2020
(Amounts in thousands of Brazilian Reais, except as otherwise stated)
| 2.1.2. | Functional and presentation currency |
The functional and presentation currency of the Company is the Brazilian real, mainly because of its revenues and the incurred costs of operations.
| 3. | New standards, changes and interpretation of standards issued and adopted from 2020, and not yet adopted |
The explanations related to this note were not subject to material changes in relation to the disclosures in Note 3 to the individual and consolidated financial statements as of December 31, 2019.
There is no other standard, changes to standards or interpretation issued and not yet adopted that could, on the Management’s opinion, have significant impact arising from their adoption on its quarterly financial information.
| 4. | Cash and cash equivalents and short-term investments |
| 4.1. | Cash and cash equivalents |
| Company | Consolidated | |||
| 09/30/2020 | 12/31/2019 | 09/30/2020 | 12/31/2019 | |
| Cash and banks | 43 | 810 | 6,705 | 12,435 |
Total cash and cash equivalents (Note 20.i.d, 20.ii.a and 20.iii) | 43 | 810 | 6,705 | 12,435 |
| 4.2. | Short-term investments |
| Company | Consolidated | ||||
| 09/30/2020 | 12/31/2019 | 09/30/2020 | 12/31/2019 | ||
| Fixed-income funds (a) | 135,445 | 125,961 | 135,444 | 125,962 | |
| Government bonds (LFT) (a) | 90,598 | 231,725 | 90,597 | 231,725 | |
| Real estate investment fund (a) | 221,451 | - | 221,451 | - | |
| Bank certificates of deposit (b) | 143,788 | 10,460 | 147,378 | 10,523 | |
| Restricted credits (c) | 27,743 | 32,972 | 29,085 | 33,560 | |
| Securities purchased under resale agreements | - | 125 | - | 125 | |
Total short-term investments (Note 20.i.d, 20.ii.a and 20.iii) | 619,025 | 401,243 | 623,955 | 401,895 | |
| (a) | Exclusive and open-end funds whose purpose is to invest in financial assets and/or fixed-income investment modalities that follow the fluctuations in interest rates in the interbank deposit market (CDI), by investing its funds mostly in investment fund shares and/or investment funds comprising investment fund shares. The Company entered into a swap contract to mitigate the risk of its exposure to index and interest rate volatility (Note 20(i)(b)). |
| (b) | As of September 30 and December 31, 2019, Certificates of Bank Deposit (CDBs) include interest earned through the statement of financial position’s reporting date, ranging from 93.5% to 110% of Interbank Deposit Certificates (CDI). |
| (c) | Restricted credits are represented by funds pledged to transactions with financial institutions. |
(A free translation of the original report in Portuguese as published in Brazil)
Gafisa S.A.
Notes to the quarterly financial information
September 30, 2020
(Amounts in thousands of Brazilian Reais, except as otherwise stated)
| 5. | Trade accounts receivable |
| Company | Consolidated | |||
| 09/30/2020 | 12/31/2019 | 09/30/2020 | 12/31/2019 | |
| Real estate development and sales | 434,567 | 492,205 | 687,561 | 605,067 |
| (-) Allowance for expected credit losses | (11,346) | (12,065) | (14,032) | (16,265) |
| ( - ) Allowance for cancelled contracts (a) | (43,547) | (27,481) | (73,912) | (37,485) |
| ( - ) Present value adjustment | (2,220) | (7,133) | (5,375) | (8,518) |
| Services and construction and other receivables | 36,591 | 14,491 | 36,748 | 14,639 |
Total trade accounts receivable (Note 20.i.d and 20.ii.a) | 414,045 | 460,017 | 630,990 | 557,438 |
| Current | 340,903 | 361,649 | 544,147 | 445,303 |
| Non-current | 73,142 | 98,368 | 86,843 | 112,135 |
(a) The increase in the allowance for cancelled contracts was mainly caused by the re-evaluation of the current contracts in relation to the uncertainty over cash inflows due to the impact of the Covid-19 pandemic on the Company’s portfolio of receivables.
The current and non-current portions have the following maturities:
| Company | Consolidated | |||
| Maturity | 09/30/2020 | 12/31/2019 | 09/30/2020 | 12/31/2019 |
| Past due: | ||||
| Up to 90 days (a) | 75,846 | 19,785 | 77,378 | 32,306 |
| From 91 to 180 days | 44,609 | 8,294 | 46,647 | 11,424 |
| Over 180 days | 98,247 | 90,216 | 137,154 | 115,619 |
| 218,702 | 118,295 | 261,179 | 159,349 | |
| Falling due: | ||||
| 2020 | 28,272 | 286,456 | 84,669 | 343,972 |
| 2021 | 155,615 | 83,082 | 298,155 | 97,213 |
| 2022 | 17.804 | 5,276 | 28,876 | 5,368 |
| 2023 | 13,444 | 3,180 | 13,627 | 3,247 |
| 2024 onwards | 37,321 | 10,407 | 37,803 | 10,557 |
| 252,456 | 388,401 | 463,130 | 460,357 | |
| ( - ) Present value adjustment | (2,220) | (7,133) | (5,375) | (8,518) |
| ( - ) Allowance for expected credit losses and cancelled contracts | (54,893) | (39,546) | (87,944) | (53,750) |
| 414,045 | 460,017 | 630,990 | 557,438 | |
(a) The increase in the period is due to the relevance of the delivery of six ventures in the period ended September 30, 2020. As reflection of the Covid-19 pandemic, the time required by banks and registry offices to process information for transferring the ownership of delivered units increased.
During the period ended September 30, 2020, the changes in the allowances for expected credit losses and cancelled contracts are summarized as follows:
| Company | Consolidated | |
| Balance as of December 31, 2019 | (39,546) | (53,750) |
| Additions (Note 22) | (24,445) | (69,893) |
| Write-offs / Reversals (Note 22) | 9,098 | 35,742 |
| Acquired balance Upcon | - | (43) |
| Balance as of September 30, 2020 | (54,893) | (87,944) |
The other explanations related to this note were not subject to material changes in relation to the disclosures in Note 5 to the financial statements as of December 31, 2019.
(A free translation of the original report in Portuguese as published in Brazil)
Gafisa S.A.
Notes to the quarterly financial information
September 30, 2020
(Amounts in thousands of Brazilian Reais, except as otherwise stated)
| 6. | Properties for sale |
| Company | Consolidated | |||
| 09/30/2020 | 12/31/2019 | 09/30/2020 | 12/31/2019 | |
| Land | 388,370 | 423,074 | 933,588 | 573,715 |
| ( - ) Provision for loss on realization of land | (122,621) | (122,621) | (122,621) | (122,621) |
| ( - ) Present value adjustment | (1,830) | (5,200) | (1,830) | (5,198) |
| Properties under construction (Note 29) | 162,075 | 190,383 | 386,489 | 355,980 |
| Completed units | 240,238 | 264,381 | 304,234 | 283,991 |
| ( - ) Provision for loss on realization of properties under construction and completed units | (63,193) | (65,627) | (64,542) | (67,099) |
| Allowance for cancelled contracts | 41,592 | 36,078 | 73,811 | 47,099 |
| Total properties for sale | 644,631 | 720,468 | 1,509,129 | 1,065,867 |
| Current | 528,437 | 490,419 | 1,317,144 | 786,660 |
| Non-current | 116,194 | 230,049 | 191,985 | 279,207 |
In the period ended September 30, 2020, the change in the provision for loss on realization of properties for sale is summarized below:
| Company | Consolidated | |
| Balance as of December 31, 2019 | (188,248) | (189,720) |
| Write-offs (a) | 2,434 | 2,557 |
| Balance as of September 30, 2020 | (185,814) | (187,163) |
(a) The amount of write-offs refers to the respective units sold in the period.
The amount of properties for sale offered as guarantee for financial liabilities is described in Note 12.
The other explanations related to this note were not subject to material changes in relation to the disclosures in Note 6 to the financial statements as of December 31, 2019.
| 7. | Other assets |
| Company | Consolidated | |||
| 09/30/2020 | 12/31/2019 | 09/30/2020 | 12/31/2019 | |
| Advances to suppliers | 17,574 | 20,142 | 20,226 | 20,702 |
| Recoverable taxes (IRRF, PIS, COFINS, among other) | 8,320 | 11,733 | 14,163 | 17,285 |
| Arbitration decision amount | 5,777 | 5,777 | 66,391 | 66,391 |
| Credits with the controlling shareholders of Calçada (a) | 20,000 | - | 20,000 | - |
| Judicial deposits (Note 16.a) | 132,249 | 122,238 | 140,661 | 129,933 |
| Other assets | - | - | 9,630 | - |
| Total other assets | 183,920 | 159,890 | 271,071 | 234,311 |
| Current | 65,760 | 52,455 | 146,125 | 67,395 |
| Non-current | 118,160 | 107,435 | 124,946 | 166,916 |
(a) Amount related to the advance made related to the acquisition of four ventures of Calçada Empreendimentos Imobiliários. The transaction was approved by the Administrative Council for Economic Defense (CADE) on November 3 (Note 31 (ii)).
| 8. | Non-current assets held for sale |
8.1 Land available for sale
The Company, in line with its strategic direction, opted to sell land not included in the business plan in effect. Likewise, it devised a specific plan for the sale of such land. The carrying amount of such land, adjusted to market value when applicable, after the test for impairment, is as follows:
| Company | Consolidated | ||||||
| Cost | Provision for impairment | Net balance | Cost | Provision for impairment | Net balance | ||
| Balance as of December 31, 2019 | 12,486 | (8,777) | 3,709 | 15,792 | (8,778) | 7,014 | |
| Additions | - | - | - | - | - | - | |
| Reversal / write-offs | - | - | - | - | - | - | |
| Balance as of September 30, 2020 | 12,486 | (8,777) | 3,709 | 15,792 | (8,778) | 7,014 | |
(A free translation of the original report in Portuguese as published in Brazil)
Gafisa S.A.
Notes to the quarterly financial information
September 30, 2020
(Amounts in thousands of Brazilian Reais, except as otherwise stated)
9. Investments in ownership interests
| (i) | Information on subsidiaries, associates and jointly-controlled investees |
| Company | Consolidated | |||||||||||||||||
| Interest in capital - % | Total assets | Total liabilities | Equity and advance for future capital increase | Profit (loss) for the period | Investments | Income from equity method investments | Investments | Income from equity method investments | ||||||||||
| Subsidiaries: | 09/30/2020 | 12/31/2019 | 09/30/2020 | 09/30/2020 | 09/30/2020 | 12/31/2019 | 09/30/2020 | 09/30/2019 | 09/30/2020 | 12/31/2019 | 09/30/2020 | 09/30/2019 | 09/30/2020 | 12/31/2019 | 09/30/2020 | 09/30/2019 | ||
| UPCON S.A. | (f) | 100% | 100% | 465,763 | 342,931 | 122,832 | - | - | - | 122,832 | - | - | - | - | - | - | - | |
| Novum Directiones SPE Ltda. | - | 100% | 100% | 177,253 | 98,294 | 78,959 | 44,120 | (1,404) | - | 78,959 | 44,120 | (1,404) | - | - | - | - | - | |
| Gafisa SPE-104 Emp. Imob. Ltda. | - | 100% | 100% | 93,723 | 25,130 | 68,594 | 55,422 | 12,951 | 4,670 | 68,594 | 55,422 | 13,172 | 4,670 | - | - | - | - | |
| Gafisa SPE-89 Emp. Imob. Ltda. | - | 100% | 100% | 109,157 | 58,143 | 51,014 | 51,015 | (1) | (13) | 51,014 | 51,015 | (1) | (13) | - | - | - | - | |
| Gafisa SPE-81 Emp. Imob. Ltda. | - | 100% | 100% | 48,799 | 824 | 47,975 | 47,964 | 11 | 1,819 | 47,975 | 47,964 | 11 | 1,819 | - | - | - | - | |
| GDU Loteamentos Ltda. | - | 100% | 100% | 43,206 | 19 | 43,187 | 43,206 | (19) | - | 43,187 | 43,206 | (19) | - | - | - | - | - | |
| Gafisa SPE- 132 Emp. Imob. Ltda. | - | 100% | 100% | 39,179 | 8,985 | 30,193 | 30,193 | - | - | 30,193 | 30,193 | - | - | - | - | - | - | |
| Nuove Direzioni SPE Ltda. | - | 100% | 100% | 41,364 | 11,202 | 30,162 | 30,887 | (725) | - | 30,162 | 30,887 | (725) | - | - | - | - | - | |
| Gafisa SPE-137 Emp. Imob. Ltda. | - | 100% | 100% | 25,608 | 42 | 25,567 | 25,567 | - | - | 25,567 | 25,567 | - | - | - | - | - | - | |
| Edsp 88 Participações S.A. | - | 100% | 100% | 29,474 | 12,682 | 16,792 | 16,724 | 68 | 175 | 16,792 | 16,724 | 68 | 175 | - | - | - | - | |
| Gafisa SPE-111 Emp. Imob. Ltda. | - | 100% | 100% | 18,139 | 3,293 | 14,846 | 14,848 | (2) | 508 | 14,846 | 14,848 | (2) | 508 | - | - | - | - | |
| Manhattan Square Em. Im.Res.02 SPE Ltd. | - | 100% | 100% | 15,960 | 1,238 | 14,722 | 14,722 | (1) | (809) | 14,722 | 14,722 | (1) | (809) | - | - | - | - | |
| Gafisa SPE 33 Emp. Imob. Ltda. | - | 100% | 100% | 196,161 | 182,632 | 13,530 | 13,227 | 302 | 138 | 13,530 | 13,227 | 302 | 138 | - | - | - | - | |
| Maraville Gafisa SPE Emp. Imob. Ltda. | - | 100% | 100% | 14,553 | 1,050 | 13,503 | 13,257 | 246 | 1,504 | 13,503 | 13,257 | 246 | 1,504 | - | - | - | - | |
| Gafisa SPE-134 Emp. Imob. Ltda. | - | 100% | 100% | 13,481 | 1,815 | 11,667 | 11,630 | 36 | (129) | 11,667 | 11,630 | 36 | (129) | - | - | - | - | |
| Gafisa SPE-78 Emp. Imob. Ltda. | 100% | 100% | 8,685 | 2,730 | 5,955 | 6,479 | (525) | 1,215 | 5,955 | 6,479 | (525) | 1,215 | - | - | - | - | ||
| OCPC01 adjustment - capitalized interest | (a) | - | - | - | - | - | - | 20,307 | 21,923 | - | (2) | - | - | - | - | |||
| Other (*) | 60,671 | 27,125 | 33,543 | 112,957 | (2,468) | (5,719) | 32,927 | 71,998 | (7,621) | (4,929) | - | - | - | - | ||||
| Subtotal Subsidiaries | 1,401,176 | 778,135 | 623,041 | 532,220 | 8,469 | 3,359 | 642,732 | 513,182 | 3,537 | 4,147 | - | - | - | - | ||||
| Jointly-controlled investees: | ||||||||||||||||||
| Gafisa e Ivo Rizzo SPE-47 Emp. Imob. Ltda. | - | 80% | 80% | 34,093 | 1,746 | 32,346 | 32,347 | 1 | 6 | 25,878 | 25,877 | - | 5 | 25,878 | 25,877 | - | 5 | |
| Sitio Jatiuca Emp. Imob. SPE Ltda | - | 50% | 50% | 35,210 | 4,658 | 30,552 | 29,636 | 916 | 905 | 15,276 | 14,818 | 458 | 452 | 15,276 | 14,818 | 458 | 452 | |
| Varandas Grand Park Emp. Imob. SPE Ltda. | (b) | 50% | 50% | 34,004 | 5,238 | 28,767 | 28,773 | 165 | 1,526 | 14,383 | 14,387 | (3) | 1,309 | 14,383 | 14,387 | (3) | 1,309 | |
| Parque Arvores Empr. Imob. Ltda. | (b) | 50% | 50% | 28,876 | 3,157 | 25,719 | 24,616 | 1,524 | 2,411 | 12,860 | 12,308 | 552 | 1,054 | 12,860 | 12,308 | 552 | 1,054 | |
| Atins Emp. Imob. Ltda. | - | 50% | 50% | 25,289 | 1,333 | 23,955 | 20,813 | 3,142 | 1,823 | 11,978 | 10,406 | 1,571 | 911 | 11,978 | 10,406 | 1,571 | 911 | |
| Gafisa SPE-116 Emp. Imob. Ltda. | - | 50% | 50% | 25,133 | 4,273 | 20,860 | 25,111 | (912) | 2,749 | 10,430 | 12,555 | (456) | 1,375 | 10,430 | 12,555 | (456) | 1,375 | |
| FIT 13 SPE Emp. Imob. Ltda. | - | 50% | 50% | 21,501 | 1,798 | 19,703 | 19,779 | (76) | 103 | 9,851 | 9,889 | (38) | 51 | 9,851 | 9,889 | (38) | 51 | |
| Performance Gafisa Gen. Severiano Ltda | - | 50% | 50% | 11,658 | 28 | 11,631 | 11,631 | - | 166 | 5,815 | 5,816 | - | 83 | 5,815 | 5,816 | - | 83 | |
| Other (*) | - | 68,628 | 28,474 | 40,153 | 38,751 | 374 | (3,220) | 20,386 | 19,850 | (3,527) | (1,832) | 32,544 | 29,122 | (3,577) | (1,587) | |||
| Subtotal jointly-controlled investees | 284,392 | 50,705 | 233,686 | 231,457 | 5,134 | 6,469 | 126,857 | 125,906 | (1,443) | 3,408 | 139,015 | 135,178 | (1,493) | 3,653 | ||||
| Associates: | ||||||||||||||||||
| Alphaville Urbanismo S.A. | - | - | - | - | - | - | (1,479,312) | - | (603,985) | - | - | - | - | - | - | - | - | |
| Citta Ville SPE Emp. Imob. Ltda. | - | 50% | 50% | 5,512 | 1,135 | 4,377 | 4,272 | 105 | 1,622 | 2,188 | 2,136 | 53 | 811 | 2,188 | 2,136 | 53 | 811 | |
| Gafisa Tiner Campo Belo I Emp. Imob. Ltda | - | 45% | 45% | 1,142 | 25 | 1,117 | 1,189 | (72) | (6) | 503 | 535 | (32) | (1) | 503 | 535 | (32) | (3) | |
| Other (*) | - | (1) | - | (1) | (1) | 1 | - | - | - | (1) | - | 728 | 953 | - | - | |||
| Indirect jointly-controlled investees Gafisa | 6,653 | 1,160 | 5,493 | (1,473,852) | 34 | (602,369) | 2,691 | 2,671 | 20 | 810 | 3,419 | 3,624 | 21 | 808 | ||||
| Goodwill arising from acquisition of subsidiary (c) | - | 130,063 | - | - | - | 130,063 | - | - | - | |||||||||
| Goodwill based on inventory surplus (d) | - | 39,886 | 39,886 | - | - | - | - | - | - | |||||||||
| Total investments | 942,229 | 681,645 | 2,114 | 8,365 | 272,497 | 138,802 | (1,472) | 4,461 | ||||||||||
| (*) Includes companies with investment balances below R$ 5,000. | ||||||||||||||||||
(A free translation of the original report in Portuguese as published in Brazil)
Gafisa S.A.
Notes to the quarterly financial information
September 30, 2020
(Amounts in thousands of Brazilian Reais, except as otherwise stated)
9. Investments in ownership interests--Continued
| (i) | Information on subsidiaries, associates and jointly-controlled investees--Continued |
| Company | Consolidated | |||||||||||||||
| Interest in capital - % | Total assets | Total liabilities | Equity and advance for future capital increase | Profit (loss) for the period | Investments | Income from equity method investments | Investments | Income from equity method investments | |||||||||
| Provision for net capital deficiency (e): | 09/30/2020 | 12/31/2019 | 09/30/2020 | 09/30/2020 | 09/30/2020 | 12/31/2019 | 09/30/2020 | 09/30/2019 | 09/30/2020 | 12/31/2019 | 09/30/2020 | 09/30/2019 | 09/30/2020 | 12/31/2019 | 09/30/2020 | 09/30/2019 | |
| Manhattan Square Emp. Imob. Res. 01 SPE Ltda | 50% | 50% | 42,160 | 55,638 | (13,477) | (6,791) | (6,686) | - | (8,086) | (4,075) | (4,011) | - | (8,086) | (4,075) | (4,011) | - | |
| Gafisa SPE 113 Em. Imob. Ltda. | 60% | 60% | 2,542 | 15,384 | (12,841) | (6,569) | (58) | (230) | (6,421) | (3,284) | (3,133) | (1,130) | (6,421) | (3,284) | (3,133) | (1,130) | |
| Manhattan Square Emp.Imob. Com. 01 SPE Ltda | 50% | 50% | 3,254 | 9,800 | (6,546) | (6,558) | (4) | (250) | (3,273) | (3,279) | 4 | (2,133) | (3,273) | (3,279) | 4 | (2,133) | |
| Other (*) | 424,021 | 435,533 | (11,513) | (4,483) | (8,306) | (182) | (11,183) | (4,156) | 1,366 | (114) | (328) | (325) | 4,229 | 891 | |||
| Total provision for net capital deficiency | 471,977 | 516,355 | (44,377) | (24,401) | - | (15,054) | (662) | (28,963) | (14,794) | (5,774) | (3,377) | (18,108) | (10,963) | (2,911) | (2,372) | ||
| Total income from equity method investments | (3,660) | 4,986 | (4,383) | 2,089 | |||||||||||||
(*) Includes companies with investment balances below (R$ 5,000).
| (a) | Financial charges of the Company not recorded in the profit or loss of subsidiaries, as required by paragraph 6 of OCPC01. |
(b) The Company recorded expense of R$386 in Income from equity method investments for the period ended September 30, 2020 related to the recognition, by jointly-controlled entities, of prior year adjustments, in accordance with the ICPC09 (R2) - Individual, Separate and Consolidated Financial Statements and the Equity Method of Accounting.
| (c) | Recognition of goodwill arising from the acquisition of the totality of UPCON S.A.’s shares. The Company commissioned a study from a company specialized in determining Purchase Price Allocation (PPA) for allocation of goodwill over a period of up to one year, according to CPC 15(R1) - Business Combinations. |
| (d) | Amount related to the goodwill arising from purchase of the control of SPE GDU Loteamentos Ltda. granted on December 27, 2019 by Alphavile Urbanismo for the urban development business with acquired assets. |
| (e) | The provision for net capital deficiency is recorded in the line item “Other payables” (Note 15). |
| (f) | In view of the completion of the transaction of acquisition of the totality of Upcon S.A.’s shares on September 22, 2020 (Note 9.1), the Company did not recorded any income from equity method investments for the eight remaining days of the month. |
| (ii) | Information on significant investees |
| Significant investee: | Other investees: | ||||||||
| Alphaville Urbanismo S.A. | Subsidiaries | Jointly-controlled investees | Associates | ||||||
| 09/30/2020 | 12/31/2019 | 09/30/2020 | 12/31/2019 | 09/30/2020 | 12/31/2019 | 09/30/2020 | 12/31/2019 | ||
| Cash and cash equivalents | - | - | 5,900 | 4,611 | 20,266 | 37,267 | 1,605 | 2,087 | |
| Current assets | - | - | 979,389 | 636,457 | 251,345 | 265,219 | 6,472 | 6,702 | |
| Non-current assets | - | - | 421,787 | 409,773 | 33,047 | 30,084 | 181 | 84 | |
| Current liabilities | - | - | 605,272 | 550,908 | 31,902 | 42,975 | 1,090 | 1,159 | |
| Non-current liabilities | - | - | 173,433 | 6,307 | 18,804 | 20,871 | 70 | 167 | |
| 09/30/2020 | 09/30/2019 | 09/30/2020 | 09/30/2019 | 09/30/2020 | 09/30/2019 | 09/30/2020 | 09/30/2019 | ||
| Net revenue | - | 27,107 | 32,913 | 54,505 | 27,497 | 53,271 | (65) | 228 | |
| Operating costs | - | - | (17,393) | (34,056) | (14,823) | (38,467) | - | (26) | |
| Depreciation and amortization | - | - | (3) | (1,114) | (5) | (21) | - | - | |
| Finance income (expenses) | - | - | (3,194) | (793) | 253 | (2,374) | 8 | 282 | |
| Income tax and social contribution | - | - | (495) | (1,204) | (850) | (1,472) | (12) | (87) | |
| Profit or loss from continued operations | - | (603,985) | 8,469 | 3,359 | 5,134 | 6,469 | 33 | (602,362) | |
| (iii) | Change in investments |
| Company | Consolidated | ||
| Balance as of December 31, 2019 | 681,645 | 138,802 | |
| Income from equity method investments | 2,114 | (1,472) | |
| Capital contribution (reduction) | (1,150) | 53 | |
| Recognition of goodwill (9.(i).(c)) | 130,063 | 130,063 | |
| Investment UPCON | 122,832 | - | |
| Other investments | 6,725 | 5,051 | |
| Balance as of September 30, 2020 | 942,229 | 272,497 |
The other explanations related to this note were not subject to material changes in relation to the disclosures in Note 9 to the financial statements as of December 31, 2019.
(A free translation of the original report in Portuguese as published in Brazil)
Gafisa S.A.
Notes to the quarterly financial information
September 30, 2020
(Amounts in thousands of Brazilian Reais, except as otherwise stated)
| 9. | Investments in ownership interests--Continued |
9.1 Business combination
| (i) | Acquisition UPCON S.A. |
On September 23, 2020, the Company disclosed the completion of the acquisition of the totality of Upcon S.A.’s shares, settled with the Company’s shares. Such transaction gave rise to a goodwill in the amount of R$130,063, for which the Company commissioned a study from a company specialized in determining the Purchase Price Allocation (PPA) for allocation of goodwill over a period of up to one year, according to CPC 15(R1) - Business Combinations.
The following table shows the determination of the acquisition cost, pursuant to CVM Resolution 665/11:
| Acquisition cost | 252,895 |
| Acquired net assets | 122,832 |
| Goodwill to be allocated | 130,063 |
| 10. | Property and equipment |
| Company | Consolidated | |||||||||||||||
| Description | 12/31/2019 | Additions | Write-offs | 100% depreciated items | 09/30/2020 | 12/31/2019 | Additions | Write-offs | Addition UPCON | 100% depreciated items | 09/30/2020 | |||||
| Cost | ||||||||||||||||
| Hardware | 8,922 | - | - | (4,918) | 4,004 | 9,111 | - | - | - | (4,946) | 4,165 | |||||
| Leasehold improvements and installations | 785 | - | - | - | 785 | 771 | - | - | 10 | - | 781 | |||||
| Furniture and fixtures | 637 | - | - | - | 637 | 741 | - | - | 123 | - | 864 | |||||
| Machinery and equipment | 2,561 | - | - | - | 2,561 | 2,561 | - | - | 22 | - | 2,583 | |||||
| Right-of-use assets | 3,235 | - | (217) | - | 3,018 | 3,235 | - | (217) | 726 | - | 3,744 | |||||
| Sales stands | 5,794 | 194 | (2,188) | - | 3,800 | 11,638 | 6,328 | (2,222) | 3,069 | - | 18,813 | |||||
| 21,934 | 194 | (2,405) | (4,918) | 14,805 | 28,057 | 6,328 | (2,439) | 3,950 | (4,946) | 30,950 | ||||||
| Accumulated depreciation | ||||||||||||||||
| Hardware | (3,826) | (1,915) | - | 4,918 | (823) | (3,905) | (1,948) | - | - | 4,946 | (907) | |||||
| Leasehold improvements and installations | (782) | (266) | - | - | (1,048) | (737) | (269) | - | (7) | - | (1,013) | |||||
| Furniture and fixtures | (511) | (48) | - | - | (559) | (604) | (49) | - | (75) | - | (728) | |||||
| Machinery and equipment | (2,315) | (192) | - | - | (2,507) | (2,315) | (192) | - | (7) | - | (2,514) | |||||
| Right-of-use assets | (1,711) | (710) | - | - | (2,421) | (1,711) | (710) | - | (715) | - | (3,136) | |||||
| Sales stands | (642) | - | - | - | (642) | (4,626) | (394) | 29 | (1,726) | - | (6,717) | |||||
| (9,787) | (3,131) | - | 4,918 | (8,000) | (13,898) | (3,562) | 29 | (2,530) | 4,946 | (15,015) | ||||||
| Total property and equipment | 12,147 | (2,937) | (2,405) | - | 6,805 | 14,159 | 2,766 | (2,410) | 1,420 | - | 15,935 | |||||
The other explanations related to this note were not subject to material changes in relation to the disclosures in Note 10 to the financial statements as of December 31, 2019.
| 11. | Intangible assets |
| Company | ||||||||||
| 12/31/2019 | 09/30/2020 | |||||||||
| Balance | Additions | Write-offs | Amortizations | 100% amortized items | Balance | |||||
| Software – Cost | 15,953 | - | - | - | (1,807) | 14,146 | ||||
| Software – Depreciation | (9,401) | - | - | (2,215) | 1,807 | (9,809) | ||||
| Other | - | 700 | (27) | - | 673 | |||||
| Total intangible assets | 6,552 | 700 | - | (2,242) | - | 5,010 | ||||
| Consolidated | ||||||||||
| 12/31/2019 | 09/30/2020 | |||||||||
| Balance | Additions | Write-offs | Amortizations | 100% amortized items | Balance | |||||
| Software – Cost | 17,353 | - | - | - | (1,807) | 15,546 | ||||
| Software – Depreciation | (10,269) | - | - | (2,395) | 1,807 | (10,857) | ||||
| Other | - | 700 | (27) | - | 673 | |||||
| Total intangible assets | 7,084 | 700 | - | (2,422) | - | 5,362 | ||||
The other explanations related to this note were not subject to material changes in relation to the disclosures in Note 10 to the financial statements as of December 31, 2019.
(A free translation of the original report in Portuguese as published in Brazil)
Gafisa S.A.
Notes to the quarterly financial information
September 30, 2020
(Amounts in thousands of Brazilian Reais, except as otherwise stated)
| 12. | Loans and financing |
| Company | Consolidated | |||||
| Type | Maturity | Annual interest rate | 09/30/2020 | 12/31/2019 | 09/30/2020 | 12/31/2019 |
| National Housing System - SFH /SFI (i) (ii) | May 2019 to July 2025 | 7.00% to 14.20% + TR 13.66% and 143% of CDI | 365,146 | 421,382 | 385,772 | 456,247 |
Certificate of Bank Credit (CCB) (ii)
| March 2021 to April 2022
|
Fixed 16.77%/12.68%/6.00% 2.5%/ 3.70%/ 4.25%+CDI
| 50,561
| 55,022
| 53,739
| 55,022
|
| Other transactions | 4,945 | 14,272 | 63,177 | 21,884 | ||
| Total loans and financing (Note 20.i.d, 20.ii.a and 20.iii) | 420,652 | 490,676 | 502,688 | 533,153 | ||
| Total current | 300,534 | 383,647 | 349,348 | 426,124 | ||
| Non-current | 120,118 | 107,029 | 153,340 | 107,029 | ||
(i) On March 26, 2020, the Company completed the renegotiation of its financial liabilities with the financial institution Banco do Brasil S.A. in the total amount of R$138,355. This transaction enabled the Company to extend the final maturity of such debts until June 2025 and reduce the finance cost. Also in the scope of the renegotiation, the Company started to work on the time required to sell the units in inventory tied to this transaction.
(ii) In the period ended September 30, 2020, the Company made payments totaling R$250,469, of which R$235,151 related to principal and R$15,318 related to the interest payable.
The current and non-current portions have the following maturities:
| Company | Consolidated | ||||
| Maturity | 09/30/2020 | 12/31/2019 | 09/30/2020 | 12/31/2019 | |
| 2020 | 182,748 | 383,647 | 217,189 | 426,124 | |
| 2021 | 122,406 | 103,269 | 140,620 | 103,269 | |
| 2022 | 11,560 | 3,760 | 27,461 | 3,760 | |
| 2023 | 7,800 | - | 12,517 | - | |
| 2024 onwards | 96,138 | - | 104,901 | - | |
| 420,652 | 490,676 | 502,688 | 533,153 | ||
The Company and its subsidiaries have restrictive covenants under certain loans and financing that limit their ability to perform certain actions, such as issuing debt, and that could require the acceleration or refinancing of loans if the Company does not fulfill certain restrictive covenants.
The ratios and minimum and maximum amounts required under restrictive covenants for loan and financing transactions are as follows:
| 09/30/2020 | 12/31/2019 | |
| Loans and financing | ||
| Total accounts receivable(1) plus inventories required to be below zero or 2.0 times over venture debt(2) | 6.54 times | 4.52 times |
| Total accounts receivable(1) plus inventories of completed units required to be below zero or 2.0 times over net debt less venture debt(2) | (4.59) times | (9.04) times |
| Total debt, less venture debt, less cash and cash equivalents and short-term investments(3), cannot exceed 75% of equity plus non-controlling interests | -17.14% | -15.81% |
| Total receivables(1) plus unrecognized income plus total inventories of completed units required to be 1.5 time over the net debt plus payable for purchase of properties plus unrecognized cost | 5.40 times | 3.79 times |
| (1) | Total receivables, whenever mentioned, refer to the amount reflected in the Statement of Financial Position plus the amount not shown in the Statement of Financial Position. |
| (2) | Venture debt and secured guarantee debt refer to SFH debts, defined as the sum of all disbursed borrowing contracts which funds were provided by the SFH. |
| (3) | Cash and cash equivalents and short-term investments refer to cash and cash equivalents and marketable securities. |
(A free translation of the original report in Portuguese as published in Brazil)
Gafisa S.A.
Notes to the quarterly financial information
September 30, 2020
(Amounts in thousands of Brazilian Reais, except as otherwise stated)
| 12. | Loans and financing--Continued |
The following table shows the summary of finance costs and charges and the capitalized portion in the line item properties for sale.
| Company | Consolidated | |||||
| 09/30/2020 | 09/30/2019 | 09/30/2020 | 09/30/2019 | |||
| Total financial charges for the year | 59,898 | 66,184 | 64,686 | 68,205 | ||
| Capitalized financial charges (Note 30) | (13,483) | (17,756) | (21,685) | (25,229) | ||
| Subtotal (Note 24) | 46,415 | 48,428 | 43,001 | 42,976 | ||
| Financial charges included in “Properties for sale”: | ||||||
| Opening balance | 193,798 | 211,465 | 206,935 | 223,807 | ||
| Capitalized financial charges | 13,483 | 17,756 | 21,685 | 25,229 | ||
| Financial charges related to cancelled land sales contract | (3,840) | (8,955) | (3,840) | (8,955) | ||
| Charges recognized in profit or loss (Note 23) | (16,710) | (21,757) | (25,307) | (30,356) | ||
| Acquired balance UPCON | - | 17,408 | ||||
| Closing balance | 186,731 | 198,509 | 216,881 | 209,725 | ||
The recorded amount of properties for sale offered as guarantee for loans, financing and debentures is R$379,986 (R$421,120 in 2019).
The other explanations related to this note were not subject to material changes in relation to the disclosures in Note 12 to the financial statements as of December 31, 2019.
| 13. | Debentures |
| Company | Consolidated | ||||||
| Program/placements | Principal - R$ | Annual interest | Final maturity | 09/30/2020 | 12/31/2019 | 09/30/2020 | 12/31/2019 |
| Tenth placement (i) | 22,453 | IPCA + 7.8% | December 2023 | 34,522 | 38,038 | 34,522 | 38,038 |
| Eleventh placement – 1st Series A (ii) | - | - | - | - | 52,008 | - | 52,008 |
| Twelfth placement (iii) | 39,843 | CDI + 3.75 % | December 2020 | 39,800 | 57,139 | 39,800 | 57,139 |
| Thirteenth placement (iv) | 17,777 | CDI + 3.00% | June 2022 | 16,671 | 33,792 | 16,671 | 33,792 |
| Fourteenth placement (v) | 22,835 | CDI + 5.00% | October 2020 | 26,024 | 16,548 | 26,024 | 16,548 |
| Fifteenth placement (a) | 33,750 | IGPM - 0.50% | July 2021 | 35,710 | - | 35,710 | - |
| RB Capital (b) | 90,083 | CDI + 6.00% | September 2024 | - | - | 90,083 | - |
| Total debentures (Note 20.i.d, 20.ii.a, 20.iii and 30.ii) | 152,727 | 197,525 | 242,810 | 197,525 | |||
| Current portion | 127,147 | 158,179 | 127,147 | 158,179 | |||
| Non-current portion | 25,580 | 39,346 | 115,663 | 39,346 | |||
(a) In the context of the acquisition of the totality of UPCON’s shares, on July 17, 2020, the Company signed the indenture of the 15th convertible debenture, of the subordinate type, into two series, in the total amount of R$33,750, maturing on July 15, 2020. The coupon rate applied to the face value corresponds to 0.50% per year and the index is the IGPM. The principal and coupon payments are only made on the respective maturity date, and may be settled by using the Company’s shares.
(b) On September 15, 2020, the subsidiary Novum signed the indenture of the first non-convertible debenture issue, with secured guarantee, in sole series, in the total amount of R$190,000, maturing in September 2024. The net proceeds from this issue will be fully and only used to develop the real estate development ventures “Scena Tatuapé", "Parque Ecoville", "Moov Belém", "Moov Estação Brás", "Moov Parque Maia", "Belvedere" and "Upside Paraíso". The funds shall be released according to the construction works’ needs, amortization and interest payments shall be made at the end of the operation. The coupon rate applied to the face value corresponds to the cumulative change of Interbank Deposits (DI) plus a surcharge equivalent to 6% p.a.
In the period ended September 30, 2020, the Company made the following payments:
| Face value placement | Interest payable | Total amortization | |
| (i) | 4,771 | 1,366 | 6,137 |
| (ii) | 52,026 | 2,928 | 54,954 |
| (iii) | 17,639 | 2,451 | 20,090 |
| (iv) | 17,590 | 1,292 | 18,882 |
| (v) | 12,511 | 1,198 | 13,709 |
| 104,537 | 9,235 | 113,772 |
The current and non-current portions have the following maturities:
| Company | Consolidated | |||
| Maturity | 09/30/2020 | 12/31/2019 | 09/30/2020 | 12/31/2019 |
| 2020 | 80,394 | 158,179 | 80,394 | 158,179 |
| 2021 | 56,131 | 23,119 | 56,131 | 23,119 |
| 2022 | 10,344 | 11,243 | 10,344 | 11,243 |
| 2023 | 5,858 | 4,984 | 5,858 | 4,984 |
| 2024 | - | - | 90,083 | - |
| 152,727 | 197,525 | 242,810 | 197,525 | |
(A free translation of the original report in Portuguese as published in Brazil)
Gafisa S.A.
Notes to the quarterly financial information
September 30, 2020
(Amounts in thousands of Brazilian Reais, except as otherwise stated)
| 13. | Debentures--Continued |
The Company is compliant with the restrictive covenants of debentures at the reporting date of this quarterly information. The ratios and minimum and maximum amounts required under restrictive covenants are as follows:
| 09/30/2020 | 12/31/2019 | |
| Tenth placement | ||
| Total accounts receivable(1) plus inventories required to be below zero or 2.0 times over net debt less venture debt(2) | (9.44) times | (14.62) times |
| Total debt, less venture debt(2), less cash and cash equivalents and short-term investments(3), cannot exceed 75% of equity plus non-controlling interests | -17.14% | -15.81% |
(a)
(1) Total receivables, whenever mentioned, refer to the amount reflected in the Statement of Financial Position plus the amount not shown in the Statement of Financial Position.
(2) Venture debt and secured guarantee debt refer to SFH debts, defined as the sum of all disbursed borrowing contracts which funds were provided by the SFH.
(3) Cash and cash equivalents and short-term investments refer to cash and cash equivalents and marketable securities.
The other explanations related to this note were not subject to material changes in relation to the disclosures in Note 13 to the financial statements as of December 31, 2019.
| 14. | Obligations assumed on the assignment of receivables |
The transactions of assignment of the receivable portfolio are as follows:
| Company | Consolidated | |||
| 09/30/2020 | 12/31/2019 | 09/30/2020 | 12/31/2019 | |
| Obligation CCI June/2011 | 152 | 322 | 294 | 412 |
| Obligation CCI November/2012 | - | - | 2,441 | 2,586 |
| Obligation CCI December/2012 | 950 | 1,683 | 950 | 1,683 |
| Obligation CCI November/2013 | 183 | 242 | 644 | 1,170 |
| Obligation CCI November/2014 | 436 | 833 | 616 | 1,203 |
| Obligation CCI December/2015 | 1,410 | 2,342 | 3,950 | 5,300 |
| Obligation CCI February/2016 | 3,705 | 5,845 | 4,168 | 6,429 |
| Obligation CCI May/2016 | 2,639 | 3,385 | 3,525 | 4,625 |
| Obligation CCI August/2016 | 1,898 | 2,351 | 1,922 | 2,392 |
| Obligation CCI December/2016 | 5,162 | 5,961 | 5,274 | 6,106 |
| Obligation CCI March/2017 | 5,920 | 8,254 | 6,110 | 8,455 |
Total obligations assumed on assignment of receivables (Note 20.i.d and 20.ii.a) | 22,455 | 31,218 | 29,894 | 40,361 |
| Current | 11,843 | 14,755 | 15,534 | 20,526 |
| Non-current | 10,612 | 16,463 | 14,360 | 19,835 |
The current and non-current portions have the following maturities:
| Company | Consolidated | ||||
| Maturity | 09/30/2020 | 12/31/2019 | 09/30/2020 | 12/31/2019 | |
| 2020 | 3,287 | 14,755 | 7,313 | 20,526 | |
| 2021 | 8,036 | 5,193 | 10,962 | 7,020 | |
| 2022 | 3,946 | 3,620 | 5,277 | 4,284 | |
| 2023 | 2,066 | 1,895 | 2,916 | 2,221 | |
| 2024 | 5,120 | 5,755 | 3,426 | 6,310 | |
| 22,455 | 31,218 | 29,894 | 40,361 | ||
The other explanations related to this note were not subject to material changes in relation to the disclosures in Note 14 to the financial statements as of December 31, 2019.
(A free translation of the original report in Portuguese as published in Brazil)
Gafisa S.A.
Notes to the quarterly financial information
September 30, 2020
(Amounts in thousands of Brazilian Reais, except as otherwise stated)
| 15. | Other payables |
| Company | Consolidated | |||
| 09/30/2020 | 12/31/2019 | 09/30/2020 | 12/31/2019 | |
| Provision for penalties due to delay in construction work | 4,491 | 3,659 | 8,677 | 5,283 |
| Cancelled contract payable and allowance for cancelled contracts | 74,305 | 71,549 | 107,428 | 97,255 |
| Warranty provision | 15,521 | 14,419 | 15,521 | 14,419 |
| Long term PIS and COFINS (deferred and payable) | 4,665 | 5,780 | 6,038 | 8,372 |
| Provision for net capital deficiency (Note 9.i.e) | 28,963 | 14,794 | 18,108 | 10,963 |
| Long-term suppliers (Note 20.i.d) | 1,311 | 1,179 | 1,781 | 1,382 |
| Share-based payment - Phantom Shares (Note 18.3) | 1,156 | 1,702 | 1,156 | 1,702 |
| Other liabilities | 6,255 | 3,379 | 41,725 | 5,181 |
| Total other payables | 136,667 | 116,461 | 200,434 | 144,557 |
| Current | 132,183 | 110,189 | 178,550 | 135,492 |
| Non-current | 4,484 | 6,272 | 21,884 | 9,065 |
| 16. | Provisions for legal claims and commitments |
In the period ended September 30, 2020, the changes in the provision are summarized as follows:
| Company | Civil lawsuits | Tax proceedings | Labor claims | Total |
| Balance as of December 31, 2019 | 226,951 | 2,682 | 33,848 | 263,481 |
| Additional provision (Note 23) | 51,127 | - | - | 51,127 |
| Payment and reversal of provision not used | (39,839) | (2,637) | (4,274) | (46,750) |
| Balance as of September 30, 2020 | 238,239 | 45 | 29,574 | 267,858 |
| Current | 165,492 | 44 | 25,096 | 190,632 |
| Non-current | 72,747 | 1 | 4,478 | 77,226 |
| Consolidated | Civil lawsuits | Tax proceedings | Labor claims | Total |
| Balance as of December 31, 2019 | 227,169 | 2,702 | 34,742 | 264,613 |
| Additional provision (Note 23) | 52,708 | - | - | 52,708 |
| Payment and reversal of provision not used | (41,000) | (570) | (5,168) | (46,738) |
| Acquired balance UPCON | 6,125 | 97 | 2,802 | 9,024 |
| Balance as of September 30, 2020 | 245,002 | 2,229 | 32,376 | 279,607 |
| Current | 166,130 | 2,131 | 25,096 | 193,357 |
| Non-current | 78,872 | 98 | 7,280 | 86,250 |
| (a) | Civil lawsuits, tax proceedings and labor claims |
As of September 30, 2020, the Company and its subsidiaries have deposited in court the amount of R$132,249 (R$122,238 in 2019) in the Company’s statements, and R$140,661 (R$129,933 in 2019) in the consolidated statements (Note 7).
| Company | Consolidated | ||||
| 09/30/2020 | 12/31/2019 | 09/30/2020 | 12/31/2019 | ||
| Civil lawsuits | 60,782 | 50,308 | 66,000 | 54,706 | |
| Tax proceedings | 37,161 | 40,516 | 38,535 | 41,989 | |
| Labor claims | 34,306 | 31,414 | 36,126 | 33,238 | |
| Total (Note 7) | 132,249 | 122,238 | 140,661 | 129,933 | |
(A free translation of the original report in Portuguese as published in Brazil)
Gafisa S.A.
Notes to the quarterly financial information
September 30, 2020
(Amounts in thousands of Brazilian Reais, except as otherwise stated)
16. Provisions for legal claims and commitments--Continued
(i) Lawsuits which likelihood of loss is rated as possible
As of September 30, 2020, the Company and its subsidiaries are aware of other claims, and civil, labor and tax risks. Based on the history of probable lawsuits and the specific analysis of main claims, the measurement of the claims with likelihood of loss considered possible amounted to R$487,235 (R$562,439 in 2019) in the Company’s statements and R$488,172 (R$565,410 in 2019) in the consolidated statements, based on average past outcomes adjusted to current estimates, for which the Company’s Management believes it is not necessary to recognize a provision for any losses. The change in the period was caused by the change in the volume of lawsuits with diluted amounts, and review of the involved amounts.
| Company | Consolidated | ||||
| 09/30/2020 | 12/31/2019 | 09/30/2020 | 12/31/2019 | ||
| Civil lawsuits | 312,790 | 398,325 | 312,790 | 398,676 | |
| Tax proceedings | 110,167 | 97,871 | 110,486 | 98,186 | |
| Labor claims | 64,278 | 66,243 | 64,896 | 68,548 | |
| 487,235 | 562,439 | 488,172 | 565,410 | ||
| (b) | Payables related to the completion of real estate ventures |
There was no material change in relation to the information disclosed in Note 16(i)(b) to the financial statements as of December 31, 2019.
| (c) | Other commitments |
In addition to the commitments mentioned in Notes 6, 12 and 13, the Company has commitments related to the rental of two commercial properties where its facilities are located, at a monthly cost of R$171 (including rent, condominium fees, and IPTU), indexed to the IGP-M/FGV change and termination of contract in August 2024.
The estimate of minimum future rent payments of this new contract for commercial property (cancellable leases) totals R$8,240, considering the above-mentioned contract expiration, as follows.
| Consolidated | |
| Estimate of payment | 09/30/2020 |
| 2020 | 766 |
| 2021 | 2,153 |
| 2022 | 2,239 |
| 2023 | 2,329 |
| 2024 onwards | 753 |
| 8,240 |
The other explanations related to this note were not subject to material changes in relation to the disclosures in Note 16 to the financial statements as of December 31, 2019.
(A free translation of the original report in Portuguese as published in Brazil)
Gafisa S.A.
Notes to the quarterly financial information
September 30, 2020
(Amounts in thousands of Brazilian Reais, except as otherwise stated)
| 17. | Payables for purchase of properties and advances from customers |
| Company | Consolidated | ||||
| Maturity | 09/30/2020 | 12/31/2019 | 09/30/2020 | 12/31/2019 | |
| Payables for purchase of properties | October 2020 to November 2022 | 42,939 | 68,020 | 180,127 | 68,133 |
| Present value adjustment | (1,855) | (5,295) | (1,859) | (5,298) | |
| Advances from customers | |||||
| Development and services | 1,088 | 1,540 | 58,173 | 14,197 | |
| Barter transaction – Land (Note 30 (i)) | 65,180 | 94,075 | 110,837 | 145,396 | |
| Total payables for properties and advances from customers (Notes 20.i.d and 20.ii.a) | 107,352 | 158,340 | 347,278 | 222,428 | |
| Current | 66,660 | 89,825 | 259,336 | 129,353 | |
| Non-current | 40,692 | 68,515 | 87,942 | 93,075 | |
The current and non-current portions fall due as follows:
| Company | Consolidated | ||||
| Maturity | 09/30/2020 | 12/31/2019 | 09/30/2020 | 12/31/2019 | |
| 2020 | 26,908 | 89,825 | 145,672 | 129,353 | |
| 2021 | 45,985 | 28,352 | 78,072 | 40,219 | |
| 2022 | 24,086 | 29,208 | 66,983 | 33,396 | |
| 2023 | 8,843 | 10,599 | 45,842 | 10,597 | |
| 2024 onwards | 1,530 | 356 | 10,709 | 8,863 | |
| 107,352 | 158,340 | 347,278 | 222,428 | ||
| 18. | Equity |
| 18.1. | Capital |
At the Extraordinary Shareholders’ Meeting held on April 30, 2020, shareholders approved the absorption of the Company’s retained losses by its capital in the amount of R$2,585,033.
The Company’s Board of Directors ratified the following capital increases in the period ended September 30, 2020:
| · | On August 7, 2020: subscription and pay-in of 75,610,000 new common shares at the price of R$4.10, totaling R$ 310,001. |
| · | On September 25, 2020: subscription and pay-in of 95,121,951 new common shares at the price of R$4.10, totaling R$390.000. |
Accordingly, as of September 30, 2020, the Company's authorized and paid-in capital amounted to R$1,041,248 (R$2,926,280 in 2019), represented by 290,731,951 registered common shares, with no par value, of which 341,570 (2,981,052 in 2019) were held in treasury.
According to the Company’s Articles of Incorporation, capital may be increased without need of making amendment to it, upon resolution of the Board of Directors, which shall set the conditions for issuance within the limit of 600,000,000 (six hundred million) common shares.
(A free translation of the original report in Portuguese as published in Brazil)
Gafisa S.A.
Notes to the quarterly financial information
September 30, 2020
(Amounts in thousands of Brazilian Reais, except as otherwise stated)
18. Equity--Continued
| 18.1. | Capital--Continued |
| Treasury shares | |||||||||||||||||
| Type | GFSA3 | R$ | % | Market value (*) R$ thousand | Carrying amount R$ thousand | ||||||||||||
| Acquisition date | Number (i) | Weighted average price | % - on shares outstanding | 09/30/2020 | 12/31/2019 | 09/30/2020 | 12/31/2019 | ||||||||||
| 2001 | 11/20/2001 | 44,462 | 38.9319 | 0.04% | 193 | 385 | 1,731 | 1,731 | |||||||||
| 2013 | Acquisitions | 1,372,096 | 51.9927 | 1.15% | 5,941 | 11,896 | 71,339 | 71,339 | |||||||||
| 2014 | Acquisitions | 3,243,947 | 35.5323 | 2.71% | 14,046 | 28,125 | 115,265 | 115,265 | |||||||||
| 2014 | Transfers | (405,205) | 43.3928 | -0.34% | (1,755) | (3,513) | (17,583) | (17,583) | |||||||||
| 2014 | Cancellations | (2,039,086) | 44.9677 | -1.70% | (8,829) | (17,679) | (91,693) | (91,693) | |||||||||
| 2015 | Acquisitions | 884,470 | 27.3124 | 0.74% | 3,830 | 7,668 | 24,157 | 24,157 | |||||||||
| 2015 | Transfers | (90,622) | 33.3473 | -0.08% | (392) | (786) | (3,022) | (3,022) | |||||||||
| 2015 | Cancellations | (2,225,020) | 33.3543 | -1.86% | (9,634) | (19,291) | (74,214) | (74,214) | |||||||||
| 2016 | Acquisitions | 334,020 | 26.0254 | 0.28% | 1,446 | 2,896 | 8,693 | 8,693 | |||||||||
| 2016 | Transfers | (68,814) | 31.2290 | -0.06% | (298) | (597) | (2,149) | (2,149) | |||||||||
| 2017 | Transfers | (112,203) | 30.6320 | -0.09% | (487) | (973) | (3,435) | (3,435) | |||||||||
| 2018 | Acquisitions | 13,221,300 | 13.4953 | 11.06% | 57,248 | 114,629 | 178,425 | 178,425 | |||||||||
| 2018 | Transfers | (17,319) | 30.6022 | -0.01% | (75) | (150) | (530) | (530) | |||||||||
| 2018 | Cancellations | (1,030,326) | - | -0.86% | (4,461) | (8,933) | - | - | |||||||||
| 2018 | Disposal | (9,168,280) | 16.1463 | -7.67% | (39,699) | (79,489) | (148,034) | (148,034) | |||||||||
| 2019 | Acquisitions | 6,794,011 | 14.7355 | 5.68% | 29,418 | 58,904 | 100,113 | 100,113 | |||||||||
| 2019 | Transfers | (9,174) | 15.3695 | -0.01% | (40) | (80) | (141) | (141) | |||||||||
| 2019 | Cancellations | (370,000) | 15.5324 | -0.31% | (1,602) | (3,208) | (5,747) | (5,747) | |||||||||
| 2019 | Disposal | (7,377,205) | 14.5999 | -6.17% | (31,943) | (63,960) | (109,658) | (109,658) | |||||||||
| 2020 | Disposal | (2,639,482) | 14.5979 | -2.17% | (11,430) | - | (40,882) | - | |||||||||
| 341,570 | 7.7116 | 0.33% | 1,477 | 25,844 | 2,634 | 43,517 | |||||||||||
| (*) | Market value calculated based on the closing share price on September 30, 2020 of R$4.33 (R$8.67 in 2019) not considering the effect of occasional volatilities. |
The Company holds shares in treasury acquired in 2001 in order to guarantee the performance of lawsuits (Note 16(a)(i)).
The change in the number of shares outstanding is as follows:
| Common shares - In thousands | |
| Shares outstanding as of December 31, 2019 | 117,005 |
| Subscription of shares | 170,732 |
| Disposal of shares | 2,639 |
| Change in management’s shares | (9,786) |
| Shares outstanding as of September 30, 2020 | 280,590 |
| Weighted average shares outstanding (Note 27) | 144,814 |
| 18.2. | Stock option plan |
Expenses for granting stocks are recorded under the account “General and administrative expenses” (Note 23) and showed the following effects on profit or loss in the periods ended September 30, 2020 and 2019:
| 09/30/2020 | 09/30/2019 | |
| Equity-settled stock option plans | 184 | 355 |
| Phantom Shares (Note 18.3) | (546) | (3,053) |
| Total option grant expenses (Note 23) | (362) | (2,698) |
Changes in the stock options outstanding in the period ended September 30, 2020 and year ended December 31, 2019, including the respective weighted average exercise prices are as follows:
| 2020 | 2019 | |||
| Number of options | Weighted average exercise price (reais) | Number of options | Weighted average exercise price (reais) | |
| Options outstanding at the beginning of the year | 1,230,383 | 16.64 | 1,239,557 | 15.58 |
| Options granted | - | - | - | - |
| Options exercised (i) | - | - | (9,174) | (16.16) |
| Options outstanding at the end of the year | 1,230,383 | 16.64 | 1,230,383 | 16.64 |
| (i) | In the year ended December 31, 2019, the amount received through exercised options was R$148. |
(A free translation of the original report in Portuguese as published in Brazil)
Gafisa S.A.
Notes to the quarterly financial information
September 30, 2020
(Amounts in thousands of Brazilian Reais, except as otherwise stated)
18. Equity--Continued
| 18.2. | Stock option plan--Continued |
As of September 30, 2020, the stock options outstanding and exercisable are as follows:
| Options outstanding | Options exercisable | |||
| Number of options | Weighted average remaining contractual life (years) | Weighted average exercise price (reais) | Number of options | Weighted average exercise price (reais) |
| 1,230,383 | 5.50 | 16.64 | 682,964 | 23.27 |
During the period ended September 30, 2020 and year ended December 31, 2019, the Company did not grant any option in connection with its stock option plans comprising common shares.
The models used by the Company for pricing granted options are the Binomial model for traditional options and the MonteCarlo model for options in the Restricted Stock Options format.
| 18.3. | Share-based payment - Phantom Shares |
The Company has a total of two cash-settled share-based payment plans with fixed terms and conditions, according to the plans approved by the Company, launched in 2015 and 2016.
As of September 30, 2020, the amount of R$1,156 (R$1,702 in 2019), related to the fair value of the phantom shares granted, is recognized in the line item “Other payables” (Note 15).
The other explanations related to this note were not subject to material changes in relation to the disclosures in Note 18 to the financial statements as of December 31, 2019.
| 19. | Income tax and social contribution |
The reconciliation of the effective tax rate for the periods ended September 30, 2020 and 2019 is as follows:
| Company | Consolidated | |||
| 09/30/2020 | 09/30/2019 | 09/30/2020 | 09/30/2019 | |
| Loss before income tax and social contribution, and statutory interest | (105,500) | (60,746) | (102,680) | (59,404) |
| Income tax calculated at the applicable rate - 34% | 35,870 | 20,654 | 34,911 | 20,197 |
| Net effect of subsidiaries and ventures taxed by presumed profit and RET | - | - | (608) | - |
| Income from equity method investments | (1,245) | (1,695) | (1,245) | (710) |
| Stock option plan | (63) | (121) | (63) | (121) |
| Other permanent differences | 22,533 | - | 21,633 | - |
| Charges on payables to venture partners | - | - | - | - |
| Recognized (unrecognized) tax credits | (57,095) | (18,838) | (58,247) | (20,587) |
| - | - | (3,619) | (1,221) | |
| Tax expenses - current | - | - | (3,619) | (1,221) |
| Tax income (expenses) - deferred | - | - | - | - |
(A free translation of the original report in Portuguese as published in Brazil)
Gafisa S.A.
Notes to the quarterly financial information
September 30, 2020
(Amounts in thousands of Brazilian Reais, except as otherwise stated)
19. Income tax and social contribution--Continued
| (ii) | Deferred income tax and social contribution |
As of September 30, 2020 and December 31, 2019, deferred income tax and social contribution are from the following sources:
| Company | Consolidated | |||
| 09/30/2020 | 12/31/2019 | 09/30/2020 | 12/31/2019 | |
| Assets | ||||
| Provisions for legal claims | 91,072 | 89,584 | 91,998 | 89,968 |
| Temporary differences - deferred PIS and COFINS | 15,396 | 14,997 | 15,396 | 14,997 |
| Provisions for realization of non-financial assets | 266,570 | 260,327 | 266,570 | 260,327 |
| Temporary differences - CPC adjustment | 6,654 | 12,114 | 6,654 | 12,114 |
| Other provisions | 13,575 | 6,489 | 13,575 | 6,479 |
| Income tax and social contribution loss carryforwards | 456,147 | 411,064 | 477,605 | 431,311 |
| 849,414 | 794,575 | 871,798 | 815,196 | |
| Unrecognized tax credits of continued operations | (781,081) | (723,986) | (803,465) | (745,218) |
| (781,081) | (723,986) | (803,465) | (745,218) | |
| Liabilities | ||||
| Discounts | (2,069) | (2,069) | (2,069) | (2,069) |
| Temporary differences - CPC adjustment | (7,877) | (42,273) | (7,877) | (41,671) |
| Income taxed between cash and accrual basis | (70,501) | (38,361) | (70,501) | (38,352) |
| (80,447) | (82,703) | (80,447) | (82,092) | |
| Total, net | (12,114) | (12,114) | (12,114) | (12,114) |
The balances of income tax and social contribution loss carryforwards for offset are as follows:
Company | |||||||
| 09/30/2020 | 12/31/2019 | ||||||
| Income tax | Social contribution |
Total | Income tax | Social contribution |
Total | ||
| Balance of income tax and social contribution loss carryforwards | 1,341,609 | 1,341,609 | - | 1,209,011 | 1,209,011 | - | |
| Deferred tax assets (25%/9%) | 335,402 | 120,745 | 456,147 | 302,253 | 108,811 | 411,064 | |
| Recognized deferred tax assets | 2,194 | 790 | 2,984 | 9,781 | 3,521 | 13,302 | |
| Unrecognized deferred tax assets | 333,208 | 119,955 | 453,163 | 292,472 | 105,290 | 397,762 | |
Consolidated | |||||||
| 09/30/2020 | 12/31/2019 | ||||||
| Income tax | Social contribution |
Total | Income tax | Social contribution |
Total | ||
| Balance of income tax and social contribution loss carryforwards | 1,404,723 | 1,404,723 | - | 1,268,563 | 1,268,563 | - | |
| Deferred tax assets (25%/9%) | 351,181 | 126,425 | 477,606 | 317,141 | 114,170 | 431,311 | |
| Recognized deferred tax assets | 2,194 | 790 | 2,984 | 9,781 | 3,521 | 13,302 | |
| Unrecognized deferred tax assets | 348,987 | 125,635 | 474,622 | 307,360 | 110,649 | 418,009 | |
The other explanations related to this note were not subject to material changes in relation to the disclosures in Note 19 to the financial statements as of December 31, 2019.
(A free translation of the original report in Portuguese as published in Brazil)
Gafisa S.A.
Notes to the quarterly financial information
September 30, 2020
(Amounts in thousands of Brazilian Reais, except as otherwise stated)
| 20. | Financial instruments |
The Company and its subsidiaries engage in operations involving financial instruments. These instruments are managed through operational strategies and internal controls aimed at providing liquidity, return and safety. The use of financial instruments for hedging purposes is achieved through a periodical analysis of exposure to the risk that the Management intends to cover (exchange, interest rate, etc.) which is submitted to the corresponding Management bodies for approval and performance of the proposed strategy. The control policy consists of ongoing monitoring of the contracted conditions in relation to the prevailing market conditions. The Company and its subsidiaries do not use derivatives or any other risky assets for speculative purposes. The result from these operations is consistent with the policies and strategies devised by the Company’s Management. The Company and its subsidiaries operations are subject to the risk factors described below:
| (i) | Risk considerations |
| a) | Credit risk |
There was no significant change in relation to the credit risks disclosed in Note 20(i)(a) to the financial statements as of December 31, 2019.
| b) | Derivative financial instruments |
In the period ended September 30, 2020, the Company entered into financial derivative instruments to mitigate the risk arising from its exposure to index and interest volatility recognized at fair value in profit or loss for the year.
As of December 30, 2020, the Company had derivative contracts to hedge the interest rate fluctuation, maturing in February 2021. The derivate contracts are as follows:
| Reais | Percentage | Maturity | Unrealized gains/(losses) on derivative instruments, net | ||||
| Interest rate swap contracts | Face value | Swap – Liability position | Beginning | End | 09/30/2020 | 12/31/2019 | |
| Swap 1 | 79,003 | 120% CDI | 08/05/2020 | 02/04/2021 | 1,495 | - | |
| Swap 2 | 100,000 | Fixed 7% | 09/10/2020 | 02/16/2021 | (878) | - | |
| Total derivative financial instruments | 617 | - | |||||
| c) | Interest rate risk |
There was no significant change in relation to the interest rate risks disclosed in Note 20(i)(c) to the financial statements as of December 31, 2019.
| d) | Liquidity risk |
There was no significant change in relation to the liquidity risks disclosed in Note 20(i)(d) to the financial statements as of December 31, 2019.
(A free translation of the original report in Portuguese as published in Brazil)
Gafisa S.A.
Notes to the quarterly financial information
September 30, 2020
(Amounts in thousands of Brazilian Reais, except as otherwise stated)
| 20. | Financial instruments--Continued |
| (i) | Risk considerations--Continued |
| d) | Liquidity risk--Continued |
The maturities of financial instruments of loans, financing, suppliers, debentures, forward transactions, obligations assumed on assignment of receivables, suppliers, payables for purchase of properties and advance from customers are as follows:
| Year ended September 30, 2020 | Company | ||||
| Liabilities | Less than 1 year | 1 to 3 years | 4 to 5 years | Over 5 years | Total |
| Loans and financing (Note 12) | 300,534 | 120,118 | - | - | 420,652 |
| Debentures (Note 13) | 127,147 | 25,580 | - | - | 152,727 |
| Obligations assumed on assignment of receivables (Note 14) | 11,843 | 6,204 | 2,258 | 2,150 | 22,455 |
| Suppliers (Note 15 and Note 20.ii.a) | 65,995 | 1,311 | - | - | 67,306 |
| Payables for purchase of properties and advances from customers (Note 17) | 66,660 | 38,478 | 2,214 | - | 107,352 |
| 572,179 | 191,691 | 4,472 | 2,150 | 770,492 | |
| Assets | |||||
| Cash and cash equivalents and short-term investments (Notes 4.1 and 4.2) | 619,068 | - | - | - | 619,068 |
| Trade accounts receivable (Note 5) | 340,903 | 68,591 | 4,551 | - | 414,045 |
| 959,971 | 68,591 | 4,551 | - | 1,033,113 | |
| Year ended September 30, 2020 | Consolidated | ||||
| Liabilities | Less than 1 year | 1 to 3 years | 4 to 5 years | Over 5 years | Total |
| Loans and financing (Note 12) | 349,348 | 153,340 | - | - | 502,688 |
| Debentures (Note 13) | 127,147 | 115,663 | - | - | 242,810 |
| Obligations assumed on assignment of receivables (Note 14) | 15,534 | 8,480 | 4,961 | 919 | 29,894 |
| Suppliers (Note 15 and Note 20.ii.a) | 131,054 | 1,781 | - | - | 132,835 |
| Payables for purchase of properties and advances from customers (Note 17) | 259,336 | 76,099 | 11,843 | - | 347,278 |
| 882,419 | 355,363 | 16,804 | 919 | 1,255,505 | |
| Assets | |||||
| Cash and cash equivalents and short-term investments (Notes 4.1 and 4.2) | 630,060 | - | - | - | 630,660 |
| Trade accounts receivable (Note 5) | 544,147 | 80,031 | 6,812 | 35,035 | 630,990 |
| 1,174,807 | 80,031 | 6,812 | 35,035 | 1,261,650 | |
The Company uses the following classification to determine and disclose the fair value of financial instruments by valuation technique:
Level 1: quoted prices (without adjustments) in active markets for identical assets or liabilities;
Level 2: inputs other than the quoted market prices within Level 1 that are observable for asset or liability, either directly (as prices) or indirectly (derived from prices); and
Level 3: inputs for asset or liability not based on observable market data (unobservable inputs).
The classification level of fair value for financial instruments measured at fair value through profit or loss of the Company as of September 30, 2020 and December 31, 2019 is as follows:
| Company | Consolidated | |||||
| Fair value classification | ||||||
| As of September 30, 2020 | Level 1 | Level 2 | Level 3 | Level 1 | Level 2 | Level 3 |
| Financial assets | ||||||
| Short-term investments (Note 4.2) | - | 619,025 | - | - | 623,955 | - |
| Company | Consolidated | |||||
| Fair value classification | ||||||
| As of December 31, 2019 | Level 1 | Level 2 | Level 3 | Level 1 | Level 2 | Level 3 |
| Financial assets | ||||||
| Short-term investments (Note 4.2) | - | 401,243 | - | - | 401,895 | - |
(A free translation of the original report in Portuguese as published in Brazil)
Gafisa S.A.
Notes to the quarterly financial information
September 30, 2020
(Amounts in thousands of Brazilian Reais, except as otherwise stated)
| 20. | Financial instruments--Continued |
| (i) | Risk considerations--Continued |
| d) | Liquidity risk--Continued |
Fair value classification
In the period ended September 30, 2020 and year ended December 31, 2019, there was no transfer between the Levels 1 and 2 fair value classifications, nor were transfers between Levels 3 and 2 fair value classifications.
| (ii) | Fair value of financial instruments |
| a) | Fair value measurement |
The Company uses the same methods and assumptions disclosed in Note 20(ii)(a) to the financial statements as of December 31, 2019 to measure fair value of each financial instrument classification for which the estimate of value is practicable.
The most significant carrying amounts and fair values of financial assets and liabilities as of September 30, 2020 and December 31, 2019, classified into Level 2 of the fair value classification, are as follows:
| Company | |||||
| 09/30/2020 | 12/31/2019 | ||||
| Carrying amount | Fair value | Carrying amount | Fair value | Classification | |
| Financial assets | |||||
| Cash and cash equivalents (Note 4.1) | 43 | 43 | 810 | 810 | (*) |
| Short-term investments (Note 4.2) | 619,025 | 619,025 | 401,243 | 401,243 | (*) |
| Trade accounts receivable (Note 5) | 414,045 | 414,045 | 460,017 | 460,017 | (**) |
| Loans receivable (Note 21.1) | 112,665 | 112,665 | 33,416 | 33,416 | (**) |
| Financial liabilities | |||||
| Loans and financing (Note 12) | 420,652 | 396,770 | 490,676 | 502,909 | (**) |
| Debentures (Note 13) | 152,727 | 186,482 | 197,525 | 278,727 | (**) |
| Suppliers | 67,306 | 67,306 | 80,285 | 80,285 | (**) |
| Obligations assumed on assignment of receivables (Note 14) | 22,455 | 22,455 | 31,218 | 31,218 | (**) |
| Payables for purchase of properties and advances from customers (Note 17) | 107,352 | 107,352 | 158,340 | 158,340 | (**) |
| Loan payable (Note 21.1) | 7,922 | 7,922 | 9,280 | 9,280 | (**) |
| Consolidated | |||||
| 09/30/2020 | 12/31/2019 | ||||
| Carrying amount | Fair value | Carrying amount | Fair value | Classification | |
| Financial assets | |||||
| Cash and cash equivalents (Note 4.1) | 6,705 | 6,705 | 12,435 | 12,435 | (*) |
| Short-term investments (Note 4.2) | 623,955 | 623,955 | 401,895 | 401,895 | (*) |
| Trade accounts receivable (Note 5) | 630,990 | 630,990 | 557,438 | 557,438 | (**) |
| Loans receivable (Note 21.1) | 41,070 | 41,070 | 33,416 | 33,416 | (**) |
| Financial liabilities | |||||
| Loans and financing (Note 12) | 502,688 | 403,210 | 533,153 | 542,909 | (**) |
| Debentures (Note 13) | 242,810 | 186,482 | 197,525 | 278,727 | (**) |
| Suppliers | 132,835 | 132,835 | 96,832 | 96,832 | (**) |
| Obligations assumed on assignment of receivables (Note 14) | 29,894 | 29,894 | 40,361 | 40,361 | (**) |
| Payables for purchase of properties and advances from customers (Note 17) | 347,355 | 347,355 | 222,428 | 222,428 | (**) |
| Loan payable (Note 21.1) | 7,922 | 7,922 | 9,280 | 9,280 | (**) |
(*) Fair value through profit or loss
(**) Amortized cost
There was no material change in relation to the information disclosed Note 20(ii)(a) to the financial statements as of December 31, 2019.
(A free translation of the original report in Portuguese as published in Brazil)
Gafisa S.A.
Notes to the quarterly financial information
September 30, 2020
(Amounts in thousands of Brazilian Reais, except as otherwise stated)
| 20. | Financial instruments–Continued |
| (ii) | Fair value of financial instruments--Continued |
| b) | Risk of debt acceleration |
As of September 30, 2020, the Company has loans and financing contracts with restrictive covenants related to cash generation, indebtedness ratios, capitalization, debt coverage, maintenance of shareholding position, and others. The breach of such obligations by the Company may give rise to the acceleration of its debts and/or acceleration of other debts of the Company, including due to the performance of any cross default or cross acceleration clauses, which may negatively impact the profit or loss of the Company and the value of its shares.
These restrictive covenants have been complied with by the Company and do not limit its ability to conduct its business as usual.
| (iii) | Capital stock management |
The explanations related to this note were not subject to material changes in relation to the disclosures in Note 20(iii) to the financial statements as of December 31, 2019.
The Company included in its net debt structure: loans and financing, debentures, less cash and cash equivalents and short-term investments:
| Company | Consolidated | |||
| 09/30/2020 | 12/31/2019 | 09/30/2020 | 12/31/2019 | |
| Loans and financing (Note 12) | 420,652 | 490,676 | 502,688 | 533,153 |
| Debentures (Note 13) | 152,727 | 197,525 | 242,810 | 197,525 |
| ( - ) Cash and cash equivalents and short-term investments (Notes 4.1 and 4.2) | (619,068) | (402,053) | (630,660) | (414,330) |
| Net debt | (45,689) | 286,148 | 114,838 | 316,348 |
| Equity | 1,509,624 | 893,708 | 1,513,890 | 895,143 |
(A free translation of the original report in Portuguese as published in Brazil)
Gafisa S.A.
Notes to the quarterly financial information
September 30, 2020
(Amounts in thousands of Brazilian Reais, except as otherwise stated)
| 20. | Financial instruments--Continued |
| (iv) | Sensitivity analysis |
The sensitivity analysis of financial instruments for the period ended September 30, 2020 describes the risks that may give rise to material changes in the Company’s profit or loss, as provided for by CVM, through Rule 475/08, in order to show a 10%, 25% and 50% increase/decrease in the risk variable considered.
As of September 30, 2020, the Company has the following financial instruments:
| a) | Financial investments, loans and financing and debentures linked to the Interbank Deposit Certificate (CDI); |
| b) | Loans and financing linked to the Referential Rate (TR) and CDI, and debentures linked to the CDI and Broad Consumer Price Index (IPCA); |
| c) | Accounts receivable and payables for purchase of properties, linked to the National Civil Construction Index (INCC) and General Market Price Index (IGP-M). |
For the sensitivity analysis in the period ended September 30, 2020, the Company considered the interest rates of investments, loans and accounts receivable, the CDI rate at 3.54%, TR at 0%, INCC at 5.32%, IPCA at 3.14% and IGP-M at 14.40%. The scenarios considered were as follows:
Scenario I - Probable: 10% increase/decrease in the risk variables used for pricing
Scenario II - Possible: 25% increase/decrease in the risk variables used for pricing
Scenario III - Possible: 50% increase/decrease in the risk variables used for pricing
The Company shows in the following chart the sensitivity to risks to which the Company is exposed, taking into account that the possible effects would impact the future results, based on the exposures shown as of December 31, 2019. The effects on equity are basically the same of the profit or loss ones.
| Scenario | |||||||
| I | II | III | III | II | I | ||
| Transaction | Risk | Increase 10% | Increase 25% | Increase 50% | Decrease 50% | Decrease 25% | Decrease 10% |
| Financial investments | Increase/decrease of CDI | 2,036 | 5,089 | 10,178 | (10,178) | (5,089) | (2,036) |
| Loans and financing | Increase/decrease of CDI | (442) | (1,105) | (2,209) | 2,209 | 1,105 | 442 |
| Debentures | Increase/decrease of CDI | (193) | (483) | (966) | 966 | 483 | 193 |
| Net effect of CDI change | 1,401 | 3,501 | 7,003 | (7,003) | (3,501) | (1,401) | |
| Loans and financing | Increase/decrease of TR | - | - | - | - | - | - |
| Net effect of TR change | - | - | - | - | - | - | |
| Debentures | Increase/decrease of IPCA | (105) | (262) | (525) | 525 | 262 | 105 |
| Net effect of IPCA change | (105) | (262) | (525) | 525 | 262 | 105 | |
| Accounts receivable | Increase/decrease of INCC | 2,138 | 5,344 | 10,688 | (10,688) | (5,344) | (2,138) |
| Payables for purchase of properties | Increase/decrease of INCC | (1,754) | (4,385) | (8,771) | 8,771 | 4,385 | 1,754 |
| Net effect of INCC change | 384 | 959 | 1,917 | (1,917) | (959) | (384) | |
| Accounts receivable | Increase/decrease of IGP-M | 2,616 | 6,539 | 13,078 | (13,078) | (6,539) | (2,616) |
| Net effect of IGP-M change | 2,616 | 6,539 | 13,078 | (13,078) | (6,539) | (2,616) | |
(A free translation of the original report in Portuguese as published in Brazil)
Gafisa S.A.
Notes to the quarterly financial information
September 30, 2020
(Amounts in thousands of Brazilian Reais, except as otherwise stated)
| 21. | Related parties |
| 21.1. | Balances with related parties |
The transactions between the Company and related companies are made under conditions and prices established between the parties.
| Company | Consolidated | |||
| Current account | 09/30/2020 | 12/31/2019 | 09/30/2020 | 12/31/2019 |
| Assets | ||||
| Current account: | ||||
| Total SPEs | 353 | 354 | 47,376 | 64,441 |
| Subsidiaries | - | - | 41,979 | 57,027 |
| Jointly-controlled investees | 320 | 321 | 5,364 | 7,381 |
| Associates | 33 | 33 | 33 | 33 |
| Condominium, consortia and third-party works | 13,600 | 13,162 | 13,601 | 13,165 |
| Loan receivable (Note 20.ii.a) | 112,665 | 33,416 | 41,070 | 33,416 |
| Dividends receivable | 7,853 | 9,872 | - | - |
| 134,471 | 56,804 | 102,047 | 111,022 | |
| Current | 93,400 | 23,388 | 2,310 | 77,606 |
| Non-current | 41,071 | 33,416 | 99,737 | 33,416 |
| Liabilities | ||||
| Current account: | ||||
| Total SPEs | (178,379) | (182,084) | (84,306) | (55,104) |
| Subsidiaries | (130,980) | (156,192) | (36,908) | (29,211) |
| Jointly-controlled investees | (44,515) | (23,228) | (44,514) | (23,229) |
| Associates | (2,884) | (2,664) | (2,884) | (2,664) |
| Loan payable (Note 20.ii.a) | (7,922) | (9,280) | (7,922) | (9,280) |
| (186,301) | (191,364) | (92,228) | (64,384) | |
| Current | (186,301) | (191,364) | (92,228) | (64,384) |
| Non-current | - | - | - | - |
The composition, nature and conditions of the balances of loans receivable and payable of the Company are as follows. Loans have maturity from July 2020 and are tied to the cash flows of the related ventures.
| Company | Consolidated | |||||
| 09/30/2020 | 12/31/2019 | 09/30/2020 | 12/31/2019 | Nature | Interest rate | |
| UPCON | 71,595 | - | - | - | Working capital | n/a |
| Lagunas - Tembok Planej. e Desenv. Imob. Ltda. | 7,662 | 6,272 | 7,662 | 6,272 | Construction | 12% p.a. + IGPM |
| Manhattan Residencial I - OAS Empreendimentos | 399 | 392 | 399 | 392 | Construction | 10% p.a. + TR |
| Target Offices & Mall- SPE Yogo Part. Emp. Im. e Comasa Const. | 33,009 | 26,752 | 33,009 | 26,752 | Construction | 12% p.a. + IGPM |
| Total receivable | 112,665 | 33,416 | 41,070 | 33,416 | ||
| Dubai Residencial - Franere, Com. Const. e Imob. Ltda. | 1,189 | 1,025 | 1,189 | 1,025 | Construction | 6% p.a. |
| Parque Árvores - Franere, Com. Const. e Imob. Ltda. | 3,647 | 5,372 | 3,647 | 5,372 | Construction | 6% p.a. |
| Parque Águas - Franere, Com. Const. e Imob. Ltda. | 3,086 | 2,883 | 3,086 | 2,883 | Construction | 6% p.a. |
| Total payable | 7,922 | 9,280 | 7,922 | 9,280 | ||
In the period ended September 30, 2020 the recognized finance income from interest on loans amounted to R$7,246 (R$2,731 in 2018) in the Company’s and Consolidated statement (Note 24).
The information regarding Management transactions and compensation is described in Note 25.
The other explanations related to this note were not subject to material changes in relation to the disclosures in Note 21 to the financial statements as of December 31, 2019.
(A free translation of the original report in Portuguese as published in Brazil)
Gafisa S.A.
Notes to the quarterly financial information
September 30, 2020
(Amounts in thousands of Brazilian Reais, except as otherwise stated)
| 21. | Related parties--Continued |
| 21.2. | Endorsements, guarantees and sureties |
The financial transactions of the subsidiaries are guaranteed by the endorsement or surety in proportion to the interest of the Company in the capital stock of such companies, in the amount of R$254,431 as of September 30, 2020 (R$132,336 in 2019).
| 22. | Net operating revenue |
| Company | Consolidated | |||
| 09/30/2020 | 09/30/2019 | 09/30/2020 | 09/30/2019 | |
| Gross operating revenue | ||||
| Real estate development, sale, barter transactions and construction services | 250,834 | 240,277 | 361,788 | 290,417 |
| (Recognition) Reversal of allowance for expected losses and cancelled contracts (Note 5) | (15,347) | 17,116 | (34,151) | 17,116 |
| Taxes on sale of real estate and services | (20,068) | (21,728) | (23,502) | (23,241) |
| Net operating revenue | 215,419 | 235,665 | 304,135 | 284,292 |
| 23. | Costs and expenses by nature |
These are represented by the following:
| Company | Consolidated | ||||
| 09/30/2020 | 09/30/2019 | 09/30/2020 | 09/30/2019 | ||
| Cost of real estate development and sales: | |||||
| Construction cost | (72,062) | (106,354) | (132,560) | (128,487) | |
| Land cost | (53,565) | (28,582) | (61,170) | (36,946) | |
| Development cost | (7,169) | (4,260) | (9,197) | (5,627) | |
| Capitalized financial charges (Note 12) | (16,710) | (21,757) | (25,307) | (30,356) | |
| Maintenance/warranty | (8,313) | (1,661) | (8,313) | (1,354) | |
| Total cost of real estate development and sales | (157,819) | (162,614) | (236,547) | (202,770) | |
| Selling expenses: | |||||
| Product marketing | (2,615) | (3,134) | (4,337) | (3,794) | |
| Brokerage and sale commission | (1,734) | (2,420) | (2,821) | (3,293) | |
| Customer Relationship Management (CRM) and corporate marketing | (1,809) | (3,921) | (2,871) | (4,499) | |
| Other | - | (110) | (720) | (97) | |
| Total selling expenses | (6,158) | (9,585) | (10,749) | (11,683) | |
| General and administrative expenses: | |||||
| Salaries and payroll charges | (16,515) | (10,060) | (16,515) | (12,150) | |
| Employee benefits | (2,852) | (1,166) | (2,852) | (1,409) | |
| Travel and utilities | (395) | (114) | (395) | (138) | |
| Services | (20,586) | (8,393) | (20,586) | (10,138) | |
| Rents and condominium fees | (2,181) | (2,676) | (2,181) | (3,231) | |
| IT | (2,836) | (5,139) | (2,836) | (6,207) | |
| Stock option plan (Note 18.2) | 362 | 2,698 | 362 | 2,698 | |
| Reserve for profit sharing (Note 25.iii) | (6,194) | (500) | (6,194) | (500) | |
| Other | 61 | (786) | 61 | (843) | |
| Total general and administrative expenses | (51,136) | (26,136) | (51,136) | (31,918) | |
| Other income (expenses), net | |||||
| Expenses with lawsuits (Note 16) | (51,127) | (45,378) | (52,708) | (45,769) | |
| Other | (5,108) | 126 | (6,509) | 70 | |
| Total other income (expenses), net | (56,235) | (45,252) | (59,217) | (45,699) | |
(A free translation of the original report in Portuguese as published in Brazil)
Gafisa S.A.
Notes to the quarterly financial information
September 30, 2020
(Amounts in thousands of Brazilian Reais, except as otherwise stated)
| 24. | Finance income (cost) |
| Company | Consolidated | |||
| 09/30/2020 | 09/30/2019 | 09/30/2020 | 09/30/2019 | |
| Finance income | ||||
| Income from financial investments | 13,864 | 7,613 | 14,006 | 7,649 |
| Finance income on loan (Note 21.1) | 7,246 | 2,976 | 7,246 | 2,976 |
| Other finance income | 512 | 873 | 1,326 | 1,338 |
| Subtotal finance income | 21,622 | 11,462 | 22,578 | 11,963 |
| Finance cost | ||||
| Interest on funding, net of capitalization (Note 12) | (46,415) | (48,428) | (43,001) | (42,976) |
| Amortization of debenture cost | (1,991) | (2,116) | (1,991) | (2,116) |
| Banking expenses | (6,691) | (5,871) | (7,321) | (7,212) |
| Offered discount and other finance expenses | (7,063) | (2,232) | (9,064) | (1,635) |
| Subtotal finance cost | (62,160) | (58,647) | (61,377) | (53,939) |
| Total finance income (cost), net | (40,538) | (47,185) | (38,799) | (41,976) |
| 25. | Transactions with management and employees |
| (i) | Management compensation |
In the periods ended September 30, 2020 and 2019, the amounts recorded in the line item “General and administrative expenses” related to the compensation of the Company’s Management are as follows:
| Management compensation | ||||
| Year ended September 30, 2020 | Board of Directors | Executive Management | Fiscal Council | |
| Number of members | 10 | 8 | - | |
| Annual fixed compensation (in R$) | ||||
| Salary/fees | 589 | 3,036 | - | |
| Direct and indirect benefits | - | 210 | - | |
| Other (INSS) | 98 | 563 | - | |
| Average monthly compensation (in R$) | - | , | - | |
| Total compensation | 687 | 3,809 | - | |
| Profit sharing (Note 25.iii) | - | 1,804 | - | |
| Total management compensation | 687 | 5,613 | - | |
| ||||
| Management compensation | ||||
| Year ended September 30, 2019 | Board of Directors | Executive Management | Fiscal Council | |
| Number of members | 7 | 3 | 3 | |
| Annual fixed compensation (in R$) | ||||
| Salary/fees | 745 | 1,398 | 94 | |
| Direct and indirect benefits | - | 4 | - | |
| Other (INSS) | 173 | 280 | 4 | |
| Monthly compensation (in R$) | 102 | 187 | 24 | |
| Total compensation | 918 | 1,681 | 98 | |
| Profit sharing (Note 25.iii) | - | - | - | |
| Total compensation and profit sharing | 918 | 1,681 | 98 | |
There is no amount related to expenses with option grant to current management members of the Company for the periods ended September 30, 2020 and 2019.
The maximum aggregate compensation of the Company’s management members for the year 2020 was established at R$16,527 (R$7,782 in 2019), as fixed and variable compensation, as approved at the Annual Shareholders’ Meeting held on April 30, 2020.
(A free translation of the original report in Portuguese as published in Brazil)
Gafisa S.A.
Notes to the quarterly financial information
September 30, 2020
(Amounts in thousands of Brazilian Reais, except as otherwise stated)
25. Transactions with management and employees--Continued
(ii) Sales transactions
In the periods ended September 30, 2020 and year ended December 31, 2019 no transaction of sale of units to current Management was carried out.
(iii) Profit sharing
In the period ended September 30, 2020, the Company recorded a reserve for profit sharing expenses amounting to R$6,194 (R$500 in 2019) in the Company’s and Consolidated statement in the account “General and Administrative Expenses " (Note 23).
| Company and Consolidated | ||
| 09/30/2020 | 09/30/2019 | |
| Executive officers (Note 25.i) | 1,804 | - |
| Other employees | 4,390 | 500 |
| Total profit sharing | 6,194 | 500 |
The other explanations related to this note were not subject to material changes in relation to the disclosures in Note 25 to the financial statements as of December 31, 2019.
| 26. | Insurance |
The liabilities covered by insurance and the respective amounts as of September 30, 2020 are as follows:
| Insurance type | Coverage |
| Engineering risks and completion bond | 423,334 |
| Civil liability (Directors and Officers – D&O) | 205,600 |
| 628,934 |
The other explanations related to this note were not subject to material changes in relation to the disclosures in Note 25 to the financial statements as of December 31, 2019.
(A free translation of the original report in Portuguese as published in Brazil)
Gafisa S.A.
Notes to the quarterly financial information
September 30, 2020
(Amounts in thousands of Brazilian Reais, except as otherwise stated)
| 27. | Earnings and loss per share |
The following table shows the calculation of basic and diluted earnings and losses per share. In view of the losses for the periods ended September 30, 2020 and 2019, shares with dilutive potential are not considered, because the impact would be antidilutive.
| 09/30/2020 | 09/30/2019 | |
| Basic numerator | ||
| Undistributed loss from continued operations | (105,500) | (60,746) |
| Undistributed loss, available for the holders of common shares | (105,500) | (60,746) |
| Basic denominator (in thousands of shares) | ||
| Weighted average number of shares (Note 18.1) | 144,814 | 52,299 |
| Basic loss per share in reais | (0.729) | (1.162) |
| From continued operations | (0.729) | (1.162) |
| Diluted numerator | ||
| Undistributed loss from continued operations | (105,500) | (60,746) |
| Undistributed loss, available for the holders of common shares | (105,500) | (60,746) |
| Diluted denominator (in thousands of shares) | ||
| Weighted average number of shares (Note 18.1) | 144,814 | 52,299 |
| Stock options | 865 | 447 |
| Anti-dilution effect | (865) | (447) |
| Diluted weighted average number of shares | 144,814 | 52,299 |
| Diluted loss per share in reais | (0.729) | (1.162) |
| From continued operations | (0.729) | (1.162) |
| 28. | Segment information |
The reports used for making decisions are the consolidated financial statements, and not the analysis by operating segments.
Therefore, in line with CPC 22 – Operating Segments, the Company understands that there is no reportable segment to be disclosed in the periods ended September 30, 2020 and 2019.
(A free translation of the original report in Portuguese as published in Brazil)
Gafisa S.A.
Notes to the quarterly financial information
September 30, 2020
(Amounts in thousands of Brazilian Reais, except as otherwise stated)
| 29. | Real estate ventures under construction – information and commitments |
In compliance with Circular Letter CVM/SNC/SEP 02/2018, related to the recognition of revenue from contracts for purchase and sale of real state units not yet completed in Brazilian real estate development companies, the Company reports information on the ventures under construction as of September 30, 2020:
| Consolidated | ||
| 09/30/2020 | ||
| Unrecognized sales revenue of units sold | 312,569 | |
| Unrecognized estimated cost of units sold | (179,316) | |
| Unrecognized estimated cost of units in inventory | (124,476) | |
| (i) Unrecognized sales revenue of units sold | ||
| Ventures under construction: | ||
| (a) Contracted sales revenue | 1,065,020 | |
| Recognized sales revenue: | ||
| Recognized sales revenue | 773,400 | |
| Cancelled contracts - reversed revenue | (20,949) | |
| (b) Recognized sales revenue, net | 752,451 | |
| Unrecognized sales revenue (a-b) (a) | 312,569 | |
| (ii) Income from damages for cancelled contracts | 1,727 | |
| (iii) Unrecognized sales revenue of contracts not eligible to revenue recognition | 44,186 |
| (iv) Allowance for cancelled contracts (liabilities) | ||
| Adjustments in recognized revenue | 116,142 | |
| Adjustments in trade accounts receivable | 71,968 | |
| Income from damages for cancelled contracts | (17,670) | |
| Liabilities – refund due to cancelled contracts | 26,504 | |
| (v) Unrecognized estimated costs of units sold | ||
| Ventures under construction: | ||
| (a) Estimated cost of units | (663,695) | |
| Incurred cost of units: | ||
| Construction cost | (499,436) | |
| Cancelled contracts – construction costs | 15,057 | |
| (b) Incurred cost, net | (484,379) | |
| Cost to be incurred of units sold (a-b) (b) | (179,316) |
| (iii) Unrecognized estimated costs of units in inventory | |||
| Ventures under construction: | |||
| Estimated cost of units | (510,965) | ||
| Incurred cost of units (Note 6) | 386,489 | ||
| Unrecognized estimated cost | (124,476) | ||
| (a) | The unrecognized sales revenue of units sold are measured by the face value of contracts, plus the contract adjustments and deducted for cancellations, not considering the effects of the levied taxes and adjustment to present value, and do not include ventures that are subject to restriction due to a suspensive clause (legal period of 180 days in which the Company can cancel a development), and therefore is not recognized in profit or loss. |
| (b) | The estimated cost of units sold and in inventory to be incurred do not include financial charges, which are recognized in properties for sale and profit or loss (cost of real estate sold) in proportion to the real estate units sold as they are incurred. |
As of September 30, 2020, the percentage of assets consolidated in the financial statements related to ventures included in the equity segregation structure of the development stood at 34.2% (29.0% in 2019).
(A free translation of the original report in Portuguese as published in Brazil)
Gafisa S.A.
Notes to the quarterly financial information
September 30, 2020
(Amounts in thousands of Brazilian Reais, except as otherwise stated)
| 30. | Additional Information on the Statement of Cash Flows |
| (i) | Transactions that did not affect Cash and Cash Equivalents |
The Company and its subsidiaries performed the following investing and financing activities that did not affect cash and cash equivalents, which were not included in the statements of cash flows:
Company | Consolidated | |||
| 09/30/2020 | 09/30/2019 | 09/30/2020 | 09/30/2019 | |
| Capital contribution (reduction) | 1,150 | - | (53) | - |
| Capitalized financial charges (Note 12) | (13,483) | (17,756) | (21,685) | (25,229) |
| Barter transaction – Land (Note 17) | (28,895) | (14,021) | (34,559) | (17,181) |
| (41,228) | (31,777) | (56,297) | (42,410) | |
| (ii) | Reconciliation of the asset and liability changes with the cash flows from financing activities: |
| Transactions affecting cash | Transactions not affecting cash | ||||||
| Company | Opening balance 12/31/2019 | Funding/ Receipt | Payment Interest | Principal payment | Interest and inflation adjustment | Other | Closing balance 09/30/2020 |
| Loans, financing and debenture (Notes 12 and 13) | (688,201) | (23,651) | (33,174) | 173,015 | (1,368) | - | (573,379) |
| Loans (Note 21.1) | 24,136 | - | - | 65,854 | 14,753 | - | 104,743 |
| Paid-in capital (Note 18.1) | (2,926,280) | (477,899) | - | - | - | 2,361,931 | (1,041,248) |
| Capital reserve (Note 18.1) | (250,599) | - | - | - | - | - | (250,599) |
| (3,840,944) | (501,550) | (33,174) | 238,869 | 13,385 | 2,362,931 | (1,760,483) | |
| Transactions affecting cash | Transactions not affecting cash | ||||||
| Consolidated | Opening balance 12/31/2019 | Funding/ Receipt | Payment Interest | Principal payment | Interest and inflation adjustment | Other | Closing balance 09/30/2020 |
| Loans, financing and debenture (Notes 12 and 13) | (730,678) | (253,642) | (31,865) | 334,251 | (2,129) | - | (684,063) |
| Loans (Note 21.1) | 24,136 | - | - | (5,741) | 14,753 | - | 33,148 |
| Paid-in capital (Note 18.1) | (2,926,280) | (477,899) | - | - | - | 2,361,931 | (1,041,248) |
| Capital reserve (Note 18.1) | (250,599) | - | - | - | - | - | (250,599) |
| (3,883,421) | (731,541) | (31,865) | 328,510 | 12,624 | 2,362,931 | (1,942,762) | |
(A free translation of the original report in Portuguese as published in Brazil)
Gafisa S.A.
Notes to the quarterly financial information
September 30, 2020
(Amounts in thousands of Brazilian Reais, except as otherwise stated)
| 31. | Events after the reporting period |
| (i) | Convertible debenture issue |
On October 21, 2020, the Company disclosed a Material Fact informing that the Board of Directors approved the following items:
(i) the launch of the public offering with restricted efforts for the placement of the sixteenth debenture issue of the Company, convertible into common shares, in two series, with secured guarantee, in the total amount of R$117,570, with unit value of R$10, and the signature of the respective trust indenture;
(ii) increase in the capital of the Company upon debenture conversion, provided that the increase limit of 600 million common shares is observed.
On November 16, 2020, in view of the conversion of the Company’s Series I debentures of the sixteenth issue, the Board of Directors approved the following:
(i) ratification of the issue of 9,944,150 common shares of the Company; and
(ii) the consequent approval of the increase in the Company’s capital: increase in the number of shares from 290,731,951 registered book-entry common shares to 300,676,101 registered book-entry common shares, and the increase in the Company’s capital from R$ 1,041,248 to R$ 1,083,248.
(ii) Approval of the transaction with Calçada S.A. by the Administrative Council for Economic Defense (CADE)
On November 3, 2020, the Company informed about CADE’s approval of the transaction made with Calçada for acquisition of the totality of its share in four real estate ventures located in the Southern and Western zones in the city of Rio de Janeiro.
| (iii) | Acquisition of assets in São Paulo |
On November 10, 2020, the Company informed that it entered into a contract for acquisition of real estate assets located in the Western zone in the city of São Paulo. This acquisition depends on the fulfillment of conditions precedent, including due diligence, and is expected to be completed in December 2020.
| (iv) | Intention of making a business combination with Tecnisa |
On August 19, 2020, the Company disclosed a Material Fact informing that it sent to Tecnisa’s Board of Directors a proposal for the potential integration of Tecnisa’s business with Gafisa, with transformational characteristics for both Tecnisa and Gafisa.
The management of both companies shall negotiate the establishment of the applicable procedures, which studies have already been initiated at Gafisa, as approved by its Board of Directors. There are many synergies between the two companies, the major players of the sector, particularly if we consider the possible combination of their potentials.
For these reasons, Gafisa understands that this operation will add value to all of its shareholders as well as to those of Tecnisa. Any alternative of this analyzed operation shall be voluntary and structured to ensure that all shareholders of Tecnisa receive equal treatment, and in case of exchange or barter, the economic condition is kept.
(A free translation of the original report in Portuguese as published in Brazil)
Gafisa S.A.
Notes to the quarterly financial information
September 30, 2020
(Amounts in thousands of Brazilian Reais, except as otherwise stated)
| 31. | Events after the reporting period--Continued |
| (iv) | Intention of making a business combination with Tecnisa |
This operation includes the Gafisa’s request to make amendments to the Articles of Incorporation and management of Tecnisa, by resolution at the Shareholders’ Meeting, as Gafisa had acquired the required amount of shares in the market to request such meeting to be called, pursuant to CVM Instruction 627/2020, included in Note 4.2. Gafisa believes that an integration between the projects of these two companies shall potentially benefit the shareholders of both companies, particularly nowadays, when the real estate market is recovering.
| (v) | Coronavirus – COVID-19 |
As of the disclosure date of this quarterly information, the Company, through its Crisis Management Committee, continues to perform periodic analysis and monitoring of the actions to be taken to anticipate any impact on business.
Until the disclosure date of this quarterly information, the Company has not noted a significant increase in customer default or reduction in sales volume, having even recording a sales increase in the quarter. However, even though it has not noted a significant increase in default in the period, the Company recognized an increase in the allowance for cancelled contracts because of the revaluation of the contracts in effect in relation to the uncertainty over cash inflows during the pandemic. Moreover, the construction of ventures has been according to the original schedule.
However, due to the Covid-19 pandemic, the Company has postponed the launches planned for the second quarter to the second half of this year, currently having three projects in launch phase.
Therefore, even considering the scenario of uncertainty over the end of the pandemic for resuming activities and its negative impact on the country’s economy, management has evaluated the effects after the reporting period of the quarterly information as of September 30, including on its projections of profit or loss and cash generation, based on its best estimate, and has concluded that there is no need to recognize additional loss allowance, nor is any material adverse effect on its operations. The Company is going to keep monitoring the pandemic to continually update its projections and analysis on any effect on its financial information.
***
(A free translation of the original report in Portuguese as published in Brazil)
Gafisa S.A.
Notes to the quarterly financial information
September 30, 2020
(Amounts in thousands of Brazilian Reais, except as otherwise stated)
Other information deemed relevant by the Company
| 1. | SHAREHOLDERS HOLDING MORE THAN 5% OF THE VOTING CAPITAL AND TOTAL NUMBER OF OUTSTANDING SHARES |
| 09/30/2020 | ||
| Common shares | ||
| Shareholder | Shares | % |
| Planner Redwood Asset Management S.A. | 39,413,089 | 13,21% |
| Outstanding shares | 251,977,292 | 86,67% |
| Treasury shares | 341,570 | 0,12% |
| Total shares | 290,731,951 | 100.00% |
| 09/30/2019 | ||
| Common shares | ||
| Shareholder | Shares | % |
| Planner Redwood Asset Management S.A. | 19,238,010 | 27.08% |
| Wishbone Management, LP | 3,629,058 | 5.11% |
| River and Mercantille Management, LLP | 3,582,114 | 5,04% |
| Outstanding shares | 41,456,093 | 58,36% |
| Treasury shares | 3,126,601 | 4,40% |
| Total shares | 71,031,876 | 100.00% |
(A free translation of the original report in Portuguese as published in Brazil)
Gafisa S.A.
Notes to the quarterly financial information
September 30, 2020
(Amounts in thousands of Brazilian Reais, except as otherwise stated)
Other information deemed relevant by the Company
| 2. | SHARES HELD BY PARENT COMPANIES, MANAGEMENT AND BOARD |
| 09/30/2020 | ||
| Common shares | ||
| Shareholder | Shares | % |
| Shareholders holding effective control of the Company | 38,413,089 | 13,21% |
| Board of Directors | 7,127,867 | 2,45% |
| Executive directors | 2,670,999 | 0,92% |
| Executive control, board members, officers and fiscal council | 48,211,955 | 16,58% |
| Treasury shares | 341,570 | 0,12% |
| Outstanding shares in the market (*) | 242,178,426 | 83,30% |
| Total shares | 290,731,951 | 100.00% |
| 09/30/2019 | ||
| Common shares | ||
| Shareholder | Shares | % |
| Shareholders holding effective control of the Company | 26,449,142 | 37,24% |
| Board of Directors | 555 | 0.00% |
| Executive directors | 12,800 | 0.02% |
| Executive control, board members, officers and fiscal council | 26,462,497 | 37,25% |
| Treasury shares | 3,126,601 | 4,40% |
| Outstanding shares in the market (*) | 41,442,778 | 58,34% |
| Total shares | 71,031,876 | 100.00% |
(*) Excludes shares of effective control, management, board and in treasury.
(A free translation of the original report in Portuguese as published in Brazil)
Gafisa S.A.
Notes to the quarterly financial information
September 30, 2020
(Amounts in thousands of Brazilian Reais, except as otherwise stated)
Other relevant information
3 – COMMITMENT CLAUSE
The Company, its shareholders, directors and board members undertake to settle, through arbitration, any and all disputes or controversies that may arise between them, related to or originating from, particularly, the application, validity, effectiveness, interpretation, breach and the effects thereof, of the provisions of Law No. 6404/76, the Company's By-Laws, the rules determined by the Brazilian Monetary Council (CMN), by the Central Bank of Brazil and by The Brazilian Securities and Exchange Commission (CVM) as well as the other rules that apply to the operations of the capital market in general, in addition to those established in the New Market Listing Regulation, Participation in the New Market Contract and in the Arbitration Regulations of the Chamber of Market Arbitration.
(A free translation of the original report in Portuguese as published in Brazil)
Gafisa S.A.
Notes to the quarterly financial information
September 30, 2020
(Amounts in thousands of Brazilian Reais, except as otherwise stated)

REVIEW REPORT ON QUARTERLY FINANCIAL INFORMATION (ITR)
To Shareholders and Management of
Gafisa S.A.
São Paulo, SP
Introduction
We have reviewed the accompanying individual and consolidated interim financial information of Gafisa S.A. (“Company”), identified as Company and Consolidated, respectively, contained in the Quarterly Financial Information (ITR) for the quarter ended September 30, 2020, which comprises the statement of financial position as of September 30, 2020, and the respective statements of profit or loss and comprehensive income for the three and nine-month periods then ended, and the statements of changes in equity and cash flows for the nine-month period then ended, including the explanatory notes.
The Company’s management is responsible for the preparation of the individual interim financial information in accordance with the Accounting Pronouncements Committee (CPC) Technical Pronouncement (CPC) 21 (R1) – Interim Financial Reporting, and of the consolidated interim financial information in accordance with such pronouncement and the International Accounting Standard (IAS) 34 – Interim Financial Reporting, applicable to the real estate development entities in Brazil, registered with the Brazilian Securities and Exchange Commission (CVM), as well as the presentation of such information according to the rules issued by CVM, applicable to the preparation of Quarterly Financial Information (ITR). Our responsibility is to express a conclusion on such interim financial information based on our review.
Scope of review
We have conducted our review according to the Brazilian and international review standards of interim financial information (NBC TR 2410 – Review of Interim Financial Information Performed by the Auditor of the Entity, and ISRE 2410 - Review of Interim Financial Information Performed by the Independent Auditor of the Entity, respectively). A review of interim financial information consists of making inquiries, primarily of the persons responsible for financial and accounting matters, and applying analytical and other review procedures. A review is substantially less in scope than an audit conducted in accordance with standards on auditing and, consequently, does not enable us to obtain assurance that we would become aware of all significant matters that might be identified in an audit. Accordingly, we do not express an audit opinion.

(A free translation of the original report in Portuguese as published in Brazil)
Gafisa S.A.
Notes to the quarterly financial information
September 30, 2020
(Amounts in thousands of Brazilian Reais, except as otherwise stated)
Conclusion from the individual interim financial information
Based on our review, we are not aware of any fact that makes us believe that the individual interim financial information included in the quarterly financial information referred to above has not been prepared, in all material respects, in accordance with the Technical Pronouncement CPC 21 (R1), applicable to the real estate development entities in Brazil, registered with the Brazilian Securities and Exchange Commission (CVM), applicable to the preparation of Quarterly Financial Information (ITR), and presented according to the rules issued by CVM.
Conclusion from the consolidated interim financial information
Based on our review, we are not aware of any fact that makes us believe that the consolidated interim financial information included in the quarterly financial information referred to above has not been prepared, in all material respects, in accordance with the Technical Pronouncement CPC 21 (R1) and IAS 34, applicable to the real estate development entities in Brazil, registered with the Brazilian Securities and Exchange Commission (CVM), applicable to the preparation of Quarterly Financial Information (ITR), and presented according to the rules issued by CVM.
Emphasis of matter
As described in Note 2, the individual interim financial information contained in the Quarterly Financial Information (ITR) has been prepared in accordance with CPC 21, applicable to real estate development entities in Brazil, registered with CVM, and the consolidated interim financial information, contained in the ITR, has been prepared in accordance with CPC 21 and IAS 34, applicable to real estate development entities in Brazil, registered with CVM. Accordingly, the determination of the accounting policy adopted by the entity on recognition of revenue from purchase and sale of real estate unit not completed, on aspects related to transfer of control, follows the Company’s Management understanding of the application of CPC 47, aligned with that issued by CVM in the Circular Letter/CVM/SNC/SEP 02/2018. Our opinion does not contain exception in relation to this matter.
(A free translation of the original report in Portuguese as published in Brazil)
Gafisa S.A.
Notes to the quarterly financial information
September 30, 2020
(Amounts in thousands of Brazilian Reais, except as otherwise stated)
Other matters
Statement of value added
The quarterly information referred to above includes the individual and consolidated statements of value added for the nine-month period ended September 30, 2020, the preparation of which is attributed to the Company’s management and is presented as supplementary information for IAS 34 purposes, applicable to real estate development entities in Brazil, registered with CVM. These statements have been submitted to the review procedures performed together with the review of the quarterly information, with the aim to conclude whether they are reconciled with the interim financial information and the accounting records, as applicable, and their format and content follow the criteria established in the Technical Pronouncement CPC 09 - “Statement of value added”. Based on our review, we are not aware of any fact that makes us believe that they have not been prepared, in all material respects, following criteria established in such Technical Pronouncement and consistently with the individual and consolidated interim financial information taken as a whole.
Rio de Janeiro, November 16, 2020.
|

| Mário Vieira Lopes |
| Accountant - CRC-RJ-060.611/O-0 |
(A free translation of the original report in Portuguese as published in Brazil)
Gafisa S.A.
Notes to the quarterly financial information
September 30, 2020
(Amounts in thousands of Brazilian Reais, except as otherwise stated)
Reports and statements / Management statement of interim financial information
Management statement of interim financial information
STATEMENT
The management of Gafisa S.A., CNPJ 01.545.826/0001-07, located at Av. Nações Unidas, 8501, 19th floor, Pinheiros, São Paulo, states as per Article 25 of CVM Instruction 480 issued on December 7, 2009 that:
i) Management has reviewed, discussed and agreed with the auditor’s conclusion expressed on the report on review interim financial Information for the period ended September 30,2020; and
ii) Management has reviewed and agreed with the interim information for the period ended September 30, 2020
São Paulo, November 16, 2020.
GAFISA S.A.
Management
(A free translation of the original report in Portuguese as published in Brazil)
Gafisa S.A.
Notes to the quarterly financial information
September 30, 2020
(Amounts in thousands of Brazilian Reais, except as otherwise stated)
Reports and Statements / Management statement on the report on review of interim financial information
Management Statement on the Review Report
STATEMENT
The management of Gafisa S.A., CNPJ 01.545.826/0001-07, located at Av. Nações Unidas, 8501, 19th floor, Pinheiros, São Paulo, states as per Article 25 of CVM Instruction 480 issued in December 7, 2009 that:
i) Management has reviewed, discussed and agreed with the auditor’s conclusion expressed on the report on review interim financial Information for the period ended September 30, 2020; and
ii) Management has reviewed and agreed with the interim information for the period ended September 30, 2020.
São Paulo, November 16, 2020.
GAFISA S.A.
Management
Rel294
SIGNATURE
Pursuant to the requirements of the Securities Exchange Act of 1934, the registrant has duly caused this report to be signed on its behalf by the undersigned, thereunto duly authorized.
Date: December 18, 2020
| Gafisa S.A. | |
| By: | /s/ Ian Andrade |
Name: Ian Andrade Title: Chief Financial Officer | |