UNITED STATES
SECURITIES AND EXCHANGE COMMISSION
Washington, D.C. 20549
FORM N-CSR
CERTIFIED SHAREHOLDER REPORT OF REGISTERED
MANAGEMENT INVESTMENT COMPANIES
Investment Company Act file number | 811-22018 | |||||
| ||||||
Nuveen Diversified Currency Opportunities Fund | ||||||
(Exact name of registrant as specified in charter) | ||||||
| ||||||
Nuveen Investments 333 West Wacker Drive Chicago, IL 60606 | ||||||
(Address of principal executive offices) (Zip code) | ||||||
| ||||||
Kevin J. McCarthy Nuveen Investments 333 West Wacker Drive Chicago, IL 60606 | ||||||
(Name and address of agent for service) | ||||||
| ||||||
Registrant’s telephone number, including area code: | (312) 917-7700 |
| ||||
| ||||||
Date of fiscal year end: | December 31 |
| ||||
| ||||||
Date of reporting period: | December 31, 2013 |
| ||||
Form N-CSR is to be used by management investment companies to file reports with the Commission not later than 10 days after the transmission to stockholders of any report that is required to be transmitted to stockholders under Rule 30e-1 under the Investment Company Act of 1940 (17 CFR 270.30e-1). The Commission may use the information provided on Form N-CSR in its regulatory, disclosure review, inspection, and policymaking roles. A registrant is required to disclose the information specified by Form N-CSR, and the Commission will make this information public. A registrant is not required to respond to the collection of information contained in Form N-CSR unless the Form displays a currently valid Office of Management and Budget (“OMB”) control number. Please direct comments concerning the accuracy of the information collection burden estimate and any suggestions for reducing the burden to Secretary, Securities and Exchange Commission, 450 Fifth Street, NW, Washington, DC 20549-0609. The OMB has reviewed this collection of information under the clearance requirements of 44 U.S.C. ss. 3507.
ITEM 1. REPORTS TO SHAREHOLDERS
Closed-End Funds

Nuveen Investments
Closed-End Funds
Seeks High Current Income and Gains from an Enhanced Global Debt Strategy
Annual Report December 31, 2013
JGG
Nuveen Global Income Opportunities Fund
JGT
Nuveen Diversified Currency Opportunities Fund
Life is Complex
Nuveen makes things e-simple.
It only takes a minute to sign up for e-Reports. Once enrolled, you'll receive an e-mail as soon as your Nuveen Fund information is ready. No more waiting for delivery by regular mail. Just click on the link within the e-mail to see the report and save it on your computer if you wish.
Free e-Reports right to your e-mail!
www.investordelivery.com
If you receive your Nuveen Fund distributions and statements from your financial advisor or brokerage account.
or
www.nuveen.com/accountaccess
If you receive your Nuveen Fund distributions and statements directly from Nuveen.

Table
of Contents
Chairman's Letter to Shareholders | 4 | ||||||
Portfolio Managers' Comments | 5 | ||||||
Fund Leverage and Currency Investment Exposure | 10 | ||||||
Share Information | 11 | ||||||
Risk Considerations | 14 | ||||||
Performance Overview and Holding Summaries | 17 | ||||||
Report of Independent Registered Public Accounting Firm | 20 | ||||||
Portfolios of Investments | 21 | ||||||
Statement of Assets and Liabilities | 39 | ||||||
Statement of Operations | 40 | ||||||
Statement of Changes in Net Assets | 41 | ||||||
Statement of Cash Flows | 42 | ||||||
Financial Highlights | 44 | ||||||
Notes to Financial Statements | 46 | ||||||
Additional Fund Information | 62 | ||||||
Glossary of Terms Used in this Report | 63 | ||||||
Reinvest Automatically, Easily and Conveniently | 64 | ||||||
Board Members & Officers | 65 | ||||||
Nuveen Investments
3
Chairman's Letter
to Shareholders

Dear Shareholders,
I am pleased to have this opportunity to introduce myself to you as the new independent chairman of the Nuveen Fund Board, effective July 1, 2013. I am honored to have been selected as chairman, with its primary responsibility to serve the interests of the Nuveen Fund shareholders. My predecessor, Robert Bremner, was the first independent director to serve as chairman of the Board and I, and my fellow Board members, plan to continue his legacy of strong independent oversight of your funds.
The global economy has hit major turning points over the last several months to a year. The developed world is gradually recovering from its financial crisis while the emerging markets appear to be struggling with the downshift of China's growth potential. Japan is entering a new era of growth after decades of economic stagnation and many of the Eurozone nations appear to be exiting their recession. Despite the positive events, there are still potential risks. Middle East tensions, rising oil prices, defaults in Europe and fallout from the financial stress in emerging markets could all reverse the recent progress in the global economy.
On the domestic front, recent events such as the Federal Reserve decision to slow down its bond buying program beginning in January of 2014 and the federal budget compromise that would guide government spending into 2015 are both positives for the economy moving forward. Corporate fundamentals are strong as earnings per share and corporate cash are at the highest level in two decades. Unemployment is trending down and the housing market has experienced a rebound, each assisting the positive economic scenario. However, there are some issues to be watched. Interest rates are expected to increase but significant uncertainty about the timing remains. Partisan politics in Washington D.C. with their troublesome outcomes add to the uncertainties that could cause problems for the economy going forward.
In the near term, governments are focused on economic recovery and the growth of their economies, which could lead to an environment of attractive investment opportunities. Over the long term, the uncertainties mentioned earlier could hinder the potential growth. Because of this, Nuveen's investment management teams work hard to balance return and risk with a range of investment strategies. I encourage you to read the following commentary on the management of your fund.
On behalf of the other members of the Nuveen Fund Board, we look forward to continuing to earn your trust in the months and years ahead.

William J. Schneider
Chairman of the Nuveen Fund Board
February 21, 2014
Nuveen Investments
4
Portfolio Manager's
Comments
Nuveen Global Income Opportunities Fund (JGG)
Nuveen Diversified Currency Opportunities Fund (JGT)
These Funds feature portfolio management by Nuveen Asset Management (NAM), LLC, an affiliate of Nuveen Investments. Steve S. Lee, CFA and Timothy A. Palmer, CFA manage these Funds.
Here they discuss general market conditions and trends, their investment strategies and the performance of the Funds during the twelve-month reporting period ended December 31, 2013.
What factors affected the U.S. economy and the equity market during the twelve-month reporting period ended December 31, 2013?
During the first part of this reporting period, widespread uncertainty about the next step for the Federal Reserve's (Fed) quantitative easing program and the potential impact on the economy and financial markets led to increased market volatility. After surprising the market in September 2013 with its decision to wait for additional evidence of an improving economy before making any adjustments to the program, the Fed announced on December 18th that it would begin tapering its monthly bond-buying program by $10 billion (to $75 billion) in January 2014. The outlook for the U.S. economy was clouded by uncertainty about global financial markets and the outcome of the "fiscal cliff." The tax consequences of the fiscal cliff situation were averted through a last-minute deal that raised payroll taxes, but left in place a number of tax breaks. However, lawmakers failed to reach a resolution on $1.2 trillion in spending cuts intended to address the federal budget deficit. This triggered a program of automatic spending cuts (or sequestration) that impacted federal programs beginning March 1, 2013. Although Congress later passed legislation that established federal funding levels for the remainder of fiscal 2013, the federal budget for fiscal 2014 continued to be debated.
On October 1, 2013, the start date for fiscal 2014, the federal government shut down for 16 days until an interim appropriations bill was signed into law, funding the government at sequestration levels through January 15, 2014, and suspending the debt limit until February 7, 2014. At the end of the reporting period, Congress passed a federal budget deal that would guide government spending into 2015 and defuse the chances of another shutdown. In addition to the ongoing political debate over federal spending, Chairman Bernanke's June 2013 remarks about tapering the Fed's asset purchase program touched off widespread uncertainty about the next step for the Fed's quantitative easing program and about the potential impact on the economy and financial markets, leading to increased market volatility.
In the third quarter of 2013, the U.S. economy, as measured by the U.S. gross domestic product (GDP), grew at an annualized rate of 4.1%, up from 2.5% for the second quarter of 2013, continuing the pattern of positive economic growth for the tenth consecutive quarter. The Consumer Price Index (CPI) rose 1.5% year-over-year as of December 2013, while the
Certain statements in this report are forward-looking statements. Discussions of specific investments are for illustration only and are not intended as recommendations of individual investments. The forward-looking statements and other views expressed herein are those of the portfolio managers as of the date of this report. Actual future results or occurrences may differ significantly from those anticipated in any forward-looking statements and the views expressed herein are subject to change at any time, due to numerous market and other factors. The Funds disclaim any obligation to update publicly or revise any forward-looking statements or views expressed herein.
Ratings shown are the highest rating given by one of the following national rating agencies: Standard & Poor's (S&P), Moody's Investors Service, Inc. (Moody's) or Fitch, Inc. (Fitch). Credit ratings are subject to change. AAA, AA, A and BBB are investment grade ratings; BB, B, CCC, CC, C and D are below investment grade ratings. Certain bonds backed by U.S. Government or agency securities are regarded as having an implied rating equal to the rating of such securities. Holdings designated N/R are not rated by these national rating agencies.
Nuveen Investments
5
Portfolio Manager's Comments (continued)
core CPI (which excludes food and energy) increased 1.7% during the same period, staying within the Fed's unofficial objective of 2.0% or lower for this inflation measure. Improvements in the labor markets continued to be slow, and unemployment remained above the Fed's target of 6.5%. As of December 2013, the national unemployment rate was 6.7%, down from 7.0% in November 2013. The housing market continued to deliver good news, as the average home price in the S&P/Case-Shiller Index of 20 major metropolitan areas rose 13.7% for the twelve months ended November 2013 (most recent data available at the time this report was prepared), the largest twelve-month percentage gain for the index since February 2006.
For much of the reporting period, low interest rates and a fairly benign macro environment caused U.S. investors to move out the risk spectrum, resulting in robust flows into U.S. equity funds. Leading U.S. stock market indexes, including the S&P 500® Index, the Dow Jones Industrial Average and the Russell 2000® Index, each hit all-time highs during the reporting period. The S&P 500® Index gained 32.39% and the Dow Jones Industrial Average gained 29.65% during the reporting period. Gold suffered its first annual decline since 2000. The Nikkei Index rose 57%, while most European developed markets generated double-digit returns. Easing money policies by the world's central banks continued, joined by significant steps in Japan, while economic growth remained weak. Returns from most developing markets underperformed developed markets, with China and Brazil both posting negative returns for the reporting period.
What key strategies were used to manage the Funds during this twelve-month reporting period ended December 31, 2013?
Both of the Funds continued to employ the same fundamental investment strategies and tactics used previously, although implementation of those strategies depended on the individual characteristics of the portfolios, as well as market conditions. The Funds' management teams used a highly collaborative, research-driven approach that we believe offers the best opportunity to achieve consistent, superior long-term performance on a risk-adjusted basis across the full range of market environments. Going into the reporting period, the Funds were generally positioned for an environment of continued moderate economic growth and improving financial conditions, a posture we remained committed to during the reporting period. Nonetheless, we made shifts on an ongoing basis that were geared toward improving each Fund's profile in response to changing conditions and valuations. These strategic moves are discussed in more detail later in this report.
During this reporting period, JGG's investment objective of high current income and gains with a secondary objective of seeking capital preservation remained unchanged. JGG features a more traditional, multi-sector global bond strategy that invests primarily in sovereign, corporate and other types of debt from developed and emerging markets around the world. JGG intends to actively manage its country, currency, sector and interest rate exposures as market conditions change. JGG will invest at least 80% of its managed assets in global debt securities, including but not limited to global sovereign and government-related debt, domestic and foreign debt securities, U.S. government securities, residential and commercial mortgage-backed securities and asset backed securities. JGG will invest primarily in securities rated investment grade at the time of purchase, from issuers in both developed and emerging market countries.
Our constructive view of the global economy and financial stabilization continued to unfold during the reporting period, as global economic data improved, U.S. fiscal uncertainties moderated, Chinese policy visibility improved and global monetary conditions remained accommodative. As a result, our key sector and interest rate themes in the Fund remained intact, favoring corporate bonds over governments and a defensive interest rate posture. We also retained the Fund's industry focus on financials as well as cyclically-sensitive industries within corporate bonds. Portfolio activity was centered on bottom-up credit and issue selection. We increased the Fund's investment grade and emerging market credit exposures during the period in response to specific opportunities. We reduced the Fund's high yield exposure as the reporting period came to a close on the heels of the segment's strong performance in 2013. In addition, we actively repositioned currency exposures based on fundamental developments and valuation shifts, including additions to the Brazilian real,
Nuveen Investments
6
Malaysian ringgit, U.S. dollar and reductions in the Canadian dollar, Indian rupee, Korean won, Norwegian krone and Turkish lira.
JGT seeks to provide the potential for an attractive level of current income and total return. The Fund offers actively managed diversified exposure to foreign currencies and short-term global yields by investing directly and indirectly in a portfolio of short-term international government securities denominated in unhedged, non-U.S. currencies. Indirect investments in international non-U.S. government securities are made by purchasing forward currency contracts and other derivative instruments that are collateralized by direct investments in U.S. cash equivalents, including U.S. government debt and agency paper. This strategy may create the economic effect of financial leverage. JGT also actively manages both long and short currency positions in multiple currencies.
The reporting period was marked by bouts of volatility in the foreign exchange market. Throughout the reporting period, we actively repositioned the Fund's currency exposure based on changes in valuations and fundamental economic developments. We increased focus on currency selection as the dollar is no longer in a broad based downtrend and global monetary policies respond to domestic priorities and developments. We remained underweight the Japanese yen and euro, and the Fund's net short U.S dollar exposure was decreased. We continued to invest in countries that should benefit from improving global growth, working toward improving external balances, or implementing structural reforms. We increased our currency exposure in Brazil, Malaysia and the U.K as those currencies exhibited either attractive yields and/or improving growth. We reduced currency exposures in Canada, Chile, India, Korea, Norway and Turkey in response to changes in valuations and fundamental developments. As we experienced opportunities in the diverging economic macro fundamentals and monetary policies, the Fund ended the reporting period with short currency exposures in Japan, Canada and Korea.
How did the Funds perform during this twelve-month reporting period ended December 31, 2013?
The tables in the Performance Overview and Holding Summaries section of this report provide total return performance for the Funds for the one-year, five-year and since inception periods ended December 31, 2013. For the twelve-month reporting period, the Funds' total returns at net asset value (NAV) underperformed their respective index.
During the reporting period, JGG underperformed the Barclays Global Aggregate Bond Index. The underperformance was largely due to the negative impact of currency positioning. Currencies were volatile in the summer and early fall as the U.S. dollar declined versus the euro and the British pound, while emerging market currencies were hit amid fears of growth and rising rates. The most notable detractors were the Fund's exposures to the Indian rupee, Turkish lira, Brazilian real and Australian dollar. Also detracting from performance was our underweight to the euro. The Fund's exposure to the Mexican peso contributed to the performance as Mexico passed several reform measures that may attract foreign investments and increase growth potential. Also, the Fund's significant underweight to the Japanese yen was a positive contributor to performance during the reporting period.
Interest rate positioning had mixed results, but in aggregate was a detractor in terms of the Fund's twelve-month reporting period returns. Our overall defensive interest rate positioning globally added value as the Fund's duration, or interest rate sensitivity, was significantly shorter than the benchmark and mid-period adjustments proved beneficial to returns. However, country selection within interest rate market positioning had a net negative impact during the reporting period. Our underweight duration in the euro zone and Japan in favor of higher yielding markets such as Mexico and South Africa was disadvantageous as rates rose less in Europe and Japan. Overweights to interest rates in smaller G-10 countries (major world economies) were partial positive offsets to the other exposures.
The improvement in credit spreads and stabilization in markets helped drive positive contribution from the Fund's corporate bond exposure during the twelve-month reporting period. Our positioning in high yield corporate bonds was the largest positive contributor to the Fund's performance, both through our overweight in the sector, as well as from issue selection and tactical repositioning within high yield during the reporting period. High yield was the top-performing fixed
Nuveen Investments
7
Portfolio Manager's Comments (continued)
income sector as it benefited from strong issuer fundamentals, accommodative financing conditions, and the reduced U.S. fiscal and monetary policy uncertainty later in the reporting period represented a catalyst for risk assets. High yield investors also became more comfortable with rising Treasury yields as macro fundamentals improved. Even as Treasury rates drifted higher in November and December, the high yield asset class again managed to outperform its fixed income peers. The spread between high yield and Treasuries tightened to end the year at 428 basis points, despite what turned out to be another brisk period for high yield bond issuance.
The Fund also experienced positive performance contribution from investment grade credit. The Fund's focus on the financial, energy and metals/mining sectors was helpful, including European bank preferreds. Emerging market credit, both investment grade and high yield, also contributed to performance.
In the current environment, income generation and interest rate risk management are key considerations. Given strong fundamentals and still attractive valuations, we are maintaining the Fund's emphasis on investment grade and high yield credit. These sectors provide strong income generation and are defensive relative to rising interest rates. Within corporate bonds, we believe issue and credit selection can be more important drivers of performance and risk management than high level sector selection. Despite recent outperformance, financial issues continued to be attractive, as are selected cyclicals. Within investment grade, we prefer BBB-rated over A-rated industrials, given better relative value and lesser risk of re-leveraging behavior in lower rated credits.
We anticipate U.S. rates to be pressured higher as they move closer to fair value levels. Although we don't expect a shock higher in yields, interest rate volatility could rise in response to economic developments. We are maintaining our defensive duration posture in the Fund and very limited exposure to Treasuries and mortgage-backed securities. We see value for return and diversification in selected developed foreign currencies and bonds, but with a sharp focus on market selection. We remain focused on developments in currencies, as we see the current market uncertainty creating valuation opportunities.
JGT also underperformed its Comparative Benchmark, which is a 50% blend of the Citigroup Non-U.S. World Government Bond 1-3 Year Index and JPMorgan Emerging Local Markets Index Plus. The Fund was negatively impacted by the general appreciation of the U.S. dollar, given the short dollar bias of the Fund, but the income generated by both currency and short-term bond exposures helped to mitigate some of those losses.
Currencies were very volatile in the summer and early fall as the U.S. dollar declined versus the euro and the British pound, while emerging market currencies were hit amid fears of growth and rising rates. Emerging market currencies with high current account deficits were the worst performers even as the central banks in those countries intervened to support their currencies. The largest detractor in terms of currencies was the Fund's overweight to growth oriented currencies, which suffered from capital outflows and concerns about current account imbalances. The most notable detractors were the Fund's exposures to the Indian rupee, Turkish lira, South African rand, Australian dollar and Brazilian real. On the other hand, the Fund's exposure to the Mexican peso contributed to the performance as Mexico passed several reform measures that may attract foreign investments and increase growth potential.
Our currency positioning also emphasized an underweight to the euro, given fundamental economic growth headwinds faced by the region, and to the Japanese yen, in light of policy divergence from the U.S. and other domestic developments in Japan. The Fund's significant underweight to the Japanese yen was a positive contributor to performance during the reporting period. We maintained this underweight due to fundamental reasons surrounding Japanese policy developments. As the Bank of Japan continued its efforts to lift inflation and improve economic conditions, its quantitative easing program put downward pressure on the Japanese yen. We also maintained this position to help protect the Fund's other foreign positions from a generalized rise in the dollar. Similarly, we held an underweight to the euro for portfolio and currency specific reasons. However, the euro positioning was a drag on results throughout the reporting period as the euro appreciated amid U.S. uncertainty and stronger-than-expected European economic performance and capital inflows into the euro zone during the latter half of the reporting period.
Nuveen Investments
8
Both JGG and JGT wrote put options and purchased call options on select currencies during the reporting period in an attempt to benefit from changes in the spot values of these currencies, and we used foreign currency exchange contracts to gain exposure to selected foreign currencies, as well as in some cases to hedge the currency risk present in a foreign bond. The overall effect of both the option and foreign currency exchange contracts activities were negative during the reporting period.
Both JGG and JGT sold U.S. Treasury futures to hedge against potential increases in U.S. interest rates and purchased selected foreign bond futures to gain exposure to those markets. The effect of these activities in the period was positive. JGG also used credit default swaps as a way to take on credit risk and earn a commensurate credit spread. The effect of these contracts on the Fund's performance was positive during the reporting period.
In JGG, we used interest rate swaps as part of an overall portfolio interest rate strategy. The effect of these contracts on the Fund's performance was positive during the reporting period.
These derivative exposures are integrated with the overall portfolio construction and such losses and gains may be naturally related to and/or may offset impacts elsewhere in the portfolio.
Nuveen Investments
9
Fund Leverage and
Currency Investment Exposure
IMPACT OF LEVERAGE STRATEGIES ON PERFORMANCE
One important factor impacting the return of JGG relative to its benchmarks was the Fund's use of leverage through the use of bank borrowings. The Fund uses leverage because our research has shown that, over time, leveraging provides opportunities for additional income and total return for shareholders. However, use of leverage also can expose shareholders to additional volatility. For example, as the prices of securities held by the Fund decline, the negative impact of these valuation changes on common share NAV and common shareholder total return is magnified by the use of leverage. Conversely, leverage may enhance common share returns during periods when the prices of securities held by the Fund generally are rising. Leverage had a negative impact on the performance of JGG during this reporting period.
JGG also continued to use interest rate swap contracts in order to hedge leverage costs. The impact on performance was positive during this reporting period.
JGT's investment strategies did not create the economic effects of leverage for the Fund during this reporting period.
As of December 31, 2013, JGG's percentages of leverage are shown in the accompanying table.
JGG | |||||||
Effective Leverage* | 33.54 | % | |||||
Regulatory Leverage* | 31.46 | % | |||||
* Effective leverage is the Fund's effective economic leverage and includes regulatory leverage. Effective leverage attempts to measure the extent to which the return and risk of an investment in the Fund's shares are magnified through the use of certain forms of leverage. This Fund uses leverage in the form of borrowings from a credit facility, and may also use derivatives that increase or decrease investment risk compared to the exposure level of the securities in the portfolio. This measure includes the notional value of certain of these derivatives considered to increase investment risk. The Fund's borrowings are considered regulatory leverage as they are part of the Fund's capital structure. Regulatory leverage is subject to asset coverage limits set forth in the Investment Company Act of 1940.
JGG'S REGULATORY LEVERAGE
Bank Borrowings
JGG employs regulatory leverage through the use of bank borrowings. As of December 31, 2013, the Fund has outstanding bank borrowings of $56,000,000.
Refer to Notes to Financial Statements, Note 8 – Borrowing Arrangements for further details.
THE FUNDS' CURRENCY INVESTMENT EXPOSURE IN EXCESS OF MANAGED ASSETS
Currency investment exposure in excess of managed assets is a Fund's net exposure to currencies other than the U.S. dollar greater than the amount of managed assets resulting from:
(i) the purchase of non-U.S. dollar denominated securities, and
(ii) the use of foreign exchange contracts such as forwards or options.
As of December 31, 2013, JGT's currency investment exposure in excess of the Fund's managed assets is as shown in the accompanying table.
JGT | |||||||
Currency Investment Exposure in Excess of Managed Assets | 2.71 | % | |||||
JGG's investment strategies did not create currency investment exposure for the Fund that exceeded its managed assets as of the end of this reporting period.
Nuveen Investments
10
Share
Information
DISTRIBUTION INFORMATION
The following information regarding each Fund's distributions is current as of December 31, 2013. Each Fund's distribution levels may vary over time based on the Fund's investment activities and portfolio investment value changes.
Each Fund has a managed distribution program. The goal of this program is to provide shareholders with relatively consistent and predictable cash flow by systematically converting the Fund's expected long-term return potential into regular distributions. As a result, regular distributions throughout the year are likely to include a portion of expected long-term gains (both realized and unrealized), along with net investment income.
Important points to understand about a managed distribution program are:
• Each Fund seeks to establish a relatively stable distribution rate that roughly corresponds to the projected total return from its investment strategy over an extended period of time. However, you should not draw any conclusions about a Fund's past or future investment performance from its current distribution rate.
• Actual returns will differ from projected long-term returns (and therefore a Fund's distribution rate), at least over shorter time periods. Over a specific timeframe, the difference between actual returns and total distributions will be reflected in an increasing (returns exceed distributions) or a decreasing (distributions exceed returns) Fund net asset value.
• Each distribution is expected to be paid from some or all of the following sources:
• net investment income (regular interest and dividends),
• realized capital gains, and
• unrealized gains, or, in certain cases, a return of principal (non-taxable distributions).
• A non-taxable distribution is a payment of a portion of a Fund's capital. When a Fund's returns exceed distributions, it may represent portfolio gains generated, but not realized as a taxable capital gain. In periods when a Fund's returns fall short of distributions, the shortfall will represent a portion of your original principal, unless the shortfall is offset during other time periods over the life of your investment (previous or subsequent) when a Fund's total return exceeds distributions.
• Because distribution source estimates are updated during the year based on a Fund's performance and forecast for its current fiscal year (which is the calendar year for each Fund), estimates on the nature of your distributions provided at the time the distributions are paid may differ from both the tax information reported to you in your Fund's IRS Form 1099 statement provided at year end, as well as the ultimate economic sources of distributions over the life of your investment.
Nuveen Investments
11
Share Information (continued)
The following table provides estimated information regarding each Fund's distributions and total return performance for the fiscal year ended December 31, 2013. This information is intended to help you better understand whether the Funds' returns for the specified time period were sufficient to meet their distributions.
As of December 31, 2013 | JGG | JGT | |||||||||
Inception date | 6/27/06 | 4/25/07 | |||||||||
Fiscal year (calendar year) ended December 31, 2013: | |||||||||||
Per share distribution: | |||||||||||
From net investment income | $ | 0.00 | $ | 0.00 | |||||||
From long-term capital gains | 0.08 | 0.03 | |||||||||
From short-term capital gains | 0.00 | 0.00 | |||||||||
Return of capital | 1.06 | 1.03 | |||||||||
Total per share distribution | $ | 1.14 | $ | 1.06 | |||||||
Distribution rate on NAV | 8.68 | % | 8.77 | % | |||||||
Current distribution rate* | 8.60 | % | 9.33 | % | |||||||
Average annual total returns: | |||||||||||
Excluding retained gain tax credit/refund***: | |||||||||||
| 1-Year on NAV | (7.49 | )% | (10.83 | )% | |||||||
| 5-Year on NAV | 2.17 | % | 2.29 | % | |||||||
Since inception on NAV | 3.46 | % | 2.15 | % | |||||||
Including retained gain tax credit/refund***: | |||||||||||
| 1-Year on NAV | N/A | (10.83 | )% | ||||||||
| 5-Year on NAV | N/A | 2.29 | % | ||||||||
Since inception on NAV | N/A | 2.25 | % | ||||||||
* Current distribution rate is based each Fund's current annualized quarterly distribution divided by the Fund's current market price. Each Fund's quarterly distributions to its shareholders may be comprised of ordinary income, net realized capital gains and, if at the end of the fiscal year the Fund's cumulative net ordinary income and net realized gains are less than the amount of the Fund's distributions, a return of capital for tax purposes.
*** JGT elected to retain a portion of its realized long-term capital gains for the tax year ended December 31, 2007, and pay required federal corporate income taxes on this amount. As reported on Form 2439, shareholders on record date must include their pro-rata share of these gains on their applicable federal tax returns, and are entitled to take offsetting tax credits, for their pro-rata share of the taxes paid by the Fund. The total returns "Including retained gain tax credit/refund" include the economic benefit to shareholders on record date of these tax credits/refunds. The Fund had no retained capital gains for the tax years ended December 31, 2008 through December 31, 2013.
Nuveen Investments
12
SHARE REPURCHASES
During November 2013, the Nuveen Funds' Board of Directors/Trustees reauthorized the Funds' open-market share repurchase program, allowing each Fund to repurchase an aggregate of up to approximately 10% of their outstanding shares.
As of December 31, 2013, and since the inception of the Funds' repurchase programs, the Funds have cumulatively repurchased and retired shares as shown in the accompanying table.
JGG | JGT | ||||||||||
Shares Cumulatively Repurchased and Retired | 95,500 | 3,521,500 | |||||||||
Shares Authorized for Repurchase | 935,000 | 4,635,000 | |||||||||
During the current reporting period, the Funds repurchased and retired shares at a weighted average price and a weighted average discount per share as shown in the accompanying table.
JGG | JGT | ||||||||||
Shares Repurchased and Retired | 69,600 | 1,962,431 | |||||||||
Weighted Average Price Per Share Repurchased and Retired | $ | 11.56 | $ | 10.84 | |||||||
Weighted Average Discount Per Share Repurchased and Retired | 13.94 | % | 15.39 | % | |||||||
OTHER SHARE INFORMATION
As of December 31, 2013, and during the current reporting period, the Funds' share prices were trading at a premium/(discount) to their NAVs as shown in the accompanying table.
JGG | JGT | ||||||||||
Share NAV | $ | 13.13 | $ | 12.08 | |||||||
Share Price | $ | 11.39 | $ | 10.08 | |||||||
Premium/(Discount) to NAV | (13.25 | )% | (16.56 | )% | |||||||
12-Month Average Premium/(Discount) to NAV | (10.02 | )% | (13.38 | )% | |||||||
Nuveen Investments
13
Risk
Considerations
Fund shares are not guaranteed or endorsed by any bank or other insured depository institution, and are not federally insured by the Federal Deposit Insurance Corporation. Shares of closed-end funds are subject to investment risks, including the possible loss of principal invested. Past performance is no guarantee of future results. Fund common shares are subject to a variety of risks, including:
Investment, Market and Price Risk. An investment in common shares is subject to investment risk, including the possible loss of the entire principal amount that you invest. Your investment in common shares represents an indirect investment in the corporate securities owned by the Funds, which generally trade in the over-the-counter markets. Shares of closed-end investment companies like the Funds frequently trade at a discount to their NAV. Your common shares at any point in time may be worth less than your original investment, even after taking into account the reinvestment of Fund dividends and distributions.
Leverage Risk. A Fund's use of leverage creates the possibility of higher volatility for the Fund's per share NAV, market price, and distributions. Leverage risk can be introduced through regulatory leverage (issuing preferred shares or debt borrowings at the Fund level) or through certain derivative investments held in a Fund's portfolio. Leverage typically magnifies the total return of a Fund's portfolio, whether that return is positive or negative. The use of leverage creates an opportunity for increased common share net income, but there is no assurance that a Fund's leveraging strategy will be successful.
Tax Risk. The tax treatment of Fund distributions may be affected by new IRS interpretations of the Internal Revenue Code and future changes in tax laws and regulations. This is particularly true for funds employing a managed distribution program.
Below-Investment Grade Risk. Investments in securities below-investment grade quality are predominantly speculative and subject to greater volatility and risk of default.
Non-U.S. Securities Risk. Investments in non-U.S securities involve special risks not typically associated with domestic investments including currency risk and adverse political, social and economic development. These risks often are magnified in emerging markets.
Call Risk or Prepayment Risk. Issuers may exercise their option to prepay principal earlier than scheduled, forcing the Funds to reinvest in lower-yielding securities.
Derivatives Strategy Risk. Derivative securities, such as calls, puts, warrants, swaps and forwards, carry risks different from, and possibly greater than, the risks associated with the underlying investments.
Issuer Credit Risk. This is the risk that a security in a Fund's portfolio will fail to make dividend or interest payments when due.
Interest Rate Risk. Fixed-income securities such as bonds, preferred, convertible and other debt securities will decline in value if market interest rates rise.
Currency Risk. Changes in exchange rates will affect the value of a Fund's investments.
Counterparty Risk. To the extent that a Fund's derivative investments are purchased or sold in over-the-counter transactions, the Fund will be exposed to the risk that counterparties to these transactions will be unable to meet their obligations.
Nuveen Investments
14
Interest Rate Swaps Risk. The risk that yields will move in the direction opposite to the direction anticipated by a Fund, which would cause a Fund to make payments to its counterparty in the transaction that could adversely affect the Fund's performance.
Forward Currency Contracts Risk. Forward currency contracts are not standardized and are substantially unregulated. Principals are not required to continue to make markets in the securities or currencies they trade and these markets can experience periods of illiquidity, sometimes of significant duration. In addition, trading forward currency contracts can have the effect of financial leverage by creating additional investment exposure.
Reinvestment Risk. If market interest rates decline, income earned from a Fund's portfolio may be reinvested at rates below that of the original bond that generated the income.
Nuveen Investments
15
THIS PAGE INTENTIONALLY LEFT BLANK
Nuveen Investments
16
JGG
Nuveen Global Income Opportunities Fund
Performance Overview and Holding Summaries as of December 31, 2013
Average Annual Total Returns as of December 31, 2013
Average Annual | |||||||||||||||
1-Year | 5-Year | Since Inception1 | |||||||||||||
JGG at NAV | (7.49 | )% | 2.17 | % | 3.46 | % | |||||||||
JGG at Share Price | (10.97 | )% | 2.28 | % | 1.44 | % | |||||||||
Barclays Global Aggregate Bond Index | (2.60 | )% | 3.91 | % | 5.22 | % | |||||||||
Past performance is not predictive of future results. Current performance may be higher or lower than the data shown. Returns do not reflect the deduction of taxes that shareholders may have to pay on Fund distributions or upon the sale of Fund shares. Comparative index return information is provided for the Fund's shares at NAV only. Indexes are not available for direct investment.
Share Price Performance — Weekly Closing Price
Portfolio Credit Quality2,3,4,5
(as a % of total investments)
AAA/U.S. Guaranteed | 2.4 | % | |||||
AA | 8.7 | % | |||||
A | 28.8 | % | |||||
BBB | 30.8 | % | |||||
BB or Lower | 25.7 | % | |||||
N/R | 3.6 | % | |||||
Country Allocation3,4,6
(as a % of total investments)
United States6 | 45.2 | % | |||||
Mexico | 11.9 | % | |||||
Turkey | 6.4 | % | |||||
South Africa | 5.0 | % | |||||
United Kingdom | 5.0 | % | |||||
South Korea | 3.5 | % | |||||
Russia | 2.6 | % | |||||
Canada | 2.4 | % | |||||
Other | 18.0 | % | |||||
Portfolio Allocation3,4
(as a % of total investments)
Corporate Bonds | 48.8 | % | |||||
Sovereign Debt | 39.0 | % | |||||
| Asset-Backed and Mortgage-Backed Securities | 4.6 | % | |||||
| $1,000 Par (or similar) Institutional Structures | 4.3 | % | |||||
Repurchase Agreements | 1.4 | % | |||||
$25 Par (or similar) Retail Structures | 1.9 | % | |||||
Refer to the Glossary of Terms Used in this Report for further definition of the terms used within this page.
1 Since inception returns are from 6/27/06.
2 Ratings shown are the highest rating given by one of the following national rating agencies: Standard & Poor's Group, Moody's Investors Service, Inc. or Fitch, Inc. Credit ratings are subject to change. AAA, AA, A, and BBB are investment grade ratings; BB, B, CCC, CC, C and D are below-investment grade ratings. Certain bonds backed by U.S. Government or agency securities are regarded as having an implied rating equal to the rating of such securities. Holdings designated N/R are not rated by these national rating agencies.
3 Holdings are subject to change.
4 Excluding investments in derivatives.
5 Excluding investments in repurchase agreements.
6 Includes investments in repurchase agreements.
Nuveen Investments
17
JGT
Nuveen Diversified Currency Opportunities Fund
Performance Overview and Holding Summaries as of December 31, 2013
Average Annual Total Returns as of December 31, 2013
Average Annual | |||||||||||||||
1-Year | 5-Year | Since Inception1 | |||||||||||||
JGT at NAV | (10.83 | )% | 2.29 | % | 2.15 | % | |||||||||
JGT at Share Price | (13.99 | )% | 3.23 | % | (0.13 | )% | |||||||||
JGT Blended Index (Comparative Index) | (3.19 | )% | 2.13 | % | 3.41 | % | |||||||||
Average Annual Total Returns as of December 31, 20132
(including retained gain tax credit/refund)
Average Annual | |||||||||||||||
1-Year | 5-Year | Since Inception1 | |||||||||||||
JGT at NAV | (10.83 | )% | 2.29 | % | 2.25 | % | |||||||||
JGT at Share Price | (13.99 | )% | 3.23 | % | (0.02 | )% | |||||||||
Past performance is not predictive of future results. Current performance may be higher or lower than the data shown. Returns do not reflect the deduction of taxes that shareholders may have to pay on Fund distributions or upon the sale of Fund shares. Comparative index return information is provided for the Fund's shares at NAV only. Indexes are not available for direct investment.
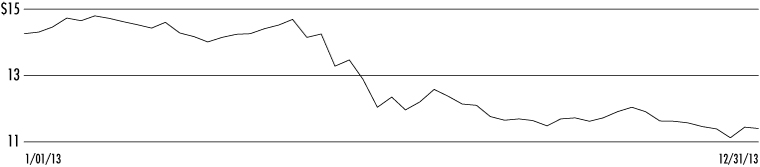
Share Price Performance — Weekly Closing Price

Nuveen Investments
18
Portfolio Credit Quality3,4,5,6
(as a % of total investments)
AAA/U.S. Guaranteed | 9.3 | % | |||||
AA | 9.1 | % | |||||
A | 38.9 | % | |||||
BBB | 29.7 | % | |||||
BB or Lower | 9.9 | % | |||||
N/R | 3.1 | % | |||||
Country Allocation4,5
(as a % of total investments)
United States7 | 18.9 | % | |||||
Brazil | 14.9 | % | |||||
Mexico | 11.8 | % | |||||
Canada | 8.1 | % | |||||
Italy | 5.3 | % | |||||
Malaysia | 4.7 | % | |||||
South Africa | 4.7 | % | |||||
Turkey | 4.6 | % | |||||
Russia | 3.6 | % | |||||
Spain | 3.4 | % | |||||
Peru | 2.4 | % | |||||
Other | 17.6 | % | |||||
Portfolio Allocation4,5
(as a % of total investments)
Sovereign Debt | 70.5 | % | |||||
Corporate Bonds | 15.8 | % | |||||
| U.S. Government and Agency Obligations | 7.3 | % | |||||
| Asset-Backed and Mortgage-Backed Securities | 5.5 | % | |||||
Repurchase Agreements | 0.7 | % | |||||
$25 Par (or similar) Retail Structures | 0.2 | % | |||||
Refer to the Glossary of Terms Used in this Report for further definition of the terms used within this page.
1 Since inception returns are from 4/25/07.
2 As previously explained in the Share Information section of this report, the Fund elected to retain a portion of its realized long-term capital gains for the tax year ended December 31, 2007, and pay required federal corporate income taxes on these amounts. These standardized total returns include the economic benefit to shareholders of record of this tax credit/refund. The Fund had no retained capital gains for the tax years ended December 31, 2008 through December 31, 2013.
3 Ratings shown are the highest rating given by one of the following national rating agencies: Standard & Poor's Group, Moody's Investors Service, Inc. or Fitch, Inc. Credit ratings are subject to change. AAA, AA, A, and BBB are investment grade ratings; BB, B, CCC, CC, C and D are below-investment grade ratings. Certain bonds backed by U.S. Government or agency securities are regarded as having an implied rating equal to the rating of such securities. Holdings designated N/R are not rated by these national rating agencies.
4 Holdings are subject to change.
5 Excluding investments in derivatives.
6 Excluding investments in repurchase agreements.
7 Including investments in repurchase agreements.
Nuveen Investments
19
Report of
Independent Registered Public Accounting Firm
To the Board of Trustees and Shareholders of
Nuveen Global Income Opportunities Fund
Nuveen Diversified Currency Opportunities Fund:
In our opinion, the accompanying statement of assets and liabilities, including the portfolio of investments, and the related statements of operations, of changes in net assets and of cash flows and the financial highlights present fairly, in all material respects, the financial position of Nuveen Global Income Opportunities Fund and the accompanying statement of assets and liabilities, including the portfolio of investments, and the related statements of operations, of changes in net assets and the financial highlights present fairly, in all material respects, the financial position of Nuveen Diversified Currency Opportunities Fund (hereinafter referred to as the "Funds") at December 31, 2013, the results of each of their operations and of Nuveen Global Income Opportunities Fund cash flows for the year then ended, the changes in each of their net assets for each of the two years in the period then ended and the financial highlights for each of the five years in the period then ended, in conformity with accounting principles generally accepted in the United States of America. These financial statements and financial highlights (hereafter referred to as "financial statements") are the responsibility of the Funds' management; our responsibility is to express an opinion on these financial statements based on our audits. We conducted our audits of these financial statements in accordance with the standards of the Public Company Accounting Oversight Board (United States). Those standards require that we plan and perform the audit to obtain reasonable assurance about whether the financial statements are free of material misstatement. An audit includes examining, on a test basis, evidence supporting the amounts and disclosures in the financial statements, assessing the accounting principles used and significant estimates made by management, and evaluating the overall financial statement presentation. We believe that our audits, which included confirmation of securities at December 31, 2013 by correspondence with the custodian and brokers, provide a reasonable basis for our opinion.
PricewaterhouseCoopers LLP
Chicago, IL
February 27, 2014
Nuveen Investments
20
JGG
Nuveen Global Income Opportunities Fund
Portfolio of Investments December 31, 2013
| Shares | Description (1) | Coupon | Ratings (2) | Value | |||||||||||||||||||
LONG-TERM INVESTMENTS – 141.6% (98.6% of Total Investments) | |||||||||||||||||||||||
$25 PAR (OR SIMILAR) RETAIL STRUCTURES – 2.6% (1.9% of Total Investments) | |||||||||||||||||||||||
Commercial Banks – 1.3% | |||||||||||||||||||||||
| 15,000 | Morgan Stanley | 7.125 | % | BB+ | $ | 392,100 | |||||||||||||||||
| 30,000 | PNC Financial Services | 6.125 | % | BBB | 757,500 | ||||||||||||||||||
| 20,000 | Regions Financial Corporation | 6.375 | % | BB | 443,000 | ||||||||||||||||||
| Total Commercial Banks | 1,592,600 | ||||||||||||||||||||||
Consumer Finance – 0.3% | |||||||||||||||||||||||
| 20,000 | Discover Financial Services | 6.500 | % | BB | 460,800 | ||||||||||||||||||
Diversified Financial Services – 0.4% | |||||||||||||||||||||||
| 18,425 | Citigroup Inc. | 7.125 | % | BB+ | 477,945 | ||||||||||||||||||
Insurance – 0.6% | |||||||||||||||||||||||
| 25,000 | Hartford Financial Services Group Inc. | 7.875 | % | BB+ | 716,500 | ||||||||||||||||||
| Total $25 Par (or similar) Retail Structures (cost $3,424,812) | 3,247,845 | ||||||||||||||||||||||
| Principal Amount (000) (4) | Description (1) | Coupon | Maturity | Ratings (2) | Value | ||||||||||||||||||
CORPORATE BONDS – 70.1% (48.8% of Total Investments) | |||||||||||||||||||||||
Aerospace & Defense – 0.6% | |||||||||||||||||||||||
$ | 680 | Exelis, Inc. | 5.550 | % | 10/01/21 | BBB+ | $ | 683,941 | |||||||||||||||
Airlines – 0.3% | |||||||||||||||||||||||
| 300 | Air Canada, 144A | 6.750 | % | 10/01/19 | BB | 316,500 | |||||||||||||||||
Auto Components – 1.6% | |||||||||||||||||||||||
| 300 | Allison Transmission Inc., 144A | 7.125 | % | 5/15/19 | B+ | 323,250 | |||||||||||||||||
| 400 | American & Axle Manufacturing Inc. | 6.625 | % | 10/15/22 | B+ | 421,000 | |||||||||||||||||
| 250 | Gestamp Funding Lux SA, 144A | 5.625 | % | 5/31/20 | BB | 254,375 | |||||||||||||||||
| 250 | Pittsburgh Glass Works LLC, 144A | 8.000 | % | 11/15/18 | B | 263,125 | |||||||||||||||||
| 300 | Stackpole International Intermediate Company, 144A | 7.750 | % | 10/15/21 | B+ | 312,000 | |||||||||||||||||
| 350 | TRW Automotive Inc., 144A | 4.450 | % | 12/01/23 | BBB– | 339,500 | |||||||||||||||||
| 1,850 | Total Auto Components | 1,913,250 | |||||||||||||||||||||
Automobiles – 0.5% | |||||||||||||||||||||||
| 200 | EUR | Fiat Finance & Trade SA | 7.000 | % | 3/23/17 | BB– | 300,090 | ||||||||||||||||
| 370 | General Motors Financial Company Inc., 144A | 4.250 | % | 5/15/23 | BB+ | 351,963 | |||||||||||||||||
| Total Automobiles | 652,053 | ||||||||||||||||||||||
Beverages – 0.2% | |||||||||||||||||||||||
| 300 | Andalou Efes Biracilik ve Malt Sanayii AS, 144A | 3.375 | % | 11/01/22 | BBB– | 238,500 | |||||||||||||||||
Building Products – 0.5% | |||||||||||||||||||||||
| 645 | Owens Corning Incorporated | 4.200 | % | 12/15/22 | BBB– | 615,931 | |||||||||||||||||
Nuveen Investments
21
JGG Nuveen Global Income Opportunities Fund (continued)
Portfolio of Investments December 31, 2013
| Principal Amount (000) (4) | Description (1) | Coupon | Maturity | Ratings (2) | Value | ||||||||||||||||||
Capital Markets – 2.9% | |||||||||||||||||||||||
$ | 1,210 | Goldman Sachs Group, Inc. | 6.000 | % | 6/15/20 | A | $ | 1,387,358 | |||||||||||||||
| 1,000 | Goldman Sachs Group, Inc. | 5.250 | % | 7/27/21 | A | 1,094,842 | |||||||||||||||||
| 300 | Lazard Group LLC | 4.250 | % | 11/14/20 | BBB | 299,349 | |||||||||||||||||
| 450 | Morgan Stanley | 4.875 | % | 11/01/22 | BBB+ | 460,647 | |||||||||||||||||
| 250 | Morgan Stanley | 3.750 | % | 2/25/23 | A | 243,266 | |||||||||||||||||
| 3,210 | Total Capital Markets | 3,485,462 | |||||||||||||||||||||
Chemicals – 2.0% | |||||||||||||||||||||||
| 300 | Eagle Spinco Inc., 144A | 4.625 | % | 2/15/21 | BB | 294,000 | |||||||||||||||||
| 745 | Eastman Chemical Company | 3.600 | % | 8/15/22 | BBB | 715,244 | |||||||||||||||||
| 300 | Ineos Group Holdings SA, 144A | 6.125 | % | 8/15/18 | B– | 301,500 | |||||||||||||||||
| 250 | Momentive Performance Materials Inc. | 8.875 | % | 10/15/20 | B3 | 263,125 | |||||||||||||||||
| 300 | Petrologisitics LP Finance, 144A | 6.250 | % | 4/01/20 | B | 300,750 | |||||||||||||||||
| 300 | PolyOne Corporation | 5.250 | % | 3/15/23 | BB | 292,500 | |||||||||||||||||
| 225 | Taminco Global Chemical Corporation, 144A | 9.750 | % | 3/31/20 | B– | 255,375 | |||||||||||||||||
| 2,420 | Total Chemicals | 2,422,494 | |||||||||||||||||||||
Commercial Banks – 1.9% | |||||||||||||||||||||||
| 535 | CIT Group Inc. | 5.000 | % | 8/01/23 | BB | 514,938 | |||||||||||||||||
| 285 | HSBC Holdings PLC | 6.800 | % | 6/01/38 | A+ | 350,594 | |||||||||||||||||
| 355 | Royal Bank of Scotland Group PLC | 6.100 | % | 6/10/23 | BBB– | 357,874 | |||||||||||||||||
| 400 | Santander UK PLC, 144A | 5.000 | % | 11/07/23 | A– | 401,488 | |||||||||||||||||
| 300 | VTB Bank OJSC via VTB Capital SA, Loan Participiation, 144A | 6.875 | % | 5/29/18 | BBB | 327,360 | |||||||||||||||||
| 340 | Wells Fargo & Company | 3.450 | % | 2/13/23 | A+ | 321,448 | |||||||||||||||||
| 2,215 | Total Commercial Banks | 2,273,702 | |||||||||||||||||||||
Commercial Services & Supplies – 2.1% | |||||||||||||||||||||||
| 200 | ABX Group Inc. | 6.375 | % | 12/01/19 | Ba3 | 203,000 | |||||||||||||||||
| 300 | ADT Corporation, 144A | 6.250 | % | 10/15/21 | BBB– | 315,000 | |||||||||||||||||
| 250 | Casella Waste Systems Inc. | 7.750 | % | 2/15/19 | Caa1 | 256,250 | |||||||||||||||||
| 400 | Ceridian Corporation, 144A | 8.875 | % | 7/15/19 | B1 | 460,000 | |||||||||||||||||
| 300 | Clean Harbors Inc. | 5.250 | % | 8/01/20 | BB+ | 309,000 | |||||||||||||||||
| 235 | EUR | Europcar Groupe SA, 144A | 11.500 | % | 5/15/17 | B– | 376,697 | ||||||||||||||||
| 250 | Iron Mountain Inc. | 5.750 | % | 8/15/24 | B1 | 231,875 | |||||||||||||||||
| 375 | R.R. Donnelley & Sons Company | 7.625 | % | 6/15/20 | BB– | 407,813 | |||||||||||||||||
| Total Commercial Services & Supplies | 2,559,635 | ||||||||||||||||||||||
Communications Equipment – 0.2% | |||||||||||||||||||||||
| 300 | Nokia Corporation | 5.375 | % | 5/15/19 | BB– | 311,250 | |||||||||||||||||
Computers & Peripherals – 0.6% | |||||||||||||||||||||||
| 300 | NCR Escrow Corporation, 144A | 6.375 | % | 12/15/23 | BB | 306,375 | |||||||||||||||||
| 350 | Seagate HDD Cayman | 7.000 | % | 11/01/21 | BBB– | 386,313 | |||||||||||||||||
| 650 | Total Computers & Peripherals | 692,688 | |||||||||||||||||||||
Construction Materials – 0.3% | |||||||||||||||||||||||
| 300 | Cemex SAB de CV, 144A | 9.000 | % | 1/11/18 | BB– | 329,250 | |||||||||||||||||
Containers & Packaging – 0.8% | |||||||||||||||||||||||
| 250 | Ardagh Packaging Finance / MP HD USA, 144A | 4.875 | % | 11/15/22 | N/R | 247,500 | |||||||||||||||||
| 415 | Ball Corporation | 4.000 | % | 11/15/23 | BB+ | 371,425 | |||||||||||||||||
| 350 | Reynolds Group | 7.125 | % | 4/15/19 | B+ | 372,750 | |||||||||||||||||
| 1,015 | Total Containers & Packaging | 991,675 | |||||||||||||||||||||
Nuveen Investments
22
| Principal Amount (000) (4) | Description (1) | Coupon | Maturity | Ratings (2) | Value | ||||||||||||||||||
Diversified Consumer Services – 0.3% | |||||||||||||||||||||||
$ | 400 | Office Depot de Mexico SA de CV, 144A | 6.875 | % | 9/20/20 | BB+ | $ | 406,000 | |||||||||||||||
Diversified Financial Services – 5.6% | |||||||||||||||||||||||
| 2,500 | Bank of America Corporation | 5.700 | % | 1/24/22 | A | 2,829,628 | |||||||||||||||||
| 540 | BNP Paribas | 2.700 | % | 8/20/18 | A+ | 550,126 | |||||||||||||||||
| 550 | Citigroup Inc. | 4.500 | % | 1/14/22 | A | 582,842 | |||||||||||||||||
| 620 | General Electric Capital Corporation | 5.300 | % | 2/11/21 | AA | 693,544 | |||||||||||||||||
| 515 | General Electric Capital Corporation | 6.875 | % | 1/10/39 | AA+ | 662,082 | |||||||||||||||||
| 490 | JPMorgan Chase & Company | 3.375 | % | 5/01/23 | A | 456,680 | |||||||||||||||||
| 545 | JPMorgan Chase & Company | 6.400 | % | 5/15/38 | A+ | 650,460 | |||||||||||||||||
| 350 | Nationstar Mortgage LLC Capital Corporation | 7.875 | % | 10/01/20 | B+ | 363,125 | |||||||||||||||||
| 6,110 | Total Diversified Financial Services | 6,788,487 | |||||||||||||||||||||
Diversified Telecommunication Services – 2.7% | |||||||||||||||||||||||
| 450 | AT&T, Inc. | 5.550 | % | 8/15/41 | A | 456,687 | |||||||||||||||||
| 375 | CyrusOne LP Finance | 6.375 | % | 11/15/22 | B+ | 388,125 | |||||||||||||||||
| 400 | Frontier Comminications Corporation | 8.500 | % | 4/15/20 | Ba2 | 448,000 | |||||||||||||||||
| 350 | IntelSat Limited, 144A | 6.750 | % | 6/01/18 | B– | 371,875 | |||||||||||||||||
| 595 | Qwest Corporation | 6.750 | % | 12/01/21 | BBB– | 651,504 | |||||||||||||||||
| 555 | Verizon Communications | 5.150 | % | 9/15/23 | A– | 595,899 | |||||||||||||||||
| 200 | Verizon Communications | 6.550 | % | 9/15/43 | A– | 233,992 | |||||||||||||||||
| 200 | Windstream Corporation | 6.375 | % | 8/01/23 | BB+ | 187,000 | |||||||||||||||||
| 3,125 | Total Diversified Telecommunication Services | 3,333,082 | |||||||||||||||||||||
Electric Utilities – 0.9% | |||||||||||||||||||||||
| 300 | AES Gener SA, 144A | 8.375 | % | 12/18/73 | Ba2 | 312,750 | |||||||||||||||||
| 225 | Intergen NV, 144A | 7.000 | % | 6/30/23 | B+ | 232,875 | |||||||||||||||||
| 600 | Origin Energy Finance Limited, 144A | 3.500 | % | 10/09/18 | BBB | 602,963 | |||||||||||||||||
| 1,125 | Total Electric Utilities | 1,148,588 | |||||||||||||||||||||
Energy Equipment & Services – 2.1% | |||||||||||||||||||||||
| 820 | Ensco PLC | 4.700 | % | 3/15/21 | BBB+ | 867,348 | |||||||||||||||||
| 155 | Gulfmark Offshore Inc. | 6.375 | % | 3/15/22 | BB– | 156,163 | |||||||||||||||||
| 300 | Precision Drilling Corporation | 6.500 | % | 12/15/21 | Ba1 | 319,500 | |||||||||||||||||
| 765 | Transocean Inc. | 3.800 | % | 10/15/22 | BBB– | 725,087 | |||||||||||||||||
| 420 | Weatherford International Limited | 7.000 | % | 3/15/38 | Baa2 | 464,883 | |||||||||||||||||
| 2,460 | Total Energy Equipment & Services | 2,532,981 | |||||||||||||||||||||
Food Products – 1.2% | |||||||||||||||||||||||
| 375 | JBS USA LLC | 7.250 | % | 6/01/21 | BB | 390,938 | |||||||||||||||||
| 250 | Marfrig Holding Europe BV, 144A | 9.875 | % | 7/24/17 | B | 246,875 | |||||||||||||||||
| 300 | Minerva Luxembourg SA, 144A | 7.750 | % | 1/31/23 | BB– | 297,750 | |||||||||||||||||
| 200 | Mriya Agro Holding PLC, 144A | 9.450 | % | 4/19/18 | B– | 171,000 | |||||||||||||||||
| 350 | Pinnacle Foods Finance LLC, 144A | 4.875 | % | 5/01/21 | B– | 330,750 | |||||||||||||||||
| 1,475 | Total Food Products | 1,437,313 | |||||||||||||||||||||
Gas Utilities – 0.3% | |||||||||||||||||||||||
| 375 | AmeriGas Finance LLC | 7.000 | % | 5/20/22 | Ba2 | 406,875 | |||||||||||||||||
Health Care Providers & Services – 1.2% | |||||||||||||||||||||||
| 400 | HCA Holdings Inc. | 7.750 | % | 5/15/21 | B– | 437,000 | |||||||||||||||||
| 375 | Kindred Healthcare Inc., Term Loan | 8.250 | % | 6/01/19 | B– | 399,375 | |||||||||||||||||
| 275 | EUR | Labco SAS, 144A | 8.500 | % | 1/15/18 | BB– | 401,962 | ||||||||||||||||
| 250 | Tenet Healthcare Corporation | 4.375 | % | 10/01/21 | BB | 235,000 | |||||||||||||||||
| Total Health Care Providers & Services | 1,473,337 | ||||||||||||||||||||||
Nuveen Investments
23
JGG Nuveen Global Income Opportunities Fund (continued)
Portfolio of Investments December 31, 2013
| Principal Amount (000) (4) | Description (1) | Coupon | Maturity | Ratings (2) | Value | ||||||||||||||||||
Hotels, Restaurants & Leisure – 0.4% | |||||||||||||||||||||||
$ | 200 | Shearer's Foods LLC, 144A | 9.000 | % | 11/01/19 | B | $ | 211,000 | |||||||||||||||
| 250 | Wynn Macau Limited, 144A | 5.250 | % | 10/15/21 | BB | 250,313 | |||||||||||||||||
| 450 | Total Hotels, Restaurants & Leisure | 461,313 | |||||||||||||||||||||
Independent Power Producers & Energy Traders – 1.2% | |||||||||||||||||||||||
| 244 | Calpine Corporation, 144A | 7.500 | % | 2/15/21 | BB+ | 266,265 | |||||||||||||||||
| 485 | Constellation Energy Group | 5.150 | % | 12/01/20 | BBB+ | 516,089 | |||||||||||||||||
| 300 | Dynegy Holdings, Inc., Term Loan | 5.875 | % | 6/01/23 | B+ | 283,500 | |||||||||||||||||
| 400 | Genon Energy Inc. | 9.500 | % | 10/15/18 | B | 453,000 | |||||||||||||||||
| 1,429 | Total Independent Power Producers & Energy Traders | 1,518,854 | |||||||||||||||||||||
Industrial Conglomerates – 0.3% | |||||||||||||||||||||||
| 2,000 | NOK | Grieg Seafood ASA | 8.660 | % | 12/21/15 | N/R | 344,583 | ||||||||||||||||
Insurance – 2.2% | |||||||||||||||||||||||
| 750 | AFLAC Insurance | 6.450 | % | 8/15/40 | A– | 882,451 | |||||||||||||||||
| 495 | Genworth Holdings Inc. | 4.800 | % | 2/15/24 | BBB– | 488,941 | |||||||||||||||||
| 385 | Liberty Mutual Group Inc., 144A | 4.950 | % | 5/01/22 | Baa2 | 398,095 | |||||||||||||||||
| 415 | Swiss Re Treasury US Corporation, 144A | 4.250 | % | 12/06/42 | AA– | 356,627 | |||||||||||||||||
| 510 | UnumProvident Corporation | 5.625 | % | 9/15/20 | BBB | 559,034 | |||||||||||||||||
| 2,555 | Total Insurance | 2,685,148 | |||||||||||||||||||||
IT Services – 0.7% | |||||||||||||||||||||||
| 565 | Computer Sciences Corporation | 4.450 | % | 9/15/22 | BBB | 544,965 | |||||||||||||||||
| 300 | First Data Corporation | 6.750 | % | 11/01/20 | BB– | 312,000 | |||||||||||||||||
| 865 | Total IT Services | 856,965 | |||||||||||||||||||||
Machinery – 1.4% | |||||||||||||||||||||||
| 1,000 | Eaton Corporation | 4.150 | % | 11/01/42 | A– | 888,336 | |||||||||||||||||
| 300 | EUR | Loxam SAS, 144A | 7.375 | % | 1/24/20 | B | 441,600 | ||||||||||||||||
| 425 | Terex Corporation | 6.000 | % | 5/15/21 | BB– | 439,344 | |||||||||||||||||
| Total Machinery | 1,769,280 | ||||||||||||||||||||||
Media – 4.3% | |||||||||||||||||||||||
| 325 | Cequel Communication Holdings I, 144A | 5.125 | % | 12/15/21 | B– | 304,688 | |||||||||||||||||
| 720 | Comcast Corporation | 6.400 | % | 5/15/38 | A– | 831,419 | |||||||||||||||||
| 620 | DIRECTV Holdings LLC | 3.800 | % | 3/15/22 | BBB | 595,594 | |||||||||||||||||
| 300 | Dish DBS Corporation | 4.250 | % | 4/01/18 | BB– | 306,000 | |||||||||||||||||
| 300 | Gannett Company Inc., 144A | 5.125 | % | 7/15/20 | Ba1 | 303,750 | |||||||||||||||||
| 275 | McGraw-Hill Global Education Holdings, 144A | 9.750 | % | 4/01/21 | BB | 303,875 | |||||||||||||||||
| 400 | Nara Cable Funding Limited, 144A | 8.875 | % | 12/01/18 | BB– | 430,000 | |||||||||||||||||
| 555 | News America Holdings Inc. | 6.650 | % | 11/15/37 | BBB+ | 647,830 | |||||||||||||||||
| 200 | Sinclair Television Group, 144A | 6.375 | % | 11/01/21 | B1 | 207,000 | |||||||||||||||||
| 300 | Sirius XM Radio Inc., 144A | 5.750 | % | 8/01/21 | BB | 303,000 | |||||||||||||||||
| 410 | Time Warner Cable Inc. | 5.875 | % | 11/15/40 | BBB | 354,669 | |||||||||||||||||
| 345 | Time Warner Inc. | 6.100 | % | 7/15/40 | BBB+ | 376,522 | |||||||||||||||||
| 250 | CAD | Videotron Limited, 144A | 5.625 | % | 6/15/25 | BB | 227,112 | ||||||||||||||||
| Total Media | 5,191,459 | ||||||||||||||||||||||
Metals & Mining – 5.2% | |||||||||||||||||||||||
| 975 | Alcoa Inc. | 5.400 | % | 4/15/21 | BBB– | 995,754 | |||||||||||||||||
| 200 | Anglogold Holdings PLC | 6.500 | % | 4/15/40 | Baa3 | 156,000 | |||||||||||||||||
| 715 | ArcelorMittal | 6.750 | % | 2/25/22 | BB+ | 777,563 | |||||||||||||||||
| 720 | Cliffs Natural Resources Inc. | 4.800 | % | 10/01/20 | BBB– | 715,620 | |||||||||||||||||
| 300 | Coeur d'Alene Mines Corporation | 7.875 | % | 2/01/21 | BB– | 304,500 | |||||||||||||||||
| 250 | Eldorado Gold Corporation, 144A | 6.125 | % | 12/15/20 | BB | 240,625 | |||||||||||||||||
| 300 | FMG Resources, 144A | 8.250 | % | 11/01/19 | BB+ | 336,750 | |||||||||||||||||
| 640 | Freeport McMoRan Copper & Gold, Inc. | 3.550 | % | 3/01/22 | BBB | 608,256 | |||||||||||||||||
Nuveen Investments
24
| Principal Amount (000) (4) | Description (1) | Coupon | Maturity | Ratings (2) | Value | ||||||||||||||||||
| Metals & Mining (continued) | |||||||||||||||||||||||
$ | 400 | Inmet Mining Corporation, 144A | 8.750 | % | 6/01/20 | B+ | $ | 434,000 | |||||||||||||||
| 700 | Newmont Mining Corporation | 3.500 | % | 3/15/22 | Baa1 | 595,830 | |||||||||||||||||
| 200 | Severstal OAO Via Steel Capital SA, 144A | 4.450 | % | 3/19/18 | BB+ | 197,750 | |||||||||||||||||
| 320 | Teck Resources Limited | 6.250 | % | 7/15/41 | BBB | 318,538 | |||||||||||||||||
| 250 | TMK OAO Capital SA, 144A | 6.750 | % | 4/03/20 | B+ | 240,625 | |||||||||||||||||
| 285 | Vale Overseas Limited | 6.875 | % | 11/10/39 | A– | 294,811 | |||||||||||||||||
| 200 | Vedanta Resources PLC, 144A | 6.000 | % | 1/31/19 | BB | 193,500 | |||||||||||||||||
| 6,455 | Total Metals & Mining | 6,410,122 | |||||||||||||||||||||
Multiline Retail – 0.7% | |||||||||||||||||||||||
| 865 | Macys Retail Holdings Inc. | 3.875 | % | 1/15/22 | BBB+ | 852,611 | |||||||||||||||||
Oil, Gas & Consumable Fuels – 13.7% | |||||||||||||||||||||||
| 165 | Anadarko Petroleum Corporation | 6.200 | % | 3/15/40 | BBB– | 182,512 | |||||||||||||||||
| 875 | Apache Corporation | 4.250 | % | 1/15/44 | A– | 786,685 | |||||||||||||||||
| 400 | CAD | Athabasca Oil Corporation, 144A | 7.500 | % | 11/19/17 | B | 350,200 | ||||||||||||||||
| 400 | Atlas Pipeline LP Finance, 144A | 5.875 | % | 8/01/23 | B+ | 381,000 | |||||||||||||||||
| 375 | Bill Barrett Corporation | 7.000 | % | 10/15/22 | B1 | 389,063 | |||||||||||||||||
| 250 | Breitburn Energy Partners LP | 7.875 | % | 4/15/22 | B– | 260,000 | |||||||||||||||||
| 250 | Cheniere Energy Inc., 144A | 5.625 | % | 2/01/21 | BB+ | 244,375 | |||||||||||||||||
| 1,000 | CNPC General Capital Limited, 144A | 3.400 | % | 4/16/23 | A+ | 916,083 | |||||||||||||||||
| 200 | Concho Resources Inc. | 5.500 | % | 10/01/22 | BB+ | 206,500 | |||||||||||||||||
| 200 | CONSOL Energy Inc. | 8.250 | % | 4/01/20 | BB | 216,500 | |||||||||||||||||
| 350 | Everest Acquisition LLC Finance, 144A | 7.750 | % | 9/01/22 | B | 392,000 | |||||||||||||||||
| 1,000 | Gazprom OAO Via Gaz Capital SA, 144A | 3.850 | % | 2/06/20 | Baa1 | 965,000 | |||||||||||||||||
| 300 | Gibson Energy, 144A | 6.750 | % | 7/15/21 | BB | 317,250 | |||||||||||||||||
| 300 | Halcon Resources Corporation. ` | 9.750 | % | 7/15/20 | CCC+ | 312,750 | |||||||||||||||||
| 350 | Hercules Offshore LLC, 144A | 7.500 | % | 10/01/21 | B | 371,000 | |||||||||||||||||
| 400 | Key Energy Services Inc. | 6.750 | % | 3/01/21 | BB– | 410,000 | |||||||||||||||||
| 400 | Linn Energy LLC Finance Corporation, 144A | 7.000 | % | 11/01/19 | B+ | 404,000 | |||||||||||||||||
| 1,000 | Lukoil International Finance, 144A | 3.416 | % | 4/24/18 | BBB | 1,008,750 | |||||||||||||||||
| 300 | Martin Mid-Stream Partners LP Finance | 7.250 | % | 2/15/21 | B– | 306,000 | |||||||||||||||||
| 350 | MEG Energy Corportation, 144A | 7.000 | % | 3/31/24 | BB | 354,375 | |||||||||||||||||
| 250 | Murphy Oil USA Inc., 144A | 6.000 | % | 8/15/23 | BB | 251,250 | |||||||||||||||||
| 675 | Nabors Industries Inc. | 4.625 | % | 9/15/21 | BBB | 675,791 | |||||||||||||||||
| 250 | Newfield Exlporation Company | 5.625 | % | 7/01/24 | BBB– | 248,750 | |||||||||||||||||
| 400 | Niska Gas Storage US LLC | 8.875 | % | 3/15/18 | B | 416,000 | |||||||||||||||||
| 330 | Northern Tier Energy LLC | 7.125 | % | 11/15/20 | BB– | 344,850 | |||||||||||||||||
| 300 | Oasis Petroleum Inc., 144A | 6.875 | % | 3/15/22 | B | 318,000 | |||||||||||||||||
| 290 | Offshore Group Investment Limited | 7.500 | % | 11/01/19 | B– | 315,375 | |||||||||||||||||
| 350 | CAD | Paramount Resources Limited, 144A | 7.625 | % | 12/04/19 | B | 334,843 | ||||||||||||||||
| 300 | PBF Holding Company LLC | 8.250 | % | 2/15/20 | BB+ | 325,500 | |||||||||||||||||
| 300 | Pertamina PT, 144A | 4.875 | % | 5/03/22 | Baa3 | 275,250 | |||||||||||||||||
| 400 | PetroBakken Energy Limited, 144A | 8.625 | % | 2/01/20 | B– | 404,000 | |||||||||||||||||
| 210 | Petrobras International Finance Company | 5.375 | % | 1/27/21 | Baa1 | 208,401 | |||||||||||||||||
| 500 | Petrohawk Energy Corporation | 7.250 | % | 8/15/18 | A | 539,000 | |||||||||||||||||
| 250 | Range Resources Corporation | 5.000 | % | 8/15/22 | BB | 245,625 | |||||||||||||||||
| 1,000 | Rowan Companies Inc. | 4.875 | % | 6/01/22 | BBB– | 1,014,752 | |||||||||||||||||
| 350 | Sandridge Energy Inc. | 8.125 | % | 10/15/22 | B2 | 371,000 | |||||||||||||||||
| 250 | Seadrill Limited, 144A | 6.125 | % | 9/15/20 | N/R | 249,375 | |||||||||||||||||
| 2,000 | NOK | Ship Finance International Limited | 6.610 | % | 10/19/17 | N/R | 331,393 | ||||||||||||||||
| 250 | SM Energy Company | 6.625 | % | 2/15/19 | BB– | 265,625 | |||||||||||||||||
| 250 | Targa Resources Inc., 144A | 4.250 | % | 11/15/23 | BB | 223,750 | |||||||||||||||||
| 700 | Thai Oil PCL, 144A | 3.625 | % | 1/23/23 | Baa1 | 622,290 | |||||||||||||||||
| Total Oil, Gas & Consumable Fuels | 16,754,863 | ||||||||||||||||||||||
Nuveen Investments
25
JGG Nuveen Global Income Opportunities Fund (continued)
Portfolio of Investments December 31, 2013
| Principal Amount (000) (4) | Description (1) | Coupon | Maturity | Ratings (2) | Value | ||||||||||||||||||
Paper & Forest Products – 1.4% | |||||||||||||||||||||||
$ | 715 | Domtar Corporation | 4.400 | % | 4/01/22 | BBB– | $ | 684,587 | |||||||||||||||
| 720 | Domtar Corporation | 6.750 | % | 2/15/44 | BBB– | 734,489 | |||||||||||||||||
| 250 | Tembec Industries, Inc. | 11.250 | % | 12/15/18 | B3 | 273,750 | |||||||||||||||||
| 1,685 | Total Paper & Forest Products | 1,692,826 | |||||||||||||||||||||
Personal Products – 0.3% | |||||||||||||||||||||||
| 300 | Albea Beauty Holdings SA, 144A | 8.375 | % | 11/01/19 | B+ | 312,000 | |||||||||||||||||
Pharmaceuticals – 1.2% | |||||||||||||||||||||||
| 400 | AbbVie Inc. | 2.900 | % | 11/06/22 | A | 373,862 | |||||||||||||||||
| 300 | Endo Pharmaceutical Holdings Inc. | 7.000 | % | 12/15/20 | B1 | 321,000 | |||||||||||||||||
| 375 | Par Pharmaceutical Companies Inc. | 7.375 | % | 10/15/20 | B– | 387,656 | |||||||||||||||||
| 335 | VP Escrow Corporation, 144A | 6.375 | % | 10/15/20 | B1 | 353,006 | |||||||||||||||||
| 1,410 | Total Pharmaceuticals | 1,435,524 | |||||||||||||||||||||
Real Estate Investment Trust (REIT) – 2.9% | |||||||||||||||||||||||
| 1,000 | CommomWealth REIT | 5.875 | % | 9/15/20 | BBB– | 1,028,818 | |||||||||||||||||
| 480 | HCP Inc. | 3.750 | % | 2/01/19 | BBB+ | 498,568 | |||||||||||||||||
| 1,000 | Liberty Property Trust | 3.375 | % | 6/15/23 | Baa1 | 910,130 | |||||||||||||||||
| 1,000 | Senior Housing Properties Trust | 6.750 | % | 4/15/20 | BBB– | 1,110,370 | |||||||||||||||||
| 3,480 | Total Real Estate Investment Trust (REIT) | 3,547,886 | |||||||||||||||||||||
Real Estate Management & Development – 1.1% | |||||||||||||||||||||||
| 350 | Country Garden Holding Company, 144A | 11.125 | % | 2/23/18 | Ba2 | 388,500 | |||||||||||||||||
| 250 | Evergrande Real Estate Group Limited, 144A | 8.750 | % | 10/30/18 | BB– | 251,875 | |||||||||||||||||
| 200 | Gemdale International Investment Limited | 7.125 | % | 11/16/17 | BB– | 206,750 | |||||||||||||||||
| 200 | Kaisa Group Holdings Limited, 144A | 8.875 | % | 3/19/18 | B+ | 204,500 | |||||||||||||||||
| 300 | Mattamy Group Corporation, 144A | 6.500 | % | 11/15/20 | BB | 297,000 | |||||||||||||||||
| 1,300 | Total Real Estate Management & Development | 1,348,625 | |||||||||||||||||||||
Road & Rail – 0.2% | |||||||||||||||||||||||
| 265 | Hertz Corporation | 7.375 | % | 1/15/21 | B | 290,838 | |||||||||||||||||
Software – 0.2% | |||||||||||||||||||||||
| 250 | BMC Software Finance Inc., 144A | 8.125 | % | 7/15/21 | B– | 257,500 | |||||||||||||||||
Textiles, Apparel & Luxury Goods – 0.2% | |||||||||||||||||||||||
| 230 | Jones Group | 6.875 | % | 3/15/19 | B+ | 243,800 | |||||||||||||||||
Tobacco – 0.8% | |||||||||||||||||||||||
| 1,030 | Reynolds American Inc. | 3.250 | % | 11/01/22 | Baa2 | 949,367 | |||||||||||||||||
Transportation Infrastructure – 0.8% | |||||||||||||||||||||||
| 954 | Asciano Finance, 144A | 5.000 | % | 4/07/18 | Baa2 | 1,011,456 | |||||||||||||||||
Wireless Telecommunication Services – 2.1% | |||||||||||||||||||||||
| 625 | American Tower Company | 5.050 | % | 9/01/20 | BBB | 660,921 | |||||||||||||||||
| 350 | Digicel Limited, 144A | 7.000 | % | 2/15/20 | B1 | 353,500 | |||||||||||||||||
| 300 | Eileme AB, 144A | 11.625 | % | 1/31/20 | B | 359,619 | |||||||||||||||||
| 200 | Millicom International Cellular SA, 144A | 6.625 | % | 10/15/21 | BB+ | 206,900 | |||||||||||||||||
| 200 | Softbank Corporation, 144A | 4.500 | % | 4/15/20 | BB+ | 195,000 | |||||||||||||||||
| 400 | Sprint Nextel Corporation | 7.000 | % | 3/01/20 | BB+ | 446,000 | |||||||||||||||||
| 300 | Wind Acquisition Finance SA, 144A | 7.250 | % | 2/15/18 | BB | 314,250 | |||||||||||||||||
| 2,375 | Total Wireless Telecommunication Services | 2,536,190 | |||||||||||||||||||||
| Total Corporate Bonds (cost $87,480,889) | 85,484,204 | ||||||||||||||||||||||
Nuveen Investments
26
| Principal Amount (000) (4) | Description (1) | Coupon | Maturity | Ratings (2) | Value | ||||||||||||||||||
$1,000 PAR (OR SIMILAR) INSTITUTIONAL STRUCTURES – 6.2% (4.3% of Total Investments) | |||||||||||||||||||||||
Capital Markets – 0.5% | |||||||||||||||||||||||
| 200 | EUR | Baggot Securities Limited, 144A | 10.240 | % | N/A (3) | N/R | $ | 289,722 | |||||||||||||||
$ | 350 | Dresdner Funding Trust, 144A | 8.151 | % | 6/30/31 | BB | 362,250 | ||||||||||||||||
| Total Capital Markets | 651,972 | ||||||||||||||||||||||
Commercial Banks – 2.1% | |||||||||||||||||||||||
| 690 | EUR | Barclays Bank PLC | 4.750 | % | N/A (3) | BBB– | 806,848 | ||||||||||||||||
| 355 | Rabobank Nederland, 144A | 11.000 | % | N/A (3) | A– | 469,931 | |||||||||||||||||
| 1,400 | Wachovia Capital Trust III | 5.570 | % | N/A (3) | BBB+ | 1,281,000 | |||||||||||||||||
| Total Commercial Banks | 2,557,779 | ||||||||||||||||||||||
Diversified Financial Services – 1.3% | |||||||||||||||||||||||
| 1,100 | General Electric Capital Corporation | 7.125 | % | N/A (3) | AA– | 1,229,250 | |||||||||||||||||
| 325 | JPMorgan Chase & Company | 6.000 | % | N/A (3) | BBB | 310,781 | |||||||||||||||||
| 1,425 | Total Diversified Financial Services | 1,540,031 | |||||||||||||||||||||
Electric Utilities – 0.3% | |||||||||||||||||||||||
| 360 | Electricite de France, 144A | 5.250 | % | N/A (3) | A3 | 358,020 | |||||||||||||||||
Insurance – 1.6% | |||||||||||||||||||||||
| 570 | Catlin Insurance Company Limited | 7.249 | % | N/A (3) | BBB+ | 591,375 | |||||||||||||||||
| 250 | Genworth Financial Inc. | 6.150 | % | 11/15/66 | Ba1 | 221,250 | |||||||||||||||||
| 355 | Lincoln National Corporation | 6.050 | % | 4/20/67 | BBB | 352,338 | |||||||||||||||||
| 305 | Prudential Financial Inc. | 5.200 | % | 3/15/44 | BBB+ | 295,087 | |||||||||||||||||
| 530 | ZFS Finance USA Trust V | 6.500 | % | 5/09/37 | A | 563,125 | |||||||||||||||||
| 2,010 | Total Insurance | 2,023,175 | |||||||||||||||||||||
IT Services – 0.4% | |||||||||||||||||||||||
| 400 | Zayo Escrow Corporation | 8.125 | % | 1/01/20 | B1 | 438,000 | |||||||||||||||||
| Total $1,000 Par (or similar) Institutional Structures (cost $7,602,401) | 7,568,977 | ||||||||||||||||||||||
| Principal Amount (000) (4) | Description (1) | Coupon | Maturity | Ratings (2) | Value | ||||||||||||||||||
SOVEREIGN DEBT – 56.0% (39.0% of Total Investments) | |||||||||||||||||||||||
Bermuda – 0.8% | |||||||||||||||||||||||
$ | 900 | Bermuda Government, 144A | 5.603 | % | 7/20/20 | AA– | $ | 967,500 | |||||||||||||||
Brazil – 0.7% | |||||||||||||||||||||||
| 1,000 | Federative Republic of Brazil | 2.625 | % | 1/05/23 | BBB | 860,000 | |||||||||||||||||
Indonesia – 1.1% | |||||||||||||||||||||||
| 1,300 | Republic of Indonesia, 144A | 5.875 | % | 3/13/20 | Baa3 | 1,374,100 | |||||||||||||||||
Italy – 1.8% | |||||||||||||||||||||||
| 1,450 | EUR | Buoni Poliennali del Tesoro, Italian Treasury Bond | 4.750 | % | 6/01/17 | BBB+ | 2,161,858 | ||||||||||||||||
Malaysia – 2.3% | |||||||||||||||||||||||
| 9,250 | MYR | Republic of Malaysia | 3.172 | % | 7/15/16 | A | 2,812,955 | ||||||||||||||||
Mexico – 16.7% | |||||||||||||||||||||||
| 15,000 | MXN | Mexico Bonos de DeSarrollo | 8.000 | % | 12/17/15 | A | 1,238,809 | ||||||||||||||||
| 85,800 | MXN | Mexico Bonos de DeSarrollo | 4.750 | % | 6/14/18 | A | 6,414,560 | ||||||||||||||||
| 56,300 | MXN | Mexico Bonos de DeSarrollo | 8.000 | % | 12/07/23 | A | 4,796,054 | ||||||||||||||||
| 40,100 | MXN | Mexico Bonos de DeSarrollo | 7.750 | % | 11/13/42 | A | 3,135,294 | ||||||||||||||||
| 60,000 | MXN | United Mexican States | 9.500 | % | 12/18/14 | A | 4,843,243 | ||||||||||||||||
| 257,200 | MXN | Total Mexico | 20,427,960 | ||||||||||||||||||||
Nuveen Investments
27
JGG Nuveen Global Income Opportunities Fund (continued)
Portfolio of Investments December 31, 2013
| Principal Amount (000) (4) | Description (1) | Coupon | Maturity | Ratings (2) | Value | ||||||||||||||||||
Norway – 2.2% | |||||||||||||||||||||||
| 15,000 | NOK | Norwegian Government Bond | 4.500 | % | 5/22/19 | AAA | $ | 2,737,210 | |||||||||||||||
Poland – 1.8% | |||||||||||||||||||||||
| 6,850 | PLN | Republic of Poland | 2.500 | % | 7/25/18 | A | 2,154,052 | ||||||||||||||||
Russia – 1.5% | |||||||||||||||||||||||
$ | 1,800 | Russian Federation, 144A | 4.500 | % | 4/04/22 | Baa1 | 1,822,500 | ||||||||||||||||
South Africa – 7.1% | |||||||||||||||||||||||
| 62,000 | ZAR | Republic of South Africa | 7.250 | % | 1/15/20 | A– | 5,847,918 | ||||||||||||||||
| 1,300 | Republic of South Africa | 5.875 | % | 9/16/25 | Baa1 | 1,352,000 | |||||||||||||||||
| 12,800 | ZAR | Republic of South Africa | 10.500 | % | 12/21/26 | A– | 1,437,849 | ||||||||||||||||
| Total South Africa | 8,637,767 | ||||||||||||||||||||||
South Korea – 5.1% | |||||||||||||||||||||||
| 6,500,000 | KRW | South Korea Stability Bond | 2.840 | % | 12/02/14 | Aa3 | 6,168,444 | ||||||||||||||||
Sweden – 1.2% | |||||||||||||||||||||||
| 8,500 | SEK | Republic of Sweden | 3.500 | % | 6/01/22 | AAA | 1,439,317 | ||||||||||||||||
Turkey – 8.9% | |||||||||||||||||||||||
| 12,300 | TRY | Republic of Turkey, Government Bond | 9.000 | % | 3/08/17 | BBB | 5,562,759 | ||||||||||||||||
| 5,975 | TRY | Republic of Turkey, Government Bond | 10.500 | % | 1/15/20 | BBB | 2,841,531 | ||||||||||||||||
| 3,370 | TRY | Republic of Turkey, Government Bond | 7.100 | % | 3/08/23 | BBB | 1,284,175 | ||||||||||||||||
| 1,000 | Republic of Turkey, Government Bond | 3.250 | % | 3/23/23 | Baa3 | 822,500 | |||||||||||||||||
| 500 | Republic of Turkey, Government Bond | 4.875 | % | 4/16/43 | Baa3 | 382,750 | |||||||||||||||||
| Total Turkey | 10,893,715 | ||||||||||||||||||||||
Ukraine – 0.7% | |||||||||||||||||||||||
| 900 | Republic of Ukraine, 144A | 7.750 | % | 9/23/20 | B– | 830,250 | |||||||||||||||||
United Kingdom – 4.1% | |||||||||||||||||||||||
| 1,500 | GBP | United Kingdom Gilt | 3.750 | % | 9/07/20 | Aa1 | 2,683,473 | ||||||||||||||||
| 1,300 | GBP | United Kingdom, Treasury Bill | 3.750 | % | 9/07/19 | Aa1 | 2,328,656 | ||||||||||||||||
| 2,800 | GBP | Total United Kingdom | 5,012,129 | ||||||||||||||||||||
| Total Sovereign Debt (cost $77,474,317) | 68,299,757 | ||||||||||||||||||||||
| Principal Amount (000) | Description (1) | Coupon | Maturity | Ratings (2) | Value | ||||||||||||||||||
ASSET-BACKED AND MORTGAGE-BACKED SECURITIES – 6.7% (4.6% of Total Investments) | |||||||||||||||||||||||
$ | 790 | Banc of America Alternative Loan Trust, Pass Through Certificates, Series 2006-6 | 6.000 | % | 7/25/46 | Caa3 | $ | 648,809 | |||||||||||||||
| 774 | Bayview Opportunity Master Fund Trust, 2013-8NPL | 3.223 | % | 3/28/33 | N/R | 773,005 | |||||||||||||||||
| 750 | CarFinance Capital Auto Trust, Automobile Receivables-Backed Notes, Series 2013-1, 144A | 3.450 | % | 3/15/19 | Baa3 | 737,273 | |||||||||||||||||
| 628 | Countrywide Asset Backed Certificates, Series 2007-4 A2 | 5.530 | % | 4/25/47 | Caa1 | 574,381 | |||||||||||||||||
| 421 | Countrywide Home Loans Mortgage, Series 2005-27 | 5.500 | % | 12/25/35 | Caa1 | 399,923 | |||||||||||||||||
| 3,850 | Fannie Mae TBA Mortgage Pool, WI/DD | 3.000 | % | TBA | N/R | 3,654,793 | |||||||||||||||||
| 1,000 | Nationstar Mortgage Advance Receivables Trust 2013-T1A | 3.721 | % | 6/20/44 | BB | 998,480 | |||||||||||||||||
| 363 | Wedgewood Real Estate Trust, Mortgage Pool 2013-1A | 5.000 | % | 7/25/43 | N/R | 360,644 | |||||||||||||||||
| 8,576 | Total Asset-Backed and Mortgage-Backed Securities (cost $8,245,091) | 8,147,308 | |||||||||||||||||||||
| Total Long-Term Investments (cost $184,227,510) | 172,748,091 | ||||||||||||||||||||||
Nuveen Investments
28
| Principal Amount (000) | Description (1) | Coupon | Maturity | Value | |||||||||||||||||||
SHORT-TERM INVESTMENTS – 2.0% (1.4% of Total Investments) | |||||||||||||||||||||||
REPURCHASE AGREEMENTS – 2.0% (1.4% of Total Investments) | |||||||||||||||||||||||
$ | 2,402 | Repurchase Agreement with State Street Bank, dated 12/31/13, repurchase price $2,402,340, collateralized by $2,580,000 U.S. Treasury Notes, 1.250%, due 2/29/20, value $2,454,927 | 0.000 | % | 1/02/14 | | $ | 2,402,340 | |||||||||||||||
| Total Short-Term Investments (cost $2,402,340) | 2,402,340 | ||||||||||||||||||||||
| Total Investments (cost $186,629,850) – 143.6% | 175,150,431 | ||||||||||||||||||||||
| Borrowings – (45.9)% (5), (10) | (56,000,000 | ) | |||||||||||||||||||||
| Other Assets Less Liabilities – 2.3% (6) | 2,844,580 | ||||||||||||||||||||||
| Net Assets – 100% | $ | 121,995,011 | |||||||||||||||||||||
Investments in Derivatives as of December 31, 2013
Forward Foreign Currency Exchange Contracts outstanding:
Counterparty | Currency Contracts to Deliver | Amount (Local Currency) | In Exchange For Currency | Amount (Local Currency) | Settlement Date | Unrealized Appreciation (Depreciation) (6) | |||||||||||||||||||||
Bank of America | U.S. Dollar | 3,520,692 | Malaysian Ringgit | 11,400,000 | 2/11/14 | $ | (48,077 | ) | |||||||||||||||||||
Barclays | Australian Dollar | 17,200,000 | U.S. Dollar | 15,593,176 | 2/13/14 | 276,572 | |||||||||||||||||||||
Barclays | Polish Zloty | 6,675,000 | U.S. Dollar | 2,195,240 | 2/20/14 | (7,625 | ) | ||||||||||||||||||||
Barclays | U.S. Dollar | 15,553,960 | Australian Dollar | 17,200,000 | 2/13/14 | (237,356 | ) | ||||||||||||||||||||
Citibank N.A. | Australian Dollar | 3,900,000 | U.S. Dollar | 3,535,662 | 2/13/14 | 62,711 | |||||||||||||||||||||
Citibank N.A. | Euro | 3,496,500 | U.S. Dollar | 4,749,443 | 2/14/14 | (60,606 | ) | ||||||||||||||||||||
Citibank N.A. | Euro | 209,000 | U.S. Dollar | 284,039 | 2/14/14 | (3,477 | ) | ||||||||||||||||||||
Citibank N.A. | Japanese Yen | 878,000,000 | U.S. Dollar | 8,538,564 | 2/14/14 | 199,751 | |||||||||||||||||||||
Citibank N.A. | Mexican Peso | 19,500,000 | U.S. Dollar | 1,505,861 | 1/17/14 | 14,042 | |||||||||||||||||||||
Citibank N.A. | Swedish Krona | 19,700,000 | U.S. Dollar | 2,962,629 | 1/17/14 | (99,516 | ) | ||||||||||||||||||||
Citibank N.A. | U.S. Dollar | 6,008,427 | Mexican Peso | 79,000,000 | 1/17/14 | 35,354 | |||||||||||||||||||||
Citibank N.A. | U.S. Dollar | 1,358,614 | Swedish Krona | 9,000,000 | 1/17/14 | 40,336 | |||||||||||||||||||||
Citibank N.A. | U.S. Dollar | 230,220 | Swedish Krona | 1,480,000 | 1/17/14 | (171 | ) | ||||||||||||||||||||
Citibank N.A. | U.S. Dollar | 13,926,297 | Australian Dollar | 15,400,000 | 2/13/14 | (212,594 | ) | ||||||||||||||||||||
Citibank N.A. | U.S. Dollar | 17,743,570 | Euro | 13,000,000 | 2/14/14 | 140,211 | |||||||||||||||||||||
Citibank N.A. | U.S. Dollar | 855,554 | Euro | 620,000 | 2/14/14 | (2,635 | ) | ||||||||||||||||||||
Credit Suisse | Norwegian Krone | 21,100,000 | U.S. Dollar | 3,425,750 | 2/18/14 | (47,098 | ) | ||||||||||||||||||||
Credit Suisse | Pound Sterling | 3,108,000 | U.S. Dollar | 5,099,078 | 2/10/14 | (46,293 | ) | ||||||||||||||||||||
Credit Suisse | U.S. Dollar | 8,738,225 | Pound Sterling | 5,350,000 | 2/10/14 | 118,834 | |||||||||||||||||||||
Credit Suisse | U.S. Dollar | 18,110 | Norwegian Krone | 110,000 | 2/18/14 | (5 | ) | ||||||||||||||||||||
Credit Suisse | U.S. Dollar | 2,696,872 | Malaysian Ringgit | 8,750,000 | 2/24/14 | (33,898 | ) | ||||||||||||||||||||
Credit Suisse | U.S. Dollar | 7,523,004 | Malaysian Ringgit | 24,200,000 | 3/04/14 | (161,910 | ) | ||||||||||||||||||||
Goldman Sachs | U.S. Dollar | 8,805,321 | Pound Sterling | 5,400,000 | 2/20/14 | 133,858 | |||||||||||||||||||||
JPMorgan | South African Rand | 39,650,000 | U.S. Dollar | 3,805,365 | 2/20/14 | 51,686 | |||||||||||||||||||||
JPMorgan | South Korean Won | 6,600,000,000 | U.S. Dollar | 6,193,694 | 2/04/14 | (74,107 | ) | ||||||||||||||||||||
JPMorgan | Turkish Lira | 4,080,000 | U.S. Dollar | 1,989,785 | 2/11/14 | 106,781 | |||||||||||||||||||||
JPMorgan | Turkish Lira | 8,600,000 | U.S. Dollar | 4,002,420 | 2/11/14 | 33,344 | |||||||||||||||||||||
Morgan Stanley | Brazilian Real | 39,000,000 | U.S. Dollar | 16,546,457 | 1/03/14 | 15,780 | |||||||||||||||||||||
Morgan Stanley | Canadian Dollar | 9,300,000 | U.S. Dollar | 8,681,285 | 1/10/14 | (72,048 | ) | ||||||||||||||||||||
Morgan Stanley | Japanese Yen | 780,000,000 | U.S. Dollar | 7,602,117 | 2/10/14 | 194,214 | |||||||||||||||||||||
Morgan Stanley | U.S. Dollar | 16,815,418 | Brazilian Real | 39,000,000 | 1/03/14 | (284,741 | ) | ||||||||||||||||||||
Morgan Stanley | U.S. Dollar | 16,410,688 | Brazilian Real | 39,000,000 | 2/04/14 | (12,823 | ) | ||||||||||||||||||||
Morgan Stanley | U.S. Dollar | 7,435,596 | Japanese Yen | 780,000,000 | 2/10/14 | (27,694 | ) | ||||||||||||||||||||
Nomura International | U.S. Dollar | 8,773,170 | New Zealand Dollar | 10,500,000 | 1/08/14 | (139,184 | ) | ||||||||||||||||||||
Nuveen Investments
29
JGG Nuveen Global Income Opportunities Fund (continued)
Portfolio of Investments December 31, 2013
Investments in Derivatives as of December 31, 2013 (continued)
Forward Foreign Currency Exchange Contracts outstanding (continued):
Counterparty | Currency Contracts to Deliver | Amount (Local Currency) | In Exchange For Currency | Amount (Local Currency) | Settlement Date | Unrealized Appreciation (Depreciation) (6) | |||||||||||||||||||||
UBS | Canadian Dollar | 4,100,000 | U.S. Dollar | 3,839,670 | 1/22/14 | $ | (18,223 | ) | |||||||||||||||||||
UBS | Canadian Dollar | 5,200,000 | U.S. Dollar | 4,878,918 | 1/22/14 | (14,019 | ) | ||||||||||||||||||||
UBS | U.S. Dollar | 7,640,660 | Canadian Dollar | 8,000,000 | 1/22/14 | (113,063 | ) | ||||||||||||||||||||
UBS | U.S. Dollar | 289,374 | Canadian Dollar | 305,000 | 1/22/14 | (2,384 | ) | ||||||||||||||||||||
$ | (296,073 | ) | |||||||||||||||||||||||||
Credit Default Swaps outstanding:
Clearing House | Referenced Entity | Buy/Sell Protection (7) | Current Credit Spread (8) | Notional Amount | Fixed Rate (Annualized) | Termination Date | Value | Unrealized Appreciation (Depreciation) | |||||||||||||||||||||||||||
Citigroup | Markit CDX NA HY21 Index | Sell | 3.05 | % | $ | 2,000,000 | 5.000 | % | 12/20/18 | $ | 173,833 | $ | 31,957 | ||||||||||||||||||||||
Interest Rate Swaps outstanding:
Counterparty | Notional Amount | Fund Pay/Receive Floating Rate | Floating Rate Index | Fixed Rate (Annualized) | Fixed Rate Payment Frequency | Effective Date (9) | Termination Date | Unrealized Appreciation (Depreciation) (6) | |||||||||||||||||||||||||||
JPMorgan | $ | 22,469,000 | Receive | 1-Month USD-LIBOR-BBA | 1.255 | % | Monthly | 12/01/14 | 12/01/18 | $ | 673,332 | ||||||||||||||||||||||||
JPMorgan | 22,469,000 | Receive | 1-Month USD-LIBOR-BBA | 1.673 | Monthly | 12/01/14 | 12/01/20 | 1,344,644 | |||||||||||||||||||||||||||
JPMorgan | 2,000,000 | Receive | 3-Month USD-LIBOR-BBA | 2.078 | Semi-Annually | 2/19/13 | 2/19/23 | 131,655 | |||||||||||||||||||||||||||
Morgan Stanley | 11,000,000 | Receive | 3-Month USD-LIBOR-BBA | 2.095 | Semi-Annually | 3/19/13 | 3/19/23 | 739,929 | |||||||||||||||||||||||||||
Morgan Stanley | 3,000,000 | Receive | 3-Month USD-LIBOR-BBA | 2.055 | Semi-Annually | 3/22/13 | 3/22/23 | 213,169 | |||||||||||||||||||||||||||
$ | 60,938,000 | $ | 3,102,729 | ||||||||||||||||||||||||||||||||
Futures Contracts outstanding:
Description | Contract Position | Number of Contracts | Contract Expiration | Notional Amount at Value (Local Currency) | Notional Amount at Value (Base Currency)* | Unrealized Appreciation (Depreciation) | |||||||||||||||||||||
5-Year U.S. Treasury Note | Short | (88 | ) | 3/14 | (10,499,500 | ) USD | $ | (10,499,500 | ) | $ | 135,229 | ||||||||||||||||
10-Year U.S. Treasury Note | Short | (20 | ) | 3/14 | (2,460,938 | ) USD | (2,460,938 | ) | 578 | ||||||||||||||||||
Euro-Bund | Long | 22 | 3/14 | 3,061,740 | EUR | 4,212,034 | (22,183 | ) | |||||||||||||||||||
UK Long GILT Bond | Long | 10 | 3/14 | 1,065,600 | GBP | 1,764,580 | (42,028 | ) | |||||||||||||||||||
Ultra Long U.S. Treasury Bond | Short | (26 | ) | 3/14 | (3,542,500 | ) USD | (3,542,500 | ) | 77,394 | ||||||||||||||||||
$ | (10,526,324 | ) | $ | 148,990 | |||||||||||||||||||||||
* The aggregate Notional Amount at Value of long and short positions is $5,976,614 and $(16,502,938), respectively.
Nuveen Investments
30
(1) All percentages shown in the Portfolio of Investments are based on net assets unless otherwise noted.
(2) Ratings (not covered by the report of independent registered public accounting firm): Using the highest of Standard & Poor's Group ("Standard & Poor's"), Moody's Investors Service, Inc. ("Moody's") or Fitch, Inc. ("Fitch") rating. Ratings below BBB by Standard & Poor's, Baa by Moody's or BBB by Fitch are considered to be below investment grade. Holdings designated N/R are not rated by any of these national rating agencies.
(3) Perpetual security. Maturity date is not applicable.
(4) Principal Amount (000) denominated in U.S. Dollars, unless otherwise noted.
(5) Borrowings as a percentage of Total Investments is 32.0%.
(6) Other Assets Less Liabilities includes the Unrealized Appreciation (Depreciation) of certain derivative instruments as listed within Investments in Derivatives as of the end of the reporting period.
(7) The Fund entered into the credit default swap to gain investment exposure to the referenced entity. Selling protection has a similar credit risk position to owning that referenced entity. Buying protection has a similar credit risk position to selling the referenced entity short.
(8) The credit spread generally serves as an indication of the current status of the payment/performance risk and therefore the likelihood of default of the credit derivative. The credit spread also reflects the cost of buying/selling protection and may include upfront payments required to be made to enter into a credit default swap contract. Higher credit spreads are indicative of a higher likelihood of performance by the seller of protection.
(9) Effective date represents the date on which both the Fund and counterparty commence interest payment accruals on each contract.
(10) The Fund segregates 100% of its eligible investments in the Portfolio of Investments as collateral for Borrowings.
TBA To be announced. Maturity date not known prior to settlement of this transaction.
WI/DD Investment, or portion of investment, purchased on a when-issued or delayed delivery basis.
144A Investment is exempt from registration under Rule 144A of the Securities Act of 1933, as amended. These investments may only be resold in transactions exempt from registration, which are normally those transactions with qualified institutional buyers.
CAD Canadian Dollar
EUR Euro
GBP British Pound Sterling
KRW South Korean Won
MXN Mexican Peso
MYR Malaysian Ringgit
NOK Norwegian Krone
PLN Polish Zloty
SEK Swedish Krona
TRY Turkish Lira
USD United States Dollar
ZAR South African Rand
USD-LIBOR-BBA United States Dollar-London Inter-Bank Offered Rate
See accompanying notes to financial statements.
Nuveen Investments
31
JGT
Nuveen Diversified Currency Opportunities Fund
Portfolio of Investments December 31, 2013
Shares | Description (1) | Coupon | Ratings (2) | Value | |||||||||||||||||||
LONG-TERM INVESTMENTS – 90.1% (91.5% of Total Investments) | |||||||||||||||||||||||
$25 PAR (OR SIMILAR) RETAIL STRUCTURES – 0.2% (0.2% of Total Investments) | |||||||||||||||||||||||
Commercial Banks – 0.2% | |||||||||||||||||||||||
50,000 | Morgan Stanley7.125% BB+ | $ | 1,307,000 | ||||||||||||||||||||
| Total $25 Par (or similar) Retail Structures (cost $1,250,000) | 1,307,000 | ||||||||||||||||||||||
| Principal Amount (000) (3) | Description (1) | Coupon | Maturity | Ratings (2) | Value | ||||||||||||||||||
CORPORATE BONDS – 15.6% (15.8% of Total Investments) | |||||||||||||||||||||||
Auto Components – 0.3% | |||||||||||||||||||||||
$ | 750 | Chassix Inc., 144A | 9.250 | % | 8/01/18 | B– | $ | 798,750 | |||||||||||||||
1,000 | Pittsburgh Glass Works LLC, 144A | 8.000 | % | 11/15/18 | B | 1,052,500 | |||||||||||||||||
1,750 | Total Auto Components | 1,851,250 | |||||||||||||||||||||
Automobiles – 0.6% | |||||||||||||||||||||||
| 1,250 | Jaguar Land Rover PLC, 144A | 4.125 | % | 12/15/18 | BB | 1,257,813 | |||||||||||||||||
| 1,580 | Jaguar Land Rover PLC, 144A | 8.125 | % | 5/15/21 | BB | 1,797,250 | |||||||||||||||||
2,830 | Total Automobiles | 3,055,063 | |||||||||||||||||||||
Building Products – 0.1% | |||||||||||||||||||||||
750 | U.S. Concrete Inc., 144A | 8.500 | % | 12/01/18 | B | 766,875 | |||||||||||||||||
Chemicals – 0.4% | |||||||||||||||||||||||
1,000 | Ineos Group Holdings SA, 144A | 6.125 | % | 8/15/18 | B– | 1,005,000 | |||||||||||||||||
1,000 | TPC Group Inc., 144A | 8.750 | % | 12/15/20 | B | 1,062,500 | |||||||||||||||||
2,000 | Total Chemicals | 2,067,500 | |||||||||||||||||||||
Commercial Banks – 0.9% | |||||||||||||||||||||||
3,000 | Export Import Bank of Korea | 1.250 | % | 11/20/15 | Aa3 | 3,009,246 | |||||||||||||||||
2,000 | VTB Capital SA, 144A | 6.875 | % | 5/29/18 | BBB | 2,182,400 | |||||||||||||||||
5,000 | Total Commercial Banks | 5,191,646 | |||||||||||||||||||||
Consumer Finance – 0.5% | |||||||||||||||||||||||
3,000 | Ford Motor Credit Company | 1.500 | % | 1/17/17 | BBB– | 2,998,656 | |||||||||||||||||
Containers & Packaging – 0.4% | |||||||||||||||||||||||
1,000 | Beverage Packaging Holdings Luxembourg II SA, 144A | 6.000 | % | 6/15/17 | CCC+ | 1,012,500 | |||||||||||||||||
1,000 | Reynolds Group | 7.875 | % | 8/15/19 | B+ | 1,105,000 | |||||||||||||||||
2,000 | Total Containers & Packaging | 2,117,500 | |||||||||||||||||||||
Diversified Telecommunication Services – 0.3% | |||||||||||||||||||||||
1,500 | Level 3 Financing Inc. | 8.625 | % | 7/15/20 | BB– | 1,680,000 | |||||||||||||||||
Electric Utilities – 0.6% | |||||||||||||||||||||||
3,000 | Power Sector Asset and Liabilities Management Corporation, 144A | 6.875 | % | 11/02/16 | BBB– | 3,375,000 | |||||||||||||||||
Food Products – 0.2% | |||||||||||||||||||||||
1,250 | Smithfield Foods Inc. | 5.250 | % | 8/01/18 | BB– | 1,309,375 | |||||||||||||||||
Nuveen Investments
32
| Principal Amount (000) (3) | Description (1) | Coupon | Maturity | Ratings (2) | Value | ||||||||||||||||||
Health Care Providers & Services – 0.1% | |||||||||||||||||||||||
$ | 400 | Iasis Healthcare Capital Corporation | 8.375 | % | 5/15/19 | CCC+ | $ | 424,000 | |||||||||||||||
Independent Power Producers & Energy Traders – 0.3% | |||||||||||||||||||||||
| 1,500 | GenOn Energy Inc. | 7.875 | % | 6/15/17 | B | 1,650,000 | |||||||||||||||||
Machinery – 0.2% | |||||||||||||||||||||||
| 1,250 | Trinseo Materials Operating, 144A | 8.750 | % | 2/01/19 | B | 1,290,625 | |||||||||||||||||
Media – 0.5% | |||||||||||||||||||||||
| 790 | Sirius XM Radio Inc., 144A | 5.750 | % | 8/01/21 | BB | 797,900 | |||||||||||||||||
| 1,500 | WideOpenWest Finance Capital Corporation | 10.250 | % | 7/15/19 | CCC+ | 1,665,000 | |||||||||||||||||
| 2,290 | Total Media | 2,462,900 | |||||||||||||||||||||
Metals & Mining – 1.4% | |||||||||||||||||||||||
| 2,000 | ArcelorMittal | 4.250 | % | 3/01/16 | BB+ | 2,087,500 | |||||||||||||||||
| 2,500 | Cliffs Natural Resources Inc. | 3.950 | % | 1/15/18 | BBB– | 2,524,487 | |||||||||||||||||
| 1,000 | Steel Capital SA, 144A | 4.450 | % | 3/19/18 | BB+ | 988,750 | |||||||||||||||||
| 2,000 | Xstrata Finance Canada Limited, 144A | 5.800 | % | 11/15/16 | BBB | 2,203,532 | |||||||||||||||||
| 7,500 | Total Metals & Mining | 7,804,269 | |||||||||||||||||||||
Oil, Gas & Consumable Fuels – 6.8% | |||||||||||||||||||||||
| 1,000 | CAD | Athabasca Oil Corporation, 144A | 7.500 | % | 11/19/17 | B | 875,500 | ||||||||||||||||
| 3,000 | CNOOC Finance 2013 Limited | 1.125 | % | 5/09/16 | AA– | 2,988,948 | |||||||||||||||||
| 5,000 | CNPC General Capital Limited, 144A | 1.450 | % | 4/16/16 | A+ | 4,952,680 | |||||||||||||||||
| 1,500 | CONSOL Energy Inc. | 8.250 | % | 4/01/20 | BB | 1,623,750 | |||||||||||||||||
| 3,000 | Gaz Capital SA, 144A | 5.092 | % | 11/29/15 | Baa1 | 3,190,500 | |||||||||||||||||
| 654 | Kodiak Oil and Gas Corporation | 8.125 | % | 12/01/19 | B | 725,940 | |||||||||||||||||
| 3,000 | Korea National Oil Corporation, 144A | 5.375 | % | 7/30/14 | A+ | 3,074,796 | |||||||||||||||||
| 3,000 | Lukoil International Finance BV, 144A | 3.416 | % | 4/24/18 | BBB | 3,026,250 | |||||||||||||||||
| 800 | CAD | Paramount Resources Limited, 144A | 7.625 | % | 12/04/19 | B | 765,357 | ||||||||||||||||
| 2,000 | Petrobras International Finance Company | 3.875 | % | 1/27/16 | Baa1 | 2,058,924 | |||||||||||||||||
| 2,000 | Petrohawk Energy Corporation | 7.250 | % | 8/15/18 | A | 2,156,000 | |||||||||||||||||
| 5,000 | Petroleos Mexicanos | 4.875 | % | 3/15/15 | BBB+ | 5,235,000 | |||||||||||||||||
| 2,000 | Rosneft Oil Corporation, 144A | 3.149 | % | 3/06/17 | Baa1 | 2,025,000 | |||||||||||||||||
| 3,000 | Sinopec Capital 2013 Limited, 144A | 1.250 | % | 4/24/16 | Aa3 | 2,988,183 | |||||||||||||||||
| 2,000 | Transocean Inc. | 2.500 | % | 10/15/17 | BBB– | 2,021,188 | |||||||||||||||||
| Total Oil, Gas & Consumable Fuels | 37,708,016 | ||||||||||||||||||||||
Personal Products – 0.2% | |||||||||||||||||||||||
| 1,000 | Albea Beauty Holdings SA, 144A | 8.375 | % | 11/01/19 | B+ | 1,040,000 | |||||||||||||||||
Real Estate Management & Development – 0.4% | |||||||||||||||||||||||
| 1,000 | Country Garden Holding Company, 144A | 11.125 | % | 2/23/18 | Ba2 | 1,110,000 | |||||||||||||||||
| 1,000 | Rialto Holdings LLC | 7.000 | % | 12/01/18 | B | 1,010,000 | |||||||||||||||||
| 2,000 | Total Real Estate Management & Development | 2,120,000 | |||||||||||||||||||||
Specialty Retail – 0.2% | |||||||||||||||||||||||
| 1,000 | Toys"R"Us Property Company II LLC | 8.500 | % | 12/01/17 | Ba2 | 1,030,000 | |||||||||||||||||
Transportation Infrastructure – 0.2% | |||||||||||||||||||||||
| 800 | Aviation Capital Group Corporation, 144A | 3.875 | % | 9/27/16 | BBB– | 826,310 | |||||||||||||||||
Wireless Telecommunication Services – 1.0% | |||||||||||||||||||||||
| 4,000 | Telefonica Emisiones SAU | 3.992 | % | 2/16/16 | BBB+ | 4,201,592 | |||||||||||||||||
| 1,500 | Wind Acquisition Finance SA, 144A | 7.250 | % | 2/15/18 | BB | 1,571,250 | |||||||||||||||||
| 5,500 | Total Wireless Telecommunication Services | 5,772,842 | |||||||||||||||||||||
| Total Corporate Bonds (cost $86,649,819) | 86,541,827 | ||||||||||||||||||||||
Nuveen Investments
33
JGT Nuveen Diversified Currency Opportunities Fund (continued)
Portfolio of Investments December 31, 2013
| Principal Amount (000) (3) | Description (1) | Coupon | Maturity | Ratings (2) | Value | ||||||||||||||||||
SOVEREIGN DEBT – 68.8% (70.0% of Total Investments) | |||||||||||||||||||||||
Argentina – 1.0% | |||||||||||||||||||||||
$ | 5,500 | Republic of Argentina | 7.000 | % | 10/03/15 | B– | $ | 5,472,500 | |||||||||||||||
Brazil – 14.3% | |||||||||||||||||||||||
| 1,000 | Banco Nacional de Desenvolvimento Economico e Social, 144A | 3.375 | % | 9/26/16 | BBB | 1,010,000 | |||||||||||||||||
| 67,100 | BRL | Letra De Tesouro Nacional de Brazil | 0.000 | % | 7/01/14 | A– | 27,101,347 | ||||||||||||||||
| 61,250 | BRL | Letra De Tesouro Nacional de Brazil | 0.000 | % | 1/01/15 | A– | 23,439,026 | ||||||||||||||||
| 74,500 | BRL | Letra De Tesouro Nacional de Brazil | 0.000 | % | 4/01/15 | A– | 27,726,568 | ||||||||||||||||
| Total Brazil | 79,276,941 | ||||||||||||||||||||||
Canada – 7.3% | |||||||||||||||||||||||
| 16,000 | CAD | Province of Ontario | 3.250 | % | 9/08/14 | Aa2 | 15,285,291 | ||||||||||||||||
| 10,000 | CAD | Province of Ontario | 3.150 | % | 9/08/15 | Aa2 | 9,713,815 | ||||||||||||||||
| 16,000 | CAD | Quebec Province | 5.500 | % | 12/01/14 | Aa2 | 15,658,687 | ||||||||||||||||
| 42,000 | CAD | Total Canada | 40,657,793 | ||||||||||||||||||||
Colombia – 2.1% | |||||||||||||||||||||||
| 5,500 | Republic of Colombia | 8.250 | % | 12/22/14 | BBB | 5,857,500 | |||||||||||||||||
| 9,948,000 | COP | Republic of Colombia | 12.000 | % | 10/22/15 | BBB | 5,809,013 | ||||||||||||||||
| Total Colombia | 11,666,513 | ||||||||||||||||||||||
Hungary – 0.3% | |||||||||||||||||||||||
| 1,500 | Republic of Hungary, Government Bond | 4.125 | % | 2/19/18 | Ba1 | 1,516,500 | |||||||||||||||||
Indonesia – 1.9% | |||||||||||||||||||||||
| 8,000 | Republic of Indonesia, 144A | 7.250 | % | 4/20/15 | Baa3 | 8,556,000 | |||||||||||||||||
| 2,000 | Republic of Indonesia, 144A | 7.500 | % | 1/15/16 | Baa3 | 2,200,000 | |||||||||||||||||
| 10,000 | Total Indonesia | 10,756,000 | |||||||||||||||||||||
Ireland – 1.5% | |||||||||||||||||||||||
| 2,000 | EUR | Irish Republic Treasury Bond | 4.600 | % | 4/18/16 | BBB+ | 2,980,067 | ||||||||||||||||
| 3,400 | EUR | Irish Republic Treasury Bond | 5.500 | % | 10/18/17 | BBB+ | 5,315,962 | ||||||||||||||||
| 5,400 | EUR | Total Ireland | 8,296,029 | ||||||||||||||||||||
Italy – 5.2% | |||||||||||||||||||||||
| 5,000 | EUR | Buoni Poliennali del Tesoro, Italian Treasury Bond | 3.000 | % | 4/15/15 | BBB+ | 7,050,459 | ||||||||||||||||
| 5,000 | EUR | Buoni Poliennali del Tesoro, Italian Treasury Bond | 4.750 | % | 9/15/16 | BBB+ | 7,423,253 | ||||||||||||||||
| 10,000 | EUR | Buoni Poliennali del Tesoro, Italian Treasury Bond | 4.000 | % | 2/01/17 | BBB+ | 14,595,771 | ||||||||||||||||
| 20,000 | EUR | Total Italy | 29,069,483 | ||||||||||||||||||||
Malaysia – 4.7% | |||||||||||||||||||||||
| 85,000 | MYR | Republic of Malaysia | 3.197 | % | 10/15/15 | A | 25,898,025 | ||||||||||||||||
Mexico – 10.6% | |||||||||||||||||||||||
| 166,000 | MXN | Mexico Bonos de DeSarrollo | 8.000 | % | 12/17/15 | A | 13,709,491 | ||||||||||||||||
| 245,500 | MXN | Mexico Bonos de DeSarrollo | 7.250 | % | 12/15/16 | A | 20,236,089 | ||||||||||||||||
| 120,000 | MXN | Mexico Bonos de DeSarrollo | 4.750 | % | 6/14/18 | A | 8,971,412 | ||||||||||||||||
| 200,500 | MXN | United Mexican States | 9.500 | % | 12/18/14 | A | 16,184,503 | ||||||||||||||||
| 732,000 | MXN | Total Mexico | 59,101,495 | ||||||||||||||||||||
Norway – 1.9% | |||||||||||||||||||||||
| 60,000 | NOK | Norwegian Government Bond | 5.000 | % | 5/15/15 | AAA | 10,363,313 | ||||||||||||||||
Nuveen Investments
34
| Principal Amount (000) (3) | Description (1) | Coupon | Maturity | Ratings (2) | Value | ||||||||||||||||||
Peru – 2.4% | |||||||||||||||||||||||
| 25,000 | PEN | Republic of Peru Treasury Bond | 8.600 | % | 8/12/17 | A– | $ | 10,264,776 | |||||||||||||||
$ | 1,146 | Republic of Peru | 9.875 | % | 2/06/15 | BBB+ | 1,253,724 | ||||||||||||||||
| 1,500 | Republic of Peru | 8.375 | % | 5/03/16 | BBB+ | 1,734,750 | |||||||||||||||||
| Total Peru | 13,253,250 | ||||||||||||||||||||||
Poland – 1.0% | |||||||||||||||||||||||
| 5,500 | Republic of Poland | 3.875 | % | 7/16/15 | A2 | 5,754,650 | |||||||||||||||||
Portugal – 0.2% | |||||||||||||||||||||||
| 1,000 | EUR | Portugal Obrigacoes do Tesouro | 5.650 | % | 2/15/24 | BB+ | 1,320,318 | ||||||||||||||||
Russia – 1.5% | |||||||||||||||||||||||
| 8,000 | Russian Federation, 144A | 3.625 | % | 4/29/15 | Baa1 | 8,260,000 | |||||||||||||||||
South Africa – 4.6% | |||||||||||||||||||||||
| 5,500 | Republic of South Africa | 6.500 | % | 6/02/14 | Baa1 | 5,623,750 | |||||||||||||||||
| 32,000 | ZAR | Republic of South Africa | 13.500 | % | 9/15/15 | A– | 3,406,792 | ||||||||||||||||
| 55,000 | ZAR | Republic of South Africa | 8.250 | % | 9/15/17 | Baa1 | 5,467,115 | ||||||||||||||||
| 115,000 | ZAR | Republic of South Africa | 8.000 | % | 12/21/18 | A– | 11,336,818 | ||||||||||||||||
| Total South Africa | 25,834,475 | ||||||||||||||||||||||
Spain – 2.6% | |||||||||||||||||||||||
| 5,000 | EUR | Kingdom of Spain, Bonos y Obligado Del Esatado | 3.300 | % | 10/31/14 | BBB | 6,977,066 | ||||||||||||||||
| 5,000 | EUR | Kingdom of Spain, Bonos y Obligado Del Esatado | 4.250 | % | 10/31/16 | BBB | 7,313,218 | ||||||||||||||||
| 10,000 | EUR | Total Spain | 14,290,284 | ||||||||||||||||||||
Trinidad and Tobago – 0.1% | |||||||||||||||||||||||
| 800 | Republic of Trinidad and Tobago | 4.375 | % | 1/16/24 | A | 821,200 | |||||||||||||||||
Turkey – 4.5% | |||||||||||||||||||||||
| 12,950 | TRY | Republic of Turkey, Government Bond | 0.000 | % | 4/09/14 | BBB | 5,893,666 | ||||||||||||||||
| 5,900 | TRY | Republic of Turkey, Government Bond | 7.500 | % | 9/24/14 | BBB | 2,705,242 | ||||||||||||||||
| 36,800 | TRY | Republic of Turkey, Government Bond | 6.500 | % | 1/07/15 | Baa1 | 16,590,806 | ||||||||||||||||
| 55,650 | TRY | Total Turkey | 25,189,714 | ||||||||||||||||||||
Ukraine – 0.8% | |||||||||||||||||||||||
| 4,500 | Republic of Ukraine, 144A | 6.875 | % | 9/23/15 | B– | 4,383,000 | |||||||||||||||||
Vietnam – 0.3% | |||||||||||||||||||||||
| 1,500 | Socialist Republic of Vietnam, 144A | 6.875 | % | 1/15/16 | BB– | 1,601,250 | |||||||||||||||||
| Total Sovereign Debt (cost $407,968,681) | 382,782,733 | ||||||||||||||||||||||
| Principal Amount (000) | Description (1) | Coupon | Maturity | Ratings (2) | Value | ||||||||||||||||||
ASSET-BACKED AND MORTGAGE-BACKED SECURITIES – 5.5% (5.5% of Total Investments) | |||||||||||||||||||||||
$ | 2,168 | Bayview Opportunity Master Fund Trust, 2013-8NPL | 3.228 | % | 3/28/33 | N/R | $ | 2,164,412 | |||||||||||||||
| 3,456 | Countrywide Asset Backed Certificates, Series 2007-4 A2 | 5.530 | % | 4/25/47 | Caa1 | 3,163,198 | |||||||||||||||||
| 3,425 | Fannie Mae Mortgage Pool | 3.000 | % | 6/01/43 | N/R | 3,256,157 | |||||||||||||||||
| 6,000 | Goldman Sachs Mortgage Securities Corporation II, Commercial Mortgage Pass-Through Certificates, Series 2007-GG10 | 5.806 | % | 8/10/45 | A | 6,588,408 | |||||||||||||||||
| 2,675 | Monty Parent Issuer LLC 2013-LTR1 | 3.470 | % | 10/20/15 | CCC | 2,672,833 | |||||||||||||||||
| 1,000 | Nationstar Mortgage Advance Receivables Trust 2013-T1 | 3.721 | % | 6/20/44 | BB | 998,480 | |||||||||||||||||
| 1,747 | Oaktree Real Estate Investments, Comnmerial Mortgage Asset Backed Securities ORES NPL LLC 2013-LV2I, 144A | 3.081 | % | 9/25/25 | N/R | 1,747,408 | |||||||||||||||||
| 1,354 | Stanwich Mortgage Loan Trust, Series 2012-NPL5 | 2.981 | % | 10/18/42 | N/R | 1,353,230 | |||||||||||||||||
| 2,912 | Vericrest Opportunity Loan Transferee, Private CMO 2013 NPL1 | 4.250 | % | 8/25/58 | N/R | 2,951,112 | |||||||||||||||||
| 2,921 | Walter Investment Management Company Capital Trust, Series 2012-AA | 4.549 | % | 10/16/50 | BBB | 2,960,874 | |||||||||||||||||
Nuveen Investments
35
JGT Nuveen Diversified Currency Opportunities Fund (continued)
Portfolio of Investments December 31, 2013
| Principal Amount (000) | Description (1) | Coupon | Maturity | Ratings (2) | Value | ||||||||||||||||||
| ASSET-BACKED AND MORTGAGE-BACKED SECURITIES (continued) | |||||||||||||||||||||||
$ | 2,461 | Wedgewood Real Estate Trust, Mortgage Pool 2013-1A | 5.000 | % | 7/25/43 | N/R | $ | 2,444,368 | |||||||||||||||
| 30,119 | Total Asset-Backed and Mortgage-Backed Securities (cost $30,912,680) | 30,300,480 | |||||||||||||||||||||
| Total Long-Term Investments (cost $526,781,180) | 500,932,040 | ||||||||||||||||||||||
| Principal Amount (000) | Description (1) | Coupon | Maturity | Ratings (2) | Value | ||||||||||||||||||
SHORT-TERM INVESTMENTS – 8.4% (8.5% of Total Investments) | |||||||||||||||||||||||
SOVEREIGN DEBT – 0.5% (0.5% of Total Investments) | |||||||||||||||||||||||
Philippines – 0.5% | |||||||||||||||||||||||
$ | 3,000 | Republic of the Philippines | 8.250 | % | 1/15/14 | N/R | $ | 3,007,500 | |||||||||||||||
U.S. GOVERNMENT AND AGENCY OBLIGATIONS – 7.2% (7.3% of Total Investments) | |||||||||||||||||||||||
| 25,000 | Freddie Mac Notes | 0.145 | % | 3/27/14 | AAA | 25,000,875 | |||||||||||||||||
| 15,000 | Fannie Mae Notes | 1.250 | % | 3/27/14 | AAA | 15,025,650 | |||||||||||||||||
| 40,000 | Total U.S. Government and Agency Obligations | 40,026,525 | |||||||||||||||||||||
REPURCHASE AGREEMENTS – 0.7% (0.7% of Total Investments) | |||||||||||||||||||||||
| 3,578 | Repurchase Agreement with State Street Bank, dated 12/31/13, repurchase price $3,577,777, collateralized by $3,840,000 U.S. Treasury Notes, 1.250%, due 2/29/20, value $3,653,844 | 0.000 | % | 1/02/14 | N/A | $ | 3,577,777 | ||||||||||||||||
| Total Short-Term Investments (cost $46,609,635) | 46,611,802 | ||||||||||||||||||||||
| Total Investments (cost $573,390,815) – 98.5% | 547,543,842 | ||||||||||||||||||||||
| Other Assets Less Liabilities – 1.5% (4) | 8,530,725 | ||||||||||||||||||||||
| Net Assets – 100% | $ | 556,074,567 | |||||||||||||||||||||
Investments in Derivatives as of December 31, 2013
Forward Foreign Currency Exchange Contracts outstanding:
Counterparty | Currency Contracts to Deliver | Amount (Local Currency) | In Exchange For Currency | Amount (Local Currency) | Settlement Date | Unrealized Appreciation (Depreciation) (4) | |||||||||||||||||||||
Bank of America | U.S. Dollar | 18,066,708 | Malaysian Ringgit | 58,500,000 | 2/11/14 | $ | (246,709 | ) | |||||||||||||||||||
Barclays | Australian Dollar | 73,000,000 | U.S. Dollar | 66,180,340 | 2/13/14 | 1,173,825 | |||||||||||||||||||||
Barclays | U.S. Dollar | 40,748,566 | Mexican Peso | 540,000,000 | 1/17/14 | 563,355 | |||||||||||||||||||||
Barclays | U.S. Dollar | 5,649,505 | Mexican Peso | 75,000,000 | 1/17/14 | 88,262 | |||||||||||||||||||||
Barclays | U.S. Dollar | 3,767,695 | Mexican Peso | 49,000,000 | 1/17/14 | (19,020 | ) | ||||||||||||||||||||
Barclays | U.S. Dollar | 470,928 | Mexican Peso | 6,200,000 | 1/17/14 | 3,394 | |||||||||||||||||||||
Barclays | U.S. Dollar | 66,013,900 | Australian Dollar | 73,000,000 | 2/13/14 | (1,007,385 | ) | ||||||||||||||||||||
Barclays | U.S. Dollar | 6,001,765 | Peruvian Nouveau Sol | 17,000,000 | 3/03/14 | 19,771 | |||||||||||||||||||||
BNP Paribas | U.S. Dollar | 20,607,750 | New Zealand Dollar | 25,000,000 | 1/17/14 | (63,667 | ) | ||||||||||||||||||||
Citibank N.A. | Euro | 35,150,000 | U.S. Dollar | 47,745,721 | 2/14/14 | (609,270 | ) | ||||||||||||||||||||
Citibank N.A. | Japanese Yen | 2,900,000,000 | U.S. Dollar | 28,202,545 | 2/14/14 | 659,771 | |||||||||||||||||||||
Citibank N.A. | U.S. Dollar | 32,818,180 | Mexican Peso | 431,500,000 | 1/17/14 | 193,105 | |||||||||||||||||||||
Citibank N.A. | U.S. Dollar | 62,442,260 | Australian Dollar | 69,050,000 | 2/13/14 | (953,221 | ) | ||||||||||||||||||||
Citibank N.A. | U.S. Dollar | 55,960,490 | Euro | 41,000,000 | 2/14/14 | 442,203 | |||||||||||||||||||||
Credit Suisse | Norwegian Krone | 63,604,000 | U.S. Dollar | 10,326,607 | 2/18/14 | (141,973 | ) | ||||||||||||||||||||
Credit Suisse | Turkish Lira | 23,000,000 | U.S. Dollar | 10,756,711 | 1/17/14 | 86,503 | |||||||||||||||||||||
Credit Suisse | U.S. Dollar | 22,287,902 | Turkish Lira | 46,000,000 | 1/17/14 | (947,486 | ) | ||||||||||||||||||||
Credit Suisse | U.S. Dollar | 2,012,651 | Turkish Lira | 4,200,000 | 1/17/14 | (64,178 | ) | ||||||||||||||||||||
Credit Suisse | U.S. Dollar | 28,174,649 | Pound Sterling | 17,250,000 | 2/10/14 | 383,155 | |||||||||||||||||||||
Nuveen Investments
36
Investments in Derivatives as of December 31, 2013 (continued)
Forward Foreign Currency Exchange Contracts outstanding (continued):
Counterparty | Currency Contracts to Deliver | Amount (Local Currency) | In Exchange For Currency | Amount (Local Currency) | Settlement Date | Unrealized Appreciation (Depreciation) (4) | |||||||||||||||||||||
Credit Suisse | U.S. Dollar | 29,588,534 | Malaysian Ringgit | 96,000,000 | 2/24/14 | $ | (371,905 | ) | |||||||||||||||||||
Credit Suisse | U.S. Dollar | 40,723,701 | Malaysian Ringgit | 131,000,000 | 3/04/14 | (876,457 | ) | ||||||||||||||||||||
Goldman Sachs | Japanese Yen | 3,000,000,000 | U.S. Dollar | 30,021,015 | 1/21/14 | 1,531,810 | |||||||||||||||||||||
Goldman Sachs | South Korean Won | 19,000,000,000 | U.S. Dollar | 17,994,128 | 2/18/14 | (49,327 | ) | ||||||||||||||||||||
Goldman Sachs | U.S. Dollar | 28,840,330 | South African Rand | 300,000,000 | 1/17/14 | (298,802 | ) | ||||||||||||||||||||
Goldman Sachs | U.S. Dollar | 27,539,750 | South African Rand | 287,000,000 | 1/17/14 | (235,022 | ) | ||||||||||||||||||||
Goldman Sachs | U.S. Dollar | 133,459 | South African Rand | 1,400,000 | 1/17/14 | (265 | ) | ||||||||||||||||||||
Goldman Sachs | U.S. Dollar | 40,765,375 | Pound Sterling | 25,000,000 | 2/20/14 | 619,712 | |||||||||||||||||||||
JPMorgan | Euro | 24,000,000 | U.S. Dollar | 32,602,824 | 2/14/14 | (413,387 | ) | ||||||||||||||||||||
JPMorgan | South Korean Won | 17,200,000,000 | U.S. Dollar | 16,141,141 | 2/04/14 | (193,128 | ) | ||||||||||||||||||||
JPMorgan | U.S. Dollar | 19,979,040 | New Zealand Dollar | 24,000,000 | 1/31/14 | (276,140 | ) | ||||||||||||||||||||
Morgan Stanley | Brazilian Real | 61,000,000 | U.S. Dollar | 25,880,356 | 1/03/14 | 24,682 | |||||||||||||||||||||
Morgan Stanley | Canadian Dollar | 30,000,000 | U.S. Dollar | 28,004,145 | 1/10/14 | (232,412 | ) | ||||||||||||||||||||
Morgan Stanley | Canadian Dollar | 22,000,000 | U.S. Dollar | 20,566,899 | 1/10/14 | (139,910 | ) | ||||||||||||||||||||
Morgan Stanley | Japanese Yen | 2,900,000,000 | U.S. Dollar | 28,264,281 | 2/10/14 | 722,079 | |||||||||||||||||||||
Morgan Stanley | U.S. Dollar | 26,301,039 | Brazilian Real | 61,000,000 | 1/03/14 | (445,365 | ) | ||||||||||||||||||||
Morgan Stanley | U.S. Dollar | 25,667,999 | Brazilian Real | 61,000,000 | 2/04/14 | (20,056 | ) | ||||||||||||||||||||
Nomura International | U.S. Dollar | 40,941,460 | New Zealand Dollar | 49,000,000 | 1/08/14 | (649,527 | ) | ||||||||||||||||||||
UBS | Canadian Dollar | 70,000,000 | U.S. Dollar | 65,677,747 | 1/22/14 | (188,720 | ) | ||||||||||||||||||||
UBS | Canadian Dollar | 6,320,000 | U.S. Dollar | 5,957,936 | 1/22/14 | 11,135 | |||||||||||||||||||||
UBS | U.S. Dollar | 29,607,557 | Canadian Dollar | 31,000,000 | 1/22/14 | (438,121 | ) | ||||||||||||||||||||
$ | (2,358,691 | ) | |||||||||||||||||||||||||
Futures Contracts outstanding:
Description | Contract Position | Number of Contracts | Contract Expiration | Notional Amount at Value | Unrealized Appreciation (Depreciation) | ||||||||||||||||||
2-Year U.S. Treasury Note | Short | (38 | ) | 3/14 | $ | (8,352,875 | ) | $ | 15,334 | ||||||||||||||
5-Year U.S. Treasury Note | Short | (351 | ) | 3/14 | (41,878,688 | ) | 529,445 | ||||||||||||||||
10-Year U.S. Treasury Note | Short | (45 | ) | 3/14 | (5,537,109 | ) | 98,454 | ||||||||||||||||
| 90-Day Eurodollar | Short | (250 | ) | 3/16 | (61,606,250 | ) | 152,385 | ||||||||||||||||
| 90-Day Eurodollar | Short | (300 | ) | 6/16 | (73,691,250 | ) | 179,112 | ||||||||||||||||
$ | (191,066,172 | ) | $ | 974,730 | |||||||||||||||||||
Nuveen Investments
37
JGT Nuveen Diversified Currency Opportunities Fund (continued)
Portfolio of Investments December 31, 2013
(1) All percentages shown in the Portfolio of Investments are based on net assets, unless otherwise noted.
(2) Ratings (not covered by the report of independent registered public accounting firm): Using the highest of Standard & Poor's Group ("Standard & Poor's"), Moody's Investors Service, Inc. ("Moody's") or Fitch, Inc. ("Fitch") rating. Ratings below BBB by Standard & Poor's, Baa by Moody's or BBB by Fitch are considered to be below investment grade. Holdings designated N/R are not rated by any of these national rating agencies.
(3) Principal Amount (000) denominated in U.S. Dollars, unless otherwise noted.
(4) Other Assets Less Liabilities includes the Unrealized Appreciation (Depreciation) of certain derivative instruments as listed within Investments in Derivatives as of the end of the reporting period.
N/A Not applicable.
144A Investment is exempt from registration under Rule 144A of the Securities Act of 1933, as amended. These investments may only be resold in transactions exempt from registration, which are normally those transactions with qualified institutional buyers.
BRL Brazilian Real
CAD Canadian Dollar
COP Colombian Peso
EUR Euro
MXN Mexican Peso
MYR Malaysian Ringgit
NOK Norwegian Krone
PEN Peruvian Nuevo Sol
TRY Turkish Lira
ZAR South African Rand
See accompanying notes to financial statements.
Nuveen Investments
38
Statement of
Assets and Liabilities December 31, 2013
| Global Income Opportunities (JGG) | Diversified Currency Opportunities (JGT) | ||||||||||
Assets | |||||||||||
Long-term investments, at value (cost $184,227,510 and $526,781,180, respectively) | $ | 172,748,091 | $ | 500,932,040 | |||||||
Short-term investments, at value (cost $2,402,340 and $46,609,635, respectively) | 2,402,340 | 46,611,802 | |||||||||
Cash denominated in foreign currencies (cost $172,621 and $315,811, respectively) | 173,095 | 312,569 | |||||||||
Cash collateral at brokers(1) | 1,171,621 | 6,343,000 | |||||||||
Credit default swaps premiums paid | 168,156 | — | |||||||||
Unrealized appreciation on: | |||||||||||
Forward foreign currency exchange contracts, net | 396,559 | 2,390,308 | |||||||||
Interest rate swaps | 3,102,729 | — | |||||||||
Receivable for: | |||||||||||
Dividends | 20,098 | 25,977 | |||||||||
Due from broker (net of amounts uncollectible of $135,899 and $—, respectively) | 605,066 | 150,747 | |||||||||
Interest | 2,336,969 | 4,809,404 | |||||||||
Reclaims | 21,175 | 12,752 | |||||||||
Variation margin on credit default swaps | 5,677 | — | |||||||||
Variation margin on futures contracts | 33,398 | 68,141 | |||||||||
Other assets | 29,402 | 47,063 | |||||||||
Total assets | 183,214,376 | 561,703,803 | |||||||||
Liabilities | |||||||||||
Borrowings | 56,000,000 | — | |||||||||
Cash overdraft | 585,477 | — | |||||||||
Unrealized depreciation on forward foreign currency exchange contracts, net | 692,632 | 4,748,999 | |||||||||
Payable for: | |||||||||||
Investments purchased | 3,671,301 | — | |||||||||
Shares repurchased | — | 151,900 | |||||||||
Accrued expenses: | |||||||||||
Interest on borrowings | 52,251 | — | |||||||||
Management fees | 131,765 | 413,211 | |||||||||
Trustees fees | 1,106 | 47,022 | |||||||||
Other | 84,833 | 268,104 | |||||||||
Total liabilities | 61,219,365 | 5,629,236 | |||||||||
Net assets | $ | 121,995,011 | $ | 556,074,567 | |||||||
Shares outstanding | 9,289,418 | 46,043,135 | |||||||||
Net asset value per share outstanding | $ | 13.13 | $ | 12.08 | |||||||
Net assets consist of: | |||||||||||
Shares, ($.01) par value per share | $ | 92,894 | $ | 460,431 | |||||||
Paid-in surplus | 133,260,156 | 610,848,656 | |||||||||
Undistributed (Over-distribution of) net investment income | (2,678,837 | ) | (23,183,446 | ) | |||||||
Accumulated net realized gain (loss) | (163,424 | ) | (4,770,052 | ) | |||||||
Net unrealized appreciation (depreciation) | (8,515,778 | ) | (27,281,022 | ) | |||||||
Net assets | $ | 121,995,011 | $ | 556,074,567 | |||||||
Authorized shares | Unlimited | Unlimited | |||||||||
(1) Cash pledged to collateralize the net payment obligations for investments in derivatives.
See accompanying notes to financial statements.
Nuveen Investments
39
Statement of
Operations Year Ended December 31, 2013
| Global Income Opportunities (JGG) | Diversified Currency Opportunities (JGT) | ||||||||||
| Investment Income (net of foreign tax withheld of $3,545 and $76,574, respectively) | $ | 9,240,623 | $ | 21,718,576 | |||||||
Expenses | |||||||||||
Management fees | 1,679,414 | 5,530,643 | |||||||||
Interest expense on borrowings | 709,198 | — | |||||||||
Shareholder servicing agent fees and expenses | 283 | 460 | |||||||||
Custodian fees and expenses | 141,802 | 360,577 | |||||||||
Trustees fees and expenses | 5,119 | 16,895 | |||||||||
Professional fees | 95,539 | 93,724 | |||||||||
Shareholder reporting expenses | 32,879 | 130,952 | |||||||||
Stock exchange listing fees | 8,586 | 33,171 | |||||||||
Investor relations expenses | 30,262 | 106,406 | |||||||||
Other expenses | 23,224 | 66,998 | |||||||||
Total expenses | 2,726,306 | 6,339,826 | |||||||||
Net investment income (loss) | 6,514,317 | 15,378,750 | |||||||||
Realized and Unrealized Gain (Loss) | |||||||||||
Net realized gain (loss) from: | |||||||||||
Investments and foreign currency | (193,905 | ) | (8,491,949 | ) | |||||||
Forward foreign currency exchange contracts | (6,822,974 | ) | (52,686,694 | ) | |||||||
Futures contracts | 256,147 | 336,174 | |||||||||
Options purchased | (256,883 | ) | (1,329,323 | ) | |||||||
Options written | 29,625 | 612,250 | |||||||||
Swaps | 1,049,316 | — | |||||||||
Change in net unrealized appreciation (depreciation) of: | |||||||||||
Investments and foreign currency | (13,264,387 | ) | (24,362,430 | ) | |||||||
Forward foreign currency exchange contracts | (824,780 | ) | (7,819,786 | ) | |||||||
Futures contracts | (107,787 | ) | 974,730 | ||||||||
Swaps | 2,843,444 | — | |||||||||
Net realized and unrealized gain (loss) | (17,292,184 | ) | (92,767,028 | ) | |||||||
Net increase (decrease) in net assets from operations | $ | (10,777,867 | ) | $ | (77,388,278 | ) | |||||
See accompanying notes to financial statements.
Nuveen Investments
40
Statement of
Changes in Net Assets
| Global Income Opportunities (JGG) | Diversified Currency Opportunities (JGT) | ||||||||||||||||||
| Year Ended 12/31/13 | Year Ended 12/31/12 | Year Ended 12/31/13 | Year Ended 12/31/12 | ||||||||||||||||
Operations | |||||||||||||||||||
Net investment income (loss) | $ | 6,514,317 | $ | 2,133,034 | $ | 15,378,750 | $ | 10,512,060 | |||||||||||
Net realized gain (loss) from: | |||||||||||||||||||
Investments and foreign currency | (193,905 | ) | 3,052,339 | (8,491,949 | ) | (2,617,593 | ) | ||||||||||||
Forward foreign currency exchange contracts | (6,822,974 | ) | 2,546,152 | (52,686,694 | ) | 51,995,401 | |||||||||||||
Futures contracts | 256,147 | 283,574 | 336,174 | — | |||||||||||||||
Options purchased | (256,883 | ) | (28,100 | ) | (1,329,323 | ) | (1,180,825 | ) | |||||||||||
Options written | 29,625 | 8,200 | 612,250 | 830,850 | |||||||||||||||
Swaps | 1,049,316 | 4,591,954 | — | — | |||||||||||||||
Change in net unrealized appreciation (depreciation) of: | |||||||||||||||||||
Investments and foreign currency | (13,264,387 | ) | 2,305,944 | (24,362,430 | ) | 11,052,644 | |||||||||||||
Forward foreign currency exchange contracts | (824,780 | ) | 465,856 | (7,819,786 | ) | 10,892,907 | |||||||||||||
Futures contracts | (107,787 | ) | 161,500 | 974,730 | — | ||||||||||||||
Options purchased | — | — | — | 95,650 | |||||||||||||||
Options written | — | — | — | (203,850 | ) | ||||||||||||||
Swaps | 2,843,444 | (4,745,821 | ) | — | — | ||||||||||||||
Net increase (decrease) in net assets from operations | (10,777,867 | ) | 10,774,632 | (77,388,278 | ) | 81,377,244 | |||||||||||||
Distributions to Shareholders | |||||||||||||||||||
From net investment income | — | (7,958,039 | ) | — | — | ||||||||||||||
From accumulated net realized gains | (770,358 | ) | (3,225,987 | ) | (1,486,107 | ) | (31,349,996 | ) | |||||||||||
Return of capital | (9,942,604 | ) | — | (48,832,158 | ) | (22,123,393 | ) | ||||||||||||
Decrease in net assets from distributions to shareholders | (10,712,962 | ) | (11,184,026 | ) | (50,318,265 | ) | (53,473,389 | ) | |||||||||||
Capital Share Transactions | |||||||||||||||||||
Shares issued in reorganization | — | — | — | 75,834,805 | |||||||||||||||
Shares repurchased and retired | (806,265 | ) | — | (21,316,878 | ) | (4,603,053 | ) | ||||||||||||
Net increase (decrease) in net assets from capital share transactions | (806,265 | ) | — | (21,316,878 | ) | 71,231,752 | |||||||||||||
Net increase (decrease) in net assets | (22,297,094 | ) | (409,394 | ) | (149,023,421 | ) | 99,135,607 | ||||||||||||
Net assets at the beginning of period | 144,292,105 | 144,701,499 | 705,097,988 | 605,962,381 | |||||||||||||||
Net assets at the end of period | $ | 121,995,011 | $ | 144,292,105 | $ | 556,074,567 | $ | 705,097,988 | |||||||||||
Undistributed (Over-distribution of) net investment income at the end of period | $ | (2,678,837 | ) | $ | (2,101,044 | ) | $ | (23,183,446 | ) | $ | 539,068 | ||||||||
See accompanying notes to financial statements.
Nuveen Investments
41
Statement of
Cash Flows Year ended December 31, 2013
| Global Income Opportunities (JGG) | |||||||
Cash Flows from Operating Activities: | |||||||
Net Increase (Decrease) in Net Assets from Operations | $ | (10,777,867 | ) | ||||
| Adjustments to reconcile the net increase (decrease) in net assets from operations to net cash provided by (used in) operating activities: | |||||||
Purchases of investments | (136,407,706 | ) | |||||
Proceeds from sales and maturities of investments | 150,148,820 | ||||||
Proceeds from (Purchases of) short-term investments, net | (875,777 | ) | |||||
Proceeds from (Payments for) cash denominated in foreign currencies, net | (122,914 | ) | |||||
Proceeds from (Payments for) swap contracts, net | 1,041,109 | ||||||
Proceeds from (Payments for) terminated options purchased, net | 244,047 | ||||||
Premiums paid for options purchased | (505,975 | ) | |||||
Premiums received for options written | 29,625 | ||||||
Amortization (Accretion) of premiums and discounts, net | 1,472,051 | ||||||
(Increase) Decrease in: | |||||||
Cash collateral at brokers | (1,171,621 | ) | |||||
Receivable for dividends | (7,793 | ) | |||||
Receivable for due from broker | 278,948 | ||||||
Receivable for interest | 420,649 | ||||||
Receivable for reclaims | (21,175 | ) | |||||
Receivable for variation margin on credit default swaps | (5,677 | ) | |||||
Receivable for variation margin on futures contracts | 96,054 | ||||||
Other assets | 28,084 | ||||||
Increase (Decrease) in: | |||||||
Payable for investments purchased | 2,255,488 | ||||||
Payable for variation margin on futures contracts | (2,538 | ) | |||||
Accrued interest on borrowings | (17,657 | ) | |||||
Accrued management fees | (17,741 | ) | |||||
Accrued Trustees fees | 18 | ||||||
Accrued other expenses | (985 | ) | |||||
Net realized (gain) loss from: | |||||||
Investments and foreign currency | 193,905 | ||||||
Options purchased | 256,883 | ||||||
Options written | (29,625 | ) | |||||
Paydowns | (2,273 | ) | |||||
Swaps | (1,041,109 | ) | |||||
Change in net unrealized (appreciation) depreciation of: | |||||||
Investments and foreign currency | 13,264,387 | ||||||
Forward foreign currency exchange contracts | 824,780 | ||||||
Swaps | (2,811,487 | ) | |||||
Proceeds from litigation settlement | 50,483 | ||||||
Net cash provided by (used in) operating activities | 16,785,411 | ||||||
Cash Flows from Financing Activities: | |||||||
Increase (Decrease) in cash overdraft | (266,184 | ) | |||||
Repayments of borrowings | (5,000,000 | ) | |||||
Cash distributions paid to shareholders | (10,712,962 | ) | |||||
Cost of shares repurchased and retired | (806,265 | ) | |||||
Net cash provided by (used in) financing activities | (16,785,411 | ) | |||||
Net Increase (Decrease) in Cash | — | ||||||
Cash at the beginning of period | — | ||||||
Cash at the End of Period | $ | — | |||||
Supplemental Disclosure of Cash Flow Information | |||||||
Cash paid for interest on borrowings (excluding borrowing costs) was $665,454. | |||||||
See accompanying notes to financial statements.
Nuveen Investments
42
THIS PAGE INTENTIONALLY LEFT BLANK
Nuveen Investments
43
Financial
Highlights
Selected data for a share outstanding throughout each period:
Investment Operations | Less Distributions | Total Returns | |||||||||||||||||||||||||||||||||||||||||||||||||||||||||
| Beginning Net Asset Value | Net Investment Income (Loss)(a) | Net Realized/ Unrealized Gain (Loss) | Total | From Net Investment Income | From Accumulated Net Realized Gains | Return of Capital | Total | Offering Costs | Discount from Shares Repurchased and Retired | Ending Net Asset Value | Ending Market Value | Based on Net Asset Value(b) | Based on Market Value(b) | ||||||||||||||||||||||||||||||||||||||||||||||
Global Income Opportunities (JGG) | |||||||||||||||||||||||||||||||||||||||||||||||||||||||||||
Year Ended 12/31: | |||||||||||||||||||||||||||||||||||||||||||||||||||||||||||
2013 | $ | 15.42 | $ | .70 | $ | (1.86 | ) | $ | (1.16 | ) | $ | — | $ | (.08 | ) | $ | (1.06 | ) | $ | (1.14 | ) | $ | — | $ | .01 | $ | 13.13 | $ | 11.39 | (7.49 | )% | (10.97 | )% | ||||||||||||||||||||||||||
2012 | 15.46 | .23 | .93 | 1.16 | (.86 | ) | (.34 | ) | — | (1.20 | ) | — | — | 15.42 | 14.02 | 7.70 | 7.49 | ||||||||||||||||||||||||||||||||||||||||||
2011 | 16.33 | .17 | .26 | .43 | (.36 | ) | — | (.94 | ) | (1.30 | ) | — | — | 15.46 | 14.16 | 2.82 | (1.19 | ) | |||||||||||||||||||||||||||||||||||||||||
2010 | 16.76 | .14 | .99 | 1.13 | (.76 | ) | (.06 | ) | (.74 | ) | (1.56 | ) | — | — | 16.33 | 15.65 | 6.85 | (.22 | ) | ||||||||||||||||||||||||||||||||||||||||
2009 | 18.00 | .27 | .05 | .32 | (.87 | ) | (.05 | ) | (.64 | ) | (1.56 | ) | — | — | * | 16.76 | 17.23 | 1.70 | 18.57 | ||||||||||||||||||||||||||||||||||||||||
Diversified Currency Opportunities (JGT) | |||||||||||||||||||||||||||||||||||||||||||||||||||||||||||
Year Ended 12/31: | |||||||||||||||||||||||||||||||||||||||||||||||||||||||||||
2013 | 14.69 | .32 | (1.95 | ) | (1.63 | ) | — | (.03 | ) | (1.03 | ) | (1.06 | ) | — | .08 | 12.08 | 10.08 | (10.83 | ) | (13.99 | ) | ||||||||||||||||||||||||||||||||||||||
2012 | 14.01 | .24 | 1.64 | 1.88 | — | (.71 | ) | (.50 | ) | (1.21 | ) | — | .01 | 14.69 | 12.87 | 13.73 | 16.54 | ||||||||||||||||||||||||||||||||||||||||||
2011 | 15.64 | .12 | (.46 | ) | (.34 | ) | (.65 | ) | (.24 | ) | (.41 | ) | (1.30 | ) | — | .01 | 14.01 | 12.11 | (2.39 | )** | (3.27 | ) | |||||||||||||||||||||||||||||||||||||
2010 | 17.12 | .36 | (.42 | ) | (.06 | ) | (.13 | ) | — | (1.29 | ) | (1.42 | ) | — | — | * | 15.64 | 13.77 | (.18 | ) | (1.44 | ) | |||||||||||||||||||||||||||||||||||||
2009 | 16.51 | .49 | 1.62 | 2.11 | (.93 | ) | (.48 | ) | (.10 | ) | (1.51 | ) | — | * | .01 | 17.12 | 15.41 | 13.35 | 22.55 | ||||||||||||||||||||||||||||||||||||||||
Borrowings at End of Period(e) | |||||||||||
Global Income Opportunities (JGG) | Aggregate Amount Outstanding (000) | Asset Coverage Per $1,000 | |||||||||
Year Ended 12/31: | |||||||||||
2013 | $ | 56,000 | $ | 3,178 | |||||||
2012 | 61,000 | 3,365 | |||||||||
Nuveen Investments
44
Ratios/Supplemental Data | |||||||||||||||||||
Ratios to Average Net Assets(c) | |||||||||||||||||||
| Ending Net Assets (000) | Expenses | Net Investment Income (Loss) | Portfolio Turnover Rate(d) | ||||||||||||||||
Global Income Opportunities (JGG) | |||||||||||||||||||
Year Ended 12/31: | |||||||||||||||||||
2013 | $ | 121,995 | 2.03 | % | 4.85 | % | 72 | % | |||||||||||
2012 | 144,292 | 1.16 | 1.47 | 93 | |||||||||||||||
2011 | 144,701 | 1.06 | 1.10 | 36 | |||||||||||||||
2010 | 152,834 | 1.06 | .82 | 105 | |||||||||||||||
2009 | 156,253 | 1.08 | 1.54 | 177 | |||||||||||||||
Diversified Currency Opportunities (JGT) | |||||||||||||||||||
Year Ended 12/31: | |||||||||||||||||||
2013 | 556,075 | .99 | 2.40 | 86 | |||||||||||||||
2012 | 705,098 | .99 | 1.65 | 117 | |||||||||||||||
2011 | 605,962 | 1.06 | .77 | 41 | |||||||||||||||
2010 | 683,648 | 1.13 | 2.28 | 77 | |||||||||||||||
2009 | 748,957 | 1.07 | 2.92 | 103 | |||||||||||||||
(a) Per share Net Investment Income (Loss) is calculated using the average daily shares method.
(b) Total Return Based on Market Value is the combination of changes in the market price per share and the effect of reinvested dividend income and reinvested capital gains distributions, if any, at the average price paid per share at the time of reinvestment. The last dividend declared in the period, which is typically paid on the first business day of the following month, is assumed to be reinvested at the ending market price. The actual reinvestment for the last dividend declared in the period may take place over several days, and in some instances may not be based on the market price, so the actual reinvestment price may be different from the price used in the calculation. Total returns are not annualized.
Total Return Based on Net Asset Value is the combination of changes in net asset value, reinvested divided income at net asset value and reinvested capital gains distributions at net asset value, if any. The last dividend declared in the period, which is typically paid on the first business day of the following month, is assumed to be reinvested at the ending net asset value. The actual reinvest price for the last dividend declared in the period may often be based on the Fund's market price (and not its net asset value), and therefore may be different from the price used in the calculation. Total returns are not annualized.
(c) • Net Investment Income (Loss) ratios reflect income earned and expenses incurred on assets attributable to borrowings, where applicable.
• Each ratio includes the effect of all interest expense paid and other costs related to borrowings as follows:
Global Income Opportunities (JGG) | Ratios of Borrowings Interest Expense to Average Net Assets(e) | ||||||
Year Ended 12/31: | |||||||
2013 | .53 | % | |||||
2012 | .07 | ||||||
(d) Portfolio Turnover Rate is calculated based on the lesser of long-term purchases or sales (as disclosed in Note 5—Investment Transactions) divided by the average long-term market value during the period.
(e) The Fund did not utilize borrowings prior to the fiscal year ended December 31, 2012.
* Rounds to less than $.01 per share.
** During the fiscal year ended December 31, 2011, Diversified Currency Opportunities (JGT) received payments from the Adviser of $36,215 to offset losses realized on the disposal of investments purchased in violation of the Fund's investment restrictions. This reimbursement did not have an impact on the Fund's Total Return Based on Net Asset Value.
See accompanying notes to financial statements.
Nuveen Investments
45
Notes to
Financial Statements
1. General Information and Significant Accounting Policies
General Information
Fund Information
The funds covered in this report and their corresponding New York Stock Exchange ("NYSE") symbols are as follows (each a "Fund" and collectively, the "Funds"):
• Nuveen Global Income Opportunities Fund (JGG) ("Global Income Opportunities (JGG)")
• Nuveen Diversified Currency Opportunities Fund (JGT) ("Diversified Currency Opportunities (JGT)")
The Funds are registered under the Investment Company Act of 1940, as amended, as non-diversified closed-end registered investment companies. Global Income Opportunities (JGG) and Diversified Currency Opportunities (JGT) were organized as Massachusetts business trusts on April 13, 2006 and February 14, 2007, respectively.
Investment Adviser
The Funds' investment adviser is Nuveen Fund Advisors, LLC (the "Adviser"), a wholly-owned subsidiary of Nuveen Investments, Inc. ("Nuveen"). The Adviser is responsible for each Fund's overall investment strategy and asset allocation decisions. The Adviser has entered into sub-advisory agreements with Nuveen Asset Management, LLC, (the "Sub-Adviser"), a subsidiary of the Adviser, under which the Sub-Adviser manages the investment portfolios of the Funds.
Investment Objectives
Global Income Opportunities' (JGG) primary investment objective is to provide a high level of current income and gains. The Fund's secondary investment objective is to seek capital preservation. The Fund invests at least 80% of its managed assets (as defined in Note 7 – Management Fees and Other Transactions with Affiliates) in global debt securities, including but not limited to global sovereign and government-related debt, domestic and foreign debt securities, U.S. government securities, residential and commercial mortgage-backed securities and asset backed securities. The Fund may invest up to 20% in other types of securities, including, but not limited to, preferred securities of domestic and foreign issuers and convertible debt. The Fund may invest in global debt from issuers in both developed and emerging market countries. The Fund will invest primarily in securities rated investment grade at the time of purchase (or unrated but deemed to be of comparable quality by the Sub-Adviser.) However, the Fund may invest up to 30% of its managed assets in securities rated below investment grade (or unrated but deemed to be of comparable quality by the Sub-Adviser). The Fund may not invest in debt rated below CCC. The Fund will use futures, forwards and other derivatives to create or reduce exposure to countries, sectors, currencies, and interest rates in seeking to enhance total returns and/or manage risk. This strategy may create the economic effect of leverage. The Sub-Adviser will monitor and adjust investments using a propriety risk reduction methodology.
Diversified Currency Opportunities' (JGT) primary investment objective is to provide an attractive level of current income and total return. The Fund invests in currencies and short-term debt of both developed market and emerging market countries and has the flexibility to short foreign currencies. The Fund will maintain a foreign currency orientation with a maximum net exposure of the dollar of 35%. The Fund invests at least 80% of its managed assets in U.S. and foreign government securities, forward currency contracts, and other currency related derivative instruments and may invest 20% in corporate, assets-backed or other types of non-government debt. The Fund seeks to maintain a weighted-average, leverage-adjusted duration of two years or less and may employ effective leverage of up to 175% through currency forward contracts. This strategy may create the economic effect of leverage. The Sub-Adviser will monitor and adjust investments using a propriety risk reduction methodology.
The Funds are subject to regulation as a commodity pool under the Commodity Exchange Act, and the Adviser has registered with the Commodity Futures Trading Commission as a commodity pool operator.
Significant Accounting Policies
The following is a summary of significant accounting policies followed by the Funds in the preparation of their financial statements in accordance with accounting principles generally accepted in the United States ("U.S. GAAP").
Nuveen Investments
46
Investment Transactions
Investment transactions are recorded on a trade date basis. Realized gains and losses from transactions are determined on the specific identification method, which is the same basis used for federal income tax purposes. Investments purchased on a when-issued/delayed delivery basis may have extended settlement periods. Any investments so purchased are subject to market fluctuation during this period. The Funds have instructed the custodian to earmark securities in the Funds' portfolios with a current value at least equal to the amount of the when-issued/delayed delivery purchase commitments. As of December 31, 2013, the following Fund had outstanding when-issued/delayed delivery purchase commitments as follows:
| Global Income Opportunities (JGG) | |||||||
Outstanding when-issued/delayed delivery purchase commitments | $ | 3,671,336 | |||||
There were no such outstanding purchase commitments in Diversified Currency Opportunities (JGT).
Investment Income
Investment income, which reflects the amortization of premiums and includes accretion of discounts for financial reporting purposes, is recorded on an accrual basis. Investment income also reflects paydown gains and losses, if any.
Professional Fees
Professional fees presented on the Statement of Operations consist of legal fees incurred in the normal course of operations, audit fees, tax consulting fees and, in some cases, workout expenditures. Workout expenditures are incurred in an attempt to protect or enhance an investment, or to pursue other claims or legal actions on behalf of Fund shareholders. Should a Fund receive a refund of workout expenditures paid in a prior reporting period such amounts will be recognized as "Legal fee refund" on the Statement of Operations.
Dividends and Distributions to Shareholders
Distributions to shareholders are recorded on the ex-dividend date. The amount and timing of distributions are determined in accordance with federal income tax regulations, which may differ from U.S. GAAP.
Each Fund makes quarterly cash distributions to shareholders of a stated dollar amount per share. Subject to approval and oversight by the Funds' Board of Trustees, each Fund seeks to maintain a stable distribution level designed to deliver the long-term return potential of each Fund's investment strategy through regular quarterly distributions (a "Managed Distribution Program"). Total distributions during a calendar year generally will be made from each Fund's net investment income, net realized capital gains and net unrealized capital gains in the Fund's portfolio, if any. The portion of distributions paid attributed to net unrealized gains, if any, is distributed from the Fund's assets and is treated by shareholders as a non-taxable distribution ("Return of Capital") for tax purposes. In the event that total distributions during a calendar year exceed a Fund's total return on net asset value, the difference will reduce net asset value per share. If a Fund's total return on net asset value exceeds total distributions during a calendar year, the excess will be reflected as an increase in net asset value per share. The final determination of the source and character of all distributions for the fiscal year is made after the end of the fiscal year and is reflected in the financial statements contained in the annual report as of December 31 each year.
The actual character of distributions made by the Funds during the fiscal years ended December 31, 2013 and December 31, 2012, are reflected in the accompanying financial statements.
Due from Broker
Global Income Opportunities (JGG) has an outstanding trade receivable in the amount of $605,066 from an affiliated entity of Lehman Brothers Holdings, Inc., ("Lehman") which filed for Chapter 11 bankruptcy protection. The trade receivable is recognized as a component of "Due from broker" on the Statement of Assets and Liabilities. The Fund's Adviser has agreed that to the extent that this asset is not ultimately recovered by the Fund, the Adviser or another party shall reimburse the Fund for this asset. The Fund's custodian has also agreed to waive any overdraft charges resulting from this receivable. As the receivable is an offset of the overdraft noted on the Fund's accounting records and recognized as a component of "Cash overdraft" on the Statement of Assets and Liabilities, there has been no effect on the Fund's net asset value.
Indemnifications
Under the Funds' organizational documents, their officers and trustees are indemnified against certain liabilities arising out of the performance of their duties to the Funds. In addition, in the normal course of business, the Funds enter into contracts that provide general indemnifications to other parties. The Funds' maximum exposure under these arrangements is unknown as this would involve future claims that may be made against the Funds that have not yet occurred. However, the Funds have not had prior claims or losses pursuant to these contracts and expect the risk of loss to be remote.
Nuveen Investments
47
Notes to Financial Statements (continued)
Netting Agreements
In the ordinary course of business, the Funds may enter into transactions subject to enforceable master repurchase agreements, International Swaps and Derivative Association, Inc. ("ISDA") master agreements or other similar arrangements ("netting agreements"). Generally, the right to offset in netting agreements allows each Fund to offset any exposure to a specific counterparty with any collateral received or delivered to that counterparty based on the terms of the agreements. Generally, each Fund manages its cash collateral and securities collateral on a counterparty basis. As of December 31, 2013, the Funds were not invested in any portfolio securities or derivatives, other than repurchase agreements, forward foreign currency exchange contracts and swap contracts further described in Note 3 – Portfolio Securities and Investments in Derivatives that are subject to netting agreements.
Use of Estimates
The preparation of financial statements in conformity with U.S. GAAP requires management to make estimates and assumptions that affect the reported amounts of assets and liabilities at the date of the financial statements and the reported amounts of increases and decreases in net assets from operations during the reporting period. Actual results may differ from those estimates.
2. Investment Valuation and Fair Value Measurements
Investment Valuation
Common stocks and other equity-type securities are valued at the last sales price on the securities exchange on which such securities are primarily traded and are generally classified as Level 1 for fair value measurement purposes. Securities primarily traded on the NASDAQ National Market ("NASDAQ") are valued, except as indicated below, at the NASDAQ Official Closing Price and are generally classified as Level 1. However, securities traded on a securities exchange or NASDAQ for which there were no transactions on a given day or securities not listed on a securities exchange or NASDAQ are valued at the quoted bid price and are generally classified as Level 2.
Prices of fixed-income securities, short-term U.S. and international government securities, forward foreign currency exchange contracts and swaps are provided by a pricing service approved by the Funds' Board of Trustees. These securities are generally classified as Level 2 for fair value measurement purposes. The pricing service establishes a security's fair value using methods that may include consideration of the following: yields or prices of investments of comparable quality, type of issue, coupon, maturity and rating, market quotes or indications of value from security dealers, evaluations of anticipated cash flows or collateral, general market conditions and other information and analysis, including the obligor's credit characteristics considered relevant. In pricing certain securities, particularly less liquid and lower quality securities, the pricing service may consider information about a security, its issuer, or market activity, provided by the Adviser. These securities are generally classified as Level 2 or Level 3 depending on the priority of the significant inputs.
Investments initially valued in currencies other than the U.S. dollar are converted to the U.S. dollar using exchange rates obtained from pricing services. As a result, the net asset value (NAV) of the Funds' shares may be affected by changes in the value of currencies in relation to the U.S. dollar. The value of securities traded in markets outside the United States or denominated in currencies other than the U.S. dollar may be affected significantly on a day that the NYSE is closed and an investor is not able to purchase, redeem or exchange shares. If significant market events occur between the time of determination of the closing price of a foreign security on an exchange and the time that the Funds' NAV is determined, or if under the Funds' procedures, the closing price of a foreign security is not deemed to be reliable, the security would be valued at fair value as determined in accordance with procedures established in good faith by the Funds' Board of Trustees. These securities are generally classified as Level 2 or Level 3 depending on the priority of the significant inputs.
The value of exchange-traded options are based on the mean of the closing bid and ask prices. Futures contracts are valued using the closing settlement price or, in the absence of such a price, the last traded price. Exchange-traded options and futures contracts are generally classified as Level 1. Options traded in the over-the-counter market are valued using an evaluated mean price and are generally classified as Level 2.
Repurchase agreements are valued at contract amount plus accrued interest, which approximates market value. These securities are generally classified as Level 2.
Certain securities may not be able to be priced by the pre-established pricing methods as described above. Such securities may be valued by the Funds' Board of Trustees or its designee at fair value. These securities generally include, but are not limited to, restricted securities (securities which may not be publicly sold without registration under the Securities Act of 1933, as amended) for which a pricing service is unable to provide a market price; securities whose trading has been formally suspended; debt securities that have gone into default and for which there is no current market quotation; a security whose market price is not available from a pre-established pricing source; a security with respect to which an event has occurred that is likely to materially affect the value of the security after the market has closed but before the calculation of a Fund's net asset value (as may be the case in non-U.S. markets on which the security is primarily traded) or make it difficult or impossible to obtain a reliable market quotation; and a security whose price, as provided by the pricing service, is not deemed to reflect the security's fair value. As a general principle, the fair value of a security would appear to be the amount that the owner might reasonably expect to receive for it in a current sale. A variety of factors may be considered in determining the fair value of such securities, which may include consideration of the following: yields or prices of investments of comparable quality, type of issue, coupon, maturity and rating, market quotes or indications of value from security dealers, evaluations of anticipated cash flows or collateral, general market conditions and
Nuveen Investments
48
other information and analysis, including the obligor's credit characteristics considered relevant. These securities are generally classified as Level 2 or Level 3 depending on the priority of the significant inputs. Regardless of the method employed to value a particular security, all valuations are subject to review by the Funds' Board of Trustees or its designee.
Fair Value Measurements
Fair value is defined as the price that the Funds would receive upon selling an investment or transferring a liability in an orderly transaction to an independent buyer in the principal or most advantageous market for the investment. A three-tier hierarchy is used to maximize the use of observable market data and minimize the use of unobservable inputs and to establish classification of fair value measurements for disclosure purposes. Observable inputs reflect the assumptions market participants would use in pricing the asset or liability. Observable inputs are based on market data obtained from sources independent of the reporting entity. Unobservable inputs reflect the reporting entity's own assumptions about the assumptions market participants would use in pricing the asset or liability. Unobservable inputs are based on the best information available in the circumstances. The following is a summary of the three-tiered hierarchy of valuation input levels.
Level 1 – Inputs are unadjusted and prices are determined using quoted prices in active markets for identical securities.
Level 2 – Prices are determined using other significant observable inputs (including quoted prices for similar securities, interest rates, prepayment speeds, credit risk, etc.).
Level 3 – Prices are determined using significant unobservable inputs (including management's assumptions in determining the fair value of investments).
The inputs or methodologies used for valuing securities are not an indication of the risks associated with investing in those securities. The following is a summary of each Fund's fair value measurements as of the end of the reporting period:
Global Income Opportunities (JGG) | Level 1 | Level 2 | Level 3 | Total | |||||||||||||||
Long-Term Investments*: | |||||||||||||||||||
$25 Par (or similar) Retail Structures | $ | 3,247,845 | $ | — | $ | — | $ | 3,247,845 | |||||||||||
Corporate Bonds | — | 85,484,204 | — | 85,484,204 | |||||||||||||||
$1,000 Par (or similar) Institutional Structures | — | 7,568,977 | — | 7,568,977 | |||||||||||||||
Sovereign Debt | — | 68,299,757 | — | 68,299,757 | |||||||||||||||
Asset-Backed and Mortgage-Backed Securities | — | 8,147,308 | — | 8,147,308 | |||||||||||||||
Short-Term Investments: | |||||||||||||||||||
Repurchase Agreements | — | 2,402,340 | — | 2,402,340 | |||||||||||||||
Derivatives: | |||||||||||||||||||
Forward Foreign Currency Exchange Contracts** | — | (296,073 | ) | — | (296,073 | ) | |||||||||||||
Credit Default Swaps** | — | 31,957 | — | 31,957 | |||||||||||||||
Interest Rate Swaps** | — | 3,102,729 | — | 3,102,729 | |||||||||||||||
Futures Contracts** | 148,990 | — | — | 148,990 | |||||||||||||||
Total | $ | 3,396,835 | $ | 174,741,199 | $ | — | $ | 178,138,034 | |||||||||||
Diversified Currency Opportunities (JGT) | Level 1 | Level 2 | Level 3 | Total | |||||||||||||||
Long-Term Investments*: | |||||||||||||||||||
$25 Par (or similar) Retail Structures | $ | 1,307,000 | $ | — | $ | — | $ | 1,307,000 | |||||||||||
Corporate Bonds | — | 86,541,827 | — | 86,541,827 | |||||||||||||||
Sovereign Debt | — | 382,782,733 | — | 382,782,733 | |||||||||||||||
Asset-Backed and Mortgage-Backed Securities | — | 30,300,480 | — | 30,300,480 | |||||||||||||||
Short-Term Investments*: | |||||||||||||||||||
Sovereign Debt | — | 3,007,500 | — | 3,007,500 | |||||||||||||||
U.S. Government & Agency Obligations | — | 40,026,525 | — | 40,026,525 | |||||||||||||||
Repurchase Agreements | — | 3,577,777 | — | 3,577,777 | |||||||||||||||
Derivatives: | |||||||||||||||||||
Forward Foreign Currency Exchange Contracts** | — | (2,358,691 | ) | — | (2,358,691 | ) | |||||||||||||
Futures Contracts** | 974,730 | — | — | 974,730 | |||||||||||||||
Total | $ | 2,281,730 | $ | 543,878,151 | $ | — | $ | 546,159,881 | |||||||||||
* Refer to the Fund's Portfolio of Investments for industry and country classifications, where applicable.
** Represents net unrealized appreciation (depreciation) as reported in the Fund's Portfolio of Investments.
The Nuveen funds' Board of Directors/Trustees is responsible for the valuation process and has delegated the oversight of the daily valuation process to the Adviser's Valuation Committee. The Valuation Committee, pursuant to the valuation policies and procedures adopted by the Board of Directors/Trustees, is responsible for making fair value determinations, evaluating the effectiveness of the funds' pricing policies, and reporting to the Board of Directors/Trustees. The Valuation Committee is aided in its efforts by the Adviser's dedicated Securities Valuation Team, which is responsible for administering the daily valuation process and applying fair value methodologies as approved by the Valuation Committee. When determining the reliability of independent pricing services for investments owned by the funds, the Valuation Committee, among other things, conducts due diligence reviews of the pricing services and monitors the quality of security prices received through various testing reports conducted by the Securities Valuation Team.
Nuveen Investments
49
Notes to Financial Statements (continued)
The Valuation Committee will consider pricing methodologies it deems relevant and appropriate when making a fair value determination, based on the facts and circumstances specific to the portfolio instrument. Fair value determinations generally will be derived as follows, using public or private market information:
(i) If available, fair value determinations shall be derived by extrapolating from recent transactions or quoted prices for identical or comparable securities.
(ii) If such information is not available, an analytical valuation methodology may be used based on other available information including, but not limited to: analyst appraisals, research reports, corporate action information, issuer financial statements and shelf registration statements. Such analytical valuation methodologies may include, but are not limited to: multiple of earnings, discount from market value of a similar freely-traded security, discounted cash flow analysis, book value or a multiple thereof, risk premium/yield analysis, yield to maturity and/or fundamental investment analysis.
The purchase price of a portfolio instrument will be used to fair value the instrument only if no other valuation methodology is available or deemed appropriate, and it is determined that the purchase price fairly reflects the instrument's current value.
For each portfolio security that has been fair valued pursuant to the policies adopted by the Board of Directors/Trustees, the fair value price is compared against the last available and next available market quotations. The Valuation Committee reviews the results of such testing and fair valuation occurrences are reported to the Board of Directors/Trustees.
3. Portfolio Securities and Investments in Derivatives
Portfolio Securities
Foreign Currency Transactions
To the extent that the Funds invest in securities and/or contracts that are denominated in a currency other than U.S. dollars, the Funds will be subject to currency risk, which is the risk that an increase in the U.S. dollar relative to the foreign currency will reduce returns or portfolio value. Generally, when the U.S. dollar rises in value against a foreign currency, the Fund's investments denominated in that currency will lose value because its currency is worth fewer U.S. dollars; the opposite effect occurs if the U.S. dollar falls in relative value. Investments and other assets and liabilities denominated in foreign currencies are converted into U.S. dollars on a spot (i.e. cash) basis at the spot rate prevailing in the foreign currency exchange market at the time of valuation. Purchases and sales of investments and income denominated in foreign currencies are translated into U.S. dollars on the respective dates of such transactions.
Global Income Opportuntities (JGG) and Diversified Currency Opportunities (JGT) may invest in non-U.S. securities (as described in Note 1 – General Information and Significant Accounting Policies, Investment Objectives). As of December 31, 2013, Global Income Opportuntities (JGG) and Diversified Currency Opportunities's (JGT) investments in non-U.S. securities were as follows:
| Global Income Opportuntities (JGG) | Value | % of Total Investments | |||||||||
Country: | |||||||||||
Mexico | $ | 20,757,209 | 11.9 | % | |||||||
Turkey | 11,132,216 | 6.4 | |||||||||
South Africa | 8,793,767 | 5.0 | |||||||||
United Kingdom | 8,759,531 | 5.0 | |||||||||
South Korea | 6,168,444 | 3.5 | |||||||||
Russia | 4,561,985 | 2.6 | |||||||||
Canada | 4,187,693 | 2.4 | |||||||||
Other* | 31,573,495 | 18.0 | |||||||||
Total | $ | 95,934,340 | 54.8 | % | |||||||
* Includes all other countries less than $4,187,693.
Nuveen Investments
50
| Diversified Currency Opportunities (JGT) | Value | % of Total Investments | |||||||||
Country: | |||||||||||
Brazil | $ | 81,335,864 | 14.9 | % | |||||||
Mexico | 64,336,495 | 11.8 | |||||||||
Canada | 44,502,181 | 8.1 | |||||||||
Italy | 29,069,484 | 5.3 | |||||||||
Malaysia | 25,898,025 | 4.7 | |||||||||
South Africa | 25,834,476 | 4.7 | |||||||||
Turkey | 25,189,715 | 4.6 | |||||||||
Russia | 19,672,900 | 3.6 | |||||||||
Spain | 18,491,876 | 3.4 | |||||||||
Peru | 13,253,250 | 2.4 | |||||||||
Other* | 96,498,313 | 17.6 | |||||||||
Total | $ | 444,082,579 | 81.1 | % | |||||||
* Includes all other countries less than $13,253,250.
The books and records of the Funds are maintained in U.S. dollars. Foreign currencies, assets and liabilities are translated into U.S. dollars at 4:00 p.m. Eastern time. Investment transactions, income and expenses are translated on the respective dates of such transactions. Net realized foreign currency gains and losses resulting from changes in exchange rates include foreign currency gains and losses between trade date and settlement date of the transactions, foreign currency transactions, and the difference between the amounts of interest and dividends recorded on the books of a Fund and the amounts actually received.
The realized gains and losses resulting from changes in foreign currency exchange rates and changes in foreign exchange rates associated with other assets and liabilities on investments, forward foreign currency exchange contracts, futures, options purchased, options written and swap contracts, when applicable, are recognized as a component of "Net realized gain (loss) from investments and foreign currency" on the Statement of Operations, when applicable.
The unrealized gains and losses resulting from changes in foreign currency exchange rates and changes in foreign exchange rates associated with other assets and liabilities on investments are recognized as a component of "Change in net unrealized appreciation (depreciation) of investments and foreign currency" on the Statement of Operations, when applicable. The unrealized gains and losses resulting from changes in foreign exchange rates associated with forward foreign currency exchange contracts, futures, options purchased, options written and swaps are recognized as a component of "Change in net unrealized appreciation (deprecation) of forward foreign currency exchange contracts, futures contracts, options purchased, options written and swaps," respectively on the Statement of Operations, when applicable.
Zero Coupon Securities
Each Fund is authorized to invest in zero coupon securities. A zero coupon security does not pay a regular interest coupon to its holders during the life of the security. Income to the holder of the security comes from accretion of the difference between the original purchase price of the security at issuance and the par value of the security at maturity and is effectively paid at maturity. The market prices of zero coupon securities generally are more volatile than the market prices of securities that pay interest periodically.
Repurchase Agreements
In connection with transactions in repurchase agreements, it is each Fund's policy that its custodian take possession of the underlying collateral securities, the fair value of which exceeds the principal amount of the repurchase transaction, including accrued interest, at all times. If the counterparty defaults, and the fair value of the collateral declines, realization of the collateral may be delayed or limited.
The following table presents the repurchase agreements for the Funds that are subject to netting agreements as of the end of the reporting period, and the collateral delivered related to those repurchase agreements.
| Fund | Counterparty | Short-Term Investments, at Value | Collateral Pledged (From) Counterparty* | Net Exposure | |||||||||||||||
Global Income Opportunities (JGG) | State Street Bank | $ | 2,402,340 | $ | (2,402,340 | ) | $ | — | |||||||||||
Diversified Currency Opportunities (JGT) | State Street Bank | 3,577,777 | (3,577,777 | ) | — | ||||||||||||||
* As of December 31, 2013, the value of the collateral pledged from the counterparty exceeded the value of the repurchase agreements. Refer to the Fund's Portfolio of Investments for details on the repurchase agreements.
Nuveen Investments
51
Notes to Financial Statements (continued)
Investment in Derivatives
The Funds record derivative instruments at fair value, with changes in fair value recognized on the Statement of Operations, when applicable. Even though the Funds' investments in derivatives may represent economic hedges, they are not considered to be hedge transactions for financial reporting purposes.
Forward Foreign Currency Exchange Contracts
Each Fund is authorized to enter into forward foreign currency exchange contracts ("forward contract") under two circumstances: (i) when a Fund enters into a contract for the purchase or sale of a security denominated in a foreign currency to "lock in" the U.S. exchange rate of the transaction, with such period being a short-dated contract covering the period between transaction date and settlement date; or (ii) when the Sub-Adviser, believes that the currency of a particular foreign country may experience a substantial movement against the U.S. dollar or against another foreign currency.
A forward contract is an agreement between two parties to purchase or sell a specified quantity of a currency at or before a specified date in the future at a specified price. Forward contracts are typically traded in the over-the-counter ("OTC") markets and all details of the contract are negotiated between the counterparties to the agreement. Accordingly, the forward contracts are valued by reference to the contracts traded in the OTC markets. The contractual obligations of a buyer or seller may generally be satisfied by taking or making physical delivery of the underlying currency, establishing an opposite position in the contract and recognizing the profit or loss on both positions simultaneously on the delivery date or, in some instances, paying a cash settlement before the designated date of delivery.
Forward contracts are valued daily at the forward rate. The net amount recorded on these transactions for each counterparty is recognized as a component of "Unrealized appreciation and/or depreciation on forward foreign currency exchange contracts, net" on the Statement of Assets and Liabilities. The change in value of the forward contracts during the reporting period is recognized as a component of "Change in net unrealized appreciation (depreciation) of forward foreign currency exchange contracts" on the Statement of Operations. When the contract is closed or offset with the same counterparty, a Fund recognizes the difference between the value of the contract at the time it was entered and the value at the time it was closed or offset as a component of "Net realized gain (loss) from forward foreign currency exchange contracts" on the Statement of Operations.
Forward contracts will generally not be entered into for terms greater than three months, but may have maturities of up to six months or more. The use of forward contracts does not eliminate fluctuations in the underlying prices of a Fund's investment securities; however, it does establish a rate of exchange that can be achieved in the future. The use of forward contracts involves the risk that anticipated currency movements will not be accurately predicted. A forward contract would limit the risk of loss due to a decline in the value of a particular currency; however, it also would limit any potential gain that might result should the value of the currency increase instead of decrease. These contracts may involve market risk in excess of the unrealized appreciation or depreciation reflected on the Statement of Assets and Liabilities. Forward contracts are subject to counterparty risk if the counterparty fails to perform as specified in the contract due to financial impairment or other reason.
During the fiscal year ended December 31, 2013, Global Income Opportunities (JGG) and Diversified Currency Opportunities (JGT) utilized forward foreign currency exchange contracts to reduce risk and to take active currency exposures. These contracts were used to reduce risk by hedging select foreign currency risks associated with each Fund's foreign debt investments. The Funds also actively managed currency exposures through these contracts in an attempt to benefit from the potential appreciation.
The average notional amount of forward foreign currency exchange contracts outstanding during the fiscal year ended December 31, 2013, was as follows:
| Global Income Opportunities (JGG) | Diversified Currency Opportunities (JGT) | ||||||||||
Average notional amount of forward foreign currency exchange contracts outstanding* | $ | 270,139,649 | $ | 1,373,831,470 | |||||||
* The average notional amount is calculated based on the outstanding notional amount at the beginning of the fiscal year and at the end of each fiscal quarter within the current fiscal year.
The following table presents the fair value of all forward foreign currency exchange contracts held by the Funds as of December 31, 2013, the location of these instruments on the Statement of Assets and Liabilities and the primary underlying risk exposure.
Location on the Statement of Assets and Liabilities | |||||||||||||||||||||||
Underlying | Derivative | Asset Derivatives | (Liability) Derivatives | ||||||||||||||||||||
Risk Exposure | Instrument | Location | Value | Location | Value | ||||||||||||||||||
Global Income Opportunities (JGG) | |||||||||||||||||||||||
| Foreign currency exchange rate | Forward contracts | Unrealized appreciation on forward foreign currency exchange contracts, net | $ | 1,094,646 | Unrealized depreciation on forward foreign currency exchange contracts, net | $ | (1,021,460 | ) | |||||||||||||||
| Foreign currency exchange rate | Forward contracts | Unrealized appreciation on forward foreign currency exchange contracts, net | (698,087 | ) | Unrealized depreciation on forward foreign currency exchange contracts, net | 328,828 | |||||||||||||||||
Total | $ | 396,559 | $ | (692,632 | ) | ||||||||||||||||||
Nuveen Investments
52
Location on the Statement of Assets and Liabilities | |||||||||||||||||||||||
Underlying | Derivative | Asset Derivatives | (Liability) Derivatives | ||||||||||||||||||||
Risk Exposure | Instrument | Location | Value | Location | Value | ||||||||||||||||||
Diversified Currency Opportunities (JGT) | |||||||||||||||||||||||
| Foreign currency exchange rate | Forward contracts | Unrealized appreciation on forward foreign currency exchange contracts, net | $ | 4,000,129 | Unrealized depreciation on forward foreign currency exchange contracts, net | $ | (7,271,632 | ) | |||||||||||||||
| Foreign currency exchange rate | Forward contracts | Unrealized appreciation on forward foreign currency exchange contracts, net | (1,609,821 | ) | Unrealized depreciation on forward foreign currency exchange contracts, net | 2,522,633 | |||||||||||||||||
Total | $ | 2,390,308 | $ | (4,748,999 | ) | ||||||||||||||||||
The following table presents the forward foreign currency contracts, which are subject to netting agreements, as well as collateral delivered related to those forward foreign currency contracts.
| Fund | Counterparty | Gross Unrealized Appreciation on Forward Foreign Currency Exchange Contracts* | Gross Unrealized (Depreciation) on Forward Foreign Currency Exchange Contracts* | Amounts Netted on Statement of Assets and Liabilities | Net Unrealized Appreciation (Depreciation) on Forward Foreign Currency Exchange Contracts | Collateral Pledged to (from) Counterparty | Net Exposure | ||||||||||||||||||||||||
Global Income Opportunites (JGG) | |||||||||||||||||||||||||||||||
Bank of America | $ | — | $ | (48,077 | ) | $ | — | $ | (48,077 | ) | $ | — | $ | (48,077 | ) | ||||||||||||||||
Barclays | 276,572 | (244,981 | ) | (244,981 | ) | 31,591 | — | 31,591 | |||||||||||||||||||||||
Citibank N.A. | 492,405 | (378,999 | ) | (378,999 | ) | 113,406 | — | 113,406 | |||||||||||||||||||||||
Credit Suisse | 118,834 | (289,204 | ) | 118,834 | (170,370 | ) | 170,370 | — | |||||||||||||||||||||||
Goldman Sachs | 133,858 | — | — | 133,858 | — | 133,858 | |||||||||||||||||||||||||
JPMorgan | 191,811 | (74,107 | ) | (74,107 | ) | 117,704 | — | 117,704 | |||||||||||||||||||||||
Morgan Stanley | 209,994 | (397,306 | ) | 209,994 | (187,312 | ) | — | (187,312 | ) | ||||||||||||||||||||||
Nomura International | — | (139,184 | ) | — | (139,184 | ) | 139,184 | — | |||||||||||||||||||||||
UBS | — | (147,689 | ) | — | (147,689 | ) | — | (147,689 | ) | ||||||||||||||||||||||
Total |
| $ | 1,423,474 | $ | (1,719,547 | ) | $ | (369,259 | ) | $ | (296,073 | ) | $ | 309,554 | $ | 13,481 | |||||||||||||||
Diversified Currency Opportunities (JGT) | |||||||||||||||||||||||||||||||
Bank of America | $ | — | $ | (246,709 | ) | $ | — | $ | (246,709 | ) | $ | 246,709 | $ | — | |||||||||||||||||
Barclays | 1,848,607 | (1,026,405 | ) | (1,026,405 | ) | 822,202 | (774,324 | ) | 47,878 | ||||||||||||||||||||||
BNP Paribas | — | (63,667 | ) | — | (63,667 | ) | — | (63,667 | ) | ||||||||||||||||||||||
Citibank N.A. | 1,295,079 | (1,562,491 | ) | 1,295,079 | (267,412 | ) | 267,412 | — | |||||||||||||||||||||||
Credit Suisse | 469,658 | (2,401,999 | ) | 469,658 | (1,932,341 | ) | 1,932,341 | — | |||||||||||||||||||||||
Goldman Sachs | 2,151,522 | (583,416 | ) | (583,416 | ) | 1,568,106 | (1,568,106 | ) | — | ||||||||||||||||||||||
JPMorgan | — | (882,655 | ) | — | (882,655 | ) | 882,655 | — | |||||||||||||||||||||||
Morgan Stanley | 746,761 | (837,743 | ) | 746,761 | (90,982 | ) | — | (90,982 | ) | ||||||||||||||||||||||
Nomura International | — | (649,527 | ) | — | (649,527 | ) | 649,527 | — | |||||||||||||||||||||||
UBS | 11,135 | (626,841 | ) | 11,135 | (615,706 | ) | 540,000 | (75,706 | ) | ||||||||||||||||||||||
Total | $ | 6,522,762 | $ | (8,881,453 | ) | $ | 912,812 | $ | (2,358,691 | ) | $ | 2,176,214 | $ | (182,477 | ) | ||||||||||||||||
* Represents gross unrealized appreciation (depreciation) for the counterparty as reported in the Fund's Portfolio of Investments.
The following table presents the amount of net realized gain (loss) and change in net unrealized appreciation (depreciation) on forward contracts during the fiscal year ended December 31, 2013, and the primary underlying risk exposure.
Fund | Underlying Risk Exposure | Derivative Instrument | Net Realized Gain (Loss) from Forward Foreign Currency Exchange Contracts | Change in Net Unrealized Appreciation (Depreciation) of Forward Foreign Currency Exchange Contracts | |||||||||||||||
Global Income Opportunities (JGG) | Foreign currency exchange rate | Forward contracts | $ | (6,822,974 | ) | $ | (824,780 | ) | |||||||||||
Diversified Currency Opportunities (JGT) | Foreign currency exchange rate | Forward contracts | (52,686,694 | ) | (7,819,786 | ) | |||||||||||||
Futures Contracts
Upon execution of a futures contract, a Fund is obligated to deposit cash or eligible securities, also known as "initial margin," into an account at its clearing broker equal to a specified percentage of the contract amount. Cash held by the broker to cover initial margin requirements on open futures contracts, if any, is recognized as "Deposits with brokers for open futures contracts" on the Statement of Assets and Liabilities. Investments in futures contracts obligate a Fund and the clearing broker to settle monies on a daily basis representing changes in the prior days "mark-to-market" of the open
Nuveen Investments
53
Notes to Financial Statements (continued)
contracts. If a Fund has unrealized appreciation the clearing broker would credit the Fund's account with an amount equal to appreciation and conversely if a Fund has unrealized depreciation the clearing broker would debit the Fund's account with an amount equal to depreciation. These daily cash settlements are also known as "variation margin." Variation margin is recognized as a receivable and/or payable for "Variation margin on futures contracts" on the Statement of Assets and Liabilities.
During the period the futures contract is open, changes in the value of the contract are recognized as an unrealized gain or loss by "marking-to-market" on a daily basis to reflect the changes in market value of the contract, which is recognized as a component of "Change in net unrealized appreciation (depreciation) of futures contracts" on the Statement of Operations. When the contract is closed or expired, a Fund records a realized gain or loss equal to the difference between the value of the contract on the closing date and value of the contract when originally entered into, which is recognized as a component of "Net realized gain (loss) from futures contracts" on the Statement of Operations.
Risks of investments in futures contracts include the possible adverse movement in the price of the securities or indices underlying the contracts, the possibility that there may not be a liquid secondary market for the contracts and/or that a change in the value of the contract may not correlate with a change in the value of the underlying securities or indices.
During the fiscal year ended December 31, 2013, Global Income Opportunities (JGG) and Diversified Currency Opportunities (JGT) sold U.S. Treasury futures as part of an overall portfolio construction strategy to manage portfolio duration and yield curve exposure. The Fund's also used selected foreign bond futures to actively manage exposure to those markets.
The average notional amount of futures contracts outstanding during the fiscal year ended December 31, 2013, was as follows:
| Global Income Opportunities (JGG) | Diversified Currency Opportunities (JGT) | ||||||||||
Average notional amount of futures contracts outstanding* | $ | 47,437,834 | $ | 69,858,434 | |||||||
* The average notional amount is calculated based on the absolute aggregate notional amount of contracts outstanding at the beginning of the fiscal year and at the end of each quarter within the current fiscal year.
The following table presents the fair value of all futures contracts held by the Funds as of December 31, 2013, the location of these instruments on the Statement of Assets and Liabilities and the primary underlying risk exposure.
Location on the Statement of Assets and Liabilities | |||||||||||||||||||||||
Underlying | Derivative | Asset Derivatives | (Liability) Derivatives | ||||||||||||||||||||
Risk Exposure | Instrument | Location | Value | Location | Value | ||||||||||||||||||
Global Income Opportunities (JGG) | |||||||||||||||||||||||
Interest rate | Futures contracts | Receivable for variation margin on futures contracts* | $ | 213,201 | — | $ | — | ||||||||||||||||
Interest rate | Futures contracts | Receivable for variation margin of futures contracts* | (64,211 | ) | — | — | |||||||||||||||||
Diversified Currency Opportunities (JGT) | |||||||||||||||||||||||
Interest rate | Futures contracts | Receivable for variation margin on futures contracts* | $ | 974,730 | — | $ | — | ||||||||||||||||
* Value represents unrealized appreciation (depreciation) of futures contracts as reported on the Fund's Portfolio of Investments and not cash collateral at brokers, if any, or the receivable or payable for variation margin on futures contracts presented on the Statement of Assets and Liabilities.
The following table presents the amount of net realized gain (loss) and change in net unrealized appreciation (depreciation) recognized on futures contracts during the fiscal year ended December 31, 2013, and the primary underlying risk exposure.
Fund | Underlying Risk Exposure | Derivative Instrument | Net Realized Gain (Loss) from Futures Contracts | Change in Net Unrealized Appreciation (Depreciation) of Futures Contracts | |||||||||||||||
Global Income Opportunities (JGG) | Interest rate | Futures contracts | $ | 256,147 | $ | (107,787 | ) | ||||||||||||
Diversified Currency Opportunities (JGT) | Interest rate | Futures contracts | 336,174 | 974,730 | |||||||||||||||
Swap Contracts
Each Fund is authorized to enter into swap contracts consistent with its investment objectives and policies to reduce, increase or otherwise alter its risk profile or to alter its portfolio characteristics (i.e. duration, yield curve positioning and credit quality).
Interest Rate Swaps Contracts
Each Fund may use interest rate swap and forward interest rate swap contracts ("interest rate swap contracts") for purposes of risk reduction or expressing market views. An example of risk reduction would be to synthetically convert certain Fund positions in fixed-rate securities effectively into adjustable rate instruments and thereby shorten the average interest rate reset time and duration of each Fund's portfolio of investments. An example of
Nuveen Investments
54
expressing a market view would be to enter into swap contracts of different tenors that offset one another in whole or in part (in one case paying the fixed leg, in the other case receiving the fixed leg), in order to benefit if certain changes occur in the slope of the yield curve. Interest rate swap contracts involve each Fund's agreement with the counterparty to pay or receive a fixed rate payment in exchange for the counterparty receiving or paying a variable rate payment. Forward interest rate swap transactions involve the Fund's agreement with a counterparty to pay, in the future, a fixed or variable rate payment in exchange for the counterparty paying the Fund a variable or fixed rate payment, the accruals for which would begin at a specified date in the future (the "effective date"). The amount of the payment obligation is based on the notional amount of the swap contract. Swap contracts do not involve the delivery of securities or other underlying assets or principal. Accordingly, the risk of loss with respect to the swap counterparty on such transactions is limited to the net amount of interest payments that each Fund is to receive. Interest rate swap contracts are valued daily. Upon entering into an interest rate swap (and beginning on the effective date for a forward swap), each Fund accrues the fixed rate payment expected to be paid or received and the variable rate payment expected to be received or paid on interest rate swap contracts on a daily basis, and recognizes the daily change in the fair value of the Fund's contractual rights and obligations under the contracts. Payments received or made at the beginning of the measurement period, if any, are recognized as "Interest rate swaps premiums paid and/or received" on the Statement of Assets and Liabilities. Payments made or received upon entering into the swap agreement are to compensate for differences between the stated terms of the swap agreements and prevailing market conditions (credit spreads, currency exchange rates, interest rates, and other relevant factors). The net amount recorded on these transactions for each counterparty is recognized on the Statement of Assets and Liabilities as a component of "Unrealized appreciation or depreciation on interest rate swaps (, net)" with the change during the fiscal period recognized on the Statement of Operations as a component of "Change in net unrealized appreciation (depreciation) of swaps." Once periodic payments are settled in cash, the net amount is recognized as a component of "Net realized gain (loss) from swaps" on the Statement of Operations, in addition to the net realized gain or loss recorded upon the termination of interest rate swap contracts. For tax purposes, periodic payments are treated as ordinary income or expense.
During the fiscal year ended December 31, 2013 Global Income Opportunities (JGG) continued to use interest rate swaps to partially fix its interest cost of leverage, which the Fund employs through the use of bank borrowings, as well as part of an overall portfolio interest rate strategy.
The average notional amount of interest rate swap contracts outstanding during the fiscal year ended December 31, 2013, was as follows:
| Global Income Opportunities (JGG) | |||||||
Average notional amount of interest rate swap contracts outstanding* | $ | 57,738,000 | |||||
* The average notional amount is calculated based on the outstanding notional amount at the beginning of the fiscal year and at the end of each fiscal quarter within the current fiscal year.
Credit Default Swaps
A Fund may enter into a credit default swap contract to seek to maintain a total return on a particular investment or portion of its portfolio, or to take an active long or short position with respect to the likelihood of a particular issuer's default. Credit default swap contracts involve one party making a stream of payments to another party in exchange for the right to receive a specified return if/when there is a credit event by a third party. Generally, a credit event means bankruptcy, failure to pay, or restructuring. The specific credit events applicable for each credit default swap are stated in the terms of the particular swap agreement. As a purchaser of a credit default swap contract, the Fund pays to the counterparty a periodic interest fee based on the notional amount of the credit default swap.
Upon occurrence of a specific credit event with respect to the underlying referenced entity, the Fund is obligated to deliver that security, or an equivalent amount of cash, to the counterparty in exchange for receipt of the notional amount from the counterparty. The difference between the value of the security delivered and the notional amount received is recorded as a realized gain. Payments received or made at the beginning of the measurement period are recognized as a component of "Credit default swap premiums paid and/or received" on the Statement of Assets and Liabilities, when applicable. As a seller of a credit default swap contract, the Fund generally receives from the counterparty a periodic interest fee based on the notional amount of the credit default swap. Upon occurrence of a specific credit event with respect to the underlying referenced entity, the Fund will either receive that security, or an equivalent amount of cash, from the counterparty in exchange for payment of the notional amount to the counterparty, or pay a net settlement amount of the credit default swap contract less the recovery value of the referenced obligation or underlying securities comprising the referenced index. The difference between the value of the security received and the notional amount paid is recorded as a realized loss.
Changes in the value of a credit default swap during the fiscal period are recognized as a component of "Change in net unrealized appreciation (depreciation) of swaps," and realized gains and losses are recognized as a component of "Net realized gain (loss) from swaps" on the Statement of Operations. Investments in swaps cleared through an exchange obligate a Fund and the clearing broker to settle monies on a daily basis representing changes in the prior days "mark-to-market" of the swap. If a Fund has unrealized appreciation the clearing broker would credit the Fund's account with an amount equal to appreciation and conversely if the Fund has unrealized depreciation the clearing broker would debit a Fund's account with an amount equal to depreciation. These daily cash settlements are also known as "variation margin." Variation margin is recognized as a receivable and/or payable for "Variation margin on credit default swaps" on the Statement of Assets and Liabilities. The maximum potential amount of future payments the
Nuveen Investments
55
Notes to Financial Statements (continued)
Fund could incur as a seller of protection in a credit default swap contract is limited to the notional amount of the contract. The maximum potential amount would be offset by the recovery value, if any, of the respective referenced entity.
During the fiscal year ended December 31, 2013, Global Income Opportunities (JGG) continued to use credit default swaps as a way to take on credit risk and earn a commensurate credit spread.
The average notional amount of credit default swap contracts outstanding during the fiscal year ended December 31, 2013, was as follows:
| Global Income Opportunities (JGG) | |||||||
Average notional amount of credit default swap contracts outstanding* | $ | 5,241,622 | |||||
* The average notional amount is calculated based on the outstanding notional at the beginning of the fiscal year and at the end of each fiscal quarter within the current fiscal year.
The following table presents the fair value of all swap contracts held by the Funds as of December 31, 2013, the location of these instruments on the Statement of Assets and Liabilities and the primary underlying risk exposure.
Location on the Statement of Assets and Liabilities | |||||||||||||||||||||||
Underlying | Derivative | Asset Derivatives | (Liability) Derivatives | ||||||||||||||||||||
Risk Exposure | Instrument | Location | Value | Location | Value | ||||||||||||||||||
Global Income Opportunities (JGG) | |||||||||||||||||||||||
Credit | Swaps | Receivable for variation margin on credit default swaps** | $ | 31,957 | — | $ | — | ||||||||||||||||
Interest rate | Swaps | Unrealized appreciation on interest rate swaps | 3,102,729 | — | — | ||||||||||||||||||
** Value represents unrealized appreciation (depreciation) of swaps as reported in the Fund's Portfolio of Investments and not cash collateral with brokers, if any, the receivable or payable for variation margin on swap contracts or premiums paid or received presented on the Statement of Assets and Liabilities.
The following table presents the swap contacts, which are subject to netting agreements, as well as the collateral delivered related to those swap contracts.
| Counterparty | Gross Unrealized Appreciation on Interest Rate Swaps*** | Gross Unrealized (Depreciation) on Interest Rate Swaps*** | Amounts Netted on Statement of Assets and Liabilities | Net Unrealized Appreciation on Interest Rate Swaps | Collateral Pledged to (from) Counterparty | Net Exposure | |||||||||||||||||||||||||
Global Income Opportunities (JGG) | |||||||||||||||||||||||||||||||
JPMorgan | $ | 2,149,631 | $ | — | $ | — | $ | 2,149,631 | $ | (2,149,631 | ) | $ | — | ||||||||||||||||||
Morgan Stanley | 953,098 | — | — | 953,098 | (397,845 | ) | 555,253 | ||||||||||||||||||||||||
Total | $ | 3,102,729 | $ | — | $ | — | $ | 3,102,729 | $ | (2,547,476 | ) | $ | 555,253 | ||||||||||||||||||
*** Represents gross unrealized appreciation (depreciation) for the counterparty as reported in the Fund's Portfolio of Investments.
The following table presents the amount of net realized gain (loss) and change in net unrealized appreciation (depreciation) recognized on swap contracts during the fiscal year ended December 31, 2013, and the primary underlying risk exposure.
Fund | Underlying Risk Exposure | Derivative Instrument | Net Realized Gain (Loss) from Swaps | Change in Net Unrealized Appreciation (Depreciation) of Swaps | |||||||||||||||
Global Income Opportunities (JGG) | |||||||||||||||||||
Credit | Swaps | $ | 1,183,380 | $ | (77,051 | ) | |||||||||||||
Interest rate | Swaps | (134,064 | ) | 2,920,495 | |||||||||||||||
Total | $ | 1,049,316 | $ | 2,843,444 | |||||||||||||||
Options Transactions
The purchase of options and/or swaptions involves the risk of loss of all or a part of the cash paid for the options (the premium). The market risk associated with purchasing options and/or swaptions is limited to the premium paid. The counterparty credit risk of purchasing options and/or swaptions, however, needs also to take into account the current value of the option, as this is the performance expected from the counterparty. When a Fund purchases an option and/or swaption, an amount equal to the premium paid (the premium plus commission) is recognized as a component of "Options and/or Swaptions purchased, at value" on the Statement of Assets and Liabilities. When a Fund writes an option and/or swaption, an amount equal to the net premium received (the premium less commission) is recognized as a component of "Options and/or Swaptions written, at value" on the Statement of Assets and Liabilities and is subsequently adjusted to reflect the current value of the written option and/or swaption until the option and/or swaption is exercised or expires or the Fund enters into a closing purchase transaction. The changes in the value of options and/or swaptions purchased
Nuveen Investments
56
during the fiscal period are recognized as a component of "Change in net unrealized appreciation (depreciation) of options and/or swaptions purchased" on the Statement of Operations. The changes in the value of options and/or swaptions written during the fiscal period are recognized as a component of "Change in net unrealized appreciation (depreciation) of options and/or swaptions written" on the Statement of Operations. When an option and/or swaption is exercised or expires or a Fund enters into a closing purchase transaction, the difference between the net premium received and any amount paid at expiration or on executing a closing purchase transaction, including commission, is recognized as a component of "Net realized gain (loss) from options and/or swaptions purchased and/or written" on the Statement of Operations. The Fund, as a writer of an option and/or swaption, has no control over whether the underlying instrument may be sold (called) or purchased (put) and as a result bears the risk of an unfavorable change in the market value of the instrument underlying the written option and/or swaption. There is also the risk the Fund may not be able to enter into a closing transaction because of an illiquid market.
During the fiscal year ended December 31, 2013, Global Income Opportunities (JGG) and Diversified Currency Opportunities (JGT) wrote put options and purchased call options on select currencies in an attempt to benefit from changes in the spot values of these currencies.
The average notional amount of outstanding options contracts during the fiscal year ended December 31, 2013, were as follows:
| Global Income Opportunities (JGG) | Diversified Currency Opportunities (JGT) | ||||||||||
Average notional amount of outstanding options purchased* | $ | 4,938,541 | $ | 37,278,195 | |||||||
| Global Income Opportunities (JGG) | Diversified Currency Opportunities (JGT) | ||||||||||
Average notional amount of outstanding options written* | $ | 585,750 | $ | 12,105,500 | |||||||
* The average notional amount is calculated based on the outstanding notional amount at the beginning of the fiscal year and at the end of each fiscal quarter within the current fiscal year.
The following table presents the amount of net realized gain (loss) and change in net unrealized appreciation (depreciation) on options contracts during the fiscal year ended December 31, 2013, and the primary underlying risk exposure.
Fund | Underlying Risk Exposure | Derivative Instrument | Net Realized Gain (Loss) from Options Purchased/Written | Change in Net Unrealized Appreciation (Depreciation) of Options Purchased/Written | |||||||||||||||
Global Income Opportunities (JGG) | |||||||||||||||||||
Foreign currency exchange rate | Options purchased | $ | (256,883 | ) | $ | — | |||||||||||||
Foreign currency exchange rate | Options written | 29,625 | — | ||||||||||||||||
Diversified Currency Opportunities (JGT) | |||||||||||||||||||
Foreign currency exchange rate | Options purchased | $ | (1,329,323 | ) | $ | — | |||||||||||||
Foreign currency exchange rate | Options written | 612,250 | — | ||||||||||||||||
Market and Counterparty Credit Risk
In the normal course of business each Fund may invest in financial instruments and enter into financial transactions where risk of potential loss exists due to changes in the market (market risk) or failure of the other party to the transaction to perform (counterparty credit risk). The potential loss could exceed the value of the financial assets recorded on the financial statements. Financial assets, which potentially expose each Fund to counterparty credit risk, consist principally of cash due from counterparties on forward, option and swap transactions, when applicable. The extent of each Fund's exposure to counterparty credit risk in respect to these financial assets approximates their carrying value as recorded on the Statement of Assets and Liabilities.
Each Fund helps manage counterparty credit risk by entering into agreements only with counterparties the Adviser believes have the financial resources to honor their obligations and by having the Adviser monitor the financial stability of the counterparties. Additionally, counterparties may be required to pledge collateral daily (based on the daily valuation of the financial asset) on behalf of each Fund with a value approximately equal to the amount of any unrealized gain above a pre-determined threshold. Reciprocally, when each Fund has an unrealized loss, the Funds have instructed the custodian to pledge assets of the Funds as collateral with a value approximately equal to the amount of the unrealized loss above a pre-determined threshold. Collateral pledges are monitored and subsequently adjusted if and when the valuations fluctuate, either up or down, by at least the pre-determined threshold amount.
Nuveen Investments
57
Notes to Financial Statements (continued)
4. Fund Shares
Transactions in Fund shares were as follows:
| Global Income Opportunities (JGG) | Diversified Currency Opportunities (JGT) | ||||||||||||||||||
| Year Ended 12/31/13 | Year Ended 12/31/12 | Year Ended 12/31/13 | Year Ended 12/31/12 | ||||||||||||||||
Shares issued in reorganization | — | — | — | 5,096,842 | |||||||||||||||
Shares issued to shareholders due to reinvestment of distributions | — | — | — | — | |||||||||||||||
Shares repurchased and retired | (69,600 | ) | — | (1,962,431 | ) | (357,790 | ) | ||||||||||||
Weighted average: | |||||||||||||||||||
Price per share repurchased and retired | $ | 11.56 | $ | — | $ | 10.84 | $ | 12.85 | |||||||||||
Discount per share repurchased and retired | 13.94 | % | — | 15.39 | % | 12.07 | % | ||||||||||||
5. Investment Transactions
Purchases and sales (including maturities but excluding short-term investments and derivative transactions) for the fiscal year ended December 31, 2013, were as follows:
| Global Income Opportunities (JGG) | Diversified Currency Opportunities (JGT) | ||||||||||
Purchases | $ | 136,407,706 | $ | 421,924,623 | |||||||
Sales and maturities | 150,148,820 | 364,495,403 | |||||||||
Transactions in options written for each Fund during the fiscal year ended December 31, 2013, were as follows:
| Global Income Opportunities (JGG) | Diversified Currency Opportunities (JGT) | ||||||||||||||||||
| Number of Contracts | Premiums Received | Number of Contracts | Premiums Received | ||||||||||||||||
Options outstanding, beginning of period | — | $ | — | — | $ | — | |||||||||||||
Options written | 1 | 29,625 | 1 | 612,250 | |||||||||||||||
Options expired | (1 | ) | (29,625 | ) | (1 | ) | (612,250 | ) | |||||||||||
Options outstanding, end of period | — | $ | — | — | $ | — | |||||||||||||
6. Income Tax Information
Each Fund is a separate taxpayer for federal income tax purposes. Each Fund intends to distribute substantially all of its investment company taxable income to shareholders and to otherwise comply with the requirements of Subchapter M of the Internal Revenue Code applicable to regulated investment companies. In any year when the Funds realize net capital gains, each Fund may choose to distribute all or a portion of its net capital gains to shareholders, or alternatively, to retain all or a portion of its net capital gains and pay federal corporate income taxes on such retained gains.
For all open tax years and all major taxing jurisdictions, management of the Funds has concluded that there are no significant uncertain tax positions that would require recognition in the financial statements. Open tax years are those that are open for examination by taxing authorities (i.e., generally the last four tax year ends and the interim tax period since then). Furthermore, management of the Funds is also not aware of any tax positions for which it is reasonably possible that the total amounts of unrecognized tax benefits will significantly change in the next twelve months.
The following information is presented on an income tax basis. Differences between amounts for financial statement and federal income tax purposes are primarily due to the amortization of premium, recognition of unrealized gain or loss for tax (mark-to-market) for certain foreign currency contracts, and timing differences in recognizing certain gains and losses on investment transactions. To the extent that differences arise that are permanent in nature, such amounts are reclassified within the capital accounts as detailed below. Temporary differences do not require reclassification. Temporary and permanent differences do not impact the net asset values of the Funds.
Nuveen Investments
58
As of December 31, 2013, the cost and unrealized appreciation (depreciation) of investments (excluding investments in derivatives), as determined on a federal income tax basis, were as follows:
| Global Income Opportunities (JGG) | Diversified Currency Opportunities (JGT) | ||||||||||
Cost of investments | $ | 187,967,886 | $ | 580,631,922 | |||||||
Gross unrealized: | |||||||||||
Appreciation | $ | 1,766,296 | $ | 2,827,614 | |||||||
Depreciation | (14,583,751 | ) | (35,915,694 | ) | |||||||
Net unrealized appreciation (depreciation) of investments | $ | (12,817,455 | ) | $ | (33,088,080 | ) | |||||
Permanent differences, primarily due to reorganization adjustments, net operating losses, return of capital distributions, foreign currency reclasses, distribution reclasses, nondeductible stock issuance costs and treatment of notional principal contracts, resulted in reclassifications among the Funds' components of net assets as of December 31, 2013, the Funds' tax year end, as follows:
| Global Income Opportunities (JGG) | Diversified Currency Opportunities (JGT) | ||||||||||
Paid-in surplus | $ | (9,942,604 | ) | $ | (76,363,663 | ) | |||||
Undistributed (Over-distribution of) net investment income | 2,850,378 | 11,217,001 | |||||||||
Accumulated net realized gain (loss) | 7,092,226 | 65,146,662 | |||||||||
The tax components of undistributed net ordinary income and net long-term capital gains as of December 31, 2013, the Funds' tax year end, were as follows:
| Global Income Opportunities (JGG) | Diversified Currency Opportunities (JGT) | ||||||||||
Undistributed net ordinary income | $ | — | $ | — | |||||||
Undistributed net long-term capital gains | — | — | |||||||||
The tax character of distributions paid during the Funds' tax years ended December 31, 2013 and December 31, 2012, was designated for purposes of the dividends paid deduction as follows:
| 2013 | Global Income Opportunities (JGG) | Diversified Currency Opportunities (JGT) | |||||||||
Distributions from net ordinary income1 | $ | — | $ | — | |||||||
Distributions from net long-term capital gains2 | 770,358 | 1,486,107 | |||||||||
Return of capital | 9,942,604 | 48,832,158 | |||||||||
2012 | Global Income Opportunities (JGG) | Diversified Currency Opportunities (JGT) | |||||||||
Distributions from net ordinary income1 | $ | 9,836,192 | $ | 12,219,580 | |||||||
Distributions from net long-term capital gains | 1,347,834 | 19,130,416 | |||||||||
Return of capital | — | 22,123,393 | |||||||||
1 Net ordinary income consists of net taxable income derived from dividends and interest, and current year earnings and profits attributable to realized gains.
2 The Funds designate as long-term capital gain dividend, pursuant to the Internal Revenue Code Section 852 (b)(3), the amount necessary to reduce earnings and profits of the Funds related to net capital gain to zero for the tax year ended December 31, 2013.
Nuveen Investments
59
Notes to Financial Statements (continued)
The Funds have elected to defer late-year losses, in accordance with federal income tax rules. These losses are treated as having arisen on the first day of the following fiscal year. The Funds have elected to defer losses as follows:
| Global Income Opportunities (JGG) | Diversified Currency Opportunities (JGT) | ||||||||||
Post-October capital losses3 | $ | — | $ | 3,795,322 | |||||||
Late-year ordinary losses4 | 956,385 | 14,378,080 | |||||||||
3 Capital losses incurred from November 1, 2013 through December 31, 2013, the Funds' tax year end.
4 Specified losses incurred from November 1, 2013 through December 31, 2013.
7. Management Fees and Other Transactions with Affiliates
Each Fund's management fee compensates the Adviser for overall investment advisory and administrative services and general office facilities. The Sub-Adviser is compensated for its services to the Funds from the management fees paid to the Adviser.
Each Fund's management fee consists of two components – a fund-level fee, based only on the amount of assets within each individual Fund, and a complex-level fee, based on the aggregate amount of all eligible fund assets managed by the Adviser. This pricing structure enables each Fund's shareholders to benefit from growth in the assets within their respective Fund as well as from growth in the amount of complex-wide assets managed by the Adviser.
The annual fund-level fee for each Fund, payable monthly, is calculated according to the following schedule:
Average Daily Managed Assets* | Fund-Level Fee Rate | ||||||
For the first $500 million | .7000 | % | |||||
For the next $500 million | .6750 | ||||||
For the next $500 million | .6500 | ||||||
For the next $500 million | .6250 | ||||||
For managed assets over $2 billion | .6000 | ||||||
The annual complex-level fee for each Fund, payable monthly, is calculated according to the following schedule:
Complex-Level Managed Asset Breakpoint Level* | Effective Rate at Breakpoint Level | ||||||
| $55 billion | .2000 | % | |||||
| $56 billion | .1996 | ||||||
| $57 billion | .1989 | ||||||
| $60 billion | .1961 | ||||||
| $63 billion | .1931 | ||||||
| $66 billion | .1900 | ||||||
| $71 billion | .1851 | ||||||
| $76 billion | .1806 | ||||||
| $80 billion | .1773 | ||||||
| $91 billion | .1691 | ||||||
| $125 billion | .1599 | ||||||
| $200 billion | .1505 | ||||||
| $250 billion | .1469 | ||||||
| $300 billion | .1445 | ||||||
* For the fund-level and complex-level fees, managed assets include closed-end fund assets managed by the Adviser that are attributable to certain types of leverage. For these purposes, leverage includes the funds' use of preferred stock and borrowings and certain investments in the residual interest certificates (also called inverse floating rate securities) in tender option bond (TOB) trusts, including the portion of assets held by a TOB trust that has been effectively financed by the trust's issuance of floating rate securities, subject to an agreement by the Adviser as to certain funds to limit the amount of such assets for determining managed assets in certain circumstances. The complex-level fee is calculated based upon the aggregate daily managed assets of all Nuveen Funds that constitute "eligible assets." Eligible assets do not include assets attributable to investments in other Nuveen Funds or assets in excess of $2 billion added to the Nuveen Fund complex in connection with the Adviser's assumption of the management of the former First American Funds effective January 1, 2011. As of December 31, 2013, the complex-level fee rate for each of these Funds was .1686%.
The Funds pay no compensation directly to those of its trustees who are affiliated with the Adviser or to its officers, all of whom receive remuneration for their services to the Funds from the Adviser or its affiliates. The Board of Trustees has adopted a deferred compensation plan for independent trustees that enables trustees to elect to defer receipt of all or a portion of the annual compensation they are entitled to receive from certain Nuveen-advised funds. Under the plan, deferred amounts are treated as though equal dollar amounts had been invested in shares of select Nuveen-advised funds.
Nuveen Investments
60
8. Borrowing Arrangements
Global Income Opportunities (JGG) has entered into a $67 million (maximum commitment amount) senior committed secured 364-day revolving line of credit ("Borrowings"), renewable annually, with its custodian bank. As of December 31, 2013, the outstanding balance on these Borrowings was $56 million. During the fiscal year ended December 31, 2013, the average daily balance outstanding and annual interest rate on these Borrowings were $59 million and .94%, respectively.
In order to maintain these Borrowings, the Fund must meet certain collateral, asset coverage and other requirements. Borrowings outstanding are fully secured by securities held in the Fund's portfolio of investments.
Interest is charged on these Borrowings at a rate per annum equal to the higher of (a) the overnight LIBOR (London Inter-bank Offered Rate) rate plus .80% or the Federal Funds rate plus .80%. In addition to interest expense, the Fund accrues a 0.15% per annum commitment fee and a .10% per annum facility fee based on the total maximum commitment amount of the Borrowings through the renewal date.
Borrowings outstanding are recognized as "Borrowings" on the Statement of Assets and Liabilities. Interest expense and commitment fees are recognized as a component of "Interest expense on borrowings" on the Statement of Operations.
Nuveen Investments
61
Additional
Fund Information
Board of Trustees
William Adams IV* | Robert P. Bremner | Jack B. Evans | William C. Hunter | David J. Kundert | John K. Nelson | ||||||||||||||||||
William J. Schneider | Thomas S. Schreier, Jr.* | Judith M. Stockdale | Carole E. Stone | Virginia L. Stringer | Terence J. Toth | ||||||||||||||||||
* Interested Board Member.
| Fund Manager Nuveen Fund Advisors, LLC 333 West Wacker Drive Chicago, IL 60606 | Custodian State Street Bank & Trust Company Boston, MA 02111 | Legal Counsel Chapman and Cutler LLP Chicago, IL 60603 | Independent Registered Public Accounting Firm PricewaterhouseCoopers LLP Chicago, IL 60606 | Transfer Agent and Shareholder Services State Street Bank & Trust Company Nuveen Funds P.O. Box 43071 Providence, RI 02940-3071 (800) 257-8787 | |||||||||||||||
Quarterly Form N-Q Portfolio of Investments Information
Each Fund is required to file its complete schedule of portfolio holdings with the Securities and Exchange Commission (SEC) for the first and third quarters of each fiscal year on Form N-Q. You may obtain this information directly from the SEC. Visit the SEC on-line at http://www.sec.gov or in person at the SEC's Public Reference Room in Washington, D.C. Call the SEC toll-free at (800) SEC -0330 for room hours and operation.
Nuveen Funds' Proxy Voting Information
You may obtain (i) information regarding how each fund voted proxies relating to portfolio securities held during the most recent twelve-month period ended June 30, without charge, upon request, by calling Nuveen Investments toll-free at (800) 257-8787 or on Nuveen's website at www.nuveen.com and (ii) a description of the policies and procedures that each fund used to determine how to vote proxies relating to portfolio securities without charge, upon request, by calling Nuveen Investments toll free at (800) 257-8787. You may also obtain this information directly from the SEC. Visit the SEC on-line at http://www.sec.gov.
CEO Certification Disclosure
Each Fund's Chief Executive Officer (CEO) has submitted to the New York Stock Exchange (NYSE) the annual CEO certification as required by Section 303A.12(a) of the NYSE Listed Company Manual.
Each Fund has filed with the SEC the certification of its CEO and Chief Financial Officer required by Section 302 of the Sarbanes-Oxley Act.
Share Information
Each Fund intends to repurchase shares of its own common stock at such times and in such amounts as is deemed advisable. During the period covered by this report, the Funds repurchased shares of their common stock as shown in the accompanying table.
JGG | JGT | ||||||||||
Shares repurchased | 69,600 | 1,962,431 | |||||||||
Any future repurchases will be reported to shareholders in the next annual or semi-annual report.
Nuveen Investments
62
Glossary of Terms
Used in this Report
n Average Annual Total Return: This is a commonly used method to express an investment's performance over a particular, usually multi-year time period. It expresses the return that would have been necessary each year to equal the investment's actual cumulative performance (including change in NAV or market price and reinvested dividends and capital gains distributions, if any) over the time period being considered.
n Barclays Global Aggregate Bond Index: An index that provides a broad-based measure of the global investment-grade fixed income markets. Index returns assume reinvestment of distributions, but do not reflect any applicable sales charges.
n JGT Blended Index (Comparative Index): A 50% blend of the 1) Citigroup Non-US World Government Bond 1-3 Year Index: an index of fixed rate government bonds with a maturity of one year or longer and amounts outstanding of at least U.S. $25 million and 2) JPMorgan Emerging Local Markets Index Plus: an index that tracks total returns for local-currency-denominated money market instruments. It consists of foreign exchange forward contracts laddered with maturities ranging from one to three months. Country weights are based on a trade-weighted allocation, with maximum weight of 10% for countries with convertible currencies and 2% for countries with non-convertible currencies. Index returns assume reinvestment of distributions, but do not reflect any applicable sales charges or management fees.
n Dow Jones Industrial Average: A price-weighted index of the 30 largest, most widely held stocks traded on the New York Stock Exchange. The index returns assume reinvestment of distributions, but do not reflect any applicable sales charges or management fees.
n Duration: Duration is a measure of the expected period over which a bond's principal and interest will be paid, and consequently is a measure of the sensitivity of a bond's or bond fund's value to changes when market interest rates change. Generally, the longer a bond's or fund's duration, the more the price of the bond or fund will change as interest rates change.
n Gross Domestic Product (GDP): The total market value of all final goods and services produced in a country/region in a given year, equal to total consumer, investment and government spending, plus the value of exports, minus the value of imports.
n Leverage: Leverage is created whenever a fund has investment exposure (both reward and/or risk) equivalent to more than 100% of the investment capital.
n Net Asset Value (NAV) Per Share: A fund's Net Assets is equal to its total assets (securities, cash, accrued earnings and receivables) less its total liabilities. NAV per share is equal to the fund's Net Assets divided by its number of shares outstanding.
n Nikkei Index: A price-weighted average comprised of Japan's 225 top-rated Japanese companies linked in the first section of the Tokyo Stock Exchange. The index returns assume reinvestment of distributions, but do not reflect any applicable sales charges or management fees.
n Russell 2000® Index: An index that measures the performance of the small-cap segment of the U.S. equity universe. The Russell 2000® Index is a subset of the Russell 3000® Index representing approximately 10% of the total market capitalization of that index. It includes approximately 2,000 of the smallest securities based on a combination of their market cap and current index membership. The index returns assume reinvestment of distributions, but do not reflect any applicable sales charges or management fees.
n S&P 500® Index: An unmanaged index generally considered representative of the U.S. stock market. Index returns assume reinvestment of distributions, but do not include the effects of any applicable sales charges or management fees.
Nuveen Investments
63
Reinvest Automatically,
Easily and Conveniently
Nuveen makes reinvesting easy. A phone call is all it takes to set up your reinvestment account.
Nuveen Closed-End Funds Automatic Reinvestment Plan
Your Nuveen Closed-End Fund allows you to conveniently reinvest distributions in additional Fund shares.
By choosing to reinvest, you'll be able to invest money regularly and automatically, and watch your investment grow through the power of compounding. Just like distributions in cash, there may be times when income or capital gains taxes may be payable on distributions that are reinvested.
It is important to note that an automatic reinvestment plan does not ensure a profit, nor does it protect you against loss in a declining market.
Easy and convenient
To make recordkeeping easy and convenient, each quarter you'll receive a statement showing your total distributions, the date of investment, the shares acquired and the price per share, and the total number of shares you own.
How shares are purchased
The shares you acquire by reinvesting will either be purchased on the open market or newly issued by the Fund. If the shares are trading at or above net asset value at the time of valuation, the Fund will issue new shares at the greater of the net asset value or 95% of the then-current market price. If the shares are trading at less than net asset value, shares for your account will be purchased on the open market. If the Plan Agent begins purchasing Fund shares on the open market while shares are trading below net asset value, but the Fund's shares subsequently trade at or above their net asset value before the Plan Agent is able to complete its purchases, the Plan Agent may cease open-market purchases and may invest the uninvested portion of the distribution in newly-issued Fund shares at a price equal to the greater of the shares' net asset value or 95% of the shares' market value on the last business day immediately prior to the purchase date. Distributions received to purchase shares in the open market will normally be invested shortly after the distribution payment date. No interest will be paid on distributions awaiting reinvestment. Because the market price of the shares may increase before purchases are completed, the average purchase price per share may exceed the market price at the time of valuation, resulting in the acquisition of fewer shares than if the distribution had been paid in shares issued by the Fund. A pro rata portion of any applicable brokerage commissions on open market purchases will be paid by Plan participants. These commissions usually will be lower than those charged on individual transactions.
Flexible
You may change your distribution option or withdraw from the Plan at any time, should your needs or situation change.
You can reinvest whether your shares are registered in your name, or in the name of a brokerage firm, bank, or other nominee. Ask your investment advisor if his or her firm will participate on your behalf. Participants whose shares are registered in the name of one firm may not be able to transfer the shares to another firm and continue to participate in the Plan.
The Fund reserves the right to amend or terminate the Plan at any time. Although the Fund reserves the right to amend the Plan to include a service charge payable by the participants, there is no direct service charge to participants in the Plan at this time.
Call today to start reinvesting distributions
For more information on the Nuveen Automatic Reinvestment Plan or to enroll in or withdraw from the Plan, speak with your financial advisor or call us at (800) 257-8787.
Nuveen Investments
64
Board
Members & Officers (Unaudited)
The management of the Funds, including general supervision of the duties performed for the Funds by the Adviser, is the responsibility of the Board of Trustees of the Funds. The number of trustees of the Funds is currently set at twelve. None of the trustees who are not "interested" persons of the Funds (referred to herein as "independent trustees") has ever been a director or employee of, or consultant to, Nuveen or its affiliates. The names and business addresses of the trustees and officers of the Funds, their principal occupations and other affiliations during the past five years, the number of portfolios each oversees and other directorships they hold are set forth below.
| Name, Year of Birth & Address | Position(s) Held with the Funds | Year First Elected or Appointed and Term(1) | Principal Occupation(s) Including other Directorships During Past 5 Years | Number of Portfolios in Fund Complex Overseen by Board Member | |||||||||||||||
Independent Board Members: | |||||||||||||||||||
| nWILLIAM J. SCHNEIDER | |||||||||||||||||||
| 1944 333 W. Wacker Drive Chicago, IL 60606 | Chairman and Board Member | 1996 Class III | Chairman of Miller-Valentine Partners Ltd., a real estate investment company; formerly, Senior Partner and Chief Operating Officer (retired 2004) of Miller-Valentine Group; an owner in several other Miller Valentine entities; Board Member of Mid-America Health System, Tech Town, Inc., a not-for-profit community development company, Board Member of WDPR Public Radio station; formerly, member, Business Advisory Council, Cleveland Federal Reserve Bank and University of Dayton Business School Advisory Council. | 206 | |||||||||||||||
| nROBERT P. BREMNER | |||||||||||||||||||
| 1940 333 W. Wacker Drive Chicago, IL 60606 | Board Member | 1996 Class lll | Private Investor and Management Consultant; Treasurer and Director, Humanities Council of Washington, D.C.; Board Member, Independent Directors Council affiliated with the Investment Company Institute. | 206 | |||||||||||||||
| nJACK B. EVANS | |||||||||||||||||||
| 1948 333 W. Wacker Drive Chicago, IL 60606 | Board Member | 1999 Class lll | President, The Hall-Perrine Foundation, a private philanthropic corporation (since 1996); Chairman, United Fire Group, a publicly held company; formerly, Member and President Pro-Tem of the Board of Regents for the State of Iowa University System; Director, Source Media Group; Life Trustee of Coe College; formerly, Director, Alliant Energy; formerly, Director, Federal Reserve Bank of Chicago; formerly, President and Chief Operating Officer, SCI Financial Group, Inc., a regional financial services firm. | 206 | |||||||||||||||
| nWILLIAM C. HUNTER | |||||||||||||||||||
| 1948 333 W. Wacker Drive Chicago, IL 60606 | Board Member | 2004 Class l | Dean Emeritus (since June 30, 2012), formerly, Dean, Tippie College of Business, University of Iowa (2006-2012); Director (since 2004) of Xerox Corporation; Director (since 2005), and President (since July 2012) Beta Gamma Sigma, Inc., The International Honor Society; Director of Wellmark, Inc. (since 2009); formerly, Dean and Distinguished Professor of Finance, School of Business at the University of Connecticut (2003-2006); previously, Senior Vice President and Director of Research at the Federal Reserve Bank of Chicago (1995-2003); formerly, Director (1997-2007), Credit Research Center at Georgetown University. | 206 | |||||||||||||||
| nDAVID J. KUNDERT | |||||||||||||||||||
| 1942 333 W. Wacker Drive Chicago, IL 60606 | Board Member | 2005 Class ll | Formerly, Director, Northwestern Mutual Wealth Management Company (2006-2013), retired (since 2004) as Chairman, JPMorgan Fleming Asset Management, President and CEO, Banc One Investment Advisors Corporation, and President, One Group Mutual Funds; prior thereto, Executive Vice President, Banc One Corporation and Chairman and CEO, Banc One Investment Management Group; Regent Emeritus, Member of Investment Committee, Luther College; member of the Wisconsin Bar Association; member of Board of Directors, Friends of Boerner Botanical Gardens; member of Board of Directors and Chair of Investment Committee, Greater Milwaukee Foundation; member of the Board of Directors (Milwaukee), College Possible. | 206 | |||||||||||||||
Nuveen Investments
65
Board Members & Officers (Unaudited) (continued)
| Name, Year of Birth & Address | Position(s) Held with the Funds | Year First Elected or Appointed and Term(1) | Principal Occupation(s) Including other Directorships During Past 5 Years | Number of Portfolios in Fund Complex Overseen by Board Member | |||||||||||||||
Independent Board Members (continued): | |||||||||||||||||||
| nJOHN K. NELSON | |||||||||||||||||||
| 1962 333 West Wacker Drive Chicago, IL 60606 | Board Member | 2013 Class ll | Senior external advisor to the financial services practice of Deloitte Consulting LLP (since 2012); Member of Board of Directors of Core12 LLC (since 2008), a private firm which develops branding, marketing and communications strategies for clients; Chairman of the Board of Trustees of Marian University (since 2010 as trustee, 2011 as Chairman); Director of The Curran Center for Catholic American Studies (since 2009) and The President's Council, Fordham University (since 2010); formerly, Chief Executive Officer of ABN AMRO N.V. North America, and Global Head of its Financial Markets Division (2007-2008); prior senior positions held at ABN AMRO include Corporate Executive Vice President and Head of Global Markets-the Americas (2006-2007), CEO of Whole- sale Banking North America and Global Head of Foreign Exchange and Futures Markets (2001-2006), and Regional Commercial Treasurer and Senior Vice President Trading-North America (1996-2001); formerly, Trustee at St. Edmund Preparatory School in New York City. | 206 | |||||||||||||||
| nJUDITH M. STOCKDALE | |||||||||||||||||||
| 1947 333 W. Wacker Drive Chicago, IL 60606 | Board Member | 1997 Class l | Formerly, Executive Director (1994-2012), Gaylord and Dorothy Donnelley Foundation (since 1994); prior thereto, Executive Director, Great Lakes Protection Fund (1990-1994). | 206 | |||||||||||||||
| nCAROLE E. STONE | |||||||||||||||||||
| 1947 333 W. Wacker Drive Chicago, IL 60606 | Board Member | 2007 Class l | Director, Chicago Board Options Exchange (since 2006); Director, C2 Options Exchange, Incorporated (since 2009); Director, CBOE Holdings, Inc. (since 2010); formerly, Commissioner, New York State Commission on Public Authority Reform (2005-2010); formerly, Chair, New York Racing Association Oversight Board (2005-2007). | 206 | |||||||||||||||
| nVIRGINIA L. STRINGER | |||||||||||||||||||
| 1944 333 W. Wacker Drive Chicago, IL 60606 | Board Member | 2011 Class l | Board Member, Mutual Fund Directors Forum; former governance consultant and non-profit board member; former Owner and President, Strategic Management Resources, Inc., a management consulting firm; former Member, Governing Board, Investment Company Institute's Independent Directors Council; previously, held several executive positions in general management, marketing and human resources at IBM and The Pillsbury Company; Independent Director, First American Fund Complex (1987-2010) and Chair (1997-2010). | 206 | |||||||||||||||
| nTERENCE J. TOTH | |||||||||||||||||||
| 1959 333 W. Wacker Drive Chicago, IL 60606 | Board Member | 2008 Class lI | Managing Partner, Promus Capital (since 2008); Director, Fulcrum IT Service LLC (since 2010), Quality Control Corporation (since 2012) and LogicMark LLC (since 2012); formerly, Director, Legal & General Investment Management America, Inc. (2008-2013); formerly, CEO and President, Northern Trust Global Investments (2004-2007); Executive Vice President, Quantitative Management & Securities Lending (2000-2004); prior thereto, various positions with Northern Trust Company (since 1994); member: Chicago Fellowship Board (since 2005), Catalyst Schools of Chicago Board (since 2008) and Chairman, and Mather Foundation Board (since 2012), and a member of its investment committee; formerly, Member, Northern Trust Mutual Funds Board (2005-2007), Northern Trust Global Investments Board (2004-2007), Northern Trust Japan Board (2004-2007), Northern Trust Securities Inc. Board (2003-2007) and Northern Trust Hong Kong Board (1997-2004). | 206 | |||||||||||||||
Nuveen Investments
66
| Name, Year of Birth & Address | Position(s) Held with the Funds | Year First Elected or Appointed and Term(1) | Principal Occupation(s) Including other Directorships During Past 5 Years | Number of Portfolios in Fund Complex Overseen by Board Member | |||||||||||||||
Interested Board Members: | |||||||||||||||||||
| nWILLIAM ADAMS IV(2) | |||||||||||||||||||
| 1955 333 W. Wacker Drive Chicago, IL 60606 | Board Member | 2013 Class ll | Senior Executive Vice President, Global Structured Products (since 2010); formerly, Executive Vice President, U.S. Structured Products, of Nuveen Investments, Inc. (1999-2010); Co-President of Nuveen Fund Advisors, LLC (since 2011); President (since 2011), formerly, Managing Director (2010-2011) of Nuveen Commodities Asset Management, LLC; Board Member of the Chicago Symphony Orchestra and of Gilda s Club Chicago. | 132 | |||||||||||||||
| nTHOMAS S. SCHREIER, JR.(2) | |||||||||||||||||||
| 1962 333 W. Wacker Drive Chicago, IL 60606 | Board Member | 2013 Class lll | Vice Chairman, Wealth Management of Nuveen Investments, Inc. (since 2011); Co-President of Nuveen Fund Advisors, LLC; Chairman of Nuveen Asset Management, LLC (since 2011); Co-Chief Executive Officer of Nuveen Securities, LLC (since 2011); Member of Board of Governors and Chairman's Council of the Investment Company Institute; formerly, Chief Executive Officer (2000-2010) and Chief Investment Officer (2007-2010) of FAF Advisors, Inc.; formerly, President of First American Funds (2001-2010). | 132 | |||||||||||||||
| Name, Year of Birth & Address | Position(s) Held with the Funds | Year First Elected or Appointed(3) | Principal Occupation(s) During Past 5 Years | Number of Portfolios in Fund Complex Overseen by Officer | |||||||||||||||
Officers of the Funds: | |||||||||||||||||||
| nGIFFORD R. ZIMMERMAN | |||||||||||||||||||
| 1956 333 W. Wacker Drive Chicago, IL 60606 | Chief Administrative Officer | 1988 | Managing Director (since 2002), and Assistant Secretary of Nuveen Securities, LLC; Managing Director (since 2004) and Assistant Secretary (since 1994) of Nuveen Investments, Inc.; Managing Director (since 2002), Assistant Secretary (since 1997) and Co-General Counsel (since 2011) of Nuveen Fund Advisors, LLC; Managing Director, Assistant Secretary and Associate General Counsel of Nuveen Asset Management, LLC (since 2011); Managing Director, Associate General Counsel and Assistant Secretary, of Symphony Asset Management LLC (since 2003); Vice President and Assistant Secretary of NWQ Investment Management Company, LLC (since 2002), Nuveen Investments Advisers Inc. (since 2002), Santa Barbara Asset Management, LLC (since 2006), and of Winslow Capital Management, LLC, (since 2010); Vice President and Assistant Secretary (since 2013), formerly, Chief Administrative Officer and Chief Compliance Officer (2006-2013) of Nuveen Commodities Asset Management, LLC; Chartered Financial Analyst. | 206 | |||||||||||||||
| nCEDRIC H. ANTOSIEWICZ | |||||||||||||||||||
| 1962 333 W. Wacker Drive Chicago, IL 60606 | Vice President | 2007 | Managing Director of Nuveen Securities, LLC. | 100 | |||||||||||||||
| nMARGO L. COOK | |||||||||||||||||||
| 1964 333 W. Wacker Drive Chicago, IL 60606 | Vice President | 2009 | Executive Vice President (since 2008) of Nuveen Investments, Inc. and of Nuveen Fund Advisors, LLC (since 2011); Managing Director-Investment Services of Nuveen Commodities Asset Management, LLC (since August 2011), previously, Head of Institutional Asset Management (2007-2008) of Bear Stearns Asset Management; Head of Institutional Asset Management (1986-2007) of Bank of NY Mellon; Chartered Financial Analyst. | 206 | |||||||||||||||
| nLORNA C. FERGUSON | |||||||||||||||||||
| 1945 333 W. Wacker Drive Chicago, IL 60606 | Vice President | 1998 | Managing Director (since 2005) of Nuveen Fund Advisors, LLC and Nuveen Securities, LLC (since 2004). | 206 | |||||||||||||||
Nuveen Investments
67
Board Members & Officers (Unaudited) (continued)
| Name, Year of Birth & Address | Position(s) Held with the Funds | Year First Elected or Appointed(3) | Principal Occupation(s) During Past 5 Years | Number of Portfolios in Fund Complex Overseen by Officer | |||||||||||||||
Officers of the Funds (continued): | |||||||||||||||||||
| nSTEPHEN D. FOY | |||||||||||||||||||
| 1954 333 W. Wacker Drive Chicago, IL 60606 | Vice President and Controller | 1998 | Senior Vice President (2010-2011), formerly, Vice President (2005-2010) and Funds Controller of Nuveen Securities, LLC; Senior Vice President (since 2013), formerly, Vice President of Nuveen Fund Advisors, LLC; Chief Financial Officer of Nuveen Commodities Asset Management, LLC (since 2010); Certified Public Accountant. | 206 | |||||||||||||||
| nSCOTT S. GRACE | |||||||||||||||||||
| 1970 333 W. Wacker Drive Chicago, IL 60606 | Vice President and Treasurer | 2009 | Managing Director, Corporate Finance & Development, Treasurer (since 2009) of Nuveen Securities, LLC; Managing Director and Treasurer (since 2009) of Nuveen Fund Advisors, LLC, Nuveen Investments Advisers, Inc., Nuveen Investments Holdings Inc. and (since 2011) Nuveen Asset Management, LLC; Vice President and Treasurer of NWQ Investment Management Company, LLC, Tradewinds Global Investors, LLC, Symphony Asset Management LLC and Winslow Capital Management, LLC.; Vice President of Santa Barbara Asset Management, LLC; formerly, Treasurer (2006-2009), Senior Vice President (2008-2009), previously, Vice President (2006-2008) of Janus Capital Group, Inc.; formerly, Senior Associate in Morgan Stanley's Global Financial Services Group (2000-2003); Chartered Accountant Designation. | 206 | |||||||||||||||
| nWALTER M. KELLY | |||||||||||||||||||
| 1970 333 W. Wacker Drive Chicago, IL 60606 | Chief Compliance Officer and Vice President | 2003 | Senior Vice President (since 2008) of Nuveen Investment Holdings, Inc. | 206 | |||||||||||||||
| nTINA M. LAZAR | |||||||||||||||||||
| 1961 333 W. Wacker Drive Chicago, IL 60606 | Vice President | 2002 | Senior Vice President of Nuveen Investment Holdings, Inc. | 206 | |||||||||||||||
| nKEVIN J. MCCARTHY | |||||||||||||||||||
| 1966 333 W. Wacker Drive Chicago, IL 60606 | Vice President and Secretary | 2007 | Managing Director and Assistant Secretary (since 2008), Nuveen Securities, LLC; Managing Director (since 2008), Assistant Secretary (since 2007) and Co-General Counsel (since 2011) of Nuveen Fund Advisors, LLC; Managing Director, Assistant Secretary and Associate General Counsel (since 2011) of Nuveen Asset Management, LLC; Managing Director (since 2008), and Assistant Secretary, Nuveen Investment Holdings, Inc.; Vice President (since 2007) and Assistant Secretary of Nuveen Investments Advisers Inc., NWQ Investment Management Company, LLC, NWQ Holdings, LLC, Symphony Asset Management LLC, Santa Barbara Asset Management, LLC, and of Winslow Capital Management, LLC. (since 2010); Vice President and Secretary (since 2010) of Nuveen Commodities Asset Management, LLC. | 206 | |||||||||||||||
| nKATHLEEN L. PRUDHOMME | |||||||||||||||||||
| 1953 901 Marquette Avenue Minneapolis, MN 55402 | Vice President and Assistant Secretary | 2011 | Managing Director, Assistant Secretary and Co-General Counsel (since 2011) of Nuveen Fund Advisors, LLC; Managing Director, Assistant Secretary and Associate General Counsel (since 2011) of Nuveen Asset Management, LLC; Managing Director and Assistant Secretary (since 2011) of Nuveen Securities, LLC; formerly, Deputy General Counsel, FAF Advisors, Inc. (2004-2010). | 206 | |||||||||||||||
Nuveen Investments
68
| Name, Year of Birth & Address | Position(s) Held with the Funds | Year First Elected or Appointed(3) | Principal Occupation(s) During Past 5 Years | Number of Portfolios in Fund Complex Overseen by Officer | |||||||||||||||
Officers of the Funds (continued): | |||||||||||||||||||
| nJOEL T. SLAGER | |||||||||||||||||||
| 1978 333 West Wacker Drive Chicago, IL 60606 | Vice President and Assistant Secretary | 2013 | Fund Tax Director for Nuveen Funds (since May, 2013); previously, Vice President of Morgan Stanley Investment Management, Inc., Assistant Treasurer of the Morgan Stanley Funds (from 2010 to 2013); Tax Director at PricewaterhouseCoopers LLP (from 2008 to 2010). | 206 | |||||||||||||||
(1) The Board Members serve three year terms. The Board of Trustees is divided into three classes. Class I, Class II, and Class III, with each being elected to serve until the third succeeding annual shareholders' meeting subsequent to its election or thereafter in each case when its respective successors are duly elected or appointed. The first year elected or appointed represents the year in which the board member was first elected or appointed to any fund in the Nuveen Complex.
(2) "Interested person" as defined in the 1940 Act, by reason of his position with Nuveen Investments, Inc. and certain of its subsidiaries, which are affiliates of the Nuveen Funds.
(3) Officers serve one year terms through August of each year. The year first elected or appointed represents the year in which the Officer was first elected or appointed to any fund in the Nuveen Complex.
Nuveen Investments
69
Notes
Notes

Nuveen Investments:
Serving Investors for Generations
Since 1898, financial advisors and their clients have relied on Nuveen Investments to provide dependable investment solutions through continued adherence to proven, long-term investing principles. Today, we offer a range of high quality equity and fixed-income solutions designed to be integral components of a well-diversified core portfolio.
Focused on meeting investor needs.
Nuveen Investments provides high-quality investment services designed to help secure the long-term goals of institutional and individual investors as well as the consultants and financial advisors who serve them. Nuveen Investments markets a wide range of specialized investment solutions which provide investors access to capabilities of its high-quality boutique investment affiliates—Nuveen Asset Management, Symphony Asset Management, NWQ Investment Management Company, Santa Barbara Asset Management, Tradewinds Global Investors, Winslow Capital Management and Gresham Investment Management. In total, Nuveen Investments managed approximately $215 billion as of September 30, 2013.
Find out how we can help you.
To learn more about how the products and services of Nuveen Investments may be able to help you meet your financial goals, talk to your financial advisor, or call us at (800) 257-8787. Please read the information provided carefully before you invest. Investors should consider the investment objective and policies, risk considerations, charges and expenses of any investment carefully. Where applicable, be sure to obtain a prospectus, which contains this and other relevant information. To obtain a prospectus, please contact your securities representative or Nuveen Investments, 333 W. Wacker Dr., Chicago, IL 60606. Please read the prospectus carefully before you invest or send money.
Learn more about Nuveen Funds at: www.nuveen.com/cef
Distributed by Nuveen Investments, LLC | 333 West Wacker Drive | Chicago, IL 60606 | www.nuveen.com/cef
EAN-G-1213D
ITEM 2. CODE OF ETHICS.
As of the end of the period covered by this report, the registrant has adopted a code of ethics that applies to the registrant’s principal executive officer, principal financial officer, principal accounting officer or controller, or persons performing similar functions. There were no amendments to or waivers from the Code during the period covered by this report. The registrant has posted the code of ethics on its website at www.nuveen.com/CEF/Shareholder/FundGovernance.aspx. (To view the code, click on Code of Conduct.)
ITEM 3. AUDIT COMMITTEE FINANCIAL EXPERT.
The registrant’s Board of Directors or Trustees (“Board”) determined that the registrant has at least one “audit committee financial expert” (as defined in Item 3 of Form N-CSR) serving on its Audit Committee. The registrant’s audit committee financial expert is Carole E. Stone, who is “independent” for purposes of Item 3 of Form N-CSR.
Ms. Stone served for five years as Director of the New York State Division of the Budget. As part of her role as Director, Ms. Stone was actively involved in overseeing the development of the State’s operating, local assistance and capital budgets, its financial plan and related documents; overseeing the development of the State’s bond-related disclosure documents and certifying that they fairly presented the State’s financial position; reviewing audits of various State and local agencies and programs; and coordinating the State’s system of internal audit and control. Prior to serving as Director, Ms. Stone worked as a budget analyst/examiner with increasing levels of responsibility over a 30 year period, including approximately five years as Deputy Budget Director. Ms. Stone has also served as Chair of the New York State Racing Association Oversight Board, as Chair of the Public Authorities Control Board, as a Commissioner on the New York State Commission on Public Authority Reform and as a member of the Boards of Directors of several New York State public authorities. These positions have involved overseeing operations and finances of certain entities and assessing the adequacy of project/entity financing and financial reporting. Currently, Ms. Stone is on the Board of Directors of CBOE Holdings, Inc., of the Chicago Board Options Exchange, and of C2 Options Exchange. Ms. Stone’s position on the boards of these entities and as a member of both CBOE Holdings’ Audit Committee and its Finance Committee has involved, among other things, the oversight of audits, audit plans and preparation of financial statements.
ITEM 4. PRINCIPAL ACCOUNTANT FEES AND SERVICES.
NUVEEN DIVERSIFIED CURRENCY OPPORTUNITIES FUND
The following tables show the amount of fees that PricewaterhouseCoopers LLP, the Fund’s auditor, billed to the Fund during the Fund’s last two full fiscal years. For engagements with PricewaterhouseCoopers LLP the Audit Committee approved in advance all audit services and non-audit services that PricewaterhouseCoopers LLP provided to the Fund, except for those non-audit services that were subject to the pre-approval exception under Rule 2-01 of Regulation S-X (the “pre-approval exception”). The pre-approval exception for services provided directly to the Fund waives the pre-approval requirement for services other than audit, review or attest services if: (A) the aggregate amount of all such services provided constitutes no more than 5% of the total amount of revenues paid by the Fund to its accountant during the fiscal year in which the services are provided; (B) the Fund did not recognize the services as non-audit services at the time of the engagement; and (C) the services are promptly brought to the Audit Committee’s attention, and the Committee (or its delegate) approves the services before the audit is completed.
The Audit Committee has delegated certain pre-approval responsibilities to its Chairman (or, in his absence, any other member of the Audit Committee).
SERVICES THAT THE FUND’S AUDITOR BILLED TO THE FUND
|
| Audit Fees Billed |
| Audit-Related Fees |
| Tax Fees |
| All Other Fees |
| ||||
Fiscal Year Ended |
| to Fund (1) |
| Billed to Fund (2) |
| Billed to Fund (3) |
| Billed to Fund (4) |
| ||||
December 31, 2013 |
| $ | 47,223 |
| $ | 0 |
| $ | 10,670 |
| $ | 0 |
|
|
|
|
|
|
|
|
|
|
| ||||
Percentage approved pursuant to pre-approval exception |
| 0 | % | 0 | % | 0 | % | 0 | % | ||||
|
|
|
|
|
|
|
|
|
| ||||
December 31, 2012 |
| $ | 46,441 |
| $ | 0 |
| $ | 2,650 |
| $ | 0 |
|
|
|
|
|
|
|
|
|
|
| ||||
Percentage approved pursuant to pre-approval exception |
| 0 | % | 0 | % | 0 | % | 0 | % | ||||
(1) “Audit Fees” are the aggregate fees billed for professional services for the audit of the Fund’s annual financial statements and services provided in connection with statutory and regulatory filings or engagements.
(2) “Audit Related Fees” are the aggregate fees billed for assurance and related services reasonably related to the performance of the audit or review of financial statements that are not reported under “Audit Fees”. These fees include offerings related to the Fund’s common shares and leverage.
(3) “Tax Fees” are the aggregate fees billed for professional services for tax advice, tax compliance, and tax planning. These fees include: all global withholding tax services; excise and state tax reviews; capital gain, tax equalization and taxable basis calculation performed by the principal accountant.
(4) “All Other Fees” are the aggregate fees billed for products and services other than “Audit Fees”, “Audit-Related Fees” and “Tax Fees”. These fees represent all “Agreed-Upon Procedures” engagements pertaining to the Fund’s use of leverage.
SERVICES THAT THE FUND’S AUDITOR BILLED TO THE
ADVISER AND AFFILIATED FUND SERVICE PROVIDERS
The following tables show the amount of fees billed by PricewaterhouseCoopers LLP to Nuveen Fund Advisors, LLC (formerly Nuveen Fund Advisors, Inc.) (the “Adviser”), and any entity controlling, controlled by or under common control with the Adviser that provides ongoing services to the Fund (“Affiliated Fund Service Provider”), for engagements directly related to the Fund’s operations and financial reporting, during the Fund’s last two full fiscal years.
The tables also show the percentage of fees subject to the pre-approval exception. The pre-approval exception for services provided to the Adviser and any Affiliated Fund Service Provider (other than audit, review or attest services) waives the pre-approval requirement if: (A) the aggregate amount of all such services provided constitutes no more than 5% of the total amount of revenues paid to PricewaterhouseCoopers LLP by the Fund, the Adviser and Affiliated Fund Service Providers during the fiscal year in which the services are provided that would have to be pre-approved by the Audit Committee; (B) the Fund did not recognize the services as non-audit services at the time of the engagement; and (C) the services are promptly brought to the Audit Committee’s attention, and the Committee (or its delegate) approves the services before the Fund’s audit is completed.
|
| Audit-Related Fees |
| Tax Fees Billed to |
| All Other Fees |
| |||
|
| Billed to Adviser and |
| Adviser and |
| Billed to Adviser |
| |||
|
| Affiliated Fund |
| Affiliated Fund |
| and Affiliated Fund |
| |||
Fiscal Year Ended |
| Service Providers |
| Service Providers |
| Service Providers |
| |||
December 31, 2013 |
| $ | 0 |
| $ | 0 |
| $ | 0 |
|
|
|
|
|
|
|
|
| |||
Percentage approved pursuant to pre-approval exception |
| 0 | % | 0 | % | 0 | % | |||
|
|
|
|
|
|
|
| |||
December 31, 2012 |
| $ | 0 |
| $ | 0 |
| $ | 0 |
|
|
|
|
|
|
|
|
| |||
Percentage approved pursuant to pre-approval exception |
| 0 | % | 0 | % | 0 | % | |||
NON-AUDIT SERVICES
The following table shows the amount of fees that PricewaterhouseCoopers LLP billed during the Fund’s last two full fiscal years for non-audit services. The Audit Committee is required to pre-approve non-audit services that PricewaterhouseCoopers LLP provides to the Adviser and any Affiliated Fund Services Provider, if the engagement related directly to the Fund’s operations and financial reporting (except for those subject to the pre-approval exception described above). The Audit Committee requested and received information from PricewaterhouseCoopers LLP about any non-audit services that PricewaterhouseCoopers LLP rendered during the Fund’s last fiscal year to the Adviser and any Affiliated Fund Service Provider. The Committee considered this information in evaluating PricewaterhouseCoopers LLP’s independence.
|
|
|
| Total Non-Audit Fees |
|
|
|
|
| ||||
|
|
|
| billed to Adviser and |
|
|
|
|
| ||||
|
|
|
| Affiliated Fund Service |
| Total Non-Audit Fees |
|
|
| ||||
|
|
|
| Providers (engagements |
| billed to Adviser and |
|
|
| ||||
|
|
|
| related directly to the |
| Affiliated Fund Service |
|
|
| ||||
|
| Total Non-Audit Fees |
| operations and financial |
| Providers (all other |
|
|
| ||||
Fiscal Year Ended |
| Billed to Fund |
| reporting of the Fund) |
| engagements) |
| Total |
| ||||
December 31, 2013 |
| $ | 10,670 |
| $ | 0 |
| $ | 0 |
| $ | 10,670 |
|
December 31, 2012 |
| $ | 2,650 |
| $ | 0 |
| $ | 0 |
| $ | 2,650 |
|
“Non-Audit Fees billed to Fund” for both fiscal year ends represent “Tax Fees” and “All Other Fees” billed to Fund in their respective amounts from the previous table.
Less than 50 percent of the hours expended on the principal accountant’s engagement to audit the registrant’s financial statements for the most recent fiscal year were attributed to work performed by persons other than the principal accountant’s full-time, permanent employees.
Audit Committee Pre-Approval Policies and Procedures. Generally, the Audit Committee must approve (i) all non-audit services to be performed for the Fund by the Fund’s independent accountants and (ii) all audit and non-audit services to be performed by the Fund’s independent accountants for the Affiliated Fund Service Providers with respect to operations and financial reporting of the Fund. Regarding tax and research projects conducted by the independent accountants for the Fund and Affiliated Fund Service Providers (with respect to operations and financial reports of the Fund) such engagements will be (i) pre-approved by the Audit Committee if they are expected to be for amounts greater than $10,000; (ii) reported to the Audit Committee chairman for his verbal approval prior to engagement if they are expected to be for amounts under $10,000 but greater than $5,000; and (iii) reported to the Audit Committee at the next Audit Committee meeting if they are expected to be for an amount under $5,000.
ITEM 5. AUDIT COMMITTEE OF LISTED REGISTRANTS.
The registrant’s Board has a separately designated Audit Committee established in accordance with Section 3(a)(58)(A) of the Securities Exchange Act of 1934, as amended (15 U.S.C. 78c(a)(58)(A)). The members of the audit committee are Robert P. Bremner, Jack B. Evans, David J. Kundert, Carole E. Stone and Terence J. Toth.
ITEM 6. SCHEDULE OF INVESTMENTS.
| (a) | See Portfolio of Investments in Item 1. |
|
|
|
| (b) | Not applicable. |
ITEM 7. DISCLOSURE OF PROXY VOTING POLICIES AND PROCEDURES FOR CLOSED-END MANAGEMENT INVESTMENT COMPANIES.
Nuveen Fund Advisors, LLC, formerly known as Nuveen Fund Advisors, Inc., is the registrant’s investment adviser (also referred to as the “Adviser”). The Adviser is responsible for the on-going monitoring of the Fund’s investment portfolio, managing the Fund’s business affairs and providing certain clerical, bookkeeping and administrative services. The Adviser has engaged Nuveen Asset Management, LLC (“Sub-Adviser”) as Sub-Adviser to provide discretionary investment advisory services. As part of these services, the Adviser has delegated to the Sub-Adviser the full responsibility for proxy voting on securities held in the registrant’s portfolio and related duties in accordance with the Sub-Adviser’s policies and procedures. The Adviser periodically monitors the Sub-Adviser’s voting to ensure that it is carrying out its duties. The Sub-Adviser’s proxy voting policies and procedures are attached to this filing as an exhibit and incorporated herein by reference.
ITEM 8. PORTFOLIO MANAGERS OF CLOSED-END MANAGEMENT INVESTMENT COMPANIES.
Nuveen Fund Advisors, LLC, formerly known as Nuveen Fund Advisors, Inc. (“NFALLC”), is the registrant’s investment adviser (NFALLC is also referred to as the “Adviser”). NFALLC is responsible for the selection and on-going monitoring of the Fund’s investment portfolio, managing the Fund’s business affairs and providing certain clerical, bookkeeping and administrative services. The Adviser has engaged Nuveen Asset Management, LLC (“Nuveen Asset Management” or “Sub-Adviser”), as Sub-Adviser to provide discretionary investment advisory services. The following section provides information on the portfolio managers at the Sub-Adviser:
NUVEEN ASSET MANAGEMENT
Item 8(a)(1). PORTFOLIO MANAGER BIOGRAPHIES
Steve Lee, CFA, Senior Vice President at Nuveen Asset Management, is the lead Portfolio Manager for the Fund. He leads the foreign Currency Sector Team of Nuveen Asset Management. He was born in South Korea and moved to the United States when he was thirteen. He has been active in Global Macro strategies and FX trading since 1995. Most recently, he was a Senior Vice President and FX Trader with HSBC Bank USA. He began his career with Deutsche Bank on their Forward Currency desk and also worked as a portfolio manager at Vega Asset Management and Tribeca Global Investments in New York. He obtained his Bachelor of Arts, Economics and Mathematics from Yale University and his MBA in Finance from New York University, Stern School of Business.
Timothy Palmer, CFA, leads the global bond and emerging markets debt sector teams of Nuveen Asset Management. He began working in the financial industry in 1986, and became a portfolio manager in 1990. Before joining FAF Advisors in 2003, he was a senior fixed-income portfolio manager with American Express Financial Advisors (now Ameriprise Financial). Prior to that, he served as CEO and managing principal of Atlas Capital Management, and he was a senior fixed-income portfolio manager for Investment Advisors, Inc. He earned a B.A. in economics from the University of St. Thomas and an M.B.A. in finance from Columbia University’s Graduate School of Business. He holds the Chartered Financial Analyst (CFA) designation.
Item 8(a)(2). OTHER ACCOUNTS MANAGED BY PORTFOLIO MANAGERS
In addition to the Fund, as of December 31, 2013, the portfolio managers are also primarily responsible for the day-to-day portfolio management of the following accounts:
|
| (ii) Number of Other Accounts Managed |
| (iii) Number of Other Accounts and |
| |||||||||||||||||||||||
(i) Name of |
| Other |
| Other Pooled |
| Other |
| Other |
| Other Pooled |
| Other |
| |||||||||||||||
Steve Lee |
| 2 |
| $ | 202.6 million |
| 0 |
| 0 |
| 0 |
| 0 |
| 0 |
| 0 |
| 0 |
| 0 |
| 0 |
| 0 |
| ||
Tim Palmer |
| 5 |
| $ | 1.45 billion |
| 1 |
| $ | 62.6 million |
| 7 |
| $ | 493 million |
| 0 |
| 0 |
| 0 |
| 0 |
| 0 |
| 0 |
|
* Assets are as of December 31, 2013.
POTENTIAL MATERIAL CONFLICTS OF INTEREST
Actual or apparent conflicts of interest may arise when a portfolio manager has day-to-day management responsibilities with respect to more than one account. More specifically, portfolio managers who manage multiple accounts are presented a number of potential conflicts, including, among others, those discussed below.
The management of multiple accounts may result in a portfolio manager devoting unequal time and attention to the management of each account. Nuveen Asset Management seeks to manage such competing interests for the time and attention of portfolio managers by having portfolio managers focus on a particular investment discipline. Most accounts managed by a portfolio manager in a particular investment strategy are managed using the same investment models.
If a portfolio manager identifies a limited investment opportunity which may be suitable for more than one account, an account may not be able to take full advantage of that opportunity due to an allocation of filled purchase or sale orders across all eligible accounts. To deal with these situations, Nuveen Asset Management has adopted procedures for allocating limited opportunities across multiple accounts.
With respect to many of its clients’ accounts, Nuveen Asset Management determines which broker to use to execute transaction orders, consistent with its duty to seek best execution of the transaction. However, with respect to certain other accounts, Nuveen Asset Management may be limited by the client with respect to the selection of brokers or may be instructed to direct trades through a particular broker. In these cases, Nuveen Asset Management may place separate, non-simultaneous, transactions for a Fund and other accounts which may temporarily affect the market price of the security or the execution of the transaction, or both, to the detriment of the Fund or the other accounts.
Some clients are subject to different regulations. As a consequence of this difference in regulatory requirements, some clients may not be permitted to engage in all the investment techniques or transactions or to engage in these transactions to the same extent as the other
accounts managed by the portfolio manager. Finally, the appearance of a conflict of interest may arise where Nuveen Asset Management has an incentive, such as a performance-based management fee, which relates to the management of some accounts, with respect to which a portfolio manager has day-to-day management responsibilities.
Nuveen Asset Management has adopted certain compliance procedures which are designed to address these types of conflicts common among investment managers. However, there is no guarantee that such procedures will detect each and every situation in which a conflict arises.
Item 8(a)(3). FUND MANAGER COMPENSATION
Portfolio manager compensation consists primarily of base pay, an annual cash bonus and long term incentive payments.
Base pay. Base pay is determined based upon an analysis of the portfolio manager’s general performance, experience, and market levels of base pay for such position.
Annual cash bonus. The Fund’s portfolio managers are eligible for an annual cash bonus based on investment performance, qualitative evaluation and financial performance of Nuveen Asset Management.
A portion of each portfolio manager’s annual cash bonus is based on the Fund’s investment performance, generally measured over the past one- and three or five-year periods unless the portfolio manager’s tenure is shorter. Investment performance for the Fund generally is determined by evaluating the Fund’s performance relative to its benchmark(s) and/or Lipper industry peer group.
A portion of the cash bonus is based on a qualitative evaluation made by each portfolio manager’s supervisor taking into consideration a number of factors, including the portfolio manager’s team collaboration, expense management, support of personnel responsible for asset growth, and his or her compliance with Nuveen Asset Management’s policies and procedures.
The final factor influencing a portfolio manager’s cash bonus is the financial performance of Nuveen Asset Management based on its operating earnings.
Long-term incentive compensation. Certain key employees of Nuveen Investments and its affiliates, including certain portfolio managers, have received equity interests in the parent company of Nuveen Investments. In addition, certain key employees of Nuveen Asset Management, including certain portfolio managers, have received profits interests in Nuveen Asset Management which entitle their holders to participate in the firm’s growth over time.
There are generally no differences between the methods used to determine compensation with respect to the Fund and the Other Accounts shown in the table above.
Item 8(a)(4). OWNERSHIP OF JGT SECURITIES AS OF DECEMBER 31, 2013
Name of Portfolio |
| None |
| $1 - |
| $10,001- |
| $50,001- |
| $100,001- |
| $500,001- |
| Over |
|
Steve Lee |
|
|
|
|
| X |
|
|
|
|
|
|
|
|
|
Timothy Palmer |
|
|
|
|
| X |
|
|
|
|
|
|
|
|
|
ITEM 9. PURCHASES OF EQUITY SECURITIES BY CLOSED-END MANAGEMENT INVESTMENT COMPANY AND AFFILIATED PURCHASERS.
|
|
|
| (b) |
| (c) |
| (d)* |
| |
|
| (a) |
| AVERAGE |
| TOTAL NUMBER OF SHARES |
| MAXIMUM NUMBER (OR |
| |
|
| TOTAL NUMBER OF |
| PRICE |
| (OR UNITS) PURCHASED AS |
| APPROXIMATE DOLLAR VALUE) OF |
| |
|
| SHARES (OR |
| PAID PER |
| PART OF PUBLICLY |
| SHARES (OR UNITS) THAT MAY YET |
| |
|
| UNITS) |
| SHARE (OR |
| ANNOUNCED PLANS OR |
| BE PURCHASED UNDER THE PLANS OR |
| |
Period* |
| PURCHASED |
| UNIT) |
| PROGRAMS |
| PROGRAMS |
| |
|
|
|
|
|
|
|
|
|
| |
JANUARY 1-31, 2013 |
| 76,924 |
| $ | 13.15 |
| 76,924 |
| 4,184,466 |
|
|
|
|
|
|
|
|
|
|
| |
FEBRUARY 1-28, 2013 |
| 0 |
|
|
| 0 |
| 4,184,466 |
| |
|
|
|
|
|
|
|
|
|
| |
MARCH 1-31, 2013 |
| 0 |
|
|
| 0 |
| 4,184,466 |
| |
|
|
|
|
|
|
|
|
|
| |
APRIL 1-30, 2013 |
| 11,200 |
| $ | 12.98 |
| 11,200 |
| 4,173,266 |
|
|
|
|
|
|
|
|
|
|
| |
MAY 1-31, 2013 |
| 35,600 |
| $ | 13.06 |
| 35,600 |
| 4,137,666 |
|
|
|
|
|
|
|
|
|
|
| |
JUNE 1-30, 2013 |
| 101,400 |
| $ | 11.37 |
| 101,400 |
| 4,036,266 |
|
|
|
|
|
|
|
|
|
|
| |
JULY 1-31, 2013 |
| 178,571 |
| $ | 11.04 |
| 178,571 |
| 3,857,695 |
|
|
|
|
|
|
|
|
|
|
| |
AUGUST 1-31, 2013 |
| 111,936 |
| $ | 10.78 |
| 111,936 |
| 3,745,759 |
|
|
|
|
|
|
|
|
|
|
| |
SEPTEMBER 1-30, 2013 |
| 209,456 |
| $ | 10.60 |
| 209,456 |
| 3,536,303 |
|
|
|
|
|
|
|
|
|
|
| |
OCTOBER 1-31, 2013 |
| 610,044 |
| $ | 10.76 |
| 610,044 |
| 2,926,259 |
|
|
|
|
|
|
|
|
|
|
| |
NOVEMBER 1-30, 2013 |
| 424,900 |
| $ | 10.52 |
| 424,900 |
| 4,210,100 |
|
|
|
|
|
|
|
|
|
|
| |
DECEMBER 1-31, 2013 |
| 202,400 |
| $ | 10.24 |
| 202,400 |
| 4,007,700 |
|
|
|
|
|
|
|
|
|
|
| |
TOTAL |
| 1,962,431 |
|
|
|
|
|
|
| |
* The registrant’s repurchase program, for the repurchase of 4,295,000 shares, was authorized November 15, 2012. The program was reauthorized for a maximum repurchase amount of 4,635,000 shares on November 20, 2013. Any repurchases made by the registrant pursuant to the program were made through open-market transactions.
ITEM 10. SUBMISSION OF MATTERS TO A VOTE OF SECURITY HOLDERS.
There have been no material changes to the procedures by which shareholders may recommend nominees to the registrant’s Board implemented after the registrant last provided disclosure in response to this Item.
ITEM 11. CONTROLS AND PROCEDURES.
| (a) | The registrant’s principal executive and principal financial officers, or persons performing similar functions, have concluded that the registrant’s disclosure controls and procedures (as defined in Rule 30a-3(c) under the Investment Company Act of 1940, as amended (the “1940 Act”) (17 CFR 270.30a-3(c))) are effective, as of a date within 90 days of the filing date of this report that includes the disclosure required by this paragraph, based on their evaluation of the controls and procedures required by Rule 30a-3(b) under the 1940 Act (17 CFR 270.30a-3(b)) and Rules 13a-15(b) or 15d-15(b) under the Securities Exchange Act of 1934, as amended (the “Exchange Act”) (17 CFR 240.13a-15(b) or 240.15d-15(b)). |
|
|
|
| (b) | There were no changes in the registrant’s internal control over financial reporting (as defined in Rule 30a-3(d) under the 1940 Act (17 CFR 270.30a-3(d)) that occurred during the second fiscal quarter of the period covered by this report that has materially affected, or is reasonably likely to materially affect, the registrant’s internal control over financial reporting. |
ITEM 12. EXHIBITS.
File the exhibits listed below as part of this Form.
(a)(1) Any code of ethics, or amendment thereto, that is the subject of the disclosure required by Item 2, to the extent that the registrant intends to satisfy the Item 2 requirements through filing of an exhibit: Not applicable because the code is posted on registrant’s website at www.nuveen.com/CEF/Shareholder/FundGovernance.aspx and there were no amendments during the period covered by this report. (To view the code, click on Code of Conduct.)
(a)(2) A separate certification for each principal executive officer and principal financial officer of the registrant as required by Rule 30a-2(a) under the 1940 Act (17 CFR 270.30a-2(a)) in the exact form set forth below: Ex-99.CERT Attached hereto.
(a)(3) Any written solicitation to purchase securities under Rule 23c-1 under the 1940 Act (17 CFR 270.23c-1) sent or given during the period covered by the report by or on behalf of the registrant to 10 or more persons. Not applicable.
(b) If the report is filed under Section 13(a) or 15(d) of the Exchange Act, provide the certifications required by Rule 30a-2(b) under the 1940 Act (17 CFR 270.30a-2(b)); Rule 13a-14(b) or Rule 15d-14(b) under the Exchange Act (17 CFR 240.13a-14(b) or 240.15d-14(b)), and Section 1350 of Chapter 63 of Title 18 of the United States Code (18 U.S.C. 1350) as an exhibit. A certification furnished pursuant to this paragraph will not be deemed “filed” for purposes of Section 18 of the Exchange Act (15 U.S.C. 78r), or otherwise subject to the liability of that section. Such certification will not be deemed to be incorporated by reference into any filing under the Securities Act of 1933 or the Exchange Act, except to the extent that the registrant specifically incorporates it by reference. Ex-99.906 CERT attached hereto.
SIGNATURES
Pursuant to the requirements of the Securities Exchange Act of 1934 and the Investment Company Act of 1940, the registrant has duly caused this report to be signed on its behalf by the undersigned, thereunto duly authorized.
(Registrant) Nuveen Diversified Currency Opportunities Fund
By (Signature and Title) | /s/ Kevin J. McCarthy |
|
|
| Kevin J. McCarthy |
|
|
| Vice President and Secretary |
|
|
Date: March 6, 2014
Pursuant to the requirements of the Securities Exchange Act of 1934 and the Investment Company Act of 1940, this report has been signed below by the following persons on behalf of the registrant and in the capacities and on the dates indicated.
By (Signature and Title) | /s/ Gifford R. Zimmerman |
|
|
| Gifford R. Zimmerman |
|
|
| Chief Administrative Officer (principal executive officer) |
|
|
Date: March 6, 2014
By (Signature and Title) | /s/ Stephen D. Foy |
|
|
| Stephen D. Foy |
|
|
| Vice President and Controller (principal financial officer) |
|
|
Date: March 6, 2014