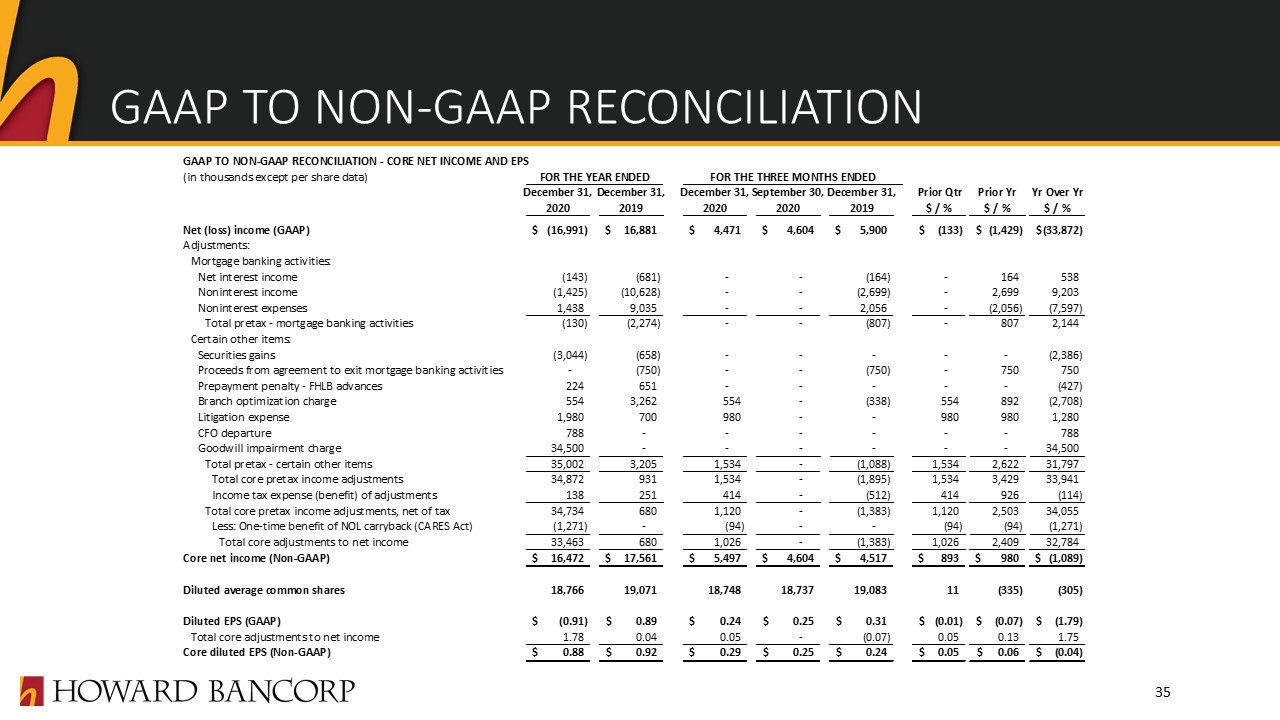
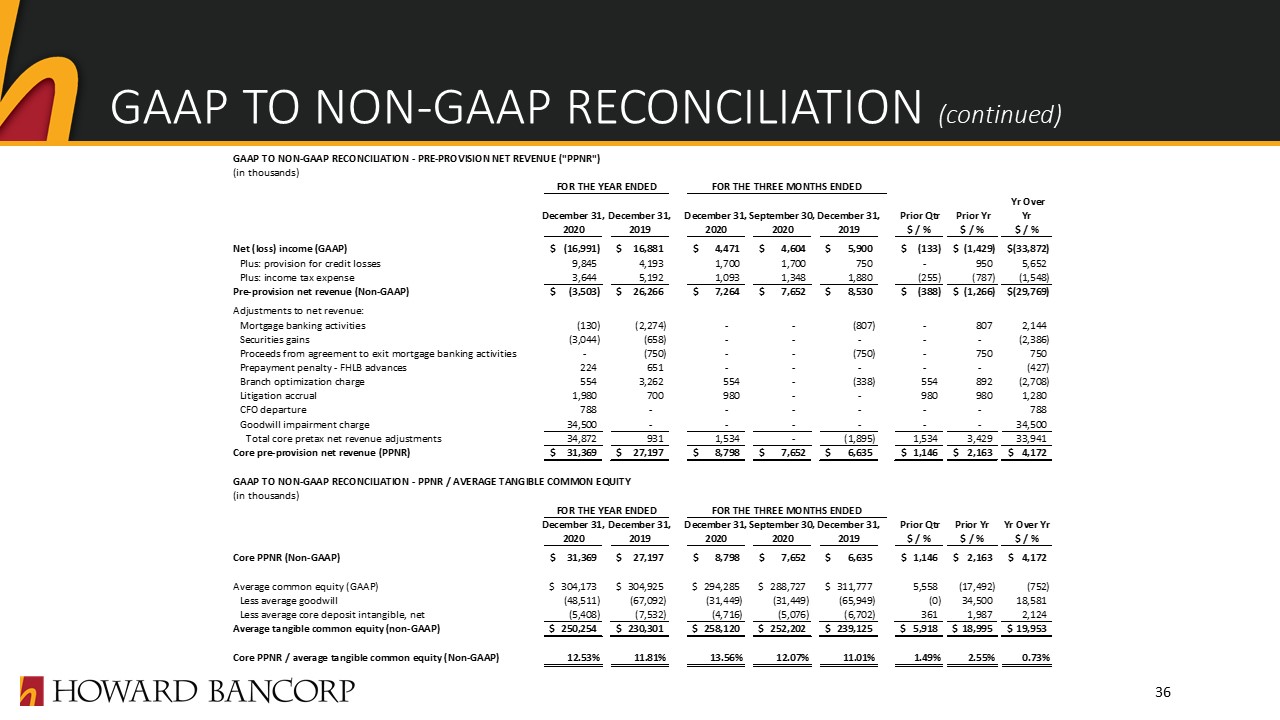
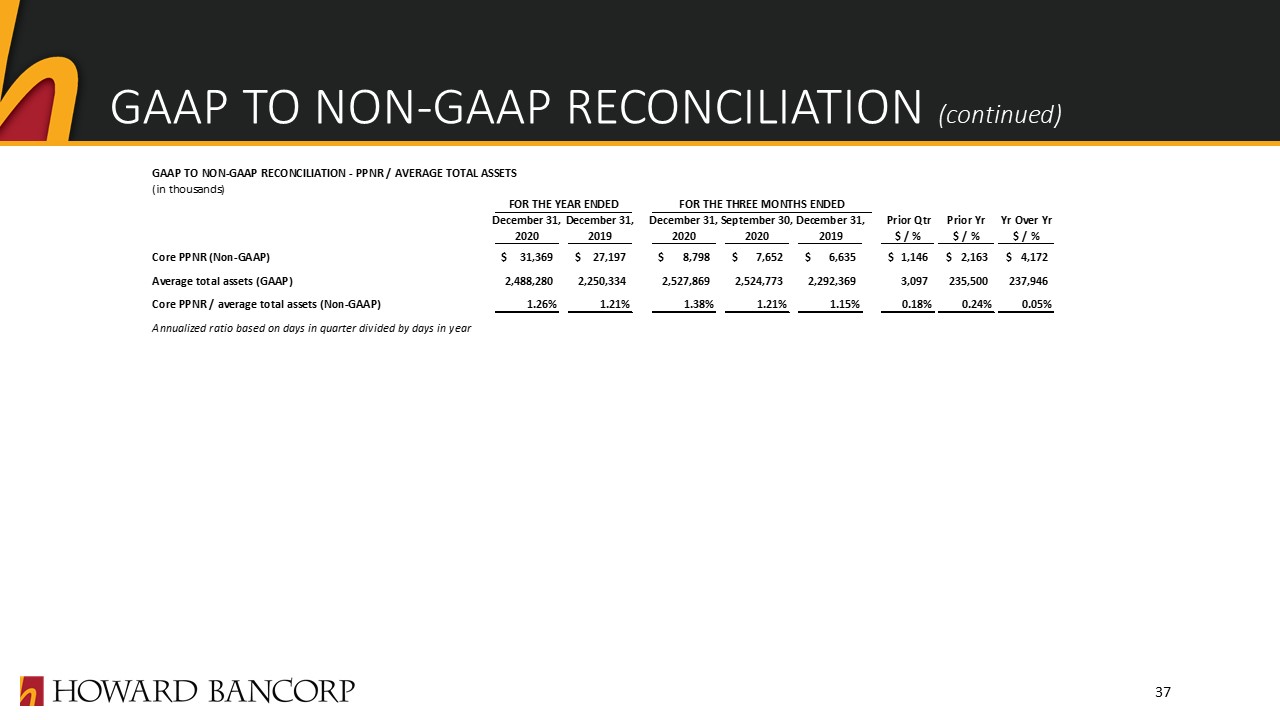
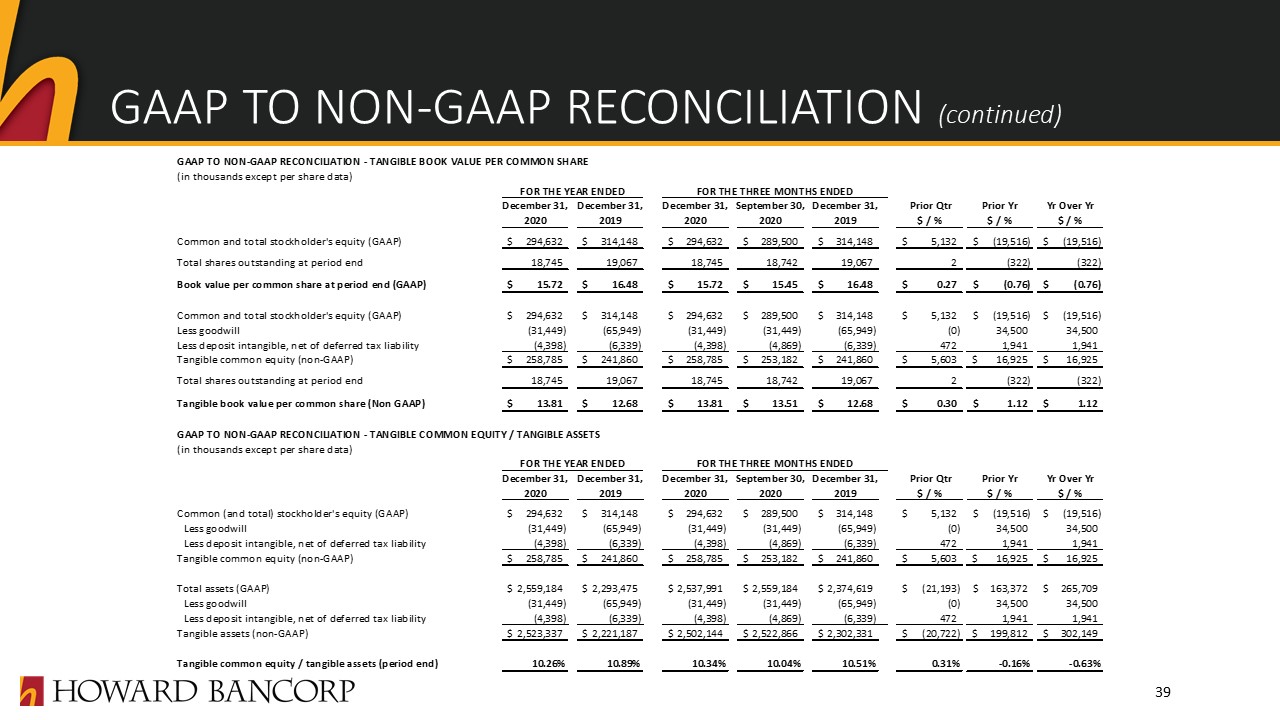
EARNINGS SNAPSHOT (1) “(PPNR)” and “Core Net Income and EPS” metrics are non-GAAP financial measures.See the GAAP to non-GAAP Reconciliation at the end of this presentation for more details. Reported Net Income (Loss) & EPS 6 ($ in thousands except per share data) Q4 '20 Q3 '20 Q4 '19 Vs Q3 '20 Vs Q4 '19 2020 2019 Yr Over Yr Net interest income $ 19,685 $ 18,272 $ 17,267 $ 1,413 $ 2,418 $ 73,602 $ 69,310 $ 4,292 Noninterest income 2,145 2,089 5,625 56 (3,480) 12,359 21,034 (8,675) Total revenue 21,830 20,361 22,892 1,469 (1,062) 85,961 90,344 (4,383) Noninterest expense 14,567 12,709 14,362 1,858 205 89,463 64,078 25,385 Pre-provision net revenue (1) 7,264 7,652 8,530 (388) (1,266) (3,502) 26,266 (29,768) Provision for credit losses 1,700 1,700 750 - 950 9,845 4,193 5,652 Income (loss) before income taxes 5,564 5,952 7,780 (388) (2,216) (13,347) 22,073 (35,420) Income tax expense (benefit) 1,093 1,348 1,880 (255) (787) 3,645 5,192 (1,547) Net income (loss) $ 4,471 $ 4,604 $ 5,900 $ (133) $ (1,429) $ (16,991) $ 16,881 $ (33,872) Net income (loss) per share - diluted $ 0.24 $ 0.25 $ 0.31 $ (0.01) $ (0.07) $ (0.91) $ 0.89 $ (1.80) Core(1) Net Income and EPS ($ in thousands except per share data) Q4 '20 Q3 '20 Q4 '19 Vs Q3 '20 Vs Q4 '19 2020 2019 Yr Over Yr Core Net income $ 5,497 $ 4,604 $ 4,517 $ 893 $ 980 $ 16,472 $ 17,561 $ (1,089) Core Diluted EPS $ 0.29 $ 0.25 $ 0.24 $ 0.05 $ 0.06 $ 0.88 $ 0.92 $ (0.04)