UNITED STATES
SECURITIES AND EXCHANGE COMMISSION
Washington, D.C. 20549
FORM N-CSR
CERTIFIED SHAREHOLDER REPORT OF REGISTERED
MANAGEMENT INVESTMENT COMPANIES
|
| Investment Company Act file number 811‑22023 |
Nuveen Managed Accounts Portfolios Trust
(Exact name of registrant as specified in charter)
Nuveen Investments
333 West Wacker Drive
Chicago, Illinois 60606
(Address of principal executive offices) (Zip code)
Mark J. Czarniecki
Vice President and Secretary
901 Marquette Avenue
Minneapolis, Minnesota 55402
(Name and address of agent for service)
Registrant’s telephone number, including area code: (312) 917‑7700
Date of fiscal year end: July 31
Date of reporting period: July 31, 2024
| Item 1. | Reports to Stockholders. |
| | |
 | |
Annual Shareholder Report
July 31, 2024 |
Municipal Total Return Managed Accounts Portfolio
NMTRX
Annual Shareholder Report
This annual shareholder report contains important information about the Municipal Total Return Managed Accounts Portfolio for the period of August 1, 2023 to July 31, 2024. You can find additional information at https://www.nuveen.com/en‑us/mutual‑funds/prospectuses. You can also request this information by contacting us at (800) 257‑8787.
This report describes changes to the Fund that occurred during the reporting period.
What were the Fund costs for the last year? (based on a hypothetical $10,000 investment)
| | | | |
| | |
| | | Cost of a $10,000 investment | | Costs paid as a percentage of
$10,000 investment* |
| | | |
| Municipal Total Return Managed Accounts Portfolio | | $0 | | 0.00% |
* Annualized for period less than one year. The Fund does not pay a management fee or other expenses (excluding interest expense, taxes, fees incurred in acquiring and disposing of portfolio securities and extraordinary expenses). The Fund’s investment adviser and sub-adviser are compensated from the fee charged by the separately managed account through which Fund shares are held.
How did the Fund perform last year? What affected the Fund’s performance?
| | |
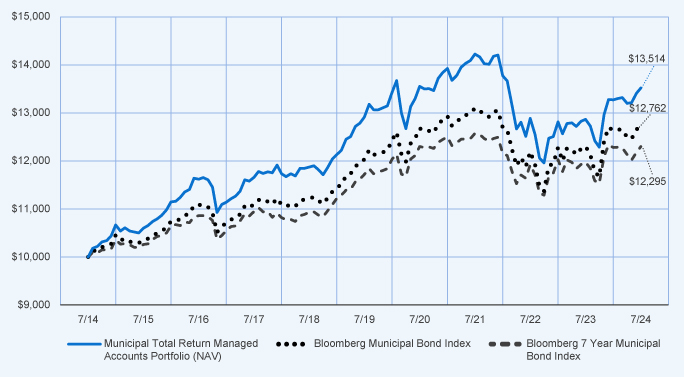
Performance Highlights • The Nuveen Municipal Total Return Managed Accounts Portfolio returned 5.08% at net asset value (NAV) for the 12 months ended July 31, 2024. The Fund outperformed the Bloomberg 7‑Year Municipal Bond Index, which returned 2.71%. • Top contributors to relative performance » Overweight to bonds with maturities of 17 years and longer, which outperformed shorter-duration bonds in the index. » Underweight to local and state general obligation (GO) sectors. » Overweight to bonds rated BBB, BB and B which outperformed bonds with higher ratings. • Top detractors from relative performance » Overweight to bonds with maturities of less than one year, which underperformed bonds with longer maturities. » Underweight to the industrial development revenue/pollution control revenue (IDR/PCR) sector. » Underweight to bonds from Georgia state issuers, which was a top‑performing state in the index. | | Performance Attribution  17+ year duration bonds Local and state GO sectors BBB‑, BB‑ and B‑rated bonds  Bonds with maturities of less than 1 year IDR/PCR sector Georgia state-issued bonds |
How did the Fund perform over the last 10 years?
Performance data shown represents past performance and does not predict or guarantee future results. The graph and table do not reflect the deduction of taxes that a shareholder would pay on Fund distributions or redemption of Fund Shares.
Fund Performance (August 1, 2014 through July 31, 2024) Initial Investment of $10,000
Average Annual Total Returns
| | | | | | | | | | | | |
| | | |
| | | 1‑Year | | | 5‑Year | | | 10‑Year | |
| | | | |
| Municipal Total Return Managed Accounts Portfolio at NAV | | | 5.08 | % | | | 0.92 | % | | | 3.06 | % |
| | | | |
| Bloomberg Municipal Bond Index | | | 3.74 | % | | | 1.18 | % | | | 2.47 | % |
| | | | |
| Bloomberg 7 Year Municipal Bond Index | | | 2.71 | % | | | 0.97 | % | | | 2.09 | % |
Investment return and principal value will fluctuate, and you may have a gain or loss when you sell your shares. Current performance may differ from figures shown. For most recent month‑end performance, go to https://www.nuveen.com/en‑us/mutual‑funds/prospectuses or call (800) 257‑8787.
Fund Statistics (as of July 31, 2024)
| | | | |
| |
| Fund net assets | | $ | 1,565,551,487 | |
| |
| Total number of portfolio holdings | | | 677 | |
| |
| Portfolio turnover (%) | | | 43% | |
| |
| Total management fees paid for the year | | $ | 0 | |
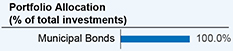
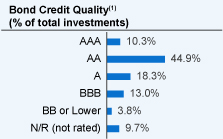
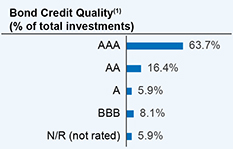
What did the Fund invest in? (as of July 31, 2024)
(1) The ratings disclosed are the highest rating given by one of the following national rating agencies: Standard & Poor’s (S&P), Moody’s Investors Service, Inc. (Moody’s) or Fitch, Inc (Fitch). This treatment of split-rated securities may differ from that used for other purposes, such as for Fund investment policies. Credit ratings are subject to change. AAA, AA, A, and BBB are investment grade ratings; BB, B, CCC, CC, C and D are below-investment grade ratings. Holdings designated N/R are not rated by these national ratings agencies.
How has the Fund changed?
| | • | | Portfolio Manager Updates: Effective October 13, 2023, Michael Sheykar, CFA was added as a portfolio manager of the Fund. | |
For more complete information, you may review the Fund’s next prospectus, which is expected to be available by November 29, 2024 at https://www.nuveen.com/en‑us/mutual‑funds/prospectuses or upon request at (800) 257‑8787.
Availability of additional information about the Fund
You can find additional information about the Fund at https://www.nuveen.com/en‑us/mutual‑funds/prospectuses, including its:
| | • | | prospectus • financial statements and other information • fund holdings • proxy voting information |
You can also request this information at (800) 257‑8787.
| | |
67073H103_AR_0724 3824674‑INV‑Y‑09/25 | |  |
| | |
| |
Annual Shareholder Report
July 31, 2024 |
Nuveen Core Impact Bond Managed Accounts Portfolio
NCIRX
Annual Shareholder Report
This annual shareholder report contains important information about the Nuveen Core Impact Bond Managed Accounts Portfolio for the period of August 1, 2023 to July 31, 2024. You can find additional information at https://www.nuveen.com/en‑us/mutual‑funds/prospectuses. You can also request this information by contacting us at (800) 257-8787.
This report describes changes to the Fund that occurred during the reporting period.
What were the Fund costs for the last year? (based on a hypothetical $10,000 investment)
| | | | |
| | |
| | | Cost of a $10,000 investment | | Costs paid as a percentage of
$10,000 investment* |
| | | |
| Nuveen Core Impact Bond Managed Accounts Portfolio | | $0 | | 0.00% |
* Annualized for period less than one year. The Fund does not pay a management fee or other expenses (excluding interest expense, taxes, fees incurred in acquiring and disposing of portfolio securities and extraordinary expenses). The Fund’s investment adviser and sub-adviser are compensated from the fee charged by the separately managed account through which Fund shares are held.
How did the Fund perform last year? What affected the Fund’s performance?
| | |
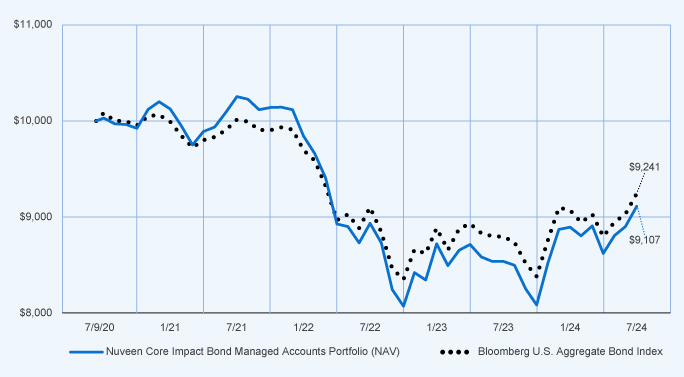
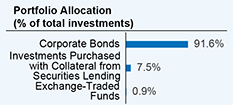
Performance Highlights • The Nuveen Core Impact Bond Managed Accounts Portfolio returned 6.7% at net asset value (NAV) for the 12 months ended July 31, 2024. The Fund outperformed the Bloomberg U.S. Aggregate Bond Index, which returned 5.1%. • Top contributors to relative performance » Overweight to corporate bonds and an out-of-benchmark allocation to municipal bonds. » Underweights to U.S. Treasury bonds and mortgage-backed securities (MBS). » Security selection within asset-backed securities (ABS), notably residential solar holdings. • Top detractors from relative performance » Security selection within commercial mortgage-backed securities (CMBS), particularly those issued by BFLD Trust and One Market Plaza Trust, which are energy-efficient, single-asset, single borrower, office properties. » Longer-duration positioning, which was unfavorable as long-end rates generally increased and the yield curve steepened during the reporting period. | | Performance Attribution Corporate bonds, municipal bonds and ABS U.S. Treasury bonds and MBS Security selection within CMBS Longer-duration positioning |
How did the Fund perform over the period since inception?
Performance data shown represents past performance and does not predict or guarantee future results. The graph and table do not reflect the deduction of taxes that a shareholder would pay on Fund distributions or redemption of Fund Shares.
Fund Performance (July 9, 2020 through July 31, 2024) Initial Investment of $10,000
Average Annual Total Returns
| | | | | | | | |
| | |
| | | 1‑Year | | | Since Inception (7/9/20) | |
| | | |
| Nuveen Core Impact Bond Managed Accounts Portfolio at NAV | | | 6.70 | % | | | (2.28 | )% |
| | | |
| Bloomberg U.S. Aggregate Bond Index | | | 5.10 | % | | | (1.93 | )% |
Investment return and principal value will fluctuate, and you may have a gain or loss when you sell your shares. Current performance may differ from figures shown. For most recent month‑end performance, go to https://www.nuveen.com/en‑us/mutual‑funds/prospectuses or call (800) 257‑8787.
Fund Statistics (as of July 31, 2024)
| | | | |
| |
| Fund net assets | | $ | 8,864,370 | |
| |
| Total number of portfolio holdings | | | 94 | |
| |
| Portfolio turnover (%) | | | 71% | |
| |
| Total management fees paid for the year | | $ | 0 | |
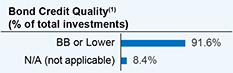
What did the Fund invest in? (as of July 31, 2024)
(1) The ratings disclosed are the highest rating given by one of the following national rating agencies: Standard & Poor’s (S&P), Moody’s Investors Service, Inc. (Moody’s) or Fitch, Inc (Fitch). This treatment of split-rated securities may differ from that used for other purposes, such as for Fund investment policies. Credit ratings are subject to change. AAA, AA, A, and BBB are investment grade ratings; BB, B, CCC, CC, C and D are below-investment grade ratings. Holdings designated N/R are not rated by these national ratings agencies.
How has the Fund changed?
For more complete information, you may review the Fund’s next prospectus, which is expected to be available by November 29, 2024 at https://www.nuveen.com/en-us/mutual-funds/prospectuses or upon request at (800) 257-8787.
Availability of additional information about the Fund
You can find additional information about the Fund at https://www.nuveen.com/en-us/mutual-funds/prospectuses, including its:
| | • | | prospectus • financial statements and other information • fund holdings • proxy voting information |
You can also request this information at (800) 257‑8787.
| | |
67073H400_AR_0724 3824683-INV-Y-09/25 | | |
| | |
| |
Annual Shareholder Report
July 31, 2024 |
Nuveen Emerging Markets Debt Managed Accounts Portfolio
NEMDX
Annual Shareholder Report
This annual shareholder report contains important information about the Nuveen Emerging Markets Debt Managed Accounts Portfolio for the period of August 1, 2023 to July 31, 2024. You can find additional information at https://www.nuveen.com/en‑us/mutual‑funds/prospectuses. You can also request this information by contacting us at (800) 257‑8787.
This report describes changes to the Fund that occurred during the reporting period.
What were the Fund costs for the last year? (based on a hypothetical $10,000 investment)
| | | | |
| | |
| | | Cost of a $10,000 investment | | Costs paid as a percentage of
$10,000 investment* |
| | | |
| Nuveen Emerging Markets Debt Managed Accounts Portfolio | | $0 | | 0.00% |
* Annualized for period less than one year. The Fund does not pay a management fee or other expenses (excluding interest expense, taxes, fees incurred in acquiring and disposing of portfolio securities and extraordinary expenses). The Fund’s investment adviser and sub-adviser are compensated from the fee charged by the separately managed account through which Fund shares are held.
How did the Fund perform last year? What affected the Fund’s performance?
| | |
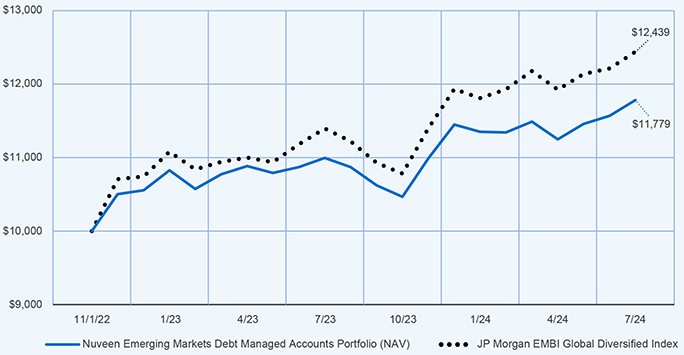
Performance Highlights • The Nuveen Emerging Markets Debt Managed Accounts Portfolio returned 7.15% at net asset value (NAV) for the 12 months ended July 31, 2024. The Fund underperformed the JP Morgan EMBI Global Diversified Index, which returned 9.18%. • Top contributors to relative performance » Security selection within Chilean and Brazilian corporate bonds. » Shorter-duration positioning, which was advantageous amid the volatile interest rate environment and generally rising long‑end rates. » Underweight to lower-beta, quasi-sovereign debt in China and Malaysia. • Top detractors from relative performance » Underweight to high yield bonds. » Lack of exposure to distressed sovereign issuers that were in the benchmark, including Argentina, Ecuador and Pakistan, which rallied during the reporting period. » Underweight to distressed Egyptian sovereign bonds, which also outperformed. » Security selection within Mexican debt. | | Performance Attribution Chilean and Brazilian corporate bonds Shorter-duration positioning Low‑beta, quasi-sovereign debt in China and Malaysia High yield bonds Distressed sovereign issuers Mexican debt |
How did the Fund perform over the period since inception?
Performance data shown represents past performance and does not predict or guarantee future results. The graph and table do not reflect the deduction of taxes that a shareholder would pay on Fund distributions or redemption of Fund Shares.
Fund Performance (November 1, 2022 through July 31, 2024) Initial Investment of $10,000
Average Annual Total Returns
| | | | | | | | |
| | |
| | | 1‑Year | | | Since
Inception (11/1/22) | |
| | | |
| Nuveen Emerging Markets Debt Managed Accounts Portfolio at NAV | | | 7.15 | % | | | 9.84 | % |
| | | |
| JP Morgan EMBI Global Diversified Index | | | 9.18 | % | | | 13.32 | % |
Investment return and principal value will fluctuate, and you may have a gain or loss when you sell your shares. Current performance may differ from figures shown. For most recent month‑end performance, go to https://www.nuveen.com/en‑us/mutual‑funds/prospectuses or call (800) 257‑8787.
Fund Statistics (as of July 31, 2024)
| | | | |
| |
| Fund net assets | | $ | 28,056,618 | |
| |
| Total number of portfolio holdings | | | 123 | |
| |
| Portfolio turnover (%) | | | 27% | |
| |
| Total management fees paid for the year | | $ | 0 | |
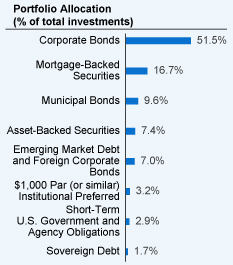
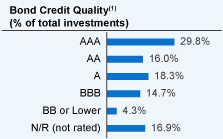
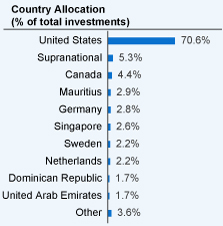
What did the Fund invest in? (as of July 31, 2024)
(1) The ratings disclosed are the credit quality ratings for its portfolio securities provided by Standard & Poor’s Group, Moody’s Investors Service, Inc. and Fitch, Inc. If all three provide a rating for a security, the middle is used; if two of the three agencies rate a security, the lower rating is used; and if only one rating agency rates a security, that rating is used. This treatment of split-rated securities may differ from that used for other purposes, such as for Fund investment policies. Credit ratings are subject to change. AAA, AA, A, and BBB are investment grade ratings; BB, B, CCC, CC, C and D are below-investment grade ratings. Holdings designated N/R are not rated by these national ratings agencies.
How has the Fund changed?
For more complete information, you may review the Fund’s next prospectus, which is expected to be available by November 29, 2024 at https://www.nuveen.com/en‑us/mutual‑funds/prospectuses or upon request at (800) 257‑8787.
Availability of additional information about the Fund
You can find additional information about the Fund at https://www.nuveen.com/en‑us/mutual‑funds/prospectuses, including its:
| | • | | prospectus • financial statements and other information • fund holdings • proxy voting information |
You can also request this information at (800) 257‑8787.
| | |
67073H509_AR_0724 3824689‑INV‑Y‑09/25 | | |
| | |
| |
Annual Shareholder Report
July 31, 2024 |
Nuveen High Yield Managed Accounts Portfolio
NMYHX
Annual Shareholder Report
This annual shareholder report contains important information about the Nuveen High Yield Managed Accounts Portfolio for the period of August 1, 2023 to July 31, 2024. You can find additional information at https://www.nuveen.com/en‑us/mutual‑funds/prospectuses. You can also request this information by contacting us at (800) 257‑8787.
This report describes changes to the Fund that occurred during the reporting period.
What were the Fund costs for the last year? (based on a hypothetical $10,000 investment)
| | | | |
| | |
| | | Cost of a $10,000 investment | | Costs paid as a percentage of
$10,000 investment* |
| | | |
| Nuveen High Yield Managed Accounts Portfolio | | $0 | | 0.00% |
* Annualized for period less than one year. The Fund does not pay a management fee or other expenses (excluding interest expense, taxes, fees incurred in acquiring and disposing of portfolio securities and extraordinary expenses). The Fund’s investment adviser and sub-adviser are compensated from the fee charged by the separately managed account through which Fund shares are held.
How did the Fund perform last year? What affected the Fund’s performance?
| | |
| |
Performance Highlights • The Nuveen High Yield Managed Accounts Portfolio returned 10.69% at net asset value (NAV) for the 12 months ended July 31, 2024. The Fund performed in line with the ICE BofA BB‑B U.S. Cash Pay High Yield Constrained Index, which returned 10.47%. • Top contributors to relative performance » Security selection within the telecommunications and cable & satellite industries. » An overweight to and security selection within support services and health care facilities industries, as higher beta names generally outperformed. » Security selection within CCC‑rated bonds, which benefited from the market’s risk‑on tone and the Fund’s avoidance of certain distressed names. • Top detractors from relative performance » Security selection within the specialty retail industry, driven by an underperforming arts and crafts retailer, The Michael’s Companies. » Overweight to and security selection within the rail sector, including a holding in a private passenger rail credit, Brightline East, which underperformed. | | Performance Attribution Telecom and cable & satellite Support services and health care facilities CCC‑rated bonds Specialty retail Rail |
How did the Fund perform over the period since inception?
Performance data shown represents past performance and does not predict or guarantee future results. The graph and table do not reflect the deduction of taxes that a shareholder would pay on Fund distributions or redemption of Fund Shares.
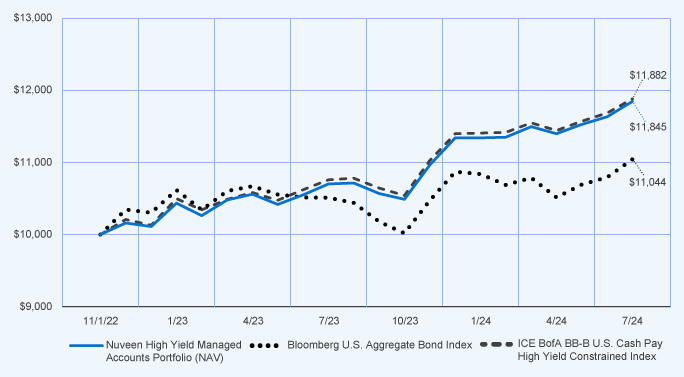
Fund Performance (November 1, 2022 through July 31, 2024) Initial Investment of $10,000
Average Annual Total Returns
| | | | | | | | |
| | |
| | | 1‑Year | | | Since Inception
(11/1/22) | |
| | | |
| Nuveen High Yield Managed Accounts Portfolio at NAV | | | 10.69 | % | | | 10.19 | % |
| | | |
| Bloomberg U.S. Aggregate Bond Index | | | 5.10 | % | | | 5.85 | % |
| | | |
| ICE BofA BB‑B U.S. Cash Pay High Yield Constrained Index | | | 10.47 | % | | | 10.39 | % |
Investment return and principal value will fluctuate, and you may have a gain or loss when you sell your shares. Current performance may differ from figures shown. For most recent month‑end performance, go to https://www.nuveen.com/en‑us/mutual‑funds/prospectuses or call (800) 257‑8787.
Fund Statistics (as of July 31, 2024)
| | | | |
| |
| Fund net assets | | $ | 18,037,207 | |
| |
| Total number of portfolio holdings | | | 196 | |
| |
| Portfolio turnover (%) | | | 77% | |
| |
| Total management fees paid for the year | | $ | 0 | |
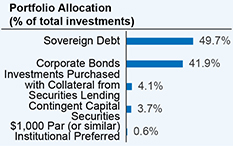
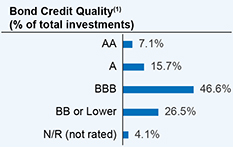
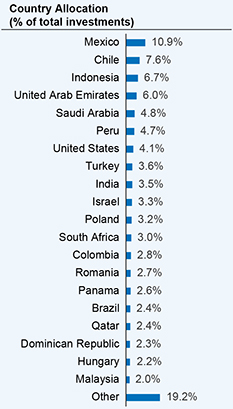
What did the Fund invest in? (as of July 31, 2024)
(1) The ratings disclosed are the lowest rating given by one of the following national rating agencies: Standard & Poor’s (S&P), Moody’s Investors Service, Inc. (Moody’s) or Fitch, Inc (Fitch). This treatment of split-rated securities may differ from that used for other purposes, such as for Fund investment policies. Credit ratings are subject to change. AAA, AA, A, and BBB are investment grade ratings; BB, B, CCC, CC, C and D are below-investment grade ratings. Holdings designated N/R are not rated by these national ratings agencies.
How has the Fund changed?
| | • | | Portfolio Manager Updates: Effective April 5, 2024, Jacob Fitzpatrick, CFA is no longer a portfolio manager of the Fund. Effective April 5, 2024, Kristal Seales, CFA was added as a portfolio manager of the Fund. | |
For more complete information, you may review the Fund’s next prospectus, which is expected to be available by November 29, 2024 at https://www.nuveen.com/en‑us/mutual‑funds/prospectuses or upon request at (800) 257‑8787.
Availability of additional information about the Fund
You can find additional information about the Fund at https://www.nuveen.com/en-us/mutual-funds/prospectuses, including its:
| | • | | prospectus • financial statements and other information • fund holdings • proxy voting information |
You can also request this information at (800) 257‑8787.
| | |
67073H608_AR_0724 3824698-INV-Y-09/25 | | |
| | |
| |
Annual Shareholder Report
July 31, 2024 |
Nuveen Preferred Securities and Income Managed Accounts Portfolio
NISPX
Annual Shareholder Report
This annual shareholder report contains important information about the Nuveen Preferred Securities and Income Managed Accounts Portfolio for the period of August 1, 2023 to July 31, 2024. You can find additional information at https://www.nuveen.com/en‑us/mutual‑funds/prospectuses. You can also request this information by contacting us at (800) 257‑8787.
This report describes changes to the Fund that occurred during the reporting period.
What were the Fund costs for the last year? (based on a hypothetical $10,000 investment)
| | | | |
| | |
| | | Cost of a $10,000 investment | | Costs paid as a percentage of
$10,000 investment* |
| | | |
| Nuveen Preferred Securities and Income Managed Accounts Portfolio | | $0 | | 0.00% |
* Annualized for period less than one year. The Fund does not pay a management fee or other expenses (excluding interest expense, taxes, fees incurred in acquiring and disposing of portfolio securities and extraordinary expenses). The Fund’s investment adviser and sub-adviser are compensated from the fee charged by the separately managed account through which Fund shares are held.
How did the Fund perform last year? What affected the Fund’s performance?
| | |
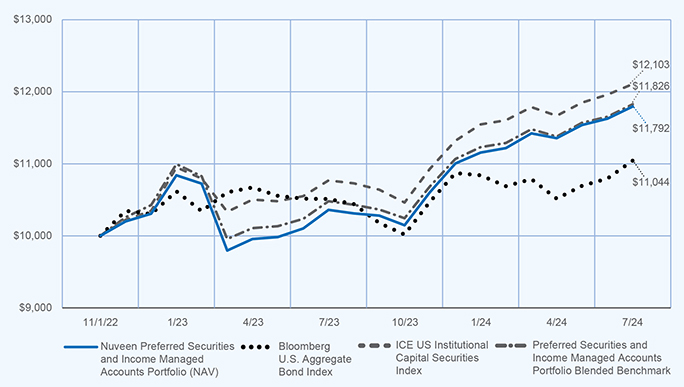
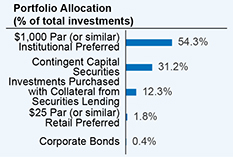
Performance Highlights • The Nuveen Preferred Securities and Income Managed Accounts Portfolio returned 13.85% at net asset value (NAV) for the 12 months ended July 31, 2024. The Fund outperformed the Preferred Securities and Income Managed Accounts Portfolio Blended Benchmark, which returned 12.85%. The Fund’s Blended Benchmark consists of: 1) 60% ICE US Institutional Capital Securities Index and 2) 40% ICE USD Contingent Capital Index. • Top contributors to relative performance » Overweights to the consumer cyclical and finance companies industries. » Overweight to floating-rate coupon securities and a corresponding underweight to fixed-rate coupon securities. » Security selection within the banking and insurance industries. • Top detractors from relative performance » Out‑of‑benchmark exposure to $25 par preferred securities. » Underweight to the contingent capital securities (CoCos) segment, which generally outperformed the $25 par preferred securities and $1000 par preferred securities segments. | | Performance Attribution Consumer cyclical and finance companies sectors Floating and fixed rate couon securities Banking and insurance sectors $25 par preferred securities CoCos |
How did the Fund perform over the period since inception?
Performance data shown represents past performance and does not predict or guarantee future results. The graph and table do not reflect the deduction of taxes that a shareholder would pay on Fund distributions or redemption of Fund Shares.
Fund Performance (November 1, 2022 through July 31, 2024) Initial Investment of $10,000
Average Annual Total Returns
| | | | | | | | |
| | |
| | | 1‑Year | | | Since
Inception
(11/1/22) | |
| | | |
| Nuveen Preferred Securities and Income Managed Accounts Portfolio at NAV | | | 13.85 | % | | | 9.90 | % |
| | | |
| Bloomberg U.S. Aggregate Bond Index | | | 5.10 | % | | | 5.85 | % |
| | | |
| ICE US Institutional Capital Securities Index* | | | 12.41 | % | | | 11.56 | % |
| | | |
| Preferred Securities and Income Managed Accounts Portfolio Blended Benchmark | | | 12.85 | % | | | 10.09 | % |
* Effective November 30, 2023, the Fund selected the ICE U.S. Institutional Capital Securities Index to replace the ICE BofA U.S. All Capital Securities Index as a Fund benchmark because the Fund’s investment adviser believes that the ICE U.S. Institutional Capital Securities Index better reflects the securities in which the Fund primarily invests as well as the principal investment strategies employed by the Fund. The benchmark change was applied retroactively to the Fund’s inception date, November 1, 2022.
Investment return and principal value will fluctuate, and you may have a gain or loss when you sell your shares. Current performance may differ from figures shown. For most recent month‑end performance, go to https://www.nuveen.com/en‑us/mutual‑funds/prospectuses or call (800) 257‑8787.
Fund Statistics (as of July 31, 2024)
| | | | |
| |
| Fund net assets | | $ | 17,798,994 | |
| |
| Total number of portfolio holdings | | | 70 | |
| |
| Portfolio turnover (%) | | | 38% | |
| |
| Total management fees paid for the year | | $ | 0 | |
What did the Fund invest in? (as of July 31, 2024)
(1) The ratings disclosed are the highest rating given by one of the following national rating agencies: Standard & Poor’s (S&P), Moody’s Investors Service, Inc. (Moody’s) or Fitch, Inc (Fitch). This treatment of split-rated securities may differ from that used for other purposes, such as for Fund investment policies. Credit ratings are subject to change. AAA, AA, A, and BBB are investment grade ratings; BB, B, CCC, CC, C and D are below-investment grade ratings. Holdings designated N/R are not rated by these national ratings agencies.
How has the Fund changed?
For more complete information, you may review the Fund’s next prospectus, which is expected to be available by November 29, 2024 at https://www.nuveen.com/en-us/mutual-funds/prospectuses or upon request at (800) 257-8787.
Availability of additional information about the Fund
You can find additional information about the Fund at https://www.nuveen.com/en-us/mutual-funds/prospectuses, including its:
| | • | | prospectus • financial statements and other information • fund holdings • proxy voting information |
You can also request this information at (800) 257-8787.
| | |
67073H707_AR_0724 3824708-INV-Y-09/25 | | |
| | |
| |
Annual Shareholder Report
July 31, 2024 |
Nuveen Securitized Credit Managed Accounts Portfolio
NNSDX
Annual Shareholder Report
This annual shareholder report contains important information about the Nuveen Securitized Credit Managed Accounts Portfolio for the period of August 1, 2023 to July 31, 2024. You can find additional information at https://www.nuveen.com/en‑us/mutual‑funds/prospectuses. You can also request this information by contacting us at (800) 257-8787.
This report describes changes to the Fund that occurred during the reporting period.
What were the Fund costs for the last year? (based on a hypothetical $10,000 investment)
| | | | |
| | |
| | | Cost of a $10,000 investment | | Costs paid as a percentage of
$10,000 investment* |
| | | |
| Nuveen Securitized Credit Managed Accounts Portfolio | | $0 | | 0.00% |
* Annualized for period less than one year. The Fund does not pay a management fee or other expenses (excluding interest expense, taxes, fees incurred in acquiring and disposing of portfolio securities and extraordinary expenses). The Fund’s investment adviser and sub-adviser are compensated from the fee charged by the separately managed account through which Fund shares are held.
How did the Fund perform last year? What affected the Fund’s performance?
| | |
Performance Highlights • The Nuveen Securitized Credit Managed Accounts Portfolio returned 7.81% at net asset value (NAV) for the 12 months ended July 31, 2024. The Fund outperformed the Bloomberg US Securitized Index, which returned 4.98%. • Top contributors to relative performance » An out-of-benchmark allocation to mortgage credit, including non-agency mortgage-backed securities (MBS) and credit risk transfers. » An overweight to commercial mortgage-backed securities (CMBS). » Security selection within the asset-backed securities (ABS) sector, including a higher allocation to esoteric ABS. • Top detractors from relative performance » Shorter-duration positioning, which was unfavorable as short-end rates declined during the reporting period. | | Performance Attribution Mortgage credit CMBS ABS Shorter-duration positioning |
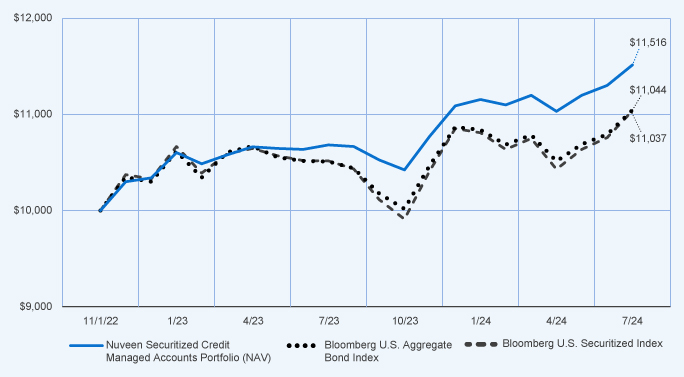
How did the Fund perform over the period since inception?
Performance data shown represents past performance and does not predict or guarantee future results. The graph and table do not reflect the deduction of taxes that a shareholder would pay on Fund distributions or redemption of Fund Shares.
Fund Performance (November 1, 2022 through July 31, 2024) Initial Investment of $10,000
Average Annual Total Returns
| | | | | | | | |
| | |
| | | 1‑Year | | | Since Inception (11/1/22) | |
| | | |
| Nuveen Securitized Credit Managed Accounts Portfolio at NAV | | | 7.81 | % | | | 8.42 | % |
| | | |
| Bloomberg U.S. Aggregate Bond Index | | | 5.10 | % | | | 5.85 | % |
| | | |
| Bloomberg U.S. Securitized Index | | | 4.98 | % | | | 5.82 | % |
Investment return and principal value will fluctuate, and you may have a gain or loss when you sell your shares. Current performance may differ from figures shown. For most recent month‑end performance, go to https://www.nuveen.com/en‑us/mutual‑funds/prospectuses or call (800) 257‑8787.
Fund Statistics (as of July 31, 2024)
| | | | |
| |
| Fund net assets | | $ | 26,793,416 | |
| |
| Total number of portfolio holdings | | | 129 | |
| |
| Portfolio turnover (%) | | | 46% | |
| |
| Total management fees paid for the year | | $ | 0 | |
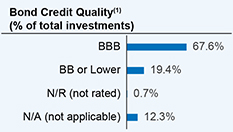
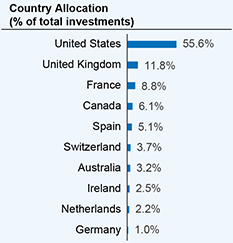
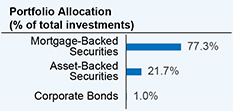
What did the Fund invest in? (as of July 31, 2024)
(1) The ratings disclosed are the highest rating given by one of the following national rating agencies: Standard & Poor’s (S&P), Moody’s Investors Service, Inc. (Moody’s) or Fitch, Inc (Fitch). This treatment of split-rated securities may differ from that used for other purposes, such as for Fund investment policies. Credit ratings are subject to change. AAA, AA, A, and BBB are investment grade ratings; BB, B, CCC, CC, C and D are below-investment grade ratings. Holdings designated N/R are not rated by these national ratings agencies.
How has the Fund changed?
For more complete information, you may review the Fund’s next prospectus, which is expected to be available by November 29, 2024 at https://www.nuveen.com/en-us/mutual-funds/prospectuses or upon request at (800) 257-8787.
Availability of additional information about the Fund
You can find additional information about the Fund at https://www.nuveen.com/en-us/mutual-funds/prospectuses, including its:
| | • | | prospectus • financial statements and other information • fund holdings • proxy voting information |
You can also request this information at (800) 257-8787.
| | |
67073H806_AR_0724 3824713-INV-Y-09/25 | | |
| | |
| |
Annual Shareholder Report
July 31, 2024 |
Nuveen Ultra Short Municipal Managed Accounts Portfolio
NUSMX
Annual Shareholder Report
This annual shareholder report contains important information about the Nuveen Ultra Short Municipal Managed Accounts Portfolio for the period of February 29, 2024 (inception) to July 31, 2024. You can find additional information at https://www.nuveen.com/en‑us/mutual‑funds/prospectuses. You can also request this information by contacting us at (800) 257‑8787.
This report describes changes to the Fund that occurred during the reporting period.
What were the Fund costs for the period since inception? (based on a hypothetical $10,000 investment)
| | | | |
| | |
| | | Cost of a $10,000 investment | | Costs paid as a percentage of
$10,000 investment* |
| | | |
| Nuveen Ultra Short Municipal Managed Accounts Portfolio | | $0 | | 0.00% |
* Annualized for period less than one year. The Fund does not pay a management fee or other expenses (excluding interest expense, taxes, fees incurred in acquiring and disposing of portfolio securities and extraordinary expenses). The Fund’s investment adviser and sub-adviser are compensated from the fee charged by the separately managed account through which Fund shares are held.
How did the Fund perform since inception? What affected the Fund’s performance?
|
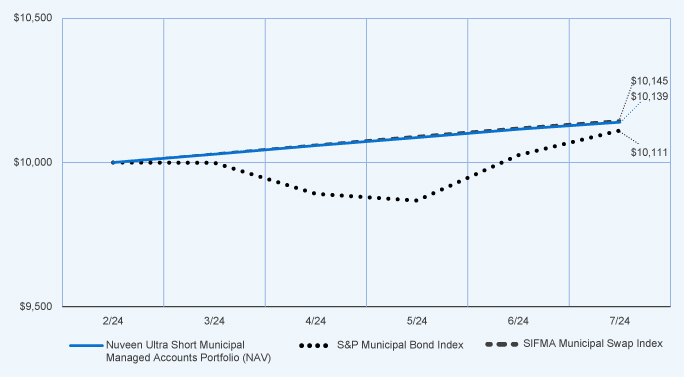
Performance Highlights • The Nuveen Ultra Short Municipal Managed Accounts Portfolio returned 1.39% at net asset value (NAV) for the abbreviated reporting period from the Fund’s inception on February 29, 2024, through July 31, 2024. The Fund performed in line with the SIFMA Municipal Swap Index, which returned 1.44%. • Primary performance drivers impacting relative yield » Shorter-duration positioning, specifically with more daily than weekly putable securities. » Overweight to positions in the AAA‑ and AA‑rated categories. » Overweight to positions with enhancement features that added another level of security to the bond’s underlying credit quality. |
How did the Fund perform over the period since inception?
Performance data shown represents past performance and does not predict or guarantee future results. The graph and table do not reflect the deduction of taxes that a shareholder would pay on Fund distributions or redemption of Fund Shares.
Fund Performance (February 29, 2024 through July 31, 2024) Initial Investment of $10,000
Average Annual Total Returns
| | | | |
| |
| | | Since Inception (2/29/24) | |
| | |
| Nuveen Ultra Short Municipal Managed Accounts Portfolio at NAV | | | 1.39 | % |
| | |
| S&P Municipal Bond Index | | | 1.11 | % |
| | |
| SIFMA Municipal Swap Index | | | 1.44 | % |
Investment return and principal value will fluctuate, and you may have a gain or loss when you sell your shares. Current performance may differ from figures shown. For most recent month‑end performance, go to https://www.nuveen.com/en‑us/mutual‑funds/prospectuses or call (800) 257‑8787.
Fund Statistics (as of July 31, 2024)
| | | | |
| |
| Fund net assets | | $ | 10,000,000 | |
| |
| Total number of portfolio holdings | | | 30 | |
| |
| Portfolio turnover (%) | | | 0% | |
| |
| Total management fees paid for the year | | $ | 0 | |
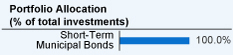
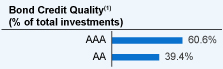
What did the Fund invest in? (as of July 31, 2024)
(1) The ratings disclosed are the highest rating given by one of the following national rating agencies: Standard & Poor’s (S&P), Moody’s Investors Service, Inc. (Moody’s) or Fitch, Inc (Fitch). This treatment of split-rated securities may differ from that used for other purposes, such as for Fund investment policies. Credit ratings are subject to change. AAA, AA, A, and BBB are investment grade ratings; BB, B, CCC, CC, C and D are below-investment grade ratings. Holdings designated N/R are not rated by these national ratings agencies.
How has the Fund changed?
For more complete information, you may review the Fund’s next prospectus, which is expected to be available by November 29, 2024 at https://www.nuveen.com/en‑us/mutual‑funds/prospectuses or upon request at (800) 257‑8787.
Availability of additional information about the Fund
You can find additional information about the Fund at https://www.nuveen.com/en‑us/mutual‑funds/prospectuses, including its:
| | • | | prospectus • financial statements and other information • fund holdings • proxy voting information |
You can also request this information at (800) 257‑8787.
| | |
67073H889_AR_0724 3824720‑INV‑Y‑09/25 | | |
As of the end of the period covered by this report, the registrant has adopted a code of ethics that applies to the registrant’s principal executive officer, principal financial officer, principal accounting officer or controller, or persons performing similar functions. There were no amendments to or waivers from the code during the period covered by this report. Upon request, a copy of the registrant’s code of ethics is available without charge by calling 800-257-8787.
| Item 3. | Audit Committee Financial Expert. |
As of the end of the period covered by this report, the registrant’s Board of Directors or Trustees (“Board”) had determined that the registrant has at least one “audit committee financial expert” (as defined in Item 3 of Form N-CSR) serving on its Audit Committee. The members of the registrant’s audit committee that have been designated as audit committee financial experts are Joseph A. Boateng, Albin F. Moschner, John K. Nelson, Loren M. Starr and Robert L. Young, who are “independent” for purposes of Item 3 of Form N-CSR.
Mr. Boateng has served as the Chief Investment Officer for Casey Family Programs since 2007. He was previously Director of U.S. Pension Plans for Johnson & Johnson from 2002-2006. Mr. Boateng is a board member of the Lumina Foundation and Waterside School, an emeritus board member of Year Up Puget Sound, member of the Investment Advisory Committee and former Chair for the Seattle City Employees’ Retirement System, and an Investment Committee Member for The Seattle Foundation. Mr. Boateng previously served on the Board of Trustees for the College Retirement Equities Fund (2018-2023) and on the Management Committee for TIAA Separate Account VA-1 (2019-2023).
Mr. Moschner is a consultant in the wireless industry and, in July 2012, founded Northcroft Partners, LLC, a management consulting firm that provides operational, management and governance solutions. Prior to founding Northcroft Partners, LLC, Mr. Moschner held various positions at Leap Wireless International, Inc., a provider of wireless services, where he was as a consultant from February 2011 to July 2012, Chief Operating Officer from July 2008 to February 2011, and Chief Marketing Officer from August 2004 to June 2008. Before he joined Leap Wireless International, Inc., Mr. Moschner was President of the Verizon Card Services division of Verizon Communications, Inc. from 2000 to 2003, and President of One Point Services at One Point Communications from 1999 to 2000. Mr. Moschner also served at Zenith Electronics Corporation as Director, President and Chief Executive Officer from 1995 to 1996, and as Director, President and Chief Operating Officer from 1994 to 1995.
Mr. Nelson formerly served on the Board of Directors of Core12, LLC from 2008 to 2023, a private firm which develops branding, marketing, and communications strategies for clients. Mr. Nelson has extensive experience in global banking and markets, having served in several senior executive positions with ABN AMRO Holdings N.V. and its affiliated entities and predecessors, including LaSalle Bank Corporation from 1996 to 2008, ultimately serving as Chief Executive Officer of ABN AMRO N.V. North America. During his tenure at the bank, he also served as Global Head of its Financial Markets Division, which encompassed the bank’s Currency, Commodity, Fixed Income, Emerging Markets, and Derivatives businesses. He was a member of the Foreign Exchange Committee of the Federal Reserve Bank of the United States and during his tenure with ABN AMRO served as the bank’s representative on various committees of The Bank of Canada, European Central Bank, and The Bank of England. Mr. Nelson previously served as a senior, external advisor to the financial services practice of Deloitte Consulting LLP. (2012-2014).
Mr. Starr was Vice Chair, Senior Managing Director from 2020 to 2021, and Chief Financial Officer, Senior Managing Director from 2005 to 2020, for Invesco Ltd. Mr. Starr is also a Director and member of the Audit Committee for AMG. He is former Chair and member of the Board of Directors, Georgia Leadership Institute for School Improvement (GLISI); former Chair and member of the Board of Trustees, Georgia Council on Economic Education (GCEE). Mr. Starr previously served on the Board of Trustees for the College Retirement Equities Fund and on the Management Committee for TIAA Separate Account VA-1 (2022-2023).
Mr. Young has more than 30 years of experience in the investment management industry. From 1997 to 2017, he held various positions with J.P. Morgan Investment Management Inc. (“J.P. Morgan Investment”) and its affiliates (collectively, “J.P. Morgan”). Most recently, he served as Chief Operating Officer and Director of J.P. Morgan Investment (from 2010 to 2016) and as President and Principal Executive Officer of the J.P. Morgan Funds (from 2013 to 2016). As Chief Operating Officer of J.P. Morgan Investment, Mr. Young led service, administration and business platform support activities for J.P. Morgan’s domestic retail mutual fund and institutional commingled and separate account businesses and co-led these activities for J.P. Morgan’s global retail and institutional
investment management businesses. As President of the J.P. Morgan Funds, Mr. Young interacted with various service providers to these funds, facilitated the relationship between such funds and their boards, and was directly involved in establishing board agendas, addressing regulatory matters, and establishing policies and procedures. Before joining J.P. Morgan, Mr. Young, a former Certified Public Accountant (CPA), was a Senior Manager (Audit) with Deloitte & Touche LLP (formerly, Touche Ross LLP), where he was employed from 1985 to 1996. During his tenure there, he actively participated in creating, and ultimately led, the firm’s midwestern mutual fund practice.
| Item 4. | Principal Accountant Fees and Services. |
The following tables show the amount of fees that PricewaterhouseCoopers, the Funds’ auditor, billed to the Funds during the Funds’ last two full fiscal years. The Audit Committee approved in advance all audit services and non-audit services that PricewaterhouseCoopers provided to the Funds, except for those non-audit services that were subject to the pre-approval exception under Rule 2-01 of Regulation S-X (the “pre-approval exception”). The pre-approval exception for services provided directly to the Funds waives the pre-approval requirement for services other than audit, review or attest services if: (A) the aggregate amount of all such services provided constitutes no more than 5% of the total amount of revenues paid by the Funds during the fiscal year in which the services are provided; (B) the Funds did not recognize the services as non-audit services at the time of the engagement; and (C) the services are promptly brought to the Audit Committee’s attention, and the Committee (or its delegate) approves the services before the audit is completed.
The Audit Committee has delegated certain pre-approval responsibilities to its Chair (or, in his absence, any other member of the Audit Committee).
| | | | | | | | | | | | | | | | |
| Fiscal Year Ended July 31, 2024 | | Audit Fees
Billed to Funds1 | | | Audit-Related Fees
Billed to Funds2 | | | Tax Fees
Billed to Funds3 | | | All Other Fees
Billed to Funds4 | |
| Municipal Total Return Managed Accounts Portfolio | | | $55,665 | | | | $0 | | | | $0 | | | | $0 | |
| | | | | | | | | | | | | | | | |
| Nuveen Core Impact Bond Managed Accounts Portfolio | | | $55,665 | | | | $0 | | | | $0 | | | | $0 | |
| | | | | | | | | | | | | | | | |
| Nuveen Emerging Markets Debt Managed Accounts Portfolio | | | $55,665 | | | | $0 | | | | $0 | | | | $0 | |
| | | | | | | | | | | | | | | | |
| Nuveen High Yield Managed Accounts Portfolio | | | $55,665 | | | | $0 | | | | $0 | | | | $0 | |
| | | | | | | | | | | | | | | | |
| Nuveen Preferred Securities and Income Managed Accounts Portfolio | | | $55,665 | | | | $0 | | | | $29 | | | | $0 | |
| | | | | | | | | | | | | | | | |
| Nuveen Securitized Credit Managed Accounts Portfolio | | | $55,665 | | | | $0 | | | | $0 | | | | $0 | |
| | | | | | | | | | | | | | | | |
| Nuveen Ultra Short Municipal Managed Accounts Portfolio5 | | | $55,575 | | | | $0 | | | | $0 | | | | $0 | |
| | | | | | | | | | | | | | | | |
Total | | | $389,565 | | | | $0 | | | | $29 | | | | $0 | |
| 1 | “Audit Fees” are the aggregate fees billed for professional services for the audit of the Fund’s annual financial statements and services provided in connection with statutory and regulatory filings or engagements. |
| 2 | “Audit-Related Fees” are the aggregate fees billed for assurance and related services reasonably related to the performance of the audit or review of financial statements that are not reported under “Audit Fees”. These fees include offerings related to the Fund’s common shares and leverage. |
| 3 | “Tax Fees” are the aggregate fees billed for professional services for tax advice, tax compliance, and tax planning. These fees include: all global withholding tax services; excise and state tax reviews; capital gain, tax equalization and taxable basis calculations performed by the principal accountant. |
| 4 | “All Other Fees” are the aggregate fees billed for products and services other than “Audit Fees”, “Audit-Related Fees” and “Tax Fees”. These fees represent all “Agreed-Upon Procedures” engagements pertaining to the Fund’s use of leverage. |
| 5 | Fund commenced operations on 2/29/2024. |
| | | | | | | | | | | | | | | | |
| Fiscal Year Ended July 31, 2024 | | Percentage Approved Pursuant to Pre-approval Exception | |
| | Audit Fees
Billed to Funds | | | Audit-Related Fees
Billed to Funds | | | Tax Fees
Billed to Funds | | | All Other Fees
Billed to Funds | |
| Municipal Total Return Managed Accounts Portfolio | | | 0% | | | | 0% | | | | 0% | | | | 0% | |
| | | | | | | | | | | | | | | | |
| Fiscal Year Ended July 31, 2024 | | Percentage Approved Pursuant to Pre-approval Exception | |
| | Audit Fees
Billed to Funds | | | Audit-Related Fees
Billed to Funds | | | Tax Fees
Billed to Funds | | | All Other Fees
Billed to Funds | |
| Nuveen Core Impact Bond Managed Accounts Portfolio | | | 0% | | | | 0% | | | | 0% | | | | 0% | |
| | | | | | | | | | | | | | | | |
| Nuveen Emerging Markets Debt Managed Accounts Portfolio | | | 0% | | | | 0% | | | | 0% | | | | 0% | |
| | | | | | | | | | | | | | | | |
| Nuveen High Yield Managed Accounts Portfolio | | | 0% | | | | 0% | | | | 0% | | | | 0% | |
| | | | | | | | | | | | | | | | |
| Nuveen Preferred Securities and Income Managed Accounts Portfolio | | | 0% | | | | 0% | | | | 0% | | | | 0% | |
| | | | | | | | | | | | | | | | |
| Nuveen Securitized Credit Managed Accounts Portfolio | | | 0% | | | | 0% | | | | 0% | | | | 0% | |
| | | | | | | | | | | | | | | | |
| Nuveen Ultra Short Municipal Managed Accounts Portfolio | | | 0% | | | | 0% | | | | 0% | | | | 0% | |
| | | | |
| Fiscal Year Ended July 31, 2023 | | Audit Fees
Billed to Funds1 | | | Audit-Related Fees
Billed to Funds2 | | | Tax Fees
Billed to Funds3 | | | All Other Fees
Billed to Funds4 | |
| Municipal Total Return Managed Accounts Portfolio | | | $58,603 | | | | $0 | | | | $0 | | | | $0 | |
| | | | | | | | | | | | | | | | |
| Nuveen Core Impact Bond Managed Accounts Portfolio | | | $58,940 | | | | $0 | | | | $0 | | | | $0 | |
| | | | | | | | | | | | | | | | |
| Nuveen Emerging Markets Debt Managed Accounts Portfolio | | | $58,500 | | | | $0 | | | | $0 | | | | $0 | |
| | | | | | | | | | | | | | | | |
| Nuveen High Yield Managed Accounts Portfolio | | | $58,500 | | | | $0 | | | | $0 | | | | $0 | |
| | | | | | | | | | | | | | | | |
| Nuveen Preferred Securities and Income Managed Accounts Portfolio | | | $58,500 | | | | $0 | | | | $0 | | | | $0 | |
| | | | | | | | | | | | | | | | |
| Nuveen Securitized Credit Managed Accounts Portfolio | | | $58,500 | | | | $0 | | | | $0 | | | | $0 | |
| | | | | | | | | | | | | | | | |
Total | | | $351,543 | | | | $0 | | | | $0 | | | | $0 | |
| 1 | “Audit Fees” are the aggregate fees billed for professional services for the audit of the Fund’s annual financial statements and services provided in connection with statutory and regulatory filings or engagements. |
| 2 | “Audit-Related Fees” are the aggregate fees billed for assurance and related services reasonably related to the performance of the audit or review of financial statements that are not reported under “Audit Fees”. These fees include offerings related to the Fund’s common shares and leverage. |
| 3 | “Tax Fees” are the aggregate fees billed for professional services for tax advice, tax compliance, and tax planning. These fees include: all global withholding tax services; excise and state tax reviews; capital gain, tax equalization and taxable basis calculations performed by the principal accountant. |
| 4 | “All Other Fees” are the aggregate fees billed for products and services other than “Audit Fees”, “Audit-Related Fees” and “Tax Fees”. These fees represent all “Agreed-Upon Procedures” engagements pertaining to the Fund’s use of leverage. |
| | | | | | | | | | | | | | | | |
| Fiscal Year Ended July 31, 2023 | | Percentage Approved Pursuant to Pre-approval Exception | |
| | Audit Fees
Billed to Funds | | | Audit-Related Fees
Billed to Funds | | | Tax Fees
Billed to Funds | | | All Other Fees
Billed to Funds | |
| Municipal Total Return Managed Accounts Portfolio | | | 0 | % | | | 0 | % | | | 0 | % | | | 0 | % |
| | | | | | | | | | | | | | | | |
| Fiscal Year Ended July 31, 2023 | | Percentage Approved Pursuant to Pre-approval Exception | |
| | Audit Fees
Billed to Funds | | | Audit-Related Fees
Billed to Funds | | | Tax Fees
Billed to Funds | | | All Other Fees
Billed to Funds | |
| | | | | | | | | | | | | | | | |
| Nuveen Core Impact Bond Managed Accounts Portfolio | | | 0% | | | | 0% | | | | 0% | | | | 0% | |
| | | | | | | | | | | | | | | | |
| Nuveen Emerging Markets Debt Managed Accounts Portfolio | | | 0% | | | | 0% | | | | 0% | | | | 0% | |
| | | | | | | | | | | | | | | | |
| Nuveen High Yield Managed Accounts Portfolio | | | 0% | | | | 0% | | | | 0% | | | | 0% | |
| | | | | | | | | | | | | | | | |
| Nuveen Preferred Securities and Income Managed Accounts Portfolio | | | 0% | | | | 0% | | | | 0% | | | | 0% | |
| | | | | | | | | | | | | | | | |
| Nuveen Securitized Credit Managed Accounts Portfolio | | | 0% | | | | 0% | | | | 0% | | | | 0% | |
| | | | | | | | | | |
| Fiscal Year Ended July 31, 2024 | | Audit-Related Fees
Billed to Adviser
and Affiliated Fund
Service Providers | | Tax Fees
Billed to Adviser
and Affiliated Fund
Service Providers | | | All Other Fees
Billed to Adviser
and Affiliated Fund
Service Providers | |
| |
Nuveen Managed Accounts Portfolios Trust | | $0 | | | $0 | | | | $0 | |
| |
| | | Percentage Approved Pursuant to Pre-approval Exception | |
| | | Audit-Related Fees
Billed to Adviser
and Affiliated Fund
Service Providers | | Tax Fees
Billed to Adviser
and Affiliated Fund
Service Providers | | | All Other Fees
Billed to Adviser
and Affiliated Fund
Service Providers | |
| | | |
| | 0% | | | 0% | | | | 0% | |
| | | |
| Fiscal Year Ended July 31, 2023 | | Audit-Related Fees
Billed to Adviser
and Affiliated Fund
Service Providers | | Tax Fees
Billed to Adviser
and Affiliated Fund
Service Providers | | | All Other Fees
Billed to Adviser
and Affiliated Fund
Service Providers | |
| |
Nuveen Managed Accounts Portfolios Trust | | $0 | | | $0 | | | | $0 | |
| |
| | | Percentage Approved Pursuant to Pre-approval Exception | |
| | | Audit-Related Fees
Billed to Adviser
and Affiliated Fund
Service Providers | | Tax Fees
Billed to Adviser
and Affiliated Fund
Service Providers | | | All Other Fees
Billed to Adviser
and Affiliated Fund
Service Providers | |
| | | |
| | 0% | | | 0% | | | | 0% | |
| | | | | | | | | | | | | | | | |
| Fiscal Year Ended July 31, 2024 | | Total Non-Audit Fees
Billed to Fund | | | Total Non-Audit Fees
Billed to Adviser and
Affiliated Fund Service
Providers (engagements
related directly to the
operations and financial
reporting of the Trust) | | | Total Non-Audit Fees
Billed to Adviser and
Affiliated Fund Service
Providers (all other
engagements) | | | Total | |
| |
| Municipal Total Return Managed Accounts Portfolio | | | $0 | | | | $0 | | | | $0 | | | | $0 | |
| | | | | | | | | | | | | | | | |
| Nuveen Core Impact Bond Managed Accounts Portfolio | | | $0 | | | | $0 | | | | $0 | | | | $0 | |
| | | | | | | | | | | | | | | | |
| Nuveen Emerging Markets Debt Managed Accounts Portfolio | | | $0 | | | | $0 | | | | $0 | | | | $0 | |
| | | | | | | | | | | | | | | | |
| Fiscal Year Ended July 31, 2024 | | Total Non-Audit Fees
Billed to Fund | | | Total Non-Audit Fees
Billed to Adviser and
Affiliated Fund Service
Providers (engagements
related directly to the
operations and financial
reporting of the Trust) | | | Total Non-Audit Fees
Billed to Adviser and
Affiliated Fund Service
Providers (all other
engagements) | | | Total | |
| |
| Nuveen High Yield Managed Accounts Portfolio | | | $0 | | | | $0 | | | | $0 | | | | $0 | |
| | | | | | | | | | | | | | | | |
| Nuveen Preferred Securities and Income Managed Accounts Portfolio | | | $29 | | | | $0 | | | | $0 | | | | $29 | |
| | | | | | | | | | | | | | | | |
| Nuveen Securitized Credit Managed Accounts Portfolio | | | $0 | | | | $0 | | | | $0 | | | | $0 | |
| | | | | | | | | | | | | | | | |
| Nuveen Ultra Short Municipal Managed Accounts Portfolio | | | $0 | | | | $0 | | | | $0 | | | | $0 | |
| | | | | | | | | | | | | | | | |
| | | | |
Total | | | $29 | | | | $0 | | | | $0 | | | | $29 | |
“Non-Audit Fees billed to Fund” for both fiscal year ends represent “Tax Fees” and “All Other Fees” billed to Fund in their respective amounts from the previous table.
Less than 50 percent of the hours expended on the principal accountant’s engagement to audit the registrant’s financial statements for the most recent fiscal year were attributed to work performed by persons other than the principal accountant’s full-time, permanent employees.
| | | | | | | | | | | | | | | | |
| Fiscal Year Ended July 31, 2023 | | Total Non-Audit Fees
Billed to Fund | | | Total Non-Audit Fees
Billed to Adviser and
Affiliated Fund Service
Providers (engagements
related directly to the
operations and financial
reporting of the Trust) | | | Total Non-Audit Fees
Billed to Adviser and
Affiliated Fund Service
Providers (all other
engagements) | | | Total | |
| |
| Municipal Total Return Managed Accounts Portfolio | | | $0 | | | | $0 | | | | $0 | | | | $0 | |
| | | | | | | | | | | | | | | | |
| Nuveen Core Impact Bond Managed Accounts Portfolio | | | $0 | | | | $0 | | | | $0 | | | | $0 | |
| | | | | | | | | | | | | | | | |
| Nuveen Emerging Markets Debt Managed Accounts Portfolio | | | $0 | | | | $0 | | | | $0 | | | | $0 | |
| | | | | | | | | | | | | | | | |
| Nuveen High Yield Managed Accounts Portfolio | | | $0 | | | | $0 | | | | $0 | | | | $0 | |
| | | | | | | | | | | | | | | | |
| Nuveen Preferred Securities and Income Managed Accounts Portfolio | | | $0 | | | | $0 | | | | $0 | | | | $0 | |
| | | | | | | | | | | | | | | | |
| Nuveen Securitized Credit Managed Accounts Portfolio | | | $0 | | | | $0 | | | | $0 | | | | $0 | |
| | | | | | | | | | | | | | | | |
| | | | |
Total | | | $0 | | | | $0 | | | | $0 | | | | $0 | |
“Non-Audit Fees billed to Fund” for both fiscal year ends represent “Tax Fees” and “All Other Fees” billed to Fund in their respective amounts from the previous table.
Audit Committee Pre-Approval Policies and Procedures. Generally, the Audit Committee must approve (i) all non-audit services to be performed for the Funds by the Funds’ independent accountant and (ii) all audit and non-audit services to be performed by the Funds’ independent accountant for the Affiliated Fund Service Providers with respect to the operations and financial reporting of the Funds. Regarding tax and research projects conducted by the independent accountant for the Funds and Affiliated Fund Service Providers (with respect to operations and financial reports of the Trust), such engagements will be (i) pre-approved by the Audit Committee if they are expected to be for amounts greater than $10,000; (ii) reported to the Audit Committee Chair for his verbal approval prior to engagement if they are expected to be for amounts under $10,000 but greater than $5,000; and (iii) reported to the Audit Committee at the next Audit Committee meeting if they are expected to be for an amount under $5,000.
Item 4(i) and Item 4(j) are not applicable to the registrant.
| Item 5. | Audit Committee of Listed Registrants. |
Not applicable to this registrant.
| (a) | Schedule of Investments is included as part of the financial statements filed under Item 7 of this Form N-CSR. |
| Item 7. | Financial Statements and Financial Highlights for Open-End Management Investment Companies. |
Item
7.
Financial
Statements
and
Financial
Highlights
for
Open-End
Management
Investment
Companies
Report
of
Independent
Registered
Public
Accounting
Firm
To
the
Board
of
Trustees
of
Nuveen
Managed
Accounts
Portfolios
Trust
and
Shareholders
of
Municipal
Total
Return
Managed
Accounts
Portfolio,
Nuveen
Core
Impact
Bond
Managed
Accounts
Portfolio,
Nuveen
Emerging
Markets
Debt
Managed
Accounts
Portfolio,
Nuveen
High
Yield
Managed
Accounts
Portfolio,
Nuveen
Preferred
Securities
and
Income
Managed
Accounts
Portfolio,
Nuveen
Securitized
Credit
Managed
Accounts
Portfolio
and
Nuveen
Ultra
Short
Municipal
Managed
Accounts
Portfolio
Opinions
on
the
Financial
Statements
We
have
audited
the
accompanying
statements
of
assets
and
liabilities,
including
the
portfolios
of
investments,
of
each
of
the
funds
listed
in
the
table
below
(constituting
Nuveen
Managed
Accounts
Portfolios
Trust,
hereafter
collectively
referred
to
as
the
"Funds")
as
of
July
31,
2024,
the
related
statements
of
operations
and
of
changes
in
net
assets
for
each
of
the
periods
indicated
in
the
table
below,
including
the
related
notes,
and
the
financial
highlights
for
each
of
the
periods
indicated
in
the
table
below
(collectively
referred
to
as
the
“financial
statements”).
In
our
opinion,
the
financial
statements
present
fairly,
in
all
material
respects,
the
financial
position
of
each
of
the
Funds
listed
in
the
table
below
as
of
July
31,
2024,
the
results
of
each
of
their
operations,
the
changes
in
each
of
their
net
assets,
and
each
of
the
financial
highlights
for
each
of
the
periods
indicated
in
the
table
below,
in
conformity
with
accounting
principles
generally
accepted
in
the
United
States
of
America.
Municipal
Total
Return
Managed
Accounts
Portfolio
(1)
Nuveen
Core
Impact
Bond
Managed
Accounts
Portfolio
(2)
Nuveen
Emerging
Markets
Debt
Managed
Accounts
Portfolio
(3)
Nuveen
High
Yield
Managed
Accounts
Portfolio
(3)
Nuveen
Preferred
Securities
and
Income
Managed
Accounts
Portfolio
(3)
Nuveen
Securitized
Credit
Managed
Accounts
Portfolio
(3)
Nuveen
Ultra
Short
Municipal
Managed
Accounts
Portfolio
(4)
(1)
Statement
of
operations
for
the
year
ended
July
31,
2024,
statement
of
changes
in
net
assets
for
the
years
ended
July
31,
2024
and
2023
and
the
financial
highlights
for
the
years
ended
July
31,
2024,
2023,
2022,
2021
and
2020
(2)
Statement
of
operations
for
the
year
ended
July
31,
2024,
statement
of
changes
in
net
assets
for
the
year
ended
July
31,
2024,
the
nine
months
ended
July
31,
2023
and
the
year
ended
October
31,
2022
and
the
financial
highlights
for
the
year
ended
July
31,
2024,
the
nine
months
ended
July
31,
2023,
the
years
ended
October
31,
2022
and
2021,
and
the
period
July
9,
2020
(commencement
of
operations)
through
October
31,
2020
(3)
Statement
of
operations
for
the
year
ended
July
31,
2024,
statement
of
changes
in
net
assets
and
the
financial
highlights
for
the
year
ended
July
31,
2024,
and
the
period
November
1,
2022
(commencement
of
operations)
through
July
31,
2023
(4)
Statement
of
operations,
statement
of
changes
in
net
assets
and
the
financial
highlights
for
the
period
February
29,
2024
(commencement
of
operations)
through
July
31,
2024
Basis
for
Opinions
These
financial
statements
are
the
responsibility
of
the
Funds’
management.
Our
responsibility
is
to
express
an
opinion
on
the
Funds’
financial
statements
based
on
our
audits.
We
are
a
public
accounting
firm
registered
with
the
Public
Company
Accounting
Oversight
Board
(United
States)
(PCAOB)
and
are
required
to
be
independent
with
respect
to
the
Funds
in
accordance
with
the
U.S.
federal
securities
laws
and
the
applicable
rules
and
regulations
of
the
Securities
and
Exchange
Commission
and
the
PCAOB.
We
conducted
our
audits
of
these
financial
statements
in
accordance
with
the
standards
of
the
PCAOB.
Those
standards
require
that
we
plan
and
perform
the
audit
to
obtain
reasonable
assurance
about
whether
the
financial
statements
are
free
of
material
misstatement,
whether
due
to
error
or
fraud.
Our
audits
included
performing
procedures
to
assess
the
risks
of
material
misstatement
of
the
financial
statements,
whether
due
to
error
or
fraud,
and
performing
procedures
that
respond
to
those
risks.
Such
procedures
included
examining,
on
a
test
basis,
evidence
regarding
the
amounts
and
disclosures
in
the
financial
statements.
Our
audits
also
included
evaluating
the
accounting
principles
used
and
significant
estimates
made
by
management,
as
well
as
evaluating
the
overall
presentation
of
the
financial
statements.
Our
procedures
included
confirmation
of
securities
owned
as
of
July
31,
2024
by
correspondence
with
the
custodian
and
brokers;
when
replies
were
not
received
from
brokers,
we
performed
other
auditing
procedures.
We
believe
that
our
audits
provide
a
reasonable
basis
for
our
opinions.
/s/
PricewaterhouseCoopers
LLP
Chicago,
Illinois
September 26,
2024
We
have
served
as
the
auditor
of
one
or
more
investment
companies
in
Nuveen
Funds
since
2002.
Municipal
Total
Return
Managed
Accounts
Portfolio
Portfolio
of
Investments
July
31,
2024
Principal
Amount
(000)
Description
(a)
Optional
Call
Provisions
(b)
Value
LONG-TERM
INVESTMENTS
-
97.5%
X
–
MUNICIPAL
BONDS
-
97
.5
%
X
1,526,013,970
ALABAMA
-
0.4%
$
2,960
Huntsville,
Alabama,
General
Obligation
Warrants,
Series
2023B,
5.000%,
3/01/40
3/33
at
100.00
$
3,347,109
1,415
Madison
Water
and
Wastewater
Board,
Alabama,
Water
and
Sewer
Revenue
Bonds,
Series
2023,
5.250%,
12/01/48
12/33
at
100.00
1,581,703
1,205
The
Public
Educational
Building
Authority
of
Jacksonville,
Alabama,
Jacksonville
State
University
Foundation,
Higher
Educational
Facilities
Revenue
Bonds,
Jackson
State
University
Project
Series
2023A,
5.000%,
8/01/54
-
AGM
Insured
2/33
at
100.00
1,268,346
TOTAL
ALABAMA
6,197,158
ALASKA
-
0.5%
1,400
Alaska
Industrial
Development
and
Export
Authority,
Power
Revenue
Bonds,
Snettisham
Hydroelectric
Project,
Refunding
Series
2015,
5.000%,
1/01/30,
(AMT)
7/25
at
100.00
1,408,998
1,590
Alaska
Municipal
Bond
Bank,
General
Obligation
Bonds,
Three
Series
2015,
5.250%,
10/01/31
4/25
at
100.00
1,612,322
Alaska
Municipal
Bond
Bank,
General
Obligation
Bonds,
Three
Series
2023
:
1,030
5.250%,
12/01/38,
(AMT)
12/33
at
100.00
1,138,194
1,145
5.250%,
12/01/40,
(AMT)
12/33
at
100.00
1,253,069
2,310
Anchorage,
Alaska,
Solid
Waste
Services
Revenue
Bonds,
Refunding
Series
2022A,
5.500%,
11/01/41
11/32
at
100.00
2,641,654
TOTAL
ALASKA
8,054,237
ARIZONA
-
2.0%
2,200
(c)
Arizona
Industrial
Development
Authority
Education
Revenue
Bonds,
Pinecrest
Academy
of
Northern
Nevada
Project,
Series
2022A,
4.500%,
7/15/29
7/25
at
100.00
2,108,401
100
(c)
Arizona
Industrial
Development
Authority,
Arizona,
Education
Facility
Revenue
Bonds,
Basis
Schools,
Inc.
Projects,
Series
2017D,
5.000%,
7/01/37
7/27
at
100.00
101,403
1,000
(c)
Arizona
Industrial
Development
Authority,
Arizona,
Education
Facility
Revenue
Bonds,
Basis
Schools,
Inc.
Projects,
Series
2017G,
5.000%,
7/01/51
7/27
at
100.00
988,275
60
(c)
Arizona
Industrial
Development
Authority,
Arizona,
Education
Revenue
Bonds, Arizona
Agribusiness
and
Equine
Center,
Inc.
Project,
Series
2017B,
4.000%,
3/01/27
No
Opt.
Call
59,361
615
(c)
Arizona
Industrial
Development
Authority,
Arizona,
Education
Revenue
Bonds,
Pinecrest
Academy
of
Nevada
Horizon,
Inspirada
and
St.
Rose
Campus
Projects,
Series
2018A,
5.000%,
7/15/28
7/26
at
100.00
625,983
Arizona
Industrial
Development
Authority,
Education
Facility
Revenue
Bonds,
Leman
Academy
of
Excellence
Projects,
Series
2022A
:
500
4.000%,
7/01/28
No
Opt.
Call
496,108
500
4.000%,
7/01/29
No
Opt.
Call
495,130
1,405
4.000%,
7/01/30
7/29
at
100.00
1,386,157
1,050
Maricopa
County
and
Phoenix
City
Industrial
Development
Authority,
Arizona,
Single
Family
Mortgage
Revenue
Bonds,
Series
2024C,
4.750%,
9/01/49
3/33
at
100.00
1,058,786
Principal
Amount
(000)
Description
(a)
Optional
Call
Provisions
(b)
Value
ARIZONA
(continued)
$
2,000
Maricopa
County
Industrial
Development
Authority,
Arizona,
Education
Revenue
Bonds,
Legacy
Traditional
Schools
Projects,
Series
2024,
4.000%,
7/01/34
7/31
at
100.00
$
1,996,294
1,605
(c)
Maricopa
County
Industrial
Development
Authority,
Arizona,
Education
Revenue
Bonds,
Sun
Valley
Academy,
Series
2024A,
6.250%,
7/01/44
7/31
at
100.00
1,680,902
2,875
Maricopa
County
Union
High
School
District
216
Agua
Fria,
Arizona,
General
Obligation
Bonds,
School
Improvement,
Project
of
2023,
Series
2024A,
5.000%,
7/01/42
7/33
at
100.00
3,217,317
1,000
Phoenix
Civic
Improvement
Corporation,
Arizona,
Airport
Revenue
Bonds,
Junior
Lien
Series
2015A,
5.000%,
7/01/45
7/25
at
100.00
1,005,904
3,785
Phoenix
Civic
Improvement
Corporation,
Arizona,
Wastewater
System
Revenue
Bonds,
Junior
Lien
Series
2023,
5.250%,
7/01/47
7/33
at
100.00
4,249,559
5,025
Phoenix
Industrial
Development
Authority,
Arizona,
Education
Facility
Revenue
Bonds,
Great
Hearts
Academies
Project,
Series
2014A,
5.000%,
7/01/44
9/24
at
100.00
5,024,711
410
(c)
Pima
County
Industrial
Development
Authority,
Arizona,
Education
Facility
Revenue
Bonds,
San
Tan
Montessori
School
Project,
Series
2017,
6.750%,
2/01/50
2/28
at
100.00
424,011
3,300
Salt
River
Project
Agricultural
Improvement
and
Power
District,
Arizona,
Electric
System
Revenue
Bonds,
Series
2023A,
5.000%,
1/01/50
1/33
at
100.00
3,572,250
1,575
(c)
Sierra
Vista
Industrial
Development
Authority,
Arizona,
Education
Facility
Revenue
Bonds,
Desert
Heights
Charter
School
Project,
Refunding
Series
2024,
5.875%,
6/01/44
6/32
at
102.00
1,593,924
Yavapai
County
Industrial
Development
Authority, Arizona,
Education
Revenue
Bonds,
Arizona
Agribusiness
and
Equine
Center
Inc
Project,
Refunding
Series
2015A
:
45
(c)
3.900%,
9/01/24
No
Opt.
Call
44,973
1,500
(c)
5.000%,
9/01/34
3/25
at
100.00
1,502,756
TOTAL
ARIZONA
31,632,205
ARKANSAS
-
0.4%
1,400
(c)
Arkansas
Development
Finance
Authority,
Charter
School
Revenue
Bonds,
Academy
of
Math
and
Science
-
Little
Rock
Project
Series
2024A,
7.000%,
7/01/59
7/31
at
103.00
1,359,066
1,800
Arkansas
Development
Finance
Authority,
Revenue
Bonds,
Baptist
Memorial
Health
Care,
Refunding
Series
2020B-1,
5.000%,
9/01/36
9/30
at
100.00
1,853,834
2,015
Arkansas
Tech
University,
Revenue
Bonds,
Refunding
Student
Fee
Series
2022A,
5.000%,
12/01/42
-
BAM
Insured
12/30
at
100.00
2,116,008
1,000
Pulaski
County,
Arkansas,
Hospital
Revenue
Bonds,
Arkansas
Children's
Hospital,
Series
2023,
5.000%,
3/01/41
3/33
at
100.00
1,092,999
TOTAL
ARKANSAS
6,421,907
CALIFORNIA
-
4.8%
Burbank-Glendale-Pasadena
Airport
Authority,
California,
Airport
Revenue
Bonds,
Senior
Series
2024B
:
2,250
5.250%,
7/01/40,
(AMT)
7/34
at
100.00
2,491,523
250
5.250%,
7/01/42,
(AMT)
7/34
at
100.00
274,768
2,500
4.250%,
7/01/43
-
AGM
Insured,
(AMT)
7/34
at
100.00
2,509,993
655
California
Educational
Facilities
Authority,
Revenue
Bonds,
Stanford
University,
Series
2013-U3,
5.000%,
6/01/43
No
Opt.
Call
801,922
205
California
Health
Facilities
Financing
Authority,
Revenue
Bonds,
Children's
Hospital
Los
Angeles,
Series
2017A,
5.000%,
8/15/35
8/27
at
100.00
212,747
3,540
California
Health
Facilities
Financing
Authority,
Revenue
Bonds,
Providence
Saint
Joseph
Health
System,
Series
2009C,
5.000%,
7/01/33
1/33
at
100.00
3,933,512
Municipal
Total
Return
Managed
Accounts
Portfolio
(continued)
Portfolio
of
Investments
July
31,
2024
Principal
Amount
(000)
Description
(a)
Optional
Call
Provisions
(b)
Value
CALIFORNIA
(continued)
$
450
California
Health
Facilities
Financing
Authority,
Revenue
Bonds,
Stanford
Health
Care,
Series
2020A,
4.000%,
8/15/50
8/30
at
100.00
$
443,759
100
(c)
California
Municipal
Finance
Authority
Charter
School
Revenue
Bonds,
River
Charter
Schools
Project,
Series
2018A,
5.500%,
6/01/38
6/26
at
100.00
101,207
1,180
(c)
California
Municipal
Finance
Authority,
Charter
School
Revenue
Bonds,
Palmdale
Aerospace
Academy
Project,
Series
2016A,
5.000%,
7/01/36
7/26
at
100.00
1,197,821
1,500
(c)
California
Municipal
Finance
Authority,
Charter
School
Revenue
Bonds,
Palmdale
Aerospace
Academy
Project,
Series
2018A,
5.000%,
7/01/38
7/28
at
100.00
1,530,919
California
Municipal
Finance
Authority,
Educational
Facilities
Revenue
Bonds,
Westside
Neighborhood
School
Project,
Series
2024
:
600
(c)
5.500%,
6/15/39
6/31
at
102.00
643,459
315
(c)
5.900%,
6/15/44
6/31
at
102.00
339,415
735
California
Municipal
Finance
Authority,
Mobile
Home
Park
Revenue
Bonds,
Caritas
Affordable
Housing
Inc
Projects,
Senior
Series
2014A,
5.000%,
8/15/30
8/24
at
100.00
735,409
California
Municipal
Finance
Authority,
Revenue
Bonds,
Eisenhower
Medical
Center,
Refunding
Series
2017A
:
3,015
5.000%,
7/01/33
7/27
at
100.00
3,096,470
1,750
4.000%,
7/01/42
7/27
at
100.00
1,591,243
6,000
California
Municipal
Finance
Authority,
Revenue
Bonds,
Linxs
APM
Project,
Senior
Lien
Series
2018A,
5.000%,
12/31/38,
(AMT)
6/28
at
100.00
6,166,814
California
Municipal
Finance
Authority,
Special
Tax
Revenue
Bonds,
Community
Facilities
District
2023-11
Improvement
Area
A
Hesperia
Silverwood,
Series
2024
:
325
5.000%,
9/01/44
9/31
at
103.00
340,822
335
5.000%,
9/01/49
9/31
at
103.00
347,339
4,000
(c)
California
Pollution
Control
Financing
Authority,
Water
Furnishing
Revenue
Bonds,
Poseidon
Resources
Channelside
LP
Desalination
Project,
Series
2012,
5.000%,
11/21/45,
(AMT)
1/25
at
100.00
4,009,190
355
California
Public
Finance
Authority,
Revenue
Bonds,
Henry
Mayo
Newhall
Hospital,
Series
2021A,
4.000%,
10/15/24
No
Opt.
Call
354,986
1,000
(c)
California
School
Finance
Authority,
California,
Charter
School
Revenue
Bonds,
Aspire
Public
Schools,
Refunding
Series
2015A,
5.000%,
8/01/35
8/25
at
100.00
1,010,282
California
School
Finance
Authority,
California,
Charter
School
Revenue
Bonds,
Aspire
Public
Schools,
Refunding
Series
2016
:
305
(c)
5.000%,
8/01/24
No
Opt.
Call
305,000
25
(c),(d)
5.000%,
8/01/24,
(ETM)
No
Opt.
Call
25,000
325
(c)
5.000%,
8/01/25
No
Opt.
Call
327,587
35
(c),(d)
5.000%,
8/01/25,
(ETM)
No
Opt.
Call
35,709
725
(c)
5.000%,
8/01/26
8/25
at
100.00
733,236
65
(c),(d)
5.000%,
8/01/26,
(Pre-refunded
8/01/25)
8/25
at
100.00
66,317
225
(c)
5.000%,
8/01/27
8/25
at
100.00
227,673
25
(c),(d)
5.000%,
8/01/27,
(Pre-refunded
8/01/25)
8/25
at
100.00
25,507
1,485
(c)
California
School
Finance
Authority,
Charter
School
Revenue
Bonds,
Classical
Academies
Project,
Series
2017A,
5.000%,
10/01/37
10/27
at
100.00
1,516,783
1,000
(c)
California
School
Finance
Authority,
Charter
School
Revenue
Bonds,
Envision
Education,
Series
2024A,
5.000%,
6/01/44,
(WI/DD)
6/32
at
100.00
1,016,108
700
(c)
California
School
Finance
Authority,
Charter
School
Revenue
Bonds,
Rocketship
Education
Obligated
Group,
Series
2016A,
5.000%,
6/01/31
6/25
at
100.00
705,758
California
School
Finance
Authority,
Charter
School
Revenue
Bonds,
Rocketship
Public
Schools
Obligated
Group,
Series
2017G
:
310
(c)
5.000%,
6/01/30
6/27
at
100.00
318,544
325
(c)
5.000%,
6/01/37
6/27
at
100.00
329,321
Principal
Amount
(000)
Description
(a)
Optional
Call
Provisions
(b)
Value
CALIFORNIA
(continued)
$
1,195
California
State,
General
Obligation
Bonds,
Various
Purpose
Series
2023,
5.250%,
10/01/45
4/33
at
100.00
$
1,361,428
California
Statewide
Communities
Development
Authority,
California,
Revenue
Bonds,
Loma
Linda
University
Medical
Center,
Series
2016A
:
3,900
(c)
5.000%,
12/01/36
6/26
at
100.00
3,974,557
280
(c)
5.000%,
12/01/46
6/26
at
100.00
282,953
165
(c)
California
Statewide
Communities
Development
Authority,
California,
Revenue
Bonds,
Loma
Linda
University
Medical
Center,
Series
2018A,
5.250%,
12/01/38
6/28
at
100.00
172,878
750
California
Statewide
Community
Development
Authority,
Health
Revenue
Bonds,
Enloe
Medical
Center,
Refunding
Series
2022A,
5.125%,
8/15/47
-
AGM
Insured
8/32
at
100.00
811,455
1,250
El
Rancho
Unified
School
District,
Los
Angeles
County,
California,
General
Obligation
Bonds,
Election
2016
Series
2023D,
5.750%,
8/01/48
-
BAM
Insured
8/33
at
100.00
1,474,792
5,000
Glendale
Unified
School
District,
Los
Angeles
County,
California,
General
Obligation
Bonds,
2011
Election
Series
2016C,
3.000%,
9/01/39
9/26
at
100.00
4,505,273
750
Irvine,
California,
Special
Tax
Bonds,
Community
Facilities
District
2004-1
Central
Park,
Series
2015A,
4.000%,
9/01/35
9/25
at
100.00
751,270
50
Long
Beach
Bond
Finance
Authority,
California,
Natural
Gas
Purchase
Revenue
Bonds,
Series
2007A,
5.000%,
11/15/35
No
Opt.
Call
54,556
1,145
Long
Beach,
California,
Airport
Revenue
Bonds,
Senior
Refunding
Series
2022C,
5.250%,
6/01/47
-
AGM
Insured,
(AMT)
6/32
at
100.00
1,231,900
1,000
Los
Angeles
Department
of
Airports,
California,
Revenue
Bonds,
Los
Angeles
International
Airport,
Refunding
&
Subordinate
Green
Series
2023A,
5.250%,
5/15/40,
(AMT)
5/33
at
100.00
1,115,184
2,220
Los
Angeles
Department
of
Airports,
California,
Revenue
Bonds,
Los
Angeles
International
Airport,
Refunding
Subordinate
Series
2022I,
5.000%,
5/15/48
11/31
at
100.00
2,435,158
1,475
Los
Angeles
Department
of
Airports,
California,
Revenue
Bonds,
Los
Angeles
International
Airport,
Senior
Lien
Series
2015D,
5.000%,
5/15/31,
(AMT)
5/25
at
100.00
1,489,520
5,000
Los
Angeles
Department
of
Airports,
California,
Revenue
Bonds,
Los
Angeles
International
Airport,
Senior
Series
2022H,
5.500%,
5/15/38,
(AMT)
11/31
at
100.00
5,642,542
500
Los
Angeles
Department
of
Airports,
California,
Revenue
Bonds,
Los
Angeles
International
Airport,
Subordinate
Lien
Series
2016B,
5.000%,
5/15/34,
(AMT)
5/26
at
100.00
510,759
1,000
North
Lake
Tahoe
Public
Financing
Authority,
California,
Lease
Revenue
Bonds,
Health
&
Human
Services
Center
Series
2022,
5.500%,
12/01/47
12/29
at
103.00
1,115,237
1,200
Rancho
Mirage,
California,
Special
Tax
Bonds,
Community
Facilities
District
5
Section
31,
Improvement
Area
1
Series
2024A,
5.000%,
9/01/44
9/34
at
100.00
1,245,538
1,290
Sacramento,
California,
Special
Tax
Bonds,
Community
Facilities
District
4
North
Natomas,
Refunding
Series
2015F,
5.000%,
9/01/27
9/25
at
100.00
1,307,508
295
San
Clemente,
California,
Special
Tax
Revenue
Bonds,
Community
Facilities
District
2006-1
Marblehead
Coastal,
Series
2015,
5.000%,
9/01/32
9/25
at
100.00
299,276
3,000
San
Francisco
Airport
Commission,
California,
Revenue
Bonds,
San
Francisco
International
Airport,
Refunding
Second
Series
2023C,
5.500%,
5/01/38,
(AMT)
5/33
at
100.00
3,433,115
Municipal
Total
Return
Managed
Accounts
Portfolio
(continued)
Portfolio
of
Investments
July
31,
2024
Principal
Amount
(000)
Description
(a)
Optional
Call
Provisions
(b)
Value
CALIFORNIA
(continued)
$
4,000
San
Francisco
Unified
School
District,
California,
General
Obligation
Bonds,
Proposition
A,
Election
of
2011
&
2006,
Series
2015C&F,
4.000%,
6/15/34
9/24
at
100.00
$
4,000,412
TOTAL
CALIFORNIA
74,981,454
COLORADO
-
5.7%
1,000
Aerotropolis
Regional
Transportation
Authority,
Colorado,
Special
Revenue
Bonds,
Series
2021,
4.250%,
12/01/41
12/26
at
103.00
932,197
1,630
Arista
Metropolitan
District,
Broomfield
County,
Colorado,
General
Obligation
Limited
Tax
Bonds,
Refunding
Convertible
to
Unlimited
Tax
Series
2023A,
5.000%,
12/01/48
-
BAM
Insured
12/33
at
100.00
1,708,919
500
Bromley
Park
Metropolitan
District
No.
2,
In
the
City
of
Brighton,
Adams
and
Weld
Counties,
Colorado,
Senior
General
Obligation
Limited
Tax
Refunding
Bonds,
Series
2023,
5.500%,
12/01/43
-
BAM
Insured
12/33
at
100.00
559,983
5,785
Centennial
Water
and
Sanitation
District,
Douglas
County,
Colorado,
Water
and
Wastewater
Revenue
Bonds,
Series
2024,
5.250%,
12/01/53
12/33
at
100.00
6,421,304
520
Chambers
Highpoint
Metropolitan
District
No.
2,
Colorado,
Limited
Tax
General
Obligation
and
Special
Revenue
Bonds,
Series
2021,
5.000%,
12/01/41
9/26
at
103.00
481,744
1,330
Colorado
Department
of
Transportation,
Headquarters
Facilities
Lease
Purchase
Agreement
Certificates
of
Participation,
Series
2016,
5.000%,
6/15/35
6/26
at
100.00
1,362,611
500
(c)
Colorado
Educational
and
Cultural
Facilities
Authority,
Charter
School
Revenue
Bonds,
Aspen
Ridge
School
Project,
Series
2015A,
5.000%,
7/01/36
7/25
at
100.00
502,246
Colorado
Educational
and
Cultural
Facilities
Authority,
Charter
School
Revenue
Bonds,
Littleton
Preparatory
Charter
School,
Series
2013
:
415
5.000%,
12/01/33
9/24
at
100.00
415,207
845
5.000%,
12/01/42
9/24
at
100.00
845,129
1,555
Colorado
Health
Facilities
Authority,
Colorado,
Revenue
Bonds,
Adventist
Health
System/Sunbelt
Obligated
Group,
Series
2016A,
5.000%,
11/15/41
5/26
at
100.00
1,584,671
Colorado
Health
Facilities
Authority,
Colorado,
Revenue
Bonds,
CommonSpirit
Health,
Series
2022A
:
1,155
5.250%,
11/01/36
11/32
at
100.00
1,306,298
5,300
5.250%,
11/01/52
11/32
at
100.00
5,699,111
1,930
Colorado
Springs,
Colorado,
Utilities
System
Revenue
Bonds,
Improvement
Series
2014A-2,
4.000%,
11/15/34
11/24
at
100.00
1,931,013
4,000
Colorado
Springs,
Colorado,
Utilities
System
Revenue
Bonds,
Improvement
Series
2023A,
5.250%,
11/15/48
11/33
at
100.00
4,479,340
2,905
Dawson
Trails
Metropolitan
District
1,
Colorado,
In
The
Town
of
Castle
Rock,
Limited
Tax
General
Obligation
Capital
Appreciation
Turbo
Bonds,
Series
2024,
0.000%,
12/01/31
6/26
at
66.03
1,610,449
1,665
Denver
City
and
County,
Colorado,
Airport
System
Revenue
Bonds,
Series
2022A,
5.500%,
11/15/35,
(AMT)
11/32
at
100.00
1,905,405
Denver
City
and
County,
Colorado,
Airport
System
Revenue
Bonds,
Series
2022D
:
1,725
5.750%,
11/15/34,
(AMT)
11/32
at
100.00
2,029,046
805
5.750%,
11/15/35,
(AMT)
11/32
at
100.00
943,203
3,500
5.750%,
11/15/40,
(AMT)
11/32
at
100.00
4,015,506
2,500
5.750%,
11/15/41,
(AMT)
11/32
at
100.00
2,856,589
700
Denver
City
and
County,
Colorado,
Airport
System
Revenue
Bonds,
Subordinate
Lien
Series
2023B,
5.500%,
11/15/40,
(AMT)
11/33
at
100.00
794,595
Denver
Convention
Center
Hotel
Authority,
Colorado,
Revenue
Bonds,
Convention
Center
Hotel,
Refunding
Senior
Lien
Series
2016
:
Principal
Amount
(000)
Description
(a)
Optional
Call
Provisions
(b)
Value
COLORADO
(continued)
$
1,100
5.000%,
12/01/25
No
Opt.
Call
$
1,115,041
500
5.000%,
12/01/36
12/26
at
100.00
508,927
5,000
Eagle,
Garfield
and
Routt
Counties
School
District
RE50J,
Colorado,
General
Obligation
Bonds,
Series
2024,
5.000%,
12/01/42
12/33
at
100.00
5,597,696
3,000
(c)
Falcon
Area
Water
and
Wastewater
Authority
(El
Paso
County,
Colorado),
Tap
Fee
Revenue
Bonds,
Series
2022A,
6.750%,
12/01/34
9/27
at
103.00
2,968,418
300
Fiddler's
Business
Improvement
District,
Colorado,
Limited
Tax
General
Obligation
Bonds,
Greenwood
Village
Project,
Series
2022,
5.550%,
12/01/47
12/27
at
103.00
309,356
500
Grandview
Reserve
Metropolitan
District,
El
Paso
County,
Colorado,
Limited
Tax
General
Obligation
Senior
Bonds,
Series
2022A
and
Limited
Tax
General
Obligation
Subordinate
Bonds,
Series
2022B(3),
6.250%,
12/01/52
9/27
at
103.00
495,168
500
(c)
Hogback
Metropolitan
District,
Jefferson
County,
Colorado,
Limited
Tax
General
Obligation
Bonds,
Convertible
to
Unlimited
Tax
Series
2021A,
5.000%,
12/01/51
12/26
at
103.00
447,160
2,000
Lakes
at
Centerra
Metropolitan
District
2,
Loveland,
Colorado,
Limited
Tax
General
Obligation
Bonds,
Refunding
Series
2024A,
5.000%,
12/01/49
-
AGM
Insured
12/29
at
103.00
2,139,591
2,550
(c)
Ledge
Rock
Center
Commercial
Metropolitan
District
(In
the
Town
of
Johnstown,
Weld
County,
Colorado),
Limited
Tax
General
Obligation
Bonds,
Series
2022,
7.125%,
11/01/42
11/29
at
103.00
2,600,664
500
Meridian
Ranch
Metropolitan
District
2018,
Subdistrict,
El
Paso
County,
Colorado,
General
Obligation
Limited
Tax
Bonds,
Series
2022,
6.250%,
12/01/37
12/27
at
103.00
511,597
1,300
Northern
Colorado
Water
Conservancy
District,
Certificates
of
Participation,
Series
2022,
5.250%,
7/01/52
7/31
at
100.00
1,405,083
1,330
Peak
Metropolitan
District
3,
Colorado
Springs,
El
Paso
County,
Colorado,
Limited
Tax
General
Obligation
Bonds,
Series
2022A-1,
7.500%,
12/01/52
12/27
at
103.00
1,354,341
1,035
(c)
Plaza
Metropolitan
District
1,
Lakewood,
Colorado,
Tax
Increment
Revenue
Bonds,
Refunding
Series
2013,
5.000%,
12/01/40
9/24
at
100.00
1,034,967
5,130
Rampart
Range
Metropolitan
District
1,
Lone
Tree,
Colorado,
Limited
Tax
Supported
and
Special
Revenue
Bonds,
Refunding
&
Improvement
Series
2017,
5.000%,
12/01/42
12/27
at
100.00
5,281,102
Ravenna
Metropolitan
District,
Douglas
County,
Colorado,
General
Obligation
Bonds,
Refunding
Limited
Tax
Series
2023
:
1,400
5.000%,
12/01/38
-
AGM
Insured
12/33
at
100.00
1,519,963
690
5.000%,
12/01/43
-
AGM
Insured
12/33
at
100.00
729,494
1,345
Silverstone
Metropolitan
District
3,
Weld
County,
Colorado,
General
Obligation
and
Special
Revenue
Bonds,
Limited
Tax
Series
2023,
7.750%,
12/01/45
12/28
at
103.00
1,383,643
State
of
Colorado,
Rural
Colorado,
Certificates
of
Participation,
Series
2022
:
2,060
6.000%,
12/15/39
12/32
at
100.00
2,475,783
7,870
6.000%,
12/15/40
12/32
at
100.00
9,399,081
900
Thompson
Crossing
Metropolitan
District
4,
Johnstown,
Larimer
County,
Colorado,
General
Obligation
Bonds,
Limited
Tax
Convertible
to
Unlimited
Tax,
Refunding
&
Improvement
Series
2019,
5.000%,
12/01/39
9/24
at
103.00
900,201
1,000
Verve
Metropolitan
District
1,
Jefferson
County
and
the
City
and
County
of
Broomfield,
Colorado,
General
Obligation
Bonds,
Refunding
and
Improvement
Limited
Tax
Series
2021,
5.000%,
12/01/41
3/26
at
103.00
838,737
Municipal
Total
Return
Managed
Accounts
Portfolio
(continued)
Portfolio
of
Investments
July
31,
2024
Principal
Amount
(000)
Description
(a)
Optional
Call
Provisions
(b)
Value
COLORADO
(continued)
$
1,250
Village
Metropolitan
District
In
the
Town
of
Avon,
Eagle
County,
Colorado,
Special
Revenue
and
Limited
Property
Tax
Bonds,
Refunding
&
Improvement
Series
2020,
5.000%,
12/01/40
12/25
at
103.00
$
1,259,298
1,000
West
Globeville
Metropolitan
District
1,
Denver,
Colorado,
General
Obligation
Limited
Tax
Bonds,
Series
2022,
6.750%,
12/01/52
12/29
at
103.00
982,178
700
Westerly
Metropolitan
District
4,
Weld
County,
Colorado,
General
Obligation
Limited
Tax
Bonds,
Series
2021A-1,
5.000%,
12/01/40
3/26
at
103.00
642,997
750
Wildwing
Metropolitan
District
5,
Larimer
County,
Colorado,
Limited
Tax
General
Obligation
Bonds,
Refunding
and
Improvement
Series
2024,
4.500%,
12/01/53
-
AGM
Insured
12/33
at
100.00
760,257
TOTAL
COLORADO
89,045,309
CONNECTICUT
-
0.8%
5,000
Connecticut
Health
and
Educational
Facilities
Authority,
Revenue
Bonds,
Hartford
HealthCare
Issue,
Series
2021A,
4.000%,
7/01/51
7/31
at
100.00
4,651,878
Harbor
Point
Infrastructure
Improvement
District,
Connecticut,
Special
Obligation
Revenue
Bonds,
Harbor
Point
Project,
Refunding
Series
2017
:
1,115
(c)
5.000%,
4/01/30
4/27
at
100.00
1,127,138
6,465
(c)
5.000%,
4/01/39
4/27
at
100.00
6,510,348
775
University
of
Connecticut,
General
Obligation
Bonds,
Series
2023A,
5.000%,
8/15/41
8/33
at
100.00
872,557
TOTAL
CONNECTICUT
13,161,921
DELAWARE
-
0.2%
375
(c)
Bridgeville,
Delaware,
Special
Obligation
Bonds,
Heritage
Shores
Special
Development
District,
Series
2024,
5.250%,
7/01/44
7/33
at
100.00
393,584
715
Delaware
State
Housing
Authority,
Senior
Single
Family
Mortgage
Revenue
Bonds,
Series
2024A,
4.625%,
7/01/49
1/33
at
100.00
717,708
Kent
County,
Delaware,
Student
Housing
&
Dining
Facility
Revenue
Bonds,
Collegiate
Housing
Foundation
-
Dover
LLC
Delaware
State
University
Project,
Series
2018A
:
1,030
5.000%,
7/01/30
1/28
at
100.00
1,057,257
750
5.000%,
7/01/31
1/28
at
100.00
769,126
TOTAL
DELAWARE
2,937,675
DISTRICT
OF
COLUMBIA
-
0.9%
2,000
District
of
Columbia,
Washington,
D.C.,
Revenue
Bonds,
KIPP
DC
Issue,
Refunding
Series
2017B,
5.000%,
7/01/37
1/28
at
100.00
2,065,542
1,240
District
of
Columbia,
Washington,
D.C.,
Revenue
Bonds,
KIPP
DC
Issue,
Series
2019,
4.000%,
7/01/44
7/29
at
100.00
1,171,998
1,540
Metropolitan
Washington
Airports
Authority,
District
of
Columbia,
Dulles
Toll
Road
Revenue
Bonds,
Dulles
Metrorail
&
Capital
improvement
Projects,
Refunding
&
Subordinate
Lien
Series
2019B,
5.000%,
10/01/47
10/29
at
100.00
1,592,535
3,500
Metropolitan
Washington
D.C.
Airports
Authority,
Airport
System
Revenue
Bonds,
Refunding
Series
2014A,
5.000%,
10/01/28,
(AMT)
10/24
at
100.00
3,511,199
5,000
Metropolitan
Washington
D.C.
Airports
Authority,
Airport
System
Revenue
Bonds,
Refunding
Series
2015A,
5.000%,
10/01/34,
(AMT)
10/24
at
100.00
5,015,999
TOTAL
DISTRICT
OF
COLUMBIA
13,357,273
FLORIDA
-
12.5%
Babcock
Ranch
Community
Independent
Special
District,
Charlotte
County,
Florida,
Special
Assessment
Bonds,
2022
Project
Series
2022
:
530
4.250%,
5/01/32
No
Opt.
Call
531,396
1,000
5.000%,
5/01/42
5/32
at
100.00
1,011,760
Principal
Amount
(000)
Description
(a)
Optional
Call
Provisions
(b)
Value
FLORIDA
(continued)
$
1,495
Bay
County
School
Board,
Florida,
Certificates
of
Participation,
Series
2022A,
5.500%,
7/01/42
7/32
at
100.00
$
1,667,070
715
Bay
County,
Florida,
Educational
Facilities
Revenue
Refunding
Bonds,
Bay
Haven
Charter
Academy,
Inc.
Project,
Series
2013A,
5.000%,
9/01/33
9/24
at
100.00
715,569
2,000
Brevard
County
Health
Facilities
Authority,
Florida,
Hospital
Revenue
Bonds,
Health
First
Obligated
Group,
Series
2022A,
5.000%,
4/01/52
4/32
at
100.00
2,099,897
4,100
Broward
County
School
District,
Florida,
General
Obligation
Bonds,
School
Series
2022,
5.000%,
7/01/47
7/32
at
100.00
4,444,585
1,000
Broward
County,
Florida,
Port
Facilities
Revenue
Bonds,
Series
2022,
5.250%,
9/01/47,
(AMT)
9/32
at
100.00
1,073,458
4,000
(c)
Cabot
Citrus
Farms
Community
Development
District,
Florida,
Special
Revenue
Bond,
Anticipated
Note
Series
2024,
5.250%,
3/01/29
5/25
at
103.00
4,039,382
1,000
Cape
Coral,
Florida,
Water
and
Sewer
Revenue
Bonds,
Series
2023,
5.250%,
10/01/48
-
BAM
Insured
10/33
at
100.00
1,118,928
2,095
(c)
Capital
Trust
Agency,
Florida,
Revenue
Bonds,
Odyssey
Charter
School
Project,
Series
2019,
5.000%,
7/01/54
7/26
at
103.00
2,056,627
110
(c)
Charlotte
County
Industrial
Development
Authority,
Florida,
Utility
System
Revenue
Bonds,
Town
&
Country
Utilities
Project,
Series
2021A,
4.000%,
10/01/51,
(AMT)
10/31
at
100.00
92,511
Collier
County
Educational
Facilities
Authority,
Florida,
Revenue
Bonds,
Ave
Maria
University,
Refunding
Series
2023
:
2,235
5.500%,
6/01/30
No
Opt.
Call
2,338,200
2,490
5.500%,
6/01/32
No
Opt.
Call
2,626,175
435
5.000%,
6/01/43
6/33
at
100.00
422,064
Corkscrew
Crossing
Community
Development
District,
Florida,
Special
Assessment
Bonds,
Series
2023
:
500
4.300%,
5/01/33
No
Opt.
Call
506,180
1,000
5.100%,
5/01/43
5/33
at
100.00
1,009,763
1,190
Daytona
Beach
Florida
Housing
Authority,Multi-family
Housing
Revenue
Bonds,
WM
At
The
River
LP,
Series
2021
B,
1.250%,
12/01/25
12/24
at
100.00
1,178,099
2,375
Escambia
County
Health
Facilities
Authority,
Florida,
Health
Care
Facilities
Revenue
Bonds,
Baptist
Health
Care
Corporation
Obligated
Group,
Series
2020A,
5.000%,
8/15/32
2/30
at
100.00
2,482,281
2,950
Escambia
County
Health
Facilities
Authority,
Florida,
Health
Care
Facilities
Revenue
Bonds,
Baptist
Health
Care
Corporation
Obligated,
Series
2020A,
5.000%,
8/15/33
2/30
at
100.00
3,074,566
925
(c)
Florida
Development
Finance
Corporation,
Educational
Facilities
Revenue
Bonds,
Cornerstone
Charter
Schools
Project,
Series
2022,
5.000%,
10/01/32
10/29
at
100.00
955,092
1,230
(c)
Florida
Development
Finance
Corporation,
Educational
Facilities
Revenue
Bonds,
Cornerstone
Classical
Academy
Series
2024A,
5.250%,
6/01/44
6/32
at
100.00
1,248,049
Florida
Development
Finance
Corporation,
Educational
Facilities
Revenue
Bonds,
Downtown
Doral
Charter
Upper
School
Project,
Series
2017C
:
175
(c)
5.150%,
7/01/27
No
Opt.
Call
177,688
385
(c)
5.750%,
7/01/47
7/27
at
101.00
390,222
170
(c)
Florida
Development
Finance
Corporation,
Educational
Facilities
Revenue
Bonds,
Renaissance
Charter
School
Income
Projects,
Series
2015A,
6.000%,
6/15/35
6/25
at
100.00
171,972
700
(c)
Florida
Development
Finance
Corporation,
Educational
Facilities
Revenue
Refunding
Bonds,
Central
Charter
School,
Series
2022,
5.250%,
8/15/37
8/32
at
100.00
698,674
Florida
Development
Finance
Corporation,
Revenue
Bonds,
Brightline
Florida
Passenger
Rail
Expansion
Project,
Brightline
Trains
Florida
LLC
Issue,
Series
2024
:
Municipal
Total
Return
Managed
Accounts
Portfolio
(continued)
Portfolio
of
Investments
July
31,
2024
Principal
Amount
(000)
Description
(a)
Optional
Call
Provisions
(b)
Value
FLORIDA
(continued)
$
5,500
5.000%,
7/01/44
-
AGM
Insured,
(AMT)
7/32
at
100.00
$
5,757,107
3,600
5.250%,
7/01/47
-
AGM
Insured,
(AMT)
7/32
at
100.00
3,798,560
500
(c)
Florida
Development
Finance
Corporation,
Student
Housing
Revenue
Bonds,
SPP
-
Tampa
I
-
LLC
The
Henry
Project,
Series
2024A-1,
5.000%,
6/01/44
6/34
at
100.00
511,276
1,000
Florida
Gulf
Coast
University
Financing
Corporation,
Capital
Improvement
Revenue
Bonds,
Refunding
Housing
Project,
Series
2022A,
5.000%,
2/01/40
8/32
at
100.00
1,082,396
12,000
Florida
Mid-Bay
Bridge
Authority,
Revenue
Bonds,
1st
Senior
Lien
Series
2015A,
5.000%,
10/01/35
10/25
at
100.00
12,164,741
2,285
Florida
State
Turnpike
Authority,
Turnpike
Revenue
Bonds,
Department
of
Transportation,
Series
2018A,
4.000%,
7/01/41
7/28
at
100.00
2,307,525
760
(c)
Fort
Lauderdale,
Florida,
Special
Assessment
Bonds,
Las
Olas
Isles
Undergrounding
Project,
Series
2022,
4.000%,
7/01/42
7/32
at
100.00
679,686
8,000
Greater
Orlando
Aviation
Authority,
Florida,
Orlando
Airport
Facilities
Revenue
Bonds,
Series
2015A,
5.000%,
10/01/40,
(AMT)
10/25
at
100.00
8,074,219
500
Hammock
Oaks
Community
Development
District,
Lady
Lake,
Florida,
Special
Assessment
Revenue
Bonds,
Area
2,
Series
2024,
6.150%,
5/01/54
5/34
at
100.00
511,067
4,000
Hernando
County,
Florida,
Non-Ad
Valorem
Revenue
Bonds,
Series
2022,
5.250%,
6/01/47
6/32
at
100.00
4,336,674
1,905
Hialeah
Utility
Systems,
Florida,
Systems
Revenue
Bonds,
Refunding
Series
2022,
5.000%,
10/01/33
10/32
at
100.00
2,086,692
Hillsborough
County
Aviation
Authority,
Florida,
Revenue
Bonds,
Tampa
International
Airport,
Senior
Lien
Series
2015A
:
7,415
5.000%,
10/01/34,
(AMT)
10/24
at
100.00
7,436,222
4,000
5.000%,
10/01/40,
(AMT)
10/24
at
100.00
4,011,448
3,250
(d)
5.000%,
10/01/40,
(Pre-refunded
10/01/24),
(AMT)
10/24
at
100.00
3,257,106
300
Hobe-Saint
Lucie
Conservancy
District,
Florida,
Special
Assessment
Revenue
Bonds,
Improvement
Unit
1A,
Series
2024,
5.600%,
5/01/44
5/34
at
100.00
310,616
2,860
Hollywood
Beach
Community
Development
District
1,
Florida,
Revenue
Bonds,
Public
Parking
Facilitiy
Project,
Refunding
Series
2020,
5.000%,
10/01/35
10/30
at
100.00
3,040,250
1,110
(c)
Jacksonville,
Florida,
Educational
Facilities
Revenue
Bonds,
Jacksonville
University
Project,
Series
2018B,
5.000%,
6/01/53
6/28
at
100.00
1,060,993
1,875
Julington
Creek
Plantation
Community
Development
District,
Florida,
Special
Assessment
Revenue
Bonds,
Series
2023,
5.500%,
5/01/43
-
AGM
Insured
5/33
at
100.00
2,076,432
400
Lake
Worth
Beach,
Florida,
Consolidated
Utility
Revenue
Bonds,
Series
2022,
5.000%,
10/01/36
-
BAM
Insured
10/32
at
100.00
451,681
1,665
Lakeland,
Florida,
Energy
System
Revenue
Bonds,
Refunding
Series
2023,
5.000%,
10/01/42
10/33
at
100.00
1,834,907
10,000
Lakeland,
Florida,
Energy
System
Revenue
Bonds,
Series
2021,
5.000%,
10/01/48
No
Opt.
Call
11,154,311
885
Lauderhill,
Florida,
Water
and
Sewer
Revenue
Bonds,
Series
2023,
5.000%,
10/01/48
-
AGM
Insured
10/33
at
100.00
954,627
740
Lee
County
Industrial
Development
Authority,
Florida,
Charter
School
Revenue
Bonds,
Lee
County
Community
Charter
Schools,
Series
2007A,
5.250%,
6/15/27
9/24
at
100.00
740,319
Lee
County
Industrial
Development
Authority,
Florida,
Charter
School
Revenue
Bonds,
Lee
County
Community
Charter
Schools,
Series
2024A
:
1,000
(c)
6.000%,
6/15/38
6/31
at
103.00
1,032,621
1,000
(c)
6.250%,
6/15/42
6/31
at
103.00
1,032,236
Principal
Amount
(000)
Description
(a)
Optional
Call
Provisions
(b)
Value
FLORIDA
(continued)
$
605
Lee
County,
Florida,
Solid
Waste
System
Revenue
Bonds,
Refunding
Series
2016,
5.000%,
10/01/26,
(AMT)
No
Opt.
Call
$
616,115
2,895
Manatee
County,
Florida,
Public
Utilities
Revenue
Bonds,
Improvement
and
Refunding
Series
2023,
4.000%,
10/01/48
4/33
at
100.00
2,836,047
Miami
Beach
Health
Facilities
Authority,
Florida,
Hospital
Revenue
Bonds,
Mount
Sinai
Medical
Center
of
Florida
Project,
Refunding
2014
:
9,250
5.000%,
11/15/39
11/24
at
100.00
9,265,707
6,550
5.000%,
11/15/44
11/24
at
100.00
6,560,786
Miami
Dade
County,
Florida,
Rickenbacker
Causeway
Revenue
Bonds,
Series
2014
:
900
5.000%,
10/01/27
10/24
at
100.00
901,822
920
5.000%,
10/01/28
10/24
at
100.00
921,882
500
5.000%,
10/01/30
10/24
at
100.00
500,992
325
Miami-Dade
County
Expressway
Authority,
Florida,
Toll
System
Revenue
Bonds,
Series
2010A,
5.000%,
7/01/40
9/24
at
100.00
325,220
Miami-Dade
County,
Florida,
Aviation
Revenue
Bonds,
Refunding
Series
2014A
:
1,145
5.000%,
10/01/28,
(AMT)
10/24
at
100.00
1,146,551
10,000
5.000%,
10/01/33,
(AMT)
10/24
at
100.00
10,013,105
4,000
Miami-Dade
County,
Florida,
Aviation
Revenue
Bonds,
Refunding
Series
2018A,
5.000%,
10/01/38,
(AMT)
10/28
at
100.00
4,131,036
Monroe
County,
Florida,
Airport
Revenue
Bonds,
Key
West
International
Airport,
Series
2022
:
1,430
5.000%,
10/01/39,
(AMT)
10/32
at
100.00
1,509,453
1,575
5.000%,
10/01/41,
(AMT)
10/32
at
100.00
1,646,573
745
Osceola
County,
Florida,
Transportation
Revenue
Bonds,
Osceola
Parkway,
Refunding
&
Improvement
Series
2019A-1,
5.000%,
10/01/29
No
Opt.
Call
791,981
Palm
Beach
County
Health
Facilities
Authority,
Florida,
Hospital
Revenue
Bonds,
Jupiter
Medical
Center,
Series
2022
:
620
5.000%,
11/01/34
11/32
at
100.00
657,349
750
5.000%,
11/01/36
11/32
at
100.00
790,611
1,520
5.000%,
11/01/47
11/32
at
100.00
1,547,007
2,175
5.000%,
11/01/52
11/32
at
100.00
2,201,820
250
(c)
Parrish
Lakes
Community
Development
District,
Manatee
County,
Florida,
Capital
Improvement
Revenue
Bonds,
Assessment
Area
3,
Series
2024,
5.800%,
5/01/54
11/34
at
100.00
250,979
1,000
Pasco
County,
Florida,
Cigarette
Tax
Allocation
Bonds,
H.
Lee
Moffitt
Cancer
Center
and
Research
Institute
Capital
Improvement
Series
2023A,
5.500%,
9/01/41
-
AGM
Insured
3/33
at
100.00
1,126,650
1,000
Poitras
East
Community
Development
District,
Osceola
County,
Florida,
Special
Assessment
Revenue
Bonds,
Series
2023,
4.200%,
5/01/33
No
Opt.
Call
1,011,217
Pompano
Beach,
Florida,
Revenue
Bonds,
John
Knox
Village
Project,
Series
2015
:
225
5.000%,
9/01/24
No
Opt.
Call
225,129
410
5.000%,
9/01/35
9/24
at
100.00
410,312
5,000
Sarasota
County
Public
Hospital
District,
Florida,
Hospital
Revenue
Bonds,
Sarasota
Memorial
Hospital
Project,
Series
2018,
5.000%,
7/01/38
7/28
at
100.00
5,227,834
2,120
Sarasota
County,
Florida,
Utility
System
Revenue
Bonds,
Series
2022,
5.250%,
10/01/52
10/32
at
100.00
2,335,610
4,440
Sarasota
County,
Florida,
Utility
System
Revenue
Bonds,
Series
2023,
5.000%,
10/01/48
4/33
at
100.00
4,825,919
St.
Johns
County
School
Board,
Florida,
Certificates
of
Participation,
Series
2024A
:
Municipal
Total
Return
Managed
Accounts
Portfolio
(continued)
Portfolio
of
Investments
July
31,
2024
Principal
Amount
(000)
Description
(a)
Optional
Call
Provisions
(b)
Value
FLORIDA
(continued)
$
2,200
5.250%,
7/01/46
-
AGM
Insured
7/33
at
100.00
$
2,446,074
3,000
5.500%,
7/01/49
-
AGM
Insured
7/33
at
100.00
3,377,683
1,350
Sumter
County
School
Board,
Florida,
Certificates
of
Participation,
Series
2024,
5.250%,
1/01/49
-
AGM
Insured
7/33
at
100.00
1,485,664
1,425
Tampa
Bay,
Florida,
Regional
Water
Supply
Authority,
Utility
System
Revenue
Bonds,
Sustainability
Series
2022,
5.250%,
10/01/47
10/32
at
100.00
1,568,381
4,090
Tampa,
Florida,
Water
and
Wastewater
Systems
Revenue
Bonds,
Green
Series
2022A,
5.250%,
10/01/57
10/32
at
100.00
4,485,832
15
Tolomato
Community
Development
District,
Florida,
Special
Assessment
Bonds,
Refunding
Series
2015-2,
6.610%,
5/01/40
9/24
at
100.00
14,778
15
(e)
Tolomato
Community
Development
District,
Florida,
Special
Assessment
Bonds,
Refunding
Series
2015-3,
6.610%,
5/01/40
9/24
at
100.00
0
Village
Community
Development
District
10,
Sumter
County,
Florida,
Special
Assessment
Revenue
Bonds,
Refunding
Series
2023
:
1,110
5.000%,
5/01/39
-
AGM
Insured
5/33
at
100.00
1,217,068
985
5.000%,
5/01/40
-
AGM
Insured
5/33
at
100.00
1,073,617
2,930
(c)
Village
Community
Development
District
14,
Leesburg,
Florida,
Special
Assessment
Bonds,
Series
2022,
4.750%,
5/01/32
5/30
at
100.00
3,048,934
TOTAL
FLORIDA
196,329,658
GEORGIA
-
1.1%
3,000
Atlanta,
Georgia,
Airport
General
Revenue
Bonds,
Series
2022B,
5.000%,
7/01/38,
(AMT)
7/32
at
100.00
3,248,920
1,000
Columbia
County
Hospital
Authority,
Georgia,
Revenue
Anticipation
Certificates,
WellStar
Health
System,
Inc.
Project,
Series
2023B,
5.750%,
4/01/53
4/33
at
100.00
1,127,856
8,425
Coweta
County
Development
Authority,
Georgia,
Revenue
Bonds,
Piedmont
Healthcare,
Inc.
Project,
Series
2019A,
5.000%,
7/01/44
7/29
at
100.00
8,784,400
950
Henry
County
Hospital
Authority,
Georgia,
Revenue
Certificates,
Piedmont
Henry
Hospital
Project,
Series
2014A,
5.000%,
7/01/34
9/24
at
100.00
952,984
2,500
(c)
Marietta
Development
Authority,
Georgia,
University
Facilities
Revenue
Bonds,
Life
University,
Inc.
Project,
Refunding
Series
2017A,
5.000%,
11/01/27
No
Opt.
Call
2,524,964
TOTAL
GEORGIA
16,639,124
GUAM
-
0.1%
1,000
Government
of
Guam,
Business
Privilege
Tax
Bonds,
Refunding
Series
2015D,
5.000%,
11/15/33
11/25
at
100.00
1,011,755
TOTAL
GUAM
1,011,755
HAWAII
-
0.1%
750
(c)
Hawaii
Department
of
Budget
and
Finance,
Special
Purpose
Revenue
Bonds,
Hawaii
Pacific
University
Project,
Refunding
Series
2024,
5.000%,
7/01/34
No
Opt.
Call
770,734
Kauai
County,
Hawaii,
Special
Tax
Bonds,
Community
Facilities
District
2008-1
Kukuiula
Development
Project,
Series
2022
:
440
4.000%,
5/15/29
No
Opt.
Call
433,176
470
4.000%,
5/15/30
No
Opt.
Call
460,081
375
5.000%,
5/15/31
No
Opt.
Call
391,431
250
5.000%,
5/15/32
No
Opt.
Call
261,748
TOTAL
HAWAII
2,317,170
Principal
Amount
(000)
Description
(a)
Optional
Call
Provisions
(b)
Value
IDAHO
-
1.2%
Boise-Kuna
Irrigation
District,
Ada
and
Canyon
Counties,
Idaho,
Arrowrock
Hydroelectric
Project
Revenue
Bonds,
Refunding
Series
2015
:
$
500
5.000%,
6/01/29
12/24
at
100.00
$
502,625
1,000
5.000%,
6/01/30
12/24
at
100.00
1,005,217
2,090
5.000%,
6/01/31
12/24
at
100.00
2,100,553
610
Idaho
Health
Facilities
Authority,
Revenue
Bonds,
Madison
Memorial
Hospital
Project,
Refunding
Series
2016,
5.000%,
9/01/29
9/26
at
100.00
615,974
Idaho
Health
Facilities
Authority,
Revenue
Bonds,
Saint
Luke's
Health
System
Project,
Series
2018A
:
1,250
5.000%,
3/01/37
9/28
at
100.00
1,296,534
4,000
4.000%,
3/01/38
9/28
at
100.00
3,969,569
6,105
Idaho
Housing
&
Finance
Association,
Idaho,
Sales
Tax
Revenue
Bonds,
Transportation
Expansion
&
Congestion
Mitigation
Fund,
Series
2023A,
5.250%,
8/15/48
8/33
at
100.00
6,785,565
1,170
(c)
Idaho
Housing
and
Finance
Association,
Nonprofit
Facilities
Revenue
Bonds,
Future
Public
School
Project,
Series
2022A,
4.000%,
5/01/32
5/29
at
103.00
1,118,713
750
Spring
Valley
Community
Infrastructure
District
1,
Eagle,
Idaho,
Special
Assessment
Bonds,
Series
2024,
6.250%,
9/01/53
3/29
at
103.00
789,769
TOTAL
IDAHO
18,184,519
ILLINOIS
-
7.8%
3,000
Chicago
Transit
Authority,
Illinois,
Sales
Tax
Receipts
Revenue
Bonds,
Series
2014,
5.000%,
12/01/44
-
AGM
Insured
12/24
at
100.00
3,008,154
569
Chicago,
Illinois,
Certificates
of
Participation,
Tax
Increment
Allocation
Revenue
Bonds,
Pullman
Park/Chicago
Redevelopement
Project,
Series
2013A,
7.125%,
3/15/33
8/24
at
100.00
569,073
Chicago,
Illinois,
General
Obligation
Bonds,
Chicago
Works
Series
2023A
:
3,850
5.000%,
1/01/35
1/32
at
100.00
4,147,216
1,685
5.500%,
1/01/39
1/32
at
100.00
1,848,558
3,000
Chicago,
Illinois,
General
Obligation
Bonds,
Project
and
Refunding
Series
2005D,
5.500%,
1/01/40
1/25
at
100.00
3,008,191
Chicago,
Illinois,
Midway
Airport
Revenue
Bonds,
Refunding
Senior
Lien
Series
2023C
:
5,000
5.000%,
1/01/33
No
Opt.
Call
5,419,788
385
5.000%,
1/01/40
1/34
at
100.00
409,603
1,500
5.000%,
1/01/41
1/34
at
100.00
1,588,596
4,320
Chicago,
Illinois,
Water
Revenue
Bonds,
Refunding
Second
Lien
Series
2012,
4.000%,
11/01/37
9/24
at
100.00
4,320,072
4,650
DuPage
County
School
District
58
Downers
Grove,
Illinois,
General
Obligation
Bonds, School
Series
2022,
5.250%,
12/15/40
12/32
at
100.00
5,261,554
2,000
Illinois
Finance
Authority,
Revenue
Bonds,
Advocate
Health
Care
Network,
Refunding
Series
2014,
4.000%,
8/01/38
8/24
at
100.00
1,955,056
525
Illinois
Finance
Authority,
Revenue
Bonds,
Bradley
University,
Refunding
Series
2021A,
4.000%,
8/01/39
8/31
at
100.00
504,418
Illinois
Finance
Authority,
Revenue
Bonds,
DePaul
College
Prep
Foundation,
Series
2023A
:
1,220
(c)
4.300%,
8/01/28
No
Opt.
Call
1,234,981
1,275
(c)
4.500%,
8/01/33
No
Opt.
Call
1,329,970
1,000
(c)
5.250%,
8/01/38
8/33
at
100.00
1,085,826
3,000
(d)
Illinois
Finance
Authority,
Revenue
Bonds,
Edward-Elmhurst
Healthcare,
Series
2017A,
5.000%,
1/01/36,
(Pre-refunded
1/01/27)
1/27
at
100.00
3,141,712
Illinois
Finance
Authority,
Revenue
Bonds,
Northshore
University
HealthSystem,
Series
2020A
:
Municipal
Total
Return
Managed
Accounts
Portfolio
(continued)
Portfolio
of
Investments
July
31,
2024
Principal
Amount
(000)
Description
(a)
Optional
Call
Provisions
(b)
Value
ILLINOIS
(continued)
$
1,750
4.000%,
8/15/40
8/30
at
100.00
$
1,724,320
2,000
4.000%,
8/15/41
8/30
at
100.00
1,955,032
9,885
Illinois
Finance
Authority,
Revenue
Bonds,
Northwestern
Memorial
Healthcare,
Series
2017A,
4.000%,
7/15/47
1/28
at
100.00
9,447,224
2,750
Illinois
Finance
Authority,
Revenue
Bonds,
Rush
University
Medical
Center
Obligated
Group,
Series
2015A,
5.000%,
11/15/38
5/25
at
100.00
2,770,212
12,000
Illinois
Finance
Authority,
Revenue
Bonds,
Silver
Cross
Hospital
and
Medical
Centers,
Refunding
Series
2015C,
5.000%,
8/15/44
8/25
at
100.00
12,057,816
725
Illinois
Finance
Authority,
Revenue
Bonds,
Smith
Crossing,
Refunding
Series
2022,
4.000%,
10/15/30
4/29
at
103.00
683,724
5,000
Illinois
Finance
Authority,
Revenue
Bonds,
University
of
Chicago,
Series
2014A,
4.000%,
10/01/38
10/24
at
100.00
4,960,594
Illinois
Finance
Authority,
Student
Housing
&
Academic
Facility
Revenue
Bonds,
CHF-Collegiate
Housing
Foundation
-
Chicago
LLC
University
of
Illinois
at
Chicago
Project,
Series
2017A
:
830
5.000%,
2/15/26
No
Opt.
Call
836,333
400
5.000%,
2/15/29
8/27
at
100.00
407,661
1,340
Illinois
Housing
Development
Authority,
Revenue
Bonds,
Social
Series
2022G,
6.250%,
10/01/52
4/32
at
100.00
1,442,586
5,425
Illinois
Sports
Facility
Authority,
State
Tax
Supported
Bonds,
Refunding
Series
2014,
5.250%,
6/15/32
-
AGM
Insured
8/24
at
100.00
5,444,322
2,000
Illinois
State,
General
Obligation
Bonds,
December
Series
2017B,
5.000%,
12/01/24
No
Opt.
Call
2,011,395
5,000
Illinois
State,
General
Obligation
Bonds,
May
Series
2020,
5.500%,
5/01/30
No
Opt.
Call
5,391,838
1,500
Illinois
State,
General
Obligation
Bonds,
May
Series
2024B,
5.250%,
5/01/45
5/34
at
100.00
1,650,708
6,000
Illinois
State,
General
Obligation
Bonds,
November
Series
2017D,
5.000%,
11/01/28
11/27
at
100.00
6,303,112
2,000
Illinois
Toll
Highway
Authority,
Toll
Highway
Revenue
Bonds,
Refunding
Senior
Series
2024A,
5.000%,
1/01/38
7/34
at
100.00
2,302,339
5,330
Illinois
Toll
Highway
Authority,
Toll
Highway
Revenue
Bonds,
Senior
Lien
Series
2015B,
5.000%,
1/01/40
1/26
at
100.00
5,423,568
4,830
Knox
&
Warren
Counties
Community
Unit
School
District
205
Galesburg,
Illinois,
General
Obligation
Bonds,
Series
2019A,
5.500%,
12/01/37
12/27
at
100.00
5,166,488
1,100
Lake
County
Consolidated
High
School
District
120
Mundelein,
Illinois,
General
Obligation
Bonds,
School
Series
2022A,
5.500%,
12/01/40
12/32
at
100.00
1,224,455
600
Madison,
Bond
and
Montgomery
Counties
Community
Unit
School
District
05,
Highland,
Illinois,
General
Obligation
Bonds,
School
Series
2022B,
5.500%,
2/01/42
-
AGM
Insured
2/30
at
100.00
650,019
1,000
Romeoville,
Will
County,
Illinois,
Revenue
Bonds,
Lewis
University
Project,
Refunding
Series
2018B,
5.000%,
10/01/39
4/25
at
100.00
1,000,784
1,000
Sangamon
County
School
District
186
Springfield,
Illinois,
General
Obligation
Bonds,
Alternate
Revenue
Source
Series
2023,
5.500%,
6/01/48
-
AGM
Insured
6/33
at
100.00
1,092,572
2,250
Southwestern
Illinois
Development
Authority,
Local
Government
Revenue
Bonds,
Edwardsville
Community
Unit
School
District
7
Project,
Series
2023A,
5.500%,
12/01/35
-
BAM
Insured
12/31
at
100.00
2,583,982
2,000
Will
County
School
District
114,
Manhattan,
Illinois,
General
Obligation
Bonds,
Series
2022,
5.500%,
1/01/43
-
BAM
Insured
1/33
at
100.00
2,238,540
Principal
Amount
(000)
Description
(a)
Optional
Call
Provisions
(b)
Value
ILLINOIS
(continued)
$
4,000
Will
County,
Illinois,
General
Obligation
Bonds,
Alternate
Revenue
Source
Series
2019,
4.000%,
11/15/47
11/29
at
100.00
$
3,856,230
TOTAL
ILLINOIS
121,458,622
INDIANA
-
5.1%
Avon
Community
School
Building
Corporation,
Hendricks
County,
Indiana,
First
Mortgage
Bonds,
Ad
Valorem
Property
Tax
Series
2023
:
1,000
5.500%,
7/15/41
7/33
at
100.00
1,151,566
1,625
5.500%,
1/15/43
7/33
at
100.00
1,848,884
3,500
Brownsburg
1999
School
Building
Corporation,
Indiana,
First
Mortgage
Bonds,
Series
2023,
5.500%,
7/15/40
7/31
at
100.00
3,892,568
750
Carmel,
Indiana,
Waterworks
Revenue
Bonds,
Refunding,
Series
2024C,
5.250%,
5/01/51
-
BAM
Insured
5/32
at
100.00
801,804
2,500
Evansville,
Indiana,
Waterworks
District
Revenue
Bonds,
Series
2022A,
5.000%,
7/01/47
-
BAM
Insured
1/32
at
100.00
2,642,213
1,000
(c)
Gary
Local
Public
Improvement
Bond
Bank,
Indiana,
Economic
Development
Revenue
Bonds,
Drexel
Foundation
for
Educational
Excellence
Project,
Refunding
Series
2020A,
5.875%,
6/01/55
6/30
at
100.00
955,459
850
IIndiana
Finance
Authority,
Hospital
Revenue
Bonds,
Parkview
Health,
Series
2018A,
4.000%,
11/01/48
11/28
at
100.00
812,477
4,000
Indiana
Finance
Authority,
Educational
Facilities
Revenue
Bonds,
DePauw
University
Project,
Series
2022A,
5.000%,
7/01/42
7/32
at
100.00
4,173,010
3,725
Indiana
Finance
Authority,
Educational
Facilities
Revenue
Bonds,
Rose
Hulman
Institute
Of
Technology
Project,
Series
2018,
5.000%,
6/01/40
12/28
at
100.00
3,837,452
520
Indiana
Finance
Authority,
Educational
Facilities
Revenue
Bonds,
Seven
Oaks
Classical
School
Project,
Series
2021A,
5.000%,
6/01/51
6/31
at
100.00
457,300
4,195
Indiana
Finance
Authority,
Health
System
Revenue
Bonds,
Franciscan
Alliance,
Inc
Obligated
Group,
Series
2016B,
5.000%,
11/01/41
11/25
at
100.00
4,244,913
Indiana
Finance
Authority,
Hospital
Revenue
Bonds,
Goshen
Health,
Series
2019A
:
500
5.000%,
11/01/30
5/29
at
100.00
518,680
1,020
5.000%,
11/01/31
5/29
at
100.00
1,052,799
435
5.000%,
11/01/32
5/29
at
100.00
447,601
1,110
5.000%,
11/01/33
5/29
at
100.00
1,140,022
760
5.000%,
11/01/34
5/29
at
100.00
780,406
665
5.000%,
11/01/35
5/29
at
100.00
683,270
235
4.000%,
11/01/36
5/29
at
100.00
228,735
1,125
4.000%,
11/01/43
5/29
at
100.00
1,052,721
Indiana
Finance
Authority,
Hospital
Revenue
Bonds,
Reid
Health
Series
2022
:
1,785
5.000%,
1/01/42
-
AGM
Insured
1/32
at
100.00
1,893,286
1,700
5.000%,
1/01/52
-
AGM
Insured
1/32
at
100.00
1,763,410
Indiana
Finance
Authority,
Indiana,
Health
Facilities
Project
Revenue
Bonds,
Margaret
Mary
Health
Project,
Series
2024A
:
1,635
5.000%,
3/01/32
No
Opt.
Call
1,741,611
1,805
5.000%,
3/01/34
No
Opt.
Call
1,939,857
2,485
5.500%,
3/01/44
3/34
at
100.00
2,677,304
3,845
5.750%,
3/01/54
3/34
at
100.00
4,166,961
785
Indiana
Housing
and
Community
Development
Authority,
Single
Family
Mortgage
Revenue
Bonds,
Social
Series
2024A-1,
4.650%,
7/01/49
1/33
at
100.00
788,330
3,000
Indiana
Municipal
Power
Agency,
Power
Supply
System
Revenue
Bonds,
Series
2022A,
5.500%,
1/01/47
1/32
at
100.00
3,320,606
1,000
Indianapolis
Local
Public
Improvement
Bond
Bank,
Indiana,
Airport
Authority
Project
Revenue
Bonds,
Series
2022G-2,
5.000%,
1/01/33,
(AMT)
1/32
at
100.00
1,088,114
Municipal
Total
Return
Managed
Accounts
Portfolio
(continued)
Portfolio
of
Investments
July
31,
2024
Principal
Amount
(000)
Description
(a)
Optional
Call
Provisions
(b)
Value
INDIANA
(continued)
Indianapolis
Local
Public
Improvement
Bond
Bank,
Indiana,
Airport
Authority
Project
Revenue
Bonds,
Series
2023I-2
:
$
500
5.250%,
1/01/42,
(AMT)
1/33
at
100.00
$
543,239
500
5.250%,
1/01/43,
(AMT)
1/33
at
100.00
540,936
1,030
5.250%,
1/01/48,
(AMT)
1/33
at
100.00
1,102,043
2,235
Indianapolis
Local
Public
Improvement
Bond
Bank,
Indiana,
Circle
City
Forward
Phase
II
Project
Revenue
Bonds,
Series
2023B,
5.250%,
2/01/48
8/33
at
100.00
2,465,355
5,850
Indianapolis
Local
Public
Improvement
Bond
Bank,
Indiana,
Revenue
Bonds,
Ad
Valorem
Property
Tax
Funded
Project
Series
2023D,
6.000%,
2/01/48
2/33
at
100.00
6,808,743
IPS
Multi-School
Building
Corporation,
Indiana,
First
Mortgage
Revenue
Bonds,
Social
Series
2022
:
630
5.500%,
7/15/37
7/32
at
100.00
732,264
500
5.500%,
7/15/39
7/32
at
100.00
575,777
Lake
Ridge
Multi-School
Building
Corporation,
Lake
County,
Indiana,
First
Mortgage
Bonds,
Ad
Valorem
Property
Tax
Series
2022
:
2,960
5.500%,
7/15/36
7/32
at
100.00
3,415,818
3,500
5.500%,
7/15/38
7/32
at
100.00
4,003,050
1,280
5.500%,
7/15/40
7/32
at
100.00
1,446,106
1,150
Mount
Vernon
of
Hancock
County
Multi-School
Building
Corporation,
Indiana,
First
Mortgage
Bonds,
Series
2022,
5.500%,
1/15/42
7/31
at
100.00
1,282,054
4,000
Terre
Haute
Sanitary
District,
Indiana,
Revenue
Bonds,
Bond
Anticipation
Notes
Series
2023,
5.250%,
9/28/28
8/24
at
100.00
4,000,515
Tippecanoe
County
NSE08
School
Building
Corporation,
Indiana,
Ad
Valorem
Property
Tax
First
Mortgage
Bonds,
Series
2023B
:
465
6.000%,
7/15/41
7/33
at
100.00
553,998
1,325
6.000%,
1/15/43
7/33
at
100.00
1,566,582
1,050
Warrick
County
School
Corporation,
Indiana,
General
Obligation
Bonds,
Series
2023,
5.000%,
1/15/25
No
Opt.
Call
1,055,066
TOTAL
INDIANA
80,192,905
IOWA
-
0.2%
3,000
PEFA
Inc.,
Public
Energy
Facilities
Authority,
Inc.,
Iowa,
Gas
Project
Revenue
Bonds,
Series
2019,
5.000%,
9/01/49
6/26
at
100.62
3,062,896
TOTAL
IOWA
3,062,896
KANSAS
-
0.6%
1,075
Hutchinson,
Kansas,
Hospital
Facilities
Revenue
Bonds,
Hutchinson
Regional
Medical
Center,
Inc.,
Series
2016,
5.000%,
12/01/36
12/26
at
100.00
1,041,618
Kansas
Independent
College
Finance
Authority,
Revenue
Anticipation
Notes,
Private
Education
Short-Term
Loan
Program,
Series
2024A,
B,
and
C
:
525
8.150%,
5/01/25
No
Opt.
Call
533,385
1,000
8.500%,
5/01/25
No
Opt.
Call
1,015,603
205
Kansas
Power
Pool,
a
Municipal
Energy
Agency
Electric
Utility
Revenue
Bonds,
DogWood
Facility,
Series
2015A,
5.000%,
12/01/28
12/25
at
100.00
208,827
1,500
Marion
County
Unified
School
District
410
Marion-Durham-Hillsboro-
Lehigh,
Kansas,
General
Obligation
Bonds,
Series
2024,
4.000%,
9/01/44
-
AGM
Insured
9/33
at
100.00
1,478,233
2,700
Unified
School
District
No.
491,
Douglas
County.
Kansas,
General
Obligation
Bonds,
Refunding
and
School
Building,
Eudora
Series
2023A,
5.000%,
9/01/42
-
AGM
Insured
9/32
at
100.00
2,918,827
Principal
Amount
(000)
Description
(a)
Optional
Call
Provisions
(b)
Value
KANSAS
(continued)
$
2,350
University
of
Kansas
Hospital
Authority,
Health
Facilities
Revenue
Bonds,
KU
Health
System,
Refunding
&
Improvement
Series
2015,
5.000%,
9/01/33
9/25
at
100.00
$
2,390,347
TOTAL
KANSAS
9,586,840
KENTUCKY
-
0.1%
1,250
Kentucky
State
Property
and
Buildings
Commission,
Revenue
Bonds,
Project
127,
Series
2022A,
5.250%,
6/01/39
6/32
at
100.00
1,405,487
TOTAL
KENTUCKY
1,405,487
LOUISIANA
-
2.1%
4,000
Greater
New
Orleans
Expressway
Commission,
Louisiana,
Toll
Revenue
Bonds,
Subordinate
Lien
Series
2017,
5.000%,
11/01/42
-
AGM
Insured
11/25
at
100.00
4,053,926
5,000
Louisiana
Local
Government
Environmental
Facilities
and
Community
Development
Authority,
Louisiana,
Insurance
Assessment
Revenue
Bonds,
Louisiana
Insurance
Guaranty
Association
Project,
Series
2022B,
5.000%,
8/15/33
8/27
at
100.00
5,198,488
200
(c)
Louisiana
Publc
Facilities
Authority,
Lousiana,
Revenue
Bonds,
Lincoln
Preparatory
School
Project,
Series
2021A,
5.000%,
6/01/31
No
Opt.
Call
196,359
Louisiana
Publc
Facilities
Authority,
Lousiana,
Revenue
Bonds,
Ochsner
Clinic
Foundation
Project,
Refunding
Series
2017
:
2,000
5.000%,
5/15/33
5/27
at
100.00
2,070,109
2,000
5.000%,
5/15/34
5/27
at
100.00
2,068,695
2,640
5.000%,
5/15/35
5/27
at
100.00
2,727,658
2,000
Louisiana
Public
Facilities
Authority,
Louisiana,
Revenue
Bonds,
Loyola
University
of
New
Orleans
Project,
Refunding
Series
2023A,
5.000%,
10/01/43
4/33
at
100.00
2,098,820
3,940
New
Orleans
Aviation
Board,
Louisiana,
General
Airport
Revenue
Bonds,
North
Terminal
Project,
Series
2015B,
5.000%,
1/01/30,
(AMT)
1/25
at
100.00
3,955,659
New
Orleans
Aviation
Board,
Louisiana,
General
Airport
Revenue
Bonds,
North
Terminal
Project,
Series
2017B
:
400
5.000%,
1/01/34,
(AMT)
1/27
at
100.00
408,740
500
5.000%,
1/01/35,
(AMT)
1/27
at
100.00
510,759
355
5.000%,
1/01/36,
(AMT)
1/27
at
100.00
362,296
500
(c)
Plaquemines
Port,
Harbor
and
Terminal
District,
Louisiana,
Facilities
Revenue
Bonds,
NOLA
Terminal
LLC
Project
Dock
and
Wharf
Series
2024A,
9.000%,
12/01/44
12/34
at
100.00
498,966
Port
New
Orleans
Board
of
Commissioners,
Louisiana,
Revenue
Bonds,
Port
Facilities,
Refunding
Series
2018B
:
3,000
5.000%,
4/01/37
-
AGM
Insured,
(AMT)
4/28
at
100.00
3,113,732
860
5.000%,
4/01/38
-
AGM
Insured,
(AMT)
4/28
at
100.00
893,036
4,900
Saint
John
the
Baptist
Parish
School
District
1,
Louisiana,
General
Obligation
Bonds,
Series
2023,
5.250%,
3/01/37
3/33
at
100.00
5,373,369
TOTAL
LOUISIANA
33,530,612
MAINE
-
0.2%
Bath,
Maine,
General
Obligation
Bonds,
Series
2024
:
1,500
4.000%,
5/01/44
5/34
at
100.00
1,497,293
1,000
4.000%,
5/01/49
5/34
at
100.00
978,637
500
Maine
Health
and
Higher
Educational
Facilities
Authority,
Revenue
Bonds,
Series
2022C,
5.500%,
7/01/38
-
AGM
Insured
7/32
at
100.00
566,110
700
Maine
Health
and
Higher
Educational
Facilities
Authority,
Revenue
Bonds,
Series
2023A,
5.000%,
7/01/42
-
AGM
Insured
7/33
at
100.00
760,918
TOTAL
MAINE
3,802,958
Municipal
Total
Return
Managed
Accounts
Portfolio
(continued)
Portfolio
of
Investments
July
31,
2024
Principal
Amount
(000)
Description
(a)
Optional
Call
Provisions
(b)
Value
MARYLAND
-
0.3%
$
250
Maryland
Health
and
Higher
Educational
Facilities
Authority,
Revenue
Bonds
Doctors
Community
Hospital,
Series
2017B,
5.000%,
7/01/32
7/27
at
100.00
$
255,919
4,615
Maryland
Transportation
Authority,
Passenger
Facility
Charge
Revenue
Bonds,
Baltimore/Washington
Internatonal
Thurgood
Marshall
Airport
Project,
Series
2019,
5.000%,
6/01/26,
(AMT)
No
Opt.
Call
4,758,309
TOTAL
MARYLAND
5,014,228
MASSACHUSETTS
-
0.5%
3,280
Massachusetts
State,
General
Obligation
Bonds,
Refunding
Series
2023B,
5.000%,
5/01/43
5/33
at
100.00
3,647,922
4,000
Massachusetts
State,
General
Obligation
Bonds,
Refunding
Series
2024A,
5.000%,
3/01/40
3/34
at
100.00
4,564,593
TOTAL
MASSACHUSETTS
8,212,515
MICHIGAN
-
2.9%
1,090
Belding
School
District,
Ionia,
Kent
and
Montcalm
Counties,
Michigan,
General
Obligation
Bonds,
School
Building
&
Site
Series
2022,
5.250%,
5/01/48
5/32
at
100.00
1,180,635
5,000
Flat
Rock
Community
School
District,
Wayne
County,
Michigan,
General
Obligation
Bonds,
Refunding
School
Building
and
Site
Series
2023,
5.250%,
5/01/52
5/32
at
100.00
5,422,655
5
(d)
Kalamazoo
Hospital
Finance
Authority,
Michigan,
Hospital
Revenue
Bonds,
Bronson
Healthcare
Group,
Inc.,
Refunding
Series
2016,
5.000%,
5/15/26,
(ETM)
No
Opt.
Call
5,164
4,000
Lansing,
Ingham
and
Eaton
Counties,
Michigan,
General
Obligation
Bonds,
Refunding
&
Capital
Improvement
Series
2023B,
5.000%,
6/01/42
-
AGM
Insured
6/33
at
100.00
4,389,275
825
Michigan
Finance
Authority,
Hospital
Revenue
Bonds,
McLaren
Health
Care,
Refunding
Series
2015B,
5.000%,
5/15/34
5/25
at
100.00
832,650
2,500
Michigan
Finance
Authority,
Hospital
Revenue
Bonds,
McLaren
Health
Care,
Series
2019A,
5.000%,
2/15/32
8/29
at
100.00
2,676,083
Michigan
Finance
Authority,
Hospital
Revenue
Bonds,
Sparrow
Obligated
Group,
Refunding
Series
2022A
:
3,600
(d)
5.000%,
11/15/33,
(Pre-refunded
11/15/32)
11/32
at
100.00
4,087,412
3,785
(d)
5.000%,
11/15/34,
(Pre-refunded
11/15/32)
11/32
at
100.00
4,297,460
3,975
(d)
5.000%,
11/15/35,
(Pre-refunded
11/15/32)
11/32
at
100.00
4,513,185
4,460
Michigan
Finance
Authority,
Local
Government
Loan
Program
Revenue
Bonds,
Detroit
Financial
Recovery
Income
Tax
Local
Project,
Refunding
Series
2014F-1,
4.500%,
10/01/29
10/24
at
100.00
4,462,716
375
(c)
Michigan
Finance
AuthorIty,
Public
School
Academy
Limited
Obligation
Revenue
Bonds,
Voyageur
Academy
Project,
Refunding
Series
2017.
Private
Placement
of
2017,
5.900%,
7/15/46
7/27
at
100.00
301,327
1,000
Michigan
Mathematics
&
Science
Initiative,
Michigan,
Public
School
Academy
Revenue
Bonds,
Series
2021,
4.000%,
1/01/51
1/31
at
100.00
851,616
3,075
Michigan
State
University,
General
Revenue
Bonds,
Series
2024A,
5.250%,
8/15/43
8/34
at
100.00
3,499,272
5,000
Michigan
State,
Trunk
Line
Fund
Bonds,
Rebuilding
Michigan
Program,
Series
2021A,
4.000%,
11/15/44
11/31
at
100.00
4,989,824
3,000
Wyoming
Public
Schools,
Kent
County,
Michigan,
General
Obligation
Bonds,
School
Building
&
Site
Series
2023,
5.000%,
5/01/43
-
AGM
Insured
5/33
at
100.00
3,261,046
TOTAL
MICHIGAN
44,770,320
Principal
Amount
(000)
Description
(a)
Optional
Call
Provisions
(b)
Value
MINNESOTA
-
0.6%
$
4,580
Forest
Lake,
Minnesota
Charter
School
Lease
Revenue
Bonds,
North
Lakes
Academy,
Refunding
Series
2021A,
5.000%,
7/01/41
7/31
at
100.00
$
4,339,363
305
Forest
Lake,
Minnesota,
Charter
School
Lease
Revenue
Bonds,
Lakes
International
Language
Academy,
Series
2014A,
4.500%,
8/01/26
9/24
at
100.00
305,035
1,750
Minneapolis-St.
Paul
Metropolitan
Airports
Commission,
Minnesota,
Airport
Revenue
Bonds,
Subordinate
Lien
Series
2022B,
5.000%,
1/01/37,
(AMT)
1/32
at
100.00
1,884,877
1,000
Minnesota
Housing
Finance
Agency,
Residential
Housing
Finance
Bonds,
Series
2022M,
5.100%,
7/01/42
1/32
at
100.00
1,063,876
1,000
Ramsey,
Anoka
County,
Minnesota,
Lease
Revenue
Bonds,
PACT
Charter
School
Project, Series
2022A,
5.000%,
6/01/32
6/29
at
100.00
1,014,499
750
St.
Paul
Housing
and
Redevelopment
Authority,
Minnesota,
Charter
School
Revenue
Bonds,
Higher
Ground
Academy
Charter
School,
Series
2023,
5.500%,
12/01/38
12/29
at
102.00
792,519
TOTAL
MINNESOTA
9,400,169
MISSISSIPPI
-
1.3%
3,180
Medical
Center
Educational
Building
Corporation,
Mississippi,
Revenue
Bonds,
University
of
Mississippi
Medical
Center,
Colony
Park
Teaching
Campus,
Series
2023A,
5.000%,
6/01/42
6/33
at
100.00
3,454,503
5,000
Mississippi
Home
Corporation,
Single
Family
Mortgage
Revenue
Bonds,
Series
2023C,
4.550%,
12/01/43
6/32
at
100.00
5,049,183
Mississippi
Hospital
Equipment
and
Facilities
Authority,
Revenue
Bonds,
Baptist
Memorial
Healthcare,
Series
2016A
:
4,000
5.000%,
9/01/41
9/26
at
100.00
4,044,550
8,500
5.000%,
9/01/46
9/26
at
100.00
8,561,209
TOTAL
MISSISSIPPI
21,109,445
MISSOURI
-
2.8%
2,500
(c)
Lee's
Summit,
Missouri,
Special
Obligation
Tax
Increment
and
Special
District
Improvement
Bonds,
Summit
Fair
Project,
Refunding
Series
2017,
4.875%,
11/01/37
11/27
at
100.00
2,338,968
1,960
Metropolitan
St.
Louis
Sewerage
District,
Missouri,
Wastewater
System
Revenue
Bonds,
Refunding
Improvement
Series
2022B,
5.250%,
5/01/52
5/32
at
100.00
2,148,963
4,000
Missouri
Development
Finance
Board,
Revenue
Bonds,
Zoo
Projects,
Series
2022,
5.500%,
5/01/42
5/32
at
100.00
4,424,363
3,000
Missouri
Health
and
Educational
Facilities
Authority,
Health
Facilities
Revenue
Bonds,
BJC
Health
System,
Series
2015A,
4.000%,
1/01/45
1/25
at
100.00
2,899,187
10,000
Missouri
Health
and
Educational
Facilities
Authority,
Health
Facilities
Revenue
Bonds,
Mercy
Health,
Series
2012,
4.000%,
11/15/42
9/24
at
100.00
9,698,930
650
Missouri
Health
and
Educational
Facilities
Authority,
Revenue
Bonds,
Lutheran
Senior
Services
Projects,
Series
2016B,
5.000%,
2/01/28
2/26
at
100.00
662,601
2,330
Orchard
Farm
R-V
School
District,
Saint
Charles
County,
Missouri,
Certificates
of
Participation,
Series
2022A,
5.250%,
4/01/39
4/29
at
100.00
2,468,569
2,200
Ozark
Reorganized
School
District
6,
Christian
County,
Missouri,
General
Obligation
Bonds,
School
Building
Series
2022,
6.000%,
3/01/42
-
AGM
Insured
9/32
at
100.00
2,571,115
10,000
Saint
Louis,
Missouri,
Airport
Revenue
Bonds,
Lambert-St.
Louis
International
Airport,
Series
2024A,
5.250%,
7/01/49
-
AGM
Insured
7/34
at
100.00
11,083,590
253
Saint
Louis,
Missouri,
Tax
Increment
Financing
Revenue
Notes,
Marquette
Building
Redevelopment
Project,
Series
2008-A,
6.500%,
1/23/28
9/24
at
100.00
103,730
Municipal
Total
Return
Managed
Accounts
Portfolio
(continued)
Portfolio
of
Investments
July
31,
2024
Principal
Amount
(000)
Description
(a)
Optional
Call
Provisions
(b)
Value
MISSOURI
(continued)
$
510
(c)
Taney
County
Industrial
Development
Authority,
Missouri,
Sales
Tax
Revenue
Improvement
Bonds,
Big
Cedar
Infrastructure
Project
Series
2023,
6.000%,
10/01/49
10/30
at
100.00
$
513,520
1,060
Transportation
Development
District,
Missouri,
Transportation
Sales
Tax
Revenue
Bonds,
Series
2017,
4.500%,
6/01/36
6/26
at
100.00
1,065,837
2,340
Universal
City
Industrial
Development
Authority,
Missouri,
Revenue
Bonds,
Tax
Increment
and
Special
District
Markets
at
Olive
Project
Series
2023A,
4.875%,
6/15/36
6/33
at
100.00
2,379,895
600
Wright
City
School
District
R-II,
Warren
County,
Missouri,
General
Obligation
Bonds,
School
Building
Series
2022,
6.000%,
3/01/42
-
AGM
Insured
9/32
at
100.00
706,745
TOTAL
MISSOURI
43,066,013
MONTANA
-
1.2%
3,000
Montana
Board
of
Housing,
Single
Family
Mortgage
Bonds,
Series
2023A,
4.450%,
12/01/43
12/32
at
100.00
3,010,345
1,220
Montana
Facility
Finance
Authority,
Hospital
Revenue
Bonds,
Benefis
Health
System
Obligated
Group,
Refunding
Series
2016,
5.000%,
2/15/31
2/27
at
100.00
1,254,831
5,000
Montana
Facility
Finance
Authority,
Revenue
Bonds,
Billings
Clinic
Obligated
Group,
Series
2018A,
5.000%,
8/15/48
8/28
at
100.00
5,125,877
8,720
Montana
State
Board
of
Regents
of
Higher
Education,
General
Revenue
Bonds,
Series
2022,
5.250%,
11/15/52
-
AGM
Insured
11/32
at
100.00
9,532,142
TOTAL
MONTANA
18,923,195
NEBRASKA
-
1.0%
Douglas
County
Hospital
Authority
2,
Nebraska,
Health
Facilities
Revenue
Bonds,
Children's
Hospital
Obligated
Group,
Series
2017
:
1,045
5.000%,
11/15/36
5/27
at
100.00
1,086,556
1,070
5.000%,
11/15/37
5/27
at
100.00
1,110,836
2,000
Douglas
County
Nebraska,
Sanitary
and
Improvement,
District
Number
608,
General
Obligation
Bonds,
North
Streams,
Series
2022,
6.000%,
12/15/37
6/27
at
100.00
1,935,834
1,750
Douglas
County
Sanitary
and
Improvement
District
608
North
Streams,
Nebraska,
General
Obligation
Bonds,
Series
2022,
5.750%,
12/15/37
6/27
at
100.00
1,654,849
1,045
Douglas
County
Sanitary
and
Improvement
District
608
North
Streams,
Nebraska,
General
Obligation
Bonds,
Series
2023,
7.000%,
10/15/38
4/28
at
100.00
1,044,855
525
Madison
County
Hospital
Authority
1,
Nebraska,
Hospital
Revenue
Bonds,
Faith
Regional
Health
Services
Project,
Series
2018,
5.000%,
7/01/29
7/25
at
100.00
526,372
2,500
Nebraska
Investment
Finance
Authority,
Single
Family
Housing
Revenue
Bonds,
Social
Series
2023G,
5.150%,
9/01/43
9/32
at
100.00
2,629,011
3,000
Nebraska
Investment
Finance
Authority,
Single
Family
Housing
Revenue
Bonds,
Social
Series
2024A,
4.500%,
9/01/44
3/33
at
100.00
3,003,768
2,800
Southeast
Community
College
Area,
Nebraska,
Certificates
of
Participation,
Series
2018,
5.000%,
12/15/47
6/28
at
100.00
2,953,864
TOTAL
NEBRASKA
15,945,945
NEVADA
-
1.6%
Clark
County
Water
Reclamation
District,
Nevada,
General
Obligation
Water
Bonds,
Limited
Tax
Series
2023
:
2,425
5.000%,
7/01/41
7/33
at
100.00
2,714,789
12,335
5.000%,
7/01/47
7/33
at
100.00
13,468,429
4,000
Clark
County,
Nevada Airport
Revenue
Bonds,
Senior
Series
2015A,
5.000%,
7/01/40
7/25
at
100.00
4,038,324
Principal
Amount
(000)
Description
(a)
Optional
Call
Provisions
(b)
Value
NEVADA
(continued)
$
2,000
Clark
County,
Nevada,
Airport
Revenue
Bonds,
Jet
Aviation
Fuel
Tax,
Refunding
Series
2022A,
5.000%,
7/01/26,
(AMT)
No
Opt.
Call
$
2,065,030
775
Henderson,
Nevada,
Local
Improvement
Bonds,
Local
Improvement
District
T-22
Rainbow
Canyon
Phase
II,
Series
2023,
5.000%,
3/01/38
3/33
at
100.00
789,736
600
Las
Vegas
Special
Improvement
District
613,
Nevada,
Local
Improvement
Bonds,
Sunstone
Phases
III
and
IV
Series
2024,
5.500%,
12/01/53
12/34
at
100.00
606,405
870
Las
Vegas,
Nevada,
Local
Improvement
Bonds,
Special
Improvement
District
812
Summerlin
Village
24,
Series
2015,
4.250%,
12/01/24
No
Opt.
Call
870,853
TOTAL
NEVADA
24,553,566
NEW
HAMPSHIRE
-
1.0%
670
New
Hampshire
Health
and
Education
Facilities
Authority,
Revenue
Bonds,
Catholic
Medical
Center,
Series
2017,
5.000%,
7/01/44
7/27
at
100.00
670,033
4,055
New
Hampshire
Health
and
Education
Facilities
Authority,
Revenue
Bonds,
Concord
Hospital,
Series
2017,
5.000%,
10/01/42
10/27
at
100.00
4,171,987
9,455
New
Hampshire
Health
and
Education
Facilities
Authority,
Revenue
Bonds,
University
System
of
New
Hampshire,
Series
2015,
5.000%,
7/01/40
7/25
at
100.00
9,516,979
1,350
New
Hampshire
Housing
Finance
Authority,
Single
Family
Mortgage
Acquisition
Bonds,
Social
Series
2023B,
4.450%,
7/01/43
7/32
at
100.00
1,354,095
TOTAL
NEW
HAMPSHIRE
15,713,094
NEW
JERSEY
-
2.2%
Middlesex
County
Improvement
Authority,
New
Jersey,
General
Obligation
Lease
Revenue
Bonds,
New
Jersey
Health
+
Life
Science
Exchange
-
H-1
Project
Series
2023A
:
3,920
5.000%,
8/15/49
8/33
at
100.00
4,302,048
2,715
5.000%,
8/15/53
8/33
at
100.00
2,963,071
5,300
New
Jersey
Economic
Development
Authority,
New
Jersey,
Transit
Transportation
Project
Revenue
Bonds,
Portal
North
Bridge
Project
Series
2022A,
5.000%,
11/01/37
11/32
at
100.00
5,901,626
1,500
New
Jersey
Economic
Development
Authority,
Private
Activity
Bonds,
The
Goethals
Bridge
Replacement
Project,
Series
2013,
5.125%,
1/01/39
-
AGM
Insured,
(AMT)
9/24
at
100.00
1,501,472
New
Jersey
Economic
Development
Authority,
Special
Facility
Revenue
Bonds,
Port
Newark
Container
Terminal
LLC
Project,
Refunding
Series
2017
:
1,800
5.000%,
10/01/24,
(AMT)
No
Opt.
Call
1,802,296
3,500
5.000%,
10/01/37,
(AMT)
10/27
at
100.00
3,615,571
2,235
5.000%,
10/01/47,
(AMT)
10/27
at
100.00
2,270,794
5,000
New
Jersey
Health
Care
Facilities
Financing
Authority,
State
Contract
Bonds,
Hospital
Asset
Transformatiom
Program,
Refunding
Series
2017,
5.000%,
10/01/29
4/28
at
100.00
5,254,080
2,000
New
Jersey
Housing
and
Mortgage
Finance
Agency,
Single
Family
Housing
Revenue
Bonds,
Series
2018B,
3.800%,
10/01/32,
(AMT)
10/27
at
100.00
1,963,895
1,700
New
Jersey
Transportation
Trust
Fund
Authority,
Transportation
Program
Bonds,
Series
2022CC,
5.250%,
6/15/36
12/32
at
100.00
1,940,352
1,700
New
Jersey
Transportation
Trust
Fund
Authority,
Transportation
System
Bonds,
Series
2009C,
5.250%,
6/15/32
12/24
at
100.00
1,709,097
200
New
Jersey
Transportation
Trust
Fund
Authority,
Transportation
System
Bonds,
Series
2015AA,
5.250%,
6/15/32
6/25
at
100.00
202,909
1,300
South
Jersey
Port
Corporation,
New
Jersey,
Marine
Terminal
Revenue
Bonds,
Subordinate
Series
2017B,
5.000%,
1/01/35,
(AMT)
1/28
at
100.00
1,351,292
TOTAL
NEW
JERSEY
34,778,503
Municipal
Total
Return
Managed
Accounts
Portfolio
(continued)
Portfolio
of
Investments
July
31,
2024
Principal
Amount
(000)
Description
(a)
Optional
Call
Provisions
(b)
Value
NEW
MEXICO
-
0.1%
$
1,980
New
Mexico
Mortgage
Finance
Authority,
Single
Family
Mortgage
Program
Bonds,
Class
1
Series
2023D,
5.150%,
9/01/43
9/32
at
100.00
$
2,109,919
TOTAL
NEW
MEXICO
2,109,919
NEW
YORK
-
7.8%
400
Buffalo
and
Erie
County
Industrial
Land
Development
Corporation,
New
York,
Revenue
Bonds,
Catholic
Health
System,
Inc.
Project,
Series
2015,
5.000%,
7/01/27
7/25
at
100.00
395,505
400
Build
New
York
City
Resource
Corporation,
New
York,
Revenue
Bonds,
Global
Community
Charter
School
Project,
Series
2022A,
4.000%,
6/15/32
No
Opt.
Call
402,945
Build
New
York
Resource
Corporation
Revenue
Bonds,
East
Harlem
Scholars
Academy
Charter
School
Project,
Series
2022
(Social
Bonds)
:
400
(c)
5.000%,
6/01/32
6/30
at
100.00
422,952
1,250
(c)
5.750%,
6/01/42
6/30
at
100.00
1,333,919
1,335
Dormitory
Authority
of
the
State
of
New
York,
Columbia
University
Revenue
Bonds,
Series
2020A,
5.000%,
10/01/50
No
Opt.
Call
1,582,649
Dormitory
Authority
of
the
State
of
New
York,
General
Revenue
Bonds,
Barnard
College,
Series
2022A
:
785
5.000%,
7/01/37
7/30
at
100.00
844,600
500
5.000%,
7/01/38
7/30
at
100.00
535,129
Dormitory
Authority
of
the
State
of
New
York,
Revenue
Bonds,
Catholic
Health
System
Obligated
Group
Series
2019A
:
725
5.000%,
7/01/32
7/29
at
100.00
707,851
525
5.000%,
7/01/34
7/29
at
100.00
508,231
925
4.000%,
7/01/38
7/29
at
100.00
792,063
800
5.000%,
7/01/41
7/29
at
100.00
764,764
9,000
Dormitory
Authority
of
the
State
of
New
York,
Revenue
Bonds,
Icahn
School
of
Medicine
at
Mount
Sinai,
Refunding
Series
2015A,
5.000%,
7/01/32
7/25
at
100.00
9,051,264
5,000
Dormitory
Authority
of
the
State
of
New
York,
Revenue
Bonds,
Memorial
Sloan
Kettering
Cancer
Center
Series
2022-1A,
4.000%,
7/01/51
7/32
at
100.00
4,859,078
2,535
Dormitory
Authority
of
the
State
of
New
York,
Revenue
Bonds,
Montefiore
Obligated
Group,
Series
2018A,
5.000%,
8/01/25
No
Opt.
Call
2,539,182
470
Dormitory
Authority
of
the
State
of
New
York,
Revenue
Bonds,
Montefiore
Obligated
Group,
Series
2020A,
5.000%,
9/01/28
No
Opt.
Call
485,124
300
(c)
Dormitory
Authority
of
the
State
of
New
York,
Revenue
Bonds,
Orange
Regional
Medical
Center
Obligated
Group,
Series
2017,
5.000%,
12/01/29
6/27
at
100.00
298,142
1,575
Liberty
Development
Corporation,
New
York,
Goldman
Sachs
Headquarter
Revenue
Bonds,
Series
2005,
5.250%,
10/01/35
No
Opt.
Call
1,830,817
580
Liberty
Development
Corporation,
New
York,
Goldman
Sachs
Headquarters
Revenue
Bonds
Series
2007,
5.500%,
10/01/37
No
Opt.
Call
694,161
1,000
Long
Island
Power
Authority,
New
York,
Electric
System
General
Revenue
Bonds,
Series
2015B,
5.000%,
9/01/36
9/25
at
100.00
1,016,275
1,975
Monroe
County
Industrial
Development
Corporation,
New
York,
Revenue
Bonds,
Rochester
General
Hospital
Project,
Series
2017,
5.000%,
12/01/46
12/26
at
100.00
1,990,802
Monroe
County
Industrial
Development
Corporation,
New
York,
Revenue
Bonds,
Rochester
Regional
Health
Project,
Series
2020A
:
600
5.000%,
12/01/24
No
Opt.
Call
601,999
750
5.000%,
12/01/25
No
Opt.
Call
760,743
2,011
Nassau
County
Tobacco
Settlement
Corporation,
New
York,
Tobacco
Settlement
Asset-Backed
Bonds,
Refunding
Series
2006A-2,
5.250%,
6/01/26
8/24
at
100.00
1,982,060
Principal
Amount
(000)
Description
(a)
Optional
Call
Provisions
(b)
Value
NEW
YORK
(continued)
$
370
New
Rochelle
Corporation,
New
York,
Local
Development
Revenue
Bonds,
Iona
College
Project,
Series
2015A,
5.000%,
7/01/32
7/25
at
100.00
$
373,888
3,000
New
York
City
Transitional
Finance
Authority,
New
York,
Future
Tax
Secured
Bonds,
Subordinate
Fiscal
2017
Series
B-1,
5.000%,
8/01/36
8/26
at
100.00
3,087,285
2,000
New
York
City
Transitional
Finance
Authority,
New
York,
Future
Tax
Secured
Bonds,
Subordinate
Fiscal
2025
Subseries
Series
A-1,
5.000%,
11/01/39
11/34
at
100.00
2,290,027
2,500
New
York
City
Transitional
Finance
Authority,
New
York,
Future
Tax
Secured
Bonds,
Subordinate
Fiscal
Series
2023B-1,
5.250%,
11/01/36
11/32
at
100.00
2,885,526
5,000
New
York
City
Transitional
Finance
Authority,
New
York,
Future
Tax
Secured
Bonds,
Subordinate
Fiscal
Series
2023D-1,
5.500%,
11/01/45
11/32
at
100.00
5,675,664
6,000
New
York
City
Transitional
Finance
Authority,
New
York,
Future
Tax
Secured
Bonds,
Subordinate
Fiscal
Series
2023E-1,
5.000%,
11/01/40
5/33
at
100.00
6,715,258
4,035
New
York
City
Transitional
Finance
Authority,
New
York,
Future
Tax
Secured
Bonds,
Subordinate
Fiscal
Series
2024A-1,
5.000%,
5/01/44
5/33
at
100.00
4,450,283
7,090
(c)
New
York
Liberty
Development
Corporation,
New
York,
Liberty
Revenue
Bonds,
3
World
Trade
Center
Project,
Class
1
Series
2014,
5.000%,
11/15/44
11/24
at
100.00
7,097,104
New
York
State
Environmental
Facilities
Corporation,
State
Clean
Water
and
Drinking
Water
Revolving
Funds
Revenue
Bonds,
Pooled
Loan
Issue,
Series
2005B
:
500
(d)
5.500%,
10/15/27,
(ETM)
No
Opt.
Call
536,248
1,000
(d)
5.500%,
4/15/35,
(ETM)
No
Opt.
Call
1,182,656
500
New
York
State
Power
Authority,
Green
Transmission
Project
Revenue
Bonds,
Green
Series
2023A,
5.250%,
11/15/42
-
AGM
Insured
11/33
at
100.00
579,317
New
York
Transportation
Development
Corporation,
New
York,
Special
Facility
Revenue
Bonds,
John
F
Kennedy
International
Airport
New
Terminal
1
Project,
Green
Series
2024
:
1,785
5.250%,
6/30/43,
(AMT)
6/33
at
100.00
1,916,242
2,600
5.500%,
6/30/54,
(AMT)
6/33
at
100.00
2,776,035
1,980
New
York
Transportation
Development
Corporation,
New
York,
Special
Facility
Revenue
Bonds,
New
Terminal
1
John
F
Kennedy
International
Airport
Project,
Green
Series
2023,
5.500%,
6/30/44
-
AGM
Insured,
(AMT)
6/31
at
100.00
2,145,766
New
York
Transportation
Development
Corporation,
New
York,
Special
Facility
Revenue
Bonds,
Terminal
4
John
F
Kennedy
International
Airport
Project,
Series
2022
:
8,500
5.000%,
12/01/31,
(AMT)
No
Opt.
Call
9,174,726
1,660
5.000%,
12/01/42,
(AMT)
12/32
at
100.00
1,738,455
2,750
Niagara
Frontier
Transportation
Authority,
New
York,
Airport
Revenue
Bonds,
Buffalo
International
Airport,
Series
2014A,
5.000%,
4/01/25,
(AMT)
9/24
at
100.00
2,751,097
7,390
Port
Authority
of
New
York
and
New
Jersey,
Consolidated
Revenue
Bonds,
One
Hundred
Eighty-Sixth
Series
2014,
5.000%,
10/15/44,
(AMT)
10/24
at
100.00
7,402,202
4,000
Port
Authority
of
New
York
and
New
Jersey,
Consolidated
Revenue
Bonds,
Two
Hundred
Eighteen
Series
2019,
5.000%,
11/01/44,
(AMT)
11/29
at
100.00
4,140,230
750
Schenectady
County
Capital
Resource
Corporation,
New
York,
Revenue
Bonds,
Union
College
Project,
Series
2022,
5.250%,
7/01/52
7/32
at
100.00
821,335
7,625
Triborough
Bridge
and
Tunnel
Authority,
New
York,
Sales
Tax
Revenue
Bonds,
MTA
Bridges
&
Tunnels,
TBTA
Capital
Lockbox-City
Sales
Tax,
Series
2022A,
5.250%,
5/15/52
11/32
at
100.00
8,349,896
7,165
Triborough
Bridge
and
Tunnel
Authority,
New
York,
Sales
Tax
Revenue
Bonds,
MTA
Bridges
&
Tunnels,
TBTA
Capital
Lockbox-City
Sales
Tax,
Series
2024A-1,
5.250%,
5/15/59
5/34
at
100.00
7,898,614
Municipal
Total
Return
Managed
Accounts
Portfolio
(continued)
Portfolio
of
Investments
July
31,
2024
Principal
Amount
(000)
Description
(a)
Optional
Call
Provisions
(b)
Value
NEW
YORK
(continued)
$
1,360
Westchester
County
Local
Development
Corporation,
New
York,
Revenue
Bonds,
Westchester
Medical
Center
Obligated
Group
Project,
Series
2023,
5.750%,
11/01/48
-
AGM
Insured
11/33
at
100.00
$
1,524,295
915
Yonkers
Industrial
Development
Agency,
New
York,
School
Facility
Revenue
Bonds,
New
Community
School
Project
Series
2022,
5.250%,
5/01/51
5/32
at
100.00
987,282
1,155
Yonkers,
New
York,
General
Obligation
Bonds,
Serial
Series
2022F,
5.000%,
11/15/38
-
BAM
Insured
11/32
at
100.00
1,294,303
TOTAL
NEW
YORK
122,193,989
NORTH
CAROLINA
-
0.4%
1,000
Charlotte,
North
Carolina,
Airport
Revenue
Bonds,
Charlotte
Douglas
International,
Refunding
Series
2017B,
5.000%,
7/01/42,
(AMT)
7/27
at
100.00
1,022,046
1,090
Greater
Asheville
Regional
Airport
Authority, North
Carolina,
Airport
System
Revenue
Bonds,
Series
2023,
5.250%,
7/01/42
-
AGM
Insured,
(AMT)
7/33
at
100.00
1,193,204
1,300
Greater
Asheville
Regional
Airport
Authority,
North
Carolina,
Airport
System
Revenue
Bonds,
Series
2022A,
5.250%,
7/01/39
-
AGM
Insured,
(AMT)
7/32
at
100.00
1,429,770
Greater
Asheville
Regional
Airport
Authority,
North
Carolina,
Airport
System
Revenue
Bonds,
Series
2023
:
430
5.250%,
7/01/41
-
AGM
Insured,
(AMT)
7/33
at
100.00
472,588
620
5.250%,
7/01/43
-
AGM
Insured,
(AMT)
7/33
at
100.00
675,685
North
Carolina
Turnpike
Authority,
Triangle
Expressway
System
Revenue
Bonds,
Senior
Lien
Series
2019
:
1,500
5.000%,
1/01/44
1/30
at
100.00
1,572,607
500
5.000%,
1/01/49
1/30
at
100.00
519,422
TOTAL
NORTH
CAROLINA
6,885,322
NORTH
DAKOTA
-
0.7%
2,580
North
Dakota
Board
of
Higher
Education,
Housing
and
Auxiliary
Facilities
Revenue
Bonds,
Bismarck
State
College,
Series
2024,
5.000%,
5/01/49
-
AGM
Insured,
(WI/DD)
5/33
at
100.00
2,752,719
1,000
North
Dakota
Housing
Finance
Agency,
Home
Mortgage
Finance
Program
Bonds,
Social
Series
2023D,
4.500%,
7/01/43
7/32
at
100.00
1,006,291
5,000
North
Dakota
Housing
Finance
Agency,
Home
Mortgage
Finance
Program
Bonds,
Social
Series
2024C,
4.650%,
7/01/44
7/33
at
100.00
5,064,535
1,485
Ward
County
Health
Care,
North
Dakota,
Revenue
Bonds,
Trinity
Obligated
Group,
Series
2017C,
5.000%,
6/01/34
6/28
at
100.00
1,494,046
TOTAL
NORTH
DAKOTA
10,317,591
OHIO
-
1.7%
925
Beachwood
City
School
District,
Cuyahoga
County,
Ohio,
General
Obligation
Bonds, School
Improvement
Series
2023,
4.125%,
12/01/60
6/30
at
100.00
897,578
1,315
Brunswick
City
School
District,
Medina
County,
Ohio,
General
Obligation
Bonds,
Classroom
Facilities
School
Improvement
Series
2023,
5.250%,
12/01/53
-
BAM
Insured
6/31
at
100.00
1,415,642
3,700
(c)
Columbus-Franklin
County
Finance
Authority,
Ohio,
Revenue
Bonds,
Bridge
Park
G
Block
Project,
Public
Infrastructure
Series
2022,
5.000%,
12/01/53
12/29
at
100.00
3,711,242
1,000
Dayton,
Ohio,
Water
System
Revenue
Bonds,
Series
2022,
5.500%,
12/01/42
12/30
at
100.00
1,110,133
2,000
Franklin
County,
Ohio,
Hospital
Facilities
Revenue
Bonds,
OhioHealth
Corporation,
Series
2015,
5.000%,
5/15/35
5/25
at
100.00
2,023,360
Principal
Amount
(000)
Description
(a)
Optional
Call
Provisions
(b)
Value
OHIO
(continued)
$
420
Muskingum
County,
Ohio,
Hospital
Facilities
Revenue
Bonds,
Genesis
HealthCare
System
Obligated
Group
Project,
Series
2013,
5.000%,
2/15/27
9/24
at
100.00
$
420,027
5,000
New
Albany
Plain
Local
Joint
Park
District,
Franklin
and
Licking
Counties,
Ohio,
General
Obligation
Bonds,
Park
Facilities
Series
2023,
5.500%,
12/01/48
-
BAM
Insured
12/32
at
100.00
5,553,549
1,150
Ohio
Air
Quality
Development
Authority,
Ohio,
Pollution
Control
Revenue
Bonds,
FirstEnergy
Generation
Corporation
Project,
Refunding
Series
2009D,
3.375%,
8/01/29
No
Opt.
Call
1,120,289
1,730
Ohio
State,
Hospital
Revenue
Bonds,
Children's
Hospital
Medical
Center
of
Akron,
Series
2024A,
5.250%,
8/14/48
8/34
at
100.00
1,914,544
1,700
Summit
County
Development
Finance
Authority,
Ohio,
Parking
System
Revenue
Bonds,
University
of
Akron
Parking
Project
Series
2023,
5.500%,
12/01/43
12/33
at
100.00
1,856,732
5,000
Washington
County,
Ohio,
Hospital
Facilities
Revenue
Bonds,
Memorial
Health
System
Obligated
Group,
Series
2022,
6.375%,
12/01/37
12/32
at
100.00
5,459,415
635
West
Holmes
Local
School
District,
Ohio,
Certificates
of
Participation,
Series
2023,
5.250%,
12/01/44
-
BAM
Insured
12/31
at
100.00
693,604
TOTAL
OHIO
26,176,115
OKLAHOMA
-
0.5%
Clinton
Public
Works
Authority, Oklahoma,
Educational
Facilities,
Lease
Revenue
Bonds,
Series
2022
:
2,145
5.000%,
10/01/33
10/32
at
100.00
2,318,092
1,925
5.000%,
10/01/35
10/32
at
100.00
2,078,190
2,000
Grand
River
Dam
Authority,
Oklahoma,
Revenue
Bonds,
Refunding
Series
2024A,
5.000%,
6/01/42
6/34
at
100.00
2,242,762
750
Oklahoma
Development
Finance
Authority,
Health
System
Revenue
Bonds,
OU
Medicine
Project,
Taxable
Series
2022,
5.500%,
8/15/37
8/32
at
100.00
795,004
TOTAL
OKLAHOMA
7,434,048
OREGON
-
0.7%
Astoria
Hospital
Facilities
Authority,
Oregon,
Hospital
Revenue
Bonds,
Columbia
Memorial
Hospital
Project,
Series
2024
:
1,625
5.250%,
8/01/41
2/34
at
100.00
1,787,944
1,635
5.250%,
8/01/42
2/34
at
100.00
1,792,800
1,375
5.250%,
8/01/43
2/34
at
100.00
1,500,659
525
(f)
Oregon
Coast
Community
College
District,
Lincoln
County,
Oregon,
General
Obligation
Bonds,
Convertible
Deferred
Interest
Series
2024,
0.000%,
6/15/43,
(WI/DD)
6/34
at
100.00
544,711
Oregon
Facilities
Authority
Charter
School
Revenue
Bonds,
Oregon,
Portland
Village
School
Project,
Series
2024
:
1,600
(c)
6.500%,
12/15/44
12/34
at
100.00
1,619,088
1,300
(c)
6.750%,
12/15/54
12/34
at
100.00
1,308,036
West
Linn,
Oregon,
General
Obligation
Bonds,
Series
2023
:
1,530
4.000%,
6/01/41
6/32
at
100.00
1,548,625
1,465
4.000%,
6/01/43
6/32
at
100.00
1,469,978
TOTAL
OREGON
11,571,841
PENNSYLVANIA
-
2.1%
100
(c)
Allentown
Neighborhood
Improvement
Zone
Development
Authority,
Pennsylvania,
Tax
Revenue
Bonds,
City
Center
Project,
Series
2018,
5.000%,
5/01/33
5/28
at
100.00
102,009
Berks
County
Industrial
Development
Authority,
Pennsylvania,
Health
System
Revenue
Bonds,
Tower
Health
Project,
Series
2017
:
Municipal
Total
Return
Managed
Accounts
Portfolio
(continued)
Portfolio
of
Investments
July
31,
2024
Principal
Amount
(000)
Description
(a)
Optional
Call
Provisions
(b)
Value
PENNSYLVANIA
(continued)
$
50
5.000%,
11/01/37
11/27
at
100.00
$
32,000
160
4.000%,
11/01/47
11/27
at
100.00
102,400
Cumberland
Valley
School
District,
Cumberland
County,
Pennsylvania,
General
Obligation
Bonds,
Series
2023A
:
1,000
5.000%,
11/15/44
-
AGM
Insured
11/32
at
100.00
1,094,016
1,420
5.000%,
11/15/47
-
AGM
Insured
11/32
at
100.00
1,530,684
1,000
Hatboro-Horsham
School
District,
Montgomery
County,
Pennsylvania,
General
Obligation
Bonds,
Series
2023A,
5.250%,
9/15/47
9/31
at
100.00
1,090,188
3,500
Montgomery
County
Higher
Education
and
Health
Authority,
Pennsylvania,
Revenue
Bonds,
Thomas
Jefferson
University,
Series
2018A,
5.000%,
9/01/30
9/28
at
100.00
3,677,546
Pennsylvania
Economic
Development
Financing
Authority,
Pennsylvania,
Private
Activity
Revenue
Bonds,
The
PennDOT
Major
Bridges
Package
One
Project,
Series
2022
:
6,000
5.000%,
6/30/33,
(AMT)
12/32
at
100.00
6,424,163
4,500
5.250%,
6/30/35,
(AMT)
12/32
at
100.00
4,908,607
1,000
Pennsylvania
Economic
Development
Financing
Authority,
Private
Activity
Revenue
Bonds,
Pennsylvania
Rapid
Bridge
Replacement
Project,
Series
2015,
4.125%,
12/31/38,
(AMT)
6/26
at
100.00
959,393
2,500
Pennsylvania
HIgher
Educational
Facilities
Authority,
Revenue
Bonds,
Thomas
Jefferson
University,
Refunding
Series
2015A,
5.250%,
9/01/50
3/25
at
100.00
2,509,039
1,000
Pennsylvania
Housing
Finance
Agency,
Single
Family
Mortgage
Revenue
Bonds,
Social
Series
2023-143A,
4.800%,
4/01/35
4/33
at
100.00
1,060,928
3,000
Pennsylvania
State,
General
Obligation
Bonds,
First
Series
2023,
4.000%,
9/01/42
9/33
at
100.00
3,017,098
2,500
Pennsylvania
Turnpike
Commission,
Turnpike
Revenue
Bonds,
Series
2022B,
5.250%,
12/01/47
12/32
at
100.00
2,745,123
1,845
Philadelphia
Authority
for
Industrial
Development,
Pennsylvania,
Revenue
Bonds,
Thomas
Jefferson
University,
Fixed
Rate
Series
2017A,
5.000%,
9/01/36
3/27
at
100.00
1,896,304
1,215
South
Western
School
District
of
York
County,
Pennsylvania,
General
Obligation
Bonds,
Series
2023,
5.250%,
2/15/50
2/31
at
100.00
1,301,334
TOTAL
PENNSYLVANIA
32,450,832
SOUTH
CAROLINA
-
1.6%
1,150
Aiken
Water
&
Sewer
System,
South
Carolina,
Revenue
Bonds,
Series
2024A,
4.000%,
8/01/49
8/33
at
100.00
1,132,083
750
Horry
County,
South
Carolina,
Limited
Obligation
Bonds,
Hospitality
Fee
&
Local
Accommodations
Fee
Pledge,
Series
2022,
5.000%,
9/01/39
9/32
at
100.00
844,396
3,000
South
Carolina
Housing
Finance
and
Development
Authority,
Multifamily
Housing
Revenue
Bonds,
Edgewood
Place
Apartments
Series
2023A,
4.800%,
7/01/45
No
Opt.
Call
3,082,605
180
(c),(d)
South
Carolina
Jobs-Economic
Development
Authority,
Economic
Development
Revenue
Bonds,
York
Preparatory
Academy
Project,
Series
2014A,
7.000%,
11/01/33,
(Pre-refunded
11/01/24)
11/24
at
100.00
181,529
South
Carolina
Jobs-Economic
Development
Authority,
Health
Care
Facilities
Revenue
Bonds,
Novant
Health
Group,
Series
2024A
:
5,000
5.500%,
11/01/45
5/34
at
100.00
5,707,894
4,000
5.500%,
11/01/46
5/34
at
100.00
4,548,994
3,265
5.500%,
11/01/50
5/34
at
100.00
3,677,671
3,500
South
Carolina
Public
Service
Authority,
Santee
Cooper
Revenue
Obligations,
Refunding
Series
2022B,
4.000%,
12/01/49
6/32
at
100.00
3,317,933
Principal
Amount
(000)
Description
(a)
Optional
Call
Provisions
(b)
Value
SOUTH
CAROLINA
(continued)
$
870
South
Island
Public
Service
District,
South
Carolina,
Waterworks
and
Sewer
System
Revenue
Bonds,
Improvement
Series
2022,
5.250%,
4/01/42
4/32
at
100.00
$
965,518
1,325
Spartanburg
County
School
District
4,
South
Carolina,
General
Obligation
Bonds,
Series
2022A,
5.000%,
3/01/47
3/32
at
100.00
1,439,209
TOTAL
SOUTH
CAROLINA
24,897,832
SOUTH
DAKOTA
-
0.7%
1,555
Baltic
School
District
No.
49-1,
South
Dakota,
General
Obligation
Bonds,
Series
2022,
5.500%,
12/01/51
-
AGM
Insured
12/31
at
100.00
1,693,364
1,960
Brandon,
Minnehaha
County,
South
Dakota,
Water
Surcharge
Revenue
Bonds,
Series
2022,
5.500%,
8/01/47
-
BAM
Insured
8/32
at
100.00
2,192,790
8,000
South
Dakota
Health
and
Educational
Facilities
Authority,
Revenue
Bonds,
Avera
Health,
Refunding
Series
2017,
4.000%,
7/01/42
7/27
at
100.00
7,728,298
TOTAL
SOUTH
DAKOTA
11,614,452
TENNESSEE
-
0.6%
2,050
Chattanooga
Health,
Educational
and
Housing
Facility
Board,
Tennessee,
Revenue
Bonds,
CommonSpirit
Health,
Series
2019A-2,
5.000%,
8/01/49
8/29
at
100.00
2,119,500
1,400
Knox
County
Health,
Educational
and
Housing
Facilities
Board,
Tennessee,
Revenue
Bonds,
University
Health
System,
Inc.,
Series
2017,
5.000%,
4/01/27
No
Opt.
Call
1,439,078
Knox
County
Health,
Educational,
and
Housing
Facilities
Board,
Revenue
Bonds,
Provident
Group
-
UTK
Properties
LLC
-
University
of
Tennessee
Project,
Student
Housing
Series
2024A-1
:
685
5.000%,
7/01/43
-
BAM
Insured
7/33
at
100.00
738,596
665
5.000%,
7/01/44
-
BAM
Insured
7/33
at
100.00
714,617
Metropolitan
Nashville
Airport
Authority,
Tennessee,
Airport
Improvement
Revenue
Bonds,
Series
2022A
:
1,100
5.250%,
7/01/34,
(AMT)
7/32
at
100.00
1,220,629
1,300
5.500%,
7/01/37,
(AMT)
7/32
at
100.00
1,474,165
2,160
Tennessee
State
School
Bond
Authority,
Higher
Educational
Facilities
Second
Program
Bonds,
Series
2022A,
5.000%,
11/01/47
11/32
at
100.00
2,348,652
TOTAL
TENNESSEE
10,055,237
TEXAS
-
6.4%
500
Arlington
Higher
Education
Finance
Corporation,
Texas,
Education
Revenue
Bonds,
Great
Hearts
America
-
Texas,
Series
2024A,
5.000%,
8/15/49
8/27
at
100.00
501,242
685
(c)
Arlington
Higher
Education
Finance
Corporation,
Texas,
Education
Revenue
Bonds,
Legacy
Traditional
Schools
-
Texas
Project,
Refunding
Series
2022A,
6.000%,
2/15/42
2/30
at
100.00
684,978
645
Arlington
Higher
Education
Finance
Corporation,
Texas,
Education
Revenue
Bonds,
Uplift
Education,
Series
2016A,
5.000%,
12/01/51
12/26
at
100.00
645,297
500
Austin
Independent
School
District,
Travis
County,
Texas,
General
Obligation
Bonds,
School
Building
Series
2023,
4.000%,
8/01/48
2/33
at
100.00
484,789
4,300
Austin
Independent
School
District,
Travis
County,
Texas,
General
Obligation
Bonds,
School
Building
Series
2024,
5.250%,
8/01/49
8/34
at
100.00
4,818,432
4,300
Austin,
Texas,
Water
and
Wastewater
System
Revenue
Bonds,
Refunding
Forward
Delivery
Series
2023,
5.000%,
11/15/42
5/33
at
100.00
4,754,049
360
(d)
Central
Texas
Regional
Mobility
Authority,
Revenue
Bonds,
Senior
Lien,
Series
2015A,
5.000%,
1/01/35,
(Pre-refunded
7/01/25)
7/25
at
100.00
366,715
Municipal
Total
Return
Managed
Accounts
Portfolio
(continued)
Portfolio
of
Investments
July
31,
2024
Principal
Amount
(000)
Description
(a)
Optional
Call
Provisions
(b)
Value
TEXAS
(continued)
$
550
(c)
City
of
Midlothian,
Texas,
Westside
Preserve
Public
Improvement
District
Improvement
Area
#1
Project,
Special
Assessment
Revenue
Bonds,
Series
2022,
5.250%,
9/15/42
9/32
at
100.00
$
545,133
3,000
Collin
County,
Texas,
General
Obligation
Bonds,
Limited
Tax
Permanent
Improvement
Series
2023,
5.000%,
2/15/40
2/33
at
100.00
3,340,255
3,740
Dallas
Area
Rapid
Transit,
Texas,
Sales
Tax
Revenue
Bonds,
Refunding
&
Improvement
Senior
Lien
Series
2021B,
4.000%,
12/01/51
12/30
at
100.00
3,578,234
3,055
Dallas
Fort
Worth
International
Airport,
Texas,
Joint
Revenue
Bonds,
Refunding
Series
2022B,
5.000%,
11/01/40
11/32
at
100.00
3,391,864
Decatur
Hospital
Authority,
Texas,
Revenue
Bonds,
Wise
Regional
Health
System,
Series
2021B
:
70
(d)
5.000%,
9/01/24,
(ETM)
No
Opt.
Call
70,090
75
(d)
5.000%,
9/01/25,
(ETM)
No
Opt.
Call
76,364
276
(d)
Decatur
Hospital
Authority,
Texas,
Revenue
Bonds,
Wise
Regional
Health
System,
Series
2021C,
4.000%,
9/01/44,
(Pre-refunded
9/01/31)
9/31
at
100.00
291,365
Galveston,
Texas,
Wharves
and
Terminal
First
Lien
Revenue
Bonds,
Series
2024A
:
650
5.500%,
8/01/40,
(AMT),
(WI/DD)
8/33
at
100.00
715,512
600
5.500%,
8/01/41,
(AMT),
(WI/DD)
8/33
at
100.00
656,684
Hackberry,
Texas,
Combination
Special
Assessment
and
Contract
Revenue
Road
and
Utility
Bonds,
Hidden
Cove
Improvement
District
2,
Series
2017
:
1,230
4.500%,
9/01/32
9/27
at
100.00
1,215,147
955
4.500%,
9/01/32
9/27
at
100.00
943,468
5,000
Harris
County
Cultural
Education
Facilities
Finance
Corporation,
Texas,
Hospital
Revenue
Bonds,
Memorial
Hermann
Health
System,
Series
2022A,
5.000%,
7/01/52
7/32
at
100.00
5,251,560
1,250
Harris
County
Flood
Control
District,
Texas,
General
Obligation
Bonds,
Refunding
Improvement, Sustainability
Green
Series
2022A,
5.250%,
10/01/40
10/32
at
100.00
1,412,595
2,255
Highland
Park
Independent
School
District,
Potter
County,
Texas,
General
Obligation
Bonds,
School
Building
Series
2023,
5.250%,
2/15/41
2/33
at
100.00
2,552,955
5,000
Houston,
Texas,
Airport
System
Revenue
Bonds,
Refunding
Subordinate
Lien
Series
2023A,
5.250%,
7/01/41
-
AGM
Insured,
(AMT)
7/33
at
100.00
5,495,203
1,200
Irving
Independent
School
District,
Dallas
County,
Texas,
General
Obligation
Bonds,
School
Building
Series
2023,
5.000%,
2/15/41
8/32
at
100.00
1,334,931
1,400
Kerrville
Health
Facilities
Development
Corporation,
Texas,
Revenue
Bonds,
Sid
Peterson
Memorial
Hospital
Project,
Series
2015,
5.000%,
8/15/35
8/25
at
100.00
1,410,159
1,500
Love
Field
Airport
Modernization
Corporation,
Texas,
General
Airport
Revenue
Bonds,
Refunding
Series
2021,
5.000%,
11/01/29,
(AMT)
No
Opt.
Call
1,597,946
1,500
(c)
Mission
Economic
Development
Corporation,
Texas,
Revenue
Bonds,
Natgasoline
Project,
Senior
Lien
Series
2018,
4.625%,
10/01/31,
(AMT)
8/24
at
103.00
1,498,553
1,060
Montgomery
County
Toll
Road
Authority,
Texas,
Toll
Road
Revenue
Bonds,
Senior
Lien
Series
2018,
5.000%,
9/15/31
9/25
at
100.00
1,073,355
585
New
Hope
Cultural
Education
Facilities
Finance
Corporation,
Texas,
Capital
Improvement
Revenue
Bonds,
CHF-Collegiate
Housing
Denton,
LLC
-
Texas
Woman's
University
Housing
Project,
Series
2018A-1,
5.000%,
7/01/38
-
AGM
Insured
7/27
at
100.00
603,752
New
Hope
Cultural
Education
Facilities
Finance
Corporation,
Texas,
Student
Housing
Revenue
Bonds,
NCCD
-
College
Station
Properties
LLC
-
Texas
A&M
University
Project, Series
2015A
:
750
(e)
5.000%,
7/01/30
7/25
at
100.00
729,375
1,500
(e)
5.000%,
7/01/33
No
Opt.
Call
1,268,996
Principal
Amount
(000)
Description
(a)
Optional
Call
Provisions
(b)
Value
TEXAS
(continued)
$
1,270
Reagan
Hospital
District
of
Reagan
County,
Texas,
Limited
Tax
Revenue
Bonds,
Series
2014A,
5.000%,
2/01/29
9/24
at
100.00
$
1,267,086
165
(d)
Red
River
Health
Facilities
Development
Corporation,
Texas,
Retirement
Facility
Revenue
Bonds,
MRC
Crossings
Project,
Series
2014A,
6.750%,
11/15/24,
(ETM)
No
Opt.
Call
166,557
5,455
San
Antonio,
Texas,
Electric
and
Gas
System
Revenue
Bonds,
Refunding
Series
2017,
5.000%,
2/01/42
2/27
at
100.00
5,618,154
2,185
Tarrant
County
Cultural
Education
Facilities
Finance
Corporation,
Texas,
Hospital
Revenue
Bonds,
Scott
&
White
Healthcare
Project,
Series
2022D,
5.500%,
11/15/47
11/32
at
100.00
2,423,907
3,850
Tarrant
County
Cultural
Education
Facilities
Finance
Corporation,
Texas,
Retirement
Facility
Revenue
Bonds,
Buckner
Senior
Living
Ventana
Project,
Series
2017A,
6.625%,
11/15/37
5/27
at
100.00
4,038,180
6,000
Tarrant
County
Cultural
Education
Facilities
Finance
Corporation,
Texas,
Revenue
Bonds,
Texas
Health
Resources
System,
Series
2016A,
5.000%,
2/15/47
8/26
at
100.00
6,094,897
2,250
Tarrant
County
Hospital
District,
Texas,
General
Obligation
Bonds,
Limited
Tax
Series
2023,
5.250%,
8/15/40
8/32
at
100.00
2,479,803
Texas
Department
of
Housing
and
Community
Affairs,
Single
Family
Mortgage
Revenue
Bonds,
Series
2022B
:
5,000
5.250%,
9/01/52
3/32
at
100.00
5,226,101
5,820
6.000%,
3/01/53
3/32
at
104.76
6,330,640
2,700
Texas
Private
Activity
Bond
Surface
Transpiration
Corporation,
Senior
Lien
Revenue
Bonds,
NTE
Mobility
Partners
Segments
3
LLC
Refunding
Series
2023,
5.250%,
12/31/36,
(AMT)
6/28
at
103.00
2,925,327
2,450
Texas
Private
Activity
Bond
Surface
Transportation
Corporation,
Senior
Lien
Revenue
Bonds,
LBJ
Infrastructure
Group
LLC
IH-635
Managed
Lanes
Project,
Refunding Series
2020A,
4.000%,
12/31/32
12/30
at
100.00
2,496,702
500
Texas
Public
Finance
Authority,
Revenue
Bonds,
Texas
Southern
University
Financing
System
Series
2023,
5.250%,
5/01/38
-
BAM
Insured
5/33
at
100.00
545,573
2,000
Texas
State
Technical
College
System,
Financing
System
Revenue
Bonds,
Improvement
Series
2022A,
6.000%,
8/01/54
-
AGM
Insured
8/32
at
100.00
2,280,915
3,150
Texas
Transportation
Commission,
Central
Texas
Turnpike
System
Revenue
Bonds,
Refunding
Second
Tier
Series
2015C,
5.000%,
8/15/42
11/24
at
100.00
3,164,527
400
(c)
Town
of
Lakewood
Village,
Texas,
Lakewood
Village
Public
Improvement
District
Improvement
District
No.
1
Project,
Special
Assessment
Revenue
Bonds,
Series
2022,
5.250%,
9/15/42
9/32
at
100.00
396,002
1,645
Uptown
Development
Authority,
Houston,
Texas,
Tax
Increment
Contract
Revenue
Bonds,
Infrastructure
Improvement
Facilities,
Series
2017A,
5.000%,
9/01/39
9/26
at
100.00
1,656,930
1,240
Viridian
Municipal
Management
District,
Texas,
Revenue
Bonds,
Road
Improvement
Series
2023,
5.000%,
12/01/38
-
AGM
Insured
12/29
at
100.00
1,311,442
TOTAL
TEXAS
99,731,741
UTAH
-
3.8%
265
(c)
Black
Desert
Public
Infrastructure
District,
Washington
County,
Utah,
Special
Assessment
Bonds,
Black
Desert
Assessment
Area
1,
Series
2024,
5.625%,
12/01/53
6/29
at
103.00
273,992
355
(c)
Firefly
Public
Infrastructure
District
1,
Utah,
Limited
Tax
General
Obligation
Bonds,
Series
2024A-1,
5.625%,
12/01/43
6/29
at
103.00
367,673
5,995
Herber
Light
and
Power
Company,
Utah,
Electric
Revenue
Bonds,
Series
2023,
5.000%,
12/15/47
-
BAM
Insured
12/32
at
100.00
6,385,286
Municipal
Total
Return
Managed
Accounts
Portfolio
(continued)
Portfolio
of
Investments
July
31,
2024
Principal
Amount
(000)
Description
(a)
Optional
Call
Provisions
(b)
Value
UTAH
(continued)
Intermountain
Power
Agency,
Utah,
Power
Supply
Revenue
Bonds,
Series
2022A
:
$
4,000
5.000%,
7/01/39
7/31
at
100.00
$
4,431,947
5,000
5.000%,
7/01/40
7/31
at
100.00
5,507,100
5,925
Jordan
Valley
Water
Conservancy
District,
Utah,
Water
Revenue
Bonds,
Series
2024A,
5.000%,
10/01/54
10/31
at
100.00
6,326,309
1,275
(c)
Jordanelle
Ridge
Public
Infrastructure
District
2,
Utah,
General
Obligation
Bonds,
Limited
Tax
Series
2023A,
7.750%,
3/01/54
12/28
at
103.00
1,296,793
Lehi
Local
Building
Authority,
Utah,
Lease
Revenue
Bonds,
Series
2022
:
4,490
5.250%,
6/15/47
6/32
at
100.00
4,828,003
4,060
5.500%,
6/15/49
6/32
at
100.00
4,425,186
1,955
(c)
MIDA
Military
Installation
Development
Authority
Golf
and
Equestrian
Center
Public
Infrastructure
District,
Utah,
Limited
Tax
and
Tax
Allocation
Revenue
Bonds,
Series
2021,
4.500%,
6/01/51
12/26
at
103.00
1,556,764
1,375
Ogden
City
Municipal
Building
Authority,
Utah,
Lease
Revenue
Bonds,
Series
2023A,
5.000%,
1/15/48
1/33
at
100.00
1,472,491
1,875
Salt
Lake
City,
Utah,
Airport
Revenue
Bonds,
International
Airport
Series
2017A,
5.000%,
7/01/34,
(AMT)
7/27
at
100.00
1,927,503
2,000
Salt
Lake
City,
Utah,
Airport
Revenue
Bonds,
International
Airport
Series
2018A,
5.000%,
7/01/30,
(AMT)
7/28
at
100.00
2,089,606
1,715
Salt
Lake
City,
Utah,
Airport
Revenue
Bonds,
International
Airport
Series
2023A,
5.250%,
7/01/43,
(AMT)
7/33
at
100.00
1,854,354
5,000
University
of
Utah,
General
Revenue
Bonds,
Green
Series
2022B,
5.000%,
8/01/41
8/32
at
100.00
5,566,183
145
Utah
Charter
School
Finance
Authority,
Charter
School
Revenue
Bonds,
Bridge
Elementary
Project,
Series
2021A,
4.000%,
6/15/41
6/28
at
103.00
117,683
1,190
Utah
Telecommunication
Open
Infrastructure
Agency,
Utah,
Revenue
Bonds,
Refunding
Sales
Tax
and
Telecommunication
Series
2022,
5.500%,
6/01/40
6/32
at
100.00
1,345,926
8,820
Wasatch
County
School
District
Local
Building
Authority,
Utah,
Lease
Revenue
Bonds,
Board
of
Education
Series
2022,
5.500%,
6/01/47
6/32
at
100.00
9,709,448
TOTAL
UTAH
59,482,247
VERMONT
-
1.0%
12,000
University
of
Vermont
and
State
Agricultural
College,
General
Obligation
Bonds,
Series
2015,
5.000%,
10/01/40
10/25
at
100.00
12,186,988
Vermont
Educational
and
Health
Buildings
Financing
Agency,
Revenue
Bonds,
University
of
Vermont
Medical
Center
Project,
Green
Series
2016B
:
1,270
5.000%,
12/01/37
6/26
at
100.00
1,291,450
1,500
5.000%,
12/01/38
6/26
at
100.00
1,522,484
TOTAL
VERMONT
15,000,922
VIRGIN
ISLANDS
-
0.1%
1,540
Matching
Fund
Special
Purpose
Securitization
Corporation,
Virgin
Islands,
Revenue
Bonds,
Series
2022A,
5.000%,
10/01/32
No
Opt.
Call
1,631,346
TOTAL
VIRGIN
ISLANDS
1,631,346
VIRGINIA
-
2.2%
8,350
Chesapeake
Bay
Bridge
and
Tunnel
District,
Virginia,
General
Resolution
Revenue
Bonds,
First
Tier
Series
2016,
5.000%,
7/01/46
7/26
at
100.00
8,423,792
1,400
Fredericksburg
Economic
Development
Authority,
Virginia,
Revenue
Bonds,Mary
Washington
Healthcare
Obligated
Group,
Refunding
Series
2014,
5.000%,
6/15/33
8/24
at
100.00
1,400,495
Principal
Amount
(000)
Description
(a)
Optional
Call
Provisions
(b)
Value
VIRGINIA
(continued)
$
3,000
Front
Royal
and
Warren
County
Industrial
Development
Authority,
Virginia,
Hospital
Revenue
Bonds,
Valley
Health
System
Obligated
Group,
Series
2018,
4.000%,
1/01/50
1/25
at
103.00
$
2,868,485
James
City
County
Economic
Development
Authority,
Virginia,
Residential
Care
Facility
Revenue
Bonds,
Williamsburg
Landing
Inc.,
Series
2024A
:
415
6.750%,
12/01/53
12/30
at
103.00
456,864
350
6.875%,
12/01/58
12/30
at
103.00
386,435
5,000
Norfolk
Economic
Development
Authority,
Virginia,
Hospital
Facility
Revenue
Bonds,
Sentara
Healthcare
Systems,
Refunding
Series
2018B,
4.000%,
11/01/48
11/28
at
100.00
4,786,550
2,200
Virginia
Beach
Development
Authority,
Virginia,
Residential
Care
Facility
Revenue
Bonds,
Westminster
Canterbury
on
Chesapeake
Bay,
Series
2023A,
6.500%,
9/01/43
9/30
at
103.00
2,503,685
5,875
Virginia
College
Building
Authority,
Educational
Facilities
Revenue
Bonds,
21st
Century
College
&
Equipment
Programs,
Series
2024A,
4.000%,
2/01/40
2/34
at
100.00
6,005,107
815
Virginia
College
Building
Authority,
Educational
Facilities
Revenue
Bonds,
Washington
and
Lee
University,
Series
2001,
5.750%,
1/01/34
No
Opt.
Call
995,168
1,750
Virginia
Small
Business
Financing
Authority,
Private
Activity
Revenue
Bonds,
Transform
66
P3
Project,
Senior
Lien
Series
2017,
5.000%,
12/31/47,
(AMT)
6/27
at
100.00
1,779,313
Virginia
Small
Business
Financing
Authority,
Revenue
Bonds,
95
Express
Lanes
LLC
Project,
Refunding
Senior
Lien
Series
2022
:
500
5.000%,
1/01/38,
(AMT)
1/32
at
100.00
528,908
300
5.000%,
6/30/38,
(AMT)
12/32
at
100.00
323,985
Virginia
Small
Business
Financing
Authority,
Revenue
Bonds,
Elizabeth
River
Crossing
OPCO,
LLC
Project,
Refunding
Senior
Lien
Series
2022
:
1,365
4.000%,
1/01/31,
(AMT)
No
Opt.
Call
1,360,975
1,300
4.000%,
1/01/32,
(AMT)
No
Opt.
Call
1,294,838
650
Williamsburg
Economic
Development
Authority,
Virginia,
Student
Housing
Revenue
Bonds,
Provident
Group
-
Williamsburg
Properties
LLC
-
William
and
Mary
Project
Series
2023A,
5.250%,
7/01/53
-
AGM
Insured
7/33
at
100.00
709,590
TOTAL
VIRGINIA
33,824,190
WASHINGTON
-
3.0%
2,500
Grant
County
Public
Hospital
District
2,
Washington,
General
Obligation
Bonds,
Quincy
Valley
Medical
Center,
Series
2023,
5.000%,
12/01/38
12/32
at
100.00
2,599,055
5,000
Jefferson
County
Public
Hospital
District
2,
Washington,
Hospital
Revenue
Bonds,
Refunding
Series
2023A,
6.875%,
12/01/53
12/30
at
103.00
5,067,628
King
County
Public
Hospital
District
2,
Washington,
General
Obligation
Bonds,
EvergreenHealth,
Limited
Tax
Series
2024
:
1,930
5.000%,
12/01/42
12/33
at
100.00
2,080,698
2,765
5.250%,
12/01/45
12/33
at
100.00
3,012,621
10,270
King
County,
Washington,
Sewer
Revenue
Bonds,
Refunding
Series
2016A,
4.000%,
7/01/40
1/26
at
100.00
10,213,114
4,000
Kitsap
County
School
District
100C
Bremerton,
Washington,
General
Obligation
Bonds,
Series
2024,
5.250%,
12/01/47
6/34
at
100.00
4,466,337
700
Skagit
County
Public
Hospital
District
1,
Washington,
Revenue
Bonds,
Skagit
Regional
Health,
Series
2024,
5.500%,
12/01/41
12/33
at
100.00
759,909
3,855
Washington
Health
Care
Facilities
Authority,
Revenue
Bonds,
Central
Washington
Health
Services
Association,
Refunding
Series
2015,
5.000%,
7/01/39
7/25
at
100.00
3,865,336
9,885
Washington
Health
Care
Facilities
Authority,
Revenue
Bonds,
Seattle
Children's
Hospital,
Series
2015B,
5.000%,
10/01/38
4/25
at
100.00
9,953,828
Municipal
Total
Return
Managed
Accounts
Portfolio
(continued)
Portfolio
of
Investments
July
31,
2024
Principal
Amount
(000)
Description
(a)
Optional
Call
Provisions
(b)
Value
WASHINGTON
(continued)
Washington
Health
Care
Facilities
Authority,
Revenue
Bonds,
Virginia
Mason
Medical
Center,
Series
2017
:
$
675
5.000%,
8/15/25
No
Opt.
Call
$
681,879
1,300
5.000%,
8/15/29
8/27
at
100.00
1,333,467
700
4.000%,
8/15/42
8/27
at
100.00
619,122
2,550
(c),(d)
Washington
State
Housing
Finance
Commission,
Non-Profit
Housing
Revenue
Bonds,
Herons
Key
Senior
Living,
Series
2015A,
7.000%,
7/01/50,
(Pre-refunded
7/01/25)
7/25
at
100.00
2,624,809
TOTAL
WASHINGTON
47,277,803
WEST
VIRGINIA
-
0.3%
3,250
West
Virginia
Hospital
Finance
Authority,
Hospital
Revenue
Bonds,
Cabell
Huntington
Hospital,
Inc.
Project,
Refunding
&
Improvement
Series
2018A,
5.000%,
1/01/43
1/29
at
100.00
3,301,311
1,250
West
Virginia
Water
Development
Authority,
Infrastructure
Excess
Lottery
Revenue
Bonds,
Chesapeake
Bay/Greenbrier
River
Projects,
Series
2014A,
5.000%,
7/01/34
9/24
at
100.00
1,251,102
TOTAL
WEST
VIRGINIA
4,552,413
WISCONSIN
-
1.3%
1,000
Public
Finance
Authority
of
Wisconsin,
Project
Revenue
Bonds,
CFP3
-
Eastern
Michigan
University
Student
Housing
Project,
Series
2022A-1,
5.250%,
7/01/36
-
BAM
Insured
7/32
at
100.00
1,121,755
1,775
(c)
Public
Finance
Authority,
Wisconsin,
Educational
Revenue
Bonds,
Lake
Norman
Charter
School,
Series
2018A,
5.000%,
6/15/38
6/26
at
100.00
1,786,747
7,315
(c)
Public
Finance
Authority,
Wisconsin,
Tax
Increment,
Revenue
Senior
Bonds,
Miami,
Miami
World
Center
Project,
Series
2024A,
5.000%,
6/01/41
6/29
at
103.00
7,421,687
1,875
Wisconsin
Health
and
Educational
Facilities
Authority,
Revenue
Bonds,
Bellin
Memorial
Hospital
Incorporated
Series
2022A,
5.500%,
12/01/52
12/32
at
100.00
2,052,658
1,935
Wisconsin
Health
and
Educational
Facilities
Authority,
Revenue
Bonds,
Bellin
Memorial
Hospital
Incorporated
Series
2022B,
5.250%,
12/01/48
12/32
at
100.00
2,042,811
1,500
Wisconsin
Health
and
Educational
Facilities
Authority,
Revenue
Bonds,
Marshfield
Clinic
Health
System,
Inc.,
Series
2017C,
5.000%,
2/15/47
2/27
at
100.00
1,501,869
2,410
Wisconsin
Health
and
Educational
Facilities
Authority,
Revenue
Bonds,
Marshfield
Clinic,
Series
2016B,
5.000%,
2/15/34
2/26
at
100.00
2,438,366
1,415
Wisconsin
Health
and
Educational
Facilities
Authority,
Wisconsin,
Revenue
Bonds,
Three
Pillars
Senior
Living
Communities,
Series
2024A,
5.250%,
8/15/39
8/34
at
100.00
1,510,548
TOTAL
WISCONSIN
19,876,441
WYOMING
-
0.3%
3,195
University
of
Wyoming,
Facilities
Revenue
Bonds,
Series
2021C,
4.000%,
6/01/51
-
AGM
Insured
6/31
at
100.00
3,080,430
1,000
(d)
Wyoming
Municipal
Power
Agency,
Power
Supply
System
Revenue
Bonds,
Refunding
Series
2017A,
5.000%,
1/01/34,
(Pre-refunded
1/01/27)
-
BAM
Insured
1/27
at
100.00
1,050,581
TOTAL
WYOMING
4,131,011
TOTAL
MUNICIPAL
BONDS
(cost
$1,506,574,726)
1,526,013,970
TOTAL
LONG-TERM
INVESTMENTS
(cost
$1,506,574,726)
1,526,013,970
Principal
Amount
(000)
Description
(a)
Optional
Call
Provisions
(b)
Value
SHORT-TERM
INVESTMENTS
-
0.7%
X
–
MUNICIPAL
BONDS
-
0
.7
%
X
11,385,000
COLORADO
-
0.1%
$
1,395
(g)
Colorado
Springs,
Colorado,
Utilities
System
Revenue
Bonds,
Variable
Rate
Demand
Subordinate
Lien
Improvement
Series
2006B,
3.560%,
11/01/36
8/24
at
100.00
$
1,395,000
TOTAL
COLORADO
1,395,000
INDIANA
-
0.3%
5,000
(g)
Purdue
University,
Indiana,
University
Revenue
Bonds,
Student
Facility
System
Series
2004A,
3.500%,
7/01/33
8/24
at
100.00
5,000,000
TOTAL
INDIANA
5,000,000
NEW
YORK
-
0.1%
1,325
(g)
Battery
Park
City
Authority,
New
York,
Revenue
Bonds,
Adjustable
Rate
Junior
Series
2019D-2,
3.600%,
11/01/38
8/24
at
100.00
1,325,000
TOTAL
NEW
YORK
1,325,000
WASHINGTON
-
0.2%
3,665
(g)
King
County,
Washington,
General
Obligation
Bonds,
Payable
from
Sewer
Revenues,
Refunding
Multi-Modal
Limited
Tax
Series
2019A,
3.950%,
1/01/46
8/24
at
100.00
3,665,000
TOTAL
WASHINGTON
3,665,000
TOTAL
MUNICIPAL
BONDS
(cost
$11,385,000)
11,385,000
TOTAL
SHORT-TERM
INVESTMENTS
(cost
$11,385,000)
11,385,000
TOTAL
INVESTMENTS
(cost
$
1,517,959,726
)
-
98
.2
%
1,537,398,970
OTHER
ASSETS
&
LIABILITIES,
NET
- 1.8%
28,152,517
NET
ASSETS
-
100%
$
1,565,551,487
(a)
All
percentages
shown
in
the
Portfolio
of
Investments
are
based
on
net
assets.
(b)
Optional
Call
Provisions:
Dates
(month
and
year)
and
prices
of
the
earliest
optional
call
or
redemption.
There
may
be
other
call
provisions
at
varying
prices
at
later
dates.
Certain
mortgage-backed
securities
may
be
subject
to
periodic
principal
paydowns.
Optional
Call
Provisions
are
not
covered
by
the
report
of
independent
registered
public
accounting
firm.
(c)
Security
is
exempt
from
registration
under
Rule
144A
of
the
Securities
Act
of
1933,
as
amended.
These
securities
are
deemed
liquid
and
may
be
resold
in
transactions
exempt
from
registration,
which
are
normally
those
transactions
with
qualified
institutional
buyers.
As
of
the
end
of
the
reporting
period,
the
aggregate
value
of
these
securities
is
$109,812,685
or
7.1%
of
Total
Investments.
(d)
Backed
by
an
escrow
or
trust
containing
sufficient
U.S.
Government
or
U.S.
Government
agency
securities,
which
ensure
the
timely
payment
of
principal
and
interest.
(e)
Defaulted
security.
A
security
whose
issuer
has
failed
to
fully
pay
principal
and/or
interest
when
due,
or
is
under
the
protection
of
bankruptcy.
(f)
Step-up
coupon
bond,
a
bond
with
a
coupon
that
increases
("steps
up"),
usually
at
regular
intervals,
while
the
bond
is
outstanding.
The
rate
shown
is
the
coupon
as
of
the
end
of
the
reporting
period.
(g)
Investment
has
a
maturity
of
greater
than
one
year,
but
has
variable
rate
and/or
demand
features
which
qualify
it
as
a
short-term
investment.
The
rate
disclosed,
as
well
as
the
reference
rate
and
spread,
where
applicable,
is
that
in
effect
as
of
the
end
of
the
reporting
period.
This
rate
changes
periodically
based
on
market
conditions
or
a
specified
market
index.
AMT
Alternative
Minimum
Tax
ETM
Escrowed
to
maturity
WI/DD
When-issued
or
delayed
delivery
security.
See
Notes
to
Financial
Statements
Nuveen
Core
Impact
Bond
Managed
Accounts
Portfolio
Portfolio
of
Investments
July
31,
2024
Principal
Amount
(000)
Description
(a)
Coupon
Maturity
Value
LONG-TERM
INVESTMENTS
-
99.7%
X
–
CORPORATE
BONDS
-
52
.8
%
X
4,680,488
AUTOMOBILES
&
COMPONENTS
-
0.9%
$
100
Ford
Motor
Co
3.250%
2/12/32
$
83,943
TOTAL
AUTOMOBILES
&
COMPONENTS
83,943
BANKS
-
3.3%
300
European
Investment
Bank
3.750%
2/14/33
291,681
TOTAL
BANKS
291,681
COMMERCIAL
&
PROFESSIONAL
SERVICES
-
1.8%
250
Rockefeller
Foundation/The
2.492%
10/01/50
160,243
TOTAL
COMMERCIAL
&
PROFESSIONAL
SERVICES
160,243
CONSUMER
SERVICES
-
2.9%
100
Massachusetts
Higher
Education
Assistance
Corp
2.673%
7/01/31
84,666
200
Starbucks
Corp
4.450%
8/15/49
168,038
TOTAL
CONSUMER
SERVICES
252,704
CONSUMER
STAPLES
DISTRIBUTION
&
RETAIL
-
1.9%
225
(b)
Alimentation
Couche-Tard
Inc
3.625%
5/13/51
166,010
TOTAL
CONSUMER
STAPLES
DISTRIBUTION
&
RETAIL
166,010
ENERGY
-
0.8%
100
TotalEnergies
Capital
International
SA
3.127%
5/29/50
69,701
TOTAL
ENERGY
69,701
FINANCIAL
SERVICES
-
11.4%
200
(b)
HA
Sustainable
Infrastructure
Capital
Inc
6.375%
7/01/34
198,268
125
(b)
HAT
Holdings
I
LLC
/
HAT
Holdings
II
LLC
3.750%
9/15/30
109,716
100
Kreditanstalt
fuer
Wiederaufbau
4.375%
2/28/34
101,991
45
Low
Income
Investment
Fund
3.386%
7/01/26
43,298
50
NHP
Foundation/The
6.000%
12/01/33
53,116
250
(b)
WLB
Asset
II
B
Pte
Ltd
3.950%
12/10/24
238,598
250
(b)
WLB
Asset
VI
Pte
Ltd
7.250%
12/21/27
262,350
TOTAL
FINANCIAL
SERVICES
1,007,337
FOOD,
BEVERAGE
&
TOBACCO
-
1.9%
250
PepsiCo
Inc
2.875%
10/15/49
172,297
TOTAL
FOOD,
BEVERAGE
&
TOBACCO
172,297
MATERIALS
-
4.0%
350
Air
Products
and
Chemicals
Inc
4.800%
3/03/33
352,175
TOTAL
MATERIALS
352,175
SEMICONDUCTORS
&
SEMICONDUCTOR
EQUIPMENT
-
2.6%
250
NXP
BV
/
NXP
Funding
LLC
/
NXP
USA
Inc
3.400%
5/01/30
231,567
TOTAL
SEMICONDUCTORS
&
SEMICONDUCTOR
EQUIPMENT
231,567
TELECOMMUNICATION
SERVICES
-
2.0%
250
Verizon
Communications
Inc
2.850%
9/03/41
179,940
TOTAL
TELECOMMUNICATION
SERVICES
179,940
Principal
Amount
(000)
Description
(a)
Coupon
Maturity
Value
UTILITIES
-
19.3%
$
200
Duke
Energy
Progress
LLC
4.000%
4/01/52
$
157,004
250
MidAmerican
Energy
Co
3.150%
4/15/50
173,095
250
PG&E
Recovery
Funding
LLC
,
(WI/DD)
5.231%
6/01/42
255,132
100
Public
Service
Co
of
Oklahoma
2.200%
8/15/31
82,972
100
Public
Service
Electric
and
Gas
Co
5.125%
3/15/53
97,048
150
(b)
RWE
Finance
US
LLC
5.875%
4/16/34
154,456
200
Southern
California
Edison
Co
3.650%
6/01/51
145,934
200
Southwestern
Electric
Power
Co
3.250%
11/01/51
131,029
150
Southwestern
Public
Service
Co
3.150%
5/01/50
98,822
189
(b)
Sweihan
PV
Power
Co
PJSC2022
1
3.625%
1/31/49
152,748
122
(b)
Topaz
Solar
Farms
LLC
5.750%
9/30/39
118,905
172
(b)
UEP
Penonome
II
SA2020
1
6.500%
10/01/38
145,745
TOTAL
UTILITIES
1,712,890
TOTAL
CORPORATE
BONDS
(cost
$5,381,356)
4,680,488
Principal
Amount
(000)
Description
(a)
Coupon
Maturity
Value
X
–
MORTGAGE-BACKED
SECURITIES
-
17.1%
X
1,519,141
$
1
Banc
of
America
Mortgage
2004-K
Trust,
2004
K
5.178%
12/25/34
$
1,159
125
(b),(c)
BFLD
Trust
2020-EYP,
(TSFR1M
reference
rate
+
2.214%
spread),
2020
EYP
7.543%
10/15/35
23,650
200
(b)
Century
Plaza
Towers
2019-CPT,
2019
CPT
2.997%
11/13/39
145,638
100
(b)
DBUBS
2017-BRBK
Mortgage
Trust,
2017
BRBK
3.452%
10/10/34
96,912
6
Fannie
Mae
Pool,
FN
MA4518
3.000%
1/01/37
5,975
6
Fannie
Mae
Pool,
FN
MA4709
5.000%
7/01/52
5,842
9
Fannie
Mae
Pool,
FN
FS0522
2.500%
2/01/52
7,802
4
Fannie
Mae
Pool,
FN
CA6414
3.000%
7/01/50
3,470
21
Fannie
Mae
Pool,
FN
MA4785
5.000%
10/01/52
21,231
2
Fannie
Mae
Pool,
FN
BU8837
5.000%
5/01/52
2,428
2
Fannie
Mae
Pool,
FN
BT0267
3.000%
9/01/51
2,125
46
Fannie
Mae
Pool,
FN
MA4732
4.000%
9/01/52
43,040
2
Fannie
Mae
Pool,
FN
FS1535
3.000%
4/01/52
1,482
1
Fannie
Mae
Pool,
FN
MA4805,
2022
1
4.500%
11/01/52
872
1
Fannie
Mae
Pool,
FN
MA4761
5.000%
9/01/52
849
35
Fannie
Mae
Pool,
FN
MA4733
4.500%
9/01/52
34,179
6
Freddie
Mac
Gold
Pool,
FG
G08760
3.000%
4/01/47
5,710
132
Freddie
Mac
Multifamily
Structured
Pass
Through
Certificates,
2020
Q014
1.555%
1/25/36
107,816
5
Freddie
Mac
Pool,
FR
SD8220
3.000%
6/01/52
3,918
4
Freddie
Mac
Pool,
FR
QD1349
3.500%
11/01/51
3,766
1
Freddie
Mac
Pool,
FR
SD2609
3.500%
12/01/52
842
2
Ginnie
Mae
II
Pool,
G2
BY0340
3.500%
8/20/50
1,549
3
Ginnie
Mae
II
Pool,
G2
BY0339
3.500%
8/20/50
2,318
3
Ginnie
Mae
II
Pool,
G2
BX3681
3.000%
8/20/50
2,429
3
Ginnie
Mae
II
Pool,
G2
BY0338
3.500%
8/20/50
2,569
4
Ginnie
Mae
II
Pool,
G2
BX3679
3.000%
8/20/50
3,966
1
Ginnie
Mae
II
Pool,
G2
BY0330
3.000%
10/20/50
464
5
Ginnie
Mae
II
Pool,
G2
MA8646
4.500%
2/20/53
4,482
51
Ginnie
Mae
II
Pool,
G2
MA8149
3.500%
7/20/52
46,766
49
Ginnie
Mae
II
Pool,
G2
MA8267,
2022
A
4.000%
9/20/52
46,698
26
Ginnie
Mae
II
Pool,
G2
MA8269
5.000%
9/20/52
26,005
4
Ginnie
Mae
II
Pool,
G2
MA8648
5.500%
2/20/53
4,435
28
Ginnie
Mae
II
Pool,
G2
MA9101
3.000%
8/20/53
24,932
27
Ginnie
Mae
II
Pool,
G2
MA8268
4.500%
9/20/52
26,003
23
Ginnie
Mae
II
Pool,
G2
MA8489
4.500%
12/20/52
22,261
18
Ginnie
Mae
II
Pool,
G2
BY0325
2.500%
10/20/50
15,553
9
Ginnie
Mae
II
Pool,
G2
MA8647
5.000%
2/20/53
9,070
1
Ginnie
Mae
II
Pool,
G2
BY0331
3.000%
10/20/50
813
5
Ginnie
Mae
II
Pool,
G2
BX3680
3.000%
8/20/50
4,595
Nuveen
Core
Impact
Bond
Managed
Accounts
Portfolio
(continued)
Portfolio
of
Investments
July
31,
2024
Principal
Amount
(000)
Description
(a)
Coupon
Maturity
Value
X–
MORTGAGE-BACKED
SECURITIES
(continued)
$
29
Ginnie
Mae
II
Pool,
G2
MA7589,
2021
A
2.500%
9/20/51
$
24,583
235
(b)
Hudson
Yards
2019-30HY
Mortgage
Trust,
2019
30HY
3.228%
7/10/39
212,895
212
(b),(c)
Natixis
Commercial
Mortgage
Securities
Trust
2019-MILE,
(TSFR1M
reference
rate
+
1.579%
spread),
2019
MILE
5.915%
7/15/36
198,679
150
(b)
One
Market
Plaza
Trust
2017-1MKT,
2017
1MKT
3.845%
2/10/32
130,930
200
(b)
VNDO
Trust
2016-350P,
2016
350P
3.903%
1/10/35
188,440
TOTAL
MORTGAGE-BACKED
SECURITIES
(cost
$1,818,510)
1,519,141
Principal
Amount
(000)
Description
(a)
Optional
Call
Provisions
(d)
Value
X
–
MUNICIPAL
BONDS
-
9
.9
%
X
875,217
ALASKA
-
1.8%
$
150
Port
Lions,
Alaska,
Revenue
Bonds,
Kodiak
Area
Native
Association
Project,
Taxable
Series
2022,
7.500%,
10/01/52
10/32
at
100.00
$
158,292
TOTAL
ALASKA
158,292
CALIFORNIA
-
4.5%
250
San
Francisco
City
&
County
Public
Utilities
Commission
Wastewater
Revenue,
4.655%,
10/01/27
9/27
at
100.00
251,328
200
San
Francisco
City
and
County,
California,
Series
2021,
2.684%,
6/15/40
6/31
at
100.00
152,039
TOTAL
CALIFORNIA
403,367
ILLINOIS
-
0.6%
50
Village
of
Deerfield,
Illinois,
Series
2011,
4.000%,
12/01/28
9/24
at
100.00
49,240
TOTAL
ILLINOIS
49,240
MASSACHUSETTS
-
1.8%
170
Massachusetts
Clean
Energy
Cooperative
Corp,
2.020%,
7/01/28
No
Opt.
Call
156,223
TOTAL
MASSACHUSETTS
156,223
OHIO
-
1.2%
100
American
Municipal
Power
Inc.,
Ohio,
Meldahl
Hydroelectric
Projects
Revenue
Bonds,
Build
America
Bond
Series
2010E,
6.270%,
2/15/50
No
Opt.
Call
108,095
TOTAL
OHIO
108,095
TOTAL
MUNICIPAL
BONDS
(cost
$826,615)
875,217
Principal
Amount
(000)
Description
(a)
Coupon
Maturity
Value
X
–
ASSET-BACKED
SECURITIES
-
7.6%
X
673,453
71
(b)
GoodLeap
Sustainable
Home
Solutions
Trust
2021-3,
2021
3CS
2.100%
5/20/48
$
56,617
122
(b)
GoodLeap
Sustainable
Home
Solutions
Trust
2021-4,
2021
4GS
2.360%
7/20/48
92,828
134
(b)
Loanpal
Solar
Loan
2021-2
Ltd,
2021
2GS
2.220%
3/20/48
106,345
114
(b)
Mosaic
Solar
Loan
Trust
2020-2,
2020
2A
1.440%
8/20/46
97,272
132
(b)
Mosaic
Solar
Loan
Trust
2021-3,
2021
3A
1.920%
6/20/52
98,643
46
(b)
Vivint
Solar
Financing
V
LLC,
2018
1A
7.370%
4/30/48
42,850
206
(b)
Vivint
Solar
Financing
VII
LLC,
2020
1A
2.210%
7/31/51
178,898
TOTAL
ASSET-BACKED
SECURITIES
(cost
$821,618)
673,453
Principal
Amount
(000)
Description
(a)
Coupon
Maturity
Value
X
–
EMERGING
MARKET
DEBT
AND
FOREIGN
CORPORATE
BONDS
-
7
.2
%
X
636,830
CANADA
-
2.7%
$
250
(b)
OMERS
Finance
Trust
3.500%
4/19/32
$
234,204
TOTAL
CANADA
234,204
NETHERLANDS
-
2.2%
200
(b)
Nederlandse
Waterschapsbank
NV
4.000%
6/01/28
198,567
TOTAL
NETHERLANDS
198,567
SWEDEN
-
2.3%
200
(b)
Kommuninvest
I
Sverige
AB
4.625%
9/29/28
204,059
TOTAL
SWEDEN
204,059
TOTAL
EMERGING
MARKET
DEBT
AND
FOREIGN
CORPORATE
BONDS
(cost
$631,952)
636,830
Principal
Amount
(000)
Description
(a)
Coupon
Maturity
Value
X
–
$1,000
PAR
(OR
SIMILAR)
INSTITUTIONAL
PREFERRED
-
3
.3
%
X
295,675
BANKS
-
2.2%
$
200
African
Development
Bank
5.750%
N/A
(e)
$
195,100
TOTAL
BANKS
195,100
UTILITIES
-
1.1%
100
(b)
Vistra
Corp
7.000%
N/A
(e)
100,575
TOTAL
UTILITIES
100,575
TOTAL
$1,000
PAR
(OR
SIMILAR)
INSTITUTIONAL
PREFERRED
(cost
$282,003)
295,675
Principal
Amount
(000)
Description
(a)
Coupon
Maturity
Value
X
–
SOVEREIGN
DEBT
-
1
.8
%
X
154,419
DOMINICAN
REPUBLIC
-
1.8%
$
150
(b)
Dominican
Republic
International
Bond
6.600%
6/01/36
$
154,419
TOTAL
DOMINICAN
REPUBLIC
154,419
TOTAL
SOVEREIGN
DEBT
(cost
$148,798)
154,419
TOTAL
LONG-TERM
INVESTMENTS
(cost
$9,910,852)
8,835,223
Principal
Amount
(000)
Description
(a)
Coupon
Maturity
Value
SHORT-TERM
INVESTMENTS
-
2.9%
X
–
U.S.
GOVERNMENT
AND
AGENCY
OBLIGATIONS
-
2
.9
%
X
261,000
$
261
Federal
Home
Loan
Bank
Discount
Notes
0.000%
8/01/24
$
261,000
TOTAL
U.S.
GOVERNMENT
AND
AGENCY
OBLIGATIONS
(cost
$261,038)
261,000
TOTAL
SHORT-TERM
INVESTMENTS
(cost
$261,038)
261,000
TOTAL
INVESTMENTS
(cost
$
10,171,890
)
-
102
.6
%
9,096,223
OTHER
ASSETS
&
LIABILITIES,
NET
- (2.6)%
(
231,853
)
NET
ASSETS
-
100%
$
8,864,370
Nuveen
Core
Impact
Bond
Managed
Accounts
Portfolio
(continued)
Portfolio
of
Investments
July
31,
2024
For
Fund
portfolio
compliance
purposes,
the
Fund’s
industry
classifications
refer
to
any
one
or
more
of
the
industry
sub-classifications
used
by
one
or
more
widely
recognized
market
indexes
or
ratings
group
indexes,
and/or
as
defined
by
Fund
management.
This
definition
may
not
apply
for
purposes
of
this
report,
which
may
combine
industry
sub-classifications
into
sectors
for
reporting
ease.
(a)
All
percentages
shown
in
the
Portfolio
of
Investments
are
based
on
net
assets.
(b)
Security
is
exempt
from
registration
under
Rule
144A
of
the
Securities
Act
of
1933,
as
amended.
These
securities
are
deemed
liquid
and
may
be
resold
in
transactions
exempt
from
registration,
which
are
normally
those
transactions
with
qualified
institutional
buyers.
As
of
the
end
of
the
reporting
period,
the
aggregate
value
of
these
securities
is
$4,109,217
or
45.2%
of
Total
Investments.
(c)
Variable
rate
security.
The
rate
shown
is
the
coupon
as
of
the
end
of
the
reporting
period.
(d)
Optional
Call
Provisions:
Dates
(month
and
year)
and
prices
of
the
earliest
optional
call
or
redemption.
There
may
be
other
call
provisions
at
varying
prices
at
later
dates.
Certain
mortgage-backed
securities
may
be
subject
to
periodic
principal
paydowns.
Optional
Call
Provisions
are
not
covered
by
the
report
of
independent
registered
public
accounting
firm.
(e)
Perpetual
security.
Maturity
date
is
not
applicable.
TSFR
1M
CME
Term
SOFR
1
Month
WI/DD
When-issued
or
delayed
delivery
security.
See
Notes
to
Financial
Statements
Nuveen
Emerging
Markets
Debt
Managed
Accounts
Portfolio
Portfolio
of
Investments
July
31,
2024
Principal
Amount
(000)
Description
(a)
Coupon
Maturity
Value
LONG-TERM
INVESTMENTS
-
96.8%
X
14,016,863
SOVEREIGN
DEBT
-
50.0%
X
14,016,863
ANGOLA
-
1.0%
$
300
(b)
Angolan
Government
International
Bond
8.750%
4/14/32
$
268,140
TOTAL
ANGOLA
268,140
BERMUDA
-
0.9%
300
(b)
Bermuda
Government
International
Bond
2.375%
8/20/30
254,460
TOTAL
BERMUDA
254,460
BRAZIL
-
0.7%
200
Brazilian
Government
International
Bond
7.125%
5/13/54
197,025
TOTAL
BRAZIL
197,025
CHILE
-
1.6%
550
Chile
Government
International
Bond
2.550%
7/27/33
452,788
TOTAL
CHILE
452,788
COLOMBIA
-
1.5%
200
Colombia
Government
International
Bond
8.000%
4/20/33
209,853
200
Colombia
Government
International
Bond
8.750%
11/14/53
212,188
TOTAL
COLOMBIA
422,041
COTE
D'IVOIRE
-
0.7%
200
(b)
Ivory
Coast
Government
International
Bond
8.250%
1/30/37
193,410
TOTAL
COTE
D'IVOIRE
193,410
DOMINICAN
REPUBLIC
-
1.6%
150
(b)
Dominican
Republic
International
Bond
7.050%
2/03/31
157,528
300
(b)
Dominican
Republic
International
Bond
5.500%
2/22/29
294,313
TOTAL
DOMINICAN
REPUBLIC
451,841
EGYPT
-
0.8%
250
(b)
Egypt
Government
International
Bond
7.600%
3/01/29
233,045
TOTAL
EGYPT
233,045
HUNGARY
-
2.2%
200
(b)
Hungary
Government
International
Bond
5.250%
6/16/29
199,189
200
(b)
Hungary
Government
International
Bond
6.250%
9/22/32
209,250
200
(b)
Magyar
Export-Import
Bank
Zrt
6.125%
12/04/27
201,438
TOTAL
HUNGARY
609,877
INDIA
-
0.7%
200
(b)
Export-Import
Bank
of
India
3.250%
1/15/30
183,098
TOTAL
INDIA
183,098
INDONESIA
-
2.4%
350
Indonesia
Government
International
Bond
3.500%
1/11/28
334,685
350
Indonesia
Government
International
Bond
4.650%
9/20/32
343,292
TOTAL
INDONESIA
677,977
ISRAEL
-
0.7%
200
Israel
Government
International
Bond
5.750%
3/12/54
185,000
TOTAL
ISRAEL
185,000
KENYA
-
0.7%
225
(b)
Republic
of
Kenya
Government
International
Bond
8.000%
5/22/32
194,405
TOTAL
KENYA
194,405
Nuveen
Emerging
Markets
Debt
Managed
Accounts
Portfolio
(continued)
Portfolio
of
Investments
July
31,
2024
Principal
Amount
(000)
Description
(a)
Coupon
Maturity
Value
MEXICO
-
4.3%
$
200
Mexico
Government
International
Bond
6.338%
5/04/53
$
191,646
250
Mexico
Government
International
Bond
4.280%
8/14/41
198,179
250
Mexico
Government
International
Bond
6.400%
5/07/54
241,971
700
Mexico
Government
International
Bond
3.500%
2/12/34
580,701
TOTAL
MEXICO
1,212,497
NIGERIA
-
0.9%
300
(b)
Nigeria
Government
International
Bond
7.375%
9/28/33
245,250
TOTAL
NIGERIA
245,250
OMAN
-
0.7%
200
(b),(c)
Oman
Government
International
Bond
6.500%
3/08/47
203,203
TOTAL
OMAN
203,203
PANAMA
-
2.7%
700
Panama
Government
International
Bond
3.298%
1/19/33
557,773
200
Panama
Government
International
Bond
6.853%
3/28/54
189,187
TOTAL
PANAMA
746,960
PARAGUAY
-
0.7%
200
(b)
Paraguay
Government
International
Bond
6.000%
2/09/36
204,957
TOTAL
PARAGUAY
204,957
PERU
-
3.6%
250
(b)
Fondo
MIVIVIENDA
SA
4.625%
4/12/27
245,090
875
Peruvian
Government
International
Bond
2.783%
1/23/31
757,551
TOTAL
PERU
1,002,641
PHILIPPINES
-
2.0%
675
Philippine
Government
International
Bond
1.950%
1/06/32
552,562
TOTAL
PHILIPPINES
552,562
POLAND
-
3.2%
400
(b)
Bank
Gospodarstwa
Krajowego
5.375%
5/22/33
402,764
200
Republic
of
Poland
Government
International
Bond
5.500%
11/16/27
205,783
75
Republic
of
Poland
Government
International
Bond
5.500%
3/18/54
73,956
75
Republic
of
Poland
Government
International
Bond
5.125%
9/18/34
75,244
140
Republic
of
Poland
Government
International
Bond
5.500%
4/04/53
138,416
TOTAL
POLAND
896,163
QATAR
-
1.1%
310
(b)
Qatar
Government
International
Bond
5.103%
4/23/48
305,824
TOTAL
QATAR
305,824
REPUBLIC
OF
SERBIA
-
0.7%
250
(b)
Serbia
International
Bond
2.125%
12/01/30
203,125
TOTAL
REPUBLIC
OF
SERBIA
203,125
ROMANIA
-
2.7%
270
(b)
Romanian
Government
International
Bond
4.000%
2/14/51
189,864
200
(b)
Romanian
Government
International
Bond
7.125%
1/17/33
214,200
250
(b)
Romanian
Government
International
Bond
6.375%
1/30/34
254,975
102
(b)
Romanian
Government
International
Bond
5.875%
1/30/29
102,867
TOTAL
ROMANIA
761,906
SAUDI
ARABIA
-
4.1%
200
(b)
Saudi
Government
International
Bond
5.750%
1/16/54
195,896
325
(b)
Saudi
Government
International
Bond
2.250%
2/02/33
262,678
250
(b)
Saudi
Government
International
Bond
4.500%
10/26/46
211,660
500
(b)
Saudi
Government
International
Bond
3.625%
3/04/28
480,870
TOTAL
SAUDI
ARABIA
1,151,104
Principal
Amount
(000)
Description
(a)
Coupon
Maturity
Value
SOUTH
AFRICA
-
2.4%
$
250
Republic
of
South
Africa
Government
International
Bond
4.300%
10/12/28
$
233,438
275
Republic
of
South
Africa
Government
International
Bond
5.875%
4/20/32
260,342
225
Republic
of
South
Africa
Government
International
Bond
5.375%
7/24/44
173,976
TOTAL
SOUTH
AFRICA
667,756
SOUTH
KOREA
-
0.8%
300
Export-Import
Bank
of
Korea
2.500%
6/29/41
215,328
TOTAL
SOUTH
KOREA
215,328
TURKEY
-
1.4%
200
(c)
Turkiye
Government
International
Bond
7.625%
5/15/34
205,294
200
Turkiye
Government
International
Bond
7.125%
7/17/32
199,641
TOTAL
TURKEY
404,935
UNITED
ARAB
EMIRATES
-
2.5%
425
(b)
Abu
Dhabi
Government
International
Bond
3.125%
9/30/49
298,563
425
(b)
Abu
Dhabi
Government
International
Bond
3.125%
5/03/26
413,482
TOTAL
UNITED
ARAB
EMIRATES
712,045
UZBEKISTAN
-
0.7%
250
(b)
Republic
of
Uzbekistan
International
Bond
3.700%
11/25/30
207,500
TOTAL
UZBEKISTAN
207,500
TOTAL
SOVEREIGN
DEBT
(cost
$13,537,521)
14,016,863
Principal
Amount
(000)
Description
(a)
Coupon
Maturity
Value
X
11,909,818
CORPORATE
BONDS
-
42.5%
X
11,909,818
AUSTRALIA
-
0
.7
%
$
200
(c)
AngloGold
Ashanti
Holdings
PLC
3.375%
11/01/28
$
183,129
TOTAL
AUSTRALIA
183,129
BRAZIL
-
1
.7
%
80
(b)
Brazil
Minas
SPE
via
State
of
Minas
Gerais2013
1
5.333%
2/15/28
79,000
225
Petrobras
Global
Finance
BV
6.900%
3/19/49
219,119
225
(b)
Rumo
Luxembourg
Sarl
4.200%
1/18/32
192,634
TOTAL
BRAZIL
490,753
CHILE
-
4
.5
%
200
(b)
Antofagasta
PLC
5.625%
5/13/32
201,427
200
(b)
Banco
del
Estado
de
Chile
2.704%
1/09/25
197,455
200
(b)
Cia
Cervecerias
Unidas
SA
3.350%
1/19/32
175,874
200
(b)
Corp
Nacional
del
Cobre
de
Chile
3.000%
9/30/29
178,953
200
(b)
Corp
Nacional
del
Cobre
de
Chile
3.700%
1/30/50
138,934
200
(b)
Empresa
Nacional
del
Petroleo
6.150%
5/10/33
203,366
200
(b)
Inversiones
CMPC
SA
3.000%
4/06/31
170,881
TOTAL
CHILE
1,266,890
CHINA
-
1
.4
%
200
(b)
Lenovo
Group
Ltd
3.421%
11/02/30
181,559
225
(b)
Prosus
NV
4.193%
1/19/32
201,043
TOTAL
CHINA
382,602
COLOMBIA
-
0
.6
%
160
Ecopetrol
SA
8.375%
1/19/36
159,199
TOTAL
COLOMBIA
159,199
Nuveen
Emerging
Markets
Debt
Managed
Accounts
Portfolio
(continued)
Portfolio
of
Investments
July
31,
2024
Principal
Amount
(000)
Description
(a)
Coupon
Maturity
Value
DOMINICAN
REPUBLIC
-
0
.7
%
$
200
(b)
AES
Espana
BV
5.700%
5/04/28
$
192,000
TOTAL
DOMINICAN
REPUBLIC
192,000
GUATEMALA
-
0
.6
%
200
(b),(c)
Millicom
International
Cellular
SA
4.500%
4/27/31
175,687
TOTAL
GUATEMALA
175,687
INDIA
-
2
.8
%
225
(b)
Bharti
Airtel
Ltd
3.250%
6/03/31
201,374
250
(b),(c)
Indian
Railway
Finance
Corp
Ltd
3.249%
2/13/30
228,425
200
REC
Ltd,
Reg
S
4.625%
3/22/28
196,096
200
(b)
UltraTech
Cement
Ltd
2.800%
2/16/31
173,165
TOTAL
INDIA
799,060
INDONESIA
-
4
.3
%
200
(b)
Freeport
Indonesia
PT
4.763%
4/14/27
197,112
200
(b)
Indonesia
Asahan
Aluminium
PT
/
Mineral
Industri
Indonesia
Persero
PT
6.530%
11/15/28
208,677
200
(b)
Indonesia
Asahan
Aluminium
PT
/
Mineral
Industri
Indonesia
Persero
PT
5.450%
5/15/30
199,191
200
(b)
Pertamina
Persero
PT
3.650%
7/30/29
187,524
200
(b)
Pertamina
Persero
PT
6.500%
5/27/41
215,667
200
(b)
Perusahaan
Perseroan
Persero
PT
Perusahaan
Listrik
Negara
5.450%
5/21/28
201,557
TOTAL
INDONESIA
1,209,728
ISRAEL
-
2
.6
%
200
(b)
Bank
Hapoalim
BM,
Reg
S
3.255%
1/21/32
181,430
225
(b)
Energean
Israel
Finance
Ltd,
Reg
S
5.375%
3/30/28
201,609
200
(b)
Israel
Electric
Corp
Ltd,
Reg
S
3.750%
2/22/32
167,593
200
(b)
Mizrahi
Tefahot
Bank
Ltd,
Reg
S
3.077%
4/07/31
184,952
TOTAL
ISRAEL
735,584
KAZAKHSTAN
-
1
.5
%
200
(b)
Development
Bank
of
Kazakhstan
JSC
5.500%
4/15/27
198,930
250
(b)
QazaqGaz
NC
JSC
4.375%
9/26/27
236,370
TOTAL
KAZAKHSTAN
435,300
KUWAIT
-
0
.7
%
200
(b)
NBK
SPC
Ltd
1.625%
9/15/27
185,317
TOTAL
KUWAIT
185,317
MALAYSIA
-
2
.0
%
225
(b)
MISC
Capital
Two
Labuan
Ltd
3.750%
4/06/27
218,291
200
(b)
Petronas
Capital
Ltd
4.800%
4/21/60
180,500
200
(b)
Petronas
Capital
Ltd
2.480%
1/28/32
170,017
TOTAL
MALAYSIA
568,808
MEXICO
-
5
.3
%
200
(b)
Alpek
SAB
de
CV
3.250%
2/25/31
173,240
200
(b)
Cemex
SAB
de
CV
9.125%
N/A
(d)
215,722
200
(b)
Comision
Federal
de
Electricidad
4.688%
5/15/29
190,674
200
Grupo
Televisa
SAB
6.625%
1/15/40
200,446
300
(b)
Mexico
City
Airport
Trust
5.500%
10/31/46
252,226
200
(b)
Orbia
Advance
Corp
SAB
de
CV
1.875%
5/11/26
187,743
200
Petroleos
Mexicanos
5.950%
1/28/31
165,014
100
Petroleos
Mexicanos
5.350%
2/12/28
90,552
TOTAL
MEXICO
1,475,617
Principal
Amount
(000)
Description
(a)
Coupon
Maturity
Value
MOROCCO
-
0
.7
%
$
225
(b)
OCP
SA
3.750%
6/23/31
$
196,313
TOTAL
MOROCCO
196,313
PERU
-
1
.2
%
200
(b)
Banco
BBVA
Peru
SA
6.200%
6/07/34
202,012
200
(b)
Petroleos
del
Peru
SA
5.625%
6/19/47
127,773
TOTAL
PERU
329,785
QATAR
-
1
.3
%
250
(b)
QatarEnergy
3.300%
7/12/51
177,893
200
QNB
Finance
Ltd,
Reg
S
2.750%
2/12/27
189,195
TOTAL
QATAR
367,088
SAUDI
ARABIA
-
0
.8
%
250
(b),(c)
Saudi
Arabian
Oil
Co
2.250%
11/24/30
213,031
TOTAL
SAUDI
ARABIA
213,031
SOUTH
AFRICA
-
0
.6
%
200
Sasol
Financing
USA
LLC
5.500%
3/18/31
173,522
TOTAL
SOUTH
AFRICA
173,522
SUPRANATIONAL
-
1
.3
%
400
(b)
Banque
Ouest
Africaine
de
Developpement
4.700%
10/22/31
352,088
TOTAL
SUPRANATIONAL
352,088
THAILAND
-
1
.5
%
200
(b)
Bangkok
Bank
PCL/Hong
Kong
5.650%
7/05/34
205,093
250
(b)
PTTEP
Treasury
Center
Co
Ltd
2.993%
1/15/30
226,930
TOTAL
THAILAND
432,023
TURKEY
-
1
.5
%
200
(b),(c)
Ford
Otomotiv
Sanayi
AS
7.125%
4/25/29
203,789
200
(b)
Sisecam
UK
PLC
8.625%
5/02/32
203,876
TOTAL
TURKEY
407,665
UNITED
ARAB
EMIRATES
-
3
.5
%
250
(b)
Abu
Dhabi
Crude
Oil
Pipeline
LLC
4.600%
11/02/47
225,189
200
(b)
DAE
Funding
LLC
3.375%
3/20/28
187,255
200
(b)
DP
World
Ltd/United
Arab
Emirates
5.625%
9/25/48
192,783
162
(b)
Galaxy
Pipeline
Assets
Bidco
Ltd
2.160%
3/31/34
140,543
240
(b)
MDGH
GMTN
RSC
Ltd
4.375%
11/22/33
228,521
TOTAL
UNITED
ARAB
EMIRATES
974,291
UNITED
KINGDOM
-
0
.7
%
200
(b)
Standard
Chartered
PLC
5.905%
5/14/35
204,338
TOTAL
UNITED
KINGDOM
204,338
TOTAL
CORPORATE
BONDS
(cost
$11,365,333)
11,909,818
Nuveen
Emerging
Markets
Debt
Managed
Accounts
Portfolio
(continued)
Portfolio
of
Investments
July
31,
2024
Principal
Amount
(000)
Description
(a)
,(e)
Coupon
Maturity
Value
X
1,039,827
CONTINGENT
CAPITAL
SECURITIES
-
3.7%
X
1,039,827
CHILE
-
1
.5
%
$
200
(b)
Banco
de
Credito
e
Inversiones
SA
8.750%
N/A
(d)
$
210,500
200
(b)
Banco
del
Estado
de
Chile
7.950%
N/A
(d)
207,260
TOTAL
CHILE
417,760
COLOMBIA
-
0
.7
%
200
Bancolombia
SA
8.625%
12/24/34
207,164
TOTAL
COLOMBIA
207,164
MEXICO
-
0
.8
%
200
(b)
BBVA
Bancomer
SA/Texas
8.450%
6/29/38
211,153
TOTAL
MEXICO
211,153
TURKEY
-
0
.7
%
200
(b)
Ulker
Biskuvi
Sanayi
AS
7.875%
7/08/31
203,750
TOTAL
TURKEY
203,750
TOTAL
CONTINGENT
CAPITAL
SECURITIES
(cost
$1,000,000)
1,039,827
Principal
Amount
(000)
Description
(a)
Coupon
Maturity
Value
X
179,971
$1,000
PAR
(OR
SIMILAR)
INSTITUTIONAL
PREFERRED
-
0.6%
X
179,971
MEXICO
-
0
.6
%
$
200
(b)
Banco
Nacional
de
Comercio
Exterior
SNC/Cayman
Islands
2.720%
8/11/31
$
179,971
TOTAL
MEXICO
179,971
TOTAL
$1,000
PAR
(OR
SIMILAR)
INSTITUTIONAL
PREFERRED
(cost
$173,994)
179,971
TOTAL
LONG-TERM
INVESTMENTS
(cost
$26,076,848)
27,146,479
Shares
Description
(a)
Coupon
Value
INVESTMENTS
PURCHASED
WITH
COLLATERAL
FROM
SECURITIES
LENDING
-
4.1%
1,149,418
(f)
State
Street
Navigator
Securities
Lending
Government
Money
Market
Portfolio
5.310%(g)
$
1,149,418
TOTAL
INVESTMENTS
PURCHASED
WITH
COLLATERAL
FROM
SECURITIES
LENDING
(cost
$1,149,418)
1,149,418
TOTAL
INVESTMENTS
(cost
$
27,226,266
)
-
100
.9
%
28,295,897
OTHER
ASSETS
&
LIABILITIES,
NET
- (0.9)%
(
239,279
)
NET
ASSETS
-
100%
$
28,056,618
For
Fund
portfolio
compliance
purposes,
the
Fund’s
industry
classifications
refer
to
any
one
or
more
of
the
industry
sub-classifications
used
by
one
or
more
widely
recognized
market
indexes
or
ratings
group
indexes,
and/or
as
defined
by
Fund
management.
This
definition
may
not
apply
for
purposes
of
this
report,
which
may
combine
industry
sub-classifications
into
sectors
for
reporting
ease.
(a)
All
percentages
shown
in
the
Portfolio
of
Investments
are
based
on
net
assets.
(b)
Security
is
exempt
from
registration
under
Rule
144A
of
the
Securities
Act
of
1933,
as
amended.
These
securities
are
deemed
liquid
and
may
be
resold
in
transactions
exempt
from
registration,
which
are
normally
those
transactions
with
qualified
institutional
buyers.
As
of
the
end
of
the
reporting
period,
the
aggregate
value
of
these
securities
is
$18,377,224
or
64.9%
of
Total
Investments.
(c)
Investment,
or
a
portion
of
investment,
is
out
on
loan
for
securities
lending.
The
total
value
of
the
securities
out
on
loan
as
of
the
end
of
the
reporting
period
was
$1,109,453.
(d)
Perpetual
security.
Maturity
date
is
not
applicable.
(e)
Contingent
Capital
Securities
(“CoCos”)
are
hybrid
securities
with
loss
absorption
characteristics
built
into
the
terms
of
the
security
for
the
benefit
of
the
issuer.
For
example,
the
terms
may
specify
an
automatic
write-down
of
principal
or
a
mandatory
conversion
into
the
issuer’s
common
stock
under
certain
adverse
circumstances,
such
as
the
issuer’s
capital
ratio
falling
below
a
specified
level.
(f)
The
Fund
may
loan
securities
representing
up
to
one
third
of
the
value
of
its
total
assets
(which
includes
collateral
for
securities
on
loan)
to
broker
dealers,
banks,
and
other
institutions.
The
collateral
maintained
by
the
Fund
shall
have
a
value,
at
the
inception
of
each
loan,
equal
to
not
less
than
100%
of
the
value
of
the
loaned
securities.
The
cash
collateral
received
by
the
Fund
is
invested
in
this
money
market
fund.
(g)
The
rate
shown
is
the
one-day
yield
as
of
the
end
of
the
reporting
period.
Reg
S
Regulation
S
allows
U.S.
companies
to
sell
securities
to
persons
or
entities
located
outside
of
the
United
States
without
registering
those
securities
with
the
Securities
and
Exchange
Commission.
Specifically,
Regulation
S
provides
a
safe
harbor
from
the
registration
requirements
of
the
Securities
Act
for
the
offers
and
sales
of
securities
by
both
foreign
and
domestic
issuers
that
are
made
outside
the
United
States.
See
Notes
to
Financial
Statements
Nuveen
High
Yield
Managed
Accounts
Portfolio
Portfolio
of
Investments
July
31,
2024
Principal
Amount
(000)
Description
(a)
Coupon
Maturity
Value
LONG-TERM
INVESTMENTS
-
98.8%
X
–
CORPORATE
BONDS
-
97
.8
%
X
17,642,716
AUTOMOBILES
&
COMPONENTS
-
4.2%
$
115
Dana
Inc
4.500%
2/15/32
$
100,478
10
Dana
Inc
4.250%
9/01/30
8,831
110
(b)
Garrett
Motion
Holdings
Inc
/
Garrett
LX
I
Sarl
7.750%
5/31/32
111,849
125
Goodyear
Tire
&
Rubber
Co/The
5.000%
7/15/29
117,975
10
(b)
IHO
Verwaltungs
GmbH,
(cash
6.375%,
PIK
7.125%)
6.375%
5/15/29
10,010
105
(b)
Phinia
Inc
6.750%
4/15/29
107,101
150
(b)
ZF
North
America
Capital
Inc
6.875%
4/14/28
153,745
150
ZF
North
America
Capital
Inc
6.750%
4/23/30
152,802
TOTAL
AUTOMOBILES
&
COMPONENTS
762,791
CAPITAL
GOODS
-
7.4%
200
(b)
Albion
Financing
2
Sarl
8.750%
4/15/27
202,638
100
(b)
Alta
Equipment
Group
Inc
9.000%
6/01/29
94,762
10
(b)
Brand
Industrial
Services
Inc
10.375%
8/01/30
10,981
65
(b)
Chart
Industries
Inc
7.500%
1/01/30
67,620
100
(b)
EquipmentShare.com
Inc
8.625%
5/15/32
103,826
25
(b)
Gates
Corp/DE
6.875%
7/01/29
25,457
75
(b)
Herc
Holdings
Inc
6.625%
6/15/29
76,576
120
(b),(c)
Husky
Injection
Molding
Systems
Ltd
/
Titan
Co-Borrower
LLC
9.000%
2/15/29
123,237
70
(b)
Masterbrand
Inc
7.000%
7/15/32
71,918
35
(b)
Standard
Industries
Inc/NJ
5.000%
2/15/27
34,245
200
(b)
TransDigm
Inc
6.375%
3/01/29
203,720
80
(b)
TransDigm
Inc
6.875%
12/15/30
82,269
110
(b)
Trinity
Industries
Inc
7.750%
7/15/28
114,790
120
(b)
WESCO
Distribution
Inc
6.625%
3/15/32
122,242
TOTAL
CAPITAL
GOODS
1,334,281
COMMERCIAL
&
PROFESSIONAL
SERVICES
-
3.4%
10
(b)
AMN
Healthcare
Inc
4.000%
4/15/29
9,158
80
(b)
ASGN
Inc
4.625%
5/15/28
76,655
200
(b)
Boost
Newco
Borrower
LLC
7.500%
1/15/31
210,654
50
(b)
Brink's
Co/The
6.500%
6/15/29
50,954
115
(b)
Garda
World
Security
Corp
4.625%
2/15/27
110,718
95
(b)
Prime
Security
Services
Borrower
LLC
/
Prime
Finance
Inc
3.375%
8/31/27
88,652
60
(b)
Prime
Security
Services
Borrower
LLC
/
Prime
Finance
Inc
6.250%
1/15/28
59,803
TOTAL
COMMERCIAL
&
PROFESSIONAL
SERVICES
606,594
CONSUMER
DISCRETIONARY
DISTRIBUTION
&
RETAIL
-
4.3%
80
(b),(c)
Academy
Ltd
6.000%
11/15/27
79,200
35
(b)
Asbury
Automotive
Group
Inc
4.625%
11/15/29
32,705
75
(b)
Bath
&
Body
Works
Inc
6.625%
10/01/30
75,712
25
(b)
Group
1
Automotive
Inc
6.375%
1/15/30
25,215
80
(c)
Kohl's
Corp
4.625%
5/01/31
64,939
50
(b)
LCM
Investments
Holdings
II
LLC
4.875%
5/01/29
47,086
100
(b),(c)
Macy's
Retail
Holdings
LLC
5.875%
4/01/29
97,671
175
(b)
Michaels
Cos
Inc/The
5.250%
5/01/28
129,453
100
(b)
Michaels
Cos
Inc/The
7.875%
5/01/29
57,479
10
(b)
PetSmart
Inc
/
PetSmart
Finance
Corp
4.750%
2/15/28
9,395
100
(b)
Staples
Inc
10.750%
9/01/29
96,866
60
(b)
Velocity
Vehicle
Group
LLC
8.000%
6/01/29
61,800
TOTAL
CONSUMER
DISCRETIONARY
DISTRIBUTION
&
RETAIL
777,521
Principal
Amount
(000)
Description
(a)
Coupon
Maturity
Value
CONSUMER
DURABLES
&
APPAREL
-
1.4%
$
80
(c)
Newell
Brands
Inc
6.625%
9/15/29
$
80,263
80
Newell
Brands
Inc
4.700%
4/01/26
79,809
115
(b)
Wolverine
World
Wide
Inc
4.000%
8/15/29
98,044
TOTAL
CONSUMER
DURABLES
&
APPAREL
258,116
CONSUMER
SERVICES
-
3.1%
80
(b)
Churchill
Downs
Inc
5.750%
4/01/30
78,438
95
(b)
Cinemark
USA
Inc
7.000%
8/01/32
96,686
115
(b),(c)
Fertitta
Entertainment
LLC
/
Fertitta
Entertainment
Finance
Co
Inc
4.625%
1/15/29
107,400
90
(b)
Hilton
Domestic
Operating
Co
Inc
5.875%
4/01/29
90,700
50
(b)
Hilton
Grand
Vacations
Borrower
Escrow
LLC
/
Hilton
Grand
Vacations
Borrower
Esc
6.625%
1/15/32
50,490
10
(b)
Merlin
Entertainments
Group
US
Holdings
Inc
7.375%
2/15/31
10,358
20
(b)
Royal
Caribbean
Cruises
Ltd
7.250%
1/15/30
20,962
100
(b)
Six
Flags
Entertainment
Corp
/
Six
Flags
Theme
Parks
Inc
6.625%
5/01/32
102,684
TOTAL
CONSUMER
SERVICES
557,718
CONSUMER
STAPLES
DISTRIBUTION
&
RETAIL
-
0.3%
50
(b)
Albertsons
Cos
Inc
/
Safeway
Inc
/
New
Albertsons
LP
/
Albertsons
LLC
6.500%
2/15/28
50,723
TOTAL
CONSUMER
STAPLES
DISTRIBUTION
&
RETAIL
50,723
ENERGY
-
14.7%
105
(b)
Antero
Midstream
Partners
LP
/
Antero
Midstream
Finance
Corp
5.750%
3/01/27
104,744
65
(b)
Archrock
Partners
LP
/
Archrock
Partners
Finance
Corp
6.250%
4/01/28
64,843
115
(b)
Baytex
Energy
Corp
7.375%
3/15/32
117,439
10
(b)
Blue
Racer
Midstream
LLC
/
Blue
Racer
Finance
Corp
7.250%
7/15/32
10,409
15
(b)
Blue
Racer
Midstream
LLC
/
Blue
Racer
Finance
Corp
7.000%
7/15/29
15,409
10
(b)
Borr
IHC
Ltd
/
Borr
Finance
LLC
10.000%
11/15/28
10,089
10
(b)
Buckeye
Partners
LP
6.875%
7/01/29
10,159
135
(b)
Civitas
Resources
Inc
8.750%
7/01/31
145,176
15
(b)
Civitas
Resources
Inc
8.625%
11/01/30
16,202
55
(b)
Civitas
Resources
Inc
8.375%
7/01/28
57,745
135
(b)
CNX
Resources
Corp
7.250%
3/01/32
139,463
10
(b)
Delek
Logistics
Partners
LP
/
Delek
Logistics
Finance
Corp
8.625%
3/15/29
10,389
165
(b)
EQM
Midstream
Partners
LP
6.500%
7/01/27
168,144
35
Genesis
Energy
LP
/
Genesis
Energy
Finance
Corp
7.875%
5/15/32
35,740
150
(b)
Harvest
Midstream
I
LP
7.500%
5/15/32
154,331
165
(b)
Hilcorp
Energy
I
LP
/
Hilcorp
Finance
Co
5.750%
2/01/29
162,235
100
(b)
Kinetik
Holdings
LP
6.625%
12/15/28
101,971
65
(b),(c)
Kinetik
Holdings
LP
5.875%
6/15/30
64,343
50
(b)
Kodiak
Gas
Services
LLC
7.250%
2/15/29
51,435
75
(b)
Kraken
Oil
&
Gas
Partners
LLC
7.625%
8/15/29
75,719
110
(b)
Parkland
Corp
4.500%
10/01/29
102,712
100
(b)
PBF
Holding
Co
LLC
/
PBF
Finance
Corp
7.875%
9/15/30
103,569
90
(b)
SM
Energy
Co
6.750%
8/01/29
90,597
90
(b)
Sunoco
LP
7.000%
5/01/29
92,633
100
(b)
Talos
Production
Inc
9.000%
2/01/29
105,367
25
(b)
Transocean
Aquila
Ltd
8.000%
9/30/28
25,473
40
(b)
Transocean
Inc
8.750%
2/15/30
42,543
35
(b)
Transocean
Titan
Financing
Ltd
8.375%
2/01/28
36,400
150
(b)
USA
Compression
Partners
LP
/
USA
Compression
Finance
Corp
7.125%
3/15/29
152,652
100
USA
Compression
Partners
LP
/
USA
Compression
Finance
Corp
6.875%
9/01/27
100,572
100
(b)
Venture
Global
LNG
Inc
8.125%
6/01/28
104,144
100
(b)
Venture
Global
LNG
Inc
9.875%
2/01/32
111,009
Nuveen
High
Yield
Managed
Accounts
Portfolio
(continued)
Portfolio
of
Investments
July
31,
2024
Principal
Amount
(000)
Description
(a)
Coupon
Maturity
Value
ENERGY
(continued)
$
70
(b)
Venture
Global
LNG
Inc
7.000%
1/15/30
$
70,000
TOTAL
ENERGY
2,653,656
EQUITY
REAL
ESTATE
INVESTMENT
TRUSTS
(REITS)
-
1.3%
115
(b)
Iron
Mountain
Inc
4.875%
9/15/27
112,292
10
(b)
RLJ
Lodging
Trust
LP
4.000%
9/15/29
8,924
95
(b)
Uniti
Group
LP
/
Uniti
Group
Finance
Inc
/
CSL
Capital
LLC
10.500%
2/15/28
96,088
25
(b)
Uniti
Group
LP
/
Uniti
Group
Finance
Inc
/
CSL
Capital
LLC
10.500%
2/15/28
25,286
TOTAL
EQUITY
REAL
ESTATE
INVESTMENT
TRUSTS
(REITS)
242,590
FINANCIAL
SERVICES
-
8.6%
110
(b)
Block
Inc
6.500%
5/15/32
111,782
130
(b)
Compass
Group
Diversified
Holdings
LLC
5.250%
4/15/29
124,560
25
(b)
Compass
Group
Diversified
Holdings
LLC
5.000%
1/15/32
22,765
310
(b)
Encore
Capital
Group
Inc
8.500%
5/15/30
321,581
225
(b)
FirstCash
Inc
6.875%
3/01/32
227,557
165
Icahn
Enterprises
LP
/
Icahn
Enterprises
Finance
Corp
5.250%
5/15/27
158,250
10
(b)
Icahn
Enterprises
LP
/
Icahn
Enterprises
Finance
Corp
9.000%
6/15/30
10,130
90
Navient
Corp
4.875%
3/15/28
84,003
10
(b)
NCR
Corp
ATM
9.500%
4/01/29
10,924
210
OneMain
Finance
Corp
3.500%
1/15/27
198,454
110
(b)
PennyMac
Financial
Services
Inc
7.875%
12/15/29
115,146
100
(b)
PennyMac
Financial
Services
Inc
7.125%
11/15/30
100,766
60
(b)
Rocket
Mortgage
LLC
/
Quicken
Loans
Co-Issuer
Inc
3.875%
3/01/31
53,372
10
(b)
Starwood
Property
Trust
Inc
7.250%
4/01/29
10,284
TOTAL
FINANCIAL
SERVICES
1,549,574
FOOD,
BEVERAGE
&
TOBACCO
-
1.1%
10
(b)
B&G
Foods
Inc
8.000%
9/15/28
10,197
115
(b)
Darling
Ingredients
Inc
6.000%
6/15/30
114,109
85
(b)
Primo
Water
Holdings
Inc
4.375%
4/30/29
79,155
TOTAL
FOOD,
BEVERAGE
&
TOBACCO
203,461
HEALTH
CARE
EQUIPMENT
&
SERVICES
-
3.5%
135
(b)
CHS/Community
Health
Systems
Inc
5.250%
5/15/30
117,730
105
(b)
CHS/Community
Health
Systems
Inc
10.875%
1/15/32
112,873
40
(b)
Concentra
Escrow
Issuer
Corp
6.875%
7/15/32
41,213
95
(b)
DaVita
Inc
4.625%
6/01/30
86,996
130
(b)
LifePoint
Health
Inc
11.000%
10/15/30
145,906
100
(b)
LifePoint
Health
Inc
9.875%
8/15/30
108,982
10
(b)
Pediatrix
Medical
Group
Inc
5.375%
2/15/30
9,083
TOTAL
HEALTH
CARE
EQUIPMENT
&
SERVICES
622,783
HOUSEHOLD
&
PERSONAL
PRODUCTS
-
1.1%
65
(b)
Coty
Inc
5.000%
4/15/26
64,297
60
(b)
Coty
Inc/HFC
Prestige
Products
Inc/HFC
Prestige
International
US
LLC
6.625%
7/15/30
61,610
70
(b)
Kronos
Acquisition
Holdings
Inc
8.250%
6/30/31
70,608
TOTAL
HOUSEHOLD
&
PERSONAL
PRODUCTS
196,515
INSURANCE
-
4.4%
130
(b)
Acrisure
LLC
/
Acrisure
Finance
Inc
4.250%
2/15/29
119,636
85
(b)
Alliant
Holdings
Intermediate
LLC
/
Alliant
Holdings
Co-Issuer
6.750%
4/15/28
85,421
200
(b)
Ardonagh
Finco
Ltd
7.750%
2/15/31
202,843
110
(b)
HUB
International
Ltd
7.250%
6/15/30
113,452
260
(b)
Panther
Escrow
Issuer
LLC
7.125%
6/01/31
266,788
TOTAL
INSURANCE
788,140
Principal
Amount
(000)
Description
(a)
Coupon
Maturity
Value
MATERIALS
-
6.6%
$
120
(b)
Arsenal
AIC
Parent
LLC
8.000%
10/01/30
$
127,674
130
(b)
Avient
Corp
7.125%
8/01/30
133,478
190
(b)
Cleveland-Cliffs
Inc
7.000%
3/15/32
190,687
140
(b)
Mineral
Resources
Ltd
9.250%
10/01/28
148,885
110
(b)
Mineral
Resources
Ltd
8.000%
11/01/27
112,898
10
(b),(c)
NOVA
Chemicals
Corp
4.250%
5/15/29
9,046
10
Olin
Corp
5.625%
8/01/29
9,874
45
(b),(c)
Owens-Brockway
Glass
Container
Inc
7.250%
5/15/31
44,525
130
(b)
Sealed
Air
Corp
6.500%
7/15/32
131,771
20
(b)
Sealed
Air
Corp
6.125%
2/01/28
20,138
120
(b)
SunCoke
Energy
Inc
4.875%
6/30/29
109,746
79
(b)
Trinseo
Materials
Operating
SCA
/
Trinseo
Materials
Finance
Inc
5.375%
9/01/25
65,966
85
(b)
Tronox
Inc
4.625%
3/15/29
77,419
TOTAL
MATERIALS
1,182,107
MEDIA
&
ENTERTAINMENT
-
11.1%
285
(b)
CCO
Holdings
LLC
/
CCO
Holdings
Capital
Corp
4.250%
2/01/31
242,495
195
(b)
CCO
Holdings
LLC
/
CCO
Holdings
Capital
Corp
5.375%
6/01/29
182,298
60
(b)
CCO
Holdings
LLC
/
CCO
Holdings
Capital
Corp
6.375%
9/01/29
58,420
10
(b)
Clear
Channel
Outdoor
Holdings
Inc
7.875%
4/01/30
10,177
120
(b)
Directv
Financing
LLC
/
Directv
Financing
Co-Obligor
Inc
5.875%
8/15/27
115,554
75
(b)
DISH
Network
Corp
11.750%
11/15/27
75,070
75
(b),(c)
Getty
Images
Inc
9.750%
3/01/27
74,956
65
(b)
Gray
Television
Inc
4.750%
10/15/30
43,638
100
(b),(c)
Gray
Television
Inc
7.000%
5/15/27
96,791
80
(b),(c)
Gray
Television
Inc
10.500%
7/15/29
83,480
140
(b)
Outfront
Media
Capital
LLC
/
Outfront
Media
Capital
Corp
7.375%
2/15/31
146,649
30
(b)
Sirius
XM
Radio
Inc
4.125%
7/01/30
26,075
95
(b)
Sirius
XM
Radio
Inc
4.000%
7/15/28
87,187
200
(b)
Sunrise
FinCo
I
BV
4.875%
7/15/31
181,956
75
(b)
Univision
Communications
Inc
4.500%
5/01/29
65,510
100
(b)
Univision
Communications
Inc
6.625%
6/01/27
99,514
10
(b),(c)
Univision
Communications
Inc
7.375%
6/30/30
9,628
200
(b)
Virgin
Media
Secured
Finance
PLC
5.500%
5/15/29
186,270
200
(b)
VZ
Secured
Financing
BV
5.000%
1/15/32
175,256
40
(b)
Ziff
Davis
Inc
4.625%
10/15/30
36,079
TOTAL
MEDIA
&
ENTERTAINMENT
1,997,003
PHARMACEUTICALS,
BIOTECHNOLOGY
&
LIFE
SCIENCES
-
1.4%
10
(b),(c)
Endo
Finance
Holdings
Inc
8.500%
4/15/31
10,539
200
(b)
Organon
&
Co
/
Organon
Foreign
Debt
Co-Issuer
BV
4.125%
4/30/28
187,904
35
(b)
Organon
&
Co
/
Organon
Foreign
Debt
Co-Issuer
BV
7.875%
5/15/34
36,347
10
(b)
Organon
&
Co
/
Organon
Foreign
Debt
Co-Issuer
BV
6.750%
5/15/34
10,090
TOTAL
PHARMACEUTICALS,
BIOTECHNOLOGY
&
LIFE
SCIENCES
244,880
REAL
ESTATE
MANAGEMENT
&
DEVELOPMENT
-
0.5%
10
(b)
Anywhere
Real
Estate
Group
LLC
/
Anywhere
Co-Issuer
Corp
7.000%
4/15/30
8,481
75
(b)
Cushman
&
Wakefield
US
Borrower
LLC
6.750%
5/15/28
75,149
TOTAL
REAL
ESTATE
MANAGEMENT
&
DEVELOPMENT
83,630
SOFTWARE
&
SERVICES
-
2.2%
150
(b),(c)
Ahead
DB
Holdings
LLC
6.625%
5/01/28
142,673
10
(b)
Cloud
Software
Group
Inc
8.250%
6/30/32
10,375
75
(b)
Open
Text
Corp
3.875%
12/01/29
68,080
130
(b)
Rocket
Software
Inc
9.000%
11/28/28
133,803
50
(b)
Science
Applications
International
Corp
4.875%
4/01/28
48,315
TOTAL
SOFTWARE
&
SERVICES
403,246
Nuveen
High
Yield
Managed
Accounts
Portfolio
(continued)
Portfolio
of
Investments
July
31,
2024
Principal
Amount
(000)
Description
(a)
Coupon
Maturity
Value
TECHNOLOGY
HARDWARE
&
EQUIPMENT
-
1.6%
$
100
(b)
Imola
Merger
Corp
4.750%
5/15/29
$
94,119
200
(b)
Sensata
Technologies
Inc
6.625%
5/31/32
202,612
TOTAL
TECHNOLOGY
HARDWARE
&
EQUIPMENT
296,731
TELECOMMUNICATION
SERVICES
-
5.9%
200
(b)
Altice
France
SA
8.125%
2/01/27
161,749
100
(b)
Frontier
Communications
Holdings
LLC
8.625%
3/15/31
104,740
105
(b)
Frontier
Communications
Holdings
LLC
5.875%
10/15/27
103,967
10
(b)
Frontier
Communications
Holdings
LLC
8.750%
5/15/30
10,476
210
(b)
Iliad
Holding
SASU
8.500%
4/15/31
218,783
130
(b)
Level
3
Financing
Inc
10.500%
4/15/29
133,250
75
(b)
Level
3
Financing
Inc
10.500%
5/15/30
76,650
50
(b)
Level
3
Financing
Inc
10.750%
12/15/30
51,562
10
(b),(c)
Zayo
Group
Holdings
Inc
4.000%
3/01/27
8,504
200
(b)
Zegona
Finance
PLC
8.625%
7/15/29
204,025
TOTAL
TELECOMMUNICATION
SERVICES
1,073,706
TRANSPORTATION
-
5.0%
35
(b)
American
Airlines
Inc
8.500%
5/15/29
36,033
67
(b)
American
Airlines
Inc/AAdvantage
Loyalty
IP
Ltd2021
CORP
5.500%
4/20/26
66,634
300
(b)
Brightline
East
LLC
11.000%
1/31/30
272,954
115
(b),(c)
Cargo
Aircraft
Management
Inc
4.750%
2/01/28
108,127
100
(b),(c)
GN
Bondco
LLC
9.500%
10/15/31
94,136
165
(b)
Hawaiian
Brand
Intellectual
Property
Ltd
/
HawaiianMiles
Loyalty
Ltd
11.000%
4/15/29
157,327
105
(b)
United
Airlines
Inc
4.375%
4/15/26
102,374
10
(b)
VistaJet
Malta
Finance
PLC
/
Vista
Management
Holding
Inc
9.500%
6/01/28
8,949
55
(b)
XPO
Inc
7.125%
6/01/31
56,731
TOTAL
TRANSPORTATION
903,265
UTILITIES
-
4.7%
80
(b)
Clearway
Energy
Operating
LLC
4.750%
3/15/28
76,795
115
(b),(c)
Ferrellgas
LP
/
Ferrellgas
Finance
Corp
5.375%
4/01/26
115,362
115
(b)
Ferrellgas
LP
/
Ferrellgas
Finance
Corp
5.875%
4/01/29
107,127
235
(b)
Talen
Energy
Supply
LLC
8.625%
6/01/30
253,243
130
(b)
TerraForm
Power
Operating
LLC
5.000%
1/31/28
125,276
95
(b)
Vistra
Operations
Co
LLC
7.750%
10/15/31
100,392
80
(b)
Vistra
Operations
Co
LLC
4.375%
5/01/29
75,490
TOTAL
UTILITIES
853,685
TOTAL
CORPORATE
BONDS
(cost
$17,142,556)
17,642,716
Shares
Description
(a)
Value
X
–
EXCHANGE-TRADED
FUNDS
-
1
.0
%
X
178,500
8,500
Invesco
Senior
Loan
ETF
$
178,500
TOTAL
EXCHANGE-TRADED
FUNDS
(cost
$179,477)
178,500
TOTAL
LONG-TERM
INVESTMENTS
(cost
$17,322,033)
17,821,216
Shares
Description
(a)
Coupon
Value
INVESTMENTS
PURCHASED
WITH
COLLATERAL
FROM
SECURITIES
LENDING
-
8.0%
1,447,778
(d)
State
Street
Navigator
Securities
Lending
Government
Money
Market
Portfolio
5.310%(e)
$
1,447,778
TOTAL
INVESTMENTS
PURCHASED
WITH
COLLATERAL
FROM
SECURITIES
LENDING
(cost
$1,447,778)
1,447,778
TOTAL
INVESTMENTS
(cost
$
18,769,811
)
-
106
.8
%
19,268,994
OTHER
ASSETS
&
LIABILITIES,
NET
- (6.8)%
(
1,231,787
)
NET
ASSETS
-
100%
$
18,037,207
For
Fund
portfolio
compliance
purposes,
the
Fund’s
industry
classifications
refer
to
any
one
or
more
of
the
industry
sub-classifications
used
by
one
or
more
widely
recognized
market
indexes
or
ratings
group
indexes,
and/or
as
defined
by
Fund
management.
This
definition
may
not
apply
for
purposes
of
this
report,
which
may
combine
industry
sub-classifications
into
sectors
for
reporting
ease.
(a)
All
percentages
shown
in
the
Portfolio
of
Investments
are
based
on
net
assets.
(b)
Security
is
exempt
from
registration
under
Rule
144A
of
the
Securities
Act
of
1933,
as
amended.
These
securities
are
deemed
liquid
and
may
be
resold
in
transactions
exempt
from
registration,
which
are
normally
those
transactions
with
qualified
institutional
buyers.
As
of
the
end
of
the
reporting
period,
the
aggregate
value
of
these
securities
is
$16,450,726
or
85.4%
of
Total
Investments.
(c)
Investment,
or
a
portion
of
investment,
is
out
on
loan
for
securities
lending.
The
total
value
of
the
securities
out
on
loan
as
of
the
end
of
the
reporting
period
was
$1,390,181.
(d)
The
Fund
may
loan
securities
representing
up
to
one
third
of
the
value
of
its
total
assets
(which
includes
collateral
for
securities
on
loan)
to
broker
dealers,
banks,
and
other
institutions.
The
collateral
maintained
by
the
Fund
shall
have
a
value,
at
the
inception
of
each
loan,
equal
to
not
less
than
100%
of
the
value
of
the
loaned
securities.
The
cash
collateral
received
by
the
Fund
is
invested
in
this
money
market
fund.
(e)
The
rate
shown
is
the
one-day
yield
as
of
the
end
of
the
reporting
period.
ETF
Exchange-Traded
Fund
PIK
Payment-in-kind
(“PIK”)
security. Depending
on
the
terms
of
the
security,
income
may
be
received
in
the
form
of
cash,
securities,
or
a
combination
of
both. The
PIK
rate
shown,
where
applicable,
represents
the
annualized
rate
of
the
last
PIK
payment
made
by
the
issuer
as
of
the
end
of
the
reporting
period.
REIT
Real
Estate
Investment
Trust
See
Notes
to
Financial
Statements
Nuveen
Preferred
Securities
and
Income
Managed
Accounts
Portfolio
Portfolio
of
Investments
July
31,
2024
Principal
Amount
(000)
Description
(a)
Coupon
Maturity
Value
LONG-TERM
INVESTMENTS
-
99.0%
X
–
$1,000
PAR
(OR
SIMILAR)
INSTITUTIONAL
PREFERRED
-
61
.3
%
X
10,912,078
AUTOMOBILES
&
COMPONENTS
-
2.9%
$
550
(b)
General
Motors
Financial
Co
Inc
5.700%
N/A
(c)
$
521,775
TOTAL
AUTOMOBILES
&
COMPONENTS
521,775
BANKS
-
14.3%
300
Citigroup
Inc
7.625%
N/A
(c)
311,994
175
Citigroup
Inc
7.125%
N/A
(c)
175,132
540
CoBank
ACB
6.450%
N/A
(c)
536,148
100
(d)
First
Citizens
BancShares
Inc/NC
(TSFR3M
reference
rate
+
4.234%
spread)
9.573%
N/A
(c)
101,662
250
(b)
M&T
Bank
Corp
5.125%
N/A
(c)
238,798
280
PNC
Financial
Services
Group
Inc/The
6.200%
N/A
(c)
279,273
225
PNC
Financial
Services
Group
Inc/The
6.250%
N/A
(c)
219,340
410
Truist
Financial
Corp
5.100%
N/A
(c)
382,940
300
(b)
US
Bancorp
5.300%
N/A
(c)
290,976
TOTAL
BANKS
2,536,263
ENERGY
-
8.2%
300
Enbridge
Inc
8.500%
1/15/84
328,100
300
Enbridge
Inc
7.625%
1/15/83
311,724
275
Energy
Transfer
LP
6.500%
N/A
(c)
273,205
75
Energy
Transfer
LP
8.000%
5/15/54
79,845
24
Energy
Transfer
LP
6.625%
N/A
(c)
23,530
300
Transcanada
Trust
5.500%
9/15/79
278,895
180
Transcanada
Trust
5.600%
3/07/82
166,952
TOTAL
ENERGY
1,462,251
FINANCIAL
SERVICES
-
13.6%
487
AerCap
Ireland
Capital
DAC
/
AerCap
Global
Aviation
Trust
6.950%
3/10/55
492,456
400
(b)
Ally
Financial
Inc
4.700%
N/A
(c)
366,724
290
American
Express
Co
3.550%
N/A
(c)
270,780
450
Charles
Schwab
Corp/The
5.375%
N/A
(c)
444,734
210
Discover
Financial
Services
6.125%
N/A
(c)
208,438
200
(b)
Goldman
Sachs
Group
Inc/The
7.500%
N/A
(c)
209,229
200
Goldman
Sachs
Group
Inc/The
7.500%
N/A
(c)
206,132
205
State
Street
Corp
6.700%
N/A
(c)
205,218
TOTAL
FINANCIAL
SERVICES
2,403,711
INSURANCE
-
10.8%
300
(b)
Assurant
Inc
7.000%
3/27/48
305,102
185
AXIS
Specialty
Finance
LLC
4.900%
1/15/40
172,432
270
Enstar
Finance
LLC
5.500%
1/15/42
241,266
325
(e)
MetLife
Inc
9.250%
4/08/38
380,826
180
Prudential
Financial
Inc
6.500%
3/15/54
183,511
650
(e)
QBE
Insurance
Group
Ltd
5.875%
N/A
(c)
643,998
TOTAL
INSURANCE
1,927,135
MEDIA
&
ENTERTAINMENT
-
3.2%
293
(e)
Farm
Credit
Bank
of
Texas
7.750%
N/A
(c)
298,352
300
(b)
Paramount
Global
6.375%
3/30/62
275,437
TOTAL
MEDIA
&
ENTERTAINMENT
573,789
Principal
Amount
(000)
Description
(a)
Coupon
Maturity
Value
REAL
ESTATE
MANAGEMENT
&
DEVELOPMENT
-
0.8%
$
147
(b),(e)
EUSHI
Finance
Inc
7.625%
12/15/54
$
149,769
TOTAL
REAL
ESTATE
MANAGEMENT
&
DEVELOPMENT
149,769
TELECOMMUNICATION
SERVICES
-
1.2%
200
Vodafone
Group
PLC
7.000%
4/04/79
207,046
TOTAL
TELECOMMUNICATION
SERVICES
207,046
UTILITIES
-
6.3%
85
AES
Corp/The
7.600%
1/15/55
86,494
52
Dominion
Energy
Inc
7.000%
6/01/54
54,610
150
Emera
Inc
6.750%
6/15/76
149,213
115
Entergy
Corp
7.125%
12/01/54
115,053
72
NextEra
Energy
Capital
Holdings
Inc
6.750%
6/15/54
74,841
330
Sempra
4.875%
N/A
(c)
323,261
325
(e)
Vistra
Corp
7.000%
N/A
(c)
326,867
TOTAL
UTILITIES
1,130,339
TOTAL
$1,000
PAR
(OR
SIMILAR)
INSTITUTIONAL
PREFERRED
(cost
$10,295,728)
10,912,078
Principal
Amount
(000)
Description
(a)
,(f)
Coupon
Maturity
Value
X
–
CONTINGENT
CAPITAL
SECURITIES
-
35
.2
%
X
6,271,364
BANKS
-
30.4%
$
200
Banco
Bilbao
Vizcaya
Argentaria
SA
9.375%
N/A
(c)
$
215,645
200
Banco
Bilbao
Vizcaya
Argentaria
SA
6.500%
N/A
(c)
199,225
200
Banco
Santander
SA
9.625%
N/A
(c)
228,272
200
Banco
Santander
SA
8.000%
N/A
(c)
202,067
200
Banco
Santander
SA
4.750%
N/A
(c)
184,342
515
(b)
Barclays
PLC
8.000%
N/A
(c)
528,930
275
(e)
BNP
Paribas
SA
7.750%
N/A
(c)
283,249
235
(e)
BNP
Paribas
SA
9.250%
N/A
(c)
252,137
200
(e)
BNP
Paribas
SA
8.500%
N/A
(c)
209,778
425
(e)
Credit
Agricole
SA
8.125%
N/A
(c)
433,502
370
HSBC
Holdings
PLC
6.000%
N/A
(c)
362,206
340
HSBC
Holdings
PLC
6.375%
N/A
(c)
339,540
250
ING
Groep
NV
5.750%
N/A
(c)
242,328
200
ING
Groep
NV,
Reg
S
7.500%
N/A
(c)
203,500
200
Lloyds
Banking
Group
PLC
7.500%
N/A
(c)
200,704
330
NatWest
Group
PLC
6.000%
N/A
(c)
325,741
200
NatWest
Group
PLC
8.125%
N/A
(c)
207,093
220
(e)
Societe
Generale
SA
9.375%
N/A
(c)
225,646
350
(e)
Societe
Generale
SA
10.000%
N/A
(c)
369,535
200
(e)
Standard
Chartered
PLC
7.750%
N/A
(c)
204,450
TOTAL
BANKS
5,417,890
FINANCIAL
SERVICES
-
4.8%
200
Deutsche
Bank
AG
6.000%
N/A
(c)
191,655
200
(e)
UBS
Group
AG
9.250%
N/A
(c)
226,331
400
(e)
UBS
Group
AG
9.250%
N/A
(c)
435,488
TOTAL
FINANCIAL
SERVICES
853,474
TOTAL
CONTINGENT
CAPITAL
SECURITIES
(cost
$5,744,591)
6,271,364
Nuveen
Preferred
Securities
and
Income
Managed
Accounts
Portfolio
(continued)
Portfolio
of
Investments
July
31,
2024
Shares
Description
(a)
Coupon
Value
X
–
$25
PAR
(OR
SIMILAR)
RETAIL
PREFERRED
-
2
.0
%
X
361,434
BANKS
-
1.7%
3,000
(e)
Farm
Credit
Bank
of
Texas
9.611%
$
299,534
TOTAL
BANKS
299,534
FOOD,
BEVERAGE
&
TOBACCO
-
0.3%
2,500
CHS
Inc
6.750%
61,900
TOTAL
FOOD,
BEVERAGE
&
TOBACCO
61,900
TOTAL
$25
PAR
(OR
SIMILAR)
RETAIL
PREFERRED
(cost
$359,239)
361,434
Principal
Amount
(000)
Description
(a)
Coupon
Maturity
Value
–
CORPORATE
BONDS
-
0
.5
%
X
78,100
FINANCIAL
SERVICES
-
0.5%
$
400
(e)
Credit
Suisse
Group
AG
7.500%
6/11/72
$
44,000
310
Credit
Suisse
Group
AG
7.500%
1/17/72
34,100
TOTAL
FINANCIAL
SERVICES
78,100
TOTAL
CORPORATE
BONDS
(cost
$643,299)
78,100
TOTAL
LONG-TERM
INVESTMENTS
(cost
$17,042,857)
17,622,976
Shares
Description
(a)
Coupon
Value
INVESTMENTS
PURCHASED
WITH
COLLATERAL
FROM
SECURITIES
LENDING
-
13.9%
2,476,710
(g)
State
Street
Navigator
Securities
Lending
Government
Money
Market
Portfolio
5.310%(h)
$
2,476,710
TOTAL
INVESTMENTS
PURCHASED
WITH
COLLATERAL
FROM
SECURITIES
LENDING
(cost
$2,476,710)
2,476,710
TOTAL
INVESTMENTS
(cost
$
19,519,567
)
-
112
.9
%
20,099,686
OTHER
ASSETS
&
LIABILITIES,
NET
- (12.9)%
(
2,300,692
)
NET
ASSETS
-
100%
$
17,798,994
For
Fund
portfolio
compliance
purposes,
the
Fund’s
industry
classifications
refer
to
any
one
or
more
of
the
industry
sub-classifications
used
by
one
or
more
widely
recognized
market
indexes
or
ratings
group
indexes,
and/or
as
defined
by
Fund
management.
This
definition
may
not
apply
for
purposes
of
this
report,
which
may
combine
industry
sub-classifications
into
sectors
for
reporting
ease.
(a)
All
percentages
shown
in
the
Portfolio
of
Investments
are
based
on
net
assets.
(b)
Investment,
or
a
portion
of
investment,
is
out
on
loan
for
securities
lending.
The
total
value
of
the
securities
out
on
loan
as
of
the
end
of
the
reporting
period
was
$2,391,331.
(c)
Perpetual
security.
Maturity
date
is
not
applicable.
(d)
Variable
rate
security.
The
rate
shown
is
the
coupon
as
of
the
end
of
the
reporting
period.
(e)
Security
is
exempt
from
registration
under
Rule
144A
of
the
Securities
Act
of
1933,
as
amended.
These
securities
are
deemed
liquid
and
may
be
resold
in
transactions
exempt
from
registration,
which
are
normally
those
transactions
with
qualified
institutional
buyers.
As
of
the
end
of
the
reporting
period,
the
aggregate
value
of
these
securities
is
$4,783,462
or
23.8%
of
Total
Investments.
(f)
Contingent
Capital
Securities
(“CoCos”)
are
hybrid
securities
with
loss
absorption
characteristics
built
into
the
terms
of
the
security
for
the
benefit
of
the
issuer.
For
example,
the
terms
may
specify
an
automatic
write-down
of
principal
or
a
mandatory
conversion
into
the
issuer’s
common
stock
under
certain
adverse
circumstances,
such
as
the
issuer’s
capital
ratio
falling
below
a
specified
level.
(g)
The
Fund
may
loan
securities
representing
up
to
one
third
of
the
value
of
its
total
assets
(which
includes
collateral
for
securities
on
loan)
to
broker
dealers,
banks,
and
other
institutions.
The
collateral
maintained
by
the
Fund
shall
have
a
value,
at
the
inception
of
each
loan,
equal
to
not
less
than
100%
of
the
value
of
the
loaned
securities.
The
cash
collateral
received
by
the
Fund
is
invested
in
this
money
market
fund.
(h)
The
rate
shown
is
the
one-day
yield
as
of
the
end
of
the
reporting
period.
Reg
S
Regulation
S
allows
U.S.
companies
to
sell
securities
to
persons
or
entities
located
outside
of
the
United
States
without
registering
those
securities
with
the
Securities
and
Exchange
Commission.
Specifically,
Regulation
S
provides
a
safe
harbor
from
the
registration
requirements
of
the
Securities
Act
for
the
offers
and
sales
of
securities
by
both
foreign
and
domestic
issuers
that
are
made
outside
the
United
States.
TSFR
3M
CME
Term
SOFR
3
Month
See
Notes
to
Financial
Statements
Nuveen
Securitized
Credit
Managed
Accounts
Portfolio
Portfolio
of
Investments
July
31,
2024
Principal
Amount
(000)
Description
(a)
Coupon
Maturity
Value
LONG-TERM
INVESTMENTS
-
99.3%
X
–
MORTGAGE-BACKED
SECURITIES
-
76.8%
X
20,578,295
$
100
Bank
2019-BNK19,
2019
BN20
3.243%
9/15/62
$
86,915
350
BANK
2019-BNK22,
2019
BN22
3.210%
11/15/62
311,577
500
Benchmark
2019-B11
Mortgage
Trust,
2019
B11
3.784%
5/15/52
454,786
199
Benchmark
2019-B15
Mortgage
Trust,
2019
B15
3.720%
12/15/72
153,695
100
Benchmark
2021-B28
Mortgage
Trust,
2021
B28
2.429%
8/15/54
81,960
248
(b),(c)
BX
Commercial
Mortgage
Trust
2021-CIP,
(TSFR1M
reference
rate
+
1.385%
spread),
2021
CIP
6.714%
12/15/38
245,248
570
(c)
CAMB
Commercial
Mortgage
Trust
2021-CX2,
2021
CX2
2.700%
11/10/46
474,961
200
Citigroup
Commercial
Mortgage
Trust
2015-GC29,
2015
GC29
3.457%
4/10/48
194,955
200
Citigroup
Commercial
Mortgage
Trust
2016-C3,
2016
C3
3.366%
11/15/49
186,210
200
COMM
2015-LC21
Mortgage
Trust,
2015
LC21
4.043%
7/10/48
194,609
295
COMM
2018-COR3
Mortgage
Trust,
2018
COR3
4.517%
5/10/51
255,233
300
(b),(c)
Connecticut
Avenue
Securities
Trust
2022-R05,
(SOFR30A
reference
rate
+
3.000%
spread),
2022
R05
8.347%
4/25/42
311,129
300
(b),(c)
Connecticut
Avenue
Securities
Trust
2022-R07,
(SOFR30A
reference
rate
+
4.650%
spread),
2022
R07
9.998%
6/25/42
326,521
240
(b),(c)
Connecticut
Avenue
Securities
Trust
2022-R09,
(SOFR30A
reference
rate
+
4.750%
spread),
2022
R09
10.098%
9/25/42
262,692
315
(b),(c)
Connecticut
Avenue
Securities
Trust
2023-R01,
(SOFR30A
reference
rate
+
3.750%
spread),
2023
R01
9.098%
12/25/42
338,153
45
CSAIL
2017-CX10
Commercial
Mortgage
Trust,
2017
CX10
3.458%
11/15/50
42,068
200
CSAIL
2020-C19
Commercial
Mortgage
Trust,
2020
C19
2.971%
3/15/53
166,341
77
(c)
DBWF
Mortgage
Trust,
2015
LCM
2.998%
6/10/34
74,183
194
Fannie
Mae
Pool,
FN
MA5165
5.500%
10/01/53
193,908
231
Fannie
Mae
Pool,
FN
CB2804
2.500%
2/01/52
196,075
179
Fannie
Mae
Pool,
FN
310210,
2022
1
4.000%
5/01/44
172,435
141
Fannie
Mae
Pool,
FN
MA4842,
2022
1
5.500%
12/01/52
141,132
142
Fannie
Mae
Pool,
FN
MA4699,
2022
1
3.500%
7/01/52
128,417
113
Fannie
Mae
Pool,
FN
MA4625,
2022
1
3.500%
6/01/52
102,098
109
Fannie
Mae
Pool,
FN
CB2211
2.500%
11/01/51
92,650
92
Fannie
Mae
Pool,
FN
MA4761
5.000%
9/01/52
90,564
99
Fannie
Mae
Pool,
FN
FS7299
3.000%
5/01/52
87,768
84
Fannie
Mae
Pool,
FN
FS5179
5.000%
6/01/53
83,209
79
Fannie
Mae
Pool,
FN
MA5353
5.500%
5/01/54
78,572
173
Fannie
Mae
Pool,
FN
MA5039
5.500%
6/01/53
173,199
543
Fannie
Mae
Pool,
FN
MA5106
5.000%
8/01/53
534,904
257
Fannie
Mae
Pool,
FN
CB3905
3.500%
6/01/52
233,881
342
Fannie
Mae
Pool,
FN
MA4962
4.000%
3/01/53
320,734
269
Fannie
Mae
Pool,
FN
MA4920
6.000%
2/01/53
273,044
483
Fannie
Mae
Pool,
FN
MA4737,
2022
1
5.000%
8/01/52
476,167
498
Fannie
Mae
Pool,
FN
MA4732
4.000%
9/01/52
467,529
308
Fannie
Mae
Pool,
FN
MA4600,
2022
2
3.500%
5/01/52
280,168
523
Fannie
Mae
Pool,
FN
FS1535
3.000%
4/01/52
459,398
302
Fannie
Mae
Pool,
FN
MA4918
5.000%
2/01/53
297,938
466
Fannie
Mae
Pool,
FN
MA4805,
2022
1
4.500%
11/01/52
448,963
444
Fannie
Mae
Pool,
FN
MA4784
4.500%
10/01/52
427,552
496
Fannie
Mae
Pool,
FN
MA4733
4.500%
9/01/52
478,499
445
Fannie
Mae
Pool,
FN
MA4655
4.000%
7/01/52
417,086
421
Fannie
Mae
Pool,
FN
MA4701,
2022
1
4.500%
7/01/52
405,514
431
Fannie
Mae
Pool,
FN
MA4700,
2022
1
4.000%
7/01/52
403,965
397
Fannie
Mae
Pool,
FN
MA5070
4.500%
7/01/53
381,999
364
Fannie
Mae
Pool,
FN
MA4919
5.500%
2/01/53
364,984
389
Fannie
Mae
Pool,
FN
MA4783
4.000%
10/01/52
364,688
130
Freddie
Mac
Pool,
FR
SD8220
3.000%
6/01/52
113,614
41
Freddie
Mac
Pool,
FR
RA7211,
2022
1
4.000%
4/01/52
38,469
76
Freddie
Mac
Pool,
FR
SD4810
3.000%
4/01/52
67,020
Principal
Amount
(000)
Description
(a)
Coupon
Maturity
Value
X–
MORTGAGE-BACKED
SECURITIES
(continued)
$
192
Freddie
Mac
Pool,
FR
RA9629
5.500%
8/01/53
$
192,052
45
Freddie
Mac
REMICS,
2018
4776
4.000%
3/15/48
42,198
36
Freddie
Mac
REMICS,
2018
4783
4.000%
4/15/48
33,763
157
(b),(c)
Freddie
Mac
STACR
REMIC
Trust
2022-DNA5,
(SOFR30A
reference
rate
+
4.500%
spread),
2022
DNA5
9.847%
6/25/42
170,286
300
(b),(c)
Freddie
Mac
STACR
REMIC
Trust
2022-HQA2,
(SOFR30A
reference
rate
+
4.000%
spread),
2022
HQA2
9.347%
7/25/42
320,697
300
(b),(c)
Freddie
Mac
STACR
REMIC
Trust
2022-HQA3,
(SOFR30A
reference
rate
+
3.550%
spread),
2022
HQA3
8.897%
8/25/42
317,117
342
Ginnie
Mae
II
Pool,
G2
MA8149
3.500%
7/20/52
314,459
67
Ginnie
Mae
II
Pool,
G2
MA8428
5.000%
11/20/52
66,712
77
Ginnie
Mae
II
Pool,
G2
MA8043
3.000%
5/20/52
69,107
60
Ginnie
Mae
II
Pool,
G2
MA7419,
2021
MTGE
3.000%
6/20/51
54,012
246
Ginnie
Mae
II
Pool,
G2
MA8200
4.000%
8/20/52
232,184
115
Ginnie
Mae
II
Pool,
G2
MA8201
4.500%
8/20/52
111,771
103
Government
National
Mortgage
Association,
2023
111
3.000%
2/20/52
70,995
575
GS
Mortgage
Securities
Trust
2017-GS6,
2017
GS6
3.638%
5/10/50
526,854
245
GS
Mortgage
Securities
Trust
2018-GS9,
2018
GS9
3.992%
3/10/51
231,199
45
GS
Mortgage
Securities
Trust
2019-GSA1,
2019
GSA1
3.340%
11/10/52
40,571
239
(c)
GS
Mortgage-Backed
Securities
Trust
2021-PJ6,
2021
PJ6
2.500%
11/25/51
193,574
93
(c)
GS
Mortgage-Backed
Securities
Trust
2023-PJ1,
2023
PJ1
3.500%
2/25/53
81,208
82
(c)
J.P.
Morgan
Mortgage
Trust
2021-15,
2021
15
2.500%
6/25/52
66,292
186
(c)
J.P.
Morgan
Mortgage
Trust
2021-INV5,
2021
INV5
3.188%
12/25/51
152,376
262
(c)
J.P.
Morgan
Mortgage
Trust
2022-6,
2022
6
3.000%
11/25/52
220,233
241
(c)
JP
Morgan
Mortgage
Trust
2017-5,
2017
5
5.477%
10/26/48
241,402
85
(c)
JP
Morgan
Mortgage
Trust
2018-4,
2018
4
3.500%
10/25/48
74,279
251
(c)
JP
Morgan
Mortgage
Trust
2018-5,
2018
5
3.500%
10/25/48
222,232
248
(c)
JP
Morgan
Mortgage
Trust
2020-1,
2020
1
3.821%
6/25/50
219,691
402
(c)
JP
Morgan
Mortgage
Trust
2020-7,
2020
7
3.000%
1/25/51
343,982
313
(c)
JP
Morgan
Mortgage
Trust
2021-11,
2021
11
2.500%
1/25/52
253,098
23
(c)
JP
Morgan
Mortgage
Trust
2021-4,
2021
4
2.881%
8/25/51
18,399
250
JPMBB
Commercial
Mortgage
Securities
Trust
2014-C23,
2014
C23
4.444%
9/15/47
247,518
78
(c)
Morgan
Stanley
Residential
Mortgage
Loan
Trust
2021-5,
2021
5
2.500%
8/25/51
62,661
273
(c)
Morgan
Stanley
Residential
Mortgage
Loan
Trust
2023-1,
2023
1
4.000%
2/25/53
247,128
225
(b),(c)
MTN
Commercial
Mortgage
Trust
2022-LPFL,
(TSFR1M
reference
rate
+
1.397%
spread),
2022
LPFL
6.727%
3/15/39
222,511
78
(b),(c)
OBX
2018-1
Trust,
(TSFR1M
reference
rate
+
0.764%
spread),
2018
1
4.658%
6/25/57
76,327
274
(c)
OBX
2022-INV5
Trust,
2022
INV5
4.000%
10/25/52
248,070
87
(c)
Oceanview
Mortgage
Trust
2022-1,
2022
1
4.500%
11/25/52
82,178
250
(c)
One
Bryant
Park
Trust
2019-OBP,
2019
OBP
2.516%
9/15/54
216,290
200
(c)
ONNI
Commerical
Mortgage
Trust
2024-APT,
2024
APT
5.753%
7/15/39
200,621
280
(c)
RCKT
Mortgage
Trust
2022-4,
2022
4
4.000%
6/25/52
253,738
221
(c)
Sequoia
Mortgage
Trust
2020-1,
2020
1
3.851%
2/25/50
177,937
76
(c)
Sequoia
Mortgage
Trust
2021-4,
2021
4
2.500%
6/25/51
62,148
500
Wells
Fargo
Commercial
Mortgage
Trust
2015-NXS2,
2015
NXS2
3.767%
7/15/58
487,750
165
Wells
Fargo
Commercial
Mortgage
Trust
2017-C38,
2017
C38
3.917%
7/15/50
155,296
TOTAL
MORTGAGE-BACKED
SECURITIES
(cost
$19,835,606)
20,578,295
Nuveen
Securitized
Credit
Managed
Accounts
Portfolio
(continued)
Portfolio
of
Investments
July
31,
2024
Principal
Amount
(000)
Description
(a)
Coupon
Maturity
Value
X
–
ASSET-BACKED
SECURITIES
-
21.6%
X
5,782,518
$
350
(c)
Affirm
Asset
Securitization
Trust
2023-B,
2023
B
6.820%
9/15/28
$
355,780
250
(b),(c)
AGL
CLO
Ltd,
(TSFR3M
reference
rate
+
2.600%
spread),
2023
25A
7.882%
7/21/36
253,110
97
(c)
Alterna
Funding
III
LLC,
2024
1A
6.260%
5/16/39
97,306
98
(c)
Alterna
Funding
III
LLC,
2024
1A
7.136%
5/16/39
98,041
264
(c)
Avis
Budget
Rental
Car
Funding
AESOP
LLC,
2019
3A
2.360%
3/20/26
260,227
100
(c)
Avis
Budget
Rental
Car
Funding
AESOP
LLC,
2024
1A
5.850%
6/20/30
101,497
150
(c)
Brex
Commercial
Charge
Card
Master
Trust,
2024
1
6.680%
7/15/27
150,917
242
(c)
Capital
Automotive
REIT,
2023
1A
5.750%
9/15/53
243,089
98
(c)
Cars
Net
Lease
Mortgage
Notes
Series
2020-1,
2020
1A
3.100%
12/15/50
89,983
100
(c)
Frontier
Issuer
LLC,
2023
1
6.600%
8/20/53
101,801
217
GM
Financial
Consumer
Automobile
Receivables
Trust
2020-4,
2020
4
0.500%
2/17/26
215,968
246
(b),(c)
Gracie
Point
International
Funding,
(SOFR90A
reference
rate
+
1.950%
spread),
2023
1A
7.299%
9/01/26
247,257
61
(b),(c)
Gracie
Point
International
Funding,
(SOFR90A
reference
rate
+
2.250%
spread),
2023
2A
7.599%
3/01/27
60,823
250
(c)
Hertz
Vehicle
Financing
III
LLC,
2023
3A
5.940%
2/25/28
253,367
100
(c)
Hertz
Vehicle
Financing
III
LP,
2021
2A
2.120%
12/27/27
92,301
141
(c)
Hilton
Grand
Vacations
Trust
2019-A,
2019
AA
2.340%
7/25/33
136,305
95
(c)
Hilton
Grand
Vacations
Trust
2024-2,
2024
2A
5.500%
3/25/38
96,717
100
(c)
Hotwire
Funding
LLC,
2024
1A
5.893%
6/20/54
102,927
300
(b),(c)
Magnetite
XXXVII
Ltd,
(TSFR3M
reference
rate
+
2.300%
spread),
2023
37A
7.582%
10/20/36
303,115
100
(c)
Mercury
Financial
Credit
Card
Master
Trust,
2024
2A
6.560%
7/20/29
101,131
100
(c)
MetroNet
Infrastructure
Issuer
LLC,
2023
1A
6.560%
4/20/53
102,885
100
(c)
MetroNet
Infrastructure
Issuer
LLC,
2024
1A
6.230%
4/20/54
102,544
185
(c)
MVW
2020-1
LLC,
2020
1A
1.740%
10/20/37
175,839
182
(c)
MVW
Owner
Trust
2019-1,
2019
1A
2.890%
11/20/36
178,493
220
(b),(c)
Myers
Park
CLO
Ltd,
(TSFR3M
reference
rate
+
1.862%
spread),
2018
1A
7.144%
10/20/30
220,552
250
(b),(c)
OneMain
Financial
Issuance
Trust
2021-1,
(SOFR30A
reference
rate
+
0.760%
spread),
2021
1A
6.097%
6/16/36
249,777
250
(c)
PenFed
Auto
Receivables
Owner
Trust
2022-A,
2022
A
4.830%
12/15/28
247,230
100
(c)
PFS
Financing
Corp,
2024
D
5.340%
4/15/29
101,401
141
(c)
Taco
Bell
Funding
LLC,
2016
1A
4.970%
5/25/46
139,347
142
(c)
Taco
Bell
Funding
LLC,
2021
1A
1.946%
8/25/51
131,160
260
(c)
Tesla
Auto
Lease
Trust,
2023
B
6.570%
8/20/27
264,092
250
(b),(c)
Texas
Debt
Capital
CLO
2024-I
Ltd,
(TSFR3M
reference
rate
+
1.950%
spread),
2024
1A
7.232%
4/22/37
252,625
100
(c)
VB-S1
Issuer
LLC
-
VBTEL,
2024
1A
5.590%
5/15/54
101,471
50
Volkswagen
Auto
Lease
Trust,
2024
A
5.210%
6/21/27
50,348
100
(c)
Ziply
Fiber
Issuer
LLC,
2024
1A
6.640%
4/20/54
103,092
TOTAL
ASSET-BACKED
SECURITIES
(cost
$5,665,863)
5,782,518
Principal
Amount
(000)
Description
(a)
Coupon
Maturity
Value
X
–
CORPORATE
BONDS
-
0
.9
%
X
256,216
EQUITY
REAL
ESTATE
INVESTMENT
TRUSTS
(REITS)
-
0.9%
$
250
(c)
SBA
Tower
Trust
6.599%
1/15/28
$
256,216
TOTAL
EQUITY
REAL
ESTATE
INVESTMENT
TRUSTS
(REITS)
256,216
TOTAL
CORPORATE
BONDS
(cost
$252,312)
256,216
TOTAL
LONG-TERM
INVESTMENTS
(cost
$25,753,781)
26,617,029
OTHER
ASSETS
&
LIABILITIES,
NET
- 0.7%
176,387
NET
ASSETS
-
100%
$
26,793,416
For
Fund
portfolio
compliance
purposes,
the
Fund’s
industry
classifications
refer
to
any
one
or
more
of
the
industry
sub-classifications
used
by
one
or
more
widely
recognized
market
indexes
or
ratings
group
indexes,
and/or
as
defined
by
Fund
management.
This
definition
may
not
apply
for
purposes
of
this
report,
which
may
combine
industry
sub-classifications
into
sectors
for
reporting
ease.
(a)
All
percentages
shown
in
the
Portfolio
of
Investments
are
based
on
net
assets.
(b)
Variable
rate
security.
The
rate
shown
is
the
coupon
as
of
the
end
of
the
reporting
period.
(c)
Security
is
exempt
from
registration
under
Rule
144A
of
the
Securities
Act
of
1933,
as
amended.
These
securities
are
deemed
liquid
and
may
be
resold
in
transactions
exempt
from
registration,
which
are
normally
those
transactions
with
qualified
institutional
buyers.
As
of
the
end
of
the
reporting
period,
the
aggregate
value
of
these
securities
is
$12,549,780
or
47.1%
of
Total
Investments.
REIT
Real
Estate
Investment
Trust
SOFR
30A
30
Day
Average
Secured
Overnight
Financing
Rate
SOFR
90A
90
Day
Average
Secured
Overnight
Financing
Rate
TSFR
1M
CME
Term
SOFR
1
Month
TSFR
3M
CME
Term
SOFR
3
Month
See
Notes
to
Financial
Statements
Nuveen
Ultra
Short
Municipal
Managed
Accounts
Portfolio
Portfolio
of
Investments
July
31,
2024
Principal
Amount
(000)
Description
(a)
Optional
Call
Provisions
(b)
Value
SHORT-TERM
INVESTMENTS
-
95.9%
X
–
MUNICIPAL
BONDS
-
95
.9
%
X
9,585,000
CALIFORNIA
-
18.9%
$
335
(c)
Bay
Area
Toll
Authority,
California,
Revenue
Bonds,
San
Francisco
Bay
Area
Toll
Bridge,
Series
2024D,
3.850%,
4/01/59
8/24
at
100.00
$
335,000
215
(c)
California
State,
General
Obligation
Bonds,
Kindergarten
University,
Series
2004A-2,
3.750%,
5/01/34
8/24
at
100.00
215,000
335
(c)
California
Statewide
Communities
Development
Authority,
Revenue
Bonds,
Rady
Children's
Hospital
of
San
Diego,
Variable
Rate
Revenue
Bonds,
Series
2008B,
3.820%,
8/15/47
8/24
at
100.00
335,000
335
(c)
Irvine
Ranch
Water
District,
California,
Certificates
of
Participation,
Series
2009S,
3.150%,
10/01/41
8/24
at
100.00
335,000
335
(c)
Metropolitan
Water
District
of
Southern
California,
Water
Revenue
Bonds,
Refunding
Variable
Rate
Demand
Series
2016B-2,
3.850%,
7/01/37
8/24
at
100.00
335,000
335
(c)
San
Mateo
County
Transportation
Authority,
California,
Sales
Tax
Revenue
Bonds,
Limited
Tax
Variable
Rate
Demand
Subordinate
Series
2020B,
3.800%,
6/01/49
8/24
at
100.00
335,000
TOTAL
CALIFORNIA
1,890,000
COLORADO
-
3.2%
325
(c)
Colorado
Health
Facilities
Authority,
Revenue
Bonds,
Boulder
Community
Hospital
Project,
Variable
Rate
Demand
Obligations
Series
2000,
3.580%,
10/01/30
8/24
at
100.00
325,000
TOTAL
COLORADO
325,000
CONNECTICUT
-
6.7%
335
(c)
Connecticut
Health
and
Educational
Facilities
Authority,
Revenue
Bonds,
Yale
University,
Series
2013A,
3.800%,
7/01/42
8/24
at
100.00
335,000
335
(c)
Connecticut
Housing
Finance
Authority,
Housing
Mortgage
Finance
Program
Bonds,
Series
2016A-3,
3.550%,
11/15/45
8/24
at
100.00
335,000
TOTAL
CONNECTICUT
670,000
DISTRICT
OF
COLUMBIA
-
3.4%
335
(c)
Metropolitan
Washington
D.C.
Airports
Authority,
Airport
System
Revenue
Bonds,
Series
2010D,
3.610%,
10/01/40
8/24
at
100.00
335,000
TOTAL
DISTRICT
OF
COLUMBIA
335,000
FLORIDA
-
2.0%
200
(c)
JEA,
Florida,
Water
and
Sewerage
System
Revenue
Bonds,
Variable
Rate
Demand
Obligations
Series
2008A-1
&
2008A-2,
3.450%,
10/01/42
8/24
at
100.00
200,000
TOTAL
FLORIDA
200,000
LOUISIANA
-
3.3%
335
(c)
Louisiana
State,
Gasoline
and
Fuels
Tax
Second
Lien
Revenue
Bonds,
Refunding
Series
2023A-2,
4.050%,
5/01/43
8/24
at
100.00
335,000
TOTAL
LOUISIANA
335,000
MASSACHUSETTS
-
6.4%
300
(c)
Massachusetts
Development
Finance
Agency,
Revenue
Bonds,
Boston
University,
Series
2008U-6E,
4.050%,
10/01/42
8/24
at
100.00
300,000
335
(c)
Massachusetts
Development
Finance
Agency,
Revenue
Bonds,
Mass
General
Brigham,
Series
2024E-2,
3.730%,
7/01/52
8/24
at
100.00
335,000
TOTAL
MASSACHUSETTS
635,000
MICHIGAN
-
3.3%
335
(c)
University
of
Michigan,
General
Revenue
Bonds,
Refunding
Series
2012D-
1,
3.810%,
12/01/24
8/24
at
100.00
335,000
TOTAL
MICHIGAN
335,000
Principal
Amount
(000)
Description
(a)
Optional
Call
Provisions
(b)
Value
MISSOURI
-
3.0%
$
300
(c)
Missouri
Health
and
Educational
Facilities
Authority,
Revenue
Bonds,
Washington
University,
Variable
Rate
Demand
Obligations,
Series
2000B,
3.950%,
3/01/40
8/24
at
100.00
$
300,000
TOTAL
MISSOURI
300,000
NEW
YORK
-
20.1%
335
(c)
Metropolitan
Transportation
Authority,
New
York,
Transportation
Revenue
Bonds,
Variable
Rate
Series
2005D-2,
4.000%,
11/01/35
8/24
at
100.00
335,000
335
(c)
New
York
City
Municipal
Water
Finance
Authority,
New
York,
Water
and
Sewer
System
Second
General
Resolution
Revenue
Bonds,
Fiscal
2014
Adjustable
Rate
Series
AA-6,
4.000%,
6/15/48
8/24
at
100.00
335,000
335
(c)
New
York
City
Transitional
Finance
Authority,
New
York,
Future
Tax
Secured
Bonds,
Subordinate
Fiscal
2013
Series
A-4,
4.050%,
8/01/39
8/24
at
100.00
335,000
335
(c)
New
York
City
Trust
for
Cultural
Resources,
New
York,
Revenue
Bonds,
Pierpont
Morgan
Library,
Series
2004,
3.510%,
2/01/34
8/24
at
100.00
335,000
335
(c)
New
York
City,
New
York,
General
Obligation
Bonds,
Subseries
G-6
Fiscal
Series
2012,
3.350%,
4/01/42
8/24
at
100.00
335,000
335
(c)
New
York
State
Housing
Finance
Agency,
316
Eleventh
Avenue
Housing
Revenue
Bonds,
Variable
Rate
Demand
Obligation
Series
2009A,
3.560%,
5/15/41
8/24
at
100.00
335,000
TOTAL
NEW
YORK
2,010,000
NORTH
CAROLINA
-
3.3%
330
(c)
Charlotte-Mecklenburg
Hospital
Authority,
North
Carolina,
Health
Care
Revenue
Bonds,
DBA
Carolinas
HealthCare
System,
Variable
Rate
Demand
Series
2007E,
4.050%,
1/15/44
-
AGM
Insured
8/24
at
100.00
330,000
TOTAL
NORTH
CAROLINA
330,000
OHIO
-
3.4%
335
(c)
Ohio
Water
Development
Authority,
Water
Pollution
Control
Loan
Fund
Revenue
Bonds,
Series
2024C,
4.050%,
12/01/54
8/24
at
100.00
335,000
TOTAL
OHIO
335,000
PENNSYLVANIA
-
6.1%
335
(c)
Pennsylvania
Turnpike
Commission,
Turnpike
Revenue
Bonds,
Variable
Rate
Series
2020,
3.650%,
12/01/39
8/24
at
100.00
335,000
275
(c)
Philadelphia
Gas
Works,
Pennsylvania,
Revenue
Bonds,
Eighth
Series,
Variable
Rate
Demand
Obligations,
Series
2009C,
3.650%,
8/01/31
8/24
at
100.00
275,000
TOTAL
PENNSYLVANIA
610,000
TENNESSEE
-
3.4%
335
(c)
Metropolitan
Government
of
Nashville
and
Davidson
County
Industrial
Development
Board,
Tennessee,
Multifamily
Housing
Revenue
Bonds,
Summit
Apartments
Project,
Refunding
Series
2006,
3.600%,
7/15/36
8/24
at
100.00
335,000
TOTAL
TENNESSEE
335,000
Nuveen
Ultra
Short
Municipal
Managed
Accounts
Portfolio
(continued)
Portfolio
of
Investments
July
31,
2024
Principal
Amount
(000)
Description
(a)
Optional
Call
Provisions
(b)
Value
VIRGINIA
-
9.4%
$
355
(c)
Fairfax
County
Economic
Development
Authority,
Virginia,
Revenue
Bonds,
Smithsonian
Institution,
Series
2003B,
3.560%,
12/01/33
8/24
at
100.00
$
355,000
250
(c)
Loudoun
County
Industrial
Development
Authority,
Virginia,
Revenue
Bonds,
Howard
Hughes
Medical
Institute,
Variable
Rate
Demand
Obligations,
Series
2003D,
3.520%,
2/15/38
8/24
at
100.00
250,000
335
(c)
Roanoke
Economic
Development
Authority,
Virginia,
Hospital
Revenue
Bonds,
Carilion
Clinic
Obligated
Group,
Refunding
Series
2020C,
3.620%,
7/01/52
8/24
at
100.00
335,000
TOTAL
VIRGINIA
940,000
TOTAL
MUNICIPAL
BONDS
(cost
$9,585,000)
9,585,000
TOTAL
SHORT-TERM
INVESTMENTS
(cost
$9,585,000)
9,585,000
TOTAL
INVESTMENTS
(cost
$
9,585,000
)
-
95
.9
%
9,585,000
OTHER
ASSETS
&
LIABILITIES,
NET
- 4.1%
415,000
NET
ASSETS
-
100%
$
10,000,000
(a)
All
percentages
shown
in
the
Portfolio
of
Investments
are
based
on
net
assets.
(b)
Optional
Call
Provisions:
Dates
(month
and
year)
and
prices
of
the
earliest
optional
call
or
redemption.
There
may
be
other
call
provisions
at
varying
prices
at
later
dates.
Certain
mortgage-backed
securities
may
be
subject
to
periodic
principal
paydowns.
Optional
Call
Provisions
are
not
covered
by
the
report
of
independent
registered
public
accounting
firm.
(c)
Investment
has
a
maturity
of
greater
than
one
year,
but
has
variable
rate
and/or
demand
features
which
qualify
it
as
a
short-term
investment.
The
rate
disclosed,
as
well
as
the
reference
rate
and
spread,
where
applicable,
is
that
in
effect
as
of
the
end
of
the
reporting
period.
This
rate
changes
periodically
based
on
market
conditions
or
a
specified
market
index.
See
Notes
to
Financial
Statements
Statement
of
Assets
and
Liabilities
See
Notes
to
Financial
Statements
July
31,
2024
Municipal
Total
Return
Core
Impact
Bond
Emerging
Markets
Debt
High
Yield
Preferred
Securities
and
Income
Securitized
Credit
ASSETS
Long-term
investments,
at
value
†‡
$
1,526,013,970
$
8,835,223
$
27,146,479
$
17,821,216
$
17,622,976
$
26,617,029
Investments
purchased
with
collateral
from
securities
lending,
at
value
(cost
approximates
value)
–
–
1,149,418
1,447,778
2,476,710
–
Short-term
investments,
at
value
◊
11,385,000
261,000
–
–
–
–
Cash
13,570,116
440
570,749
10,886
–
192,579
Receivables:
Interest
16,598,941
89,509
322,951
306,550
246,605
85,895
Investments
sold
7,605,894
–
–
–
217,900
–
Reimbursement
from
Adviser
88,652
–
12,407
12,532
11,835
12,503
Shares
sold
6,772,050
–
–
–
–
–
Other
100,849
20,691
19,564
19,043
19,137
18,169
Total
assets
1,582,135,472
9,206,863
29,221,568
19,618,005
20,595,163
26,926,175
LIABILITIES
Cash
overdraft
–
–
–
–
11,958
–
Payables:
Collateral
from
securities
lending
–
–
1,149,418
1,447,778
2,476,710
–
Dividends
1,227,904
35,082
–
106,974
91,580
97,182
Interest
682
—
–
—
–
—
Payable
to
Adviser
–
40,842
–
–
–
–
Investments
purchased
-
regular
settlement
3,724,473
—
–
–
200,000
–
Investments
purchased
-
when-issued/delayed-
delivery
settlement
5,670,407
249,999
–
–
–
–
Shares
redeemed
5,582,251
–
–
9,488
4,687
19,206
Accrued
expenses:
Custodian
fees
120,354
13,373
11,289
12,713
7,512
11,950
Trustees
fees
58,970
190
482
301
296
434
Professional
fees
47,493
2,502
2,971
2,659
2,801
3,039
Shareholder
reporting
expenses
18,351
467
707
549
549
670
Shareholder
servicing
agent
fees
126,094
38
83
66
76
80
Other
7,006
—
—
270
—
198
Total
liabilities
16,583,985
342,493
1,164,950
1,580,798
2,796,169
132,759
Net
assets
$
1,565,551,487
$
8,864,370
$
28,056,618
$
18,037,207
$
17,798,994
$
26,793,416
NET
ASSETS
CONSIST
OF:
Paid-in
capital
$
1,711,398,428
$
11,129,191
$
26,659,198
$
17,334,987
$
17,046,144
$
25,697,166
Total
distributable
earnings
(loss)
(145,846,941)
(2,264,821)
1,397,420
702,220
752,850
1,096,250
Net
assets
$
1,565,551,487
$
8,864,370
$
28,056,618
$
18,037,207
$
17,798,994
$
26,793,416
Shares
outstanding
153,177,119
1,126,574
2,659,131
1,732,189
1,706,572
2,556,880
Net
asset
value
("NAV")
per
share
10.22
7.87
10.55
10.41
10.43
10.48
Authorized
shares
-
per
class
Unlimited
Unlimited
Unlimited
Unlimited
Unlimited
Unlimited
Par
value
per
share
$
0.01
$
0.01
$
0.01
$
0.01
$
0.01
$
0.01
†
Long-term
investments,
cost
$
1,506,574,726
$
9,910,852
$
26,076,848
$
17,322,033
$
17,042,857
$
25,753,781
◊
Short-term
investments,
cost
$
11,385,000
$
261,038
$
—
$
—
$
—
$
—
‡
Includes
securities
loaned
of
$
—
$
—
$
1,109,453
$
1,390,181
$
2,391,331
$
—
Statement
of
Assets
and
Liabilities
(continued)
See
Notes
to
Financial
Statements
July
31,
2024
Ultra
Short
Municipal
ASSETS
Short-term
investments,
at
value
◊
9,585,000
Cash
25,613
Receivables:
Interest
24,034
Investments
sold
360,113
Reimbursement
from
Adviser
19,813
Other
17,789
Total
assets
10,032,362
LIABILITIES
Payables:
Dividends
23,152
Payable
to
Adviser
–
Accrued
expenses:
Custodian
fees
6,644
Trustees
fees
114
Professional
fees
1,445
Other
1,007
Total
liabilities
32,362
Net
assets
$
10,000,000
NET
ASSETS
CONSIST
OF:
Paid-in
capital
$
10,000,000
Total
distributable
earnings
(loss)
–
Net
assets
$
10,000,000
Shares
outstanding
1,000,000
Net
asset
value
("NAV")
per
share
10.00
Authorized
shares
-
per
class
Unlimited
Par
value
per
share
$
0.01
◊
Short-term
investments,
cost
$
9,585,000
See
Notes
to
Financial
Statements
Year
Ended
July
31,
2024
Municipal
Total
Return
Core
Impact
Bond
Emerging
Markets
Debt
High
Yield
INVESTMENT
INCOME
Dividends
$
—
$
—
$
—
$
5,106
Interest
60,807,682
406,617
1,758,558
1,314,920
Securities
lending
income,
net
—
360
4,908
11,297
Tax
withheld
—
—
(
666
)
—
Total
investment
income
60,807,682
406,977
1,762,800
1,331,323
EXPENSES
–
–
–
–
Shareholder
servicing
agent
fees
417,106
256
65
78
Interest
expense
46,831
58
126
240
Trustees
fees
54,992
319
1,024
651
Custodian
expenses,
net
138,208
21,488
18,102
22,524
Registration
fees
175,362
28,943
28,833
28,578
Professional
fees
192,098
59,288
78,571
70,366
Shareholder
reporting
expenses
46,494
5,855
11,669
12,080
Other
18,922
5,434
6,374
6,842
Total
expenses
before
fee
waiver/expense
reimbursement
1,090,013
121,641
144,764
141,359
Fee
waiver/expense
reimbursement
(
1,066,987
)
(
121,592
)
(
144,670
)
(
141,137
)
Net
expenses
23,026
49
94
222
Net
investment
income
(loss)
60,784,656
406,928
1,762,706
1,331,101
REALIZED
AND
UNREALIZED
GAIN
(LOSS)
Realized
gain
(loss)
from:
Investments
(
19,242,817
)
(
516,667
)
200,624
203,370
Net
realized
gain
(loss)
(
19,242,817
)
(
516,667
)
200,624
203,370
Change
in
unrealized
appreciation
(depreciation)
on:
Investments
26,827,234
666,388
(
19,849
)
286,601
Net
change
in
unrealized
appreciation
(depreciation)
26,827,234
666,388
(
19,849
)
286,601
Net
realized
and
unrealized
gain
(loss)
7,584,417
149,721
180,775
489,971
Net
increase
(decrease)
in
net
assets
from
operations
$
68,369,073
$
556,649
$
1,943,481
$
1,821,072
Statement
of
Operations
(continued)
See
Notes
to
Financial
Statements
Year
Ended
July
31,
2024
Preferred
Securities
and
Income
Securitized
Credit
Ultra
Short
Municipal(a)
INVESTMENT
INCOME
Dividends
$
50,318
$
—
$
—
Interest
1,111,944
1,460,907
137,969
Securities
lending
income,
net
9,636
—
—
Tax
withheld
(
2,080
)
—
—
Total
investment
income
1,169,818
1,460,907
137,969
EXPENSES
–
–
–
Shareholder
servicing
agent
fees
99
126
1,243
Interest
expense
142
25
—
Trustees
fees
629
954
199
Custodian
expenses
11,015
17,868
8,336
Registration
fees
28,540
29,281
18,960
Professional
fees
84,971
71,910
119,666
Shareholder
reporting
expenses
11,543
11,738
457
Other
4,787
5,307
898
Total
expenses
before
fee
waiver/expense
reimbursement
141,726
137,209
149,759
Fee
waiver/expense
reimbursement
(
141,602
)
(
137,209
)
(
149,759
)
Net
expenses
124
—
—
Net
investment
income
(loss)
1,169,694
1,460,907
137,969
REALIZED
AND
UNREALIZED
GAIN
(LOSS)
Realized
gain
(loss)
from:
Investments
201,636
188,554
—
Foreign
currency
transactions
14
—
—
Net
realized
gain
(loss)
201,650
188,554
–
Change
in
unrealized
appreciation
(depreciation)
on:
Investments
855,041
340,757
—
Net
change
in
unrealized
appreciation
(depreciation)
855,041
340,757
–
Net
realized
and
unrealized
gain
(loss)
1,056,691
529,311
—
Net
increase
(decrease)
in
net
assets
from
operations
$
2,226,385
$
1,990,218
$
137,969
(a)
For
the
period
February
29,
2024
(commencement
of
operations)
through
July
31,
2024.
Statement
of
Changes
in
Net
Assets
See
Notes
to
Financial
Statements
Municipal
Total
Return
Year
Ended
7/31/24
Year
Ended
7/31/23
OPERATIONS
Net
investment
income
(loss)
$
60,784,656
$
50,201,454
Net
realized
gain
(loss)
(19,242,817)
(101,338,619)
Net
change
in
unrealized
appreciation
(depreciation)
26,827,234
39,435,944
Net
increase
(decrease)
in
net
assets
from
operations
68,369,073
(11,701,221)
DISTRIBUTIONS
TO
SHAREHOLDERS
Dividends
(60,373,205)
(50,040,266)
Total
distributions
(60,373,205)
(50,040,266)
FUND
SHARE
TRANSACTIONS
Subscriptions
620,670,921
789,630,438
Reinvestments
of
distributions
46,693,208
37,754,645
Redemptions
(593,848,373)
(758,898,628)
Net
increase
(decrease)
from
Fund
share
transactions
73,515,756
68,486,455
Net
increase
(decrease)
in
net
assets
81,511,624
6,744,968
Net
assets
at
the
beginning
of
period
1,484,039,863
1,477,294,895
Net
assets
at
the
end
of
period
$
1,565,551,487
$
1,484,039,863
See
Notes
to
Financial
Statements
Statement
of
Changes
in
Net
Assets
(continued)
Core
Impact
Bond
Year
Ended
7/31/24
Nine
Months
Ended
7/31/23
Year
Ended
10/31/22
Operations
Net
investment
income
(loss)
$
406,928
$
276,682
$
295,489
Net
realized
gain
(loss)
(516,667)
(306,108)
(247,326)
Net
change
in
unrealized
appreciation
(depreciation)
666,388
506,380
(2,152,999)
Net
increase
(decrease)
in
net
assets
from
operations
556,649
476,954
(2,104,836)
DISTRIBUTIONS
TO
SHAREHOLDERS
Dividends
(417,176)
(294,771)
(314,641)
Total
distributions
(417,176)
(294,771)
(314,641)
FUND
SHARE
TRANSACTIONS
Subscriptions
–
6,000
–
Reinvestments
of
distributions
8,607
294,776
314,635
Net
increase
(decrease)
from
Fund
share
transactions
8,607
300,776
314,635
Net
increase
(decrease)
in
net
assets
148,080
482,959
(2,104,842)
Net
assets
at
the
beginning
of
period
8,716,290
8,233,331
10,338,173
Net
assets
at
the
end
of
period
$
8,864,370
$
8,716,290
$
8,233,331
See
Notes
to
Financial
Statements
Emerging
Markets
Debt
High
Yield
Year
Ended
7/31/24
For
the
Period
11/01/22
(commencement
of
operations)
through
7/31/23
Year
Ended
7/31/24
For
the
Period
11/01/22
(commencement
of
operations)
through
7/31/23
OPERATIONS
Net
investment
income
(loss)
$
1,762,706
$
1,241,668
$
1,331,101
$
833,762
Net
realized
gain
(loss)
200,624
141,523
203,370
4,039
Net
change
in
unrealized
appreciation
(depreciation)
(19,849)
1,089,479
286,601
212,582
Net
increase
(decrease)
in
net
assets
from
operations
1,943,481
2,472,670
1,821,072
1,050,383
DISTRIBUTIONS
TO
SHAREHOLDERS
Dividends
(1,919,930)
(1,098,801)
(1,330,002)
(839,233)
Total
distributions
(1,919,930)
(1,098,801)
(1,330,002)
(839,233)
FUND
SHARE
TRANSACTIONS
Subscriptions
519,965
25,030,000
1,395,770
15,080,000
Reinvestments
of
distributions
38,859
1,098,801
110,058
839,230
Redemptions
(28,427)
–
(90,071)
–
Net
increase
(decrease)
from
Fund
share
transactions
530,397
26,128,801
1,415,757
15,919,230
Net
increase
(decrease)
in
net
assets
553,948
27,502,670
1,906,827
16,130,380
Net
assets
at
the
beginning
of
period
27,502,670
–
16,130,380
–
Net
assets
at
the
end
of
period
$
28,056,618
$
27,502,670
$
18,037,207
$
16,130,380
See
Notes
to
Financial
Statements
Statement
of
Changes
in
Net
Assets
(continued)
Preferred
Securities
and
Income
Securitized
Credit
Year
Ended
7/31/24
For
the
Period
11/01/22
(commencement
of
operations)
through
7/31/23
Year
Ended
7/31/24
For
the
Period
11/01/22
(commencement
of
operations)
through
7/31/23
OPERATIONS
Net
investment
income
(loss)
$
1,169,694
$
770,145
$
1,460,907
$
819,378
Net
realized
gain
(loss)
201,650
36,365
188,554
32,279
Net
change
in
unrealized
appreciation
(depreciation)
855,041
(274,922)
340,757
522,491
Net
increase
(decrease)
in
net
assets
from
operations
2,226,385
531,588
1,990,218
1,374,148
DISTRIBUTIONS
TO
SHAREHOLDERS
Dividends
(1,218,770)
(786,353)
(1,516,440)
(751,676)
Total
distributions
(1,218,770)
(786,353)
(1,516,440)
(751,676)
FUND
SHARE
TRANSACTIONS
Subscriptions
1,180,279
15,050,000
4,665,291
20,240,000
Reinvestments
of
distributions
78,694
786,355
257,560
751,674
Redemptions
(49,184)
–
(217,359)
–
Net
increase
(decrease)
from
Fund
share
transactions
1,209,789
15,836,355
4,705,492
20,991,674
Net
increase
(decrease)
in
net
assets
2,217,404
15,581,590
5,179,270
21,614,146
Net
assets
at
the
beginning
of
period
15,581,590
–
21,614,146
–
Net
assets
at
the
end
of
period
$
17,798,994
$
15,581,590
$
26,793,416
$
21,614,146
See
Notes
to
Financial
Statements
Ultra
Short
Municipal
For
the
Period
2/29/24
(commencement
of
operations)
through
7/31/24
OPERATIONS
Net
investment
income
(loss)
$
137,969
Net
increase
(decrease)
in
net
assets
from
operations
137,969
DISTRIBUTIONS
TO
SHAREHOLDERS
Dividends
(137,969)
Total
distributions
(137,969
)
FUND
SHARE
TRANSACTIONS
Subscriptions
10,000,000
Net
increase
(decrease)
from
Fund
share
transactions
10,000,000
Net
increase
(decrease)
in
net
assets
10,000,000
Net
assets
at
the
beginning
of
period
–
Net
assets
at
the
end
of
period
$
10,000,000
The
following
data
is
for
a
share outstanding
for
each
fiscal year
end
unless
otherwise
noted:
Investment
Operations
Less
Distributions
Net
Asset
Value,
Beginning
of
Period
Net
Investment
Income
(NII)
(Loss)(a)
Net
Realized/
Unrealized
Gain
(Loss)
Total
From
NII
From
Net
Realized
Gains
Total
Net
Asset
Value,
End
of
Period
Municipal
Total
Return
7/31/24
$
10.13
$
0.41
$
0.09
$
0.50
$
(0.41)
$
—
$
(0.41)
$
10.22
7/31/23
10.52
0.36
(0.39)
(0.03)
(0.36)
—
(0.36)
10.13
7/31/22
11.95
0.32
(1.43)
(1.11)
(0.32)
—
(0.32)
10.52
7/31/21
11.71
0.33
0.24
0.57
(0.33)
—
(0.33)
11.95
7/31/20
11.50
0.35
0.21
0.56
(0.35)
—
(0.35)
11.71
(a)
Based
on
average
shares
outstanding.
(b)
Percentage
is
not
annualized.
(c)
The
expense
ratios
reflect,
among
other
things,
the
interest
expense
deemed
to
have
been
paid
by
the
Fund
on
the
floating
rate
certificates
issued
by
the
special
purpose
trusts
for
the
self-deposited
inverse
floaters
held
by
the
Fund,
where
applicable,
as
described
in
Notes
to
Financial
Statements
and
the
interest
expense
and
fees
paid
on
borrowings,
as
described
in
Notes
to
Financial
Statements.
(d)
After
fee
waiver
and/or
expense
reimbursement
from
the
Adviser,
where
applicable.
See
Notes
to
Financial
Statements
for
more
information.
(e)
Value
rounded
to
zero.
See
Notes
to
Financial
Statements
Ratio/Supplemental
Data
Ratios
to
Average
Net
Assets
Total
Return(b)
Net
Assets,
End
of
Period
(000)
Gross
Expenses
Including
Interest(c)
Gross
Expenses
Excluding
Interest
Net
Expenses
Including
Interest(c),(d)
Net
Expenses
Excluding
Interest(d)
NII
(Loss)(d)
Portfolio
Turnover
Rate
5.08
%
$
1,565,551
0.07
%
0.07
%
—(e)
—(e)
4.10
%
43
%
(0.19)
1,484,040
0.11
0.06
0.04
—(e)
3.59
58
(9
.42)
1,477,295
0.11
0.05
0.06
—
2.81
32
4.96
1,631,074
0.10
0.05
0.05
—(e)
2.80
7
5.00
1,358,883
0.18
0.06
0.12
—
3.07
19
Financial
Highlights
(continued)
The
following
data
is
for
a
share
outstanding
for
each
fiscal
year
end
unless
otherwise
noted:
4
Investment
Operations
Less
Distributions
Net
Asset
Value,
Beginning
of
Period
Net
Investment
Income
(NII)
(Loss)(a)
Net
Realized/
Unrealized
Gain
(Loss)
Total
From
NII
From
Net
Realized
Gains
Total
Net
Asset
Value,
End
of
Period
Core
Impact
Bond
7/31/24
$
7.74
$
0.36
$
0.14
$
0.50
$
(0.37)
$
—
$
(0.37)
$
7.87
7/31/23(e)
7.57
0.25
0.19
0.44
(0.27)
—
(0.27)
7.74
10/31/22
9.84
0.28
(2.25)
(1.97)
(0.30)
—
(0.30)
7.57
10/31/21
9.90
0.24
(0.03)
0.21
(0.27)
—
(0.27)
9.84
10/31/20(g)
10.00
0.04
(0.12)
(0.08)
(0.02)
—
(0.02)
9.90
(a)
Based
on
average
shares
outstanding.
(b)
Percentage
is
not
annualized.
(c)
After
fee
waiver
and/or
expense
reimbursement
from
the
Adviser,
where
applicable.
See
Notes
to
Financial
Statements
for
more
information.
(d)
Value
rounded
to
zero.
(e)
For
the
nine
months
ended
July
31,
2023.
(f)
Annualized.
(g)
For
the
period
July
9,
2020
(commencement
of
operations)
through
October
31,
2020.
See
Notes
to
Financial
Statements
Ratio/Supplemental
Data
Ratios
to
Average
Net
Assets
Total
Return(b)
Net
Assets,
End
of
Period
(000)
Gross
Expenses
Net
Expenses(c)
NII
(Loss)(c)
Portfolio
Turnover
Rate
6.70
%
$
8,864
1.41
%
—(d)
4.72
%
71
%
5.77
8,716
2.56
(f)
—(f)
4.26
(f)
46
(20.41)
8,233
2.16
—(d)
3.15
53
2.17
10,338
2.13
—(d)
2.39
96
(0.77)
10,122
0.99
(f)
—(f)
1.13
(f)
113
Financial
Highlights
(continued)
The
following
data
is
for
a
share outstanding
for
each
fiscal year
end
unless
otherwise
noted:
Investment
Operations
Less
Distributions
Net
Asset
Value,
Beginning
of
Period
Net
Investment
Income
(NII)
(Loss)(a)
Net
Realized/
Unrealized
Gain
(Loss)
Total
From
NII
From
Net
Realized
Gains
Total
Net
Asset
Value,
End
of
Period
Emerging
Markets
Debt
7/31/24
$
10.55
$
0.66
$
0.06
$
0.72
$
(
0.66
)
$
(
0.06
)
$
(
0.72
)
$
10.55
7/31/23(e)
10.00
0.49
0.49
0.98
(
0.43
)
—
(
0.43
)
10.55
(a)
Based
on
average
shares
outstanding.
(b)
Percentage
is
not
annualized.
(c)
After
fee
waiver
and/or
expense
reimbursement
from
the
Adviser,
where
applicable.
See
Notes
to
Financial
Statements
for
more
information.
(d)
Value
rounded
to
zero.
(e)
For
the
period
November
1,
2022
(commencement
of
operations)
through
July
31,
2023.
(f)
Annualized.
See
Notes
to
Financial
Statements
Ratio/Supplemental
Data
Ratios
to
Average
Net
Assets
Total
Return(b)
Net
Assets,
End
of
Period
(000)
Gross
Expenses
Net
Expenses(c)
NII
(Loss)(c)
Portfolio
Turnover
Rate
7
.15
%
$
28,057
0
.53
%
—
(d)
6
.40
%
27
%
9
.93
27,503
0
.51
(f)
—
(f)
6
.22
(f)
15
Financial
Highlights
(continued)
The
following
data
is
for
a
share outstanding
for
each
fiscal year
end
unless
otherwise
noted:
Investment
Operations
Less
Distributions
Net
Asset
Value,
Beginning
of
Period
Net
Investment
Income
(NII)
(Loss)(a)
Net
Realized/
Unrealized
Gain
(Loss)
Total
From
NII
From
Net
Realized
Gains
Total
Net
Asset
Value,
End
of
Period
High
Yield
7/31/24
$
10.14
$
0.77
$
0.27
$
1.04
$
(
0.77
)
$
(
—
)
(d)
$
(
0.77
)
$
10.41
7/31/23(e)
10.00
0.54
0.14
0.68
(
0.54
)
—
(
0.54
)
10.14
(a)
Based
on
average
shares
outstanding.
(b)
Percentage
is
not
annualized.
(c)
After
fee
waiver
and/or
expense
reimbursement
from
the
Adviser,
where
applicable.
See
Notes
to
Financial
Statements
for
more
information.
(d)
Value
rounded
to
zero.
(e)
For
the
period
November
1,
2022
(commencement
of
operations)
through
July
31,
2023.
(f)
Annualized.
See
Notes
to
Financial
Statements
Ratio/Supplemental
Data
Ratios
to
Average
Net
Assets
Total
Return(b)
Net
Assets,
End
of
Period
(000)
Gross
Expenses
Net
Expenses(c)
NII
(Loss)(c)
Portfolio
Turnover
Rate
10
.69
%
$
18,037
0
.80
%
—
(d)
7
.57
%
77
%
7
.01
16,130
0
.87
(f)
—
(f)
7
.19
(f)
16
Financial
Highlights
(continued)
The
following
data
is
for
a
share outstanding
for
each
fiscal year
end
unless
otherwise
noted:
Investment
Operations
Less
Distributions
Net
Asset
Value,
Beginning
of
Period
Net
Investment
Income
(NII)
(Loss)(a)
Net
Realized/
Unrealized
Gain
(Loss)
Total
From
NII
From
Net
Realized
Gains
Total
Net
Asset
Value,
End
of
Period
Preferred
Securities
and
Income
7/31/24
$
9.84
$
0.69
$
0.62
$
1.31
$
(
0.70
)
$
(
0.02
)
$
(
0.72
)
$
10.43
7/31/23(e)
10.00
0.50
(
0.15
)
0.35
(
0.51
)
—
(
0.51
)
9.84
(a)
Based
on
average
shares
outstanding.
(b)
Percentage
is
not
annualized.
(c)
After
fee
waiver
and/or
expense
reimbursement
from
the
Adviser,
where
applicable.
See
Notes
to
Financial
Statements
for
more
information.
(d)
Value
rounded
to
zero.
(e)
For
the
period
November
1,
2022
(commencement
of
operations)
through
July
31,
2023.
(f)
Annualized.
See
Notes
to
Financial
Statements
Ratio/Supplemental
Data
Ratios
to
Average
Net
Assets
Total
Return(b)
Net
Assets,
End
of
Period
(000)
Gross
Expenses
Net
Expenses(c)
NII
(Loss)(c)
Portfolio
Turnover
Rate
13
.85
%
$
17,799
0
.84
%
—
(d)
6
.90
%
38
%
3
.57
15,582
0
.79
(f)
—
(f)
6
.76
(f)
10
Financial
Highlights
(continued)
The
following
data
is
for
a
share outstanding
for
each
fiscal year
end
unless
otherwise
noted:
Investment
Operations
Less
Distributions
Net
Asset
Value,
Beginning
of
Period
Net
Investment
Income
(NII)
(Loss)(a)
Net
Realized/
Unrealized
Gain
(Loss)
Total
From
NII
From
Net
Realized
Gains
Total
Net
Asset
Value,
End
of
Period
Securitized
Credit
7/31/24
$
10.31
$
0.58
$
0.19
$
0.77
$
(
0.57
)
$
(
0.03
)
$
(
0.60
)
$
10.48
7/31/23(e)
10.00
0.40
0.28
0.68
(
0.37
)
—
(
0.37
)
10.31
(a)
Based
on
average
shares
outstanding.
(b)
Percentage
is
not
annualized.
(c)
After
fee
waiver
and/or
expense
reimbursement
from
the
Adviser,
where
applicable.
See
Notes
to
Financial
Statements
for
more
information.
(d)
Value
rounded
to
zero.
(e)
For
the
period
November
1,
2022
(commencement
of
operations)
through
July
31,
2023.
(f)
Annualized.
See
Notes
to
Financial
Statements
Ratio/Supplemental
Data
Ratios
to
Average
Net
Assets
Total
Return(b)
Net
Assets,
End
of
Period
(000)
Gross
Expenses
Net
Expenses(c)
NII
(Loss)(c)
Portfolio
Turnover
Rate
7
.81
%
$
26,793
0
.54
%
—
(d)
5
.70
%
46
%
6
.82
21,614
0
.66
(f)
—
(f)
5
.20
(f)
17
Financial
Highlights
(continued)
The
following
data
is
for
a
share
outstanding
for
each
fiscal
year
end
unless
otherwise
noted:
4
Investment
Operations
Less
Distributions
Net
Asset
Value,
Beginning
of
Period
Net
Investment
Income
(NII)
(Loss)(a)
Net
Realized/
Unrealized
Gain
(Loss)
Total
From
NII
From
Net
Realized
Gains
Total
Net
Asset
Value,
End
of
Period
Ultra
Short
Municipal
7/31/24(d)
$
10.00
$
0.14
$
—
$
0.14
$
(
0.14
)
$
—
$
(
0.14
)
$
10.00
(a)
Based
on
average
shares
outstanding.
(b)
Percentage
is
not
annualized.
(c)
After
fee
waiver
and/or
expense
reimbursement
from
the
Adviser,
where
applicable.
See
Notes
to
Financial
Statements
for
more
information.
(d)
For
the
period
February
29,
2024
(commencement
of
operations)
through
July
31,
2024.
(e)
Annualized.
See
Notes
to
Financial
Statements
Ratio/Supplemental
Data
Ratios
to
Average
Net
Assets
Total
Return(b)
Net
Assets,
End
of
Period
(000)
Gross
Expenses
Net
Expenses(c)
NII
(Loss)(c)
Portfolio
Turnover
Rate
1
.39
%
$
10,000
1
.91
%
(e)
—
(e)
3
.28
%
(e)
—
%
Notes
to
Financial
Statements
1.
General
Information
Trust
and
Fund
Information
:
The
Nuveen
Managed
Accounts
Portfolios
Trust
(the
“Trust”)
is
an
open-end
management
investment
company
registered
under
the
Investment
Company
Act
of
1940
(the
“1940
Act”),
as
amended.
The
Trust
is
comprised
of
Municipal
Total
Return
Managed
Accounts
Portfolio
(“Municipal
Total
Return”),
Nuveen
Core
Impact
Bond
Managed
Accounts
Portfolio
(“Core
Impact
Bond”),
Nuveen
Emerging
Markets
Debt
Managed
Accounts
Portfolio
(“Emerging
Markets
Debt”),
Nuveen
High
Yield
Managed
Accounts
Portfolio
(“High
Yield”),
Nuveen
Preferred
Securities
and
Income
Managed
Accounts
Portfolio
(“Preferred
Securities
and
Income”),
Nuveen
Securitized
Credit
Managed
Accounts
Portfolio
(“Securitized
Credit
Managed”)
and
Nuveen
Ultra
Short
Municipal
Managed
Accounts
Portfolio
(“Ultra
Short
Municipal”)
(each
a
“Fund”
and
collectively
the
“Funds”),
among
others.
The
Trust
was
organized
as
a
Massachusetts
business
trust
on
November
14,
2006.
Each
Fund
is
developed
exclusively
for
use
within
separately
managed
accounts
sponsored
by
Nuveen,
LLC
(“Nuveen”).
Each
Fund
is
a
specialized
fixed-income
fund
to
be
used
in
combination
with
selected
individual
securities
to
effectively
model
institutional-level
investment
strategies.
Each
Fund
enables
certain
Nuveen
separately
managed
account
investors
to
achieve
greater
diversification
and
return
potential
that
smaller
managed
accounts
might
otherwise
achieve
by
investing
in
additional
fixed-income
classes,
including
those
that
have
a
lower
credit
quality,
higher
yielding
securities
and
to
gain
access
to
special
investment
opportunities
normally
available
only
to
institutional
investors.
Current
Fiscal
Period:
The
end
of
the
reporting
period
for
the
Funds
is
July
31,
2024,
and
the
period
covered
by
these
Notes
to
Financial
Statements
is
for
the
fiscal
year
July
31,
2024,
while
the
reporting
period
for
Ultra
Short
Municipal
is
the
period
February
29,
2024
(commencement
of
operations)
through
July
31,
2024
(the
"current
fiscal
period").
Investment
Adviser
and
Sub-Adviser:
The
Funds'
investment
adviser
is
Nuveen
Fund
Advisors,
LLC
(the
“Adviser”),
a
subsidiary
of
Nuveen,
LLC
(“Nuveen”).
Nuveen
is
the
investment
management
arm
of
Teachers
Insurance
and
Annuity
Association
of
America
(TIAA).
The
Adviser
has
overall
responsibility
for
management
of
the
Funds,
oversees
the
management
of
the
Funds'
portfolio,
manages
the
Funds'
business
affairs
and
provides
certain
clerical,
bookkeeping
and
other
administrative
services,
and,
if
necessary,
asset
allocation
decisions.
The
Adviser
has
entered
into sub-
advisory
agreements
with
Nuveen
Asset
Management,
LLC,
(the
“Sub-Adviser”),
a
subsidiary
of
the
Adviser,
under
which
the
Sub-Adviser
manages
the
investment
portfolios
of
the
Funds.
2.
Significant
Accounting
Policies
The
accompanying
financial
statements
were
prepared
in
accordance
with
accounting
principles
generally
accepted
in
the
United
States
of
America
(“U.S.
GAAP”),
which
may
require
the
use
of
estimates
made
by
management
and
the
evaluation
of
subsequent
events.
Actual
results
may
differ
from
those
estimates. Each
Fund
is
an
investment
company
and
follows
accounting
guidance
in
the
Financial
Accounting
Standards
Board
(“FASB”)
Accounting
Standards
Codification
946,
Financial
Services
–
Investment
Companies.
The
net
asset
value
(“NAV”)
for
financial
reporting
purposes
may
differ
from
the
NAV
for
processing
security
and
shareholder
transactions.
The
NAV
for
financial
reporting
purposes
includes
security
and
common
shares
transactions
through
the
date
of
the
report.
Total
return
is
computed
based
on
the
NAV
used
for
processing
security
and common
shares transactions.
The
following
is
a
summary
of
the
significant
accounting
policies
consistently
followed
by
the
Funds.
Compensation:
The Trust
pays
no
compensation
directly
to
those
of
its officers,
all
of
whom
receive
remuneration
for
their
services
to the
Trust
from
the
Adviser
or
its
affiliates.
The
Funds'
Board
of Trustees
(the
"Board") has
adopted
a
deferred
compensation
plan
for
independent
trustees
that
enables
trustees
to
elect
to
defer
receipt
of
all
or
a
portion
of
the
annual
compensation
they
are
entitled
to
receive
from
certain
Nuveen-advised
funds.
Under
the
plan,
deferred
amounts
are
treated
as
though
equal
dollar
amounts
had
been
invested
in
shares
of
select
Nuveen-advised
funds.
Custodian
Fee
Credit:
As
an
alternative
to
overnight
investments,
Municipal
Total
Return
has
an
arrangement
with
its
custodian
bank,
State
Street
Bank
and
Trust
Company,
(the
“Custodian”)
whereby
certain
custodian
fees
and
expenses
are
reduced
by
net
credits
earned
on
the
Fund’s
cash
on
deposit
with
the
bank.
Credits
for
cash
balances
may
be
offset
by
charges
for
any
days
on
which
the
Fund
overdraws
its
account
at
the
Custodian.
The
amount
of
custodian
fee
credit
earned
by
the
Fund
is
recognized
on
the
Statement
of
Operations
as
a
component
of
“Custodian
expenses,
net”.
During
the
current
reporting
period,
the
custodian
fee
credit
earned
by
the
Fund
was
as
follows:
Distributions
to
Shareholders:
Distributions
to
shareholders
are
recorded
on
the
ex-dividend
date.
The
amount,
character
and
timing
of
distributions
are
determined
in
accordance
with
federal
income
tax
regulations,
which
may
differ
from
U.S.
GAAP.
Foreign
Currency
Transactions
and
Translation:
The
books
and
records
of
the
Funds
are
maintained
in
U.S.
dollars.
Assets,
including
investments,
and
liabilities
denominated
in
foreign
currencies
are
translated
into
U.S.
dollars
at
the
end
of
each
day.
Purchases
and
sales
of
securities,
income
and
expenses
are
translated
into
U.S.
dollars
at
the
prevailing
exchange
rate
on
the
respective
dates
of
the
transactions.
Net
realized
foreign
currency
gains
and
losses
resulting
from
changes
in
exchange
rates
associated
with
(i)
foreign
currency,
(ii)
investments
and
(iii)
derivatives
include
foreign
currency
gains
and
losses
between
trade
date
and
settlement
date
of
the
transactions,
foreign
currency
transactions,
and
the
difference
between
the
amounts
of
interest
and
dividends
recorded
on
the
books
of
the
Funds
and
the
amounts
actually
received
are
recognized
as
a
component
of
“Net
realized
gain
(loss)
from
foreign
currency
transactions”
on
the
Statement
of
Operations,
when
applicable.
Fund
Gross
Custodian
Fee
Credits
Municipal
Total
Return
$
91,864
The
unrealized
gains
and
losses
resulting
from
changes
in
foreign
currency
exchange
rates
and
changes
in
foreign
exchange
rates
associated
with
(i)
investments
and
(ii)
other
assets
and
liabilities
are
recognized
as
a
component
of
“Change
in
unrealized
appreciation
(depreciation)
on foreign
currency
translations”
on
the
Statement
of
Operations,
when
applicable.
The
unrealized
gains
and
losses
resulting
from
changes
in
foreign
exchange
rates
associated
with
investments
in
derivatives
are
recognized
as
a
component
of
the
respective
derivative’s
related
“Change
in
unrealized
appreciation
(depreciation)”
on
the
Statement
of
Operations,
when
applicable.
As
of
the
end
of
the
reporting
period,
the
following
Funds'
investments
in
non-U.S.
securities
were
as
follows:
Core
Impact
Bond
Value
%
of
Net
Assets
Supranational
$
486,781
5.5
%
Canada
400,214
4.5
Mauritius
262,350
3.0
Germany
256,447
2.9
Singapore
238,598
2.7
Sweden
204,059
2.3
Netherlands
198,567
2.2
Dominican
Republic
154,419
1.7
United
Arab
Emirates
152,748
1.7
Panama
145,745
1.7
Cayman
Islands
106,345
1.2
France
69,701
0.8
Total
non-U.S.
Securities
$2,675,974
30.2%
Emerging
Markets
Debt
Value
%
of
Net
Assets
Mexico
$
3,079,238
11.0
%
Chile
2,137,438
7.6
Indonesia
1,887,705
6.7
United
Arab
Emirates
1,686,336
6.0
Saudi
Arabia
1,364,135
4.9
Peru
1,332,426
4.8
Turkey
1,016,350
3.6
India
982,158
3.5
Israel
920,584
3.3
Poland
896,163
3.2
South
Africa
841,278
3.0
Colombia
788,404
2.8
Romania
761,906
2.7
Panama
746,960
2.7
Brazil
687,778
2.4
Qatar
672,912
2.4
Dominican
Republic
643,841
2.3
Hungary
609,877
2.2
Malaysia
568,808
2.0
Philippines
552,562
2.0
Kazakhstan
435,300
1.5
Other
4,534,320
16.2
Total
non-U.S.
Securities
$27,146,479
96.8%
Preferred
Securities
and
Income
Value
%
of
Net
Assets
United
Kingdom
$
2,375,709
13.4
%
France
1,773,847
9.9
Canada
1,234,884
6.9
Spain
1,029,551
5.8
Switzerland
739,919
4.2
Australia
643,998
3.6
Ireland
492,455
2.8
Netherlands
445,829
2.5
Germany
191,655
1.1
Total
non-U.S.
Securities
$8,927,847
50.2%
Notes
to
Financial
Statements
(continued)
Foreign
Taxes:
The
Funds
may
be
subject
to
foreign
taxes
on
income,
gains
on
investments
or
foreign
currency
repatriation,
a
portion
of
which
may
be
recoverable.
The
Funds
will
accrue
such
taxes
and
recoveries
as
applicable,
based
upon
the
current
interpretation
of
tax
rules
and
regulations
that
exist
in
the
markets
in
which
the
Funds
invest.
Indemnifications:
Under
the
Trust’s
organizational
documents,
its
officers
and
trustees
are
indemnified
against
certain
liabilities
arising
out
of
the
performance
of
their
duties
to
the
Trust.
In
addition,
in
the
normal
course
of
business,
the
Trust
enters
into
contracts
that
provide
general
indemnifications
to
other
parties.
The
Trust’s
maximum
exposure
under
these
arrangements
is
unknown
as
this
would
involve
future
claims
that
may
be
made
against
the
Trust
that
have
not
yet
occurred.
However,
the
Trust
has
not
had
prior
claims
or
losses
pursuant
to
these
contracts
and
expects
the
risk
of
loss
to
be
remote.
Investments
and
Investment
Income:
Securities
transactions
are
accounted
for
as
of
the
trade
date
for
financial
reporting
purposes.
Realized
gains
and
losses
on
securities
transactions
are
based
upon
the
specific
identification
method.
Investment
income
is
recorded
on
the
ex-dividend
date,
or
for
certain
foreign
securities,
when
information
is
available.
Non-cash
dividends
received
in
the
form
of
stock,
if
any,
are
recognized
on
the
ex-dividend
date
and
recorded
at
fair
value.
Interest
income
is
recorded
on
an
accrual
basis
and
includes
accretion
of
discounts
and
amortization
of
premiums
for
financial
reporting
purposes.
Interest
income
also
reflects
payment-in-kind
(“PIK”)
interest
and
paydown
gains
and
losses,
if
any.
PIK
interest
represents
income
received
in
the
form
of
securities
in
lieu
of
cash.
Securities
lending
income
is
comprised
of
fees
earned
from
borrowers
and
income
earned
on
cash
collateral
investments.
Netting
Agreements:
In
the
ordinary
course
of
business,
the
Funds
may
enter
into
transactions
subject
to
enforceable International
Swaps
and
Derivatives
Association,
Inc.
(ISDA)
master
agreements
or
other
similar
arrangements
(“netting
agreements”).
Generally,
the
right
to
offset
in
netting
agreements
allows
each
Fund
to
offset
certain
securities
and
derivatives
with
a
specific
counterparty,
when
applicable,
as
well
as
any
collateral
received
or
delivered
to
that
counterparty
based
on
the
terms
of
the
agreements.
Generally,
each
Fund
manages
its
cash
collateral
and
securities
collateral
on
a
counterparty
basis.
With
respect
to
certain
counterparties,
in
accordance
with
the
terms
of
the
netting
agreements,
collateral
posted
to
the
Funds
is
held
in
a
segregated
account
by
the
Funds’
custodian
and/or
with
respect
to
those
amounts
which
can
be
sold
or
repledged,
are
presented
in
the
Funds’
Portfolio
of
Investments
or
Statement
of
Assets
and
Liabilities.
The
Funds’
investments
subject
to
netting
agreements
as
of
the
end
of
the
reporting
period,
if
any,
are
further
described
later
in
these
Notes
to
Financial
Statements.
New
Accounting
Pronouncement:
In
June
2022,
the
FASB
issued
ASU
2022-03
to
clarify
the
guidance
in
Topic
820,
Fair
Value
Measurement
("Topic
820").
The
amendments
in
ASU
2022-03
affect
all
entities
that
have
investments
in
equity
securities
measured
at
fair
value
that
are
subject
to
a
contractual
sale
restriction.
ASU
2022-03
(1)
clarifies
the
guidance
in
Topic
820,
when
measuring
the
fair
value
of
an
equity
security
subject
to
contractual
restrictions
that
prohibit
the
sale
of
an equity
security,
(2)
amends
a
related
illustrative
example,
and
(3)
introduces
new
disclosure
requirements
for
equity
securities
subject
to
contractual
sale
restrictions
that
are
measured
at
fair
value
in
accordance
with
Topic
820.
For
public
business
entities,
the
amendments
in
ASU
2022-03
are
effective
for
fiscal
years
beginning
after
December
15,
2023,
and
interim
periods
within
those
fiscal
years.
For
all
other
entities,
the
amendments
are
effective
for
fiscal
years
beginning
after
December
15,
2024,
and
interim
periods
within
those
fiscal
years.
Early
adoption
is
permitted
for
both
interim
and
annual
financial
statements
that
have
not
yet
been
issued
or
made
available
for
issuance.
During
the
current
fiscal
period,
the
Funds
adopted
the
new
guidance
and
there
was
no
material
impact
to
the
Funds.
3.
Investment
Valuation
and
Fair
Value
Measurements
The
Funds’
investments
in
securities
are
recorded
at
their
estimated
fair
value
utilizing
valuation
methods
approved
by
the
Adviser,
subject
to
oversight
of
the Board.
Fair
value
is
defined
as
the
price
that
would
be
received
upon
selling
an
investment
or
transferring
a
liability
in
an
orderly
transaction
to
an
independent
buyer
in
the
principal
or
most
advantageous
market
for
the
investment.
U.S.
GAAP
establishes
the
three-tier
hierarchy
which
is
used
to
maximize
the
use
of
observable
market
data
and
minimize
the
use
of
unobservable
inputs
and
to
establish
classification
of
fair
value
measurements
for
disclosure
purposes.
Observable
inputs
reflect
the
assumptions
market
participants
would
use
in
pricing
the
asset
or
liability.
Observable
inputs
are
based
on
market
data
obtained
from
sources
independent
of
the
reporting
entity.
Unobservable
inputs
reflect
management’s
assumptions
about
the
assumptions
market
participants
would
use
in
pricing
the
asset
or
liability.
Unobservable
inputs
are
based
on
the
best
information
available
in
the
circumstances.
The
following
is
a
summary
of
the
three-tiered
hierarchy
of
valuation
input
levels.
Level
1
–
Inputs
are
unadjusted
and
prices
are
determined
using
quoted
prices
in
active
markets
for
identical
securities.
Level
2
–
Prices
are
determined
using
other
significant
observable
inputs
(including
quoted
prices
for
similar
securities,
interest
rates,
credit
spreads,
etc.).
Level
3
–
Prices
are
determined
using
significant
unobservable
inputs
(including
management’s
assumptions
in
determining
the
fair
value
of
investments).
A
description
of
the
valuation
techniques
applied
to
the
Funds’
major
classifications
of
assets
and
liabilities
measured
at
fair
value
follows:
Equity
securities
and
exchange-traded
funds
listed
or
traded
on
a
national
market
or
exchange
are
valued
based
on
their
last
reported sales
price
or
official
closing
price of such
market
or
exchange
on
the
valuation
date.
Foreign
equity
securities
and
registered
investment
companies
that
trade
on
a
foreign
exchange
are
valued
at
the
last
reported sales
price
or
official
closing
price
on
the
principal
exchange
where
traded,
and
converted
to
U.S.
dollars
at
the
prevailing
rates
of
exchange
on
the valuation
date.
For
events affecting
the value
of
foreign
securities
between
the
time
when
the
exchange
on
which
they
are
traded
closes
and
the
time
when
the
Funds'
net
assets
are
calculated,
such
securities
will
be
valued
at
fair
value
in
accordance
with
procedures
adopted
by
the
Adviser,
subject
to
the
oversight
of
the
Board. To
the
extent
these
securities
are
actively
traded
and
no
valuation
adjustments
are
applied,
they
are
generally
classified
as
Level
1. When
valuation
adjustments
are
applied
to
the
most
recent
last
sales
price
or
official
closing
price, these
securities
are
generally
classified
as
Level
2.
Prices
of
fixed-income
securities
are
generally
provided
by
pricing
services
approved
by
the
Adviser,
which
is
subject
to
review
by
the
Adviser
and
oversight
of
the
Board. Pricing
services
establish
a
security’s
fair
value
using
methods
that
may
include
consideration
of
the
following:
yields
or
prices
of
investments
of
comparable
quality,
type
of
issue,
coupon,
maturity
and
rating,
market
quotes
or
indications
of
value
from
security
dealers,
evaluations
of
anticipated
cash
flows
or
collateral,
general
market
conditions
and
other
information
and
analysis,
including
the
obligor’s
credit
characteristics
considered
relevant.
In
pricing
certain
securities,
particularly
less
liquid
and
lower
quality
securities,
pricing
services
may
consider
information
about
a
security,
its
issuer
or
market
activity
provided
by
the
Adviser.
These
securities
are
generally
classified
as
Level
2.
Investments
in
investment
companies
are
valued
at
their
respective
NAVs
or
share
price on
the
valuation
date
and
are
generally
classified
as
Level
1.
For
any
portfolio
security
or
derivative
for
which
market
quotations
are
not
readily
available
or
for
which
the
Adviser
deems
the
valuations
derived
using
the
valuation
procedures
described
above
not
to
reflect
fair
value,
the
Adviser
will
determine
a
fair
value
in
good
faith
using
alternative
procedures
approved
by
the
Adviser,
subject
to
the
oversight
of
the
Board.
As
a
general
principle,
the
fair
value
of
a
security
is
the
amount
that
the
owner
might
reasonably
expect
to
receive
for
it
in
a
current
sale.
A
variety
of
factors
may
be
considered
in
determining
the
fair
value
of
such
securities,
which
may
include
consideration
of
the
following:
yields
or
prices
of
investments
of
comparable
quality,
type
of
issue,
coupon,
maturity
and
rating,
market
quotes
or
indications
of
value
from
security
dealers,
evaluations
of
anticipated
cash
flows
or
collateral,
general
market
conditions
and
other
information
and
analysis,
including
the
obligor’s
credit
characteristics
considered
relevant.
To
the
extent
the
inputs
are
observable
and
timely,
the
values
would
be
classified
as
Level
2;
otherwise
they
would
be
classified
as
Level
3.
The
following
table
summarizes
the
market
value
of
the
Funds’
investments
as
of
the
end
of
the
reporting
period,
based
on
the
inputs
used
to
value
them:
Municipal
Total
Return
Level
1
Level
2
Level
3
Total
Long-Term
Investments:
Municipal
Bonds
$
–
$
1,526,013,970
$
–
$
1,526,013,970
Short-Term
Investments:
Municipal
Bonds
–
11,385,000
–
11,385,000
Total
$
–
$
1,537,398,970
$
–
$
1,537,398,970
Core
Impact
Bond
Level
1
Level
2
Level
3
Total
Long-Term
Investments:
Corporate
Bonds
$
–
$
4,680,488
$
–
$
4,680,488
Mortgage-Backed
Securities
–
1,519,141
–
1,519,141
Municipal
Bonds
–
875,217
–
875,217
Asset-Backed
Securities
–
673,453
–
673,453
Emerging
Market
Debt
and
Foreign
Corporate
Bonds
–
636,830
–
636,830
$1,000
Par
(or
similar)
Institutional
Preferred
–
295,675
–
295,675
Sovereign
Debt
–
154,419
–
154,419
Short-Term
Investments:
U.S.
Government
and
Agency
Obligations
–
261,000
–
261,000
Total
$
–
$
9,096,223
$
–
$
9,096,223
Emerging
Markets
Debt
Level
1
Level
2
Level
3
Total
Long-Term
Investments:
Sovereign
Debt
$
–
$
14,016,863
$
–
$
14,016,863
Corporate
Bonds
–
11,909,818
–
11,909,818
Contingent
Capital
Securities
–
1,039,827
–
1,039,827
$1,000
Par
(or
similar)
Institutional
Preferred
–
179,971
–
179,971
Investments
Purchased
with
Collateral
from
Securities
Lending
1,149,418
–
–
1,149,418
Total
$
1,149,418
$
27,146,479
$
–
$
28,295,897
High
Yield
Level
1
Level
2
Level
3
Total
Long-Term
Investments:
Corporate
Bonds
$
–
$
17,642,716
$
–
$
17,642,716
Exchange-Traded
Funds
178,500
–
–
178,500
Investments
Purchased
with
Collateral
from
Securities
Lending
1,447,778
–
–
1,447,778
Total
$
1,626,278
$
17,642,716
$
–
$
19,268,994
Notes
to
Financial
Statements
(continued)
4.
Portfolio
Securities
Inverse
Floating
Rate
Securities:
Municipal
Total
Return is
authorized
to
invest
in
inverse
floating
rate
securities.
An
inverse
floating
rate
security
is
created
by
depositing
a
municipal
bond
(referred
to
as
an
“Underlying
Bond”),
typically
with
a
fixed
interest
rate,
into
a
special
purpose
tender
option
bond
(“TOB”)
trust
(referred
to
as
the
“TOB
Trust”)
created
by
or
at
the
direction
of
one
or
more
Funds.
In
turn,
the
TOB
Trust
issues
(a)
floating
rate
certificates
(referred
to
as
“Floaters”),
in
face
amounts
equal
to
some
fraction
of
the
Underlying
Bond’s
par
amount
or
market
value,
and
(b)
an
inverse
floating
rate
certificate
(referred
to
as
an
“Inverse
Floater”)
that
represents
all
remaining
or
residual
interest
in
the
TOB
Trust.
Floaters
typically
pay
short-term
tax-exempt
interest
rates
to
third
parties
who
are
also
provided
a
right
to
tender
their
certificate
and
receive
its
par
value,
which
may
be
paid
from
the
proceeds
of
a
remarketing
of
the
Floaters,
by
a
loan
to
the
TOB
Trust
from
a
third
party
liquidity
provider
(“Liquidity
Provider”),
or
by
the
sale
of
assets
from
the
TOB
Trust.
The
Inverse
Floater
is
issued
to
a
long
term
investor,
such
as
the
Fund.
The
income
received
by
the
Inverse
Floater
holder
varies
inversely
with
the
short-term
rate
paid
to
holders
of
the
Floaters,
and
in
most
circumstances
the
Inverse
Floater
holder
bears
substantially
all
of
the
Underlying
Bond’s
downside
investment
risk
and
also
benefits
disproportionately
from
any
potential
appreciation
of
the
Underlying
Bond’s
value.
The
value
of
an
Inverse
Floater
will
be
more
volatile
than
that
of
the
Underlying
Bond
because
the
interest
rate
is
dependent
on
not
only
the
fixed
coupon
rate
of
the
Underlying
Bond
but
also
on
the
short-term
interest
paid
on
the
Floaters,
and
because
the
Inverse
Floater
essentially
bears
the
risk
of
loss
(and
possible
gain)
of
the
greater
face
value
of
the
Underlying
Bond.
The
Inverse
Floater
held
by the
Fund
gives
the
Fund
the
right
to
(a)
cause
the
holders
of
the
Floaters
to
tender
their
certificates
at
par
(or
slightly
more
than
par
in
certain
circumstances),
and
(b)
have
the
trustee
of
the
TOB
Trust
(the
“Trustee”)
transfer
the
Underlying
Bond
held
by
the
TOB
Trust
to
the
Fund,
thereby
collapsing
the
TOB
Trust.
A Fund
may
acquire
an
Inverse
Floater
in
a
transaction
where
it
(a)
transfers
an
Underlying
Bond
that
it
owns
to
a
TOB
Trust
created
by
a
third
party
or
(b)
transfers
an
Underlying
Bond
that
it
owns,
or
that
it
has
purchased
in
a
secondary
market
transaction
for
the
purpose
of
creating
an
Inverse
Floater,
to
a
TOB
Trust
created
at
its
direction,
and
in
return
receives
the
Inverse
Floater
of
the
TOB
Trust
(referred
to
as
a
“self-deposited
Inverse
Floater”).
The
Fund
may
also
purchase
an
Inverse
Floater
in
a
secondary
market
transaction
from
a
third
party
creator
of
the
TOB
Trust
without
first
owning
the
Underlying
Bond
(referred
to
as
an
“externally-deposited
Inverse
Floater”).
An
investment
in
a
self-deposited
Inverse
Floater
is
accounted
for
as
a
“financing”
transaction
(i.e.,
a
secured
borrowing).
For
a
self-deposited
Inverse
Floater,
the
Underlying
Bond
deposited
into
the
TOB
Trust
is
identified
in
the
Fund’s
Portfolio
of
Investments
as
“(UB)
–
Underlying
bond
of
an
inverse
floating
rate
trust
reflected
as
a
financing
transaction,”
with
the
Fund
recognizing
as
liabilities,
labeled
“Floating
rate
obligations”
on
the
Statement
of
Assets
and
Liabilities,
(a)
the
liquidation
value
of
Floaters
issued
by
the
TOB
Trust,
and
(b)
the
amount
of
any
borrowings
by
the
TOB
Trust
from
a
Liquidity
Provider
to
enable
the
TOB
Trust
to
purchase
outstanding
Floaters
in
lieu
of
a
remarketing.
In
addition,
the
Fund
recognizes
in
“Investment
Income”
the
entire
earnings
of
the
Underlying
Bond,
and
recognizes
(a)
the
interest
paid
to
the
holders
of
the
Floaters
or
on
the
TOB
Trust’s
borrowings,
and
(b)
other
expenses
related
to
remarketing,
administration,
trustee,
liquidity
and
other
services
to
a
TOB
Trust,
as
a
component
of
“Interest
expense”
on
the
Statement
of
Operations.
Earnings
due
from
the
Underlying
Bond
and
interest
due
to
the
holders
of
the
Floaters
as
of
the
end
of
the
reporting
period
are
recognized
as
components
of
“Receivable
for
interest”
and
“Payable
for
interest”
on
the
Statement
of
Assets
and
Liabilities,
respectively.
In
contrast,
an
investment
in
an
externally-deposited
Inverse
Floater
is
accounted
for
as
a
purchase
of
the
Inverse
Floater
and
is
identified
in
the
Fund’s
Portfolio
of
Investments
as
“(IF)
–
Inverse
floating
rate
investment.”
For
an
externally-deposited
Inverse
Floater,
a
Fund’s
Statement
of
Assets
and
Liabilities
recognizes
the
Inverse
Floater
and
not
the
Underlying
Bond
as
an
asset,
and
the
Fund
does
not
recognize
the
Floaters,
or
any
related
Preferred
Securities
and
Income
Level
1
Level
2
Level
3
Total
Long-Term
Investments:
$1,000
Par
(or
similar)
Institutional
Preferred
$
–
$
10,912,078
$
–
$
10,912,078
Contingent
Capital
Securities
–
6,271,364
–
6,271,364
$25
Par
(or
similar)
Retail
Preferred
61,900
299,534
–
361,434
Corporate
Bonds
–
78,100
–
78,100
Investments
Purchased
with
Collateral
from
Securities
Lending
2,476,710
–
–
2,476,710
Total
$
2,538,610
$
17,561,076
$
–
$
20,099,686
Securitized
Credit
Level
1
Level
2
Level
3
Total
Long-Term
Investments:
Mortgage-Backed
Securities
$
–
$
20,578,295
$
–
$
20,578,295
Asset-Backed
Securities
–
5,782,518
–
5,782,518
Corporate
Bonds
–
256,216
–
256,216
Total
$
–
$
26,617,029
$
–
$
26,617,029
Ultra
Short
Municipal
Level
1
Level
2
Level
3
Total
Short-Term
Investments:
Municipal
Bonds
–
9,585,000
–
9,585,000
Total
$
–
$
9,585,000
$
–
$
9,585,000
borrowings
from
a
Liquidity
Provider,
as
a
liability.
Additionally,
the
Fund
reflects
in
“Investment
Income”
only
the
net
amount
of
earnings
on
the
Inverse
Floater
(net
of
the
interest
paid
to
the
holders
of
the
Floaters
or
the
Liquidity
Provider
as
lender,
and
the
expenses
of
the
Trust),
and
does
not
show
the
amount
of
that
interest
paid
or
the
expenses
of
the
TOB
Trust
as
described
above
as
interest
expense
on
the
Statement
of
Operations.
Fees
paid
upon
the
creation
of
a
TOB
Trust
for
self-deposited
Inverse
Floaters
and
externally-deposited
Inverse
Floaters
are
recognized
as
part
of
the
cost
basis
of
the
Inverse
Floater
and
are
capitalized
over
the
term
of
the
TOB
Trust.
As
of
the
end
of
the
reporting
period,
the
aggregate
value
of
Floaters
issued
by
the
Fund’s
TOB
Trust
for
self-deposited
Inverse
Floaters
and
externally-deposited
Inverse
Floaters
was
as
follows:
During
the
current
fiscal
period,
the
average
amount
of
Floaters
(including
any
borrowings
from
a
Liquidity
Provider)
outstanding,
and
the
average
annual
interest
rates
and
fees
related
to
self-deposited
Inverse
Floaters,
were
as
follows:
TOB
Trusts
are
supported
by
a
liquidity
facility
provided
by
a
Liquidity
Provider
pursuant
to
which
the
Liquidity
Provider
agrees,
in
the
event
that
Floaters
are
(a)
tendered
to
the
Trustee
for
remarketing
and
the
remarketing
does
not
occur,
or
(b)
subject
to
mandatory
tender
pursuant
to
the
terms
of
the
TOB
Trust
agreement,
to
either
purchase
Floaters
or
to
provide
the
Trustee
with
an
advance
from
a
loan
facility
to
fund
the
purchase
of
Floaters
by
the
TOB
Trust.
In
certain
circumstances,
the
Liquidity
Provider
may
otherwise
elect
to
have
the
Trustee
sell
the
Underlying
Bond
to
retire
the
Floaters
that
were
tendered
and
not
remarketed
prior
to
providing
such
a
loan.
In
these
circumstances,
the
Liquidity
Provider
remains
obligated
to
provide
a
loan
to
the
extent
that
the
proceeds
of
the
sale
of
the
Underlying
Bond
are
not
sufficient
to
pay
the
purchase
price
of
the
Floaters.
The
size
of
the
commitment
under
the
loan
facility
for
a
given
TOB
Trust
is
at
least
equal
to
the
balance
of
that
TOB
Trust’s
outstanding
Floaters
plus
any
accrued
interest.
In
consideration
of
the
loan
facility,
fee
schedules
are
in
place
and
are
charged
by
the
Liquidity
Provider(s).
Any
loans
made
by
the
Liquidity
Provider
will
be
secured
by
the
purchased
Floaters
held
by
the
TOB
Trust.
Interest
paid
on
any
outstanding
loan
balances
will
be
effectively
borne
by
the
Fund
that
owns
the
Inverse
Floaters
of
the
TOB
Trust
that
has
incurred
the
borrowing
and
may
be
at
a
rate
that
is
greater
than
the
rate
that
would
have
been
paid
had
the
Floaters
been
successfully
remarketed.
As
described
above,
any
amounts
outstanding
under
a
liquidity
facility
are
recognized
as
a
component
of
“Floating
rate
obligations”
on
the
Statement
of
Assets
and
Liabilities
by
the
Fund
holding
the
corresponding
Inverse
Floaters
issued
by
the
borrowing
TOB
Trust.
As
of
the
end
of
the
reporting
period,
there
were
no
loans
outstanding
under
any such
facility.
The Fund
may
also
enter
into
shortfall
and
forbearance
agreements
(sometimes
referred
to
as
a
“recourse
arrangement”)
(TOB
Trusts
involving
such
agreements
are
referred
to
herein
as
“Recourse
Trusts”),
under
which
a
Fund
agrees
to
reimburse
the
Liquidity
Provider
for
the
Trust’s
Floaters,
in
certain
circumstances,
for
the
amount
(if
any)
by
which
the
liquidation
value
of
the
Underlying
Bond
held
by
the
TOB
Trust
may
fall
short
of
the
sum
of
the
liquidation
value
of
the
Floaters
issued
by
the
TOB
Trust
plus
any
amounts
borrowed
by
the
TOB
Trust
from
the
Liquidity
Provider,
plus
any
shortfalls
in
interest
cash
flows.
Under
these
agreements,
a
Fund’s
potential
exposure
to
losses
related
to
or
on
an
Inverse
Floater
may
increase
beyond
the
value
of
the
Inverse
Floater
as
a
Fund
may
potentially
be
liable
to
fulfill
all
amounts
owed
to
holders
of
the
Floaters
or
the
Liquidity
Provider.
Any
such
shortfall
amount
in
the
aggregate
is
recognized
as
“Unrealized
depreciation
on
Recourse
Trusts”
on
the
Statement
of
Assets
and
Liabilities.
As
of
the
end
of
the
reporting
period, the
Fund's
maximum
exposure
to
the
Floaters
issued
by
Recourse
Trusts
for
self-deposited
Inverse
Floaters
and
externally-deposited
Inverse
Floaters
was
as
follows:
Fund
Floating
Rate
Obligations:
Self-
Deposited
Inverse
Floaters
Floating
Rate
Obligations:
Externally-Deposited
Inverse
Floaters
Total
Municipal
Total
Return
$
—
$
—
$
—
Fund
Average
Floating
Rate
Obligations
Outstanding
Average
Annual
Interest
Rate
And
Fees
Municipal
Total
Return
$
264,986
4.28
%
Fund
Maximum
Exposure
to
Recourse
Trusts:
Self-Deposited
Inverse
Floaters
Maximum
Exposure
to
Recourse
Trusts:
Externally-Deposited
Inverse
Floaters
Total
Municipal
Total
Return
$
—
$
—
$
—
Notes
to
Financial
Statements
(continued)
Securities
Lending:
Each
Fund
(except
for
Municipal
Total
Return
and
Ultra
Short
Municipal)
may
lend
securities
representing
up
to
one-third
of
the
value
of
its
total
assets
to
broker-dealers,
banks,
and
other
institutions
in
order
to
generate
additional
income.
When
loaning
securities, a
Fund
retains
the
benefits
of
owning
the
securities,
including
the
economic
equivalent
of
dividends
or
interest
generated
by
the
security.
The
loans
are
continuous,
can
be
recalled
at
any
time,
and
have
no
set
maturity.
The
Funds’
custodian,
State
Street
Bank
and
Trust
Company,
serves
as
the
securities
lending
agent
(the
“Agent”).
When
a
Fund
loans
its
portfolio
securities,
it
will
receive,
at
the
inception
of
each
loan,
cash
collateral
equal
to
an
amount
not
less
than
100%
of
the
market
value
of
the
loaned
securities.
The
actual
percentage
of
the
cash
collateral
will
vary
depending
upon
the
asset
type
of
the
loaned
securities.
Collateral
for
the
loaned
securities
is
invested
in
a
government
money
market
vehicle
maintained
by
the
Agent,
which
is
subject
to
the
requirements
of
Rule
2a-7
under
the
1940
Act.
The
value
of
the
loaned
securities
and
the
liability
to
return
the
cash
collateral
received
are
recognized
on
the
Statement
of
Assets
and
Liabilities.
If
the
market
value
of
the
loaned
securities
increases,
the
borrower
must
furnish
additional
collateral
to
the
Fund,
which
is
also
recognized
on
the
Statement
of
Assets
and
Liabilities.
Securities
out
on
loan
are
subject
to
termination
at
any
time
at
the
option
of
the
borrower
or
the
Fund.
Upon
termination,
the
borrower
is
required
to
return
to
the
Fund
securities
identical
to
the
securities
loaned.
During
the
term
of
the
loan,
the
Fund
bears
the
market
risk
with
respect
to
the
investment
of
collateral
and
the
risk
that
the
Agent
may
default
on
its
contractual
obligations
to
the
Fund.
The
Agent
bears
the
risk
that
the
borrower
may
default
on
its
obligation
to
return
the
loaned
securities
as
the
Agent
is
contractually
obligated
to
indemnify
the
Fund
if
at
the
time
of
a
default
by
a
borrower
some
or
all
of
the
loan
securities
have
not
been
returned.
Securities
lending
income
recognized
by
a
Fund
consists
of
earnings
on
invested
collateral
and
lending
fees,
net
of
any
rebates
to
the
borrower
and
compensation
to
the
Agent.
Such
income
is
recognized
on
the
Statement
of
Operations.
As
of
the
end
of
the
current
reporting
period,
the
total
value
of
the
loaned
securities
and
the
total
value
of
collateral
received
were
as
follows:
Zero
Coupon
Securities:
A
zero
coupon
security
does
not
pay
a
regular
interest
coupon
to
its
holders
during
the
life
of
the
security.
Income
to
the
holder
of
the
security
comes
from
accretion
of
the
difference
between
the
original
purchase
price
of
the
security
at
issuance
and
the
par
value
of
the
security
at
maturity
and
is
effectively
paid
at
maturity.
The
market
prices
of
zero
coupon
securities
generally
are
more
volatile
than
the
market
prices
of
securities
that
pay
interest
periodically.
Purchases
and
Sales:
Long-term
purchases
and
sales
during
the
current fiscal
period
were
as
follows:
The
Funds
may
purchase
securities
on
a
when-issued
or
delayed-delivery
basis.
Securities
purchased
on
a
when-issued
or
delayed-delivery
basis
may
have
extended
settlement
periods;
interest
income
is
not
accrued
until
settlement
date.
Any
securities
so
purchased
are
subject
to
market
fluctuation
during
this
period. If
a
Fund
has
outstanding
when-issued/delayed-delivery
purchases
commitments
as
of
the
end
of
the
reporting
period,
such
amounts
are
recognized
on
the
Statement
of
Assets
and
Liabilities.
Fund
Asset
Class
out
on
Loan
Long-Term
Investments,
at
Value
Total
Collateral
Received
Emerging
Markets
Debt
Corporate
Bonds
$697,807
$724,418
Sovereign
Debt
411,646
425,000
Total
$1,109,453
$1,149,418
High
Yield
Corporate
Bonds
$1,390,181
$1,447,778
Preferred
Securities
and
Income
$1000
Par
(or
similar)
Institutional
Preferred
$1,863,417
$1,938,442
Contingent
Capital
Securities
527,914
538,268
Total
$2,391,331
$2,476,710
Fund
Non-U.S.
Government
Purchases
U.S.
Government
Purchases
Non-U.S.
Government
Sales
and
Maturities
U.S.
Government
Sales
Municipal
Total
Return
$
725,948,303
$
—
$
610,564,089
$
—
Core
Impact
Bond
2,762,510
3,471,187
2,179,613
3,883,516
Emerging
Markets
Debt
7,087,317
—
7,304,142
—
High
Yield
14,469,350
—
13,113,458
—
Preferred
Securities
and
Income
7,738,409
—
6,330,967
—
Securitized
Credit
10,351,125
7,203,875
3,783,727
7,749,621
Ultra
Short
Municipal
—
—
—
—
5.
Derivative
Investments
Each
Fund
is
authorized
to
invest
in
certain
derivative
instruments.
As
defined
by
U.S.
GAAP,
a
derivative
is
a
financial
instrument
whose
value
is
derived
from
an
underlying
security
price,
foreign
exchange
rate,
interest
rate,
index
of
prices
or
rates,
or
other
variables.
Investments
in
derivatives
as
of
the
end
of
and/or
during
the
current
fiscal
period,
if
any,
are
included
within
the
Statement
of
Assets
and
Liabilities
and
the
Statement
of
Operations,
respectively.
Market
and
Counterparty
Credit
Risk:
In
the
normal
course
of
business
each
Fund
may
invest
in
financial
instruments
and
enter
into
financial
transactions
where
risk
of
potential
loss
exists
due
to
changes
in
the
market
(market
risk)
or
failure
of
the
other
party
to
the
transaction
to
perform
(counterparty
credit
risk).
The
potential
loss
could
exceed
the
value
of
the
financial
assets
recorded
on
the
financial
statements.
Financial
assets,
which
potentially
expose
each
Fund
to
counterparty
credit
risk,
consist
principally
of
cash
due
from
counterparties
on
forward,
option
and
swap
transactions,
when
applicable.
The
extent
of
each
Fund’s
exposure
to
counterparty
credit
risk
in
respect
to
these
financial
assets
approximates
their
carrying
value
as
recorded
on
the
Statement
of
Assets
and
Liabilities.
Each
Fund
helps
manage
counterparty
credit
risk
by
entering
into
agreements
only
with
counterparties
the
Adviser
believes
have
the
financial
resources
to
honor
their
obligations
and
by
having
the
Adviser
monitor
the
financial
stability
of
the
counterparties.
Additionally,
counterparties
may
be
required
to
pledge
collateral
daily
(based
on
the
daily
valuation
of
the
financial
asset)
on
behalf
of
each
Fund
with
a
value
approximately
equal
to
the
amount
of
any
unrealized
gain
above
a
pre-determined
threshold.
Reciprocally,
when
each
Fund
has
an
unrealized
loss,
the
Funds
have
instructed
the
custodian
to
pledge
assets
of
the
Funds
as
collateral
with
a
value
approximately
equal
to
the
amount
of
the
unrealized
loss
above
a
pre-determined
threshold.
Collateral
pledges
are
monitored
and
subsequently
adjusted
if
and
when
the
valuations
fluctuate,
either
up
or
down,
by
at
least
the
pre-determined
threshold
amount.
6.
Fund
Shares
Transactions
in Fund
shares
during
the
current
and
prior
fiscal
period
were
as
follows:
Year
Ended
7/31/24
Year
Ended
7/31/23
Municipal
Total
Return
Shares
Amount
Shares
Amount
Subscriptions
61,510,020
$620,670,921
78,221,908
$789,630,438
Reinvestments
of
distributions
4,632,941
46,693,208
3,747,380
37,754,645
Redemptions
(59,490,974)
(593,848,373)
(75,819,611)
(758,898,628)
Net
increase
(decrease)
6,651,987
$73,515,756
6,149,677
$68,486,455
Year
Ended
7/31/24
Nine
Months
Ended
7/31/23
Year
Ended
10/31/22
Core
Impact
Bond
Shares
Amount
Shares
Amount
Shares
Amount
Subscriptions
—
$—
761
$6,000
—
$—
Reinvestment
of
distributions
1,121
8,607
37,478
294,776
36,387
314,635
Net
increase
(decrease)
1,121
$8,607
38,239
$300,776
36,387
$314,635
7/31/24
For
the
Period
November
1,
2022
(commencement
of
operations)
through
July
31,
2023
Emerging
Markets
Debt
Shares
Amount
Shares
Amount
Subscriptions
50,141
$519,965
2,502,871
$25,030,000
Reinvestments
of
distributions
3,744
38,859
105,086
1,098,801
Redemptions
(2,711)
(28,427)
—
—
Net
increase
(decrease)
51,174
$530,397
2,607,957
$26,128,801
7/31/24
For
the
Period
November
1,
2022
(commencement
of
operations)
through
July
31,
2023
High
Yield
Shares
Amount
Shares
Amount
Subscriptions
139,005
$1,395,770
1,507,984
$15,080,000
Reinvestments
of
distributions
10,782
110,058
83,168
839,230
Redemptions
(8,752)
(90,071)
—
—
Net
increase
(decrease)
141,035
$1,415,757
1,591,152
$15,919,230
Notes
to
Financial
Statements
(continued)
7.
Income
Tax
Information
Each
Fund
is
a
separate
taxpayer
for
federal
income
tax
purposes.
Each
Fund
intends
to
distribute
substantially
all
of
its
net
investment
income
and
net
capital
gains
to
shareholders
and
otherwise
comply
with
the
requirements
of
Subchapter
M
of
the
Internal
Revenue
Code
applicable
to
regulated
investment
companies.
Therefore,
no
federal
income
tax
provision
is
required.
Each
Fund
intends
to
satisfy
conditions
that
will
enable
interest
from
municipal
securities,
which
is
exempt
from
regular
federal
income
tax,
to
retain
such
tax-exempt
status
when
distributed
to
shareholders
of
the
Funds.
Net
realized
capital
gains
and
ordinary
income
distributions
paid
by
the
Funds
are
subject
to
federal
taxation.
Each
Fund
files
income
tax
returns
in
U.S.
federal
and
applicable
state
and
local
jurisdictions.
A
Fund's
federal
income
tax
returns
are
generally
subject
to
examination
for
a
period
of
three
fiscal
years
after
being
filed.
State
and
local
tax
returns
may
be
subject
to
examination
for
an
additional
period
of
time
depending
on
the
jurisdiction.
Management
has
analyzed
each
Fund's
tax
positions
taken
for
all
open
tax
years
and
has
concluded
that
no
provision
for
income
tax
is
required
in
the
Fund's
financial
statements.
Differences
between
amounts
for
financial
statement
and
federal
income
tax
purposes
are
primarily
due
to
timing
differences
in
recognizing
gains
and
losses
on
investment
transactions.
Temporary
differences
do
not
require
reclassification.
As
of
year
end,
permanent
differences
that
resulted
in
reclassifications
among
the
components
of
net
assets
relate
primarily
to
complex
securities
character
adjustments,
distribution
reallocations,
foreign
currency
transactions,
paydowns,
and
taxable
market
discount.
Temporary
and
permanent
differences
have
no
impact
on
a
Fund's
net
assets.
As
of
year
end,
the
aggregate
cost
and
the
net
unrealized
appreciation/(depreciation)
of
all
investments
for
federal
income
tax
purposes
were
as
follows:
7/31/24
For
the
Period
November
1,
2022
(commencement
of
operations)
through
July
31,
2023
Preferred
Securities
and
Income
Shares
Amount
Shares
Amount
Subscriptions
119,891
$1,180,279
1,504,766
$15,050,000
Reinvestments
of
distributions
7,768
78,694
78,964
786,355
Redemptions
(4,817)
(49,184)
—
—
Net
increase
(decrease)
122,842
$1,209,789
1,583,730
$15,836,355
7/31/24
For
the
Period
November
1,
2022
(commencement
of
operations)
through
July
31,
2023
Securitized
Credit
Shares
Amount
Shares
Amount
Subscriptions
457,044
$4,665,291
2,023,233
$20,240,000
Reinvestments
of
distributions
25,030
257,560
72,607
751,674
Redemptions
(21,036)
(217,359)
—
—
Net
increase
(decrease)
461,038
$4,705,492
2,095,840
$20,991,674
For
the
Period
February
29,
2024
(commencement
of
operations)
through
July
31,
2024
Ultra
Short
Municipal
Shares
Amount
Subscriptions
1,000,000
$10,000,000
Net
increase
(decrease)
1,000,000
$10,000,000
Fund
Tax
Cost
Gross
Unrealized
Appreciation
Gross
Unrealized
(Depreciation)
Net
Unrealized
Appreciation
(Depreciation)
Municipal
Total
Return
$
1,517,643,803
$
26,361,865
$
(6,606,698)
$
19,755,167
Core
Impact
Bond
10,203,219
101,054
(1,208,050)
(1,106,996)
Emerging
Markets
Debt
27,226,353
1,148,014
(78,471)
1,069,543
High
Yield
18,771,239
592,308
(94,553)
497,755
Preferred
Securities
and
Income
19,494,550
1,153,785
(548,649)
605,136
Securitized
Credit
25,758,990
865,583
(7,544)
858,039
Ultra
Short
Municipal
9,585,000
—
—
—
Undistributed
tax-exempt
income
(on
a
tax
basis)
has
not
been
reduced
for
the
dividends
declared
during
the
period
July
1,
2024
through
July
31,
2024
and
paid
on
August
1,
2024.
The
Fund
designates
these
amounts
paid
during
the
period
as
Exempt
Interest
Dividends.
For
purposes
of
this
disclosure,
tax
cost
generally
includes
the
cost
of
portfolio
investments
as
well
as
up-front
fees
or
premiums
exchanged
on
derivatives
and
any
amounts
unrealized
for
income
statement
reporting
but
realized
income
and/or
capital
gains
for
tax
reporting,
if
applicable.
As
of
year
end,
the
components
of
accumulated
earnings
on
a
tax
basis
were
as
follows:
The
tax
character
of
distributions
paid
was
as
follows:
Fund
Undistributed
Tax-Exempt
Income
1
Undistributed
Ordinary
Income
Undistributed
Long-Term
Capital
Gains
Unrealized
Appreciation
(Depreciation)
Capital
Loss
Carryforwards
Late-Year
Loss
Deferrals
Other
Book-to-Tax
Differences
Total
Municipal
Total
Return
$
6,887,068
$
5,307
$
—
$
19,755,167
$
(167,051,628)
$
—
$
(5,442,855)
$
(145,846,941)
Core
Impact
Bond
—
42,735
—
(1,106,996)
(1,164,722)
—
(35,838)
(2,264,821)
Emerging
Markets
Debt
—
178,307
149,570
1,069,543
—
—
—
1,397,420
High
Yield
—
143,369
178,153
497,755
—
—
(117,057)
702,220
Preferred
Securities
and
Income
—
62,123
184,566
605,136
—
—
(98,975)
752,850
Securitized
Credit
—
181,526
174,228
858,039
—
—
(117,543)
1,096,250
Ultra
Short
Municipal
23,152
—
—
—
—
—
(23,152)
—
7/31/24
7/31/23
Fund
Tax-Exempt
Income
1
Ordinary
Income
Long-Term
Capital
Gains
Tax-Exempt
Income
Ordinary
Income
Long-Term
Capital
Gains
Municipal
Total
Return
$
60,305,606
$
67,599
$
—
$
50,037,792
$
2,474
$
—
7/31/24
Nine
Months
Ended
7/31/23
10/31/22
Ordinary
Income
Long-Term
Capital
Gains
Ordinary
Income
Long-Term
Capital
Gains
Ordinary
Income
Long-Term
Capital
Gains
Core
Impact
Bond
$417,176
$–
$294,771
$–
$314,641
$–
7/31/24
For
the
Period
11/01/22
(commencement
of
operations)
through
7/31/23
Ordinary
Income
Long-Term
Capital
Gains
Ordinary
Income
Long-Term
Capital
Gains
Emerging
Markets
Debt
$1,919,930
$–
$1,098,801
$–
High
Yield
1,330,002
–
839,233
–
Preferred
Securities
and
Income
1,218,770
–
786,353
–
Securitized
Credit
1,516,440
–
751,676
–
For
the
Period
2/29/24
(commencement
of
operations)
through
7/31/24
Tax-Exempt
Income
1
Ordinary
Income
Long-Term
Capital
Gains
Ultra
Short
Municipal
$137,969
$–
$–
1
The
Fund
designates
these
amounts
paid
during
the
period
as
Exempt
Interest
Dividends.
Notes
to
Financial
Statements
(continued)
As
of
year
end,
the
Funds
had
capital
loss
carryforwards,
which
will
not
expire:
8.
Management
Fees
and
Other
Transactions
with
Affiliates
Management
Fees:
The
Adviser
does
not
charge
any
management
fees
or
other
expenses
directly
to each
Fund.
The
Adviser
has
agreed
irrevocably
during
the
existence
of each
Fund
to
waive
all
fees
and
pay
or
reimburse
all
expenses
of each
Fund
(excluding
interest
expense,
taxes,
fees
incurred
in
acquiring
and
disposing
of
portfolio
securities
and
extraordinary
expenses).
The
Adviser
and
the
Sub-Adviser
are
compensated
for
their
services
to
the
Funds
from
the
fee
charged
at
the
separately
managed
account
level.
Other
Transactions
with
Affiliates:
As
of
the
end
of
the
reporting
period,
the
percentage
of
Fund
shares
owned
by
TIAA
are
as
follows:
9.
Commitments
and
Contingencies
In
the
normal
course
of
business,
each
Fund
enters
into
a
variety
of
agreements
that
may
expose
the
Funds
to
some
risk
of
loss.
These
could
include
recourse
arrangements
for
certain
TOB
Trusts,
which
are
described
elsewhere
in
these
Notes
to
Financial
Statements.
The
risk
of
future
loss
arising
from
such
agreements,
while
not
quantifiable,
is
expected
to
be
remote.
As
of
the
end
of
the
reporting
period,
the
Funds
did
not
have
any
unfunded
commitments
other
than
those
disclosed
in
the
Notes
to
Financial
Statements,
when
applicable.
From
time
to
time,
the
Funds
may
be
a
party
to
certain
legal
proceedings
in
the
ordinary
course
of
business,
including
proceedings
relating
to
the
enforcement
of
the
Funds’
rights
under
contracts.
As
of
the
end
of
the
reporting
period,
the
Funds
are
not
subject
to
any
material
legal
proceedings.
10.
Borrowing
Arrangements
Committed
Line
of
Credit:
The
Funds,
along
with
certain
other
funds
managed
by
the
Adviser
(“Participating
Funds”),
have
established
a
364-day,
$2.700
billion
standby
credit
facility
with
a
group
of
lenders,
under
which
the
Participating
Funds
may
borrow
for
temporary
purposes
(other
than
on-
going
leveraging
for
investment
purposes).
Each
Participating
Fund
is
allocated
a
designated
proportion
of
the
facility’s
capacity
(and
its
associated
costs,
as
described
below)
based
upon
a
multi-factor
assessment
of
the
likelihood
and
frequency
of
its
need
to
draw
on
the
facility,
the
size
of
the
Fund
and
its
anticipated
draws,
and
the
potential
importance
of
such
draws
to
the
operations
and
well-being
of
the
Fund,
relative
to
those
of
the
other
Funds.
A
Fund
may
effect
draws
on
the
facility
in
excess
of
its
designated
capacity
if
and
to
the
extent
that
other
Participating
Funds
have
undrawn
capacity.
The
credit
facility
expires
in
June
2025
unless
extended
or
renewed.
The
credit
facility
has
the
following
terms:
0.15%
per
annum
on
unused
commitment
amounts
and
a
drawn
interest
rate
equal
to
the
higher
of
(a)
OBFR
(Overnight
Bank
Funding
Rate)
plus
1.20%
per
annum
or
(b)
the
Fed
Funds
Effective
Rate
plus
1.20%
per
annum
on
amounts
borrowed. The
Participating
Funds
also
incurred
a
0.05%
upfront
fee
on
the
increased
commitments
from
select
lenders.
Interest
expense
incurred
by
the
Participating
Funds,
when
applicable,
is
recognized
as
a
component
of
“Interest
expense”
on
the
Statement
of
Operations.
Participating
Funds
paid
administration,
legal
and
arrangement
fees,
which
are
recognized
as
a
component
of
“Interest
expense”
on
the
Statement
of
Operations,
and
along
with
commitment
fees,
have
been
allocated
among
such
Participating
Funds
based
upon
the
relative
proportions
of
the
facility’s
aggregate
capacity
reserved
for
them
and
other
factors
deemed
relevant
by
the
Adviser
and
the
Board
of
each
Participating
Fund.
Fund
Short-Term
Long-Term
Total
Municipal
Total
Return
$
44,401,479
$
122,650,149
$
167,051,628
Core
Impact
Bond
248,299
916,423
1,164,722
Emerging
Markets
Debt
—
—
—
High
Yield
—
—
—
Preferred
Securities
and
Income
—
—
—
Securitized
Credit
—
—
—
Ultra
Short
Municipal
—
—
—
Fund
TIAA
Owned
Shares
Municipal
Total
Return
—
%
Core
Impact
Bond
100
Emerging
Markets
Debt
98
High
Yield
92
Preferred
Securities
and
Income
95
Securitized
Credit
82
Ultra
Short
Municipal
100
During
the
current
fiscal
period,
the
Funds
utilized
this
facility.
The
following
Funds’
maximum
outstanding
balance
during
the
utilization
period
was
as
follows:
During
each
Fund’s
utilization
period(s)
during
the
current
fiscal
period,
the
average
daily
balance
outstanding
and
average
annual
interest
rate
on
the
Borrowings
were
as
follows:
Borrowings
outstanding
as
of
the
end
of
the
reporting
period,
if
any,
are
recognized
as
“Borrowings”
on
the
Statement
of
Assets
and
Liabilities.
Fund
Maximum
Outstanding
Balance
Municipal
Total
Return
$
—
Core
Impact
Bond
—
Emerging
Markets
Debt
129,198
High
Yield
—
Preferred
Securities
and
Income
—
Securitized
Credit
—
Ultra
Short
Municipal
—
Fund
Utilization
Period
(Days
Outstanding)
Average
Daily
Balance
Outstanding
Average
Annual
Interest
Rate
Municipal
Total
Return
—
$
—
—
%
Core
Impact
Bond
—
—
—
Emerging
Markets
Debt
5
129,198
6.53
High
Yield
—
—
—
Preferred
Securities
and
Income
—
—
—
Securitized
Credit
—
—
—
Ultra
Short
Municipal
—
—
—
Important
Tax
Information
(Unaudited)
As
required
by
the
Internal
Revenue
Code
and
Treasury
Regulations,
certain
tax
information,
as
detailed
below,
must
be
provided
to
shareholders.
Shareholders
are
advised
to
consult
their
tax
advisor
with
respect
to
the
tax
implications
of
their
investment.
The
amounts
listed
below
may
differ
from
the
actual
amounts
reported
on
Form
1099-DIV,
which
will
be
sent
to
shareholders
shortly
after
calendar
year
end.
Long-Term
Capital
Gains
As
of
year
end,
each
Fund
designates
the
following
distribution
amounts,
or
maximum
amount
allowable,
as
being
from net
long-term
capital
gains
pursuant
to
Section
852(b)(3)
of
the
Internal
Revenue
Code:
Dividends
Received
Deduction
(DRD)
Each
Fund
listed
below
had
the
following
percentage,
or
maximum
amount
allowable,
of
ordinary
income
distributions
eligible
for
the
dividends
received
deduction
for
corporate
shareholders:
Qualified
Dividend
Income
(QDI)
Each
Fund
listed
below
had
the
following
percentage,
or
maximum
amount
allowable,
of
ordinary
income
distributions
treated
as
qualified
dividend
income
for
individuals
pursuant
to
Section
1(h)(11)
of
the
Internal
Revenue
Code:
Fund
Net
Long-Term
Capital
Gains
Municipal
Total
Return
$
—
Core
Impact
Bond
—
Emerging
Markets
Debt
—
High
Yield
—
Preferred
Securities
and
Income
—
Securitized
Credit
—
Ultra
Short
Municipal
—
Fund
Percentage
Municipal
Total
Return
–
%
Core
Impact
Bond
0
.9
Emerging
Markets
Debt
–
High
Yield
–
Preferred
Securities
and
Income
26
.1
Securitized
Credit
–
Ultra
Short
Municipal
–
Fund
Percentage
Municipal
Total
Return
–
%
Core
Impact
Bond
0
.9
Emerging
Markets
Debt
–
High
Yield
–
Preferred
Securities
and
Income
62
.5
Securitized
Credit
–
Ultra
Short
Municipal
–
Qualified
Interest
Income
(QII)
Each
Fund
listed
below
had
the
following
percentage,
or
maximum
amount
allowable,
of
ordinary
income
distributions
treated
as
qualified interest
income
and/or short-term
capital
gain
dividends pursuant
to
Section
871(k)
of
the
Internal
Revenue
Code:
163(j)
Each
Fund
listed
below
had
the
following
percentage,
or
maximum
amount
allowable,
of
ordinary
dividends
treated
as
Section
163(j)
interest
dividends
pursuant
to
Section
163(j)
of
the
Internal
Revenue
Code:
Fund
Prior
Year
End
to
12/31
Percentage
1/1
to
Current
Year
End
Percentage
Municipal
Total
Return
—
%
—
%
Core
Impact
Bond
96
.1
43
.6
Emerging
Markets
Debt
2
.0
1
.8
High
Yield
77
.6
89
.1
Preferred
Securities
and
Income
6
.0
9
.7
Securitized
Credit
75
.7
100
.0
Ultra
Short
Municipal
—
—
Fund
Percentage
Municipal
Total
Return
–
%
Core
Impact
Bond
89
.2
Emerging
Markets
Debt
92
.8
High
Yield
99
.4
Preferred
Securities
and
Income
9
.3
Securitized
Credit
83
.5
Ultra
Short
Municipal
–
| Item 8. | Changes in and Disagreements with Accountants for Open-End Management Investment Companies. |
Not applicable.
| Item 9. | Proxy Disclosures for Open-End Management Investment Companies. |
Not applicable.
| Item 10. | Remuneration Paid to Directors, Officers, and Others of Open-End Management Investment Companies. |
Remuneration paid to directors, officers and others is included in the Statement of Operations under the line items “Trustee Fees” and “Management Fees” as part of the financial statements filed under Item 7 of this Form N-CSR.
Item 11. Statement Regarding Basis for Approval of Investment Advisory Contract
Municipal Total Return Managed Accounts Portfolio
Nuveen Core Impact Bond Managed Accounts Portfolio
Nuveen Emerging Markets Debt Managed Accounts Portfolio
Nuveen High Yield Managed Accounts Portfolio
Nuveen Preferred Securities and Income Managed Accounts Portfolio
Nuveen Securitized Credit Managed Accounts Portfolio
Nuveen Ultra Short Municipal Managed Accounts Portfolio
The Board of Trustees (the “Board” and each Trustee, a “Board Member”) of Nuveen Managed Accounts Portfolios Trust (the “Trust”) is responsible for determining whether to initially approve or, after an initial term, to renew, the advisory arrangements of the portfolios comprising the Trust. A discussion of the Board’s most recent approval of the renewal of the advisory arrangements of Municipal Total Return Managed Accounts Portfolio, Nuveen Core Impact Bond Managed Accounts Portfolio, Nuveen Emerging Markets Debt Managed Accounts Portfolio, Nuveen High Yield Managed Accounts Portfolio, Nuveen Preferred Securities and Income Managed Accounts Portfolio and Nuveen Securitized Credit Managed Accounts Portfolio is set forth in Part I below. The advisory arrangements of Nuveen Ultra Short Municipal Managed Accounts Portfolio have not yet been up for renewal, and a discussion of the Board’s initial approval of the advisory arrangements of such portfolio is set forth in Part II below. The Board Members are not “interested persons” (as defined under the Investment Company Act of 1940 (the “1940 Act”)) and, therefore, the Board is deemed to be comprised of all disinterested Board Members. References to the Board and the Board Members are interchangeable.
PART I
Municipal Total Return Managed Accounts Portfolio
Nuveen Core Impact Bond Managed Accounts Portfolio
Nuveen Emerging Markets Debt Managed Accounts
Portfolio Nuveen High Yield Managed Accounts Portfolio
Nuveen Preferred Securities and Income Managed Accounts Portfolio
Nuveen Securitized Credit Managed Accounts Portfolio
The Approval Process
At meetings held on April 18 and 19, 2024 (for purposes of this Part I, the “Meeting”), the Board approved, for each of Municipal Total Return Managed Accounts Portfolio, Nuveen Core Impact Bond Managed Accounts Portfolio, Nuveen Emerging Markets Debt Managed Accounts Portfolio, Nuveen High Yield Managed Accounts Portfolio, Nuveen Preferred Securities and Income Managed Accounts Portfolio and Nuveen Securitized Credit Managed Accounts Portfolio (for purposes of this Part I, collectively, the “Funds” and each a “Fund”), the renewal of the investment management agreement (for purposes of this Part I, each an “Investment Management Agreement”) with Nuveen Fund Advisors, LLC (for purposes of this Part I, “NFAL”; NFAL is an “Adviser”) pursuant to which NFAL serves as investment adviser to such Fund. Similarly, for each respective Fund, the Board approved the renewal of the sub-advisory agreement (for purposes of this Part I, each a “Sub-Advisory Agreement”) with Nuveen Asset Management, LLC (for purposes of this Part I, the “Sub-Adviser”) pursuant to which the Sub-Adviser serves as the sub-adviser to such Fund. Below is a summary of the annual review process the Board undertook related to its most recent renewal of each Investment Management Agreement and Sub-Advisory Agreement on behalf of the applicable Fund.
In accordance with applicable law, following up to an initial two-year period, the Board considers the renewal of each Investment Management Agreement and Sub-Advisory Agreement on behalf of the applicable Fund on an annual basis. For purposes of this Part I, the Investment Management Agreements and Sub-Advisory Agreements are collectively referred to as the “Advisory Agreements,” and NFAL and the Sub-Adviser are collectively, the “Fund Advisers” and each a “Fund Adviser.” In addition, the fund complex consists of the group of funds advised by NFAL (collectively referred to as the “Nuveen funds”) and the group of funds advised by Teachers Advisors, LLC (“TAL” and such funds are collectively, the “TC funds”). For clarity, NFAL serves as Adviser to the Nuveen funds, including the Funds, and TAL serves as “Adviser” to the TC funds. The Board Members considered that the prior separate boards of the TC funds and Nuveen funds were consolidated effective in January 2024. Accordingly, at the Meeting, the Board Members considered the review of the advisory agreements for the Nuveen funds as well as reviewed the investment management agreements for the TC funds. Depending on the appropriate context, references to “the Adviser” may be to NFAL with respect to the Nuveen funds and/or TAL with respect to the TC funds.
The Board Members considered the review of the advisory agreements of the Nuveen funds and the TC funds to be an ongoing process. The Board Members therefore employed the accumulated information, knowledge and experience they had gained during their tenure on the respective board of the TC funds or Nuveen funds (as the case may be) governing the applicable funds and working with the respective investment advisers and sub- advisers, as applicable, in their review of the advisory agreements for the fund complex.
During the course of the year prior to the Meeting, the Board and/or its committees received a wide variety of materials that covered a range of topics relevant to the Board’s annual consideration of the renewal of the advisory agreements, including reports on fund investment results over various periods; product initiatives for various funds; fund expenses; compliance, regulatory and risk management matters; trading practices, including soft dollar arrangements (as applicable); the liquidity and derivatives risk management programs; management of distributions; valuation of securities; payments to financial intermediaries (as applicable); securities lending (as applicable); and overall market and regulatory developments.
Item 11. Statement Regarding Basis for Approval of Investment Advisory Contract (continued)
The Board also met periodically with and/or received presentations by key investment professionals managing a fund’s portfolio. In particular, at the Board meeting held on February 27-29, 2024 (the “February Meeting”), the Board and/or its Investment Committee received the annual performance review of the funds as described in further detail below. The presentations, discussions and meetings throughout the year also provide a means for the Board to evaluate and consider the level, breadth and quality of services provided by the Adviser and sub-advisers, as applicable, and how such services have changed over time in light of new or modified regulatory requirements, changes to market conditions or other factors.
In connection with its annual consideration of the advisory agreements, the Board, through its independent legal counsel, requested and received extensive materials and information prepared specifically for its review of the advisory agreements. The materials provided at the Meeting and/or prior meetings covered a wide range of matters including, but not limited to, a description of the nature, extent and quality of services provided by the Fund Advisers; the consolidation of the Nuveen fund family and TC fund family; a review of product actions advanced in 2023 for the benefit of particular funds and/or the fund complex; a review of each sub-adviser, if applicable, and/or applicable investment team; an analysis of fund performance with a focus on funds considered to have met certain challenged performance measurements; an analysis of certain fee and expense information; a list of management fee and, if applicable, sub-advisory fee schedules; a description of portfolio manager compensation; a description of the profitability and/or financial data of Nuveen, TAL and the sub-advisers; and a description of indirect benefits received by the Adviser and the sub-advisers as a result of their relationships with the funds, as applicable.
The information prepared specifically for the annual review supplemented the information provided to the Board and its committees and the evaluations of the funds by the Board and its committees during the year. The Board’s review of the advisory agreements for the fund complex is based on all the information provided to the Board and its committees over time. The performance, fee and expense data and other information provided by a Fund Adviser or other service providers were not independently verified by the Board Members.
As part of their review, the Board Members and independent legal counsel met by videoconference in executive session on April 10, 2024 (the “April Executive Session”) to review and discuss materials provided in connection with their annual review of the advisory agreements for the fund complex. After reviewing this information, the Board Members requested, directly or through independent legal counsel, additional information, and the Board subsequently reviewed and discussed the responses to these follow-up questions and requests.
The Board Members were advised by independent legal counsel during the annual review process as well as throughout the year, including meeting in executive sessions with such counsel at which no representatives of management were present. In connection with their annual review, the Board Members also received a memorandum from independent legal counsel outlining their fiduciary duties and legal standards in reviewing the Advisory Agreements.
The Board’s decisions to renew each Advisory Agreement were not based on a single identified factor, but rather each decision reflected the comprehensive consideration of all the information provided to the Board and its committees throughout the year as well as the materials prepared specifically in connection with the annual review process. The contractual arrangements may reflect the results of prior year(s) of review, negotiation and information provided in connection with the Board’s annual review of the funds’ advisory arrangements and oversight of the funds. Each Board Member may have attributed different levels of importance to the various factors and information considered in connection with the annual review process and may have placed different emphasis on the relevant information year to year in light of, among other things, changing market and economic conditions. A summary of the principal factors and information, but not all the factors, the Board considered in deciding to renew the Advisory Agreements is set forth below.
A. Nature, Extent and Quality of Services
In evaluating the renewal of the Advisory Agreements, the Board Members received and considered information regarding the nature, extent and quality of the applicable Fund Adviser’s services provided to each respective Fund with particular focus on the services and enhancements or changes to such services provided during the last year. The Board Members considered the Investment Management Agreements and the Sub-Advisory Agreements separately in the course of their review. With this approach, they considered the roles of NFAL and the Sub-Adviser in providing services to the Funds.
The Board considered that the Adviser provides a wide array of management, oversight and other services to manage and operate the applicable funds. The Board considered the Adviser’s and its affiliates’ dedication of resources, time, people and capital as well as continual program of improvement and innovation aimed at enhancing the funds and fund complex for investors and meeting the needs of an increasingly complex regulatory environment. In particular, over the past several years, the Board considered the significant resources, both financial and personnel, the Adviser and its affiliates have committed in working to consolidate the Nuveen fund family and TC fund family under one centralized umbrella. The Board considered that the organizational changes in bringing together Nuveen, its affiliates and TIAA’s (as defined below) asset management businesses, consolidating the Nuveen and TC fund families and other initiatives were anticipated to provide various benefits for the funds through, among other things, enhanced operating efficiencies, centralized investment leadership and a centralized shared resources and support model. As part of these efforts, the boards of the TC funds and Nuveen funds were consolidated effective in January 2024.
The Board also reviewed information regarding other product actions undertaken or continued by management in the 2023 calendar year in seeking to improve the effectiveness of the organization, the product line-up as well as particular funds through, among other things, continuing to review and optimize the product line and gaining efficiencies through mergers and liquidations; reviewing and updating investment policies and benchmarks; implementing fee waivers and/or expense cap changes for certain funds; evaluating and adjusting portfolio management teams as appropriate for various funds; and developing policy positions on a broad range of regulatory proposals that may impact the funds and communicating with lawmakers and other regulatory authorities to help ensure these positions are considered. In its review, the Board considered that the funds operated in a highly regulated industry and the scope and complexity of the services and resources that the Adviser and its affiliates must provide to manage and operate the applicable funds have expanded over the years as a result of, among other things, regulatory, market and other developments, such as the adoption of the tailored shareholder report or the revised fund name rule.
In considering the breadth and quality of services the Adviser and its various teams provide, the Board considered that the Adviser provides investment advisory services. With respect to the Nuveen funds, such funds utilize sub-advisers to manage the portfolios of the funds subject to the supervision of NFAL. Accordingly, the Board considered that NFAL and its affiliates, among other things, oversee and review the performance of the respective sub-adviser and its investment team(s); evaluate Nuveen fund performance and market conditions; evaluate investment strategies and recommend changes thereto; set and manage distributions consistent with the respective Nuveen fund’s product design; oversee trade execution and, as applicable, securities lending; evaluate investment risks; and manage valuation matters. The Board further considered that over the course of the 2023 calendar year, the Nuveen global public product team which supports the funds in the fund complex and their shareholders assessed the investment personnel across the investment leadership teams which resulted in additions or other modifications to the portfolio management teams of various funds. The Board also reviewed a description of the compensation structure applicable to certain portfolio managers.
In addition to the above investment advisory services, the Board further considered the extensive compliance, regulatory, administrative and other services the Adviser and its various teams or affiliates provide to manage and operate the applicable funds. Given the highly regulated industry in which the funds operate, the Board considered the breadth of the Adviser’s compliance program and related policies and procedures. The Board reviewed various initiatives the Adviser’s compliance team undertook or continued in 2023, in part, to address new regulatory requirements, support international business growth and product development, enhance international trading capabilities, enhance monitoring capabilities in light of the new regulatory requirements and guidance and maintain a comprehensive training program. The Board further considered, among other things, that other non-advisory services provided included, among other things, board support and reporting; establishing and reviewing the services provided by other fund service providers (such as a fund’s custodian, accountant, and transfer agent); risk management, including reviews of the liquidity risk management and derivatives risk management programs; legal support services; regulatory advocacy; and cybersecurity, business continuity and disaster recovery planning and testing. However, the Board considered that the Funds may not require the same level of shareholder services as other funds given that they are sold via separately managed accounts.
Aside from the services provided, the Board considered the financial resources of the Adviser and/or its affiliates and their willingness to make investments in the technology, personnel and infrastructure to support the funds, including to enhance global talent, middle office systems, software and international and internal capabilities. The Board considered the access provided by the Adviser and its affiliates to a seed capital budget to support new or existing funds and/or facilitate changes for a respective fund. The Board considered the benefits to shareholders of investing in a fund that is a part of a large fund complex with a variety of investment disciplines, capabilities, expertise and resources available to navigate and support the funds including during stressed times. The Board considered the overall reputation and capabilities of the Adviser and its affiliates and the Adviser’s continuing commitment to provide high quality services.
In its review, the Board also considered the significant risks borne by the Adviser and its affiliates in connection with their services to the applicable funds, including entrepreneurial risks in sponsoring and supporting new funds and smaller funds and ongoing risks with managing the funds, such as investment, operational, reputational, regulatory, compliance and litigation risks.
With respect to the Funds, the Board considered the division of responsibilities between NFAL and the Sub-Adviser and considered that the Sub- Adviser and its investment personnel generally are responsible for the management of each Fund’s portfolio under the oversight of NFAL and the Board. The Board considered an analysis of the Sub-Adviser provided by NFAL which included, among other things, a summary of changes in the leadership teams and/or portfolio manager teams; the performance of the Nuveen funds sub-advised by the Sub-Adviser over various periods of time; and data reflecting product changes (if any) taken with respect to certain Nuveen funds. The Board considered that NFAL recommended the renewal of the Sub-Advisory Agreements.
Based on its review, the Board determined, in the exercise of its reasonable business judgment, that it was satisfied with the nature, extent and quality of services provided to the respective Funds under each applicable Advisory Agreement.
B. The Investment Performance of the Funds and Fund Advisers
In evaluating the quality of the services provided by the Fund Advisers, the Board also considered a variety of investment performance data of the Funds. In this regard, the Board and/or its Investment Committee reviewed, among other things, performance of the Funds over the quarter, one-, three- and five-year periods ending December 31, 2023 and March 31, 2024 (or for such shorter periods to the extent a Fund was not in existence during such periods). The Board performed its annual review of fund performance at its February Meeting and an additional review at the April Executive Session and also reviewed and discussed performance data at its other regularly scheduled quarterly meetings throughout the year. The Board therefore took into account the performance data, presentations and discussions (written and oral) that were provided at the Meeting and in prior meetings over time in evaluating fund performance, including management’s analysis of a fund’s performance with particular focus on funds that met certain challenged performance measurements as determined pursuant to a methodology approved by the Board or additional measurements as determined by management’s investment analysts. As various Nuveen funds have modified their portfolio teams and/or made significant changes to their portfolio strategies over time, the Board reviewed, among other things, certain tracking performance data over specific periods comparing performance before and after such changes.
The Board considered that performance data reflects performance over a specified period which may differ significantly depending on the ending dates selected, particularly during periods of market volatility. Further, the Board considered that shareholders may evaluate performance based on their own respective holding periods which may differ from the performance periods reviewed by the Board and lead to differing results.
In its evaluation, the Board reviewed fund performance results from different perspectives. In general, subject to certain exceptions, the Board reviewed both absolute and relative fund performance over the various time periods and considered performance results in light of a fund’s investment objective(s), strategies and risks. With respect to the relative performance, the Board generally considered fund performance in comparison to the performance of certain peer funds (a “performance peer group”), subject to certain exceptions, and recognized and/or customized benchmarks (i.e., generally benchmarks derived from multiple recognized benchmarks). (Given their unique nature, the Funds do not have performance peer groups available.) In reviewing such comparative performance, the Board was cognizant of the inherent limitations
Item 11. Statement Regarding Basis for Approval of Investment Advisory Contract (continued)
of such data which can make meaningful performance comparisons generally difficult. With respect to relative performance of a fund compared to a benchmark index, differences, among other things, in the investment objective(s) and strategies of a fund and the benchmark (particularly an actively managed fund that does not directly follow an index) as well as the costs of operating a fund would necessarily contribute to differences in performance results and limit the value of the comparative performance information.
The Board evaluated performance in light of various relevant factors which may include, among other things, general market conditions, issuer- specific information, asset class information, leverage and fund cash flows. The Board considered that long-term performance could be impacted by even one period of significant outperformance or underperformance and that a single investment theme could disproportionately affect performance. Further, the Board considered that market and economic conditions may significantly impact a fund’s performance, particularly over shorter periods, and such performance may be more reflective of such economic or market events and not necessarily reflective of management skill. Although the Board reviews short-, intermediate- and longer-term performance data, the Board considered that longer periods of performance may reflect full market cycles.
In their review from year to year, the Board Members consider and may place different emphasis on the relevant information in light of changing circumstances in market and economic conditions. In evaluating performance, the Board focused particular attention on funds with less favorable performance records. However, depending on the facts and circumstances, including any differences between the respective fund and its benchmark and/or performance peer group, as applicable, the Board may be satisfied with a fund’s performance notwithstanding that its performance may be below that of its benchmark and/or peer group for certain periods. With respect to any funds for which the Board has identified performance issues, the Board seeks to monitor such funds more closely until performance improves, discuss with the Adviser the reasons for such results, consider whether any steps are necessary or appropriate to address such issues, discuss and evaluate the potential consequences of such steps and review the results of any steps undertaken.
The performance determinations with respect to each Fund are summarized below.
| | • | | For Municipal Total Return Managed Accounts Portfolio, the Board considered that, given the unique nature of the Fund, the Fund does not have peers. In considering the performance of the Fund relative to its benchmark, the Board considered that although the Fund’s performance was below the performance of its benchmark for the three- and five-year periods ended December 31, 2023 and March 31, 2024, the Fund outperformed its benchmark for the one-year periods ended December 31, 2023 and March 31, 2024. On the basis of the Board’s ongoing review of investment performance and all relevant factors, including the relative market conditions during certain reporting periods, the Fund’s investment objective(s) and management’s discussion of performance, the Board concluded that the Fund’s performance supported renewal of the Advisory Agreements. |
| | • | | For Nuveen Core Impact Bond Managed Accounts Portfolio, the Board considered that, given the unique nature of the Fund, the Fund does not have peers. In considering the performance of the Fund relative to its benchmark, the Board considered that although the Fund’s performance was below the performance of its benchmark for the three-year periods ended December 31, 2023 and March 31, 2024, the Fund outperformed its benchmark for the one-year periods ended December 31, 2023 and March 31, 2024. On the basis of the Board’s ongoing review of investment performance and all relevant factors, including the relative market conditions during certain reporting periods, the Fund’s investment objective(s) and management’s discussion of performance, the Board concluded that the Fund’s performance supported renewal of the Advisory Agreements. |
| | • | | For Nuveen Emerging Markets Debt Managed Accounts Portfolio, the Board considered that, given the unique nature of the Fund, the Fund does not have peers. In considering the performance of the Fund relative to its benchmark, the Board considered that the Fund’s performance was below the performance of its benchmark for the one-year periods ended December 31, 2023 and March 31, 2024. The Board, however, considered that the Fund’s performance history was too short to make a meaningful assessment of performance. |
| | • | | For Nuveen High Yield Managed Accounts Portfolio, the Board considered that, given the unique nature of the Fund, the Fund does not have peers. In considering the performance of the Fund relative to its benchmark, the Board considered that the Fund’s performance was below the performance of its benchmark for the one-year periods ended December 31, 2023 and March 31, 2024. The Board, however, considered that the Fund’s performance history was too short to make a meaningful assessment of performance. |
| | • | | For Nuveen Preferred Securities and Income Managed Accounts Portfolio, the Board considered that, given the unique nature of the Fund, the Fund does not have peers. In considering the performance of the Fund relative to its blended benchmark, the Board considered that although the Fund’s performance was below the performance of its blended benchmark for the one-year period ended December 31, 2023, the Fund outperformed its blended benchmark for the one-year period ended March 31, 2024. The Board, however, considered that the Fund’s performance history was too short to make a meaningful assessment of performance. |
| | • | | For Nuveen Securitized Credit Managed Accounts Portfolio, the Board considered that, given the unique nature of the Fund, the Fund does not have peers. In considering the performance of the Fund relative to its benchmark, the Board considered that the Fund outperformed its benchmark for the one-year periods ended December 31, 2023 and March 31, 2024. The Board, however, considered that the Fund’s performance history was too short to make a meaningful assessment of performance. |
C. Fees, Expenses and Profitability
Each Fund is sold via separately managed accounts which pay the Adviser a managed account management fee. As the Adviser is compensated from the applicable managed accounts, the Funds do not pay the Adviser a management fee. Further, the Adviser had agreed to pay or reimburse each Fund’s expenses (subject to certain exceptions such as for interest expense, taxes, fees incurred in acquiring and disposing of portfolio securities and extraordinary expenses). Given the unique fee arrangement, the Funds do not have peer groups and, therefore, a comparative peer analysis was not provided for any of the Funds. In addition, as the Adviser pays nearly all the Funds’ expenses, the Board considered that the Funds’ expenses were also not comparable to a peer group or to other Nuveen funds. Each managed account management fee was an asset-based fee based on the entire separately managed account portfolio, including the portion invested in the respective Fund.
With respect to Municipal Total Return Managed Accounts Portfolio, the managed account management fee paid to the Adviser represented an implied management fee for managing such Fund and an implied management fee for managing individual municipal bonds. With respect to the other Funds, the managed account management fee paid to the Adviser represented an implied management fee for managing such Funds and an implied management fee for managing individual securities.
Based on its review of the information provided, the Board determined that each Fund’s fee and expense arrangement was reasonable.
| | 2. | Comparisons with the Fees of Other Clients |
In evaluating the appropriateness of fees, the Board also considered that the Adviser, affiliated sub-advisers and/or their affiliate(s) provide investment management services to other types of clients which may include: separately managed accounts, retail managed accounts, foreign funds (UCITS), other investment companies (as sub-advisers), limited partnerships and collective investment trusts. The Board reviewed the equal weighted average fee or other fee data for the other types of clients managed in a similar manner to certain of the Nuveen funds and TC funds. The Board considered the Adviser’s rationale for the differences in the management fee rates of the funds compared to the management fee rates charged to these other types of clients. In this regard, the Board considered that differences, including but not limited to, the amount, type and level of services provided by the Adviser to the funds compared to that provided to other clients as well as differences in investment policies; regulatory, disclosure and governance requirements; servicing relationships with vendors; the manner of managing such assets; product structure; investor profiles; and account sizes all may contribute to variations in relative fee rates. Further, differences in the client base, governing bodies, distribution, jurisdiction and operational complexities also would contribute to variations in management fees assessed the funds compared to foreign fund clients. In addition, differences in the level of advisory services required for passively managed funds also contribute to differences in the management fee levels of such funds compared to actively managed funds. As a general matter, higher fee levels reflect higher levels of service provided by the Adviser, increased investment management complexity, greater product management requirements, and higher levels of business risk or some combination of these factors. The Board considered the wide range of services in addition to investment management that the Adviser had provided to the funds compared to other types of clients as well as the increased entrepreneurial, legal and regulatory risks that the Adviser incurs in sponsoring and managing the funds. Given that the Funds are sold via separately managed accounts, the Board considered that the Funds may not require the same level of shareholder services as other funds. Further, as noted, given the Funds’ unique fee and expense structure pursuant to which they do not pay management fees and the expenses are primarily reimbursed, comparisons with peers were not available.
| | 3. | Profitability of Fund Advisers |
In their review, the Board Members considered various profitability data relating to the Fund Advisers’ services to the Nuveen funds.
With respect to the Nuveen funds, the Board Members reviewed the estimated profitability information of Nuveen as a result of its advisory services to the Nuveen funds overall as well as profitability data of certain other asset management firms. Such profitability information included, among other things, gross and net revenue margins (excluding distribution) of Nuveen Investments, Inc. (“Nuveen Investments”) for services to the Nuveen funds on a pre-tax and after-tax basis for the 2023 and 2022 calendar years as well as the revenues earned (less any expense reimbursements/fee waivers) and expenses incurred by Nuveen Investments for its advisory activities to the Nuveen funds (excluding distribution) for the 2023 and 2022 calendar years. The Board Members also considered the rationale for the change in Nuveen’s profitability from 2022 to 2023. In addition, the Board reviewed the revenues, expenses and operating margin (pre- and after-tax) NFAL derived from its exchange-traded fund product line for the 2023 and 2022 calendar years.
In developing the profitability data, the Board Members considered the subjective nature of calculating profitability as the information is not audited and is necessarily dependent on cost allocation methodologies to allocate expenses throughout the complex and among the various advisory products. Given there is no single universally recognized expense allocation methodology and that other reasonable and valid allocation methodologies could be employed and could lead to significantly different results, the Board reviewed, among other things, a description of the cost allocation methodologies employed to develop the financial information, a summary of the refinements Nuveen had made to the methodology that had occurred over the years from 2010 through 2021 to provide Nuveen’s profitability analysis, and a historical expense analysis of Nuveen Investments’ revenues, expenses and pre-tax net revenue margins derived from its advisory services to the Nuveen funds (excluding distribution) for the calendar years from 2017 through 2023. The Board of the Nuveen funds had also appointed two Board Members to serve as the Board’s liaisons to meet with representatives of NFAL and review the development of the profitability data and to report to the full Board.
Item 11. Statement Regarding Basis for Approval of Investment Advisory Contract (continued)
In addition, the Board considered certain comparative operating margin data. In this regard, the Board reviewed the operating margins of Nuveen Investments compared to the adjusted operating margins of a peer group of asset management firms with publicly available data and the most comparable assets under management (based on asset size and asset composition) to Nuveen. The Board considered that the operating margins of the peers were adjusted generally to address that certain services provided by the peers were not provided by Nuveen. The Board also reviewed, among other things, the net revenue margins (pre-tax) of Nuveen Investments on a company-wide basis and the net revenue margins (pre-tax) of Nuveen Investments derived from its services to the Nuveen funds only (including and excluding distribution) compared to the adjusted operating margins of the peer group for each calendar year from 2014 to 2023. In their review of the comparative data, the Board Members considered the limitations of the comparative data given that peer data is not generally public and the calculation of profitability is subjective and affected by numerous factors (such as types of funds a peer manages, its business mix, its cost of capital, the numerous assumptions underlying the methodology used to allocate expenses and other factors) that can have a significant impact on the results.
Aside from the profitability data, the Board considered that NFAL and TAL are affiliates of Teachers Insurance and Annuity Association of America (“TIAA”). NFAL is a subsidiary of Nuveen, LLC, the investment management arm of TIAA, and TAL is an indirect wholly owned subsidiary of TIAA. Accordingly, the Board also reviewed a balance sheet for TIAA reflecting its assets, liabilities and capital and contingency reserves for the 2023 and 2022 calendar years to consider the financial strength of TIAA. The Board considered the benefit of an investment adviser and its parent with significant resources, particularly during periods of market volatility. The Board also considered the reinvestments the Adviser, its parent and/or other affiliates made into their business through, among other things, the investment of seed capital in certain funds, initiatives in international expansion, investments in infrastructure and continued investments in enhancements to technological capabilities.
The Board Members considered the profitability of the Sub-Adviser from its relationships with the respective Nuveen funds. In this regard, the Board Members reviewed, among other things, the Sub-Adviser’s revenues, expenses and net revenue margins (pre- and after-tax) for its advisory activities to the respective Nuveen funds for the calendar years ended December 31, 2023 and December 31, 2022. The Board Members also reviewed a profitability analysis reflecting the revenues, expenses and revenue margin (pre- and after-tax) grouped by similar types of funds (such as municipal, taxable fixed income, equity, real assets and index/asset allocation) for the Sub-Adviser for the calendar years ending December 31, 2023 and December 31, 2022.
In evaluating the reasonableness of the compensation, the Board Members also considered the indirect benefits NFAL or the Sub-Adviser received that were directly attributable to the management of the applicable funds as discussed in further detail below. Based on its review, the Board was satisfied that each Fund Adviser’s level of profitability from its relationship with each Nuveen fund was not unreasonable over various time frames in light of the nature, extent and quality of services provided.
D. Economies of Scale and Whether Fee Levels Reflect These Economies of Scale
The Board considered whether there have been economies of scale with respect to the management of the funds in the fund complex, including the Funds, whether these economies of scale have been appropriately shared with such funds and whether there is potential for realization of further economies of scale. Although the Board considered that economies of scale are difficult to measure with any precision and the rates at which certain expenses are incurred may not decline with a rise in assets, the Board considered that there are various methods that may be employed to help share the benefits of economies of scale, including, among other things, through the use of breakpoints in the management fee schedule, fee waivers and/or expense limitations, the pricing of funds at scale at inception and investments in the Adviser’s business which can enhance the services provided to the applicable funds for the fees paid. The Board considered that the Adviser has generally employed one or more of these various methods among the applicable funds. In this regard, the boards governing the Nuveen funds have considered that the management fee of NFAL generally is comprised of a fund-level component and a complex-level component each with its own breakpoint schedule, subject to certain exceptions. However, the Board Members considered that because the Funds do not pay a management fee, there are no applicable fund-level or complex-wide level breakpoint schedules, although the Funds’ assets would be counted toward the complex-wide total.
In addition, the Board Members considered the temporary and/or permanent expense caps (if any) applicable to a fund. The Board considered that such waivers and reimbursements applicable to the respective funds are another means for potential economies of scale to be shared with shareholders of such funds and can provide a protection from an increase in expenses if the assets of the applicable funds decline. In this regard, as noted above, each Fund is reimbursed nearly all of its expenses by the Adviser.
The Board Members also considered the continued reinvestment in Nuveen/TIAA’s business to enhance its capabilities and services to the benefit of its various clients. The Board understood that many of these investments were not specific to individual funds, but rather incurred across a variety of products and services pursuant to which the family of funds as a whole may benefit. The Board further considered that the Adviser and its affiliates have provided certain additional services, including, but not limited to, services required by new regulations and regulatory interpretations, and this was also a means of sharing economies of scale with the funds and their shareholders. The Board considered the Adviser’s and/or its affiliates’ ongoing efforts to streamline the product line-up, among other things, to create more scaled funds which may help improve both expense and trading economies.
Based on its review, the Board was satisfied that the current fee arrangements together with the reinvestment in management’s business appropriately shared any economies of scale with shareholders.
E. Indirect Benefits
The Board Members received and considered information regarding various indirect benefits the respective Fund Adviser or its affiliates may receive as a result of their relationship with the funds in the fund complex, including the Funds. These benefits included, among other things, economies of scale to the extent the Adviser or its affiliates share investment resources and/or personnel with other clients of the Adviser. The funds may also be
used as investment options for other products or businesses offered by the Adviser and/or its affiliates, such as variable products, fund of funds and 529 education savings plans, and affiliates of the Adviser may serve as sub-advisers to various funds in which case all advisory and sub-advisory fees generated by such funds stay within Nuveen.
Further, the funds may pay the Adviser and/or its affiliates for other services, such as distribution. In this regard, the Board Members considered that an affiliate of the Adviser serves as principal underwriter providing distribution and/or shareholder services to the open-end funds for which it may be compensated. In addition, the Board Members considered that the Adviser and Sub-Adviser may utilize soft dollar brokerage arrangements attributable to the respective funds to obtain research and other services for any or all of their clients, although the Board Members also considered reimbursements of such costs by the Adviser and/or Sub-Adviser.
The Adviser and its affiliates may also benefit from the advisory relationships with the funds in the fund complex to the extent this relationship results in potential investors viewing the TIAA group of companies as a leading retirement plan provider in the academic and nonprofit market and a single source for all their financial service needs. The Adviser and/or its affiliates may further benefit to the extent that they have pricing or other information regarding vendors the funds utilize in establishing arrangements with such vendors for other products.
Based on its review, the Board concluded that any indirect benefits received by a Fund Adviser as a result of its relationship with the Funds were reasonable in light of the services provided.
F. Other Considerations
The Board Members did not identify any single factor discussed previously as all-important or controlling. The Board Members concluded that the terms of each Advisory Agreement were reasonable, that each Fund’s fee arrangement was reasonable and that the Advisory Agreements be renewed for an additional one-year period.
PART II
Nuveen Ultra Short Municipal Managed Accounts Portfolio
The Approval Process
At the meeting held on January 18, 2024 (for purposes of this Part II, the “January Meeting”), the Board considered and approved the investment management agreement (for purposes of this Part II, the “Investment Management Agreement”) pursuant to which Nuveen Fund Advisors, LLC (for purposes of this Part II, the “Adviser”) serves as investment adviser to Nuveen Ultra Short Municipal Managed Accounts Portfolio (for purposes of this Part II, the “Fund”), a series of the Trust, and the investment sub-advisory agreement (for purposes of this Part II, the “Sub-Advisory Agreement”) pursuant to which Nuveen Asset Management, LLC (for purposes of this Part II, the “Sub-Adviser”) serves as investment sub-adviser to the Fund. For purposes of this Part II, the Adviser and the Sub-Adviser are each hereafter a “Fund Adviser.” In addition, for purposes of this Part II, the Investment Management Agreement and the Sub-Advisory Agreement are each hereafter an “Advisory Agreement” and collectively, the “Advisory Agreements.” The Board Members oversee both a group of funds advised by the Adviser (the “Nuveen funds”) and a group of funds advised by Teachers Advisors, LLC (the “TC funds”), an affiliate of the Adviser, as the result of a consolidation of the boards of the Nuveen funds and the TC funds that became effective in January 2024.
To assist the Board in its evaluation of an Advisory Agreement with a Fund Adviser at the January Meeting, the Board Members had received, in adequate time in advance of the January Meeting and/or at prior meetings, materials which outlined, among other things:
| | • | | the nature, extent and quality of the services expected to be provided by the Fund Adviser; |
| | • | | the organization of the Fund Adviser, including the responsibilities of various departments and key personnel; |
| | • | | the expertise and background of the Fund Adviser; |
| | • | | certain performance-related information (as described below); |
| | • | | certain profitability-related information (as described below); |
| | • | | the proposed fee and expense arrangements for the Fund; and |
| | • | | the soft dollar practices of the Fund Adviser, if any. |
At the January Meeting and/or at prior meetings, the Adviser made presentations to and responded to questions from the Board. During the January Meeting and/or at prior meetings, the Board Members also met privately with their legal counsel to, among other things, review the Board’s duties under the 1940 Act, the general principles of state law in reviewing and approving advisory contracts, the standards used by courts in determining whether investment company boards of directors have fulfilled their duties, factors to be considered in voting on advisory contracts and an adviser’s fiduciary duty with respect to advisory agreements and compensation. It is with this background that the Board Members considered the Advisory Agreements. As outlined in more detail below, the Board Members considered various factors they believed relevant with respect to the Fund. Each Board Member may have accorded different weight to the various factors and information discussed below in reaching his or her conclusions with respect to the Fund’s Advisory Agreements. As applicable, the Board Members also considered information they had received in their capacity as trustees or directors of other registered investment companies advised by the Fund Advisers.
Item 11. Statement Regarding Basis for Approval of Investment Advisory Contract (continued)
A. Nature, Extent and Quality of Services
The Board Members considered the nature, extent and quality of the respective Fund Adviser’s services, including portfolio management services and administrative services. Given that the Adviser and the Sub-Adviser already serve as adviser and sub-adviser, respectively, to other Nuveen funds overseen by the Board Members, the Board has a good understanding of each such Fund Adviser’s organization, operations, personnel and services. As the Board meets regularly throughout the year to oversee the Nuveen funds, including funds currently advised by the Fund Advisers, Board Members may have, in part, relied upon their knowledge from their meetings and any other interactions throughout the year with the respective Fund Adviser in evaluating the Advisory Agreements.
At the January Meeting and/or at prior meetings, the Board Members reviewed materials outlining, among other things, the respective Fund Adviser’s organization and business; the types of services that such Fund Adviser or its affiliates provide to the Nuveen funds (as applicable) and are expected to provide to the Fund; and the experience of the respective Fund Adviser. Further, at the January Meeting and/or at prior meetings, the Board Members have evaluated the background and experience of the relevant investment personnel.
The Board has considered that the Adviser provides a wide array of management, oversight and administrative services to manage and operate the Nuveen funds and that the scope and complexity of these services, along with the undertakings required of the Adviser in connection with providing these services, have expanded over time as a result of, among other things, regulatory, market and other developments. The Board has considered the Adviser’s dedication of resources, time, personnel and capital and commitment to continuing to develop improvements and innovations that seek to enhance the fund complex and meet the needs of the Nuveen funds in an increasingly complex regulatory environment. At the January Meeting and/or at prior meetings, the Board received and considered information regarding, among other things, the Adviser’s investment oversight responsibilities, regulatory and compliance services, administrative duties and other services.
Given the Nuveen funds operate in a highly regulated industry, the Board has further considered the extensive compliance, regulatory and administrative services the Adviser and its various teams provide to manage and operate the Nuveen funds. The Board has considered that such services have included, but are not limited to, managing compliance policies; monitoring compliance with applicable policies, laws and regulations; devising internal compliance programs in seeking to enhance compliance with regulatory requirements and creating a framework to review and assess compliance programs; overseeing sub-adviser compliance testing; preparing compliance training materials; and responding to regulatory requests.
In addition to the above functions, the Board has considered the quality and extent of other non-advisory services the Adviser provides including, among other things, various fund administration services (such as preparing, overseeing or assisting with the preparation of tax and regulatory filings); product management services (such as evaluating and enhancing products and strategies); legal support services; shareholder services and transfer agency function oversight services; and board support and reporting services. However, the Board considered that the Fund may not require the same level of shareholder services as other Nuveen funds given that it is sold via separately managed accounts.
The Board Members considered that the Adviser would oversee the Sub-Adviser, which was generally expected to provide portfolio advisory services to the Fund. In addition, the Board Members considered the experience and expertise of the investment team expected to manage the Fund.
Based on its review, the Board determined, in the exercise of its reasonable business judgment, that it was satisfied with the nature, extent and quality of services expected to be provided to the Fund under each Advisory Agreement.
B. Investment Performance
The Fund was new and, therefore, did not have its own performance history. The Board Members, however, were familiar with the performance records of other municipal Nuveen funds advised by the Adviser and sub-advised by the Sub-Adviser.
C. Fees, Expenses and Profitability
The Board considered that the Fund’s fee structure would differ from that of most other open-end Nuveen funds. In this regard, the Board considered that the Fund would be sold via separately managed accounts that would pay the Adviser a managed account management fee. As the Adviser will be compensated from the managed accounts, the Fund will not pay the Adviser a management fee. The managed account management fee will be an asset-based fee based on the entire separately managed account portfolio, including the portion invested in the Fund. The managed account management fee paid to the Adviser therefore will include an embedded fee for managing the Fund and embedded fees for managing individual bonds. In evaluating the proposed fee arrangement for the Fund, the Board considered the rationale for the determination of the effective gross management fee for the Fund portion of the overall product. Further, the Board considered the Fund’s estimated annual operating expenses, but also considered that the Adviser had agreed to pay or reimburse the Fund’s expenses (except for interest expense, taxes, fees incurred in acquiring and disposing of portfolio securities and extraordinary expenses).
Based on its review of the information provided, the Board considered the Fund’s proposed fee and expense structure and determined that the proposed arrangement was reasonable.
| 2. | Comparisons with the Fees of Other Clients |
At the January Meeting and/or at prior meetings, the Board considered information regarding the fee rates that the respective Fund Advisers charge to certain other types of clients and the types of services provided to these other clients. With respect to the Adviser and/ or the Sub-Adviser, such other clients may include retail and institutional municipal managed accounts sub-advised by the Sub-Adviser, municipal exchange-traded funds (“ETFs”) sub-advised by the Sub-Adviser that are offered by another fund complex, municipal managed accounts offered by an unaffiliated adviser and certain municipal private limited partnerships offered by Nuveen. The Board has reviewed, among other things, the fee range and average fee of municipal retail advisory accounts and municipal institutional accounts; the sub- advisory fee the Sub-Adviser has received for serving as sub-adviser to certain municipal ETFs offered outside the Nuveen family; and the management fee rates paid by the municipal private limited partnerships operated by Nuveen.
In considering the comparative fee data, the Board has considered that differences, including but not limited to, the amount, type and level of services provided by the Adviser to the Nuveen funds compared to that provided to other clients as well as differences in investment policies; eligible portfolio assets and the manner of managing such assets; product structure; investor profiles; account sizes; and regulatory requirements contribute to the variations in the fee schedules. The Board has considered the wide range of services in addition to investment management that the Adviser provides to the Nuveen funds compared to other types of clients as well as the increased entrepreneurial, legal and regulatory risks that the Adviser incurs in sponsoring and managing the Nuveen funds. In general, higher fee levels reflect higher levels of service provided by the Adviser, increased investment management complexity, greater product management requirements, and higher levels of business risk or some combination of these factors. Given that the Fund would be sold via separately managed accounts, however, the Board considered that the Fund may not require the same level of shareholder services as other Nuveen funds.
| 3. | Profitability of Fund Advisers |
At the January Meeting and/or at prior meetings, the Board Members have considered profitability and other financial data for Nuveen, including estimated profitability information of Nuveen as a result of its advisory services to the Nuveen funds as well as profitability data of certain other asset management firms. Such profitability information has included, among other things, gross and net revenue margins (excluding distribution) of Nuveen Investments, Inc. (“Nuveen Investments”) for services to the Nuveen funds on a pre-tax and after-tax basis for the 2022 and 2021 calendar years as well as the revenues earned (less any expense reimbursements/fee waivers) and expenses incurred by Nuveen Investments for its advisory activities to the Nuveen funds (excluding distribution and certain other expenses) for the 2022 and 2021 calendar years. The Board Members have also considered a summary of some of the key factors that impacted Nuveen’s profitability in 2022. In addition, the Board has considered the revenues, expenses and operating margin (pre- and after-tax) the Adviser derived from its ETF product line for the 2022 and 2021 calendar years.
In developing the profitability data of the Adviser for its advisory services to the Nuveen funds, the Board Members have considered the subjective nature of calculating profitability as the information is not audited and is necessarily dependent on cost allocation methodologies to allocate expenses throughout the complex and among the various advisory products. Given there is no single universally recognized expense allocation methodology and that other reasonable and valid allocation methodologies could be employed and could lead to significantly different results, the Board has reviewed, among other things, a description of the cost allocation methodologies employed to develop the financial information, a summary of the history of changes to the methodology over the years from 2010 through 2022, and a historical expense analysis of Nuveen Investments’ revenues, expenses and pre-tax net revenue margins derived from its advisory services to the Nuveen funds (excluding distribution) for the calendar years from 2017 through 2022. The Board had also appointed four Board Members to serve as the Board’s liaisons, with the assistance of independent counsel, to meet with representatives of the Adviser and review the development of the profitability data and to report to the full Board.
In addition, the Board has considered certain comparative operating margin data. In this regard, the Board has reviewed the operating margins of Nuveen Investments compared to the adjusted operating margins of a peer group of asset management firms with publicly available data and the most comparable assets under management (based on asset size and asset composition) to Nuveen. The Board has considered that the operating margins of the peers were adjusted generally to address that certain services provided by the peers were not provided by Nuveen. The Board has also reviewed, among other things, the net revenue margins (pre-tax) of Nuveen Investments on a company-wide basis and the net revenue margins (pre-tax) of Nuveen Investments derived from its services to the Nuveen funds only (including and excluding distribution) compared to the adjusted operating margins of the peer group for each calendar year from 2012 to 2022. Although the total company operating margins of Nuveen Investments were in the bottom half of the peer group range for 2022 and 2021, the Board Members have considered the limitations of the comparative data given that peer data is not generally public and the calculation of profitability is subjective and affected by numerous factors (such as types of funds a peer manages, its business mix, its cost of capital, the numerous assumptions underlying the methodology used to allocate expenses and other factors) that can have a significant impact on the results.
Item 11. Statement Regarding Basis for Approval of Investment Advisory Contract (continued)
Aside from Nuveen’s profitability, the Board has considered that the Adviser is a subsidiary of Nuveen, LLC, the investment management arm of Teachers Insurance and Annuity Association of America (“TIAA”). Accordingly, the Board has also reviewed a balance sheet for TIAA reflecting its assets, liabilities and capital and contingency reserves for the 2022 and 2021 calendar years to consider the financial strength of TIAA. The Board has considered the benefit of an investment adviser and its parent with significant resources, particularly during periods of market volatility. The Board has also considered the reinvestments Nuveen, its parent and/or other affiliates have made into its business through, among other things, the investment of seed capital in certain Nuveen funds and continued investments in enhancements to technological capabilities.
In addition to Nuveen, the Board Members have considered the profitability of the Sub-Adviser from its relationships with the respective Nuveen funds. In this regard, the Board Members have reviewed, among other things, the Sub-Adviser’s revenues, expenses and net revenue margins (pre- and after-tax) for its advisory activities to the respective Nuveen funds for the calendar years ended December 31, 2022 and December 31, 2021. The Board Members have also reviewed a profitability analysis reflecting the revenues, expenses and revenue margin (pre- and after-tax) by asset type for the Sub-Adviser for the calendar years ending December 31, 2022 and December 31, 2021.
In evaluating the reasonableness of the compensation, the Board Members have also considered any other ancillary benefits derived by the respective Fund Adviser from its relationship with the Nuveen funds as discussed in further detail below.
Based on its consideration of the information provided, the Board was satisfied that Nuveen’s and the Sub-Adviser’s level of profitability was acceptable and not unreasonable in light of the services to be provided.
D. Economies of Scale and Whether Fee Levels Reflect These Economies of Scale
The Board considered whether the Fund could be expected to benefit from any economies of scale. The Board has considered that although economies of scale are difficult to measure and certain expenses may not decline with a rise in assets, there are several methods to help share the benefits of economies of scale, including breakpoints in the management fee schedule, fee waivers and/or expense limitations, the pricing of Nuveen funds at scale at inception and investments in Nuveen’s business which can enhance the services provided to the Nuveen funds for the fees paid. In this regard, the boards governing the Nuveen funds have considered that the management fee of the Adviser is generally comprised of a fund-level component and a complex-level component, each with its own breakpoint schedule, subject to certain exceptions. However, the Board Members considered that because the Fund would not pay management fees, there would be no applicable fund-level or complex-wide level breakpoint schedules, although the Fund’s assets would be counted toward the complex-wide total. In addition, as indicated above, the Board Members considered that the Fund was expected to be reimbursed nearly all of its expenses by the Adviser.
Based on its review, the Board was satisfied that the proposed fee arrangements would appropriately share any economies of scale with the Fund’s shareholders.
E. Indirect Benefits
At the January Meeting and/or prior meetings, the Board Members have received and considered information regarding other benefits the respective Fund Adviser or its affiliates may receive as a result of their relationship with the Nuveen funds. In addition, the Board Members have considered that the Adviser and Sub-Adviser may utilize soft dollar brokerage arrangements attributable to the respective Nuveen funds to obtain research and other services for any or all of their clients, although the Board Members have also considered reimbursements of such costs by the Adviser and/or Sub-Adviser.
Based on its review, the Board concluded that any indirect benefits expected to be received by a Fund Adviser as a result of its relationship with the Fund were reasonable in light of the services expected to be provided.
F. Approval
The Board Members did not identify any single factor discussed previously as all-important or controlling. The Board Members concluded that the terms of the Investment Management Agreement and the Sub-Advisory Agreement were reasonable, that the Fund’s fee arrangements were reasonable and that the Investment Management Agreement and Sub-Advisory Agreement should be and were approved on behalf of the Fund.
| Item 12. | Disclosure of Proxy Voting Policies and Procedures for Closed-End Management Investment Companies. |
Not applicable to open-end investment companies.
| Item 13. | Portfolio Managers of Closed-End Management Investment Companies. |
Not applicable to open-end investment companies.
| Item 14. | Purchases of Equity Securities by Closed-End Management Investment Company and Affiliated Purchasers. |
Not applicable to open-end investment companies.
| Item 15. | Submission of Matters to a Vote of Security Holders. |
There have been no material changes to the procedures by which shareholders may recommend nominees to the registrant’s Board of Trustees implemented after the registrant last provided disclosure in response to this Item.
| Item 16. | Controls and Procedures. |
| (a) | The registrant’s principal executive and principal financial officers, or persons performing similar functions, have concluded that the registrant’s disclosure controls and procedures (as defined in Rule 30a-3(c) under the Investment Company Act of 1940, as amended (the “1940 Act”) (17 CFR 270.30a-3(c))) are effective, as of a date within 90 days of the filing date of this report that includes the disclosure required by this paragraph, based on their evaluation of the controls and procedures required by Rule 30a-3(b) under the 1940 Act (17 CFR 270.30a-3(b)) and Rules 13a-15(b) or 15d-15(b) under the Securities Exchange Act of 1934, as amended (the “Exchange Act”) (17 CFR 240.13a-15(b) or 240.15d-15(b)). |
| (b) | There were no changes in the registrant’s internal control over financial reporting (as defined in Rule 30a-3(d) under the 1940 Act (17 CFR 270.30a-3(d)) that occurred during the period covered by this report that has materially affected, or is reasonably likely to materially affect, the registrant’s internal control over financial reporting. |
| Item 17. | Disclosure of Securities Lending Activities for Closed-End Management Investment Companies. |
| (a) | Not applicable to open-end investment companies. |
| (b) | Not applicable to open-end investment companies. |
| Item 18. | Recovery of Erroneously Awarded Compensation. |
| (a)(1) | Not applicable because the code of ethics is available, upon request and without charge, by calling 800-257-8787 and there were no amendments during the period covered by this report. |
SIGNATURES
Pursuant to the requirements of the Securities Exchange Act of 1934 and the Investment Company Act of 1940, the registrant has duly caused this report to be signed on its behalf by the undersigned, thereunto duly authorized.
Nuveen Managed Accounts Portfolios Trust
| | | | |
Date: October 4, 2024 | | By: | | /s/ Jordan M. Farris Jordan M. Farris
Chief Administrative Officer |
Pursuant to the requirements of the Securities Exchange Act of 1934 and the Investment Company Act of 1940, this report has been signed below by the following persons on behalf of the registrant and in the capacities and on the dates indicated.
| | | | |
Date: October 4, 2024 | | By: | | /s/ Jordan M. Farris Jordan M. Farris
Chief Administrative Officer
(principal executive officer) |
| | |
Date: October 4, 2024 | | By: | | /s/ E. Scott Wickerham E. Scott Wickerham
Vice President and Controller
(principal financial officer) |