Corporate Property Associates 17 - Global Inactive
Filed: 3 Aug 18, 7:42am
| Table of Contents | |
| Overview | |
| Financial Results | |
| Statements of Income – Last Five Quarters | |
| FFO and AFFO – Last Five Quarters | |
| Balance Sheets and Capitalization | |
| Owned Real Estate | |
| Investment Activity | |
| Investment Management | |
| Appendix | |
Adjusted EBITDA – Last Five Quarters | |
| Summary Metrics | |
| Financial Results | |||||||||||||||
| Segment | |||||||||||||||
Owned Real Estate | Investment Management | Total | |||||||||||||
| Revenues, excluding reimbursable costs – consolidated ($'000) | $ | 168,179 | $ | 21,694 | $ | 189,873 | |||||||||
| Net income attributable to W. P. Carey ($'000) | 59,316 | 16,365 | 75,681 | ||||||||||||
| Net income attributable to W. P. Carey per diluted share | 0.55 | 0.15 | 0.70 | ||||||||||||
Normalized pro rata cash NOI from real estate ($'000) (a) (b) | 169,731 | N/A | 169,731 | ||||||||||||
Adjusted EBITDA ($'000) (a) (b) | 159,541 | 27,607 | 187,148 | ||||||||||||
AFFO attributable to W. P. Carey ($'000) (a) (b) | 116,462 | 26,137 | 142,599 | ||||||||||||
AFFO attributable to W. P. Carey per diluted share (a) (b) | 1.08 | 0.24 | 1.32 | ||||||||||||
| Distributions declared per share – second quarter | 1.02 | ||||||||||||||
| Distributions declared per share – second quarter annualized | 4.08 | ||||||||||||||
| Dividend yield – annualized, based on quarter end share price of $66.35 | 6.1 | % | |||||||||||||
Dividend payout ratio – for the six months ended June 30, 2018 (c) | 78.3 | % | |||||||||||||
| Balance Sheet and Capitalization | |||||||||||||||
| Equity market capitalization – based on quarter end share price of $66.35 ($'000) | $ | 7,112,766 | |||||||||||||
Pro rata net debt ($'000) (d) | 4,330,253 | ||||||||||||||
| Enterprise value ($'000) | 11,443,019 | ||||||||||||||
Total capitalization ($'000) (e) | 11,565,449 | ||||||||||||||
| Total consolidated debt ($'000) | 4,401,058 | ||||||||||||||
Gross assets ($'000) (f) | 8,945,697 | ||||||||||||||
Liquidity ($'000) (g) | 1,225,411 | ||||||||||||||
Pro rata net debt to enterprise value (b) | 37.8 | % | |||||||||||||
Pro rata net debt to adjusted EBITDA (annualized) (a) (b) | 5.8x | ||||||||||||||
| Total consolidated debt to gross assets | 49.2 | % | |||||||||||||
Weighted-average interest rate (b) | 3.5 | % | |||||||||||||
Weighted-average debt maturity (years) (b) | 5.6 | ||||||||||||||
| Moody's Investors Service – corporate rating | Baa2 (stable) | ||||||||||||||
| Standard & Poor's Ratings Services – issuer rating | BBB (stable) | ||||||||||||||
| Owned Real Estate Portfolio (Pro Rata) | |||||||||||||||
ABR ($’000) (h) | $ | 693,482 | |||||||||||||
| Number of net-leased properties | 878 | ||||||||||||||
| Number of operating properties | 1 | ||||||||||||||
Number of tenants – net-leased properties | 208 | ||||||||||||||
ABR from investment grade tenants as a % of total ABR – net-leased properties (i) | 27.5 | % | |||||||||||||
| Net-leased properties – square footage (millions) | 86.6 | ||||||||||||||
| Occupancy – net-leased properties | 99.6 | % | |||||||||||||
| Weighted-average lease term (years) | 10.0 | ||||||||||||||
| Maximum commitment for capital investment projects expected to be completed during 2018 ($’000) | $ | 70,067 | |||||||||||||
| Acquisitions and completed capital investment projects – second quarter ($'000) | 289,193 | ||||||||||||||
| Dispositions – second quarter ($'000) | 128,277 | ||||||||||||||
| (a) | Normalized pro rata cash NOI, Adjusted EBITDA and AFFO are non-GAAP measures. See the Terms and Definitions section in the Appendix for a description of our non-GAAP measures and for details on how certain non-GAAP measures are calculated. |
| (b) | Presented on a pro rata basis. See the Terms and Definitions section in the Appendix for a description of pro rata. |
| (c) | Represents distributions declared per share divided by AFFO per diluted share on a year-to-date basis. |
| (d) | Represents total pro rata debt outstanding less consolidated cash and cash equivalents. See the Terms and Definitions section in the Appendix for a description of pro rata. |
 | Investing for the long runTM | 1 | |
| (e) | Represents equity market capitalization plus total pro rata debt outstanding. See the Terms and Definitions section in the Appendix for a description of pro rata. |
| (f) | Gross assets represent consolidated total assets before accumulated depreciation on buildings and improvements. Gross assets are net of accumulated amortization on in-place lease and other intangible assets of $464.2 million and above-market rent intangible assets of $302.2 million. |
| (g) | Represents availability on our Senior Unsecured Credit Facility plus consolidated cash and cash equivalents. |
| (h) | See the Terms and Definitions section in the Appendix for a description of ABR. |
| (i) | Percentage of portfolio is based on ABR, as of June 30, 2018. Includes tenants or guarantors with investment grade ratings (18.7%) and subsidiaries of non-guarantor parent companies with investment grade ratings (8.8%). Investment grade refers to an entity with a rating of BBB- or higher from Standard & Poor’s Ratings Services or Baa3 or higher from Moody’s Investors Service. See the Terms and Definitions section in the Appendix for a description of ABR. |
| | Investing for the long runTM | 2 | |
| Components of Net Asset Value | |
| Owned Real Estate | Three Months Ended Jun. 30, 2018 | Annualized | |||||||
Normalized pro rata cash NOI (a) (b) | $ | 169,731 | $ | 678,924 | |||||
| Investment Management | Three Months Ended Jun. 30, 2018 | Twelve Months Ended Jun. 30, 2018 | |||||||
Adjusted EBITDA (a) (b) | $ | 27,607 | $ | 115,987 | |||||
| Selected Components of Adjusted EBITDA: | |||||||||
Asset management revenue (c) | 17,268 | 69,045 | |||||||
Structuring revenue (c) | 4,426 | 22,199 | |||||||
Operating partnership interests in real estate cash flow of Managed REITs (d) | 8,586 | 42,168 | |||||||
| Back-end fees and interests associated with the Managed Programs | See the Summary of Back-End Fees for / Interests in the Managed Programs section for details. | ||||||||
| Balance Sheet – Selected Information (Consolidated Unless Otherwise Stated) | As of Jun. 30, 2018 | ||||||||
| Assets | |||||||||
Book value of real estate excluded from NOI (e) | $ | 51,447 | |||||||
| Cash and cash equivalents | 122,430 | ||||||||
| Due from affiliates | 78,100 | ||||||||
| Other assets, net: | |||||||||
| Straight-line rent adjustments | $ | 77,988 | |||||||
| Deferred charges | 42,705 | ||||||||
| Restricted cash, including escrow | 41,388 | ||||||||
| Securities and derivatives | 26,475 | ||||||||
| Investment in GCIF securities | 23,806 | ||||||||
| Accounts receivable | 20,098 | ||||||||
| Taxes receivable | 17,671 | ||||||||
| Other intangible assets, net | 12,667 | ||||||||
| Prepaid expenses | 12,390 | ||||||||
| Note receivable | 9,637 | ||||||||
| Leasehold improvements, furniture and fixtures | 3,179 | ||||||||
| Other | 169 | ||||||||
| Total other assets, net | $ | 288,173 | |||||||
| Liabilities | |||||||||
Total pro rata debt outstanding (b) | $ | 4,452,683 | |||||||
| Distributions payable | 110,972 | ||||||||
| Deferred income taxes | 88,871 | ||||||||
| Accounts payable, accrued expenses and other liabilities: | |||||||||
| Accounts payable and accrued expenses | $ | 90,552 | |||||||
| Prepaid and deferred rents | 77,142 | ||||||||
| Tenant security deposits | 31,651 | ||||||||
| Accrued taxes payable | 27,392 | ||||||||
| Securities and derivatives | 4,244 | ||||||||
| Straight-line rent adjustments | 1,878 | ||||||||
| Other | 12,429 | ||||||||
| Total accounts payable, accrued expenses and other liabilities | $ | 245,288 | |||||||
| | Investing for the long runTM | 3 | |
| Other | Ownership % | Number of Shares / Units Owned | NAV | Implied Value | |||||||||
| A | B | A x B | |||||||||||
Ownership in Managed Programs: (f) | |||||||||||||
| CPA:17 – Global | 4.6 | % | 16,131,967 | $ | 10.04 | (g) | $ | 161,965 | |||||
| CPA:18 – Global | 3.0 | % | 4,327,814 | 8.57 | (g) | 37,089 | |||||||
| CWI 1 | 2.6 | % | 3,597,692 | 10.41 | (g) | 37,452 | |||||||
| CWI 2 | 2.3 | % | 2,045,049 | 11.11 | (g) | 22,720 | |||||||
| CESH I | 2.4 | % | 3,492 | 1,000.00 | (h) | 3,492 | |||||||
| $ | 262,718 | ||||||||||||
| (a) | Normalized pro rata cash NOI and Adjusted EBITDA are non-GAAP measures. See the Terms and Definitions section in the Appendix for a description of our non-GAAP measures and for details on how they are calculated. |
| (b) | Presented on a pro rata basis. See the Terms and Definitions section in the Appendix for a description of pro rata. |
| (c) | Amounts are gross of fees paid to the respective subadvisors of CWI 1, CWI 2, CPA:18 – Global (for multi-family properties) and CCIF (prior to our resignation as the advisor to CCIF in the third quarter of 2017). |
| (d) | We are entitled to receive distributions of our share of earnings up to 10% of the Available Cash of each of the Managed REITs, as defined in their respective operating partnership agreements. Pursuant to the terms of their subadvisory agreements, however, 20% of the distributions of Available Cash we receive from CWI 1 and 25% of the distributions of Available Cash we receive from CWI 2 are paid to their respective subadvisors. Amounts for CWI 1 and CWI 2 are net of fees paid to their respective subadvisors. |
| (e) | Represents the value of real estate not included in net operating income, such as vacant assets and in-progress build-to-suit properties. |
| (f) | Separate from operating partnership interests in the Managed REITs and our interests in unconsolidated real estate joint ventures with our affiliate, CPA:17 – Global. |
| (g) | We calculated the estimated net asset values per share, or NAVs, by relying in part on an estimate of the fair market values of the respective real estate portfolios adjusted to give effect to mortgage loans, both provided by third parties, as well as other adjustments. Refer to the SEC filings of the Managed REITs for the calculation methodologies of the respective NAVs. |
| (h) | We own limited partnership units of CESH I at its private placement price of $1,000 per share; a NAV for CESH I has not yet been calculated. |
| | Investing for the long runTM | 4 | |

| | Investing for the long runTM | 5 | |
| Consolidated Statements of Income – Last Five Quarters | |
| Three Months Ended | |||||||||||||||||||
| Jun. 30, 2018 | Mar. 31, 2018 | Dec. 31, 2017 | Sep. 30, 2017 | Jun. 30, 2017 | |||||||||||||||
| Revenues | |||||||||||||||||||
| Owned Real Estate: | |||||||||||||||||||
| Lease revenues | $ | 162,634 | $ | 163,213 | $ | 154,826 | $ | 161,511 | $ | 158,255 | |||||||||
| Reimbursable tenant costs | 5,733 | 6,219 | 5,584 | 5,397 | 5,322 | ||||||||||||||
| Operating property revenues | 4,865 | 7,218 | 6,910 | 8,449 | 8,223 | ||||||||||||||
| Lease termination income and other | 680 | 942 | 515 | 1,227 | 2,247 | ||||||||||||||
| 173,912 | 177,592 | 167,835 | 176,584 | 174,047 | |||||||||||||||
| Investment Management: | |||||||||||||||||||
| Asset management revenue | 17,268 | 16,985 | 16,854 | 17,938 | 17,966 | ||||||||||||||
| Reimbursable costs from affiliates | 5,537 | 5,304 | 6,055 | 6,211 | 13,479 | ||||||||||||||
| Structuring revenue | 4,426 | 1,739 | 6,217 | 9,817 | 14,330 | ||||||||||||||
| Other advisory revenue | — | 190 | — | 99 | 706 | ||||||||||||||
| Dealer manager fees | — | — | — | 105 | 1,000 | ||||||||||||||
| 27,231 | 24,218 | 29,126 | 34,170 | 47,481 | |||||||||||||||
| 201,143 | 201,810 | 196,961 | 210,754 | 221,528 | |||||||||||||||
| Operating Expenses | |||||||||||||||||||
| Depreciation and amortization | 64,337 | 65,957 | 64,015 | 64,040 | 62,849 | ||||||||||||||
| General and administrative | 16,442 | 18,583 | 17,702 | 17,236 | 17,529 | ||||||||||||||
| Reimbursable tenant and affiliate costs | 11,270 | 11,523 | 11,639 | 11,608 | 18,801 | ||||||||||||||
Property expenses, excluding reimbursable tenant costs (a) | 8,908 | 9,899 | 9,560 | 10,556 | 10,530 | ||||||||||||||
| Stock-based compensation expense | 3,698 | 8,219 | 4,268 | 4,635 | 3,104 | ||||||||||||||
Merger and other expenses (b) | 2,692 | (37 | ) | (533 | ) | 65 | 1,000 | ||||||||||||
Subadvisor fees (c) | 1,855 | 2,032 | 2,002 | 5,206 | 3,672 | ||||||||||||||
| Impairment charges | — | 4,790 | 2,769 | — | — | ||||||||||||||
Restructuring and other compensation (d) | — | — | 289 | 1,356 | 7,718 | ||||||||||||||
| Dealer manager fees and expenses | — | — | — | 462 | 2,788 | ||||||||||||||
| 109,202 | 120,966 | 111,711 | 115,164 | 127,991 | |||||||||||||||
| Other Income and Expenses | |||||||||||||||||||
| Interest expense | (41,311 | ) | (38,074 | ) | (40,401 | ) | (41,182 | ) | (42,235 | ) | |||||||||
| Equity in earnings of equity method investments in the Managed Programs and real estate | 12,558 | 15,325 | 16,930 | 16,318 | 15,728 | ||||||||||||||
| Other gains and (losses) | 10,586 | (2,763 | ) | 1,356 | (4,569 | ) | (916 | ) | |||||||||||
| (18,167 | ) | (25,512 | ) | (22,115 | ) | (29,433 | ) | (27,423 | ) | ||||||||||
| Income before income taxes and gain on sale of real estate | 73,774 | 55,332 | 63,135 | 66,157 | 66,114 | ||||||||||||||
| (Provision for) benefit from income taxes | (6,262 | ) | 6,002 | 192 | (1,760 | ) | (2,448 | ) | |||||||||||
| Income before gain on sale of real estate | 67,512 | 61,334 | 63,327 | 64,397 | 63,666 | ||||||||||||||
| Gain on sale of real estate, net of tax | 11,912 | 6,732 | 11,146 | 19,257 | 3,465 | ||||||||||||||
| Net Income | 79,424 | 68,066 | 74,473 | 83,654 | 67,131 | ||||||||||||||
| Net (income) loss attributable to noncontrolling interests | (3,743 | ) | (2,792 | ) | 736 | (3,376 | ) | (2,813 | ) | ||||||||||
| Net Income Attributable to W. P. Carey | $ | 75,681 | $ | 65,274 | $ | 75,209 | $ | 80,278 | $ | 64,318 | |||||||||
| Basic Earnings Per Share | $ | 0.70 | $ | 0.60 | $ | 0.69 | $ | 0.74 | $ | 0.60 | |||||||||
| Diluted Earnings Per Share | $ | 0.70 | $ | 0.60 | $ | 0.69 | $ | 0.74 | $ | 0.59 | |||||||||
| Weighted-Average Shares Outstanding | |||||||||||||||||||
| Basic | 108,059,394 | 108,057,940 | 108,041,556 | 108,019,292 | 107,668,218 | ||||||||||||||
| Diluted | 108,234,934 | 108,211,936 | 108,208,918 | 108,143,694 | 107,783,204 | ||||||||||||||
| Distributions Declared Per Share | $ | 1.020 | $ | 1.015 | $ | 1.010 | $ | 1.005 | $ | 1.000 | |||||||||
| (a) | Amounts for the three and twelve months ended June 30, 2018 include $3.6 million and $21.0 million, respectively, of property expenses related to two hotel operating properties, one of which we sold in April 2018. |
| (b) | Amount for the three months ended June 30, 2018 is primarily comprised of costs incurred in connection with the Proposed Merger. Amount for the three months ended June 30, 2017 is comprised of an accrual for estimated one-time legal settlement expenses. |
| (c) | The subadvisors for CWI 1, CWI 2 and CPA:18 – Global earn a percentage of gross fees recorded, which we account for as an expense and are recorded as Subadvisor fees in our consolidated statements of income. The amounts paid to the subadvisors are the differences between gross and net fees. Pursuant to the terms of the subadvisory agreement we had with CCIF’s subadvisor (prior to our resignation as the advisor to CCIF in the third quarter of 2017), we paid a subadvisory fee equal to 50% of the asset management fees and organization and offering costs paid to us by CCIF. |
| (d) | Amounts for the three months ended December 31, 2017, September 30, 2017 and June 30, 2017 represent restructuring expenses resulting from our exit from non-traded retail fundraising activities, which we announced in June 2017. |
| | Investing for the long runTM | 6 | |
| Statements of Income, Owned Real Estate – Last Five Quarters | |
| Three Months Ended | |||||||||||||||||||
| Jun. 30, 2018 | Mar. 31, 2018 | Dec. 31, 2017 | Sep. 30, 2017 | Jun. 30, 2017 | |||||||||||||||
| Revenues | |||||||||||||||||||
| Lease revenues | $ | 162,634 | $ | 163,213 | $ | 154,826 | $ | 161,511 | $ | 158,255 | |||||||||
| Reimbursable tenant costs | 5,733 | 6,219 | 5,584 | 5,397 | 5,322 | ||||||||||||||
| Operating property revenues | 4,865 | 7,218 | 6,910 | 8,449 | 8,223 | ||||||||||||||
| Lease termination income and other | 680 | 942 | 515 | 1,227 | 2,247 | ||||||||||||||
| 173,912 | 177,592 | 167,835 | 176,584 | 174,047 | |||||||||||||||
| Operating Expenses | |||||||||||||||||||
| Depreciation and amortization | 63,374 | 64,920 | 62,951 | 62,970 | 61,989 | ||||||||||||||
| General and administrative | 10,599 | 12,065 | 11,691 | 11,234 | 7,803 | ||||||||||||||
Property expenses, excluding reimbursable tenant costs (a) | 8,908 | 9,899 | 9,560 | 10,556 | 10,530 | ||||||||||||||
| Reimbursable tenant costs | 5,733 | 6,219 | 5,584 | 5,397 | 5,322 | ||||||||||||||
Merger and other expenses (b) | 2,692 | (37 | ) | (533 | ) | 65 | 1,000 | ||||||||||||
| Stock-based compensation expense | 1,990 | 4,306 | 2,227 | 1,880 | 899 | ||||||||||||||
| Impairment charges | — | 4,790 | 2,769 | — | — | ||||||||||||||
| 93,296 | 102,162 | 94,249 | 92,102 | 87,543 | |||||||||||||||
| Other Income and Expenses | |||||||||||||||||||
| Interest expense | (41,311 | ) | (38,074 | ) | (40,401 | ) | (41,182 | ) | (42,235 | ) | |||||||||
| Equity in earnings of equity method investments in real estate | 3,529 | 3,358 | 3,535 | 3,740 | 3,721 | ||||||||||||||
| Other gains and (losses) | 9,630 | (2,887 | ) | 594 | (4,918 | ) | (1,371 | ) | |||||||||||
| (28,152 | ) | (37,603 | ) | (36,272 | ) | (42,360 | ) | (39,885 | ) | ||||||||||
| Income before income taxes and gain on sale of real estate | 52,464 | 37,827 | 37,314 | 42,122 | 46,619 | ||||||||||||||
| (Provision for) benefit from income taxes | (1,317 | ) | 3,533 | 4,953 | (1,511 | ) | (3,731 | ) | |||||||||||
| Income before gain on sale of real estate | 51,147 | 41,360 | 42,267 | 40,611 | 42,888 | ||||||||||||||
| Gain on sale of real estate, net of tax | 11,912 | 6,732 | 11,146 | 19,257 | 3,465 | ||||||||||||||
| Net Income from Owned Real Estate | 63,059 | 48,092 | 53,413 | 59,868 | 46,353 | ||||||||||||||
| Net (income) loss attributable to noncontrolling interests | (3,743 | ) | (2,792 | ) | 736 | (3,376 | ) | (2,813 | ) | ||||||||||
| Net Income from Owned Real Estate Attributable to W. P. Carey | $ | 59,316 | $ | 45,300 | $ | 54,149 | $ | 56,492 | $ | 43,540 | |||||||||
| Basic Earnings Per Share | $ | 0.55 | $ | 0.42 | $ | 0.50 | $ | 0.52 | $ | 0.41 | |||||||||
| Diluted Earnings Per Share | $ | 0.55 | $ | 0.42 | $ | 0.50 | $ | 0.52 | $ | 0.40 | |||||||||
| Weighted-Average Shares Outstanding | |||||||||||||||||||
| Basic | 108,059,394 | 108,057,940 | 108,041,556 | 108,019,292 | 107,668,218 | ||||||||||||||
| Diluted | 108,234,934 | 108,211,936 | 108,208,918 | 108,143,694 | 107,783,204 | ||||||||||||||
| (a) | Amounts for the three and twelve months ended June 30, 2018 include $3.6 million and $21.0 million, respectively, of property expenses related to two hotel operating properties, one of which we sold in April 2018. |
| (b) | Amount for the three months ended June 30, 2018 is primarily comprised of costs incurred in connection with the Proposed Merger. Amount for the three months ended June 30, 2017 is comprised of an accrual for estimated one-time legal settlement expenses. |
| | Investing for the long runTM | 7 | |
| Statements of Income, Investment Management – Last Five Quarters | |
| Three Months Ended | |||||||||||||||||||
| Jun. 30, 2018 | Mar. 31, 2018 | Dec. 31, 2017 | Sep. 30, 2017 | Jun. 30, 2017 | |||||||||||||||
| Revenues | |||||||||||||||||||
| Asset management revenue | $ | 17,268 | $ | 16,985 | $ | 16,854 | $ | 17,938 | $ | 17,966 | |||||||||
| Reimbursable costs from affiliates | 5,537 | 5,304 | 6,055 | 6,211 | 13,479 | ||||||||||||||
| Structuring revenue | 4,426 | 1,739 | 6,217 | 9,817 | 14,330 | ||||||||||||||
| Other advisory revenue | — | 190 | — | 99 | 706 | ||||||||||||||
| Dealer manager fees | — | — | — | 105 | 1,000 | ||||||||||||||
| 27,231 | 24,218 | 29,126 | 34,170 | 47,481 | |||||||||||||||
| Operating Expenses | |||||||||||||||||||
| General and administrative | 5,843 | 6,518 | 6,011 | 6,002 | 9,726 | ||||||||||||||
| Reimbursable costs from affiliates | 5,537 | 5,304 | 6,055 | 6,211 | 13,479 | ||||||||||||||
Subadvisor fees (a) | 1,855 | 2,032 | 2,002 | 5,206 | 3,672 | ||||||||||||||
| Stock-based compensation expense | 1,708 | 3,913 | 2,041 | 2,755 | 2,205 | ||||||||||||||
| Depreciation and amortization | 963 | 1,037 | 1,064 | 1,070 | 860 | ||||||||||||||
Restructuring and other compensation (b) | — | — | 289 | 1,356 | 7,718 | ||||||||||||||
| Dealer manager fees and expenses | — | — | — | 462 | 2,788 | ||||||||||||||
| 15,906 | 18,804 | 17,462 | 23,062 | 40,448 | |||||||||||||||
| Other Income and Expenses | |||||||||||||||||||
| Equity in earnings of equity method investments in the Managed Programs | 9,029 | 11,967 | 13,395 | 12,578 | 12,007 | ||||||||||||||
| Other gains and (losses) | 956 | 124 | 762 | 349 | 455 | ||||||||||||||
| 9,985 | 12,091 | 14,157 | 12,927 | 12,462 | |||||||||||||||
| Income before income taxes | 21,310 | 17,505 | 25,821 | 24,035 | 19,495 | ||||||||||||||
| (Provision for) benefit from income taxes | (4,945 | ) | 2,469 | (4,761 | ) | (249 | ) | 1,283 | |||||||||||
| Net Income from Investment Management Attributable to W. P. Carey | $ | 16,365 | $ | 19,974 | $ | 21,060 | $ | 23,786 | $ | 20,778 | |||||||||
| Basic Earnings Per Share | $ | 0.15 | $ | 0.18 | $ | 0.19 | $ | 0.22 | $ | 0.19 | |||||||||
| Diluted Earnings Per Share | $ | 0.15 | $ | 0.18 | $ | 0.19 | $ | 0.22 | $ | 0.19 | |||||||||
| Weighted-Average Shares Outstanding | |||||||||||||||||||
| Basic | 108,059,394 | 108,057,940 | 108,041,556 | 108,019,292 | 107,668,218 | ||||||||||||||
| Diluted | 108,234,934 | 108,211,936 | 108,208,918 | 108,143,694 | 107,783,204 | ||||||||||||||
| (a) | The subadvisors for CWI 1, CWI 2 and CPA:18 – Global earn a percentage of gross fees recorded, which we account for as an expense and are recorded as Subadvisor fees in our consolidated statements of income. The amounts paid to the subadvisors are the differences between gross and net fees. Pursuant to the terms of the subadvisory agreement we had with CCIF’s subadvisor (prior to our resignation as the advisor to CCIF in the third quarter of 2017), we paid a subadvisory fee equal to 50% of the asset management fees and organization and offering costs paid to us by CCIF. |
| (b) | Amounts for the three months ended December 31, 2017, September 30, 2017 and June 30, 2017 represent restructuring expenses resulting from our exit from non-traded retail fundraising activities, which we announced in June 2017. |
| | Investing for the long runTM | 8 | |
| FFO and AFFO, Consolidated – Last Five Quarters | |
| Three Months Ended | |||||||||||||||||||
| Jun. 30, 2018 | Mar. 31, 2018 | Dec. 31, 2017 | Sep. 30, 2017 | Jun. 30, 2017 | |||||||||||||||
| Net income attributable to W. P. Carey | $ | 75,681 | $ | 65,274 | $ | 75,209 | $ | 80,278 | $ | 64,318 | |||||||||
| Adjustments: | |||||||||||||||||||
| Depreciation and amortization of real property | 63,073 | 64,580 | 62,603 | 62,621 | 61,636 | ||||||||||||||
| Gain on sale of real estate, net | (11,912 | ) | (6,732 | ) | (11,146 | ) | (19,257 | ) | (3,465 | ) | |||||||||
| Impairment charges | — | 4,790 | 2,769 | — | — | ||||||||||||||
| Proportionate share of adjustments for noncontrolling interests | (2,729 | ) | (2,782 | ) | (2,696 | ) | (2,692 | ) | (2,562 | ) | |||||||||
| Proportionate share of adjustments to equity in net income of partially owned entities | 902 | 1,252 | 877 | 866 | 833 | ||||||||||||||
| Total adjustments | 49,334 | 61,108 | 52,407 | 41,538 | 56,442 | ||||||||||||||
FFO (as defined by NAREIT) Attributable to W. P. Carey (a) | 125,015 | 126,382 | 127,616 | 121,816 | 120,760 | ||||||||||||||
| Adjustments: | |||||||||||||||||||
Above- and below-market rent intangible lease amortization, net (b) | 12,303 | 11,802 | 17,922 | 12,459 | 12,323 | ||||||||||||||
Other amortization and non-cash items (c) | (7,437 | ) | 5,146 | 2,198 | 6,208 | 6,693 | |||||||||||||
| Stock-based compensation | 3,698 | 8,219 | 4,268 | 4,635 | 3,104 | ||||||||||||||
| Tax expense (benefit) – deferred | 3,028 | (12,155 | ) | (10,497 | ) | (1,234 | ) | (1,382 | ) | ||||||||||
Merger and other expenses (d) | 2,692 | (37 | ) | (533 | ) | 65 | 1,000 | ||||||||||||
| Straight-line and other rent adjustments | (2,637 | ) | (2,296 | ) | (2,002 | ) | (3,212 | ) | (2,965 | ) | |||||||||
| Amortization of deferred financing costs | 1,905 | (194 | ) | 2,043 | 2,184 | 2,542 | |||||||||||||
| Realized losses (gains) on foreign currency | 627 | (1,515 | ) | (472 | ) | (449 | ) | (378 | ) | ||||||||||
| Loss (gain) on extinguishment of debt | — | 1,609 | (81 | ) | 1,566 | (2,443 | ) | ||||||||||||
Restructuring and other compensation (e) | — | — | 289 | 1,356 | 7,718 | ||||||||||||||
| Proportionate share of adjustments to equity in net income of partially owned entities | 3,635 | 1,752 | 2,884 | 3,064 | 1,978 | ||||||||||||||
| Proportionate share of adjustments for noncontrolling interests | (230 | ) | (343 | ) | (1,573 | ) | (216 | ) | (513 | ) | |||||||||
| Total adjustments | 17,584 | 11,988 | 14,446 | 26,426 | 27,677 | ||||||||||||||
AFFO Attributable to W. P. Carey (a) | $ | 142,599 | $ | 138,370 | $ | 142,062 | $ | 148,242 | $ | 148,437 | |||||||||
| Summary | |||||||||||||||||||
FFO (as defined by NAREIT) attributable to W. P. Carey (a) | $ | 125,015 | $ | 126,382 | $ | 127,616 | $ | 121,816 | $ | 120,760 | |||||||||
FFO (as defined by NAREIT) attributable to W. P. Carey per diluted share (a) | $ | 1.16 | $ | 1.16 | $ | 1.18 | $ | 1.13 | $ | 1.12 | |||||||||
AFFO attributable to W. P. Carey (a) | $ | 142,599 | $ | 138,370 | $ | 142,062 | $ | 148,242 | $ | 148,437 | |||||||||
AFFO attributable to W. P. Carey per diluted share (a) | $ | 1.32 | $ | 1.28 | $ | 1.31 | $ | 1.37 | $ | 1.38 | |||||||||
| Diluted weighted-average shares outstanding | 108,234,934 | 108,211,936 | 108,208,918 | 108,143,694 | 107,783,204 | ||||||||||||||
| (a) | FFO and AFFO are non-GAAP measures. See the Terms and Definitions section in the Appendix for a description of our non-GAAP measures. |
| (b) | Amount for the three months ended December 31, 2017 includes an adjustment of $5.7 million related to the accelerated amortization of an above-market rent intangible in connection with a lease restructuring. |
| (c) | Primarily represents unrealized gains and losses from foreign exchange movements and derivatives. |
| (d) | Amount for the three months ended June 30, 2018 is primarily comprised of costs incurred in connection with the Proposed Merger. Amount for the three months ended June 30, 2017 is comprised of an accrual for estimated one-time legal settlement expenses. |
| (e) | Amounts for the three months ended December 31, 2017, September 30, 2017 and June 30, 2017 represent restructuring expenses resulting from our exit from non-traded retail fundraising activities, which we announced in June 2017. |
| | Investing for the long runTM | 9 | |
| FFO and AFFO, Owned Real Estate – Last Five Quarters | |
| Three Months Ended | |||||||||||||||||||
| Jun. 30, 2018 | Mar. 31, 2018 | Dec. 31, 2017 | Sep. 30, 2017 | Jun. 30, 2017 | |||||||||||||||
| Net income from Owned Real Estate attributable to W. P. Carey | $ | 59,316 | $ | 45,300 | $ | 54,149 | $ | 56,492 | $ | 43,540 | |||||||||
| Adjustments: | |||||||||||||||||||
| Depreciation and amortization of real property | 63,073 | 64,580 | 62,603 | 62,621 | 61,636 | ||||||||||||||
| Gain on sale of real estate, net | (11,912 | ) | (6,732 | ) | (11,146 | ) | (19,257 | ) | (3,465 | ) | |||||||||
| Impairment charges | — | 4,790 | 2,769 | — | — | ||||||||||||||
| Proportionate share of adjustments for noncontrolling interests | (2,729 | ) | (2,782 | ) | (2,696 | ) | (2,692 | ) | (2,562 | ) | |||||||||
| Proportionate share of adjustments to equity in net income of partially owned entities | 902 | 1,252 | 877 | 866 | 833 | ||||||||||||||
| Total adjustments | 49,334 | 61,108 | 52,407 | 41,538 | 56,442 | ||||||||||||||
FFO (as defined by NAREIT) Attributable to W. P. Carey – Owned Real Estate (a) | 108,650 | 106,408 | 106,556 | 98,030 | 99,982 | ||||||||||||||
| Adjustments: | |||||||||||||||||||
Above- and below-market rent intangible lease amortization, net (b) | 12,303 | 11,802 | 17,922 | 12,459 | 12,323 | ||||||||||||||
Other amortization and non-cash items (c) | (7,176 | ) | 4,826 | 2,260 | 6,808 | 7,038 | |||||||||||||
Merger and other expenses (d) | 2,692 | (37 | ) | (533 | ) | 65 | 1,000 | ||||||||||||
| Straight-line and other rent adjustments | (2,637 | ) | (2,296 | ) | (2,002 | ) | (3,212 | ) | (2,965 | ) | |||||||||
| Stock-based compensation | 1,990 | 4,306 | 2,227 | 1,880 | 899 | ||||||||||||||
| Amortization of deferred financing costs | 1,905 | (194 | ) | 2,043 | 2,184 | 2,542 | |||||||||||||
| Tax (benefit) expense – deferred | (1,767 | ) | (9,518 | ) | (15,047 | ) | (2,694 | ) | 33 | ||||||||||
| Realized losses (gains) on foreign currency | 633 | (1,558 | ) | (477 | ) | (454 | ) | (382 | ) | ||||||||||
| Loss (gain) on extinguishment of debt | — | 1,609 | (81 | ) | 1,566 | (2,443 | ) | ||||||||||||
| Proportionate share of adjustments to equity in net income of partially owned entities | 99 | (71 | ) | 41 | (79 | ) | (92 | ) | |||||||||||
| Proportionate share of adjustments for noncontrolling interests | (230 | ) | (343 | ) | (1,573 | ) | (216 | ) | (513 | ) | |||||||||
| Total adjustments | 7,812 | 8,526 | 4,780 | 18,307 | 17,440 | ||||||||||||||
AFFO Attributable to W. P. Carey – Owned Real Estate (a) | $ | 116,462 | $ | 114,934 | $ | 111,336 | $ | 116,337 | $ | 117,422 | |||||||||
| Summary | |||||||||||||||||||
FFO (as defined by NAREIT) attributable to W. P. Carey – Owned Real Estate (a) | $ | 108,650 | $ | 106,408 | $ | 106,556 | $ | 98,030 | $ | 99,982 | |||||||||
FFO (as defined by NAREIT) attributable to W. P. Carey per diluted share – Owned Real Estate (a) | $ | 1.01 | $ | 0.98 | $ | 0.99 | $ | 0.91 | $ | 0.93 | |||||||||
AFFO attributable to W. P. Carey – Owned Real Estate (a) | $ | 116,462 | $ | 114,934 | $ | 111,336 | $ | 116,337 | $ | 117,422 | |||||||||
AFFO attributable to W. P. Carey per diluted share – Owned Real Estate (a) | $ | 1.08 | $ | 1.06 | $ | 1.03 | $ | 1.07 | $ | 1.09 | |||||||||
| Diluted weighted-average shares outstanding | 108,234,934 | 108,211,936 | 108,208,918 | 108,143,694 | 107,783,204 | ||||||||||||||
| (a) | FFO and AFFO are non-GAAP measures. See the Terms and Definitions section in the Appendix for a description of our non-GAAP measures. |
| (b) | Amount for the three months ended December 31, 2017 includes an adjustment of $5.7 million related to the accelerated amortization of an above-market rent intangible in connection with a lease restructuring. |
| (c) | Primarily represents unrealized gains and losses from foreign exchange movements and derivatives. |
| (d) | Amount for the three months ended June 30, 2018 is primarily comprised of costs incurred in connection with the Proposed Merger. Amount for the three months ended June 30, 2017 is comprised of an accrual for estimated one-time legal settlement expenses. |
| | Investing for the long runTM | 10 | |
| FFO and AFFO, Investment Management – Last Five Quarters | |
| Three Months Ended | |||||||||||||||||||
| Jun. 30, 2018 | Mar. 31, 2018 | Dec. 31, 2017 | Sep. 30, 2017 | Jun. 30, 2017 | |||||||||||||||
| Net income from Investment Management attributable to W. P. Carey | $ | 16,365 | $ | 19,974 | $ | 21,060 | $ | 23,786 | $ | 20,778 | |||||||||
FFO (as defined by NAREIT) Attributable to W. P. Carey – Investment Management (a) | 16,365 | 19,974 | 21,060 | 23,786 | 20,778 | ||||||||||||||
| Adjustments: | |||||||||||||||||||
| Tax expense (benefit) – deferred | 4,795 | (2,637 | ) | 4,550 | 1,460 | (1,415 | ) | ||||||||||||
| Stock-based compensation | 1,708 | 3,913 | 2,041 | 2,755 | 2,205 | ||||||||||||||
Other amortization and non-cash items (b) | (261 | ) | 320 | (62 | ) | (600 | ) | (345 | ) | ||||||||||
| Realized (gains) losses on foreign currency | (6 | ) | 43 | 5 | 5 | 4 | |||||||||||||
Restructuring and other compensation (c) | — | — | 289 | 1,356 | 7,718 | ||||||||||||||
| Proportionate share of adjustments to equity in net income of partially owned entities | 3,536 | 1,823 | 2,843 | 3,143 | 2,070 | ||||||||||||||
| Total adjustments | 9,772 | 3,462 | 9,666 | 8,119 | 10,237 | ||||||||||||||
AFFO Attributable to W. P. Carey – Investment Management (a) | $ | 26,137 | $ | 23,436 | $ | 30,726 | $ | 31,905 | $ | 31,015 | |||||||||
| Summary | |||||||||||||||||||
FFO (as defined by NAREIT) attributable to W. P. Carey – Investment Management (a) | $ | 16,365 | $ | 19,974 | $ | 21,060 | $ | 23,786 | $ | 20,778 | |||||||||
FFO (as defined by NAREIT) attributable to W. P. Carey per diluted share – Investment Management (a) | $ | 0.15 | $ | 0.18 | $ | 0.19 | $ | 0.22 | $ | 0.19 | |||||||||
AFFO attributable to W. P. Carey – Investment Management (a) | $ | 26,137 | $ | 23,436 | $ | 30,726 | $ | 31,905 | $ | 31,015 | |||||||||
AFFO attributable to W. P. Carey per diluted share – Investment Management (a) | $ | 0.24 | $ | 0.22 | $ | 0.28 | $ | 0.30 | $ | 0.29 | |||||||||
| Diluted weighted-average shares outstanding | 108,234,934 | 108,211,936 | 108,208,918 | 108,143,694 | 107,783,204 | ||||||||||||||
| (a) | FFO and AFFO are non-GAAP measures. See the Terms and Definitions section in the Appendix for a description of our non-GAAP measures. |
| (b) | Primarily represents unrealized gains and losses from foreign exchange movements. |
| (c) | Amounts for the three months ended December 31, 2017, September 30, 2017 and June 30, 2017 represent restructuring expenses resulting from our previously announced exit from non-traded retail fundraising activities. |
| | Investing for the long runTM | 11 | |
| Elements of Pro Rata Statement of Income and AFFO Adjustments | |
Equity Investments (a) | Noncontrolling Interests (b) | AFFO Adjustments | ||||||||||
| Revenues | ||||||||||||
| Owned Real Estate: | ||||||||||||
| Lease revenues | $ | 4,869 | $ | (6,165 | ) | $ | 9,111 | (c) | ||||
| Reimbursable tenant costs | 24 | (166 | ) | (156 | ) | |||||||
| Operating property revenues: | ||||||||||||
| Hotel revenues | — | — | — | |||||||||
| Lease termination income and other | — | (1 | ) | (14 | ) | |||||||
| Investment Management: | ||||||||||||
| Asset management revenue | — | — | — | |||||||||
| Reimbursable costs from affiliates | — | — | — | |||||||||
| Structuring revenue | — | — | — | |||||||||
| Operating Expenses | ||||||||||||
| Depreciation and amortization | 347 | (2,737 | ) | (60,670 | ) | (d) | ||||||
| General and administrative | — | (4 | ) | — | ||||||||
| Reimbursable tenant and affiliate costs | 24 | (166 | ) | (156 | ) | |||||||
| Property expenses, excluding reimbursable tenant costs: | ||||||||||||
| Hotel expenses | — | — | — | |||||||||
| Non-reimbursable property expenses | 168 | (167 | ) | (298 | ) | (e) | ||||||
| Stock-based compensation expense | — | — | (3,698 | ) | (e) | |||||||
| Merger and other expenses | — | — | (2,692 | ) | (f) | |||||||
Subadvisor fees (g) | — | — | — | |||||||||
| Other Income and Expenses | ||||||||||||
| Interest expense | (604 | ) | (237 | ) | 1,926 | (h) | ||||||
| Equity in earnings of equity method investments in the Managed Programs and real estate: | ||||||||||||
| Income related to our general partnership interests in the Managed REITs | — | — | — | |||||||||
| Joint ventures | (3,755 | ) | (1 | ) | 555 | (i) | ||||||
| Income related to our ownership in the Managed Programs | — | — | 3,540 | (j) | ||||||||
| Other gains and (losses) | (1 | ) | (190 | ) | (6,756 | ) | (k) | |||||
| Provision for income taxes | 6 | (57 | ) | 3,110 | (l) | |||||||
| Gain on sale of real estate, net of tax | — | — | (11,912 | ) | ||||||||
| Net income attributable to noncontrolling interests | — | 3,743 | — | |||||||||
| (a) | Represents the break-out by line item of amounts recorded in Equity in earnings of equity method investments in the Managed Programs and real estate. |
| (b) | Represents the break-out by line item of amounts recorded in Net income attributable to noncontrolling interests. |
| (c) | Represents the reversal of amortization of above- or below-market lease intangibles of $12.0 million and the elimination of non-cash amounts related to straight-line rent and other of $2.9 million. |
| (d) | Adjustment is a non-cash adjustment excluding corporate depreciation and amortization. |
| (e) | Adjustment to exclude a non-cash item. |
| (f) | Adjustment primarily to exclude costs incurred in connection with the Proposed Merger. |
| (g) | The subadvisors for CWI 1, CWI 2 and CPA:18 – Global earn a percentage of gross fees recorded, which we account for as an expense and are recorded as Subadvisor fees in our consolidated statements of income. The amounts paid to the subadvisors are the differences between gross and net fees. |
| (h) | Represents the elimination of non-cash components of interest expense, such as deferred financing costs, debt premiums and discounts. |
| (i) | Adjustments to include our pro rata share of AFFO adjustments from equity investments. |
| | Investing for the long runTM | 12 | |
| (j) | Represents Adjusted MFFO from the Managed Programs in place of our pro rata share of net income from our ownership in the Managed Programs. Adjusted MFFO is defined as MFFO adjusted for deferred taxes and excluding the adjustment for realized gains and losses on hedges. |
| (k) | Represents eliminations of gains (losses) related to the extinguishment of debt, foreign currency, unrealized gains (losses) on derivatives and other items. |
| (l) | Primarily represents the elimination of deferred taxes. |
| | Investing for the long runTM | 13 | |
| Capital Expenditures | |
| Tenant Improvements and Leasing Costs | |||
| Tenant improvements | $ | 275 | |
| Leasing costs | 1,136 | ||
| Tenant Improvements and Leasing Costs | 1,411 | ||
| Maintenance Capital Expenditures | |||
| Operating property | 1,891 | ||
| Net-lease properties | 25 | ||
| Maintenance Capital Expenditures | 1,916 | ||
| Total: Tenant Improvements and Leasing Costs, and Maintenance Capital Expenditures | $ | 3,327 | |
| | Investing for the long runTM | 14 | |
| | Investing for the long runTM | 15 | |
| Consolidated Balance Sheets | |
| Jun. 30, 2018 | Dec. 31, 2017 | ||||||
| Assets | |||||||
| Investments in real estate: | |||||||
Land, buildings and improvements (a) | $ | 5,651,906 | $ | 5,457,265 | |||
| Net investments in direct financing leases | 705,588 | 721,607 | |||||
| In-place lease and other intangible assets | 1,228,241 | 1,213,976 | |||||
| Above-market rent intangible assets | 631,977 | 640,480 | |||||
| Investments in real estate | 8,217,712 | 8,033,328 | |||||
Accumulated depreciation and amortization (b) | (1,445,397 | ) | (1,329,613 | ) | |||
| Net investments in real estate | 6,772,315 | 6,703,715 | |||||
Equity investments in the Managed Programs and real estate (c) | 363,622 | 341,457 | |||||
| Cash and cash equivalents | 122,430 | 162,312 | |||||
| Due from affiliates | 78,100 | 105,308 | |||||
| Other assets, net | 288,173 | 274,650 | |||||
| Goodwill | 642,060 | 643,960 | |||||
| Total assets | $ | 8,266,700 | $ | 8,231,402 | |||
| Liabilities and Equity | |||||||
| Debt: | |||||||
| Senior unsecured notes, net | $ | 3,018,475 | $ | 2,474,661 | |||
| Unsecured revolving credit facility | 396,917 | 216,775 | |||||
| Unsecured term loans, net | — | 388,354 | |||||
| Non-recourse mortgages, net | 985,666 | 1,185,477 | |||||
| Debt, net | 4,401,058 | 4,265,267 | |||||
| Accounts payable, accrued expenses and other liabilities | 245,288 | 263,053 | |||||
| Below-market rent and other intangible liabilities, net | 107,542 | 113,957 | |||||
| Deferred income taxes | 88,871 | 67,009 | |||||
| Distributions payable | 110,972 | 109,766 | |||||
| Total liabilities | 4,953,731 | 4,819,052 | |||||
| Redeemable noncontrolling interest | 965 | 965 | |||||
| Preferred stock, $0.001 par value, 50,000,000 shares authorized; none issued | — | — | |||||
| Common stock, $0.001 par value, 450,000,000 shares authorized; 107,200,687 and 106,922,616 shares, respectively, issued and outstanding | 107 | 107 | |||||
| Additional paid-in capital | 4,443,374 | 4,433,573 | |||||
| Distributions in excess of accumulated earnings | (1,132,182 | ) | (1,052,064 | ) | |||
| Deferred compensation obligation | 36,007 | 46,656 | |||||
| Accumulated other comprehensive loss | (247,402 | ) | (236,011 | ) | |||
| Total stockholders' equity | 3,099,904 | 3,192,261 | |||||
| Noncontrolling interests | 212,100 | 219,124 | |||||
| Total equity | 3,312,004 | 3,411,385 | |||||
| Total liabilities and equity | $ | 8,266,700 | $ | 8,231,402 | |||
| (a) | Includes $42.3 million and $83.0 million of amounts attributable to operating properties as of June 30, 2018 and December 31, 2017, respectively. We sold one hotel operating property in April 2018. |
| (b) | Includes $679.0 million and $630.0 million of accumulated depreciation on buildings and improvements as of June 30, 2018 and December 31, 2017, respectively, and $766.4 million and $699.7 million of accumulated amortization on lease intangibles as of June 30, 2018 and December 31, 2017, respectively. |
| (c) | Our equity investments in the Managed Programs totaled $225.3 million and $201.4 million as of June 30, 2018 and December 31, 2017, respectively. Our equity investments in real estate joint ventures totaled $138.3 million and $140.0 million as of June 30, 2018 and December 31, 2017, respectively. |
| | Investing for the long runTM | 16 | |
| Capitalization | |
| Description | Shares | Share Price | Market Value | ||||||||||
| Equity | |||||||||||||
| Common equity | 107,200,687 | $ | 66.35 | $ | 7,112,766 | ||||||||
| Preferred equity | — | ||||||||||||
| Total Equity Market Capitalization | 7,112,766 | ||||||||||||
Outstanding Balance (a) | |||||||||||||
| Pro Rata Debt | |||||||||||||
| Non-recourse mortgages | 1,007,066 | ||||||||||||
| Unsecured revolving credit facility (due February 22, 2021) | 396,917 | ||||||||||||
| Senior unsecured notes: | |||||||||||||
| Due January 20, 2023 | 582,900 | ||||||||||||
| Due April 1, 2024 | 500,000 | ||||||||||||
| Due July 19, 2024 | 582,900 | ||||||||||||
| Due February 1, 2025 | 450,000 | ||||||||||||
| Due October 1, 2026 | 350,000 | ||||||||||||
| Due April 15, 2027 | 582,900 | ||||||||||||
| Total Pro Rata Debt | 4,452,683 | ||||||||||||
| Total Capitalization | $ | 11,565,449 | |||||||||||
| (a) | Excludes unamortized deferred financing costs totaling $18.6 million and unamortized discount, net totaling $15.0 million as of June 30, 2018. |
| | Investing for the long runTM | 17 | |
| Debt Overview | |
| USD-Denominated | EUR-Denominated | GBP-Denominated | Total | ||||||||||||||||||||||||||||||
| Outstanding Balance | |||||||||||||||||||||||||||||||||
Out-standing Balance (in USD) | Weigh-ted -Avg. Interest Rate | Out-standing Balance (in USD) | Weigh-ted -Avg. Interest Rate | Out-standing Balance (in USD) | Weigh-ted Avg. Interest Rate | Amount (a) (b) (in USD) | % of Total | Weigh-ted -Avg. Interest Rate | Weigh-ted -Avg. Maturity (Years) | ||||||||||||||||||||||||
| Non-Recourse Debt | |||||||||||||||||||||||||||||||||
| Fixed | $ | 726,568 | 5.7 | % | $ | 109,842 | 4.3 | % | $ | 10,333 | 5.6 | % | $ | 846,743 | 19.0 | % | 5.5 | % | 4.2 | ||||||||||||||
| Variable: | |||||||||||||||||||||||||||||||||
| Swapped | 95,519 | 4.9 | % | 1,976 | 8.5 | % | — | — | % | 97,495 | 2.2 | % | 5.0 | % | 2.6 | ||||||||||||||||||
| Floating | 44,892 | 3.8 | % | — | — | % | — | — | % | 44,892 | 1.0 | % | 3.8 | % | 1.7 | ||||||||||||||||||
| Capped | — | — | % | 17,936 | 3.3 | % | — | — | % | 17,936 | 0.4 | % | 3.3 | % | 3.1 | ||||||||||||||||||
| Total Pro Rata Non-Recourse Debt | 866,979 | 5.5 | % | 129,754 | 4.2 | % | 10,333 | 5.6 | % | 1,007,066 | 22.6 | % | 5.3 | % | 3.9 | ||||||||||||||||||
| Recourse Debt | |||||||||||||||||||||||||||||||||
| Fixed – Senior unsecured notes: | |||||||||||||||||||||||||||||||||
| Due January 20, 2023 | — | — | % | 582,900 | 2.0 | % | — | — | % | 582,900 | 13.1 | % | 2.0 | % | 4.6 | ||||||||||||||||||
| Due April 1, 2024 | 500,000 | 4.6 | % | — | — | % | — | — | % | 500,000 | 11.2 | % | 4.6 | % | 5.8 | ||||||||||||||||||
| Due July 19, 2024 | — | — | % | 582,900 | 2.3 | % | — | — | % | 582,900 | 13.1 | % | 2.3 | % | 6.1 | ||||||||||||||||||
| Due February 1, 2025 | 450,000 | 4.0 | % | — | — | % | — | — | % | 450,000 | 10.1 | % | 4.0 | % | 6.6 | ||||||||||||||||||
| Due October 1, 2026 | 350,000 | 4.3 | % | — | — | % | — | — | % | 350,000 | 7.9 | % | 4.3 | % | 8.3 | ||||||||||||||||||
| Due April 15, 2027 | — | — | % | 582,900 | 2.1 | % | — | — | % | 582,900 | 13.1 | % | 2.1 | % | 8.8 | ||||||||||||||||||
| Total Senior Unsecured Notes | 1,300,000 | 4.3 | % | 1,748,700 | 2.1 | % | — | — | % | 3,048,700 | 68.5 | % | 3.1 | % | 6.6 | ||||||||||||||||||
| Variable: | |||||||||||||||||||||||||||||||||
Unsecured revolving credit facility (due February 22, 2021) (c) | 195,000 | 3.1 | % | 201,917 | 1.0 | % | — | — | % | 396,917 | 8.9 | % | 2.0 | % | 2.7 | ||||||||||||||||||
| Total Recourse Debt | 1,495,000 | 4.1 | % | 1,950,617 | 2.0 | % | — | — | % | 3,445,617 | 77.4 | % | 2.9 | % | 6.1 | ||||||||||||||||||
| Total Pro Rata Debt Outstanding | $ | 2,361,979 | 4.6 | % | $ | 2,080,371 | 2.1 | % | $ | 10,333 | 5.6 | % | $ | 4,452,683 | 100.0 | % | 3.5 | % | 5.6 | ||||||||||||||
| (a) | Debt data is presented on a pro rata basis. See the Terms and Definitions section in the Appendix for a description of pro rata. |
| (b) | Excludes unamortized deferred financing costs totaling $18.6 million and unamortized discount, net totaling $15.0 million as of June 30, 2018. |
| (c) | Depending on the currency, we incurred interest at either London Interbank Offered Rate (LIBOR) or Euro Interbank Offered Rate (EURIBOR) plus 1.00% on our Unsecured revolving credit facility. EURIBOR has a floor of 0.00% under the terms of our credit agreement. Availability under our Unsecured revolving credit facility was $1.1 billion as of June 30, 2018. The aggregate principal amount (of revolving and term loans) available under our credit agreement may be increased up to an amount not to exceed the U.S. dollar equivalent of $2.35 billion. |
| | Investing for the long runTM | 18 | |
| Debt Maturity | |
| Real Estate | Debt | ||||||||||||||||||||
Number of Properties (a) | Weighted- Average Interest Rate | Total Outstanding Balance (b) (c) | % of Total Outstanding Balance | ||||||||||||||||||
| Year of Maturity | ABR (a) | Balloon | |||||||||||||||||||
| Non-Recourse Debt | |||||||||||||||||||||
| Remaining 2018 | 4 | $ | 5,925 | 6.8 | % | $ | 31,696 | $ | 31,907 | 0.7 | % | ||||||||||
| 2019 | 10 | 16,165 | 6.1 | % | 46,662 | 50,549 | 1.1 | % | |||||||||||||
| 2020 | 22 | 47,576 | 4.9 | % | 221,445 | 244,562 | 5.5 | % | |||||||||||||
| 2021 | 14 | 25,686 | 5.5 | % | 107,094 | 121,625 | 2.7 | % | |||||||||||||
| 2022 | 30 | 43,225 | 5.1 | % | 202,234 | 234,554 | 5.3 | % | |||||||||||||
| 2023 | 25 | 36,776 | 5.1 | % | 91,087 | 131,532 | 3.0 | % | |||||||||||||
| 2024 | 22 | 20,785 | 5.9 | % | 3,444 | 53,029 | 1.2 | % | |||||||||||||
| 2025 | 13 | 14,915 | 4.8 | % | 52,825 | 86,695 | 1.9 | % | |||||||||||||
| 2026 | 7 | 10,154 | 6.6 | % | 18,992 | 42,264 | 1.0 | % | |||||||||||||
| 2027 | 1 | 2,423 | 5.8 | % | — | 10,349 | 0.2 | % | |||||||||||||
| Total Pro Rata Non-Recourse Debt | 148 | $ | 223,630 | 5.3 | % | $ | 775,479 | 1,007,066 | 22.6 | % | |||||||||||
| Recourse Debt | |||||||||||||||||||||
| Fixed – Senior unsecured notes: | |||||||||||||||||||||
| Due January 20, 2023 | 2.0 | % | 582,900 | ||||||||||||||||||
| Due April 1, 2024 | 4.6 | % | 500,000 | ||||||||||||||||||
| Due July 19, 2024 | 2.3 | % | 582,900 | ||||||||||||||||||
| Due February 1, 2025 | 4.0 | % | 450,000 | ||||||||||||||||||
| Due October 1, 2026 | 4.3 | % | 350,000 | ||||||||||||||||||
| Due April 15, 2027 | 2.1 | % | 582,900 | ||||||||||||||||||
| Total Senior Unsecured Notes | 3.1 | % | 3,048,700 | 68.5 | % | ||||||||||||||||
| Variable: | |||||||||||||||||||||
Unsecured revolving credit facility (due February 22, 2021) (d) | 2.0 | % | 396,917 | 8.9 | % | ||||||||||||||||
| Total Recourse Debt | 2.9 | % | 3,445,617 | 77.4 | % | ||||||||||||||||
| Total Pro Rata Debt Outstanding | 3.5 | % | $ | 4,452,683 | 100.0 | % | |||||||||||||||
| (a) | Represents the number of properties and ABR associated with the debt that is maturing in each respective year. |
| (b) | Debt maturity data is presented on a pro rata basis. See the Terms and Definitions section in the Appendix for a description of pro rata. Total outstanding balance includes balloon payments and scheduled amortization for our non-recourse debt. |
| (c) | Excludes unamortized deferred financing costs totaling $18.6 million and unamortized discount, net totaling $15.0 million as of June 30, 2018. |
| (d) | Depending on the currency, we incurred interest at either LIBOR or EURIBOR plus 1.00% on our Unsecured revolving credit facility. EURIBOR has a floor of 0.00% under the terms of our credit agreement. Availability under our Unsecured revolving credit facility was $1.1 billion as of June 30, 2018. The aggregate principal amount (of revolving and term loans) available under our credit agreement may be increased up to an amount not to exceed the U.S. dollar equivalent of $2.35 billion. |
| | Investing for the long runTM | 19 | |
| Senior Unsecured Notes | |
| Issuer / Corporate | Senior Unsecured Notes | |||||||
| Ratings Agency | Rating | Outlook | Rating | Outlook | ||||
| Moody's | Baa2 | Stable | Baa2 | Stable | ||||
| Standard & Poor's | BBB | Stable | BBB | Stable | ||||
| Covenant | Metric | Required | As of Jun. 30, 2018 | |||
| Limitation on the incurrence of debt | "Total Debt" / "Total Assets" | ≤ 60% | 44.9% | |||
| Limitation on the incurrence of secured debt | "Secured Debt" / "Total Assets" | ≤ 40% | 10.0% | |||
| Limitation on the incurrence of debt based on consolidated EBITDA to annual debt service charge | "Consolidated EBITDA" / "Annual Debt Service Charge" | ≥ 1.5x | 4.8x | |||
| Maintenance of unencumbered asset value | "Unencumbered Assets" / "Total Unsecured Debt" | ≥ 150% | 192.0% | |||
| | Investing for the long runTM | 20 | |
| | Investing for the long runTM | 21 | |
Investment Activity – Capital Investment Projects (a) | |
| Primary Transaction Type | Property Type | Expected Completion Date | Estimated Change in Square Footage | Lease Term (Years) | Funded During Three Months Ended Jun. 30, 2018 | Total Funded Through Jun. 30, 2018 | Maximum Commitment | |||||||||||||||||||||||
| Tenant | Location | Remaining | Total | |||||||||||||||||||||||||||
Nord Anglia Education, Inc. (b) | Coconut Creek, FL | Build-to-Suit | Education Facility | Q3 2018 | 130,000 | 25 | $ | 5,499 | $ | 18,624 | $ | 5,590 | $ | 24,810 | ||||||||||||||||
Ontex BVBA (c) | Radomsko, Poland | Build-to-Suit | Industrial | Q3 2018 | 280,897 | 15 | 5,703 | 8,500 | 7,240 | 15,740 | ||||||||||||||||||||
Nord Anglia Education, Inc. (b) | Windermere, FL | Build-to-Suit | Education Facility | Q3 2018 | 38,000 | 25 | 3,371 | 10,669 | 4,481 | 15,442 | ||||||||||||||||||||
Hellweg Die Profi-Baumärkte GmbH & Co. KG (c) (d) | Germany | Renovation | Retail | Q3 2018 | N/A | 19 | 1,932 | 2,901 | 5,462 | 8,363 | ||||||||||||||||||||
Hellweg Die Profi-Baumärkte GmbH & Co. KG (c) | Germany | Renovation | Retail | Q3 2018 | N/A | 19 | — | 366 | 5,346 | 5,712 | ||||||||||||||||||||
| Auria Solutions Ltd. | Holmesville, OH | Expansion | Industrial | Q1 2019 | 32,000 | 17 | — | — | 3,140 | 3,140 | ||||||||||||||||||||
| Astellas US Holding, Inc. | Westborough, MA | Redevelopment | Laboratory | Q3 2019 | 10,063 | 18 | — | — | 51,677 | 51,677 | ||||||||||||||||||||
Nippon Express Co., Ltd. (c) | Rotterdam, the Netherlands | Expansion | Industrial | Q3 2019 | 353,239 | 10 | 75 | 75 | 19,924 | 19,999 | ||||||||||||||||||||
| Total | 844,199 | $ | 16,580 | $ | 41,135 | $ | 102,860 | $ | 144,883 | |||||||||||||||||||||
| (a) | This schedule includes future estimates for which we can give no assurance as to timing or amounts. Completed capital investment projects are included in the Investment Activity – Acquisitions and Completed Capital Investment Projects section. Funding amounts exclude capitalized construction interest. |
| (b) | Interest earned on the funding for these properties is excluded from the remaining commitments. |
| (c) | Commitment amounts are based on the exchange rate of the euro at period end. |
| (d) | This project relates to a jointly owned investment that we consolidate, and in which our affiliate, CPA:17 – Global, has a 36.52% equity interest. Funding and commitment amounts are presented on a pro rata basis. On a consolidated basis, (i) the total amount funded during the three months ended June 30, 2018 was $3.0 million, (ii) the total amount funded through June 30, 2018 was $4.6 million, (iii) the remaining commitment was $8.6 million and (vi) the total maximum commitment was $13.2 million. |
| | Investing for the long runTM | 22 | |
| Investment Activity – Acquisitions and Completed Capital Investment Projects | |
| Gross Investment Amount | Closing Date / Asset Completion Date | Property Type(s) | Gross Square Footage | ||||||||||
| Tenant / Lease Guarantor | Property Location(s) | ||||||||||||
| Acquisitions | |||||||||||||
| 1Q18 | |||||||||||||
| LKQ Corporation | Sellersburg, IN | $ | 6,108 | Feb-18 | Warehouse | 75,375 | |||||||
Undisclosed (3 properties) (a) | Appleton, Madison and Waukesha, WI | 79,109 | Mar-18 | Retail, Warehouse | 771,354 | ||||||||
| 1Q18 Total | 85,217 | 846,729 | |||||||||||
| 2Q18 | |||||||||||||
Forterra, Inc. (b) | Bessemer, AL | 85,527 | Jun-18 | Industrial | 1,020,422 | ||||||||
Danske Fragtmænd A/S (15 properties) (c) | Various, Denmark | 186,589 | Jun-18 | Warehouse, Office | 1,986,823 | ||||||||
| 2Q18 Total | 272,116 | 3,007,245 | |||||||||||
| Year-to-Date Total | 357,333 | 3,853,974 | |||||||||||
| Completed Capital Investment Projects | |||||||||||||
| 1Q18 | |||||||||||||
Nord Anglia Education, Inc. (d) | Houston, TX | 20,977 | Jan-18 | Education Facility | 98,678 | ||||||||
| 1Q18 Total | 20,977 | 98,678 | |||||||||||
| 2Q18 | |||||||||||||
Schlage Lock Company LLC (c) | Zawiercie, Poland | 11,386 | Apr-18 | Industrial | 155,108 | ||||||||
| Auria Solutions Ltd. | Albemarle and Old Fort, NC | 2,180 | Apr-18 | Industrial | N/A | ||||||||
Griffith Foods Group Inc. (e) | Chicago, IL | 3,511 | Jun-18 | Industrial | N/A | ||||||||
| 2Q18 Total | 17,077 | 155,108 | |||||||||||
| Year-to-Date Total | 38,054 | 253,786 | |||||||||||
| Year-to-Date Total Acquisitions and Completed Capital Investment Projects | $ | 395,387 | 4,107,760 | ||||||||||
| (a) | Tenant undisclosed under terms of the lease agreement. |
| (b) | Property was acquired in exchange for 23 properties, which were transferred back to the same tenant in a nonmonetary swap transaction. Amount is based on the fair value of the property acquired. |
| (c) | Amount reflects the applicable exchange rate on the date of the transaction. |
| (d) | Rent related to this project commenced on March 1, 2018. |
| (e) | Rent related to this project commenced on July 1, 2018. |
| | Investing for the long runTM | 23 | |
| Investment Activity – Dispositions | |
Tenant / Lease Guarantor | Property Location(s) | Gross Sale Price | Closing Date | Property Type(s) | Gross Square Footage | ||||||||
| 1Q18 | |||||||||||||
Carl Leipold GmbH (a) | Bunde, Germany | $ | 1,217 | Mar-18 | Industrial, Office | 36,797 | |||||||
Compass Group USA, Inc. (b) | Lafayette, LA | 1,650 | Mar-18 | Office | 33,818 | ||||||||
| Multiple tenants | Nashville, TN | 12,600 | Mar-18 | Office | 64,693 | ||||||||
| IAC Soft Trim Properties, LLC | Springfield, TN | 4,250 | Mar-18 | Industrial | 144,072 | ||||||||
Mantsinen Group Ltd. Oy (a) | Ylämylly, Finland | 15,769 | Mar-18 | Industrial | 172,083 | ||||||||
| 1Q18 Total | 35,486 | 451,463 | |||||||||||
| 2Q18 | |||||||||||||
| DoubleTree | Memphis, TN | 38,950 | Apr-18 | Hotel | 42,500 | ||||||||
| Vacant | Orlando, FL | 3,800 | May-18 | Warehouse | 58,827 | ||||||||
Forterra, Inc. (23 properties) (a) (c) | Various, United States (20 properties) and Canada (3 properties) | 85,527 | Jun-18 | Industrial | 1,853,830 | ||||||||
| 2Q18 Total | 128,277 | 1,955,157 | |||||||||||
| Year-to-Date Total Dispositions | $ | 163,763 | 2,406,620 | ||||||||||
| (a) | Amount reflects the applicable exchange rate on the date of the transaction. |
| (b) | This multi-tenant property had approximately 25,000 vacant square feet as of the date of disposition. |
| (c) | Properties were disposed of in exchange for one property acquired from the same tenant valued at this amount in a nonmonetary swap transaction. |
| | Investing for the long runTM | 24 | |
| Joint Ventures | |
Joint Venture or JV (Principal Tenant) | JV Partnership | Consolidated | Pro Rata (a) | |||||||||||||||||
| Partner | WPC % | Debt Outstanding (b) | ABR | Debt Outstanding (c) | ABR | |||||||||||||||
Unconsolidated Joint Ventures (Equity Method Investments) (d) | ||||||||||||||||||||
Wanbishi Archives Co. Ltd. (e) | CPA:17 – Global | 3.00% | $ | — | $ | 2,756 | $ | — | $ | 83 | ||||||||||
Jumbo Logistiek Vastgoed B.V. (e) | CPA:17 – Global | 15.00% | 73,559 | 14,521 | 11,034 | 2,178 | ||||||||||||||
ALSO Actebis GmbH (e) | CPA:17 – Global | 30.00% | — | 3,877 | — | 1,163 | ||||||||||||||
Wagon Automotive GmbH (e) | CPA:17 – Global | 33.33% | — | 3,372 | — | 1,124 | ||||||||||||||
| Frontier Spinning Mills, Inc. | CPA:17 – Global | 40.00% | — | 5,342 | — | 2,137 | ||||||||||||||
| The New York Times Company | CPA:17 – Global | 45.00% | 99,759 | 27,656 | 44,891 | 12,445 | ||||||||||||||
| Total Unconsolidated Joint Ventures | 173,318 | 57,524 | 55,925 | 19,130 | ||||||||||||||||
| Consolidated Joint Ventures | ||||||||||||||||||||
Berry Global Inc. (f) | CPA:17 – Global | 50.00% | 22,841 | 7,587 | 11,421 | 3,793 | ||||||||||||||
Tesco Global Aruhazak Zrt. (e) | CPA:17 – Global | 51.00% | 35,169 | 6,738 | 17,936 | 3,436 | ||||||||||||||
Dick’s Sporting Goods, Inc. (f) | CPA:17 – Global | 55.10% | 18,675 | 3,581 | 10,290 | 1,973 | ||||||||||||||
Hellweg Die Profi-Baumärkte GmbH & Co. KG (e) (f) | CPA:17 – Global | 63.48% | — | 33,102 | — | 21,013 | ||||||||||||||
Eroski Sociedad Cooperativa (e) | CPA:17 – Global | 70.00% | — | 2,440 | — | 1,708 | ||||||||||||||
| U-Haul Moving Partners, Inc. and Mercury Partners, LP | CPA:17 – Global | 88.46% | — | 36,008 | — | 31,853 | ||||||||||||||
| McCoy-Rockford, Inc. | Third party | 90.00% | 3,349 | 857 | 3,013 | 771 | ||||||||||||||
| Total Consolidated Joint Ventures | 80,034 | 90,313 | 42,660 | 64,547 | ||||||||||||||||
| Total Unconsolidated and Consolidated Joint Ventures | $ | 253,352 | $ | 147,837 | $ | 98,585 | $ | 83,677 | ||||||||||||
| (a) | See the Terms and Definitions section in the Appendix for a description of pro rata. |
| (b) | Excludes unamortized deferred financing costs totaling $0.6 million and unamortized premium, net totaling $0.3 million as of June 30, 2018. |
| (c) | Excludes unamortized deferred financing costs totaling $0.2 million and unamortized premium, net totaling $0.1 million as of June 30, 2018. |
| (d) | Excludes a preferred equity position in a jointly owned investment, Beach House JV, LLC, which did not have debt outstanding or ABR as of June 30, 2018. |
| (e) | Amounts are based on the applicable exchange rate at the end of the period. |
| (f) | Excludes certain properties leased to the tenants that we consolidate and in which we have a 100% ownership interest. |
| | Investing for the long runTM | 25 | |
| Top Ten Tenants | |
| Tenant / Lease Guarantor | Property Type | Tenant Industry | Location | Number of Properties | ABR | ABR % | Weighted-Average Lease Term (Years) | ||||||||||||
Hellweg Die Profi-Baumärkte GmbH & Co. KG (a) | Retail | Retail Stores | Germany | 53 | $ | 35,640 | 5.1 | % | 18.7 | ||||||||||
| U-Haul Moving Partners Inc. and Mercury Partners, LP | Self Storage | Cargo Transportation, Consumer Services | United States | 78 | 31,853 | 4.6 | % | 5.8 | |||||||||||
State of Andalucia (a) | Office | Sovereign and Public Finance | Spain | 70 | 28,802 | 4.2 | % | 16.5 | |||||||||||
Pendragon PLC (a) | Retail | Retail Stores, Consumer Services | United Kingdom | 70 | 21,673 | 3.1 | % | 11.8 | |||||||||||
| Marriott Corporation | Hotel | Hotel, Gaming and Leisure | United States | 18 | 20,065 | 2.9 | % | 5.4 | |||||||||||
Forterra, Inc. (a) (b) | Industrial | Construction and Building | United States and Canada | 27 | 18,016 | 2.6 | % | 25.0 | |||||||||||
OBI Group (a) | Office, Retail | Retail Stores | Poland | 18 | 16,289 | 2.3 | % | 5.9 | |||||||||||
| True Value Company | Warehouse | Retail Stores | United States | 7 | 15,993 | 2.3 | % | 4.5 | |||||||||||
| Nord Anglia Education, Inc. | Education Facility | Consumer Services | United States | 3 | 15,521 | 2.2 | % | 23.5 | |||||||||||
| UTI Holdings, Inc. | Education Facility | Consumer Services | United States | 5 | 14,484 | 2.1 | % | 3.7 | |||||||||||
Total (c) | 349 | $ | 218,336 | 31.4 | % | 12.5 | |||||||||||||
| (a) | ABR amounts are subject to fluctuations in foreign currency exchange rates. |
| (b) | Of the 27 properties leased to Forterra, Inc., 25 are located in the United States and two are located in Canada. |
| (c) | See the Terms and Definitions section in the Appendix for a description of pro rata. |
| | Investing for the long runTM | 26 | |
| Diversification by Property Type | |
| Total Net-Lease Portfolio | Unencumbered Net-Lease Portfolio (a) | ||||||||||||||||||||||||||
| Property Type | ABR | ABR % | Square Footage (b) | Sq. ft. % | ABR | ABR % | Square Footage (b) | Sq. ft. % | |||||||||||||||||||
| U.S. | |||||||||||||||||||||||||||
| Industrial | $ | 139,562 | 20.1 | % | 27,209 | 31.4 | % | $ | 81,040 | 17.2 | % | 16,651 | 27.4 | % | |||||||||||||
| Office | 103,885 | 15.0 | % | 6,321 | 7.3 | % | 43,803 | 9.3 | % | 3,061 | 5.0 | % | |||||||||||||||
| Retail | 30,365 | 4.4 | % | 2,337 | 2.7 | % | 21,279 | 4.5 | % | 1,674 | 2.8 | % | |||||||||||||||
| Warehouse | 79,117 | 11.4 | % | 15,490 | 17.9 | % | 42,268 | 9.0 | % | 8,409 | 13.8 | % | |||||||||||||||
| Self Storage (net lease) | 31,853 | 4.6 | % | 3,535 | 4.1 | % | 31,853 | 6.8 | % | 3,535 | 5.8 | % | |||||||||||||||
Other (c) | 70,854 | 10.2 | % | 4,443 | 5.1 | % | 33,715 | 7.2 | % | 1,970 | 3.2 | % | |||||||||||||||
| U.S. Total | 455,636 | 65.7 | % | 59,335 | 68.5 | % | 253,958 | 54.0 | % | 35,300 | 58.0 | % | |||||||||||||||
| International | |||||||||||||||||||||||||||
| Industrial | 58,948 | 8.5 | % | 10,027 | 11.6 | % | 58,797 | 12.5 | % | 10,016 | 16.5 | % | |||||||||||||||
| Office | 64,379 | 9.3 | % | 4,744 | 5.5 | % | 51,105 | 10.9 | % | 4,168 | 6.8 | % | |||||||||||||||
Retail (d) | 82,609 | 11.9 | % | 7,569 | 8.7 | % | 82,610 | 17.6 | % | 7,569 | 12.4 | % | |||||||||||||||
| Warehouse | 31,910 | 4.6 | % | 4,968 | 5.7 | % | 23,382 | 5.0 | % | 3,817 | 6.3 | % | |||||||||||||||
| Self Storage (net lease) | — | — | % | — | — | % | — | — | % | — | — | % | |||||||||||||||
| Other | — | — | % | — | — | % | — | — | % | — | — | % | |||||||||||||||
| International Total | 237,846 | 34.3 | % | 27,308 | 31.5 | % | 215,894 | 46.0 | % | 25,570 | 42.0 | % | |||||||||||||||
| Total | |||||||||||||||||||||||||||
| Industrial | 198,510 | 28.6 | % | 37,236 | 43.0 | % | 139,837 | 29.7 | % | 26,667 | 43.9 | % | |||||||||||||||
| Office | 168,264 | 24.3 | % | 11,065 | 12.8 | % | 94,908 | 20.2 | % | 7,229 | 11.8 | % | |||||||||||||||
Retail (d) | 112,974 | 16.3 | % | 9,906 | 11.4 | % | 103,889 | 22.1 | % | 9,243 | 15.2 | % | |||||||||||||||
| Warehouse | 111,027 | 16.0 | % | 20,458 | 23.6 | % | 65,650 | 14.0 | % | 12,226 | 20.1 | % | |||||||||||||||
| Self Storage (net lease) | 31,853 | 4.6 | % | 3,535 | 4.1 | % | 31,853 | 6.8 | % | 3,535 | 5.8 | % | |||||||||||||||
Other (c) | 70,854 | 10.2 | % | 4,443 | 5.1 | % | 33,715 | 7.2 | % | 1,970 | 3.2 | % | |||||||||||||||
Total (e) | $ | 693,482 | 100.0 | % | 86,643 | 100.0 | % | $ | 469,852 | 100.0 | % | 60,870 | 100.0 | % | |||||||||||||
| (a) | Represents properties unencumbered by non-recourse mortgage debt. |
| (b) | Includes square footage for vacant properties. |
| (c) | Includes ABR from tenants with the following property types: education facility, hotel, theater, fitness facility and net-lease student housing. |
| (d) | Includes automotive dealerships. |
| (e) | See the Terms and Definitions section in the Appendix for a description of pro rata. |
| | Investing for the long runTM | 27 | |
| Diversification by Tenant Industry | |
| Total Net-Lease Portfolio | Unencumbered Net-Lease Portfolio (a) | ||||||||||||||||||||||||||
| Industry Type | ABR | ABR % | Square Footage | Sq. ft. % | ABR | ABR % | Square Footage | Sq. ft. % | |||||||||||||||||||
Retail Stores (b) | $ | 124,396 | 17.9 | % | 15,687 | 18.1 | % | $ | 95,273 | 20.3 | % | 10,354 | 17.0 | % | |||||||||||||
| Consumer Services | 73,537 | 10.6 | % | 5,703 | 6.6 | % | 56,630 | 12.0 | % | 4,443 | 7.3 | % | |||||||||||||||
| Automotive | 55,515 | 8.0 | % | 8,900 | 10.3 | % | 48,844 | 10.4 | % | 7,766 | 12.8 | % | |||||||||||||||
| Sovereign and Public Finance | 41,949 | 6.0 | % | 3,364 | 3.9 | % | 32,394 | 6.9 | % | 3,000 | 4.9 | % | |||||||||||||||
| Cargo Transportation | 41,307 | 6.0 | % | 5,847 | 6.7 | % | 34,850 | 7.4 | % | 5,410 | 8.9 | % | |||||||||||||||
| Construction and Building | 38,380 | 5.5 | % | 7,464 | 8.6 | % | 26,670 | 5.7 | % | 5,492 | 9.0 | % | |||||||||||||||
| Hotel, Gaming and Leisure | 35,368 | 5.1 | % | 2,254 | 2.6 | % | 15,215 | 3.2 | % | 1,040 | 1.7 | % | |||||||||||||||
| Beverage, Food and Tobacco | 30,713 | 4.4 | % | 6,876 | 7.9 | % | 30,713 | 6.5 | % | 6,876 | 11.3 | % | |||||||||||||||
| Healthcare and Pharmaceuticals | 28,249 | 4.1 | % | 2,048 | 2.4 | % | 14,333 | 3.0 | % | 1,119 | 1.8 | % | |||||||||||||||
| High Tech Industries | 28,197 | 4.1 | % | 2,479 | 2.8 | % | 18,632 | 4.0 | % | 1,533 | 2.5 | % | |||||||||||||||
| Containers, Packaging and Glass | 27,680 | 4.0 | % | 5,325 | 6.1 | % | 7,874 | 1.7 | % | 1,556 | 2.6 | % | |||||||||||||||
| Media: Advertising, Printing and Publishing | 23,121 | 3.3 | % | 1,588 | 1.8 | % | 4,689 | 1.0 | % | 655 | 1.1 | % | |||||||||||||||
| Capital Equipment | 21,115 | 3.0 | % | 3,522 | 4.1 | % | 16,302 | 3.5 | % | 2,457 | 4.0 | % | |||||||||||||||
| Business Services | 14,187 | 2.0 | % | 1,723 | 2.0 | % | 10,194 | 2.2 | % | 1,473 | 2.4 | % | |||||||||||||||
| Durable Consumer Goods | 11,606 | 1.7 | % | 2,485 | 2.9 | % | 3,464 | 0.7 | % | 1,139 | 1.9 | % | |||||||||||||||
| Grocery | 11,505 | 1.7 | % | 1,228 | 1.4 | % | 5,064 | 1.1 | % | 388 | 0.6 | % | |||||||||||||||
| Aerospace and Defense | 10,769 | 1.6 | % | 1,115 | 1.3 | % | 6,588 | 1.4 | % | 788 | 1.3 | % | |||||||||||||||
| Wholesale | 9,798 | 1.4 | % | 1,625 | 1.9 | % | 3,885 | 0.8 | % | 706 | 1.2 | % | |||||||||||||||
| Banking | 9,726 | 1.4 | % | 702 | 0.8 | % | 1,736 | 0.4 | % | 106 | 0.2 | % | |||||||||||||||
| Chemicals, Plastics and Rubber | 9,485 | 1.4 | % | 1,108 | 1.3 | % | 3,237 | 0.7 | % | 437 | 0.7 | % | |||||||||||||||
| Metals and Mining | 9,023 | 1.3 | % | 1,341 | 1.5 | % | 3,396 | 0.7 | % | 772 | 1.3 | % | |||||||||||||||
| Oil and Gas | 8,189 | 1.2 | % | 333 | 0.4 | % | 8,189 | 1.7 | % | 333 | 0.5 | % | |||||||||||||||
| Non-Durable Consumer Goods | 8,156 | 1.2 | % | 1,883 | 2.2 | % | 5,919 | 1.3 | % | 1,355 | 2.2 | % | |||||||||||||||
| Telecommunications | 7,155 | 1.0 | % | 418 | 0.5 | % | 3,215 | 0.7 | % | 166 | 0.3 | % | |||||||||||||||
Other (c) | 14,356 | 2.1 | % | 1,625 | 1.9 | % | 12,546 | 2.7 | % | 1,506 | 2.5 | % | |||||||||||||||
Total (d) | $ | 693,482 | 100.0 | % | 86,643 | 100.0 | % | $ | 469,852 | 100.0 | % | 60,870 | 100.0 | % | |||||||||||||
| (a) | Represents properties unencumbered by non-recourse mortgage debt. |
| (b) | Includes automotive dealerships. |
| (c) | Includes ABR from tenants in the following industries: insurance, electricity, media: broadcasting and subscription, forest products and paper and environmental industries. Also includes square footage for vacant properties. |
| (d) | See the Terms and Definitions section in the Appendix for a description of pro rata. |
| | Investing for the long runTM | 28 | |
| Diversification by Geography | |
| Total Net-Lease Portfolio | Unencumbered Net-Lease Portfolio (a) | ||||||||||||||||||||||||||
| Region | ABR | ABR % | Square Footage (b) | Sq. ft. % | ABR | ABR % | Square Footage (b) | Sq. ft. % | |||||||||||||||||||
| U.S. | |||||||||||||||||||||||||||
| South | |||||||||||||||||||||||||||
| Texas | $ | 57,378 | 8.3 | % | 7,702 | 8.9 | % | $ | 33,391 | 7.1 | % | 4,925 | 8.1 | % | |||||||||||||
| Florida | 29,943 | 4.3 | % | 2,598 | 3.0 | % | 26,798 | 5.7 | % | 2,342 | 3.8 | % | |||||||||||||||
| Georgia | 21,388 | 3.1 | % | 3,210 | 3.7 | % | 16,173 | 3.4 | % | 2,343 | 3.9 | % | |||||||||||||||
| Tennessee | 13,198 | 1.9 | % | 1,985 | 2.3 | % | 4,600 | 1.0 | % | 993 | 1.6 | % | |||||||||||||||
| Alabama | 10,042 | 1.5 | % | 1,920 | 2.2 | % | 10,042 | 2.1 | % | 1,920 | 3.2 | % | |||||||||||||||
Other (c) | 5,843 | 0.8 | % | 1,096 | 1.3 | % | 5,180 | 1.1 | % | 937 | 1.5 | % | |||||||||||||||
| Total South | 137,792 | 19.9 | % | 18,511 | 21.4 | % | 96,184 | 20.4 | % | 13,460 | 22.1 | % | |||||||||||||||
| East | |||||||||||||||||||||||||||
| North Carolina | 19,043 | 2.8 | % | 4,517 | 5.2 | % | 12,093 | 2.6 | % | 3,238 | 5.3 | % | |||||||||||||||
| New Jersey | 19,004 | 2.7 | % | 1,097 | 1.3 | % | 8,529 | 1.8 | % | 601 | 1.0 | % | |||||||||||||||
| New York | 18,524 | 2.7 | % | 1,178 | 1.4 | % | 758 | 0.2 | % | 66 | 0.1 | % | |||||||||||||||
| Pennsylvania | 18,080 | 2.6 | % | 2,525 | 2.9 | % | 9,411 | 2.0 | % | 1,583 | 2.6 | % | |||||||||||||||
| Massachusetts | 15,551 | 2.2 | % | 1,390 | 1.6 | % | 11,309 | 2.4 | % | 1,163 | 1.9 | % | |||||||||||||||
| Virginia | 7,655 | 1.1 | % | 1,025 | 1.2 | % | 6,900 | 1.5 | % | 531 | 0.9 | % | |||||||||||||||
| Connecticut | 6,969 | 1.0 | % | 1,135 | 1.3 | % | 1,999 | 0.4 | % | 251 | 0.4 | % | |||||||||||||||
Other (c) | 18,183 | 2.6 | % | 3,782 | 4.4 | % | 7,941 | 1.7 | % | 2,093 | 3.5 | % | |||||||||||||||
| Total East | 123,009 | 17.7 | % | 16,649 | 19.3 | % | 58,940 | 12.6 | % | 9,526 | 15.7 | % | |||||||||||||||
| West | |||||||||||||||||||||||||||
| California | 41,686 | 6.0 | % | 3,187 | 3.7 | % | 14,867 | 3.2 | % | 1,451 | 2.4 | % | |||||||||||||||
| Arizona | 27,045 | 3.9 | % | 3,049 | 3.5 | % | 8,577 | 1.8 | % | 685 | 1.1 | % | |||||||||||||||
| Colorado | 9,983 | 1.5 | % | 864 | 1.0 | % | 6,306 | 1.3 | % | 509 | 0.8 | % | |||||||||||||||
Other (c) | 27,034 | 3.9 | % | 3,225 | 3.7 | % | 17,250 | 3.7 | % | 1,943 | 3.2 | % | |||||||||||||||
| Total West | 105,748 | 15.3 | % | 10,325 | 11.9 | % | 47,000 | 10.0 | % | 4,588 | 7.5 | % | |||||||||||||||
| Midwest | |||||||||||||||||||||||||||
| Illinois | 21,123 | 3.0 | % | 3,111 | 3.6 | % | 8,928 | 1.9 | % | 1,637 | 2.7 | % | |||||||||||||||
| Michigan | 12,263 | 1.8 | % | 1,456 | 1.7 | % | 12,263 | 2.6 | % | 1,456 | 2.4 | % | |||||||||||||||
| Indiana | 9,708 | 1.4 | % | 1,493 | 1.7 | % | 3,526 | 0.8 | % | 508 | 0.8 | % | |||||||||||||||
| Wisconsin | 9,036 | 1.3 | % | 1,585 | 1.8 | % | 7,679 | 1.6 | % | 1,414 | 2.3 | % | |||||||||||||||
| Minnesota | 8,909 | 1.3 | % | 904 | 1.0 | % | 7,190 | 1.5 | % | 644 | 1.1 | % | |||||||||||||||
| Ohio | 8,285 | 1.2 | % | 1,776 | 2 | % | 4,231 | 0.9 | % | 913 | 1.5 | % | |||||||||||||||
Other (c) | 19,763 | 2.8 | % | 3,525 | 4.1 | % | 8,017 | 1.7 | % | 1,154 | 1.9 | % | |||||||||||||||
| Total Midwest | 89,087 | 12.8 | % | 13,850 | 15.9 | % | 51,834 | 11.0 | % | 7,726 | 12.7 | % | |||||||||||||||
| U.S. Total | 455,636 | 65.7 | % | 59,335 | 68.5 | % | 253,958 | 54.0 | % | 35,300 | 58.0 | % | |||||||||||||||
| International | |||||||||||||||||||||||||||
| Germany | 57,697 | 8.3 | % | 5,930 | 6.8 | % | 53,980 | 11.5 | % | 5,718 | 9.4 | % | |||||||||||||||
| United Kingdom | 33,547 | 4.8 | % | 2,324 | 2.7 | % | 31,526 | 6.7 | % | 2,111 | 3.5 | % | |||||||||||||||
| Spain | 30,510 | 4.4 | % | 2,927 | 3.4 | % | 30,510 | 6.5 | % | 2,927 | 4.8 | % | |||||||||||||||
| Poland | 19,057 | 2.8 | % | 2,344 | 2.7 | % | 19,057 | 4.0 | % | 2,344 | 3.8 | % | |||||||||||||||
| The Netherlands | 15,340 | 2.2 | % | 2,233 | 2.6 | % | 12,118 | 2.6 | % | 1,792 | 2.9 | % | |||||||||||||||
| France | 14,508 | 2.1 | % | 1,266 | 1.4 | % | 6,517 | 1.4 | % | 1,025 | 1.7 | % | |||||||||||||||
| Denmark | 12,335 | 1.8 | % | 1,987 | 2.3 | % | 12,335 | 2.6 | % | 1,987 | 3.3 | % | |||||||||||||||
| Australia | 12,081 | 1.7 | % | 3,272 | 3.8 | % | 12,081 | 2.6 | % | 3,272 | 5.4 | % | |||||||||||||||
| Finland | 11,658 | 1.7 | % | 949 | 1.1 | % | 11,658 | 2.5 | % | 949 | 1.5 | % | |||||||||||||||
| Canada | 11,072 | 1.6 | % | 1,817 | 2.1 | % | 11,072 | 2.4 | % | 1,817 | 3.0 | % | |||||||||||||||
Other (d) | 20,041 | 2.9 | % | 2,259 | 2.6 | % | 15,040 | 3.2 | % | 1,628 | 2.7 | % | |||||||||||||||
| International Total | 237,846 | 34.3 | % | 27,308 | 31.5 | % | 215,894 | 46.0 | % | 25,570 | 42.0 | % | |||||||||||||||
Total (e) | $ | 693,482 | 100.0 | % | 86,643 | 100.0 | % | $ | 469,852 | 100.0 | % | 60,870 | 100.0 | % | |||||||||||||
| | Investing for the long runTM | 29 | |
| (a) | Represents properties unencumbered by non-recourse mortgage debt. |
| (b) | Includes square footage for vacant properties. |
| (c) | Other properties within South include assets in Louisiana, Arkansas, Mississippi and Oklahoma. Other properties within East include assets in Kentucky, South Carolina, Maryland, New Hampshire and West Virginia. Other properties within West include assets in Utah, Washington, Nevada, Oregon, New Mexico, Wyoming, Alaska and Montana. Other properties within Midwest include assets in Missouri, Kansas, Nebraska, Iowa, South Dakota and North Dakota. |
| (d) | Includes assets in Norway, Hungary, Austria, Mexico, Sweden, Belgium and Japan. |
| (e) | See the Terms and Definitions section in the Appendix for a description of pro rata. |
| | Investing for the long runTM | 30 | |
| Contractual Rent Increases | |
| Total Net-Lease Portfolio | Unencumbered Net-Lease Portfolio (a) | ||||||||||||||||||||||||||
| Rent Adjustment Measure | ABR | ABR % | Square Footage | Sq. ft. % | ABR | ABR % | Square Footage | Sq. ft. % | |||||||||||||||||||
| (Uncapped) CPI | $ | 287,831 | 41.5 | % | 33,502 | 38.7 | % | $ | 210,656 | 44.8 | % | 23,399 | 38.4 | % | |||||||||||||
| Fixed | 189,737 | 27.4 | % | 26,289 | 30.3 | % | 120,698 | 25.7 | % | 17,873 | 29.4 | % | |||||||||||||||
| CPI-based | 182,643 | 26.3 | % | 24,129 | 27.8 | % | 125,627 | 26.7 | % | 18,267 | 30.0 | % | |||||||||||||||
Other (b) | 26,655 | 3.8 | % | 1,838 | 2.1 | % | 10,555 | 2.3 | % | 801 | 1.3 | % | |||||||||||||||
| None | 6,616 | 1.0 | % | 579 | 0.7 | % | 2,316 | 0.5 | % | 224 | 0.4 | % | |||||||||||||||
| Vacant | — | — | % | 306 | 0.4 | % | — | — | % | 306 | 0.5 | % | |||||||||||||||
Total (c) | $ | 693,482 | 100.0 | % | 86,643 | 100.0 | % | $ | 469,852 | 100.0 | % | 60,870 | 100.0 | % | |||||||||||||
| (a) | Represents properties unencumbered by non-recourse mortgage debt. |
| (b) | Represents leases attributable to percentage rent. |
| (c) | See the Terms and Definitions section in the Appendix for a description of pro rata. |
| | Investing for the long runTM | 31 | |
| Same Store Analysis | |
| ABR | |||||||||||||||
| Property Type | As of Jun. 30, 2018 | As of Jun. 30, 2017 | Increase | % Increase | |||||||||||
| Industrial | $ | 165,009 | $ | 160,424 | $ | 4,585 | 2.9 | % | |||||||
| Office | 155,937 | 154,775 | 1,162 | 0.8 | % | ||||||||||
Retail (a) | 94,972 | 93,660 | 1,312 | 1.4 | % | ||||||||||
| Warehouse | 94,106 | 92,508 | 1,598 | 1.7 | % | ||||||||||
| Self Storage (net lease) | 31,853 | 31,853 | — | — | % | ||||||||||
Other (b) | 62,383 | 61,729 | 654 | 1.1 | % | ||||||||||
| Total | $ | 604,260 | $ | 594,949 | $ | 9,311 | 1.6 | % | |||||||
| Rent Adjustment Measure | |||||||||||||||
| (Uncapped) CPI | $ | 260,048 | $ | 256,833 | $ | 3,215 | 1.3 | % | |||||||
| Fixed | 148,764 | 146,058 | 2,706 | 1.9 | % | ||||||||||
| CPI-based | 162,176 | 158,786 | 3,390 | 2.1 | % | ||||||||||
Other (c) | 26,656 | 26,656 | — | — | % | ||||||||||
| None | 6,616 | 6,616 | — | — | % | ||||||||||
| Total | $ | 604,260 | $ | 594,949 | $ | 9,311 | 1.6 | % | |||||||
| Geography | |||||||||||||||
| U.S. | $ | 396,582 | $ | 390,501 | $ | 6,081 | 1.6 | % | |||||||
| Europe | 182,063 | 179,431 | 2,632 | 1.5 | % | ||||||||||
Other International (d) | 25,615 | 25,017 | 598 | 2.4 | % | ||||||||||
| Total | $ | 604,260 | $ | 594,949 | $ | 9,311 | 1.6 | % | |||||||
| Same Store Portfolio Summary | |||||||||||||||
| Number of properties | 785 | ||||||||||||||
| Square footage (in thousands) | 73,333 | ||||||||||||||
| (a) | Includes automotive dealerships. |
| (b) | Includes ABR from tenants with the following property types: education facility, hotel, theater, fitness facility and net-lease student housing. |
| (c) | Represents leases attributable to percentage rent. |
| (d) | Includes assets in Canada, Australia, Mexico and Japan. |
| | Investing for the long runTM | 32 | |
| Leasing Activity | |
| Lease Renewals and Extensions | Expected Tenant Improvements ($’000s) | Leasing Commissions ($’000s) | |||||||||||||||||||||||||
| ABR | |||||||||||||||||||||||||||
| Property Type | Square Feet | Number of Leases | Prior Lease ($’000s) | New Lease ($'000s) (a) | Releasing Spread | Incremental Lease Term | |||||||||||||||||||||
| Industrial | 3,023,414 | 3 | $ | 19,321 | $ | 16,283 | (15.7 | )% | $ | — | $ | 1,000 | 10.7 years | ||||||||||||||
| Office | 94,649 | 1 | 1,207 | 1,347 | 11.7 | % | — | — | 2 years | ||||||||||||||||||
| Retail | 66,060 | 2 | 549 | 549 | — | % | — | — | 5 years | ||||||||||||||||||
| Warehouse | 369,537 | 1 | 1,396 | 1,293 | (7.3 | )% | 475 | 136 | 5 years | ||||||||||||||||||
| Self Storage (net lease) | — | — | — | — | — | % | — | — | N/A | ||||||||||||||||||
| Other | 46,658 | 1 | 892 | 892 | — | % | — | — | 5 years | ||||||||||||||||||
Total / Weighted Average (b) | 3,600,318 | 8 | $ | 23,365 | $ | 20,364 | (12.8 | )% | $ | 475 | $ | 1,136 | 9.2 years | ||||||||||||||
| Q2 Summary | |||||||||||||||||||||||||||
| Prior Lease ABR (% of Total Portfolio) | 3.4 | % | |||||||||||||||||||||||||
| (a) | New Lease amounts are based on in-place rents at time of lease commencement and exclude any free rent periods. |
| (b) | Weighted average refers to the incremental lease term. |
| | Investing for the long runTM | 33 | |
| Lease Expirations – Total Net-Lease Portfolio | |
Year of Lease Expiration (a) | Number of Leases Expiring | ABR | ABR % | Square Footage | Sq. ft. % | |||||||||||
| Remaining 2018 | 3 | $ | 7,319 | 1.1 | % | 603 | 0.7 | % | ||||||||
| 2019 | 17 | 25,362 | 3.7 | % | 1,996 | 2.3 | % | |||||||||
| 2020 | 22 | 26,762 | 3.9 | % | 2,639 | 3.0 | % | |||||||||
| 2021 | 76 | 37,962 | 5.5 | % | 5,086 | 5.9 | % | |||||||||
| 2022 | 40 | 69,582 | 10.0 | % | 9,442 | 10.9 | % | |||||||||
| 2023 | 21 | 41,773 | 6.0 | % | 5,860 | 6.7 | % | |||||||||
2024 (b) | 45 | 98,032 | 14.1 | % | 12,008 | 13.8 | % | |||||||||
| 2025 | 41 | 30,993 | 4.5 | % | 3,439 | 4.0 | % | |||||||||
| 2026 | 19 | 19,072 | 2.7 | % | 3,159 | 3.6 | % | |||||||||
| 2027 | 25 | 41,713 | 6.0 | % | 5,957 | 6.9 | % | |||||||||
| 2028 | 11 | 21,079 | 3.0 | % | 2,514 | 2.9 | % | |||||||||
| 2029 | 11 | 20,127 | 2.9 | % | 2,656 | 3.1 | % | |||||||||
| 2030 | 9 | 15,811 | 2.3 | % | 1,481 | 1.7 | % | |||||||||
| 2031 | 54 | 33,580 | 4.8 | % | 2,832 | 3.3 | % | |||||||||
| Thereafter (>2031) | 64 | 204,315 | 29.5 | % | 26,665 | 30.8 | % | |||||||||
| Vacant | — | — | — | % | 306 | 0.4 | % | |||||||||
Total (c) | 458 | $ | 693,482 | 100.0 | % | 86,643 | 100.0 | % | ||||||||
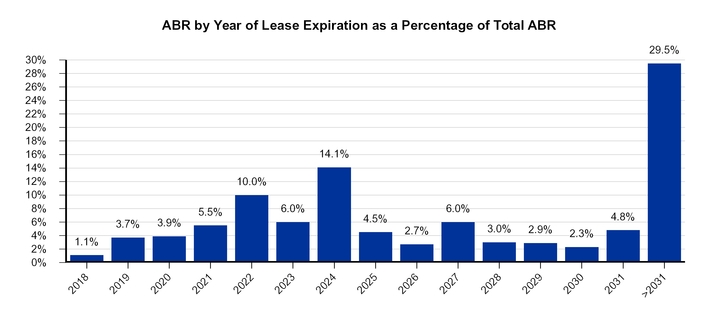
| (a) | Assumes tenants do not exercise any renewal options. |
| (b) | Includes ABR of $12.3 million from a tenant (The New York Times Company) that exercised its option in January 2018 to repurchase the property it is leasing from a jointly owned investment with our affiliate, CPA:17 – Global, in which we have a 45% equity interest and which is consolidated by CPA:17 – Global. There can be no assurance that such repurchase will be completed. |
| (c) | See the Terms and Definitions section in the Appendix for a description of pro rata. |
| | Investing for the long runTM | 34 | |
| Lease Expirations – Unencumbered Net-Lease Portfolio | |
Year of Lease Expiration (a) | Number of Leases Expiring | ABR | ABR % | Square Footage | Sq. ft. % | |||||||||||
| Remaining 2018 | 3 | $ | 7,319 | 1.6 | % | 603 | 1.0 | % | ||||||||
| 2019 | 10 | 5,569 | 1.2 | % | 644 | 1.1 | % | |||||||||
| 2020 | 14 | 11,707 | 2.5 | % | 1,450 | 2.4 | % | |||||||||
| 2021 | 66 | 19,796 | 4.2 | % | 2,965 | 4.9 | % | |||||||||
| 2022 | 27 | 25,615 | 5.4 | % | 4,043 | 6.6 | % | |||||||||
| 2023 | 15 | 13,489 | 2.9 | % | 2,529 | 4.2 | % | |||||||||
| 2024 | 34 | 64,737 | 13.8 | % | 8,300 | 13.6 | % | |||||||||
| 2025 | 34 | 19,659 | 4.2 | % | 1,739 | 2.9 | % | |||||||||
| 2026 | 8 | 11,887 | 2.5 | % | 1,995 | 3.3 | % | |||||||||
| 2027 | 19 | 28,045 | 6.0 | % | 3,699 | 6.1 | % | |||||||||
| 2028 | 9 | 16,056 | 3.4 | % | 2,275 | 3.7 | % | |||||||||
| 2029 | 11 | 20,127 | 4.3 | % | 2,656 | 4.4 | % | |||||||||
| 2030 | 7 | 9,518 | 2.0 | % | 884 | 1.4 | % | |||||||||
| 2031 | 54 | 33,580 | 7.1 | % | 2,832 | 4.6 | % | |||||||||
| Thereafter (>2031) | 55 | 182,748 | 38.9 | % | 23,950 | 39.3 | % | |||||||||
| Vacant | — | — | — | % | 306 | 0.5 | % | |||||||||
Total (b) (c) | 366 | $ | 469,852 | 100.0 | % | 60,870 | 100.0 | % | ||||||||
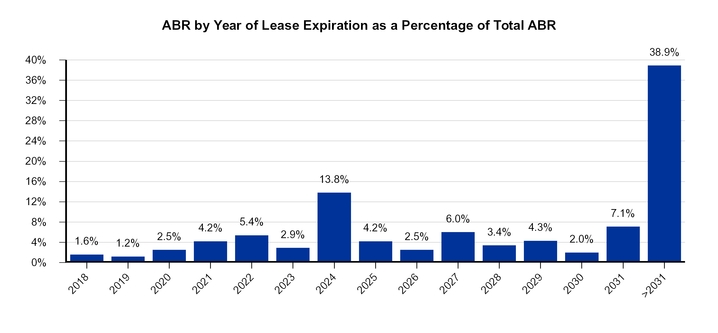
| (a) | Assumes tenants do not exercise any renewal options. |
| (b) | See the Terms and Definitions section in the Appendix for a description of pro rata. |
| (c) | Represents properties unencumbered by non-recourse mortgage debt. |
| | Investing for the long runTM | 35 | |
| | Investing for the long runTM | 36 | |
| Selected Information – Managed Programs | |
| Managed Programs | |||||||||||||||||||
| CPA:17 – Global | CPA:18 – Global | CWI 1 | CWI 2 | CESH I | |||||||||||||||
| General | |||||||||||||||||||
| Year established | 2007 | 2013 | 2010 | 2015 | 2016 | ||||||||||||||
AUM (a) | $ | 5,808,434 | $ | 2,549,589 | $ | 2,893,645 | $ | 1,959,683 | $ | 213,993 | |||||||||
| Net-lease AUM | 5,107,168 | 1,557,317 | N/A | N/A | N/A | ||||||||||||||
NAV (b) | 10.04 | 8.57 | 10.41 | 11.11 | 1,000.00 | ||||||||||||||
| Fundraising status | Closed | Closed | Closed | Closed | Closed | ||||||||||||||
| Portfolio | |||||||||||||||||||
| Investment type | Net lease / Diversified REIT | Net lease / Diversified REIT | Lodging REIT | Lodging REIT | Student Housing | ||||||||||||||
| Number of net-leased properties | 411 | 59 | N/A | N/A | N/A | ||||||||||||||
| Number of operating properties | 38 | 83 | 28 | 12 | 9 | ||||||||||||||
Number of tenants – net-leased properties (c) | 114 | 100 | N/A | N/A | N/A | ||||||||||||||
Square footage (c) | 47,136 | 16,866 | 6,314 | 3,468 | 117 | ||||||||||||||
Occupancy (d) | 99.7 | % | 98.3 | % | 80.5 | % | 82.4 | % | 30.3 | % | |||||||||
| Acquisitions – second quarter | $ | — | $ | 94,745 | $ | — | $ | — | $ | — | |||||||||
| Dispositions – second quarter | — | — | — | — | — | ||||||||||||||
| Balance Sheet (Book Value) | |||||||||||||||||||
| Total assets | $ | 4,470,224 | $ | 2,398,943 | $ | 2,348,888 | $ | 1,630,589 | $ | 222,603 | |||||||||
| Total debt | 1,897,796 | 1,370,526 | 1,389,179 | 831,805 | 49,233 | ||||||||||||||
| Total debt / total assets | 42.5 | % | 57.1 | % | 59.1 | % | 51.0 | % | 22.1 | % | |||||||||
| (a) | Represents estimated value of real estate assets plus cash and cash equivalents, less distributions payable for the Managed REITs and fair value of investments plus cash for CESH I. |
| (b) | The estimated NAVs for CPA:17 – Global, CWI 1 and CWI 2 were determined as of December 31, 2017. The estimated NAV for CPA:18 – Global was determined as of March 31, 2018. We own limited partnership units of CESH I at its private placement price of $1,000 per share; a NAV for CESH I has not yet been calculated. |
| (c) | For CPA:17 – Global and CPA:18 – Global, excludes operating properties. For CESH I, one property has been placed into service as of June 30, 2018. The remaining investments are build-to-suit projects and gross square footage cannot be determined at this time. |
| (d) | Represents occupancy for net-leased properties for CPA:17 – Global and single-tenant net-leased properties for CPA:18 – Global. Represents occupancy for hotels owned by CWI 1 and CWI 2 for the three months ended June 30, 2018. Occupancy for CPA:17 – Global's 37 self-storage properties was 93.1% as of June 30, 2018. Occupancy for CPA:18 – Global's 69 self-storage properties and 14 multi-family properties was 92.1% and 92.3%, respectively, as of June 30, 2018. CPA:18 – Global’s multi-tenant net-leased properties had an occupancy rate of 96.1% and square footage of 0.6 million as of June 30, 2018. |
| | Investing for the long runTM | 37 | |
| Managed Programs Fee Summary | |
| Managed Programs | |||||||||||||||||||||||
| CPA:17 – Global | CPA:18 – Global | CWI 1 | CWI 2 | CESH I (a) | Total | ||||||||||||||||||
| Year established | 2007 | 2013 | 2010 | 2015 | 2016 | ||||||||||||||||||
| Fundraising status | Closed | Closed | Closed | Closed | Closed | ||||||||||||||||||
1. Structuring Fees | |||||||||||||||||||||||
| Structuring fee, gross (% of total aggregate cost) | 4.50% (b) | 4.50% (b) | 2.50% | 2.50% | 2.00% | ||||||||||||||||||
Net of subadvisor fees (c) | 4.50% | 4.50% | 2.00% | 1.875% | 2.00% | ||||||||||||||||||
| Gross acquisition volume – second quarter | $ | — | $ | 94,745 | $ | — | $ | — | $ | — | $ | 94,745 | |||||||||||
Structuring revenue – second quarter (d) | $ | — | $ | 4,163 | $ | 263 | $ | — | $ | — | $ | 4,426 | |||||||||||
| 2. Asset Management Fees | |||||||||||||||||||||||
| Asset management fee, gross (% of average AUM, per annum) | 0.50% (e) | 0.50% (e) | 0.50% (e) | 0.55% (e) | 1.00% (f) | ||||||||||||||||||
Net of subadvisor fees (c) | 0.50% | 0.50% | 0.40% | 0.41% | 1.00% | ||||||||||||||||||
| AUM – current quarter | $ | 5,808,434 | $ | 2,549,589 | $ | 2,893,645 | $ | 1,959,683 | $ | 213,993 | $ | 13,425,344 | |||||||||||
| AUM – prior quarter | $ | 5,806,328 | $ | 2,475,417 | $ | 2,896,851 | $ | 1,957,502 | $ | 201,943 | $ | 13,338,041 | |||||||||||
| Average AUM | $ | 5,807,381 | $ | 2,512,503 | $ | 2,895,248 | $ | 1,958,593 | $ | 207,968 | $ | 13,381,693 | |||||||||||
Asset management revenue – second quarter (g) | $ | 7,493 | $ | 3,151 | $ | 3,534 | $ | 2,607 | $ | 483 | $ | 17,268 | |||||||||||
3. Operating Partnership Interests (h) | |||||||||||||||||||||||
| Operating partnership interests, gross (% of Available Cash) | 10.00% | 10.00% | 10.00% | 10.00% | N/A | ||||||||||||||||||
Net of subadvisor fees (c) | 10.00% | 10.00% | 8.00% | 7.50% | N/A | ||||||||||||||||||
Equity in earnings of equity method investments in the Managed Programs and real estate (profits interest) – second quarter (i) | $ | 5,185 | $ | 2,830 | $ | — | $ | 571 | N/A | $ | 8,586 | ||||||||||||
| (a) | In addition to the fees shown, we may also receive distributions from CESH I upon liquidation of the fund in an amount potentially equal to 20% of available cash after the limited partners have received certain cumulative distributions. |
| (b) | Comprised of an initial acquisition fee (generally 2.50% of the total aggregate cost of net-leased properties) paid when the transaction is completed and a subordinated acquisition fee (generally 2.00% of the total aggregate cost of net-leased properties) paid in annual installments over three years, provided certain performance criterion are met. The acquisition fee for other properties is generally 1.75% of the total aggregate cost. |
| (c) | We earn investment management revenue from CWI 1 and CWI 2 in our role as their advisor. Pursuant to the terms of their subadvisory agreements, however, 20% of the fees we receive from CWI 1 and 25% of the fees we receive from CWI 2 are paid to their respective subadvisors. In connection with the acquisitions of multi-family properties on behalf of CPA:18 – Global, we entered into agreements with third-party advisors for the day-to-day management of the properties for which we pay 100% of asset management fees paid to us by CPA:18 – Global. |
| (d) | Amounts for CWI 1 and CWI 2 are gross of fees paid to their respective subadvisors. Amount for CWI 1 is related to a mortgage loan refinancing. |
| (e) | Based on average market value of assets. Under the terms of the respective advisory agreements of the Managed REITs, we may elect to receive cash or shares of CWI 1 and CWI 2’s stock for asset management fees due, while the CPA REITs have an option to pay asset management fees in cash or shares upon our recommendation. Asset management fees are recorded in Asset management revenue in our consolidated financial statements. |
| (f) | Based on gross assets at fair value. |
| (g) | Amounts for CWI 1 and CWI 2 are gross of fees paid to their respective subadvisors. |
| (h) | Available Cash means cash generated by operating partnership operations and investments, excluding cash from sales and refinancings, after the payment of debt service and other operating expenses, but before distributions to partners. Amounts are recorded in Equity in earnings of equity method investments in the Managed Programs and real estate in our consolidated financial statements. |
| (i) | Amounts for CWI 1 and CWI 2 are net of fees paid to their respective subadvisors. |
| | Investing for the long runTM | 38 | |
| Investment Activity – Managed Programs | |
| Acquisitions | Gross Investment Amount | Gross Square Footage | ||||||||||||||||
| Fund | Tenant / Operator | Property Location(s) | Closing Date | Property Type(s) | Ownership | |||||||||||||
| 1Q18 | ||||||||||||||||||
CPA:18 – Global (a) (b) | Collegiate AC | Barcelona, Spain | $ | 28,473 | Mar-18 | Student Housing | 112,980 | 98.7 | % | |||||||||
| 1Q18 Total | 28,473 | 112,980 | ||||||||||||||||
| 2Q18 | ||||||||||||||||||
CPA:18 – Global (a) (b) | Temprano Capital Partners | Coimbra, Portugal | 26,326 | Jun-18 | Student Housing | 135,076 | 98.5 | % | ||||||||||
CPA:18 – Global (a) (b) | Collegiate AC | San Sebastian, Spain | 36,733 | Jun-18 | Student Housing | 126,075 | 100.0 | % | ||||||||||
CPA:18 – Global (a) (b) | Pallars | Barcelona, Spain | 31,686 | Jun-18 | Student Housing | 77,504 | 100.0 | % | ||||||||||
| 2Q18 Total | 94,745 | 338,655 | ||||||||||||||||
| Year-to-Date Total Acquisitions | $ | 123,218 | 451,635 | |||||||||||||||
| Dispositions | Gross Square Footage | |||||||||||||||||
| Portfolio(s) | Tenant / Operator | Property Location(s) | Gross Sale Price | Closing Date | Property Type(s) | Ownership | ||||||||||||
| 1Q18 | ||||||||||||||||||
| CWI 1 | Marriott | Boca Raton, FL | $ | 76,000 | Jan-18 | Hotel | 167,056 | 100.0 | % | |||||||||
| CWI 1 (2 properties) | Hilton | Atlanta, GA and Memphis, TN | 63,000 | Feb-18 | Hotel | 164,050 | 100.0 | % | ||||||||||
| 1Q18 Total | 139,000 | 331,106 | ||||||||||||||||
| 2Q18 (N/A) | ||||||||||||||||||
| Year-to-Date Total Dispositions | $ | 139,000 | 331,106 | |||||||||||||||
| (a) | Amount reflects the applicable exchange rate on the date of the transaction. |
| (b) | Acquisition includes a build-to-suit transaction. Gross investment amount represents total commitment for build-to-suit funding. |
| | Investing for the long runTM | 39 | |
| Summary of Future Liquidity Strategies for Managed Programs | |
General Liquidation Guideline (a) | ||||||||
CPA:17 – Global (b) | CPA:18 – Global | CWI 1 | CWI 2 | CESH I | ||||
| 8 to 12 years following investment of substantially all proceeds from the initial public offering in 2011 | Beginning after the seventh anniversary of the closing of the initial public offering in 2015 | Beginning six years following the termination of the initial public offering in 2013 | Beginning six years following the termination of the initial public offering in 2017 | Beginning five years after raising the minimum offering amount in 2016 | ||||
| (a) | Based on general liquidation guidelines set forth in the respective prospectuses; ultimately, liquidation is approved by the independent directors of each program (except for CESH I, which is determined by its General Partner). |
| (b) | On June 17, 2018, we announced that our board of directors had unanimously approved a definitive merger agreement pursuant to which CPA:17 – Global will merge with and into a subsidiary of ours in a stock for-stock transaction valued at approximately $6 billion. The transaction has also been approved by CPA:17 – Global’s board of directors upon the unanimous recommendation and approval of a Special Committee consisting of CPA:17 – Global’s independent directors. The Proposed Merger and related transactions are subject to the satisfaction of a number of closing conditions, including approvals by our stockholders and the stockholders of CPA:17 – Global. If these approvals are obtained and the other closing conditions are met, we currently expect the transaction to close at or around December 31, 2018, although there can be no assurance that the transaction will occur at such time or at all. |
| | Investing for the long runTM | 40 | |
| Summary of Back-End Fees for / Interests in the Managed Programs | |
| Back-End Fees and Interests | |||||||||
CPA:17 – Global (a) | CPA:18 – Global | CWI 1 | CWI 2 | CESH I | |||||
| Disposition Fees | Net leased properties — equal to the lesser of (i) 50% of the brokerage commission paid or (ii) 3% of the contract sales price of a property. Investments in B Notes, C Notes, mortgage-backed securities and real estate-related loans — 1% of the average equity value. | Investments other than those described below — equal to the lesser of (i) 50% of the brokerage commission paid or (ii) 3% of the contract sales price of a property. Readily marketable real estate securities — none. | Equal to the lesser of: (i) 50% of the competitive real estate commission and (ii) 1.5% of the contract sales price of a property. | Equal to the lesser of: (i) 50% of the competitive real estate commission and (ii) 1.5% of the contract sales price of a property. | N/A | ||||
| Interest in Disposition Proceeds | Special general partner interest entitled to receive distributions of up to 15% of the net proceeds from the sale, exchange or other disposition of operating partnership assets remaining after the corporation has received a return of 100% of its initial investment in the operating partnership, through certain liquidity events or distributions, plus the 6% preferred return rate. | Special general partner interest entitled to receive distributions of up to 15% of the net proceeds from the sale, exchange or other disposition of operating partnership assets remaining after the corporation has received a return of 100% of its initial investment in the operating partnership, through certain liquidity events or distributions, plus the 6% preferred return rate. | Special general partner interest receives up to 15% of the net proceeds from the sale, exchange or other disposition of operating partnership assets remaining after the corporation has received a return of 100% of its initial investment in the operating partnership (through certain liquidity transactions or distributions) plus the six percent preferred return rate. A listing will not trigger the payment of this distribution. | Special general partner interest receives up to 15% of the net proceeds from the sale, exchange or other disposition of operating partnership assets remaining after the corporation has received a return of 100% of its initial investment in the operating partnership (through certain liquidity transactions or distributions) plus the six percent preferred return rate. A listing will not trigger the payment of this distribution. | Available Cash (as defined in In “Principal Terms”), subject to any other limitations provided for herein, will be initially apportioned among the Limited Partners in proportion to their respective capital contributions and the General Partner as provided in connection with its Carried Interest and distributed. (b) | ||||
| Purchase of Special GP Interest | Lesser of (i) 5.0x the distributions of the last completed fiscal year and (ii) the discounted value of expected future distributions from point of valuation to April 2021, using a discount rate used by the independent third-party valuation firm to determine the most recent appraisal. | Lesser of (i) 5.0x the distributions of the last completed fiscal year and (ii) the discounted value of expected future distributions from point of valuation to March 2025 using a discount rate used by the independent third-party valuation firm to determine the most recent appraisal. | Fair market value as determined by Appraisal. | Fair market value as determined by Appraisal. | N/A | ||||
| Distribution Related to Ownership of Shares | 4.6% ownership as of 6/30/2018 | 3.0% ownership as of 6/30/2018 | 2.6% ownership as of 6/30/2018 | 2.3% ownership as of 6/30/2018 | 2.4% ownership as of 6/30/2018 | ||||
| (a) | On June 17, 2018, we announced that our board of directors had unanimously approved a definitive merger agreement pursuant to which CPA:17 – Global will merge with and into a subsidiary of ours in a stock for-stock transaction valued at approximately $6 billion. The transaction has also been approved by CPA:17 – Global’s board of directors upon the unanimous recommendation and approval of a Special Committee consisting of CPA:17 – Global’s independent directors. The Proposed Merger and related transactions are subject to the satisfaction of a number of closing conditions, including approvals by our stockholders and the stockholders of CPA:17 – Global. If these approvals are obtained and the other closing conditions are met, we currently expect the transaction to close at or around December 31, 2018, although there can be no assurance that the transaction will occur at such time or at all. |
| (b) | Order of distributions are as follows: (1) First, to a Limited Partner until it has received an amount equal to its total capital contributions or deemed capital contribution with respect to the Advisor Units in the case of the Advisor (or a wholly owned subsidiary of the Advisor); (2) Second, to a Limited Partner until such Limited Partner has received a cumulative, non-compounding, annual 10% return on its unreturned capital contributions (the “Preferred Return”); (3) Third, to the General Partner until the General Partner has received 20% of the aggregate amounts distributed pursuant to clause (2) and this clause (3); (4) Thereafter, 80% to such Limited Partner and 20% to the General Partner (together with the amounts received under clause (3), the General Partner’s “Carried Interest”). The Advisor’s capital contribution for purposes of the Partnership Agreement will be deemed to be the value of the Advisor Units upon their issuance. |
| | Investing for the long runTM | 41 | |
| | Investing for the long runTM | 42 | |
| Normalized Pro Rata Cash NOI | |
| Three Months Ended Jun. 30, 2018 | |||
| Consolidated Lease Revenues | |||
| Total lease revenues – as reported | $ | 162,634 | |
| Less: Consolidated Non-Reimbursable Property Expenses | |||
| Non-reimbursable property expenses – as reported | 5,327 | ||
| 157,307 | |||
| Plus: NOI from Operating Properties | |||
| Hotel revenues | 4,865 | ||
| Hotel expenses | (3,581 | ) | |
| 1,284 | |||
| 158,591 | |||
| Adjustments for Pro Rata Ownership of Real Estate Joint Ventures: | |||
| Add: Pro rata share of NOI from equity investments | 4,702 | ||
| Less: Pro rata share of NOI attributable to noncontrolling interests | (5,997 | ) | |
| (1,295 | ) | ||
| 157,296 | |||
| Adjustments for Pro Rata Non-Cash Items: | |||
| Add: Above- and below-market rent intangible lease amortization | 11,746 | ||
| Less: Straight-line rent amortization | (2,635 | ) | |
| Add: Other non-cash items | 303 | ||
| 9,414 | |||
Pro Rata Cash NOI (a) | 166,710 | ||
Adjustment to normalize for intra-period acquisitions, completed capital investment projects and dispositions (b) | 3,021 | ||
Normalized Pro Rata Cash NOI (a) | $ | 169,731 | |
| | Investing for the long runTM | 43 | |
| Three Months Ended Jun. 30, 2018 | |||
| Net Income from Owned Real Estate Attributable to W. P. Carey | |||
| Net income from Owned Real Estate attributable to W. P. Carey – as reported | $ | 59,316 | |
| Adjustments for Consolidated Operating Expenses | |||
| Add: Operating expenses – as reported | 93,296 | ||
| Less: Property expenses, excluding reimbursable tenant costs – as reported | (8,908 | ) | |
| 84,388 | |||
| Adjustments for Other Consolidated Revenues and Expenses: | |||
| Less: Lease termination income and other | (680 | ) | |
| Less: Reimbursable property expenses – as reported | (5,733 | ) | |
| Add: Other income and (expenses) | 28,152 | ||
| Add: Provision for income taxes | 1,317 | ||
| Less: Gain on sale of real estate | (11,912 | ) | |
| 11,144 | |||
| Other Adjustments: | |||
| Add: Above- and below-market rent intangible lease amortization | 12,303 | ||
Adjustment to normalize for intra-period acquisitions, completed capital investment projects and dispositions (b) | 3,021 | ||
| Less: Straight-line rent amortization | (2,650 | ) | |
| Add: Adjustments for pro rata ownership | 2,081 | ||
| Add: Property expenses, excluding reimbursable tenant costs, non-cash | 128 | ||
| 14,883 | |||
Normalized Pro Rata Cash NOI (a) | $ | 169,731 | |
| (a) | Pro rata cash NOI and normalized pro rata cash NOI are non-GAAP measures. See the Terms and Definitions section that follows for a description of our non-GAAP measures and for details on how pro rata cash NOI and normalized pro rata cash NOI are calculated. |
| (b) | For properties acquired and capital investment projects completed during the three months ended June 30, 2018, the adjustment modifies our pro rata share of cash NOI for the partial period with an amount estimated to be equivalent to the additional pro rata share of cash NOI necessary to reflect ownership for the full quarter. For properties disposed of during the three months ended June 30, 2018, the adjustment eliminates our pro rata share of cash NOI for the period. |
| | Investing for the long runTM | 44 | |
| Adjusted EBITDA, Consolidated – Last Five Quarters | |
| Three Months Ended | |||||||||||||||||||
| Jun. 30, 2018 | Mar. 31, 2018 | Dec. 31, 2017 | Sep. 30, 2017 | Jun. 30, 2017 | |||||||||||||||
| Net income | $ | 79,424 | $ | 68,066 | $ | 74,473 | $ | 83,654 | $ | 67,131 | |||||||||
| �� | |||||||||||||||||||
| Adjustments to Derive Consolidated EBITDA | |||||||||||||||||||
| Depreciation and amortization | 64,337 | 65,957 | 64,015 | 64,040 | 62,849 | ||||||||||||||
| Interest expense | 41,311 | 38,074 | 40,401 | 41,182 | 42,235 | ||||||||||||||
| Provision for (benefit from) income taxes | 6,262 | (6,002 | ) | (192 | ) | 1,760 | 2,448 | ||||||||||||
Consolidated EBITDA (a) | 191,334 | 166,095 | 178,697 | 190,636 | 174,663 | ||||||||||||||
| Adjustments to Derive Adjusted EBITDA | |||||||||||||||||||
| Adjustments for Non-Cash Items: | |||||||||||||||||||
Above- and below-market rent intangible and straight-line rent adjustments (b) (c) | 9,653 | 9,507 | 15,920 | 9,247 | 9,186 | ||||||||||||||
Unrealized (gains) losses and other (d) | (8,741 | ) | 4,557 | 2,495 | 7,382 | 7,226 | |||||||||||||
| Stock-based compensation expense | 3,698 | 8,219 | 4,268 | 4,635 | 3,104 | ||||||||||||||
| Impairment charges | — | 4,790 | 2,769 | — | — | ||||||||||||||
| 4,610 | 27,073 | 25,452 | 21,264 | 19,516 | |||||||||||||||
Adjustments for Non-Core Items: (e) | |||||||||||||||||||
| Gain on sale of real estate, net | (11,912 | ) | (6,732 | ) | (11,146 | ) | (19,257 | ) | (3,465 | ) | |||||||||
Merger and other expenses (f) | 2,692 | (37 | ) | (533 | ) | 65 | 1,000 | ||||||||||||
| Loss (gain) on extinguishment of debt | — | 1,609 | (81 | ) | 1,566 | (2,443 | ) | ||||||||||||
Restructuring and other compensation (g) | — | — | 289 | 1,356 | 7,718 | ||||||||||||||
| Other | 1,973 | (1,081 | ) | (595 | ) | (1,553 | ) | (536 | ) | ||||||||||
| (7,247 | ) | (6,241 | ) | (12,066 | ) | (17,823 | ) | 2,274 | |||||||||||
| Adjustments for Pro Rata Ownership | |||||||||||||||||||
| Real Estate Joint Ventures: | |||||||||||||||||||
| Add: Pro rata share of adjustments for equity investments | 1,436 | 1,661 | 1,450 | 1,307 | 1,242 | ||||||||||||||
| Less: Pro rata share of adjustments for amounts attributable to noncontrolling interests | (6,569 | ) | (6,784 | ) | (6,801 | ) | (6,866 | ) | (6,433 | ) | |||||||||
| (5,133 | ) | (5,123 | ) | (5,351 | ) | (5,559 | ) | (5,191 | ) | ||||||||||
Equity Investments in the Managed Programs: (h) | |||||||||||||||||||
| Add: Distributions received from equity investments in the Managed Programs | 3,837 | 3,582 | 3,273 | 3,417 | 2,981 | ||||||||||||||
Less: Income from equity investments in the Managed Programs | (253 | ) | (1,464 | ) | (101 | ) | (531 | ) | (1,279 | ) | |||||||||
| 3,584 | 2,118 | 3,172 | 2,886 | 1,702 | |||||||||||||||
Adjusted EBITDA (a) | $ | 187,148 | $ | 183,922 | $ | 189,904 | $ | 191,404 | $ | 192,964 | |||||||||
| (a) | EBITDA and adjusted EBITDA are non-GAAP measures. See the Terms and Definitions section that follows for a description of our non-GAAP measures. |
| (b) | Straight-line rent adjustments relate to our net-leased properties subject to operating leases. |
| (c) | Amount for the three months ended December 31, 2017 includes an adjustment of $5.7 million related to the accelerated amortization of an above-market rent intangible in connection with a lease restructuring. |
| (d) | Comprised of unrealized gains and losses on derivatives, unrealized gains and losses on foreign currency and straight-line rent adjustments for office rent expenses. |
| (e) | Comprised of items that we do not consider to be part of our core operating business plan or representative of our overall long-term operating performance, based on a number of factors, including the nature of the item and/or the frequency with which it occurs. We believe that these adjustments provide a more representative view of EBITDA from our core operating business and allow for more meaningful comparisons. |
| (f) | Amount for the three months ended June 30, 2018 is primarily comprised of costs incurred in connection with the Proposed Merger. Amount for the three months ended June 30, 2017 is comprised of an accrual for estimated one-time legal settlement expenses. |
| (g) | Amounts for the three months ended December 31, 2017, September 30, 2017 and June 30, 2017 represent restructuring expenses resulting from our exit from non-traded retail fundraising activities, which we announced in June 2017. |
| (h) | Adjustments to include cash distributions received from the Managed Programs in place of our pro rata share of net income from our ownership in the Managed Programs. |
| | Investing for the long runTM | 45 | |
| Adjusted EBITDA, Owned Real Estate – Last Five Quarters | |
| Three Months Ended | |||||||||||||||||||
| Jun. 30, 2018 | Mar. 31, 2018 | Dec. 31, 2017 | Sep. 30, 2017 | Jun. 30, 2017 | |||||||||||||||
| Net income from Owned Real Estate | $ | 63,059 | $ | 48,092 | $ | 53,413 | $ | 59,868 | $ | 46,353 | |||||||||
| Adjustments to Derive Consolidated EBITDA | |||||||||||||||||||
| Depreciation and amortization | 63,374 | 64,920 | 62,951 | 62,970 | 61,989 | ||||||||||||||
| Interest expense | 41,311 | 38,074 | 40,401 | 41,182 | 42,235 | ||||||||||||||
| Provision for (benefit from) income taxes | 1,317 | (3,533 | ) | (4,953 | ) | 1,511 | 3,731 | ||||||||||||
Consolidated EBITDA – Owned Real Estate (a) | 169,061 | 147,553 | 151,812 | 165,531 | 154,308 | ||||||||||||||
| Adjustments to Derive Adjusted EBITDA | |||||||||||||||||||
| Adjustments for Non-Cash Items: | |||||||||||||||||||
Above- and below-market rent intangible and straight-line rent adjustments (b) (c) | 9,653 | 9,507 | 15,920 | 9,247 | 9,186 | ||||||||||||||
Unrealized (gains) losses and other (d) | (8,789 | ) | 4,826 | 2,715 | 8,014 | 7,685 | |||||||||||||
| Stock-based compensation expense | 1,990 | 4,306 | 2,227 | 1,880 | 899 | ||||||||||||||
| Impairment charges | — | 4,790 | 2,769 | — | — | ||||||||||||||
| 2,854 | 23,429 | 23,631 | 19,141 | 17,770 | |||||||||||||||
Adjustments for Non-Core Items: (e) | |||||||||||||||||||
| Gain on sale of real estate, net | (11,912 | ) | (6,732 | ) | (11,146 | ) | (19,257 | ) | (3,465 | ) | |||||||||
Merger and other expenses (f) | 2,692 | (37 | ) | (533 | ) | 65 | 1,000 | ||||||||||||
| Loss (gain) on extinguishment of debt | — | 1,609 | (81 | ) | 1,566 | (2,443 | ) | ||||||||||||
| Other | 1,979 | (1,545 | ) | (588 | ) | (1,535 | ) | (653 | ) | ||||||||||
| (7,241 | ) | (6,705 | ) | (12,348 | ) | (19,161 | ) | (5,561 | ) | ||||||||||
| Adjustments for Pro Rata Ownership | |||||||||||||||||||
| Real Estate Joint Ventures: | |||||||||||||||||||
| Add: Pro rata share of adjustments for equity investments | 1,436 | 1,661 | 1,450 | 1,307 | 1,242 | ||||||||||||||
| Less: Pro rata share of adjustments for amounts attributable to noncontrolling interests | (6,569 | ) | (6,784 | ) | (6,801 | ) | (6,866 | ) | (6,433 | ) | |||||||||
| (5,133 | ) | (5,123 | ) | (5,351 | ) | (5,559 | ) | (5,191 | ) | ||||||||||
Adjusted EBITDA – Owned Real Estate (a) | $ | 159,541 | $ | 159,154 | $ | 157,744 | $ | 159,952 | $ | 161,326 | |||||||||
| (a) | EBITDA and adjusted EBITDA are non-GAAP measures. See the Terms and Definitions section that follows for a description of our non-GAAP measures. |
| (b) | Straight-line rent adjustments relate to our net-leased properties subject to operating leases. |
| (c) | Amount for the three months ended December 31, 2017 includes an adjustment of $5.7 million related to the accelerated amortization of an above-market rent intangible in connection with a lease restructuring. |
| (d) | Comprised of unrealized gains and losses on derivatives and unrealized gains and losses on foreign currency. |
| (e) | Comprised of items that we do not consider to be part of our core operating business plan or representative of our overall long-term operating performance, based on a number of factors, including the nature of the item and/or the frequency with which it occurs. We believe that these adjustments provide a more representative view of EBITDA from our core operating business and allow for more meaningful comparisons. |
| (f) | Amount for the three months ended June 30, 2018 is primarily comprised of costs incurred in connection with the Proposed Merger. Amount for the three months ended June 30, 2017 is comprised of an accrual for estimated one-time legal settlement expenses. |
| | Investing for the long runTM | 46 | |
| Adjusted EBITDA, Investment Management – Last Five Quarters | |
| Three Months Ended | |||||||||||||||||||
| Jun. 30, 2018 | Mar. 31, 2018 | Dec. 31, 2017 | Sep. 30, 2017 | Jun. 30, 2017 | |||||||||||||||
| Net income from Investment Management | $ | 16,365 | $ | 19,974 | $ | 21,060 | $ | 23,786 | $ | 20,778 | |||||||||
| Adjustments to Derive Consolidated EBITDA | |||||||||||||||||||
| Provision for (benefit from) income taxes | 4,945 | (2,469 | ) | 4,761 | 249 | (1,283 | ) | ||||||||||||
| Depreciation and amortization | 963 | 1,037 | 1,064 | 1,070 | 860 | ||||||||||||||
Consolidated EBITDA – Investment Management (a) | 22,273 | 18,542 | 26,885 | 25,105 | 20,355 | ||||||||||||||
| Adjustments to Derive Adjusted EBITDA | |||||||||||||||||||
| Adjustments for Non-Cash Items: | |||||||||||||||||||
| Stock-based compensation expense | 1,708 | 3,913 | 2,041 | 2,755 | 2,205 | ||||||||||||||
Unrealized losses (gains) and other (b) | 48 | (269 | ) | (220 | ) | (632 | ) | (459 | ) | ||||||||||
| 1,756 | 3,644 | 1,821 | 2,123 | 1,746 | |||||||||||||||
Adjustments for Non-Core Items: (c) | |||||||||||||||||||
Restructuring and other compensation (d) | — | — | 289 | 1,356 | 7,718 | ||||||||||||||
| Other | (6 | ) | 464 | (7 | ) | (18 | ) | 117 | |||||||||||
| (6 | ) | 464 | 282 | 1,338 | 7,835 | ||||||||||||||
| Adjustments for Pro Rata Ownership | |||||||||||||||||||
Equity Investments in the Managed Programs: (e) | |||||||||||||||||||
| Add: Distributions received from equity investments in the Managed Programs | 3,837 | 3,582 | 3,273 | 3,417 | 2,981 | ||||||||||||||
| Less: Income from equity investments in the Managed Programs | (253 | ) | (1,464 | ) | (101 | ) | (531 | ) | (1,279 | ) | |||||||||
| 3,584 | 2,118 | 3,172 | 2,886 | 1,702 | |||||||||||||||
Adjusted EBITDA – Investment Management (a) | $ | 27,607 | $ | 24,768 | $ | 32,160 | $ | 31,452 | $ | 31,638 | |||||||||
| (a) | EBITDA and adjusted EBITDA are non-GAAP measures. See the Terms and Definitions section that follows for a description of our non-GAAP measures. |
| (b) | Comprised of unrealized gains and losses on foreign currency and straight-line rent adjustments for office rent expenses. |
| (c) | Comprised of items that we do not consider to be part of our core operating business plan or representative of our overall long-term operating performance, based on a number of factors, including the nature of the item and/or the frequency with which it occurs. We believe that these adjustments provide a more representative view of EBITDA from our core operating business and allow for more meaningful comparisons. |
| (d) | Amounts for the three months ended December 31, 2017, September 30, 2017 and June 30, 2017 represent restructuring expenses resulting from our previously announced exit from non-traded retail fundraising activities. |
| (e) | Adjustments to include cash distributions received from the Managed Programs in place of our pro rata share of net income from our ownership in the Managed Programs. |
| | Investing for the long runTM | 47 | |
| Terms and Definitions | |
| | Investing for the long runTM | 48 | |
| | Investing for the long runTM | 49 | |