Exhibit 13.1

THE BANK OF NEW YORK MELLON CORPORATION
2007 Annual Report  Financial Section
THE BANK OF NEW YORK MELLON CORPORATION
2007 ANNUAL REPORT
FINANCIAL SECTION
TABLE OF CONTENTS
Introduction
On July 1, 2007, The Bank of New York Company, Inc. (“The Bank of New York”) and Mellon Financial Corporation (“Mellon”) merged into The Bank of New York Mellon Corporation (“The Bank of New York Mellon” or “BNY Mellon”), with BNY Mellon being the surviving entity. For accounting and financial reporting purposes the merger was accounted for as a purchase of Mellon for a value of $17 billion. The Bank of New York Mellon’s financial results for 2007 include six months of the combined company’s results and six months of legacy The Bank of New York only. Financial results for periods prior to 2007 reflect legacy The Bank of New York only.
The merger transaction resulted in The Bank of New York shareholders receiving .9434 shares of The Bank of New York Mellon common stock for each share of The Bank of New York common stock outstanding at the closing date of the merger. All legacy The Bank of New York earnings per share and common stock outstanding amounts in this Annual Report have been restated to reflect this exchange ratio. See page 62 for additional information.
We expect to realize annual expense synergies of $700 million by 2010 and our targeted run rate for revenue synergies is $250-$400 million by 2011. Merger and integration costs to combine the operations of The Bank of New York and Mellon were approximately $550 million in 2007 with
approximately $355 million recognized as expense and $195 million recorded as goodwill. Total merger and integration costs are currently expected to be approximately $1.325 billion.
The Bank of New York Mellon is a leading provider of financial services for institutions, corporations and high-net-worth individuals, providing superior asset and wealth management, asset servicing, issuer services, clearing and execution services, and treasury services through a worldwide client-focused team. We have more than $23 trillion in assets under custody and administration, more than $1.1 trillion in assets under management and service $11 trillion in outstanding debt.
Throughout this Annual Report, certain measures, which are noted, exclude certain items. We believe the presentation of this information enhances investor understanding of period-to-period results. In addition, they reflect the principal basis on which our management monitors financial performance.
In this Annual Report, references to “our,” “we,” “us,” the “company,” the “Company,” the “Corporation” and similar terms for periods prior to July 1, 2007 refer to The Bank of New York Company, Inc., and references to “our,” “we,” “us,” the “Company,” the “Corporation” and similar terms for periods on or after July 1, 2007 refer to BNY Mellon.
2 The Bank of New York Mellon Corporation
FINANCIAL SUMMARY
| | | | | | | | | | | | | | | | | | | | |
| The Bank of New York Mellon Corporation(and its subsidiaries) | | | | | | | | | | | | | | | |
| | | | | | Legacy The Bank of New York only | |
(dollar amounts in millions, except per share amounts or unless otherwise noted) | | 2007(a) | | | 2006(b) | | | 2005 | | | 2004 | | | 2003 | |
| Year ended Dec. 31 | | | | | | | | | | | | | | | | | | | | |
| | | | | |
Fee and other revenue | | $ | 9,031 | | | $ | 5,339 | | | $ | 4,715 | | | $ | 4,394 | | | $ | 3,737 | |
Net interest revenue | | | 2,300 | | | | 1,499 | | | | 1,340 | | | | 1,157 | | | | 1,143 | |
Total revenue | | | 11,331 | | | | 6,838 | | | | 6,055 | | | | 5,551 | | | | 4,880 | |
Provision for credit losses | | | (10 | ) | | | (20 | ) | | | (7 | ) | | | (4 | ) | | | 132 | |
Merger and integration expense | | | 404 | | | | 106 | | | | - | | | | - | | | | 96 | |
Noninterest expense excluding merger and integration expense | | | 7,712 | | | | 4,582 | | | | 4,084 | | | | 3,715 | | | | 3,222 | |
Income from continuing operations before income taxes | | | 3,225 | | | | 2,170 | | | | 1,978 | | | | 1,840 | | | | 1,430 | |
Income taxes | | | 998 | | | | 694 | | | | 635 | | | | 587 | | | | 458 | |
Income from continuing operations | | | 2,227 | | | | 1,476 | | | | 1,343 | | | | 1,253 | | | | 972 | |
Income from discontinued operations, net of tax | | | (8 | ) | | | 1,371 | | | | 228 | | | | 187 | | | | 185 | |
Income before extraordinary (loss) | | | 2,219 | | | | 2,847 | | | | 1,571 | | | | 1,440 | | | | 1,157 | |
Extraordinary (loss) on consolidation of commercial paper conduit, net of tax | | | (180 | ) | | | - | | | | - | | | | - | | | | - | |
Net Income | | $ | 2,039 | | | $ | 2,847 | | | $ | 1,571 | | | $ | 1,440 | | | $ | 1,157 | |
Per common share – diluted (c): | | | | | | | | | | | | | | | | | | | | |
Income from continuing operations excluding merger and integration expense | | $ | 2.64 | | | $ | 2.14 | | | $ | 1.84 | | | $ | 1.71 | | | $ | 1.45 | |
Income from continuing operations | | | 2.38 | | | | 2.04 | | | | 1.84 | | | | 1.71 | | | | 1.36 | |
Income (loss) from discontinued operations, net of tax | | | (.01 | ) | | | 1.90 | | | | .31 | | | | .25 | | | | .26 | |
Income before extraordinary (loss) | | | 2.37 | | | | 3.94 | | | | 2.16 | (d) | | | 1.96 | | | | 1.62 | |
Extraordinary (loss), net of tax | | | (.19 | ) | | | - | | | | - | | | | - | | | | - | |
Net income | | $ | 2.18 | | | $ | 3.94 | | | $ | 2.16 | | | $ | 1.96 | | | $ | 1.62 | |
Selected data | | | | | | | | | | | | | | | | | | | | |
| | | | | |
Return on tangible common shareholders’ equity | | | 39.06 | % | | | 56.08 | % | | | 31.13 | % | | | 31.46 | % | | | 31.90 | % |
Return on tangible common shareholders’ equity excluding merger and integration expense | | | 43.21 | | | | 57.47 | | | | 31.13 | | | | 31.46 | | | | 33.68 | |
Return on common shareholders’ equity | | | 10.08 | | | | 27.56 | | | | 16.59 | | | | 16.37 | | | | 15.12 | |
Return on common shareholders’ equity excluding merger and integration expense | | | 11.25 | | | | 28.25 | | | | 16.59 | | | | 16.37 | | | | 15.97 | |
Return on assets | | | 1.37 | | | | 2.67 | | | | 1.55 | | | | 1.45 | | | | 1.27 | |
Return on assets excluding merger and integration expense | | | 1.53 | | | | 2.73 | | | | 1.55 | | | | 1.45 | | | | 1.34 | |
Pre-tax operating margin (FTE) (continuing operations) | | | 29 | | | | 32 | | | | 33 | | | | 33 | | | | 30 | |
Pre-tax operating margin (FTE) excluding merger and integration expense and intangible amortization expense (continuing operations) | | | 35 | | | | 35 | | | | 34 | | | | 34 | | | | 32 | |
Average common equity to average assets | | | 13.61 | | | | 9.67 | | | | 9.34 | | | | 8.86 | | | | 8.37 | |
Fee and other revenue as a percent of total revenue (FTE) | | | 80 | % | | | 78 | % | | | 78 | % | | | 79 | % | | | 76 | % |
Annualized fee and other revenue per employee(in thousands)(based on average headcount) | | $ | 283 | | | $ | 262 | | | $ | 240 | | | $ | 229 | | | $ | 220 | |
Non-U.S. percent of revenue (FTE) | | | 32 | % | | | 30 | % | | | 30 | % | | | 30 | % | | | 25 | % |
Net interest margin (FTE) (continuing operations) | | | 2.08 | | | | 2.01 | | | | 2.02 | | | | 1.79 | | | | 1.97 | |
Cash dividends per share (c) | | $ | 0.95 | | | $ | 0.91 | | | $ | 0.87 | | | $ | 0.84 | | | $ | 0.81 | |
Common dividend payout ratio | | | 43.58 | % | | | 23.10 | % | | | 40.28 | % | | | 42.86 | % | | | 50.00 | % |
Dividend yield | | | 1.9 | | | | 2.2 | | | | 2.6 | | | | 2.4 | | | | 2.3 | |
Closing common stock price (c) | | $ | 48.76 | | | $ | 41.73 | | | $ | 33.76 | | | $ | 35.43 | | | $ | 35.11 | |
Market capitalization(in billions) | | | 55.9 | | | | 29.8 | | | | 24.6 | | | | 26.0 | | | | 25.7 | |
Book value per common share(c) | | | 25.66 | | | | 16.03 | | | | 13.57 | | | | 12.66 | | | | 11.52 | |
Employees (continuing operations) | | | 42,100 | | | | 22,400 | | | | 19,900 | | | | 19,600 | | | | 18,700 | |
Common shares outstanding(in thousands) (c) | | | 1,145,983 | | | | 713,079 | | | | 727,483 | | | | 734,079 | | | | 731,316 | |
Assets under management (in billions) | | $ | 1,121 | | | $ | 142 | | | $ | 115 | | | $ | 111 | | | $ | 95 | |
Assets under custody (in trillions) | | | 23.1 | | | | 15.5 | | | | 11.4 | | | | 10.0 | | | | 8.6 | |
Cross-border assets(in trillions) | | | 10.0 | | | | 6.3 | | | | 3.4 | | | | 2.7 | | | | 2.3 | |
Market value of securities on loan(in billions) | | | 633 | | | | 399 | | | | 311 | | | | 232 | | | | 174 | |
| | | | | |
| Capital ratios at Dec. 31 | | | | | | | | | | | | | | | | | | | | |
Tier I capital ratio (e) | | | 9.32 | % | | | 8.19 | % | | | 8.38 | % | | | 8.31 | % | | | 7.44 | % |
Total (Tier I plus Tier II capital ratio) (e) | | | 13.25 | | | | 12.49 | | | | 12.48 | | | | 12.21 | | | | 11.49 | |
Adjusted tangible shareholders’ equity to assets(e) (f) | | | 4.96 | | | | 5.31 | | | | 5.57 | | | | 5.56 | | | | 4.91 | |
| | | | | |
| At Dec. 31 | | | | | | | | | | | | | | | | | | | | |
Securities | | $ | 48,698 | | | $ | 21,106 | | | $ | 27,218 | | | $ | 23,770 | | | $ | 22,780 | |
Loans | | | 50,931 | | | | 37,793 | | | | 32,927 | | | | 28,375 | | | | 28,414 | |
Total assets | | | 197,656 | | | | 103,206 | | | | 102,118 | | | | 94,529 | | | | 92,397 | |
Deposits | | | 118,125 | | | | 62,146 | | | | 49,787 | | | | 43,052 | | | | 40,753 | |
Long-term debt | | | 16,873 | | | | 8,773 | | | | 7,817 | | | | 6,121 | | | | 6,121 | |
Common shareholders’ equity | | | 29,403 | | | | 11,429 | | | | 9,876 | | | | 9,290 | | | | 8,428 | |
| (a) | 2007 includes six months of The Bank of New York Mellon’s results. See Note 4 of Notes to Consolidated Financial Statements for details of the merger. |
| (b) | Certain amounts have been revised, see Note 2 of Notes to Consolidated Financial Statements. |
| (c) | Legacy The Bank of New York earnings per share and all other share-related data are presented in post-merger share count terms. See page 62 for additional information. Also see page 63 for a reconciliation of reported net income and diluted earnings per share to non-GAAP net income and diluted earnings per share. |
| (d) | Does not foot due to rounding. |
| (e) | Includes discontinued operations. |
| (f) | As defined on page 73. The deferred tax liability totaled $2.006 billion for 2007, $159 million in 2006 and none in 2005, 2004 and 2003. |
Note: FTE denotes presentation on a fully taxable equivalent basis.
The Bank of New York Mellon Corporation 3
Management’s Discussion and Analysis of Financial Condition and Results of Operations
Results of Operations
BNY Mellon’s actual results of future operations may differ from those estimated or anticipated in certain forward-looking statements contained herein for reasons which are discussed below and under the heading “Forward-Looking Statements and Risk Factors.” When used in this report, words such as “estimate,” “forecast,” “project,” “anticipate,” “confident,” “target,” “expect,” “intend,” “continue,” “seek,” “believe,” “plan,” “goal,” “could,” “should,” “may,” “will,” “strategy,” “synergies,” “opportunities,” “trends,” and words of similar meaning, signify forward-looking statements in addition to statements specifically identified as forward-looking statements. In addition, certain business terms used in this document are defined in the Glossary.
Overview
Our businesses
The Bank of New York Mellon Corporation (NYSE: BK) is a global leader in providing a comprehensive array of services that enable institutions and individuals to manage and service their financial assets in more than 100 markets worldwide. We have a long tradition of collaborating with clients to deliver innovative solutions through our core competencies: asset and wealth management, securities servicing and treasury services. Our extensive global client base includes a broad range of leading financial institutions, corporations, government entities, endowments/foundations and high-net-worth individuals. One of our two principal subsidiaries, The Bank of New York (the “Bank”), founded in 1784, is the oldest bank in the United States. Our other principal subsidiary, Mellon Bank, N.A. (“Mellon Bank”), was founded in 1869. Both institutions have consistently played a prominent role in the evolution of financial markets worldwide.
BNY Mellon’s businesses benefit from the global growth in financial assets. Our success is based on continuing to provide superior client service, strong investment performance and the highest fiduciary standards. We seek to deploy capital effectively to our businesses to accelerate their long-term growth and deliver top-tier returns to our shareholders.
Our long-term financial goals are focused on achieving superior total returns to shareholders by generating first quartile earnings per share growth over time relative to a group of 12 peer companies. Key components of this strategy include: providing the best client service versus peers (as measured
through independent surveys); strong investment performance (relative to investment benchmarks); above median revenue growth (relative to peer companies for each of our businesses); competitive margins; and positive operating leverage.
Based on the growth opportunities in our businesses, we expect that an increasing percentage of our revenue and income will be derived outside the U.S.
As measurements of efficiency, over time we expect to increase the level of fee revenue per employee and increase our pre-tax margins.
We believe that our businesses are compatible with our strategy and goals for the following reasons:
| | · | | Demand for our products and services is driven by market and demographic trends in the markets in which we compete. These trends include growth in worldwide retirement and financial assets; the growth and concentration of the wealth segments; global growth in assets managed by financial institutions; and the globalization of the investment process. |
| | · | | Many of our products complement one another. |
| | · | | We are able to leverage sales, distribution and technology across our businesses benefiting our clients and shareholders. |
| | · | | The revenue generated by our businesses is principally fee-based. |
| | · | | Our businesses generally do not require as much capital for growth as traditional banking. |
We pursue our long-term financial goals by focusing on organic revenue growth, expense management, superior client service, successful integration of acquisitions and disciplined capital management.
In 2007, we established a Tier I capital target of 8% as our principal capital measure. We also revised our secondary targeted capital ratio from 5% of tangible common equity to 5% of adjusted tangible common equity. The change from “tangible common equity” to “adjusted tangible common equity” reflects the impact of the merger with Mellon and associated goodwill, intangibles and related deferred tax liability. The goodwill and intangibles created in the merger have no economic impact but reduce tangible equity.
How we reported results
All information in this Annual Report is reported on a continuing operations basis, unless otherwise noted.
4 The Bank of New York Mellon Corporation
Results of Operations(continued)
For a description of discontinued operations, see Note 5 of Notes to Consolidated Financial Statements.
Certain amounts are presented on a fully taxable equivalent (FTE) basis. We believe that this presentation allows for comparison of amounts arising from both taxable and tax-exempt sources and is consistent with industry practice. The adjustment to an FTE basis has no impact on net income. In addition, results for 2007 include six months of the combined company’s results, while the results for the first half of 2007 and all prior periods include legacy The Bank of New York only.
Summary of financial results
2007
In 2007, we reported consolidated net income of $2.039 billion and diluted earnings per share of $2.18 compared with net income of $2.847 billion and diluted earnings per share of $3.94 in 2006. Net income in 2006 included net income from discontinued operations of $1.371 billion and diluted earnings per share of $1.90, primarily from the sale of our Retail Business.
In December of 2007, we consolidated the assets of our bank-sponsored conduit, Three Rivers Funding Corporation (“TRFC”) which resulted in an extra-ordinary after-tax loss of $180 million or $0.19 per share. See pages 16 and 17 for a further explanation of this consolidation.
Income from continuing operations before extra-ordinary loss in 2007 was $2.227 billion and diluted earnings per share was $2.38, compared with $1.476 billion and $2.04 per share in 2006.
Results for 2007 and 2006 include merger and integration expense of $404 million and $106 million pre-tax, respectively. Excluding these amounts, diluted earnings per share from continuing operations was $2.64 per share in 2007 and $2.14 per share in 2006.
Performance highlights for 2007 include:
| | · | | Assets under management, excluding securities lending assets, amounted to $1.121 trillion at Dec. 31, 2007 compared to $142 billion at Dec. 31, 2006. Assets under custody and administration amounted to $23.1 trillion at Dec. 31, 2007 compared with $15.5 trillion at Dec. 31, 2006. Both increases primarily resulted from the merger with Mellon; |
| | · | | Asset and wealth management fees totaled $2.060 billion in 2007 compared with $545 million in 2006. The increase was primarily due to the merger with Mellon as well as net new business and higher equity market levels; |
| | · | | Asset servicing revenue was $2.350 billion in 2007 compared with $1.401 billion in 2006. The increase was primarily due to the merger with Mellon, as well as a higher level of securities lending revenue and increased client activity related to market volatility and net new business; |
| | · | | Issuer services revenue was $1.560 billion in 2007 compared with $895 million in 2006. The increase was primarily due to the acquisition of the corporate trust business (“the Acquired Corporate Trust Business”) of J.P. Morgan Chase & Co., strong growth in Depositary Receipts revenue, and to a lesser extent, the merger with Mellon; |
| | · | | Revenue from foreign exchange and other trading activities was $786 million in 2007, compared with $415 million in 2006. The increase reflects the merger with Mellon, record customer volumes, the favorable impact that resulted from increased currency volatility in the second half of 2007 and a higher valuation of the credit derivatives portfolio; |
| | · | | Net interest revenue was $2.3 billion in 2007, compared with $1.499 billion in 2006. The increase was primarily due to the merger with Mellon, as well as growth in client deposits and wider spreads on investment securities; |
| | · | | Securities losses totaled $201 million in 2007 primarily reflecting a $200 million loss on collateralized debt obligations (CDOs) recorded in the fourth quarter, and |
| | · | | Noninterest expense was $8.116 billion in 2007 compared with $4.688 billion in 2006. The increase resulted from the merger with Mellon, the purchase of the Acquired Corporate Trust Business, as well as $404 million pre-tax of merger and integration expense and $319 million pre-tax of intangible amortization expense in 2007, partially offset by the disposition of certain businesses in the BNY ConvergEx transaction and $175 million of merger-related synergies generated in 2007. |
2006
In 2006, we reported net income of $2.847 billion and diluted earnings per share of $3.94 and income from continuing operations of $1.476 billion and diluted
The Bank of New York Mellon Corporation 5
Results of Operations(continued)
earnings per share of $2.04. This compares to net income of $1.571 billion and diluted earnings per share of $2.16 and income from continuing operations of $1.343 billion and diluted earnings per share of $1.84 in 2005. Discontinued operations for 2006 included a net after-tax gain of $1.371 billion, or diluted earnings per share of $1.90.
Adjusting for the impact of merger and integration expense ($106 million pre-tax), diluted earnings per share from continuing operations for 2006 were $2.14 compared with $1.84 for 2005.
Performance highlights for 2006 include:
| | · | | A 13% increase in securities servicing fees; |
| | · | | A 12% increase in net interest revenue; |
| | · | | A 9% increase in foreign exchange and other trading activities, and |
| | · | | A 20% increase in asset and wealth management fees. |
On Oct. 1, 2006, we purchased the Acquired Corporate Trust Business from and sold our Retail Business to, JP Morgan Chase.
On October 2, 2006, we completed the transaction resulting in the formation of BNY ConvergEx Group. BNY ConvergEx Group brought together BNY Securities Group’s trade execution, commission management, independent research and transition management business with Eze Castle Software, a leading provider of trade order management and related investment technologies.
2005
In 2005, we reported net income of $1.571 billion and diluted earnings per share of $2.16. Income from continuing operations was $1.343 billion, or $1.84 of diluted earnings per share.
Securities servicing fees were up 10% from 2004. Net interest revenue increased $183 million compared with 2004. Asset and wealth management fees and foreign exchange and other trading activities also rose from the prior year. We repurchased 5 million net shares in 2005.
During 2005, we formed strategic alliances to penetrate faster-growing markets in France, Germany, the Nordic and Baltic region, Japan, Australia, and India. We also continued to expand our market
presence in high-growth areas such as hedge fund servicing and collateral management, while extending our capabilities in the rapidly growing area of alternative investments.
Revenue overview
The vast majority of BNY Mellon’s revenue consists of fee and other revenue, given our mix of businesses, with net interest revenue comprising the balance.
Fee and other revenue represented 80% of total revenue, on a fully taxable equivalent (FTE) basis in 2007, compared with 78% in 2006.
Since fee and other revenue constitutes the majority of our total revenue, we discuss it in greater detail by type of fee in the following sections, as well as in the business segments review section beginning on page 17. There we note the specific drivers of such revenue and the factors that caused the various types of fee and other revenue to increase or decline in 2007 compared with 2006. The business segments discussion combines, for each business segment, all types of fee and other revenue generated directly by that segment as well as fee and other revenue transferred between segments under revenue transfer agreements, with net interest revenue generated directly by or allocated to that segment. The discussion of revenue by business segment is fundamental to an understanding of BNY Mellon’s results as it represents a principal measure by which management reviews the performance of our businesses compared with performance in prior periods, with our operating plan and with the performance of our competitors.
Net interest revenue comprised 20% of total revenue, on an FTE basis, in 2007 compared with 22% in 2006. Net interest revenue is generated from a combination of loans, investment securities, interest-bearing deposits with banks and federal funds sold and securities purchased under resale agreements. For more information, see page 11.
6 The Bank of New York Mellon Corporation
Results of Operations(continued)
Sector overview
| | |
| Sector/Segment | | Primary types of fee revenue |
Asset & Wealth Management sector |
Asset Management segment | | · Asset and wealth management fees from: Institutional clients Mutual funds Private clients · Performance fees · Distribution and servicing fees |
Wealth Management segment | | · Wealth management fees from high-net-worth individuals, families, family offices and business enterprises, charitable gift programs and foundations and endowments |
Institutional Services sector |
Asset Servicing segment | | · Asset servicing fees, including: Institutional trust and custody fees Broker-dealer services Securities lending · Foreign exchange |
Issuer Services segment | | · Issuer services fees, including: Corporate Trust Depositary receipts Employee investment plan services Shareowner services |
Clearing & Execution Services segment | | · Clearing and execution services fees, including: Broker Dealer and Registered Investment Advisor services Electronic trading services |
Treasury Services segment | | · Treasury services fees, including: Global payment services Working capital solutions Global markets and institutional banking services · Financing-related fees |
Other segment | | · Leasing operations · Corporate Treasury activities · Business exits · Merger and integration expenses |
The Bank of New York Mellon Corporation 7
Results of Operations(continued)
Fee and other revenue
| | | | | | | | | | | | | | | | | | |
| Fee and other revenue(a) | | 2007 | | | Legacy The Bank
of New York only | | | 2007
vs. 2006 | | | 2006
vs. 2005 | |
| (in millions unless otherwise noted) | | | 2006 | | | 2005 | | | �� |
Securities servicing fees: | | | | | | | | | | | | | | | | | | |
Asset servicing | | $ | 2,350 | | | $ | 1,401 | | | $ | 1,267 | | | 68 | % | | 11 | % |
Issuer services | | | 1,560 | | | | 895 | | | | 639 | | | 74 | | | 40 | |
Clearing and execution services | | | 1,192 | | | | 1,248 | | | | 1,242 | | | (4 | ) | | - | |
Total securities servicing fees | | | 5,102 | | | | 3,544 | | | | 3,148 | | | 44 | | | 13 | |
Asset and wealth management fees | | | 2,060 | | | | 545 | | | | 455 | | | 278 | | | 20 | |
Performance fees | | | 93 | | | | 35 | | | | 9 | | | 166 | | | 289 | |
Foreign exchange and other trading activities | | | 786 | | | | 415 | | | | 379 | | | 89 | | | 9 | |
Treasury services | | | 348 | | | | 209 | | | | 206 | | | 67 | | | 1 | |
Financing-related fees | | | 216 | | | | 250 | | | | 282 | | | (14 | ) | | (11 | ) |
Distribution and servicing | | | 212 | | | | 6 | | | | 5 | | | N/M | | | N/M | |
Investment income | | | 149 | | | | 160 | | | | 90 | | | (7 | ) | | 78 | |
Securities gains (losses) | | | (201 | ) | | | 2 | | | | 22 | | | N/M | | | N/M | |
Other | | | 266 | | | | 173 | | | | 119 | | | 54 | | | 45 | |
Total fee and other revenue | | $ | 9,031 | | | $ | 5,339 | | | $ | 4,715 | | | 69 | % | | 13 | % |
Fee and other revenue as a percentage of total revenue (FTE) | | | 80 | % | | | 78 | % | | | 78 | % | | | | | | |
Market value of assets under management at period-end(in billions) | | $ | 1,121 | | | $ | 142 | | | $ | 115 | | | 689 | % | | 23 | % |
Market value of assets under custody and administration at period-end(in trillions) | | $ | 23.1 | | | $ | 15.5 | (b) | | $ | 11.4 | (b) | | 49 | % | | 36 | % |
| (a) | Results for 2007 include six months of the combined Company’s results and six months of legacy The Bank of New York only. All other periods prior to 2007 include legacy The Bank of New York only. |
| (b) | Revised for the Acquired Corporate Trust Business and harmonization adjustments. |
Fee and other revenue
Fee and other revenue totaled $9.031 billion in 2007, an increase of $3.692 billion, or 69%, from $5.339 billion in 2006. The increase in revenue in 2007 was primarily driven by the merger with Mellon, the full-year impact of the acquisition in October 2006 of the Acquired Corporate Trust Business and stronger performances in securities servicing, asset and wealth management, foreign exchange and other trading activities and treasury services. Partially offsetting the growth in fee and other revenue was the disposition of certain execution businesses in the October 2006 BNY ConvergEx transaction and securities losses.
Securities servicing fees
The increase in securities servicing fees compared to 2006 reflects the merger with Mellon and the Acquired Corporate Trust Business, as well as strong organic growth in securities lending revenue, Depositary Receipts and broker-dealer services. These results were partially offset by the BNY ConvergEx transaction. See the “Institutional Services Sector” in “Business segments review” for additional details.
Asset and wealth management fees
Asset and wealth management fees increased from 2006 primarily due to the merger with Mellon, net new business and improved equity markets. See the “Asset and Wealth Management Sector” in “Business segments review” for additional details regarding the drivers of asset and wealth management fees. Total assets under management for the Asset and Wealth management sector were $1.121 trillion at Dec. 31, 2007, up from $142 billion at Dec. 31, 2006. The increase resulted from the merger with Mellon and net new business. Net asset inflows totaled $55 billion in 2007 resulting from $70 billion of money market inflows partially offset by $15 billion of long-term outflows.
A large category of Asset and Wealth management fees are from managed mutual funds generated in the Asset Management segment. These fees are based on the daily average net assets of each fund and the basis point management fee paid by that fund. Managed mutual fund revenue was $637 million in 2007 compared with $10 million in 2006. The increase resulted from the merger with Mellon.
8 The Bank of New York Mellon Corporation
Results of Operations(continued)
Performance fees
Performance fees, which are reported in the Asset Management segment, are generally calculated as a percentage of a portfolio’s performance in excess of a benchmark index or a peer group’s performance. There is an increase/decrease in incentive expense with a related change in performance fees. Performance fees totaled $93 million in 2007, an increase of $58 million compared with 2006, reflecting the merger with Mellon. As a result of the turbulent market environment in 2007, performance fees were impacted by a lower outperformance on certain alternative and quantitative strategies.
Foreign exchange and other trading activities
Foreign exchange and other trading activities revenue, which is primarily reported in the Asset Servicing segment, was $786 million in 2007, an increase of $371 million, or 89%, compared with 2006. The increase was due to the merger with Mellon, record customer volumes due to increased activity of the existing client base, new clients, and the favorable impact that resulted from increased currency volatility in the second half of 2007. Other trading activities increased reflecting a higher valuation of the credit derivative portfolio caused by the widening of credit spreads.
Treasury services
Treasury services, which is primarily reported in the Treasury services segment, includes fees related to funds transfer, cash management, and liquidity management. Treasury services fees increased $139 million from 2006 reflecting the merger with Mellon, as well as higher client volumes and net new business in the global payments business, partially offset by customers paying with compensating balances in lieu of fees. Earnings on compensating balance deposits are recognized in net interest revenue.
Financing-related fees
Financing-related fees, which are primarily reported in the Treasury Services segment, include capital markets fees, loan commitment fees and credit-related trade fees.
Financing-related fees decreased $34 million from 2006 reflecting a lower level of credit-related activities consistent with our strategic direction.
Distribution and servicing fees
Distribution and servicing fees earned from mutual funds are primarily based on average assets in the
funds and the sales of funds managed or administered by BNY Mellon and are primarily reported in the Asset Management segment. These fees, which include 12b-1 fees, fluctuate with the overall level of net sales, the relative mix of sales between share classes and the funds’ market values.
The $206 million increase in distribution and servicing fee revenue in 2007 compared with 2006 primarily reflects the merger with Mellon, as well as higher sales volumes and higher market values of mutual funds. The impact of these fees on income in any one period can be more than offset by distribution and servicing expense paid to other financial intermediaries to cover their costs for distribution and servicing of mutual funds. Distribution and servicing expense is recorded as noninterest expense on the income statement.
Investment income
Investment income, which is primarily reported in the Other and Asset Management segments, includes the gains and losses on private equity investments and seed capital investments, income from insurance contracts, and lease residual gains and losses. The decline compared to prior periods principally reflects lower private equity investment income as well as the lower market value of seed capital investments due to the market environment. Private equity investment income was $67 million in 2007, down from $97 million in 2006. This decrease was partially offset by higher returns from insurance contracts and the merger with Mellon.
Securities gains (losses)
The $201 million securities loss in 2007 primarily reflects a $200 million loss on CDOs recorded in the fourth quarter. Based on deteriorating conditions in the U.S. housing market, we recognized a pre-tax loss of $200 million ($118 million after-tax) for other than temporary impairment related to these securities. Within our securities available for sale portfolio, we held $179 million (par value $379 million) of CDOs that contained subprime exposure at Dec. 31, 2007.
Other revenue
Other revenue is comprised of expense reimbursements from joint ventures, merchant card fees, asset-related gains, equity investment income, net economic value payments and other transactions. Expense reimbursements from joint ventures relate to expenses incurred by BNY Mellon on behalf of joint
The Bank of New York Mellon Corporation 9
Results of Operations(continued)
ventures. Asset-related gains (losses) include loan and real estate dispositions. Equity investment income primarily reflects our proportionate share of the income from our investment in Wing Hang Bank Limited. Other transactions primarily include low-income housing, other investments and various miscellaneous revenues. The breakdown among these categories is shown in the following table:
| | | | | | | | | | |
| Other revenue | | 2007 | | Legacy The Bank
of New York only | |
| (in millions) | | | 2006 | | 2005 | |
Expense reimbursements from joint ventures | | $ | 58 | | $ | - | | $ | - | |
Merchant card fees | | | 25 | | | - | | | - | |
Asset-related gains | | | 9 | | | 100 | | | 88 | |
Equity investment income | | | 56 | | | 47 | | | 39 | |
Net economic value payments | | | 41 | | | 23 | | | - | |
Other | | | 77 | | | 3 | | | (8 | ) |
Total other revenue | | $ | 266 | | $ | 173 | | $ | 119 | |
Other revenue increased from 2006 reflecting the merger with Mellon, higher net economic value payments, a settlement received for early termination of a contract that occurred in 2005 associated with the clearing business ($28 million) and revenue related to transitional services agreements ($15 million). Net economic value payments were $41 million in 2007 and $23 million in 2006. These payments were primarily related to the Acquired Corporate Trust Business, for international customers whose net revenue had not previously been transferred. Upon conversion, revenue from the Acquired Corporate Trust Business clients was reflected in Issuer Services fees and net interest revenue. Asset-related gains in 2006 include a pre-tax gain of $35 million related to
the conversion of our New York Stock Exchange (“NYSE”) seats into cash and shares of NYSE Group, Inc. common stock, some of which were sold.
2006 compared with 2005
The increase in fee and other revenue in 2006 versus 2005 primarily reflected stronger performance in securities servicing, asset and wealth management fees, performance fees, foreign exchange and other trading activities as well as higher level of investment income and other income. Securities servicing fee growth in 2006 reflected the Acquired Corporate Trust Business and strong organic growth in issuer services, investor services and broker-dealer services. Growth in these areas was partly offset by disposition of certain execution businesses in the BNY ConvergEx transaction and weaker results in our clearing and remaining domestic execution business. Asset and wealth management fees increased over 2005 primarily resulting from acquisitions. The increase in performance fees reflected improved performance fees at Ivy Asset Management Corp. (“Ivy”). Foreign exchange and other trading activities grew strongly in 2006 versus 2005 reflecting higher customer volumes driven by cross-border investment flows, greater business from existing clients, and favorable market conditions in the first half of 2006. Other trading revenues increased in 2006 as a result of higher fixed income activities partially offset by lower trading revenue at Pershing Group LLC (“Pershing”). Investment income in 2006 included a realized gain of $11 million from the sale of a private equity investment. The increase in other revenue reflects the gain on the sale of NYSE seats and net economic value payments.
10 The Bank of New York Mellon Corporation
Results of Operations(continued)
Net interest revenue
| | | | | | | | | | | | | | | | | | |
| Net interest revenue | | | | | Legacy The Bank of
New York only | | | 2007 vs. 2006 | | | 2006
vs. 2005 | |
| (dollar amounts in millions) | | 2007 (a) | | | 2006 | | | 2005 | | | |
Net interest revenue | | $ | 2,300 | | | $ | 1,499 | | | $ | 1,340 | | | 53 | % | | 12 | % |
Tax equivalent adjustment | | | 12 | | | | 22 | | | | 27 | | | N/M | | | N/M | |
Net interest revenue on an FTE basis | | $ | 2,312 | | | $ | 1,521 | | | $ | 1,367 | | | 52 | % | | 11 | % |
| | | | | |
Net interest margin (FTE) | | | 2.08 | % | | | 2.01 | % (b) | | | 2.02 | % (b) | | 7bp | | | (1 | )bp |
| (a) | Results for 2007 include six months of the combined company’s results and six months of legacy The Bank of New York only. All other periods reflect legacy The Bank of New York only. |
| (b) | Calculated on a continuing operations basis even though the balance sheet, in accordance with GAAP, is not restated for discontinued operations. |
bp - basis points
The increase in net interest revenue from 2006 principally reflects the merger with Mellon, as well as a higher level of average interest-earning assets driven by growth in client deposits, as well as higher deposit balances associated with the Acquired Corporate Trust Business, wider spreads on investment securities and lower bond premium amortization due to slowing prepayments. This growth was partially offset by the required recalculation of the yield on leverage leases under FSP-FAS 13-2, for changes to New York state tax rates resulting from the merger with Mellon ($22 million). We received net economic value payments on the Acquired Corporate Trust Business deposits post-acquisition but prior to the transfer of the deposits to us. These payments, which totaled $41 million in 2007 and $23 million in 2006, are recorded in Other revenue.
Average interest-earning assets were $111.2 billion in 2007, compared with $75.6 billion in 2006 and $67.7 billion in 2005. The increase in 2007 from 2006 reflects the merger with Mellon, the impact of higher deposits related to the Acquired Corporate Trust
Business, as well as a higher level of interest and noninterest-bearing deposits driven by higher client activity across our businesses. Average loans were $41.5 billion in 2007, compared with $33.6 billion in 2006 and $32.1 billion in 2005. Average securities were $37.4 billion in 2007, up from $25.9 billion in 2006 and $24.3 billion in 2005.
The net interest margin was 2.08% in 2007 compared with 2.01% in 2006 and 2.02% in 2005. The increase in the net interest margin from 2006 principally reflects the merger with Mellon as well as a higher average level of noninterest-bearing deposits, wider spreads on investment securities and lower bond premium amortization due to slowing prepayments.
2006 compared with 2005
The increase in net interest revenue in 2006 compared to 2005 primarily reflects the impact of higher deposit balances related to the Acquired Corporate Trust Business, higher amounts of interest-earning assets and interest-free balances, as well as the higher value of interest-free balances in a rising rate environment.
The Bank of New York Mellon Corporation 11
Results of Operations(continued)
CONSOLIDATED BALANCE SHEET – AVERAGE BALANCES AND INTEREST YIELDS/RATES(a)
| | | | | | | | | | | |
| | | 2007(b) | |
| (dollar amounts in millions, presented on an FTE basis) | | Average
balance | | | Interest | | | Average
yields/rates | |
Assets | | | | | | | | | | | |
Interest-earning assets: | | | | | | | | | | | |
Interest-bearing deposits with banks (primarily foreign banks) | | $ | 26,505 | | | $ | 1,242 | | | 4.68 | % |
Federal funds sold and securities under resale agreements | | | 5,727 | | | | 290 | | | 5.06 | |
Margin loans | | | 5,392 | | | | 332 | | | 6.16 | |
Non-margin loans: | | | | | | | | | | | |
Domestic offices | | | | | | | | | | | |
Consumer | | | 4,722 | | | | 278 | | | 5.90 | |
Commercial | | | 18,806 | | | | 913 | | | 4.85 | |
Foreign offices | | | 12,595 | | | | 693 | | | 5.50 | |
Total non-margin loans | | | 36,123 | | | | 1,884 | (c) | | 5.22 | |
Securities: | | | | | | | | | | | |
U.S. government obligations | | | 270 | | | | 12 | | | 4.45 | |
U.S. government agency obligations | | | 7,314 | | | | 390 | | | 5.33 | |
Obligations of states and political subdivisions | | | 408 | | | | 27 | | | 6.73 | |
Other securities: | | | | | | | | | | | |
Domestic offices | | | 19,832 | | | | 1,125 | | | 5.67 | |
Foreign offices | | | 7,529 | | | | 363 | | | 4.81 | |
Total other securities | | | 27,361 | | | | 1,488 | | | 5.44 | |
Trading securities: | | | | | | | | | | | |
Domestic offices | | | 1,121 | | | | 47 | | | 4.19 | |
Foreign offices | | | 953 | | | | 51 | | | 5.39 | |
Total trading securities | | | 2,074 | | | | 98 | | | 4.74 | |
Total securities | | | 37,427 | | | | 2,015 | | | 5.38 | |
Total interest-earning assets | | | 111,174 | | | $ | 5,763 | (e) | | 5.18 | % |
Allowance for credit losses | | | (303 | ) | | | | | | | |
Cash and due from banks | | | 3,945 | | | | | | | | |
Other assets | | | 33,773 | | | | | | | | |
Assets of discontinued operations | | | 53 | | | | | | | | |
Total assets | | $ | 148,642 | | | | | | | | |
Liabilities and shareholders’ equity | | | | | | | | | | | |
Interest-bearing deposits | | | | | | | | | | | |
Domestic offices: | | | | | | | | | | | |
Money market rate accounts | | $ | 11,535 | | | $ | 349 | | | 3.03 | % |
Savings | | | 610 | | | | 16 | | | 2.56 | |
Certificates of deposits of $100,000 & over | | | 2,845 | | | | 152 | | | 5.35 | |
Other time deposits | | | 1,012 | | | | 60 | | | 5.93 | |
Total domestic | | | 16,002 | | | | 577 | | | 3.61 | |
Foreign offices: | | | | | | | | | | | |
Banks | | | 9,720 | | | | 358 | | | 3.69 | |
Government & official institutions | | | 1,108 | | | | 45 | | | 4.03 | |
Other | | | 39,492 | | | | 1,409 | | | 3.57 | |
Total foreign | | | 50,320 | | | | 1,812 | | | 3.60 | |
Total interest-bearing deposits | | | 66,322 | | | | 2,389 | | | 3.60 | |
Federal funds purchased & securities under repurchase agreements | | | 2,890 | | | | 125 | | | 4.30 | |
Other funds borrowed: | | | | | | | | | | | |
Domestic offices | | | 1,762 | | | | 76 | | | 4.28 | |
Foreign offices | | | 761 | | | | 15 | | | 2.02 | |
Total other funds borrowed | | | 2,523 | | | | 91 | | | 3.59 | |
Payables to customers and broker-dealers | | | 5,113 | | | | 177 | | | 3.47 | |
Long term debt | | | 12,327 | | | | 669 | | | 5.43 | |
Total interest-bearing liabilities | | $ | 89,175 | | | $ | 3,451 | | | 3.87 | % |
Total noninterest-bearing deposits | | | 21,677 | | | | | | | | |
Other liabilities | | | 17,503 | | | | | | | | |
Liabilities of discontinued operations | | | 53 | | | | | | | | |
Total liabilities | | | 128,408 | | | | | | | | |
Shareholders’ equity | | | 20,234 | | | | | | | | |
Total liabilities and shareholders’ equity | | $ | 148,642 | | | | | | | | |
Net interest margin-taxable equivalent basis | | | | | | | | | | 2.08 | % |
Assets attributable to foreign offices(d) | | | 36.68 | % | | | | | | | |
Liabilities attributable to foreign offices | | | 37.55 | | | | | | | | |
| (a) | Average balances and rates have been impacted by allocations made to match assets of discontinued operations with liabilities of discontinued operations. |
| (b) | Average balances and rates for 2007 include six months of the combined Company’s results and six months legacy The Bank of New York only. |
| (c) | Includes fees of $32 million in 2007. Nonaccrual loans are included in the average loan balance; the associated income, recognized on the cash basis, is included in interest. |
| (d) | Includes Cayman Islands branch offices. |
| (e) | The tax equivalent adjustment was $12 million in 2007 and is based on the federal statutory tax rate (35%) and applicable state and local taxes. |
12 The Bank of New York Mellon Corporation
Results of Operations(continued)
| | | | | | | | | | | | | | | | | | | | | | |
| | | Legacy The Bank of New York only | |
| | | 2006(a) | | | 2005(a) | |
| (dollar amounts in millions, presented on an FTE basis) | | Average
balance | | | Interest | | | Average
yields/rates | | | Average
balance | | | Interest | | | Average yields/
rates | |
Assets | | | | | | | | | | | | | | | | | | | | | | |
Interest-earning assets: | | | | | | | | | | | | | | | | | | | | | | |
Interest-bearing deposits with banks (primarily foreign banks) | | $ | 13,327 | | | $ | 538 | | | 4.04 | % | | $ | 8,996 | | | $ | 274 | | | 3.04 | % |
Federal funds sold and securities under resale agreements | | | 2,791 | | | | 130 | | | 4.67 | | | | 2,399 | | | | 70 | | | 2.90 | |
Margin loans | | | 5,372 | | | | 330 | | | 6.15 | | | | 6,403 | | | | 267 | | | 4.17 | |
Non-margin loans: | | | | | | | | | | | | | | | | | | | | | | |
Domestic offices | | | | | | | | | | | | | | | | | | | | | | |
Consumer | | | 2,985 | | | | 168 | | | 5.64 | | | | 1,740 | | | | 91 | | | 5.25 | |
Commercial | | | 14,955 | | | | 707 | | | 4.72 | | | | 14,631 | | | | 558 | | | 3.81 | |
Foreign offices | | | 10,300 | | | | 574 | | | 5.57 | | | | 9,295 | | | | 396 | | | 4.25 | |
Total non-margin loans | | | 28,240 | | | | 1,449 | (b) | | 5.13 | | | | 25,666 | | | | 1,045 | (b) | | 4.07 | |
Securities: | | | | | | | | | | | | | | | | | | | | | | |
U.S. government obligations | | | 190 | | | | 8 | | | 4.32 | | | | 273 | | | | 9 | | | 3.43 | |
U.S. government agency obligations | | | 3,565 | | | | 169 | | | 4.73 | | | | 3,766 | | | | 153 | | | 4.05 | |
Obligations of states and political subdivisions | | | 105 | | | | 9 | | | 8.34 | | | | 141 | | | | 12 | | | 8.39 | |
Other securities: | | | | | | | | | | | | | | | | | | | | | | |
Domestic offices | | | 15,702 | | | | 850 | | | 5.42 | | | | 14,640 | | | | 630 | | | 4.30 | |
Foreign offices | | | 2,746 | | | | 114 | | | 4.15 | | | | 1,882 | | | | 83 | | | 4.44 | |
Total other securities | | | 18,448 | | | | 964 | | | 5.23 | | | | 16,522 | | | | 713 | | | 4.32 | |
Trading securities | | | | | | | | | | | | | | | | | | | | | | |
Domestic offices | | | 660 | | | | 30 | | | 4.56 | | | | 593 | | | | 22 | | | 3.77 | |
Foreign offices | | | 2,908 | | | | 135 | | | 4.64 | | | | 2,956 | | | | 131 | | | 4.45 | |
Total trading securities | | | 3,568 | | | | 165 | | | 4.63 | | | | 3,549 | | | | 153 | | | 4.34 | |
Total securities | | | 25,876 | | | | 1,315 | | | 5.09 | | | | 24,251 | | | | 1,040 | | | 4.29 | |
Total interest-earning assets | | | 75,606 | | | $ | 3,762 | (d) | | 4.98 | % | | | 67,715 | | | $ | 2,696 | (d) | | 3.98 | % |
Allowance for credit losses | | | (340 | ) | | | | | | | | | | (474 | ) | | | | | | | |
Cash and due from banks | | | 2,910 | | | | | | | | | | | 2,772 | | | | | | | | |
Other assets | | | 18,302 | | | | | | | | | | | 16,306 | | | | | | | | |
Assets of discontinued operations | | | 10,364 | | | | | | | | | | | 15,116 | | | | | | | | |
Total assets | | $ | 106,842 | | | | | | | | | | $ | 101,435 | | | | | | | | |
Liabilities and shareholders’ equity | | | | | | | | | | | | | | | | | | | | | | |
Interest-bearing deposits | | | | | | | | | | | | | | | | | | | | | | |
Domestic offices: | | | | | | | | | | | | | | | | | | | | | | |
Money market rate accounts | | $ | 5,465 | | | $ | 145 | | | 2.66 | % | | $ | 6,320 | | | $ | 109 | | | 1.73 | % |
Savings | | | 452 | | | | 6 | | | 1.36 | | | | 597 | | | | 5 | | | 0.87 | |
Certificates of deposit of $100,000 & over | | | 4,114 | | | | 210 | | | 5.12 | | | | 3,155 | | | | 107 | | | 3.40 | |
Other time deposits | | | 551 | | | | 26 | | | 4.70 | | | | 437 | | | | 16 | | | 3.38 | |
Total domestic | | | 10,582 | | | | 387 | | | 3.66 | | | | 10,509 | | | | 237 | | | 2.25 | |
Foreign offices: | | | | | | | | | | | | | | | | | | | | | | |
Banks | | | 6,764 | | | | 243 | | | 3.59 | | | | 6,050 | | | | 129 | | | 2.13 | |
Government & official institutions | | | 705 | | | | 25 | | | 3.50 | | | | 581 | | | | 14 | | | 2.44 | |
Other | | | 25,092 | | | | 779 | | | 3.11 | | | | 19,930 | | | | 459 | | | 2.30 | |
Total foreign | | | 32,561 | | | | 1,047 | | | 3.22 | | | | 26,561 | | | | 602 | | | 2.26 | |
Total interest-bearing deposits | | | 43,143 | | | | 1,434 | | | 3.33 | | | | 37,070 | | | | 839 | | | 2.26 | |
Federal funds purchased & securities under repurchase agreements | | | 2,237 | | | | 104 | | | 4.65 | | | | 1,284 | | | | 35 | | | 2.73 | |
Other funds borrowed: | | | | | | | | | | | | | | | | | | | | | | |
Domestic offices | | | 1,632 | | | | 94 | | | 5.74 | | | | 1,480 | | | | 55 | | | 3.68 | |
Foreign offices | | | 459 | | | | 6 | | | 1.32 | | | | 385 | | | | 3 | | | 0.84 | |
Total other funds borrowed | | | 2,091 | | | | 100 | | | 4.77 | | | | 1,865 | | | | 58 | | | 3.10 | |
Payables to customers and broker-dealers | | | 4,899 | | | | 167 | | | 3.40 | | | | 6,014 | | | | 128 | | | 2.12 | |
Long term debt | | | 8,295 | | | | 436 | | | 5.26 | | | | 7,312 | | | | 269 | | | 3.68 | |
Total interest-bearing liabilities | | | 60,665 | | | $ | 2,241 | | | 3.69 | % | | | 53,545 | | | $ | 1,329 | | | 2.48 | % |
Total noninterest-bearing deposits | | | 11,609 | | | | | | | | | | | 10,078 | | | | | | | | |
Other liabilities | | | 13,871 | | | | | | | | | | | 13,223 | | | | | | | | |
Liabilities of discontinued operations | | | 10,364 | | | | | | | | | | | 15,116 | | | | | | | | |
Total liabilities | | | 96,509 | | | | | | | | | | | 91,962 | | | | | | | | |
Shareholders’ equity | | | 10,333 | | | | | | | | | | | 9,473 | | | | | | | | |
Total liabilities and shareholders’ equity | | $ | 106,842 | | | | | | | | | | $ | 101,435 | | | | | | | | |
Net interest margin-taxable equivalent basis | | | | | | | | | | 2.01 | % | | | | | | | | | | 2.02 | % |
Assets attributable to foreign offices(c) | | | 33.19 | % | | | | | | | | | | 29.51 | % | | | | | | | |
Liabilities attributable to foreign offices | | | 36.21 | | | | | | | | | | | 32.97 | | | | | | | | |
| (a) | Average balances and rates have been impacted by allocations made to match assets of discontinued operations with liabilities of discontinued operations. |
| (b) | Includes fees of $42 million in 2006 and $66 million in 2005. Nonaccrual loans are included in the average loan balance; the associated income, recognized on the cash basis, is included in interest. |
| (c) | Includes Cayman Islands branch office. |
| (d) | The tax equivalent adjustments were $22 million in 2006 and $27 million in 2005, and are based on the federal statutory tax rate (35%) and applicable state and local taxes. |
The Bank of New York Mellon Corporation 13
Results of Operations(continued)
Noninterest expense
| | | | | | | | | | | | | | | | | | |
| Noninterest expense | | 2007(a) | | | Legacy The Bank of
New York only | | | 2007
vs. 2006 | | | 2006
vs. 2005 | |
| (dollars in millions) | | | 2006 | | | 2005 | | | |
Staff: | | | | | | | | | | | | | | | | | | |
Compensation | | $ | 2,453 | | | $ | 1,615 | | | $ | 1,567 | | | 52 | % | | 3 | % |
Incentives | | | 1,114 | | | | 621 | | | | 347 | | | 79 | | | 79 | |
Employee benefits | | | 553 | | | | 404 | | | | 396 | | | 37 | | | 2 | |
Total staff | | | 4,120 | | | | 2,640 | | | | 2,310 | | | 56 | | | 14 | |
Professional, legal and other purchased services | | | 781 | | | | 381 | | | | 344 | | | 105 | | | 11 | |
Net occupancy | | | 449 | | | | 279 | | | | 250 | | | 61 | | | 12 | |
Software | | | 280 | | | | 220 | | | | 214 | | | 27 | | | 3 | |
Distribution and servicing | | | 268 | | | | 17 | | | | 17 | | | N/M | | | - | |
Furniture and equipment | | | 267 | | | | 190 | | | | 199 | | | 41 | | | (5 | ) |
Sub-custodian | | | 200 | | | | 134 | | | | 96 | | | 49 | | | 40 | |
Business development | | | 190 | | | | 108 | | | | 97 | | | 76 | | | 11 | |
Clearing and execution | | | 183 | | | | 199 | | | | 204 | | | (8 | ) | | (2 | ) |
Communications | | | 109 | | | | 97 | | | | 91 | | | 12 | | | 7 | |
Other | | | 546 | | | | 241 | | | | 222 | | | 127 | | | 9 | |
Subtotal | | | 7,393 | | | | 4,506 | | | | 4,044 | | | 64 | | | 11 | |
Amortization of intangible assets | | | 319 | | | | 76 | | | | 40 | | | 320 | | | 90 | |
Merger and integration expense: | | | | | | | | | | | | | | | | | | |
The Bank of New York Mellon | | | 355 | | | | - | | | | - | | | - | | | - | |
Acquired Corporate Trust Business | | | 49 | | | | 106 | | | | - | | | (54 | ) | | - | |
Total noninterest expense | | $ | 8,116 | | | $ | 4,688 | | | $ | 4,084 | | | 73 | % | | 15 | % |
Total staff expense as a percentage of total revenue (FTE) | | | 36 | % | | | 38 | % | | | 38 | % | | | | | | |
Employees at period-end | | | 42,100 | | | | 22,400 | | | | 19,900 | | | 88 | % | | 13 | % |
| (a) | Results for 2007 include six months of the combined Company’s results and six months of legacy The Bank of New York only. All other periods reflect legacy The Bank of New York only. |
Total noninterest expense, excluding intangible amortization and merger and integration expense, was $7.393 billion in 2007, an increase of $2.887 billion or 64% compared with 2006. The merger with Mellon, the purchase of the Acquired Corporate Trust Business and the disposition of certain execution businesses in the BNY ConvergEx transaction significantly impacted comparisons of 2007 to 2006. The net impact of these transactions increased nearly all expense categories. Noninterest expense for 2007 also includes the pre-tax write-off of the value of the remaining interest in a hedge fund manager that was disposed of in 2006 ($32 million). Noninterest expense reflects $175 million in expense synergies associated with the merger with Mellon in 2007. We expect to realize annual expense synergies of $700 million by 2010.
The increase in merger and integration expense and intangible amortization expense compared to 2006 resulted from the merger with Mellon, partially offset by a decrease in merger and integration expense related to the Acquired Corporate Trust Business.
Total merger and integration costs associated with the Mellon merger are currently expected to be approximately $1.325 billion.
Staff expense
Given our mix of fee-based businesses, which are staffed with high quality professionals, staff expense comprised approximately 56% of total noninterest expense, excluding merger and integration and intangible amortization expense in 2007.
Staff expense is comprised of:
| | · | | compensation expense, which includes: |
| | · | | base salary expense, primarily driven by headcount; |
| | · | | the cost of temporary help and overtime, and |
| | · | | incentive expense, which includes: |
| | · | | additional compensation earned under a wide range of sales commission plans and incentive plans designed to reward a |
14 The Bank of New York Mellon Corporation
Results of Operations(continued)
| | combination of individual, business unit and corporate performance goals; as well as |
| | · | | stock-based compensation expense, and |
| | · | | employee benefit expense, primarily medical benefits, payroll taxes, pension and other retirement benefits. |
The increase in compensation, incentive and employee benefits expense reflects a net increase in headcount associated with the Mellon merger, the Acquired Corporate Trust Business, and organic business growth, partially offset by the BNY ConvergEx transaction.
Non-staff expense
Non-staff expense includes certain expenses that vary with the levels of business activity and levels of expensed business investments, fixed infrastructure costs and expenses associated with corporate activities related to technology, compliance, productivity initiatives and corporate development.
Non-staff expense, excluding merger and integration expense and intangible amortization expense, totaled $3.273 billion in 2007 compared with $1.866 billion in 2006. Non-staff expense was impacted by the merger with Mellon, the Acquired Corporate Trust Business, and the BNY ConvergEX transaction, and also included the following activity:
| | · | | A $251 million increase in distribution and servicing expense. Distribution and servicing expense represents amounts paid to other financial intermediaries to cover their costs for distribution (marketing support, administration and record keeping) and servicing of mutual funds. Generally, increases in distribution and servicing expense reflect higher net sales. Distribution and servicing expense in any one year is not expected to be fully recovered by higher distribution and service revenue; rather it contributes to future growth in mutual fund management revenue reflecting the growth in mutual fund assets generated through certain distribution channels; |
| | · | | An increase in professional, legal and other purchased services, business development, furniture and equipment, software and communications expense resulting from business growth and strategic initiatives; |
| | · | | An increase in sub-custodian expenses reflecting increased asset values, higher transaction volumes of assets under custody and increased depositary receipts activity, and |
| | · | | An increase in other expense reflecting organic business growth, the write-off of the remaining interest in a hedge fund manager ($32 million pre-tax), and a $17 million pre-tax loss related to Structured Investment Vehicle (“SIV”) securities purchased from a commingled Net Asset Value (NAV) fund, which is managed to the specifications of a money market fund. |
In 2007, we incurred $355 million of merger and integration expenses related to the merger with Mellon, comprised of the following:
| | · | | Personnel related—includes severance, retention, relocation expenses, accelerated vesting of stock options and restricted stock expense ($122 million); |
| | · | | Integration/conversion costs—including consulting, system conversions and staff ($136 million); |
| | · | | Transaction costs—includes investment banker and legal fees, and foundation funding ($67 million), and |
| | · | | One-time costs—includes facilities related costs, asset write-offs, vendor contract modifications, rebranding and net gain (loss) on disposals ($30 million). |
We also incurred $49 million of merger and integration expense associated with the Acquired Corporate Trust Business in 2007.
Amortization of intangible assets increased to $319 million in 2007 compared with $76 million in 2006, primarily reflecting the merger with Mellon.
2006 compared with 2005
Total noninterest expense increased in 2006 compared with 2005 reflecting increased costs associated with new business, acquisitions, higher pension costs, as well as merger and integration costs. Staff expense was up in 2006 compared with 2005, reflecting higher staff levels tied to new businesses, acquisitions, higher incentive compensation and increased temporary help, partially offset by the BNY ConvergeEx transaction. Employee benefits expense increased compared with 2005, reflecting acquisitions and expenses for incentive payments and pensions. Subcustodian expenses increased in 2006 compared with 2005 reflecting increased asset values and transaction volumes of assets under custody, and increased activity in Depositary Receipts. Professional, legal and other purchased services increased, reflecting the impact of the Acquired Corporate Trust Business.
The Bank of New York Mellon Corporation 15
Results of Operations(continued)
Merger and integration expenses in 2006 primarily included a loss in connection with the restructuring of our investment portfolio and employee-related costs, including severance. The swap of the Acquired Corporate Trust Business for the Retail Business resulted in a more liability-sensitive balance sheet because corporate trust liabilities reprice more quickly than retail deposits. We sold $5.5 billion of investment securities in the third quarter of 2006 to adjust our interest rate sensitivity.
Income taxes
On a continuing operations basis, the effective tax rate for 2007 was 31.0%, compared to 32.0% for 2006 and 32.1% for 2005. The lower effective tax rate in 2007 compared with 2006 reflects the benefit of higher foreign tax credits and lower state and local taxes, partially offset by the phase out of the benefits received from synthetic fuel credits. The slight decrease in the effective tax rate in 2006 compared with 2005 primarily reflected the increased benefit from foreign operations offset by lower tax-exempt income and lower credits from low-income housing.
The projected effective tax rate for 2008, excluding merger and integration expense, is expected to range between 33.75% and 34.25%. The projected increase in the effective tax rate over 2007 is primarily attributable to the loss of synthetic fuel credits, higher expected pre-tax income, and the adverse effect of the merger with Mellon on New York state and local income taxes.
We made synthetic fuel and low-income housing (Sections 29 and 42 of the Internal Revenue Code, respectively) investments that generate tax credits, which have the effect of reducing our tax expense. We invested in leveraged leases which, through accelerated depreciation, postpone the payment of taxes to future years. For financial statement purposes, deferred taxes are recorded as a liability for future payment.
In 2007, our effective tax rate benefited from synthetic fuel tax credits. These credits are related to investments that produce alternative fuel from coal by-products and were impacted by the price of oil. To manage our exposure in 2007 to the risk of increases in oil prices that could have reduced synthetic fuel tax credits, we entered into an option contract covering a specified number of barrels of oil that settled at the end of 2007. The option contract economically hedges a portion of our projected 2007 synthetic fuel tax credit benefit. The contract did not qualify for hedge
accounting and, as a result, changes in the fair value of the option were recorded in trading income. The synthetic fuel program terminated at the end of 2007.
Extraordinary (loss) - Consolidation of Three Rivers Funding Corporation (“TRFC”)
On Dec. 31, 2007, we called the first loss notes of TRFC, making us the primary beneficiary and triggering the consolidation of TRFC. The consolidation resulted in the recognition of an extraordinary (loss) (non-cash accounting charge) of $180 million after-tax, or $0.19 per share, representing the mark to market discount from par associated with spread widening for the assets in TRFC.
Strategically TRFC was not core to our focus on high growth global opportunities in Asset Management and Securities Servicing; it had an immaterial impact on our consolidated financial results, generating only $4 million of fee revenue in 2007. Furthermore, the continuing disruption in the capital markets negatively impacted TRFC funding costs and related returns, which was in sharp contrast to our funding costs and balance sheet strength. Consolidation improves the profitability of this portfolio by enabling use of cheaper funding generated by BNY Mellon as opposed to costlier funding generated by TRFC.
In addition to the extraordinary (loss), the size of the Dec. 31, 2007 balance sheet increased by the full amount of third party commercial paper funding previously issued by TRFC of approximately $4.0 billion. At Dec. 31, 2007, we held $136 million of TRFC’s commercial paper, which was eliminated upon consolidation.
As a result of our excess liquidity, we were able to eliminate the TRFC commercial paper in the first quarter of 2008. Eliminating the TRFC commercial paper is expected to result in an improvement in our adjusted tangible common equity ratio of approximately 10 basis points during the first quarter of 2008.
Also prospectively, the $180 million after-tax mark to market on the TRFC assets is expected to be accreted into income over the remaining lives of the assets, which are currently projected to average approximately 4-5 years, dependent upon the credit quality of the assets.
The fair value of TRFC’s asset-backed securities portfolio, which is included in our securities available for sale portfolio, totaled approximately $3.5 billion at
16 The Bank of New York Mellon Corporation
Results of Operations(continued)
Dec. 31, 2007. Below are TRFC’s asset and mortgage-backed securities by credit rating received from external rating agencies.
| | | | | | | | | | | | | | | | |
Credit ratings for TRFC’s asset and mortgage-backed securities
Dec. 31, 2007 | | | | | | | | | |
| (dollar amounts in millions) | | AAA | | | AA | | | A | | | Total | |
Variable & fixed rate mortgages | | $ | 1,608 | | | | - | | | | - | | | $ | 1,608 | |
Home equity lines of credit | | | 799 | | | | - | | | | - | | | | 799 | |
Credit cards | | | - | | | | 39 | | | | 701 | | | | 740 | |
Subprime mortgage loans | | | 270 | | | | - | | | | - | | | | 270 | |
Other asset-backed securities | | | 30 | | | | 20 | | | | - | | | | 50 | |
Total | | $ | 2,707 | (a) | | $ | 59 | | | $ | 701 | | | $ | 3,467 | |
Percent | | | 78 | % | | | 2 | % | | | 20 | % | | | 100 | % |
| (a) | Includes $802 million wrapped with monoline insurance. |
In addition to these securities, TRFC has approximately $400 million of securitizations of client receivables that are structured to meet a credit rating of A. These securitizations are recorded as commercial loans in the loan portfolio.
Business segments review
We have an internal information system that produces performance data for our seven business segments along product and service lines.
Business segments accounting principles
Our segment data has been determined on an internal management basis of accounting, rather than the generally accepted accounting principles used for consolidated financial reporting. These measurement principles are designed so that reported results of the segments will track their economic performance.
The accounting policies of the business segments are the same as those described in Note 1 of Notes to Consolidated Financial Statements except that segment results are subject to restatement whenever improvements are made in the measurement principles or when organizational changes are made. Net interest revenue differs from the amounts shown in the Consolidated Income Statement because amounts presented in the Business Segments are on an FTE basis. In 2007, in connection with the merger with Mellon, business segment reporting was realigned to reflect the new business structure of the combined company. In addition, several allocation methodologies were also revised to achieve greater harmonization with Mellon’s methodologies. Segment
data for 2006 and 2005 has been restated to reflect these revisions. The operations of acquired businesses are integrated with the existing business segments soon after most acquisitions are completed. As a result of the integration of staff support functions, management of customer relationships, operating processes and the financial impact of funding the acquisitions, we cannot precisely determine the impact of acquisitions on income before taxes and therefore do not report it.
We provide segment data for seven segments, with certain segments combined into sector groupings as shown below:
| | · | | Asset and Wealth Management Sector |
| | · | | Asset Management segment |
| | · | | Wealth Management segment |
| | · | | Institutional Services Sector |
| | · | | Asset Servicing segment |
| | · | | Issuer Services segment |
| | · | | Clearing and Execution Services segment |
| | · | | Treasury Services segment |
Business segment information is reported on a continuing operations basis for all periods presented. See Note 5 of Notes to Consolidated Financial Statements for a discussion of discontinued operations.
The results of our business segments are presented and analyzed on an internal management reporting basis:
| | · | | Revenue amounts reflect fee and other revenue generated by each segment, as well as fee and other revenue transferred between segments under revenue transfer agreements. |
| | · | | Revenues and expenses associated with specific client bases are included in those segments. For example, foreign exchange activity associated with clients using custody products is allocated to the Asset Servicing segment within the Institutional Services Sector. |
| | · | | Balance sheet assets and liabilities and their related income or expense are specifically assigned to each segment. Segments with a net liability position have also been allocated assets from the securities portfolio. |
| | · | | Net interest revenue is allocated to segments based on the yields on the assets and liabilities generated by each segment. We employ a funds transfer pricing system that matches funds with |
The Bank of New York Mellon Corporation 17
Results of Operations(continued)
| | the specific assets and liabilities of each segment based on their interest sensitivity and maturity characteristics. |
| | · | | The measure of revenues and profit or loss by a segment has been adjusted to present segment data on an FTE basis. |
| | · | | The provision for credit losses is allocated to segments based on changes in each segment’s credit risk during the period. Previously, the provision for credit losses was based on management’s judgment as to average credit losses that would have been incurred in the |
| | operations of the segment over a credit cycle of a period of years. |
| | · | | Support and other indirect expenses are allocated to segments based on internally-developed methodologies. |
| | · | | Goodwill and intangible assets are reflected within individual business segments. |
| | · | | The operations of the Acquired Corporate Trust Business are included only from Oct. 1, 2006, the date on which it was acquired. |
| | · | | The operations of Mellon are included only from July 1, 2007, the effective date of the merger. |
| | | | | | | | | | | | |
| Market indexes | | | | | | | | Inc/(Dec) | |
| | | 2007 | | 2006 | | 2005 | | 2007
vs.
2006 | | | 2006
vs.
2005 | |
| | | | | | | | | | | | |
S&P 500 Index(a) | | 1468 | | 1418 | | 1248 | | 4 | % | | 14 | % |
FTSE 100 Index (a) | | 6457 | | 6221 | | 5619 | | 4 | | | 11 | |
NASDAQ Composite Index(a) | | 2652 | | 2415 | | 2205 | | 10 | | | 10 | |
Lehman Brothers Aggregate BondSM Index(a) | | 257.5 | | 226.6 | | 206.2 | | 14 | | | 10 | |
MSCI EAFE® Index(a) | | 2253.4 | | 2074.5 | | 1680.1 | | 9 | | | 23 | |
NYSE Volume(in billions) | | 532.0 | | 458.5 | | 415.1 | | 16 | | | 10 | |
NASDAQ Volume(in billions) | | 539.7 | | 502.6 | | 449.2 | | 7 | | | 12 | |
The merger with Mellon in July 2007, the acquisition of the Acquired Corporate Trust Business and the BNY ConvergEx transaction in October 2006, had a considerable impact on the business segment results in 2007 compared with 2006. The merger with Mellon significantly impacted the Asset Management, Wealth Management and the Asset Servicing segments and, to a lesser extent, the Issuer Services, Treasury Services and the Other segments. The Acquired Corporate Trust Business primarily impacted the Issuer Services segment. The BNY ConvergEx transaction primarily impacted the Clearing and Execution Services segment. The volatile market environment also impacted the business segments in 2007, as reflected by a strong year in securities lending, foreign exchange and other trading activities, as well as clearing and execution revenue. The growth in clearing and execution revenue was offset by the disposition of certain businesses in the BNY ConvergEx transaction. Depositary Receipts were also
strong in 2007, reflecting business growth and corporate actions. Non-program equity trading volumes increased 17% in 2007 compared with 2006. In addition, average daily U.S. fixed-income trading volume was up 13%. Total debt issuance decreased 6% in 2007 compared with 2006. The issuance of global collateralized debt obligations decreased 12% compared with 2006.
The changes in the value of market indices impact fee revenue in the Asset and Wealth Management segments and our securities servicing businesses. Using the S&P 500 as a proxy for the equity markets, we estimate that a 100 point change in the value of the S&P 500, sustained for one year, impacts fee revenue by approximately 1% and fully diluted EPS on a continuing operations basis by $0.05 per share. The consolidating schedules below show the contribution of our segments to our overall profitability.
18 The Bank of New York Mellon Corporation
Results of Operations(continued)
| | | | | | | | | | | | | | | | | | | | | | | | | | | | | | | | | | | | | | | | |
For the year ended
Dec. 31, 2007(a) (in millions, presented on an
FTE basis) | | Asset
Management | | | Wealth
Management | | | Total Asset &
Wealth
Management
Sector | | | Asset
Servicing | | | Issuer
Services | | | Clearing &
Execution
Services | | | Treasury
Services | | | Total
Institutional
Services
Sector | | | Other
Segment | | | Total
Continuing
Operations | |
Fee and other revenue | | $ | 1,865 | | | $ | 436 | | | $ | 2,301 | | | $ | 2,928 | | | $ | 1,660 | | | $ | 1,360 | | | $ | 748 | | | $ | 6,696 | | | $ | 54 | | | $ | 9,051 | |
Net interest revenue | | | 14 | | | | 199 | | | | 213 | | | | 721 | | | | 567 | | | | 304 | | | | 489 | | | | 2,081 | | | | 18 | | | | 2,312 | |
Total revenue | | | 1,879 | | | | 635 | | | | 2,514 | | | | 3,649 | | | | 2,227 | | | | 1,664 | | | | 1,237 | | | | 8,777 | | | | 72 | | | | 11,363 | |
Provision for credit losses | | | - | | | | - | | | | - | | | | - | | | | - | | | | - | | | | - | | | | - | | | | (10 | ) | | | (10 | ) |
Noninterest expense | | | 1,392 | | | | 479 | | | | 1,871 | | | | 2,481 | | | | 1,159 | | | | 1,220 | | | | 650 | | | | 5,510 | | | | 735 | | | | 8,116 | |
Income before taxes | | $ | 487 | | | $ | 156 | | | $ | 643 | | | $ | 1,168 | | | $ | 1,068 | | | $ | 444 | | | $ | 587 | | | $ | 3,267 | | | $ | (653 | ) | | $ | 3,257 | |
Pre-tax operating margin(b) | | | 26 | % | | | 25 | % | | | 26 | % | | | 32 | % | | | 48 | % | | | 27 | % | | | 47 | % | | | 37 | % | | | N/M | | | | 29 | % |
Average assets(c) | | $ | 7,387 | | | $ | 8,062 | | | $ | 15,449 | | | $ | 17,095 | | | $ | 6,331 | | | $ | 15,482 | | | $ | 18,057 | | | $ | 56,965 | | | $ | 76,175 | | | $ | 148,589 | |
Excluding intangible amortization: | | | | | | | | | | | | | | | | | | | | | | | | | | | | | | | | | | | | | | | | |
Noninterest expense | | $ | 1,244 | | | $ | 437 | | | $ | 1,681 | | | $ | 2,466 | | | $ | 1,084 | | | $ | 1,196 | | | $ | 636 | | | $ | 5,382 | | | $ | 734 | | | $ | 7,797 | |
Income before taxes | | | 635 | | | | 198 | | | | 833 | | | | 1,183 | | | | 1,143 | | | | 468 | | | | 601 | | | | 3,395 | | | | (652 | ) | | | 3,576 | |
Pre-tax operating margin(b) | | | 34 | % | | | 31 | % | | | 33 | % | | | 32 | % | | | 51 | % | | | 28 | % | | | 49 | % | | | 39 | % | | | N/M | | | | 31 | % |
| (a) | Results for 2007 include six months of the combined Company’s results and six months of legacy The Bank of New York only. |
| (b) | Income before taxes divided by total revenue. |
| (c) | Includes average assets of discontinued operations of $53 million for 2007, consolidated average assets were $148.642 billion for 2007. |
| | | | | | | | | | | | | | | | | | | | | | | | | | | | | | | | | | | | | | | | |
Legacy The Bank of New York only | |
For the year ended Dec. 31, 2006 (in millions, presented on an FTE basis) | | Asset
Management | | | Wealth
Management | | | Total Asset &
Wealth
Management
Sector | | | Asset
Servicing | | | Issuer
Services | | | Clearing &
Execution
Services | | | Treasury
Services | | | Total
Institutional
Services
Sector | | | Other
Segment | | | Total
Continuing
Operations | |
Fee and other revenue | | $ | 357 | | | $ | 198 | | | $ | 555 | | | $ | 1,712 | | | $ | 961 | | | $ | 1,359 | | | $ | 570 | | | $ | 4,602 | | | $ | 182 | | | $ | 5,339 | |
Net interest revenue | | | 15 | | | | 60 | | | | 75 | | | | 476 | | | | 258 | | | | 278 | | | | 392 | | | | 1,404 | | | | 42 | | | | 1,521 | |
Total revenue | | | 372 | | | | 258 | | | | 630 | | | | 2,188 | | | | 1,219 | | | | 1,637 | | | | 962 | | | | 6,006 | | | | 224 | | | | 6,860 | |
Provision for credit losses | | | - | | | | (2 | ) | | | (2 | ) | | | - | | | | - | | | | (4 | ) | | | 5 | | | | 1 | | | | (19 | ) | | | (20 | ) |
Noninterest expense | | | 237 | | | | 210 | | | | 447 | | | | 1,630 | | | | 615 | | | | 1,201 | | | | 510 | | | | 3,956 | | | | 285 | | | | 4,688 | |
Income before taxes | | $ | 135 | | | $ | 50 | | | $ | 185 | | | $ | 558 | | | $ | 604 | | | $ | 440 | | | $ | 447 | | | $ | 2,049 | | | $ | (42 | ) | | $ | 2,192 | |
Pre-tax operating margin(a) | | | 36 | % | | | 19 | % | | | 29 | % | | | 26 | % | | | 50 | % | | | 27 | % | | | 46 | % | | | 34 | % | | | N/M | | | | 32 | % |
Average assets(b) | | $ | 1,072 | | | $ | 1,489 | | | $ | 2,561 | | | $ | 8,596 | | | $ | 2,004 | | | $ | 16,436 | | | $ | 16,274 | | | $ | 43,310 | | | $ | 50,607 | | | $ | 96,478 | |
Excluding intangible amortization: | | | | | | | | | | | | | | | | | | | | | | | | | | | | | | | | | | | | | | | | |
Noninterest expense | | $ | 222 | | | $ | 210 | | | $ | 432 | | | $ | 1,617 | | | $ | 597 | | | $ | 1,171 | | | $ | 510 | | | $ | 3,895 | | | $ | 285 | | | $ | 4,612 | |
Income before taxes | | | 150 | | | | 50 | | | | 200 | | | | 571 | | | | 622 | | | | 470 | | | | 447 | | | | 2,110 | | | | (42 | ) | | | 2,268 | |
Pre-tax operating margin(a) | | | 40 | % | | | 19 | % | | | 32 | % | | | 26 | % | | | 51 | % | | | 29 | % | | | 46 | % | | | 35 | % | | | N/M | | | | 33 | % |
| (a) | Income before taxed divided by total revenue. |
| (b) | Including average assets of discontinued operations of $10.364 billion for 2006, consolidated average assets were $106.842 billion for 2006. |
| | | | | | | | | | | | | | | | | | | | | | | | | | | | | | | | | | | | | | | | |
Legacy The Bank of New York only | |
For the year ended Dec. 31, 2005 (in millions, presented on an FTE basis) | | Asset
Management | | | Wealth
Management | | | Total Asset &
Wealth
Management
Sector | | | Asset
Servicing | | | Issuer
Services | | | Clearing &
Execution
Services | | | Treasury
Services | | | Total
Institutional
Services
Sector | | | Other
Segment | | | Total
Continuing
Operations | |
Fee and other revenue | | $ | 262 | | | $ | 192 | | | $ | 454 | | | $ | 1,560 | | | $ | 683 | | | $ | 1,318 | | | $ | 638 | | | $ | 4,199 | | | $ | 62 | | | $ | 4,715 | |
Net interest revenue | | | 24 | | | | 50 | | | | 74 | | | | 421 | | | | 156 | | | | 221 | | | | 396 | | | | 1,194 | | | | 99 | | | | 1,367 | |
Total revenue | | | 286 | | | | 242 | | | | 528 | | | | 1,981 | | | | 839 | | | | 1,539 | | | | 1,034 | | | | 5,393 | | | | 161 | | | | 6,082 | |
Provision for credit losses | | | - | | | | - | | | | - | | | | - | | | | - | | | | 8 | | | | 5 | | | | 13 | | | | (20 | ) | | | (7 | ) |
Noninterest expense | | | 159 | | | | 181 | | | | 340 | | | | 1,474 | | | | 429 | | | | 1,175 | | | | 538 | | | | 3,616 | | | | 128 | | | | 4,084 | |
Income before taxes | | $ | 127 | | | $ | 61 | | | $ | 188 | | | $ | 507 | | | $ | 410 | | | $ | 356 | | | $ | 491 | | | $ | 1,764 | | | $ | 53 | | | $ | 2,005 | |
Pre-tax operating margin(a) | | | 44 | % | | | 25 | % | | | 36 | % | | | 26 | % | | | 49 | % | | | 23 | % | | | 47 | % | | | 33 | % | | | 33 | % | | | 33 | % |
Average assets(b) | | $ | 915 | | | $ | 1,272 | | | $ | 2,187 | | | $ | 4,174 | | | $ | 1,301 | | | $ | 17,349 | | | $ | 13,695 | | | $ | 36,519 | | | $ | 47,613 | | | $ | 86,319 | (b) |
Excluding intangible amortization: | | | | | | | | | | | | | | | | | | | | | | | | | | | | | | | | | | | | | | | | |
Noninterest expense | | $ | 156 | | | $ | 181 | | | $ | 337 | | | $ | 1,468 | | | $ | 427 | | | $ | 1,146 | | | $ | 538 | | | $ | 3,579 | | | $ | 128 | | | $ | 4,044 | |
Income before taxes | | | 130 | | | | 61 | | | | 191 | | | | 513 | | | | 412 | | | | 385 | | | | 491 | | | | 1,801 | | | | 53 | | | | 2,045 | |
Pre-tax operating margin(a) | | | 45 | % | | | 25 | % | | | 36 | % | | | 26 | % | | | 49 | % | | | 25 | % | | | 47 | % | | | 33 | % | | | 33 | % | | | 34 | % |
| (a) | Income before taxes divided by total revenue. |
| (b) | Including average assets of discontinued operations of $15.116 billion for 2005, consolidated average assets were $101.435 billion for 2005. |
The Bank of New York Mellon Corporation 19
Results of Operations(continued)
Asset and Wealth Management Sector
Asset and Wealth Management fee revenue is dependent on the overall level and mix of assets under management (“AUM”) and the management fees expressed in basis points (one-hundredth of one percent) charged for managing those assets. Assets under management were $1.121 trillion at Dec. 31, 2007, compared with $142 billion at Dec. 31, 2006. The year-over-year increase in AUM primarily reflects the merger with Mellon and continued growth across asset classes and strategies.
Performance fees are also earned in the Asset and Wealth Management sector. These fees are generally calculated as a percentage of a portfolio’s performance in excess of a benchmark index or a peer group’s performance.
The overall level of assets under management for a given period is determined by:
| | · | | the beginning level of assets under management; |
| | · | | the net flows of new assets during the period resulting from new business wins and existing client enrichments reduced by losses and withdrawals; and |
| | · | | the impact of market price appreciation or depreciation, the impact of any acquisitions or divestitures and foreign exchange rates. |
These components are shown in the changes in market value of assets under management table below. The mix of assets under management is determined principally by client asset allocation decisions among equities, fixed income, alternative investments and overlay and money markets. The trend of this mix is shown in the assets under management at period end, by product type, table below.
Managed equity assets typically generate higher percentage fees than money market and fixed-income assets. Also, actively managed assets typically generate higher management fees than indexed or passively managed assets of the same type.
Management fees are typically subject to fee schedules based on the overall level of assets managed for a single client or by individual asset class and style. This is most prevalent for institutional assets where amounts we manage for individual clients are typically large.
A key driver of organic growth in asset and wealth management fees is the amount of net new business flows of assets under management. Overall market conditions are also key drivers with a key long-term economic driver being the growth rate of financial assets as measured by the U.S. Federal Reserve. This measure encompasses both net flows and market appreciation or depreciation in the U.S. markets overall.
| | | | | | | | | | | | | | | |
| Assets under management at period-end, by product type | | 2007 | | Legacy The Bank of New York only |
| (in billions) | | | 2006 | | 2005 | | 2004 | | 2003 |
Equity securities | | $ | 460 | | $ | 39 | | $ | 37 | | $ | 36 | | $ | 30 |
Fixed income securities | | | 218 | | | 21 | | | 20 | | | 22 | | | 19 |
Alternative investments and overlay | | | 147 | | | 44 | | | 25 | | | 24 | | | 15 |
Money market | | | 296 | | | 38 | | | 33 | | | 29 | | | 31 |
Total assets under management | | $ | 1,121 | | $ | 142 | | $ | 115 | | $ | 111 | | $ | 95 |
| | | | | | | | | | | | | | | |
| Assets under management at period-end, by client type | | 2007 | | Legacy The Bank of New York only |
| (in billions) | | | 2006 | | 2005 | | 2004 | | 2003 |
Institutional | | $ | 671 | | $ | 105 | | $ | 82 | | $ | 79 | | $ | 65 |
Mutual funds | | | 349 | | | 15 | | | 11 | | | 10 | | | 9 |
Private client | | | 101 | | | 22 | | | 22 | | | 22 | | | 21 |
Total assets under management | | $ | 1,121 | | $ | 142 | | $ | 115 | | $ | 111 | | $ | 95 |
20 The Bank of New York Mellon Corporation
Results of Operations(continued)
| | | | | | | | | | | | |
| Changes in market value of assets under management from Dec. 31, 2006 to Dec. 31, 2007 - by business segment | |
| (in billions) | | Asset
Management | | | Wealth
Management | | | Total | |
Market value of assets under management at Dec. 31, 2006: | | | | | | | | | | | | |
The Bank of New York | | $ | 118 | | | $ | 24 | | | $ | 142 | |
Mellon at June 30, 2007 | | | 868 | | | | 61 | | | | 929 | |
Net inflows (outflows): (a) | | | | | | | | | | | | |
Long-term | | | (17 | ) | | | 2 | | | | (15 | ) |
Money market | | | 70 | | | | - | | | | 70 | |
| | | | | | | | | | | | |
Total net inflows | | | 53 | | | | 2 | | | | 55 | |
Net market depreciation(b) | | | (4 | ) | | | (1 | ) | | | (5 | ) |
Market value of assets under management at Dec. 31, 2007 | | $ | 1,035 | | | $ | 86 | | | $ | 1,121 | |
| (a) | Excludes $18 bilion of net flows from Mellon during the first six months of 2007. |
| (b) | Includes the effect of changes in foreign exchange rates. |
At Dec. 31, 2007, the investment portfolio of money market funds under management included approximately $2.9 billion of senior notes issued by structured investment vehicles (“SIVs”), which represented 1% of the portfolio. During January and February of 2008, $1.2 billion of these securities matured. At February 27, 2008, the remaining $1.7 billion balance is to bank-sponsored SIVs and all sponsors have agreed to support the notes which are scheduled to mature in the first half of 2008.
Asset Management segment
| | | | | | | | | | | |
(dollar amounts in millions, unless
otherwise noted; presented on an
FTE basis) | | 2007 | | | 2006 (a) | | | 2007
vs.
2006 | |
Revenue: | | | | | | | | | | | |
Asset and wealth management: | | | | | | | | | | | |
Mutual funds | | $ | 637 | | | $ | 10 | | | N/M | |
Institutional clients | | | 821 | | | | 252 | | | 226 | % |
Private clients | | | 122 | | | | 48 | | | 154 | |
| | | | | | | | | | | |
Total asset management revenue | | | 1,580 | | | | 310 | | | 410 | |
Performance fees | | | 93 | | | | 35 | | | 166 | |
Distribution and servicing | | | 193 | | | | - | | | N/M | |
Other | | | (1 | ) | | | 12 | | | (108 | ) |
| | | | | | | | | | | |
Total fee and other revenue | | | 1,865 | | | | 357 | | | 422 | |
Net interest revenue | | | 14 | | | | 15 | | | (7 | ) |
| | | | | | | | | | | |
Total revenue | | | 1,879 | | | | 372 | | | 405 | |
Noninterest expense (excluding intangible amortization) | | | 1,244 | | | | 222 | | | 460 | |
| | | | | | | | | | | |
Income before taxes (excluding intangible amortization) | | | 635 | | | | 150 | | | 323 | |
Amortization of intangible assets | | | 148 | | | | 15 | | | N/M | |
| | | | | | | | | | | |
Income before taxes | | $ | 487 | | | $ | 135 | | | 261 | % |
| | | | | | | | | | | |
Memo: Income before taxes (excluding intangible amortization and non- operating items) (b) | | $ | 667 | | | $ | 150 | | | 345 | % |
Pre-tax operating margin (excluding intangible amortization) | | | 34 | % | | | 40 | % | | | |
Average assets | | $ | 7,387 | | | $ | 1,072 | | | 589 | % |
| (a) | Legacy The Bank of New York only. |
| (b) | Results for 2007 exclude a pre-tax charge ($32 million) related to the write-off of the value of the remaining interest in a legacy Mellon hedge fund manager that was disposed of in 2006. |
The Bank of New York Mellon Corporation 21
Results of Operations(continued)
Business description
BNY Mellon Asset Management is the umbrella organization for all of our affiliated investment management firms and is responsible, through various subsidiaries, for U.S. and non-U.S. retail, intermediary and institutional distribution of investment management and related services. The investment management firms offer a broad range of equity, fixed income, cash and alternative/overlay products. In addition to the investment subsidiaries, BNY Mellon Asset Management consists of BNY Mellon Asset Management International (formerly Mellon Global Investments), which is responsible for the distribution of investment management products internationally and the Dreyfus Corporation which is responsible for U.S. distribution of retail mutual funds, separate accounts and annuities.
We are the 13th largest global asset manager; and the 9th largest U.S. asset manager; and the 7th largest asset manager in Europe. We are also a top five tax-exempt, institutional U.S. asset manager.
The results of the Asset Management segment are mainly driven by the period-end and average levels of assets managed as well as the mix of those assets, as shown in the table on page 20. Results for this segment are also impacted by sales of fee-based products such as fixed and variable annuities and separately managed accounts. Expenses in this segment are mainly driven by staffing costs, incentives, distribution and servicing expense, and product distribution costs.
Review of financial results
Income before taxes was $487 million in 2007 compared with $135 million in 2006. Income before taxes (excluding intangible amortization) was $635 million in 2007 compared with $150 million in 2006. Results in 2007 included a $32 million charge related to the write-off of the value of the remaining interest in a hedge fund manager that was disposed of in 2006. Excluding this charge, income before taxes (excluding intangible amortization) was $667 million in 2007.
Fee and other revenue was $1.865 billion in 2007 compared with $357 million in 2006 primarily reflecting the merger with Mellon, net new business and improved equity markets. Performance fees increased $58 million in 2007 reflecting fees received on funds acquired in the merger with Mellon. The increase in distribution and servicing fees reflect the
merger with Mellon. See the “Fee and Other Revenue” section for a discussion of distribution and servicing fees. Other fee revenue decreased, principally reflecting the lower market value of seed capital investments due to the market environment in 2007.
Noninterest expense (excluding intangible amortization) was $1.244 billion in 2007, compared with $222 million in 2006, primarily reflecting the merger with Mellon and higher incentive compensation, temporary labor, technology, legal expenses and the write-off of the remaining interest in a hedge fund manager.
2006 compared with 2005
Income before taxes was $135 million in 2006, compared with $127 million in 2005. Income before taxes (excluding intangible amortization) was $150 million in 2006 compared with $130 million in 2005. Fee and other revenue increased $95 million, primarily due to a rise in equity market levels and higher performance fees. Noninterest expense (excluding intangible amortization) increased $66 million in 2006 compared with 2005 primarily due to acquisitions, higher staff costs, incentive compensation and technology costs.
Wealth Management segment
| | | | | | | | | | | |
(dollar amounts in millions, unless
otherwise noted; presented on an
FTE basis) | | 2007 | | | 2006 (a) | | | 2007 vs
2006 | |
Revenue: | | | | | | | | | | | |
Asset and wealth management | | $ | 408 | | | $ | 193 | | | 111 | % |
Other | | | 28 | | | | 5 | | | N/M | |
| | | | | | | | | | | |
Total fee & other revenue | | | 436 | | | | 198 | | | 120 | |
Net interest revenue | | | 199 | | | | 60 | | | 232 | |
| | | | | | | | | | | |
Total revenue | | | 635 | | | | 258 | | | 146 | |
Provision for credit losses | | | - | | | | (2 | ) | | N/M | |
Noninterest expense (excluding intangible amortization) | | | 437 | | | | 210 | | | 108 | |
| | | | | | | | | | | |
Income before taxes (excluding intangible amortization) | | | 198 | | | | 50 | | | 296 | |
Amortization of intangible assets | | | 42 | | | | - | | | N/M | |
| | | | | | | | | | | |
Income before taxes | | $ | 156 | | | $ | 50 | | | 212 | |
| | | | | | | | | | | |
Pre-tax operating margin (excluding intangible amortization) | | | 31 | % | | | 19 | % | | | |
Average assets | | $ | 8,062 | | | $ | 1,489 | | | 441 | % |
Average loans | | | 4,033 | | | | 1,391 | | | 190 | |
Average deposits | | | 6,175 | | | | 1,114 | | | 454 | |
Market value of total client assets at period-end(in billions) | | $ | 170 | | | $ | 59 | | | 188 | % |
| (a) | Legacy The Bank of New York only. |
22 The Bank of New York Mellon Corporation
Results of Operations(continued)
Business description
In the Wealth Management segment, we offer a full array of investment management, wealth and estate planning and private banking and finance solutions to help clients protect, grow and transfer their wealth. Clients include predominantly high-net-worth individuals, families, family offices and business enterprises, charitable gift programs and endowments and foundations. BNY Mellon Wealth Management is a top ten U.S. wealth manager with $170 billion in client assets. We serve our clients through an expansive network of 80 offices globally. The activities of Mellon 1st Business Bank, N.A. and Mellon United National Bank are included in this segment.
The results of the Wealth Management segment are driven by the level and mix of assets managed and custodied and the level of activity in client accounts.
Net interest revenue is determined by the level of interest spread between loans and deposits. Expenses of this segment are driven mainly by staff expense in the investment management, sales, service and support groups.
Review of financial results
Income before taxes was $156 million in 2007 compared with $50 million in 2006. Income before taxes (excluding intangible amortization) was $198 million in 2007 compared with $50 million in 2006.
Total fee and other revenue was $436 million in 2007 compared with $198 million in 2006. The increase resulted from the merger with Mellon, organic growth, with record net new business and market performance.
Net interest revenue increased $139 million compared with 2006, reflecting the merger with Mellon and increased deposit levels.
Noninterest expense (excluding intangible amortization) increased $227 million compared with 2006, primarily reflecting the merger with Mellon, as well as expenses associated with new distribution channels.
Total client assets were $170 billion at Dec. 31, 2007, compared with $59 billion at Dec. 31, 2006. The increase resulted from the merger with Mellon, new business, enrichments and higher market levels in 2007.
2006 compared with 2005
Income before taxes was $50 million in 2006 compared with $61 million in 2005. Excluding intangible amortization, income before taxes decreased $11 million. Fee and other revenue increased $6 million due to organic growth and strong market performance. Net interest revenue increased $10 million as a result of wider spreads given higher interest rates. Noninterest expense (excluding intangible amortization) increased $29 million due to higher staff and technology costs.
Institutional Services Sector
As of Dec. 31, 2007, our assets under custody and administration increased to $23.1 trillion, from $15.5 trillion at Dec. 31, 2006 and $11.4 trillion at Dec 31, 2005. The increase in assets under custody and administration compared with 2006 primarily reflects the merger with Mellon, growth in the custody business, rising asset prices and the impact of the Acquired Corporate Trust Business. Equity securities comprised 32% and fixed-income securities were 68% of the assets under custody and administration at Dec. 31, 2007, compared with 33% equity securities and 67% fixed-income securities at Dec. 31, 2006. Assets under custody and administration at Dec. 31, 2007 consisted of assets related to the custody, mutual funds, and corporate trust businesses of $18.3 trillion, broker-dealer services assets of $2.5 trillion, and all other assets of $2.3 trillion.
| | | | | | | | | | | | | | | | | | | | |
| | | 2007 | | | Legacy The Bank of New York only | |
| | | | 2006 | | | 2005 | | | 2004 | | | 2003 | |
Market value of assets under custody and administration at period-end(in trillions) | | $ | 23.1 | (b) | | $ | 15.5 | (a) | | $ | 11.4 | (a) | | $ | 10.0 | (a) | | $ | 8.6 | (a) |
Market value of securities on loan at period-end(in billions) (c) | | $ | 633 | | | $ | 399 | | | $ | 311 | | | $ | 232 | | | $ | 174 | |
| (a) | Revised for Acquired Corporate Trust Business and harmonization adjustments. |
| (b) | Includes the assets under custody or administration of CIBC Mellon Global Securities Services, a joint venture between BNY Mellon and the Canadian Imperial Bank of Commerce of $989 billion at Dec. 31, 2007. |
| (c) | Represents the total amount of securities on loan, both cash and non-cash managed by the Asset Servicing segment. |
The Bank of New York Mellon Corporation 23
Results of Operations(continued)
Asset Servicing segment
| | | | | | | | | | | |
(dollar amounts in
millions, unless
otherwise noted;
presented on an FTE
basis) | | 2007 | | | 2006 (a) | | | 2007 vs. 2006 | |
Revenue: | | | | | | | | | | | |
Securities servicing fees- Asset servicing | | $ | 2,293 | | | $ | 1,396 | | | 64 | % |
Foreign exchange and other trading activities | | | 511 | | | | 215 | | | 138 | |
Other | | | 124 | | | | 101 | | | 23 | |
| | | | | | | | | | | |
Total fee and other revenue | | | 2,928 | | | | 1,712 | | | 71 | |
Net interest revenue | | | 721 | | | | 476 | | | 51 | |
| | | | | | | | | | | |
Total revenue | | | 3,649 | | | | 2,188 | | | 67 | |
Noninterest expense (excluding intangible amortization) | | | 2,466 | | | | 1,617 | | | 53 | |
| | | | | | | | | | | |
Income before taxes (excluding intangible amortization) | | | 1,183 | | | | 571 | | | 107 | |
Amortization of intangible assets | | | 15 | | | | 13 | | | 15 | |
| | | | | | | | | | | |
Income before taxes | | $ | 1,168 | | | $ | 558 | | | 109 | % |
| | | | | | | | | | | |
Pre-tax operating margin (excluding intangible amortization) | | | 32 | % | | | 26 | % | | | |
Average assets | | $ | 17,095 | | | $ | 8,596 | | | 99 | % |
Average deposits | | | 34,108 | | | | 23,065 | | | 48 | |
Securities lending revenue | | | 365 | | | | 170 | | | 115 | |
Market value of securities on loan at period-end(in billions) | | | 633 | | | | 399 | | | 59 | % |
| (a) | Legacy The Bank of New York only. |
Business description
The Asset Servicing segment includes global custody, global fund services, securities lending, global liquidity services, outsourcing, government securities clearance, collateral management and credit-related services and other linked revenues, principally foreign exchange. Clients include corporate and public retirement funds, foundations and endowments and global financial institutions including banks, broker-dealers, investment managers, insurance companies and mutual funds.
The results of the Asset Servicing segment are driven by a number of factors which include the level of transactional activity and the extent of services provided including custody, accounting, fund administration, daily valuations, performance measurement and risk analytics, securities lending and
investment manager backoffice outsourcing, as well as the market value of assets under administration and custody. Market interest rates impact both securities lending revenue and the earnings on client cash balances. Broker-dealer fees depend on the level of activity in the fixed income markets and the financing needs of customers, which are typically higher when the equity and fixed-income markets are active. Also, the adoption of tri-party repo arrangements continue to remain a key revenue driver in broker-dealer services. Foreign exchange trading revenues are influenced by the volume of client transactions and the spread realized on these transactions, market volatility in major currencies, the level of cross-border
assets held in custody for clients, the level and nature of underlying cross-border investment and other transactions undertaken by corporate and institutional clients. Segment expenses are principally driven by staffing levels and technology investments necessary to process transaction volumes. Fees paid to subcustodians are driven by market values of global assets and related transaction volumes.
We are one of the leading securities servicing providers globally with a total of $23.1 trillion of assets under custody and administration at Dec. 31, 2007. We are one of the largest mutual fund custodians for U.S. funds and one of the largest providers of fund services in the world, servicing funds with over $4.7 trillion in total assets. We also service more than 45% of the exchange-traded funds in the U.S. Fifty-five percent of the top 20 endowments and 42% of the top 50 endowments are BNY Mellon Asset Servicing clients.
We are a leading custodian in the U.K. and service 35% of U.K. pensions. In securities lending, we are one of the largest lenders of U.S. Treasury securities and depositary receipts and service a lending pool of more than $3 trillion in 30 markets around the world. We are the largest global provider of performance analytics and a leading offshore fund administrator.
Our broker dealer service business is a leader in global clearance, clearing equity and fixed income transactions in more than 100 markets. We clear approximately 50% of the transactions in U.S. Government securities. With $1.6 trillion in tri-party balances worldwide, we are a leading collateral management agent.
Review of financial results
Income before taxes was $1.168 billion in 2007 compared with $558 million in 2006.
24 The Bank of New York Mellon Corporation
Results of Operations(continued)
Total fee and other revenue increased $1.216 billion in 2007 compared with 2006 driven by the merger with Mellon, increased transaction volumes related to market volatility, new business, new assets from existing clients and organic growth across all business products, especially global custody, domestic and international mutual funds, exchange-traded funds, hedge fund servicing and collateral management. European asset servicing continues to gain growth across all products, also reflective of significant cross-border investment interest and capital flow. Securities lending revenue increased $195 million from 2006. The increase from 2006 resulted from the merger with Mellon, higher loan balances in 2007 compared with 2006, as well as a significant widening in spreads reflecting the volatile market environment in the second half of 2007.
The growth in global collateral management was due to new product introduction, new business wins and an industry trend towards centralized collateralized fundings. We handle approximately $1.6 trillion of financing for our broker-dealer clients daily through collateralized financing agreements, up approximately 23% from a year ago.
Foreign exchange and other trading activity increased $296 million compared with 2006, reflecting the merger with Mellon, record customer volumes due to increased activity of our existing client base and the acquisition of new clients, as well as elevated foreign currency volatility in the second half of 2007. Net interest revenue increased $245 million compared with 2006, primarily driven by the merger with Mellon, deposit growth and improved spreads.
Noninterest expense (excluding intangible amortization) increased $849 million compared with 2006 reflecting the merger with Mellon, higher staff expense in support of new business, increased sub-custodian expenses related to higher asset levels, higher joint venture pass-thru payments, higher expenses in support of growth initiatives and a $17 million pre-tax loss related to the purchase of SIV securities from a commingled NAV fund (“CNAV Fund”), which is managed by securities lending. The CNAV Fund is managed to the specifications of a money market fund.
A capital support agreement has been executed for the same CNAV Fund. The fund includes covered SIV securities of Whistle Jacket Capital/White Pine Finance, LLC totaling $185 million (the “Covered Securities”). Under the agreement we will provide capital in specified circumstances to the fund for a period of four months, subject to an aggregate
maximum of $55.5 million. Upon the sale or other disposition of a Covered Security, we are required to contribute capital that is the least of the following amounts: (i) the amount, if any, by which the amortized cost of a Covered Security exceeds the amount realized from the sale or other disposition of the Covered Security; (ii) the amount, if any, necessary to restore the net asset value per share of the fund to a specified threshold amount, or (iii) the remaining amount of the aggregate capital contribution limit, taking into account all prior contributions. We will not receive any consideration from the fund for the contributed capital, if any, under the agreement. As a result of entering into the capital support agreement, we will record an initial non-cash charge equal to the estimated fair value of the agreement, with future changes recorded in earnings during the period of change in fair value. The total expense that will be recorded over the term of the agreement will equal the amount of total capital actually contributed to the fund.
At Dec. 31, 2007, the total of all CNAV Funds which are managed by securities lending had a balance of $150 billion and included $8.9 billion of senior notes issued by SIV’s, all of which were rated AAA. A significant majority of these SIV’s are bank sponsored where the bank has committed to support the SIV.
We continue to monitor exposure to SIV senior note investments in the CNAV Funds we manage. On a case by case basis, depending on future circumstances, we could choose to purchase SIV notes from these funds and/or enter into further capital support agreements with the funds.
2006 compared with 2005
Income before taxes increased $51 million in 2006 compared with 2005. Total fee and other revenue in this segment increased 10% in 2006 compared with 2005 primarily due to market volatility as well as particularly strong growth in broker-dealer services. Securities lending fees increased in 2006 compared with 2005 as strong growth in average loan volumes was partly offset by lower spreads. Revenues from foreign exchange trading were also up significantly, reflecting higher customer volumes driven by cross-border investment flows and greater business from existing clients. Net interest revenue increased $55 million in 2006 compared with 2005, reflecting increased deposit flows. Noninterest expense (excluding intangible amortization) increased $149 million compared with 2005, reflecting higher staff expense, technology cost and sub-custodian expenses.
The Bank of New York Mellon Corporation 25
Results of Operations(continued)
Issuer Services segment
| | | | | | | | | | | |
(dollar amounts in millions,
unless otherwise noted; presented
on an FTE basis) | | 2007 | | | 2006 (a) | | | 2007 vs. 2006 | |
| | | |
| | | |
Revenue: | | | | | | | | | | | |
Securities servicing fees- Issuer services | | $ | 1,560 | | | $ | 895 | | | 74 | % |
Other | | | 100 | | | | 66 | | | 52 | |
| | | | | | | | | | | |
Total fee & other revenue | | | 1,660 | | | | 961 | | | 73 | |
Net interest revenue | | | 567 | | | | 258 | | | 120 | |
| | | | | | | | | | | |
Total revenue | | | 2,227 | | | | 1,219 | | | 83 | |
Provision for credit losses | | | - | | | | - | | | - | |
Noninterest expense (excluding intangible amortization) | | | 1,084 | | | | 597 | | | 82 | |
| | | | | | | | | | | |
Income before taxes (excluding intangible amortization) | | | 1,143 | | | | 622 | | | 84 | |
Amortization of intangible assets | | | 75 | | | | 18 | | | 317 | |
| | | | | | | | | | | |
Income before taxes | | $ | 1,068 | | | $ | 604 | | | 77 | % |
| | | | | | | | | | | |
Pre-tax operating margin (excluding intangible amortization) | | | 51 | % | | | 51 | % | | | |
Average assets | | $ | 6,331 | | | $ | 2,004 | | | 216 | % |
Average deposits | | $ | 21,315 | | | | 7,239 | | | 194 | |
Depositary receipts outstanding(in billions) | | $ | 1,360 | | | $ | 645 | | | 111 | |
Depositary receipt trading value(in billions) | | $ | 519 | | | $ | 178 | | | 192 | |
| (a) | Legacy The Bank of New York only. |
Business description
The Issuer Services segment provides a diverse array of products and services to fixed income and equity issuers, including corporations and shareholders, corporate trust, depositary receipts, employee investment plan services, and shareowner services.
As the world’s largest trustee, we provide diverse services for corporate, municipal, structured, and international debt issuers. We serve as trustee or agent for approximately 90,000 clients with $11 trillion in outstanding debt securities from offices in 54 locations around the world, including 18 non-U.S. locations. We serve as the depositary for more than 1,300 American and global depositary receipt programs, with a 65% market share, acting in partnership with leading companies from 63 countries. In addition to its top-ranked stock transfer agency services, BNY Mellon Shareowner Services offers a comprehensive suite of equity solutions ranging from record keeping and corporate actions processing, demutualizations, direct investment, dividend reinvestment, proxy solicitation and employee stock plan administration.
Fee revenue in the issuer services segment depends on:
| | · | | the volume of issuance of fixed income securities; |
| | · | | depositary receipts issuance and cancellation volume; |
| | · | | corporate actions impacting depositary receipts; and |
| | · | | transfer agency and corporate action volumes. |
Expenses in the Issuer Services segment are driven by staff, equipment, and space required to support the services provided by the segment.
Review of financial results
Income before taxes was up 77% to $1.068 billion in 2007 from $604 million in 2006.
Total fee and other revenue increased $699 million in 2007 compared with 2006. Issuer services fees continued to exhibit strong growth compared with last year. The acquisition of the Acquired Corporate Trust Business and the merger with Mellon significantly impacted comparisons of 2007 to 2006. Issuer services fees increased reflecting higher Depositary Receipts resulting from higher servicing and dividend fees. Depositary Receipts reflect the continued globalization of the world’s equity portfolios which drove higher levels of depositary receipts trading and investment in both U.S. and non-U.S. markets. The growth in Corporate Trust resulted from the Acquired Corporate Trust Business, while growth in Shareowner Services was due to the merger with Mellon.
Other fee revenue increased $34 million compared with 2006 reflecting the Acquired Corporate Trust Business and the merger with Mellon.
Net interest revenue increased $309 million in 2007 compared with 2006, primarily reflecting the impact of the Acquired Corporate Trust Business as well as higher deposits in Shareowner Services. Deposit growth was also impacted by new business and increased client volumes, as well as the merger with Mellon. Average deposits were $21.3 billion in 2007, compared with $7.2 billion in 2006.
Noninterest expense (excluding intangible amortization) increased $487 million in 2007 compared with 2006 reflecting the impact of the Acquired Corporate Trust Business, the merger with Mellon, and expenses associated with revenue growth in Depositary Receipts and Shareowner Services.
26 The Bank of New York Mellon Corporation
Results of Operations(continued)
2006 compared with 2005
Income before taxes increased $194 million in 2006 compared with 2005. Total fee and other revenue in this segment increased $278 million in 2006 compared with 2005, primarily reflecting strong growth in Depositary Receipts and Corporate Trust as well as the results of the Acquired Corporate Trust Business. Net interest revenue increased $102 million compared with 2005, reflecting the positive impact of rising rates on spreads and increased deposit levels generated by the growth in the Acquired Corporate Trust Business.
Noninterest expense (excluding intangible amortization) increased $170 million compared with 2005, reflecting the impact of the Acquired Corporate Trust Business and expenses associated with revenue growth in Depositary Receipts and Corporate Trust. Growth in Depositary Receipts drove sub-custodian expense higher in 2006. Included in 2006 expense was $22 million of transition services expense associated with the Acquired Corporate Trust Business.
Clearing & Execution Services segment
| | | | | | | | | | | |
(dollar amounts in millions, unless
otherwise noted; presented on an FTE
basis) | | 2007 | | | 2006 (a) | | | 2007
vs.
2006 | |
Revenue: | | | | | | | | | | | |
Securities servicing fees-Clearing & execution services | | $ | 1,186 | | | $ | 1,210 | | | (2 | )% |
Other | | | 174 | | | | 149 | | | 17 | |
| | | | | | | | | | | |
Total fee & other revenue | | | 1,360 | | | | 1,359 | | | - | |
Net interest revenue | | | 304 | | | | 278 | | | 9 | |
| | | | | | | | | | | |
Total revenue | | | 1,664 | | | | 1,637 | | | 2 | |
Provision for credit losses | | | - | | | | (4 | ) | | N/M | |
Noninterest expense (excluding intangible amortization) | | | 1,196 | | | | 1,171 | | | 2 | |
| | | | | | | | | | | |
Income before taxes (excluding intangible amortization) | | | 468 | | | | 470 | | | - | |
Amortization of intangible assets | | | 24 | | | | 30 | | | (20 | ) |
| | | | | | | | | | | |
Income before taxes | | $ | 444 | | | $ | 440 | | | 1 | % |
| | | | | | | | | | | |
Pre-tax operating margin (excluding intangible amortization) | | | 28 | % | | | 29 | % | | | |
Memo: Income before taxes (excluding intangible amortization and non-operating items) (b) | | $ | 441 | | | $ | 470 | | | (6 | )% |
Average assets | | $ | 15,482 | | | $ | 16,436 | | | (6 | ) |
Average active accounts(in thousands) | | | 5,119 | | | | 5,104 | | | - | |
Average margin loans(in millions) | | $ | 5,382 | | | $ | 5,373 | | | - | |
| (a) | Legacy The Bank of New York only. |
| (b) | Results for 2007 exclude the pre-tax benefit ($27 million) of the negotiated settlement received for the early termination of a contract that occurred in 2005. |
Business description
Our Clearing & Execution Services segment consists of the Pershing clearing business, a 35.4% equity interest in BNY ConvergEx Group, and the B-Trade and G-Trade businesses, which became part of BNY ConvergEx Group on Feb, 1, 2008. The BNY ConvergEx Group transaction which closed on Oct. 1, 2006, changed the accounting from a fully consolidated subsidiary to a 35.4% equity interest recorded in other income.
Our Pershing and Pershing Advisor Solutions subsidiaries provide financial institutions and independent registered investment advisors with operational support, trading services, flexible technology and practice management programs. Pershing services more than 1,150 retail and institutional financial organizations and independent registered investment advisors who collectively represent more than five million active investors.
Through B-Trade and G-Trade and our affiliate, BNY ConvergEx Group, LLC, we provide liquidity and execution management, investment technologies, and intermediary and clearing services in more than 90 global markets, executing 235 million U.S. shares and $1.6 billion in non-U.S. principal each day and clearing more than 1.2 million trades daily.
Our execution services business is one of the largest global agency brokerage organizations, providing a full suite of broker-assisted and electronic trading capabilities. In addition, we are one of the leading institutional electronic brokers for non-U.S. dollar equity execution.
Revenue in this segment includes Broker Dealer and Registered Investment Advisor services and electronic trading services which are primarily driven by:
| | · | | trading volumes, particularly those related to retail customers; |
| | · | | overall market levels; and |
| | · | | the amount of assets under administration. |
A substantial amount of revenue in this segment is generated from non-transactional activities, such as asset gathering, mutual fund, money fund and retirement programs, administration and other services. Segment expenses are driven by staff,
The Bank of New York Mellon Corporation 27
Results of Operations(continued)
equipment and space required to support the services provided by the segment and the cost of execution and clearance of trades.
Review of financial results
Income before taxes was $444 million in 2007 compared with $440 million in 2006. Total fee and other revenue increased slightly in 2007 compared with 2006, reflecting the impact of the BNY ConvergEx transaction, as well as a $35 million gain on the sale of NYSE seats in 2006 and a settlement received for early termination of a contract that occurred in 2005 ($28 million). Income before taxes (excluding intangible amortization) was $468 million in 2007, compared with $470 million in 2006. Clearing and execution servicing fees decreased $24 million compared with 2006 reflecting the disposition of certain execution businesses in the BNY ConvergEx transaction which was primarily offset by higher market activity and volumes which increased clearing-related revenues, as well as continued growth in money market and mutual fund positions.
Net interest revenue increased $26 million as higher revenues resulting from higher levels of customer deposits were partially offset by the impact of the BNY ConvergEx transaction.
Noninterest expense (excluding intangible amortization) increased $25 million in 2007 compared with 2006, reflecting higher salaries and benefits, clearing costs, bank technology charges, and outside services which more than offset the reduction in expense resulting from the BNY ConvergEx transaction.
2006 compared with 2005
Income before taxes increased $84 million compared with 2005. Fee and other revenue increased $41 million, reflecting good organic growth in asset-driven fees and retirement products, as well as a $35 million gain on the sale of NYSE seats in 2006. Net interest revenue increased by $57 million compared with 2005, primarily reflecting rising interest rates and the internalization of stock loan activities partly offset by lower balances. Noninterest expense (excluding intangible amortization) increased $25 million in 2006 compared with 2005 as the impact of higher activity-driven expenses more than offset the impact of the BNY ConvergEx transaction.
Treasury Services segment
| | | | | | | | | | | |
(dollar amounts in millions, unless otherwise noted; presented on an FTE basis) | | 2007 | | | 2006 (a) | | | 2007
vs.
2006 | |
Revenue: | | | | | | | | | | | |
Treasury services | | $ | 326 | | | $ | 201 | | | 62 | % |
Other | | | 422 | | | | 369 | | | 14 | |
| | | | | | | | | | | |
Total fee and other revenue | | | 748 | | | | 570 | | | 31 | |
Net interest revenue | | | 489 | | | | 392 | | | 25 | |
| | | | | | | | | | | |
Total revenue | | | 1,237 | | | | 962 | | | 29 | |
Provision for credit losses | | | - | | | | 5 | | | N/M | |
Noninterest expense (excluding intangible amortization) | | | 636 | | | | 510 | | | 25 | |
| | | | | | | | | | | |
Income before taxes (excluding intangible amortization) | | | 601 | | | | 447 | | | 34 | |
Amortization of intangible assets | | | 14 | | | | - | | | N/M | |
| | | | | | | | | | | |
Income before taxes | | $ | 587 | | | $ | 447 | | | 31 | % |
| | | | | | | | | | | |
Pre-tax operating margin (excluding intangible amortization) | | | 49 | % | | | 46 | % | | | |
Average assets | | $ | 18,057 | | | $ | 16,274 | | | 11 | % |
Average loans | | | 12,166 | | | | 12,561 | | | (3 | ) |
Average deposits | | | 15,408 | | | | 12,163 | | | 27 | |
| (a) | Legacy The Bank of New York only. |
Business description
The Treasury Services segment includes treasury services, global payment services, working capital solutions, foreign exchange and other trading activities, capital markets business and large corporate banking.
Treasury services revenue is directly influenced by the volume of transactions and payments processed, loan levels, types of service provided and net interest revenue earned from deposit balances generated by activity across the business operations. Our revenue is indirectly influenced by other factors including market volatility in major currencies and the level and nature of underlying cross-border investments and other transactions undertaken by corporate and institutional clients. Foreign exchange trading revenues are directly influenced by the volume of client transactions and the spread realized on such transactions. Segment expenses are driven by staff, equipment and space required to support the services provided.
Treasury Services offers leading-edge technology, innovative products, and industry expertise to help its clients optimize cash flow, manage liquidity, and make payments around the world in more than 100 different countries. We maintain a global network of branches, representative offices and correspondent banks to provide comprehensive payment services
28 The Bank of New York Mellon Corporation
Results of Operations(continued)
including funds transfer, cash management, trade services and liquidity management. We are one of the largest funds transfer banks in the U.S. transferring over $1.8 trillion daily via more than 170,000 wire transfers.
We provide lending and credit-related services to large public and private corporations and financial institutions nationwide through a broad range of capital markets services including syndicated loans, bond underwriting, and private placements of corporate debt and equity securities.
Our corporate lending strategy is to focus on those clients and industries that are major users of securities servicing and treasury services. Revenue from our lending activities is primarily driven by loan levels and spreads over funding costs.
Review of financial results
Income before taxes was $587 million in 2007, compared with $447 million in 2006. Total fee and other revenue increased $178 million in 2007 driven by higher treasury services revenue and higher foreign exchange and other trading activities revenue. Treasury services fees were up $125 million in 2007 reflecting the merger with Mellon, higher client volumes and growth in the global payment business. The increase in other income in 2007 compared with 2006 primarily reflects the higher valuation of the credit derivatives portfolio.
The increase in net interest revenue in 2007 compared with 2006 reflects the merger with Mellon as well as higher deposit levels, including compensating balances (in lieu of treasury services fees), and wider spreads. There was no provision for credit losses in 2007 compared with a charge of $5 million in 2006. Noninterest expense excluding intangible amortization) increased $126 million in 2007 compared with 2006, primarily due to the merger with Mellon, as well as increased salaries, incentives and brokerage commission.
2006 compared with 2005
Income before taxes decreased $44 million in 2006 compared to 2005. Total fee and other revenue decreased $68 million compared with 2005, reflecting lower asset related gains and capital market fees. Net interest revenue decreased $4 million in 2006 compared with 2005, reflecting lower loan spreads. Noninterest expense (excluding intangible amortization) decreased $28 million in 2006, primarily reflecting lower operations costs resulting from the sale of our Retail Business to JPMorgan Chase.
Other segment
| | | | | | | | |
(dollar amounts in millions,
unless otherwise noted;
presented on an FTE basis) | | 2007 | | | 2006 (a) | |
Revenue: | | | | | | | | |
Fee and other revenue | | $ | 54 | | | $ | 182 | |
Net interest revenue | | | 18 | | | | 42 | |
| | | | | | | | |
Total revenue | | | 72 | | | | 224 | |
Provision for credit losses | | | (10 | ) | | | (19 | ) |
Noninterest expense (excluding intangible amortization and merger and integration expense) | | | 330 | | | | 179 | |
| | | | | | | | |
Income (loss) before taxes (excluding intangible amortization and merger and integration expense) | | | (248 | ) | | | 64 | |
| | | | | | | | |
Amortization of intangible assets | | | 1 | | | | - | |
Merger and integration expense: | | | | | | | | |
The Bank of New York Mellon | | | 355 | | | | - | |
Acquired Corporate Trust Business | | | 49 | | | | 106 | |
| | | | | | | | |
Total merger & integration expenses | | | 404 | | | | 106 | |
| | | | | | | | |
Income before taxes | | $ | (653 | ) | | $ | (42 | ) |
| | | | | | | | |
Memo: Income before taxes (excluding intangible amortization, merger and integration expense and non-operating items)(b) | | $ | (220 | ) | | $ | 64 | |
Average assets | | | 76,175 | | | | 50,607 | |
Average deposits | | | 10,403 | | | | 11,134 | |
| (a) | Legacy The Bank of New York only. |
| (b) | Results for 2007 include a reduction in net interest revenue resulting from a recalculation of the yield on the leverage lease portfolio caused by the impact of the merger with Mellon on the New York state marginal tax rate ($22 million) and a write-off of internally developed software ($6 million). |
Business description
The Other segment primarily includes:
| | · | | the results of leasing operations; |
| | · | | corporate treasury activities; |
Revenue primarily reflects:
| | · | | net interest revenue from the leasing portfolio; |
| | · | | revenue from corporate and bank owned life insurance; |
| | · | | any residual interest income resulting from transfer pricing algorithms relative to actual results, and |
| | · | | gains (losses) from the sale of securities and other assets. |
Noninterest expense includes:
| | · | | merger and integration charges; |
| | · | | direct expenses supporting leasing, investing and funding activities; |
The Bank of New York Mellon Corporation 29
Results of Operations(continued)
| | · | | certain corporate overhead not directly attributable to the operations of other segments, and |
| | · | | expenses previously allocated to the Retail and Middle Market Banking Segment that did not qualify for treatment as discontinued operations expense. |
Review of financial results
Income before taxes was a loss of $653 million in 2007 compared with a loss of $42 million in 2006.
Total fee and other revenue decreased $128 million in 2007 compared with 2006. The decrease primarily reflects the $200 million (pre-tax) securities loss related to CDOs recorded in the fourth quarter of 2007.
Net interest revenue was $18 million in 2007, a decrease of $24 million compared to 2006. The decrease reflects the negative impact of the required recalculation of the yield on leverage leases under FSP-FAS 13-2 resulting from the merger with Mellon ($22 million), recorded in the third quarter of 2007 which more than offset the positive impact of the changing interest rate environment on corporate treasury allocations.
There was a $10 million credit to provision for credit losses recorded in 2007 compared with a credit of $19 million in 2006.
Noninterest expense (excluding intangible amortization/merger and integration expense) increased $151 million in 2007 compared with 2006, primarily reflecting the merger with Mellon. Merger and integration expenses associated with the Mellon merger were $355 million in 2007 and include amounts for integration/conversion costs ($136 million), personnel-related costs ($122 million), transaction costs ($67 million), and one-time costs ($30 million).
2006 compared with 2005
Income before taxes decreased $95 million in 2006 compared with 2005. Total fee and other revenue increased $120 million compared with 2005, reflecting higher securities, investment and asset gains. Net interest revenue decreased $57 million in 2006 compared with 2005, due to the impact of accounting for the Retail Business as discontinued operations. Noninterest expense (excluding intangible
amortization) increased $157 million in 2006 compared with 2005, primarily due to merger and integration expense associated with the Acquired Corporate Trust Business.
International operations
Our primary international activities consist of securities servicing, asset management and global payment services. Target customers include financial institutions, pension funds and securities issuers worldwide.
In BNY Mellon Asset Servicing, we are a leading global custodian. In the United Kingdom, we provide a full range of both local and global services. In Continental Europe, a full global product set is provided with access to certain local markets through strategic partnerships. Off-shore mutual fund servicing capabilities for funds registered in Dublin, the Channel Islands, Luxembourg and Singapore are provided through operations in Luxembourg and Dublin.
In the Asia-Pacific region, we have over 50 years of experience providing trade and cash services to financial institutions and central banks. In addition, we offer a broad range of servicing and fiduciary products to financial institutions, corporations and central banks depending on the state of market development. In emerging markets, we lead with global payments and issuer services, introducing other products as the markets mature. For more established markets, our focus is on global, not local, asset servicing products and alternative investments.
BNY Mellon Asset Management operates a multi-boutique model, providing investors the skills of our specialist boutique asset managers, which together, manage investments spanning virtually all asset classes. With assets under management of more than $1 trillion, we are the 13th largest global asset manager. In Europe, we are the 7th largest asset manager active in the European marketplace and we are the U.K.’s 12th largest mutual fund manager. We have a rapidly growing presence in Asia and Latin America and now rank among the top 20 foreign asset managers in Japan.
Our clients include some of the world’s largest pension funds and institutions, local authorities, treasuries, family offices and individual investors. Through our global network of offices, we have developed an in depth understanding of local
30 The Bank of New York Mellon Corporation
Results of Operations(continued)
requirements and cultural needs and we pride ourselves in providing dedicated service through our multilingual sales, marketing and client service teams.
We are also a leading provider and major market maker in the area of foreign exchange and interest-rate risk management services, dealing in over 100 currencies, and providing traditional trust and banking services to customers domiciled outside of the United States, principally in Europe and Asia.
We conduct business through subsidiaries, branches, and representative offices in 34 countries. We have major operation centers based in Brussels, Dublin, Luxembourg, Singapore and throughout the United Kingdom including London, Manchester, Brentwood, Edinburgh and Poole.
Our financial results, as well as our level of assets under custody and management, are impacted by the translation of financial results denominated in foreign currencies to the U.S. Dollar. We are primarily impacted by activities denominated in the British Pound, and to a lesser extent, the Euro. If the U.S. Dollar depreciates against these currencies, the translation impact is a higher level of fee revenue, net interest revenue, operating expense and assets under management and custody. Conversely, if the U.S. Dollar appreciates, the translated levels of fee revenue, net interest revenue, operating expense and assets under management and custody will be lower.
| | | | | | | | | |
| Foreign exchange rates | | | | | | |
| (in millions) | | 2007 | | 2006 | | 2005 |
Spot rate (at Dec. 31): | | | | | | | | | |
British pound | | $ | 1.9844 | | $ | 1.9591 | | $ | 1.7208 |
Euro | | | 1.4594 | | | 1.3197 | | | 1.1844 |
Yearly average rate: | | | | | | | | | |
British pound | | $ | 2.0018 | | $ | 1.8430 | | $ | 1.8207 |
Euro | | | 1.3707 | | | 1.2562 | | | 1.2454 |
International clients accounted for 32% of revenue and 37% of net income in 2007. After adjusting net income for the after-tax impact of the CDO write-down, merger and integration expense and intangible amortization, net income from International clients was 32% of total net income. At Dec. 31, 2007, we had 7,700 employees in Europe and 3,150 in Asia.
International financial data
Foreign activity includes asset and wealth management and securities servicing fee revenue generating businesses, foreign exchange trading activity, loans and other revenue producing assets and transactions in which the customer is domiciled outside of the United States and/or the foreign activity is resident at a foreign entity.
Foreign revenue, income before income taxes, net income and assets from foreign operations on a continuing operations basis are shown in the table below:
| | | | | | | | | | | | | | | | | | | | | | | | | | | | | | | | | | | | | | |
| International operations – continuing operations | | | Legacy The Bank of New York only |
| | | 2007(a) | | | 2006 | | 2005 |
| (in millions) | | Revenues | | | Income
before
taxes | | Net
income | | Total
assets | | | Revenues | | Income
before
taxes | | Net
income | | Total
assets | | Revenues | | Income
before
taxes | | Net
income | | Total
assets |
Domestic | | $ | 7,654 | | | $ | 2,041 | | $ | 1,407 | | $ | 129,431 | | | $ | 4,775 | | $ | 1,605 | | $ | 1,092 | | $ | 71,053 | | $ | 4,245 | | $ | 1,475 | | $ | 1,007 | | $ | 67,031 |
Europe | | | 2,780 | (b) | | | 743 | | | 509 | | | 52,722 | (b) | | | 1,517 | | | 423 | | | 286 | | | 24,855 | | | 1,327 | | | 376 | | | 251 | | | 19,414 |
Asia | | | 553 | | | | 247 | | | 172 | | | 5,209 | | | | 338 | | | 104 | | | 72 | | | 4,204 | | | 279 | | | 85 | | | 56 | | | 4,828 |
Other | | | 344 | | | | 194 | | | 139 | | | 10,294 | | | | 208 | | | 38 | | | 26 | | | 3,076 | | | 204 | | | 42 | | | 29 | | | 2,037 |
Total | | $ | 11,331 | | | $ | 3,225 | | $ | 2,227 | | $ | 197,656 | | | $ | 6,838 | | $ | 2,170 | | $ | 1,476 | | $ | 103,188 | | $ | 6,055 | | $ | 1,978 | | $ | 1,343 | | $ | 93,310 |
| (a) | Results for 2007 include six months of the combined Company’s results and six months of legacy The Bank of New York only. |
| (b) | In 2007, includes revenue of approximately $1.3 billion and assets of approximately $39.4 billion of international operations domiciled in the U.K., which is 11% of total revenue and 20% of total assets. |
In 2007, revenues from Europe were $2.780 billion, compared with $1.517 billion in 2006 and $1.327 billion in 2005. Revenues from Europe were up 83% in 2007 compared to 2006. The increase in 2007 reflects the impact of the merger with Mellon and the acquisition of the Acquired Corporate Trust Business. The increases in 2007 compared with 2006 and 2006
compared with 2005 were also impacted by higher cross-border flows which drove revenue higher in global mutual funds, custody, corporate trust and depositary receipts. Revenues from Asia were $553 million in 2007 compared with $338 million in 2006, and $279 million in 2005. The increase in Asia in 2007 was impacted by the merger with Mellon. The
The Bank of New York Mellon Corporation 31
Results of Operations(continued)
increases in 2007 and 2006 as well as 2006 and 2005 were also primarily due to increases in net interest income, securities lending, depositary receipts, and equity in the earnings of Wing Hang. Net income from Europe was $509 million in 2007 compared with $286 million in 2006 and $251 million in 2005. Net income from Asia was $172 million in 2007, compared with $72 million in 2006, and $56 million in 2005. Net income from Europe and Asia were driven by the same factors affecting revenue. In addition, in all periods, net income from Europe was positively impacted by the strength of the Euro and Sterling versus the dollar.
Cross-border risk
Foreign assets are subject to general risks attendant to the conduct of business in each foreign country, including economic uncertainties and each foreign government’s regulations. In addition, our foreign assets may be affected by changes in demand or pricing resulting from fluctuations in currency exchange rates or other factors. Cross-border outstandings include loans, acceptances, interest-bearing deposits with other banks, other interest-bearing investments, and other monetary assets which are denominated in dollars or other non-local currency. Also included are local currency outstandings not hedged or funded by local borrowings.
The table below shows our cross-border outstandings for the last three years where cross-border exposure exceeds 1.00% of total assets (denoted with “*”) or 0.75% of total assets (denoted with “**”).
| | | | | | | | | | | | |
Cross-border outstandings (in millions) | | Banks and
other financial
institutions | | Public
sector | | Commercial,
industrial
and other | | Total
cross-border
outstandings |
2007: | | | | | | | | | | | | |
Netherlands* | | $ | 4,945 | | $ | - | | $ | 2,487 | | $ | 7,432 |
Germany* | | | 4,824 | | | 178 | | | 338 | | | 5,340 |
France* | | | 2,651 | | | 150 | | | 150 | | | 2,951 |
United Kingdom* | | | 1,582 | | | - | | | 1,073 | | | 2,655 |
Ireland* | | | 1,184 | | | 5 | | | 1,445 | | | 2,634 |
Switzerland** | | | 1,710 | | | - | | | 152 | | | 1,862 |
2006 –Legacy The Bank of New York only: | | | | | | | | | | | | |
Germany* | | $ | 4,241 | | $ | 200 | | $ | 402 | | $ | 4,843 |
France* | | | 2,197 | | | 341 | | | 35 | | | 2,573 |
United Kingdom* | | | 1,211 | | | 38 | | | 1,025 | | | 2,274 |
Netherlands* | | | 653 | | | - | | | 753 | | | 1,406 |
Canada* | | | 723 | | | 197 | | | 233 | | | 1,153 |
Italy** | | | 992 | | | - | | | 17 | | | 1,009 |
Switzerland** | | | 767 | | | - | | | 121 | | | 888 |
2005 –Legacy The Bank of New York only: | | | | | | | | | | | | |
Germany* | | $ | 2,216 | | $ | 185 | | $ | 406 | | $ | 2,807 |
United Kingdom* | | | 571 | | | - | | | 1,256 | | | 1,827 |
Netherlands* | | | 1,010 | | | - | | | 570 | | | 1,580 |
France* | | | 740 | | | 169 | | | 203 | | | 1,112 |
Belgium** | | | 634 | | | 49 | | | 257 | | | 940 |
Switzerland** | | | 744 | | | - | | | 141 | | | 885 |
Critical accounting estimates
Our significant accounting policies are described in the Notes to Consolidated Financial Statements under “Summary of Significant Accounting and Reporting Policies”. Four of our more critical accounting estimates are those related to the allowance for credit losses, the valuation of derivatives and securities where quoted market prices are not available, goodwill and other intangibles, and pension accounting. In addition to “Summary of Significant Accounting and Reporting Policies” in the Notes to
Consolidated Financial Statements, further information on policies related to the allowance for credit losses can be found under “Asset Quality and Allowance for Credit Losses” in the MD&A section. Further information on the valuation of derivatives and securities where quoted market prices are not available can be found under “Market Risk” and “Trading Activities and Risk Management” in the MD&A section and in “Fair Value of Financial Instruments” in the Notes to Consolidated Financial Statements. Further information on goodwill and intangible assets can be found in “Goodwill and
32 The Bank of New York Mellon Corporation
Results of Operations(continued)
Intangibles” in the Notes to Consolidated Financial Statements. Additional information on pensions can be found in “Employee Benefit Plans” in the Notes to the Consolidated Financial Statements.
Reserve for loan losses and reserve for unfunded commitments
The reserve for loan losses and reserve for unfunded commitments consist of four elements: (1) an allowance for impaired credits; (2) an allowance for higher risk rated loans and exposures; (3) an allowance for pass rated loans and exposures; and (4) an unallocated allowance based on general economic conditions and certain risk factors in our individual portfolio and markets. Further discussion of the four elements can be found under “Asset Quality and Allowance for Credit Losses” in the MD&A section.
The reserve for loan losses represents management’s estimate of probable losses inherent in our credit portfolio. This evaluation process is subject to numerous estimates and judgments. Probability of default ratings are assigned after analyzing the credit quality of each borrower/counterparty and our internal ratings are generally consistent with external ratings agencies default databases. Loss given default ratings are driven by the collateral, structure, and seniority of each individual asset and are consistent with external loss given default/recovery databases. The portion of the allowance related to impaired credits is based on the present value of expected future cash flows; however, as a practical expedient, it may be based on the credit’s observable market price. Additionally, it may be based on the fair value of collateral if the credit is collateral dependent. Changes in the estimates of probability of default, risk ratings, loss given default/recovery rates, and cash flows could have a direct impact on the allocated allowance for loan losses.
To the extent actual results differ from forecasts or management’s judgment, the allowance for credit losses may be greater or less than future charge-offs.
We consider it difficult to quantify the impact of changes in forecast on our allowance for credit losses. Nevertheless, we believe the following discussion may enable investors to better understand the variables that drive the allowance for credit losses.
A key variable in determining the allowance is management’s judgment in determining the size of the
unallocated allowance. At Dec. 31, 2007, the unallocated allowance was $116 million, or 23%, of the total allowance. At Dec. 31, 2006, the unallocated allowance was $102 million, or 23%, of the total allowance. At Dec. 31, 2007 if the unallocated allowance, as a percent of the total allowance, was five percent higher or lower, the allowance would have increased or decreased by $25 million, respectively.
The credit rating assigned to each credit is another significant variable in determining the allowance. If each credit were rated one grade better, the allowance would have decreased by $95 million, while if each credit were rated one grade worse, the allowance would have increased by $179 million. Similarly, if the loss given default were one rating worse, the allowance would have increased by $33 million, while if the loss given default were one rating better, the allowance would have decreased by $60 million.
For impaired credits, if the fair value of the loans were 10% higher or lower, the allowance would have decreased or increased by $11 million, respectively.
Valuation of derivatives and securities where quoted market prices are not available
When quoted market prices are not available for derivatives and securities values held in our investment portfolios, such values are estimated at fair value, which is defined as the value at which positions could be closed out or sold in a transaction with a willing counterparty. Fair value for these instruments is determined based on discounted cash flow analysis, comparison to similar instruments, and the use of financial models. Financial models use as their basis independently-sourced market parameters including, for example, interest rate yield curves, option volatilities, and currency rates. Discounted cash flow analysis is dependent upon estimated future cash flows and the level of interest rates. Model-based pricing uses inputs of observable prices for interest rates, foreign exchange rates, option volatilities and other factors. Models are benchmarked and validated by independent parties. Our valuation process takes into consideration factors such as counterparty credit quality, liquidity, concentration concerns, and results of stress tests. We apply judgment in the application of these factors. In addition, we must apply judgment when no external parameters exist.
Economic models, in conjunction with quoted dealer prices, are used to value the CDOs held in our investment securities portfolio. A primary driver of
The Bank of New York Mellon Corporation 33
Results of Operations(continued)
the valuation of CDOs is the assumption of a peak-to-trough decline in home prices. The peak-to-trough assumption is determined by using several independent sources, including: forecasts of future home price appreciation rates, housing sales data, housing inventory levels, and other significant housing market trends, as well as the forward curve for interest rates.
In times of financial stress, actual prices and valuations may significantly diverge from results predicted by models. Finally, other factors can affect our estimate of fair value, including market dislocations, incorrect model assumptions, and unexpected correlations.
These valuation methods could expose us to materially different results should the models used or underlying assumptions be inaccurate. See “Basis of Presentation” in Note 1 of the Notes to Consolidated Financial Statements.
We currently price over 95% of our investment securities and derivatives portfolio using observable prices or market based inputs. We adopted SFAS No. 157 as of Jan. 1, 2008.
Goodwill and other intangibles
We record all assets and liabilities acquired in purchase acquisitions, including goodwill, indefinite-lived intangibles, and other intangibles, at fair value as required by SFAS Nos. 141 and 142 (“SFAS 141 and SFAS 142”), “Business Combinations.” Goodwill ($16.3 billion at Dec. 31, 2007) and indefinite-lived intangible assets ($2.7 billion at Dec. 31, 2007) are not amortized but are subject to annual tests for impairment or more often if events or circumstances indicate they may be impaired. Other intangible assets are amortized over their estimated useful lives and are subject to impairment if events or circumstances indicate a possible inability to realize the carrying amount.
The initial recording of goodwill, indefinite-lived intangibles, and other intangibles requires subjective judgments concerning estimates of the fair value of the acquired assets and liabilities. The goodwill impairment test is performed in two phases. The first step compares the fair value of the reporting unit with its carrying amount, including goodwill. If the fair value of the reporting unit exceeds its carrying amount, goodwill of the reporting unit is considered not impaired; however, if the carrying amount of the reporting unit exceeds its fair value, an additional
procedure would be performed. That additional procedure would compare the implied fair value of the reporting unit’s goodwill with the carrying amount of that goodwill. An impairment loss would be recorded to the extent that the carrying amount of goodwill exceeds its implied fair value. Indefinite-lived intangible assets are evaluated for impairment at least annually by comparing their fair value to their carrying value. Other intangible assets ($3.7 billion at Dec. 31, 2007) are evaluated for impairment if events and circumstances indicate a possible impairment. Such evaluation of other intangible assets is based on undiscounted cash flow projections.
Fair value may be determined using: market prices, comparison to similar assets, market multiples, discounted cash flow analysis and other determinants. Estimated cash flows may extend far into the future and, by their nature, are difficult to determine over an extended timeframe. Factors that may significantly affect the estimates include, among others, competitive forces, customer behaviors and attrition, changes in revenue growth trends, cost structures and technology, and changes in discount rates and specific industry or market sector conditions. Other key judgments in accounting for intangibles include useful life and classification between goodwill and indefinite-lived intangibles or other intangibles which require amortization. See Note 6 of the Notes to Consolidated Financial Statements for additional information regarding intangible assets. At Dec. 31, 2007, we had $22.7 billion of goodwill, indefinite-lived intangibles, and other intangible assets.
Pension accounting
BNY Mellon has defined benefit pension plans covering approximately 25,200 U.S. employees and approximately 4,400 non-U.S. employees.
Legacy The Bank of New York has one qualified and two non-qualified defined benefit pension plans in the U.S. and five overseas. As of Dec. 31, 2007, the U.S. plans accounted for 75% of the projected benefit obligation. Pension expense for the legacy The Bank of New York plans was $13 million in 2007, compared with $38 million in 2006 and $26 million in 2005.
In addition to its pension plans, legacy The Bank of New York has an Employee Stock Ownership Plan (“ESOP”). Benefits payable under the U.S. qualified pension plan are offset by the equivalent value of benefits earned under the ESOP.
34 The Bank of New York Mellon Corporation
Results of Operations(continued)
Legacy Mellon has two qualified and several non-qualified defined benefit pension plans in the U.S. and two overseas. As of Dec. 31, 2007, the U.S. plans accounted for 87% of the projected benefit obligation. A pension credit of $17 million was recorded for the legacy Mellon plans for the period July 1, 2007 to Dec. 31, 2007.
A net pension credit of approximately $42 million is expected to be recorded for BNY Mellon in 2008, assuming current currency exchange rates.
A number of key assumption and measurement date values determine pension expense. The key elements include the long-term rate of return on plan assets, the discount rate, the market-related value of plan assets, and for the legacy The Bank of New York U.S. plan the price used to value stock in the ESOP. Since 2005, these key elements have varied as follows:
| | | | | | | | | | | | | | | | |
(dollars in millions,
except per share
amounts) | | | | | | | | Legacy The Bank of
New York only | |
| | 2008 | | | 2007 | | | 2006 | | | 2005 | |
Domestic plans: | | | | | | | | | | | | | | | | |
Long-term rate of return on plan assets | | | 8.00 | % | | | 8.00 | % | | | 7.88 | % | | | 8.25 | % |
Discount rate | | | 6.38 | | | | 6.00 | | | | 5.88 | | | | 6.00 | |
Market-related value of plan assets(a) | | $ | 3,628 | | | $ | 1,352 | | | $ | 1,324 | | | $ | 1,502 | |
ESOP stock price (a) | | | 47.15 | | | | 34.85 | | | | 30.46 | | | | 30.67 | |
Net U.S. pension credit/(expense) | | | N/A | | | $ | 16 | (c) | | $ | (26 | ) | | $ | (17 | ) |
All other net pension credit/(expense) | | | N/A | | | $ | (12 | ) (d) | | | (12 | ) | | | (9 | ) |
Total net pension credit/(expense) (b) | | | N/A | | | $ | 4 | | | $ | (38 | ) | | $ | (26 | ) |
| (a) | See “Summary of Significant Accounting and Reporting Policies” in Note 1 of Notes to Consolidated Financial Statements. |
| (b) | Pension benefits expense includes discontinued operations expense of $6 million in 2006 and 2005. |
| (c) | Includes a $21 million credit for legacy Mellon plans based on a discount rate of 6.25% as of July 1, 2007, and a long-term rate of return on plan assets of 8.25%. |
| (d) | Includes $4 million of expense for legacy Mellon’s foreign plans. |
The discount rate for U.S. pension plans was determined after reviewing a number of high quality long-term bond indices whose yields were adjusted to match the duration of BNY Mellon’s pension liability. We also reviewed the results of several models that matched bonds to our pension cash flows. After reviewing the various indices and models, we selected a discount rate of 6.38% as of Dec. 31, 2007. The
discount rates for foreign pension plans are based on high quality corporate bonds rates in countries that have an active corporate bond market. In those countries with no active corporate bond market, discount rates are based on local government bond rates plus a credit spread.
Our expected long-term rate of return on plan assets is based on anticipated returns for each asset class. Anticipated returns are weighted for the target allocation for each asset class. Anticipated returns are based on forecasts for prospective returns in the equity and fixed income markets, which should track the long-term historical returns for these markets. We also consider the growth outlook for U.S. and global economies, as well as current and prospective interest rates.
The market-related value of plan assets also influences the level of pension expense. Differences between expected and actual returns are recognized over five years to compute an actuarially derived market-related value of plan assets. For the legacy Mellon plans, the market-related value of assets was set equal to the assets’ market value as of July 1, 2007. The averaging of actuarial gains and losses, for the legacy Mellon plan assets, will be phased in over the next five years.
Unrecognized actuarial gains and losses are amortized over the future service period of active employees if they exceed a threshold amount. BNY Mellon currently has unrecognized losses which are being amortized.
The annual impacts of hypothetical changes in the key elements on pension costs are shown in the table below.
| | | | | | | | | | | | | | | | |
Pension expense (dollar amounts in millions,
except per share amounts) | | Increase in pension expense | | | (Decrease) in
pension expense | |
Long-term rate of return on plan assets | | | (100 | )bp | | | (50 | ) bp | | | 50 | bp | | | 100 | bp |
Change in pension expense | | $ | 46.3 | | | $ | 23.3 | | | $ | (23.2 | ) | | $ | (46.1 | ) |
| | | | |
Discount rate | | | (50 | ) bp | | | (25 | ) bp | | | 25 | bp | | | 50 | bp |
Change in pension expense | | $ | 20.9 | | | $ | 10.4 | | | $ | (9.5 | ) | | $ | (18.0 | ) |
| | | | |
Market-related value of plan assets | | | (20.00 | )% | | | (10.00 | )% | | | 10.00 | % | | | 20.00 | % |
Change in pension expense | | $ | 138.6 | | | $ | 62.8 | | | $ | (40.2 | ) | | $ | (81.8 | ) |
| | | | |
ESOP stock price | | $ | (10 | ) | | $ | (5 | ) | | $ | 5 | | | $ | 10 | |
Change in pension expense | | $ | 11.5 | | | $ | 5.5 | | | $ | (5.2 | ) | | $ | (9.9 | ) |
Consolidated balance sheet review
Total assets were $197.7 billion at Dec. 31, 2007, compared with $103.2 billion at Dec. 31, 2006. Total
The Bank of New York Mellon Corporation 35
Results of Operations(continued)
shareholders’ equity was $29.4 billion at Dec. 31, 2007 compared with $11.4 billion at Dec. 31, 2006. The increase in assets and shareholders’ equity primarily reflects the merger with Mellon. The increase in assets also reflects growth in client deposits as well as the transition of the deposits from the Acquired Corporate Trust Business.
| | · | | Interest-bearing deposits with banks and federal funds sold and securities purchased under resale agreements totaled $43.4 billion or 22% of assets at Dec. 31, 2007, compared with $18.3 billion, or 18% of assets at Dec. 31, 2006. This increase in liquid assets reflects the growth in deposits, as well as the acquisition of the remaining 50% interest in the ABN AMRO Mellon joint venture. |
| | · | | Investment securities were $48.7 billion or 25% of our year-end assets in 2007 compared with $21.1 billon or 20% in 2006. The increase in investment securities primarily relates to the merger with Mellon, deposit growth and the consolidation of TRFC. |
| | · | | Loans were $50.9 billion, or 26% of assets at Dec. 31, 2007, compared with $37.8 billion or 37% of assets at Dec. 31, 2006. The increase in loan levels was driven by the merger with Mellon and the needs of our securities servicing customers. |
Investment securities
The following table shows the distribution of our securities portfolio:
| | | | | | |
Investment securities (at fair value) (in millions) | | Dec. 31,
2007 | | Dec. 31,
2006 (a) |
Fixed income securities: | | | | | | |
Mortgage/asset-backed securities | | $ | 44,934 | | $ | 18,249 |
Corporate debt | | | 560 | | | 256 |
Short-term money market instruments | | | 452 | | | 531 |
U.S. treasury securities | | | 437 | | | 86 |
U.S. Government agencies | | | 778 | | | 673 |
State and political subdivisions | | | 721 | | | 88 |
Other foreign debt | | | 298 | | | 126 |
Subtotal fixed income securities | | | 48,180 | | | 20,009 |
Equity securities: | | | | | | |
Money market or fixed income funds | | | 406 | | | 1,032 |
Other | | | 103 | | | 46 |
Subtotal equity securities | | | 509 | | | 1,078 |
Total investment securities | | $ | 48,689 | | $ | 21,087 |
| (a) | Legacy The Bank of New York only. |
At Dec. 31, 2007, our investment securities portfolio included $45.2 billion of securities that we manage and $3.5 billion added in connection with the consolidation of TRFC (see page 16). Each of these portfolios is discussed separately below.
Investment securities, excluding TRFC, were $45.2 billion at Dec. 31, 2007, compared with $21.1 billion at Dec. 31, 2006 and $27.2 billion at Dec. 31, 2005. Average investment securities were $35.4 billion in 2007, compared with $22.3 billion in 2006 and $20.7 billion in 2005. At Dec. 31, 2007, the fixed income portfolio composition was approximately:
| | · | | 49% variable rate mortgage-backed |
| | · | | 5% treasuries, government agencies, municipalities and short-term securities |
At Dec. 31, 2007, our portfolio of mortgage and asset-backed securities of $41.5 billion (excluding TRFC securities) were rated as follows, by external rating agencies:
In replacing securities that mature or are paid off, we have been adding either adjustable or short life classes of structured mortgage-backed securities, both of which have short durations. The effective duration of our mortgage and asset-backed portfolio at Dec. 31, 2007 (excluding TRFC securities) was approximately 1.66 years. The duration of our securities portfolio has declined in 2007 as we have purchased floating rate notes to better match the duration of the deposits in the Acquired Corporate Trust Business.
At Dec. 31, 2007, within our investment securities portfolio, we had $1.5 billion of exposure (excluding TRFC securities) to mortgage-backed securities with subprime collateral. More than 98% of the collateral supporting these mortgage-backed securities is vintage 2005 or earlier.
In addition, within asset-backed securities, we held $379 million of CDOs, at par, that contained subprime exposure. Based on deteriorating conditions in the U.S. housing market, we recognized a pre-tax loss of $200 million ($118 million after-tax) related to these securities in the fourth quarter of 2007. An analysis of
36 The Bank of New York Mellon Corporation
Results of Operations(continued)
the portfolio showed it to be other than temporarily impaired. In addition, we recognized a $13 million loss on CDO exposure in the third quarter of 2007. The carrying value of the CDOs at Dec. 31, 2007 was $179 million or 47% of par. At Dec. 31, 2007, we had discontinued accruing interest on $37 million of these securities due to uncertainty about collecting the carrying value. All of these securities are currently paying interest. We intend to apply interest to principal on these securities which will result in a $9 million reduction of principal in 2008, assuming all interest continues to be paid.
At Dec. 31, 2007, our mortgage-backed securities with subprime exposure and collateralized debt obligations were rated as follows:
| | | | | | |
| Ratings at Dec. 31, 2007 | | Mortgage-
backed
securities (a) | | | Asset-backed
collateralized
debt
obligations | |
AAA | | 18 | % | | 44 | % |
AA | | 65 | | | 38 | |
A | | 16 | | | 18 | |
BBB | | 1 | | | - | |
Total | | 100 | % | | 100 | % |
| (a) | With subprime exposure, excluding TRFC. |
In the third quarter of 2007, we acquired $375 million of commercial paper and medium-term notes issued by a SIV from a portfolio advised by one of our asset managers. During the fourth quarter of 2007, $75 million of these securities matured, and we sold $174 million of these securities, resulting in a pre-tax loss of $8 million. We applied a similar discount to the $126 million of remaining securities which resulted in a write-down of $6 million. Also, in the fourth quarter of 2007, we acquired additional SIV securities with a fair market value of $45 million from a commingled NAV fund. The $165 million carrying amount of remaining SIV securities at Dec. 31, 2007 was 88% of par. On Jan. 8, 2008, we were notified of an enforcement action related to the SIV which will likely result in the liquidation of the SIV. We expect to receive an in-kind vertical slice of the underlying assets held by the SIV if there is a liquidation. At Feb. 25, 2008, the underlying assets held by the SIV were rated 68% AAA, 22% AA and 10% A.
As discussed on pages 16 and 17, on Dec. 31, 2007, we consolidated TRFC. The fair value of TRFC’s asset-backed securities portfolio, which is included in securities available for sale, totaled approximately $3.5 billion at Dec 31, 2007. Below are TRFC’s asset and mortgage-backed securities by credit rating received from external rating agencies.
| | | | | | | | | | | | | | | | |
Credit ratings for TRFC’s asset and mortgage-backed securities Dec. 31, 2007 (dollar amounts in millions) | | AAA | | | AA | | | A | | | Total | |
Variable & fixed rate mortgages | | $ | 1,608 | | | $ | - | | | $ | - | | | $ | 1,608 | |
Home equity lines of credit | | | 799 | | | | - | | | | - | | | | 799 | |
Credit cards | | | - | | | | 39 | | | | 701 | | | | 740 | |
Subprime mortgage loans | | | 270 | | | | - | | | | - | | | | 270 | |
Other asset-backed securities | | | 30 | | | | 20 | | | | - | | | | 50 | |
Total | | $ | 2,707 | (a) | | $ | 59 | | | $ | 701 | | | $ | 3,467 | |
Percent | | | 78 | % | | | 2 | % | | | 20 | % | | | 100 | % |
| (a) | Includes $802 million wrapped with monoline insurance. |
The TRFC securities will be integrated into our investment portfolio during the first quarter of 2008 as the third party funding supporting the investment matures.
The unrealized net of tax loss on securities available-for-sale was $339 million at Dec. 31, 2007. At Dec. 31, 2006, the unrealized gains and losses on securities available for sale netted to zero. The increased unrealized net loss is the result of spreads widening on all instruments, including CDO’s, offset in part by lower interest rates in 2007. We continue to have the ability and intent to hold these securities until any temporary impairment is recovered, or until maturity. The unrealized net of tax loss on securities available-for-sale decreased the adjusted tangible common equity ratio 18 bps at Dec. 31, 2007.
The Bank of New York Mellon Corporation 37
Results of Operations(continued)
The following table shows the maturity distribution by carrying amount and yield (not on a tax equivalent basis) of our securities portfolio at Dec. 31, 2007.
| | | | | | | | | | | | | | | | | | | | | | | | | | | | | | | | | | |
| Securities portfolio | | U.S.
government | | | U.S.
government
agency | | | States and
political
subdivisions | | | Other bonds,
notes and
debentures | | | Mortgage/asset-
backed and equity
securities | | | Total |
| (dollars in millions) | | Amount | | Yield (a) | | | Amount | | Yield (a) | | | Amount | | Yield (a) | | | Amount | | Yield (a) | | | Amount | | | Yield (a) | | |
Securities held-to-maturity: | | | | | | | | | | | | | | | | | | | | | | | | | | | | | | | | | | |
One year or less | | $ | - | | - | % | | $ | - | | - | % | | $ | - | | - | % | | $ | - | | - | % | | $ | - | | | - | % | | $ | - |
Over 1 through 5 years | | | - | | - | | | | - | | - | | | | 4 | | 5.94 | | | | 15 | | 4.68 | | | | - | | | - | | | | 19 |
Over 5 through 10 years | | | - | | - | | | | - | | - | | | | 15 | | 6.17 | | | | - | | - | | �� | | - | | | - | | | | 15 |
Over 10 years | | | - | | - | | | | - | | - | | | | 222 | | 6.66 | | | | - | | - | | | | - | | | - | | | | 222 |
Mortgage-backed securities | | | - | | - | | | | - | | - | | | | - | | - | | | | - | | - | | | | 1,922 | | | 5.35 | | | | 1,922 |
Equity securities | | | - | | - | | | | - | | - | | | | - | | - | | | | - | | - | | | | 2 | | | 4.24 | | | | 2 |
Total | | $ | - | | - | % | | $ | - | | - | % | | $ | 241 | | 6.62 | % | | $ | 15 | | 4.68 | % | | $ | 1,924 | | | 5.35 | % | | $ | 2,180 |
Securities available-for-sale: | | | | | | | | | | | | | | | | | | | | | | | | | | | | | | | | | | |
One year or less | | $ | 341 | | 4.14 | % | | $ | 559 | | 4.45 | % | | $ | 8 | | 8.72 | % | | $ | 336 | | 5.14 | % | | $ | - | | | - | % | | $ | 1,244 |
Over 1 through 5 years | | | 93 | | 3.59 | | | | 219 | | 4.91 | | | | 34 | | 8.50 | | | | 47 | | 7.45 | | | | - | | | - | | | | 393 |
Over 5 through 10 years | | | 3 | | 4.30 | | | | - | | - | | | | 35 | | 5.54 | | | | 182 | | 5.10 | | | | - | | | - | | | | 220 |
Over 10 years | | | - | | - | | | | - | | - | | | | 401 | | 6.85 | | | | 728 | | 4.22 | | | | - | | | - | | | | 1,129 |
Mortgage-backed securities | | | - | | - | | | | - | | - | | | | - | | - | | | | - | | - | | | | 40,802 | | | 5.37 | | | | 40,802 |
Asset-backed securities | | | - | | - | | | | - | | - | | | | - | | - | | | | - | | - | | | | 2,221 | (b) | | 5.50 | | | | 2,221 |
Equity securities | | | - | | - | | | | - | | - | | | | - | | - | | | | - | | - | | | | 509 | | | 4.06 | | | | 509 |
Total | | $ | 437 | | 4.02 | % | | $ | 778 | | 4.58 | % | | $ | 478 | | 6.90 | % | | $ | 1,293 | | 4.71 | % | | $ | 43,532 | | | 5.36 | % | | $ | 46,518 |
| (a) | Yields are based upon the amortized cost of securities. |
| (b) | Includes $37 million, which, at Dec. 31, 2007, the accrual of interest had been discontinued due to uncertainty as to the collection of the carrying value. |
Within our securities portfolio, including TRFC securities, we own $1.7 billion of securities which have a credit enhancement through a guarantee by a monoline insurer. $237 million of these securities are mortgage-backed, $661 million are municipal securities and $802 million are asset-backed securities. At Dec. 31, 2007, these securities were rated AAA. In all cases, when purchasing the securities, we relied on the creditworthiness of the underlying securities.
We also have equity investments categorized as other assets (bracketed amounts indicate carrying values). Included in other assets are joint ventures and other equity investments ($1.251 billion), Federal Reserve Bank stock ($366 million), strategic investments related to asset management and securities servicing ($313 million), private equity investments ($269 million), and tax advantaged low-income housing investments ($201 million).
Our equity investment in Wing Hang has a fair value of $895 million (book value of $275 million) at Dec. 31, 2007. An agreement with certain other shareholders of Wing Hang prohibits the sale of this interest without their permission. We received dividends from Wing
Hang of $17 million, $18 million, and $16 million in 2007, 2006 and 2005, respectively.
Private equity activities consist of investments in private equity funds, mezzanine financings, and direct equity investments. Consistent with our policy to focus on our core activities, we continue to reduce our exposure to these activities. The carrying and fair value of our private equity investments was $269 million at Dec. 31, 2007, down $12 million from $281 million at Dec. 31, 2006. At Dec. 31, 2007, private equity investments consisted of investments in private equity funds of $218 million, direct equity of $29 million, mezzanine financings of $5 million, and leveraged bond funds of $17 million. Fair values for private equity funds are generally based upon information provided by fund sponsors and our knowledge of the underlying portfolio while mezzanine financing and direct equity investments are based upon Company models. At Dec. 31, 2007, we had hedged approximately $8 million of our private equity fund investments. Hedge positions are recorded at fair value with resulting gains and losses reflected in Investment income. In 2007, we had an average invested balance of $275 million in private equity. Investment income and interest income were $71 million, a pre-tax return of 26%.
38 The Bank of New York Mellon Corporation
Results of Operations(continued)
At Dec. 31, 2007, we had $55 million of unfunded investment commitments to private equity funds and partnerships. The timing of future cash requirements to fund such commitments is generally dependent on the investment cycle. This cycle, the period over which privately-held companies are funded by private equity investors and ultimately sold, merged, or taken public through an initial public offering, can vary based on overall market conditions as well as the nature and type of industry in which the companies operate. If unused, the commitments expire in 2010 and 2011.
Commitments to private equity limited partnerships may extend beyond the expiration period shown above to cover certain follow-on investments, claims and liabilities, and organizational and partnership expenses.
From time to time, we may make other fund commitments consistent with our strategy to expand our asset management activities.
Loans
| | | | | | |
| Loans | | Dec. 31, |
| (in billions) | | 2007 | | 2006 (a) |
Period-end: | | | | | | |
Non-margin | | $ | 45.7 | | $ | 32.7 |
Margin | | | 5.2 | | | 5.1 |
Total | | $ | 50.9 | | $ | 37.8 |
Yearly average: | | | | | | |
Non-margin | | $ | 36.1 | | $ | 28.2 |
Margin | | | 5.4 | | | 5.4 |
Total | | $ | 41.5 | | $ | 33.6 |
| (a) | Legacy The Bank of New York only. |
At Dec. 31, 2007, total exposures were $114.9 billion, up from $87.1 billion in 2006 reflecting the merger with Mellon and increased lending to financial institutions. Our financial institutions and commercial portfolios comprise our largest concentrated risk. These portfolios make up 70% of our total lending exposure.
The following table provides additional details on our credit exposures and outstandings for continuing operations at Dec. 31, 2007 in comparison to Dec. 31, 2006.
| | | | | | | | | | | | | | | | | | |
| Total exposure – consolidated | | | | Legacy The Bank of New York only |
| | | Dec. 31, 2007 | | Dec. 31, 2006(a) |
| (in billions) | | Loans | | Unfunded
commitments | | Total
exposure | | Loans | | Unfunded
commitments | | Total
exposure |
Non-margin loans: | | | | | | | | | | | | | | | | | | |
Financial institutions | | $ | 14.1 | | $ | 32.2 | | $ | 46.3 | | $ | 13.0 | | $ | 25.5 | | $ | 38.5 |
Commercial | | | 6.0 | | | 27.8 | | | 33.8 | | | 4.4 | | | 21.8 | | | 26.2 |
Subtotal | | | 20.1 | | | 60.0 | | | 80.1 | | | 17.4 | | | 47.3 | | | 64.7 |
Wealth management loans and mortgages | | | 8.0 | | | 2.2 | | | 10.2 | | | 4.3 | | | 0.5 | | | 4.8 |
Leasing financing | | | 4.9 | | | 0.1 | | | 5.0 | | | 5.5 | | | 0.1 | | | 5.6 |
Commercial real estate | | | 3.0 | | | 1.7 | | | 4.7 | | | 1.4 | | | 1.4 | | | 2.8 |
Other | | | 9.7 | | | - | | | 9.7 | | | 4.1 | | | - | | | 4.1 |
Subtotal non-margin loans | | | 45.7 | | | 64.0 | | | 109.7 | | | 32.7 | | | 49.3 | | | 82.0 |
Margin loans | | | 5.2 | | | - | | | 5.2 | | | 5.1 | | | - | | | 5.1 |
Total | | $ | 50.9 | | $ | 64.0 | | $ | 114.9 | | $ | 37.8 | | $ | 49.3 | | $ | 87.1 |
| (a) | Classifications have been changed following the merger with Mellon |
Total loans were $50.9 billion at Dec. 31, 2007, compared with $37.8 billion at Dec. 31, 2006. The increase primarily reflects the merger with Mellon. Average total loans were $41.5 billion in 2007, compared with $33.6 billion in 2006. The increase in average loans primarily resulted from the merger with Mellon and increased overdrafts related to custody business and broker-dealer loans. Wealth management
loans and mortgages are primarily composed of loans to high-net-worth individuals secured by marketable securities and jumbo mortgages. We had less than $20 million of subprime mortgages in our loan portfolio. These loans were issued to support our Community Reinvestment Act requirements. Other loans are composed largely of overdrafts related to custody and securities clearance clients.
The Bank of New York Mellon Corporation 39
Results of Operations(continued)
Financial institutions
The financial institutions portfolio exposure was $46.3 billion at Dec. 31, 2007, compared to $38.5 billion at Dec. 31, 2006. The increase primarily reflects the merger with Mellon and greater activity in the capital markets in 2007, which drove increased demand for credit from financial institutions. These exposures are of high quality with 88% meeting the investment grade equivalent criteria of our rating system. These exposures are generally short-term, with 72% expiring within one year and are frequently secured. For example, mortgage banking, securities industry, and asset managers often borrow against marketable securities held in custody.
Exposure to banks is largely to investment grade counterparties in developed countries. Non-investment grade bank exposures are short term in nature supporting our global trade finance and dollar clearing businesses in developing countries globally.
As a conservative measure, our internal credit rating classification for international counterparties caps the rating based upon the sovereign rating of the country where the counterparty resides regardless of the credit rating of the counterparty or the underlying collateral.
The asset manager portfolio exposures are high quality with 96% meeting our investment grade equivalent ratings criteria. These exposures are generally short term liquidity facilities with the vast majority to regulated mutual funds. At Dec. 31, 2007, we had $81 million of senior loans to two SIVs, net of $19 million of credit losses which were recorded in 2007. We believe we are adequately reserved for any further potential losses. This represents the extent of our loan exposure to SIVs.
Our mortgage banking exposures are 73% investment grade with the balance of our exposure extended on a secured basis. We have also purchased $200 million of credit protection related to this portfolio.
Included in insurance exposure in the table below is $240 million of direct credit exposure to six monoline financial guaranty insurers. We also extend facilities which provide liquidity, primarily for variable rate tax exempt securities wrapped by monoline insurers. The credit approval for these facilities is based on an assessment of the underlying tax exempt issuer and is not simply dependent upon the monoline.
The diversity of the financial institutions portfolio is shown in the following table:
| | | | | | | | | | | | | | | | | | | | | | | | |
| Financial institutions portfolio exposure | | Dec. 31, 2007 | | | Legacy The Bank of
New York only |
| | | | Dec. 31, 2006(a) |
| (in billions) | | Loans | | Unfunded
commitments | | Total
exposure | | % Inv
grade | | | % due
<1 yr | | | Loans | | Unfunded
commitments | | Total
exposure |
Securities industry | | $ | 6.9 | | $ | 5.2 | | $ | 12.1 | | 92 | % | | 94 | % | | $ | 7.4 | | $ | 3.9 | | $ | 11.3 |
Banks | | | 4.2 | | | 3.2 | | | 7.4 | | 56 | | | 90 | | | | 3.1 | | | 3.0 | | | 6.1 |
Asset managers | | | 1.2 | | | 9.9 | | | 11.1 | | 96 | | | 88 | | | | 1.3 | | | 7.9 | | | 9.2 |
Insurance | | | 0.2 | | | 7.2 | | | 7.4 | | 99 | | | 24 | | | | 0.3 | | | 5.3 | | | 5.6 |
Government | | | 0.1 | | | 3.2 | | | 3.3 | | 100 | | | 32 | | | | 0.1 | | | 2.4 | | | 2.5 |
Mortgage banks | | | 0.6 | | | 0.1 | | | 0.7 | | 73 | | | 55 | | | | 0.2 | | | 0.6 | | | 0.8 |
Other | | | 0.9 | | | 3.4 | | | 4.3 | | 90 | | | 60 | | | | 0.6 | | | 2.4 | | | 3.0 |
Total | | $ | 14.1 | | $ | 32.2 | | $ | 46.3 | | 88 | % | | 72 | % | | $ | 13.0 | | $ | 25.5 | | $ | 38.5 |
| (a) | Classifications have been changed following the merger with Mellon. |
40 The Bank of New York Mellon Corporation
Results of Operations(continued)
Commercial
The commercial portfolio exposure increased to $33.8 billion at Dec. 31, 2007, from $26.2 billion at Dec. 31,
2006 primarily due to the merger with Mellon. Approximately 82% of the portfolio is investment grade and 19% of the portfolio matures within one year.
| | | | | | | | | | | | | | | | | | | | | | | | |
| Commercial portfolio exposure | | | | | Legacy The Bank of
New York only |
| | | Dec. 31, 2007 | | | Dec. 31, 2006 (a) |
| (in billions) | | Loans | | Unfunded
commitments | | Total
exposure | | % Inv
grade | | | % due
<1 yr | | | Loans | | Unfunded
commitments | | Total
exposure |
Media and telecom | | $ | 1.4 | | $ | 2.8 | | $ | 4.2 | | 72 | % | | 12 | % | | $ | 1.3 | | $ | 2.4 | | $ | 3.7 |
Manufacturing | | | 1.9 | | | 9.2 | | | 11.1 | | 76 | | | 21 | | | | 1.1 | | | 6.7 | | | 7.8 |
Energy and utilities | | | 1.0 | | | 6.4 | | | 7.4 | | 94 | | | 6 | | | | 0.6 | | | 5.1 | | | 5.7 |
Services and other | | | 1.7 | | | 9.4 | | | 11.1 | | 84 | | | 29 | | | | 1.4 | | | 7.6 | | | 9.0 |
Total | | $ | 6.0 | | $ | 27.8 | | $ | 33.8 | | 82 | % | | 19 | % | | $ | 4.4 | | $ | 21.8 | | $ | 26.2 |
| (a) | Classifications have been changed following the merger with Mellon. |
Wealth Management loans and mortgages
Wealth Management loans and mortgages are primarily composed of loans to high-net-worth individuals secured by marketable securities and jumbo mortgages. As previously indicated, at Dec. 31, 2007, we had less than $20 million of subprime mortgages in our portfolio. These loans were issued to support our Community Reinvestment Act requirements.
Lease financings
We utilize the leasing portfolio as part of our tax cash flow management strategy. This portfolio generates attractive after-tax risk-adjusted returns. Counterparties in the leasing transactions are generally highly rated. The leasing portfolio consisted of non-airline exposures of $4.7 billion and $249 million of airline exposures at Dec. 31, 2007.
The non-airline portion of the leasing portfolio, now combined with legacy Mellon’s leasing portfolio, consisted of $4.7 billion of exposures backed by well-diversified assets, primarily large-ticket transportation equipment. The largest component is rail, consisting of both passenger and freight trains. Assets are both domestic and foreign-based, with primary concentrations in the United States and European countries. Excluding airline leasing, counterparty rating equivalents at Dec. 31, 2007, were as follows:
| | · | | 35% of the counterparties are AA or better; |
| | · | | 6% are non-investment grade |
At Dec. 31, 2007, our exposure to the airline industry consisted of a $249 million leasing portfolio, including an $18 million real estate lease exposure. At Dec. 31, 2007, the airline-leasing portfolio consisted of $42 million to major U.S. carriers, $143 million to foreign airlines and $64 million to U.S. regionals.
In 2007, the airline industry continued to face challenging operating conditions. Despite the industry’s improved capacity utilization, higher oil prices combined with a weaker economic outlook during the latter half of 2007 had a dampening effect on aircraft values in the secondary market. Because of these factors, we continue to maintain a sizable allowance for loan losses against these exposures and to closely monitor the portfolio. In 2007, we sold $67 million of aircraft leasing exposure, resulting in a charge-off of $36 million. In 2006, we sold $38 million of leasing exposure to a domestic airline, resulting in a charge-off of $23 million.
Commercial real estate
Our commercial real estate lending activities include both construction facilities and medium-term loans. Our client base consists of experienced developers and long-term holders of real estate assets. Loans are approved on the basis of existing or projected cash flow, and supported by appraisals and a knowledge of local market conditions. Development loans are
structured with moderate leverage, and in most instances, involve some level of recourse to the developer. Our commercial real estate loan portfolio totaled $4.7 billion of exposure at Dec. 31, 2007 compared with $2.8 billion of exposure at Dec. 31, 2006. The increase primarily resulted from the Mellon merger. At Dec. 31, 2007, approximately 75% of our
The Bank of New York Mellon Corporation 41
Results of Operations(continued)
commercial real estate portfolio was secured. The secured portfolio is diverse by project type with approximately 28% secured by residential buildings, approximately 22% secured by office buildings, 12% secured by retail properties, and 38% by other categories. Approximately 80% of the unsecured portfolio is allocated to investment grade real estate investment trusts (REITs) under revolving credit agreements.
We avoid speculative development loans. Real estate facilities are focused on experienced owners and are structured with moderate leverage based on existing cash flows.
Other loans
Other loans are composed largely of overdrafts related to custody and securities clearance clients. Overdrafts increased significantly at Dec. 31, 2007 and have since been repaid.
We have credit relationships in the international markets, particularly in areas associated with our
securities servicing and trade finance. Excluding lease financings, these activities resulted in outstanding international loans of $11.7 billion and $6.6 billion at Dec. 31, 2007 and 2006, respectively. This increase primarily resulted from overdrafts related to custody and securities clearance clients.
At Dec. 31, 2007, our emerging markets exposures totaled approximately $5.9 billion consisting primarily of short-term loans, and a $275 million investment in Wing Hang. Emerging market countries where we have exposure include Argentina, Brazil, Bulgaria, Chile, China, Colombia, Costa Rica, Dominican Republic, Egypt, Honduras, Indonesia, India, Israel, Jamaica, Jordan, Korea, Malaysia, Mexico, Mozambique, Panama, Peru, Philippines, Russia, South Africa, Taiwan, Thailand, Turkey, Uruguay, Vietnam, and Yemen.
The table below shows trends in the loans outstanding at year-end on a continuing operations basis over the last five years based on a product analysis.
| | | | | | | | | | | | | | | | | | | | |
| Loans by product | | | | | Legacy The Bank of New York only | |
| (in millions) | | 2007 | | | 2006 | | | 2005 | | | 2004 | | | 2003 | |
Domestic: | | | | | | | | | | | | | | | | | | | | |
Commercial and industrial loans | | $ | 6,553 | | | $ | 4,814 | | | $ | 3,676 | | | $ | 3,411 | | | $ | 4,221 | |
Real estate loans: | | | | | | | | | | | | | | | | | | | | |
Construction and land development | | | 772 | | | | 284 | | | | 324 | | | | 284 | | | | 304 | |
Other, principally commercial mortgages | | | 1,789 | | | | 422 | | | | 554 | | | | 863 | | | | 1,375 | |
Collateralized by residential properties | | | 3,659 | | | | 3,815 | | | | 2,710 | | | | 1,983 | | | | 1,076 | |
Banks and other financial institutions | | | 3,737 | | | | 2,494 | | | | 2,266 | | | | 1,323 | | | | 1,320 | |
Loans for purchasing or carrying securities | | | 6,208 | | | | 7,114 | | | | 4,935 | | | | 3,028 | | | | 4,221 | |
Lease financings | | | 3,206 | | | | 3,032 | | | | 3,262 | | | | 3,595 | | | | 3,727 | |
Less: Unearned income on lease financings | | | (1,174 | ) | | | (832 | ) | | | (938 | ) | | | (1,072 | ) | | | (1,063 | ) |
Wealth loans | | | 4,196 | | | | 266 | | | | 378 | | | | 431 | | | | 573 | |
Margin loans | | | 5,210 | | | | 5,167 | | | | 6,089 | | | | 6,059 | | | | 5,712 | |
Other | | | 2,122 | | | | 1,336 | | | | 946 | | | | 548 | | | | 431 | |
Total domestic | | | 36,278 | | | | 27,912 | | | | 24,202 | | | | 20,453 | | | | 21,897 | |
Foreign: | | | | | | | | | | | | | | | | | | | | |
Commercial and industrial loans | | | 913 | | | | 1,111 | | | | 1,184 | | | | 793 | | | | 1,305 | |
Banks and other financial institutions | | | 8,940 | | | | 5,350 | | | | 4,196 | | | | 3,939 | | | | 2,045 | |
Lease financings | | | 5,811 | | | | 5,802 | | | | 5,816 | | | | 5,871 | | | | 6,026 | |
Less: Unearned income on lease financings | | | (2,876 | ) | | | (2,504 | ) | | | (2,615 | ) | | | (2,731 | ) | | | (2,960 | ) |
Government and official institutions | | | 312 | | | | 9 | | | | 101 | | | | 42 | | | | 93 | |
Other | | | 1,553 | | | | 113 | | | | 43 | | | | 8 | | | | 8 | |
Total foreign | | | 14,653 | | | | 9,881 | | | | 8,725 | | | | 7,922 | | | | 6,517 | |
Less: Allowance for loan losses | | | (327 | ) | | | (287 | ) | | | (326 | ) | | | (491 | ) | | | (558 | ) |
Net loans | | $ | 50,604 | | | $ | 37,506 | | | $ | 32,601 | | | $ | 27,884 | | | $ | 27,856 | |
42 The Bank of New York Mellon Corporation
Results of Operations(continued)
The following table shows the maturity structure of our commercial loan portfolio at Dec. 31, 2007.
| | | | | | | | | | | | | | |
| Maturity of loan portfolio | | Within
1 year | | Between
1 and 5
years | | | After
5 years | | | Total |
| (in millions) | | | | |
Domestic: | | | | | | | | | | | | | | |
Real estate, excluding loans collateralized by 1-4 family residential properties | | $ | 721 | | $ | 1,098 | | | $ | 742 | | | $ | 2,561 |
Commercial and industrial loans | | | 1,858 | | | 4,175 | | | | 520 | | | | 6,553 |
Loans for purchasing or carrying securities | | | 6,113 | | | 95 | | | | - | | | | 6,208 |
Margin loans | | | 5,210 | | | - | | | | - | | | | 5,210 |
Other, excluding loans to individuals and those collateralized by 1-4 family residential properties | | | 4,613 | | | 1,202 | | | | 44 | | | | 5,859 |
Subtotal | | | 18,515 | | | 6,570 | | | | 1,306 | | | | 26,391 |
Foreign | | | 10,928 | | | 765 | | | | 25 | | | | 11,718 |
Total | | $ | 29,443 | | $ | 7,335 | (a) | | $ | 1,331 | (a) | | $ | 38,109 |
| (a) | Variable rate loans due after one year totaled $8.048 billion and fixed-rate loans totaled $618 million. |
Counterparty risk ratings profile
The table below summarizes the risk ratings of our foreign exchange and interest rate derivative counterparty credit exposure for the past year.
| | | | | | | | | | | | | | | |
| Counterparty risk ratings profile for the quarter ended (a) | | | | | Legacy The Bank
of New York only | |
| | | Dec. 31,
2007 | | | Sept. 30,
2007 | | | June 30,
2007 | | | March 31,
2007 | | | Dec. 31,
2006 | |
AAA to AA- | | 72 | % | | 70 | % | | 71 | % | | 75 | % | | 76 | % |
A+ to A- | | 13 | | | 12 | | | 13 | | | 13 | | | 12 | |
BBB+ to BBB- | | 10 | | | 12 | | | 9 | | | 6 | | | 6 | |
Noninvestment grade | | 5 | | | 6 | | | 7 | | | 6 | | | 6 | |
Total | | 100 | % | | 100 | % | | 100 | % | | 100 | % | | 100 | % |
| (a) | Represents credit rating agency equivalent of internal credit ratings. |
For derivative counterparty credit exposure, see Note 24 of Notes to Consolidated Financial Statements.
Asset quality and allowance for credit losses
Over the past several years, we have improved our risk profile through greater focus on clients who are active users of our non-credit services, de-emphasizing broad-based loan growth. Our primary exposure to credit risk of a customer consists of funded loans, unfunded formal contractual commitments to lend, counterparty risk associated with derivative transactions and overdrafts associated with clearing and settlement.
The role of credit has shifted to one that complements our other services instead of as a lead product. Credit solidifies customer relationships and, through a disciplined allocation of capital, can earn acceptable rates of return as part of an overall relationship. We regularly cull our loan portfolio of credit exposures
that no longer meet risk/return criteria, including an assessment of overall relationship profitability. In addition, we make use of credit derivatives and other risk mitigants as economic hedges of portions of the credit risk in our portfolio. The effect of these transactions is to transfer credit risk to creditworthy, independent third parties.
We have implemented the following institutional credit strategies to improve our credit risk profile:
Focus on investment grade names to support cross-selling;
| | · | | Avoid single name/industry concentrations, using credit default swaps as appropriate. At Dec. 31, 2007, we have used credit default swaps to reduce exposure on $2.065 billion of loans and commitments, and |
| | · | | Establish a target of $4.5 billion of exposure reduction which will: |
The Bank of New York Mellon Corporation 43
Results of Operations(continued)
| | · | | lower expected loss and potential volatility in the credit provision, and |
| | · | | result in a modest reduction in interest revenue and associated capital markets fees. |
Activity in allowance for credit losses
The following table details changes in our allowance for credit losses for the last five years:
| | | | | | | | | | | | | | | | | | | | |
| Allowance for credit losses activity | | | | | Legacy The Bank of New York only | |
| (dollar amounts in millions) | | 2007 | | | 2006 | | | 2005 | | | 2004 | | | 2003 | |
Loans outstanding, Dec. 31, | | $ | 50,931 | | | $ | 37,793 | | | $ | 32,927 | | | $ | 28,375 | | | $ | 28,414 | |
Average loans outstanding | | | 41,515 | | | | 33,612 | | | | 32,069 | | | | 30,627 | | | | 28,678 | |
Allowance for credit losses: | | | | | | | | | | | | | | | | | | | | |
Balance, Jan. 1 | | | | | | | | | | | | | | | | | | | | |
Domestic | | $ | 328 | | | $ | 363 | | | $ | 481 | | | $ | 500 | | | $ | 514 | |
Foreign | | | 7 | | | | 11 | | | | 27 | | | | 70 | | | | 79 | |
Unallocated | | | 102 | | | | 96 | | | | 119 | | | | 113 | | | | 99 | |
Total | | | 437 | | | | 470 | | | | 627 | | | | 683 | | | | 692 | |
Charge-offs: | | | | | | | | | | | | | | | | | | | | |
Commercial | | | (53 | ) | | | (27 | ) | | | (144 | ) | | | (24 | ) | | | (118 | ) |
Foreign | | | (19 | ) | | | (2 | ) | | | (10 | ) | | | (28 | ) | | | (26 | ) |
Other | | | (6 | ) | | | - | | | | - | | | | (5 | ) | | | (7 | ) |
Total charge-offs | | | (78 | ) | | | (29 | ) | | | (154 | ) | | | (57 | ) | | | (151 | ) |
Recoveries: | | | | | | | | | | | | | | | | | | | | |
Commercial | | | 14 | | | | 7 | | | | 1 | | | | 2 | | | | 9 | |
Foreign | | | 1 | | | | 7 | | | | 3 | | | | 3 | | | | 1 | |
Other | | | - | | | | 2 | | | | - | | | | - | | | | - | |
Total recoveries | | | 15 | | | | 16 | | | | 4 | | | | 5 | | | | 10 | |
Net charge-offs | | | (63 | ) | | | (13 | ) | | | (150 | ) | | | (52 | ) | | | (141 | ) |
Provision | | | (10 | ) | | | (20 | ) | | | (7 | ) | | | (4 | ) | | | 132 | |
Addition resulting from merger with Mellon | | | 130 | | | | - | | | | - | | | | - | | | | - | |
Balance, Dec. 31, | | | | | | | | | | | | | | | | | | | | |
Domestic | | | 354 | | | | 328 | | | | 363 | | | | 481 | | | | 500 | |
Foreign | | | 24 | | | | 7 | | | | 11 | | | | 27 | | | | 70 | |
Unallocated | | | 116 | | | | 102 | | | | 96 | | | | 119 | | | | 113 | |
Total allowance, Dec. 31, | | $ | 494 | | | $ | 437 | | | $ | 470 | | | $ | 627 | | | $ | 683 | |
Allowance for loan losses | | $ | 327 | | | $ | 287 | | | $ | 326 | | | $ | 491 | | | $ | 558 | |
Allowance for unfunded commitments | | | 167 | | | | 150 | | | | 144 | | | | 136 | | | | 125 | |
Net charge-offs to average loans outstanding | | | 0.15 | % | | | 0.04 | % | | | 0.47 | % | | | 0.17 | % | | | 0.49 | % |
Net charge-offs to total allowance for credit losses | | | 12.75 | | | | 2.97 | | | | 31.91 | | | | 8.29 | | | | 20.64 | |
Total allowance for credit losses to year-end loans outstanding | | | 0.97 | | | | 1.16 | | | | 1.43 | | | | 2.21 | | | | 2.40 | |
Allowance for loan losses to year-end loans outstanding | | | 0.64 | | | | 0.76 | | | | 0.99 | | | | 1.73 | | | | 1.96 | |
Net charge-offs were $63 million in 2007, $13 million in 2006, and $150 million in 2005. Net charge-offs in 2007 included $23 million related to the sale of leased aircraft, $19 million related to foreign SIV exposure and $13 million related to an investment fund. Net charge-offs in 2006 included $23 million related to the sale of airline exposure. Net charge-offs in 2005 included $140 million related to two bankrupt airline customers.
The provision for credit losses was a credit of $10 million in 2007, compared with a credit of $20 million in 2006 and a credit of $7 million in 2005. The provision in 2007 compared with 2006 primarily
reflects the growth in nonperforming assets and the current credit environment.
The total allowance for credit losses was $494 million and $437 million at year-end 2007 and 2006, respectively. The increase in the allowance for loan losses and allowance for unfunded commitments reflects the merger with Mellon, partially offset by credit losses from the sale of airline leases, SIV exposure, and an investment fund. The ratio of the total allowance for credit losses to year-end non-margin loans was 1.08% and 1.34% at Dec. 31,
2007 and 2006. The ratio of the allowance for loan losses to year-end non-margin loans was 0.72% and
44 The Bank of New York Mellon Corporation
Results of Operations(continued)
0.88% at Dec. 31, 2007 and 2006. The decline in these ratios reflects the sale of heavily reserved airline leases in 2007.
We had $5.210 billion and $5.167 billion of secured margin loans on our balance sheet at Dec. 31, 2007 and 2006. We have rarely suffered a loss on these types of loans and do not allocate any of our allowance for credit losses to these loans. As a result, we believe that the ratio of total allowance for credit losses to non-margin loans is a more appropriate metric to measure the adequacy of the reserve.
Our total allowance for credit losses at year-end 2007 equated to approximately 5.7 times the average charge-offs and 6.6 times the average net charge-offs for the last three years. Because historical charge-offs are not necessarily indicative of future charge-off levels, we also give consideration to other risk indicators when determining the appropriate allowance level.
The allowance for loan losses and the allowance for unfunded commitments consist of four elements:
| | · | | an allowance for impaired credits (nonaccrual commercial credits over $1 million); |
| | · | | an allowance for higher risk rated credits; |
| | · | | an allowance for pass rated credits, and |
| | · | | an unallocated allowance based on general economic conditions and risk factors in our individual markets. |
The first element, impaired credits, is based on individual analysis of all nonperforming commercial credits over $1 million. The allowance is measured by the difference between the recorded value of impaired loans and their fair value. Fair value is either the present value of the expected future cash flows from the borrower, the market value of the loan, or the fair value of the collateral.
The second element, higher risk rated credits, is based on the assignment of loss factors for each specific risk category of higher risk credits. We rate each credit in our portfolio that exceeds $1 million and assign the credits to specific risk pools. A potential loss factor is assigned to each pool, and an amount is included in the allowance equal to the product of the amount of the loan in the pool and the risk factor. Reviews of higher risk rated loans are conducted quarterly and the loan’s rating is updated as necessary. We prepare a loss migration analysis and compare our actual loss experience to the loss factors on an annual basis to attempt to ensure the accuracy of the loss factors assigned to each pool.
The third element, pass rated credits, is based on our expected loss model. Borrowers are assigned to pools based on their credit ratings. The expected loss for each loan in a pool incorporates the borrower’s credit rating, loss given default rating and maturity. The credit rating is dependent upon the borrower’s probability of default. The loss given default incorporates a recovery expectation. Borrower ratings are reviewed semi-annually at a minimum and are periodically mapped to third parties, including rating agency and default and recovery, data bases to ensure ongoing consistency and validity. Commercial loans over $1 million are individually analyzed before being assigned a credit rating. We also apply this technique to our leasing and consumer portfolios. At our subsidiary banks that provide credit to small businesses, exposures are pooled and reserves are established based on historical portfolio losses.
The fourth element, the unallocated allowance, is based on management’s judgment regarding the following factors:
| | · | | Economic conditions including duration of the current cycle; |
| | · | | Past experience including recent loss experience; |
| | · | | Volume, composition, and growth of the loan portfolio; |
| | · | | Specific credits and industry conditions; |
| | · | | Results of bank regulatory and internal credit exams; |
| | · | | Geopolitical issues and their impact on the economy; and |
| | · | | Volatility and model risk. |
Based on an evaluation of these four elements, including individual credits, historical credit losses, and global economic factors, we have allocated our allowance for credit losses on a continuing operations basis as follows:
| | | | | | | | | | | | | | | |
Allocation of allowance
for credit losses | | | | | Legacy The Bank of
New York only | |
| | | 2007 | | | 2006 | | | 2005 | | | 2004 | | | 2003 | |
Domestic: | | | | | | | | | | | | | | | |
Real Estate | | 3 | % | | 2 | % | | 1 | % | | 1 | % | | 1 | % |
Commercial | | 61 | | | 67 | | | 72 | | | 73 | | | 73 | |
Wealth management | | 8 | | | 6 | | | 4 | | | 2 | | | - | |
Foreign | | 5 | | | 2 | | | 3 | | | 5 | | | 10 | |
Unallocated | | 23 | | | 23 | | | 20 | | | 19 | | | 16 | |
Total | | 100 | % | | 100 | % | | 100 | % | | 100 | % | | 100 | % |
The Bank of New York Mellon Corporation 45
Results of Operations(continued)
The above allocation is inherently judgmental, and the entire allowance for credit losses is available to absorb credit losses regardless of the nature of the loss. The percentage of the unallocated allowance for credit losses was 23% at Dec. 31, 2007, unchanged from
Dec. 31, 2006. The unallocated allowance reflects various factors in the current credit environment, and is also available, among other things, to absorb further deterioration in our mortgage industry-related exposure.
Nonperforming assets
The following table shows the distribution of nonperforming assets at the end of each of the last five years.
| | | | | | | | | | | | | | | | | | | | |
| Nonperforming assets | | | | | Legacy The Bank of New York only | |
| | | Dec. 31, | |
| (dollar amounts in millions) | | 2007 | | | 2006 | | | 2005 | | | 2004 | | | 2003 | |
Loans: | | | | | | | | | | | | | | | | | | | | |
Commercial | | $ | 39 | | | $ | 26 | | | $ | 12 | | | $ | 121 | | | $ | 207 | |
Commercial real estate | | | 40 | | | | - | | | | - | | | | - | | | | - | |
Residential real estate | | | 20 | | | | 2 | | | | - | | | | - | | | | - | |
Other | | | - | | | | - | | | | 1 | | | | 1 | | | | 9 | |
Foreign | | | 87 | | | | 9 | | | | 13 | | | | 28 | | | | 80 | |
Total nonperforming loans | | | 186 | | | | 37 | | | | 26 | | | | 150 | | | | 296 | |
Other assets owned | | | 4 | | | | 1 | | | | 13 | | | | 1 | | | | - | |
Total nonperforming assets | | $ | 190 | | | $ | 38 | | | $ | 39 | | | $ | 151 | | | $ | 296 | |
Nonperforming assets ratio | | | 0.4 | % | | | 0.1 | % | | | 0.1 | % | | | 0.7 | % | | | 1.3 | % |
Allowance for loan losses/nonperforming loans | | | 175.8 | | | | 775.7 | | | | 1,253.8 | | | | 327.3 | | | | 188.5 | |
Allowance for loan losses/nonperforming assets | | | 172.1 | | | | 755.3 | | | | 835.9 | | | | 325.2 | | | | 188.5 | |
Total allowance for credit losses/nonperforming loans | | | 265.6 | | | | 1,181.1 | | | | 1,807.7 | | | | 418.0 | | | | 230.7 | |
Total allowance for credit losses/nonperforming assets | | | 260.0 | | | | 1,150.0 | | | | 1,205.1 | | | | 415.2 | | | | 230.7 | |
Nonperforming assets increased by $152 million to $190 million at Dec. 31, 2007. The increase relates principally to liquidity facilities to two foreign SIVs ($81 million), a related party loan provided to support an investment management product that is currently being unwound ($24 million), and commercial construction loans ($23 million) and a loan to a real estate development company ($17 million) which are included in commercial real estate loans in the table above. The SIV exposure added to nonperforming loans represents all of the SIV exposure within our loan portfolio.
| | | | | | | | |
| Nonperforming assets activity | | Dec. 31, | |
| (in millions) | | 2007 | | | 2006 (a) | |
Balance at beginning of year | | $ | 38 | | | $ | 39 | |
Additions | | | 215 | | | | 41 | |
Charge-offs | | | (33 | ) | | | (2 | ) |
Paydowns/sales | | | (36 | ) | | | (37 | ) |
Other | | | 6 | | | | (3 | ) |
Balance at end of year | | $ | 190 | | | $ | 38 | |
| (a) | Legacy the Bank of New York only. |
The following table shows loans past due 90 days or more and still accruing interest for the last five years.
| | | | | | | | | | | | |
| Past due loans at year-end | | | | Legacy The Bank of
New York only |
| (in millions) | | 2007 | | 2006 | | 2005 | | 2004 | | 2003 |
Domestic: | | | | | | | | | | | | |
Consumer | | $ | - | | $ 9 | | $ | 2 | | $7 | | $ 9 |
Commercial | | | 343 | | 7 | | | 7 | | 1 | | 2 |
Total domestic | | | 343 | | 16 | | | 9 | | 8 | | 11 |
Foreign Banks | | | - | | - | | | - | | - | | - |
Total past due loans | | $ | 343 | | $16 | | $ | 9 | | $8 | | $11 |
Past due loans at Dec. 31, 2007 were primarily comprised of loans to an asset manager that has filed bankruptcy. (See Note 27 of Notes to Consolidated Financial Statements.) These loans are well secured, largely by high grade fixed income securities, and are in the process of collection.
46 The Bank of New York Mellon Corporation
Results of Operations(continued)
Deposits
Total deposits were $118.1 billion at year-end 2007, compared with $62.1 billion at Dec. 31, 2006 and $49.8 billion at Dec. 31, 2005. The increase, compared with 2006, was primarily due to the merger with Mellon, the Acquired Corporate Trust Business, and growth in the securities servicing business. Noninterest-bearing deposits were $32.4 billion at Dec. 31, 2007, compared with $19.6 billion at Dec. 31, 2006 and $12.7 billion at Dec. 31, 2005. Interest-bearing deposits were $85.8 billion at Dec. 31, 2007, compared with $42.6 billion at Dec. 31, 2006 and $37.1 billion at Dec. 31, 2005.
The aggregate amount of deposits by foreign customers in domestic offices was $7.3 billion, $6.3 billion, and $5.6 billion at Dec. 31, 2007, 2006, and 2005, respectively.
The majority of deposits in foreign offices of $64.7 billion at Dec. 31, 2007 were in amounts in excess of $100,000 and were primarily overnight foreign deposits.
The following table shows the maturity breakdown of domestic time deposits of $100,000 or more at Dec. 31, 2007.
| | | | | | | | | |
Deposits > $100,000 at
Dec. 31, 2007 (in millions) | | Certificates
of deposits | | Other
time
deposits | | Total |
3 months or less | | $ | 600 | | $ | 21,684 | | $ | 22,284 |
Between 3 and 6 months | | | 462 | | | - | | | 462 |
Between 6 and 12 months | | | 92 | | | - | | | 92 |
Over 12 months | | | 1,378 | | | - | | | 1,378 |
Total | | $ | 2,532 | | $ | 21,684 | | $ | 24,216 |
Other borrowings
We fund ourselves primarily through deposits and other borrowings, which are comprised of federal funds purchased and securities sold under repurchase agreement, payables to customers and broker-dealers, other borrowed funds, and long-term debt. At Dec. 31, 2007, we had $4.079 billion of commercial paper that was primarily recorded in the consolidation of TRFC. We eliminated this commercial paper in the first quarter of 2008. We also held $224 million and $85 million of commercial paper at Dec. 31, 2006 and 2005, respectively. Federal funds purchased and securities sold under repurchase agreements were $2.193 billion at Dec. 31, 2007, compared with $790 million at Dec. 31, 2006 and $834 million at Dec. 31, 2005. Payables to customers and broker-dealers were
$7.578 billion at Dec. 31, 2007, $7.266 billion at Dec. 31, 2006 and $8.623 billion at Dec. 31, 2005. Other borrowed funds were $1.840 billion at Dec. 31, 2007, compared with $1.401 billion at Dec. 31, 2006 and $819 million at Dec. 31, 2005. Other borrowed funds consist primarily of extended federal funds purchased and amounts owed to the U.S. Treasury.
See “Liquidity and dividends” below for a discussion of long-term debt.
Information related to federal funds purchased and securities sold under repurchase agreements in 2007, 2006 and 2005 is presented in the table below.
| | | | | | | | | | | | |
Federal funds purchased and
securities sold under repurchase
agreements | | | | | Legacy The Bank of
New York only | |
| (dollar amounts in millions) | | 2007 | | | 2006 | | | 2005 | |
Maximum month-end balance | | $ | 8,496 | | | $ | 2,079 | | | $ | 3,349 | |
Average daily balance | | | 2,890 | | | | 2,237 | | | | 1,284 | |
Average rate during the year | | | 4.30 | % | | | 4.65 | % | | | 2.73 | % |
Balance at Dec. 31 | | | 2,193 | | | | 790 | | | | 834 | |
Average rate at Dec. 31 | | | 3.54 | % | | | 4.18 | % | | | 3.04 | % |
Information related to other borrowed funds in 2007, 2006 and 2005 is presented in the table below.
| | | | | | | | | | | | |
| Other borrowed funds(a) | | | | | Legacy The Bank of
New York only | |
| (dollar amounts in millions) | | 2007 | | | 2006 | | | 2005 | |
Maximum month-end balance | | $ | 5,919 | | | $ | 2,219 | | | $ | 1,414 | |
Average daily balance | | | 2,523 | | | | 2,091 | | | | 1,865 | |
Average rate during the year | | | 3.59 | % | | | 4.77 | % | | | 3.10 | % |
Balance at Dec. 31 | | | 5,919 | | | | 1,625 | | | | 904 | |
Average rate at Dec. 31 | | | 3.07 | % | | | 3.39 | % | | | 3.44 | % |
| (a) | Includes commercial paper. |
Liquidity and dividends
We maintain our liquidity through the management of our assets and liabilities, utilizing worldwide financial markets. The diversification of liabilities reflects our efforts to maintain flexibility of funding sources under changing market conditions. Stable core deposits from our securities servicing businesses, wealth management businesses and treasury services are generated through our diversified network and managed with the use of trend studies and deposit pricing. The use of derivative products such as interest rate swaps and financial futures enhances liquidity by enabling us to issue long-term liabilities with limited exposure to interest rate risk. Liquidity also results from the maintenance of a portfolio of assets that can be easily sold and the monitoring of unfunded loan commitments, thereby reducing unanticipated funding requirements. Liquidity is managed on both a
The Bank of New York Mellon Corporation 47
Results of Operations(continued)
consolidated basis and at The Bank of New York Mellon Corporation parent company (“Parent”).
On July 1, 2007, the merger with Mellon added approximately $33 billion of interest-earning assets, including $18 billion of securities, $7 billion of loans and $6 billion of other money market investments. The merger also provided the following funding sources: $21 billion of interest-bearing deposits; $8 billion of noninterest bearing-deposits; $4 billion of long-term debt and $1 billion of federal funds purchased. Goodwill and intangibles related to the merger with Mellon were approximately $16 billion.
Non-core sources of funds such as money market rate accounts, certificates of deposit greater than $100,000, federal funds purchased and other borrowings were $19.8 billion and $13.9 billion on an average basis in 2007 and 2006, respectively. The increase primarily reflects the merger with Mellon. Average foreign deposits, primarily from our European-based securities servicing business, were $50.3 billion in 2007 compared with $32.6 billion in 2006. The increase in foreign deposits reflects liquidity from our corporate trust and custody businesses, the merger with Mellon, and the acquisition of the Acquired Corporate Trust Business. Domestic savings and other time deposits were $1.6 billion and $1.0 billion on an average basis, in 2007 and 2006 Average payables to customers and broker-dealers were $5.1 billion in 2007 and $4.9 billion in 2006. Long-term debt increased on average to $12.3 billion in 2007 from $8.3 billion in 2006, reflecting the merger with Mellon, as well as the building of liquidity to pay debt maturing in 2008. Average noninterest-bearing deposits increased to $21.7 billion in 2007 from $11.6 billion in 2006, reflecting the acquisition of the Acquired Corporate Trust Business, the merger with Mellon and organic growth in our securities servicing businesses. A significant reduction in our securities servicing businesses would reduce access to deposits.
We have entered into several modest securitization transactions. See Note 16 of Notes to Consolidated Financial Statements. These transactions have not had a significant impact on our liquidity or capital.
The Parent’s cash position was $4.414 billion and $908 million at Dec. 31, 2007 and 2006, respectively. Substantially, all of these funds were deposited with The Bank of New York. Our policy is to maintain sufficient cash for the Parent to be able to satisfy its obligations for one year without the need to access the capital markets or take a dividend from our bank subsidiaries.
The Parent has four major sources of liquidity:
| | · | | dividends from its subsidiaries; |
| | · | | the commercial paper market; |
| | · | | a revolving credit agreement with third party financial institutions; and |
| | · | | access to the capital markets. |
At Dec. 31, 2007, our bank subsidiaries had the ability to pay dividends of approximately $1.635 billion to the Parent without the need for a regulatory waiver. This dividend capacity would increase in 2008 to the extent of the banks’ net income less dividends. At Dec. 31, 2007, nonbank subsidiaries of the Parent had liquid assets of approximately $948 million. These assets could be liquidated and the proceeds delivered by dividend or loan to the Parent. In accordance with GAAP, on July 1, 2007, the retained earnings of the bank subsidiaries acquired in the merger with Mellon were transferred to capital surplus. As a result, the dividend limitations for these banks is limited to the amount of earnings retained in the third and fourth quarters of 2007. Capital can be distributed by these banking subsidiaries via a regulatory waiver.
Restrictions on our ability to obtain funds from our subsidiaries are discussed in more detail in Note 21 of Notes to Consolidated Financial Statements.
In 2007 and 2006, the Parent’s average commercial paper borrowings, which exclude commercial paper issued by TRFC, were $73 million and $349 million, respectively. Commercial paper outstandings issued by the Parent were $65 million and $224 million at Dec. 31, 2007 and 2006, respectively. Net of commercial paper outstanding, the Parent’s cash position at Dec. 31, 2007 increased by $3.665 billion to $4.349 billion compared with Dec. 31, 2006. The Parent has been increasing cash in anticipation of the repayment of long-term debt that matures in the next twelve months.
On Oct. 10, 2006, we entered into a $250 million credit agreement with 11 financial institutions. The facility was reduced to $226 million reflecting our merger with of one of our lenders, Mellon Bank, N.A., pursuant to the merger with Mellon. The fee on this facility depends on our credit rating and at Dec. 31, 2007 was 6 basis points. The credit agreement requires us to maintain:
| | · | | shareholder’s equity of $5 billion; |
| | · | | a ratio of Tier I capital plus the allowance for credit losses to nonperforming assets of at least 2.5; |
| | · | | a double leverage ratio less than 1.3; and |
48 The Bank of New York Mellon Corporation
Results of Operations(continued)
| | · | | adequate capitalization of all our banks for regulatory purposes. |
This facility matures in October 2011. There were no borrowings under this facility at Dec. 31, 2007.
We also have the ability to access the capital markets. In July 2007, we filed an S-3 shelf registration statement with the SEC covering the issuance of an unlimited amount of debt, common stock, preferred stock and trust preferred securities.
Access to the capital markets is partially dependent on our credit ratings, which, as of Dec. 31, 2007, were as follows:
| | | | | | | | | |
| Debt ratings at Dec. 31, 2007 | | Standard
&
Poor’s | | Moody’s | | Fitch | | Dominion
Bond
Rating
Service | |
Parent: | | | | | | | | | |
Commercial paper | | A-1 | | P-1 | | F1+ | | R-1 (middle | ) |
Subordinated long-term debt | |
A | |
Aa3 | | A+ | | A (high | ) |
Senior long-term debt | | A+ | | Aa2 | | AA- | | AA (low | ) |
| | | | |
The Bank of New York: | | | | | | | | | |
Long-term deposits | | AA- | | Aaa | | AA | | AA | |
| | | | |
Mellon Bank, N.A.: | | | | | | | | | |
Long-term deposits | | AA- | | Aaa | | AA | | AA | |
Subordinated debt | | A+ | | Aa1 | | A+ | | AA (low | ) |
| | | | |
Outlook | | Positive | | Stable | | Positive | | Positive | |
Moody’s upgraded our senior debt ratings for The Bank of New York from Aa2 to Aaa in March 2007, and for the Parent from Aa3 to Aa2 in April 2007. In June 2007, Dominion Bond Rating Service upgraded the long-term ratings of the Parent and its subsidiaries to Positive from Stable and the short-term rating of The Bank of New York to R-1 (high) from R-1 (middle). In July 2007, Dominion Bond Rating Service upgraded Mellon Bank, N.A.’s long-term deposits from AA (low) to AA and subordinated debt from A (high) to AA (low). In December 2007, Standard & Poor’s revised our outlook to Positive from Stable.
The Parent’s major uses of funds are payment of dividends, principal and interest on its borrowings, acquisitions, and additional investment in its subsidiaries.
The Parent has $3.050 billion of long-term debt that will become due in 2008. The increased amount of long-term debt due in 2008 is primarily due to $1.350 billion of extendible notes on which investors exercised their right not to extend the maturity date, as
well as $250 million acquired in the merger with Mellon. In 2007, we called $250 million of subordinated debt and $133 million of subordinated debt matured. Also, $700 million of senior debt matured. We have $400 million of subordinated debt that will become callable and steps up to a higher interest rate in 2008. We expect that we will call this debt when the interest rate steps up. In addition, the Parent has the option to call $626 million of subordinated debt in 2008, which it expects to call and refinance if market conditions are favorable. The Parent expects to refinance any debt it repays by issuing a combination of senior and subordinated debt.
We also have $250 million of long-term debt, issued by The Bank of New York that will become due in 2008.
As a result of the merger with Mellon and issuances in 2007, long-term debt increased to $16.873 billion at Dec. 31, 2007 from $8.773 billion at Dec. 31, 2006. In 2007, we issued $309 million of callable medium-term subordinated notes bearing interest at rates from 5.45% to 6.30%. The notes are due in 2022, 2023, 2032 and 2033 and are callable by us after three to five years. The notes qualify as Tier II capital.
In 2007, we issued $4.325 billion of senior debt, summarized in the following table.
| | | |
| Senior debt issuances | | |
| (in millions) | | 2007 |
4.95% non-callable five-year global senior medium-term notes due 2012 | | $ | 1,800 |
5.00% senior notes due 2012 | | | 250 |
3-month LIBOR + 10bps senior note due 2012 | | | 500 |
Extendible notes due 2017(a) | | | 750 |
3-month LIBOR +1.5 bps senior note due 2010 | | | 500 |
3-month LIBOR +35 bps senior note due 2009 | | | 425 |
3-month LIBOR +44 bps senior note due 2010 | | | 100 |
Total senior debt issuances | | $ | 4,325 |
| (a) | Investors exercised their right not to extend the maturity date of these notes; therefore, $650 million is due in the third quarter of 2008 and $100 million is due in the fourth quarter of 2008. |
We have $1.150 billion of junior subordinated debentures that are callable in 2008. These securities qualify as Tier I Capital. We have not yet decided if we will call these securities. The decision to call will be based on interest rates, the availability of cash and capital, and regulatory conditions. If we call the preferred trust securities, we expect to replace them with new preferred trust securities or senior or
subordinated debt. See discussion of qualification of preferred trust securities as capital in “Capital.”
The Bank of New York Mellon Corporation 49
Results of Operations(continued)
Double leverage is the ratio of investment in subsidiaries divided by our consolidated equity plus preferred trust securities. Our double leverage ratio at Dec. 31, 2007, 2006, and 2005 was 98.89%, 102.86%, and 103.91%, respectively. Our target double leverage ratio is a maximum of 120%. The double leverage ratio is monitored by regulators and rating agencies and is an important constraint on our ability to invest in our subsidiaries and expand our businesses.
Pershing LLC, an indirect subsidiary of BNY Mellon, has committed and uncommitted lines of credit in place for liquidity purposes. The committed lines of credit of $500 million with four financial institutions matures in March 2008. In 2007, the average borrowing against these lines of credit was $2 million. Pershing LLC has three separate uncommitted lines of credit amounting to $1 billion in aggregate. In 2007, average daily borrowing under these lines was $17 million in aggregate.
Pershing Limited, an indirect U.K.-based subsidiary of BNY Mellon, has committed and uncommitted lines in place for liquidity purposes. The committed line of credit of $275 million with four financial institutions mature in March 2008. In 2007, the average daily borrowing against this line of credit was $3 million. Pershing Limited has three separate uncommitted lines of credit amounting to $300 million in aggregate. In 2007, average daily borrowing under these lines was $129 million in aggregate.
Statement of cash flows
Cash provided by operating activities was $4.0 billion in 2007, compared with $3.9 billion provided in 2006 and
$1.1 billion used in 2005. The cash flows from operations in 2007 were principally the results of earnings and changes in trading activities. The cash flows from operations in 2006 were principally the result of earnings, the gain on the sale of the Retail Business and changes in trading activities. The cash flows used for operations in 2005 were principally the result of changes in trading activities, partially offset by earnings.
In 2007, cash used for investing activities was $21.6 billion compared to $6.3 billion used for investing activities in 2006 and $7.6 billion used for investing activities in 2005. In 2007, 2006, and 2005, cash was used to increase our investment in highly-rated securities and short-term liquid assets. Interest-bearing deposits were a use of funds in 2007, 2006, and 2005. Loans to customers were a use of funds in 2007, 2006 and 2005. Federal funds sold and securities purchased under resale agreements were also a use of funds in 2007 and 2006 and were a source of funds in 2005.
In 2007, cash provided by financing activities was $21.5 billion as compared to $2.5 billion provided by financing activities in 2006 and $8.1 billion provided by financing activities in 2005. In 2007, 2006 and 2005, sources of funds included deposits and the issuance of long-term debt.
Commitments and obligations
We have contractual obligations to make fixed and determinable payments to third parties as indicated in the table below. The table excludes certain obligations such as trade payables and trading liabilities, where the obligation is short-term or subject to valuation based on market factors.
| | | | | | | | | | | | | | | |
| Contractual obligations at Dec. 31, 2007 | | | | Payments due by period |
| (in millions) | | Total | | Less than
1 year | | 1-3 years | | 3-5 years | | Over
5 years |
Deposits without a stated maturity | | $ | 18,311 | | $ | 18,311 | | $ | - | | $ | - | | $ | - |
Term deposits | | | 67,442 | | | 66,059 | | | 1,222 | | | 15 | | | 146 |
Federal funds purchased and securities sold under repurchase agreements | | | 2,193 | | | 2,193 | | | - | | | - | | | - |
Payables to customers and broker-dealers | | | 7,578 | | | 7,578 | | | - | | | - | | | - |
Other borrowed funds(a) | | | 5,919 | | | 5,919 | | | - | | | - | | | - |
Long-term debt(b) | | | 25,438 | | | 4,099 | | | 3,500 | | | 5,311 | | | 12,528 |
Operating leases | | | 2,623 | | | 331 | | | 493 | | | 422 | | | 1,377 |
Unfunded pension and post retirement benefits | | | 395 | | | 45 | | | 84 | | | 87 | | | 179 |
Capital leases | | | 55 | | | 20 | | | 32 | | | 3 | | | - |
Total contractual obligations | | $ | 129,954 | | $ | 104,555 | | $ | 5,331 | | $ | 5,838 | | $ | 14,230 |
| (a) | Includes commercial paper of $4.079 billion. |
50 The Bank of New York Mellon Corporation
Results of Operations(continued)
We have entered into fixed and determinable commitments as indicated in the tables below:
| | | | | | | | | | | | | | | |
| Other commercial commitments at Dec. 31, 2007 | | | | Amount of commitment expiration per period |
| (in millions) | | Total | | Less Than
1 year | | 1-3 years | | 3-5 years | | Over
5 years |
Securities lending indemnifications | | $ | 618,487 | | $ | 618,487 | | $ | - | | $ | - | | $ | - |
Lending commitments | | | 49,055 | | | 19,134 | | | 9,983 | | | 19,140 | | | 798 |
Standby letters of credit | | | 13,813 | | | 9,261 | | | 2,448 | | | 1,899 | | | 205 |
Commercial letters of credit | | | 1,167 | | | 1,095 | | | 65 | | | 7 | | | - |
Investment commitments(a) | | | 200 | | | 5 | | | 7 | | | 48 | | | 140 |
Purchase obligations(b) | | | 362 | | | 133 | | | 140 | | | 36 | | | 53 |
Total commitments | | $ | 683,084 | | $ | 648,115 | | $ | 12,643 | | $ | 21,130 | | $ | 1,196 |
| (a) | Includes venture capital, community reinvestment act, and other investment-related commitments. Commitments to venture capital limited partnerships may extend beyond expiration period shown to cover certain follow-on investments, claims and liabilities, and organizational and partnership expenses. |
| (b) | Purchase obligations are defined as agreements to purchase goods or services that are enforceable and legally binding and specify all significant terms. |
In addition to the amounts shown in the table above, $92 million of unrecognized tax benefits have been recorded as liabilities in accordance with FIN 48. Related to these unrecognized tax benefits, we have also recorded a liability for potential interest of $28 million associated with these unrecognized tax benefits as of Dec. 31, 2007. At this point, it is not possible to determine when these amounts will be settled or resolved.
We believe that over the next twelve months, it is reasonably possible that the tax benefits associated with the IRS exam of our LILO transactions will be settled (see FSP FAS 13-2 in Note 3 of Notes to Consolidated Financial Statements). Given that we deposited funds with the IRS in anticipation of reaching a settlement (see Commitments and contingent liabilities, Note 24 of Notes to Consolidated Financial Statements), we do not believe the resolution of this matter will have a material impact on our short- and long-term liquidity positions.
Off-balance sheet arrangements
Off-balance sheet arrangements to be discussed in this section are limited to guarantees, retained or contingent interests, certain derivative instruments related to our common stock, and obligations arising out of unconsolidated variable interest entities. For BNY Mellon, these items include certain credit guarantees and securitizations. Guarantees include lending-related guarantees issued as part of our corporate banking business and securities lending indemnifications issued as part of BNY Mellon’s
servicing and fiduciary businesses. We have issued guarantees as indicated in the table below:
| | | | | |
Guarantees at Dec. 31, 2007 (in millions) | | Notional | | Typical Revenue
Based on Notional
(Basis Points) |
Corporate Banking: | | | | | |
Standby letters of credit | | $ | 13,813 | | 12.5-135 |
Commercial letters of credit | | | 1,167 | | 10-150 |
Securities lending indemnifications | | | 618,487 | | 4-8 |
Standby letters of credit and foreign and other guarantees totaled $14 billion at Dec. 31, 2007, an increase of $3 billion compared with Dec. 31, 2006. Standby letters of credit and foreign and other guarantees are used by the customer as a credit enhancement and typically expire without being drawn upon.
A commercial letter of credit is normally a short-term instrument used to finance a commercial contract for the shipment of goods from a seller to a buyer. Although the commercial letter of credit is contingent upon the satisfaction of specified conditions, it represents a credit exposure if the buyer defaults on the underlying transaction. As a result, the total contractual amounts do not necessarily represent future cash requirements. Commercial letters of credit totaled $1.167 billion at Dec. 31, 2007, compared with $1.195 billion at Dec. 31, 2006.
A securities lending transaction is a fully collateralized transaction in which the owner of a security agrees to lend the security through an agent
The Bank of New York Mellon Corporation 51
Results of Operations(continued)
(BNY Mellon) to a borrower, usually a broker/dealer or bank, on an open, overnight or term basis, under the terms of a prearranged contract, which generally matures in less than 90 days. We recorded $366 million of fee revenue from securities lending transactions in 2007 compared with $170 million in 2006. Securities are lent with and without indemnification against broker default. Custodian securities lent with indemnification against broker default of return of securities totaled $618 billion at Dec. 31, 2007, a $219 billion increase compared with Dec. 31, 2006, reflecting the merger with Mellon and the acquisition of the remaining 50% of the ABN AMRO Mellon joint venture, as well as growth in this line of business. These transactions were primarily collateralized at 102% by cash and U.S. government securities, which is monitored daily, thus reducing credit risk. Market risk can also arise in securities lending transactions. These risks are controlled through policies limiting the level of risk that can be undertaken.
We expect many of these guarantees to expire without the need to advance any cash. The revenue associated with guarantees frequently depends on the credit rating of the obligor and the structure of the transaction, including collateral, if any.
We provided services to two qualifying special-purpose entities (“QSPEs”) at Dec. 31, 2007. All of our securitizations are QSPEs as defined by SFAS No. 140, “Accounting for Transfers and Servicing of Financial Assets and Extinguishment of Liabilities,” which, by design, are passive investment vehicles and therefore, we do not consolidate them. See Note 16 of Notes to Consolidated Financial Statements.
Asset-backed commercial paper securitization
In Dec. 2007, we called the first loss notes of TRFC, triggering the consolidation of TRFC. See page 16 for a further discussion.
Since 2000, we have sold and distributed securities for Old Slip Funding, LLC (“OSF”), an asset- backed commercial paper securitization program. We service the program and receive a market-based fee of approximately five basis points that is adequate to compensate us for our servicing responsibilities. As a result, there is no servicing asset or liability.
In 2007, we restructured the program with a third party holding the first loss position, which is designed to absorb the majority of any expected losses. The first loss note holder commitment is $5 million. The Bank of New York provides additional liquidity and credit enhancement to OSF’s commercial paper
securitization program through total rate of return swaps and a subordinated loan. The swaps are constructed to mature as the commercial paper matures. To the extent there is a liquidity issue impacting the paying ability of the underlying assets or if the underlying assets undergo a credit default, the swaps are designed to ensure the timely payments to the beneficial interest holders. At Dec. 31, 2007, the authorized size of the program was $5 billion. Effective Feb. 15, 2008, the authorized program size was lowered to $150 million. OSF is funded by commercial paper (98%) and a subordinated loan (2%). Other than an increased cost of funding, OSF experienced no funding difficulties and did not require liquidity support in 2007. There were no material writedowns of assets held by OSF in 2007. At Dec. 31, 2007, OSF held a $135 million book-value asset portfolio consisting of mortgage-backed securities, 93% of which were rated AAA and 7% were rated A. At Dec. 31, 2007, a FIN 46R analysis was performed on OSF and it was not subject to consolidation by BNY Mellon. Consolidation of OSF would be immaterial to the assets of BNY Mellon.
Capital
| | | | | | | | | | | | |
Capital data (dollar amounts in
millions except per share
amounts; common shares
in thousands) | | | | | Legacy The Bank of
New York only | |
| | 2007 | | | 2006 | | | 2005 | |
Average shareholders’ equity to assets ratio (a) | | | 13.61 | % | | | 9.67 | % | | | 9.34 | % |
At Dec. 31 | | | | | | | | | | | | |
Total shareholders’ equity | | $ | 29,403 | | | $ | 11,429 | | | $ | 9,876 | |
Tangible shareholders’ equity | | $ | 6,670 | | | $ | 4,968 | | | $ | 5,555 | |
Adjusted tangible shareholders’ equity to assets ratio(b)(c) | | | 4.96 | % | | | 5.31 | % | | | 5.57 | % |
Tier I capital ratio (a)(c) | | | 9.32 | % | | | 8.19 | % | | | 8.38 | % |
Total (Tier I plus Tier II) capital ratio(a) | | | 13.25 | % | | | 12.49 | % | | | 12.48 | % |
Leverage capital ratio(a) | | | 6.53 | % | | | 6.67 | % | | | 6.60 | % |
Book value per common share | | $ | 25.66 | | | $ | 16.03 | | | $ | 13.57 | |
Tangible book value per common share | | $ | 5.82 | | | $ | 6.98 | | | $ | 7.64 | |
Dividend per share | | $ | .95 | | | $ | .91 | | | $ | .87 | |
Dividend yield | | | 1.9 | % | | | 2.2 | % | | | 2.6 | % |
Closing common stock price per share | | $ | 48.76 | | | $ | 41.73 | | | $ | 33.76 | |
Market capitalization | | $ | 55,878 | | | $ | 29,761 | | | $ | 24,560 | |
Common shares outstanding | | | 1,145,983 | | | | 713,079 | | | | 727,483 | |
| (a) | Includes discontinued operations. |
| (b) | Shareholders’ equity less goodwill and intangible assets divided by total assets less goodwill and intangible assets. Adjusted for deferred tax liabilities associated with non-tax deductible identifiable intangible assets. |
| (c) | Consolidated target ratios for Tier I and adjusted tangible common equity are 8.00% and 5.00%, respectively. |
52 The Bank of New York Mellon Corporation
Results of Operations(continued)
The increase in shareholders’ equity compared with Dec. 31, 2006 primarily resulted from the merger with Mellon. See Note 4 of Notes to Consolidated Financial Statements for further information regarding the impact of the merger with Mellon. In connection with the merger, we issued 418.3 million shares of common stock, resulting in an increase to shareholders’ equity of $16.7 billion. During 2007, we retained $1.151 billion of operating earnings. Accumulated other comprehensive income declined $257 million reflecting the decrease in the fair value of securities available-for-sale. On July 1, 2007, in connection with the merger with Mellon, we retired all outstanding treasury stock. Since July 1, 2007, we have repurchased 1.7 million shares of common stock.
In a non-taxable business combination, such as our merger with Mellon, deferred tax liabilities are recorded in relation to identifiable intangible assets. The recording of this deferred tax liability results in an increase in goodwill equal to the amount of the deferred tax liability. Bank regulators and rating agencies adjust equity upward for the amount of this deferred tax liability since it is a liability for accounting purposes and will never require a cash settlement unless a sale occurs. As a result, we believe Tier I and adjusted tangible common equity should be our primary capital metrics.
The Tier I and adjusted tangible common equity ratios vary depending on the size of the balance sheet at quarter-end and the impact of interest rates on unrealized gains and losses among other factors. The balance sheet size fluctuates from quarter to quarter based on levels of customer and market activity. In general, when servicing clients are more actively trading securities, deposit balances and the balance sheet as a whole are higher to finance these activities.
Our Tier I capital ratio was 9.32% at Dec. 31, 2007, which is more than 100 basis points above our principal capital measure target for Tier I capital of 8%. Our adjusted tangible common equity ratio was 4.96% at Dec. 31, 2007 and was in line with our targeted capital ratio of 5% of adjusted tangible common equity.
A billion dollar change in risk-weighted assets changes the Tier I ratio by 7 basis points while a $100 million change in common equity changes the Tier I ratio by 8 basis points.
A billion dollar change in assets changes the adjusted tangible common equity ratio by 3 basis points while a $100 million change in common equity changes the adjusted tangible common equity ratio by 6 basis points.
In July 2007, we raised our common stock dividend to $0.24 cents per share. In January 2008, we declared a quarterly common stock dividend of $.24 per share that was paid on Feb. 1, 2008.
In 2006, we retained $2.191 billion of earnings. In 2006, we issued $326 million of callable medium-term subordinated notes qualifying as Tier II capital, as well as $650 million of senior debt. During 2006, we entered into a lease transaction recorded as long-term debt of $527 million. We did not call any debt and $525 million of debt matured. Long-term debt at Dec. 31, 2006 totaled $8.773 billion.
In 2005, we retained $927 million of earnings. In 2005, we issued $500 million of noncallable subordinated notes and $285 million of callable medium-term subordinated notes qualifying as Tier II capital, as well as $1 billion of senior debt. During 2005, we called $94 million of higher rate debt and $110 million of debt matured. Long-term debt increased to $7.817 billion reflecting the transfer of Pershing from the Bank to the Parent.
Stock repurchase programs
Under our stock repurchase program, we repurchase shares from time to time. The following table discloses our repurchases of our common stock in the fourth quarter of 2007.
| | | | | | | | |
| Share repurchases fourth quarter 2007 | | | Total
shares
repurchased
as part of a
publicly
announced
plan |
(common shares in thousands) | | Total
shares
repurchased |
| | Average
price per
share |
(a) | |
Fourth quarter 2007: | | | | | | | | |
October 2007 | | 66 | | | $ 42.04 | | | - |
November 2007 | | 444 | | | 45.31 | | | 420 |
December 2007 | | 47 | | | 44.96 | | | - |
Total fourth quarter 2007 | | 557 | (b) | | $ 44.89 | | | 420 |
| (a) | Amounts include commissions paid which were not significant. Total purchase price in the fourth quarter of 2007 was $19 million. |
| (b) | Includes 137 thousand shares at a purchase price of approximately $6 million purchased from employees primarily in connection with the employees’ payment of taxes upon the vesting of restricted stock. |
The Bank of New York Mellon Corporation 53
Results of Operations(continued)
As disclosed on Aug. 8, 2007, the Executive Committee of the Corporation’s Board of Directors authorized the Corporation to repurchase up to 6.5 million shares, a number based on the unused authorization previously given by the Board of Directors of The Bank of New York.
On Dec. 18, 2007, the Board of Directors of BNY Mellon authorized the repurchase of up to 35 million shares of common stock. This authorization is in addition to the authority to repurchase up to 6.5 million shares previously approved by the Executive Committee of the Board, of which 5.1 million shares remained at Dec. 31, 2007, resulting in an aggregate of 40.1 million shares available for repurchase at Dec. 31, 2007. There is no expiration date on either repurchase program.
Capital adequacy
Regulators establish certain levels of capital for bank holding companies and banks, including BNY Mellon and our bank subsidiaries, in accordance with established quantitative measurements. For the Parent to maintain its status as a financial holding company, our bank subsidiaries must, among other things, qualify as well capitalized. In addition, major bank holding companies such as the Parent are expected by the regulators to be well capitalized. As of Dec. 31, 2007 and 2006, the Parent and our bank subsidiaries were considered well capitalized on the basis of the ratios (defined by regulation) of Total and Tier I capital to risk-weighted assets and leverage (Tier I capital to average assets), which are shown as follows:
| | | | | | | | | | | | | | | | | | | | | |
Consolidated and primary bank
subsidiaries capital ratios | | Dec. 31, 2007 | | | Dec. 31, 2006(a) | | | Guidelines | |
| | | Consolidated | | | The Bank of
New York | | | Mellon
Bank, N.A. | | | Consolidated | | | The Bank of
New York | | | Well
Capitalized | | | Adequately
Capitalized | |
Tier I(b) | | 9.32 | % | | 8.24 | % | | 8.49 | % | | 8.19 | % | | 8.66 | % | | 6 | % | | 4 | % |
Total capital(c) | | 13.25 | | | 11.82 | | | 12.14 | | | 12.49 | | | 11.50 | | | 10 | | | 8 | |
Leverage | | 6.53 | | | 5.64 | | | 8.06 | | | 6.67 | | | 7.06 | | | 5 | | | 3-5 | |
| (a) | Legacy The Bank of New York only. |
| (b) | Tier I capital consists, generally, of common equity, trust-preferred securities (subject to limitations in 2009), and certain qualifying preferred stock, less goodwill and most other intangibles. |
| (c) | Total Capital consists of Tier I capital plus Tier II capital. Tier II capital consists, generally, of certain qualifying preferred stock and subordinated debt and a portion of the loan loss allowance. |
If a bank holding company or bank fails to qualify as “adequately capitalized”, regulatory sanctions and limitations are imposed. At Dec. 31, 2007, the amounts of capital by which BNY Mellon and our primary bank subsidiaries, The Bank of New York and Mellon Bank, N.A. exceed the well-capitalized guidelines are as follows:
| | | | | | | | | |
Capital above
guidelines at
Dec. 31, 2007 (in millions) | | Consolidated | | The Bank of
New York | | Mellon
Bank, N.A. |
Tier I Capital | | $ | 4,007 | | $ | 1,756 | | $ | 696 |
Total Capital | | | 3,925 | | | 1,432 | | | 598 |
Leverage | | | 2,636 | | | 735 | | | 902 |
We currently have $2.030 billion of trust preferred securities outstanding, net of issuance costs. On
March 1, 2005, the Board of Governors of the Federal Reserve System (the “FRB”) adopted a final rule that allows the continued limited inclusion of trust preferred securities in the Tier I capital of bank holding companies (BHCs). Under the final rule, we will be subject to a 15 percent limit in the amount of trust preferred securities that can be included in Tier I capital, net of goodwill, less any deferred tax liability. Amounts in excess of these limits will be included in Tier II capital. The final rule provides a five-year transition period, ending March 31, 2009, for application of quantitative limits. Under the transition rules and final rules, we expect all of our trust preferred securities to continue to qualify as Tier I capital. BNY Mellon and our bank subsidiaries are expected to remain “well capitalized” under the final rule.
54 The Bank of New York Mellon Corporation
Results of Operations(continued)
The following tables present the components of our risk-based capital and risk-adjusted assets at Dec. 31, 2007 and 2006:
| | | | | | | | |
Risk-based and leverage capital ratios at year-end(a) | |
| (in millions) | | 2007 | | | 2006 (b) | |
Tier I capital: | | | | | | | | |
Common shareholders’ equity | | $ | 29,403 | | | $ | 11,429 | |
Trust-preferred securities | | | 2,030 | | | | 1,150 | |
Adjustments for: | | | | | | | | |
Goodwill and other intangibles(c) | | | (20,718 | ) | | | (6,458 | ) |
Pensions | | | 246 | | | | 264 | |
Securities valuation allowance | | | 339 | | | | (13 | ) |
Merchant banking investment | | | (41 | ) | | | (22 | ) |
Total Tier I capital | | | 11,259 | | | | 6,350 | |
Qualifying unrealized equity security gains | | | 2 | | | | - | |
Qualifying subordinate debt | | | 4,257 | | | | 2,903 | |
Qualifying allowance for loan loss | | | 494 | | | | 437 | |
Tier II capital | | | 4,753 | | | | 3,340 | |
Total risk-based capital | | $ | 16,012 | | | $ | 9,690 | |
Total risk-adjusted assets | | $ | 120,866 | | | $ | 77,567 | |
| (a) | On a regulatory basis. |
| (b) | Legacy The Bank of New York only. Certain balances have been revised, see Note 2 of Notes to Consolidated Financial Statements. |
| (c) | Includes a deferred tax liability of $2.006 billion at Dec. 31, 2007 and $159 million at Dec. 31, 2006 associated with non-tax deductible identifiable intangible assets. |
| | | | | | | | | | | | | | |
| Components of risk adjusted assets | | | | Legacy The Bank of
New York only |
| | | 2007 (a) | | 2006(a) |
| (in millions) | | Balance
sheet/
notional
amount | | | Risk
adjusted
balance | | Balance
sheet/
notional
amount | | | Risk
adjusted
balance |
Assets: | | | | | | | | | | | | | | |
Cash, due from banks and interest-bearing deposits in banks | | $ | 40,947 | | | $ | 8,096 | | $ | 16,012 | | | $ | 3,179 |
Securities | | | 48,698 | | | | 12,437 | | | 21,106 | | | | 5,385 |
Trading assets | | | 6,420 | | | | - | | | 5,544 | | | | - |
Fed funds sold and securities purchased under resale agreements | | | 9,108 | | | | 1,590 | | | 5,114 | | | | 801 |
Loans | | | 50,931 | | | | 36,954 | | | 37,793 | | | | 30,224 |
Allowance for loan losses | | | (327 | ) | | | - | | | (287 | ) | | | - |
Other assets | | | 41,879 | | | | 20,149 | | | 17,924 | | | | 10,755 |
Total assets | | $ | 197,656 | | | $ | 79,226 | | $ | 103,206 | | | $ | 50,344 |
Off-balance sheet exposure: | | | | | | | | | | | | | | |
Commitments to extend credit | | $ | 49,664 | | | $ | 15,313 | | $ | 37,448 | | | $ | 12,182 |
Securities lending | | | 618,487 | | | | 8,043 | | | 398,675 | | | | 1,073 |
Standby letters of credit and other guarantees | | | 17,609 | | | | 13,044 | | | 14,695 | | | | 11,284 |
Interest rate contracts | | | 792,601 | | | | 2,528 | | | 766,653 | | | | 1,457 |
Foreign exchange contracts | | | 323,648 | | | | 1,401 | | | 116,980 | | | | 734 |
Equity derivative contracts | | | 11,733 | | | | 197 | | | - | | | | - |
Total off-balance sheet exposure | | $ | 1,813,742 | | | $ | 40,526 | | $ | 1,334,451 | | | | 26,730 |
Market risk equivalent assets | | | | | | | 1,114 | | | | | | | 493 |
Allocated transfer risk reserve | | | | | | | - | | | | | | | - |
Total risk-adjusted assets | | | | | | $ | 120,866 | | | | | | $ | 77,567 |
| (a) | On a regulatory basis. |
The Bank of New York Mellon Corporation 55
Results of Operations(continued)
Capital framework
The U.S. federal bank regulatory agencies’ risk-based capital guidelines are based upon the 1988 Capital Accord of the Basel Committee on Banking Supervision (the “Basel Committee”). The Basel Committee issued, in June 2004, and updated in November 2005, a revised framework for capital adequacy commonly known as the New Accord (the “New Accord” or “Basel II”) that would set capital requirements for operational risk and refine the existing capital requirements for credit risk.
In the United States, U.S. regulators are mandating the adoption of the New Accord for “core” banks. The Bank of New York Mellon is a “core” bank. The only approach available to “core” banks is the Advanced Internal Ratings Based (“A-IRB”) approach for credit risk and the Advanced Measurement Approach (“AMA”) for operational risk.
On Dec. 7, 2007, The U.S. regulatory agencies published the U.S. Basel II final rule in the Federal Register. The final rule becomes effective on April 1, 2008. Under the final rule, 2008 is the first possible year for a bank to begin its parallel run and 2009 is the first possible year for a bank to begin its first of three transitional floor periods.
In the U.S., we are currently working towards implementing Basel II, A-IRB and AMA approaches within the required deadlines. We began implementing the Basel II Standardized Approach at our foreign subsidiaries as of Jan. 1, 2008. We maintain an active dialogue with regulators in U.S. and international jurisdictions to facilitate a smooth Basel II implementation process.
We believe Basel II will not constrain our current business practices and that using the advanced approaches, given our portfolio, could result in a reduction of risk-weighted assets notwithstanding the leverage ratio requirement.
Risk management
The understanding, identification and management of risk are essential elements for the successful management of BNY Mellon.
Our primary risk exposures are:
| | |
| Type of risk | | Description |
Credit | | The possible loss we would suffer if any of our borrowers or other counterparties were to default on their obligations to us. Credit risk arises primarily from lending, trading, and securities servicing activities. |
| | |
Market | | The risk of loss due to adverse changes in the financial markets. Market risk arises from derivative financial instruments, such as futures, forwards, swaps and options, and other financial instruments, including loans, securities, deposits, and other borrowings. Our market risks are primarily interest rate and foreign exchange risk and, to a lesser extent, equity and credit risk. |
| | |
Operational | | The risk of loss resulting from inadequate or failed internal processes, human factors and systems, or from external events. |
Risk management and oversight begins with the Board of Directors and two key Board committees: the Risk Committee and the Audit and Examining Committee (the “A&E Committee”).
The Risk Committee is comprised of independent directors and meets on a regular basis to review and assess our risks control processes with respect to such risks, and our risk management and fiduciary policies and activities. The delegation of policy formulation and day-to-day oversight is to our Chief Risk Officer, who, together with the Chief Auditor and Chief Compliance Officer, helps ensure an effective risk management structure. The functions of the Risk Committee are described in more detail in its charter, a copy of which is available on our website, www.bnymellon.com.
The A&E Committee is also comprised of independent directors, all of whom have been determined by the Board to be financially literate within the meaning of the NYSE listing standards as interpreted by the Board, and two of whom have been determined (based upon education and experience as a principal accounting or financial officer or public
56 The Bank of New York Mellon Corporation
Results of Operations(continued)
accountant, or experience actively supervising a principal accounting or financial officer or public accountant) to be audit committee financial experts as set out in the rules and regulations under the Exchange Act, and to have accounting or related financial management expertise as such qualification under the NYSE listing standards is interpreted by the Board. The A&E Committee meets on a regular basis to perform, among other things, an oversight review of the integrity of our financial statements and financial reporting process, compliance with legal and regulatory requirements, our independent registered public accountant’s qualifications and independence, and the performance of our independent registered public accountant and our internal audit function. The A&E Committee also reviews management’s assessment of the adequacy of internal controls. The functions of the A&E Committee are described in more detail in its charter, a copy of which is available on our website, www.bnymellon.com.
The Senior Risk Management Committee is the senior-most management body that approves BNY Mellon’s risk appetite and tolerances and sets strategic direction and policy and provides oversight for the risk management, compliance and ethics framework.
Our risk management framework is designed to:
| | · | | Provide that risks are identified, monitored, reported, and priced properly; |
| | · | | Define and communicate the types and amount of risk to take; |
| | · | | Communicate to the appropriate management level, the type and amount of risk taken; |
| | · | | Maintain a risk management organization that is independent of the risk taking activities; and |
| | · | | Promote a strong risk management culture that encourages a focus on risk-adjusted performance. |
Credit risk
To balance the value of our activities with the credit risk incurred in pursuing them, we set and monitor internal credit limits for activities that entail credit risk, most often on the size of the exposure and the maximum maturity of credit extended. For credit exposures driven by changing market rates and prices, exposure measures include an add-on for such potential changes.
We manage credit risk at both the individual exposure level as well as at the portfolio level. Credit risk at the
individual exposure level is managed through our credit approval system of Divisional Portfolio Managers (“DPMs”) and the Chief Credit Officer (“CCO”). The DPMs and CCO are responsible for approving the size, terms and maturity of all credit exposures as well as the ongoing monitoring of the exposures. In addition, they are responsible for assigning and maintaining the risk ratings on each exposure.
Credit risk at the portfolio level is managed by the Portfolio Management Division (“PMD”) within the Risk Management and Compliance Sector. The PMD is responsible for calculating two fundamental credit measures. First, we project a statistically expected credit loss, used to help determine the appropriate loan loss reserve and to measure customer profitability. Expected loss considers three basic components: the estimated size of the exposure whenever default might occur, the probability of default before maturity, and the severity of the loss we would incur, commonly called “loss given default.” For corporate banking, where most of our credit risk is created, unfunded commitments are assigned a usage given default percentage. Borrowers/Counterparties are assigned ratings by DPMs and the CCO on an 18-grade scale, which translates to a scaled probability of default. Additionally, transactions are assigned loss-given-default ratings (on a 12-grade scale) that reflect the transactions’ structures including the effects of guarantees, collateral, and relative seniority of position.
The second fundamental measurement of credit risk calculated by the PMD is called economic capital. Our economic capital model estimates the capital required to support the overall credit risk portfolio. Using a Monte Carlo simulation engine and measures of correlation among borrower defaults, the economic model examines extreme and highly unlikely scenarios of portfolio credit loss in order to estimate credit related capital, and then allocates that capital to individual borrowers and exposures. The credit related capital calculation supports a second tier of policy standards and limits by serving as an input to both profitability analysis and concentration limits of capital at risk with any one borrower, industry or country.
The PMD is responsible for the calculation methodologies and the estimates of the inputs used in those methodologies for the determination of expected loss and economic capital. These methodologies and input estimates are regularly evaluated to insure their appropriateness and accuracy. As new techniques and data become available, the PMD attempts to incorporate, where appropriate, those techniques or data.
The Bank of New York Mellon Corporation 57
Results of Operations(continued)
Credit risk is intrinsic to much of the banking business and necessary to its smooth functioning. However, BNY Mellon seeks to limit both on and off-balance sheet credit risk through prudent underwriting and the use of capital only where risk-adjusted returns warrant. We seek to manage risk and improve our portfolio diversification through syndications, asset sales, credit enhancements, credit derivatives, and active collateralization and netting agreements. In addition, we have a separate Credit Risk Review group, which is part of Internal Audit, made up of experienced loan review officers who perform timely reviews of the loan files and credit ratings assigned to the loans.
Market risk
Our market risk governance structure includes two committees comprised of senior executives who review market risk activities, risk measurement methodologies and risk limits, approve new products and provide direction for our market risk profile. The Asset/Liability Management Committee oversees the market risk management process for interest rate risk related to asset/liability management activities. The Market Risk Committee oversees the market risk management process for trading activities, including foreign exchange risk. Both committees are supported by a comprehensive risk management process that is designed to help identify, measure, and manage market risk, as discussed under “Trading Activities and Risk Management” and “Asset/Liability Management” below and in Note 23 of Notes to Consolidated Financial Statements.
Operational risk
Overview
In providing a comprehensive array of products and services, we are exposed to operational risk. Operational risk may result from, but is not limited to, errors related to transaction processing, breaches of the internal control system and compliance requirements, fraud by employees or persons outside the corporation or business interruption due to system failures or other events. Operational risk also includes potential legal or regulatory actions that could arise as a result of noncompliance with applicable laws and/or regulatory requirements. In the case of an operational event, we could suffer a financial loss as well as damage to our reputation.
To address these risks, we maintain comprehensive policies and procedures and an internal control framework designed to provide a sound operational
environment. These controls have been designed to manage operational risk at appropriate levels given our financial strength, the business environment and markets in which we operate, the nature of our businesses, and considering factors such as competition and regulation. Our internal auditors monitor and test the overall effectiveness of the internal control and financial reporting systems on an ongoing basis.
We have also established procedures that are designed to ensure that policies relating to conduct, ethics and business practices are followed on a uniform basis. Among the procedures designed to ensure effectiveness are our “Code of Conduct”, “Know Your Customer”, and compliance training programs.
Operational risk management
We have established operational risk management as an independent risk discipline. The Operational Risk Management (“ORM”) Group reports to the Chief Risk Officer. The organizational framework for operational risk is based upon a strong risk culture that incorporates both governance and risk management activities comprising:
| | · | | Board Oversight and Governance—The Risk Committee of the Board approves and oversees our operational risk management strategy in addition to credit and market risk. The Risk Committee meets regularly to review and approve operational risk management initiatives, discuss key risk issues, and review the effectiveness of the risk management systems. |
| | · | | Business Line Accountability—Business managers are responsible for maintaining an effective system of internal controls commensurate with their risk profiles and in accordance with BNY Mellon policies and procedures. |
| | · | | ORM Group—The ORM Group is responsible for developing risk management policies and tools for assessing, measuring, monitoring and managing operational risk for BNY Mellon. The primary objectives of the ORM group are to promote effective risk management, identify emerging risks, create incentives for generating continuous improvement in controls, and to optimize capital. |
Global compliance
Our global compliance function provides leadership, guidance, and oversight to help business units identify
58 The Bank of New York Mellon Corporation
Results of Operations(continued)
applicable laws and regulations and implement effective measures to meet the specific requirements. Compliance takes a proactive approach by anticipating evolving regulatory standards and remaining aware of industry best practices, legislative initiatives, competitive issues, and public expectations and perceptions. The function uses its global reach to disseminate information about compliance-related matters throughout the Corporation. The Chief Compliance and Ethics Officer reports to the Chief Risk Officer, is a member of all critical committees of the Corporation, and provides regular updates to the A&E Committee of the Board of Directors.
Internal audit
Our internal audit function reports directly to the A&E Committee of the Board of Directors. Internal Audit utilizes a risk-based approach to its audit activity covering the risks in the operational, compliance, regulatory, technology, fraud, processing and other key risk areas of the Corporation. Internal Audit has unrestricted access to the Corporation and regularly participates in key committees of the Corporation.
Economic Capital
BNY Mellon has implemented a methodology to quantify economic capital. We define economic capital as the capital required to protect against unexpected economic losses over a one-year period at a level consistent with the solvency of a firm with a target debt rating. We quantify economic capital requirements for the risks inherent in our business activities using statistical modeling techniques and then aggregate them at the consolidated level. A capital reduction, or diversification benefit, is applied to reflect the unlikely event of experiencing an extremely large loss in each type of risk at the same time. Economic capital levels are directly related to our risk profile. As such, it has become a part of our internal capital assessment process and, along with regulatory capital, is a key component to ensuring that the actual level of capital is commensurate with our risk profile, and is sufficient to provide the financial flexibility to undertake future strategic business initiatives.
The framework and methodologies to quantify each of our risk-types have been developed by the PMD and are designed to be consistent with our risk management principles. The framework has been approved by senior management and has been
reviewed by the Risk Committee of the Board of Directors. Due to the evolving nature of quantification techniques, we expect to continue to refine the methodologies used to estimate our economic capital requirements.
Trading activities and risk management
Our trading activities are focused on acting as a market maker for our customers. The risk from these market making activities and from our own positions is managed by our traders and limited in total exposure as described below.
We manage trading risk through a system of position limits, a value-at-risk (“VAR”) methodology based on a Monte Carlo simulation, stop loss advisory triggers, and other market sensitive measures. Risk is monitored and reported to senior management by a separate unit on a daily basis. Based on certain assumptions, the VAR methodology is designed to capture the potential overnight pre-tax dollar loss from adverse changes in fair values of all trading positions. The calculation assumes a one-day holding period for most instruments, utilizes a 99% confidence level, and incorporates the non-linear characteristics of options. The VAR model is the basis for the economic capital calculation, which is allocated to lines of business for computing risk-adjusted performance.
As the VAR methodology does not evaluate risk attributable to extraordinary financial, economic or other occurrences, the risk assessment process includes a number of stress scenarios based upon the risk factors in the portfolio and management’s assessment of market conditions. Additional stress scenarios based upon historic market events are also tested. Stress tests, by their design, incorporate the impact of reduced liquidity and the breakdown of observed correlations. The results of these stress tests are reviewed weekly with senior management.
The Bank of New York Mellon Corporation 59
Results of Operations(continued)
The following tables indicate the calculated VAR amounts for the trading portfolio for the years ended Dec. 31, 2007 and 2006.
| | | | | | | | | | | | | | |
VAR (a) (b) (in millions) | | 2007 | |
| | Average | | | Minimum | | Maximum | | Dec. 31 | |
Interest rate | | $ | 4.0 | | | $ | 1.9 | | $ | 9.5 | | $ | 5.7 | |
Foreign exchange | | | 1.6 | | | | 1.0 | | | 4.1 | | | 1.4 | |
Equity | | | 2.3 | | | | 1.0 | | | 6.6 | | | 1.4 | |
Credit | | | 2.7 | | | | 0.5 | | | 8.0 | | | 5.6 | |
Commodities | | | 2.0 | | | | - | | | 3.7 | | | - | |
Diversification | | | (3.3 | ) | | | N/M | | | N/M | | | (5.3 | ) |
Overall portfolio | | | 9.3 | | | | 3.0 | | | 16.3 | | | 8.8 | |
| | | | | | | | | | | | | | |
VAR (a) (b) (in millions) | | 2006 | |
| | Average | | | Minimum | | Maximum | | Dec. 31 | |
Interest rate | | $ | 2.9 | | | $ | 1.8 | | $ | 7.6 | | $ | 3.1 | |
Foreign exchange | | | 1.1 | | | | 0.6 | | | 2.6 | | | 1.3 | |
Equity | | | 1.1 | | | | 0.5 | | | 3.7 | | | 1.0 | |
Credit derivatives | | | 0.9 | | | | 0.6 | | | 2.2 | | | 0.8 | |
Diversification | | | (1.6 | ) | | | N/M | | | N/M | | | (2.1 | ) |
Overall portfolio | | | 4.4 | | | | 3.0 | | | 6.8 | | | 4.1 | |
| (a) | Results for 2007 include six months of the combined Company’s results and six months of legacy The Bank of New York only. Results for 2006 are legacy The Bank of New York only. |
| (b) | Value-at-Risk is intended to depict risk by underlying driver, i.e. interest rate, currency exchange rate, or counterparty credit quality. Accordingly, the credit derivative risk category has been revised to credit. |
| N/M | - Because the minimum and maximum may occur on different days for different risk components, it is not meaningful to compute a portfolio diversification effect. |
During the year 2007, interest rate risk generated 30% of average VAR, credit derivatives generated 20% of average VAR, foreign exchange accounted for 12% of average VAR, commodities risk generated 21% of average VAR, and equity generated 17% of average VAR. During 2007, our daily trading loss did not exceed our calculated VAR amount on any given day.
Asset/liability management
Our diversified business activities include lending, investing in securities, accepting deposits, processing securities, raising money as needed to fund assets, and other transactions. The market risks from these activities are interest rate risk and foreign exchange risk. Our primary market risk is exposure to movements in U.S. dollar interest rates and certain foreign currency interest rates. We actively manage interest rate sensitivity. In addition to gap analysis, we use earnings simulation and discounted cash flow models to identify interest rate exposures.
An earnings simulation model is the primary tool used to assess changes in pre-tax net interest revenue. The model incorporates management’s assumptions regarding interest rates, balance changes on core deposits, market spreads, changes in the prepayment behavior of loans and securities, and the impact of derivative financial instruments used for interest rate risk management purposes. These assumptions have been developed through a combination of historical analysis and future expected pricing behavior. These assumptions are inherently uncertain, and, as a result, the earnings simulation model cannot precisely estimate net interest revenue or the impact of higher or lower interest rates on net interest revenue. Actual results may differ from projected results due to timing, magnitude and frequency of interest rate changes and changes in market conditions and management’s strategies, among other factors.
We evaluate the effect on earnings by running various interest rate ramp scenarios up and down from a baseline scenario, which assumes no changes in interest rates. These scenarios are reviewed to examine the impact of large interest rate movements. Interest rate sensitivity is quantified by calculating the change in pre-tax net interest revenue between the scenarios over a 12-month measurement period.
The following table shows net interest revenue sensitivity for The Bank of New York Mellon:
| | | | | | |
Estimated changes in net interest revenue (dollar amounts in millions) | | Dec. 31, 2007 | |
| | $ | | % | |
up 200 bps vs. stable rate | | $ | 106 | | 3.6 | % |
up 100 bps vs. stable rate | | | 64 | | 2.2 | |
down 100 bps vs. stable rate | | | 13 | | 0.4 | |
down 200 bps vs. stable rate | | | 31 | | 1.1 | |
bps - basis points.
The baseline scenario’s Fed Funds rate in the Dec. 31, 2007 analysis was 4.25%. The 100 basis point ramp scenarios assume short-term rates change 25 basis points in each of the next four quarters, while the 200 basis point ramp scenarios assume a 50 basis point per quarter change. The down 100 basis point and the down 200 basis point Dec. 31, 2007 scenarios assume 10 year rates decline 41 and 66 basis points, respectively. Both the up 100 basis point and the up 200 basis point Dec. 31, 2007 scenarios assume a steepening of the yield curve with 10-year rates rising 134 and 234 basis points, respectively. These scenarios do not reflect strategies that management could employ to limit the impact as interest rate
60 The Bank of New York Mellon Corporation
Results of Operations(continued)
expectations change. The previous table relies on certain critical assumptions including depositors’ behavior related to interest rate fluctuations and the prepayment and extension risk in certain of our assets. To the extent that actual behavior is different from that assumed in the models, there could be a change in interest rate sensitivity.
We also project future cash flows from our assets and liabilities over a long-term horizon and then discount these cash flows using the same assumptions noted above. The aggregation of these discounted cash flows is the Economic Value of Equity (“EVE”). The following table shows how the EVE would change in response to changes in interest rates:
| | | |
| Estimated changes in EVE at Dec. 31, 2007 | | | |
Rate change: | | | |
up 200 bps vs. stable rate | | (0.8 | )% |
up 100 bps vs. stable rate | | 0.2 | |
down 100 bps vs. stable rate | | 1.3 | |
down 200 bps vs. stable rate | | 1.7 | |
These results do not reflect strategies that management could employ to limit the impact as interest rate expectations change.
The asymmetrical accounting treatment of the impact of a change in interest rates on our balance sheet may create a situation in which an increase in interest rates can adversely affect reported equity and regulatory capital, even though economically there may be no impact on our economic capital position. For example, an increase in rates will result in a decline in the value of our fixed income investment portfolio, which will be reflected through a reduction in other comprehensive income in our shareholders’ equity, thereby affecting the adjusted tangible common equity (TCE) ratio. Under current accounting rules, to the extent FAS 159-Fair-value option is not applied, there is no corresponding change on our fixed liabilities, even though economically these liabilities are more valuable as rates rise.
We project the impact of this change using the same interest rate ramp up assumptions described earlier and comparing the projected mark-to-market on the investment securities portfolio at Dec. 31, 2007, under the higher rate environments versus a stable rate
scenario. The table below shows the impact of a change in interest rates on the adjusted TCE ratio:
| | | |
| Estimated changes in the adjusted TCE ratio at Dec. 31, 2007 | | | |
| (in basis points) | | | |
up 200 bps vs. stable rate | | (61 | ) |
up 100 bps vs. stable rate | | (31 | ) |
down 100 bps vs. stable rate | | 23 | |
down 200 bps vs. stable rate | | 41 | |
These results do not reflect strategies that management could employ to limit the impact as interest rate expectations change.
To manage foreign exchange risk, we fund foreign currency-denominated assets with liability instruments denominated in the same currency. We utilize various foreign exchange contracts if a liability denominated in the same currency is not available or desired, and to minimize the earnings impact of translation gains or losses created by investments in overseas markets. The foreign exchange risk related to the interest rate spread on foreign currency-denominated asset/liability positions is managed as part of our trading activities. We use forward foreign exchange contracts to protect the value of our net investment in foreign operations. At Dec. 31, 2007, net investments in foreign operations totaled approximately $6.662 billion and were spread across 12 foreign currencies.
Business continuity
We are prepared for events that could damage our physical facilities, cause delay or disruptions to operational functions, including telecommunications networks, or impair our clients, vendors, and counterparties. Key elements of our business continuity strategies are extensive planning and testing, and diversity of business operations, data centers and telecommunications infrastructure.
We have established multiple geographically diverse locations for our funds transfer and broker-dealer services operational units, which provide redundant functionality to facilitate uninterrupted operations.
Our securities clearing, mutual fund accounting and custody, securities lending, master trust, UIT, corporate trust, stock transfer, item processing, wealth management and treasury units have common functionality in multiple sites designed to facilitate continuance of operations or rapid recovery. In
The Bank of New York Mellon Corporation 61
Results of Operations(continued)
addition, we have recovery positions for over 11,500 employees on a global basis.
We continue to enhance geographic diversity for business operations by moving additional personnel to growth centers outside of existing major urban centers. We replicate 100% of our critical production computer data to multiple recovery data centers.
We have an active telecommunications diversity program. All major buildings and data centers have diverse telecommunications carriers. The data centers have multiple fiber optic rings and have been designed so that there is no single point of failure. All major buildings have been designed with diverse telecommunications access and connect to at least two geographically dispersed connection points. We have an active program to audit circuits for route diversity and to test customer back-up connections.
In 2003, the Board of Governors of the Federal Reserve System, the Office of the Comptroller of the Currency and the Securities and Exchange Commission jointly published the Interagency Paper, “Sound Practices to Strengthen the Resilience of the U.S. Financial System” (“Sound Practices Paper”). The purpose of the document was to define the guidelines for the financial services industry and other interested parties regarding “best practices” related to business continuity planning. Under these guidelines we are a key clearing and settlement organization required to meet a higher standard for business continuity.
We believe we have substantially met all of the requirements of the Sound Practices Paper. As a core clearing and settlement organization, we believe that we are at the forefront of the industry in improving business continuity practices.
We are committed to seeing that requirements for business continuity are met not just within our own facilities, but also within those of vendors and service
providers whose operation is critical to our safety and soundness. To that end, we have a Service Provider Management Office whose function is to review new and existing service providers and vendors to see that they meet our standards for business continuity, as well as for information security, financial stability, personnel practices, etc.
We have developed a comprehensive plan to prepare for the possibility of a flu pandemic, which anticipates significant reduced staffing levels and will provide for increased remote working by staff for one or more periods lasting several weeks.
Although we are committed to observing best practices as well as meeting regulatory requirements, geopolitical uncertainties and other external factors will continue to create risk that cannot always be identified and anticipated.
The Bank of New York historical earnings per share and average shares outstanding
In the merger transaction between The Bank of New York and Mellon, The Bank of New York shareholders received .9434 shares of BNY Mellon common stock for each share of The Bank of New York common stock outstanding on the closing date of the merger. Mellon shareholders received one share of BNY Mellon common stock for each share of Mellon common stock outstanding on the closing date of the merger. The table below converts earnings per share and average shares outstanding for legacy The Bank of New York into post-merger share count terms.
In addition, all authorized, issued, treasury stock and loan to ESOP share amounts have been adjusted for the conversion ratio of .9434 described above. In the merger transaction, all shares of treasury stock of The Bank of New York and Mellon were cancelled and retired.
62 The Bank of New York Mellon Corporation
Results of Operations(continued)
| | | | | | | | | |
Continuing operations – before extraordinary (loss) (in dollars, share amounts in thousands) | | | | Legacy The Bank
of New York only |
| | 2007 | | 2006 | | 2005 |
Earnings per share: | | | | | | | | | |
Basic – as reported | | $ | 2.41 | | $ | 1.95 | | $ | 1.75 |
Basic – adjusted for exchange ratio | | | 2.41 | | | 2.07 | | | 1.86 |
Basic – as reported – excluding merger and integration expense (a) | | | 2.67 | | | 2.05 | | | 1.75 |
Basic – adjusted for exchange ratio – excluding merger and integration expense (a) | | | 2.67 | | | 2.17 | | | 1.86 |
| | | |
Diluted – as reported | | | 2.38 | | | 1.93 | | | 1.74 |
Diluted – adjusted for exchange ratio | | | 2.38 | | | 2.04 | | | 1.84 |
Diluted – as reported – excluding merger and integration expense (a) | | | 2.64 | | | 2.02 | | | 1.74 |
Diluted – adjusted for exchange ratio – excluding merger and integration expense (a) | | | 2.64 | | | 2.14 | | | 1.84 |
| | | |
Average shares outstanding: | | | | | | | | | |
Basic – as reported | | | 923,199 | | | 756,620 | | | 764,963 |
Basic – adjusted for exchange ratio | | | 923,199 | | | 713,795 | | | 721,666 |
Diluted – as reported | | | 934,704 | | | 765,749 | | | 772,851 |
Diluted – adjusted for exchange ratio | | | 934,704 | | | 722,407 | | | 729,108 |
| (a) | After-tax merger and integration expense totaled $238 million and $72 million for the years ended Dec. 31, 2007 and, Dec. 31, 2006, respectively. There was no merger and integration expense for 2005. |
Supplemental information – Reconciliation of diluted earnings per share – GAAP to non-GAAP
Reported amounts are presented in accordance with GAAP. We believe that this supplemental non-GAAP information is useful to the investment community in analyzing the financial results and trends of our business. We believe they facilitate
comparisons with prior periods and reflect the principal basis on which our management internally monitors financial performance. These non-GAAP items also are excluded from our segment measures used internally to evaluate segment performance because management does not consider them particularly relevant or useful in evaluating the operating performance of our business segments.
| | | | | | | | | | | | | | | | | | | | | | |
| Reconciliation of GAAP to non-GAAP EPS (a) | | 2007 | | | 2006(b) | | | 2005 | |
| (dollar amounts in millions, except per share amounts) | | After-tax | | | Diluted
EPS | | | After-tax | | Diluted
EPS | | | After-tax | | Diluted
EPS | |
Net income-GAAP | | $ | 2,039 | | | $ | 2.18 | | | $ | 2,847 | | $ | 3.94 | | | $ | 1,571 | | $ | 2.16 | |
Discontinued operations income (loss) | | | (8 | ) | | | (0.01 | ) | | | 1,371 | | | 1.90 | | | | 228 | | | 0.31 | |
Extraordinary (loss)-TRFC | | | (180 | ) | | | (0.19 | ) | | | - | | | - | | | | - | | | - | |
Continuing operations before extraordinary item | | | 2,227 | | | | 2.38 | | | | 1,476 | | | 2.04 | | | | 1,343 | | | 1.84 | (c) |
Merger and integration (M&I) expenses | | | 238 | | | | 0.25 | | | | 72 | | | 0.10 | | | | - | | | - | |
Continuing operations before extraordinary item, and M&I expenses | | | 2,465 | | | | 2.64 | (c) | | | 1,548 | | | 2.14 | | | | 1,343 | | | 1.84 | |
Intangible amortization expense | | | 197 | | | | 0.21 | | | | 50 | | | 0.07 | | | | 27 | | | 0.04 | |
Continuing operations before extraordinary item, M&I expenses and intangible amortization – non-GAAP | | $ | 2,662 | (d) | | $ | 2.85 | (d) | | $ | 1,598 | | $ | 2.22 | (c) | | $ | 1,370 | | $ | 1.88 | |
| (a) | Results for 2007 include six months of the combined Company’s results. Results for 2006 and 2005 include legacy The Bank of New York only. |
| (b) | Revised, see Note 2 of Notes to Consolidated Financial Statements. |
| (c) | Amounts do not foot due to rounding. |
| (d) | Results include $118 million after-tax, or $0.13 per share resulting from writedown of CDOs. |
The Bank of New York Mellon Corporation 63
SUPPLEMENTAL INFORMATION
| | | | | | | | | | | | | | | | | | | | | | | | |
| Rate/Volume analysis(a) | | 2007 vs. 2006
Inc. (Dec.) due to change in | | | 2006 vs. 2005
Inc. (Dec.) due to change in | |
| (dollar amounts in millions, presented on an FTE basis) | | Average
balance | | | Average
Rate | | | Total
Inc.
(Dec.) | | | Average
balance | | | Average
rate | | | Total
Inc.
(Dec.) | |
Interest Revenue | | | | | | | | | | | | | | | | | | | | | | | | |
Interest-earning assets: | | | | | | | | | | | | | | | | | | | | | | | | |
Interest-bearing deposits with banks (primarily foreign banks) | | $ | 606 | | | $ | 98 | | | $ | 704 | | | $ | 157 | | | $ | 107 | | | $ | 264 | |
Federal funds sold and securities purchased under resale agreements | | | 148 | | | | 12 | | | | 160 | | | | 12 | | | | 48 | | | | 60 | |
Margin loans | | | 1 | | | | 1 | | | | 2 | | | | (48 | ) | | | 111 | | | | 63 | |
Non-margin loans: | | | | | | | | | | | | | | | | | | | | | | | | |
Domestic offices | | | | | | | | | | | | | | | | | | | | | | | | |
Consumer | | | 102 | | | | 8 | | | | 110 | | | | 70 | | | | 7 | | | | 77 | |
Commercial | | | 186 | | | | 20 | | | | 206 | | | | 13 | | | | 136 | | | | 149 | |
Foreign offices | | | 127 | | | | (8 | ) | | | 119 | | | | 46 | | | | 132 | | | | 178 | |
Total non-margin loans | | | 415 | | | | 20 | | | | 435 | | | | 129 | | | | 275 | | | | 404 | |
Securities: | | | | | | | | | | | | | | | | | | | | | | | | |
U.S. government obligations | | | 4 | | | | - | | | | 4 | | | | (3 | ) | | | 2 | | | | (1 | ) |
U.S. government agency obligations | | | 197 | | | | 24 | | | | 221 | | | | (9 | ) | | | 25 | | | | 16 | |
Obligations of states and political subdivisions | | | 20 | | | | (2 | ) | | | 18 | | | | (3 | ) | | | - | | | | (3 | ) |
Other securities: | | | | | | | | | | | | | | | | | | | | | | | | |
Domestic offices | | | 234 | | | | 41 | | | | 275 | | | | 47 | | | | 174 | | | | 221 | |
Foreign offices | | | 228 | | | | 21 | | | | 249 | | | | 37 | | | | (6 | ) | | | 31 | |
Total other securities | | | 462 | | | | 62 | | | | 524 | | | | 84 | | | | 168 | | | | 252 | |
Trading securities: | | | | | | | | | | | | | | | | | | | | | | | | |
Domestic offices | | | 20 | | | | (3 | ) | | | 17 | | | | 3 | | | | 5 | | | | 8 | |
Foreign offices | | | (103 | ) | | | 19 | | | | (84 | ) | | | (2 | ) | | | 6 | | | | 4 | |
Total trading securities | | | (83 | ) | | | 16 | | | | (67 | ) | | | 1 | | | | 11 | | | | 12 | |
Total securities | | | 600 | | | | 100 | | | | 700 | | | | 70 | | | | 206 | | | | 276 | |
Total interest revenue | | | 1,770 | | | | 231 | | | | 2,001 | | | | 320 | | | | 747 | | | | 1,067 | |
Interest expense | | | | | | | | | | | | | | | | | | | | | | | | |
Interest-bearing deposits | | | | | | | | | | | | | | | | | | | | | | | | |
Domestic offices: | | | | | | | | | | | | | | | | | | | | | | | | |
Money market rate accounts | | $ | 181 | | | $ | 23 | | | $ | 204 | | | $ | (16 | ) | | $ | 52 | | | $ | 36 | |
Savings | | | 3 | | | | 7 | | | | 10 | | | | (1 | ) | | | 2 | | | | 1 | |
Certificates of deposits of $100,000 & over | | | (67 | ) | | | 9 | | | | (58 | ) | | | 39 | | | | 64 | | | | 103 | |
Other time deposits | | | 26 | | | | 8 | | | | 34 | | | | 3 | | | | 7 | | | | 10 | |
Total domestic | | | 143 | | | | 47 | | | | 190 | | | | 25 | | | | 125 | | | | 150 | |
Foreign offices: | | | | | | | | | | | | | | | | | | | | | | | | |
Banks in foreign countries | | | 108 | | | | 7 | | | | 115 | | | | 17 | | | | 97 | | | | 114 | |
Government & official institutions | | | 16 | | | | 4 | | | | 20 | | | | 4 | | | | 7 | | | | 11 | |
Other time and savings | | | 501 | | | | 129 | | | | 630 | | | | 135 | | | | 185 | | | | 320 | |
Total foreign | | | 625 | | | | 140 | | | | 765 | | | | 156 | | | | 289 | | | | 445 | |
Total interest-bearing deposits | | | 768 | | | | 187 | | | | 955 | | | | 181 | | | | 414 | | | | 595 | |
Federal funds purchased & securities sold under repurchase agreements | | | 29 | | | | (8 | ) | | | 21 | | | | 35 | | | | 34 | | | | 69 | |
Other funds borrowed: | | | | | | | | | | | | | | | | | | | | | | | | |
Domestic offices | | | 7 | | | | (25 | ) | | | (18 | ) | | | 6 | | | | 33 | | | | 39 | |
Foreign offices | | | 6 | | | | 3 | | | | 9 | | | | 1 | | | | 2 | | | | 3 | |
Total other funds borrowed | | | 13 | | | | (22 | ) | | | (9 | ) | | | 7 | | | | 35 | | | | 42 | |
Payables to customers and broker-dealers | | | 7 | | | | 3 | | | | 10 | | | | (27 | ) | | | 66 | | | | 39 | |
Long-term debt | | | 218 | | | | 15 | | | | 233 | | | | 40 | | | | 127 | | | | 167 | |
Total interest expense | | | 1,035 | | | | 175 | | | | 1,210 | | | | 236 | | | | 676 | | | | 912 | |
Changes in net interest revenue | | $ | 735 | | | $ | 56 | | | $ | 791 | | | $ | 84 | | | $ | 71 | | | $ | 155 | |
| (a) | Changes which are solely due to balance changes or rate changes are allocated to such categories on the basis of the respective percentage changes in average balances and average rates. Changes in interest revenue or interest expense arising from the combination of rate and volume variances are allocated proportionately to rate and volume based on their relative absolute magnitudes. |
64 The Bank of New York Mellon Corporation
RECENT ACCOUNTING DEVELOPMENTS
SFAS No. 157—Fair Value Measurement
In September 2006, the FASB issued SFAS No. 157 (“SFAS 157”), “Fair Value Measurements.” SFAS 157 defines fair value, establishes a framework for measuring fair value in accordance with generally accepted accounting principles, and requires additional disclosures about fair value measurements. Under this framework, a three-level hierarchy has been established based on the transparency of the inputs to the valuation of an asset or liability. SFAS 157 clarifies that fair value is the amount that would be exchanged to sell an asset or transfer a liability, in an orderly transaction between market participants. SFAS 157 nullifies the consensus reached in EITF Issue No. 02-3 prohibiting the recognition of day one gain or loss on derivative contracts (and hybrid instruments measured at fair value under SFAS 133 as modified by SFAS 155) where we cannot verify all of the significant model inputs to observable market data and verify the model to market transactions. However, SFAS 157 requires that a fair value measurement technique include an adjustment for risks inherent in a particular valuation technique (such as a pricing model) and/or the risks inherent in the inputs to the model if market participants would also include such an adjustment. SFAS 157 will require us to consider the effect of our own credit standing in determining the fair value of our liabilities. In addition, SFAS 157 prohibits the recognition of “block discounts” for large holdings of unrestricted financial instruments where quoted prices are readily and regularly available in an active market. The requirements of SFAS 157 are to be applied prospectively, except for changes in fair value measurements that result from the initial application of SFAS 157 to existing derivative financial instruments measured under EITF Issue No. 02-3, existing hybrid instruments measured at fair value, and block discounts, which are to be recorded as an adjustment to opening retained earnings in the year of adoption.
We adopted SFAS 157 as of Jan. 1, 2008. We believe the adoption of SFAS 157 will not have a material impact on our financial condition or results of operations and we estimate that less than 5% of our assets and liabilities measured at fair value will be in the lowest tier of the fair value hierarchy.
EITF 06-4 and EITF 06-10—Split-Dollar Life Insurance
In September 2006, the FASB ratified Emerging Issues Task Force (EITF) 06-4, “Postretirement
Benefits Associated with Split-Dollar Life Insurance Arrangements,” and EITF 06-10, “Accounting for Collateral Assignment Split-Dollar Life Insurance Arrangements,” respectively. EITF 06-4 and EITF 06-10 address endorsement and collateral assignment split-dollar life insurance arrangements, respectively, that provide a benefit to an employee that extends to postretirement periods. An endorsement split-dollar policy is owned and controlled by the employer. However, a collateral assignment policy is owned and controlled by the employee. Both policy arrangements provide that the employer and an employee split the insurance policy’s cash surrender value and/or death benefits.
The EITFs require that the deferred compensation or postretirement benefit aspects of the split-dollar life insurance arrangements be recognized as a liability by the employer because the obligation is not effectively settled by the purchase of a life insurance policy. The liability for future benefits will be recognized based on the substantive agreement with the employee, which may be either to provide a future death benefit or to pay for the future cost of the life insurance. At adoption, any net liability recognized will be recorded as a direct adjustment to the beginning balance of retained earnings and reported as a change in accounting principle.
Both EITFs were effective Jan. 1, 2008. The adoption of these EITFs require us to record a liability, in accordance with FAS 106, of approximately $28 million with an offsetting debit to retained earnings of approximately $18 million (after-tax).
SFAS No. 159—Fair-Value Option
In February 2007, the FASB issued SFAS No. 159 (“SFAS 159”), “The Fair Value Option for Financial Assets and Financial Liabilities.” SFAS 159 provides companies with an irrevocable option to elect fair value as the measurement basis for selected financial assets, financial liabilities, unrecognized firm commitments and written loan commitments which are not subject to fair value under other accounting standards. There is a one-time election available to apply this standard to existing financial instruments as of Jan. 1, 2008; otherwise, the fair value option will be available for financial instruments on their initial transaction date. The first re-measurement of existing financial instruments for which the option is elected will be recorded as an adjustment to retained earnings. For financial instruments for which the election has
The Bank of New York Mellon Corporation 65
RECENT ACCOUNTING DEVELOPMENTS(continued)
been made, changes in the fair value subsequent to initial adoption are recorded in earnings. SFAS 159 also requires companies to provide additional information that will help investors and other users of financial statements to understand more easily the effect on earnings of the company’s choice to use fair value. In addition, it requires companies to display the fair value of those assets and liabilities for which they have chosen to use fair value on the face of the balance sheet.
We adopted SFAS 159 along with SFAS 157 on Jan. 1, 2008. We elected the fair value option for $390 million of existing loans and unfunded loan commitments where the related credit risks are managed utilizing other financial instruments which are fair valued in earnings. This election better aligns the accounting and reflects our risk management practices. As a result of adopting the fair value option on these loans and commitments, we will record a charge to retained earnings as of Jan. 1, 2008 of approximately $36 million, after-tax.
FSP No. FIN 39-1—Amendment of FASB Interpretation No. 39
In April 2007, the FASB issued FASB Staff Position No. FIN 39-1 (“FSP 39-1”) “Amendment of FASB Interpretation No. 39.” FSP 39-1 permits offsetting of fair value amounts recognized for the right to reclaim cash collateral (a receivable) or obligation to return cash collateral (a payable) against fair value amounts recognized for derivative instruments executed with the same counterparty under the same master netting arrangements, and amends FIN No. 39 to replace the terms “conditional contracts” and “exchange contracts” with the term “derivative instruments”, as defined in FAS 133. We adopted this FSP on Jan. 1, 2008. The impact of adopting FSP 39-1 is immaterial to our balance sheet.
SOP 07-1—Investment Companies
In June 2007, the Accounting Standards Executive Committee of the AICPA issued Statement of Position (“SOP”) 07-1, “Clarification of the Scope of the Audit and Accounting GuideInvestment Companies and Accounting by Parent Companies and Equity Method Investors for Investments in Investment Companies.” SOP 07-1 provides guidance for determining whether an entity is an “investment company,” as defined, and whether the specialized industry accounting principles for investment companies should be retained in the
consolidated financial statements of the parent or of an equity method investor.
This new standard was expected to be effective for fiscal years beginning on or after Dec. 15, 2007. However, in October 2007, the FASB delayed the effective date of SOP 07-1 indefinitely primarily because of concerns over implementation issues arising from the interaction between the SOP and SFAS 157 and SFAS 159 and because of the short implementation period between its issuance and its effective date. For entities that have not yet adopted the provisions of SOP 07-1, early adoption will not be permitted during the indefinite deferral. A new effective date will be determined after the FASB addresses implementation issues and potential amendments.
SFAS No. 160—Noncontrolling Interests
In December 2007, the FASB issued SFAS No. 160 (“SFAS 160”), “Noncontrolling Interests in Consolidated Financial Statements, an amendment of ARB No. 51.” SFAS 160 amends ARB No. 51 to establish accounting and reporting standards for the noncontrolling interest in a subsidiary (i.e. minority interest) and for the deconsolidation of a subsidiary. This statement applies to all entities that prepare consolidated financial statements. This statement requires that noncontrolling interests in a subsidiary is part of the equity of the controlling group and is to be reported on the balance sheet within the equity section separately from BNY Mellon as a distinct item. The equity section of the balance sheet will be required to present equity attributable to both controlling and noncontrolling interests. The carrying amount of the noncontrolling interest is adjusted to reflect the change in ownership interest, and any difference between the amount by which the noncontrolling interests are adjusted and the fair value of the consideration paid or received is recognized directly in equity attributable to the noncontrolling interest (i.e., as additional paid in capital). Any transaction that results in the loss of control of a subsidiary is considered a remeasurement event with any retained interest remeasured at fair value. The gain or loss recognized in income includes both the realized gain or loss related to the portion of the ownership interest sold and the gain or loss on the remeasurement to fair value of the retained interest.
We expect to adopt SFAS 160 on Jan. 1, 2009. This statement is to be applied prospectively as of Jan. 1, 2009, except for the presentation requirements. The
66 The Bank of New York Mellon Corporation
RECENT ACCOUNTING DEVELOPMENTS(continued)
disclosure requirements are to be applied retroactively for all periods presented. We are currently evaluating the impact of SFAS 160.
EITF 07-1—Accounting for Collaborative Arrangements
In December 2007, the FASB ratified EITF No. 07-1, “Accounting for Collaborative Arrangements Relating to the Development and Commercialization of Intellectual Property.” This EITF defines a collaborative arrangement and establishes disclosure requirements such as income statement classifications and amounts attributable to transactions arising from collaborative arrangements, as well as information regarding the nature and purpose of the collaborative arrangement, the collaborators’ rights and obligations under the arrangement, and any accounting policies. EITF 07-1 is effective Jan. 1, 2009. The requirements would be applied as a change in accounting principle through retrospective application to all prior periods presented for collaborative arrangements existing as of Jan. 1, 2009. We are currently evaluating the impact of EITF 07-1.
SFAS No. 141 (revised)—Business Combinations
In December 2007, the FASB issued SFAS No. 141 (revised 2007) (“SFAS 141 (R)”), “Business Combinations.” SFAS 141 (R) requires all acquisitions of businesses to be measured at the fair value of the business acquired rather than the cost-based provision that SFAS No. 141 had carried forward. This statement would require deal costs, such as legal, investment banking, and due diligence cost to be expensed as incurred. Back-end contingent payments would be recorded up front at fair value. Subsequent fair value changes would be recorded as income. The fair value of equity securities of the acquirer issued as consideration would be measured at the acquisition date rather than at the agreement date; accordingly, the purchase price and goodwill would not be known until closing. Restructuring or exit activities will no longer be considered an assumed liability of the acquired entity but will be expensed as incurred. This statement applies to business combination transactions completed subsequent to Dec. 31, 2008. We are currently evaluating the impact of SFAS 141 (R).
Adoption of new accounting standards
For a discussion of the adoption of new accounting standards, see Note 3 of Notes to Consolidated Financial Statements.
The Bank of New York Mellon Corporation 67
FOURTH QUARTER 2007 REVIEW
Net income for the fourth quarter of 2007 was $520 million, or $.45 per share, compared with $1.625 billion, or $2.27 per share, in the fourth quarter of 2006. The fourth quarter of 2007 included an extraordinary (loss) of $180 million, net of tax, associated with management’s decision to restructure and consolidate the assets of the bank-sponsored conduit, TRFC. (See discussion on pages 16 and 17). Net income for the fourth quarter of 2006 included a net after-tax gain of $1.217 billion from the sale of our Retail Business. Income from continuing operations, before extraordinary loss was $700 million and diluted earnings per share was $.61 in the fourth quarter of 2007 compared with $427 million and $.60 per share in the fourth quarter of 2006. Continuing operations returned 9.5% on equity in the fourth quarter of 2007 compared with 15.0% in the fourth quarter of 2006.
Income from continuing operations for the fourth quarter of 2007 included merger and integration expense of $69 million after-tax or approximately $.06 per share. Results in the fourth quarter of 2007 also included a pre-tax loss of $200 million ($118 million after-tax or $.10 per share) for other than temporary impairment related to collateralized debt obligations, in our securities portfolio, that contained subprime exposure.
During the quarter, we completed the acquisition of the remaining 50% interest in the ABN AMRO Mellon Global Securities Services B.V. joint venture.
Fee and other revenue comprised 80% of total revenue, on an FTE basis, in the fourth quarter of 2007, compared with 76% in the fourth quarter of 2006. Fee and other revenue increased to $3.044 billion in the fourth quarter of 2007, an increase of 111% from $1.441 billion in the fourth quarter of 2006, primarily due to increases in asset and wealth management fees, securities servicing fees, and foreign exchange and other trading activities. The increase in asset and wealth management fees reflected the merger with Mellon as well as new business and higher equity market levels. The increase in securities servicing fees reflects: the merger with Mellon, as well as higher asset servicing fees due to increased client activity related to market volatility and net new business; higher issuer services fees reflecting a strong quarter in Depositary Receipts; and higher clearing and execution services fees due to increased activity resulting from market volatility along with continued growth in money market and
mutual fund positions. Foreign exchange and other trading activities increased mainly due to the merger with Mellon, higher client volumes, a significant increase in currency volatility, as well as a higher valuation of the credit derivatives portfolio.
Net interest revenue on an FTE basis was $757 million, an increase of $305 million compared to $452 million in the fourth quarter of 2006. The increase reflects the merger with Mellon as well as a strong flow of client deposits together with the benefit from Federal Reserve interest rate reductions.
Total noninterest expense was $2.749 billion in the fourth quarter of 2007, an increase of $1.464 billion compared with $1.285 billion in the fourth quarter of 2006. Excluding merger and integration expenses and the amortization of intangible assets, operating expense increased $1.260 billion compared with the fourth quarter of 2006. This increase reflects the merger with Mellon as well as increased professional, legal and other purchased services, net occupancy, furniture and equipment, business development and other expense primarily due to business growth, strategic initiatives and the impact of acquisitions. Operating expense also reflects the benefit of $96 million in merger-related expense synergies in the fourth quarter of 2007.
The effective tax rate was 31.8% in the fourth quarter of 2007, compared with 31.2% in the fourth quarter of 2006. Excluding merger and integration expense, the tax rate was 33.2% in the fourth quarter of 2007 compared with 31.3% in the fourth quarter of 2006.
68 The Bank of New York Mellon Corporation
SELECTED QUARTERLY DATA (unaudited)(a)
| | | | | | | | | | | | | | | | | | | | | | | | | | | | | | | | |
| | | | | | | | | Legacy The Bank of New York only | |
| | | Quarter ended(a) | |
| | | 2007 | | | 2006 | |
| (dollar amounts in millions, except per share amounts) | | Dec. 31 | | | Sept. 30 | | | June 30 | | | March 31 | | | Dec. 31 | | | Sept. 30 | | | June 30 | | | March 31 | |
Consolidated income statement | | | | | | | | | | | | | | | | | | | | | | | | | | | | | | | | |
Total fee and other revenue | | $ | 3,044 | | | $ | 2,931 | | | $ | 1,580 | | | $ | 1,475 | | | $ | 1,441 | | | $ | 1,263 | | | $ | 1,370 | | | $ | 1,265 | |
Net interest revenue | | | 752 | | | | 669 | | | | 452 | | | | 427 | | | | 451 | | | | 351 | | | | 358 | | | | 339 | |
Total revenue | | | 3,796 | | | | 3,600 | | | | 2,032 | | | | 1,902 | | | | 1,892 | | | | 1,614 | | | | 1,728 | | | | 1,604 | |
Provision for credit losses | | | 20 | | | | - | | | | (15 | ) | | | (15 | ) | | | (15 | ) | | | (4 | ) | | | (1 | ) | | | - | |
Noninterest expense | | | 2,749 | | | | 2,706 | | | | 1,389 | | | | 1,272 | | | | 1,285 | | | | 1,196 | | | | 1,138 | | | | 1,069 | |
Income from continuing operations before income taxes and extraordinary (loss) | | | 1,027 | | | | 894 | | | | 658 | | | | 645 | | | | 622 | | | | 422 | | | | 591 | | | | 535 | |
Provision for income taxes | | | 327 | | | | 252 | | | | 210 | | | | 208 | | | | 195 | | | | 124 | | | | 200 | | | | 175 | |
Income from continuing operations | | | 700 | | | | 642 | | | | 448 | | | | 437 | | | | 427 | | | | 298 | | | | 391 | | | | 360 | |
Income (loss) from discontinued operations, net of tax | | | - | | | | (2 | ) | | | (3 | ) | | | (3 | ) | | | 1,198 | | | | 54 | | | | 57 | | | | 62 | |
Income before extraordinary (loss) | | | 700 | | | | 640 | | | | 445 | | | | 434 | | | | 1,625 | | | | 352 | | | | 448 | | | | 422 | |
Extraordinary (loss) on consolidation of commercial paper conduit, net of tax | | | (180 | ) | | | - | | | | - | | | | - | | | | - | | | | - | | | | - | | | | - | |
Net income | | $ | 520 | | | $ | 640 | | | $ | 445 | | | $ | 434 | | | $ | 1,625 | | | $ | 352 | | | $ | 448 | | | $ | 422 | |
Basic earnings per share(b) | | | | | | | | | | | | | | | | | | | | | | | | | | | | | | | | |
Continuing operations | | $ | .62 | | | $ | .57 | | | $ | .63 | | | $ | .61 | | | $ | .61 | | | $ | .42 | | | $ | .55 | | | $ | .50 | |
Discontinued operations | | | - | | | | - | | | | - | | | | - | | | | 1.70 | | | | .07 | | | | .08 | | | | .09 | |
Income before extraordinary (loss) | | | .62 | | | | .57 | | | | .62 | (c) | | | .61 | | | | 2.30 | (c) | | | .49 | | | | .63 | | | | .59 | |
Extraordinary (loss) | | | (.16 | ) | | | - | | | | - | | | | - | | | | - | | | | - | | | | - | | | | - | |
Net income | | $ | .46 | | | $ | .57 | | | $ | .62 | | | $ | .61 | | | $ | 2.30 | | | $ | .49 | | | $ | .63 | | | $ | .59 | |
Diluted earnings per share(b) | | | | | | | | | | | | | | | | | | | | | | | | | | | | | | | | |
Continuing operations | | $ | .61 | | | $ | .56 | | | $ | .62 | | | $ | .61 | | | $ | .60 | | | $ | .41 | | | $ | .54 | | | $ | .49 | |
Discontinued operations | | | - | | | | - | | | | - | | | | - | | | | 1.68 | | | | .07 | | | | .08 | | | | .09 | |
Income before extraordinary (loss) | | | .61 | | | | .56 | | | | .62 | | | | .60 | (c) | | | 2.27 | (c) | | | .49 | (c) | | | .62 | | | | .58 | |
Extraordinary (loss) | | | (.16 | ) | | | - | | | | - | | | | - | | | | - | | | | - | | | | - | | | | - | |
Net income | | $ | .45 | | | $ | .56 | | | $ | .62 | | | $ | .60 | | | $ | 2.27 | | | $ | .49 | | | $ | .62 | | | $ | .58 | |
Average balances(d) | | | | | | | | | | | | | | | | | | | | | | | | | | | | | | | | |
Interest-bearing deposits with banks | | $ | 37,107 | | | $ | 34,461 | | | $ | 20,558 | | | $ | 13,546 | | | $ | 15,157 | | | $ | 16,033 | | | $ | 12,432 | | | $ | 9,624 | |
Securities | | | 49,310 | | | | 48,039 | | | | 26,836 | | | | 25,141 | | | | 23,384 | | | | 24,596 | | | | 27,651 | | | | 27,929 | |
Loans | | | 47,109 | | | | 45,517 | | | | 37,317 | | | | 35,953 | | | | 35,335 | | | | 33,552 | | | | 33,732 | | | | 31,791 | |
Total interest-earning assets | | | 140,622 | | | | 133,521 | | | | 90,557 | | | | 79,075 | | | | 79,841 | | | | 76,088 | | | | 75,380 | | | | 71,035 | |
Total assets | | | 192,987 | | | | 183,828 | | | | 114,323 | | | | 102,041 | | | | 102,138 | | | | 108,864 | | | | 110,388 | | | | 106,133 | |
Deposits | | | 114,727 | | | | 107,336 | | | | 68,944 | | | | 58,765 | | | | 59,065 | | | | 54,592 | | | | 53,884 | | | | 51,382 | |
Long-term debt | | | 15,510 | | | | 14,767 | | | | 10,042 | | | | 8,888 | | | | 8,677 | | | | 8,339 | | | | 8,146 | | | | 8,011 | |
Total shareholders’ equity | | | 29,136 | | | | 28,669 | | | | 11,566 | | | | 11,277 | | | | 11,338 | | | | 10,262 | | | | 9,882 | | | | 9,888 | |
Net interest margin (FTE)(d) | | | 2.16 | % | | | 2.02 | % | | | 2.01 | % | | | 2.18 | % | | | 2.27 | % | | | 1.89 | % | | | 1.95 | % | | | 1.95 | % |
Annualized return on equity(e) | | | 9.53 | % | | | 8.89 | % | | | 15.54 | % | | | 15.70 | % | | | 14.95 | % | | | 11.61 | % | | | 15.85 | % | | | 14.75 | % |
Pre-tax operating margin (FTE)( e) | | | 27 | % | | | 25 | % | | | 32 | % | | | 34 | % | | | 33 | % | | | 26 | % | | | 34 | % | | | 33 | % |
Common stock data(b)(f) | | | | | | | | | | | | | | | | | | | | | | | | | | | | | | | | |
Market price per share range: | | | | | | | | | | | | | | | | | | | | | | | | | | | | | | | | |
High | | $ | 50.26 | | | $ | 46.93 | | | $ | 44.67 | | | $ | 45.91 | | | $ | 42.33 | | | $ | 37.81 | | | $ | 39.04 | | | $ | 38.20 | |
Low | | | 42.93 | | | | 38.30 | | | | 40.78 | | | | 40.40 | | | | 35.59 | | | | 33.35 | | | | 33.03 | | | | 33.18 | |
Average | | | 46.88 | | | | 42.91 | | | | 43.21 | | | | 43.01 | | | | 38.53 | | | | 35.82 | | | | 35.76 | | | | 35.59 | |
Period end close | | | 48.76 | | | | 44.14 | | | | 43.93 | | | | 42.98 | | | | 41.73 | | | | 37.38 | | | | 34.13 | | | | 38.20 | |
Dividends per share | | | .24 | | | | .24 | | | | .23 | | | | .23 | | | | .23 | | | | .23 | | | | .22 | | | | .22 | |
Market capitalization(g) | | $ | 55,878 | | | $ | 50,266 | | | $ | 31,495 | | | $ | 30,750 | | | $ | 29,761 | | | $ | 26,938 | | | $ | 24,562 | | | $ | 27,807 | |
| (a) | Third quarter and fourth quarter of 2007 reflect the results of the combined company while the results for the first and second quarters of 2007 and all periods in 2006 reflect legacy The Bank of New York only. Results for fourth quarter of 2006 have been revised, see Note 2. |
| (b) | All share-related data is presented in post-merger share count terms. |
| (c) | Amount does not foot due to rounding. |
| (d) | Prior periods calculated on a continuing operations basis even though the balance sheet, in accordance with GAAP, is not restated for discontinued operations. |
| (e) | Continuing operations basis. |
| (f) | At Dec. 31, 2007, there were 28,904 shareholders registered with our stock transfer agent, compared with 24,546 at Jan. 31, 2007 and 25,186 at Jan. 31, 2006. In addition, there were approximately 40,786 BNY Mellon employees at Dec. 31, 2007, who participated in BNY Mellon 401(k) Retirement Savings Plans. All shares of BNY Mellon common stock held by the Plans for its participants are registered in the names of The Bank of New York and Mellon Bank, N.A., as trustee. |
The Bank of New York Mellon Corporation 69
SELECTED QUARTERLY DATA (unaudited)(a)(continued)
Fourth quarter 2007 compared with the fourth quarter of 2006(a)
See discussion on page 68 of this report.
Third quarter of 2007 compared with the third quarter of 2006(a)
On July 1, 2007, we completed our merger with Mellon Financial Corporation. Both companies merged into a new holding company named The Bank of New York Mellon Corporation. As a result, the financial results for the third quarter of 2007 include three months of the combined company’s results, while the results of the third quarter 2006 represent legacy The Bank of New York only. Consolidated net income was $640 million, and diluted earnings per share was $.56 in the third quarter of 2007, compared with net income of $352 million, or $.49 per share in the third quarter of 2006. Third quarter 2007 income from continuing operations was $642 million, and diluted earnings per share was $.56, compared with income from continuing operations of $298 million, or $.41 per share in the third quarter of 2006. The third quarter of 2007 included merger and integration expenses of $218 million (pre-tax), or approximately $.11 per share. Excluding this amount, diluted earnings per share from continuing operations in the third quarter of 2007 was $.67 per share. The third quarter of 2006 included merger and integration expenses of $89 million (pre-tax), or approximately $.09 per share. Excluding this amount, diluted earnings per share from continuing operations in the third quarter of 2006 was $.50 per share. Fee and other revenue was $2.931 billion in the third quarter of 2007 compared with $1.263 billion in the third quarter of 2006. The increase in fee and other revenue was primarily due to the merger with Mellon, the Acquired Corporate Trust Business, net new business and higher equity market levels. Return on common equity on a continuing operations basis was 8.89% in the third quarter of 2007, compared with 11.61% in the third quarter of 2006.
Second quarter of 2007 compared with the second quarter of 2006(a)
We reported second quarter 2007 net income of $445 million and diluted earnings per share of $.62, and
income from continuing operations of $448 million and diluted earnings per share of $.62. This compares to net income of $448 million, or $.62 of diluted earnings per share, and income from continuing operations of $391 million, or $.54 of diluted earnings per share, in the second quarter of 2006. The second quarter of 2007 included merger and integration expenses of $47 million (pre-tax) that amounted to approximately $.04 per share. Excluding this amount, diluted earnings per share from continuing operations in the second quarter of 2007 was $.66 per share.
Performance highlights for the quarter include asset servicing growth of 17% over the second quarter of 2006, a record quarterly level reflecting increased transaction volumes and organic growth across all business products; asset and wealth management fees were up 25% over the second quarter of 2006 reflecting organic growth; and, good expense discipline drove positive operating leverage (excluding merger and integration expense).
First quarter of 2007 compared with the first quarter of 2006 (a)
We reported first quarter net income of $434 million and diluted earnings per share of $.60. Excluding merger and integration costs, first quarter net income was $444 million and diluted earnings per share was $.62. This compares to net income of $422 million, or $.58 of diluted earnings per share, and income from continuing operations of $360 million, or $.49 of diluted earnings per share in the first quarter of 2006.
Performance highlights for the quarter include asset servicing revenue growth of 17% over the first quarter of 2006, driven by custody, fund services, and broker-dealer services; asset and wealth management fees were up 20% over the first quarter of 2006, reflecting organic growth; and good expense discipline drove positive operating leverage.
| (a) | Quarterly data for the first and second quarters of 2007 and all periods of 2006 represent legacy The Bank of New York only. All earnings per share data is presented in post-merger share count terms. |
70 The Bank of New York Mellon Corporation
NEW YORK STOCK EXCHANGE ANNUAL CERTIFICATION
Because our common stock is listed on the NYSE, our Chief Executive Officer is required to make an annual certification to the NYSE stating that he was not aware of any violation by BNY Mellon of the Corporate Governance Listing Standards of the NYSE. The Chief Executive Officer of The Bank of New York and Mellon each submitted this annual certification to the NYSE for 2007, and our Chief Executive Officer will do so after our 2008 Annual
Meeting of Shareholders, in accordance with NYSE rules. We filed an Interim Written Affirmation for BNY Mellon with the NYSE on July 12, 2007.
We have filed with the SEC the certification required to be made by our Chief Executive Officer and Chief Financial Officer under Section 302 of the Sarbanes Oxley Act of 2002, as exhibits to the Annual Report on Form 10-K for the year ended Dec. 31, 2007.
The Bank of New York Mellon Corporation 71
FORWARD-LOOKING STATEMENTS AND RISK FACTORS
Some statements in this document are forward-looking. These include all statements about the future results of BNY Mellon, projected business growth, statements with respect to the merger of The Bank of New York and Mellon with and into BNY Mellon, expectations with respect to operations after the merger, the expected outcome of legal, regulatory and investigatory proceedings, predicted loan losses, and BNY Mellon’s plans, objectives and strategies. In addition, these forward-looking statements relate to: expected annual expense synergies; total merger and integration costs; the expected increase in the percentage of revenue and income from outside the U.S.; the expected increase in the level of fee revenue per employee; targeted capital ratios; reasons why our businesses are compatible with our strategies and goals; our projected effective tax rate for 2008; the anticipated effects of the consolidation of TRFC, including improved profitability, improved adjusted tangible common equity ratio, the accretive effect of the TRFC consolidation, the timing of the integration of TRFC’s assets into our investment portfolio and the timing of elimination of TRFC’s commercial paper; the impact of any capital support agreements, factors that could affect projected fee revenue, including allowance for credit reserves and valuation models; assumptions with respect to pension plans, including expected future contributions and benefit payments; reduction in principal of the CDO portfolio; expectations with respect to receipt of an in-kind vertical slice of underlying assets from a SIV if there is a liquidation; adequacy of reserves, including reserves for SIV exposure; the effect of a significant reduction in securities servicing business on deposits; expectations with respect to capital, including anticipated repayment and call of outstanding debt and issuance of replacement securities; expectations with respect to securities lending guarantees expiring without the need to advance cash; matters relating to Old Slip Funding LLC, including the impact of any consolidation if it were to occur; expectations with respect to the well-capitalized status of BNY Mellon and its bank subsidiaries; the effects of the implementation of Basel II; compliance with the requirements of the Sound Practices Paper; effect of geopolitical factors and other external factors; timing and impact of adoption of recent accounting pronouncements; impact of the acquisition of the remaining 50% interest in the ABN AMRO Mellon joint venture; ability to realize benefit of deferred tax assets including carryovers; likelihood that results of open tax years will affect Tax Reserves; amount of dividends bank subsidiaries can pay without regulatory waiver; resolution of matters relating to LILO transactions and impact of those resolutions; potential impact of review of corporate trust business; impact of
judgments and settlements, if any, arising from pending or potential legal or regulatory proceedings, including the claims raised by The Federal Customs Service of The Russian Federation and matters relating to the information returns, and withholding tax returns for the Acquired Corporate Trust Business.
In this report, any other report, any press release or any written or oral statement that the Company or its executives may make, words such as “estimate,” “forecast,” “project,” “anticipate,” “confident,” “target,” “expect,” “intend,” “seek,” “believe,” “plan,” “goal,” “could,” “should,” “may,” “will,” “strategy,” “synergies,” “opportunities,” “trends” and words of similar meaning, signify forward-looking statements.
Factors that could cause BNY Mellon’s results to differ materially from those described in the forward-looking statements, as well as other uncertainties affecting future results and the value of BNY Mellon’s stock and factors which represent risks associated with the business and operations of BNY Mellon, can be found in the “Risk Factors” section of BNY Mellon’s annual report on Form 10-K for the year ended Dec. 31, 2007, and any subsequent reports filed with the Securities and Exchange Commission (the “Commission”) by BNY Mellon pursuant to the Securities Exchange Act of 1934, as amended (the “Exchange Act”).
Forward-looking statements, including discussions and projections of future results of operations and discussions of future plans contained in the MD&A, are based on management’s current expectations and assumptions that involve risks and uncertainties and that are subject to change based on various important factors (some of which are beyond BNY Mellon’s control), including adverse changes in market conditions and the timing of such changes, and the actions that management could take in response to these changes. Actual results may differ materially from those expressed or implied as a result of these risks and uncertainties and the risks and uncertainties described in the documents referred to in the preceding paragraph. The “Risk Factors” discussed in the Form 10-K could cause or contribute to such differences. Investors should consider all risks mentioned elsewhere in this document and in subsequent reports filed by BNY Mellon with the Commission pursuant to the Exchange Act, as well as other uncertainties affecting future results and the value of BNY Mellon’s stock.
All forward-looking statements speak only as of the date on which such statements are made, and BNY Mellon undertakes no obligation to update any statement to reflect events or circumstances after the date on which such forward-looking statement is made or to reflect the occurrence of unanticipated events.
72 The Bank of New York Mellon Corporation
GLOSSARY
Accumulated Benefit Obligation (“ABO”)—The actuarial present value of benefits (vested and non-vested) attributed to employee services rendered.
Adjusted tangible shareholders’ equity to assets—Shareholders’ equity less goodwill and intangible assets divided by total assets less goodwill and intangible assets. Adjusted for deferred tax liabilities associated with non-tax deductible identifiable intangible assets.
Alternative investments—Usually refers to investments in hedge funds, leveraged loans, subordinated and distressed debt, real estate and foreign currency overlay. Many hedge funds pursue strategies that are uncommon relative to mutual funds. Examples of alternative investment strategies are: long-short equity, event driven, statistical arbitrage, fixed income arbitrage, convertible arbitrage, short bias, global macro, and equity market neutral.
Assets under custody and administration—Assets held in a fiduciary capacity for which various services are provided such as; custody, accounting, administration valuations and performance measurement. These assets are not on our balance sheet.
Assets under management—Assets held in a fiduciary capacity that are either actively or passively managed. These assets are not on our balance sheet.
Collateral management—A comprehensive program designed to simplify collateralization and expedite securities transfers for buyers and sellers. The Corporation acting as an independent collateral manager is positioned between the buyer and seller to provide a convenient, flexible, and efficient service to ensure proper collateralization throughout the term of the transaction. The service includes verification of securities eligibility and maintenance of margin requirements.
Collateralized Debt Obligations (CDOs)—A type of asset-backed security and structured credit product that gain exposure to the credit of a portfolio of fixed-income assets and divide the credit risk among different tranches.
Credit derivatives—Contractual agreements that provide insurance against a credit event of one or more referenced credits. The nature of the credit event is established by the buyer and seller at the inception of the transaction, such events include bankruptcy, insolvency and failure to meet payment obligations
when due. The buyer of the credit derivative pays a periodic fee in return for a contingent payment by the seller (insurer) following a credit event.
Credit risk—The risk of loss due to borrower or counterparty default.
Cross-currency swaps—Contracts that generally involve the exchange of both interest and principal amounts in two different currencies. Also see interest rate swaps in this glossary.
Depositary Receipts (“DR”)—A negotiable security that generally represents a non-U.S. company’s publicly traded equity. Although typically denominated in U.S. dollars, depositary receipts can also be denominated in Euros. Depositary receipts are eligible to trade on all U.S. stock exchanges and many European stock exchanges. American depositary receipts (“ADR”) trade only in the U.S.
Derivative—A contract or agreement whose value is derived from changes in interest rates, foreign exchange rates, prices of securities or commodities, credit worthiness for credit default swaps or financial or commodity indices.
Discontinued operations—The operating results of a component of an entity, as defined by SFAS No. 144, that are removed from continuing operations when that component has been disposed of or it is management’s intention to sell the component.
Double leverage—The situation that exists when a holding company’s equity investments in wholly-owned subsidiaries (including goodwill and intangibles) exceed its equity capital. Double leverage is created when a bank holding company issues debt and downstreams the proceeds to a subsidiary as an equity investment.
Economic Value of Equity (“EVE”)—An aggregation of discounted future cash flows of assets and liabilities over a long-term horizon.
Exchange Traded Fund (“ETF”)—Each share of an ETF tracks a basket of stocks in some index or benchmark, providing investors with a vehicle that closely parallels the performance of these benchmarks while allowing for intraday trading.
FASB—Financial Accounting Standards Board.
Foreign currency options—Similar to interest rate options except they are based on foreign exchange rates. Also see interest rate options in this glossary.
The Bank of New York Mellon Corporation 73
GLOSSARY(continued)
Foreign currency swaps—An agreement to exchange stipulated amounts of one currency for another currency at one or more future dates.
Foreign exchange contracts—Contracts that provide for the future receipt or delivery of foreign currency at previously agreed-upon terms.
Forward rate agreements—Contracts to exchange payments on a specified future date, based on a market change in interest rates from trade date to contract settlement date.
Fully Taxable Equivalent (“FTE”)—Basis for comparison of yields on assets having ordinary taxability with assets for which special tax exemptions apply. The FTE adjustment reflects an increase in the interest yield or return on a tax-exempt asset to a level that would be comparable had the asset been fully taxable.
Generally Accepted Accounting Principles (“GAAP”)—Accounting rules and conventions defining acceptable practices in preparing financial statements in the U.S. The FASB is the primary source of accounting rules.
Granularity—Refers to the amount of concentration in the credit portfolio due to large individual exposures. One measure of granularity is the amount of economic capital attributable to an exposure. As the average economic capital per exposure declines, the portfolio is considered to be more granular.
Hedge fund—A fund, usually used by wealthy individuals and institutions, which is allowed to use aggressive strategies that are unavailable to mutual funds, including selling short, leverage, program trading, swaps, arbitrage, and derivatives. Hedge funds are exempt from many of the rules and regulations governing mutual funds, which allow them to accomplish aggressive investing goals. Legal requirements in many countries allow only certain sophisticated investors to participate in hedge funds.
Interest rate options, including caps and floors—Contracts to modify interest rate risk in exchange for the payment of a premium when the contract is initiated. As a writer of interest rate options, we receive a premium in exchange for bearing the risk of unfavorable changes in interest rates. Conversely, as a purchaser of an option, we pay a premium for the right, but not the obligation, to buy or sell a financial instrument or currency at predetermined terms in the future.
Interest rate sensitivity—The exposure of net interest income to interest rate movements.
Interest rate swaps—Contracts in which a series of interest rate flows in a single currency is exchanged over a prescribed period. Interest rate swaps are the most common type of derivative contract that we use in our asset/liability management activities. An example of a situation in which we would utilize an interest rate swap would be to convert our fixed-rate debt to a variable rate. By entering into the swap, the principal amount of the debt would remain unchanged, but the interest streams would change.
Investment grade loans and commitments—Those where the customer has a Moody’s long-term rating of Baa3 or better; and/or a Standard & Poor’s long-term rating of BBB- or better; or if unrated, an equivalent rating using our internal risk ratings
Invoiced services—Services provided by global payment services for which the customer can choose to pay directly or by leaving a compensating balance.
Joint venture—A company or entity owned and operated by a group of companies for a specific business purpose, no one of which has a majority interest.
Lease-In-Lease-Out (“LILO”) transaction—A transaction in which a person or entity leases property from the owner for a specified time period and then leases the property back to that owner for a shorter time period. The obligations of the property owner as sublessee are usually secured by deposits, letters of credit, or marketable securities.
Leverage ratio—Tier I Capital divided by leverage assets. Leverage assets are defined as quarterly average total assets, net of goodwill, intangibles and certain other items as required by the Federal Reserve.
Liquidity risk—The risk of being unable to fund our portfolio of assets at appropriate maturities and rates, and the risk of being unable to liquidate a position in a timely manner at a reasonable price.
Loans for purchasing or carrying securities—Loans primarily to brokers and dealers in securities.
Margin loans—A loan that is used to purchase shares of stock. The shares purchased are used as collateral for the loan.
74 The Bank of New York Mellon Corporation
GLOSSARY(continued)
Mark-to-market exposure—A measure, at a point in time, of the value of a derivative or foreign exchange contract in the open market. When the mark-to-market is positive, it indicates the counterparty owes us and, therefore, creates a repayment risk for us. When the mark-to-market is negative, we owe the counterparty. In this situation, we do not have repayment risk.
Market risk—The potential loss in value of portfolios and financial instruments caused by movements in market variables, such as interest and foreign-exchange rates, credit spreads, and equity and commodity prices.
Master netting agreement—An agreement between two counterparties that have multiple contracts with each other that provides for the net settlement of all contracts through a single payment in the event of default or termination of any one contract.
N/A—Not applicable.
N/M—Not meaningful.
Net interest margin—The result of dividing net interest revenue by average interest-earning assets.
Operating leverage—The rate of increase in revenue to the rate of increase in expenses.
Operational risk—The risk of loss resulting from inadequate or failed processes or systems, human factors, or external events.
Performance fees—Fees paid to an investment advisor based upon the fund’s performance for the period relative to various predetermined benchmarks.
Pre-tax operating margin (FTE)—Income before tax on an FTE basis for a period divided by total revenue on an FTE basis for that period.
Projected Benefit Obligation (“PBO”)—The actuarial present value of all benefits accrued on employee service rendered prior to the calculation date, including allowance for future salary increases if the pension benefit is based on future compensation levels.
Return on assets—Annualized income divided by average assets.
Return on tangible common equity—Annualized income, excluding amortization expense of intangible assets, divided by average tangible shareholders’ equity.
Return on equity—Annualized income divided by average shareholders’ equity.
Securities lending short-term investment fund—For some of our securities lending clients, we invest the cash collateral received in the customer’s securities lending transactions in a short-term highly liquid commingled investment fund. The fund is rated AAA by Standard & Poor’s and started operation in 2003.
Securities lending transaction—A fully collateralized transaction in which the owner of a security agrees to lend the security through an agent (BNY Mellon) to a borrower, usually a broker/dealer or bank, on an open, oversight or term basis, under the terms of a prearranged contract, which generally matures in less than 90 days.
Statement of Financial Accounting Standards (“SFAS”)—Statement published by the Financial Accounting Standards Board.
Structured Investment Vehicle (“SIV”)—A fund which borrows money by issuing short-term securities at low interest and then lends money by buying long-term securities at higher interest, making a profit for investors from the difference.
Sub-custodian—A local provider (e.g., a bank) contracted by us to provide specific custodial related services in a selected country or geographic area. Services generally include holding foreign securities in safekeeping, facilitating settlements and reporting holdings to the custodian.
Tangible common equity ratio (“TCE”)—The percentage computed by dividing common shareholders’ equity less intangibles and goodwill by period-end total assets less intangibles and goodwill.
Tangible shareholders’ equity—Shareholders’ equity less goodwill and intangibles.
Tier I and total capital—Includes common shareholders’ equity (excluding certain components of comprehensive income), qualifying trust-preferred securities and minority interest in equity accounts of consolidated subsidiaries, less goodwill and certain intangible assets, and a deduction for certain non-financial equity investments. Total capital includes Tier I capital, as well as qualifying subordinated debt and the reserve for credit losses.
The Bank of New York Mellon Corporation 75
GLOSSARY(continued)
Unfunded commitments—Legally binding agreements to provide a defined level of financing until a specified future date.
Unit Investment Trust (“UIT”)—A sponsor-created portfolio of securities. Like mutual funds, these securities portfolios are designed to meet specific investment objectives. However, unlike a mutual fund, a UIT is an unmanaged portfolio consisting of securities that are fixed at the UIT’s initiation and generally remain unchanged over the security’s life.
Value at Risk (“VAR”)—A measure of the dollar amount of potential loss at a specified confidence level from adverse market movements in an ordinary market environment.
Variable Interest Entity (“VIE”)—An entity that: (1) lacks enough equity investment at risk to permit the entity to finance its activities without additional financial support from other parties; (2) has equity owners that lack the right to make significant decisions affecting the entity’s operations; and/or (3) has equity owners that do not have an obligation to absorb or the right to receive the entity’s losses or returns.
76 The Bank of New York Mellon Corporation
REPORT OF MANAGEMENT ON INTERNAL CONTROL OVER FINANCIAL REPORTING
Management of the Corporation is responsible for establishing and maintaining adequate internal control over financial reporting for the Corporation, as such term is defined in Rule 13a-15(f) under the Securities Exchange Act of 1934, as amended.
The Corporation’s management, including its principal executive officer and principal financial officer, has assessed the effectiveness of the Corporation’s internal control over financial reporting as of December 31, 2007. In making this assessment, management used the criteria set forth by the Committee of Sponsoring Organizations of
the Treadway Commission in Internal Control—Integrated Framework. Based upon such assessment, management believes that, as of December 31, 2007, the Corporation’s internal control over financial reporting is effective based upon those criteria.
KPMG LLP, the independent registered public accounting firm that audited the 2007 financial statements included in this Annual Report under “Financial Statements and Notes,” has issued a report with respect to the effectiveness of the Corporation’s internal control over financial reporting. This report appears on page 78.
The Bank of New York Mellon Corporation 77
REPORT OF INDEPENDENT REGISTERED PUBLIC ACCOUNTING FIRM
The Board of Directors and Shareholders of
The Bank of New York Mellon Corporation:
We have audited The Bank of New York Mellon Corporation’s (“the Corporation”) internal control over financial reporting as of December 31, 2007, based on criteria established in Internal Control—Integrated Framework issued by the Committee of Sponsoring Organizations of the Treadway Commission (COSO). The Corporation’s management is responsible for maintaining effective internal control over financial reporting and for its assessment of the effectiveness of internal control over financial reporting, included in the accompanying Report of Management on Internal Control over Financial Reporting. Our responsibility is to express an opinion on the Corporation’s internal control over financial reporting based on our audit.
We conducted our audit in accordance with the standards of the Public Company Accounting Oversight Board (United States). Those standards require that we plan and perform the audit to obtain reasonable assurance about whether effective internal control over financial reporting was maintained in all material respects. Our audit included obtaining an understanding of internal control over financial reporting, assessing the risk that a material weakness exists, and testing and evaluating the design and operating effectiveness of internal control based on the assessed risk. Our audit also included performing such other procedures as we considered necessary in the circumstances. We believe that our audit provides a reasonable basis for our opinion.
A company’s internal control over financial reporting is a process designed to provide reasonable assurance regarding the reliability of financial reporting and the preparation of financial statements for external purposes in accordance with generally accepted accounting principles. A company’s internal control over financial reporting includes those policies and procedures that (1) pertain to the maintenance of records that, in reasonable detail, accurately and fairly reflect the transactions and dispositions of the assets of the company; (2) provide reasonable assurance that transactions are recorded as necessary to permit preparation of financial statements in accordance with generally accepted accounting principles, and that receipts and expenditures of the company are being made only in accordance with authorizations of management and directors of the company; and (3) provide reasonable assurance regarding prevention or timely detection of unauthorized acquisition, use, or disposition of the company’s assets that could have a material effect on the financial statements.
Because of its inherent limitations, internal control over financial reporting may not prevent or detect misstatements. Also, projections of any evaluation of effectiveness to future periods are subject to the risk that controls may become inadequate because of changes in conditions, or that the degree of compliance with the policies or procedures may deteriorate.
In our opinion, the Corporation maintained, in all material respects, effective internal control over financial reporting as of December 31, 2007, based on criteria established in Internal Control—Integrated Framework issued by the Committee of Sponsoring Organizations of the Treadway Commission.
We also have audited, in accordance with the standards of the Public Company Accounting Oversight Board (United States), the consolidated balance sheet of the Corporation as of December 31, 2007, and the related consolidated statements of income, changes in shareholders’ equity, and cash flows for the year then ended, and our report dated February 27, 2008 expressed an unqualified opinion on those consolidated financial statements.

New York, New York
February 27, 2008
78 The Bank of New York Mellon Corporation
CONSOLIDATED INCOME STATEMENT
The Bank of New York Mellon Corporation (and its subsidiaries)
| | | | | | | | | | | | |
| | | Year ended Dec. 31,(a) | |
| (in millions, except per share amounts or unless otherwise noted) | | 2007 | | | 2006 | | | 2005 | |
Fee and other revenue | | | | | | | | | | | | |
Securities servicing fees: | | | | | | | | | | | | |
Asset servicing | | $ | 2,350 | | | $ | 1,401 | | | $ | 1,267 | |
Issuer services | | | 1,560 | | | | 895 | | | | 639 | |
Clearing and execution services | | | 1,192 | | | | 1,248 | | | | 1,242 | |
Total securities servicing fees | | | 5,102 | | | | 3,544 | | | | 3,148 | |
Asset and wealth management fees | | | 2,060 | | | | 545 | | | | 455 | |
Performance fees | | | 93 | | | | 35 | | | | 9 | |
Foreign exchange and other trading activities | | | 786 | | | | 415 | | | | 379 | |
Treasury services | | | 348 | | | | 209 | | | | 206 | |
Financing-related fees | | | 216 | | | | 250 | | | | 282 | |
Distribution and servicing | | | 212 | | | | 6 | | | | 5 | |
Investment income | | | 149 | | | | 160 | | | | 90 | |
Securities gains (losses) | | | (201 | ) | | | 2 | | | | 22 | |
Other | | | 266 | | | | 173 | | | | 119 | |
Total fee and other revenue | | | 9,031 | | | | 5,339 | | | | 4,715 | |
Net interest revenue | | | | | | | | | | | | |
Interest revenue | | | 5,751 | | | | 3,740 | | | | 2,669 | |
Interest expense | | | 3,451 | | | | 2,241 | | | | 1,329 | |
Net interest revenue | | | 2,300 | | | | 1,499 | | | | 1,340 | |
Provision for credit losses | | | (10 | ) | | | (20 | ) | | | (7 | ) |
Net interest revenue after provision for credit losses | | | 2,310 | | | | 1,519 | | | | 1,347 | |
Noninterest expense | | | | | | | | | | | | |
Staff | | | 4,120 | | | | 2,640 | | | | 2,310 | |
Professional, legal and other purchased services | | | 781 | | | | 381 | | | | 344 | |
Net occupancy | | | 449 | | | | 279 | | | | 250 | |
Software | | | 280 | | | | 220 | | | | 214 | |
Distribution and servicing | | | 268 | | | | 17 | | | | 17 | |
Furniture and equipment | | | 267 | | | | 190 | | | | 199 | |
Sub-custodian | | | 200 | | | | 134 | | | | 96 | |
Business development | | | 190 | | | | 108 | | | | 97 | |
Clearing and execution | | | 183 | | | | 199 | | | | 204 | |
Communications | | | 109 | | | | 97 | | | | 91 | |
Other | | | 546 | | | | 241 | | | | 222 | |
Subtotal | | | 7,393 | | | | 4,506 | | | | 4,044 | |
Amortization of intangible assets | | | 319 | | | | 76 | | | | 40 | |
Merger and integration expense: | | | | | | | | | | | | |
The Bank of New York Mellon | | | 355 | | | | - | | | | - | |
Acquired Corporate Trust Business | | | 49 | | | | 106 | | | | - | |
Total noninterest expense | | | 8,116 | | | | 4,688 | | | | 4,084 | |
Income | | | | | | | | | | | | |
Income from continuing operations before income taxes | | | 3,225 | | | | 2,170 | | | | 1,978 | |
Provision for income taxes | | | 998 | | | | 694 | | | | 635 | |
Income from continuing operations | | | 2,227 | | | | 1,476 | | | | 1,343 | |
Income (loss) from discontinued operations, net of tax | | | (8 | ) | | | 1,371 | | | | 228 | |
Income before extraordinary (loss) | | | 2,219 | | | | 2,847 | | | | 1,571 | |
Extraordinary (loss) on consolidation of commercial paper conduit, net of tax | | | (180 | ) | | | - | | | | - | |
Net income | | $ | 2,039 | | | $ | 2,847 | | | $ | 1,571 | |
The Bank of New York Mellon Corporation 79
CONSOLIDATED INCOME STATEMENT(continued)
| | | | | | | | | | | |
| | | Year ended Dec. 31,(a) | |
| (in dollars unless otherwise noted) | | 2007 | | | 2006 | | 2005 | |
Earnings per share (b) | | | | | | | | | | | |
Basic: | | | | | | | | | | | |
Income from continuing operations | | $ | 2.41 | | | $ | 2.07 | | $ | 1.86 | |
Income (loss) from discontinued operations, net of tax | | | (.01 | ) | | | 1.92 | | | .32 | |
Income before extraordinary (loss) | | | 2.40 | | | | 3.99 | | | 2.18 | |
Extraordinary (loss), net of tax | | | (.19 | ) | | | - | | | - | |
Net income | | $ | 2.21 | | | $ | 3.99 | | $ | 2.18 | |
Diluted: | | | | | | | | | | | |
Income from continuing operations | | $ | 2.38 | | | $ | 2.04 | | $ | 1.84 | |
Income (loss) from discontinued operations, net of tax | | | (.01 | ) | | | 1.90 | | | .31 | |
Income before extraordinary (loss) | | | 2.37 | | | | 3.94 | | | 2.16 | (c) |
Extraordinary (loss), net of tax | | | (.19 | ) | | | - | | | - | |
Net income | | $ | 2.18 | | | $ | 3.94 | | $ | 2.16 | |
Average shares outstanding(b) (in thousands) | | | | | | | | | | | |
Basic | | | 923,199 | | | | 713,795 | | | 721,666 | |
Common stock equivalents | | | 11,505 | | | | 8,612 | | | 7,442 | |
Diluted | | | 934,704 | | | | 722,407 | | | 729,108 | |
| (a) | Results for 2007 include six months of the combined Company’s results and six months of legacy The Bank of New York only. All other periods reflect legacy The Bank of New York only. Certain prior period amounts have been revised, see Note 2 of Notes to Consolidated Financial Statements. |
| (b) | All earnings per share data and average shares outstanding are presented in post-merger share count terms. |
| (c) | Does not foot due to rounding. |
See accompanying Notes to Consolidated Financial Statements.
80�� The Bank of New York Mellon Corporation
CONSOLIDATED BALANCE SHEET
The Bank of New York Mellon Corporation (and its subsidiaries)
| | | | | | | | |
| | | Dec. 31 | |
| (dollar amounts in millions, except per share amounts) | | 2007 | | | 2006(a) | |
Assets | | | | | | | | |
Cash and due from banks | | $ | 6,635 | | | $ | 2,840 | |
Interest-bearing deposits with banks | | | 34,312 | | | | 13,172 | |
Federal funds sold and securities purchased under resale agreements | | | 9,108 | | | | 5,114 | |
Securities: | | | | | | | | |
Held-to-maturity (fair value of $2,171 and $1,710) | | | 2,180 | | | | 1,729 | |
Available-for-sale | | | 46,518 | | | | 19,377 | |
Total securities | | | 48,698 | | | | 21,106 | |
Trading assets | | | 6,420 | | | | 5,544 | |
Loans | | | 50,931 | | | | 37,793 | |
Reserve for loan losses | | | (327 | ) | | | (287 | ) |
Net loans | | | 50,604 | | | | 37,506 | |
Premises and equipment | | | 1,731 | | | | 1,050 | |
Accrued interest receivable | | | 739 | | | | 422 | |
Goodwill | | | 16,331 | | | | 5,008 | |
Intangible assets | | | 6,402 | | | | 1,453 | |
Other assets | | | 16,676 | | | | 9,973 | |
Assets of discontinued operations | | | - | | | | 18 | |
Total assets | | $ | 197,656 | | | $ | 103,206 | |
Liabilities | | | | | | | | |
Deposits: | | | | | | | | |
Noninterest-bearing (principally domestic offices) | | $ | 32,372 | | | $ | 19,554 | |
Interest-bearing deposits in domestic offices | | | 21,082 | | | | 10,041 | |
Interest-bearing deposits in foreign offices | | | 64,671 | | | | 32,551 | |
Total deposits | | | 118,125 | | | | 62,146 | |
Federal funds purchased and securities sold under repurchase agreements | | | 2,193 | | | | 790 | |
Trading liabilities | | | 4,577 | | | | 2,507 | |
Payables to customers and broker-dealers | | | 7,578 | | | | 7,266 | |
Commercial paper | | | 4,079 | | | | 224 | |
Other borrowed funds | | | 1,840 | | | | 1,401 | |
Accrued taxes and other expenses | | | 8,101 | | | | 5,129 | |
Other liabilities (including allowance for lending related commitments of $167 and $150) | | | 4,887 | | | | 3,477 | |
Long-term debt | | | 16,873 | | | | 8,773 | |
Liabilities of discontinued operations | | | - | | | | 64 | |
Total liabilities | | | 168,253 | | | | 91,777 | |
Shareholders’ equity(b) | | | | | | | | |
Common stock-par value $.01 per share; authorized 3,500,000,000 shares; issued 1,146,896,177 and 994,110,501 shares | | | 11 | | | | 10 | |
Additional paid-in capital | | | 19,990 | | | | 10,035 | |
Retained earnings | | | 10,015 | | | | 9,280 | |
Accumulated other comprehensive loss, net of tax | | | (574 | ) | | | (317 | ) |
Less: Treasury stock of 912,896 and 280,935,236 shares, at cost | | | (39 | ) | | | (7,576 | ) |
Loan to ESOP (- and 95,994 shares) | | | - | | | | (3 | ) |
Total shareholders’ equity | | | 29,403 | | | | 11,429 | |
Total liabilities and shareholders’ equity | | $ | 197,656 | | | $ | 103,206 | |
| (a) | Legacy The Bank of New York only. Certain prior period balances have been revised, see Note 2 of Notes to Consolidated Financial Statements. |
| (b) | Par value, authorized, issued, treasury stock and loan to ESOP shares at Dec. 31, 2006 have been restated in post merger share count terms. |
See accompanying Notes to Consolidated Financial Statements.
The Bank of New York Mellon Corporation 81
CONSOLIDATED STATEMENT OF CASH FLOWS
The Bank of New York Mellon Corporation (and its subsidiaries)
| | | | | | | | | | | | |
| | | Year ended Dec. 31,(a) | |
| (in millions) | | 2007 | | | 2006(b) | | | 2005 | |
Operating activities | | | | | | | | | | | | |
Net income | | $ | 2,039 | | | $ | 2,847 | | | $ | 1,571 | |
Income (loss) from discontinued operations | | | (8 | ) | | | 1,371 | | | | 228 | |
Extraordinary (loss) | | | (180 | ) | | | - | | | | - | |
Income from continuing operations | | | 2,227 | | | | 1,476 | | | | 1,343 | |
Adjustments to reconcile net income to cash provided by (used for) operating activities: | | | | | | | | | | | | |
Provision for credit losses | | | (10 | ) | | | (20 | ) | | | (7 | ) |
Depreciation and amortization | | | 826 | | | | 490 | | | | 515 | |
Deferred tax expense (benefit) | | | (148 | ) | | | 398 | | | | (55 | ) |
Securities gains and venture capital income | | | 141 | | | | (9 | ) | | | (68 | ) |
Change in trading activities | | | 1,947 | | | | 847 | | | | (2,216 | ) |
Change in accruals and other, net | | | (992 | ) | | | (67 | ) | | | (885 | ) |
Net effect of discontinued operations | | | (21 | ) | | | 796 | | | | 258 | |
Net cash provided by (used for) operating activities | | | 3,970 | | | | 3,911 | | | | (1,115 | ) |
Investing activities | | | | | | | | | | | | |
Change in interest-bearing deposits with banks | | | (10,625 | ) | | | (3,810 | ) | | | (946 | ) |
Change in margin loans | | | (43 | ) | | | 921 | | | | (30 | ) |
Purchases of securities held-to-maturity | | | - | | | | (567 | ) | | | (544 | ) |
Paydowns of securities held-to-maturity | | | 228 | | | | 227 | | | | 373 | |
Maturities of securities held-to-maturity | | | 233 | | | | 116 | | | | 70 | |
Purchases of securities available-for-sale | | | (30,398 | ) | | | (11,122 | ) | | | (18,044 | ) |
Sales of securities available-for-sale | | | 2,600 | | | | 7,559 | | | | 4,941 | |
Paydowns of securities available-for-sale | | | 4,862 | | | | 4,553 | | | | 6,759 | |
Maturities of securities available-for-sale | | | 16,023 | | | | 4,510 | | | | 2,437 | |
Net principal disbursed on loans to customers | | | (3,647 | ) | | | (5,551 | ) | | | (6,212 | ) |
Proceeds from sale of loans | | | 52 | | | | 122 | | | | 263 | |
Change in federal funds sold and securities purchased under resale agreements | | | (2,612 | ) | | | (2,689 | ) | | | 3,283 | |
Change in seed capital investments | | | 136 | | | | (216 | ) | | | - | |
Purchases of premises and equipment/capitalized software | | | (313 | ) | | | (221 | ) | | | (131 | ) |
Acquisitions, net cash | | | 1,431 | | | | 2,135 | | | | (265 | ) |
Disposition net of cash included | | | - | | | | (2,275 | ) | | | - | |
Proceeds from the sale of premises and equipment | | | 1 | | | | 149 | | | | - | |
Other, net | | | 506 | | | | (188 | ) | | | (44 | ) |
Net effect of discontinued operations | | | (8 | ) | | | - | | | | 468 | |
Net cash used for investing activities | | | (21,574 | ) | | | (6,347 | ) | | | (7,622 | ) |
Financing activities | | | | | | | | | | | | |
Change in deposits | | | 19,067 | | | | 3,304 | | | | 6,108 | |
Change in federal funds purchased and securities sold under repurchase agreements | | | 75 | | | | (43 | ) | | | (371 | ) |
Change in payables to customers and broker-dealers | | | 313 | | | | (1,358 | ) | | | (41 | ) |
Change in other funds borrowed | | | (772 | ) | | | 588 | | | | 534 | |
Change in commercial paper | | | (295 | ) | | | 139 | | | | (168 | ) |
Net proceeds from the issuance of long-term debt | | | 4,617 | | | | 1,527 | | | | 2,033 | |
Repayments of long-term debt | | | (1,131 | ) | | | (567 | ) | | | (215 | ) |
Proceeds from the exercise of stock options | | | 475 | | | | 217 | | | | 61 | |
Issuance of common stock | | | 20 | | | | 174 | | | | 171 | |
Tax benefit realized on share-based payment awards | | | 55 | | | | 37 | | | | 11 | |
Stock rights redemption | | | - | | | | - | | | | (39 | ) |
Treasury stock acquired | | | (113 | ) | | | (883 | ) | | | (417 | ) |
Cash dividends paid | | | (884 | ) | | | (656 | ) | | | (644 | ) |
Net effect of discontinued operations | | | 41 | | | | - | | | | 1,031 | |
Net cash provided by financing activities | | | 21,468 | | | | 2,479 | | | | 8,054 | |
Effect of exchange rate changes on cash | | | (69 | ) | | | (85 | ) | | | 309 | |
Change in cash and due from banks | | | | | | | | | | | | |
Change in cash and due from banks | | | 3,795 | | | | (42 | ) | | | (374 | ) |
Cash and due from banks at beginning of period | | | 2,840 | | | | 2,882 | | | | 3,256 | |
Cash and due from banks at end of period | | $ | 6,635 | | | $ | 2,840 | | | $ | 2,882 | |
Supplemental disclosures | | | | | | | | | | | | |
Interest paid | | $ | 3,546 | | | $ | 2,322 | | | $ | 1,389 | |
Income taxes paid | | | 1,390 | | | | 652 | | | | 876 | |
Income taxes refunded | | | 147 | | | | 4 | | | | 20 | |
| (a) | Results for 2007 include six months of the combined Company’s results and six months of legacy The Bank of New York only. All other periods reflect legacy The Bank of New York only. |
| (b) | Revised, see Note 2 of Notes to Consolidated Financial Statements. |
See accompanying Notes to Consolidated Financial Statements.
82 The Bank of New York Mellon Corporation
CONSOLIDATED STATEMENT OF CHANGES IN SHAREHOLDERS’ EQUITY
The Bank of New York Mellon Corporation (and its subsidiaries)
| | | | | | | | | | | | | | | | | | | | | | | | | | | | |
| (in millions, except per share amounts) | | Common
stock | | | Additional
paid-in
capital | | | Retained
earnings | | | Accumulated
other
comprehensive
income (loss),
net of tax | | | Treasury
stock | | | ESOP
loan | | | Total
shareholders’
equity | |
Balance at Jan. 1, 2005 | | $ | 10 | | | $ | 9,535 | | | $ | 6,162 | | | $ | (6 | ) | | $ | (6,411 | ) | | $ | - | | | $ | 9,290 | |
Comprehensive income: | | | | | | | | | | | | | | | | | | | | | | | | | | | | |
Net income | | | - | | | | - | | | | 1,571 | | | | - | | | | - | | | | - | | | | 1,571 | |
Other comprehensive income, net of tax: | | | - | | | | - | | | | - | | | | (138 | ) | | | - | | | | - | | | | (138 | ) |
Reclassification adjustment | | | - | | | | - | | | | - | | | | 10 | | | | - | | | | - | | | | 10 | |
Total comprehensive income | | | - | | | | - | | | | 1,571 | | | | (128 | ) | | | - | | | | - | | | | 1,443 | |
Dividends on common stock at $.87 per share | | | - | | | | - | | | | (644 | ) | | | - | | | | - | | | | - | | | | (644 | ) |
Repurchase of common stock | | | - | | | | - | | | | - | | | | - | | | | (407 | ) | | | (10 | ) | | | (417 | ) |
Common stock issued under employee benefit plans | | | - | | | | 158 | | | | - | | | | - | | | | - | | | | 3 | | | | 161 | |
Stock rights redemption | | | - | | | | (39 | ) | | | - | | | | - | | | | - | | | | - | | | | (39 | ) |
Stock awards and options exercised | | | - | | | | - | | | | - | | | | - | | | | 82 | | | | - | | | | 82 | |
Balance at Dec. 31, 2005 | | $ | 10 | | | $ | 9,654 | | | $ | 7,089 | | | $ | (134 | ) | | $ | (6,736 | ) | | $ | (7 | ) | | $ | 9,876 | |
Comprehensive income: | | | | | | | | | | | | | | | | | | | | | | | | | | | | |
Net income | | | - | | | | - | | | | 2,847 | | | | - | | | | - | | | | - | | | | 2,847 | |
Other comprehensive income, net of tax: | | | - | | | | - | | | | - | | | | 133 | | | | - | | | | - | | | | 133 | |
Adjustment to initially apply SFAS 158 | | | - | | | | - | | | | - | | | | (264 | ) | | | - | | | | - | | | | (264 | ) |
Reclassification adjustment | | | - | | | | - | | | | - | | | | (52 | ) | | | - | | | | - | | | | (52 | ) |
Total comprehensive income | | | - | | | | - | | | | 2,847 | | | | (183 | ) | | | - | | | | - | | | | 2,664 | |
Dividends on common stock at $.91 per share | | | - | | | | - | | | | (656 | ) | | | - | | | | - | | | | - | | | | (656 | ) |
Repurchase of common stock | | | - | | | | - | | | | - | | | | - | | | | (883 | ) | | | - | | | | (883 | ) |
Common stock issued under employee benefit plans | | | - | | | | 381 | | | | - | | | | - | | | | - | | | | 4 | | | | 385 | |
Stock awards and options exercised | | | - | | | | - | | | | - | | | | - | | | | 43 | | | | - | | | | 43 | |
Balance at Dec. 31, 2006(a) | | $ | 10 | | | $ | 10,035 | | | $ | 9,280 | | | $ | (317 | ) | | $ | (7,576 | ) | | $ | (3 | ) | | $ | 11,429 | |
Adjustments for the cumulative effect of applying FSP FAS 13-2 and FIN 48, net of taxes of $(214) | | | - | | | | - | | | | (416 | ) | | | - | | | | - | | | | - | | | | (416 | ) |
Adjusted balance at Jan. 1, 2007 | | | 10 | | | | 10,035 | | | | 8,864 | | | | (317 | ) | | | (7,576 | ) | | | (3 | ) | | | 11,013 | |
Comprehensive income: | | | | | | | | | | | | | | | | | | | | | | | | | | | | |
Net income | | | - | | | | - | | | | 2,039 | | | | - | | | | - | | | | - | | | | 2,039 | |
Other comprehensive income, net of tax: | | | - | | | | - | | | | - | | | | (231 | ) | | | - | | | | - | | | | (231 | ) |
Reclassification adjustment | | | - | | | | - | | | | - | | | | (26 | ) | | | - | | | | - | | | | (26 | ) |
Total comprehensive income | | | - | | | | - | | | | 2,039 | | | | (257 | ) | | | - | | | | - | | | | 1,782 | |
Dividends on common stock at $.95 per share | | | - | | | | - | | | | (884 | ) | | | - | | | | - | | | | - | | | | (884 | ) |
Repurchase of common stock | | | - | | | | - | | | | - | | | | - | | | | (113 | ) | | | - | | | | (113 | ) |
Common stock issued under employee benefit plans | | | - | | | | 25 | | | | - | | | | - | | | | 2 | | | | 3 | | | | 30 | |
Common stock issued in settlement of share repurchase agreements with broker-dealer counterparties | | | - | | | | (35 | ) | | | - | | | | - | | | | 35 | | | | - | | | | - | |
Stock awards and options exercised | | | - | | | | 644 | | | | - | | | | - | | | | 69 | | | | - | | | | 713 | |
Retirement of treasury stock | | | (3 | ) | | | (7,541 | ) | | | - | | | | - | | | | 7,544 | | | | - | | | | - | |
Merger with Mellon | | | 4 | | | | 16,846 | | | | - | | | | - | | | | - | | | | - | | | | 16,850 | |
Other | | | - | | | | 16 | | | | (4 | ) | | | - | | | | - | | | | - | | | | 12 | |
Balance at Dec. 31, 2007 | | $ | 11 | | | $ | 19,990 | | | $ | 10,015 | | | $ | (574 | ) | | $ | (39 | ) | | $ | - | | | $ | 29,403 | |
| (a) | Certain prior period balances have been revised, see Note 2 of Notes to Consolidated Financial Statements. |
| See | accompanying Notes to Consolidated Financial Statements. |
The Bank of New York Mellon Corporation 83
NOTES TO CONSOLIDATED FINANCIAL STATEMENTS
1. Summary of significant accounting and reporting policies
Basis of Presentation
The accounting and financial reporting policies of The Bank of New York Mellon Corporation, a global financial services company, conform to U.S. generally accepted accounting principles (GAAP) and prevailing industry practices. The preparation of financial statements in conformity with U.S. GAAP requires management to make estimates and assumptions that affect the reported amounts in the consolidated financial statements. Amounts subject to significant estimates and assumptions are items such as the reserve for loans losses and lending-related commitments, goodwill and intangibles, pension and post-retirement obligations, and the fair value of financial instruments. Actual results could differ from these estimates.
In addition to discontinued operations (see Note 5 of Notes to Consolidated Financial Statements), certain other prior year information has been reclassified to conform its presentation with the 2007 financial statements.
The consolidated financial statements include the accounts of BNY Mellon and its subsidiaries. Equity investments of less than a majority but at least 20% ownership are accounted for by the equity method and classified as other assets. Earnings on these investments are reflected in fee and other revenue as securities servicing fees, asset and wealth management fees or investment income, as appropriate, in the period earned. Our most significant equity method investments are:
| | | | | |
| (in millions) | | Percent Ownership | | | Book Value |
Wing Hang | | 20.2 | % | | $274.5 |
CIBC Mellon | | 50 | % | | $593.9 |
The income statement and balance sheet include results of acquired businesses accounted for under the purchase method of accounting pursuant to SFAS No. 141 “Business Combinations”, and equity investments from the dates of acquisition. We record any contingent purchase payments when the amounts are resolved and become payable.
The Parent Corporation financial statements in Note 21 of Notes to Consolidated Financial Statements include the accounts of the Parent Corporation; those of a wholly owned financing subsidiary that functions as a financing entity for
BNY Mellon and its subsidiaries by issuing commercial paper and other debt guaranteed by BNY Mellon; and MIPA, LLC, a single member company, created to hold and administer corporate owned life insurance. Financial data for the Parent Corporation, the financing subsidiary and the single member company are combined for financial reporting purposes because of the limited function of these entities and the unconditional guarantee by BNY Mellon of their obligations.
We consider the underlying facts and circumstances of individual transactions when assessing whether or not an entity is a potential variable interest entity (VIE). BNY Mellon’s assessment focuses on the dispersion of risks and rewards attributable to the potential VIE. VIEs are entities in which equity investors do not have the characteristics of a controlling financial interest. A company is deemed to be the primary beneficiary and thus required to consolidate a VIE if the company has a variable interest (or combination of variable interests) that will absorb a majority of the VIE’s expected losses, that will receive a majority of the VIE’s expected residual returns, or both. A “variable interest” is a contractual, ownership or other interest that changes with changes in the fair value of the VIE’s net assets. “Expected losses” and “expected residual returns” are measures of variability in the expected cash flows of a VIE. When we transfer financial assets in a securitization to a VIE, the VIE must represent a qualifying special purpose entity (QSPE) or we would continue to consolidate the transferred financial assets. QSPE status is achieved when all conditions specified in SFAS No. 140, “Accounting for Transfers and Servicing of Financial Assets and Extinguishments of Liabilities,” are met. Those conditions focus on whether the entity is demonstrably distinct from BNY Mellon, limited to only permitted activities, limited on what assets the QSPE may hold, and limited on sales or other dispositions of assets. We also obtain the required true-sale opinions from outside counsel on all securitizations. We have determined that all of our securitization trusts are QSPEs.
Nature of operations
BNY Mellon is a global financial services company providing a broad range of financial products and services in domestic and international markets. Through our seven business segments (Asset Management, Wealth Management, Asset Servicing, Issuer Services, Clearing and Execution Services, Treasury Services and Other), we serve the following major classes of customers—institutions, corporations, and high net worth individuals. For
84 The Bank of New York Mellon Corporation
NOTES TO CONSOLIDATED FINANCIAL STATEMENTS(continued)
institutions and corporations we provide the following services:
| | · | | shareowner services, and |
For individuals, we provide mutual funds, separate accounts, wealth management and private banking services. BNY Mellon’s asset management businesses provide investment products in many asset classes and investment styles on a global basis.
Trading account securities, available-for-sale securities, and held-to-maturity securities
Securities are classified in the trading account securities portfolio, the available-for-sale securities portfolio or the held-to-maturity securities portfolio when they are purchased. Securities are classified as trading account securities when the intent is profit maximization through market appreciation and resale. Securities are classified as available-for-sale securities when we intend to hold the securities for an indefinite period of time or when the securities may be used for tactical asset/liability purposes and may be sold from time to time to effectively manage interest rate exposure, prepayment risk and liquidity needs. Securities are classified as held-to-maturity securities when we intend to hold them until maturity. Seed capital investments are classified as other assets, trading account securities or available-for-sale securities, depending on the nature of the investment and management’s intent.
Trading account securities are stated at fair value. Trading revenue includes both realized and unrealized gains and losses. The liability incurred on short-sale transactions, representing the obligation to deliver securities, is included in trading account liabilities at fair value.
Available-for-sale securities are stated at fair value. Unrealized gains or losses on assets classified as
available for sale, net of tax, are recorded as an addition to or deduction from other comprehensive results. Held-to-maturity securities are stated at cost, adjusted for amortization of premium and accretion of discount on a level yield basis. Gains and losses on sales of available-for-sale securities are reported in the income statement. The cost of debt and equity securities sold is determined on a specific identification and average cost method, respectively. Unrealized gains and losses on seed capital investments classified as Other assets are recorded in investment income.
We conduct quarterly reviews to identify and evaluate investments that have indications of possible impairment. An investment in a debt or equity security is impaired if its fair value falls below its cost and the decline is considered other-than-temporary. We examine various factors when determining whether an impairment is other-than-temporary. Examples of factors that may indicate that an other-than-temporary impairment has occurred include:
| | · | | Fair value is below cost; |
| | · | | The decline in fair value has existed for an extended period of time; |
| | · | | Management does not possess both the intent and the ability to hold the investment for a period of time sufficient to allow for any anticipated recovery in fair value; |
| | · | | The decline in fair value is attributable to specific adverse conditions affecting a particular investment; |
| | · | | The decline in fair value is attributable to specific conditions, such as conditions in an industry or in a geographic area; and |
| | · | | A debt security has been downgraded by a rating agency. |
Securities with an unrealized loss that is determined to be other-than-temporary are written down to fair value, with the write-down recorded as a realized loss in securities gains (losses).
The accounting policy for the determination of the value of a security when quoted prices are not available has been identified as a “critical accounting estimate” as it requires us to make numerous assumptions based on available market data.
Loans and leases
Loans are reported net of any unearned discount. Loan origination and upfront commitment fees, as well as
The Bank of New York Mellon Corporation 85
NOTES TO CONSOLIDATED FINANCIAL STATEMENTS(continued)
certain direct loan origination and commitment costs, are deferred and amortized as a yield adjustment over the lives of the related loans. Deferred fees and costs are netted against outstanding loan balances. Loans held for sale are carried at the lower of aggregate cost or fair value.
Unearned revenue on direct financing leases is accreted over the lives of the leases in decreasing amounts to provide a constant rate of return on the net investment in the leases. Revenue on leveraged leases is recognized on a basis to achieve a constant yield on the outstanding investment in the lease, net of the related deferred tax liability, in the years in which the net investment is positive. Gains and losses on residual values of leased equipment sold are included in other income. Considering the nature of these leases and the number of significant assumptions, there is risk associated with the income recognition on these leases should any of the assumptions change materially in future periods.
Nonperforming assets
Commercial loans are placed on nonaccrual status when the fair value of collateral is less than the principal and principal or interest is past due 90 days or more, or when there is reasonable doubt that interest or principal will be collected. Residential mortgage loans are generally placed on nonaccrual status when, in our judgment, collection is in doubt or the loans are 180 days or more delinquent, subject to an impairment test. Consumer loans are not classified as nonperforming assets, but are charged off and interest accrued is suspended based upon an established delinquency schedule determined by product. Real estate acquired in satisfaction of loans is carried in other assets at the lower of the recorded investment in the property or fair value minus estimated costs to sell.
When a loan is placed on nonaccrual status, previously accrued and uncollected interest is reversed against current period interest revenue. Interest receipts on nonaccrual and impaired loans are recognized as interest revenue or are applied to principal when we believe the ultimate collectibility of principal is in doubt. Nonaccrual loans generally are restored to an accrual basis when principal and interest payments become current or when the loan becomes well secured and is in the process of collection.
A loan is considered to be impaired, as defined by SFAS No. 114, “Accounting by Creditors for
Impairment of a Loan,” when it is probable that we will be unable to collect all principal and interest amounts due according to the contractual terms of the loan agreement. An impairment reserve is measured on the commercial loans of $1 million or greater and which meet the definition of an impaired loan per SFAS No. 114. Personal nonaccrual loans are not tested for impairment because they are included in large groups of smaller-balance homogeneous loans that, by definition along with leases, are excluded from the scope of SFAS No. 114.
Impaired loans are required to be measured based upon the loan’s market price, the present value of expected future cash flows, discounted at the loan’s initial effective interest rate, or at fair value of the collateral if the loan is collateral dependent. If the loan valuation is less than the recorded value of the loan, an impairment reserve is established by either an allocation of the reserve for credit losses or by a provision for credit losses. Impairment reserves are not needed when the recorded investment in an impaired loan is less than the loan valuation.
Reserve for loans losses and reserve for unfunded commitments
The reserve for loans losses, shown as a valuation allowance to loans, and the allowance for lending related commitments are referred to as BNY Mellon’s reserve for credit exposure. The accounting policy for the determination of the adequacy of the reserves has been identified as a “critical accounting estimate” as it requires us to make numerous complex and subjective estimates and assumptions relating to amounts which are inherently uncertain.
The reserve for loans losses is maintained to absorb losses inherent in the loans portfolio as of the balance sheet date based on our judgment. The reserve determination methodology is designed to provide procedural discipline in assessing the appropriateness of the reserve. Credit losses are charged against the reserve. Recoveries are added to the reserve.
The methodology for determining the allowance for lending related commitments considers the same factors as the reserve for loan losses, as well as an estimate of the probability of drawdown.
Premises and equipment
Premises and equipment are carried at cost less accumulated depreciation and amortization. Depreciation and amortization is computed using the
86 The Bank of New York Mellon Corporation
NOTES TO CONSOLIDATED FINANCIAL STATEMENTS(continued)
straight-line method over the estimated useful life of the owned asset and, for leasehold improvements, over the lesser of the remaining term of the leased facility or the estimated economic life of the improvement. For owned and capitalized assets, estimated useful lives range from 2 to 40 years. Maintenance and repairs are charged to expense as incurred, while major improvements are capitalized and amortized to operating expense over their identified useful lives.
Software
BNY Mellon capitalizes costs relating to acquired software and internal-use software development projects that provide new or significantly improved functionality. We capitalize projects that are expected to result in longer term operational benefits, such as replacement systems or new applications that result in significantly increased operational efficiencies or functionality. All other costs incurred in connection with an internal-use software project are expensed as incurred. Capitalized software is recorded in other assets.
Identified intangible assets and goodwill
Identified intangible assets with estimable lives are amortized in a pattern consistent with the assets’ identifiable cash flows or using a straight-line method over their remaining estimated benefit periods if the pattern of cash flows is not estimable. Intangible assets with estimable lives are reviewed for possible impairment when events or changed circumstances may affect the underlying basis of the asset. Goodwill and intangibles with indefinite lives are not amortized, but are assessed at least annually for impairment. The accounting policy for valuing and impairment testing of identified intangible assets and goodwill has been identified as a “critical accounting estimate” as it requires us to make numerous complex and subjective estimates.
Fee revenue
We record security servicing fees, asset and wealth management fees, foreign exchange and other trading activities, treasury services, financing-related fees, distribution and servicing, and other revenue when the services are provided and earned based on contractual terms, when amounts are determined and collectibility is reasonably assured.
Additionally, we recognize revenue from non-refundable, up-front implementation fees under
outsourcing contracts using a straight-line method, commencing in the period the ongoing services are performed through the expected term of the contractual relationship. Incremental direct set-up costs of implementation, up to the related implementation fee or minimum fee revenue amount, are deferred and amortized over the same period that the related implementation fees are recognized. If a client terminates an outsourcing contract prematurely, the unamortized deferred incremental direct set-up costs and the unamortized deferred up-front implementation fees related to that contract are recognized in the period the contract is terminated.
Performance fees are recognized in the period in which the performance fees are earned and become determinable. Performance fees are generally calculated as a percentage of the applicable portfolio’s performance in excess of a benchmark index or a peer group’s performance. For hedge fund investments, an investment management performance fee is calculated as a percentage of the applicable portfolio’s positive returns. When a portfolio underperforms its benchmark or fails to generate positive performance in the instance of a hedge fund investment, subsequent years’ performance must generally exceed this shortfall prior to fees being earned. Amounts billable in subsequent years and which are subject to a clawback if performance thresholds in those years are not met are not recognized since the fees are potentially uncollectible. These fees are recognized when it is determined that they will be collected. When a multiyear performance contract provides that fees earned are billed ratably over the performance period, only the portion of the fees earned that is non-refundable is recognized.
Net interest revenue
Revenue on interest-earning assets and expense on interest-bearing liabilities is recognized based on the effective yield of the related financial instrument.
Foreign currency translation
Assets and liabilities denominated in foreign currencies are translated to U.S. dollars at the rate of exchange on the balance sheet date. Revenue and expense accounts are translated monthly at an average monthly exchange rate. Transaction gains and losses are included in the income statement. Translation gains and losses on investments in foreign entities with functional currencies that are not the U.S. dollar are recorded as foreign currency translation adjustments in other comprehensive income.
The Bank of New York Mellon Corporation 87
NOTES TO CONSOLIDATED FINANCIAL STATEMENTS(continued)
Pension
The measurement date for BNY Mellon’s pension plans was changed from Sept. 30 to Dec. 31. Plan assets are determined based on fair value generally representing observable market prices. The projected benefit obligation is determined based on the present value of projected benefit distributions at an assumed discount rate. The discount rate utilized is based on the yield of high quality corporate bonds available in the marketplace. Periodic pension expense includes service costs, interest costs based on an assumed discount rate, an expected return on plan assets based on an actuarially derived market-related value and amortization of actuarial gains and losses.
Actuarial gains and losses include the impact of plan amendments and various gains and losses which are deferred and amortized over the future service periods of active employees. The market-related value utilized to determine the expected return on plan assets is based on fair value adjusted for the difference between expected returns and actual performance of plan assets. The unrealized difference between actual experience and expected returns is included in the market-related value over a five-year period.
Any gains or losses related to changes in the amount of the projected benefit obligation or plan assets resulting from experience different from the assumed discount rate or expected returns and from changes in assumptions are deferred. To the extent a gain or loss, excluding the asset gain or loss, exceeds 10 percent of the greater of the projected benefit obligation or the market-related value of plan assets, the excess is recognized over the future service periods of active employees.
BNY Mellon’s accounting policy regarding pensions has been identified as a “critical accounting estimate” as it is regarded to be critical to the presentation of our financial statements since it requires management to make numerous complex and subjective assumptions relating to amounts which are inherently uncertain.
Severance
BNY Mellon provides separation benefits through the BNY Mellon Separation Plan, the Bank of New York Company, Inc. Separation Plan or the Mellon Financial Corporation Displacement Program to eligible employees separated or displaced from their jobs for business reasons not related to individual performance. Basic separation benefits are based on the employee’s years of continuous benefited service.
Separation expense is recorded when management commits to an action that will result in separation and the amount of the liability can be reasonably estimated.
Income Taxes
We record current tax liabilities or assets through charges or credits to the current tax provision for the estimated taxes payable or refundable for the current year. Deferred tax assets and liabilities are recorded for future tax consequences attributable to differences between the financial statement carrying amounts of assets and liabilities and their respective tax bases. Deferred tax assets and liabilities are measured using enacted tax rates expected to apply to taxable income in the years in which those temporary differences are expected to be recovered or settled. A deferred tax valuation allowance is established if it is more likely than not that all or a portion of the deferred tax assets will not be realized. A tax position that fails to meet a more-likely-than-not recognition threshold will result in either a reduction of current or deferred tax assets, and/or recording of current or deferred tax liabilities. Interest and penalties related to income taxes are recorded as income tax expense.
Derivative financial instruments
Derivative contracts, such as futures contracts, forwards, interest rate swaps, foreign currency swaps and options and similar products used in trading activities are recorded at fair value. We do not recognize gains or losses at the inception of derivative transactions if the fair value is not determined based upon observable market transactions and market data. Gains and losses are included in foreign exchange and other trading activities in fee and other revenue. Unrealized gains and losses are reported on a gross basis in trading account assets and trading liabilities, after taking into consideration master netting agreements.
We enter into various derivative financial instruments for non-trading purposes primarily as part of our asset/liability management (“ALM”) process. These derivatives are designated as fair value and cash flow hedges of certain assets and liabilities when we enter into the derivative contracts. Gains and losses associated with fair value hedges are recorded in income as well as any change in the value of the related hedged item. Gains and losses on cash flow hedges are recorded in other comprehensive income.
We formally document all relationships between hedging instruments and hedged items, as well as our
88 The Bank of New York Mellon Corporation
NOTES TO CONSOLIDATED FINANCIAL STATEMENTS(continued)
risk-management objectives and strategy for undertaking various hedge transactions. This process includes linking all derivatives that are designated as fair value or cash flow hedges to specific assets or liabilities on the balance sheet.
We formally assess, both at the hedge’s inception and on an ongoing basis, whether the derivatives that are used in hedging transactions are highly effective and whether those derivatives are expected to remain highly effective in future periods. We evaluate ineffectiveness in terms of amounts that could impact a hedge’s ability to qualify for hedge accounting and the risk that the hedge could result in more than a de minimus amount of ineffectiveness. At inception, the potential causes of ineffectiveness related to each of our hedges is assessed to determine if we can expect the hedge to be highly effective over the life of the transaction and to determine the method for evaluating effectiveness on an ongoing basis. Recognizing that changes in the value of derivatives used for hedging or the value of hedged items could result in significant ineffectiveness, we have processes in place that are designed to identify and evaluate such changes when they occur. Quarterly, we perform a quantitative effectiveness assessment and record any ineffectiveness.
We discontinue hedge accounting prospectively when we determine that a derivative is no longer an effective hedge, the derivative expires, is sold, or management discontinues the derivative’s hedge designation. Subsequent gains and losses on these derivatives are included in foreign exchange and other trading activities.
The accounting policy for the determination of the value of derivative when quoted prices are not available has been identified as a “critical accounting estimate” as it requires us to make numerous assumptions based on the available market data.
Statement of cash flows
We have defined cash and cash equivalents as cash and due from banks. Cash flows from hedging activities are classified in the same category as the items hedged.
Stock options
We adopted SFAS No. 123 (revised 2004) (“SFAS 123(R)”), “Share-Based Payment”, which is a revision of SFAS No. 123, “Accounting for Stock-Based Compensation” on Jan. 1, 2006, using the “modified prospective” method. Under this method,
compensation cost is recognized beginning with the effective date: (a) based on the requirements of SFAS 123(R) for all share-based payments granted after the effective date; and (b) based on the requirements of SFAS 123 for all awards granted to employees prior to the effective date of SFAS 123(R) that remain unvested on the effective date.
The modified retroactive restatement method requires that our financial statements be restated as if fair value accounting had been adopted in 1995. For 2007 and 2006, there is no difference between the prospective method and the retroactive restatement method. The following table discloses the pro forma effects on net income and earnings per share for 2005 as if the retroactive restatement method had been adopted.
| | | | |
| Pro forma income and EPS | | | |
| (in millions except per share amounts) | | 2005 | |
Reported net income | | $ | 1,571 | |
Stock-based employee compensation costs using prospective method, net of tax | | | 29 | |
Stock-based employee compensation costs using retroactive restatement, net of tax | | | (37 | ) |
Pro forma net income | | $ | 1,563 | |
Reported diluted earnings per share | | $ | 2.16 | |
Impact on diluted earnings per share | | | (.01 | ) |
Pro forma diluted earnings per share | | $ | 2.15 | |
Certain of our stock compensation grants vest when the employee retires. SFAS 123(R) requires the completion of expensing of new grants with this feature by the first date the employee is eligible to retire. For grants prior to Jan. 1, 2006, we will continue to expense them over their stated vesting period. The adoption of SFAS 123(R) increased pre-tax expense by $17 million in 2007 and $12 million in 2006, respectively.
2. Revision of prior period financial statements
Our fourth quarter 2006 acquisition of the Acquired Corporate Trust Business and sale of our Retail Business to JPMorgan Chase included a “Like Kind Exchange” (the “LKE”) of finite lived intangible assets, principally core deposit intangibles, under Internal Revenue Code section (“Section”) 1031. The
LKE deferred taxes of $164 million were treated as a liability acquired in the business combination with an offsetting increase to goodwill.
We reviewed the transaction and determined that $164 million of deferred tax expense should have been recognized on the gain related to the Retail
Business intangibles included in the LKE with
The Bank of New York Mellon Corporation 89
NOTES TO CONSOLIDATED FINANCIAL STATEMENTS(continued)
JPMorgan Chase. Accordingly, we have corrected the fourth quarter 2006 financial statements with a non-cash charge to discontinued operations—income taxes and a reduction in goodwill of $164 million. This revision does not impact income from continuing operations or our tangible common equity. We revised our prior period’s financial statements and notes to reflect these taxes in discontinued operations.
The table below presents the effect of the correction on our previously reported consolidated statements of income for the fiscal year ended Dec. 31, 2006 and for the three-month period ended Dec. 31, 2006, the consolidated statement of cash flows for the fiscal year ended Dec. 31, 2006 and the consolidated balance sheet for the period ended Dec. 31, 2006.
| | | | | | | | | | | | | | | | | | | | |
| For the period ended Dec. 31, 2006 | | As previously reported | | | | | | As revised | |
| (in millions, except per share amounts) | | Fourth quarter | | | Year | | | Adjustment | | | Fourth quarter | | | Year | |
Income from continuing operations | | $ | 427 | | | $ | 1,476 | | | $ | - | | | $ | 427 | | | $ | 1,476 | |
Discontinued operations: | | | | | | | | | | | | | | | | | | | | |
Income from discontinued operations | | | 2,130 | | | | 2,426 | | | | - | | | | 2,130 | | | | 2,426 | |
Income taxes | | | (768 | ) | | | (891 | ) | | | (164 | ) | | | (932 | ) | | | (1,055 | ) |
Discontinued operations, net | | | 1,362 | | | | 1,535 | | | | (164 | ) | | | 1,198 | | | | 1,371 | |
Net income | | $ | 1,789 | | | $ | 3,011 | | | $ | (164 | ) | | $ | 1,625 | | | $ | 2,847 | |
Per common share data(a) | | | | | | | | | | | | | | | | | | | | |
Basic earnings: | | | | | | | | | | | | | | | | | | | | |
Income from continuing operations | | $ | 0.61 | | | $ | 2.07 | | | | | | | $ | 0.61 | | | $ | 2.07 | |
Income from discontinued operations, net | | | 1.93 | | | | 2.15 | | | | | | | | 1.70 | | | | 1.92 | |
Net income | | $ | 2.53 | (b) | | $ | 4.22 | | | | | | | $ | 2.30 | (b) | | $ | 3.99 | |
Diluted earnings: | | | | | | | | | | | | | | | | | | | | |
Income from continuing operations | | $ | 0.60 | | | $ | 2.04 | | | | | | | $ | 0.60 | | | $ | 2.04 | |
Income from discontinued operations, net | | | 1.90 | | | | 2.13 | | | | | | | | 1.68 | | | | 1.90 | |
Net income | | $ | 2.50 | | | $ | 4.17 | | | | | | | $ | 2.27 | (b) | | $ | 3.94 | |
| (a) | Per common share data is presented in post-merger share count terms. |
| (b) | Does not foot due to rounding. |
The effect of the correction on the Dec. 31, 2006 consolidated balance sheet is as follows:
| | | | | | | | | | |
Balance as of Dec. 31,
2006 | | | | | | | |
| (in millions) | | As previously
reported | | Adjustment | | | As revised |
Goodwill | | $ | 5,172 | | $ | (164 | ) | | $ | 5,008 |
Total assets | | | 103,370 | | | (164 | ) | | | 103,206 |
Retained earnings | | | 9,444 | | | (164 | ) | | | 9,280 |
Total shareholders’ equity | | | 11,593 | | | (164 | ) | | | 11,429 |
Memo: Tangible common equity | | | 4,968 | | | - | | | | 4,968 |
The effect of the correction on the year-ended 2006 consolidated statement of cash flows is as follows:
| | | | | | | | | | | | |
Year ended Dec. 31,
2006 | | | | | | | | | |
| (in millions) | | As previously
reported | | | Adjustment | | | As revised | |
Net income | | $ | 3,011 | | | $ | (164 | ) | | $ | 2,847 | |
Gain on retail business sale, net of taxes | | | (1,381 | ) | | | 164 | | | | (1,217 | ) |
Net cash provided by operating activities | | | 3,911 | | | | - | | | | 3,911 | |
3. Accounting changes and new accounting pronouncements
SFAS No. 155—Accounting for Certain Hybrid Financial Instruments
In February 2006, the FASB issued SFAS No. 155 (“SFAS 155”), “Accounting for Certain Hybrid Financial Instruments”, an amendment of SFAS 140 and SFAS 133. SFAS 155 permits us to elect to
90 The Bank of New York Mellon Corporation
NOTES TO CONSOLIDATED FINANCIAL STATEMENTS(continued)
measure any hybrid financial instrument at fair value if the hybrid instrument contains an embedded derivative that otherwise would require bifurcation and be accounted for separately under SFAS 133. SFAS 155 clarifies which interest-only strips and principal-only strips are not subject to the requirements of SFAS 133 and that concentrations of credit risk in the form of subordination are not embedded derivatives. SFAS 155 is effective for all financial instruments acquired, issued, or subject to a re-measurement event after Dec. 31, 2006. On Jan. 17, 2007, the FASB issued Derivative Implementation Groups (“DIG”) Issue B40 which impacts how SFAS 155 is applied. The adoption of SFAS 155 and DIG Issue B40 did not have a significant impact on our investment activities.
FSP FAS 13-2—Leases
In July 2006, the FASB issued FASB Staff Position (“FSP”) FAS 13-2, “Accounting for a Change or Projected Change in the Timing of Cash Flows Relating to Income Taxes Generated by a Leverage Lease Transaction,” revising the accounting guidance under SFAS No. 13 (“SFAS 13”), “Accounting for Leases,” for leveraged leases. This FSP modifies existing interpretations of SFAS 13 and associated industry practice. As a result in 2007, we recognized a one-time after-tax charge to equity of $389 million related to a change in the timing of our lease cash flows due to the LILO settlement, further described in Note 24 of Notes to Consolidated Financial Statements. However, an amount approximating this one-time charge will be taken into income over the remaining term of the affected leases. Since we have not yet reached a settlement with the IRS related to LILOs originated in 1998, in the fourth quarter of 2007, we changed our estimate assuming a September 2008 settlement date. This resulted in an after-tax charge to earnings in 2007 of $5 million. As with our other LILOs, the portion of the one-time charge related to 1998 leases will be taken into income between the settlement date and the end of the lease term.
FIN No. 48—Taxes
In 2007, we adopted FASB Interpretation No. 48, “Accounting for Uncertainty in Income Taxes” (“FIN 48”). FIN 48 clarifies the accounting for uncertain tax positions in accordance with SFAS No. 109, “Accounting for Income Taxes.” FIN 48 requires that a tax position meet a “more-likely-than-not threshold” for the benefit of the uncertain tax position to be recognized in the financial statements. A tax position that fails to meet a more-likely-than-not recognition
threshold will result in either reduction of current or deferred tax assets, and/or recording of current or deferred tax liabilities. The impact of adoption in 2007 was a charge to equity of $27 million. See Note 13 of Notes to Consolidated Financial Statements for further discussion related to FIN 48.
SFAS No. 158—Pensions
In September 2006, the FASB issued SFAS No. 158, “Employers’ Accounting for Defined Benefit Pension and Other Postretirement Plans—an amendment of FASB Statements No. 87, 88, 106 and 132(R)” (“SFAS 158”). SFAS 158 requires the Company to (a) recognize in its statement of financial position an asset for a plan’s overfunded status or a liability for a plan’s underfunded status, (b) measure a plan’s assets and its obligations that determine its funded status as of the end of the fiscal year, (c) recognize changes in the funded status of a defined postretirement plan in the year in which the changes occur (reported in comprehensive income) and (d) provide additional disclosure. The requirement to recognize the funded status of a benefit plan and the disclosure requirements are effective as of the end of the fiscal year ending after December 15, 2006. The requirement to measure the plan assets and benefit obligations as of the date of the employer’s fiscal year-end statement of financial position is effective for fiscal years ending after December 15, 2008. On December 31, 2006, the Company adopted the recognition and disclosure provisions of SFAS 158. The effect of adopting SFAS 158 on the Company’s consolidated balance sheets at December 31, 2006 has been included in the accompanying financial statements. The adoption of SFAS 158 resulted in a charge to equity of $264 million.
4. Acquisitions and dispositions
Acquisitions in 2007
Merger with Mellon Financial Corporation
On July 1, 2007, we completed our merger with Mellon Financial Corporation (“Mellon”), headquartered in Pittsburgh, Pennsylvania. Both companies merged into a new holding company named The Bank of New York Mellon Corporation (“BNY Mellon”) upon completion of the transaction. In the transaction, each share of Mellon $.50 par value
The Bank of New York Mellon Corporation 91
NOTES TO CONSOLIDATED FINANCIAL STATEMENTS(continued)
common stock was converted into one share of BNY Mellon $.01 par value common stock and each share of The Bank of New York $7.50 par value common stock was converted into .9434 shares of BNY Mellon $.01 par value common stock. The merger was accounted for as a purchase of Mellon for accounting and financial reporting purposes. As a result, the historical financial statements of the combined company presented in this Annual Report are the historical financial statements of The Bank of New York. Mellon’s results of operations were included with The Bank of New York’s results beginning July 1, 2007.
At June 30, 2007, Mellon had total assets of $43 billion, total common shares outstanding of 418,330,448 and had 17,400 employees. Mellon’s total revenue and net income from continuing operations for the first six months of 2007 were $2,902 million and $524 million, respectively.
The merger with Mellon added approximately $33 billion of interest-earning assets, including $18 billion of securities, $7 billion of loans and $6 billion of other money market investments. The merger also provided the following funding sources: $21 billion of interest-bearing deposits, $8 billion of noninterest-bearing deposits, $4 billion of long term debt and $1 billion of federal funds purchased. Goodwill and intangibles related to the merger with Mellon were approximately $16 billion.
Purchase price and goodwill—Mellon
The purchase price has been allocated to the assets acquired and liabilities assumed using their fair values at the merger date. The computation of the purchase price and the allocation of the purchase price to the net assets of Mellon, based on their respective fair values at July 1, 2007, and the resulting amount of goodwill are presented in the following table. Changes to the carrying amount of goodwill and intangible assets, since the merger date, reflect additional information obtained about the fair value of the assets acquired and liabilities assumed.
| | | | | | | | |
(dollar amounts in millions, except per share
amounts)(a) | | July 1, 2007 | |
Purchase price of Mellon Financial: | | | | | | | | |
Mellon Financial net common shares outstanding | | | 418,330,448 | | | | | |
Exchange ratio | | | 1.00 | | | | | |
The Bank of New York Mellon shares | | | 418,330,448 | | | | | |
Average price per share | | $ | 39.86 | | | | | |
| | | | | | | | |
Purchase price of Mellon Financial shares | | | | | | $ | 16,675 | |
Estimated fair value of outstanding Mellon Financial stock options | | | | | | | 302 | |
| | | | | | | | |
Total purchase price | | | | | | $ | 16,977 | |
| | | | | | | | |
Net Mellon Financial assets acquired: | | | | | | | | |
Mellon Financial shareholders’ equity | | | | | | $ | 5,194 | |
Mellon Financial goodwill and intangibles | | | | | | | (2,925 | ) |
Unrecognized compensation on unvested stock options and restricted stock | | | | | | | 126 | |
Estimated adjustments to reflect assets at fair value: | | | | | | | | |
Loans and leases, net | | | | | | | (199 | ) |
Premises and equipment | | | | | | | 15 | |
Identified intangibles | | | | | | | 5,010 | |
Other assets | | | | | | | 532 | |
Estimated adjustments to reflect liabilities at fair value: | | | | | | | | |
Deposits | | | | | | | (4 | ) |
Long-term debt | | | | | | | (18 | ) |
Other liabilities | | | | | | | (95 | ) |
Deferred taxes | | | | | | | | |
Related to new intangibles carrying value | | | (1,728 | ) | | | | |
Related to stock options | | | (40 | ) | | | | |
Related to all other adjustments | | | 214 | | | | | |
| | | | | | | | |
Total deferred tax adjustments | | | | | | | (1,554 | ) |
Estimated exit and transactions costs | | | | | | | (169 | ) |
| | | | | | | | |
Total net assets acquired and adjustment to fair value | | | | | | | 5,913 | |
| | | | | | | | |
Goodwill | | | | | | $ | 11,064 | |
| (a) | Certain amounts have been revised subsequent to July 1, 2007. |
92 The Bank of New York Mellon Corporation
NOTES TO CONSOLIDATED FINANCIAL STATEMENTS(continued)
Components of the fair value of acquired, identifiable intangible assets related to the acquisition of Mellon as of July 1, 2007 are as follows:
| | | | | |
| (in millions) | | Fair
value (a) | | Estimated
lives or
contract
terms |
Amortizing intangibles: | | | | | |
Asset and Wealth Management customer relationships | | $ | 1,815 | | 14 years |
Customer contracts in Institutional services | | | 711 | | 24 years |
Core deposits | | | 106 | | 5 years |
Non-compete agreements | | | 21 | | 6 years |
Indefinite-lived intangibles: | | | | | |
Mutual funds advisory contracts | | | 1,357 | | N/A |
Trade names | | | 1,000 | | N/A |
| | | | | |
Total | | $ | 5,010 | | |
| (a) | Certain amounts have been revised subsequent to July 1, 2007. |
The following condensed statement of net assets acquired reflects the fair value of Mellon’s net assets as of July 1, 2007.
| | | |
| Mellon’s net assets | | |
| (in millions) | | July 1, 2007 |
Assets | | | |
Cash and cash equivalents | | $ | 7,928 |
Securities | | | 18,397 |
Trading assets | | | 1,305 |
Loans, net of allowance | | | 6,840 |
Goodwill and other intangible assets | | | 16,074 |
All other assets | | | 6,249 |
Total assets | | $ | 56,793 |
Liabilities | | | |
Deposits | | $ | 28,990 |
Short-term borrowings | | | 1,943 |
All other liabilities | | | 4,566 |
Long-term debt | | | 4,317 |
Total liabilities | | $ | 39,816 |
Net assets acquired | | $ | 16,977 |
Other 2007 acquisitions
In addition to the previously discussed merger with Mellon, we acquired three businesses for a total cost of $635 million.
Goodwill and the tax-deductible portion of goodwill related to other 2007 acquisitions was $418 million and $7 million, respectively. We frequently structure our acquisitions with both an initial payment and a later contingent payment tied to post-closing revenue or income growth, and we record the fair value of
contingent payments as an additional cost of the entity acquired in the period that the payment becomes probable.
At Dec. 31, 2007, we are potentially obligated to pay additional consideration which, using reasonable assumptions for the performance of the acquired companies and joint ventures, could range from approximately $343 million to $483 million over the next four years. None of the potential contingent additional consideration was recorded as goodwill at Dec. 31, 2007. Cash paid or accrued for contingent payments was $56 million in 2007.
In December 2007, we completed the acquisition of ABN AMRO Mellon Global Securities Services B.V. (ABN AMRO Mellon). ABN AMRO Mellon, the 50-50 joint venture company, established by Mellon Bank N.A. and ABN AMRO in 2003 to provide global custody and related services to institutions outside North America, will now be known as BNY Mellon Asset Servicing B.V. and become a part of the asset servicing segment. The acquisition of BNY Mellon Asset Servicing B.V. added $1.0 billion of loans, $3.5 billion of money market assets and $4.5 billion of deposits. The impact of the acquisition on earnings per share is not expected to be material.
In January 2007, certain clearing and custody relationships rights were acquired by our Pershing subsidiary. The transaction involved 46 organizations, comprised of 30 registered investment advisor firms and 16 introducing broker-dealer firms.
In March 2007, we sold our 49% stake in joint venture BNY Mortgage Co. to EverBank Financial Corp. The transaction is consistent with our strategic moves to focus on asset management and securities servicing.
In June 2007, we sold our 30% equity investment in RBS International Securities Services (Holdings) Limited to BNP Paribas Securities Services.
In December 2007, we acquired the remaining 50% joint venture interest in PI Asset Management, an asset management firm that manages funds of hedge funds aimed at Japanese institutional investors.
In November 2007, we agreed to acquire ARX Capital Management, a leading independent asset management business headquartered in Rio de Janeiro, Brazil. ARX Capital Management specializes in Brazilian multi-strategy, long/short and long only investment strategies and has more than $2.8 billion in assets under management. In January 2008, we
The Bank of New York Mellon Corporation 93
NOTES TO CONSOLIDATED FINANCIAL STATEMENTS(continued)
completed the acquisition of ARX Capital Management. The transaction is a key development in our global growth and will enable us to offer clients access to expanding investment opportunities and expertise in the Brazilian marketplace.
2006 Acquisitions
During 2006, five businesses were acquired for a total cost of $2.557 billion. Goodwill and the tax-deductible portion of goodwill related to 2006 acquisitions was $1.782 billion and $1.641 billion, respectively. See below for a discussion of the business acquired in 2006.
Purchase of Acquired Corporate Trust Business and sale of Retail Business
On October 1, 2006, we sold our Retail Business to JPMorgan Chase for the net asset value plus a premium of $2.3 billion. JPMorgan Chase sold its corporate trust business to us for the net asset value plus a premium of $2.15 billion. The difference between premiums resulted in us receiving a net cash payment of $150 million. We may also receive a contingent payment of up to $50 million, tied to customer retention. We recorded an after-tax gain of $1.217 billion, revised (see Note 2 of Notes to Consolidated Financial Statements) on the sale of the Retail Business. For further details, see Note 5 of Notes to Consolidated Financial Statements.
On October 2, 2006, we completed the transaction resulting in the formation of BNY ConvergEx Group. BNY ConvergEx Group brought together BNY Securities Group’s trade execution, commission management, independent research and transition management business with Eze Castle Software, a leading provider of trade order management and related investment technologies.
BNY Mellon, as successor to The Bank of New York, and GTCR Golder Rauner, LLC each hold a 35.4% stake in BNY ConvergEx Group, with the balance held by Eze Castle Software’s investors and BNY ConvergEx Group’s management team.
In addition, our B-Trade and G-Trade businesses became part of the BNY ConvergEx Group on Feb. 1, 2008.
Other 2006 acquisitions/divestures
| | · | | In Jan. 2006, we acquired Alcentra Group Limited, an international asset management group. |
| | · | | In March 2006, we acquired Urdang Capital Management, Inc., a real estate investment firm. |
| | · | | In June 2006, we acquired the bond administration business of TD Banknorth, N.A. |
| | · | | In December 2006, we sold our transfer agency software business, Rufus, to Bravura Solutions Limited. |
| | · | | In December 2006, we acquired the remaining 50% stake in AIB/BNY Securities Services (Ireland) Ltd. |
Pro forma condensed combined financial information
On a pro forma basis, if the merger with Mellon and the acquisition of the Acquired Corporate Trust Business had occurred on Jan. 1, 2006, the transactions would have had the following impact:
| | | | | | | | | | | | |
(dollar amounts in millions,
except per share amounts) | | 2007 | | 2006 |
| | Reported | | Pro forma | | Reported | | Pro forma |
Revenue | | $ | 11,331 | | $ | 14,216 | | $ | 6,838 | | $ | 12,732 |
Income from continuing operations | | | 2,227 | | | 3,000 | | | 1,476 | | | 2,497 |
Net income | | | 2,039 | | | 2,815 | | | 2,847 | | | 2,463 |
Diluted earnings per share: | | | | | | | | | | | | |
Income from continuing operations | | $ | 2.38 | | $ | 2.63 | | $ | 2.04 | | $ | 2.20 |
Net income | | | 2.18 | | | 2.46 | | | 3.94 | | | 2.17 |
The pro forma results are based on adding the pre-tax historical results of Mellon and the Acquired Corporate Trust Business to our results and primarily adjusting for amortization of intangibles created in the transaction and taxes. The pro forma data does not include adjustments to reflect our operating costs or expected differences in the way funds generated by the Acquired Corporate Trust Business are invested. The pro forma data is intended for informational purposes and is not indicative of the future results of operations.
5. Discontinued operations
On Oct. 1, 2006, we acquired JPMorgan Chase’s corporate trust business and JPMorgan Chase acquired our Retail Business. We adopted discontinued operations accounting for our Retail Business. The results from continuing operations exclude the results of our Retail Business and include the operations of the Acquired Corporate Trust Business only after Oct. 1, 2006.
94 The Bank of New York Mellon Corporation
NOTES TO CONSOLIDATED FINANCIAL STATEMENTS(continued)
In accordance with the generally accepted accounting principles (GAAP), results for all the Retail Business are reported separately as discontinued operations for all periods presented. The assets and liabilities of the businesses sold are included in assets of discontinued operations and liabilities of discontinued operations on the consolidated balance sheet. Net interest revenue has been computed by allocating investment securities and federal funds sold and related interest income to discontinued operations to match the amount and duration of the assets sold with the amount and duration of the liabilities sold. In addition, certain residual activity from businesses that Mellon had reported as discontinued operations prior to the merger are also included as discontinued operations after July 2007.
Assets and liabilities of discontinued operations as of Dec. 31, 2007 and Dec. 31, 2006 were not significant.
Summarized financial information for discontinued operations is as follows:
| | | | | | | | | | | |
| Discontinued operations(a) | | | | | Legacy The Bank
of New York only |
| (in millions) | | 2007 | | | 2006 | | | 2005 |
Fee and other revenue | | $ | 16 | | | $ | 2,372 | (b) | | $ | 258 |
Net interest revenue | | | - | | | | 457 | | | | 569 |
Total revenue | | $ | 16 | | | $ | 2,829 | | | $ | 827 |
Income (loss) from discontinued operations | | $ | (16 | ) | | $ | 2,426 | | | $ | 389 |
Income taxes (benefits) | | | (8 | ) | | | 1,055 | (c) | | | 161 |
Income (loss) from discontinued operations, net of taxes | | $ | (8 | ) | | $ | 1,371 | (c) | | $ | 228 |
| (a) | Results for 2007 include six months of the combined Company’s results and six months of legacy The Bank of New York only. All other periods reflect legacy The Bank of New York only. |
| (b) | Including the $2.159 billion pre-tax gain on the sale of the Retail Business. |
| (c) | Revised, See Note 2 of Notes to Consolidated Financial Statements. |
6. Goodwill and Intangibles
Goodwill
The level of goodwill increased in 2007 due to the merger with Mellon, the acquisition of the remaining 50% interest in ABN AMRO Mellon, other smaller acquisitions as well as additional consideration paid for prior acquisitions, and the effect of foreign exchange rates on non-U.S. dollar denominated goodwill. The following table shows the changes to goodwill, by business sector for 2007:
| | | | | | | | | | | | |
Goodwill (in millions) | | Asset and
Wealth
Management | | | Institutional
Services | | | Total | |
Balance at Dec. 31, 2006 (Revised See Note 2)(a) | | $ | 605 | | | $ | 4,403 | | | $ | 5,008 | |
Mellon | | | 8,815 | | | | 2,278 | | | | 11,093 | |
Other acquisitions | | | 7 | | | | 411 | | | | 418 | |
Foreign exchange translation | | | (39 | ) | | | 7 | | | | (32 | ) |
Other(b) | | | 28 | | | | (184 | ) | | | (156 | ) |
Balance at Dec. 31, 2007 | | $ | 9,416 | | | $ | 6,915 | | | $ | 16,331 | |
| (a) | Legacy The Bank of New York only. Revised, see Note 2 of Notes to Consolidated Financial Statements. |
| (b) | Other changes in goodwill include purchase price adjustments and certain other reclassifications. |
The Bank of New York Mellon Corporation 95
NOTES TO CONSOLIDATED FINANCIAL STATEMENTS(continued)
The table below provides a further breakdown of goodwill by business segment. Goodwill impairment testing is performed annually at the business segment level. No impairment losses were recorded in 2007 and 2006.
| | | | | | | | | | | | | | | | | | | | | | | | | | |
Goodwill by segment (in millions) | | Asset
Management | | | Wealth
Management | | Asset
Servicing | | | Issuer
Services | | | Clearing & Execution
Services | | | Treasury
Services | | Total | |
Balance at Dec. 31, 2006(a) | | $ | 571 | | | $ | 34 | | $ | 912 | | | $ | 2,328 | | | $ | 1,132 | | | $ | 31 | | $ | 5,008 | |
Mellon | | | 6,513 | | | | 2,302 | | | 2,027 | | | | 190 | | | | - | | | | 61 | | | 11,093 | |
Other acquisitions | | | 7 | | | | - | | | 411 | | | | - | | | | - | | | | - | | | 418 | |
Foreign exchange translation | | | (39 | ) | | | - | | | 5 | | | | - | | | | 2 | | | | - | | | (32 | ) |
Other(b) | | | 2 | | | | 26 | | | (64 | ) | | | (105 | ) | | | (15 | ) | | | - | | | (156 | ) |
Balance at Dec. 31, 2007 | | $ | 7,054 | | | $ | 2,362 | | $ | 3,291 | | | $ | 2,413 | | | $ | 1,119 | | | $ | 92 | | $ | 16,331 | |
| (a) | Legacy The Bank of New York only. Revised, see Note 2 of Notes to Consolidated Financial Statements. |
| (b) | Other changes in goodwill include purchase price adjustments and certain other reclassifications. |
Intangible assets
Intangible assets not subject to amortization are tested annually for impairment or more often if events or circumstances indicate they may be impaired. The increase in intangible assets in 2007 compared with
2006 resulted from the merger with Mellon. No impairment losses were recorded on intangible assets in 2007 or 2006.
| | | | | | | | | | | | | | | | | | | | | | | | | |
| Intangible assets | | Dec. 31, 2007 | | Dec. 31, 2006(a) |
| (in millions) | | Gross
carrying
amount (a) | | Acquisitions (b) | | Accumulated
amortization | | | Net
carrying
amount | | Remaining
weighted
average
amortization
period | | Gross
carrying
amount | | Accumulated
amortization | | | Net
carrying
amount |
Subject to amortization: | | | | | | | | | | | | | | | | | | | | | | | | | |
Customer contracts- Institutional services | | $ | 1,301 | | $ | 738 | | $ | (263 | ) | | $ | 1,776 | | 16 yrs. | | $ | 1,138 | | $ | (136 | ) | | $ | 1,002 |
Customer relationships-Asset and Wealth Management | | | 93 | | | 1,840 | | | (175 | ) | | | 1,758 | | 13 yrs. | | | 93 | | | (12 | ) | | | 81 |
Deposit premiums | | | - | | | 106 | | | (24 | ) | | | 82 | | 4 yrs. | | | - | | | - | | | | - |
Other | | | 17 | | | 47 | | | (2 | ) | | | 62 | | 7 yrs. | | | 17 | | | (17 | ) | | | - |
Total subject to amortization | | $ | 1,411 | | $ | 2,731 | | $ | (464 | ) | | $ | 3,678 | | 14 yrs. | | $ | 1,248 | | $ | (165 | ) | | $ | 1,083 |
Not subject to amortization(c) | | | | | | | | | | | | | | | | | | | | | | | | | |
Trade name | | $ | 370 | | $ | 999 | | | N/A | | | $ | 1,369 | | N/A | | $ | 370 | | | N/A | | | $ | 370 |
Mutual fund advisory contracts | | | - | | | 1,355 | | | N/A | | | | 1,355 | | N/A | | | - | | | N/A | | | | - |
Total not subject to amortization | | $ | 370 | | $ | 2,354 | | | N/A | | | $ | 2,724 | | N/A | | $ | 370 | | | N/A | | | $ | 370 |
Total intangible assets | | $ | 1,781 | | $ | 5,085 | | $ | (464 | ) | | $ | 6,402 | | N/A | | $ | 1,618 | | $ | (165 | ) | | $ | 1,453 |
| (a) | Legacy The Bank of New York only. |
| (b) | See Note 4 of Notes to Consolidated Financial Statement for the impact of the Mellon merger. |
| (c) | Intangible assets not subject to amortization have an indefinite life. |
| | | | | | | | | | | | | | | | | | | | | |
Intangible assets – net carrying
amount by segment (in millions) | | Asset
Management | | Wealth
Management | | Asset
Servicing | | Issuer
Services | | Clearing
&
Execution
Services | | Treasury
Services | | Total |
Legacy The Bank of New York | | $ | 68 | | $ | 1 | | $ | 23 | | $ | 719 | | $ | 710 | | $ | - | | $ | 1,521 |
Mellon | | | 3,296 | | | 642 | | | 434 | | | 200 | | | - | | | 261 | | | 4,833 |
Other acquisitions | | | - | | | - | | | 48 | | | - | | | - | | | - | | | 48 |
Net carrying amount at Dec. 31, 2007 | | $ | 3,364 | | $ | 643 | | $ | 505 | | $ | 919 | | $ | 710 | | $ | 261 | | $ | 6,402 |
96 The Bank of New York Mellon Corporation
NOTES TO CONSOLIDATED FINANCIAL STATEMENTS(continued)
Intangible amortization expense was $319 million, $76 million and $40 million for 2007, 2006 and 2005. The increase compared with both prior periods resulted from the merger with Mellon. The impact of intangible amortization expense and purchase accounting adjustments, in 2007, related to the merger with Mellon was $123 million pre-tax or $81 million after-tax.
Estimated annual amortization expense for current intangibles for the next five years is as follows:
| | | |
For the year ended Dec. 31, | | Estimated amortization
expense (in millions) |
2008 | | $ | 469 |
2009 | | | 422 |
2010 | | | 381 |
2011 | | | 350 |
2012 | | | 320 |
7. Securities
The following table sets forth the amortized cost and the fair values of securities at the end of the last two years. At Dec. 31, 2007, securities issued by U.S. Government sponsored enterprises exceed 10% of shareholders’ equity. At Dec. 31, 2007, there were no other issuers that exceeded 10% of shareholders’ equity.
| | | | | | | | | | | | | | | | | | | | | | | | |
| Securities | | | | Legacy The Bank of New York only |
| | | Dec. 31, 2007 | | Dec. 31, 2006 |
| (in millions) | | Amortized
cost | | Gross
unrealized | | Fair
value | | Amortized
cost | | Gross
unrealized | | Fair
value |
| | | Gains | | Losses | | | | Gains | | Losses | |
Available-for-sale: | | | | | | | | | | | | | | | | | | | | | | | | |
U.S. Government obligations | | $ | 436 | | $ | 2 | | $ | - | | $ | 438 | | $ | 86 | | $ | - | | $ | - | | $ | 86 |
U.S. Government agency obligations | | | 777 | | | 1 | | | - | | | 778 | | | 554 | | | - | | | - | | | 554 |
Obligations of states and political subdivisions | | | 474 | | | 4 | | | - | | | 478 | | | 85 | | | 3 | | | - | | | 88 |
Mortgage-backed securities | | | 41,254 | | | 153 | | | 605 | | | 40,802 | | | 16,315 | | | 60 | | | 66 | | | 16,309 |
Asset-backed securities | | | 2,328 | | | 24 | | | 131 | | | 2,221 | | | 468 | | | 3 | | | 7 | | | 464 |
Equity securities | | | 505 | | | 11 | | | 7 | | | 509 | | | 1,073 | | | 5 | | | - | | | 1,078 |
Other debt securities | | | 1,345 | | | 2 | | | 55 | | | 1,292 | | | 796 | | | 2 | | | - | | | 798 |
Total securities available for sale | | | 47,119 | | | 197 | | | 798 | | | 46,518 | | | 19,377 | | | 73 | | | 73 | | | 19,377 |
Held-to-maturity: | | | | | | | | | | | | | | | | | | | | | | | | |
U.S. Government obligations | | | - | | | - | | | - | | | - | | | - | | | - | | | - | | | - |
U.S. Government agency obligations | | | - | | | - | | | - | | | - | | | 120 | | | - | | | 1 | | | 119 |
Obligations of states and political subdivisions | | | 241 | | | 2 | | | - | | | 243 | | | - | | | - | | | - | | | - |
Mortgage-backed securities | | | 1,921 | | | 13 | | | 24 | | | 1,910 | | | 1,492 | | | 1 | | | 17 | | | 1,476 |
Asset-backed securities | | | - | | | - | | | - | | | - | | | - | | | - | | | - | | | - |
Emerging markets | | | - | | | - | | | - | | | - | | | 117 | | | - | | | 2 | | | 115 |
Other debt securities | | | 16 | | | - | | | - | | | 16 | | | - | | | - | | | - | | | - |
Other equity securities | | | 2 | | | - | | | - | | | 2 | | | - | | | - | | | - | | | - |
Total securities held-to-maturity | | | 2,180 | | | 15 | | | 24 | | | 2,171 | | | 1,729 | | | 1 | | | 20 | | | 1,710 |
Total securities | | $ | 49,299 | | $ | 212 | | $ | 822 | | $ | 48,689 | | $ | 21,106 | | $ | 74 | | $ | 93 | | $ | 21,087 |
At Dec. 31, 2007, the majority of unrealized losses are attributable to changes in interest rates on investment grade securities. The portion of unrealized losses that are not attributable to interest rates are attributable to
prevailing market spreads and are expected to be recovered. We have the ability and intent to hold these securities until their value recovers. We believe that all of our unrealized losses are temporary in nature.
The Bank of New York Mellon Corporation 97
NOTES TO CONSOLIDATED FINANCIAL STATEMENTS(continued)
Temporarily impaired securities
The following tables show the aggregate related fair value of investments with a continuous unrealized loss
position for less than 12 months and those that have been in a continuous unrealized loss position for greater than twelve months.
| | | | | | | | | | | | | | | | | | |
| Temporarily impaired securities | | Less than 12 months | | 12 months or more | | Total |
| | Fair
value | | Unrealized
losses | | Fair
value | | Unrealized
losses | | Fair
value | | Unrealized
losses |
| (in millions) | | | | | | |
Dec. 31, 2007: | | | | | | | | | | | | | | | | | | |
Mortgage-backed securities | | $ | 17,591 | | $ | 416 | | $ | 10,673 | | $ | 213 | | $ | 28,264 | | $ | 629 |
Asset-backed securities | | | 144 | | | 37 | | | 454 | | | 94 | | | 598 | | | 131 |
Other debt securities | | | 396 | | | 55 | | | - | | | - | | | 396 | | | 55 |
Equity securities | | | 19 | | | 6 | | | 19 | | | 1 | | | 38 | | | 7 |
Total temporarily impaired securities | | $ | 18,150 | | $ | 514 | | $ | 11,146 | | $ | 308 | | $ | 29,296 | | $ | 822 |
Dec. 31, 2006: | | | | | | | | | | | | | | | | | | |
U.S. Government agency obligations | | $ | - | | $ | - | | $ | 119 | | $ | 1 | | $ | 119 | | $ | 1 |
Mortgage-backed securities | | | 5,429 | | | 21 | | | 4,003 | | | 62 | | | 9,432 | | | 83 |
Asset-backed securities | | | 224 | | | 7 | | | - | | | - | | | 224 | | | 7 |
Emerging markets | | | 110 | | | 2 | | | - | | | - | | | 110 | | | 2 |
Total temporarily impaired securities | | $ | 5,763 | | $ | 30 | | $ | 4,122 | | $ | 63 | | $ | 9,885 | | $ | 93 |
The amortized cost and fair values of securities at Dec. 31, 2007, by contractual maturity, are as follows:
| | | | | | | | | | | | |
| Securities by contractual maturity at Dec. 31, 2007 | | Available for sale | | Held to maturity |
| (in millions) | | Amortized
cost | | Fair
value | | Amortized
cost | | Fair
value |
Due in one year or less | | $ | 1,266 | | $ | 1,244 | | $ | - | | $ | - |
Due after one year through five years | | | 395 | | | 393 | | | 19 | | | 19 |
Due after five years through ten years | | | 217 | | | 220 | | | 15 | | | 15 |
Due after ten years | | | 1,154 | | | 1,129 | | | 222 | | | 224 |
Mortgage-backed securites | | | 41,254 | | | 40,802 | | | 1,922 | | | 1,911 |
Asset-backed securities | | | 2,328 | | | 2,221 | | | - | | | - |
Equity securities | | | 505 | | | 509 | | | 2 | | | 2 |
Total securities | | $ | 47,119 | | $ | 46,518 | | $ | 2,180 | | $ | 2,171 |
Realized gross gains on the sale of securities available-for-sale were $29 million in 2007 and $81 million in 2006. There were $230 million of realized gross losses in 2007 and $79 million of realized gross losses in 2006. In 2007, we recorded a $200 million (pre-tax) loss for other than temporary impairment, on $379 million of CDOs that contained subprime exposure.
At Dec. 31, 2007, assets amounting to $34.2 billion were pledged primarily for potential borrowing at the Federal Reserve Discount Window. The significant components of pledged assets were as follows: $29.9 billion were securities and $4.3 billion were loans. Included in these pledged assets was securities available-for-sale of $750 million which were pledged as collateral for actual borrowings. The lenders in these borrowings have the right to repledge or sell these securities. We obtain securities under resale, securities borrowed and custody agreements on terms which permit us to repledge or resell the securities to others. As of Dec. 31, 2007, the market value of the securities received that can be sold or repledged was
$29.5 billion. We routinely repledge or lend these securities to third parties. As of Dec. 31, 2007, the market value of collateral repledged and sold was $311 million.
8. Loans
For details of our loan distribution and industry concentrations of credit risk at Dec. 31, 2007 and 2006, see the “Loans by product” table on page 42, which is incorporated by reference into these Notes to Consolidated Financial Statements.
In the ordinary course of business, we and our banking subsidiaries have made loans at prevailing interest rates and terms to our directors and executive officers and to entities in which certain of our directors have an ownership interest or direct or indirect subsidiaries of such entities. The aggregate amount of these loans was $35 million, $211 million, and $244 million at Dec. 31, 2007, 2006, and 2005, respectively. These loans are primarily extensions of credit under revolving lines of credit established for such entities.
98 The Bank of New York Mellon Corporation
NOTES TO CONSOLIDATED FINANCIAL STATEMENTS(continued)
The composition of our loan portfolio is shown in the following table:
| | | | | | | | |
| Composition of loan portfolio | | Dec. 31 | |
| (in millions) | | 2007 | | | 2006(a) | |
Commercial | | $ | 7,466 | | | $ | 5,925 | |
Real estate | | | 6,220 | | | | 4,521 | |
Wealth loans | | | 4,196 | | | | 266 | |
Lease financings | | | 4,967 | | | | 5,498 | |
Banks and other financial institutions | | | 12,677 | | | | 7,844 | |
Loans for purchasing or carrying securities | | | 6,208 | | | | 7,114 | |
Margin loans | | | 5,210 | | | | 5,167 | |
Government and official institutions | | | 312 | | | | 9 | |
Other | | | 3,675 | | | | 1,449 | |
Less: Allowance for loan losses | | | (327 | ) | | | (287 | ) |
Total loans | | $ | 50,604 | | | $ | 37,506 | |
| (a) | Legacy The Bank of New York only. |
Transactions in the allowance for credit losses are summarized as follows:
| | | | | | | | | | | | |
Allowance for credit
losses | | Allowance
for loan
losses | | | Allowance
for lending-
related
commitments | | | Allowance
for credit
losses | |
| (in millions) | | | |
Balance at Dec. 31, 2004(a) | | $ | 491 | | | $ | 136 | | | $ | 627 | |
Charge-offs | | | (154 | ) | | | - | | | | (154 | ) |
Recoveries | | | 4 | | | | - | | | | 4 | |
Net charge-offs | | | (150 | ) | | | - | | | | (150 | ) |
Provision | | | (15 | ) | | | 8 | | | | (7 | ) |
Balance at Dec. 31, 2005(a) | | $ | 326 | | | $ | 144 | | | $ | 470 | |
Charge-offs | | | (29 | ) | | | - | | | | (29 | ) |
Recoveries | | | 16 | | | | - | | | | 16 | |
Net charge-offs | | | (13 | ) | | | - | | | | (13 | ) |
Provision | | | (26 | ) | | | 6 | | | | (20 | ) |
Balance at Dec. 31, 2006(a) | | $ | 287 | | | $ | 150 | | | $ | 437 | |
Additions resulting from merger with Mellon | | | 43 | | | | 87 | | | | 130 | |
Charge-offs(b) | | | (72 | ) | | | (6 | ) | | | (78 | ) |
Recoveries(b) | | | 15 | | | | - | | | | 15 | |
Net charge-offs | | | (57 | ) | | | (6 | ) | | | (63 | ) |
Provision(b) | | | 54 | | | | (64 | ) | | | (10 | ) |
Balance at Dec. 31, 2007 | | $ | 327 | | | $ | 167 | | | $ | 494 | |
| (a) | Legacy The Bank of New York only. |
| (b) | Includes six months of the combined Company’s results and six months of legacy The Bank of New York only. |
The table below sets forth information about our nonperforming assets and impaired loans.
| | | | | | | | | |
| Nonperforming assets | | | | Legacy The Bank of
New York only |
| | | Dec. 31, |
| (in millions) | | 2007 | | 2006 | | 2005 |
Loans: | | | | | | | | | |
Commercial | | $ | 79 | | $ | 26 | | $ | 12 |
Residential real estate | | | 20 | | | 2 | | | 1 |
Total domestic | | | 99 | | | 28 | | | 13 |
Foreign | | | 87 | | | 9 | | | 13 |
Total nonperforming loans | | | 186 | | | 37 | | | 26 |
Other assets owned | | | 4 | | | 1 | | | 13 |
Total nonperforming assets | | $ | 190 | | $ | 38 | | $ | 39 |
Impaired loans with an allowance | | $ | 141 | | $ | 8 | | $ | 17 |
Impaired loans without an allowance(a) | | | 17 | | | 19 | | | - |
Total impaired loans | | $ | 158 | | $ | 27 | | $ | 17 |
Allowance for impaired loans (b) | | $ | 34 | | $ | 1 | | $ | 5 |
Average balance of impaired loans during the year | | | 27 | | | 41 | | | 101 |
Interest income recognized on impaired loans during the year | | | - | | | 2 | | | 3 |
| (a) | When the discounted cash flows, collateral value or market price equals or exceeds the carrying value of the loan, then the loan does not require an allowance under the accounting standard related to impaired loans. |
| (b) | The allowance for impaired loans is included in the allowance for loan losses. |
| | | | | | | | | |
| Past due loans at year-end | | | | Legacy The Bank of
New York only |
| (in millions) | | 2007 | | 2006 | | 2005 |
Domestic: | | | | | | | | | |
Consumer | | $ | - | | $ | 9 | | $ | 2 |
Commercial | | | 343 | | | 7 | | | 7 |
Total domestic | | | 343 | | | 16 | | | 9 |
Foreign Banks | | | - | | | - | | | - |
Total past due loans | | $ | 343 | | | 16 | | $ | 9 |
| | | | | | | | | |
| Lost interest | | | | Legacy The Bank of
New York only |
| (in millions) | | 2007 | | 2006 | | 2005 |
Amount by which interest income recognized on nonperforming loans exceeded reversals: | | | | | | | | | |
Total | | $ | 1 | | $ | 1 | | $ | - |
Foreign | | | - | | | - | | | - |
Amount by which interest income would have increased if nonperforming loans at year-end had been performing for the entire year: | | | | | | | | | |
Total | | | 6 | | | 1 | | | 1 |
Foreign | | | 2 | | | - | | | - |
The Bank of New York Mellon Corporation 99
NOTES TO CONSOLIDATED FINANCIAL STATEMENTS(continued)
At Dec. 31, 2007, commitments to borrowers whose loans were classified as nonaccrual or reduced rate were not material.
We use the discounted cash flow method as the primary method for valuing impaired loans.
9. Other assets
| | | | | | | |
| Other assets | | Dec. 31, |
| (in millions) | | 2007 | | | 2006 (a) |
Accounts and interest receivable | | $ | 4,889 | | | $ | 3,443 |
Corporate/bank owned life insurance | | | 3,599 | | | | 1,721 |
Equity in joint ventures and other investments | | | 2,400 | (b) | | | 857 |
Prepaid pension assets | | | 1,657 | | | | 635 |
Fails to deliver | | | 1,650 | | | | 1,523 |
Software | | | 519 | | | | 388 |
Margin deposits | | | 511 | | | | 324 |
Prepaid expenses | | | 329 | | | | 223 |
Due from customers on acceptances | | | 81 | | | | 213 |
Other | | | 1,041 | | | | 646 |
Total other assets | | $ | 16,676 | | | $ | 9,973 |
| (a) | Legacy The Bank of New York only. |
| (b) | Includes Federal Reserve Bank stock of $366 million, at cost. |
10. Deposits
The aggregate amount of time deposits in denominations of $100,000 or greater was approximately $43.4 billion at Dec. 31, 2007 and $31.8 billion at Dec. 31, 2006. At Dec. 31, 2007, the scheduled maturities of all time deposits for the years 2008 through 2012 and 2013 and thereafter are as follows: $41.944 billion; $828 million; $402 million; $15 million; $0.1 million; and $175 million, respectively.
11. Other fee and other revenue and noninterest expense
In 2007, other fee and other revenues included $58 million of expense reimbursement from joint ventures, $41 million of net economic value payments related to the Acquired Corporate Trust Business, and a $28 million settlement received for early termination of a contract with a clearing business. In 2006, other fee and other revenue included a pre-tax gain of $35 million related to the conversion of our New York Stock Exchange seats into cash and shares of NYSE Group, Inc. common stock, some of which were sold. In 2005, other fee and other revenue included a $17 million gain on the sale of our interest in Financial Models Companies, Inc. In 2007, other noninterest expense included personnel related, postage, forms and supplies and joint venture pass-through expenses of $211 million, as well as a $32 million write-off of the remaining interest in a hedge fund manager and a $17 million loss related to SIV securities purchased
from a commingled NAV fund. The commingled NAV fund is managed to the specifications of a money market fund. In 2006, other noninterest expense included a $22 million transition services expense related to the Acquired Corporate Trust Business.
Other fee and other revenue includes equity in earnings of unconsolidated subsidiaries of $56 million, $47 million and $39 million in 2007, 2006 and 2005.
12. Net interest revenue
| | | | | | | | | |
| Net interest revenue | | | | Legacy The Bank
of New York only |
| | | Year ended Dec. 31, |
| (in millions) | | 2007 | | 2006 | | 2005 |
Interest revenue | | | | | | | | | |
Non-margin loans | | $ | 1,884 | | $ | 1,449 | | $ | 1,045 |
Margin loans | | | 332 | | | 330 | | | 267 |
Securities: | | | | | | | | | |
Taxable | | | 1,887 | | | 1,101 | | | 823 |
Exempt from federal income taxes | | | 18 | | | 29 | | | 38 |
Total securities | | | 1,905 | | | 1,130 | | | 861 |
Deposits in banks | | | 1,242 | | | 538 | | | 274 |
Federal funds sold and securities purchased under resale agreements | | | 290 | | | 130 | | | 70 |
Trading assets | | | 98 | | | 163 | | | 152 |
Total interest revenue | | | 5,751 | | | 3,740 | | | 2,669 |
Interest expense | | | | | | | | | |
Deposits in domestic offices | | | 577 | | | 387 | | | 237 |
Deposits in foreign offices | | | 1,812 | | | 1,047 | | | 602 |
Federal funds purchased and securities sold under repurchase agreements | | | 125 | | | 104 | | | 35 |
Other borrowed funds | | | 91 | | | 100 | | | 58 |
Customer payables | | | 177 | | | 167 | | | 128 |
Long-term debt | | | 669 | | | 436 | | | 269 |
Total interest expense | | | 3,451 | | | 2,241 | | | 1,329 |
Net interest revenue | | $ | 2,300 | | $ | 1,499 | | $ | 1,340 |
13. Income taxes
| | | | | | | | | | | | |
Provision for income taxes
from continuing operations | | | | | Legacy The Bank
of New York only | |
| | | Year ended Dec. 31, | |
| (in millions) | | 2007 | | | 2006 | | | 2005 | |
Current taxes: | | | | | | | | | | | | |
Federal | | $ | 801 | | | $ | (30 | ) | | $ | 437 | |
Foreign | | | 237 | | | | 232 | | | | 198 | |
State and local | | | 108 | | | | 94 | | | | 55 | |
Total current tax expense | | | 1,146 | | | | 296 | | | | 690 | |
Deferred taxes: | | | | | | | | | | | | |
Federal | | | (99 | ) | | | 425 | | | | (96 | ) |
Foreign | | | (9 | ) | | | - | | | | - | |
State and local | | | (40 | ) | | | (27 | ) | | | 41 | |
Total deferred tax expense (benefit) | | | (148 | ) | | | 398 | | | | (55 | ) |
Provision for income taxes | | $ | 998 | | | $ | 694 | | | $ | 635 | |
100 The Bank of New York Mellon Corporation
NOTES TO CONSOLIDATED FINANCIAL STATEMENTS(continued)
The components of income before taxes are as follows:
| | | | | | | | | |
Components of income before
taxes | | | | Legacy The Bank
of New York only |
| (in millions) | | 2007 | | 2006 | | 2005 |
Domestic | | $ | 2,154 | | $ | 1,582 | | $ | 1,712 |
Foreign | | | 1,071 | | | 588 | | | 266 |
Income before taxes | | $ | 3,225 | | $ | 2,170 | | $ | 1,978 |
The components of our net deferred tax liability (included in accrued taxes and other expenses) at Dec. 31 are as follows:
| | | | | | | | | | | | |
| Net deferred tax liability | | | | | Legacy The Bank
of New York only | |
| (in millions) | | 2007 | | | 2006 | | | 2005 | |
Lease financings | | $ | 3,010 | | | $ | 3,298 | | | $ | 3,202 | |
Depreciation and amortization | | | 2,645 | | | | 757 | | | | 549 | |
Pension obligations | | | 609 | | | | 237 | | | | 373 | |
Securities valuation | | | (193 | ) | | | 92 | | | | 31 | |
Credit losses on loans | | | (221 | ) | | | (201 | ) | | | (251 | ) |
Tax credit carryovers | | | (404 | ) | | | (286 | ) | | | (390 | ) |
Net operating loss carryover | | | (485 | ) | | | (323 | ) | | | (285 | ) |
Reserves not deducted for tax | | | (905 | ) | | | (175 | ) | | | (118 | ) |
Other assets | | | (478 | ) | | | (175 | ) | | | (190 | ) |
Other liabilities | | | 438 | | | | 248 | | | | 187 | |
Net deferred tax liability | | $ | 4,016 | | | $ | 3,472 | | | $ | 3,108 | |
We recorded foreign tax credit carryovers of $346 million, a portion of which will begin to expire in 2012, and general business credit carryovers of $58 million which begin to expire in 2023. We have federal net operating loss carryovers of $1.386 billion (for which we have recorded a $485 million tax benefit) related to a separate filing of a group of certain leasing subsidiaries which begin to expire in 2023. We have not recorded a valuation allowance because we expect to realize our deferred tax assets including these carryovers.
As of Dec. 31, 2007, we had approximately $959 million of earnings attributable to foreign subsidiaries that have been permanently reinvested abroad and for which no provision has been recorded for income tax that would occur if repatriated. It is not practicable at this time to determine the income tax liability that would result upon repatriation of these earnings.
The statutory federal income tax rate is reconciled to our effective income tax rate below:
| | | | | | | | | |
| Effective tax rate | | | | | Legacy The Bank
of New York only | |
| | | 2007 | | | 2006 | | | 2005 | |
Federal rate | | 35.0 | % | | 35.0 | % | | 35.0 | % |
State and local income taxes, net of federal income tax benefit | | 1.3 | | | 2.0 | | | 2.7 | |
Credit for synthetic fuel investments | | (0.7 | ) | | (1.8 | ) | | (2.5 | ) |
Credit for low-income housing investments | | (1.0 | ) | | (1.7 | ) | | (1.8 | ) |
Tax-exempt income | | (1.6 | ) | | (1.4 | ) | | (1.5 | ) |
Foreign operations | | (3.2 | ) | | (0.7 | ) | | (0.4 | ) |
Other – net | | 1.2 | | | 0.6 | | | 0.6 | |
Effective rate | | 31.0 | % | | 32.0 | % | | 32.1 | % |
| | | | |
| FIN 48 Unrecognized tax positions | | | |
| (in millions) | | 2007 | |
Gross balance at Jan. 1, 2007 | | $ | 842 | |
Unrecognized tax benefits acquired July 1, 2007 | | | 44 | |
Prior period tax positions | | | | |
Increases | | | 91 | |
Decreases | | | (5 | ) |
Current period tax positions | | | 5 | |
Settlements | | | - | |
Statute expiration | | | - | |
Gross balance at Dec. 31, 2007 | | $ | 977 | |
Amount affecting effective tax rate if recognized | | $ | 170 | |
We adopted the provisions of FASB Interpretation No. 48 (“FIN 48”), “Accounting for Uncertainty in Income Taxes – an interpretation of FASB Statement No. 109,” on Jan. 1, 2007. As a result of the adoption of FIN 48, we recognized a $27 million increase in our liability for uncertain tax benefits (“Tax Reserves”), which reduced the Jan. 1, 2007 retained earnings balance. We recognize accrued interest and penalties, if applicable, related to income taxes in income tax expense. Included in the statement of financial position as of Dec. 31, 2007 is accrued interest, where applicable, of $233 million. The additional tax expense related to interest for 2007 is $77 million.
BNY Mellon’s federal consolidated income tax returns are closed to examination through 1995. Although the IRS has completed its examination for 1996 and 1997, at this time, a formal revenue agent’s report has not been received. We believe it is unlikely that there will be any changes to those years that would affect the Tax Reserves. The IRS is currently examining our consolidated income tax returns for tax years 1998 through 2002. Our New York State and New York City
The Bank of New York Mellon Corporation 101
NOTES TO CONSOLIDATED FINANCIAL STATEMENTS(continued)
return examinations have been completed through 1993. New York State and New York City are currently examining our tax returns for the years 1994 through 1996. Our United Kingdom income tax returns are closed through 1998. Although the UK tax authorities have completed their examination for the period from 1999 through 2004, at this time, a formal report has not been received. We believe it is unlikely that there will be any changes to those years that would materially affect the Tax Reserves.
We have Tax Reserves related to transactions occurring in the years 1998 through 2002 that are currently under examination by the IRS. We believe that over the next 12 months, it is reasonably possible that the unrecognized tax benefits associated with the IRS examination of our LILO transactions will be settled. (See discussion of FSP FAS 13-2 in Note 3 of Notes to Consolidated Financial Statements.) We do not expect that the resolution of this and other issues over the next 12 months will have a material impact on our financial statements.
14. Extraordinary (loss) – Consolidation of Three Rivers Funding Corporation (“TRFC”)
Mellon Bank, N.A. has a referral relationship with and provides administrative services to TRFC. On Dec. 31, 2007, we called the first loss notes of TRFC, making us the primary beneficiary and triggering the consolidation of TRFC. The consolidation resulted in the recognition of an extraordinary (loss) (non-cash accounting charge) of $180 million, net of a tax benefit of $122 million. The extraordinary (loss) represents the mark to market discount from par at Dec. 31, 2007, associated with spread widening for the assets in TRFC. The diluted earnings per share impact of the extraordinary (loss) was $0.19 per share.
In addition to the extraordinary (loss), the size of the Dec. 31, 2007 balance sheet increased by the full amount of third party commercial paper funding previously issued by TRFC of approximately $4.0 billion. At Dec. 31, 2007, we held $136 million of TRFC’s commercial paper, which was eliminated upon consolidation.
15. Long-term debt
| | | | | | | | | | | | | | |
| Long-term debt | | At Dec. 31, 2007 | | Dec. 31, 2006 |
| (in millions) | | Rate | | | Maturity | | Amount | | Rate | | | Amount |
Senior debt | | | | | | | | | | | | | | |
Fixed rate | | 3.25-6.38 | % | | 2008-2019 | | $ | 4,452 | | 3.63-5.20 | % | | $ | 2,106 |
Floating rate | | 4.83-5.59 | % | | 2008-2038 | | | 4,305 | | 5.17-5.41 | % | | | 1,781 |
Subordinated debt(a) | | 3.27-7.40 | % | | 2008-2033 | | | 6,050 | | 3.27-7.40 | % | | | 3,701 |
Junior subordinated debentures(a) | | 5.95-7.97 | % | | 2008-2043 | | | 2,066 | | 5.95-7.97 | % | | | 1,185 |
Total | | | | | | | $ | 16,873 | | | | | $ | 8,773 |
The aggregate amounts of notes and debentures that mature during the five years 2008 through 2012 for BNY Mellon are as follows: $3.300 billion, $1.225 billion, $950 million, $1.394 billion and $2.850 billion. At Dec. 31, 2007, subordinated debt aggregating $1.432 billion was redeemable at our option as follows: $626 million in 2008; $237 million in 2009; and $569 million after 2009. We have $400 million of subordinated debt that is fixed at 3.40% until 2008 when it becomes variable. We intend to call this debt in the first quarter of 2008.
Junior subordinated debentures
Wholly owned subsidiaries of BNY Mellon (the “Trusts”) have issued cumulative Company- Obligated Mandatory Redeemable Trust Preferred Securities of Subsidiary Trust Holding Solely Junior
Subordinated Debentures (“Trust Preferred Securities”). The sole assets of each trust, with the exception of Mellon Capital IV, are our junior subordinated deferrable interest debentures whose maturities and interest rates match the Trust Preferred Securities. The assets for Mellon Capital IV are currently (i) our remarketable 6.044% junior subordinated notes due 2043, and (ii) interests in stock purchase contracts between Mellon Capital IV and us. On the “stock purchase date”, as defined in the prospectus supplement for the Trust Preferred Securities of Mellon Capital IV, the sole assets of the trust will be shares of a series of our non-cumulative perpetual preferred stock.
Our obligations under the agreements that relate to the Trust Preferred Securities, the Trusts and the notes
102 The Bank of New York Mellon Corporation
NOTES TO CONSOLIDATED FINANCIAL STATEMENTS(continued)
and debentures constitute a full and unconditional guarantee by us of the Trusts’ obligations under the Preferred Trust Securities.
The following table sets forth a summary of the Trust Preferred Securities issued by the Trusts as of Dec. 31, 2007:
| | | | | | | | | | | | | | | | |
| Trust Preferred Securities at Dec. 31, 2007 | | Amount | | Interest
Rate | | | Assets
of Trust (a) | | Due
Date | | Call
Date | | Call
Price | |
| (dollar amounts in millions) | | | | | | |
BNY Institutional Capital Trust A | | $ | 300 | | 7.78 | % | | $ | 309 | | 2026 | | 2006 | | 103.89 | % (b) |
BNY Capital I(c) | | | 300 | | 7.97 | | | | 309 | | 2026 | | 2006 | | 103.99 | (b) |
BNY Capital IV | | | 200 | | 6.88 | | | | 206 | | 2028 | | 2004 | | Par | |
BNY Capital V | | | 350 | | 5.95 | | | | 361 | | 2033 | | 2008 | | Par | |
MEL Capital III (d) (e) | | | 397 | | 6.37 | | | | 380 | | 2036 | | 2016 | | Par | |
MEL Capital IV(e) | | | 500 | | 6.24 | | | | 501 | | - | | 2012 | | Par | |
Total | | $ | 2,047 | | | | | $ | 2,066 | | | | | | | |
| (a) | Junior subordinated debentures and interests in stock purchase contracts for Mellon Capital IV. |
| (b) | Call price decreases ratably to par in the year 2016. |
| (c) | The BNY Capital I Preferred and Common Trust Securities were redeemed on Feb. 1, 2008. |
| (d) | Amount was translated from Sterling into U.S. dollars on a basis of U.S. $1.98 to £1, the rate of exchange on Dec. 31, 2007. |
| (e) | Includes purchase accounting adjustments. |
We have the option to shorten the maturity of BNY Capital IV to 2013 or extend the maturity to 2047. The BNY Capital Preferred Trust Securities have been converted to floating rate via interest rate swaps.
16. Securitizations
We provide services to two QSPEs as of Dec. 31, 2007.
Money fund securitization
In 2000, we purchased BNY Hamilton Money Fund shares with a market value of $400 million. We then sold the right to receive the principal value of the shares in 2021 in a securitization transaction and retained the rights to receive on-going dividends from the shares. We did not recognize a gain on the sale. The purpose of this securitization is to achieve a favorable after-tax risk-adjusted investment return. We sponsor the BNY Hamilton Money Fund and receive an administrative fee for servicing the fund. We hedged a portion of the interest rate risk of the transaction by entering into a $200 million interest rate swap with a third party. The retained interest is recorded in available-for-sale securities in the consolidated balance sheet.
Municipal bond securitizations
We sponsor approximately $170 million of municipal bond securitizations for which no gain was recognized. These securitizations are comprised of $119 million which are Aaa insured, quarterly variable rate bonds with borrowers rated no lower than A3 on Moody’s municipal bond scale and $51
million which are one year general obligation, unlimited tax notes issued by a borrower having a Moody’s municipal bond rating of Baa2. All transactions were done at par value. These transactions generate approximately $1 million of annual pre-tax equivalent revenue. The program’s purpose is to achieve a favorable after-tax risk-adjusted investment return.
Asset-backed commercial paper conduit
Since 2000, we have sold and distributed securities for Old Slip Funding, LLC (“OSF”), an asset-backed commercial paper securitization program. We service the program and receive a market-based fee of approximately five basis points that is adequate to compensate us for our servicing responsibilities. As a result, there is no servicing asset or liability.
In 2007, we restructured the program with a third party holding the first loss position, which is designed to absorb the majority of any expected losses. The first loss note holder commitment is $5 million. The Bank of New York provides additional liquidity and credit enhancement to OSF’s commercial paper securitization program through total rate of return swaps and a subordinated loan. The swaps are constructed to mature as the commercial paper matures. To the extent there is a liquidity issue impacting the paying ability of the underlying assets or if the underlying assets undergo a credit default, the swaps are designed to ensure the timely payments to the beneficial interest holders. At Dec. 31, 2007, the authorized size of the program was $5 billion.
Effective Feb. 15, 2008, the authorized program size was lowered to $150 million. OSF is funded by
The Bank of New York Mellon Corporation 103
NOTES TO CONSOLIDATED FINANCIAL STATEMENTS(continued)
commercial paper (98%) and a subordinated funding loan (2%). Other than an increased cost of funding, OSF experienced no funding difficulties and did not require liquidity support in 2007. There were no material writedowns of assets held by OSF in 2007. At Dec. 31, 2007, OSF held a $135 million book-value asset portfolio consisting of mortgage-backed securities, 93% of which were rated AAA and 7% were rated A. At Dec. 31, 2007, a FIN 46R analysis was performed on OSF and it was not subject to consolidation by BNY Mellon. Consolidation of OSF would be immaterial to the assets of BNY Mellon.
Impact of programs
The impact of these securitizations on our fully diluted earnings per share is less than 1 cent. Furthermore, if these transactions were consolidated on the balance sheet, there would have been virtually no impact on our liquidity, and the Tier I and Total Capital ratios at Dec. 31, 2007 would have been four and five basis points lower, respectively.
17. Shareholders’ equity
Effective July 1, 2007, BNY Mellon had 3.5 billion authorized shares of common stock with a par value of $.01 per share and 100 million authorized shares of preferred stock with a par value of $.01 per share. At Dec. 31, 2007, there were 1,145,983,281 outstanding shares of common stock and no outstanding shares of preferred stock.
Prior to the merger with Mellon, we had 5 million authorized shares of Class A convertible preferred stock having a par value of $2.00 per share. At Dec. 31, 2006, 3,000 shares were outstanding. On Jan. 22, 2007, we redeemed 300 shares of Class A convertible preferred stock at a per share redemption price of $25 plus accrued dividends of $11.03. The remaining 2,700 shares were converted into The Bank of New York common stock with shareholders receiving 7.39644 shares (unadjusted) of The Bank of New York common stock for each share of Class A convertible preferred stock.
In addition to the Class A preferred stock, we had 5 million authorized shares of preferred stock having no par value, with no shares outstanding at Dec. 31, 2006.
In October 2006, we repurchased 10 million shares of common stock at an initial price of $35.33 from a broker-dealer counterparty who borrowed the shares as part of an accelerated share repurchase program. The initial price was subject to a purchase price adjustment
based on the price the counterparty actually paid for the shares. The program matured in October 2007. In November 2007, we issued 818,164 shares of common stock to settle the purchase price adjustment.
On Dec. 18, 2007, the Board of Directors of BNY Mellon authorized the repurchase of up to 35 million shares of common stock. This authorization is in addition to the authority to repurchase up to 6.5 million shares previously approved by the Executive Committee of the Board, of which 5.1 million shares remain at Dec. 31, 2007. We repurchased 1.5 million shares of our common stock in the second half of 2007 as part of a publicly announced plan. Total share repurchases in the second half of 2007 totaled 1.7 million shares.
18. Comprehensive results
| | | | | | | | | | | | |
Accumulated unrealized gain
(loss), net of tax | | Dec. 31, | |
| (in millions) | | 2007 | | | 2006 | | | 2005 | |
Foreign currency translation, net of tax | | | | | | | | | | | | |
Beginning balance | | $ | (64 | ) | | $ | (77 | ) | | $ | (61 | ) |
Period change | | | 75 | | | | 13 | | | | (16 | ) |
Ending balance | | $ | 11 | | | $ | (64 | ) | | $ | (77 | ) |
SFAS No. 158 adjustment, net of tax(a) | | | | | | | | | | | | |
Pensions, net of tax | | | | | | | | | | | | |
Beginning balance | | $ | (295 | ) | | $ | (26 | ) | | $ | (23 | ) |
Period change | | | 46 | | | | (193 | ) | | | (3 | ) |
Total | | | (249 | ) | | | (219 | ) | | | (26 | ) |
Other post-retirement benefits: | | | | | | | | | | | | |
Period change | | | 3 | | | | (76 | ) | | | - | |
Ending balance | | $ | (246 | ) | | $ | (295 | ) | | $ | (26 | ) |
Unrealized gain (loss) on assets available for sale, net of tax | | | | | | | | | | | | |
Beginning balance | | $ | 16 | | | $ | (57 | ) | | $ | 49 | |
Period change | | | (358 | ) | | | 73 | | | | (106 | ) |
Ending balance | | $ | (342 | ) | | $ | 16 | | | $ | (57 | ) |
Unrealized gain (loss) on cash flow hedges, net of tax | | | | | | | | | | | | |
Beginning balance | | $ | 26 | | | $ | 26 | | | $ | 29 | |
Period change | | | (23 | ) | | | - | | | | (3 | ) |
Ending balance(b) | | $ | 3 | | | $ | 26 | | | $ | 26 | |
Total accumulated unrealized gain (loss), net of tax | | | | | | | | | | | | |
Beginning balance | | $ | (317 | ) | | $ | (134 | ) | | $ | (6 | ) |
Period change | | | (257 | ) | | | (183 | ) | | | (128 | ) |
Ending balance | | $ | (574 | ) | | $ | (317 | ) | | $ | (134 | ) |
| (a) | In accordance with SFAS No. 158 in 2007 and 2006 and SFAS No. 87 in 2005. |
| (b) | Includes unrealized gain(loss) on foreign currency cash flow hedges of $4 million, $3 million and $(3) million at Dec. 31, 2007, Dec. 31, 2006 and Dec. 31, 2005, respectively. |
104 The Bank of New York Mellon Corporation
NOTES TO CONSOLIDATED FINANCIAL STATEMENTS(continued)
| | | | | | | | | | | | |
Tax effects allocated to each
component of comprehensive
results | | Before
tax
amount | | | Tax
(expense)
benefit | | | After-
tax
amount | |
| (in millions) | | | |
Year ended Dec. 31, 2005: | | | | | | | | | | | | |
Foreign currency translation adjustment | | $ | (20 | ) | | $ | 4 | | | $ | (16 | ) |
Minimum pension liability | | | (5 | ) | | | 2 | | | | (3 | ) |
Unrealized gain (loss) on assets available for sale: | | | | | | | | | | | | |
During the year | | | (188 | ) | | | 74 | | | | (114 | ) |
Reclassification adjustments | | | 14 | | | | (6 | ) | | | 8 | |
Unrealized gain (loss) | | | (174 | ) | | | 68 | | | | (106 | ) |
Unrealized gain (loss) on cash flow hedges: | | | | | | | | | | | | |
During the year | | | (10 | ) | | | 5 | | | | (5 | ) |
Reclassification adjustments | | | 3 | | | | (1 | ) | | | 2 | |
Unrealized gain (loss) | | | (7 | ) | | | 4 | | | | (3 | ) |
Other comprehensive results | | $ | (206 | ) | | $ | 78 | | | $ | (128 | ) |
Year ended Dec. 31, 2006: | | | | | | | | | | | | |
Foreign currency translation adjustment | | $ | 21 | | | $ | (8 | ) | | $ | 13 | |
SFAS No. 158 adjustment(a) | | | | | | | | | | | | |
Pensions | | | (320 | ) | | | 127 | | | | (193 | ) |
Other post-retirement benefits | | | (126 | ) | | | 50 | | | | (76 | ) |
Unrealized gain(loss) on assets available for sale: | | | | | | | | | | | | |
During the year | | | 202 | | | | (81 | ) | | | 121 | |
Reclassification adjustments | | | (81 | ) | | | 33 | | | | (48 | ) |
Unrealized gain (loss) | | | 121 | | | | (48 | ) | | | 73 | |
Unrealized gain (loss) on cash flow hedges: | | | | | | | | | | | | |
During the year | | | 7 | | | | (3 | ) | | | 4 | |
Reclassification adjustments | | | (7 | ) | | | 3 | | | | (4 | ) |
Unrealized gain (loss) | | | - | | | | - | | | | - | |
Other comprehensive results | | $ | (304 | ) | | $ | 121 | | | $ | (183 | ) |
Year ended Dec. 31, 2007: | | | | | | | | | | | | |
Foreign currency translation adjustment | | $ | 111 | | | $ | (36 | ) | | $ | 75 | |
SFAS No. 158 adjustment(a) | | | | | | | | | | | | |
Pensions | | | 87 | | | | (41 | ) | | | 46 | |
Other post-retirement benefits | | | 8 | | | | (5 | ) | | | 3 | |
Unrealized gain (loss) on assets available for sale: | | | | | | | | | | | | |
During the year | | | (557 | ) | | | 218 | | | | (339 | ) |
Reclassification adjustments | | | (32 | ) | | | 13 | | | | (19 | ) |
Unrealized gain(loss) | | | (589 | ) | | | 231 | | | | (358 | ) |
Unrealized gain/(loss) on cash flow hedges: | | | | | | | | | | | | |
During the year | | | (26 | ) | | | 10 | | | | (16 | ) |
Reclassification adjustments | | | (11 | ) | | | 4 | | | | (7 | ) |
Unrealized gain (loss) | | | (37 | ) | | | 14 | | | | (23 | ) |
Other comprehensive results | | $ | (420 | ) | | $ | 163 | | | $ | (257 | ) |
| (a) | In accordance with SFAS No. 158 in 2007 and 2006 and SFAS No. 87 in 2005. |
19. Stock–based compensation
Our Long-Term Incentive Plans provide for the issuance of stock options, restricted stock, restricted stock units (RSUs) and other stock-based awards to employees of BNY Mellon and its subsidiaries.
In connection with the merger with Mellon, all outstanding stock-based awards granted under Mellon’s equity compensation plans at the merger date were converted to BNY Mellon shares using a one-to-one ratio and are incorporated within this footnote. Upon approval of the merger with The Bank of New York by Mellon shareholders, change in control provisions were triggered in stock option plans for Mellon’s employees and directors, resulting in the immediate vesting of 7 million stock options under various option plans. These stock options are included as exercisable in the stock option activity table on the following page.
Stock Option Plans
Our stock option plans (“the Option Plans”) provide for the issuance of stock options at fair market value at the date of grant to officers and employees of BNY Mellon and its subsidiaries. At Dec. 31, 2007, under the Option Plans, we may issue 37,957,525 new options. In addition, we may reissue any options cancelled under our 1999 and 2003 Long-Term Incentive Plans. Generally, each option granted under the Option Plans is exercisable between one and ten years from the date of grant.
The compensation cost that has been charged against income was $66 million, $42 million, and $48 million for 2007, 2006 and 2005, respectively. The total income tax benefit recognized in the income statement was $27 million, $19 million, and $20 million for 2007, 2006, and 2005, respectively.
We used a lattice-based binomial method to calculate the fair value on the date of grant. The fair value of each option award is estimated on the date of grant using the weighted-average assumptions noted in the following table:
| | | | | | | | | |
| Assumptions | | 2007 | | | 2006 | | | 2005 | |
Dividend yield | | 2.4 | % | | 2.8 | % | | 2.6 | % |
Expected volatility | | 23 | | | 22 | | | 24 | |
Risk-free interest rate | | 4.46 | | | 4.72 | | | 4.17 | |
Expected option lives (in years) | | 6 | | | 6 | | | 5 | |
The Bank of New York Mellon Corporation 105
NOTES TO CONSOLIDATED FINANCIAL STATEMENTS(continued)
For 2007 and 2006, assumptions were determined as follows:
| | · | | Expected volatilities are based on implied volatilities from traded options on our stock, historical volatility of our stock, and other factors. |
| | · | | We use historical data to estimate option exercises and employee terminations within the valuation model. |
| | · | | The risk-free rate for periods within the contractual life of the option is based on the U.S. Treasury yield curve at the time of grant. |
| | · | | The expected term of options granted is derived from the output of the option valuation model and represents the period of time that options granted are expected to be outstanding. |
A summary of the status of our Option Plans as of Dec. 31, 2007, 2006, and 2005, and changes during the years ended on those dates, is presented below:
| | | | | | | | |
| Stock option activity(a) | | Shares
subject to
option | | | Weighted
average
Exercise price | | Weighted Average
remaining
contractual term
(in years) |
Balance at Dec. 31, 2004 | | 64,915,169 | | | $ | 36.98 | | |
Granted | | 5,895,943 | | | | 32.19 | | |
Exercised | | (3,179,338 | ) | | | 19.31 | | |
Canceled | | (2,100,169 | ) | | | 40.76 | | |
Balance at Dec. 31, 2005 | | 65,531,605 | | | $ | 37.29 | | |
Granted | | 5,906,816 | | | | 37.09 | | |
Exercised | | (8,670,355 | ) | | | 25.45 | | |
Canceled | | (2,029,112 | ) | | | 42.63 | | |
Balance at Dec. 31, 2006 | | 60,738,954 | | | $ | 38.79 | | |
Mellon conversion, July 1 | | 31,649,426 | | | | 35.97 | | |
Granted | | 8,028,880 | | | | 41.61 | | |
Exercised | | (14,479,352 | ) | | | 33.13 | | |
Canceled | | (1,828,205 | ) | | | 45.98 | | |
Balance at Dec. 31, 2007 | | 84,109,703 | | | $ | 38.82 | | 5.5 |
Vested and expected to vest at Dec. 31, 2007 | | 82,805,594 | | | $ | 38.78 | | 5.5 |
Exercisable at Dec. 31, 2007 | | 63,727,506 | | | $ | 38.37 | | 4.4 |
| (a) | Values for 2006, 2005 and 2004 represent legacy The Bank of New York only and have been restated in post merger share count terms. |
| | | | | | | | | |
| | | 2007 | | 2006 | | 2005 |
Weighted average fair value of options at grant date (a) | | $ | 8.96 | | $ | 7.75 | | $ | 6.50 |
Aggregate intrinsic value (in millions) | | | | | | | | | |
-Outstanding at 12/31 | | $ | 875 | | $ | 338 | | $ | 189 |
-Exercisable at 12/31 | | $ | 701 | | $ | 268 | | $ | 144 |
| (a) | Values for 2006 and 2005 represent legacy The Bank of New York only and have been restated in post merger share count terms. |
| | | | | | | | | | | | |
| Stock options outstanding at Dec. 31, 2007 | | | | | | |
| | | Options Outstanding | | Options Exercisable(a) |
Range of
Exercise
Prices | | Number
Outstanding
at Dec. 31,
2007 | | Weighted
Average
Remaining
Contractual
Life | | Weighted
Average
Exercise
Price | | Number
Exercisable
at Dec. 31,
2007 | | Weighted
Average
Exercise
Price |
$21 to 31 | | 15,298,974 | | 2.7 years | | $ | 26.85 | | 15,180,930 | | $ | 26.84 |
31 to 41 | | 38,754,463 | | 6.5 | | | 37.04 | | 23,208,716 | | | 35.78 |
41 to 51 | | 22,634,258 | | 4.6 | | | 43.94 | | 17,915,852 | | | 43.50 |
51 to 60 | | 7,422,008 | | 3.1 | | | 57.15 | | 7,422,008 | | | 57.15 |
$21 to 60 | | 84,109,703 | | 5.5 | | $ | 38.82 | | 63,727,506 | | $ | 38.37 |
| (a) | At Dec. 31, 2006 and 2005, 49,854,177 and 51,809,812 options were exercisable at an average price of $39.56 and $39.00, respectively, and have been restated in post merger share count terms. |
106 The Bank of New York Mellon Corporation
NOTES TO CONSOLIDATED FINANCIAL STATEMENTS(continued)
The total intrinsic value of options exercised during the years ended Dec. 31, 2007, 2006 and 2005 was $148 million, $100 million, and $31 million.
As of Dec. 31, 2007, there was $130 million of total unrecognized compensation cost related to nonvested shares granted under the Option Plans. The unrecognized compensation cost is expected to be recognized over a weighted-average period of three years.
Cash received from options exercised under the option plans for the years ended Dec. 31, 2007, 2006, and 2005, was $475 million, $217 million, and $61 million, respectively. The actual tax benefit realized for the tax deductions from options exercised totaled $55 million, $37 million, and $11 million, respectively, for the years ended Dec. 31, 2007, 2006, and 2005, respectively.
Restricted stock and RSUs
Restricted stock and RSUs are granted under our Long-Term Incentive Plans at no cost to the recipient. These awards are subject to forfeiture until certain restrictions have lapsed, including continued employment for a specified period. The recipient of a share of restricted stock is entitled to voting rights and dividends on the common stock. An RSU entitles the recipient to receive a share of common stock after the applicable restrictions lapse. The recipient is entitled to receive cash payments equivalent to any dividends paid on the underlying common stock during the period the RSU is outstanding but does not receive voting rights.
The fair value of restricted stock and RSUs is equal to the fair market value of our common stock on the date of grant. The expense is recognized over the vesting period of one to seven years. The total compensation expense recognized for restricted stock and RSUs was $101 million, $70 million and $55 million in 2007, 2006 and 2005, respectively.
The following table summarizes our nonvested restricted stock activity for 2007.
| | | | | | |
Nonvested restricted stock and
RSU activity | | Number
of shares | | | Weighted-
average
fair value |
Nonvested restricted stock and RSUs at Dec. 31, 2006 | | 6,977,028 | | | $ | 31.61 |
Mellon conversion July 1 | | 1,277,435 | | | | 41.57 |
Granted | | 3,829,202 | | | | 41.74 |
Vested | | (2,463,188 | ) | | | 29.09 |
Forfeited | | (825,690 | ) | | | 37.17 |
Nonvested restricted stock and RSUs at Dec. 31, 2007 | | 8,794,787 | | | | 37.58 |
As of Dec. 31, 2007, $167 million of total unrecognized compensation costs related to nonvested restricted stock is expected to be recognized over a weighted-average period of approximately two years.
20. Employee benefit plans
BNY Mellon has defined benefit and defined contribution retirement plans covering substantially all full-time and eligible part-time employees and other post-retirement plans providing healthcare benefits for certain retired employees.
The Bank of New York Mellon Corporation 107
NOTES TO CONSOLIDATED FINANCIAL STATEMENTS(continued)
Defined benefit plans
The following tables report the combined data for our domestic and foreign defined benefit pension and post retirement healthcare plans. The measurement
date for plan assets and obligations was changed from Sept. 30 to Dec. 31, effective Dec. 31, 2007. The impact of acquisitions shown below reflects the merger with the Mellon pension plans, effective July 1, 2007.
| | | | | | | | | | | | | | | | | | | | | | | | | | | | | | | | |
| | | Pension Benefits | | | Healthcare Benefits | |
| | | Domestic | | | Foreign | | | Domestic | | | Foreign | |
| (in millions) | | 2007 | | | 2006 (a) | | | 2007 | | | 2006 (a) | | | 2007 | | | 2006 (a) | | | 2007 | | | 2006 (a) | |
Weighted-average assumptions used to determine benefit obligations | | | | | | | | | | | | | | | | | | | | | | | | | | | | | | | | |
Measurement date | | | Dec. 31 | | | | Sept. 30 | | | | Dec. 31 | | | | Sept. 30 | | | | Dec. 31 | | | | Sept. 30 | | | | Dec. 31 | | | | Sept. 30 | |
Discount rate | | | 6.38 | % | | | 6.00 | % | | | 5.75 | % | | | 4.95 | % | | | 6.38 | % | | | 6.00 | % | | | 5.80 | % | | | 5.00 | % |
Rate of compensation increase | | | 3.50 | | | | 3.75 | | | | 4.43 | % | | | 4.46 | % | | | - | | | | - | | | | - | | | | - | |
Change in projected benefit obligation | | | | | | | | | | | | | | | | | | | | | | | | | | | | | | | | |
Benefit obligation at beginning of period | | $ | (867 | ) | | $ | (963 | ) | | $ | (254 | ) | | $ | (227 | ) | | $ | (175 | ) | | $ | (185 | ) | | $ | (8 | ) | | $ | (8 | ) |
Service cost | | | (61 | ) | | | (49 | ) | | | (18 | ) | | | (9 | ) | | | (1 | ) | | | - | | | | - | | | | - | |
Interest cost | | | (94 | ) | | | (53 | ) | | | (18 | ) | | | (11 | ) | | | (12 | ) | | | (10 | ) | | | (1 | ) | | | (1 | ) |
Employee contributions | | | - | | | | - | | | | (1 | ) | | | (1 | ) | | | - | | | | - | | | | - | | | | - | |
Actuarial gain/(loss) | | | 99 | | | | 136 | | | | (21 | ) | | | 2 | | | | (3 | ) | | | 3 | | | | 2 | | | | 1 | |
Acquisitions | | | (1,512 | ) | | | - | | | | (171 | ) | | | - | | | | (80 | ) | | | - | | | | - | | | | - | |
Curtailment gain/(loss) | | | - | | | | (4 | ) | | | - | | | | 2 | | | | - | | | | - | | | | - | | | | - | |
Benefits paid | | | 93 | | | | 66 | | | | 7 | | | | 4 | | | | 23 | | | | 17 | | | | - | | | | - | |
Adjustments due to change in measurement date | | | (7 | ) | | | - | | | | (5 | ) | | | - | | | | (2 | ) | | | - | | | | - | | | | - | |
Foreign exchange adjustment | | | N/A | | | | N/A | | | | (16 | ) | | | (14 | ) | | | N/A | | | | N/A | | | | (1 | ) | | | - | |
Benefit obligation at end of period | | | (2,349 | ) | | | (867 | ) | | | (497 | ) | | | (254 | ) | | | (250 | ) | | | (175 | ) | | | (8 | ) | | | (8 | ) |
Change in plan assets | | | | | | | | | | | | | | | | | | | | | | | | | | | | | | | | |
Fair value at beginning of period | | | 1,425 | | | | 1,333 | | | | 265 | | | | 219 | | | | 68 | | | | 65 | | | | - | | | | - | |
Actual return on plan assets | | | 199 | | | | 143 | | | | 21 | | | | 23 | | | | 3 | | | | 3 | | | | - | | | | - | |
Employer contributions | | | 13 | | | | 15 | | | | 16 | | | | 13 | | | | - | | | | - | | | | - | | | | - | |
Employee contributions | | | - | | | | - | | | | 1 | | | | 1 | | | | - | | | | - | | | | - | | | | - | |
Acquisitions | | | 2,187 | | | | - | | | | 229 | | | | - | | | | - | | | | - | | | | - | | | | - | |
Benefit payments | | | (93 | ) | | | (66 | ) | | | (7 | ) | | | (4 | ) | | | - | | | | - | | | | - | | | | - | |
Adjustments due to change in measurement date | | | 11 | | | | - | | | | 4 | | | | - | | | | 1 | | | | - | | | | - | | | | - | |
Foreign exchange adjustment | | | N/A | | | | N/A | | | | 16 | | | | 13 | | | | N/A | | | | N/A | | | | - | | | | - | |
Fair value at end of period | | | 3,742 | | | | 1,425 | | | | 545 | | | | 265 | | | | 72 | | | | 68 | | | | - | | | | - | |
Net amount recognized | | | 1,393 | | | | 558 | | | | 48 | | | | 11 | | | | (178 | ) | | | (107 | ) | | | (8 | ) | | | (8 | ) |
Fourth quarter activity, net | | | - | | | | 4 | | | | - | | | | - | | | | - | | | | 4 | | | | - | | | | - | |
Funded status at end of period | | $ | 1,393 | | | $ | 562 | | | $ | 48 | | | $ | 11 | | | $ | (178 | ) | | $ | (103 | ) | | $ | (8 | ) | | $ | (8 | ) |
Amounts recognized in accumulated other comprehensive (income)/loss consist of: | | | | | | | | | | | | | | | | | | | | | | | | | | | | | | | | |
Net loss/(gain) | | $ | 208 | | | $ | 351 | | | $ | 96 | | | $ | 58 | | | $ | 88 | | | $ | 88 | | | $ | (3 | ) | �� | $ | (1 | ) |
Prior service cost/(credit) | | | (72 | ) | | | (84 | ) | | | - | | | | - | | | | - | | | | - | | | | - | | | | - | |
Net initial obligation/(asset) | | | - | | | | - | | | | - | | | | - | | | | 20 | | | | 25 | | | | - | | | | - | |
Total (before tax effects) | | $ | 136 | | | $ | 267 | | | $ | 96 | | | $ | 58 | | | $ | 108 | | | $ | 113 | | | $ | (3 | ) | | $ | (1 | ) |
| (a) | Legacy The Bank of New York only. |
108 The Bank of New York Mellon Corporation
NOTES TO CONSOLIDATED FINANCIAL STATEMENTS(continued)
| | | | | | | | | | | | | | | | | | | | | | | | | | | | | | | | | | | | | | | | | | | | | | | | |
Net periodic benefit cost/
(credit) (a) | | Pension Benefits | | | Healthcare Benefits | |
| | | Domestic | | | Foreign | | | Domestic | | | Foreign | |
| (in millions) | | 2007 (b) | | | 2006 | | | 2005 | | | 2007 (b) | | | 2006 | | | 2005 | | | 2007 (b) | | | 2006 | | | 2005 | | | 2007 (b) | | | 2006 | | | 2005 | |
Weighted-average assumptions as of Jan. 1 | | | | | | | | | | | | | | | | | | | | | | | | | | | | | | | | | | | | | | | | | | | | | | | | |
Market-related value of plan assets | | $ | 1,352 | | | $ | 1,324 | | | $ | 1,502 | | | $ | 252 | | | $ | 252 | | | $ | 219 | | | $ | 72 | | | $ | 72 | | | $ | 70 | | | | N/A | | | | N/A | | | | N/A | |
Discount rate | | | 6.00 | % | | | 5.88 | % | | | 6.00 | % | | | 4.95 | % | | | 4.90 | % | | | 5.50 | % | | | 6.00 | % | | | 5.88 | % | | | 6.00 | % | | | 5.00 | % | | | 5.00 | % | | | 5.00 | % |
Expected rate of return on plan assets | | | 8.00 | | | | 7.88 | | | | 8.25 | | | | 6.40 | | | | 6.70 | | | | 7.10 | | | | 8.00 | | | | 7.25 | | | | 7.25 | | | | N/A | | | | N/A | | | | N/A | |
Rate of compensation increase | | | 3.75 | | | | 3.75 | | | | 3.75 | | | | 4.46 | | | | 4.20 | | | | 4.20 | | | | - | | | | - | | | | - | | | | - | | | | - | | | | - | |
Components of net periodic benefit cost/(credit) | | | | | | | | | | | | | | | | | | | | | | | | | | | | | | | | | | | | | | | | | | | | | | | | |
Service cost | | $ | 61 | | | $ | 49 | | | $ | 64 | | | $ | 18 | | | $ | 9 | | | $ | 9 | | | $ | 1 | | | $ | - | | | $ | - | | | $ | - | | | $ | - | | | $ | - | |
Interest cost | | | 94 | | | | 53 | | | | 55 | | | | 18 | | | | 11 | | | | 9 | | | | 13 | | | | 10 | | | | 9 | | | | - | | | | 1 | | | | 1 | |
Expected return on assets | | | (190 | ) | | | (100 | ) | | | (120 | ) | | | (28 | ) | | | (15 | ) | | | (11 | ) | | | (5 | ) | | | (5 | ) | | | (5 | ) | | | - | | | | - | | | | - | |
Curtailment (gain)/loss | | | - | | | | (11 | ) | | | - | | | | - | | | | - | | | | - | | | | - | | | | 8 | | | | - | | | | - | | | | - | | | | - | |
Other | | | 19 | | | | 35 | | | | 18 | | | | 4 | | | | 7 | | | | 2 | | | | 11 | | | | 12 | | | | 8 | | | | - | | | | - | | | | - | |
Net periodic benefit cost/(credit) (c) | | $ | (16 | ) | | $ | 26 | | | $ | 17 | | | $ | 12 | | | $ | 12 | | | $ | 9 | | | $ | 20 | | | $ | 25 | | | $ | 12 | | | $ | - | | | $ | 1 | | | $ | 1 | |
| (a) | Results prior to July 1, 2007 represent legacy The Bank of New York only. |
| (b) | Assumptions in effect as of July 1, 2007 for legacy Mellon plans include discount rate of 6.25% for domestic plans and discount rate of 5.75% for foreign plans, expected rate of return on plan assets of 8.25% and rate of compensation increase of 3.25%. |
| (c) | Pension benefits expense includes discontinued operations expense of $6 million for 2006 and 2005. |
| | | | | | | | | | | | | | | | |
| Changes in other comprehensive (income)/loss in 2007 | | Pension Benefits | | | Healthcare Benefits | |
| (in millions) | | Domestic | | | Foreign | | | Domestic | | | Foreign | |
Net loss/(gain) arising during period | | $ | (108 | ) | | $ | 28 | | | $ | 7 | | | $ | (2 | ) |
Recognition of prior years’ net (loss) | | | (29 | ) | | | (4 | ) | | | (7 | ) | | | - | |
Prior service cost/(credit) arising during period | | | - | | | | - | | | | - | | | | - | |
Recognition of prior years’ prior service credit | | | 10 | | | | - | | | | - | | | | - | |
Recognition of prior years’ net initial (obligation) | | | - | | | | - | | | | (4 | ) | | | - | |
Adjustment due to change in measurement date | | | (4 | ) | | | (1 | ) | | | (1 | ) | | | - | |
Foreign exchange adjustment | | | - | | | | 15 | | | | - | | | | - | |
Total recognized in other comprehensive (income)/loss (before tax effects) | | $ | (131 | ) | | $ | 38 | | | $ | (5 | ) | | $ | (2 | ) |
| | | | | | | | | | | | | |
Amounts expected to be recognized in net periodic benefit cost/(income) in 2008
(before tax effects) | | Pension Benefits | | Healthcare Benefits |
| (in millions) | | Domestic | | | Foreign | | Domestic | | Foreign |
(Gain)/loss recognition | | $ | 9 | | | $ | 1 | | $ | 6 | | $ | - |
Prior service cost recognition | | | (10 | ) | | | - | | | - | | | - |
Net initial obligation (asset) recognition | | | - | | | | - | | | 4 | | | - |
| | | | | | | | | | | | | | | | |
| | | Domestic | | | Foreign | |
| (in millions) | | 2007 | | | 2006 (a) | | | 2007 | | | 2006 (a) | |
Pension benefits: | | | | | | | | | | | | | | | | |
Prepaid benefit cost | | $ | 1,590 | | | $ | 610 | | | $ | 67 | | | $ | 25 | |
Accrued benefit cost | | | (197 | ) | | | (52 | ) | | | (19 | ) | | | (14 | ) |
Total pension benefits | | $ | 1,393 | | | $ | 558 | | | $ | 48 | | | $ | 11 | |
Healthcare benefits: | | | | | | | | | | | | | | | | |
Prepaid benefit cost | | $ | - | | | $ | - | | | $ | - | | | $ | - | |
Accrued benefit cost | | | (178 | ) | | | (107 | ) | | | (8 | ) | | | (8 | ) |
Total healthcare benefits | | $ | (178 | ) | | $ | (107 | ) | | $ | (8 | ) | | $ | (8 | ) |
| (a) | Legacy The Bank of New York only. |
The accumulated benefit obligation for all defined benefit plans was $2.612 billion at Dec. 31, 2007 and $1.048 billion at Sept. 30, 2006.
| | | | | | | | | | | | |
Plans with obligations in
excess of plan assets | | Domestic | | Foreign |
| (in millions) | | 2007 | | 2006 (a) | | 2007 | | 2006 (a) |
Projected benefit obligation | | $ | 198 | | $ | 52 | | $ | 13 | | $ | 13 |
Accumulated benefit obligation | | | 194 | | | 49 | | | 12 | | | 12 |
Fair value of plan assets | | | - | | | - | | | 1 | | | 1 |
| (a) | Legacy The Bank of New York only. |
The Bank of New York Mellon Corporation 109
NOTES TO CONSOLIDATED FINANCIAL STATEMENTS(continued)
Our expected long-term rate of return on plan assets is based on anticipated returns for each asset class. Anticipated returns are weighted for the target allocation for each asset class and are based on forecasts for prospective returns in the equity and fixed income markets, which should track the long-term historical returns for these markets. We also consider the growth outlook for U.S. and global economies, as well as current and prospective interest rates.
For additional information on pension assumptions see “Critical Accounting Estimates” on pages 34 and 35.
Assumed healthcare cost trend—Domestic healthcare benefits
The assumed health care cost trend rate used in determining benefit expense for 2007 is 8.9% decreasing to 5.0% in 2013. This projection is based on various economic models that forecast a decreasing growth rate of health care expenses over time. The underlying assumption is that health care expense growth cannot outpace gross national product (“GNP”) growth indefinitely, and over time a lower equilibrium growth rate will be achieved. Further, the growth rate assumed in 2013 bears a reasonable relationship to the discount rate.
An increase in the health care cost trend rate of one percentage point for each year would increase the postretirement benefit obligation by $19.8 million, or 7.9% and the sum of the service and interest costs by $1.4 million, or 6.9%. Conversely, a decrease in this rate of one percentage point for each year would decrease the benefit obligation by $17.2 million, or 6.9%, and the sum of the service and interest costs by $1.2 million, or 5.9%.
Assumed healthcare cost trend—Foreign healthcare benefits
An increase in the healthcare cost trend rate of one percentage point for each year would increase the post-retirement benefit obligation by $1.7 million, or 23%, and the sum of the service and interest costs by $0.2 million, or 33%. Conversely, a decrease in this rate of one percentage point for each year would decrease the benefit obligation by $1.2 million, or 16%, and the sum of the service and interest costs by $0.1 million, or 17%.
Investment strategy and asset allocation
Our investment objective for U.S. and foreign plans is to maximize total return while maintaining a broadly
diversified portfolio for the primary purpose of satisfying obligations for future benefit payments.
Equities are the main holding including our common stock as well as private equities. Alternative investments and fixed income securities provide diversification and lower the volatility of returns. In general, equity securities within any plan’s portfolio are maintained in the range of 45% to 75% of total plan assets, fixed-income securities range from 20% to 50% of plan assets and other assets (including cash equivalents) are held in amounts ranging from 0% to 10% of plan assets. Asset allocation within the approved ranges varies from time to time based on economic conditions (both current and forecast) and the advice of professional investment advisors.
Our pension assets were invested as follows at Dec. 31, 2007 and Sept. 30, 2006:
| | | | | | | | | | | | |
| Asset Allocations(a) | | Domestic | | | Foreign | |
| (in millions) | | 2007 | | | 2006 | | | 2007 | | | 2006 | |
Equities | | 65 | % | | 69 | % | | 59 | % | | 54 | % |
Fixed income | | 26 | | | 19 | | | 29 | | | 38 | |
Alternative investment | | 3 | | | 7 | | | 10 | | | - | |
Private equities | | 2 | | | 3 | | | - | | | - | |
Real estate | | 2 | | | - | | | 2 | | | - | |
Cash | | 2 | | | 2 | | | - | | | 8 | |
Total plan assets | | 100 | % | | 100 | % | | 100 | % | | 100 | % |
| (a) | Asset allocations prior to July 1, 2007 are for legacy The Bank of New York only. |
Included in the domestic plan assets above were 2 million and 4.2 million shares of our common stock with a fair value of $98 million and $150 million at Dec. 31, 2007 and Sept. 30, 2006, respectively, representing 3% of 2007 plan assets and 11% of 2006 plan assets. The BNY Mellon retirement plans received approximately $2 million and $3 million of dividends from BNY Mellon common stock in 2007 and 2006, respectively. Assets of the U.S. post retirement healthcare plan are invested in an insurance contract.
BNY Mellon expects to make cash contributions to fund its defined benefit pension plans in 2008 of $20 million for the domestic plans and $46 million for the foreign plans.
110 The Bank of New York Mellon Corporation
NOTES TO CONSOLIDATED FINANCIAL STATEMENTS(continued)
The following benefit payments for BNY Mellon’s pension and healthcare plans, which reflect expected future service as appropriate, are expected to be paid:
| | | | | | |
| (in millions) | | Domestic | | Foreign |
Pension benefits: | | | | | | |
Year 2008 | | $ | 185 | | $ | 7 |
2009 | | | 137 | | | 8 |
2010 | | | 139 | | | 9 |
2011 | | | 151 | | | 10 |
2012 | | | 154 | | | 10 |
2013-2017 | | | 872 | | | 74 |
Total pension benefits | | $ | 1,638 | | $ | 118 |
Healthcare benefits: | | | | | | |
Year 2008 | | $ | 24 | | $ | - |
2009 | | | 25 | | | - |
2010 | | | 25 | | | - |
2011 | | | 25 | | | - |
2012 | | | 24 | | | - |
2013-2017 | | | 107 | | | 1 |
Total healthcare benefits | | $ | 230 | | $ | 1 |
Defined contribution plans
We have an Employee Stock Ownership Plan (“ESOP”) covering certain domestic full-time employees with more than one year of service. The ESOP works in conjunction with our defined benefit pension plan. Employees are entitled to the higher of their benefit under the ESOP or the defined benefit pension plan at retirement. If the benefit under the pension plan is higher, the employee’s share of the ESOP is contributed to the pension plan.
Contributions are made equal to required principal and interest payments on borrowings by the ESOP. At Dec. 31, 2007 and Sept. 30, 2006, the ESOP owned 9.0 million and 10.5 million shares of our stock, respectively. The fair value of total ESOP assets were $443 million and $375 million at Dec. 31, 2007 and Sept. 30, 2006. Contributions were approximately $3.6 million in 2007, $3.3 million in 2006 and $2.1 million in 2005. ESOP related expense was $3 million, $3 million and $2 million in 2007, 2006 and 2005.
We have defined contribution plans, excluding the ESOP, for which we recognized a cost of $86 million in 2007, $62 million in 2006, and $58 million in 2005. The increase in defined contribution costs in 2007 reflects the domestic and foreign plans assumed in the merger with Mellon.
21. Company financial information
Our bank subsidiaries are subject to dividend limitations under the Federal Reserve Act, as well as national and state banking laws. Under these statutes, prior regulatory approval is required for dividends in any year that would exceed the Bank’s net profits for such year combined with retained net profits for the prior two years. Our national bank subsidiaries may not declare dividends in excess of net profits on hand, as defined, after deducting the amount by which the principal amount of all loans, on which interest is past due for a period of six months or more, exceeds the reserve for credit losses. The Bank of New York is also prohibited from paying dividends in excess of undivided profits.
Under the first and more significant of these limitations, our bank subsidiaries could declare dividends of approximately $1.635 billion in 2008 plus net profits earned in the remainder of 2008.
In accordance with GAAP, on July 1, 2007, the retained earnings of the bank subsidiaries acquired in the merger with Mellon were transferred to capital surplus. As a result, the dividend limitation for these banks is limited to the amount of earnings retained in the third and fourth quarters of 2007. Capital can be distributed by these banking subsidiaries via a regulatory waiver.
The payment of dividends also is limited by minimum capital requirements imposed on banks. As of Dec. 31, 2007, BNY Mellon’s bank subsidiaries exceeded these minimum requirements.
The bank subsidiaries declared dividends of $611 million in 2007, $2.125 billion in 2006, and $911 million in 2005. The Federal Reserve Board and the Office of the Comptroller of the Currency (“OCC”) have issued additional guidelines that require bank holding companies and national banks to continually evaluate the level of cash dividends in relation to their respective operating income, capital needs, asset quality and overall financial condition.
The Federal Reserve Board can also prohibit a dividend if payment would constitute an unsafe or unsound banking practice. The Federal Reserve Board generally considers that a bank’s dividends should not exceed earnings from continuing operations.
The Bank of New York Mellon Corporation 111
NOTES TO CONSOLIDATED FINANCIAL STATEMENTS(continued)
Our capital ratios and discussion of related regulatory requirements are presented in the “Capital—Capital adequacy” section on page 54 and through the risk-based and leverage capital ratios at year-end table on page 55 and are incorporated by reference into these Notes to Consolidated Financial Statements.
The Federal Reserve Act limits and requires collateral for extensions of credit by our insured subsidiary banks to BNY Mellon and certain of its non-bank affiliates. Also, there are restrictions on the amounts of investments by such banks in stock and other securities of BNY Mellon and such affiliates, and restrictions on the acceptance of their securities as collateral for loans by such banks. Extensions of credit by the banks to each of our affiliates are limited to 10% of such bank’s regulatory capital, and in the aggregate for BNY Mellon and all such affiliates to 20%, and collateral must be between 100% and 130% of the amount of the credit, depending on the type of collateral.
Our insured subsidiary banks are required to maintain reserve balances with Federal Reserve Banks under the Federal Reserve Act and Regulation D. Required balances averaged $403 million and $112 million for the years 2007 and 2006.
In addition, under the National Bank Act, if the capital stock of a national bank is impaired by losses or otherwise, the OCC is authorized to require payment of the deficiency by assessment upon the bank’s shareholders, pro rata, and to the extent necessary, if any such assessment is not paid by any shareholder after three months notice, to sell the stock of such shareholder to make good the deficiency.
The Parent company’s condensed financial statements are as follows:
Condensed Income Statement—The Bank of New York Mellon Corporation (Parent Corporation) (a)
| | | | | | | | | | | | |
| Year ended Dec. 31 | | | | | Legacy The Bank
of New York only | |
| (in millions) | | 2007 | | | 2006 (b) | | | 2005 | |
Dividends from bank subsidiaries | | $ | 564 | | | $ | 2,076 | | | $ | 862 | |
Dividends from nonbank subsidiaries | | | 321 | | | | 687 | | | | 108 | |
Interest revenue from bank subsidiaries | | | 210 | | | | 92 | | | | 104 | |
Interest revenue from nonbank subsidiaries | | | 242 | | | | 197 | | | | 142 | |
Other revenue | | | 53 | | | | (25 | ) | | | 24 | |
Total revenue | | | 1,390 | | | | 3,027 | | | | 1,240 | |
Interest (including $149 in 2007, $127 in 2006 and $81 in 2005 to subsidiaries) | | | 769 | | | | 546 | | | | 340 | |
Other expense | | | 152 | | | | 35 | | | | 63 | |
Total expense | | | 921 | | | | 581 | | | | 403 | |
Income before income taxes and equity in undistributed net income of subsidiaries | | | 469 | | | | 2,446 | | | | 837 | |
Provision (benefit) for income taxes | | | (106 | ) | | | (122 | ) | | | (58 | ) |
Equity in undistributed net income: | | | | | | | | | | | | |
Bank subsidiaries | | | 844 | | | | 395 | | | | 411 | |
Nonbank subsidiaries | | | 620 | | | | (116 | ) | | | 265 | |
Net income | | $ | 2,039 | | | $ | 2,847 | | | $ | 1,571 | |
| (a) | Includes results of discontinued operations and the extraordinary (loss). |
| (b) | Revised, see Note 2 of Notes to Consolidated Financial Statements. |
112 The Bank of New York Mellon Corporation
NOTES TO CONSOLIDATED FINANCIAL STATEMENTS(continued)
Condensed Balance Sheet—The Bank of New York Mellon Corporation (Parent Corporation)
| | | | | | |
| | | Dec. 31 |
| (in millions) | | 2007 | | 2006 (a) (b) |
Assets: | | | | | | |
Cash and due from banks | | $ | 4,414 | | $ | 908 |
Securities | | | 437 | | | 74 |
Loans—net of reserve | | | 224 | | | 401 |
Investment in and advances to subsidiaries and associated companies: | | | | | | |
Banks | | | 22,707 | | | 11,748 |
Other | | | 19,849 | | | 9,843 |
Subtotal | | | 42,556 | | | 21,591 |
Corporate-owned life insurance | | | 935 | | | - |
Other assets | | | 470 | | | 177 |
Total assets | | $ | 49,036 | | $ | 23,151 |
Liabilities: | | | | | | |
Deferred compensation | | $ | 512 | | $ | - |
Other borrowed funds | | | 372 | | | 224 |
Due to nonbank subsidiaries | | | 2,765 | | | 2,657 |
Other liabilities | | | 496 | | | 889 |
Long-term debt | | | 15,488 | | | 7,952 |
Total liabilities | | | 19,633 | | | 11,722 |
Shareholders’ equity | | | 29,403 | | | 11,429 |
Total liabilities and shareholders’ equity | | $ | 49,036 | | $ | 23,151 |
| (a) | Revised, see Note 2 of Notes to Consolidated Financial Statements. |
| (b) | Legacy The Bank of New York only. |
Condensed Statement of Cash Flows—The Bank of New York Mellon Corporation (Parent Corporation)
| | | | | | | | | | | | |
| | | | | | Legacy The Bank
of New York only | |
| | | Year-ended Dec. 31 | |
| (in millions) | | 2007 | | | 2006 (a) | | | 2005 | |
Operating activities: | | | | | | | | | | | | |
Net income | | $ | 2,039 | | | $ | 2,847 | | | $ | 1,571 | |
Adjustments to reconcile net income to net cash provided by operating activities: | | | | | | | | | | | | |
Amortization | | | 17 | | | | 17 | | | | 30 | |
Equity in undistributed net income of subsidiaries | | | (1,464 | ) | | | (279 | ) | | | (676 | ) |
Change in accrued interest receivable | | | (24 | ) | | | (7 | ) | | | - | |
Change in accrued interest payable | | | (17 | ) | | | 15 | | | | 25 | |
Change in taxes payable | | | (439 | ) | | | 595 | | | | 23 | |
Other, net | | | 471 | | | | (181 | ) | | | (18 | ) |
Net cash provided by operating activities | | | 583 | | | | 3,007 | | | | 955 | |
Investing activities: | | | | | | | | | | | | |
Purchases of securities | | | (956 | ) | | | (61 | ) | | | (18 | ) |
Proceeds from sales of securities | | | 813 | | | | 8 | | | | - | |
Change in loans | | | 180 | | | | (310 | ) | | | (61 | ) |
Acquisitions of, investments in, and advances to subsidiaries | | | (566 | ) | | | (2,367 | ) | | | (2,093 | ) |
Other, net | | | (10 | ) | | | 125 | | | | 15 | |
Net cash used in investing activities | | | (539 | ) | | | (2,605 | ) | | | (2,157 | ) |
Financing activities: | | | | | | | | | | | | |
Net change in commercial paper | | | (159 | ) | | | 139 | | | | (168 | ) |
Proceeds from issuance of long-term debt | | | 4,617 | | | | 974 | | | | 1,778 | |
Repayments of long-term debt | | | (982 | ) | | | (258 | ) | | | (202 | ) |
Change in advances from subsidiaries | | | 433 | | | | (66 | ) | | | 236 | |
Issuance of common stock | | | 495 | | | | 428 | | | | 243 | |
Treasury stock acquired | | | (113 | ) | | | (883 | ) | | | (417 | ) |
Cash dividends paid | | | (884 | ) | | | (656 | ) | | | (644 | ) |
Tax benefit realized on share based payment awards | | | 55 | | | | 37 | | | | 11 | |
Stock rights redemption | | | - | | | | - | | | | (39 | ) |
Net cash provided (used) in financing activities | | | 3,462 | | | | (285 | ) | | | 798 | |
Change in cash and due from banks | | | 3,506 | | | | 117 | | | | (404 | ) |
Cash and due from banks at beginning of year | | | 908 | | | | 791 | | | | 1,195 | |
Cash and due from banks at end of year | | $ | 4,414 | | | $ | 908 | | | $ | 791 | |
Supplemental disclosures | | | | | | | | | | | | |
Interest paid | | $ | 785 | | | $ | 530 | | | $ | 314 | |
Income taxes paid(b) | | $ | 1,053 | | | $ | 430 | | | $ | 658 | |
Income taxes refunded(b) | | | (142 | ) | | | - | | | | (1 | ) |
Payments (received from) paid to subsidiaries | | | (820 | ) | | | 585 | | | | 311 | |
Net income taxes paid | | $ | 91 | | | $ | 1,015 | | | $ | 968 | |
| (a) | Revised, see Note 2 of Notes to Consolidated Financial Statements. |
| (b) | Includes discontinued operations. |
The Bank of New York Mellon Corporation 113
NOTES TO CONSOLIDATED FINANCIAL STATEMENTS(continued)
22. Fair value of financial instruments
The carrying amounts of our financial instruments (i.e., monetary assets and liabilities) are determined under different accounting methods—see Note 1 “Summary of Significant Accounting and Reporting Policies” in the Notes to the Consolidated Financial Statements. The following disclosure discusses these instruments on a uniform fair value basis. However, active markets do not exist for a significant portion of these instruments, principally loans and commitments. As a result, fair value determinations require significant subjective judgments regarding future cash flows. Other judgments would result in different fair values. Among the assumptions we used are discount rates ranging principally from 3% to 7% at Dec. 31, 2007 and 5% to 8% at Dec. 31, 2006. The fair value information supplements the basic financial statements and other traditional financial data presented throughout this report.
A summary of the practices used for determining fair value is as follows.
Interest-bearing deposits in banks
The fair value interest-bearing deposits in banks is based on discounted cash flows.
Securities, trading activities, and derivatives used for ALM
The fair value of securities and trading assets and liabilities is based on quoted market prices, dealer quotes, or pricing models. Fair value amounts for derivative instruments, such as options, futures and forward rate contracts, commitments to purchase and sell foreign exchange, and foreign currency swaps, are similarly determined. The fair value of interest rate swaps is the amount that would be received or paid to terminate the agreement.
Loans and commitments
For certain categories of consumer loans, fair value includes consideration of the quoted market prices for securities backed by similar loans. Discounted future cash flows and secondary market values are used to determine the fair value of other types of loans. The fair value of commitments to extend credit, standby letters of credit, and commercial letters of credit is based upon the cost to settle the commitment.
Other financial assets
Fair value is assumed to equal carrying value for these assets due to their short maturity.
Deposits, borrowings, and long-term debt
The fair value of noninterest-bearing deposits and payables to customers and broker-dealers is assumed to be their carrying amount. The fair value of interest-bearing deposits, borrowings, and long-term debt is based upon current rates for instruments of the same remaining maturity or quoted market prices for the same or similar issues.
| | | | | | | | | | | | | |
Financial
instruments-
summary | | | | | | Legacy The Bank
of New York only |
| | | Dec. 31, 2007 | | Dec. 31, 2006 |
| (in millions) | | Carrying
amount | | Estimated
fair value | | Carrying
amount | | | Estimated
fair value |
Assets: | | | | | | | | | | | | | |
Interest-bearing deposits in banks | | $ | 34,312 | | $ | 34,322 | | $ | 13,172 | | | $ | 13,163 |
Securities | | | 50,772 | | | 51,427 | | | 21,856 | | | | 22,332 |
Trading assets | | | 6,420 | | | 6,420 | | | 5,544 | | | | 5,544 |
Loans and commitments | | | 45,629 | | | 45,796 | | | 31,995 | | | | 32,209 |
Derivatives used for ALM | | | 144 | | | 156 | | | 87 | | | | 141 |
Other financial assets | | | 20,235 | | | 20,235 | | | 10,309 | | | | 10,309 |
Total financial assets | | $ | 157,512 | | $ | 158,356 | | $ | 82,963 | | | $ | 83,698 |
Non-financial assets | | | 40,144 | | | | | | 20,225 | (a) | | | |
Assets of discontinued operations | | | - | | | | | | 18 | | | | |
Total assets | | $ | 197,656 | | | | | $ | 103,206 | (a) | | | |
Liabilities: | | | | | | | | | | | | | |
Noninterest-bearing deposits | | $ | 32,372 | | $ | 32,372 | | $ | 19,554 | | | $ | 19,554 |
Interest-bearing deposits | | | 85,753 | | | 85,768 | | | 42,592 | | | | 42,600 |
Payables to customers and broker-dealers | | | 7,578 | | | 7,578 | | | 7,266 | | | | 7,266 |
Borrowings | | | 8,256 | | | 8,256 | | | 2,481 | | | | 2,481 |
Long-term debt | | | 16,873 | | | 16,602 | | | 8,773 | | | | 8,706 |
Trading liabilities | | | 4,577 | | | 4,577 | | | 2,507 | | | | 2,507 |
Derivatives used for ALM | | | 116 | | | 69 | | | 134 | | | | 117 |
Total financial liabilities | | $ | 155,525 | | $ | 155,222 | | $ | 83,307 | | | $ | 83,231 |
Non-financial liabilities | | | 12,728 | | | | | | 8,406 | | | | |
Liabilities of discontinued operations | | | - | | | | | | 64 | | | | |
Total liabilities | | $ | 168,253 | | | | | $ | 91,777 | | | | |
| (a) | Revised, see Note 2 of Notes to Consolidated Financial Statements. |
114 The Bank of New York Mellon Corporation
NOTES TO CONSOLIDATED FINANCIAL STATEMENTS(continued)
The table below summarizes the carrying amount of the hedged financial instruments and the related notional amount of the hedge and estimated fair value (unrealized gain/(loss)) of the derivatives that were linked to these items:
| | | | | | | | | | | | | |
Hedged financial
instruments | | | | | | Unrealized | |
| (in millions) | | Carrying
amount | | Notional
amount | | Gain | | (Loss) | |
At Dec. 31, 2007: | | | | | | | | | | | | | |
Loans | | $ | 36 | | $ | 39 | | $ | - | | $ | (3 | ) |
Securities held-for-sale | | | 223 | | | 223 | | | - | | | (11 | ) |
Deposits | | | 669 | | | 660 | | | 8 | | | - | |
Long-term debt | | | 8,796 | | | 8,743 | | | 148 | | | (55 | ) |
At Dec. 31, 2006(a): | | | | | | | | | | | | | |
Loans | | $ | 43 | | $ | 43 | | $ | - | | $ | - | |
Securities held-for-sale | | | 493 | | | 428 | | | 34 | | | (5 | ) |
Deposits | | | 1,528 | | | 1,530 | | | 27 | | | (2 | ) |
Long-term debt | | | 6,130 | | | 6,238 | | | 80 | | | (110 | ) |
| (a) | Legacy The Bank of New York only. |
The following table illustrates the notional amount, remaining contracts outstanding, and weighted average rates for derivative hedging contracts:
| | | | | | | | | | | | | | | | | | | | | | | | |
| Interest rate swaps | | Dec. 31,
2007 | | | Remaining contacts outstanding at Dec. 31, | |
| (dollars in millions) | | | 2008 | | | 2009 | | | 2010 | | | 2011 | | | 2012 | |
Receive fixed interest rate swaps: | | | | | | | | | | | | | | | | | | | | | | | | |
Notional | | $ | 9,003 | | | $ | 8,457 | | | $ | 7,244 | | | $ | 7,144 | | | $ | 6,582 | | | $ | 5,132 | |
Weighted average rate | | | 5.24 | % | | | 5.34 | % | | | 5.36 | % | | | 5.39 | % | | | 5.37 | % | | | 5.41 | % |
Pay fixed interest rate swaps: | | | | | | | | | | | | | | | | | | | | | | | | |
Notional | | $ | 662 | | | $ | 240 | | | $ | 226 | | | $ | 223 | | | $ | - | | | $ | - | |
Weighted average rate | | | 5.75 | % | | | 6.27 | % | | | 6.31 | % | | | 6.32 | % | | | - | | | | - | |
Forward LIBOR rate (a) | | | 4.82 | % | | | 3.37 | % | | | 3.82 | % | | | 4.37 | % | | | 4.70 | % | | | 4.86 | % |
| (a) | The forward LIBOR rate shown above reflects the implied forward yield curve for that index at Dec. 31, 2007. However, actual repricings for ALM interest rate swaps are generally based on 3-month LIBOR. |
23. Trading activities
The following table shows the fair value of our financial instruments that are held for trading purposes:
| | | | | | | | | | | | | | | | | | | | | | | | |
| Trading account | | | | Legacy The Bank of New York only |
| | | 2007 | | 2006 |
| | | Assets | | Liabilities | | Assets | | Liabilities |
| (in millions) | | Dec. 31 | | Average | | Dec. 31 | | Average | | Dec. 31 | | Average | | Dec. 31 | | Average |
Interest rate contracts: | | | | | | | | | | | | | | | | | | | | | | | | |
Futures and forward contracts | | $ | - | | $ | - | | $ | 95 | | $ | 14 | | $ | - | | $ | 15 | | $ | - | | $ | - |
Swaps | | | 2,295 | | | 1,466 | | | 1,655 | | | 1,109 | | | 1,390 | | | 1,637 | | | 951 | | | 1,088 |
Written options | | | - | | | - | | | 675 | | | 641 | | | - | | | - | | | 764 | | | 961 |
Purchased options | | | 187 | | | 189 | | | - | | | 1 | | | 208 | | | 190 | | | - | | | - |
Foreign exchange contracts: | | | | | | | | | | | | | | | | | | | | | | | | |
Written options | | | - | | | - | | | 176 | | | 127 | | | - | | | - | | | 115 | | | 84 |
Purchased options | | | 137 | | | 109 | | | - | | | - | | | 79 | | | 134 | | | - | | | - |
Commitments to purchase and sell foreign exchange | | | 1,184 | | | 1,060 | | | 1,156 | | | 1,007 | | | 301 | | | 310 | | | 259 | | | 355 |
Debt securities | | | 1,665 | | | 2,049 | | | 213 | | | 265 | | | 3,338 | | | 3,560 | | | 140 | | | 238 |
Credit derivatives | | | 61 | | | 16 | | | 3 | | | 6 | | | 2 | | | 2 | | | 9 | | | 9 |
Equities | | | 877 | | | 722 | | | 604 | | | 631 | | | 226 | | | 146 | | | 269 | | | 148 |
Commodity and other derivatives | | | 14 | | | 6 | | | - | | | - | | | - | | | - | | | - | | | - |
Total trading account | | $ | 6,420 | | $ | 5,617 | | $ | 4,577 | | $ | 3,801 | | $ | 5,544 | | $ | 5,994 | | $ | 2,507 | | $ | 2,883 |
The Bank of New York Mellon Corporation 115
NOTES TO CONSOLIDATED FINANCIAL STATEMENTS(continued)
Revenue from foreign exchange and other trading activities included the following:
| | | | | | | | | | | |
Foreign exchange and other
trading activities | | | | Legacy The Bank
of New York only | |
| (in millions) | | 2007 | | 2006 | | | 2005 | |
Foreign exchange | | $ | 593 | | $ | 304 | | | $ | 266 | |
Interest rate contract | | | 46 | | | 25 | | | | 22 | |
Debt securities | | | 69 | | | 75 | | | | 67 | |
Credit derivatives | | | 59 | | | (8 | ) | | | (2 | ) |
Equities | | | 16 | | | 19 | | | | 26 | |
Commodity and other derivatives | | | 3 | | | - | | | | - | |
Total | | $ | 786 | | $ | 415 | | | $ | 379 | |
Foreign exchange includes income from purchasing and selling foreign exchange, futures, and options.
Interest rate contracts reflect results from futures and forward contracts, interest rate swaps, foreign currency swaps, and options. Debt securities primarily reflect income from fixed income securities. Credit derivatives include revenue from credit default swaps. Equities include income from equity securities and equity derivatives. Commodity and other derivatives include option contracts for barrels of oil related to synthetic fuel tax credits.
The following table of total daily revenue or loss captures trading volatility and shows the number of days in which our trading revenues fell within particular ranges during the past year.
| | | | | | | | | | |
| Distribution of revenues | | Legacy The Bank of New York only | | | | |
| | | Quarter ended |
| (in millions) | | Dec. 31,
2006(a) | | March 31,
2007(a) | | June 30,
2007(a) | | Sept. 30,
2007 | | Dec. 31,
2007 |
Revenue range: | | Number of occurrences |
Less than $(2.5) | | - | | - | | - | | 2 | | - |
$(2.5) - $0 | | 4 | | 6 | | 4 | | 5 | | 3 |
$0 - $2.5 | | 45 | | 33 | | 33 | | 16 | | 8 |
$2.5 - $5.0 | | 11 | | 20 | | 24 | | 20 | | 25 |
More than $5.0 | | 2 | | 3 | �� | 3 | | 20 | | 26 |
| (a) | Based on revenues before deducting share of joint venture partner, Susquehanna Trading. |
24. Commitments and contingent liabilities
In the normal course of business, various commitments and contingent liabilities are outstanding which are not reflected in the accompanying consolidated balance sheets.
Our significant trading and off-balance sheet risks are securities, foreign currency and interest rate risk management products, commercial lending commitments, letters of credit, and securities lending indemnifications. We assume these risks to reduce interest rate and foreign currency risks, to provide customers with the ability to meet credit and liquidity needs, to hedge foreign currency and interest rate risks, and to trade for our own account. These items involve, to varying degrees, credit, foreign exchange, and interest rate risk not recognized in the balance sheet. Our off-balance sheet risks are managed and monitored in manners similar to those used for on-balance-sheet risks. There are no significant industry concentrations of such risks.
A summary of our off-balance sheet credit transactions, net of participations, at Dec. 31, 2007 and 2006 follows:
| | | | | | |
| Off-balance sheet credit risks | | Dec. 31 |
| (in millions) | | 2007 | | 2006 (a) |
Lending commitments(b) | | $ | 49,055 | | $ | 36,465 |
Standby letters of credit(c) | | | 13,813 | | | 10,902 |
Commercial letters of credit | | | 1,167 | | | 1,195 |
Securities lending indemnifications | | | 618,487 | | | 398,675 |
| (a) | Legacy The Bank of New York only. |
| (b) | Net of participations totaling $763 million at Dec. 31, 2007 and $899 million at Dec. 31, 2006. |
| (c) | Net of participations totaling $2.576 billion at Dec. 31, 2007 and $2.574 billion at Dec. 31, 2006. |
The total potential loss on undrawn commitments, standby and commercial letters of credit, and securities lending indemnifications is equal to the total notional amount if drawn upon, which does not consider the value of any collateral. Since many of the commitments are expected to expire without being drawn upon, the total amount does not necessarily represent future cash requirements. We
116 The Bank of New York Mellon Corporation
NOTES TO CONSOLIDATED FINANCIAL STATEMENTS(continued)
also extend facilities which provide liquidity, primarily for variable rate tax-exempt securities wrapped by monoline insurers. The credit approval for these facilities is based on an assessment of the underlying tax exempt issuer and is not simply dependent on the monoline. The allowance for lending-related commitments was $167 million at Dec. 31, 2007 and $150 million at Dec. 31, 2006. A summary of lending commitment maturities at Dec. 31, 2007, is as follows: $19.1 billion less than one year; $29.2 billion in one to five years, and $.8 billion over five years.
A securities lending transaction is a fully collateralized transaction in which the owner of a security agrees to lend the security through an agent (The Bank of New York Mellon Corporation) to a borrower, usually a broker/dealer or bank, on an open, overnight or term basis, under the terms of a prearranged contract, which generally matures in less than 90 days. We generally lend securities with indemnification against broker default. We generally require the borrower to provide 102% cash collateral which is monitored on a daily basis, thus reducing credit risk. Security lending transactions are generally entered into only with highly-rated counterparties. Securities lending indemnifications were secured by collateral of $637 billion at Dec. 31, 2007 and $406 billion at Dec. 21, 2006.
Standby letters of credit principally support corporate obligations and include $683 million and $1.0 billion that were collateralized with cash and securities at Dec. 31, 2007 and 2006. At Dec. 31, 2007, approximately $9.3 billion of the standbys will expire within one year.
The estimated liability for losses related to these arrangements, if any, is included in the reserve for unfunded commitments.
The notional amounts for off-balance sheet risks express the dollar volume of the transactions; however, credit risk is much smaller. We perform credit reviews and enter into netting agreements to minimize the credit risk of foreign currency and interest rate risk management products. We enter into offsetting positions to reduce exposure to foreign exchange and interest rate risk.
A summary of the notional amount and credit exposure of our derivative financial instruments at Dec. 31, 2007 and 2006 follows:
| | | | | | | | | | | | | | |
Derivative financial
instruments | | Notional | | Credit exposure | |
| (in millions) | | 2007 | | 2006 (a) | | 2007 | | | 2006 (a) | |
Interest rate contracts: | | | | | | | | | | | | | | |
Futures and forward contracts | | $ | 81,738 | | $ | 60,986 | | $ | 4 | | | $ | 1 | |
Swaps | | | 363,809 | | | 322,024 | | | 5,272 | | | | 3,255 | |
Written options | | | 188,480 | | | 199,788 | | | 8 | | | | 7 | |
Purchased options | | | 160,739 | | | 183,855 | | | 919 | | | | 641 | |
Foreign exchange contracts: | | | | | | | | | | | | | | |
Swaps | | | 3,479 | | | 2,572 | | | 20 | | | | 112 | |
Written options | | | 7,177 | | | 9,596 | | | 2 | | | | 9 | |
Purchased options | | | 6,974 | | | 10,892 | | | 193 | | | | 141 | |
Commitments to purchase and sell foreign exchange | | | 306,018 | | | 93,920 | | | 723 | | | | 602 | |
Equity derivatives: | | | | | | | | | | | | | | |
Futures and forwards | | | 894 | | | 326 | | | 4 | | | | 5 | |
Written options | | | 5,003 | | | 10,023 | | | 5 | | | | 1 | |
Purchased options | | | 3,668 | | | 6,755 | | | 506 | | | | 236 | |
Credit derivatives: | | | | | | | | | | | | | | |
Beneficiary | | | 2,258 | | | 1,688 | | | 38 | | | | 2 | |
Guarantor | | | 2 | | | - | | | - | | | | - | |
| | | | | | | | | 7,694 | | | | 5,012 | |
Effect of master netting agreements | | | | | | | | | (5,077 | ) | | | (4,215 | ) |
Total credit exposure | | | | | | | | $ | 2,617 | | | $ | 797 | |
| (a) | Legacy The Bank of New York only. |
At Dec. 31, 2007, approximately $226 billion (notional) of interest rate contracts will mature within one year, $407 billion (notional) between one and five years, and the balance after five years. At Dec. 31, 2007, approximately $262 billion (notional) of foreign exchange contracts will mature within one year and $41 billion between one and five years, and the balance after five years.
Use of derivative financial instruments involves reliance on counterparties. Failure of a counterparty to honor its obligation under a derivative contract is a risk we assume whenever we engage in a derivative contract.
Operating Leases
Net rent expense for premises and equipment was $278 million in 2007, $180 million in 2006 and $181 million in 2005.
At Dec. 31, 2007, we were obligated under various noncancelable lease agreements, some of which
The Bank of New York Mellon Corporation 117
NOTES TO CONSOLIDATED FINANCIAL STATEMENTS(continued)
provide for additional rents based upon real estate taxes, insurance, and maintenance and for various renewal options. A summary of the future minimum rental commitments under noncancelable operating leases, net of related sublease revenue, is as follows: 2008—$331 million; 2009—$254 million; 2010—$239 million; 2011—$218 million; 2012—$204 million; and 2013 through 2027—$1.377 billion.
Other
We have provided standard representations for underwriting agreements, acquisition and divestiture agreements, sales of loans and commitments, and other similar types of arrangements and customary indemnification for claims and legal proceedings related to providing financial services. Insurance has been purchased to mitigate certain of these risks. We are a minority equity investor in, and member of, several industry clearing or settlement exchanges through which foreign exchange, securities, or other transactions settle. Certain of these industry clearing or settlement exchanges require their members to guarantee their obligations and liabilities or to provide financial support in the event other partners do not honor their obligations. It is not possible to estimate a maximum potential amount of payments that could be required with such agreements.
In the ordinary course of business, we make certain investments that have tax consequences. From time to time, the IRS may question or challenge the tax position we have taken. We engaged in certain types of structured cross-border leveraged leasing investments, referred to as “LILOs,” prior to mid-1999 that the IRS has challenged. In 2004, the IRS proposed adjustments to our tax treatment of these transactions. On Feb. 28, 2006, we settled this matter with the IRS relating to LILO transactions closed in 1996 and 1997.
Our 1998 LILO transactions are in a subsequent audit cycle and were not part of the settlement. We believe that a comparable settlement for 1998 may be possible, given the similarity between these leases and the settled leases. However, negotiations are ongoing and the treatment of the 1998 leases may still be litigated if an acceptable settlement cannot be reached. Under current U.S. generally accepted accounting principles, if the 1998 leases are settled, on a basis comparable to the 1996 and 1997 leases we would not expect the settlement of the 1998 leases to have a further impact on net income, based on existing reserves.
In the fourth quarters of 2005 and 2007, we deposited funds with the IRS in anticipation of reaching a settlement on the 1998 LILO investments.
On Feb. 11, 2005, the IRS released Notice 2005-13, which identified certain lease investments known as “SILOs” as potentially subject to IRS challenge. On Sept. 6, 2007, we received a draft Form 5701,Notice of Proposed Adjustment, denying the tax benefits associated with certain of our so-called SILOs. Although it is likely the IRS will challenge the tax benefits associated with all such leases in 2008, we remain confident that our tax treatment of the leases complied with statutory, administrative and judicial authority existing at the time they were entered into.
In 2001 and 2002, we entered into various structured transactions that involved, among other things, the payment of U.K. corporate income taxes that were credited against our U.S. corporate income tax liability. The IRS continues to review these transactions and it is likely that some or all of the credits will be challenged upon completion of the review.
On Oct. 9, 2007, we received a letter from the IRS informing us that the IRS is considering designating one such transaction for litigation. At this time, it is unknown if the transaction will ultimately be designated for litigation, but, if so designated, we are prepared to defend our position and we believe that any tax benefits associated with these transactions were consistent with the applicable statutory, judicial and administrative authority existing at the time they were entered into.
Based on a probability assessment of various potential outcomes, we currently believe we have adequate tax reserves to cover our LILO exposure and any other potential tax exposures. Probabilities and outcomes are reviewed as events unfold, and adjustments to the reserves are made when appropriate.
In connection with the acquisition of JPMC’s corporate trust business, we were required to file various IRS information and withholding tax returns. While preparing these returns in 2007, we identified certain inconsistencies in the supporting tax documentation and records transferred to us that were needed to file accurate returns. For additional information, see “Legal and Regulatory Proceedings” on page 120.
In the fourth quarter of 2007, we also discovered that other business lines, including the legacy The Bank of
118 The Bank of New York Mellon Corporation
NOTES TO CONSOLIDATED FINANCIAL STATEMENTS(continued)
New York corporate trust business, may have similar issues and initiated an extensive company-wide review to identify any inconsistencies in the supporting tax documentation. Any deficiencies that are identified will be promptly remediated. We made an initial disclosure of this matter to the IRS on a voluntary basis in the fourth quarter of 2007 and we continue to work diligently with the IRS to help resolve the matters. Any exposure resulting from this matter is uncertain and cannot currently be reasonably estimated.
25. Derivative instruments used for interest rate risk management purposes.
We utilize interest rate swap agreements to manage our exposure to interest rate fluctuations. For hedges of fixed-rate loans, asset-backed securities, deposits and long-term debt, the hedge documentation specifies the terms of the hedged items and the interest rate swaps and indicates that the derivative is hedging a fixed-rate item and is a fair value hedge, that the hedge exposure is to the changes in the fair value of the hedged item due to changes in benchmark interest rates, and that the strategy is to eliminate fair value variability by converting fixed-rate interest payments to LIBOR. There were no counterparty default losses on these instruments in 2007, 2006 and 2005.
The fixed rate loans hedged generally have an original maturity of 9 to 12 years and are not callable. These loans are hedged with “pay fixed rate, receive variable rate” swaps with similar notional amounts, maturities, and fixed rate coupons. The swaps are not callable. At Dec. 31, 2007, $39 million of loans were hedged with interest rate swaps which had notional values of $39 million.
The securities hedged generally have a weighted average life of 10 years and are callable six months prior to maturity. These securities are hedged with pay fixed rate, receive variable rate swaps of like maturity, repricing and fixed rate coupon. The swaps are callable six months prior to maturity. At Dec. 31, 2007, $223 million of securities were hedged with interest rate swaps which had notional values of $223 million.
The fixed rate deposits hedged generally have original maturities of 3 to 12 years, and, except for five deposits, are not callable. These deposits are hedged with receive fixed rate, pay variable rate swaps of similar maturity, repricing and fixed rate coupon. The swaps are not callable except for the five that hedge
the callable deposits. At Dec. 31, 2007, $660 million of deposits were hedged with interest rate swaps which had notional values of $660 million.
The fixed rate long-term debt hedged generally has an original maturity of 5 to 30 years. We issue both callable and non-callable debt. The non-callable debt is hedged with simple interest rate swaps similar to those described for deposits. Callable debt is hedged with callable swaps where the call dates of the swaps exactly match the call dates of the debt. At Dec. 31, 2007, $9.172 billion of debt was hedged with interest rate swaps that had notional values of $8.343 billion.
In addition to the fair value hedges discussed above, we have a cash flow hedge utilizing an interest rate swap to hedge the variability in expected future cash flows attributable to floating rates on a long-term debt issue. The hedge documentation specifies the terms of the hedged items and interest rate swaps and indicates that the derivative is hedging future variable interest payments, that the hedge exposure is the variability in interest payments, and that the strategy is to eliminate variability by converting floating rate interest payments to fixed payments. For cash flow hedges the interest rate swap is marked-to-market with the changes in value recorded in other comprehensive income. The amount recognized as other comprehensive income for the cash flow hedge is reclassified to net interest revenue as interest is realized on the hedged item.
The long-term debt hedged has a principal amount of $400 million and has a LIBOR-based floating rate and a two-year original maturity. The debt is hedged with a receive LIBOR, pay fixed rate swap with the same maturity and interest payment dates as the debt to eliminate the variability in interest payments on the debt. Within the next twelve months, net pre-tax gains of under $100 thousand included in other comprehensive income are expected to be reclassified to income.
Forward foreign exchange contracts are also used to hedge the value of our net investments in foreign subsidiaries. These forward contracts usually have maturities of less than two years. The derivatives employed are designated as net investment hedges of changes in value of our foreign investment due to exchange rates, such that changes in value of the forward exchange contracts offset the changes in value of the foreign investments due to changes in foreign exchange rates. The change in fair market value of these contracts is deferred and reported
The Bank of New York Mellon Corporation 119
NOTES TO CONSOLIDATED FINANCIAL STATEMENTS(continued)
within accumulated translation adjustments in shareholders’ equity, net of tax effects. At Dec. 31, 2007, foreign exchange contracts, with notional amounts totaling $4.013 billion, were designated as hedges.
Ineffectiveness related to derivatives and hedging relationships was recorded in income as follows:
| | | | | | | | | | | | |
| Ineffectiveness | | | | | Legacy The Bank
of New York only | |
| | | Dec. 31, | |
| (in millions) | | 2007 | | | 2006 | | | 2005 | |
Fair value hedges on loans | | $ | 0.1 | | | $ | (0.1 | ) | | $ | 0.1 | |
Fair value hedge of securities | | | 0.1 | | | | 0.1 | | | | (0.1 | ) |
Fair value hedge of deposits and long-term debt | | | 5.8 | | | | (1.2 | ) | | | 0.9 | |
Cash flow hedges | | | 0.1 | | | | (0.5 | ) | | | 0.2 | |
Other(a) | | | (0.2 | ) | | | 0.5 | | | | - | |
Total | | $ | 5.9 | | | $ | (1.2 | ) | | $ | 1.1 | |
| (a) | Includes ineffectiveness recorded on foreign exchange hedges. |
26. Business segments
For details of our business segments, see Business segments review on pages 17 and 18 preceeding the Market indexes table, the tables, through “Average assets” (excluding “pre-tax operating margin”) on page 19. For details of the primary types of fee revenue generated by each segment, see the sector overview table on page 7. The tables and information in those paragraphs are incorporated by reference into these Notes to Consolidated Financial Statements.
27. Legal and regulatory proceedings
In the ordinary course of business, the Company and its subsidiaries are routinely defendants in or parties to a number of pending and potential legal actions, including actions brought on behalf of various classes of claimants, and regulatory matters. Claims for significant monetary damages are asserted in certain of these actions and proceedings. In regulatory enforcement matters, claims for disgorgement and the imposition of penalties and/or other remedial sanctions are possible. Due to the inherent difficulty of predicting the outcome of such matters, the Company cannot ascertain what the eventual outcome of these matters will be. The Company intends to defend itself vigorously against all of the claims asserted in these legal actions.
As previously disclosed in the Company’s Form 8-K dated May 17, 2007, the Federal Customs Service of the Russian Federation is pursuing a claim against The Bank of New York (“BNY”), a subsidiary of the Company. The claim is based on allegations relating to the previously disclosed Russian funds transfer matter that was the subject of the Company’s Non-Prosecution Agreement and alleges violations of U.S. law by failing to supervise and monitor funds transfer activities at BNY. This “lack of action” is alleged to have resulted in underpayment to the Russian Federation of the value added taxes that were due to be paid by the customers of the bank’s clients on certain goods imported into the country. The claim seeks $22.5 billion in “direct and indirect” losses.
BNY has been defending itself vigorously in this matter and intends to continue to do so. BNY believes it has meritorious procedural and substantive defenses to the allegations in the Russian courts and also believes it has meritorious defenses to an attempted enforcement of a judgment outside the Russian Federation in countries in which BNY has material assets if a judgment were to be entered in this matter by the Russian courts.
The Company filed a proof of claim on January 18, 2008, in the Chapter 11 bankruptcy of Sentinel Management Group, Inc. (“Sentinel”), seeking to recover approximately $312 million loaned to Sentinel and secured by securities and cash in an account maintained by Sentinel at BNY. At the time of the bankruptcy, the cash and securities collateral for the loan were valued at over $600 million. The Chapter 11 Trustee for Sentinel recently indicated that he is prepared to file an adversary proceeding against BNY seeking to disallow BNY’s claim and asserting a claim for damages against BNY under a variety of theories including that BNY aided and abetted certain insiders of Sentinel in mis-appropriating customer assets and improperly using those assets as collateral for the loan. BNY has also learned that the Commodities Futures Trading Commission (the “CFTC”) has opened an investigation that includes a review of Sentinel’s relationship with BNY. While the timing and outcome of the bankruptcy is uncertain, the Company intends to vigorously pursue its claim.
As previously disclosed in the Company’s Annual Report on Form 10-K for the year ended Dec. 31, 2006, the U.S. Securities and Exchange Commission (“SEC”) is investigating the trading activities of Pershing Trading Company LP, a floor specialist, on two regional exchanges from 1999 to 2004. Because the conduct at
120 The Bank of New York Mellon Corporation
NOTES TO CONSOLIDATED FINANCIAL STATEMENTS(continued)
issue is alleged to have occurred largely during the period when Pershing was owned by Credit Suisse First Boston (USA), Inc. (“CSFB”), the Company has made claims for indemnification against CSFB relating to this matter under the agreement relating to the acquisition of Pershing. CSFB is disputing these claims for indemnification.
The Company previously disclosed in its Annual Report on Form 10-K for the year ended Dec. 31, 2006 that the SEC was investigating the appropriateness of certain expenditures made in connection with marketing and distribution of the Hamilton Funds. The Company was informed by the SEC Staff on Sept. 11, 2007 that they had concluded their investigation and that no enforcement action was recommended.
The Company previously disclosed in its Annual Report on Form 10-K for the year ended Dec. 31, 2006 that the SEC was investigating possible market-timing transactions cleared by Pershing LLC. The Company was informed by the SEC Staff orally that they had concluded their investigation and that no enforcement action was recommended.
As previously reported in a Current Report filed by Mellon on Form 8-K dated Sept. 30, 2005, Mellon Investor Services LLC (“MIS”) received a “Wells Notice” from the SEC relating to MIS’ disclosure practices to its transfer agency (issuer) clients during the period 2001 through late 2004 concerning the receipt of fees from a search firm that performs in-depth searches for “lost” shareholders. The Company was informed by the SEC Staff on Aug. 16, 2007 that they had concluded their investigation and that no enforcement action was recommended.
In connection with the acquired JPMorgan Chase corporate trust business, BNY was required to file various IRS information and withholding tax returns for 2006. In preparing to do so, BNY identified certain inconsistencies in the supporting tax documentation and records transferred to BNY that were needed to file accurate returns. The Company and JPMorgan Chase jointly disclosed this matter to the IRS on a voluntary basis in a meeting on Sept. 7, 2007 and the Company believes it will receive additional time to remediate the issues. The Company and JPMorgan Chase are attempting to resolve the information reporting and withholding issues presented. While there can be no assurance, the Company believes that after remediation the potential financial exposure will be immaterial, and, in any event, BNY is indemnified by JPMorgan Chase for the 2006 tax withholding and reporting obligations associated with the acquisition.
The Bank of New York Mellon Corporation 121
REPORT OF INDEPENDENT REGISTERED PUBLIC ACCOUNTING FIRM
The Board of Directors and Shareholders of
The Bank of New York Mellon Corporation:
We have audited the accompanying consolidated balance sheet of The Bank of New York Mellon Corporation and subsidiaries (“the Corporation”) as of December 31, 2007, and the related consolidated statements of income, changes in shareholders’ equity, and cash flows for the year then ended. These consolidated financial statements are the responsibility of the Corporation’s management. Our responsibility is to express an opinion on these consolidated financial statements based on our audit. The accompanying consolidated balance sheet of the Corporation and subsidiaries as of December 31, 2006, and the related consolidated statements of income, changes in shareholders’ equity, and cash flows for the two years ended December 31, 2006, were audited by other auditors whose report, dated February 21, 2007, was unqualified and included an explanatory paragraph that described the change in the Corporation’s method of accounting for defined benefit pension and other postretirement plans discussed in Note 3 to the consolidated financial statements.
We conducted our audit in accordance with the standards of the Public Company Accounting Oversight Board (United States). Those standards require that we plan and perform the audit to obtain reasonable assurance about whether the financial statements are free of material misstatement. An audit includes examining, on a test basis, evidence supporting the amounts and disclosures in the financial statements. An audit also includes assessing the accounting principles used and significant estimates made by management, as well as evaluating the overall financial statement presentation. We believe that our audit provides a reasonable basis for our opinion.
In our opinion, the consolidated financial statements referred to above present fairly, in all material respects, the financial position of the Corporation and subsidiaries as of December 31, 2007, and the results of their operations and their cash flows for the year then ended, in conformity with U.S. generally accepted accounting principles.
We also have audited, in accordance with the standards of the Public Company Accounting Oversight Board (United States), the Corporation’s internal control over financial reporting as of December 31, 2007, based on criteria established in Internal Control—Integrated Framework issued by the Committee of Sponsoring Organizations of the Treadway Commission (COSO), and our report dated February 27, 2008 expressed an unqualified opinion on the effectiveness of the Corporation’s internal control over financial reporting.
New York, New York
February 27, 2008
122 The Bank of New York Mellon Corporation
DIRECTORS, SENIOR MANAGEMENT AND EXECUTIVE COMMITTEE
| | | | |
Directors Frank J. Biondi, Jr. Senior Managing Director WaterView Advisors LLC Investment advisor Ruth E. Bruch Senior Vice President and Chief Information Officer Kellogg Company Cereal and convenience foods Nicholas M. Donofrio Executive Vice President, Innovation and Technology IBM Corporation Developer, manufacturer and provider of advanced information technologies and services Steven G. Elliott Senior Vice Chairman The Bank of New York Mellon Corporation Gerald L. Hassell President The Bank of New York Mellon Corporation Edmund F. “Ted” Kelly Chairman, President and Chief Executive Officer Liberty Mutual Group Multi-line insurance company Robert P. Kelly Chief Executive Officer The Bank of New York Mellon Corporation Richard J. Kogan Principal The KOGAN Group LLC Michael J. Kowalski Chairman and Chief Executive Officer Tiffany & Co. International designer, manufacturer and distributor of jewelry and fine goods John A. Luke, Jr. Chairman and Chief Executive Officer MeadWestvaco Corporation Manufacturer of paper, packaging and specialty chemicals | | Robert Mehrabian Chairman, President and Chief Executive Officer Teledyne Technologies, Inc. Advanced industrial technologies Mark A. Nordenberg Chancellor University of Pittsburgh Major public research university Catherine A. Rein Senior Executive Vice President and Chief Administrative Officer MetLife, Inc. Insurance and financial services company Thomas A. Renyi Executive Chairman The Bank of New York Mellon Corporation William C. Richardson President and Chief Executive Officer Emeritus The W.K. Kellogg Foundation Private foundation Samuel C. Scott III Chairman, President and Chief Executive Officer Corn Products International, Inc. Global producers of corn-refined products and ingredients John P. Surma Chairman and Chief Executive Officer United States Steel Corporation Steel manufacturing Wesley W. von Schack Chairman, President and Chief Executive Officer Energy East Corporation Energy services company Senior Management Thomas A. Renyi Executive Chairman Robert P. Kelly Chief Executive Officer Gerald L. Hassell President | | Executive Committee Torry Berntsen Chief Client Management Officer Richard F. Brueckner Chief Executive Officer Pershing LLC Steven G. Elliott Senior Vice Chairman Co-Head, Integration Thomas P. (Todd) Gibbons Chief Risk Officer Timothy F. Keaney Co-Chief Executive Officer BNY Mellon Asset Servicing Carl Krasik General Counsel David F. Lamere Chief Executive Officer BNY Mellon Wealth Management Jonathan Little Vice Chairman, BNY Mellon Asset Management Chairman, BNY Asset Management International Chairman, The Dreyfus Corporation Donald R. Monks Vice Chairman Co-Head, Integration Ronald P. O’Hanley Chief Executive Officer and President BNY Mellon Asset Management James P. Palermo Co-Chief Executive Officer BNY Mellon Asset Servicing Karen B. Peetz Chief Executive Officer The Bank of New York Mellon Corporate Trust Lisa B. Peters Chief Human Resources Officer Brian G. Rogan Chief Executive Officer The Bank of New York Mellon Issuer and Treasury Services Bruce W. Van Saun Vice Chairman Chief Financial Officer Kurt D. Woetzel Chief Information Officer |
The Bank of New York Mellon Corporation 123
PERFORMANCE GRAPH
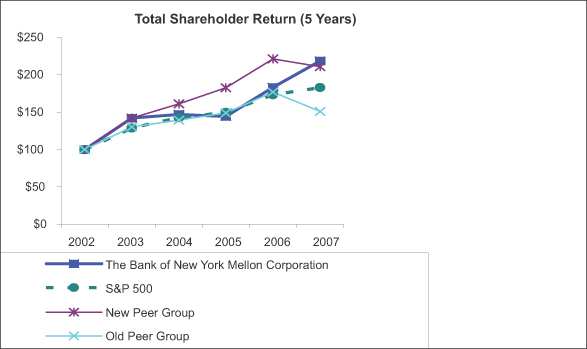
| | | | | | | | | | | | | | | | | | |
| | | 2002 | | 2003 | | 2004 | | 2005 | | 2006 | | 2007 |
The Bank of New York Mellon Corporation | | $ | 100.00 | | $ | 142.09 | | $ | 147.09 | | $ | 144.31 | | $ | 183.06 | | $ | 218.48 |
S&P 500 | | | 100.00 | | | 128.68 | | | 142.68 | | | 149.69 | | | 173.33 | | | 182.85 |
New Peer Group | | | 100.00 | | | 142.14 | | | 161.09 | | | 182.77 | | | 221.21 | | | 210.97 |
Old Peer Group | | | 100.00 | | | 130.18 | | | 139.38 | | | 148.97 | | | 177.00 | | | 151.04 |
This graph shows The Bank of New York Mellon’s cumulative total shareholder returns over the five-year period from Dec. 31, 2002 to Dec. 31, 2007. The graph reflects total shareholder returns for The Bank of New York from Dec. 31, 2002 to June 29, 2007, and for The Bank of New York Mellon from July 2, 2007 to Dec. 31, 2007. June 29, 2007 was the last day of trading on the NYSE of The Bank of New York stock and July 2, 2007 was the first day of trading on the NYSE of The Bank of New York Mellon stock. We are showing combined The Bank of New York – The Bank of New York Mellon shareholder returns because The Bank of New York Mellon does not have a five-year history as a public company. The graph also shows the cumulative total returns for the same five-year period of the S&P 500 index, as well as our old and new peer groups (listed below). After the merger, we reevaluated the composition of our peer group and determined that a change was appropriate. Our new peer group is composed of asset managers and institutional service providers that represent our primary competitors. The comparison assumes a $100 investment on Dec. 31, 2002 in The Bank of New York stock (which was converted on a .9434 for one basis into The Bank of New York Mellon stock on July 1, 2007), in the S&P 500 Index and in each of the peer groups shown and assumes that all dividends were reinvested.
| | |
New Peer Group* | | Old Peer Group* |
AllianceBernstein Holdings LP | | BB & T Corporation |
BlackRock, Inc. | | Bear Stearns Companies, Inc. |
JP MorganChase & Co. | | Fifth Third Bancorp |
Legg Mason, Inc. | | Lehman Brothers Holdings, Inc. |
Lehman Brothers Holdings, Inc. | | National City Corporation |
Northern Trust Corporation | | Northern Trust Corporation |
PNC Financial Services Group, Inc. | | PNC Financial Services Group, Inc. |
Prudential Financial, Inc. | | State Street Corporation |
State Street Corporation | | SunTrust Banks, Inc. |
SunTrust Banks, Inc. | | US Bancorp |
US Bancorp | | Wachovia Corporation |
Wachovia Corporation | | |
| * | Individual returns are weighted by market capitalization at the end of each year. |
124 The Bank of New York Mellon Corporation