
Exhibit 99.1 2019 Annual Meeting of Stockholders April 9, 2019 1 | 2019 Annual Meeting of StockholdersExhibit 99.1 2019 Annual Meeting of Stockholders April 9, 2019 1 | 2019 Annual Meeting of Stockholders
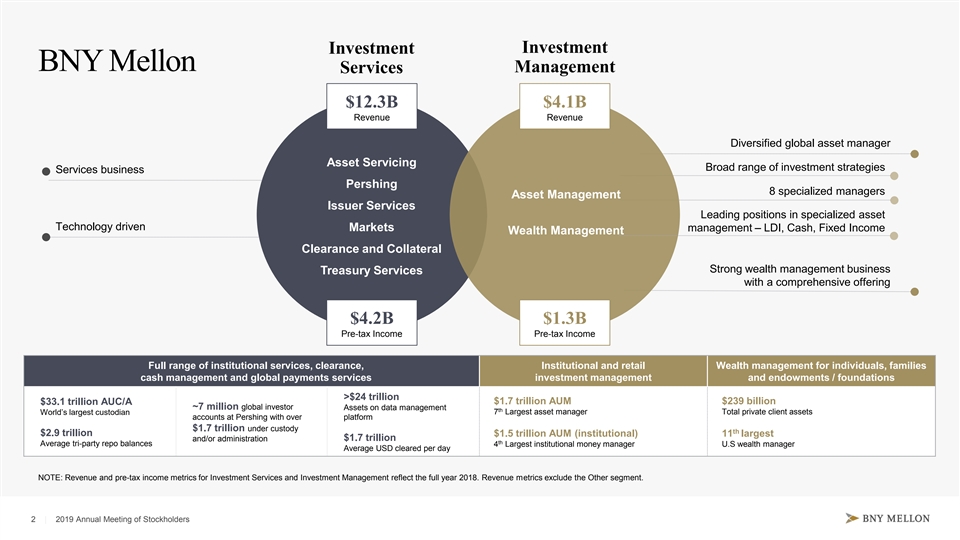
Investment Investment BNY Mellon Management Services $12.3B $4.1B Revenue Revenue Diversified global asset manager Asset Servicing Broad range of investment strategies Services business Pershing 8 specialized managers Asset Management Issuer Services Leading positions in specialized asset Technology driven Markets management – LDI, Cash, Fixed Income Wealth Management Clearance and Collateral Strong wealth management business Treasury Services with a comprehensive offering $4.2B $1.3B Pre-tax Income Pre-tax Income Full range of institutional services, clearance, Institutional and retail Wealth management for individuals, families cash management and global payments services investment management and endowments / foundations >$24 trillion $1.7 trillion AUM $239 billion $33.1 trillion AUC/A ~7 million global investor Assets on data management th 7 Largest asset manager Total private client assets World’s largest custodian accounts at Pershing with over platform $1.7 trillion under custody th $2.9 trillion $1.5 trillion AUM (institutional) 11 largest and/or administration $1.7 trillion th Average tri-party repo balances 4 Largest institutional money manager U.S wealth manager Average USD cleared per day NOTE: Revenue and pre-tax income metrics for Investment Services and Investment Management reflect the full year 2018. Revenue metrics exclude the Other segment. 2 | 2019 Annual Meeting of StockholdersInvestment Investment BNY Mellon Management Services $12.3B $4.1B Revenue Revenue Diversified global asset manager Asset Servicing Broad range of investment strategies Services business Pershing 8 specialized managers Asset Management Issuer Services Leading positions in specialized asset Technology driven Markets management – LDI, Cash, Fixed Income Wealth Management Clearance and Collateral Strong wealth management business Treasury Services with a comprehensive offering $4.2B $1.3B Pre-tax Income Pre-tax Income Full range of institutional services, clearance, Institutional and retail Wealth management for individuals, families cash management and global payments services investment management and endowments / foundations >$24 trillion $1.7 trillion AUM $239 billion $33.1 trillion AUC/A ~7 million global investor Assets on data management th 7 Largest asset manager Total private client assets World’s largest custodian accounts at Pershing with over platform $1.7 trillion under custody th $2.9 trillion $1.5 trillion AUM (institutional) 11 largest and/or administration $1.7 trillion th Average tri-party repo balances 4 Largest institutional money manager U.S wealth manager Average USD cleared per day NOTE: Revenue and pre-tax income metrics for Investment Services and Investment Management reflect the full year 2018. Revenue metrics exclude the Other segment. 2 | 2019 Annual Meeting of Stockholders
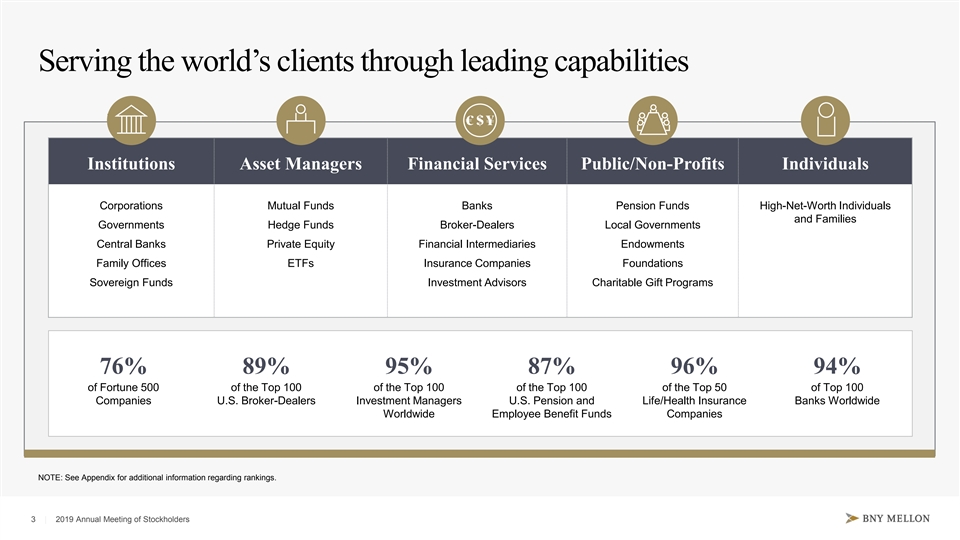
Serving the world’s clients through leading capabilities Institutions Asset Managers Financial Services Public/Non-Profits Individuals Corporations Mutual Funds Banks Pension Funds High-Net-Worth Individuals and Families Governments Hedge Funds Broker-Dealers Local Governments Central Banks Private Equity Financial Intermediaries Endowments Family Offices ETFs Insurance Companies Foundations Sovereign Funds Investment Advisors Charitable Gift Programs 76% 89% 95% 87% 96% 94% of Fortune 500 of the Top 100 of the Top 100 of the Top 100 of the Top 50 of Top 100 Companies U.S. Broker-Dealers Investment Managers U.S. Pension and Life/Health Insurance Banks Worldwide Worldwide Employee Benefit Funds Companies NOTE: See Appendix for additional information regarding rankings. 3 | 2019 Annual Meeting of StockholdersServing the world’s clients through leading capabilities Institutions Asset Managers Financial Services Public/Non-Profits Individuals Corporations Mutual Funds Banks Pension Funds High-Net-Worth Individuals and Families Governments Hedge Funds Broker-Dealers Local Governments Central Banks Private Equity Financial Intermediaries Endowments Family Offices ETFs Insurance Companies Foundations Sovereign Funds Investment Advisors Charitable Gift Programs 76% 89% 95% 87% 96% 94% of Fortune 500 of the Top 100 of the Top 100 of the Top 100 of the Top 50 of Top 100 Companies U.S. Broker-Dealers Investment Managers U.S. Pension and Life/Health Insurance Banks Worldwide Worldwide Employee Benefit Funds Companies NOTE: See Appendix for additional information regarding rankings. 3 | 2019 Annual Meeting of Stockholders

A dynamic model delivering long-term value to clients and shareholders Attractive High Risk-Adjusted Business Model Returns Strong EPS Growth • Diversified business mix • Increasing scale benefits • Prudent credit risk business model • Majority of revenue from • Positive operating leverage recurring fees • Robust liquidity profile • Positive capital generation 1 • Low risk-weighted assets model • >22% ROTCE enables growth with limited new capital required • Serving a critical industry 1. ROTCE represents the Return on Tangible Common Shareholders’ Equity, a Non-GAAP measure, excludes goodwill and intangible assets, net of deferred tax liabilities. See Appendix for a reconciliation. 4 | 2019 Annual Meeting of StockholdersA dynamic model delivering long-term value to clients and shareholders Attractive High Risk-Adjusted Business Model Returns Strong EPS Growth • Diversified business mix • Increasing scale benefits • Prudent credit risk business model • Majority of revenue from • Positive operating leverage recurring fees • Robust liquidity profile • Positive capital generation 1 • Low risk-weighted assets model • >22% ROTCE enables growth with limited new capital required • Serving a critical industry 1. ROTCE represents the Return on Tangible Common Shareholders’ Equity, a Non-GAAP measure, excludes goodwill and intangible assets, net of deferred tax liabilities. See Appendix for a reconciliation. 4 | 2019 Annual Meeting of Stockholders
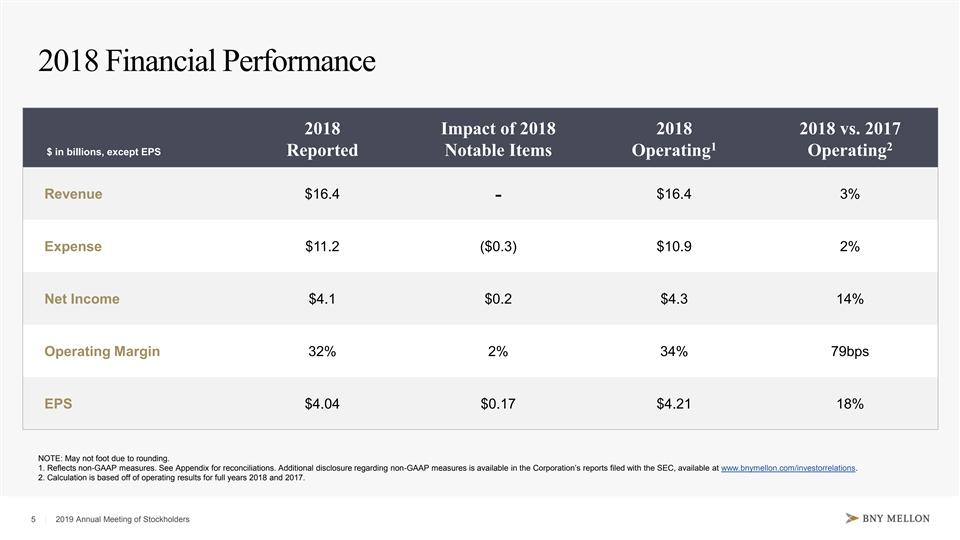
2018 Financial Performance 2018 Impact of 2018 2018 2018 vs. 2017 1 2 $ in billions, except EPS Reported Notable Items Operating Operating Revenue $16.4 $16.4 3% - Expense $11.2 ($0.3) $10.9 2% Net Income $4.1 $0.2 $4.3 14% Operating Margin 32% 2% 34% 79bps EPS $4.04 $0.17 $4.21 18% NOTE: May not foot due to rounding. 1. Reflects non-GAAP measures. See Appendix for reconciliations. Additional disclosure regarding non-GAAP measures is available in the Corporation’s reports filed with the SEC, available at www.bnymellon.com/investorrelations. 2. Calculation is based off of operating results for full years 2018 and 2017. 5 | 2019 Annual Meeting of Stockholders2018 Financial Performance 2018 Impact of 2018 2018 2018 vs. 2017 1 2 $ in billions, except EPS Reported Notable Items Operating Operating Revenue $16.4 $16.4 3% - Expense $11.2 ($0.3) $10.9 2% Net Income $4.1 $0.2 $4.3 14% Operating Margin 32% 2% 34% 79bps EPS $4.04 $0.17 $4.21 18% NOTE: May not foot due to rounding. 1. Reflects non-GAAP measures. See Appendix for reconciliations. Additional disclosure regarding non-GAAP measures is available in the Corporation’s reports filed with the SEC, available at www.bnymellon.com/investorrelations. 2. Calculation is based off of operating results for full years 2018 and 2017. 5 | 2019 Annual Meeting of Stockholders
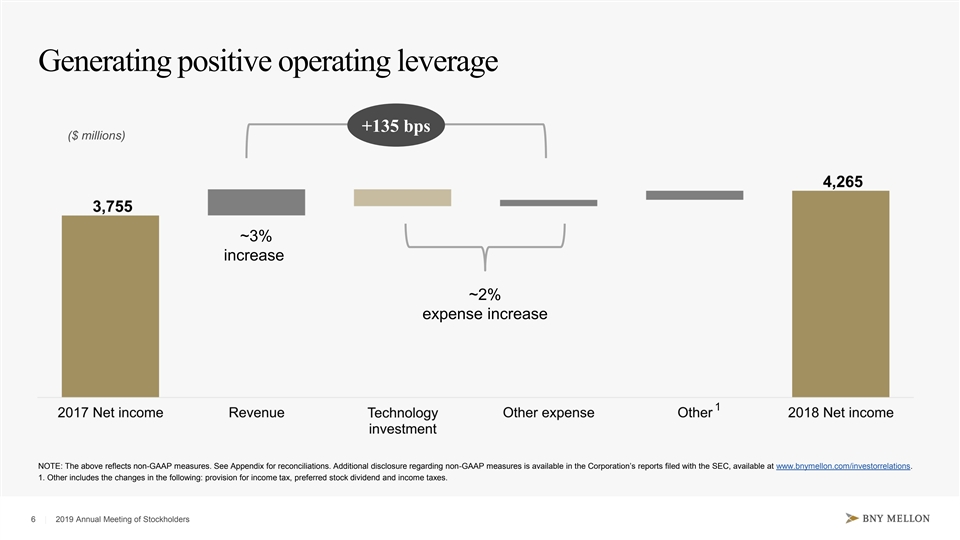
Generating positive operating leverage +135 bps ($ millions) ~3% increase ~2% expense increase 1 NOTE: The above reflects non-GAAP measures. See Appendix for reconciliations. Additional disclosure regarding non-GAAP measures is available in the Corporation’s reports filed with the SEC, available at www.bnymellon.com/investorrelations. 1. Other includes the changes in the following: provision for income tax, preferred stock dividend and income taxes. 6 | 2019 Annual Meeting of StockholdersGenerating positive operating leverage +135 bps ($ millions) ~3% increase ~2% expense increase 1 NOTE: The above reflects non-GAAP measures. See Appendix for reconciliations. Additional disclosure regarding non-GAAP measures is available in the Corporation’s reports filed with the SEC, available at www.bnymellon.com/investorrelations. 1. Other includes the changes in the following: provision for income tax, preferred stock dividend and income taxes. 6 | 2019 Annual Meeting of Stockholders

Returning majority of generated capital to shareholders 23.9% ($ millions) 22.5% 21.2% 19.7% +20% 16.0% 4,321 1 ROTCE 3,588 3,176 3,117 2,431 3,269 2,686 2,398 2,355 1,669 Share buy-back 1,052 902 778 762 762 Common dividends 2014 2015 2016 2017 2018 2 Total Payout Ratio 98% 102% 93% 92% 105% 1. ROTCE represents the Return on Tangible Common Shareholders’ Equity, a Non-GAAP measure, excludes goodwill and intangible assets, net of deferred tax liabilities. See Appendix for a reconciliation. 2. Total payout ratio excludes preferred dividends. 7 | 2019 Annual Meeting of StockholdersReturning majority of generated capital to shareholders 23.9% ($ millions) 22.5% 21.2% 19.7% +20% 16.0% 4,321 1 ROTCE 3,588 3,176 3,117 2,431 3,269 2,686 2,398 2,355 1,669 Share buy-back 1,052 902 778 762 762 Common dividends 2014 2015 2016 2017 2018 2 Total Payout Ratio 98% 102% 93% 92% 105% 1. ROTCE represents the Return on Tangible Common Shareholders’ Equity, a Non-GAAP measure, excludes goodwill and intangible assets, net of deferred tax liabilities. See Appendix for a reconciliation. 2. Total payout ratio excludes preferred dividends. 7 | 2019 Annual Meeting of Stockholders

Delivering progress on our priorities • Strong demand for offering in U.S. and UK Pershing Asset Servicing • Accelerating investments in RIA servicing and Markets • Launching new platform for CLO and traditional loan products as well as improved client reporting Issuer Services • Alliance with BlackRock • Added new sales and relationship management Solutions • Focused investments in • Extending collateral optimization services Clearance & Collateral servicing capabilities for alternative managers Management • Completed conversion of new government clearing clients • Real estate • New leadership • Credit managers Treasury Services • Focus on growing high-margin payment, FX and associated liability deposits from target • Private equity clients globally • Formed new team to build data • Consolidating in North America to create multi-asset capabilities through Mellon business • Investing in thematic, passives, alternatives, smart beta and LDI • Expanded foreign exchange Investment Management and securities lending options • New leadership in Wealth Management • Investing in goals-based advice tools and digital capabilities 8 | 2019 Annual Meeting of StockholdersDelivering progress on our priorities • Strong demand for offering in U.S. and UK Pershing Asset Servicing • Accelerating investments in RIA servicing and Markets • Launching new platform for CLO and traditional loan products as well as improved client reporting Issuer Services • Alliance with BlackRock • Added new sales and relationship management Solutions • Focused investments in • Extending collateral optimization services Clearance & Collateral servicing capabilities for alternative managers Management • Completed conversion of new government clearing clients • Real estate • New leadership • Credit managers Treasury Services • Focus on growing high-margin payment, FX and associated liability deposits from target • Private equity clients globally • Formed new team to build data • Consolidating in North America to create multi-asset capabilities through Mellon business • Investing in thematic, passives, alternatives, smart beta and LDI • Expanded foreign exchange Investment Management and securities lending options • New leadership in Wealth Management • Investing in goals-based advice tools and digital capabilities 8 | 2019 Annual Meeting of Stockholders

Announcing a new alliance: BNY Mellon and BlackRock Solutions 9 | 2019 Annual Meeting of StockholdersAnnouncing a new alliance: BNY Mellon and BlackRock Solutions 9 | 2019 Annual Meeting of Stockholders
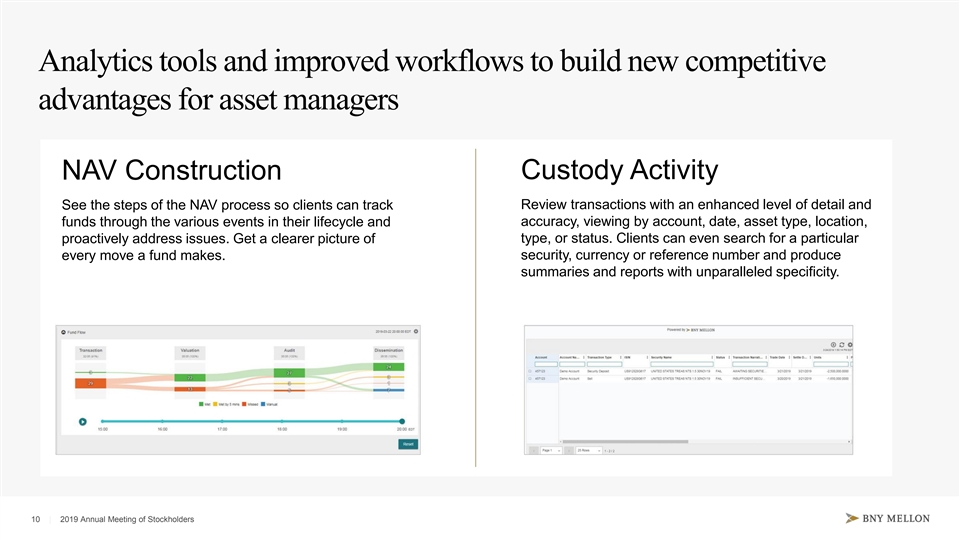
Analytics tools and improved workflows to build new competitive advantages for asset managers Custody Activity NAV Construction Review transactions with an enhanced level of detail and See the steps of the NAV process so clients can track accuracy, viewing by account, date, asset type, location, funds through the various events in their lifecycle and proactively address issues. Get a clearer picture of type, or status. Clients can even search for a particular every move a fund makes. security, currency or reference number and produce summaries and reports with unparalleled specificity. 10 | 2019 Annual Meeting of StockholdersAnalytics tools and improved workflows to build new competitive advantages for asset managers Custody Activity NAV Construction Review transactions with an enhanced level of detail and See the steps of the NAV process so clients can track accuracy, viewing by account, date, asset type, location, funds through the various events in their lifecycle and proactively address issues. Get a clearer picture of type, or status. Clients can even search for a particular every move a fund makes. security, currency or reference number and produce summaries and reports with unparalleled specificity. 10 | 2019 Annual Meeting of Stockholders
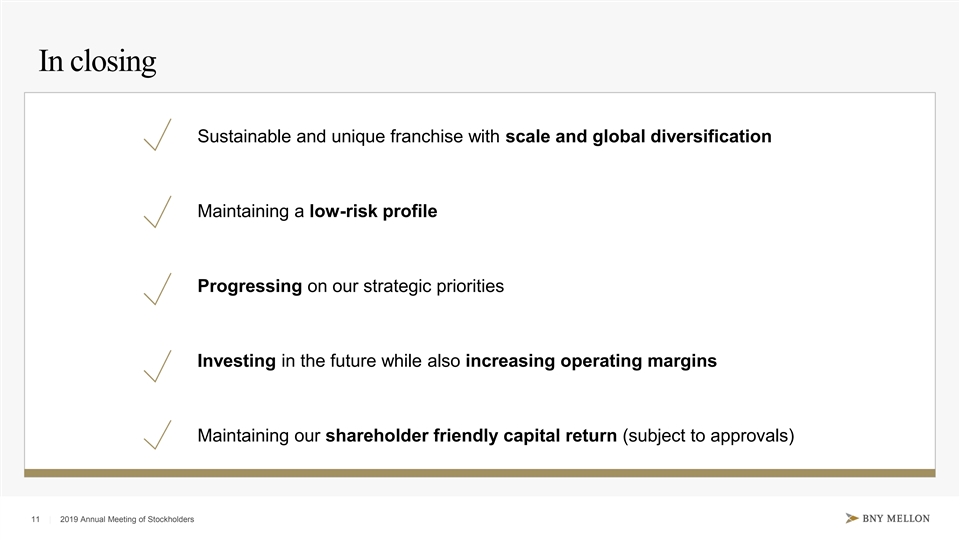
In closing Sustainable and unique franchise with scale and global diversification Maintaining a low-risk profile Progressing on our strategic priorities Investing in the future while also increasing operating margins Maintaining our shareholder friendly capital return (subject to approvals) 11 | 2019 Annual Meeting of StockholdersIn closing Sustainable and unique franchise with scale and global diversification Maintaining a low-risk profile Progressing on our strategic priorities Investing in the future while also increasing operating margins Maintaining our shareholder friendly capital return (subject to approvals) 11 | 2019 Annual Meeting of Stockholders

12 | 2019 Annual Meeting of Stockholders12 | 2019 Annual Meeting of Stockholders
Cautionary Statement • A number of statements in our presentations, the accompanying slides and the responses to your questions are “forward-looking statements.” Words such as “estimate”, “forecast”, “project”, “anticipate”, “target”, “expect”, “intend”, “continue”, “seek”, “believe”, “plan”, “goal”, “could”, “should”, “may”, “will”, “strategy”, “opportunities”, “trends” and words of similar meaning signify forward-looking statements. These statements relate to, among other things, The Bank of New York Mellon Corporation’s (the “Corporation”) expectations regarding: our risk profile, performance, capital plans, investments, strategic priorities, financial goals, client experience and revenue growth; and statements regarding the Corporation's aspirations, as well as the Corporation’s overall plans, strategies, goals, objectives, expectations, outlooks, estimates, intentions, targets, opportunities and initiatives. These forward-looking statements are based on assumptions that involve risks and uncertainties and that are subject to change based on various important factors (some of which are beyond the Corporation’s control). • Actual outcomes may differ materially from those expressed or implied as a result of the factors described under “Forward Looking Statements” and “Risk Factors” in the Corporation’s Annual Report on Form 10-K for the year ended December 31, 2018 (the “2018 Annual Report”) and in other filings of the Corporation with the Securities and Exchange Commission (the “SEC”). Such forward-looking statements speak only as of April 9, 2019, and the Corporation undertakes no obligation to update any forward-looking statement to reflect events or circumstances after that date or to reflect the occurrence of unanticipated events. For additional information regarding the Corporation, please refer to the Corporation's SEC filings available at www.bnymellon.com/investorrelations. • Non-GAAP Measures: In this presentation we discuss some non-GAAP measures in detailing the Corporation’s performance, which exclude certain items or otherwise include components that differ from GAAP. We believe these measures are useful to the investment community in analyzing the financial results and trends of ongoing operations. We believe they facilitate comparisons with prior periods and reflect the principal basis on which our management monitors financial performance. Additional disclosures relating to non-GAAP measures are contained in the Corporation’s reports filed with the SEC, including the 2018 Annual Report, and are available at www.bnymellon.com/investorrelations. 13 | 2019 Annual Meeting of StockholdersCautionary Statement • A number of statements in our presentations, the accompanying slides and the responses to your questions are “forward-looking statements.” Words such as “estimate”, “forecast”, “project”, “anticipate”, “target”, “expect”, “intend”, “continue”, “seek”, “believe”, “plan”, “goal”, “could”, “should”, “may”, “will”, “strategy”, “opportunities”, “trends” and words of similar meaning signify forward-looking statements. These statements relate to, among other things, The Bank of New York Mellon Corporation’s (the “Corporation”) expectations regarding: our risk profile, performance, capital plans, investments, strategic priorities, financial goals, client experience and revenue growth; and statements regarding the Corporation's aspirations, as well as the Corporation’s overall plans, strategies, goals, objectives, expectations, outlooks, estimates, intentions, targets, opportunities and initiatives. These forward-looking statements are based on assumptions that involve risks and uncertainties and that are subject to change based on various important factors (some of which are beyond the Corporation’s control). • Actual outcomes may differ materially from those expressed or implied as a result of the factors described under “Forward Looking Statements” and “Risk Factors” in the Corporation’s Annual Report on Form 10-K for the year ended December 31, 2018 (the “2018 Annual Report”) and in other filings of the Corporation with the Securities and Exchange Commission (the “SEC”). Such forward-looking statements speak only as of April 9, 2019, and the Corporation undertakes no obligation to update any forward-looking statement to reflect events or circumstances after that date or to reflect the occurrence of unanticipated events. For additional information regarding the Corporation, please refer to the Corporation's SEC filings available at www.bnymellon.com/investorrelations. • Non-GAAP Measures: In this presentation we discuss some non-GAAP measures in detailing the Corporation’s performance, which exclude certain items or otherwise include components that differ from GAAP. We believe these measures are useful to the investment community in analyzing the financial results and trends of ongoing operations. We believe they facilitate comparisons with prior periods and reflect the principal basis on which our management monitors financial performance. Additional disclosures relating to non-GAAP measures are contained in the Corporation’s reports filed with the SEC, including the 2018 Annual Report, and are available at www.bnymellon.com/investorrelations. 13 | 2019 Annual Meeting of Stockholders

Appendix 14 | 2019 Annual Meeting of StockholdersAppendix 14 | 2019 Annual Meeting of Stockholders

Disclosures Slide 3: BNY Mellon client data as of December 2018 Willis Towers Watson, October 30, 2018. Based on discretionary assets under management at the end of 2017; does not include saving/current accounts or assets unrelated to investment business, money market funds, advisory portfolios, or transactional assets. Analysis based on data supplied by third parties in U.S. dollars Investment Managers, Pensions and Employee Benefits: Pensions & Investments, P&I Crain Communications Inc. ©2019 Barron’s, “America’s Top 40 Wealth Management Firms,” September 24, 2018. Ranked by submitted assets under management Slide 4: Fortune 500: Fortune, Time Inc. ©2018 Broker-Dealers: Investment News, InvestmentNews LLC ©2019 Investment Managers, Pensions and Employee Benefits: Pensions & Investments, P&I Crain Communications Inc. ©2019 Life and Health Insurance Companies: A.M. Best, A.M. Best Company, Inc. ©2019 Banks: relbanks.com, Relbanks.com ©2011-2018 15 | 2019 Annual Meeting of StockholdersDisclosures Slide 3: BNY Mellon client data as of December 2018 Willis Towers Watson, October 30, 2018. Based on discretionary assets under management at the end of 2017; does not include saving/current accounts or assets unrelated to investment business, money market funds, advisory portfolios, or transactional assets. Analysis based on data supplied by third parties in U.S. dollars Investment Managers, Pensions and Employee Benefits: Pensions & Investments, P&I Crain Communications Inc. ©2019 Barron’s, “America’s Top 40 Wealth Management Firms,” September 24, 2018. Ranked by submitted assets under management Slide 4: Fortune 500: Fortune, Time Inc. ©2018 Broker-Dealers: Investment News, InvestmentNews LLC ©2019 Investment Managers, Pensions and Employee Benefits: Pensions & Investments, P&I Crain Communications Inc. ©2019 Life and Health Insurance Companies: A.M. Best, A.M. Best Company, Inc. ©2019 Banks: relbanks.com, Relbanks.com ©2011-2018 15 | 2019 Annual Meeting of Stockholders
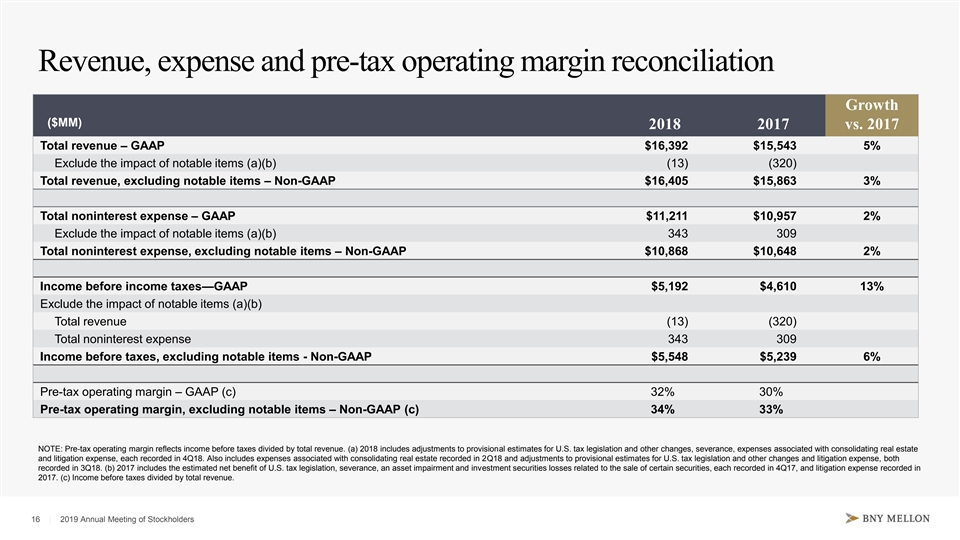
Revenue, expense and pre-tax operating margin reconciliation Growth ($MM) 2018 2017 vs. 2017 Total revenue – GAAP $16,392 $15,543 5% Exclude the impact of notable items (a)(b) (13) (320) Total revenue, excluding notable items – Non-GAAP $16,405 $15,863 3% Total noninterest expense – GAAP $11,211 $10,957 2% Exclude the impact of notable items (a)(b) 343 309 Total noninterest expense, excluding notable items – Non-GAAP $10,868 $10,648 2% Income before income taxes—GAAP $5,192 $4,610 13% Exclude the impact of notable items (a)(b) Total revenue (13) (320) Total noninterest expense 343 309 Income before taxes, excluding notable items - Non-GAAP $5,548 $5,239 6% Pre-tax operating margin – GAAP (c) 32% 30% Pre-tax operating margin, excluding notable items– Non-GAAP (c) 34% 33% NOTE: Pre-tax operating margin reflects income before taxes divided by total revenue. (a) 2018 includes adjustments to provisional estimates for U.S. tax legislation and other changes, severance, expenses associated with consolidating real estate and litigation expense, each recorded in 4Q18. Also includes expenses associated with consolidating real estate recorded in 2Q18 and adjustments to provisional estimates for U.S. tax legislation and other changes and litigation expense, both recorded in 3Q18. (b) 2017 includes the estimated net benefit of U.S. tax legislation, severance, an asset impairment and investment securities losses related to the sale of certain securities, each recorded in 4Q17, and litigation expense recorded in 2017. (c) Income before taxes divided by total revenue. 16 | 2019 Annual Meeting of StockholdersRevenue, expense and pre-tax operating margin reconciliation Growth ($MM) 2018 2017 vs. 2017 Total revenue – GAAP $16,392 $15,543 5% Exclude the impact of notable items (a)(b) (13) (320) Total revenue, excluding notable items – Non-GAAP $16,405 $15,863 3% Total noninterest expense – GAAP $11,211 $10,957 2% Exclude the impact of notable items (a)(b) 343 309 Total noninterest expense, excluding notable items – Non-GAAP $10,868 $10,648 2% Income before income taxes—GAAP $5,192 $4,610 13% Exclude the impact of notable items (a)(b) Total revenue (13) (320) Total noninterest expense 343 309 Income before taxes, excluding notable items - Non-GAAP $5,548 $5,239 6% Pre-tax operating margin – GAAP (c) 32% 30% Pre-tax operating margin, excluding notable items– Non-GAAP (c) 34% 33% NOTE: Pre-tax operating margin reflects income before taxes divided by total revenue. (a) 2018 includes adjustments to provisional estimates for U.S. tax legislation and other changes, severance, expenses associated with consolidating real estate and litigation expense, each recorded in 4Q18. Also includes expenses associated with consolidating real estate recorded in 2Q18 and adjustments to provisional estimates for U.S. tax legislation and other changes and litigation expense, both recorded in 3Q18. (b) 2017 includes the estimated net benefit of U.S. tax legislation, severance, an asset impairment and investment securities losses related to the sale of certain securities, each recorded in 4Q17, and litigation expense recorded in 2017. (c) Income before taxes divided by total revenue. 16 | 2019 Annual Meeting of Stockholders

Net income and EPS reconciliation 2018 2017 2018 vs. 2017 Diluted Diluted Diluted Results Results Results EPS EPS EPS ($MM) Net income applicable to common shareholders of The Bank of New York Mellon Corporation – GAAP $4,097 $4.04 $3,915 $3.72 5% 9% Exclude the impact of notable items: (a)(b) Total revenue (13) (320) Total noninterest expense 343 309 Provision for income taxes (188) (789) Net impact of notable items (168) (0.17) 160 0.15 Net income applicable to common shareholders of The Bank of New York Mellon Corporation, excluding notable items – Non-GAAP $4,265 $4.21 $3,755 $3.57 14% 18% (a) 2018 includes adjustments to provisional estimates for U.S. tax legislation and other changes, severance, expenses associated with consolidating real estate and litigation expense, each recorded in 4Q18. Also includes expenses associated with consolidating real estate recorded in 2Q18 and adjustments to provisional estimates for U.S. tax legislation and other changes and litigation expense, both recorded in 3Q18. (b) 2017 includes the estimated net benefit of U.S. tax legislation, severance, an asset impairment and investment securities losses related to the sale of certain securities, each recorded in 4Q17, and litigation expense recorded in 2017. 17 | 2019 Annual Meeting of StockholdersNet income and EPS reconciliation 2018 2017 2018 vs. 2017 Diluted Diluted Diluted Results Results Results EPS EPS EPS ($MM) Net income applicable to common shareholders of The Bank of New York Mellon Corporation – GAAP $4,097 $4.04 $3,915 $3.72 5% 9% Exclude the impact of notable items: (a)(b) Total revenue (13) (320) Total noninterest expense 343 309 Provision for income taxes (188) (789) Net impact of notable items (168) (0.17) 160 0.15 Net income applicable to common shareholders of The Bank of New York Mellon Corporation, excluding notable items – Non-GAAP $4,265 $4.21 $3,755 $3.57 14% 18% (a) 2018 includes adjustments to provisional estimates for U.S. tax legislation and other changes, severance, expenses associated with consolidating real estate and litigation expense, each recorded in 4Q18. Also includes expenses associated with consolidating real estate recorded in 2Q18 and adjustments to provisional estimates for U.S. tax legislation and other changes and litigation expense, both recorded in 3Q18. (b) 2017 includes the estimated net benefit of U.S. tax legislation, severance, an asset impairment and investment securities losses related to the sale of certain securities, each recorded in 4Q17, and litigation expense recorded in 2017. 17 | 2019 Annual Meeting of Stockholders

Return on common equity and tangible common equity reconciliation ($MM) 2018 2017 2016 2015 2014 Net income applicable to common shareholders of The Bank of New York Mellon $4,097 $3,915 $3,425 $3,053 $2,494 Corporation–GAAP 180 209 237 261 298 Add: Amortization of intangible assets Less: Tax impact of amortization of intangible assets 42 72 81 89 104 Adjusted net income applicable to common shareholders of The Bank of New York $4,235 $4,052 $3,581 3,225 2,688 Mellon Corporation excluding amortization of intangible assets–Non-GAAP $37,818 $36,145 $35,504 $35,564 $36,618 Average common shareholders’ equity 17,458 17,441 17,497 17,731 18,063 Less: Average goodwill 3,314 3,508 3,737 3,992 4,305 Average intangible assets 1,072 1,034 1,497 1,401 1,340 Add: Deferred tax liability–tax deductible goodwill (a) 692 718 1,105 1,148 1,216 Deferred tax liability–intangible assets (a) $18,810 $16,948 $16,872 $16,390 $16,806 Average tangible common shareholders’ equity – Non-GAAP Return on common shareholders’ equity – GAAP 10.8% 10.8% 9.6% 8.6% 6.8% 22.5% 23.9% 21.2% 19.7% 16.0% Return on tangible common shareholders’ equity–Non-GAAP (a) Deferred tax liabilities are based on fully phased-in U.S. capital rules 18 | 2019 Annual Meeting of StockholdersReturn on common equity and tangible common equity reconciliation ($MM) 2018 2017 2016 2015 2014 Net income applicable to common shareholders of The Bank of New York Mellon $4,097 $3,915 $3,425 $3,053 $2,494 Corporation–GAAP 180 209 237 261 298 Add: Amortization of intangible assets Less: Tax impact of amortization of intangible assets 42 72 81 89 104 Adjusted net income applicable to common shareholders of The Bank of New York $4,235 $4,052 $3,581 3,225 2,688 Mellon Corporation excluding amortization of intangible assets–Non-GAAP $37,818 $36,145 $35,504 $35,564 $36,618 Average common shareholders’ equity 17,458 17,441 17,497 17,731 18,063 Less: Average goodwill 3,314 3,508 3,737 3,992 4,305 Average intangible assets 1,072 1,034 1,497 1,401 1,340 Add: Deferred tax liability–tax deductible goodwill (a) 692 718 1,105 1,148 1,216 Deferred tax liability–intangible assets (a) $18,810 $16,948 $16,872 $16,390 $16,806 Average tangible common shareholders’ equity – Non-GAAP Return on common shareholders’ equity – GAAP 10.8% 10.8% 9.6% 8.6% 6.8% 22.5% 23.9% 21.2% 19.7% 16.0% Return on tangible common shareholders’ equity–Non-GAAP (a) Deferred tax liabilities are based on fully phased-in U.S. capital rules 18 | 2019 Annual Meeting of Stockholders
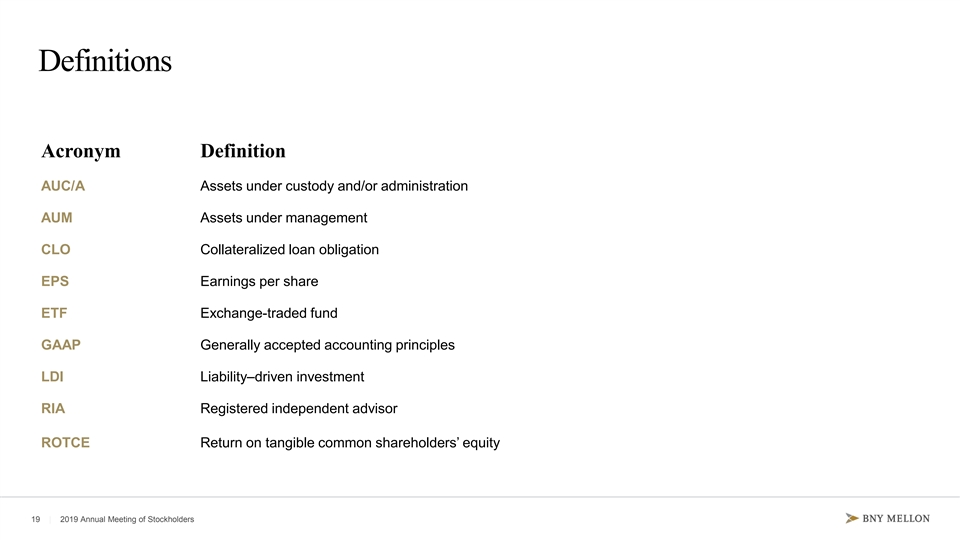
Definitions Acronym Definition AUC/A Assets under custody and/or administration AUM Assets under management CLO Collateralized loan obligation EPS Earnings per share ETF Exchange-traded fund GAAP Generally accepted accounting principles LDI Liability–driven investment RIA Registered independent advisor ROTCE Return on tangible common shareholders’ equity 19 | 2019 Annual Meeting of StockholdersDefinitions Acronym Definition AUC/A Assets under custody and/or administration AUM Assets under management CLO Collateralized loan obligation EPS Earnings per share ETF Exchange-traded fund GAAP Generally accepted accounting principles LDI Liability–driven investment RIA Registered independent advisor ROTCE Return on tangible common shareholders’ equity 19 | 2019 Annual Meeting of Stockholders

20 | 2019 Annual Meeting of Stockholders20 | 2019 Annual Meeting of Stockholders


