
April 15, 2020 Exhibit 99.1
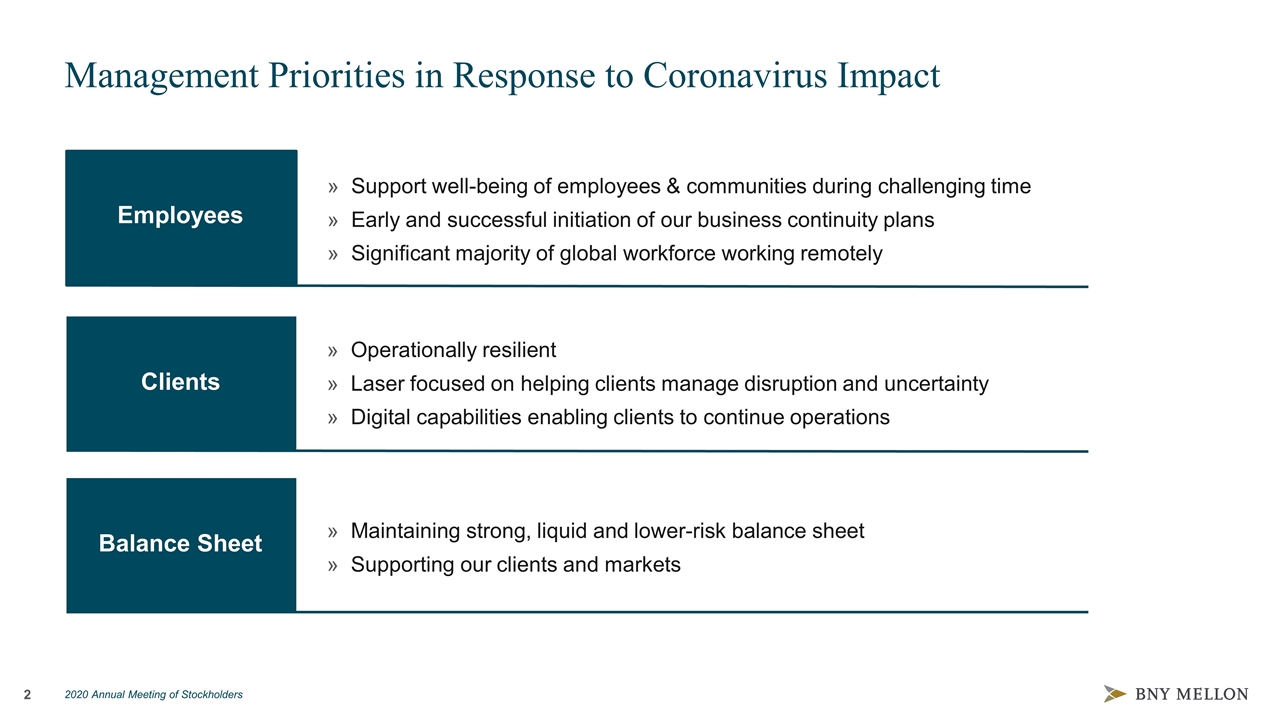
Management Priorities in Response to Coronavirus Impact Support well-being of employees & communities during challenging time Early and successful initiation of our business continuity plans Significant majority of global workforce working remotely Maintaining strong, liquid and lower-risk balance sheet Supporting our clients and markets Operationally resilient Laser focused on helping clients manage disruption and uncertainty Digital capabilities enabling clients to continue operations Employees Clients Balance Sheet
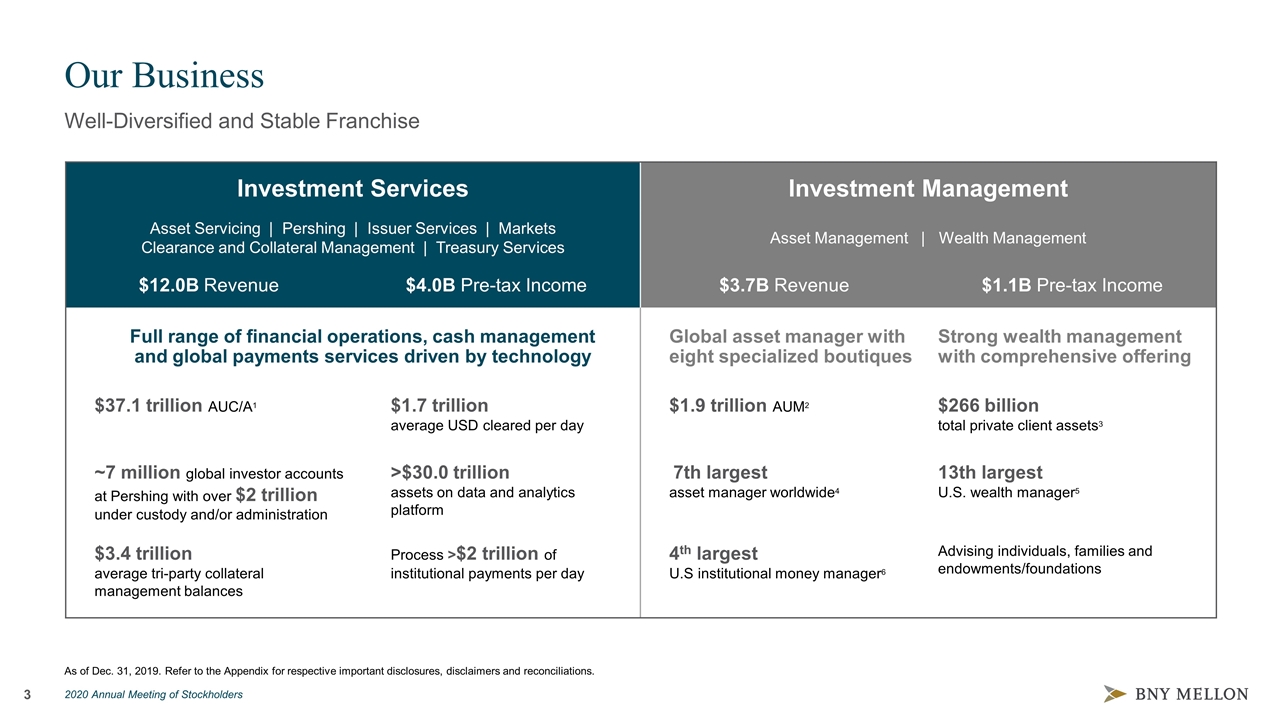
Our Business Well-Diversified and Stable Franchise As of Dec. 31, 2019. Refer to the Appendix for respective important disclosures, disclaimers and reconciliations. Investment Services Investment Management Asset Servicing | Pershing | Issuer Services | Markets Clearance and Collateral Management | Treasury Services Asset Management | Wealth Management $12.0B Revenue $4.0B Pre-tax Income $3.7B Revenue $1.1B Pre-tax Income Full range of financial operations, cash management and global payments services driven by technology Global asset manager with eight specialized boutiques Strong wealth management with comprehensive offering $37.1 trillion AUC/A1 $1.7 trillion average USD cleared per day $1.7 trillion average USD cleared per day $1.9 trillion AUM2 $266 billion total private client assets3 ~7 million global investor accounts at Pershing with over $2 trillion under custody and/or administration >$30.0 trillion assets on data and analytics platform >$30.0 trillion assets on data and analytics platform 7th largest asset manager worldwide4 13th largest U.S. wealth manager5 $3.4 trillion average tri-party collateral management balances Process >$2 trillion of institutional payments per day Process >$2 trillion of institutional payments per day 4th largest U.S institutional money manager6 Advising individuals, families and endowments/foundations
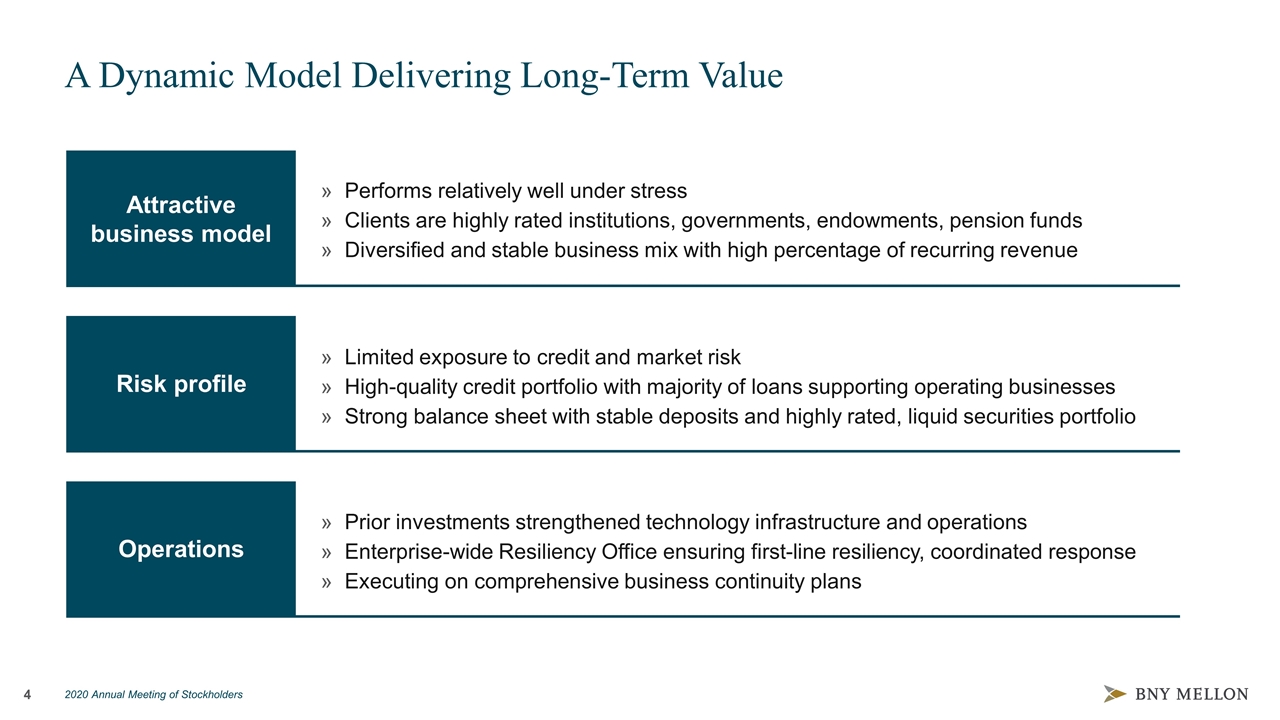
Prior investments strengthened technology infrastructure and operations Enterprise-wide Resiliency Office ensuring first-line resiliency, coordinated response Executing on comprehensive business continuity plans A Dynamic Model Delivering Long-Term Value Performs relatively well under stress Clients are highly rated institutions, governments, endowments, pension funds Diversified and stable business mix with high percentage of recurring revenue Limited exposure to credit and market risk High-quality credit portfolio with majority of loans supporting operating businesses Strong balance sheet with stable deposits and highly rated, liquid securities portfolio Attractive business model Risk profile Operations
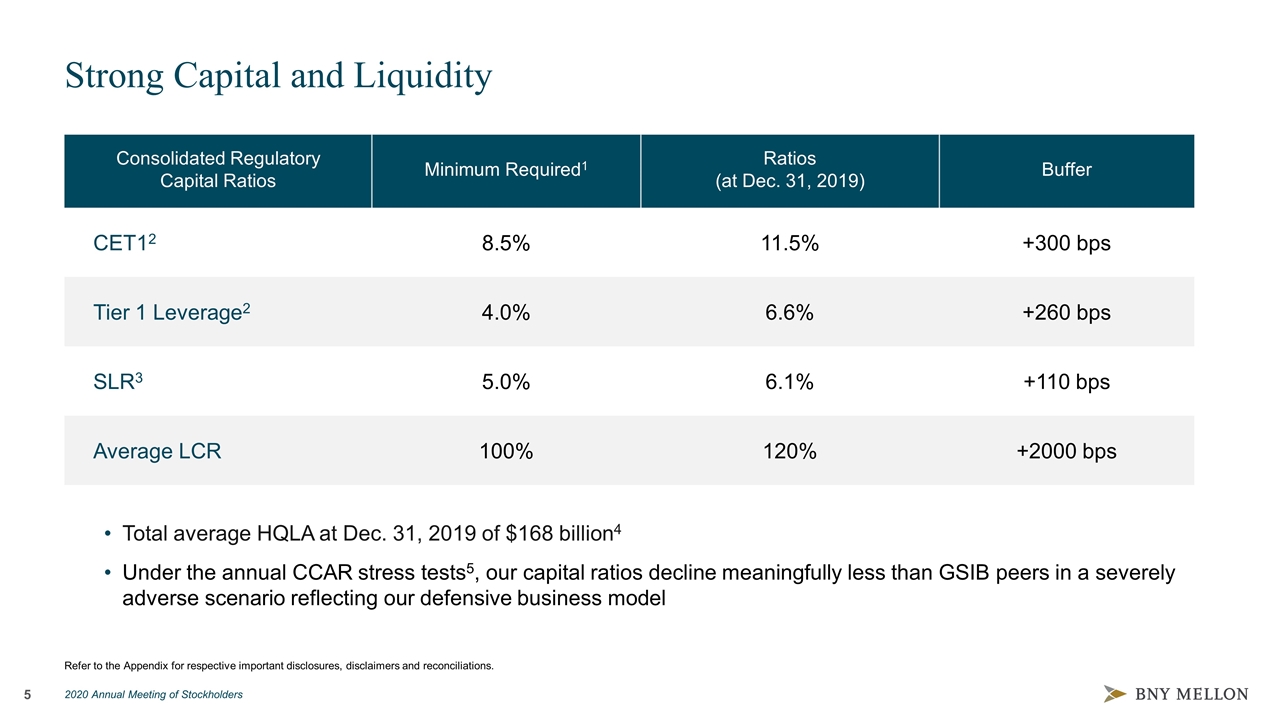
Strong Capital and Liquidity Refer to the Appendix for respective important disclosures, disclaimers and reconciliations. Consolidated Regulatory Capital Ratios Minimum Required1 Ratios (at Dec. 31, 2019) Buffer CET12 8.5% 11.5% +300 bps Tier 1 Leverage2 4.0% 6.6% +260 bps SLR3 5.0% 6.1% +110 bps Average LCR 100% 120% +2000 bps Total average HQLA at Dec. 31, 2019 of $168 billion4 Under the annual CCAR stress tests5, our capital ratios decline meaningfully less than GSIB peers in a severely adverse scenario reflecting our defensive business model
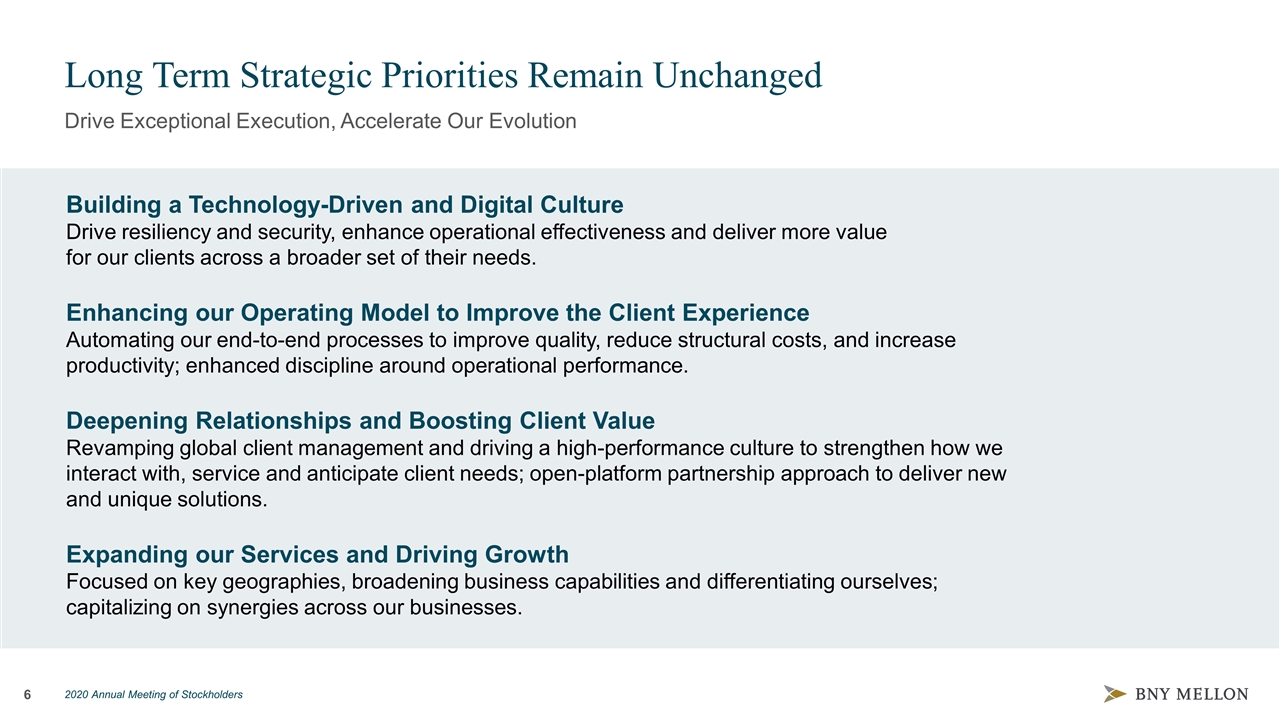
Long Term Strategic Priorities Remain Unchanged Drive Exceptional Execution, Accelerate Our Evolution Building a Technology-Driven and Digital Culture Drive resiliency and security, enhance operational effectiveness and deliver more value for our clients across a broader set of their needs. Enhancing our Operating Model to Improve the Client Experience Automating our end-to-end processes to improve quality, reduce structural costs, and increase productivity; enhanced discipline around operational performance. Deepening Relationships and Boosting Client Value Revamping global client management and driving a high-performance culture to strengthen how we interact with, service and anticipate client needs; open-platform partnership approach to deliver new and unique solutions. Expanding our Services and Driving Growth Focused on key geographies, broadening business capabilities and differentiating ourselves; capitalizing on synergies across our businesses.
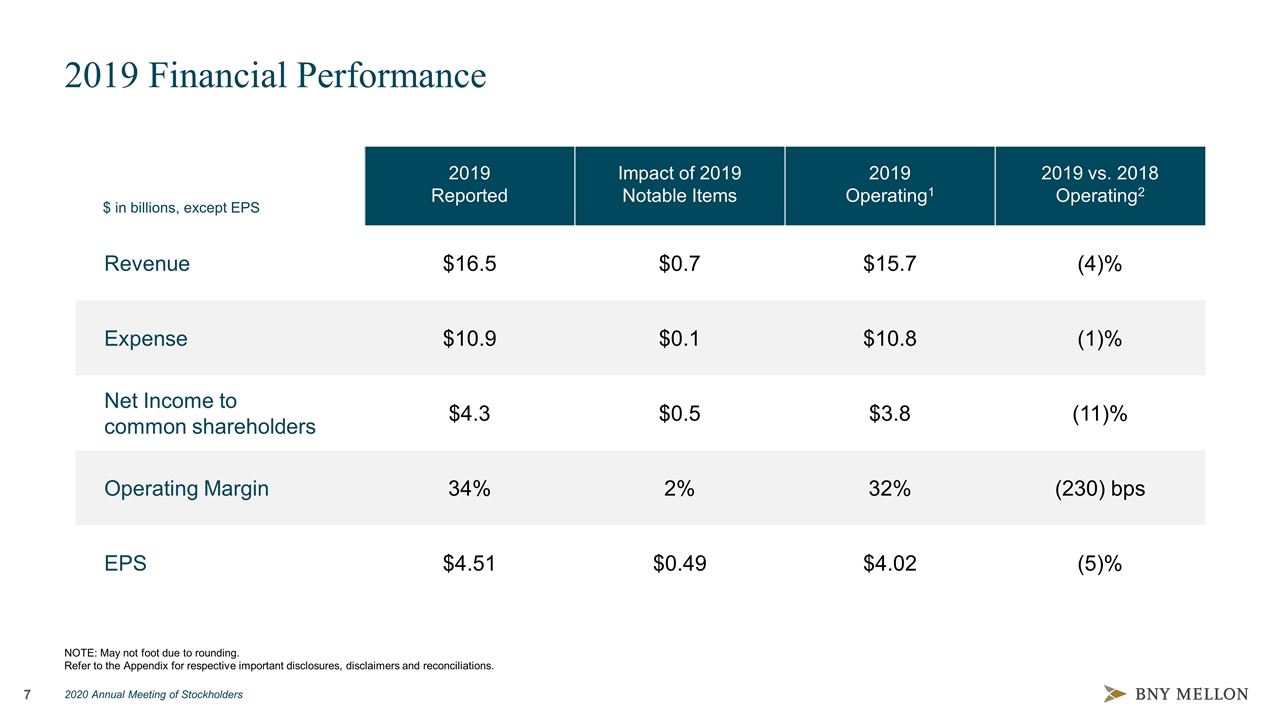
2019 Financial Performance NOTE: May not foot due to rounding. Refer to the Appendix for respective important disclosures, disclaimers and reconciliations. $ in billions, except EPS 2019 Reported Impact of 2019 Notable Items 2019 Operating1 2019 vs. 2018 Operating2 Revenue $16.5 $0.7 $15.7 (4)% Expense $10.9 $0.1 $10.8 (1)% Net Income to common shareholders $4.3 $0.5 $3.8 (11)% Operating Margin 34% 2% 32% (230) bps EPS $4.51 $0.49 $4.02 (5)%
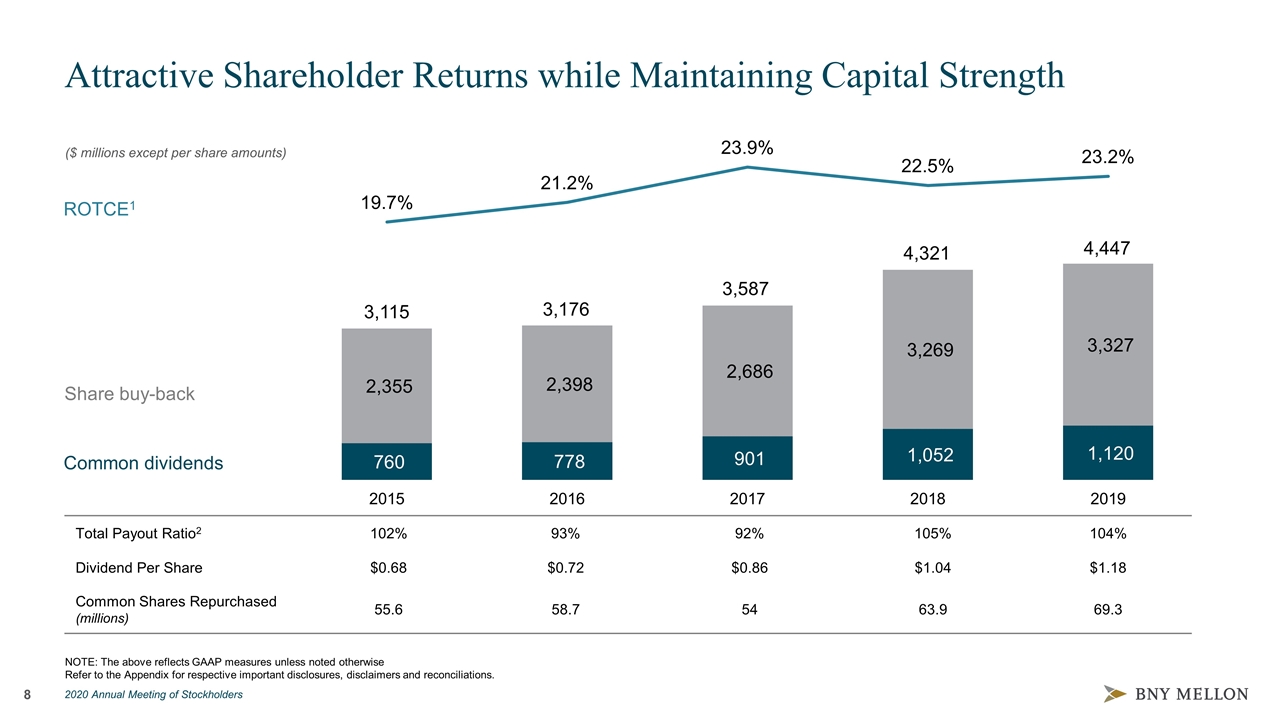
Attractive Shareholder Returns while Maintaining Capital Strength 3,115 3,176 3,587 4,447 Total Payout Ratio2 102% 93% 92% 105% 104% Dividend Per Share $0.68 $0.72 $0.86 $1.04 $1.18 Common Shares Repurchased (millions) 55.6 58.7 54 63.9 69.3 ($ millions except per share amounts) Common dividends Share buy-back ROTCE1 4,321 NOTE: The above reflects GAAP measures unless noted otherwise Refer to the Appendix for respective important disclosures, disclaimers and reconciliations.
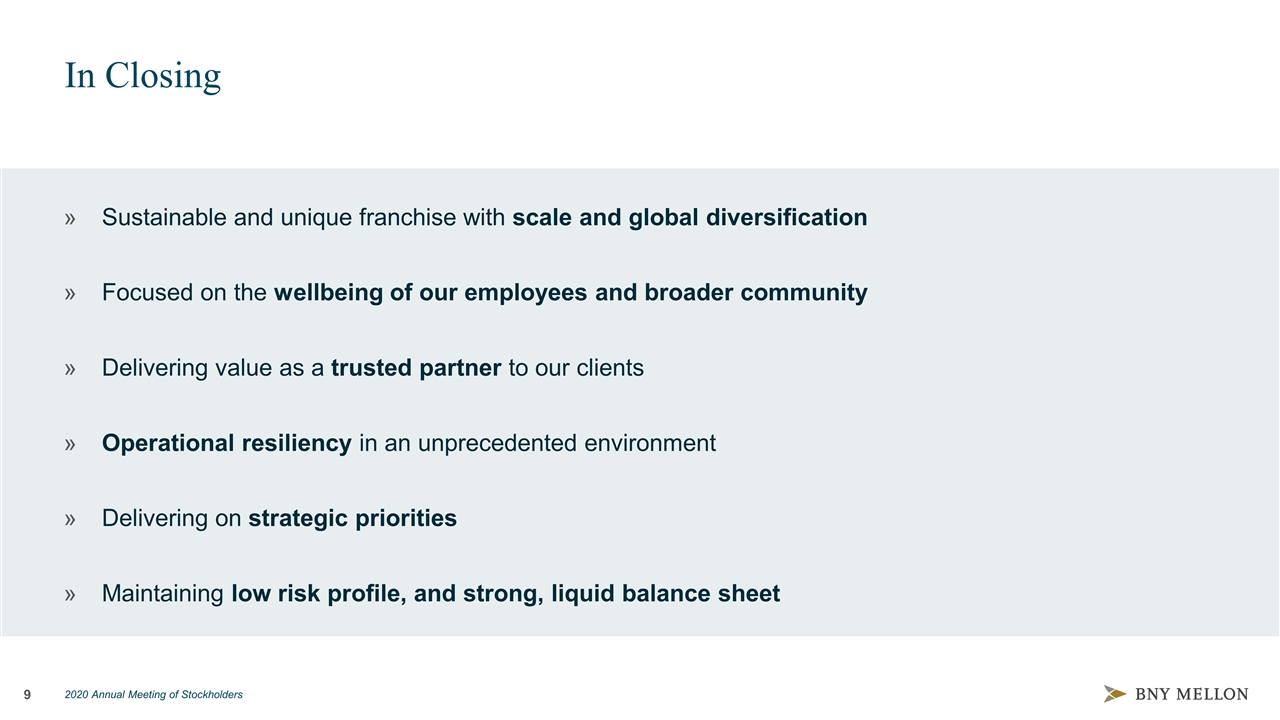
In Closing Sustainable and unique franchise with scale and global diversification Focused on the wellbeing of our employees and broader community Delivering value as a trusted partner to our clients Operational resiliency in an unprecedented environment Delivering on strategic priorities Maintaining low risk profile, and strong, liquid balance sheet

Q&A 2020 ANNUAL MEETING OF STOCKHOLDERS

Cautionary Statement A number of statements in our presentations, the accompanying slides and the responses to your questions are “forward-looking statements.” Words such as “estimate,” “forecast,” “project,” “anticipate,” “likely,” “target,” “expect,” “intend,” “continue,” “seek,” “believe,” “plan,” “goal,” “could,” “should,” “would,” “may,” “might,” “will,” “strategy,” “synergies,” “opportunities,” “trends,” “future” and words of similar meaning signify forward-looking statements. These statements relate to, among other things, The Bank of New York Mellon Corporation’s (the “Corporation”) expectations regarding: capital plans, strategic priorities, financial goals, organic growth, performance, organizational quality and efficiency, investments, including in technology and product development, capabilities, resiliency, revenue, net interest revenue, fees, expenses, cost discipline, sustainable growth, company management, deposits, interest rates and yield curves, securities portfolio, taxes, business opportunities, divestments, volatility, preliminary business metrics and regulatory capital ratios; and statements regarding the Corporation's aspirations, as well as the Corporation’s overall plans, strategies, goals, objectives, expectations, outlooks, estimates, intentions, targets, opportunities and initiatives. These forward-looking statements are based on assumptions that involve risks and uncertainties and that are subject to change based on various important factors (some of which are beyond the Corporation’s control). Actual outcomes may differ materially from those expressed or implied as a result of the factors described under “Forward Looking Statements” and “Risk Factors” in the Corporation’s Annual Report on Form 10-K for the year ended December 31, 2019 (the “2019 Annual Report”) and in other filings of the Corporation with the Securities and Exchange Commission (the “SEC”). All forward-looking statements speak only as of April 15, 2020, and the Corporation undertakes no obligation to update any forward-looking statement to reflect events or circumstances after that date or to reflect the occurrence of unanticipated events. For additional information regarding the Corporation, please refer to the Corporation's SEC filings available at www.bnymellon.com/investorrelations. Non-GAAP Measures: In this presentation we discuss some non-GAAP measures in detailing the Corporation’s performance, which exclude certain items or otherwise include components that differ from GAAP. We believe these measures are useful to the investment community in analyzing the financial results and trends of ongoing operations. We believe they facilitate comparisons with prior periods and reflect the principal basis on which our management monitors financial performance. Additional disclosures relating to non-GAAP measures are contained in the Corporation’s reports filed with the SEC, including the 2019 Annual Report, and are available at www.bnymellon.com/investorrelations.

Appendix 2020 ANNUAL MEETING OF STOCKHOLDERS
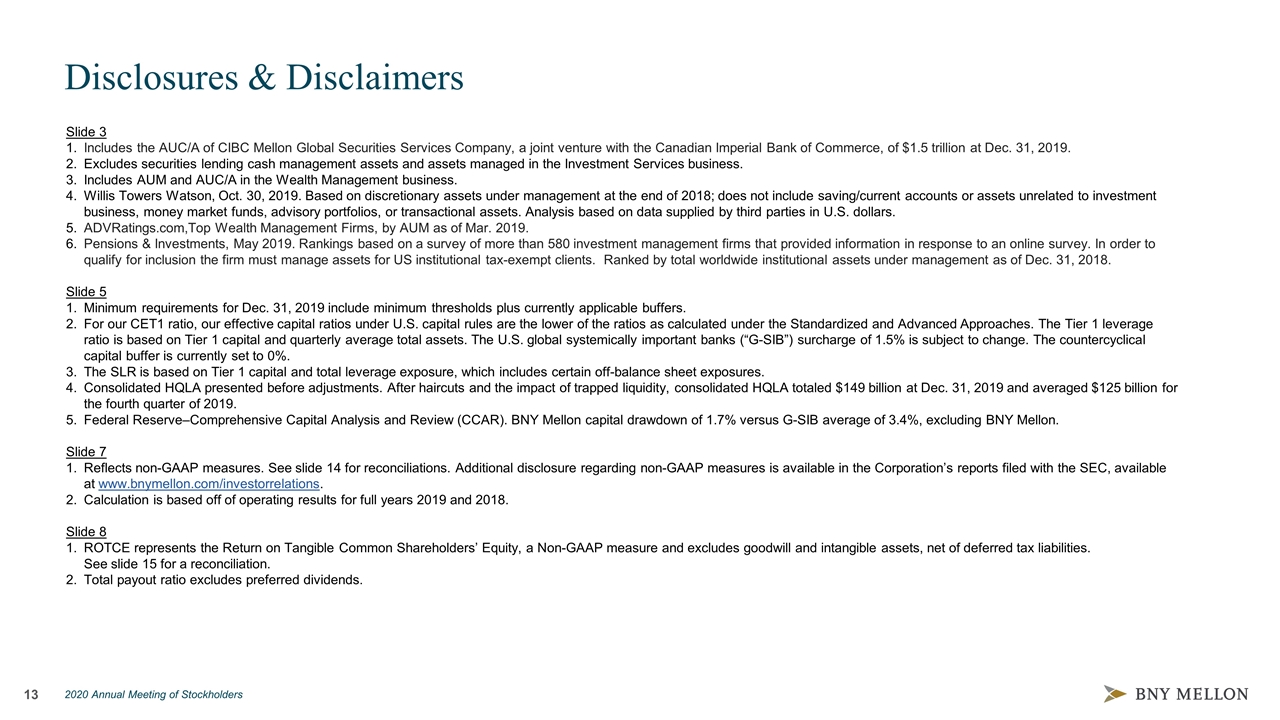
Slide 3 Includes the AUC/A of CIBC Mellon Global Securities Services Company, a joint venture with the Canadian Imperial Bank of Commerce, of $1.5 trillion at Dec. 31, 2019. Excludes securities lending cash management assets and assets managed in the Investment Services business. Includes AUM and AUC/A in the Wealth Management business. Willis Towers Watson, Oct. 30, 2019. Based on discretionary assets under management at the end of 2018; does not include saving/current accounts or assets unrelated to investment business, money market funds, advisory portfolios, or transactional assets. Analysis based on data supplied by third parties in U.S. dollars. ADVRatings.com,Top Wealth Management Firms, by AUM as of Mar. 2019. Pensions & Investments, May 2019. Rankings based on a survey of more than 580 investment management firms that provided information in response to an online survey. In order to qualify for inclusion the firm must manage assets for US institutional tax-exempt clients. Ranked by total worldwide institutional assets under management as of Dec. 31, 2018. Slide 5 Minimum requirements for Dec. 31, 2019 include minimum thresholds plus currently applicable buffers. For our CET1 ratio, our effective capital ratios under U.S. capital rules are the lower of the ratios as calculated under the Standardized and Advanced Approaches. The Tier 1 leverage ratio is based on Tier 1 capital and quarterly average total assets. The U.S. global systemically important banks (“G-SIB”) surcharge of 1.5% is subject to change. The countercyclical capital buffer is currently set to 0%. The SLR is based on Tier 1 capital and total leverage exposure, which includes certain off-balance sheet exposures. Consolidated HQLA presented before adjustments. After haircuts and the impact of trapped liquidity, consolidated HQLA totaled $149 billion at Dec. 31, 2019 and averaged $125 billion for the fourth quarter of 2019. Federal Reserve–Comprehensive Capital Analysis and Review (CCAR). BNY Mellon capital drawdown of 1.7% versus G-SIB average of 3.4%, excluding BNY Mellon. Slide 7 Reflects non-GAAP measures. See slide 14 for reconciliations. Additional disclosure regarding non-GAAP measures is available in the Corporation’s reports filed with the SEC, available at www.bnymellon.com/investorrelations. Calculation is based off of operating results for full years 2019 and 2018. Slide 8 ROTCE represents the Return on Tangible Common Shareholders’ Equity, a Non-GAAP measure and excludes goodwill and intangible assets, net of deferred tax liabilities. See slide 15 for a reconciliation. Total payout ratio excludes preferred dividends.
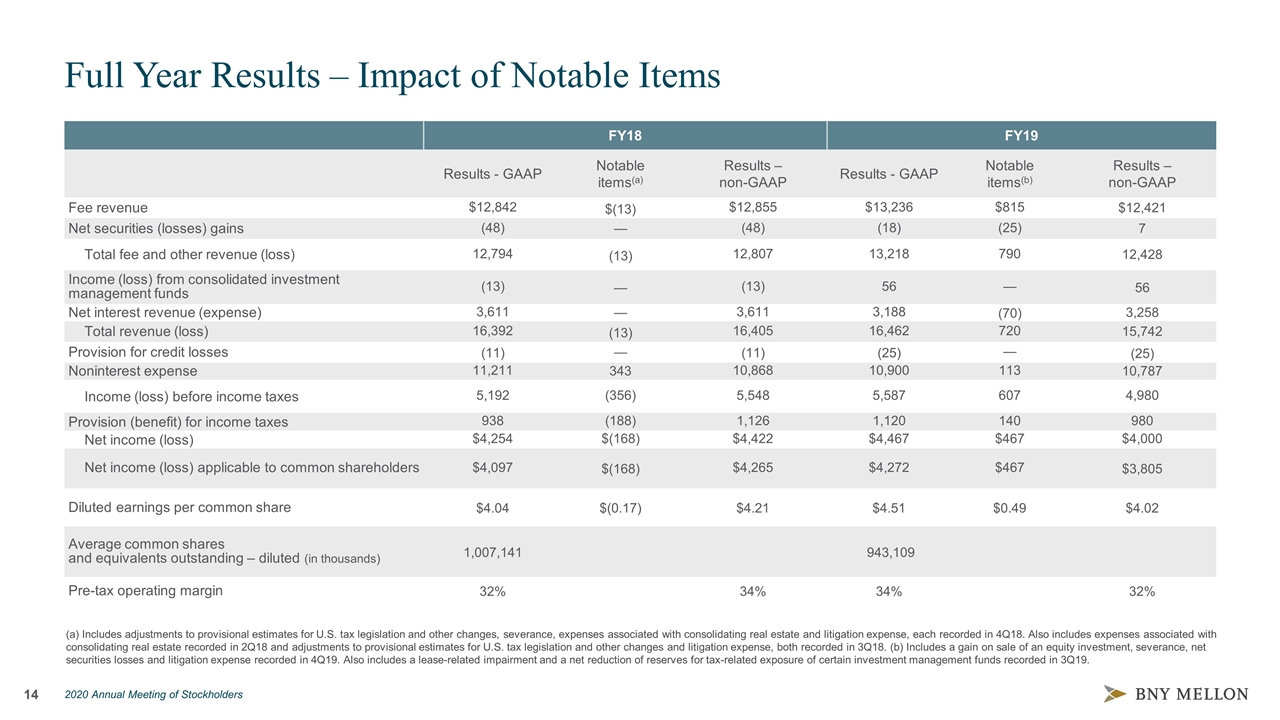
Full Year Results – Impact of Notable Items FY18 FY19 Results - GAAP Notable items(a) Results – non-GAAP Results - GAAP Notable items(b) Results – non-GAAP Fee revenue $12,842 $(13) $12,855 $13,236 $815 $12,421 Net securities (losses) gains (48) — (48) (18) (25) 7 Total fee and other revenue (loss) 12,794 (13) 12,807 13,218 790 12,428 Income (loss) from consolidated investment management funds (13) — (13) 56 — 56 Net interest revenue (expense) 3,611 — 3,611 3,188 (70) 3,258 Total revenue (loss) 16,392 (13) 16,405 16,462 720 15,742 Provision for credit losses (11) — (11) (25) — (25) Noninterest expense 11,211 343 10,868 10,900 113 10,787 Income (loss) before income taxes 5,192 (356) 5,548 5,587 607 4,980 Provision (benefit) for income taxes 938 (188) 1,126 1,120 140 980 Net income (loss) $4,254 $(168) $4,422 $4,467 $467 $4,000 Net income (loss) applicable to common shareholders $4,097 $(168) $4,265 $4,272 $467 $3,805 Diluted earnings per common share $4.04 $(0.17) $4.21 $4.51 $0.49 $4.02 Average common shares and equivalents outstanding – diluted (in thousands) 1,007,141 943,109 Pre-tax operating margin 32% 34% 34% 32% (a) Includes adjustments to provisional estimates for U.S. tax legislation and other changes, severance, expenses associated with consolidating real estate and litigation expense, each recorded in 4Q18. Also includes expenses associated with consolidating real estate recorded in 2Q18 and adjustments to provisional estimates for U.S. tax legislation and other changes and litigation expense, both recorded in 3Q18. (b) Includes a gain on sale of an equity investment, severance, net securities losses and litigation expense recorded in 4Q19. Also includes a lease-related impairment and a net reduction of reserves for tax-related exposure of certain investment management funds recorded in 3Q19.
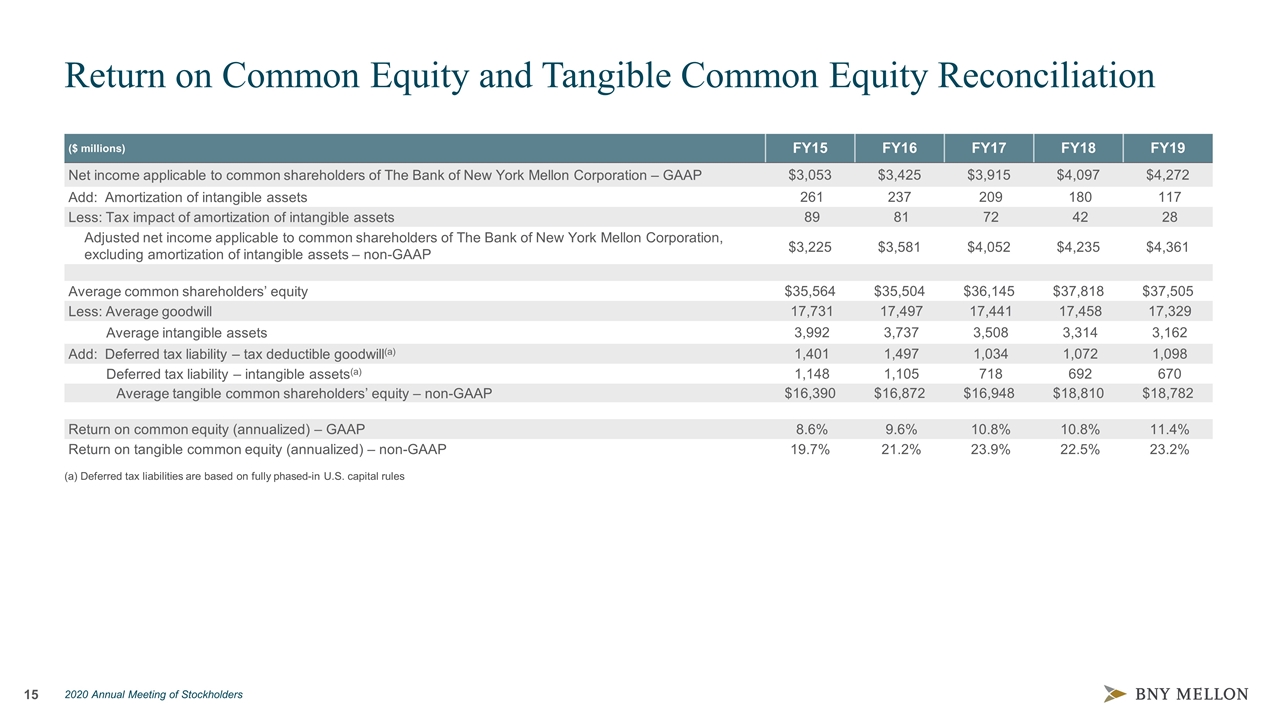
Return on Common Equity and Tangible Common Equity Reconciliation ($ millions) FY15 FY16 FY17 FY18 FY19 Net income applicable to common shareholders of The Bank of New York Mellon Corporation – GAAP $3,053 $3,425 $3,915 $4,097 $4,272 Add: Amortization of intangible assets 261 237 209 180 117 Less: Tax impact of amortization of intangible assets 89 81 72 42 28 Adjusted net income applicable to common shareholders of The Bank of New York Mellon Corporation, excluding amortization of intangible assets – non-GAAP $3,225 $3,581 $4,052 $4,235 $4,361 Average common shareholders’ equity $35,564 $35,504 $36,145 $37,818 $37,505 Less: Average goodwill 17,731 17,497 17,441 17,458 17,329 Average intangible assets 3,992 3,737 3,508 3,314 3,162 Add: Deferred tax liability – tax deductible goodwill(a) 1,401 1,497 1,034 1,072 1,098 Deferred tax liability – intangible assets(a) 1,148 1,105 718 692 670 Average tangible common shareholders’ equity – non-GAAP $16,390 $16,872 $16,948 $18,810 $18,782 Return on common equity (annualized) – GAAP 8.6% 9.6% 10.8% 10.8% 11.4% Return on tangible common equity (annualized) – non-GAAP 19.7% 21.2% 23.9% 22.5% 23.2% (a) Deferred tax liabilities are based on fully phased-in U.S. capital rules
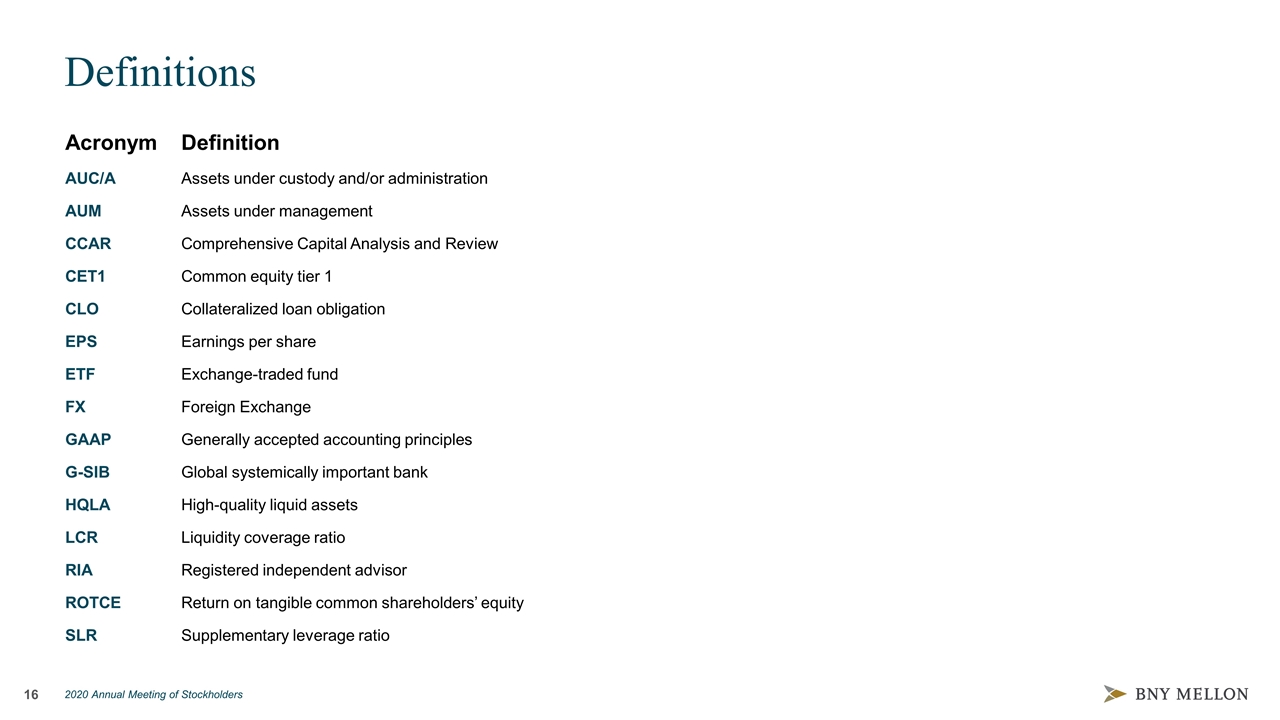
Definitions Acronym Definition AUC/A Assets under custody and/or administration AUM Assets under management CCAR Comprehensive Capital Analysis and Review CET1 Common equity tier 1 CLO Collateralized loan obligation EPS Earnings per share ETF Exchange-traded fund FX Foreign Exchange GAAP Generally accepted accounting principles G-SIB Global systemically important bank HQLA High-quality liquid assets LCR Liquidity coverage ratio RIA Registered independent advisor ROTCE Return on tangible common shareholders’ equity SLR Supplementary leverage ratio


