BNY Mellon Fourth Quarter 2015 Financial Highlights January 21, 2016
2 Fourth Quarter 2015 – Financial Highlights Cautionary Statement A number of statements in our presentations, the accompanying slides and the responses to your questions are “forward-looking statements.” Words such as “estimate”, “forecast”, “project”, “anticipate”, “target”, “expect”, “intend”, “continue”, “seek”, “believe”, “plan”, “goal”, “could”, “should”, “may”, “will”, “strategy”, “opportunities”, “trends” and words of similar meaning signify forward-looking statements. These statements relate to, among other things, The Bank of New York Mellon Corporation’s (the “Corporation”) expectations regarding: strategic priorities, financial goals, business improvement process, capital plans, estimated capital ratios and expectations regarding those ratios; preliminary business metrics; and statements regarding the Corporation's aspirations, as well as the Corporation’s overall plans, strategies, goals, objectives, expectations, estimates, intentions, targets, opportunities and initiatives. These forward-looking statements are based on assumptions that involve risks and uncertainties and that are subject to change based on various important factors (some of which are beyond the Corporation’s control). Actual results may differ materially from those expressed or implied as a result of the factors described under “Forward Looking Statements” and “Risk Factors” in the Corporation’s Annual Report on Form 10-K for the year ended December 31, 2014 (the “2014 Annual Report”), and in other filings of the Corporation with the Securities and Exchange Commission (the “SEC”). Such forward-looking statements speak only as of January 21, 2016, and the Corporation undertakes no obligation to update any forward-looking statement to reflect events or circumstances after that date or to reflect the occurrence of unanticipated events. Non-GAAP Measures: In this presentation we may discuss some non-GAAP measures in detailing the Corporation’s performance, which exclude certain items or otherwise include components that differ from GAAP. We believe these measures are useful to the investment community in analyzing the financial results and trends of ongoing operations. We believe they facilitate comparisons with prior periods and reflect the principal basis on which our management monitors financial performance. Additional disclosures relating to non-GAAP adjusted measures are contained in the Corporation’s reports filed with the SEC, including the 2014 Annual Report and the Corporation's Earnings Release for the quarter ended December 31, 2015, included as an exhibit to our Current Report on Form 8-K filed on January 21, 2016 (the “Earnings Release”), available at www.bnymellon.com/investorrelations.
3 Fourth Quarter 2015 – Financial Highlights Fourth Quarter and Full-Year 2015 Financial Highlights 4Q15 (4Q15 vs. 4Q14) • Earnings per common share of $0.57, including: • $0.11 per common share for the previously disclosed impairment charge related to a recent court decision, litigation and restructuring charges • Earnings per common share +17% on an adjusted basis1 • Generated more than 300 bps of positive operating leverage on an adjusted basis1 • Total revenue +2% on an adjusted basis1 ▪ Net interest revenue +7% • Total noninterest expense (2%) on an adjusted basis1 • Executing on capital plan and return of value to common shareholders • Repurchased 10.1 million common shares for $431 million • Return on tangible common equity1 of 16%; 19% on an adjusted basis1 FY 2015 (FY 2015 vs. FY 2014) • Earnings per common share of $2.71, including: • $0.14 per common share for the previously disclosed impairment charge related to a recent court decision, litigation and restructuring charges • Earnings per common share +19% on an adjusted basis1 • Generated more than 400 bps of positive operating leverage on an adjusted basis1 • $1,191 billion of estimated AUC/A new business wins • $3.1 billion of value returned to shareholders in the form of common stock dividends and share repurchases • Return on tangible common equity1 of 20%; 21% on an adjusted basis1 1 Represents a Non-GAAP measure. See Appendix for reconciliations. Additional disclosures regarding these measures and other Non-GAAP adjusted measures are available in the Corporation’s reports filed with the SEC, available at www.bnymellon.com/investorrelations. Note: Pre-tax operating leverage is the rate of increase in total revenue less the rate of increase in total noninterest expense. bps - basis points
4 Fourth Quarter 2015 – Financial Highlights Fourth Quarter 2015 Key Messages • Executing on our strategic priorities; delivering on our three-year financial goals set at our 2014 Investor Day • Focused on enhancing the client experience ◦ Deepening existing client relationships and selectively adding new business • Continued progress on our Business Improvement Process from investments to leverage scale, increase efficiency and effectiveness, and reduce risk and structural costs • Continue to return significant value to shareholders through share repurchases and dividends
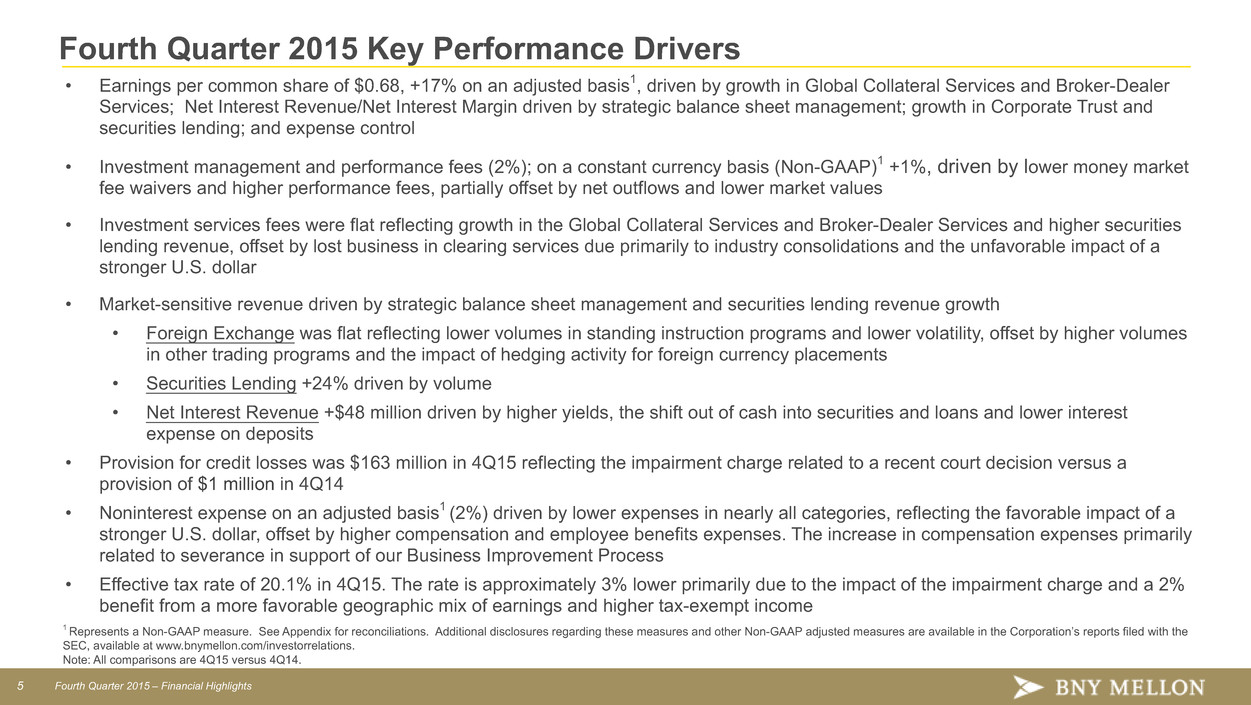
5 Fourth Quarter 2015 – Financial Highlights Fourth Quarter 2015 Key Performance Drivers • Earnings per common share of $0.68, +17% on an adjusted basis1, driven by growth in Global Collateral Services and Broker-Dealer Services; Net Interest Revenue/Net Interest Margin driven by strategic balance sheet management; growth in Corporate Trust and securities lending; and expense control • Investment management and performance fees (2%); on a constant currency basis (Non-GAAP)1 +1%, driven by lower money market fee waivers and higher performance fees, partially offset by net outflows and lower market values • Investment services fees were flat reflecting growth in the Global Collateral Services and Broker-Dealer Services and higher securities lending revenue, offset by lost business in clearing services due primarily to industry consolidations and the unfavorable impact of a stronger U.S. dollar • Market-sensitive revenue driven by strategic balance sheet management and securities lending revenue growth • Foreign Exchange was flat reflecting lower volumes in standing instruction programs and lower volatility, offset by higher volumes in other trading programs and the impact of hedging activity for foreign currency placements • Securities Lending +24% driven by volume • Net Interest Revenue +$48 million driven by higher yields, the shift out of cash into securities and loans and lower interest expense on deposits • Provision for credit losses was $163 million in 4Q15 reflecting the impairment charge related to a recent court decision versus a provision of $1 million in 4Q14 • Noninterest expense on an adjusted basis1 (2%) driven by lower expenses in nearly all categories, reflecting the favorable impact of a stronger U.S. dollar, offset by higher compensation and employee benefits expenses. The increase in compensation expenses primarily related to severance in support of our Business Improvement Process • Effective tax rate of 20.1% in 4Q15. The rate is approximately 3% lower primarily due to the impact of the impairment charge and a 2% benefit from a more favorable geographic mix of earnings and higher tax-exempt income 1 Represents a Non-GAAP measure. See Appendix for reconciliations. Additional disclosures regarding these measures and other Non-GAAP adjusted measures are available in the Corporation’s reports filed with the SEC, available at www.bnymellon.com/investorrelations. Note: All comparisons are 4Q15 versus 4Q14.
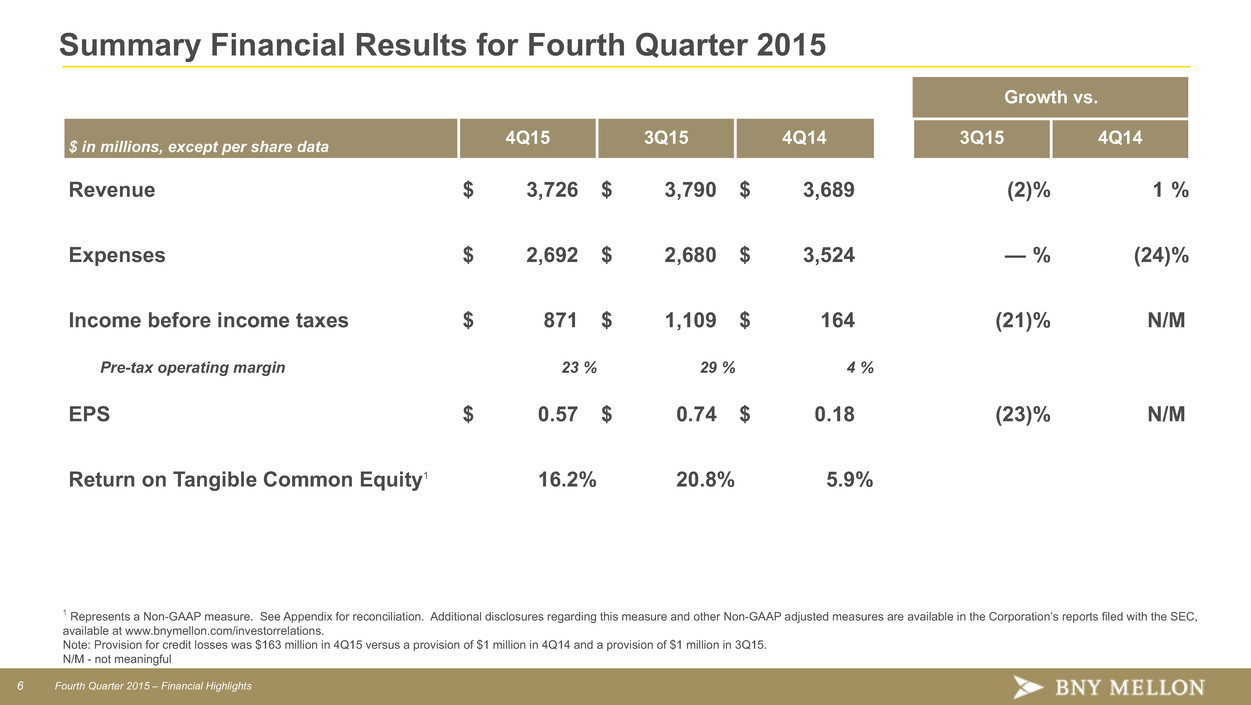
6 Fourth Quarter 2015 – Financial Highlights Summary Financial Results for Fourth Quarter 2015 Growth vs. $ in millions, except per share data 4Q15 3Q15 4Q14 3Q15 4Q14 Revenue $ 3,726 $ 3,790 $ 3,689 (2)% 1 % Expenses $ 2,692 $ 2,680 $ 3,524 — % (24)% Income before income taxes $ 871 $ 1,109 $ 164 (21)% N/M Pre-tax operating margin 23 % 29 % 4 % EPS $ 0.57 $ 0.74 $ 0.18 (23)% N/M Return on Tangible Common Equity1 16.2% 20.8% 5.9% 1 Represents a Non-GAAP measure. See Appendix for reconciliation. Additional disclosures regarding this measure and other Non-GAAP adjusted measures are available in the Corporation’s reports filed with the SEC, available at www.bnymellon.com/investorrelations. Note: Provision for credit losses was $163 million in 4Q15 versus a provision of $1 million in 4Q14 and a provision of $1 million in 3Q15. N/M - not meaningful
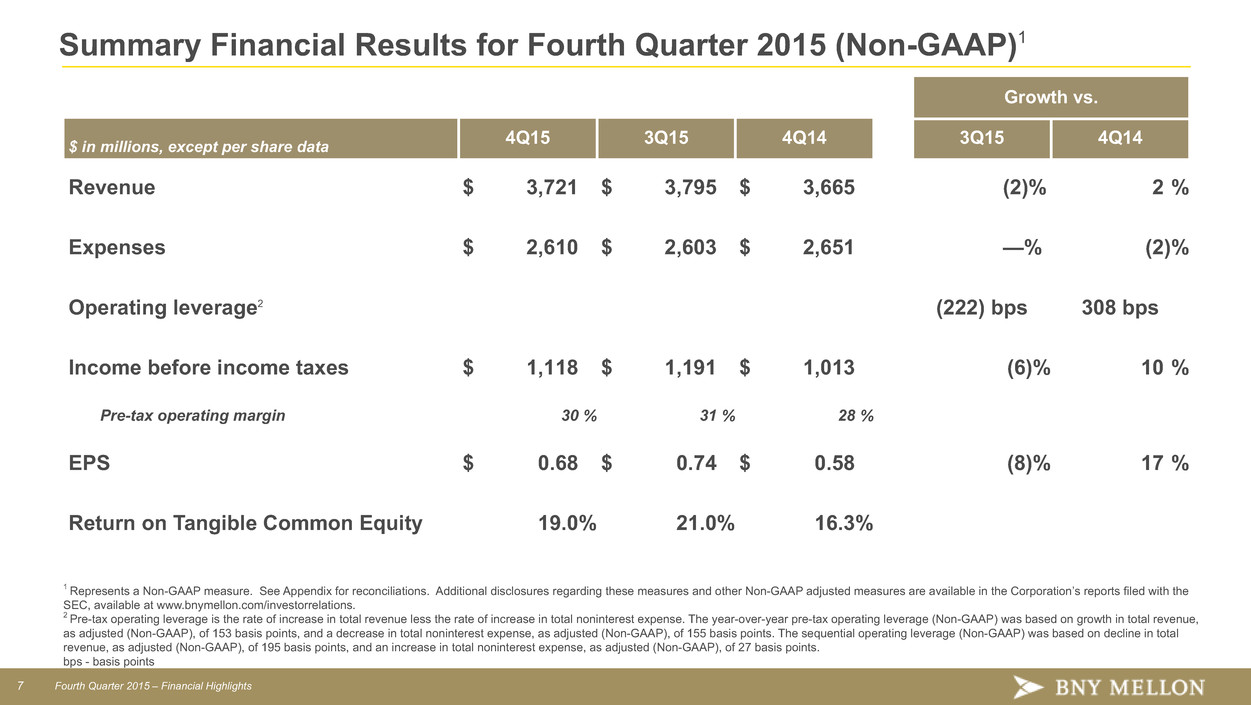
7 Fourth Quarter 2015 – Financial Highlights Summary Financial Results for Fourth Quarter 2015 (Non-GAAP)1 Growth vs. $ in millions, except per share data 4Q15 3Q15 4Q14 3Q15 4Q14 Revenue $ 3,721 $ 3,795 $ 3,665 (2)% 2 % Expenses $ 2,610 $ 2,603 $ 2,651 —% (2)% Operating leverage2 (222) bps 308 bps Income before income taxes $ 1,118 $ 1,191 $ 1,013 (6)% 10 % Pre-tax operating margin 30 % 31 % 28 % EPS $ 0.68 $ 0.74 $ 0.58 (8)% 17 % Return on Tangible Common Equity 19.0% 21.0% 16.3% 1 Represents a Non-GAAP measure. See Appendix for reconciliations. Additional disclosures regarding these measures and other Non-GAAP adjusted measures are available in the Corporation’s reports filed with the SEC, available at www.bnymellon.com/investorrelations. 2 Pre-tax operating leverage is the rate of increase in total revenue less the rate of increase in total noninterest expense. The year-over-year pre-tax operating leverage (Non-GAAP) was based on growth in total revenue, as adjusted (Non-GAAP), of 153 basis points, and a decrease in total noninterest expense, as adjusted (Non-GAAP), of 155 basis points. The sequential operating leverage (Non-GAAP) was based on decline in total revenue, as adjusted (Non-GAAP), of 195 basis points, and an increase in total noninterest expense, as adjusted (Non-GAAP), of 27 basis points. bps - basis points
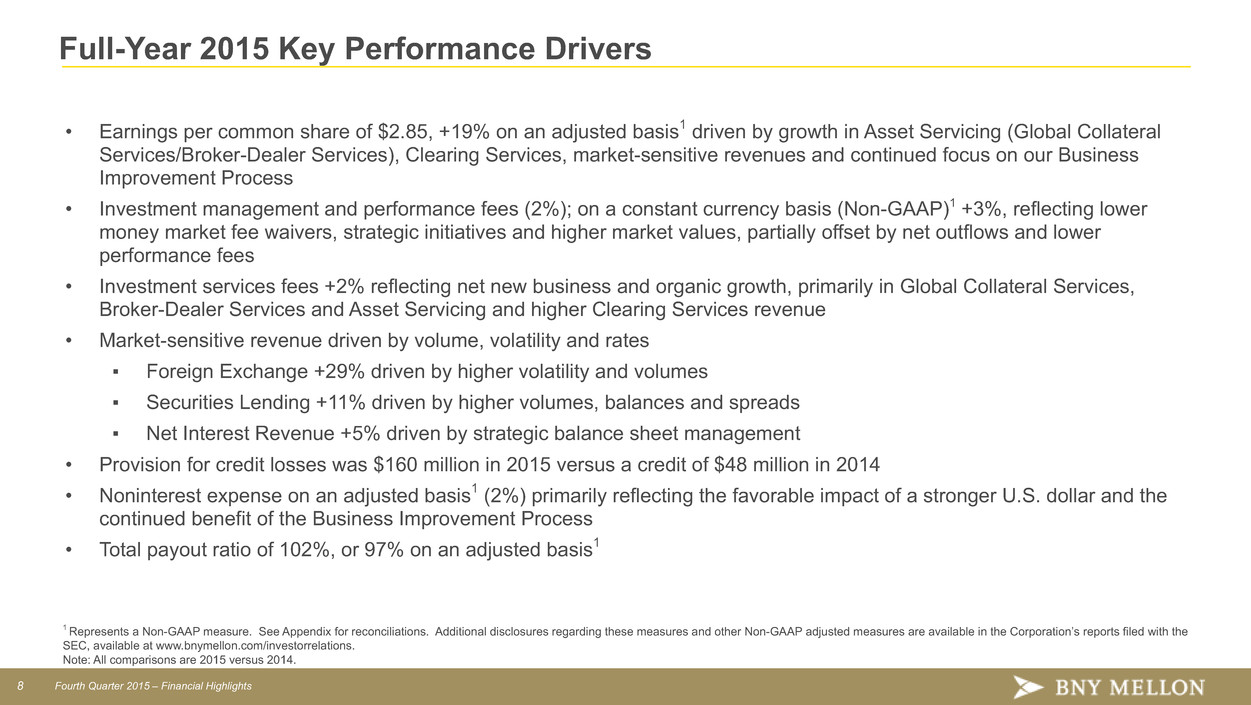
8 Fourth Quarter 2015 – Financial Highlights Full-Year 2015 Key Performance Drivers • Earnings per common share of $2.85, +19% on an adjusted basis1 driven by growth in Asset Servicing (Global Collateral Services/Broker-Dealer Services), Clearing Services, market-sensitive revenues and continued focus on our Business Improvement Process • Investment management and performance fees (2%); on a constant currency basis (Non-GAAP)1 +3%, reflecting lower money market fee waivers, strategic initiatives and higher market values, partially offset by net outflows and lower performance fees • Investment services fees +2% reflecting net new business and organic growth, primarily in Global Collateral Services, Broker-Dealer Services and Asset Servicing and higher Clearing Services revenue • Market-sensitive revenue driven by volume, volatility and rates ▪ Foreign Exchange +29% driven by higher volatility and volumes ▪ Securities Lending +11% driven by higher volumes, balances and spreads ▪ Net Interest Revenue +5% driven by strategic balance sheet management • Provision for credit losses was $160 million in 2015 versus a credit of $48 million in 2014 • Noninterest expense on an adjusted basis1 (2%) primarily reflecting the favorable impact of a stronger U.S. dollar and the continued benefit of the Business Improvement Process • Total payout ratio of 102%, or 97% on an adjusted basis1 1 Represents a Non-GAAP measure. See Appendix for reconciliations. Additional disclosures regarding these measures and other Non-GAAP adjusted measures are available in the Corporation’s reports filed with the SEC, available at www.bnymellon.com/investorrelations. Note: All comparisons are 2015 versus 2014.
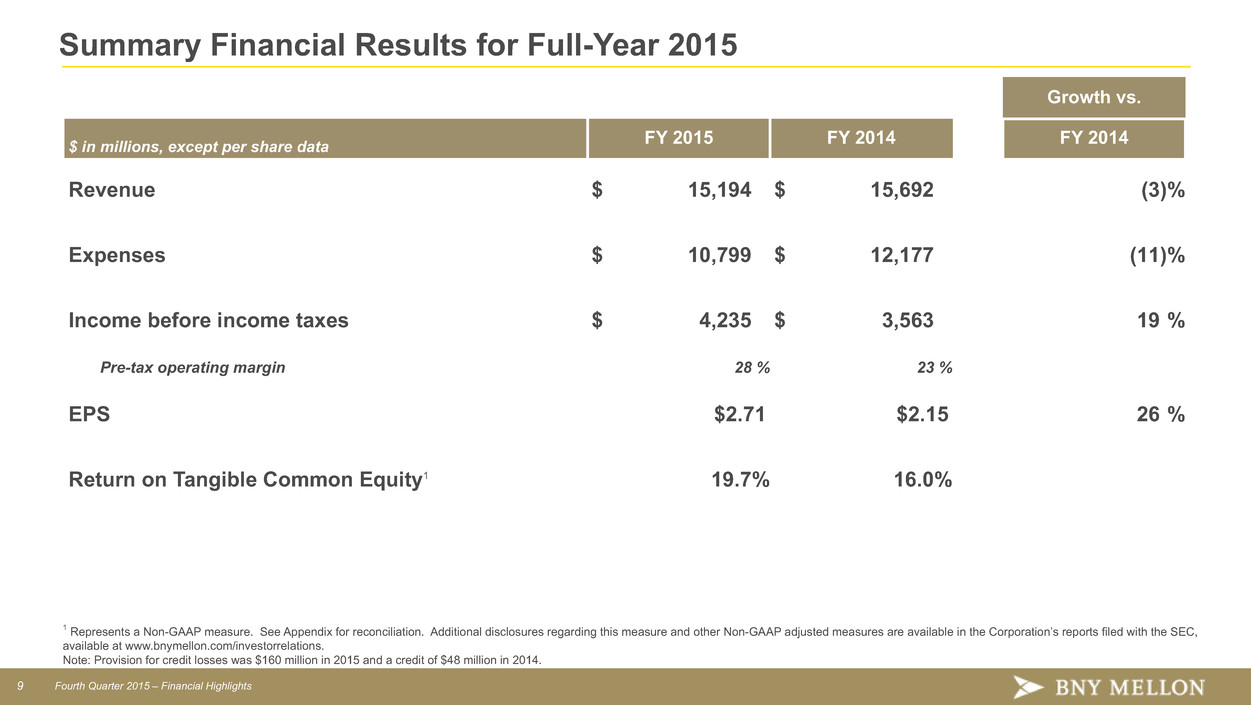
9 Fourth Quarter 2015 – Financial Highlights Summary Financial Results for Full-Year 2015 Growth vs. $ in millions, except per share data FY 2015 FY 2014 FY 2014 Revenue $ 15,194 $ 15,692 (3)% Expenses $ 10,799 $ 12,177 (11)% Income before income taxes $ 4,235 $ 3,563 19 % Pre-tax operating margin 28 % 23 % EPS $2.71 $2.15 26 % Return on Tangible Common Equity1 19.7% 16.0% 1 Represents a Non-GAAP measure. See Appendix for reconciliation. Additional disclosures regarding this measure and other Non-GAAP adjusted measures are available in the Corporation’s reports filed with the SEC, available at www.bnymellon.com/investorrelations. Note: Provision for credit losses was $160 million in 2015 and a credit of $48 million in 2014.
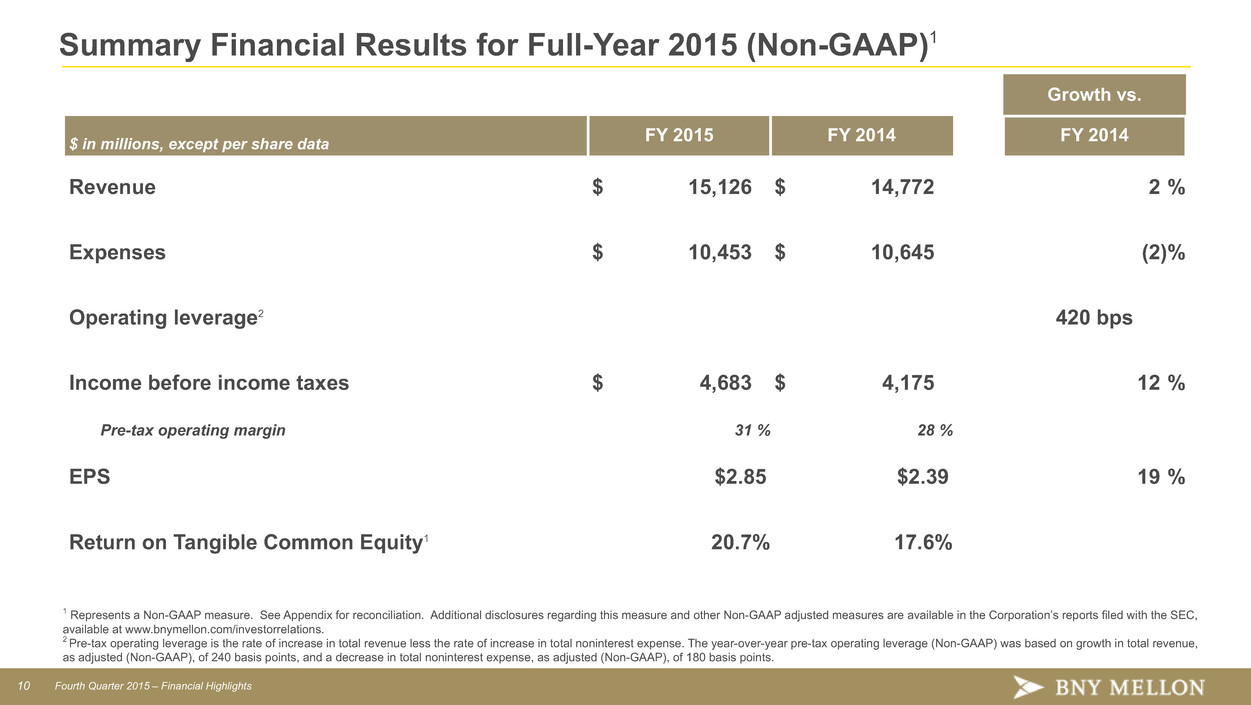
10 Fourth Quarter 2015 – Financial Highlights Summary Financial Results for Full-Year 2015 (Non-GAAP)1 Growth vs. $ in millions, except per share data FY 2015 FY 2014 FY 2014 Revenue $ 15,126 $ 14,772 2 % Expenses $ 10,453 $ 10,645 (2)% Operating leverage2 420 bps Income before income taxes $ 4,683 $ 4,175 12 % Pre-tax operating margin 31 % 28 % EPS $2.85 $2.39 19 % Return on Tangible Common Equity1 20.7% 17.6% 1 Represents a Non-GAAP measure. See Appendix for reconciliation. Additional disclosures regarding this measure and other Non-GAAP adjusted measures are available in the Corporation’s reports filed with the SEC, available at www.bnymellon.com/investorrelations. 2 Pre-tax operating leverage is the rate of increase in total revenue less the rate of increase in total noninterest expense. The year-over-year pre-tax operating leverage (Non-GAAP) was based on growth in total revenue, as adjusted (Non-GAAP), of 240 basis points, and a decrease in total noninterest expense, as adjusted (Non-GAAP), of 180 basis points.
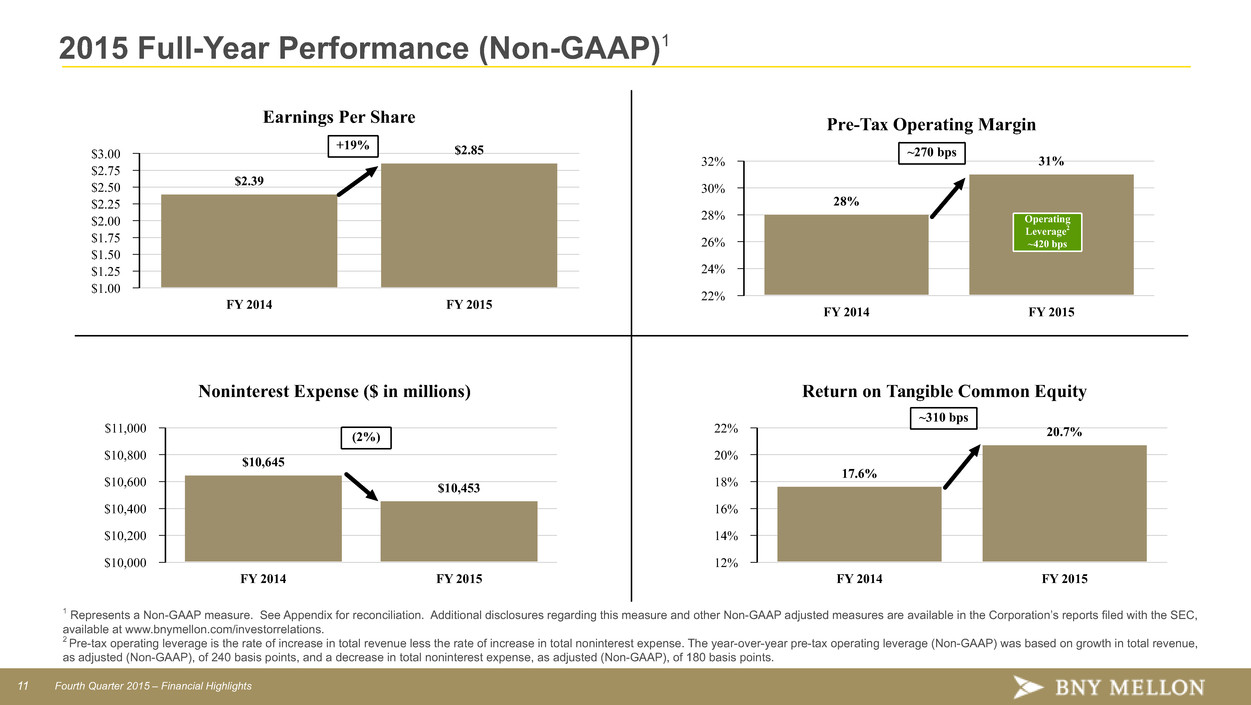
11 Fourth Quarter 2015 – Financial Highlights 2015 Full-Year Performance (Non-GAAP)1 Earnings Per Share $3.00 $2.75 $2.50 $2.25 $2.00 $1.75 $1.50 $1.25 $1.00 FY 2014 FY 2015 $2.39 $2.85 Noninterest Expense ($ in millions) $11,000 $10,800 $10,600 $10,400 $10,200 $10,000 FY 2014 FY 2015 $10,645 $10,453 Pre-Tax Operating Margin 32% 30% 28% 26% 24% 22% FY 2014 FY 2015 28% 31% Return on Tangible Common Equity 22% 20% 18% 16% 14% 12% FY 2014 FY 2015 17.6% 20.7% +19% (2%) ~310 bps ~270 bps Operating Leverage2 ~420 bps 1 Represents a Non-GAAP measure. See Appendix for reconciliation. Additional disclosures regarding this measure and other Non-GAAP adjusted measures are available in the Corporation’s reports filed with the SEC, available at www.bnymellon.com/investorrelations. 2 Pre-tax operating leverage is the rate of increase in total revenue less the rate of increase in total noninterest expense. The year-over-year pre-tax operating leverage (Non-GAAP) was based on growth in total revenue, as adjusted (Non-GAAP), of 240 basis points, and a decrease in total noninterest expense, as adjusted (Non-GAAP), of 180 basis points.
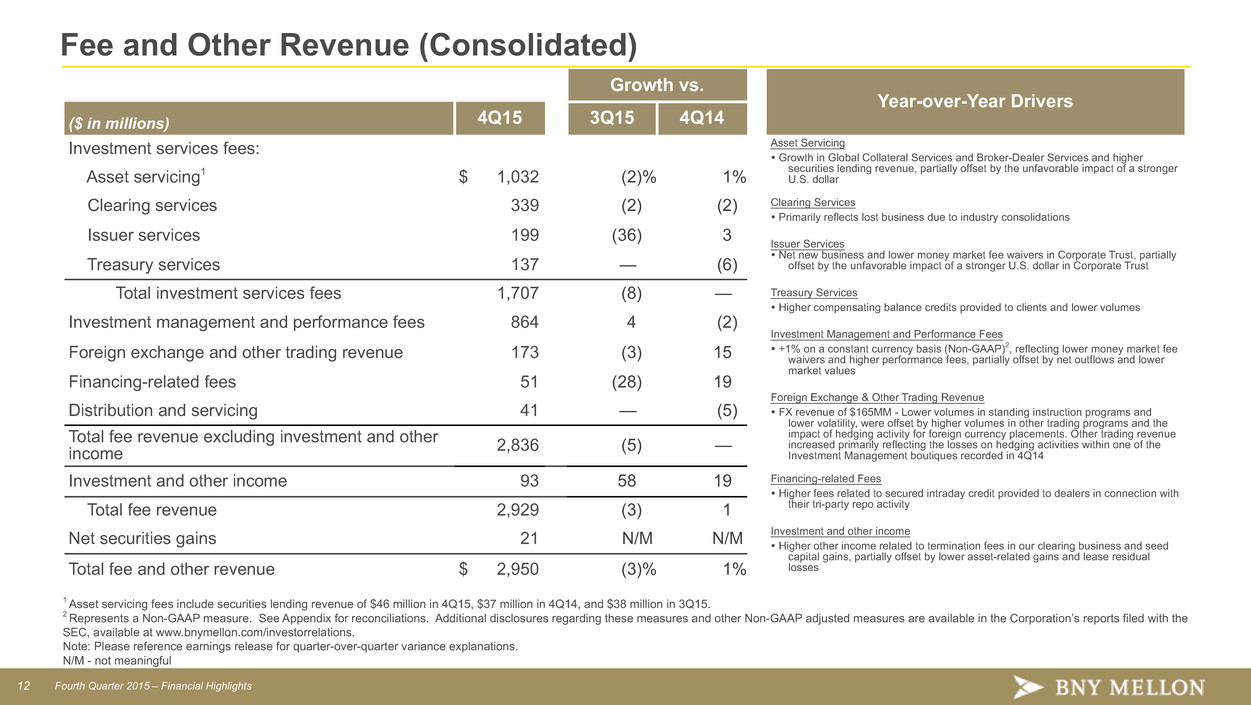
12 Fourth Quarter 2015 – Financial Highlights Fee and Other Revenue (Consolidated) Growth vs. Year-over-Year Drivers ($ in millions) 4Q15 3Q15 4Q14 Investment services fees: Asset ServicingŸ Growth in Global Collateral Services and Broker-Dealer Services and higher securities lending revenue, partially offset by the unfavorable impact of a stronger U.S. dollar Clearing Services Ÿ Primarily reflects lost business due to industry consolidations Issuer Services Ÿ Net new business and lower money market fee waivers in Corporate Trust, partially offset by the unfavorable impact of a stronger U.S. dollar in Corporate Trust Treasury Services Ÿ Higher compensating balance credits provided to clients and lower volumes Investment Management and Performance Fees Ÿ +1% on a constant currency basis (Non-GAAP)2, reflecting lower money market fee waivers and higher performance fees, partially offset by net outflows and lower market values Foreign Exchange & Other Trading Revenue Ÿ FX revenue of $165MM - Lower volumes in standing instruction programs and lower volatility, were offset by higher volumes in other trading programs and the impact of hedging activity for foreign currency placements. Other trading revenue increased primarily reflecting the losses on hedging activities within one of the Investment Management boutiques recorded in 4Q14 Financing-related Fees Ÿ Higher fees related to secured intraday credit provided to dealers in connection with their tri-party repo activity Investment and other income Ÿ Higher other income related to termination fees in our clearing business and seed capital gains, partially offset by lower asset-related gains and lease residual losses Asset servicing1 $ 1,032 (2)% 1% Clearing services 339 (2) (2) Issuer services 199 (36) 3 Treasury services 137 — (6) Total investment services fees 1,707 (8) — Investment management and performance fees 864 4 (2) Foreign exchange and other trading revenue 173 (3) 15 Financing-related fees 51 (28) 19 Distribution and servicing 41 — (5) Total fee revenue excluding investment and other income 2,836 (5) — Investment and other income 93 58 19 Total fee revenue 2,929 (3) 1 Net securities gains 21 N/M N/M Total fee and other revenue $ 2,950 (3)% 1% 1 Asset servicing fees include securities lending revenue of $46 million in 4Q15, $37 million in 4Q14, and $38 million in 3Q15. 2 Represents a Non-GAAP measure. See Appendix for reconciliations. Additional disclosures regarding these measures and other Non-GAAP adjusted measures are available in the Corporation’s reports filed with the SEC, available at www.bnymellon.com/investorrelations. Note: Please reference earnings release for quarter-over-quarter variance explanations. N/M - not meaningful
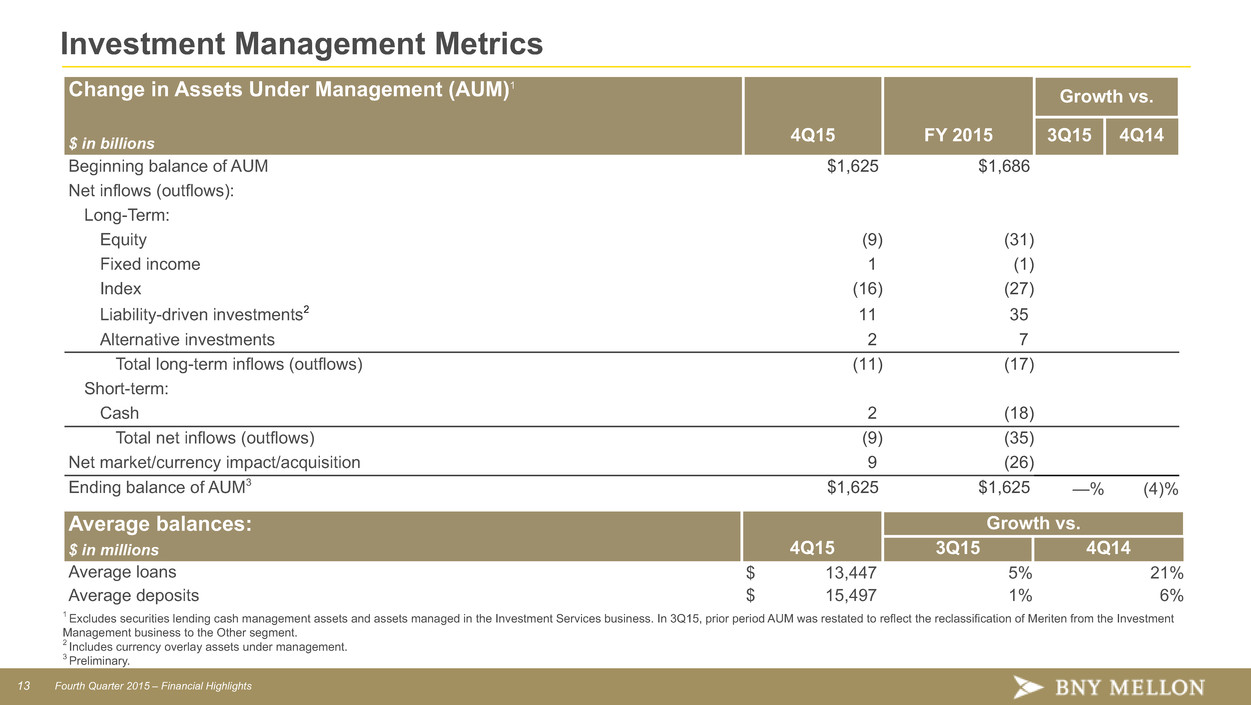
13 Fourth Quarter 2015 – Financial Highlights Investment Management Metrics Change in Assets Under Management (AUM)1 Growth vs. $ in billions 4Q15 FY 2015 3Q15 4Q14 Beginning balance of AUM $1,625 $1,686 Net inflows (outflows): Long-Term: Equity (9) (31) Fixed income 1 (1) Index (16) (27) Liability-driven investments2 11 35 Alternative investments 2 7 Total long-term inflows (outflows) (11) (17) Short-term: Cash 2 (18) Total net inflows (outflows) (9) (35) Net market/currency impact/acquisition 9 (26) Ending balance of AUM3 $1,625 $1,625 —% (4)% Average balances: Growth vs. $ in millions 4Q15 3Q15 4Q14 Average loans $ 13,447 5% 21% Average deposits $ 15,497 1% 6% 1 Excludes securities lending cash management assets and assets managed in the Investment Services business. In 3Q15, prior period AUM was restated to reflect the reclassification of Meriten from the Investment Management business to the Other segment. 2 Includes currency overlay assets under management. 3 Preliminary.
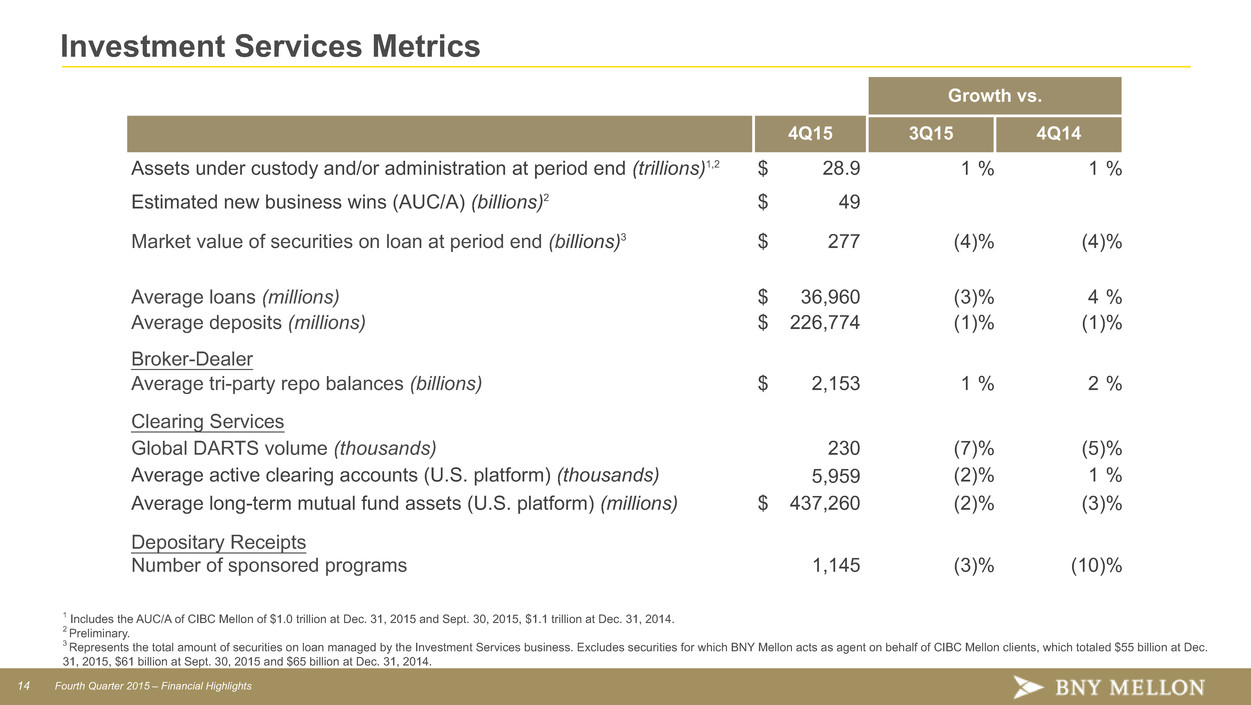
14 Fourth Quarter 2015 – Financial Highlights Investment Services Metrics Growth vs. 4Q15 3Q15 4Q14 Assets under custody and/or administration at period end (trillions)1,2 $ 28.9 1 % 1 % Estimated new business wins (AUC/A) (billions)2 $ 49 Market value of securities on loan at period end (billions)3 $ 277 (4)% (4)% Average loans (millions) $ 36,960 (3)% 4 % Average deposits (millions) $ 226,774 (1)% (1)% Broker-Dealer Average tri-party repo balances (billions) $ 2,153 1 % 2 % Clearing Services Global DARTS volume (thousands) 230 (7)% (5)% Average active clearing accounts (U.S. platform) (thousands) 5,959 (2)% 1 % Average long-term mutual fund assets (U.S. platform) (millions) $ 437,260 (2)% (3)% Depositary Receipts Number of sponsored programs 1,145 (3)% (10)% 1 Includes the AUC/A of CIBC Mellon of $1.0 trillion at Dec. 31, 2015 and Sept. 30, 2015, $1.1 trillion at Dec. 31, 2014. 2 Preliminary. 3 Represents the total amount of securities on loan managed by the Investment Services business. Excludes securities for which BNY Mellon acts as agent on behalf of CIBC Mellon clients, which totaled $55 billion at Dec. 31, 2015, $61 billion at Sept. 30, 2015 and $65 billion at Dec. 31, 2014.
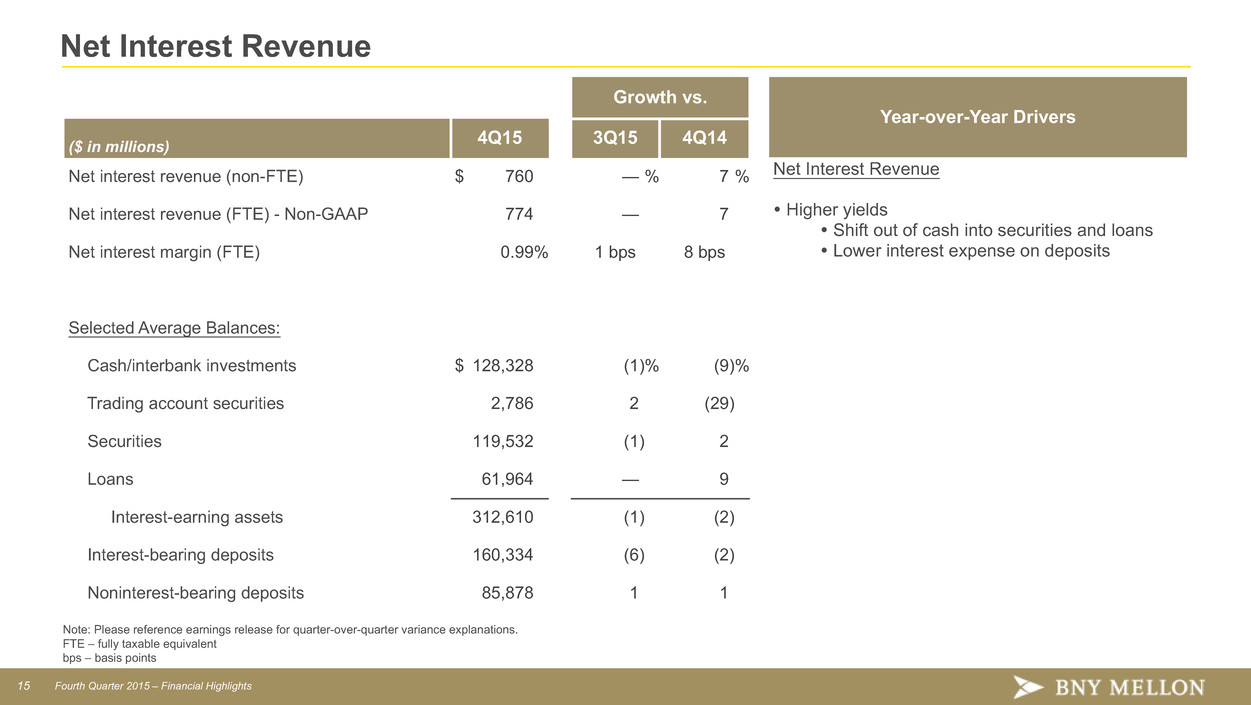
15 Fourth Quarter 2015 – Financial Highlights Net Interest Revenue Growth vs. Year-over-Year Drivers ($ in millions) 4Q15 3Q15 4Q14 Net interest revenue (non-FTE) $ 760 — % 7 % Net Interest Revenue Ÿ Higher yields Ÿ Shift out of cash into securities and loans Ÿ Lower interest expense on deposits Net interest revenue (FTE) - Non-GAAP 774 — 7 Net interest margin (FTE) 0.99% 1 bps 8 bps Selected Average Balances: Cash/interbank investments $ 128,328 (1)% (9)% Trading account securities 2,786 2 (29) Securities 119,532 (1) 2 Loans 61,964 — 9 Interest-earning assets 312,610 (1) (2) Interest-bearing deposits 160,334 (6) (2) Noninterest-bearing deposits 85,878 1 1 Note: Please reference earnings release for quarter-over-quarter variance explanations. FTE – fully taxable equivalent bps – basis points
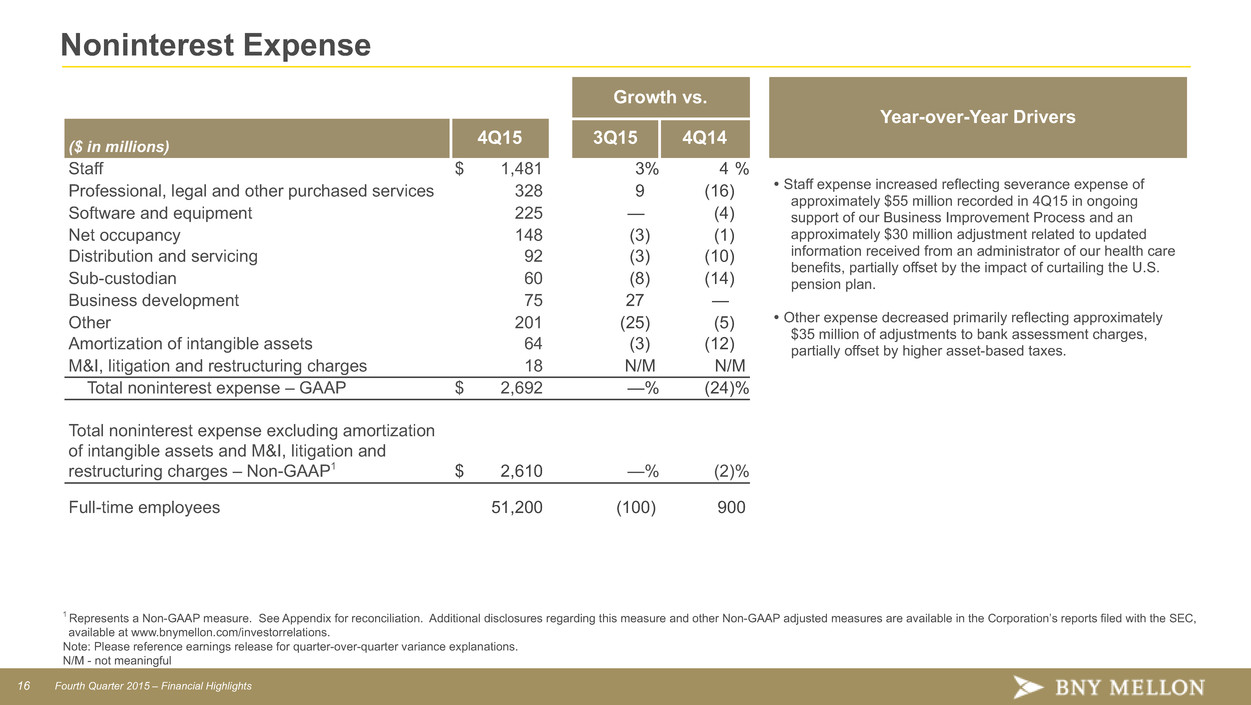
16 Fourth Quarter 2015 – Financial Highlights Noninterest Expense Growth vs. Year-over-Year Drivers ($ in millions) 4Q15 3Q15 4Q14 Staff $ 1,481 3% 4 % Ÿ Staff expense increased reflecting severance expense of approximately $55 million recorded in 4Q15 in ongoing support of our Business Improvement Process and an approximately $30 million adjustment related to updated information received from an administrator of our health care benefits, partially offset by the impact of curtailing the U.S. pension plan. Ÿ Other expense decreased primarily reflecting approximately $35 million of adjustments to bank assessment charges, partially offset by higher asset-based taxes. Professional, legal and other purchased services 328 9 (16) Software and equipment 225 — (4) Net occupancy 148 (3) (1) Distribution and servicing 92 (3) (10) Sub-custodian 60 (8) (14) Business development 75 27 — Other 201 (25) (5) Amortization of intangible assets 64 (3) (12) M&I, litigation and restructuring charges 18 N/M N/M Total noninterest expense – GAAP $ 2,692 —% (24)% Total noninterest expense excluding amortization of intangible assets and M&I, litigation and restructuring charges – Non-GAAP1 $ 2,610 —% (2)% Full-time employees 51,200 (100) 900 1 Represents a Non-GAAP measure. See Appendix for reconciliation. Additional disclosures regarding this measure and other Non-GAAP adjusted measures are available in the Corporation’s reports filed with the SEC, available at www.bnymellon.com/investorrelations. Note: Please reference earnings release for quarter-over-quarter variance explanations. N/M - not meaningful
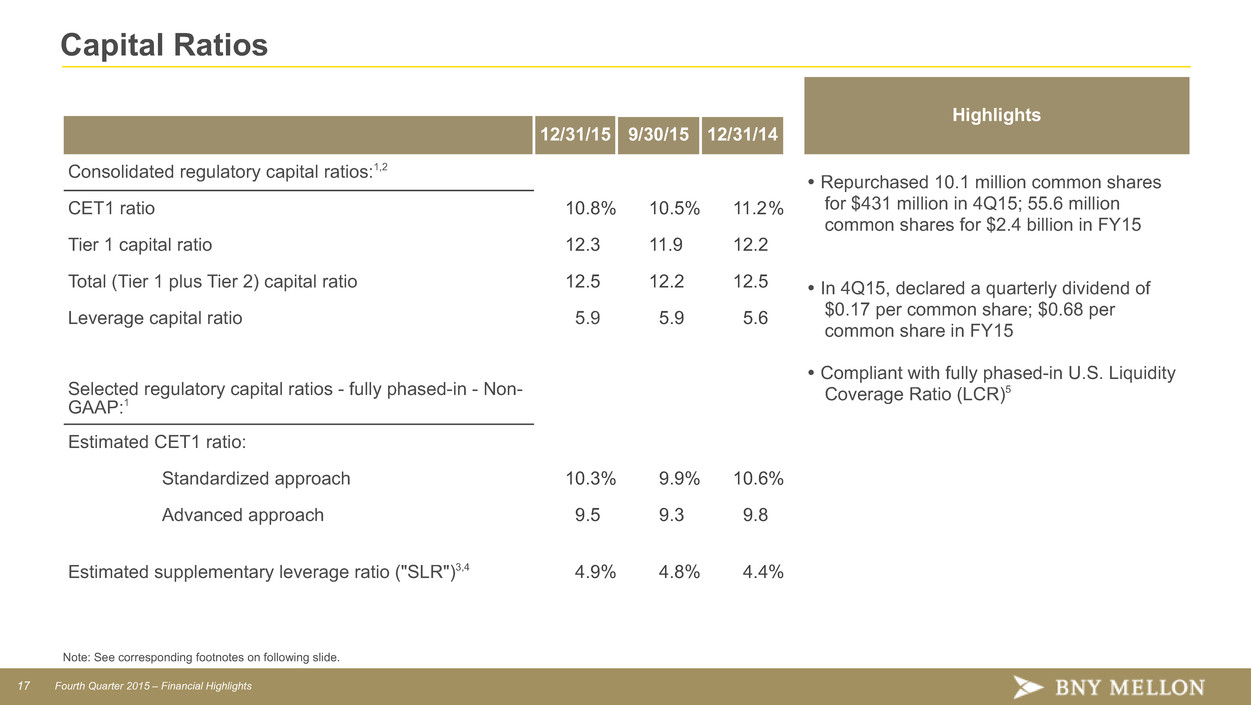
17 Fourth Quarter 2015 – Financial Highlights Capital Ratios Highlights 12/31/15 9/30/15 12/31/14 Consolidated regulatory capital ratios:1,2 Ÿ Repurchased 10.1 million common shares for $431 million in 4Q15; 55.6 million common shares for $2.4 billion in FY15 Ÿ In 4Q15, declared a quarterly dividend of $0.17 per common share; $0.68 per common share in FY15 Ÿ Compliant with fully phased-in U.S. Liquidity Coverage Ratio (LCR)5 CET1 ratio 10.8% 10.5% 11.2% Tier 1 capital ratio 12.3 11.9 12.2 Total (Tier 1 plus Tier 2) capital ratio 12.5 12.2 12.5 Leverage capital ratio 5.9 5.9 5.6 Selected regulatory capital ratios - fully phased-in - Non- GAAP:1 Estimated CET1 ratio: Standardized approach 10.3% 9.9% 10.6% Advanced approach 9.5 9.3 9.8 Estimated supplementary leverage ratio ("SLR")3,4 4.9% 4.8% 4.4% Note: See corresponding footnotes on following slide.
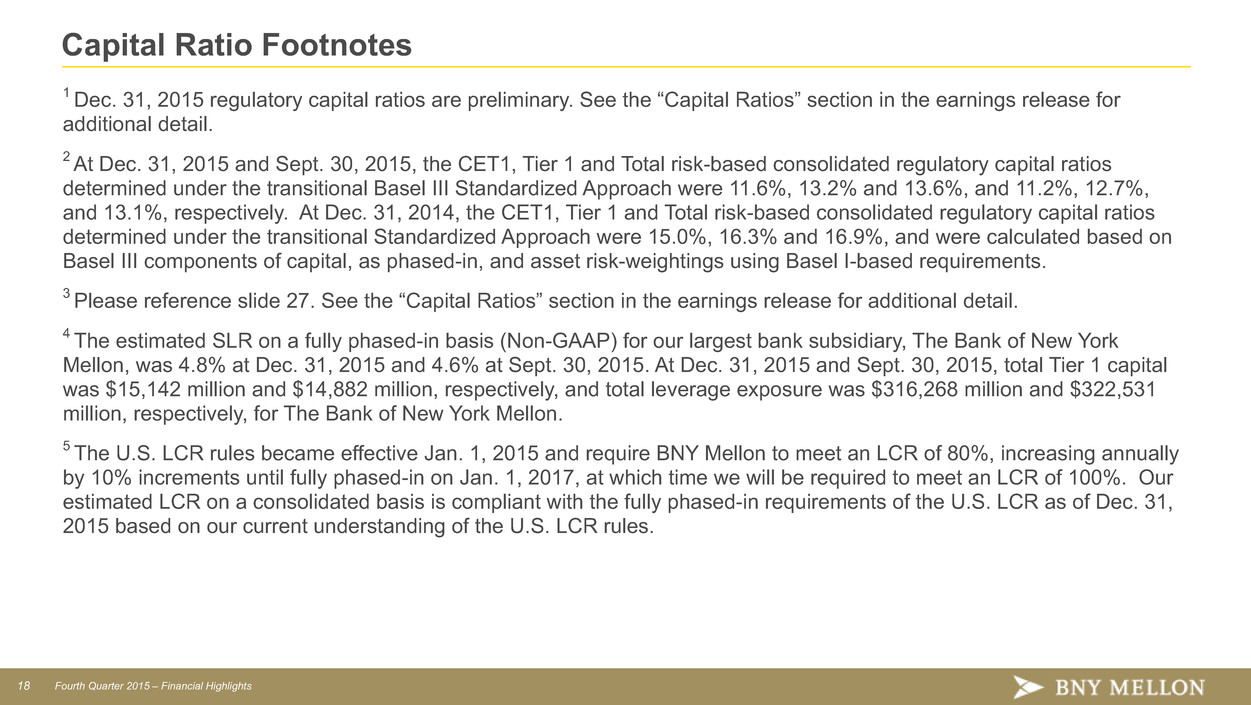
18 Fourth Quarter 2015 – Financial Highlights Capital Ratio Footnotes 1 Dec. 31, 2015 regulatory capital ratios are preliminary. See the “Capital Ratios” section in the earnings release for additional detail. 2 At Dec. 31, 2015 and Sept. 30, 2015, the CET1, Tier 1 and Total risk-based consolidated regulatory capital ratios determined under the transitional Basel III Standardized Approach were 11.6%, 13.2% and 13.6%, and 11.2%, 12.7%, and 13.1%, respectively. At Dec. 31, 2014, the CET1, Tier 1 and Total risk-based consolidated regulatory capital ratios determined under the transitional Standardized Approach were 15.0%, 16.3% and 16.9%, and were calculated based on Basel III components of capital, as phased-in, and asset risk-weightings using Basel I-based requirements. 3 Please reference slide 27. See the “Capital Ratios” section in the earnings release for additional detail. 4 The estimated SLR on a fully phased-in basis (Non-GAAP) for our largest bank subsidiary, The Bank of New York Mellon, was 4.8% at Dec. 31, 2015 and 4.6% at Sept. 30, 2015. At Dec. 31, 2015 and Sept. 30, 2015, total Tier 1 capital was $15,142 million and $14,882 million, respectively, and total leverage exposure was $316,268 million and $322,531 million, respectively, for The Bank of New York Mellon. 5 The U.S. LCR rules became effective Jan. 1, 2015 and require BNY Mellon to meet an LCR of 80%, increasing annually by 10% increments until fully phased-in on Jan. 1, 2017, at which time we will be required to meet an LCR of 100%. Our estimated LCR on a consolidated basis is compliant with the fully phased-in requirements of the U.S. LCR as of Dec. 31, 2015 based on our current understanding of the U.S. LCR rules.
APPENDIX
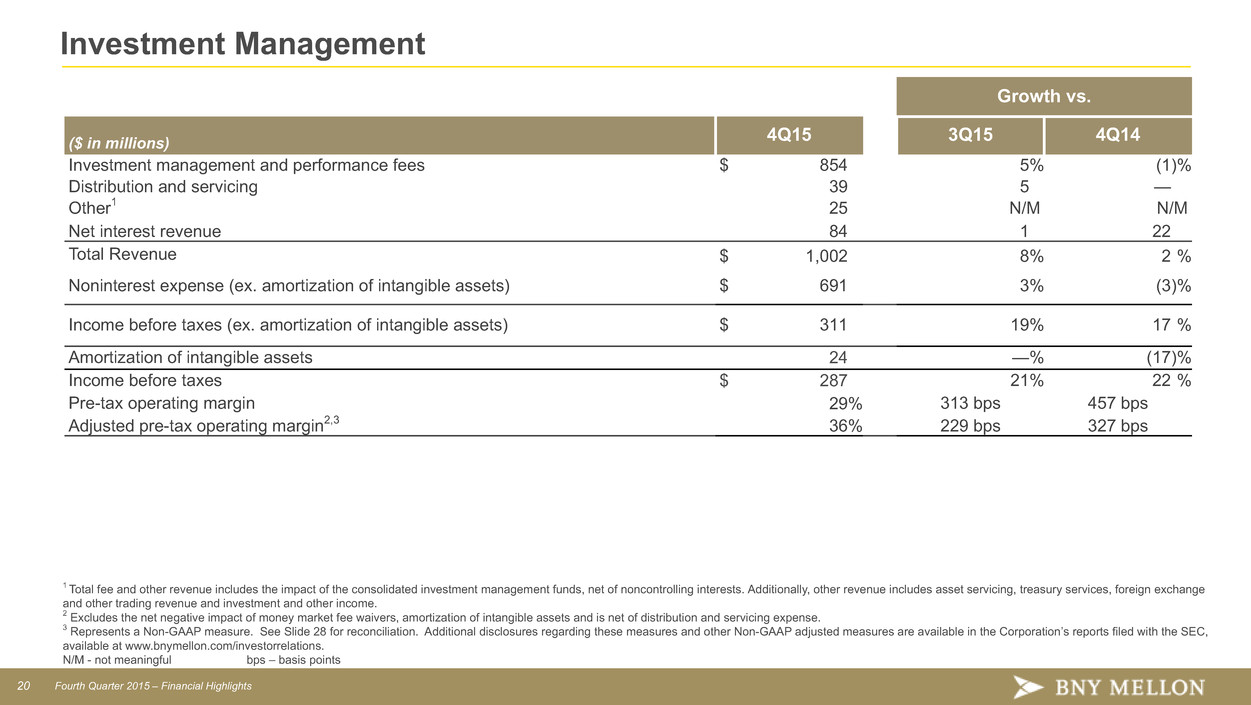
20 Fourth Quarter 2015 – Financial Highlights Investment Management . Growth vs. ($ in millions) 4Q15 3Q15 4Q14 Investment management and performance fees $ 854 5% (1)% Distribution and servicing 39 5 — Other1 25 N/M N/M Net interest revenue 84 1 22 Total Revenue $ 1,002 8% 2 % Noninterest expense (ex. amortization of intangible assets) $ 691 3% (3)% Income before taxes (ex. amortization of intangible assets) $ 311 19% 17 % Amortization of intangible assets 24 —% (17)% Income before taxes $ 287 21% 22 % Pre-tax operating margin 29% 313 bps 457 bps Adjusted pre-tax operating margin2,3 36% 229 bps 327 bps 1 Total fee and other revenue includes the impact of the consolidated investment management funds, net of noncontrolling interests. Additionally, other revenue includes asset servicing, treasury services, foreign exchange and other trading revenue and investment and other income. 2 Excludes the net negative impact of money market fee waivers, amortization of intangible assets and is net of distribution and servicing expense. 3 Represents a Non-GAAP measure. See Slide 28 for reconciliation. Additional disclosures regarding these measures and other Non-GAAP adjusted measures are available in the Corporation’s reports filed with the SEC, available at www.bnymellon.com/investorrelations. N/M - not meaningful bps – basis points
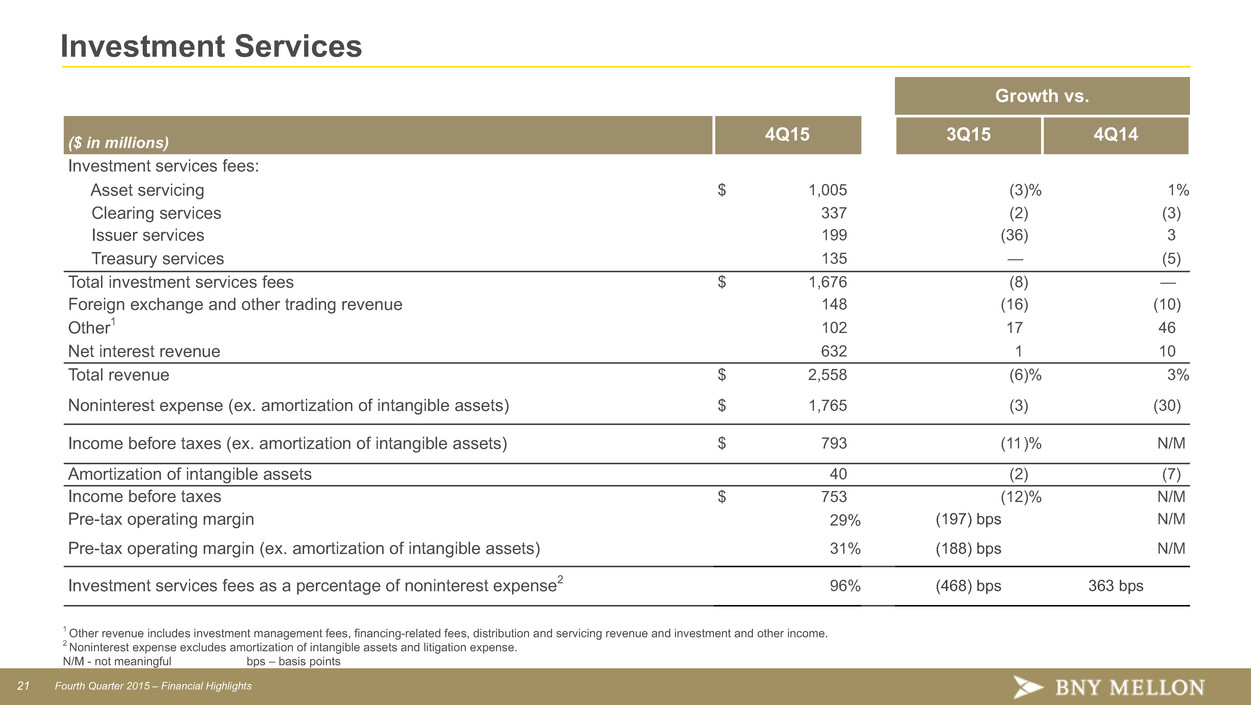
21 Fourth Quarter 2015 – Financial Highlights Investment Services Growth vs. ($ in millions) 4Q15 3Q15 4Q14 Investment services fees: Asset servicing $ 1,005 (3)% 1% Clearing services 337 (2) (3) Issuer services 199 (36) 3 Treasury services 135 — (5) Total investment services fees $ 1,676 (8) — Foreign exchange and other trading revenue 148 (16) (10) Other1 102 17 46 Net interest revenue 632 1 10 Total revenue $ 2,558 (6)% 3% Noninterest expense (ex. amortization of intangible assets) $ 1,765 (3) (30) Income before taxes (ex. amortization of intangible assets) $ 793 (11)% N/M Amortization of intangible assets 40 (2) (7) Income before taxes $ 753 (12)% N/M Pre-tax operating margin 29% (197) bps N/M Pre-tax operating margin (ex. amortization of intangible assets) 31% (188) bps N/M Investment services fees as a percentage of noninterest expense2 96% (468) bps 363 bps 1 Other revenue includes investment management fees, financing-related fees, distribution and servicing revenue and investment and other income. 2 Noninterest expense excludes amortization of intangible assets and litigation expense. N/M - not meaningful bps – basis points

22 Fourth Quarter 2015 – Financial Highlights Expense & Pre-Tax Operating Margin - Non-GAAP Reconciliation 4Q15 3Q15 4Q14 QoQ Operating Leverage YoY Operating Leverage($ in millions) Total revenue – GAAP $ 3,726 $ 3,790 $ 3,689 Less: Net income (loss) attributable to noncontrolling interests of consolidated investment management funds 5 (5) 24 Total revenue, as adjusted – Non-GAAP2 $ 3,721 $ 3,795 $ 3,665 (1.95)% 1.53 % Total noninterest expense – GAAP $ 2,692 $ 2,680 $ 3,524 Less: Amortization of intangible assets 64 66 73 M&I, litigation and restructuring charges 18 11 800 Total noninterest expense excluding amortization of intangible assets and M&I, litigation and restructuring charges – Non-GAAP2 $ 2,610 $ 2,603 $ 2,651 0.27 % (1.55)% Less: Provision for credit losses 163 1 1 Add: Impairment charge related to a recent court decision 170 — — Income before income taxes, as adjusted – Non-GAAP2 $ 1,118 $ 1,191 $ 1,013 Operating Leverage Pre-tax operating margin – Non-GAAP1,2 30% 3 31% 3 28% (222) bps +308 bps 1 Income before taxes divided by total revenue. 2 Non-GAAP excludes net income (loss) attributable to noncontrolling interests of consolidated investment management funds, amortization of intangible assets, M&I, litigation and restructuring charges (recoveries), and the impairment charge related to a recent court decision, if applicable. 3 Our GAAP earnings include tax-advantaged investments such as low income housing, renewable energy, bank-owned life insurance and tax-exempt securities. The benefits of these investments are primarily reflected in tax expense. If reported on a tax-equivalent basis these investments would increase revenue and income before taxes by $73 million for 4Q15, $53 million for 3Q15, $52 million for 2Q15 and $64 million for 1Q15 and would increase our pre-tax operating margin by approximately 1.5% for 4Q15, 1.0% for 3Q15, 0.9% for 2Q15 and 1.2% for 1Q15.
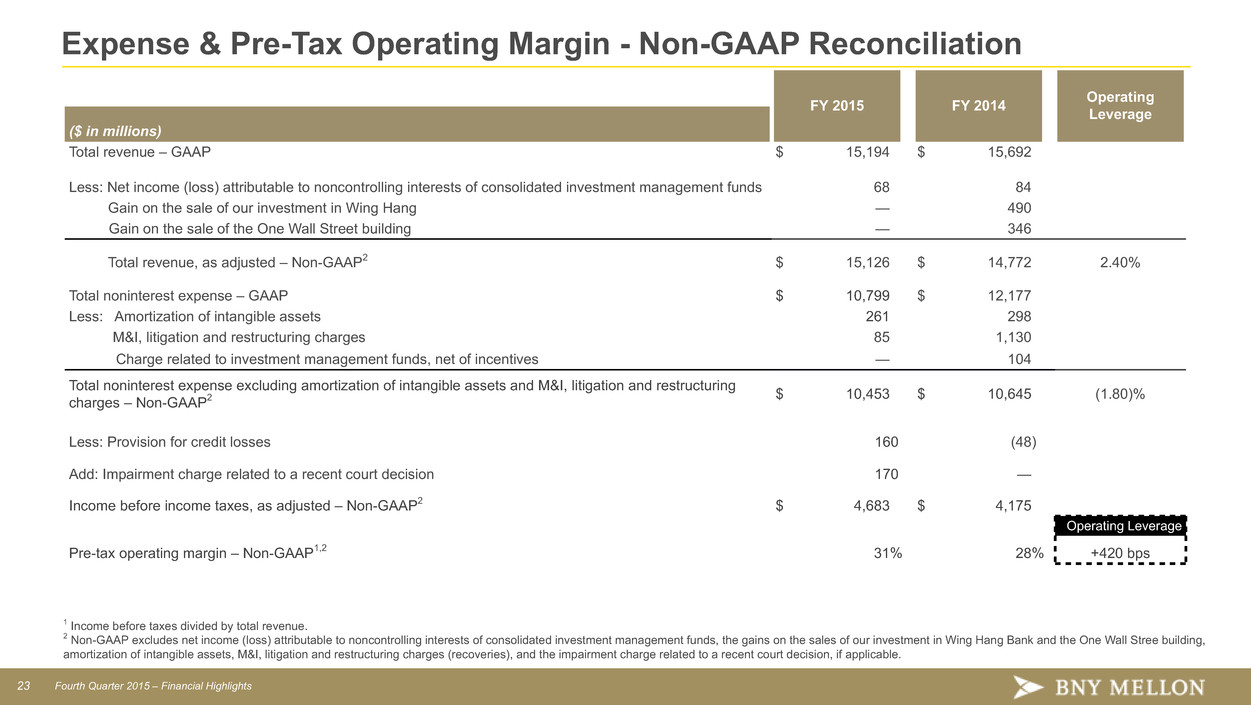
23 Fourth Quarter 2015 – Financial Highlights Expense & Pre-Tax Operating Margin - Non-GAAP Reconciliation 1 Income before taxes divided by total revenue. 2 Non-GAAP excludes net income (loss) attributable to noncontrolling interests of consolidated investment management funds, the gains on the sales of our investment in Wing Hang Bank and the One Wall Stree building, amortization of intangible assets, M&I, litigation and restructuring charges (recoveries), and the impairment charge related to a recent court decision, if applicable. FY 2015 FY 2014 OperatingLeverage ($ in millions) Total revenue – GAAP $ 15,194 $ 15,692 Less: Net income (loss) attributable to noncontrolling interests of consolidated investment management funds 68 84 Gain on the sale of our investment in Wing Hang — 490 Gain on the sale of the One Wall Street building — 346 Total revenue, as adjusted – Non-GAAP2 $ 15,126 $ 14,772 2.40% Total noninterest expense – GAAP $ 10,799 $ 12,177 Less: Amortization of intangible assets 261 298 M&I, litigation and restructuring charges 85 1,130 Charge related to investment management funds, net of incentives — 104 Total noninterest expense excluding amortization of intangible assets and M&I, litigation and restructuring charges – Non-GAAP2 $ 10,453 $ 10,645 (1.80)% Less: Provision for credit losses 160 (48) Add: Impairment charge related to a recent court decision 170 — Income before income taxes, as adjusted – Non-GAAP2 $ 4,683 $ 4,175 Operating Leverage Pre-tax operating margin – Non-GAAP1,2 31% 28% +420 bps
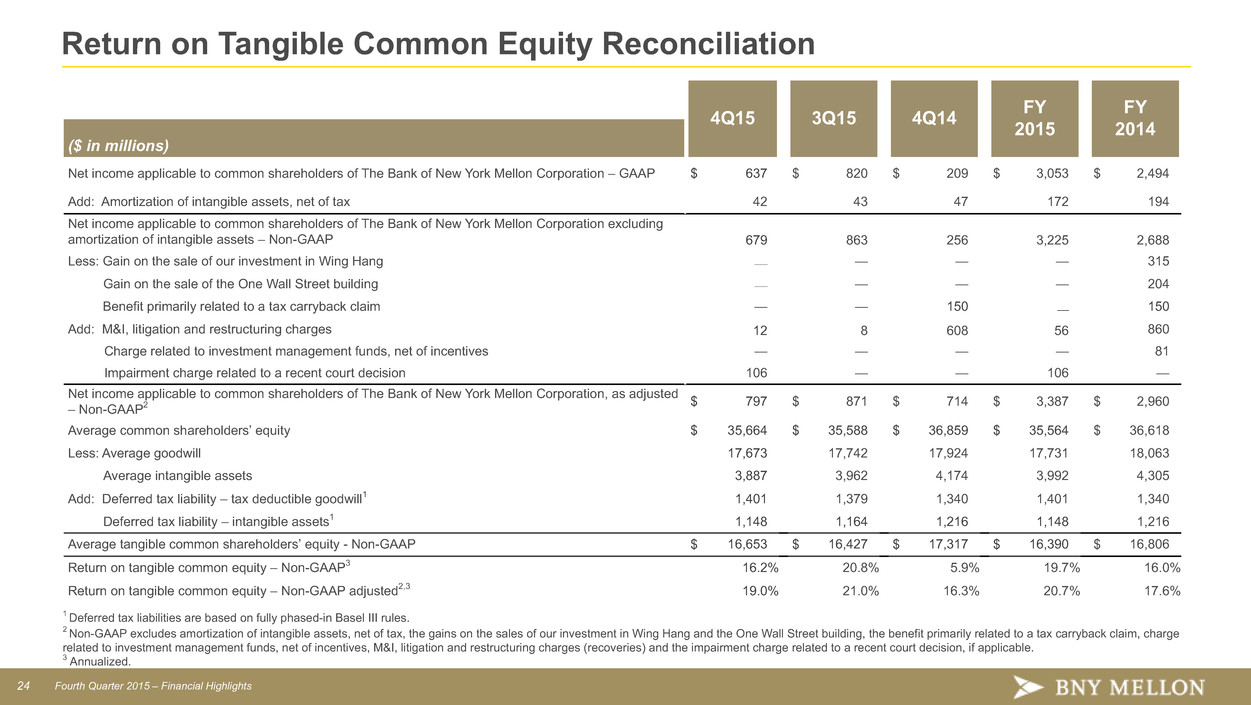
24 Fourth Quarter 2015 – Financial Highlights Return on Tangible Common Equity Reconciliation 4Q15 3Q15 4Q14 FY 2015 FY 2014 ($ in millions) Net income applicable to common shareholders of The Bank of New York Mellon Corporation – GAAP $ 637 $ 820 $ 209 $ 3,053 $ 2,494 Add: Amortization of intangible assets, net of tax 42 43 47 172 194 Net income applicable to common shareholders of The Bank of New York Mellon Corporation excluding amortization of intangible assets – Non-GAAP 679 863 256 3,225 2,688 Less: Gain on the sale of our investment in Wing Hang — — — — 315 Gain on the sale of the One Wall Street building — — — — 204 Benefit primarily related to a tax carryback claim — — 150 — 150 Add: M&I, litigation and restructuring charges 12 8 608 56 860 Charge related to investment management funds, net of incentives — — — — 81 Impairment charge related to a recent court decision 106 — — 106 — Net income applicable to common shareholders of The Bank of New York Mellon Corporation, as adjusted – Non-GAAP2 $ 797 $ 871 $ 714 $ 3,387 $ 2,960 Average common shareholders’ equity $ 35,664 $ 35,588 $ 36,859 $ 35,564 $ 36,618 Less: Average goodwill 17,673 17,742 17,924 17,731 18,063 Average intangible assets 3,887 3,962 4,174 3,992 4,305 Add: Deferred tax liability – tax deductible goodwill1 1,401 1,379 1,340 1,401 1,340 Deferred tax liability – intangible assets1 1,148 1,164 1,216 1,148 1,216 Average tangible common shareholders’ equity - Non-GAAP $ 16,653 $ 16,427 $ 17,317 $ 16,390 $ 16,806 Return on tangible common equity – Non-GAAP3 16.2% 20.8% 5.9% 19.7% 16.0% Return on tangible common equity – Non-GAAP adjusted2,3 19.0% 21.0% 16.3% 20.7% 17.6% 1 Deferred tax liabilities are based on fully phased-in Basel III rules. 2 Non-GAAP excludes amortization of intangible assets, net of tax, the gains on the sales of our investment in Wing Hang and the One Wall Street building, the benefit primarily related to a tax carryback claim, charge related to investment management funds, net of incentives, M&I, litigation and restructuring charges (recoveries) and the impairment charge related to a recent court decision, if applicable. 3 Annualized.
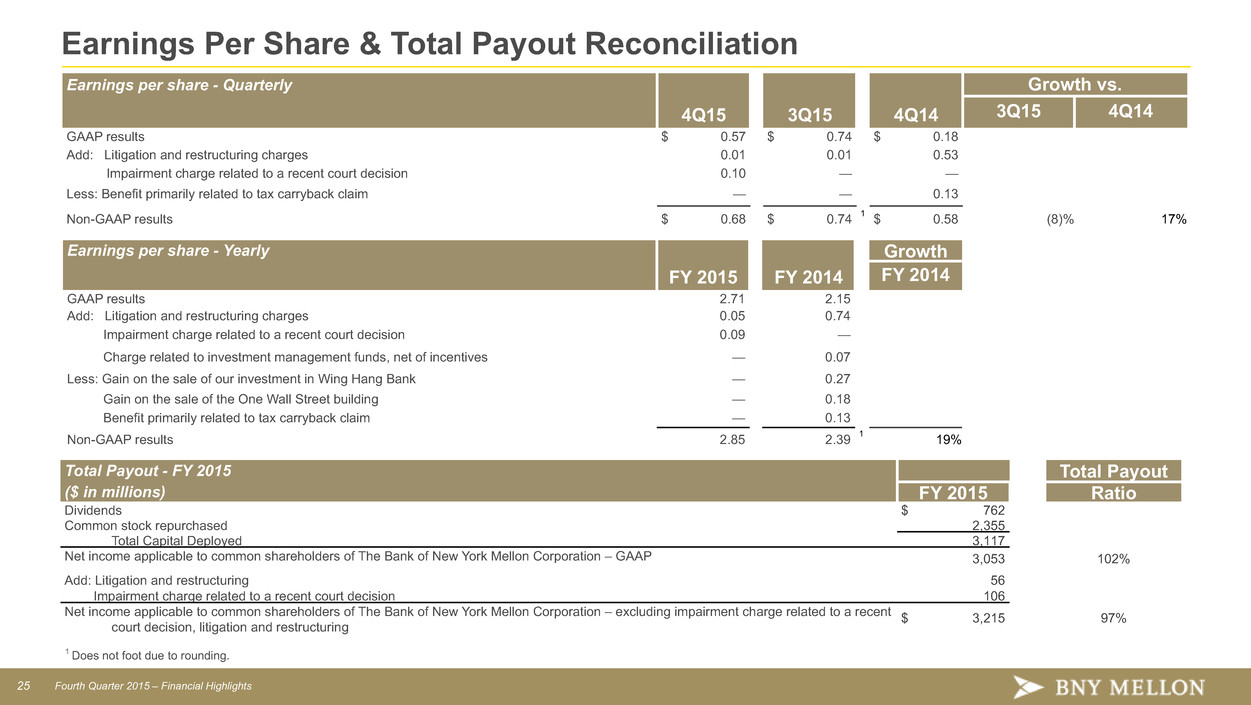
25 Fourth Quarter 2015 – Financial Highlights Earnings Per Share & Total Payout Reconciliation Earnings per share - Quarterly Growth vs. 4Q15 3Q15 4Q14 3Q15 4Q14 GAAP results $ 0.57 $ 0.74 $ 0.18 Add: Litigation and restructuring charges 0.01 0.01 0.53 Impairment charge related to a recent court decision 0.10 — — Less: Benefit primarily related to tax carryback claim — — 0.13 Non-GAAP results $ 0.68 $ 0.74 1 $ 0.58 (8)% 17% 1 Does not foot due to rounding. Earnings per share - Yearly Growth FY 2015 FY 2014 FY 2014 GAAP results 2.71 2.15 Add: Litigation and restructuring charges 0.05 0.74 Impairment charge related to a recent court decision 0.09 — Charge related to investment management funds, net of incentives — 0.07 Less: Gain on the sale of our investment in Wing Hang Bank — 0.27 Gain on the sale of the One Wall Street building — 0.18 Benefit primarily related to tax carryback claim — 0.13 Non-GAAP results 2.85 2.39 1 19% Total Payout - FY 2015 Total Payout ($ in millions) FY 2015 Ratio Dividends $ 762 Common stock repurchased 2,355 Total Capital Deployed 3,117 Net income applicable to common shareholders of The Bank of New York Mellon Corporation – GAAP 3,053 102% Add: Litigation and restructuring 56 Impairment charge related to a recent court decision 106 Net income applicable to common shareholders of The Bank of New York Mellon Corporation – excluding impairment charge related to a recent court decision, litigation and restructuring $ 3,215 97%
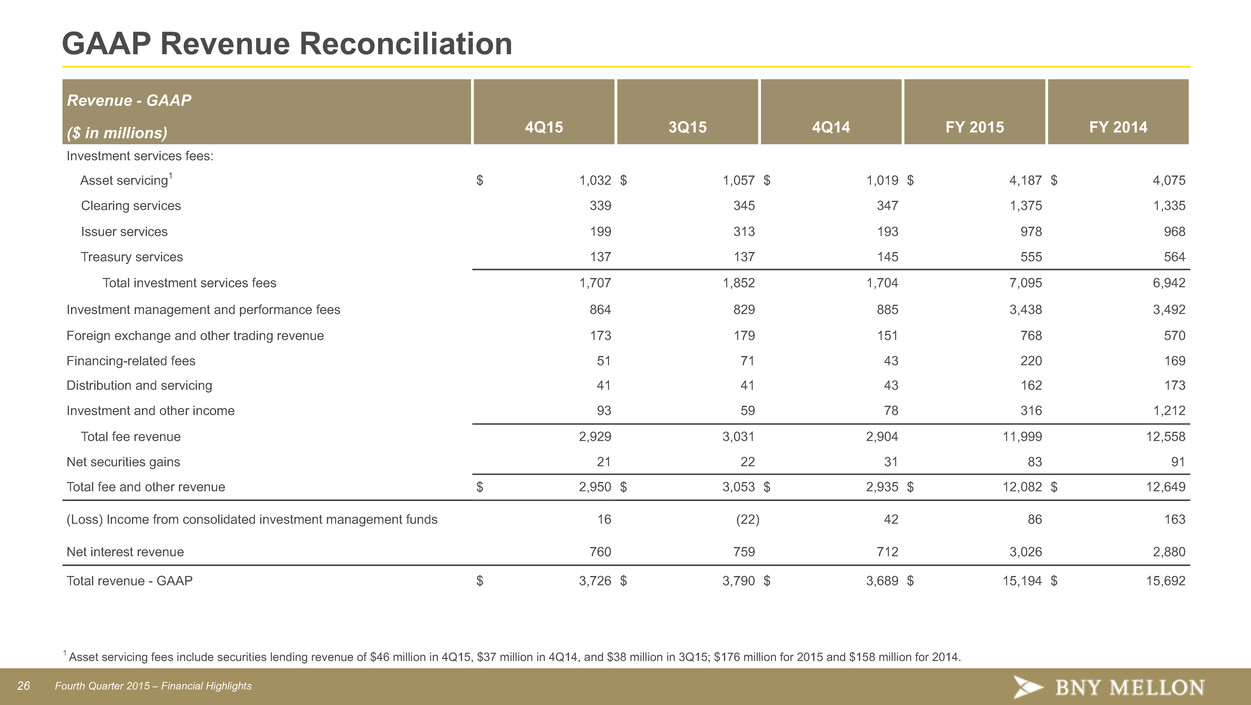
26 Fourth Quarter 2015 – Financial Highlights GAAP Revenue Reconciliation Revenue - GAAP ($ in millions) 4Q15 3Q15 4Q14 FY 2015 FY 2014 Investment services fees: Asset servicing1 $ 1,032 $ 1,057 $ 1,019 $ 4,187 $ 4,075 Clearing services 339 345 347 1,375 1,335 Issuer services 199 313 193 978 968 Treasury services 137 137 145 555 564 Total investment services fees 1,707 1,852 1,704 7,095 6,942 Investment management and performance fees 864 829 885 3,438 3,492 Foreign exchange and other trading revenue 173 179 151 768 570 Financing-related fees 51 71 43 220 169 Distribution and servicing 41 41 43 162 173 Investment and other income 93 59 78 316 1,212 Total fee revenue 2,929 3,031 2,904 11,999 12,558 Net securities gains 21 22 31 83 91 Total fee and other revenue $ 2,950 $ 3,053 $ 2,935 $ 12,082 $ 12,649 (Loss) Income from consolidated investment management funds 16 (22) 42 86 163 Net interest revenue 760 759 712 3,026 2,880 Total revenue - GAAP $ 3,726 $ 3,790 $ 3,689 $ 15,194 $ 15,692 1 Asset servicing fees include securities lending revenue of $46 million in 4Q15, $37 million in 4Q14, and $38 million in 3Q15; $176 million for 2015 and $158 million for 2014.
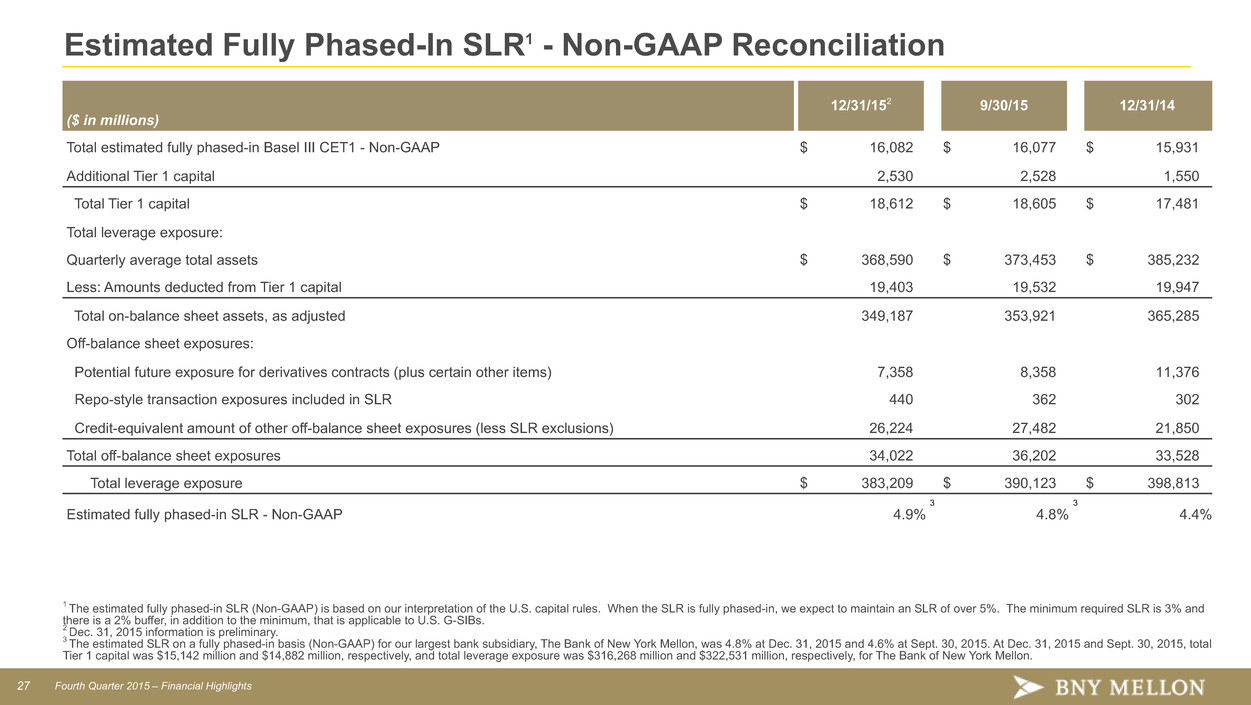
27 Fourth Quarter 2015 – Financial Highlights Estimated Fully Phased-In SLR1 - Non-GAAP Reconciliation ($ in millions) 12/31/152 9/30/15 12/31/14 Total estimated fully phased-in Basel III CET1 - Non-GAAP $ 16,082 $ 16,077 $ 15,931 Additional Tier 1 capital 2,530 2,528 1,550 Total Tier 1 capital $ 18,612 $ 18,605 $ 17,481 Total leverage exposure: Quarterly average total assets $ 368,590 $ 373,453 $ 385,232 Less: Amounts deducted from Tier 1 capital 19,403 19,532 19,947 Total on-balance sheet assets, as adjusted 349,187 353,921 365,285 Off-balance sheet exposures: Potential future exposure for derivatives contracts (plus certain other items) 7,358 8,358 11,376 Repo-style transaction exposures included in SLR 440 362 302 Credit-equivalent amount of other off-balance sheet exposures (less SLR exclusions) 26,224 27,482 21,850 Total off-balance sheet exposures 34,022 36,202 33,528 Total leverage exposure $ 383,209 $ 390,123 $ 398,813 Estimated fully phased-in SLR - Non-GAAP 4.9% 3 4.8% 3 4.4% 1 The estimated fully phased-in SLR (Non-GAAP) is based on our interpretation of the U.S. capital rules. When the SLR is fully phased-in, we expect to maintain an SLR of over 5%. The minimum required SLR is 3% and there is a 2% buffer, in addition to the minimum, that is applicable to U.S. G-SIBs. 2 Dec. 31, 2015 information is preliminary. 3 The estimated SLR on a fully phased-in basis (Non-GAAP) for our largest bank subsidiary, The Bank of New York Mellon, was 4.8% at Dec. 31, 2015 and 4.6% at Sept. 30, 2015. At Dec. 31, 2015 and Sept. 30, 2015, total Tier 1 capital was $15,142 million and $14,882 million, respectively, and total leverage exposure was $316,268 million and $322,531 million, respectively, for The Bank of New York Mellon.
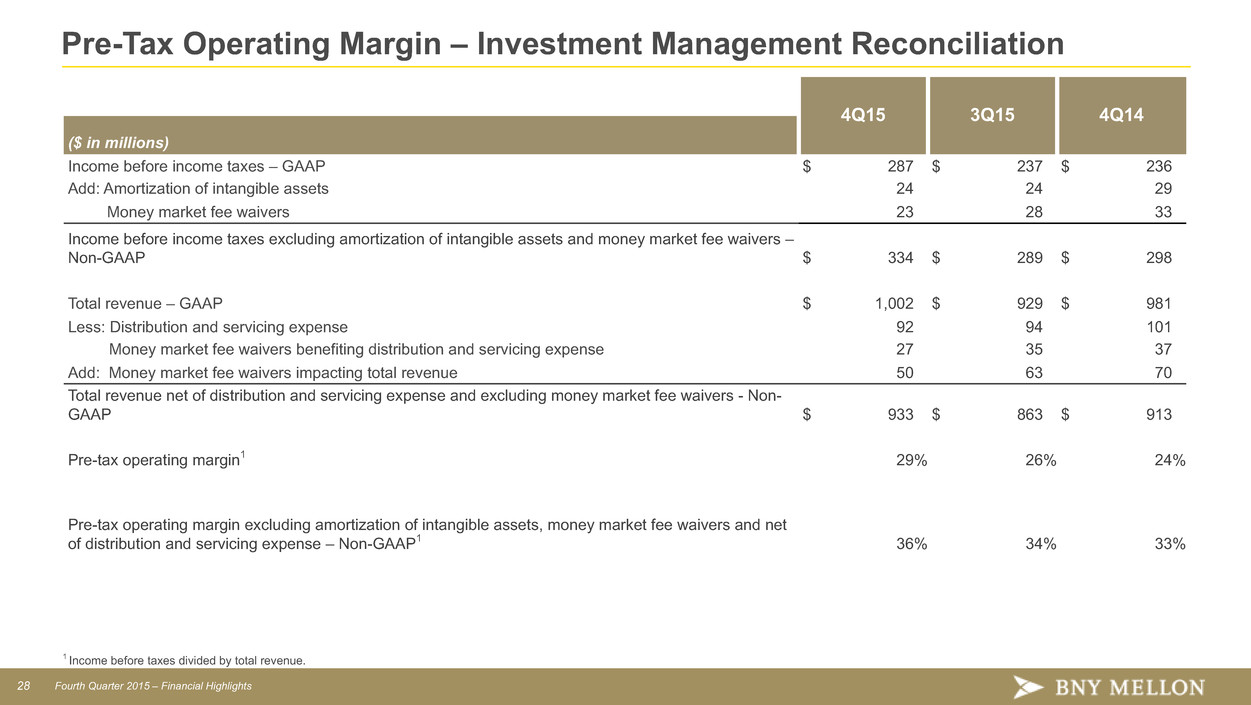
28 Fourth Quarter 2015 – Financial Highlights Pre-Tax Operating Margin – Investment Management Reconciliation 4Q15 3Q15 4Q14 ($ in millions) Income before income taxes – GAAP $ 287 $ 237 $ 236 Add: Amortization of intangible assets 24 24 29 Money market fee waivers 23 28 33 Income before income taxes excluding amortization of intangible assets and money market fee waivers – Non-GAAP $ 334 $ 289 $ 298 Total revenue – GAAP $ 1,002 $ 929 $ 981 Less: Distribution and servicing expense 92 94 101 Money market fee waivers benefiting distribution and servicing expense 27 35 37 Add: Money market fee waivers impacting total revenue 50 63 70 Total revenue net of distribution and servicing expense and excluding money market fee waivers - Non- GAAP $ 933 $ 863 $ 913 Pre-tax operating margin1 29% 26% 24% Pre-tax operating margin excluding amortization of intangible assets, money market fee waivers and net of distribution and servicing expense – Non-GAAP1 36% 34% 33% 1 Income before taxes divided by total revenue.
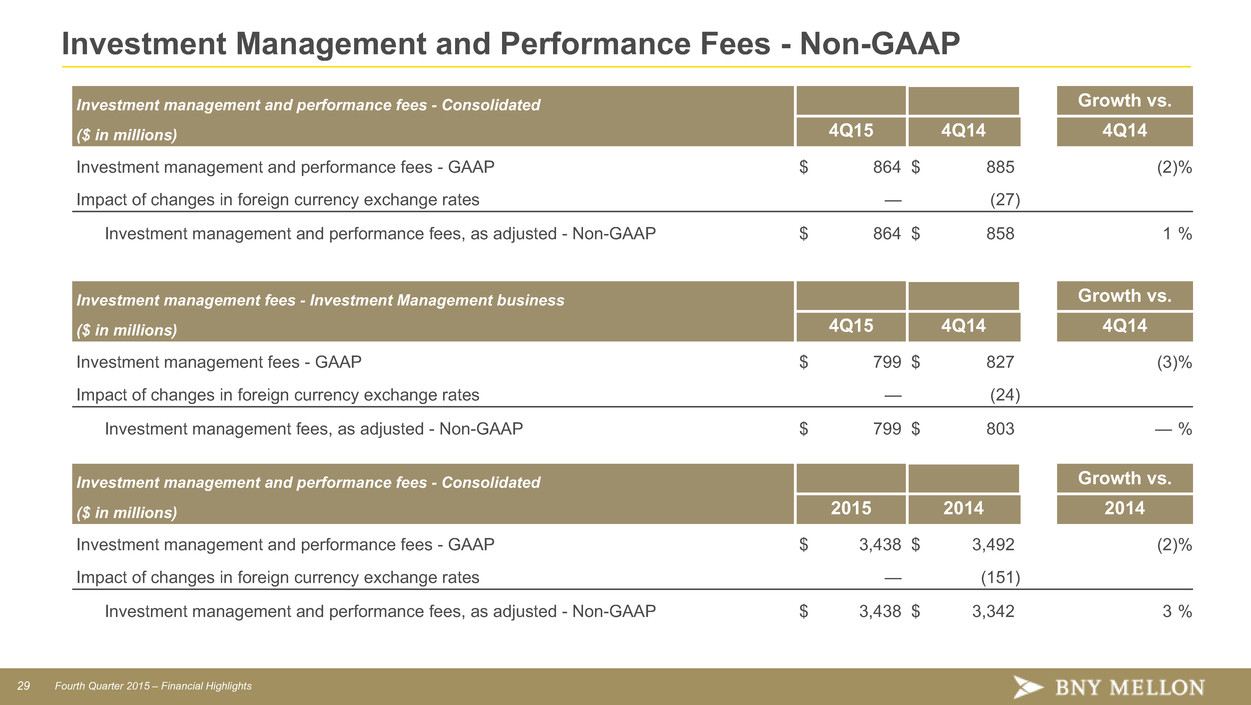
29 Fourth Quarter 2015 – Financial Highlights Investment Management and Performance Fees - Non-GAAP Investment management fees - Investment Management business Growth vs. ($ in millions) 4Q15 4Q14 4Q14 Investment management fees - GAAP $ 799 $ 827 (3)% Impact of changes in foreign currency exchange rates — (24) Investment management fees, as adjusted - Non-GAAP $ 799 $ 803 — % Investment management and performance fees - Consolidated Growth vs. ($ in millions) 4Q15 4Q14 4Q14 Investment management and performance fees - GAAP $ 864 $ 885 (2)% Impact of changes in foreign currency exchange rates — (27) Investment management and performance fees, as adjusted - Non-GAAP $ 864 $ 858 1 % Investment management and performance fees - Consolidated Growth vs. ($ in millions) 2015 2014 2014 Investment management and performance fees - GAAP $ 3,438 $ 3,492 (2)% Impact of changes in foreign currency exchange rates — (151) Investment management and performance fees, as adjusted - Non-GAAP $ 3,438 $ 3,342 3 %


