UNITED STATES
SECURITIES AND EXCHANGE COMMISSION
Washington, DC 20549
FORM 10-K
(Mark One)
| x | ANNUAL REPORT PURSUANT TO SECTION 13 OR 15(d) OF THE SECURITIES EXCHANGE ACT OF 1934 |
For the fiscal year ended September 30, 2007
OR
| ¨ | TRANSITION REPORT PURSUANT TO SECTION 13 OR 15(d) OF THE SECURITIES EXCHANGE ACT OF 1934 |
For the transition period from to
Commission File Number: 333-141572
BCSB BANCORP, INC.
(Exact name of registrant as specified in its charter)
| | |
Maryland | | 26-1424764 |
(State or other jurisdiction of incorporation or organization) | | (I.R.S. Employer Identification No.) |
| | |
| 4111 E. Joppa Road, Suite 300, Baltimore, Maryland | | 21236 |
| (Address of principal executive offices) | | (Zip Code) |
Issuer’s telephone number, including area code: (410) 256-5000
Securities registered pursuant to Section 12(b) of the Act: None
Securities registered pursuant to Section 12(g) of the Act: None
Indicate by check mark if the registrant is a well-known seasoned issuer, as defined in Rule 405 of the Securities Act. Yes ¨ No x
Indicate by check mark if the registrant is not required to file reports pursuant to Section 13 or 15(d) of the Act. Yes ¨ No x
Indicate by check mark whether the registrant: (1) has filed all reports required to be filed by Section 13 or 15(d) of the Securities Exchange Act of 1934 during the preceding 12 months (or for such shorter period that the registrant was required to file such reports), and (2) has been subject to such filing requirements for the past 90 days. Yes x No ¨
Indicate by check mark if disclosure of delinquent filers pursuant to Item 405 of Regulation S-K is not contained herein, and will not be contained, to the best of registrant’s knowledge, in definitive proxy or information statements incorporated by reference in Part III of this Form 10-K or any amendment to this Form 10-K. ¨
Indicate by check mark whether the registrant is a large accelerated, an accelerated filer, or a non-accelerated filer. See definition of “accelerated filer and large accelerated filer” in Rule 12b-2 of the Exchange Act. (Check one):
Large Accelerated Filer ¨ Accelerated Filer ¨ Non-accelerated Filer x
Indicate by check mark whether the registrant is a shell company (as defined in Rule 12b-2 of the Exchange Act). Yes ¨ No x
The aggregate market value of voting and non-voting common equity held by non-affiliates was $0 as of March 31, 2007.
Number of shares of Common Stock outstanding as of December 31, 2007:0
DOCUMENTS INCORPORATED BY REFERENCE
The following lists the documents incorporated by reference and the Part of the Form 10-K into which the document is incorporated:
| | 1. | Portions of Proxy Statement for the registrant’s 2008 Annual Meeting of Stockholders. (Part III) |
Forward-Looking Statements
When used in this Annual Report, the words or phrases “will likely result,” “are expected to,” “will continue,” “is anticipated,” “estimate,” “project” or similar expressions are intended to identify “forward-looking statements” within the meaning of the Private Securities Litigation Reform Act of 1995. Such statements are subject to certain risks and uncertainties including changes in economic conditions in the Company’s market area, changes in policies by regulatory agencies, fluctuations in interest rates, demand for loans in the Company’s market area, competition and information provided by third-party vendors that could cause actual results to differ materially from historical earnings and those presently anticipated or projected. The Company wishes to caution readers not to place undue reliance on any such forward-looking statements, which speak only as of the date made. The Company wishes to advise readers that the factors listed above could affect the Company’s financial performance and could cause the Company’s actual results for future periods to differ materially from any opinions or statements expressed with respect to future periods in any current statements.
The Company does not undertake, and specifically disclaims any obligation, to publicly release the result of any revisions which may be made to any forward-looking statements to reflect events or circumstances after the date of such statements or to reflect the occurrence of anticipated or unanticipated events.
PART I
Item 1. Business
General
BCSB Bancorp, Inc. BCSB Bancorp, Inc. is a Maryland corporation formed by Baltimore County Savings Bank, F. S. B. (the “Bank”) in March 2007 to be its new holding company upon the completion of the Bank’s conversion from the mutual holding company to the stock holding company form of organization (the “Conversion”). As of September 30, 2007, BCSB Bancorp had not engaged in any business operations, and, therefore, the information presented in this Annual Report on Form 10-K is for BCSB Bankcorp, Inc.
BCSB Bankcorp. BCSB Bankcorp (the “Company”) is a federally chartered mid-tier stock holding company that was formed in 1998. Currently BCSB Bankcorp owns all of Baltimore County Savings Bank’s capital stock and directs, plans and coordinates Baltimore County Savings Bank’s business activities. At September 30, 2007, BCSB Bankcorp had 5,929,743 issued and outstanding shares of common stock. Baltimore County Savings Bank, M.H.C. (the “MHC”) owns 3,754,960 shares, representing 63.3% of the outstanding common stock, and the remaining 2,174,783 shares are held by the public. At September 30, 2007, the Company had total assets of $642.4 million, deposits of $558.4 million and total stockholders’ equity of $34.6 million.
The Company’s net income has decreased in recent years. Net income was $1.7 million, $1.3 million, $885,000 and $601,000 for the years ended September 30, 2002, 2003, 2004 and 2005, respectively. The Company had a net loss of $2.9 million and $7.4 million for the years ended September 30, 2007 and 2006, respectively. At September 30, 2007, net loans receivable were $416.3 million, which included single-family residential loans, single-family rental property loans, commercial real estate loans, construction loans and commercial lines of credit, totaling $164.5 million, $36.2 million, $119.6 million, $42.3 million and $13.0 million, respectively, representing 38.19%, 8.42%, 27.77%, 9.82% and 3.01%, respectively, of our gross loan portfolio. Deposits consist primarily of certificates of deposit, passbook savings deposits, NOW accounts and money market deposit accounts, which totaled $393.1 million, $81.6 million, $65.3 million and $18.3 million, respectively, at September 30, 2007 representing 70.4%, 14.6%, 11.7% and 3.3%, respectively, of total deposits at that date. At September 30, 2007, $119.6 million of certificates of deposit, representing 21.4% of total deposits, had balances of more than $100,000.
The Company’s and the Bank’s executive offices are located at 4111 E. Joppa Road, Suite 300, Baltimore, Maryland 21236, and its main telephone number is (410) 256-5000.
Baltimore County Savings Bank, F.S.B.Baltimore County Savings Bank, F.S.B. is a community-oriented financial institution dedicated to serving the financial service needs of consumers and businesses within its market area, which consists of the Baltimore Metropolitan Area. The Bank is subject to extensive regulation, examination and supervision by the Office of Thrift Supervision, its primary federal regulator, and the Federal Deposit Insurance Corporation, its deposit insurer. The Bank attracts deposits from the general public and invests these funds in loans secured by first mortgages on owner-occupied, single-family residences in its market area and other real estate loans consisting of commercial real estate loans, construction loans and single-family rental property loans. To a lesser extent, the Bank originates consumer loans and commercial loans. The Bank derives its
1
income primarily from interest earned on these loans, and to a lesser extent, interest earned on investment securities and mortgage-backed securities. The Bank operates out of its main office in Baltimore County, Maryland and 18 branch offices in Baltimore County, Harford County and Howard County and Baltimore City in Maryland.
Market Area
The Bank’s market area consists of the Baltimore metropolitan area. At September 30, 2007, management estimates that more than 95% of deposits and 95% of all lending came from its market area.
The economy of the Bank’s market area is a diverse cross section of employment sectors, with a mix of services, manufacturing, wholesale/retail trade, federal and local government, health care facilities and finance related employment. This partially mitigates the risk associated with a decline in any particular economic sector. Once the backbone of the regional economy, the manufacturing industry is relatively stable following a long period of decline. Demographic and economic growth trends, measured by changes in population, number of households, age distribution and median household income, provide key insight into the health of our market area. Baltimore County has the largest population at 768,000, followed by Baltimore City at 633,000, Anne Arundel County at 512,000, Howard County at 270,200 and Harford County at 238,750. Located adjacent to major transportation corridors and Washington, DC, the Baltimore metropolitan area provides a diversified broad economic base. According to Baltimore County Department of Economic Development 78% of Baltimore County’s employees work in the private sector with approximately 7% in manufacturing, 20% in trade, transportation and utilities, 12.0% in professional business services, 22.0% in education and health services, and 8% in leisure and hospitality. Government provides 17.5% of Baltimore County’s jobs, with self-employed providing the remaining employment.
Harford County continues to experience strong economic growth while maintaining a strong government presence of approximately 12,486 employed in the Aberdeen Proving Grounds (APG) both in the military and in civilian capacity. The Maryland Department of Labor and Licensing Regulation estimates 61,323 work in Harford County’s private sector with 23% working in retail trade, transportation, and utilities, 12.7% in professional or business services, 10.59% in local government and 10.0% in education and health services. Going forward Harford county and the entire Baltimore metropolitan area will benefit from final congressional approval of the Base Realignment or Closure Commission’s (BRAC) decision to shift an additional 8,000 department of defense jobs to APG according to the Maryland Department of Planning, BRAC report issued in December 2006. The department estimates approximately 14,000 households to be located in Harford and Cecil Counties over 2009 through 2015.
Based on data provided by Environmental Systems Research Institute, Inc. from 2000 to 2006, Baltimore City experienced a decline in population at a rate of 0.5% annually, while Baltimore County’s population increased at a 0.9% annual rate over the same period. Comparatively, over the same time period, annual population growth rates for Harford County and Howard County equaled 1.8% and 1.7%, respectively, which exceeded the comparable Maryland growth rate of 1.2% and the U.S. growth rate of 1.3%.
Income levels in the market area tend to reflect the nature of the markets served, with higher income levels in the faster growing suburban markets. Based on data provided by Environmental Systems Research Institute, Inc. from 2000 to 2006 Baltimore City’s median income increased at an annual rate of 2.9%, while Baltimore County’s median income increased 3.2% over the same period. Comparatively, over the same time period, annual median income growth rates for Howard County and Harford County equaled 3.7% and 3.4%, respectively, outpacing the Maryland and U.S. median income growth rate of 3.4%.
Following the median income growth rate pattern, based on data provided by Environmental Systems Research Institute, Inc., the annual rate of growth of per capita income for Baltimore City was 3.1%, while Baltimore County’s was 3.5% from 2000 to 2006. Comparatively, over the same time period, annual per capita income for Howard County increased 5.0%, while Harford County’s increased 4.0%, exceeding the comparable Maryland per capita growth rate of 4.0% and the U.S. per capita growth rate of 3.9%.
2
Lending Activities
General. The Bank’s gross loan portfolio totaled $430.7 million at September 30, 2007, representing 67.0% of total assets at that date. At September 30, 2007, $164.5 million, or 38.2% of the Bank’s gross loan portfolio, consisted of single-family, residential mortgage loans. Other loans secured by real estate include construction loans, single-family rental property and commercial real estate loans, which amounted to $42.3 million, $36.2 million and $119.6 million, respectively, or 9.8%, 8.4% and 27.8%, respectively, of the Bank’s gross loan portfolio at September 30, 2007. The Bank also originates consumer loans, consisting primarily of automobile loans and home equity lines of credit, which totaled $30.5 million and $17.0 million, respectively, or 7.08% and 3.9% respectively, of the Bank’s gross loan portfolio. Other lending activities include commercial lines of credit, which totaled $13.0 million, or 3.0% of the Bank’s gross loan portfolio.
3
Loan Portfolio Composition.The following table sets forth selected data relating to the composition of the Bank’s loan portfolio by type of loan at the dates indicated. At September 30, 2007, the Bank had no concentrations of loans exceeding 10% of gross loans other than as disclosed below.
| | | | | | | | | | | | | | | | | | | | | | | | | | | | | | |
| | | At September 30, | |
| | | 2007 | | | 2006 | | | 2005 | | | 2004 | | | 2003 | |
| | | Amount | | % | | | Amount | | % | | | Amount | | % | | | Amount | | % | | | Amount | | % | |
| | | (Dollars in thousands) | |
Real Estate Loans: | | | | | | | | | | | | | | | | | | | | | | | | | | | | | | |
Single-family residential (1) | | $ | 164,522 | | 38.19 | % | | $ | 214,724 | | 44.50 | % | | $ | 195,203 | | 40.44 | % | | $ | 179,010 | | 43.47 | % | | $ | 179,552 | | 46.32 | % |
Single-family rental property loans | | | 36,245 | | 8.42 | | | | 29,131 | | 6.04 | | | | 26,914 | | 5.58 | | | | 19,257 | | 4.68 | | | | 14,348 | | 3.70 | |
Commercial | | | 119,598 | | 27.77 | | | | 110,179 | | 22.83 | | | | 75,034 | | 15.55 | | | | 64,615 | | 15.69 | | | | 53,675 | | 13.85 | |
Construction (2) | | | 42,284 | | 9.82 | | | | 39,021 | | 8.09 | | | | 53,755 | | 11.14 | | | | 23,225 | | 5.64 | | | | 16,411 | | 4.23 | |
Commercial lines of credit | | | 12,982 | | 3.01 | | | | 9,606 | | 2.00 | | | | 16,463 | | 3.41 | | | | 16,038 | | 3.89 | | | | 6,410 | | 1.65 | |
Commercial leases | | | 4,574 | | 1.06 | | | | 4,749 | | .98 | | | | 3,300 | | .68 | | | | 1,300 | | .32 | | | | 820 | | .21 | |
Commercial loans secured | | | — | | — | | | | 365 | | .08 | | | | 1,869 | | .39 | | | | 800 | | .20 | | | | 133 | | .03 | |
Commercial loans unsecured | | | 336 | | .08 | | | | 409 | | .08 | | | | 538 | | .11 | | | | 545 | | .13 | | | | 678 | | .17 | |
| | | | | | | | | | |
Consumer Loans: | | | | | | | | | | | | | | | | | | | | | | | | | | | | | | |
Automobile | | | 30,490 | | 7.08 | | | | 53,530 | | 11.09 | | | | 88,287 | | 18.29 | | | | 88,122 | | 21.40 | | | | 98,168 | | 25.33 | |
Home equity lines of credit | | | 16,960 | | 3.94 | | | | 17,942 | | 3.72 | | | | 17,901 | | 3.71 | | | | 15,629 | | 3.79 | | | | 13,943 | | 3.60 | |
Other | | | 2,713 | | .63 | | | | 2,849 | | .59 | | | | 3,377 | | .70 | | | | 3,265 | | .79 | | | | 3,474 | | .90 | |
| | | | | | | | | | | | | | | | | | | | | | | | | | | | | | |
| | | 430,704 | | 100 | % | | | 482,505 | | 100.00 | % | | | 482,641 | | 100.00 | % | | | 411,806 | | 100.00 | % | | | 387,612 | | 100.00 | % |
| | | | | | | | | | | | | | | | | | | | | | | | | | | | | | |
Add: | | | | | | | | | | | | | | | | | | | | | | | | | | | | | | |
Purchase accounting premium (net) | | | 285 | | | | | | 451 | | | | | | 665 | | | | | | 950 | | | | | | 1,320 | | | |
Less: | | | | | | | | | | | | | | | | | | | | | | | | | | | | | | |
Undisbursed portion of loans in process | | | 9,846 | | | | | | 12,014 | | | | | | 16,874 | | | | | | 13,764 | | | | | | 7,753 | | | |
Deferred loan origination fees | | | 558 | | | | | | 355 | | | | | | 272 | | | | | | 267 | | | | | | 429 | | | |
Unearned interest | | | 1,633 | | | | | | 4,132 | | | | | | 9,067 | | | | | | 10,002 | | | | | | 12,750 | | | |
Allowance for loan losses | | | 2,650 | | | | | | 2,679 | | | | | | 2,746 | | | | | | 2,587 | | | | | | 2,698 | | | |
| | | | | | | | | | | | | | | | | | | | | | | | | | | | | | |
Total | | $ | 416,302 | | | | | $ | 463,776 | | | | | $ | 454,347 | | | | | $ | 386,136 | | | | | $ | 365,302 | | | |
| | | | | | | | | | | | | | | | | | | | | | | | | | | | | | |
| (1) | Includes fixed-rate second mortgage loans. |
| (2) | Includes acquisition and development loans. |
4
Loan Maturity Schedules. The following table sets forth certain information at September 30, 2007 regarding the dollar amount of loans maturing in the Bank’s portfolio based on their contractual terms to maturity, including scheduled repayments of principal. Demand loans, loans having no stated schedule of repayments and no stated maturity, and overdrafts are reported as due in one year or less. The table does not include any estimate of prepayments which significantly shorten the average life of mortgage loans and may cause the Bank’s repayment experience to differ from that shown below.
| | | | | | | | | | | | |
| | | Due in 1 year
of less | | Due 1 through
5 years | | Due after
5 years | | Total |
| | | (In thousands) |
Real Estate Loans | | | | | | | | | | | | |
Single-family residential | | $ | 3,928 | | $ | 13,099 | | $ | 147,495 | | $ | 164,522 |
Single-family rental property | | | 339 | | | 913 | | | 34,993 | | | 36,245 |
Commercial | | | 2,340 | | | 3,144 | | | 114,114 | | | 119,598 |
Construction | | | 18,626 | | | 7,030 | | | 16,628 | | | 42,284 |
Commercial lines of credit | | | 2,290 | | | 237 | | | 10,455 | | | 12,982 |
Commercial leases | | | 202 | | | 4,148 | | | 224 | | | 4,574 |
Commercial loans unsecured | | | 336 | | | | | | — | | | 336 |
Consumer: | | | | | | | | | | | | |
Automobile | | | 1,718 | | | 28,158 | | | 614 | | | 30,490 |
Home equity lines of credit | | | — | | | — | | | 16,960 | | | 16,960 |
Other | | | 485 | | | 975 | | | 1,253 | | | 2,713 |
| | | | | | | | | | | | |
Total | | $ | 30,264 | | $ | 57,704 | | $ | 342,736 | | $ | 430,704 |
| | | | | | | | | | | | |
The following table sets forth at September 30, 2007, the dollar amount of all loans due within one year and one year or more after September 30, 2007 which have predetermined interest rates and have floating or adjustable interest rates.
| | | | | | |
| | | Predetermined
Rate | | Floating or Adjustable Rates |
| | | (In thousands) |
Real Estate loans: | | | | | | |
Single-family residential | | $ | 151,161 | | $ | 13,361 |
Single-family rental property | | | 9,162 | | | 27,083 |
Commercial | | | 35,632 | | | 83,966 |
Construction | | | 20,954 | | | 21,330 |
Commercial lines of credit | | | — | | | 12,982 |
Commercial leases | | | 4,574 | | | — |
Commercial loans unsecured | | | 336 | | | — |
Consumer: | | | | | | |
Automobiles | | | 30,490 | | | — |
Home equity lines of credit | | | — | | | 16,960 |
Other | | | 2,713 | | | — |
| | | | | | |
Total | | $ | 255,022 | | $ | 175,682 |
| | | | | | |
Scheduled contractual principal repayments of loans do not reflect the actual life of such assets. The average life of loans is substantially less than their contractual terms because of prepayments. In addition, due-on-sale clauses on loans generally give the Bank the right to declare a loan immediately due and payable in the event, among other things, that the borrower sells the real property subject to the mortgage and the loan is not repaid. The average life of mortgage loans tends to increase when current mortgage loan market rates are substantially higher than rates on existing mortgage loans and, conversely, decrease when current mortgage loan market rates are substantially lower than rates on existing mortgage loans.
5
Originations, Purchases and Sales of Loans. The Bank generally has authority to originate and purchase loans secured by real estate located throughout the United States. Consistent with its emphasis on being a community-oriented financial institution, the Bank concentrates its lending activities in its market area.
The following table sets forth certain information with respect to the Bank’s loan origination, purchase and sale activity for the periods indicated.
| | | | | | | | | |
| | | Year Ended September 30, |
| | | 2007 | | 2006 | | 2005 |
| | | (In thousands) |
Loans originated: | | | | | | | | | |
Real Estate Loans: | | | | | | | | | |
Single-family residential | | $ | 32,421 | | $ | 50,160 | | $ | 53,800 |
Single-family rental property | | | 11,097 | | | 5,779 | | | 10,599 |
Commercial | | | 20,060 | | | 36,463 | | | 39,095 |
Construction | | | 14,517 | | | 14,738 | | | 18,652 |
Commercial lines of credit | | | 1,712 | | | 3,275 | | | 8,174 |
Commercial loans secured | | | — | | | 107 | | | 2,866 |
Commercial leases | | | 2,205 | | | 2,745 | | | 190 |
Consumer: | | | | | | | | | |
Automobile | | | 4,152 | | | 6,884 | | | 47,659 |
Home equity lines of credit | | | 4,457 | | | 8,435 | | | 11,803 |
Other | | | 1,367 | | | 896 | | | 1,089 |
| | | | | | | | | |
Total loans originated | | $ | 91,988 | | $ | 129,482 | | $ | 193,927 |
| | | | | | | | | |
Loans purchased: | | | | | | | | | |
Real estate loans | | $ | 3,500 | | $ | 0 | | $ | 0 |
| | | | | | | | | |
Total loans purchased | | $ | 0 | | $ | 0 | | $ | 0 |
| | | | | | | | | |
Loans sold: | | | | | | | | | |
Whole loans | | $ | 46,438 | | $ | 0 | | $ | 0 |
| | | | | | | | | |
Total loans sold | | $ | 46,438 | | $ | 0 | | $ | 0 |
| | | | | | | | | |
The Bank’s loan originations are derived from a number of sources, including referrals by realtors, depositors and borrowers and advertising, as well as walk-in customers. The Bank’s solicitation programs consist of advertisements in local media, in addition to occasional participation in various community organizations and events. Real estate loans are originated by the Bank’s loan personnel. Automobile loans are originated by the Bank’s loan personnel and loan applications are accepted at the Bank’s offices.
Loan Underwriting Policies. The Bank’s lending activities are subject to the Bank’s written, non-discriminatory underwriting standards and to loan origination procedures prescribed by the Bank’s Board of Directors and its management. Detailed loan applications are obtained to determine the borrower’s ability to repay, and the more significant items on these applications are verified through the use of credit reports, financial statements and confirmations. Loans are approved based on a loan approval matrix, which is governed by the type of loan and the loan amount. Levels of approval are the loan officer, officers’ loan committee, which includes the President, Chief Financial Officer, Executive Vice President in charge of lending and Executive Vice President of Operations, a directors loan committee which consist of the officers’ loan committee and at least three outside directors, and the full board. Individual officers of the Bank have been granted authority by the Board of Directors to approve loans up to varying specified dollar amounts, depending upon the type of loan. Applications for single-family real estate loans generally are underwritten and closed in accordance with the standards of the Federal Home Loan Mortgage Corporation, (“FHLMC”) and the Federal National Mortgage Association, (“FNMA”). Upon receipt of a loan application from a prospective borrower, a credit report and verifications are ordered to verify specific information relating to the loan applicant’s employment, income and credit standing. If a proposed loan is to be secured by a deed of trust or a mortgage on real estate, an appraisal of the real estate is generally undertaken by an appraiser approved by the Bank and licensed by the State of Maryland. In the case of single-family residential mortgage loans, except when the Bank becomes aware of a particular risk of environmental contamination, the Bank generally does not obtain a formal environmental report on the real estate at the time a loan is made. A formal environmental report may be required in connection with commercial real estate loan.
6
It is the Bank’s policy to record a lien on the real estate securing a loan and to obtain title insurance or an attorney’s certification which ensures that the property is free of prior encumbrances and other possible title defects. Borrowers must also obtain hazard insurance policies prior to closing. When the property is in a flood plain as designated by Federal Emergency Management Agency, the Bank requires adequate flood insurance prior to settlement of the loan.
With respect to single-family residential mortgage loans, the Bank makes a loan commitment of between 30 and 60 days for each loan approved. If the borrower desires a longer commitment, the commitment may be extended for good cause and upon written approval.
The Bank is permitted to lend up to 97% of the lesser of the appraised value or the purchase price of the real property securing a mortgage loan. However, if the amount of a residential loan originated or refinanced exceeds 90% of the appraised value, the Bank’s policy is to obtain private mortgage insurance at the borrower’s expense on the principal amount of the loan. The Bank does provide a first time home buyers loan program in conjunction with the Federal Home Loan Bank of Atlanta where 100% of the loan amount will be funded for qualified buyers. The Bank will make a single-family residential mortgage loan with up to a 97% loan-to-value ratio if the required private mortgage insurance is obtained. The Bank generally limits the loan-to-value ratio on commercial real estate mortgage loans to 80%, although the loan-to-value ratio on commercial real estate loans in limited circumstances has been as high as 90%. The Bank limits the loan-to-value ratio on single-family rental property loans to 80%. Home equity loans are made in amounts which, when added to any senior indebtedness, do not exceed 90% of the value of the property.
Under applicable law, with certain limited exceptions, loans and extensions of credit by a savings institution to a person outstanding at one time shall not exceed 15% of the institution’s unimpaired capital and surplus. Loans and extensions of credit fully secured by readily marketable collateral may comprise an additional 10% of unimpaired capital and surplus. Under these limits, the Bank’s loans to one borrower were limited to $7.6 million at September 30, 2007. Applicable law additionally authorizes savings institutions to make loans to one borrower, for any purpose, in an amount not to exceed $500,000 or in an amount not to exceed the lesser of $30,000,000 or 30% of unimpaired capital and surplus to develop residential housing, provided: (i) the purchase price of each single-family dwelling in the development does not exceed $500,000; (ii) the savings institution is and continues to be in compliance with its fully phased-in regulatory capital requirements; (iii) the loans comply with applicable loan-to-value requirements; (iv) the aggregate amount of loans made under this authority does not exceed 150% of unimpaired capital and surplus; and (v) the Director of OTS, by order, permits the savings institution to avail itself of this higher limit. At September 30, 2007, the Bank had no lending relationships in excess of the loans-to-one-borrower limit. At September 30, 2007, the Bank’s largest loan customer, a residential land developer, was a $5.5 million relationship consisting of residential properties. At September 30, 2007, the loans were current and performing in accordance with their terms.
Interest rates charged by the Bank on loans are affected principally by competitive factors, the demand for such loans and the supply of funds available for lending purposes. These factors are, in turn, affected by general economic conditions, monetary policies of the federal government, including the Federal Reserve Board, legislative tax policies and government budgetary matters.
Single-Family Residential Real Estate Lending. The Bank historically has been and continues to be an originator of single-family, residential real estate loans in its market area. At September 30, 2007, single-family, residential mortgage loans, excluding single-family rental property loans and home equity loans, totaled $164.5 million, or 38.2% of the Bank’s gross loan portfolio.
The Bank originates fixed-rate mortgage loans at competitive interest rates. At September 30, 2007, the Bank had $151.2 million of fixed-rate single-family mortgage loans, which amounted to 91.9% of the Bank’s single-family mortgage loans. The Bank emphasizes the origination of fixed-rate single-family residential mortgage loans with maturities of 30 years or less by offering competitive rates.
7
The Bank also offers adjustable-rate single-family residential mortgage loans. As of September 30, 2007, $13.4 million, or 8.1% of the Bank’s single-family mortgage loans carried adjustable rates. After the initial term, the rate adjustments on the Bank’s adjustable-rate loans are indexed to a rate which adjusts annually based upon changes in an index based on the weekly average yield on U.S. Treasury securities adjusted to a constant comparable maturity of one year, as made available by the Federal Reserve Board. The interest rates on most of the Bank’s adjustable-rate mortgage loans are adjusted once a year, and the Bank offers loans that have an initial adjustment period of one, three or five years. The maximum adjustment is 2% per adjustment period with a maximum aggregate adjustment of 6% over the life of the loan. The Bank offers adjustable-rate mortgage loans that provide for initial rates of interest below the rates that would prevail when the index used for repricing is applied,i.e., “teaser” rates. All of the Bank’s adjustable-rate loans require that any payment adjustment resulting from a change in the interest rate be sufficient to result in full amortization of the loan by the end of the loan term and, thus, do not permit any of the increased payment to be added to the principal amount of the loan, known as “negative amortization.”
The retention of adjustable-rate loans in the Bank’s portfolio helps reduce the Bank’s exposure to increases in prevailing market interest rates. However, there are unquantifiable credit risks resulting from potential increases in costs to borrowers in the event of upward repricing of adjustable-rate loans. It is possible that during periods of rising interest rates, the risk of default on adjustable-rate loans may increase due to increases in interest costs to borrowers. Further, although adjustable-rate loans allow the Bank to increase the sensitivity of its interest-earning assets to changes in interest rates, the extent of this interest sensitivity is limited by the initial fixed-rate period before the first adjustment and the lifetime interest rate adjustment limitations. Accordingly, there can be no assurance that yields on the Bank’s adjustable-rate loans will fully adjust to compensate for increases in the Bank’s cost of funds. Finally, adjustable-rate loans increase the Bank’s exposure to decreases in prevailing market interest rates, although decreases in the Bank’s cost of funds tend to offset this effect.
Single-family Rental Property Loans. The Bank also offers single-family residential mortgage loans secured by properties that are not owner-occupied. As of September 30, 2007, single-family rental property loans totaled $36.2 million, or 8.4%, of the Bank’s gross loan portfolio. Originations of single-family rental property loans were $11.1 million, $5.8 million and $10.6 million for the years ended September 30, 2007, 2006 and 2005, respectively. Single-family residential mortgage loans secured by non-owner-occupied properties are made on a fixed-rate or an adjustable-rate basis and carry interest rates generally from 0.5% to 1.0% above the rates charged on comparable loans secured by owner-occupied properties. The maximum term on such loans is 30 years.
Construction Lending. A substantial portion of the Bank’s construction loans are originated for the construction of owner-occupied, single-family dwellings in the Bank’s primary market area. Residential construction loans are offered primarily to individuals building their primary or secondary residence, as well as to selected local developers to build single-family dwellings. Generally, loans to owner/occupants for the construction of owner-occupied, single-family residential properties are originated in connection with the permanent loan on the property and have a construction term of up to 12 months. Such loans are offered on a fixed-rate or adjustable-rate basis. Interest rates on residential construction loans made to the owner/occupant have interest rates during the construction period equal to the same rate on the permanent loan selected by the customer. Interest rates on residential construction loans to builders are set at the prime rate plus a margin of between 0% and 1.5%. Interest rates on commercial construction loans are based on the prime rate plus a negotiated margin of between 0% and 1.5% and adjust monthly, with construction terms generally not exceeding 18 months. Advances are made on a percentage of completion basis. At September 30, 2007, $42.3 million, or 9.8%, of the Bank’s gross loan portfolio consisted of commercial construction loans, acquisition and development loans, and construction loans on single family residences.
Prior to making a commitment to fund a loan, the Bank requires both an appraisal of the property by appraisers approved by the Board of Directors and a draw schedule of projected construction costs. The Bank also reviews and inspects each project at the commencement of construction and as needed prior to disbursements during the term of the construction loan.
Consolidation in the building industry and the increasing presence in the Bank’s market of large builders that are not locally based have limited the Bank’s ability to compete for some loans to builders because the Bank’s loans-to-one-borrower limitation limits its ability to meet the volume requirements of the large builders. The Bank’s construction loans totaled $42.3 million,
8
$39.0 million and $53.8 million at September 30, 2007, 2006 and 2005, respectively, and construction loan originations were $14.5 million, $14.7 million and $18.7 million during the years ended September 30, 2007, 2006 and 2005, respectively.
On occasion, the Bank makes acquisition and development loans to local developers to acquire and develop land for sale to builders who will construct single-family residences. Acquisition and development loans, which are considered by the Bank to be construction loans, are made at a rate that adjusts monthly, based on the prime rate plus a negotiated margin, for terms of up to three years. Interest only is paid during the term of the loan, and the principal balance of the loan is paid down as developed lots are sold to builders. Generally, in connection with acquisition and development loans, the Bank issues a letter of credit to secure the developer’s obligation to local governments to complete certain work. If the developer fails to complete the required work, the Bank would be required to fund the cost of completing the work up to the amount of the letter of credit. Letters of credit generate fee income for the Bank but create additional risk. At September 30, 2007, the Bank had 21 letters of credit outstanding totaling $1.0 million. All acquisition and development loans were performing in accordance with their terms at such date.
Construction financing generally is considered to involve a higher degree of risk of loss than long-term financing on improved, occupied real estate. Risk of loss on a construction loan is dependent largely upon the accuracy of the initial estimate of the property’s value at completion of construction or development and the estimated cost (including interest) of construction. During the construction phase, a number of factors could result in delays and cost overruns. If the estimate of construction costs proves to be inaccurate and the borrower is unable to meet the Bank’s requirements of putting up additional funds to cover extra costs or change orders, then the Bank will demand that the loan be paid off and, if necessary, institute foreclosure proceedings, or refinance the loan. If the estimate of value proves to be inaccurate, the Bank may be confronted, at or prior to the maturity of the loan, with collateral having a value which is insufficient to assure full repayment. The Bank has sought to minimize this risk by limiting construction lending to qualified borrowers (i.e., borrowers who satisfy all credit requirements and whose loans satisfy all other underwriting standards which would apply to the Bank’s permanent mortgage loan financing for the subject property) in the Bank’s market area. On loans to builders, the Bank works only with selected builders with whom it has experience and carefully monitors the creditworthiness of the builders.
Commercial Real Estate Lending.The Bank’s commercial real estate loan portfolio includes loans to finance the acquisition of small office buildings, churches, medical condominiums, shopping centers and commercial and industrial buildings. Such loans generally range in size from $100,000 to $5 million, with the largest having an outstanding principal balance of $5.4 million at September 30, 2007. At September 30, 2007, the Bank had $119.6 million of commercial real estate loans, which amounted to 27.8% of the Bank’s gross loan portfolio. Commercial real estate loans are originated on a fixed-rate or adjustable-rate basis with terms of up to 25 years.
Commercial real estate lending entails significant additional risks as compared with single-family residential property lending. Commercial real estate loans typically involve larger loan balances to single borrowers or groups of related borrowers. The payment experience on such loans typically is dependent on the successful operation of the real estate project, retail establishment or business. These risks can be significantly impacted by supply and demand conditions in the market for office and retail space and, as such, may be subject to a greater extent to adverse conditions in the economy generally. To minimize these risks, the Bank generally limits itself to its market area or to borrowers with which it has prior experience or who are otherwise known to the Bank. It is the Bank’s policy generally to obtain annual financial statements of the business of the borrower or the project for which commercial real estate loans are made. In addition, in the case of commercial real estate loans made to a legal entity, the Bank seeks, whenever possible, to obtain personal guarantees and annual financial statements of the principals of the legal entity.
Commercial Lines of Credit. The Bank provides commercial lines of credit to businesses within the Bank’s market area. These loans are secured by business assets, including real property, equipment, automobiles and consumer leases. Generally, all loans are further personally guaranteed by the owners of the business. The commercial lines have adjustable interest rates tied to the prime rate and are offered at rates from prime plus 0% to prime plus 3 1/2%. As of September 30, 2007, the Bank had $13.0 million of such loans outstanding.
9
Consumer Lending. The consumer loans currently in the Bank’s loan portfolio consist of automobile loans, home equity lines of credit and loans secured by savings deposits.
Automobile loans totaled $30.5 million, or 7.1%, of the Bank’s gross loan portfolio, at September 30, 2007. Automobile loans are secured by both new and used cars and, depending on the creditworthiness of the borrower, may be made for up to 110% of the “invoice price” or clean “black book” value, whichever is lower, or, with respect to used automobiles, the loan values as published by a wholesale value listing utilized by the automobile industry. Automobile loans are made directly to the borrower-owner. New and used cars are financed for a period generally of up to six years, or less, depending on the age of the car. Collision insurance is required for all automobile loans. The Bank also maintains a blanket collision insurance policy that provides insurance for any borrower who allows his insurance to lapse.
The Bank originates second mortgage loans and home equity lines of credit. As of September 30, 2007, home equity lines of credit totaled $17.0 million, or 3.9% of the Bank’s gross loan portfolio. Second mortgage loans are made at fixed rates and for terms of up to 15 years and totaled $21.2 million, or 4.9%, of the Bank’s gross loans at September 30, 2007.
The Bank’s home equity lines of credit currently have adjustable interest rates tied to the prime rate and can be offered anywhere from as low as the prime rate less 0.50% up to the prime rate plus 1.0%. The interest rate may not adjust to a rate higher than 18%. The home equity lines of credit require monthly payments until the loan is paid in full, with a loan term not to exceed 30 years. The minimum monthly payment is the outstanding interest. Home equity lines of credit are secured by subordinate liens against residential real property. The Bank requires that fire and extended coverage casualty insurance (and, if appropriate, flood insurance) be maintained in an amount at least sufficient to cover its loan.
The Bank makes savings account loans for up to 90% of the depositor’s savings account balance. The interest rate is normally 2.0% above the rate paid on the related savings account, and the account must be pledged as collateral to secure the loan. Interest generally is billed on a quarterly basis. At September 30, 2007, savings account loans accounts totaled $1.2 million, or .28%, of the Bank’s gross loan portfolio.
As part of the Bank’s loan strategy, the Bank has diversified its lending portfolio to afford the Bank the opportunity to earn higher yields and to provide a fuller range of banking services. These products have generally been in the consumer area and include, boat loans and loans for the purchase of recreational vehicles. Such loans totaled $1.5 million at September 30, 2007.
Consumer lending usually affords the Bank the opportunity to earn yields higher than those obtainable on single-family residential lending. However, consumer loans entail greater risk than do residential mortgage loans, particularly in the case of loans which are unsecured or secured by rapidly depreciable assets. Repossessed collateral for a defaulted consumer loan may not provide an adequate source of repayment of the outstanding loan balance as a result of the greater likelihood of damage, loss or depreciation. The remaining deficiency often does not warrant further substantial collection efforts against the borrower. In addition, consumer loan collections are dependent on the borrower’s continuing financial stability, and thus are more likely to be adversely affected by events such as job loss, divorce, illness or personal bankruptcy.
Loan Fees and Servicing. The Bank receives fees in connection with late payments and for miscellaneous services related to its loans. The Bank also charges fees in connection with loan originations typically from 0 to 2 points (one point being equal to 1% of the loan amount) on residential and commercial loan originations. The Bank services loans sold to FHLMC and FNMA. The Bank also services participation loans originated and sold by the Bank with servicing retained, and earns minimal income from this activity.
Nonperforming Loans and Other Problem Assets. It is management’s policy to continually monitor its loan portfolio to anticipate and address potential and actual delinquencies. When a borrower fails to make a payment on a loan, the Bank takes immediate steps to have the delinquency cured and the loan restored to current status. Loans which are past due 15 days incur a late fee of 5% of principal and interest due. As a matter of policy, the Bank will send a late notice to the borrower after the loan has been past due 15 days and again after 30 days. If payment is not promptly received, the borrower is contacted again, and efforts are made to formulate an affirmative plan to cure the delinquency. Generally, after any loan is delinquent 90 days or more, formal legal
10
proceedings are commenced to collect amounts owed. In the case of automobile loans, late notices are sent after loans are ten days delinquent, and the collateral is seized after a loan is delinquent 60 days. Repossessed cars subsequently are sold at auction.
Loans generally are placed on non-accrual status if the loan becomes past due more than 90 days, except in instances where in management’s judgment there is no doubt as to full collectibility of principal and interest, or management concludes that payment in full is not likely. Consumer loans are generally charged off, or any expected loss is reserved for, after they become more than 120 days past due. All other loans are charged off when management concludes that they are uncollectible. See Note 3 of Notes to Financial Statements.
Real estate acquired by the Bank as a result of foreclosure is classified as real estate acquired through foreclosure until such time as it is sold. When such property is acquired, it is initially recorded at the lower of cost or estimated fair value and subsequently at the lower of book value or fair value less estimated costs to sell. Costs relating to holding such real estate are charged against income in the current period, while costs relating to improving such real estate are capitalized until a saleable condition is reached. Any required write-down of the loan to its fair value less estimated selling costs upon foreclosure is charged against the allowance for loan losses. See Note 1 of Notes to Financial Statements.
11
The following table sets forth information with respect to the Bank’s nonperforming assets at the dates indicated.
| | | | | | | | | | | | | | | | | | | | |
| | | At September 30, | |
| | | 2007 | | | 2006 | | | 2005 | | | 2004 | | | 2003 | |
| | | (Dollars in thousands) | |
Loans accounted for on a non-accrual basis: (1) | | | | | | | | | | | | | | | | | | | | |
Real Estate: | | | | | | | | | | | | | | | | | | | | |
Single-family residential | | $ | — | | | $ | 69 | | | $ | 647 | | | $ | 266 | | | $ | 59 | |
Single-family rental property | | | — | | | | — | | | | — | | | | — | | | | — | |
Commercial | | | 2,266 | | | | 2,381 | | | | 91 | | | | 606 | | | | 166 | |
Construction | | | — | | | | — | | | | — | | | | — | | | | — | |
Commercial lines of credit | | | — | | | | — | | | | — | | | | — | | | | — | |
Commercial loans secured | | | — | | | | — | | | | — | | | | — | | | | — | |
Consumer | | | 24 | | | | 42 | | | | — | | | | — | | | | 75 | |
| | | | | | | | | | | | | | | | | | | | |
Total | | $ | 2,290 | | | $ | 2,492 | | | $ | 738 | | | $ | 872 | | | $ | 300 | |
Accruing loans which are contractually past due 90 days or more: | | | | | | | | | | | | | | | | | | | | |
Real Estate: | | | | | | | | | | | | | | | | | | | | |
Single-family residential | | $ | — | | | $ | — | | | $ | — | | | $ | — | | | $ | — | |
Single-family rental property | | | — | | | | — | | | | — | | | | — | | | | — | |
Commercial | | | — | | | | — | | | | — | | | | — | | | | — | |
Construction | | | — | | | | — | | | | — | | | | — | | | | — | |
Commercial lines of credit | | | — | | | | — | | | | — | | | | — | | | | — | |
Commercial loans secured | | | — | | | | — | | | | — | | | | — | | | | — | |
Consumer | | | — | | | | — | | | | — | | | | — | | | | — | |
| | | | | | | | | | | | | | | | | | | | |
Total | | $ | — | | | $ | — | | | $ | — | | | $ | — | | | $ | — | |
| | | | | | | | | | | | | | | | | | | | |
Total non-performing loans | | $ | 2,290 | | | $ | 2,492 | | | $ | 738 | | | $ | 872 | | | $ | 300 | |
| | | | | | | | | | | | | | | | | | | | |
Percentage of gross loans | | | .53 | % | | | .51 | % | | | .15 | % | | | .21 | % | | | .08 | % |
| | | | | | | | | | | | | | | | | | | | |
Percentage of total assets | | | .35 | % | | | .32 | % | | | .09 | % | | | .11 | % | | | .04 | % |
| | | | | | | | | | | | | | | | | | | | |
Other non-performing assets (2) | | $ | 108 | | | $ | 130 | | | $ | 86 | | | $ | 33 | | | $ | 283 | |
| | | | | | | | | | | | | | | | | | | | |
Loans modified in troubled debt restructuring | | $ | — | | | $ | — | | | $ | — | | | $ | — | | | $ | — | |
| | | | | | | | | | | | | | | | | | | | |
| (1) | Non-accrual status denotes loans on which, in the opinion of management, the collection of additional interest is unlikely. Payments received on a non-accrual loan are either applied to the outstanding principal balance or recorded as interest income, depending on management’s assessment of the collectibility of the loan. |
| (2) | Other nonperforming assets include the Bank’s inventory of repossessed cars and other real estate owned. |
During the year ended September 30, 2007, gross interest income of $192,000, would have been recorded on loans accounted for on a non-accrual basis if the loans had been current throughout the year. Interest on such loans included in income during the year ended September 30, 2007 amounted to $18,000.
At September 30, 2007, the Bank had no loans which were not classified as non-accrual, 90 days past due or restructured but where known information about possible credit problems of borrowers caused management to have serious concerns as to the ability of the borrowers to comply with present loan repayment terms and may result in disclosure as non-accrual, 90 days past due or restructured.
At September 30, 2007, non-accrual loans consisted of 1 commercial loan aggregating $2.3 million and 2 consumer loans aggregating $24,000.
Real estate acquired through foreclosure is initially recorded at the lower of cost or estimated fair value and subsequently at the lower of book value or fair value less estimated costs to sell. Fair value is defined as the amount in cash or cash-equivalent value of other consideration that a real estate parcel would yield in a current sale between a willing buyer and a willing seller, as measured by market transactions. If a market does not exist, fair value of the item is estimated based on selling prices of similar items in active markets or, if there are no active markets for similar items, by discounting a forecast of expected cash flows at a rate commensurate
12
with the risk involved. Fair value is generally determined through an appraisal at the time of foreclosure. The Bank records a valuation allowance for estimated selling costs of the property immediately after foreclosure. Subsequent to foreclosure, real estate acquired through foreclosure is periodically evaluated by management and an allowance for loss is established if the estimated fair value of the property, less estimated costs to sell, declines. At September 30, 2007, the Bank had real estate owned values at $94,000. The Bank had $14,000 of other nonperforming assets, which consisted of the Bank’s inventory of repossessed cars.
Federal regulations require savings institutions to classify their assets on the basis of quality on a regular basis. An asset meeting one of the classification definitions set forth below may be classified and still be a performing loan. An asset is classified as substandard if it is determined to be inadequately protected by the current retained earnings and paying capacity of the obligor or of the collateral pledged, if any. An asset is classified as doubtful if full collection is highly questionable or improbable. An asset is classified as loss if it is considered uncollectible, even if a partial recovery could be expected in the future. The regulations also provide for a special mention designation, described as assets which do not currently expose a savings institution to a sufficient degree of risk to warrant classification but do possess credit deficiencies or potential weaknesses deserving management’s close attention. Such assets designated as special mention may include nonperforming loans consistent with the above definition. Assets classified as substandard or doubtful require a savings institution to establish general allowances for loan losses. If an asset or portion thereof is classified loss, a savings institution must either establish a specific allowance for loss in the amount of the portion of the asset classified loss, or charge off such amount. Federal examiners may disagree with a savings institution’s classifications. If a savings institution does not agree with an examiner’s classification of an asset, it may appeal this determination to the OTS Regional Director. The Bank regularly reviews its assets to determine whether any assets require classification or re-classification. At September 30, 2007, the Bank had $7.6 million in classified assets consisting of $1.9 million in assets classified as special mention, $5.7 million in assets classified as substandard, no assets classified as doubtful and no assets classified as loss. Special mention assets consisted of $546,000 in single-family residential mortgage loans 60 to 89 days delinquent at September 30, 2007, $30,000 in consumer loans 60 to 120 days delinquent and commercial loans of $1.3 million that the Bank is monitoring for management and credit weaknesses at September 30, 2007. Substandard assets consisted of the $2.3 million in non-accrual loans described above and two single–family residential mortgage loans of $148,000 that are 60 to 89 days delinquent . Substandard assets also includes two commercial loans aggregating $3.2 million that the Bank is monitoring for management and credit weaknesses.
Allowance for Loan Losses.In originating loans, the Bank recognizes that credit losses will be experienced and that the risk of loss will vary with, among other things, the type of loan being made, the creditworthiness of the borrower over the term of the loan, general economic conditions and, in the case of a secured loan, the quality of the security for the loan. It is management’s policy to maintain an adequate allowance for loan losses based on, among other things, the Bank’s and the industry’s historical loan loss experience, evaluation of economic conditions, regular reviews of delinquencies and loan portfolio quality and evolving standards imposed by federal bank examiners. The Bank increases its allowance for loan losses by charging provisions for loan losses against the Bank’s income.
Management will continue to actively monitor the Bank’s asset quality and allowance for loan losses. Management will charge off loans and properties acquired in settlement of loans against the allowances for losses on such loans and such properties when appropriate and will provide specific loss allowances when necessary. Although management believes it uses the best information available to make determinations with respect to the allowances for losses and believes such allowances are adequate, future adjustments may be necessary if economic conditions differ substantially from the economic conditions in the assumptions used in making the initial determinations.
The Bank’s methodology for establishing the allowance for loan losses takes into consideration probable losses that have been identified in connection with specific assets as well as losses that have not been identified but are expected to have occurred. Management conducts regular reviews of the Bank’s assets and evaluates the need to establish allowances on the basis of this review. Allowances are established by management and reviewed by the Board of Directors on a monthly basis based on an assessment of risk in the Bank’s assets taking into consideration the composition and quality of the portfolio, delinquency trends, current charge-off and loss experience, loan concentrations, the state of the real estate market, regulatory reviews conducted in the regulatory
13
examination process and economic conditions generally. Additional provisions for losses on loans are made in order to bring the allowance to a level deemed adequate. Specific reserves will be provided for individual assets, or portions of assets, when ultimate collection is considered improbable by management based on the current payment status of the assets and the fair value of the security. At the date of foreclosure or other repossession, the Bank would transfer the property to real estate acquired in settlement of loans initially at the lower of cost or estimated fair value and subsequently at the lower of book value or fair value less estimated selling costs. Any portion of the outstanding loan balance in excess of fair value less estimated selling costs would be charged off against the allowance for loan losses. If, upon ultimate disposition of the property, net sales proceeds exceed the net carrying value of the property, a gain on sale of real estate would be recorded.
The following table sets forth an analysis of the Bank’s allowance for loan losses for the periods indicated.
| | | | | | | | | | | | | | | | | | | |
| | | At September 30, | |
| | | 2007 | | | 2006 | | | 2005 | | | 2004 | | | 2003 | |
| | | (Dollars in thousands) | |
Balance at the beginning of the period | | $ | 2,679 | | | $ | 2,746 | | | $ | 2,587 | | | $ | 2,698 | | | 2,199 | |
| | | | | | | | | | | | | | | | | | | |
Loans charged-off: | | | | | | | | | | | | | | | | | | | |
Real estate mortgage: | | | | | | | | | | | | | | | | | | | |
Single-family residential | | | | | | | — | | | | — | | | | — | | | — | |
Multi-family residential | | | | | | | — | | | | — | | | | — | | | — | |
Commercial | | | | | | | — | | | | — | | | | — | | | — | |
Construction | | | | | | | — | | | | — | | | | — | | | — | |
Commercial loans secured | | | | | | | — | | | | — | | | | — | | | — | |
Consumer | | | 364 | | | | 578 | | | | 677 | | | | 1,242 | | | 1,239 | |
| | | | | | | | | | | | | | | | | | | |
Total charge-offs | | | 364 | | | | 578 | | | | 677 | | | | 1,242 | | | 1,239 | |
| | | | | |
Recoveries: | | | | | | | | | | | | | | | | | | | |
Real estate mortgage: | | | | | | | | | | | | | | | | | | | |
Single-family residential | | | — | | | | — | | | | — | | | | — | | | — | |
Multi-family residential | | | — | | | | — | | | | — | | | | — | | | — | |
Commercial | | | — | | | | — | | | | — | | | | — | | | — | |
Construction | | | — | | | | — | | | | — | | | | — | | | — | |
Commercial loans secured | | | — | | | | — | | | | — | | | | — | | | — | |
Consumer | | | 218 | | | | 317 | | | | 383 | | | | 423 | | | 379 | |
| | | | | | | | | | | | | | | | | | | |
Total recoveries | | | 218 | | | | 317 | | | | 383 | | | | 423 | | | 379 | |
Net loans charged off | | | (146 | ) | | | (261 | ) | | | (294 | ) | | | (819 | ) | | (860 | ) |
Provision for loan losses | | | 117 | | | | 194 | | | | 453 | | | | 708 | | | 1,359 | |
Allowance assumed in the acquisition | | | — | | | | — | | | | — | | | | — | | | — | |
| | | | | | | | | | | | | | | | | | | |
Balance at the end of period | | $ | 2,650 | | | $ | 2,679 | | | $ | 2,746 | | | $ | 2,587 | | | 2,698 | |
| | | | | | | | | | | | | | | | | | | |
Ratio of net charge-offs to average loans outstanding during the period | | | .03 | % | | | .06 | % | | | .07 | % | | | .22 | % | | .22 | % |
| | | | | | | | | | | | | | | | | | | |
14
The following table allocates the allowance for loan losses by loan category at the dates indicated. The allocation of the allowance to each category is not necessarily indicative of future losses and does not restrict the use of the allowance to absorb losses in any category.
| | | | | | | | | | | | | | | | | | | | | | | | | | | | | | |
| | | At September 30, | |
| | | 2007 | | | 2006 | | | 2005 | | | 2004 | | | 2003 | |
| | | Amount | | Percent
of Loans
in
Category
to Total
Loans | | | Amount | | Percent
of Loans
in
Category
to Total
Loans | | | Amount | | Percent
of Loans
in
Category
to Total
Loans | | | Amount | | Percent
of Loans
in
Category
to Total
Loans | | | Amount | | Percent
of Loans
in
Category
to Total
Loans | |
| | | (Dollars in Thousands) | |
Real estate loans: | | | | | | | | | | | | | | | | | | | | | | | | | | | | | | |
Single-family residential | | $ | 633 | | 38.19 | % | | $ | 697 | | 44.50 | % | | $ | 548 | | 40.44 | % | | $ | 578 | | 43.47 | % | | $ | 539 | | 46.32 | % |
Single-family rental property | | | 80 | | 8.42 | | | | 64 | | 6.04 | | | | 40 | | 5.58 | | | | 29 | �� | 4.68 | | | | 22 | | 3.70 | |
Commercial | | | 976 | | 27.77 | | | | 591 | | 21.87 | | | | 707 | | 15.55 | | | | 455 | | 15.69 | | | | 396 | | 13.85 | |
Construction | | | 127 | | 9.82 | | | | 94 | | 8.09 | | | | 14 | | 11.14 | | | | 16 | | 5.64 | | | | 107 | | 4.23 | |
Commercial lines of credit | | | 39 | | 3.01 | | | | 42 | | 2.91 | | | | 22 | | 3.41 | | | | 10 | | 3.89 | | | | 16 | | 1.65 | |
Commercial leases | | | 27 | | 1.06 | | | | 28 | | .98 | | | | 2 | | .68 | | | | — | | .32 | | | | — | | — | |
Commercial loans secured | | | — | | — | | | | 1 | | .08 | | | | 72 | | .39 | | | | 52 | | .20 | | | | — | | .21 | |
Commercial loans unsecured | | | 335 | | .08 | | | | 409 | | .08 | | | | 537 | | .11 | | | | 541 | | .13 | | | | 569 | | .03 | |
Consumer | | | 433 | | 11.65 | | | | 753 | | 15.45 | | | | 804 | | 22.70 | | | | 906 | | 25.98 | | | | 1,049 | | 29.83 | |
| | | | | | | | | | | | | | | | | | | | | | | | | | | | | | |
Total allowance for loan losses | | $ | 2,650 | | 100.00 | % | | $ | 2,679 | | 100.00 | % | | $ | 2,746 | | 100.00 | % | | $ | 2,587 | | 100.00 | % | | $ | 2,698 | | 100.00 | % |
| | | | | | | | | | | | | | | | | | | | | | | | | | | | | | |
Investment Activities
General.The Bank is permitted under federal law to make certain investments, including investments in securities issued by various federal agencies and state and municipal governments, deposits at the FHLB of Atlanta, certificates of deposit in federally insured institutions, certain bankers’ acceptances and federal funds. It may also invest, subject to certain limitations, in commercial paper rated in one of the two highest investment rating categories of a nationally recognized credit rating agency, and certain other types of corporate debt securities and mutual funds. Federal regulations require the Bank to maintain an investment in FHLB stock and a minimum amount of liquid assets which may be invested in cash and specified securities. From time to time, the OTS adjusts the percentage of liquid assets which savings banks are required to maintain. See “ – Regulation – Depository Institution Regulation – Liquidity Requirements.”
The Bank makes investments in order to maintain the levels of liquid assets required by regulatory authorities and manage cash flow, diversify its assets, obtain yield and to satisfy certain requirements for favorable tax treatment. The investment activities of the Bank consist primarily of investments in mortgage-backed securities and other investment securities, consisting primarily of securities issued or guaranteed by the U.S. government or agencies thereof. Typical investments include federally sponsored agency mortgage pass-through and federally sponsored agency and mortgage-related securities. Investment and aggregate investment limitations and credit quality parameters of each class of investment are prescribed in the Bank’s investment policy. The Bank performs analyses on mortgage-related securities prior to purchase and on an ongoing basis to determine the impact on earnings and market value under various interest rate and prepayment conditions. Under the Bank’s current investment policy, securities purchases are made by the Bank’s President. The Bank’s President, Chief Financial Officer and Treasurer have authority to sell investment securities subject to the Bank’s designation as available for sale and purchase comparable investment securities with similar characteristics. The Board of Directors reviews securities transactions on a monthly basis.
Securities designated as “held to maturity” are those assets which the Bank has the ability and intent to hold to maturity. Upon acquisition, securities are classified as to the Bank’s intent, and a sale would only be affected due to deteriorating investment quality. The held to maturity investment portfolio is not used for speculative purposes and is carried at amortized cost. In the event the Bank sells securities from this portfolio for other than credit quality reasons, all securities within the investment portfolio with matching characteristics may be reclassified as assets available for sale. Securities designated as “available for sale” are those assets which the Bank may not hold to maturity and thus are carried at market value with unrealized gains or losses, net of tax effect, recognized in retained earnings. At September 30, 2007 the Bank’s securities portfolio consists of available for sale securities only.
15
Mortgage-Backed and Related Securities. Mortgage-backed securities represent a participation interest in a pool of single-family or multi-family mortgages, the principal and interest payments on which are passed from the mortgage originators through intermediaries that pool and repackage the participation interest in the form of securities to investors such as the Bank. Such intermediaries may include quasi-governmental agencies such as FHLMC, FNMA and GNMA which guarantee the payment of principal and interest to investors. Mortgage-backed securities generally increase the quality of the Bank’s assets by virtue of the guarantees that back them, are more liquid than individual mortgage loans and may be used to collateralize borrowings or other obligations of the Bank.
Mortgage-related securities typically are issued with stated principal amounts and the securities are backed by pools of mortgages that have loans with interest rates that are within a range and have similar maturities. The underlying pool of mortgages can be composed of either fixed-rate or adjustable-rate mortgage loans. Mortgage-backed securities generally are referred to as mortgage participation certificates or pass-through certificates. As a result, the interest rate risk characteristics of the underlying pool of mortgages,i.e., fixed-rate or adjustable-rate, as well as prepayment risk, are passed on to the certificate holder. The life of a mortgage-backed pass-through security is equal to the life of the underlying mortgages.
The actual maturity of a mortgage-backed security varies, depending on when the mortgagors prepay or repay the underlying mortgages. Prepayments of the underlying mortgages may shorten the life of the investment, thereby adversely affecting its yield to maturity and the related market value of the mortgage-backed security. The yield is based upon the interest income and the amortization of the premium or accretion of the discount related to the mortgage-backed security. Premiums and discounts on mortgage-backed securities are amortized or accredited over the estimated term of the securities using a level yield method. The prepayment assumptions used to determine the amortization period for premiums and discounts can significantly affect the yield of the mortgage-backed security, and these assumptions are reviewed periodically to reflect the actual prepayment. The actual prepayments of the underlying mortgages depend on many factors, including the type of mortgage, the coupon rate, the age of the mortgages, the geographical location of the underlying real estate collateralizing the mortgages and general levels of market interest rates. The difference between the interest rates on the underlying mortgages and the prevailing mortgage interest rates is an important determinant in the rate of prepayments. During periods of falling mortgage interest rates, prepayments generally increase, and, conversely, during periods of rising mortgage interest rates, prepayments generally decrease. If the coupon rate of the underlying mortgage significantly exceeds the prevailing market interest rates offered for mortgage loans, refinancing generally increases and accelerates the prepayment of the underlying mortgages. Prepayment experience is more difficult to estimate for adjustable-rate mortgage-backed securities.
Mortgage-related securities, which include collateralized mortgage obligations (“CMOs”), are typically issued by a special purpose entity, which may be organized in a variety of legal forms, such as a trust, a corporation or a partnership. The entity aggregates pools of pass-through securities, which are used to collateralize the mortgage-related securities. Once combined, the cash flows can be divided into “tranches” or “classes” of individual securities, thereby creating more predictable average lives for each security than the underlying pass-through pools. Accordingly, under this security structure, all principal paydowns from the various mortgage pools are allocated to a mortgage-related securities’ class or classes structured to have priority until it has been paid off. These securities generally have fixed interest rates, and, as a result, changes in interest rates generally would affect the market value and possibly the prepayment rates of such securities.
Some mortgage-related securities instruments are like traditional debt instruments due to their stated principal amounts and traditionally defined interest rate terms. Purchasers of certain other mortgage-related securities instruments are entitled to the excess, if any, of the issuer’s cash flows. These mortgage-related securities instruments may include instruments designated as residual interest and are riskier in that they could result in the loss of a portion of the original investment. Cash flows from residual interests are very sensitive to prepayments and, thus, contain a high degree of interest rate risk. The Bank does not purchase residual interests in mortgage-related securities.
16
The Bank’s mortgage-backed securities portfolio consists primarily of seasoned fixed-rate and adjustable rate mortgage-backed securities. The Bank makes such investments in order to manage cash flow, diversify assets, obtain yield, to satisfy certain requirements for favorable tax treatment and to satisfy the qualified thrift lender test. See “Regulation – Depository Institution Regulation – Qualified Thrift Lender Test.”
At September 30, 2007, there were no mortgage-backed securities classified as held to maturity.
At September 30, 2007, mortgage-backed securities and CMO’s (collateralized mortgage obligations) with an amortized cost of $106.1 million were classified as available for sale. At September 30, 2007, the Bank’s available for sale mortgage-backed securities and CMO’s had a weighted average yield of 5.50%.
The following table sets forth the carrying value of the Bank’s investments at the dates indicated.
| | | | | | | | | |
| | | At September 30, |
| | | 2007 | | 2006 | | 2005 |
| | | (Dollars in Thousands) |
Securities available for sale: | | | | | | | | | |
U.S. government and agency securities | | $ | 3,970 | | $ | 110,054 | | $ | 116,443 |
Mortgage-backed securities | | | 77,704 | | | 86,801 | | | 112,120 |
Collaterized mortgage obligations | | | 27,295 | | | — | | | — |
| | | | | | | | | |
Equity investments in mutual funds | | | — | | | 33,014 | | | 34,943 |
| | | | | | | | | |
Total Available for Sale | | $ | 108,969 | | $ | 229,869 | | $ | 263,506 |
| | | | | | | | | |
Securities held to maturity: | | | | | | | | | |
U.S. government and agency securities | | $ | — | | $ | 4,496 | | $ | 1,995 |
Mortgage-backed securities | | | — | | | 28,675 | | | 26,470 |
FHLB stock | | | — | | | 6,972 | | | 8,060 |
| | | | | | | | | |
Total Held to Maturity | | $ | — | | $ | 40,143 | | $ | 36,525 |
| | | |
Total | | $ | 108,969 | | $ | 270,012 | | $ | 300,031 |
| | | | | | | | | |
17
The following table sets forth information in the scheduled maturities, amortized cost, market value and average yields for the Bank’s investment portfolio at September 30, 2007.
| | | | | | | | | | | | | | | | | | | | | | | | | | | | | | | | | |
| | | One Year or Less | | | One to Five Years | | | Five to Ten Years | | | More than Ten Years | | | Total Investment Portfolio | |
| | | Carrying
Value | | Average
Yield | | | Carrying
Value | | Average
Yield | | | Carrying
Value | | Average
Yield | | | Carrying
Value | | Average
Yield | | | Carrying
Value | | Market
Value | | Average
Yield | |
| | | (Dollars in thousands) | |
Securities available for sale: | | | | | | | | | | | | | | | | | | | | | | | | | | | | | | | | | |
U.S. government and agency obligations | | $ | — | | — | % | | $ | 2,000 | | 4.69 | % | | $ | 1,000 | | 5.25 | % | | $ | 1,000 | | 5.55 | % | | $ | 4,000 | | $ | 3,970 | | 5.04 | % |
Mortgage-backed securities | | | — | | — | | | | 258 | | 6.21 | | | | 159 | | 8.09 | | | | 78,072 | | 5.47 | | | | 78,489 | | | 77,704 | | 5.48 | |
Collateralized Mortgage Obligations | | | — | | — | | | | — | | — | | | | — | | | | | | 27,591 | | 5.57 | | | | 27,591 | | | 27,295 | | 5.57 | |
Equity Investment in mutual funds | | | — | | — | | | | — | | — | | | | — | | | | | | — | | — | | | | — | | | — | | — | |
| | | | | | | | | | | | | | | | | | | | | | | | | | | | | | | | | |
Total available for sale | | $ | — | | | | | $ | 2,258 | | | | | $ | 1,159 | | | | | $ | 106,663 | | | | | $ | 110,080 | | $ | 108,969 | | | |
| | | | | |
| | | One Year or Less | | | One to Five Years | | | Five to Ten Years | | | More than Ten Years | | | Total Investment Portfolio | |
| | | Carrying
Value | | Average
Yield | | | Carrying
Value | | Average
Yield | | | Carrying
Value | | Average
Yield | | | Carrying
Value | | Average
Yield | | | Carrying
Value | | Market
Value | | Average
Yield | |
Securities held to maturity: | | | | | | | | | | | | | | | | | | | | | | | | | | | | | | | | | |
U.S. government and agency obligations | | $ | — | | — | % | | $ | — | | — | % | | $ | — | | — | % | | $ | — | | — | % | | $ | — | | $ | — | | — | % |
Mortgage-backed securities | | | — | | — | | | | — | | — | | | | — | | — | | | | — | | — | | | | — | | | — | | — | |
FHLB stock | | | — | | — | | | | — | | — | | | | — | | — | | | | 2,270 | | 5.72 | | | | 2,270 | | | 2,270 | | 5.72 | |
| | | | | | | | | | | | | | | | | | | | | | | | | | | | | | | | | |
Total held to maturity | | $ | — | | | | | $ | — | | | | | $ | — | | | | | $ | 2,270 | | | | | $ | 2,270 | | $ | 2,270 | | | |
| | | | | | | | | | | |
Total | | $ | — | | | | | $ | 2,258 | | | | | $ | 1,159 | | | | | $ | 108,933 | | | | | $ | 112,350 | | $ | 111,239 | | | |
| | | | | | | | | | | | | | | | | | | | | | | | | | | | | | | | | |
18
Deposit Activity and Other Sources of Funds
General. Deposits are the primary source of the Bank’s funds for lending, investment activities and general operational purposes. In addition to deposits, the Bank derives funds from loan principal and interest repayments, maturities of investment securities and mortgage-backed securities and interest payments thereon. Although loan repayments are a relatively stable source of funds, deposit inflows and outflows are significantly influenced by general interest rates and money market conditions. Borrowings may be used on a short-term basis to compensate for reductions in the availability of funds, or on a longer term basis for general operational purposes. The Bank has access to borrow from the FHLB of Atlanta.
Deposits. The Bank attracts deposits principally from within its market area by offering a variety of deposit instruments, including checking accounts, money market accounts, statement and passbook savings accounts, Individual Retirement Accounts, and certificates of deposit which range in maturity from seven days to five years. Deposit terms vary according to the minimum balance required, the length of time the funds must remain on deposit and the interest rate. Maturities, terms, service fees and withdrawal penalties for its deposit accounts are established by the Bank on a periodic basis. The Bank reviews its deposit mix and pricing on a weekly basis. In determining the characteristics of its deposit accounts, the Bank considers the rates offered by competing institutions, lending and liquidity requirements, growth goals and federal regulations. Management believes it prices its deposits comparably to rates offered by its competitors.
The Bank attempts to compete for deposits with other institutions in its market area by offering competitively priced deposit instruments that are tailored to the needs of its customers. Additionally, the Bank seeks to meet customers’ needs by providing convenient customer service to the community, efficient staff and convenient hours of service. Substantially all of the Bank’s depositors are Maryland residents. To provide additional convenience, the Bank participates in several networks at locations throughout the mid-Atlantic and the South and MoneyPass a surcharge free Automated Teller Machine network at locations throughout the United States, through which customers can gain access to their accounts at any time. The Bank currently has ATM machines in all of its eighteen offices. The Bank also has remote ATM’s at three area community college’s, Dundalk Community College, Catonsville Community College and Essex Community College. The Bank also has an Internet-based banking system to provide additional customer convenience.
19
Savings deposits in the Bank at September 30, 2007 were represented by the various types of savings programs described below.
| | | | | | | | | | | | | | |
Interest*
Rate | | | Minimum Term | | Category | | Minimum
Amount | | Balances
(in thousands) | | Percentage of
Total Savings | |
| | | | | Demand deposits: | | | | | | | | | |
| .14 | % | | None | | NOW and Super NOW accounts | | $ | 250 | | $ | 65,334 | | 11.70 | % |
| 3.12 | | | None | | Money Market | | | 250 | | | 18,339 | | 3.28 | |
| | | | | | | | | | | | | | |
| | | | | Total demand deposits | | | | | | 83,673 | | 14.98 | |
| | | | | Passbook savings deposits: | | | | | | | | | |
| .58 | | | None | | Regular Passbook | | | 25 | | | 61,644 | | 11.04 | |
| 1.18 | | | None | | Money market passbook | | | 10,000 | | | 19,988 | | 3.58 | |
| | | | | | | | | | | | | | |
| | | | | Total passbook savings deposits | | | | | $ | 81,632 | | 14.62 | % |
| | | | | |
| | | | | | Certificates of Deposit | | | | | | | |
| 2.69 | | | 3 months or less | | Fixed-term, fixed rate | | $ | 1,000 | | $ | 6,859 | | 1.23 | |
| 4.20 | | | 6 months | | Fixed-term, fixed rate | | | 1,000 | | | 18,117 | | 3.24 | |
| 4.90 | | | 12 months | | Fixed-term, fixed rate | | | 100 | | | 87,825 | | 15.73 | |
| 4.90 | | | 18 months | | Fixed-term, fixed rate | | | 100 | | | 24,236 | | 4.34 | |
| 4.80 | | | 24 months | | Fixed-term, fixed rate | | | 100 | | | 45,160 | | 8.09 | |
| 4.12 | | | 30 months | | Fixed-term, fixed rate | | | 100 | | | 1,964 | | .35 | |
| 4.61 | | | 36 months | | Fixed-term, fixed rate | | | 100 | | | 8,101 | | 1.45 | |
| 4.75 | | | 48 months | | Fixed-term, fixed rate | | | 100 | | | 14,217 | | 2.54 | |
| 4.39 | | | 60 months | | Fixed-term, fixed rate | | | 100 | | | 67,059 | | 12.01 | |
| 4.79 | | | $100,000 and over | | Fixed-term, fixed rate | | | N/A | | | 119,566 | | 21.41 | |
| | | | | | | | | | | | | | |
| | | | | Total Certificates of deposit | | | | | | 393,104 | | 70.39 | |
| | | | | Accrued interest payable | | | | | | 48 | | .01 | |
| | | | | | | | | | | | | | |
| | | | | Total deposits | | | | | $ | 558,457 | | 100.00 | % |
| | | | | | | | | | | | | | |
| * | Represents weighted average interest rate |
20
The following table sets forth the change in dollar amount of deposits in the various types of accounts offered by the Bank between the dates indicated.
| | | | | | | | | | | | | | | | | | | | | | | | | | |
| | | Balance at
September 30,
2007 | | % of
Deposit | | | Increase
(Decrease) | | | Balance at
September 30,
2006 | | % of
Deposits | | | Increase
(Decrease) | | | Balance at
September 30,
2004 | | % of
Deposits | |
| | | (Dollars in thousands) | |
NOW | | $ | 65,334 | | 11.70 | % | | $ | 6,703 | | | $ | 58,631 | | 9.69 | % | | $ | (4,866 | ) | | $ | 63,497 | | 10.62 | % |
Money market deposit | | | 18,339 | | 3.28 | | | | 689 | | | | 17,650 | | 2.92 | | | | 5,470 | | | | 12,180 | | 2.04 | |
Passbook savings deposits | | | 81,632 | | 14.62 | | | | (14,258 | ) | | | 95,890 | | 15.85 | | | | (20,803 | ) | | | 116,693 | | 19.53 | |
Certificate of deposit | | | 273,538 | | 48.98 | | | | (28,238 | ) | | | 301,776 | | 49.90 | | | | 26,442 | | | | 275,334 | | 46.07 | |
Certificate of deposit $100,000 and over | | | 119,566 | | 21.41 | | | | (11,076 | ) | | | 130,642 | | 21.60 | | | | 754 | | | | 129,888 | | 21.73 | |
Purchase accounting premiums, net | | | — | | — | | | | — | | | | — | | — | | | | (18 | ) | | | 18 | | — | |
Accrued interests payable | | | 48 | | .01 | | | | (208 | ) | | | 256 | | .04 | | | | 197 | | | | 59 | | .01 | |
| | | | | | | | | | | | | | | | | | | | | | | | | | |
Total | | $ | 558,457 | | 100 | % | | | (46,388 | ) | | $ | 604,845 | | 100.00 | % | | $ | 7,176 | | | $ | 597,669 | | 100.00 | % |
| | | | | | | | | | | | | | | | | | | | | | | | | | |
21
The following tables set forth the average balances and average interest rates based on month-end balances for various types of deposits as of the dates indicated.
| | | | | | | | | | | | | | | | | | |
| | | Year Ended September 30, | |
| | | 2007 | | | 2006 | | | 2005 | |
| | | Average
Balance | | Average
Rate | | | Average
Balance | | Average
Rate | | | Average
Balance | | Average
Rate | |
| | | (Dollars in thousands) | |
NOW | | $ | 35,988 | | .27 | % | | $ | 41,296 | | .24 | % | | $ | 38,509 | | .32 | % |
Money Market deposits | | | 18,432 | | 3.15 | | | | 15,930 | | 3.03 | | | | 13,938 | | .95 | |
Passbook savings deposits | | | 89,846 | | .78 | | | | 96,929 | | 1.05 | | | | 118,817 | | .93 | |
Non-interest bearing demand deposits | | | 24,441 | | — | | | | 21,786 | | — | | | | 23,213 | | — | |
Certificate of deposit | | | 415,370 | | 4.58 | | | | 432,011 | | 3.88 | | | | 395,372 | | 3.38 | |
| | | | | | | | | | | | | | | | | | |
Total | | $ | 584,077 | | 3.49 | % | | $ | 607,952 | | 3.02 | % | | $ | 589,849 | | 2.49 | % |
| | | | | | | | | | | | | | | | | | |
The following table sets forth the time deposits in the Bank classified by rates at the dates indicated.
| | | | | | | | | |
| | | At September 30, |
| | | 2007 | | 2006 | | 2005 |
| | | (Dollars in Thousands) |
0.26 – 2.00% | | $ | 4,933 | | $ | 226 | | $ | 19,290 |
2.01 – 4.00 | | | 49,247 | | | 84,540 | | | 237,946 |
4.01 – 6.00 | | | 338,924 | | | 347,596 | | | 138,052 |
6.01 – 7.25 | | | — | | | 56 | | | 9,934 |
| | | | | | | | | |
Total | | $ | 393,104 | | $ | 432,418 | | $ | 405,222 |
| | | | | | | | | |
The following table sets forth the amount and maturities of time deposits at September 30, 2007.
| | | | | | | | | | | | | | | |
Rate | | Less Than
One Year | | 1 – 2 Years | | 2 – 3 Years | | After 3 Years | | Total |
0.26 - 2.00% | | $ | 10 | | $ | 4,923 | | $ | — | | $ | — | | $ | 4,933 |
2.01 - 4.00 | | | 40,940 | | | 8,180 | | | 34 | | | 93 | | | 49,247 |
4.01 - 6.00 | | | 212,240 | | | 106,430 | | | 15,143 | | | 5,111 | | | 338,924 |
| | | | | | | | | | | | | | | |
Total | | $ | 253,190 | | $ | 119,533 | | $ | 15,177 | | $ | 5,204 | | $ | 393,104 |
| | | | | | | | | | | | | | | |
22
The following table indicates the amount of the Bank’s certificates of deposit of $100,000 or more by time remaining until maturity as of September 30, 2007. At such date, such deposits represented 21.4% of total deposits and had a weighted average rate of 4.79%.
| | | |
Maturity Period | | Certificates of Deposit |
| | | (In thousands) |
Three months or less | | $ | 22,044 |
Over three through six months | | | 27,343 |
Over six through 12 months | | | 25,299 |
Over 12 months | | | 44,880 |
| | | |
Total | | $ | 119,566 |
| | | |
The following table sets forth the savings activities of the Bank for the periods indicated.
| | | | | | | | | | | | |
| | | At September 30, | |
| | | 2007 | | | 2006 | | | 2005 | |
| | | (In Thousands) | |
Deposits | | $ | 1,112,039 | | | $ | 827,491 | | | $ | 771,529 | |
Withdrawals | | | 1,178,832 | | | | (838,694 | ) | | | (769,193 | ) |
| | | | | | | | | | | | |
Net increase before interest credit | | | (66,793 | ) | | | (11,203 | ) | | | 2,336 | |
Interest credited | | | 20,405 | | | | 18,379 | | | | 14,711 | |
| | | | | | | | | | | | |
Net (decrease) increase in savings deposits | | $ | (46,388 | ) | | $ | 7,176 | | | $ | 17,047 | |
| | | | | | | | | | | | |
In the unlikely event the Bank is liquidated, depositors will be entitled to full payment of their deposit accounts prior to any payment being made to the sole stockholder of the Bank.
Borrowings.Savings deposits historically have been the primary source of funds for the Bank’s lending, investments and general operating activities. The Bank is authorized, however, to use advances from the FHLB of Atlanta to supplement its supply of lendable funds and to meet deposit withdrawal requirements. The FHLB of Atlanta functions as a central reserve bank providing credit for savings institutions and certain other member financial institutions. As a member of the FHLB System, the Bank is required to own stock in the FHLB of Atlanta and is authorized to apply for advances. Advances are pursuant to several different programs, each of which has its own interest rate and range of maturities. The Bank has a Blanket Agreement for advances with the FHLB under which the Bank may borrow up to 80% of assets subject to normal collateral and underwriting requirements. Advances from the FHLB of Atlanta are secured by the Bank’s stock in the FHLB of Atlanta and other eligible assets. At September 30, 2007, the Bank had $20.0 million in outstanding FHLB advances.
On June 27, 2002, the Company established a Delaware business trust subsidiary (the “Business Trust”), which issued and sold to private investors 12,500 securities with a liquidation amount of $1,000 per security, for a total of $12.5 million of preferred securities. The Company funded the Business Trust with $387,000 in exchange for 100% of the Business Trust’s common securities. The Business Trust used the proceeds from these transactions to purchase $12,887,000 of floating rate junior subordinated debentures from the Company. The Company makes periodic interest payments on the debentures to the Business Trust, and the Business Trust in turn makes interest payments on the trust preferred securities to the private investors.
The trust preferred securities issued by the Business Trust and the junior subordinated debentures held by the Business Trust are due June 30, 2032. The rate is 3.65% per annum over the three-month LIBOR rate and resets quarterly. The rate at September 30, 2007 was 9.01%. The junior subordinated debentures are the sole assets of the Business Trust. The subordinated debt securities, unsecured, rank junior and are subordinate in right of payment of all senior debt of the Company, and the Company has guaranteed repayment on the trust preferred securities issued by the Business Trust. The Company used the proceeds from these transactions to increase the capital of the Bank. The $12.5 million proceeds from the subordinated debt securities are includable as part of Tier 1 regulatory capital for the Bank.
23
Payments to be made by the Business Trust on the trust preferred securities are dependent on payments that the Company has undertaken to make, particularly the payment to be made by the Company on the debentures. Distributions on the trust preferred securities are payable quarterly at a rate of 3.65% per annum over the three-month LIBOR rate. The distributions are funded by interest payments received on the debentures and are subject to deferral for up to five years under certain conditions. Distributions are included in interest expense. The Company may redeem the debentures, in whole or in part, at par at any time after the interest adjustment date following June 30, 2007, or under certain conditions in whole but not in part, at any time at a redemption price equal to 103% of the principal amount plus any accrued unpaid interest.
On September 29, 2003, the Company established a second Delaware statutory trust subsidiary (the “Statutory Trust”), which issued and sold to private investors 10,000 securities with a liquidation amount of $1,000 per security, for a total of $10.0 million of preferred securities. The Company funded the Statutory Trust with $310,000 in exchange for 100% of the Statutory Trust’s common securities. The Statutory Trust used the proceeds from these transactions to purchase $10,310,000 of floating rate junior subordinated debentures from the Company. The Company makes periodic interest payments on the debentures to the Statutory Trust, and the Statutory Trust in turn makes interest payments on the trust preferred securities to the private investors.
The trust preferred securities and junior subordinated debentures are due October 7, 2033. The rate is 3.00% per annum over the three-month LIBOR rate and resets quarterly. The rate at September 30, 2007 was 8.65%. The junior subordinated debentures are the sole assets of the Statutory Trust. The subordinated debt securities, unsecured, rank junior and are subordinate in right of payment of all senior debt of the Company, and the Company has guaranteed repayment on the trust preferred securities issued by the Statutory Trust. The Company used the proceeds from these transactions to increase the capital of the Bank. The $10.3 million proceeds from the subordinated debt securities are includable as part of Tier 1 regulatory capital for the Bank.
In 2007, the Company had a total annual expense of $2.1 million related to its trust preferred securities. Payments to be made by the Statutory Trust on the trust preferred securities are dependent on payments that the Company has undertaken to make, particularly the payment to be made by the Company on the debentures. Distributions on the trust preferred securities are payable quarterly at a rate of 3.00% per annum over the three-month LIBOR rate. The distributions are funded by interest payments received on the debentures and are subject to deferral for up to five years under certain conditions. Distributions are included in interest expense. The Company may redeem the debentures, in whole or in part, at par at any time after October 7, 2008, or under certain conditions in whole but not in part, at any time at a redemption price equal to 103% of the principal amount plus any accrued unpaid interest.
Subsidiary Activities
As a federally chartered savings bank, the Bank is permitted to invest an amount equal to 2% of its assets in subsidiaries, with an additional investment of 1% of assets where such investment serves primarily community, inner-city and community development purposes. Under such limitations, as of September 30, 2007, the Bank was authorized to invest up to approximately $19.3 million in the stock of or loans to subsidiaries, including the additional 1% investment for community inner-city and community development purposes. Institutions meeting their applicable minimum regulatory capital requirements may invest up to 50% of their regulatory capital in conforming first mortgage loans to subsidiaries in which they own 10% or more of the capital stock.
The Bank has one subsidiary service corporation, Ebenezer Road, Inc. (“Ebenezer Road”). Ebenezer Road is an insurance agency that sells primarily vendors’ single interest insurance on automobile loans, as well as annuity products. The fees from the activities of its subsidiaries were immaterial during the year ended September 30, 2007.
24
Competition
The Bank faces strong competition both in originating real estate and consumer loans and in attracting deposits. It competes for real estate and other loans principally on the basis of interest rates, the types of loans it originates, the deposit products it offers and the quality of service it provides to borrowers. The Bank also competes by offering products which are tailored to the local community. The Bank’s competition in originating real estate loans comes primarily from other savings institutions, commercial banks and mortgage bankers. Commercial banks, credit unions and finance companies provide vigorous competition in consumer lending. Competition may increase as a result of the continuing reduction of restrictions on the interstate operations of financial institutions.
The Bank attracts deposits through its offices primarily from the local community. Consequently, competition for deposits is principally from other savings institutions, commercial banks, credit unions and brokers in the local community. The Bank competes for deposits and loans by offering what it believes to be a variety of deposit accounts at competitive rates, convenient business hours, a commitment to outstanding customer service and a well-trained staff. Management believes that the Bank has developed strong relationships with local realtors and the community in general.
As of June 30, 2007, the most recent date for which data is available from the Federal Deposit Insurance Corporation, we held approximately 1.22% of all deposits in the Baltimore metropolitan area, which ranked us 17th out of 84 financial institutions in the Baltimore metropolitan area. In Baltimore County and Harford County we held 2.97% and 3.67%, respectively, of deposits held by all banks and savings institutions. The Baltimore metropolitan area has a high concentration of financial institutions and financial service providers, many of which are branches of large money center, super-regional and regional banks that have greater resources than then Bank’s and may offer products or services that the Bank does not provide.
Employees
As of September 30, 2007, the Company had 155 full-time and 27 part-time employees, none of whom were represented by a collective bargaining agreement. Management considers the Bank’s relationships with its employees to be good.
Depository Institution Regulation
General. The Bank is a federally chartered savings institution and a member of the FHLB of Atlanta and its deposits are insured by the FDIC (“FDIC”) through the Deposit Insurance Fund. As a federal savings institution, the Bank is subject to regulation and supervision by the Office of Thrift Supervision (“OTS”) and the FDIC and to OTS regulations governing such matters as capital standards, mergers, establishment of branch offices, subsidiary investments and activities and general investment authority. The OTS periodically examines the Bank for compliance with various regulatory requirements and for safe and sound operations. The FDIC also has the authority to conduct special examinations of the Bank because its deposits are insured by the Deposit Insurance Fund. The Bank must file reports with the OTS describing its activities and financial condition and must obtain the approval of the OTS prior to entering into certain transactions, such as mergers with or acquisitions of other depository institutions. Certain of the laws and regulations governing the Bank, Company and MHC are described below. However, the description does purport to be a complete discussion of the legal and regulatory requirements to which the Bank, Company and MHC are subject and is qualified in its entirety by reference to the actual laws and regulations.
Regulatory Capital Requirements. Under the OTS’s regulatory capital requirements, savings associations must maintain “tangible” capital equal to 1.5% of adjusted total assets, “core” capital equal to at least 4.0% (or 3.0%, if the institution is rated composite 1 CAMELS under the OTS examination rating system) of adjusted total assets and “total” capital (a combination of “core” and “supplementary” capital) equal to at least 8.0% of risk-weighted assets. In addition, the OTS has adopted regulations which impose certain restrictions on savings associations that have a total risk-based capital ratio that is less than 8.0%, a ratio of Tier 1 capital to risk-weighted assets of less than 4.0% or a ratio of Tier 1 capital to adjusted total assets of less than 4.0% (or 3.0%, if the institution is rated composite 1 CAMELS under the OTS examination rating system). For purposes of these regulations, Tier 1 capital has the same definitions as core capital. See“–Prompt Corrective Regulatory Action.”
25
Core capital is defined as common stockholders’ equity (including retained earnings), noncumulative perpetual preferred stock and related surplus, minority interests in the equity accounts of fully consolidated subsidiaries, certain nonwithdrawable accounts and pledged deposits. Core capital is generally reduced by the amount of the savings institution’s intangible assets. Limited exceptions to the deduction of intangible assets exist for certain mortgage servicing rights and credit card relationships and qualifying supervisory goodwill. Tangible capital is given the same definition as core capital but does not include an exception for qualifying supervisory goodwill and is reduced by the amount of all the savings association’s intangible assets with only a limited exception for certain mortgage servicing rights. Both core and tangible capital are further reduced by an amount equal to a savings institution’s debt and equity investments in subsidiaries engaged in activities not permissible to national banks (other than subsidiaries engaged in activities undertaken as agent for customers or in mortgage banking activities and subsidiary depository institutions or their holding companies). Investments in and extensions of credit to such subsidiaries are required to be fully netted against tangible and core capital. At September 30, 2007, the Bank had no such investments.
Adjusted total assets are a savings association’s total assets as determined under generally accepted accounting principles increased by certain goodwill amounts and by a prorated portion of the assets of unconsolidated includable subsidiaries in which the savings association holds a minority interest. Adjusted total assets are reduced by the amount of assets that have been deducted from capital, the portion of savings association’s investments in unconsolidated includable subsidiaries, and, for purpose of the core capital requirement, qualifying supervisory goodwill. At September 30, 2007, the Bank’s adjusted total assets for the purposes of the core and tangible capital requirements were approximately $633.3 million.
In determining compliance with the risk-based capital requirement, a savings association is allowed to include both core capital and supplementary capital in its total capital provided the amount of supplementary capital included does not exceed the savings association’s core capital. Supplementary capital is defined to include certain preferred stock issues, nonwithdrawable accounts and pledged deposits that do not qualify as core capital, certain approved subordinated debt, certain other capital instruments, a portion of the savings association’s allowances for loan and lease losses and up to 45% of unrealized net gains on equity securities. Total core and supplementary capital are reduced by the amount of capital instruments held by other depository institutions pursuant to reciprocal arrangements and equity investments other than those deducted from core and tangible capital. As of September 30, 2007, the Bank had no investments for which OTS regulations require a deduction from total capital.
The risk-based capital requirement is measured against risk-weighted assets which equal the sum of each asset and the credit-equivalent amount of each off-balance sheet item after being multiplied by an assigned risk weight. Under the OTS risk-weighting system, one-to-four family first mortgages not more than 90 days past due with loan-to-value ratios under 80% and average annual occupancy rates of at least 80% and certain qualifying loans for the construction of one-to-four-family residences pre-sold to home purchasers are assigned a risk weight of 50%. Consumer and residential construction loans are assigned a risk weight of 100%. Mortgage-backed securities issued, or fully guaranteed as to principal and interest by the FNMA or FHLMC are assigned a 20% risk weight. Cash and U.S. Government securities backed by the full faith and credit of the U.S. Government (such as mortgage-backed securities issued by GNMA) are given a 0% risk weight.
For information with respect to the Bank’s compliance with its regulatory capital requirements at September 30, 2007 see Note 14 of Notes to Consolidated Financial Statements.
The risk-based capital requirements of the OTS also require that savings institutions with more than a “normal” level of interest rate risk to maintain additional total capital. A savings institution’s interest rate risk is measured in terms of the sensitivity of its “net portfolio value” to changes in interest rates. The interest rate risk rule did not have a material effect on the Bank’s risk-based capital at September 30, 2007.
In addition to requiring generally applicable capital standards for savings institutions, the OTS is authorized to establish the minimum level of capital for a savings institution at such amount or at such ratio of capital-to-assets as the OTS determines to be necessary or appropriate for such institution in light of the particular circumstances of the institution. Such circumstances would include a high degree of exposure to interest rate risk, concentration of credit risk and certain risks arising from non-traditional activity. The OTS may treat the failure of any savings institution to maintain capital at or above such level as an unsafe or unsound practice and may issue a directive requiring any savings institution which fails to maintain capital at or above the minimum level required by the OTS to submit and adhere to a plan for increasing capital.
26
Qualified Thrift Lender Test. A savings institution that does not meet the Qualified Thrift Lender (“QTL”) test must either convert to a bank charter or comply with the following restrictions on its operations: (i) the institution may not engage in any new activity or make any new investment, directly or indirectly, unless such activity or investment is permissible for both a national bank and a savings institution; (ii) the branching powers of the institution shall be restricted to those of a national bank; (iii) the institution shall not be eligible to obtain any advances from its FHLB; and (iv) payment of dividends by the institution shall be subject to the rules regarding payment of dividends by a national bank. In addition, any company that controls a savings institution that fails to qualify as a QTL will be required to register as, and to be deemed, a bank holding company subject to all of the provisions of the Bank Holding Company Act of 1956 (the “BHCA”) and other statutes applicable to bank holding companies. Upon the expiration of three years from the date the institution ceases to be a QTL, it must cease any activity and not retain any investment not permissible for a national bank and a savings institution and immediately repay any outstanding FHLB advances (subject to safety and soundness considerations).
To meet the QTL test, an institution must either qualify as a “domestic building and loan association” under the Internal Revenue Code or its “Qualified Thrift Investments” must total at least 65% of “portfolio assets.” Under OTS regulations, portfolio assets are defined as total assets less intangibles, property used by a savings institution in its business and liquidity investments in an amount not exceeding 20% of assets. Qualified Thrift Investments consist of (i) loans, equity positions or securities related to domestic, residential real estate or manufactured housing, (ii) 50% of the dollar amount of residential mortgage loans subject to sale under certain conditions, (iii) education loans, small business loans and credit card loans, and (iv) stock in an FHLB. In addition, subject to a 20% of portfolio assets limit, savings institutions are able to treat as Qualified Thrift Investments consumer loans, 200% of their investments in loans to finance “starter homes” and loans for construction, development or improvement of housing and community service facilities or for financing small businesses in “credit-needy” areas. In order to maintain QTL status, the savings institution must maintain a weekly average percentage of Qualified Thrift Investments to portfolio assets equal to 65% on a monthly average basis in nine out of 12 months. A savings institution that fails to maintain QTL status will be permitted to requalify once, and if it fails the QTL test a second time, it will become immediately subject to all penalties as if all time limits on such penalties had expired.
At September 30, 2007, the percentage of the Bank’s portfolio assets invested in Qualified Thrift Investments was in excess of the percentage required to qualify the Bank under the QTL test.
Dividend Limitations. Under the OTS prompt corrective action regulations, the Bank would be prohibited from making any capital distributions if, after making the distribution, it would have: (i) a total risk-based capital ratio of less than 8.0%; (ii) a Tier 1 risk-based capital ratio of less than 4.0%; or (iii) a Tier 1 leverage ratio of less than 4.0%. See“—Prompt Corrective Regulatory Action.” Under OTS regulations, the Bank is not permitted to pay dividends on its capital stock if its regulatory capital would thereby be reduced below the amount then required for the liquidation account established for the benefit of certain depositors of the Bank at the time of its conversion to stock form.
Savings institutions must submit notice to the OTS prior to making a capital distribution if (a) they would not be well-capitalized after the distribution, (b) the distribution would result in the retirement of any of the institution’s common or preferred stock or debt counted as its regulatory capital, or (c) the institution is a subsidiary of a holding company. A savings institution must make application to the OTS to pay a capital distribution if (w) the institution would not be adequately capitalized following the distribution, (x) the institution’s total distributions for the calendar year exceeds the institution’s net income for the calendar year to date plus its net income (less distributions) for the preceding two years, (y) the savings association is not eligible for “expedited treatment” under OTS regulations (generally, examination and Community Reinvestment Act ratings in one of the two top categories), or (z) the distribution would otherwise violate applicable law or regulation or an agreement with or condition imposed by the OTS.
In addition to the foregoing, earnings of the Bank appropriated to bad debt reserves and deducted for federal income tax purposes are not available for payment of cash dividends or other distributions to the Company without payment of taxes at the then current tax rate by the Bank on the amount of earnings removed from the reserves for such distributions. See “Taxation.” The Company intends to make full use of this favorable tax treatment afforded to the Bank and the Company and does not contemplate use of any earnings of the Bank in a manner which would limit either institution’s bad debt deduction or create federal tax liabilities.
27
Insurance of Deposit Accounts.The Bank’s deposits are insured up to applicable limits by the Deposit Insurance Fund of the FDIC. The Deposit Insurance Fund is the successor to the Bank Insurance Fund and the Savings Association Insurance Fund, which were merged in 2006. The FDIC recently amended its risk-based assessment system for 2007 to implement authority granted by the Federal Deposit Insurance Reform Act of 2005 (“Reform Act”). Under the revised system, insured institutions are assigned to one of four risk categories based on supervisory evaluations, regulatory capital levels and certain other factors. An institution’s assessment rate depends upon the category to which it is assigned. Risk category I, which contains the least risky depository institutions, is expected to include more than 90% of all institutions. Unlike the other categories, Risk Category I contains further risk differentiation based on the FDIC’s analysis of financial ratios, examination component ratings and other information. Assessment rates are determined by the FDIC and currently range from five to seven basis points for the healthiest institutions (Risk Category I) to 43 basis points of assessable deposits for the riskiest (Risk Category IV). The FDIC may adjust rates uniformly from one quarter to the next, except that no single adjustment can exceed three basis points. No institution may pay a dividend if in default of the FDIC assessment.
The Reform Act also provided for a one-time credit for eligible institutions based on their assessment base as of December 31, 1996. Subject to certain limitations with respect to institutions that are exhibiting weaknesses, credits can be used to offset assessments until exhausted. The Bank’s one-time credit remaining is approximately $275,000. The Reform Act also provided for the possibility that the FDIC may pay dividends to insured institutions once the Deposit Insurance Fund reserve ratio equals or exceeds 1.35% of estimated insured deposits. The Bank’s assessment for the year ended September 30, 2007 was $137,000.
In addition to the assessment for deposit insurance, institutions are required to make payments on bonds issued in the late 1980s by the Financing Corporation to recapitalize a predecessor deposit insurance fund. This payment is established quarterly and during the year ending September 30, 2007 averaged 1.21 basis points of assessable deposits.
The Reform Act provided the FDIC with authority to adjust the Deposit Insurance Fund ratio to insured deposits within a range of 1.15% and 1.50%, in contrast to the prior statutorily fixed ratio of 1.25%. The ratio, which is viewed by the FDIC as the level that the fund should achieve, was established by the agency at 1.25% for 2007.
The FDIC has authority to increase insurance assessments. A significant increase in insurance premiums would likely have an adverse effect on the operating expenses and results of operations of the Bank. Management cannot predict what insurance assessment rates will be in the future.
Insurance of deposits may be terminated by the FDIC upon a finding that the institution has engaged in unsafe or unsound practices, is in an unsafe or unsound condition to continue operations or has violated any applicable law, regulation, rule, order or condition imposed by the FDIC or the Office of Thrift Supervision. The management of the Bank does not know of any practice, condition or violation that might lead to termination of deposit insurance.
Federal Home Loan Bank System.The Bank is a member of the FHLB System, which consists of 12 district Federal Home Loan Banks subject to supervision and regulation by the Federal Housing Finance Board (“FHFB”). The Federal Home Loan Banks provide a central credit facility primarily for member institutions. As a member of the FHLB of Atlanta, the Bank is required to acquire and hold shares of capital stock in the FHLB of Atlanta. The Bank was in compliance with this requirement with investment in FHLB of Atlanta stock at September 30, 2007 of $2.3 million. The FHLB of Atlanta serves as a reserve or central bank for its member institutions within its assigned district. At September 30, 2007, the Bank had $20.0 million in advances outstanding from the FHLB of Atlanta.
Federal Reserve System. Pursuant to regulations of the Federal Reserve Board, all FDIC-insured depository institutions were, in 2007, required to maintain average daily reserves equal to 3% on transaction accounts from $8.5 million up to $45.8 million, plus
28
10% on the amount over $45.8 million. These reserve requirements are subject to adjustment by the Federal Reserve Board. Because required reserves must be maintained in the form of vault cash or in a non-interest bearing account at a Federal Reserve Bank, the effect of the reserve requirement is to reduce the amount of the institution’s interest-earning assets. As of September 30, 2007, the Bank met its reserve requirements.
Prompt Corrective Regulatory Action.Under FDICIA, the federal banking regulators are required to take prompt corrective action if an insured depository institution fails to satisfy certain minimum capital requirements, including a leverage limit, a risk-based capital requirement, and any other measure deemed appropriate by the federal banking regulators for measuring the capital adequacy of an insured depository institution. All institutions, regardless of their capital levels, are restricted from making any capital distribution or paying any management fees if the institution would thereafter fail to satisfy the minimum levels for any of its capital requirements. An institution that fails to meet the minimum level for any relevant capital measure (an “undercapitalized institution”) may be: (i) subject to increased monitoring by the appropriate federal banking regulator; (ii) required to submit an acceptable capital restoration plan within 45 days; (iii) subject to asset growth limits; and (iv) required to obtain prior regulatory approval for acquisitions, branching and new lines of businesses. The capital restoration plan must include a guarantee by the institution’s holding company that the institution will comply with the plan until it has been adequately capitalized on average for four consecutive quarters, under which the holding company would be liable up to the lesser of 5% of the institution’s total assets or the amount necessary to bring the institution into capital compliance as of the date it failed to comply with its capital restoration plan. A “significantly undercapitalized” institution, as well as any undercapitalized institution that does not submit an acceptable capital restoration plan, may be subject to regulatory demands for recapitalization, broader application of restrictions on transactions with affiliates, limitations on interest rates paid on deposits, asset growth and other activities, possible replacement of directors and officers, and restrictions on capital distributions by any bank holding company controlling the institution. Any company controlling the institution may also be required to divest the institution or the institution could be required to divest subsidiaries. The senior executive officers of a significantly undercapitalized institution may not receive bonuses or increases in compensation without prior approval and the institution is prohibited from making payments of principal or interest on its subordinated debt. In their discretion, the federal banking regulators may also impose the foregoing sanctions on an undercapitalized institution if the regulators determine that such actions are necessary to carry out the purposes of the prompt corrective provisions. If an institution’s ratio of tangible capital to total assets falls below the “critical capital level” established by the appropriate federal banking regulator, the institution will be subject to conservatorship or receivership within specified time periods.
Under the implementing regulations, the federal banking regulators, including the OTS, generally measure an institution’s capital adequacy on the basis of its total risk-based capital ratio (the ratio of its total capital to risk-weighted assets), Tier 1 risk-based capital ratio (the ratio of its core capital to risk-weighted assets) and leverage ratio (the ratio of its core capital to adjusted total assets). The following table shows the capital ratios required for the various prompt corrective action categories. The OTS may reclassify a well capitalized savings institution as adequately capitalized and may require an adequately capitalized or undercapitalized institution to comply with the supervisory actions applicable to institutions in the next lower capital category (but may not reclassify a significantly undercapitalized institution as critically undercapitalized) if the OTS determines, after notice and an opportunity for a hearing, that the savings institution is in an unsafe or unsound condition or that the institution has received and not corrected a less-than-satisfactory rating for any CAMELS rating category.
| | | | | | | | |
| | | Well Capitalized | | Adequately Capitalized | | Undercapitalized | | Significantly
Undercapitalized |
Total risk-based capital ratio | | 10.0% or more | | 8.0% or more | | Less than 8.0% | | Less than 6.0% |
Tier I risk-based capital ratio | | 6.0% or more | | 4.0% or more | | Less than 4.0% | | Less than 3.0% |
Leverage ratio | | 5.0% or more | | 4.0% or more | | Less than 4.0% | | Less than 3.0% |
| * | 3.0% if institution has composite 1 CAMELS rating. |
29
A “critically undercapitalized” savings institution is defined as an institution that has a ratio of “tangible equity” to total assets of less than 2.0%. Tangible equity is defined as core capital plus cumulative perpetual preferred stock (and related surplus) less all intangibles other than qualifying supervisory goodwill and certain purchased mortgage servicing rights.
Safety and Soundness Standards. Interagency Guidelines Establishing Standards for Safety and Soundness require savings institutions to maintain internal controls and information systems and internal audit systems that are appropriate for the size, nature and scope of the institution’s business. The guidelines also establish certain basic standards for loan documentation, credit underwriting, interest rate risk exposure, and asset growth. The guidelines further provide that savings institutions should maintain safeguards to prevent the payment of compensation, fees and benefits that are excessive or that could lead to material financial loss, and should take into account factors such as comparable compensation practices at comparable institutions. If the OTS determines that a savings institution is not in compliance with the safety and soundness guidelines, it may require the institution to submit an acceptable plan to achieve compliance with the guidelines. A savings institution must submit an acceptable compliance plan to the OTS within 30 days of receipt of a request for such a plan. Failure to submit or implement a compliance plan may subject the institution to regulatory sanctions. Under the guidelines, a savings institution should maintain systems, commensurate with its size and the nature and scope of its operations, to identify problem assets and prevent deterioration in those assets as well as to evaluate and monitor earnings and ensure that earnings are sufficient to maintain adequate capital and reserves. Management believes that these regulatory standards do not materially affect the Bank’s operations.
Lending Limits. Savings institutions generally are subject to the lending limits applicable to national banks. With certain limited exceptions, the amount that a savings institution or a national bank may lend to any borrower outstanding at one time may not exceed 15% of the unimpaired capital and surplus of the institution. Loans and extensions of credit fully secured by readily marketable collateral may comprise an additional 10% of unimpaired capital and surplus. Savings institutions are additionally authorized to make loans to one borrower, for any purpose: (i) in an amount not to exceed $500,000, or (ii) by order of the Director of OTS, in an amount not to exceed the lesser of $30,000,000 or 30% of unimpaired capital and surplus to develop residential housing, provided: (a) the savings institution is and continues to be in compliance with its regulatory capital requirements; (b) the loans comply with applicable loan-to-value requirements; and (c) the aggregate amount of loans made under this authority does not exceed 150% of unimpaired capital and surplus.
At September 30, 2007, the Bank’s general lending limit was $7.6 million.
Uniform Lending Standards. Under OTS regulations, savings institutions must adopt and maintain written policies that establish appropriate limits and standards for extensions of credit that are secured by liens or interests in real estate or are made for the purpose of financing permanent improvements to real estate. These policies must establish loan portfolio diversification standards, prudent underwriting standards, including loan-to-value limits, that are clear and measurable, loan administration procedures and documentation, approval and reporting requirements. The real estate lending policies must reflect consideration of the Interagency Guidelines for Real Estate Lending Policies (the “Interagency Guidelines”) that have been adopted by the federal bank regulators.
Management believes that the Bank’s current lending policies conform to the Interagency Guidelines.
Transactions with Related Parties. Generally, transactions between a savings bank or its subsidiaries and its affiliates (i.e., companies that control the Bank or are under common control of the Bank) must be on terms as favorable to the Bank as transactions with non-affiliates. In addition, certain of these transactions are restricted to a percentage of the Bank’s capital and are subject to specified collateral requirements. Affiliates of the Bank include the Company, the MHC, BCSB Bankcorp Capital Trust I, BCSB Bankcorp Capital Trust II and any company which is under common control with the Bank.
The Bank’s authority to extend credit to executive officers, directors, trustees and 10% stockholders, as well as entities under such persons control, is currently governed by Sections 22(g) and 22(h) of the Federal Reserve Act and Regulation O promulgated by the Federal Reserve Board. Among other things, these regulations generally require such loans to be made on terms substantially similar to those offered to unaffiliated individuals, place limits on the amount of loans the Bank may make to such persons based, in part, on the Bank’s capital position, and require certain board of directors’ approval procedures to be followed.
30
Enforcement. The OTS has primary enforcement responsibility over savings institutions and has the authority to bring actions against the institution and all institution-affiliated parties, including stockholders, and any attorneys, appraisers and accountants who knowingly or recklessly participate in wrongful action likely to have an adverse effect on an insured institution. Formal enforcement action may range from the issuance of a capital directive or cease and desist order to removal of officers and/or directors in institution of receivership, conservatorship or termination of deposit insurance. Civil penalties cover a wide range of violations and can amount to $25,000 per day, or even $1 million per day in especially egregious cases. The FDIC has the authority to recommend to the Director of the OTS that enforcement action to be taken with respect to a particular savings institution. If action is not taken by the Director, the FDIC has authority to take such action under certain circumstances. Federal law also establishes criminal penalties for certain violations.
Holding Company Regulation
General.The Company and MHC are savings and loan holding companies within the meaning of federal law. As such, they are registered with the Office of Thrift Supervision and are subject to Office of Thrift Supervision regulations, examinations, supervision, reporting requirements and regulations concerning corporate governance and activities. In addition, the Office of Thrift Supervision has enforcement authority over the Company and the MHC and their non-savings institution subsidiaries. Among other things, this authority permits the Office of Thrift Supervision to restrict or prohibit activities that are determined to be a serious risk to the Bank.
Restrictions Applicable to Mutual Holding Companies.According to federal law and Office of Thrift Supervision regulations, a mutual holding company, such as the MHC, may generally engage, with appropriate regulatory approvals, in the following activities: (1) investing in the stock of a savings association; (2) acquiring a mutual association through the merger of such association into a savings association subsidiary of such holding company or an interim savings association subsidiary of such holding company; (3) merging with or acquiring another holding company, one of whose subsidiaries is a savings association; and (4) any activity approved by the Federal Reserve Board for a bank holding company or financial holding company or previously approved by the Office of Thrift Supervision for multiple savings and loan holding companies. Recent legislation, which authorized mutual holding companies to engage in activities permitted for financial holding companies, expanded the authorized activities. Financial holding companies may engage in a broad array of financial service activities including insurance and securities.
Federal law prohibits a savings and loan holding company, including a federal mutual holding company, from directly or indirectly, or through one or more subsidiaries, acquiring more than 5.0% of the voting stock of another savings institution, or its holding company, without prior written approval of the Office of Thrift Supervision. In evaluating applications by holding companies to acquire savings institutions, the Office of Thrift Supervision must consider the financial and managerial resources and future prospects of the company and institution involved, the effect of the acquisition on the risk to the insurance funds, the convenience and needs of the community and competitive factors. Federal law also prohibits a savings and loan holding company from acquiring more than 5.0% of a company engaged in activities other than those authorized for savings and loan holding companies by federal law; or acquiring or retaining control of a depository institution that is not insured by the FDIC.
The Office of Thrift Supervision is prohibited from approving any acquisition that would result in a multiple savings and loan holding company controlling savings institutions in more than one state, except: (1) the approval of interstate supervisory acquisitions by savings and loan holding companies; and (2) the acquisition of a savings institution in another state if the laws of the state of the target savings institution specifically permit such acquisitions. The states vary in the extent to which they permit interstate savings and loan holding company acquisitions. This limitation would not prohibit an interstate merger of the subsidiary savings institution.
If the savings institution subsidiary of a savings and loan holding company fails to meet the qualified thrift lender test, the holding company must register with the Federal Reserve Board as a bank holding company within one year of the savings institution’s failure to so qualify.
Stock Holding Company Subsidiary Regulation.The Office of Thrift Supervision has adopted regulations governing the two-tier mutual holding company form of organization and subsidiary stock holding companies that are controlled by mutual holding companies. The Company is the stock holding company subsidiary of the MHC. The Company is permitted to engage in activities that are permitted for the MHC subject to the same restrictions and conditions.
31
Waivers of Dividends by the MHC.Office of Thrift Supervision regulations require the MHC to notify the Office of Thrift Supervision if it proposes to waive receipt of dividends from the Company. The Office of Thrift Supervision reviews dividend waiver notices on a case-by-case basis, and, in general, does not object to a waiver if: (i) the waiver would not be detrimental to the safe and sound operation of the savings institution; and (ii) the mutual holding company’s board of directors determines that such waiver is consistent with such directors’ fiduciary duties to the mutual holding company’s members. We anticipate that the MHC will waive dividends that the Company may pay, if any.
Conversion of the MHC to Stock Form.Office of Thrift Supervision regulations permit the MHC to convert from the mutual form of organization to the capital stock form of organization. In a conversion transaction, each share of common stock held by stockholders other than the MHC would be automatically converted into a number of shares of common stock of the new holding company based on an exchange ratio determined at the time of conversion that ensures that stockholders other than the MHC own the same percentage of common stock in the new holding company as they owned in the Company immediately before conversion. The total number of shares held by stockholders other than the MHC after a conversion transaction would be increased by any purchases by such stockholders in the stock offering conducted as part of the conversion transaction.
Acquisition of Control.Under the federal Change in Bank Control Act, a notice must be submitted to the Office of Thrift Supervision if any person (including a company), or group acting in concert, seeks to acquire “control” of a savings and loan holding company or savings institution. An acquisition of “control” can occur upon the acquisition of 10% or more of the voting stock of a savings and loan holding company or savings institution or as otherwise defined by the Office of Thrift Supervision. Under the Change in Bank Control Act, the Office of Thrift Supervision has 60 days from the filing of a complete notice to act, taking into consideration certain factors, including the financial and managerial resources of the acquirer and the anti-trust effects of the acquisition. Any company that so acquires control would then be subject to regulation as a savings and loan holding company.
Sarbanes-Oxley Act of 2002.On July 30, 2002, the Sarbanes-Oxley Act of 2002 (“SOX”) was signed into law which mandated a variety of reforms intended to address corporate and accounting fraud. SOX contained provisions which amend the Securities Exchange Act of 1934, as amended (the “Act”) and provisions which directed the SEC to promulgate rules. The resultant law and regulations under the Act as of the time of this annual report is set forth in the following paragraphs. SOX provided for the establishment of the Public Company Accounting Oversight Board (“PCAOB”), which enforces auditing, quality control and independence standards for firms that audit Securities and Exchange Commission (“SEC”)-reporting companies and is funded by fees from all SEC-reporting companies. SOX imposes higher standards for auditor independence and restricts the provision of consulting services by auditing firms to companies they audit. Any non-audit services being provided to an audit client must be preapproved by the Company’s audit committee members. In addition, certain audit partners must be rotated periodically. SOX requires chief executive officers and chief financial officers, or their equivalent, to certify to the accuracy of periodic reports filed with the SEC, subject to civil and criminal penalties if they knowingly or willfully violate this certification requirement. In addition, under SOX, legal counsel is required to report evidence of a material violation of the securities laws or a breach of fiduciary duty by a company to its chief executive officer or its chief legal officer, and, if such officer does not appropriately respond, to report such evidence to the audit committee or other similar committee of the board of directors or the board itself.
Longer prison terms apply to corporate executives who violate federal securities laws, the period during which certain types of suits can be brought against a company or its officers was extended, and bonuses issued to top executives prior to restatement of a company’s financial statements are now subject to disgorgement if such restatement was due to corporate misconduct. Executives are also prohibited from trading during retirement plan “blackout” periods, and loans to company executives are restricted. Directors and executive officers must also report most changes in their ownership of a company’s securities within two business days of the change, and all ownership reports must be electronically filed.
32
SOX also increased the oversight and authority of audit committees of publicly traded companies. Audit committee members must be independent and are barred from accepting consulting, advisory or other compensatory fees from the issuer. Audit committees of publicly traded companies must have authority to retain their own counsel and other advisors funded by the company. Audit committees must establish procedures for the receipt, retention and treatment of complaints regarding accounting and auditing matters and procedures for confidential, anonymous submission of employee concerns regarding questionable accounting or auditing matters. It is the responsibility of the audit committee to hire, oversee and work on disagreements with the Company’s independent auditor.
It is unlawful for any person that is not a registered public accounting firm (“RPAF”) to audit an SEC-reporting company. Under the Act, a RPAF is prohibited from performing statutorily mandated audit services for a company if such company’s chief executive officer, chief financial officer, comptroller, chief accounting officer or any person serving in equivalent positions has been employed by such firm and participated in the audit of such company during the one-year period preceding the audit initiation date. SOX also prohibits any officer or director of a company or any other person acting under their direction from taking any action to fraudulently influence, coerce, manipulate or mislead any independent public or certified accountant engaged in the audit of the Company’s financial statements for the purpose of rendering the financial statement’s materially misleading. The SEC has prescribed rules requiring inclusion of an internal control report and assessment by management in the annual report to stockholders. Under current SEC rules, the Company will be required to provide the internal control report and management assessment beginning with the fiscal year ending September 30, 2008. SOX requires the RPAF that issues the audit report to attest to and report on management’s assessment of the Company’s internal control over financial reporting. In addition, SOX requires that each financial report required to be prepared in accordance with (or reconciled to) generally accepted accounting principles and filed with the SEC reflect all material correcting adjustments that are identified by a RPAF in accordance with generally accepted accounting principles and the rules and regulations of the SEC.
Although the Company anticipates it will incur additional expense in complying with the provisions of the Act and the related rules, management does not expect that such compliance will have a material impact on the Company’s financial condition or results of operations.
USA Patriot Act.The USA Patriot Act is intended to strengthen U.S. law enforcement’s and the intelligence communities’ abilities to work cohesively to combat terrorism on a variety of fronts. The potential impact of the USA Patriot Act on financial institutions of all kinds is significant and wide ranging. The USA Patriot Act contains sweeping anti-money laundering and financial transparency laws and imposes various regulations including standards for verifying client identification at account opening, and rules to promote cooperation among financial institutions, regulators and law enforcement entities in identifying parties that may be involved in terrorism or money laundering.
Taxation
General. The Company and the Bank, together with the Bank’s subsidiaries, file a consolidated federal income tax return based on a fiscal year ending September 30. Consolidated returns have the effect of deferring gain or loss on intercompany transactions and allowing companies included within the consolidated return to offset income against losses under certain circumstances.
Federal Income Taxation. Thrift institutions are subject to the provisions of the Internal Revenue Code of 1986, as amended (the “Code”) in the same general manner as other corporations. However, institutions such as the Bank which met certain definitional tests and other conditions prescribed by the Code benefited from certain favorable provisions regarding their deductions from taxable income for annual additions to their bad debt reserve. For purposes of the bad debt reserve deduction, loans were separated into “qualifying real property loans,” which generally are loans secured by interests in certain real property, and nonqualifying loans, which are all other loans. The bad debt reserve deduction with respect to nonqualifying loans was based on actual loss experience, however, the amount of the bad debt reserve deduction with respect to qualifying real property loans could be based upon actual loss experience (the “experience method”) or a percentage of taxable income determined without regard to such deduction (the “percentage of taxable income method”).
33
Earnings appropriated to an institution’s bad debt reserve and claimed as a tax deduction were not available for the payment of cash dividends or for distribution to stockholders (including distributions made on dissolution or liquidation), unless such amount was included in taxable income, along with the amount deemed necessary to pay the resulting federal income tax.
Beginning with the first taxable year beginning after December 31, 1995, savings institutions, such as the Bank, are treated the same as commercial banks. Associations with $500 million or more in assets will only be able to take a tax deduction when a loan is actually charged off. Associations with less than $500 million in assets will still be permitted to make deductible bad debt additions to reserves, but only using the experience method.
The Bank’s tax returns were last audited for the year ended September 30, 1994.
Under provisions of the Revenue Reconciliation Act of 1993 (“RRA”), enacted on August 10, 1993, the maximum federal corporate income tax rate was increased from 34% to 35% for taxable income over $10.0 million, with a 3% surtax imposed on taxable income over $15.0 million. Also under provisions of RRA, a separate depreciation calculation requirement has been eliminated in the determination of adjusted current earnings for purposes of determining alternative minimum taxable income, rules relating to payment of estimated corporate income taxes were revised, and certain acquired intangible assets such as goodwill and customer-based intangibles were allowed a 15-year amortization period. Beginning with tax years ending on or after January 1, 1993, RRA also provides that securities dealers must use mark-to-market accounting and generally reflect changes in value during the year or upon sale as taxable gains or losses. The IRS has indicated that financial institutions which originate and sell loans will be subject to the rule.
State Income Taxation. The state of Maryland imposes an income tax of approximately 7% on income measured substantially the same as federally taxable income. The state of Maryland currently assesses a personal property tax for December 2000 and forward.
For additional information regarding taxation, see Note 15 of Notes to Financial Statements.
Item 1A. Risk Factors
The Bank and the Company are subject to the restrictions and conditions of a Supervisory Agreement with, and other commitments the bank has made to, the Office of Thrift Supervision. Failure to comply with the Supervisory Agreement could result in additional enforcement action against it, including the imposition of monetary penalties, and could adversely affect the Bank’s ability to meet the obligations under the Company’s trust preferred securities.
The Bank and the Company entered into a Supervisory Agreement with the Office of Thrift Supervision on December 8, 2005, which requires the Bank and the Company to take certain actions, including complying with the Bank Secrecy Act and the Flood Disaster Protection Act and submitting a business plan to the Office of Thrift Supervision for review and approval. In addition, the Bank and the Company have made certain other commitments to the Office of Thrift Supervision, whereby we agreed, among other things, that the Bank will not pay any dividend to the Company or to Baltimore County Savings Bank, M.H.C. without the prior written approval of the Office of Thrift Supervision and that the Company will not incur any debt without the prior written approval of the Office of Thrift Supervision. While management believes that the Bank has complied with the terms of the Supervisory Agreement and its other commitments, if the Bank fails to comply with the terms and conditions of the Supervisory Agreement, the Office of Thrift Supervision could take additional enforcement action against it, including the imposition of monetary penalties or the issuance of a cease and desist order requiring further corrective action. The Bank and the Company have incurred significant additional regulatory compliance expense in connection with the Supervisory Agreement and our additional commitments, and although management does not expect it, it is possible regulatory compliance expenses related to the Supervisory Agreement and the Bank’s other commitments could have a material adverse impact on it in the future. In addition, the Office of Thrift Supervision must approve any deviation from its business plan, which could limit the Bank’s and Company’s ability to make any changes to our business, which could negatively impact the scope and flexibility of business activities. Moreover, if the Company is unable to complete its proposed stock offering, the Company’s commitment not to incur debt, and the Bank’s commitment not to pay a dividend to the Company, without prior Office of Thrift Supervision approval, could adversely affect our ability to meet our
34
obligations under our trust preferred securities. While management believes that the Bank and the Company have taken actions that will result in the Supervisory Agreement and its other commitments being terminated in the near future, such actions may not result in the Office of Thrift Supervision terminating the Supervisory Agreement.
The Bank has had losses and low earnings in recent years, and if it cannot generate and increase its income to competitive levels the Company’s stock price may be adversely affected.
The Bank’s net income has decreased in recent years. Net income was $1.3 million, $885,000 and $601,000 for the years ended September 30, 2003, 2004 and 2005, respectively. The Bank had net losses of $7.4 million and $2.9 million for the years ended September 30, 2006 and 2007, respectively, the return on average assets was (.41)%, (.92)%, .08%, ..12% and .21% for the years ended September 30, 2007, 2006, 2005, 2004 and 2003, respectively, and the return on average equity was (8.57)%, (19.86)%, 1.40%, 2.03% and 2.94% for the years ended September 30, 2007, 2006, 2005, 2004 and 2003, respectively. The Bank faces significant challenges that will hinder its ability to generate competitive returns. These challenges include the fact that it operates under a Supervisory Agreement with the Office of Thrift Supervision, the Bank has limited cash at the holding company level and has a low interest rate spread. The Bank’s interest rate spread, which is the difference between the average yield earned on its interest-earning assets and the average rate paid on its interest rate spread, declined from 2.81% for the year ended September 30, 2003 to 2.43% for the year ended September 30, 2004 to 2.16% for the year ended September 30, 2005 to 1.96% for the year ended September 30, 2006. Its interest rate spread increased to 2.04% for the year ended September 30, 2007 primarily due to the balance sheet restructuring we completed earlier in the year. While the bank has identified various strategic initiatives it will pursue in its efforts to overcome these challenges and improve earnings, its strategic initiatives my not succeed in generating and increasing income. If the bank is unable to generate or increase income, the Company’s stock price may be adversely affected.
The Bank’s increased emphasis on commercial real estate and commercial lending may expose it to increased lending risks.
In recent years, the Bank has significantly increased its emphasis on commercial real estate lending. Commercial real estate loans increased from $53.7 million, or 13.8% of its total loans, at September 30, 2003 to $119.6 million, or 27.8% of its total loans, at September 30, 2007. Moreover, as part of the Bank’s strategy to increase earnings, it will seek to continue to increase commercial real estate lending, as well as commercial lending, and intend to add commercial lending personnel to assist it in these efforts. These types of loans generally expose a lender to greater risk of non-payment and loss than single-family residential mortgage loans because repayment of the loans often depends on the successful operation of the property and the income stream of the borrowers and, for construction loans, the accuracy of the estimate of the property’s value at completion of construction and the estimated cost of construction. Such loans typically involve larger loan balances to single borrowers or groups of related borrowers compared to single-family residential mortgage loans. Commercial business loans expose the Bank to additional risks since they typically are made on the basis of the borrower’s ability to make repayments from the cash flow of the borrower’s business and are secured by non-real estate collateral that may depreciate over time. In addition, since such loans generally entail greater risk than single-family residential mortgage loans, the Bank may need to increase its allowance for loan losses in the future to account for the likely increase in probable incurred credit losses associated with the growth of such loans. Also, many of the Bank’s commercial and construction borrowers have more than one loan outstanding with the Bank. Consequently, an adverse development with respect to one loan or one credit relationship can expose the Bank to a significantly greater risk of loss compared to an adverse development with respect to a single-family residential mortgage loan.
Certain interest rate movements may decrease income and asset value.
Since June 30, 2004, the U.S. Federal Reserve has increased its target for the federal funds rate from 1.00% to 5.25%. While these short-term market interest rates, which the Bank uses as a guide to price its deposits, have increased, longer-term market interest rates, which the Bank uses as a guide to price its longer-term loans, have not increased to the same degree. As a result, the Bank was in an interest rate environment known as an “inverted yield curve,” where short-term market interest rates exceeded long-term market interest rates. This inversion of the market yield curve had a negative impact on the Bank’s interest rate spread and net interest margin. Short-term rates have since been declining over the final quarter of 2007, helping to establish a more normal yield curve.
35
Changes in interest rates also affect the value of the Bank’s interest-earning assets, and in particular its securities portfolio. Generally, the value of fixed-rate securities fluctuates inversely with changes in interest rates. Unrealized gains and losses on securities available for sale are reported as a separate component of equity, net of tax. Decreases in the fair value of securities available for sale resulting from increases in interest rates could have an adverse effect on stockholders’ equity.
The Bank does not expect to recover all of its losses from a recent check-kiting scheme, and its recovery efforts are expected to take a long period of time and may result in further expenses or litigation.
In late June 2006, the Bank became aware of a check-kiting scheme perpetrated by a single commercial deposit customer. It is believed that this scheme took place over an extended period of time prior to its discovery by the Bank in June 2006. As a result of this check-kiting scheme, the Bank incurred an after-tax loss of $6.9 million. During the quarter ended March 31, 2007, the Bank reached a settlement with its insurance provider, pursuant to which it received a recovery of $2.2 million pre-tax in settlement of a bond claim with our insurance carrier. The Bank is aggressively pursuing collection of the remaining check-kiting losses from the customer, but the customer has filed for bankruptcy and one of the two principals of the customer has committed suicide. It does not appear that the customer, the surviving principal or the estate of the deceased principal has material assets from which the Bank could make any recovery, particularly after payment of bankruptcy expenses by the bankruptcy estate of the customer. Moreover, there are other secured and unsecured creditors who are asserting additional and competing claims against the bankruptcy estate of the customer and certain principals of the customer. The recovery process is uncertain and is expected to require an extended period of time to resolve. The Bank will incur further expenses in pursuing its recovery efforts, and it is possible that the Bank may be involved in litigation with other creditors as it seeks to recover limited available assets. It is also possible that the Bank will incur expenses and liability for claims brought against it although to date no claims have been brought. The Bank reported an expense of $296,000 on a pre-tax basis in connection with pursuing and defending various claims in the bankruptcy estate of the former customer and with other litigants with competing claims seeking to recover limited available assets. Management felt it was prudent to recognize this expense in light of the complex and protracted nature of the ongoing proceeding. At this time, management does not believe, however, that the Bank will incur additional material expenses in connection with this matter. In addition, the negative publicity from the check-kiting scheme adversely affected the Bank’s ability in the short term to attract and retain deposits. The Bank has examined all deposit accounts with more than a minimal negative balance and believe it does not have a risk of additional material check-kiting losses at this time. The Bank also has developed and implemented additional procedures to detect check-kiting that it believes will further reduce the risk of future check-kiting losses.
The Company currently does not pay dividends and may not resume the payment of dividends.
The Company currently does not pay dividends and does not expect to resume the payment of dividends. On December 1, 2006, the Company suspended its dividend program and agreed with the Office of Thrift Supervision that it will not issue a dividend to stockholders going forward without Office of Thrift Supervision consent. The Company has also made an additional commitment to the Office of Thrift Supervision not to pay a dividend to stockholders without the prior written approval of the Office of Thrift Supervision. Besides the Office of Thrift Supervision limitations to which the Company is subject, its ability to pay dividends will depend on a number of factors, including capital requirements, our financial condition and results of operations, including the ability to generate sufficient earnings to warrant the payment of dividends, tax considerations, statutory and regulatory limitations and general economic conditions. In addition, the ability to pay dividends may depend, in part, on the Company’s receipt of dividends from the Bank because the Company initially will have no source of income other than earnings from the investments. The Company has made a commitment to the Office of Thrift Supervision that the Bank will not pay any dividend to it or to Baltimore County Savings Bank, M.H.C. without the prior written approval of the Office of Thrift Supervision. In addition to the specific commitment the Company made, Office of Thrift Supervision regulations limit distributions from the Bank to the Company.
A downturn in the local economy or a decline in real estate values could hurt our profits.
Nearly all of the Bank’s real estate loans are secured by real estate in Baltimore, Harford and Howard Counties and Baltimore City in Maryland. As a result, a downturn in the local economy, and, particularly, a downturn in the residential construction industry,
36
could cause significant increases in non-performing loans, which would adversely affect profits. Additionally, a decrease in asset quality could require additions to the Bank’s allowance for loan losses through increased provisions for loan losses, which would negatively affect profits. A decline in real estate values could cause some of the Bank’s mortgage loans to become inadequately collateralized, which would expose it to a greater risk of loss.
Strong competition within Baltimore County Savings Bank’s market area could adversely affect profits and slow growth.
The Bank faces intense competition both in making loans and attracting deposits. This competition has made it more difficult for the Bank to make new loans and at times has forced us to offer higher deposit rates. Price competition for loans and deposits might result in the Bank earning less on loans and paying more on deposits, which would reduce net interest income. Competition also makes it more difficult for the Bank to grow loans and deposits and to hire and retain experienced employees. Competition also makes it more difficult to hire and retain experienced employees. Some of the institutions with which it competes have substantially greater resources and lending limits than the bank has and may offer services that the Bank does not provide. The Bank expects competition to increase in the future as a result of legislative, regulatory and technological changes and the continuing trend of consolidation in the financial services industry. The Bank’s profitability depends upon its continued ability to compete successfully in its market area.
The Bank and Company operate in a highly regulated environment and may be adversely affected by changes in laws and regulations.
Both the Bank and the Company are subject to extensive regulation, supervision and examination by the Office of Thrift Supervision, their primary federal regulator, and by the Federal Deposit Insurance Corporation, as insurer of the Bank’s deposits. Such regulation and supervision govern the activities in which an institution and its holding company may engage and are intended primarily for the protection of the insurance fund and the depositors and borrowers of the Bank rather than holders of the Company’s common stock. Regulatory authorities have extensive discretion in their supervisory and enforcement activities, including the imposition of restrictions on operations, the classification of our assets and determination of the level of allowance for loan losses. Any change in such regulation and oversight, whether in the form of regulatory policy, regulations, legislation or supervisory action, may have a material impact on operations.
The MHC’s majority control of the Company’s common stock enables it to exercise voting control over most matters put to a vote of stockholders and will prevent stockholders from forcing a sale or a second-step conversion transaction which stockholders may find advantageous.
The MHC owns a majority of the Company’s common stock and, through its board of directors, is able to exercise voting control over most matters put to a vote of stockholders. The same directors and officers who manage the Company and the Bank also manage the MHC. As a federally chartered mutual holding company, the board of directors of the MHC must ensure that the interest of depositors of the Bank are represented and considered in matters put to a vote of stockholders of the Company. Therefore, the votes cast by the MHC may not be in stockholders’ personal best interests. For example, the MHC may exercise its voting control to defeat a stockholder nominee for election to the Company’s board of directors. In addition, stockholders will not be able to force a merger or second-step conversion transaction without the consent of the MHC. Some stockholders may desire a sale or merger transaction, since stockholders typically receive a premium for their shares, or a second-step conversion transaction, since fully converted institutions tend to trade at higher multiples than mutual holding companies.
Item 1B. Unresolved Staff Comments
Not applicable.
37
Item 2. Properties
The following table sets forth the location and certain additional information regarding the Bank’s offices at September 30, 2007.
| | | | | | | | | | | | | | |
| | | Year
Opened | | Owned or
Leased | | Expiration Date (If Leased) (1) | | Book Value at
September 30,
2007 | | Approximate
Square
Footage | | Deposits at
September 30,
2007 |
| | | | | | | | | | | | | (Deposits in
Thousands) |
Main Office: | | | | | | | | | | | | | | |
Perry Hall | | 1955 | | Leased (2) | | November 2018 | | $ | 162,634 | | 8,000 | | $ | 129,806 |
| | | | | | |
Branch Offices: | | | | | | | | | | | | | | |
Bel Air | | 1975 | | Leased | | May 2013 | | | | | 1,200 | | | 43,980 |
Dundalk (3) | | 1976 | | Leased | | June 2011 | | | | | 1,700 | | | 44,543 |
Timonium | | 1978 | | Leased | | July 2013 | | | | | 1,250 | | | 58,021 |
Catonsville | | 2003 | | Leased | | April 2011 | | | | | 3,550 | | | 46,423 |
Abingdon | | 1999 | | Leased (2) | | October 2008 | | | 403,836 | | 1,800 | | | 13,298 |
Forest Hill | | 1999 | | Leased (2) | | July 2019 | | | 346,450 | | 1,800 | | | 24,886 |
Essex | | 1999 | | Leased | | November 2012 | | | | | 3,200 | | | 17,343 |
Hickory | | 2000 | | Leased (2) | | January 2020 | | | 399,468 | | 1,800 | | | 12,403 |
White Marsh | | 2000 | | Leased (2) | | January 2015 | | | 483,604 | | 1,800 | | | 31,986 |
Carney | | 2001 | | Leased | | July 2011 | | | | | 2,100 | | | 24,307 |
Lutherville (4) | | 2002 | | Owned | | | | | 614,911 | | 7,440 | | | 23,502 |
Golden Ring (4) | | 2002 | | Leased | | May 2011 | | | | | | | | 27,729 |
Hamilton (4) | | 2002 | | Owned | | | | | 153,835 | | 1,500 | | | 9,177 |
Ellicott City (4) | | 2002 | | Leased | | August 2020 | | | | | | | | 25,140 |
Honeygo | | 2005 | | Leased (2) | | December 2025 | | | 686,621 | | 1,800 | | | 11,393 |
Sparks | | 2005 | | Leased (2) | | December 2025 | | | 644,317 | | 1,800 | | | 11,292 |
Owings Mills | | 2005 | | Leased (2) | | September 2026 | | | 786,375 | | 1,800 | | | 3,230 |
| | | | | | |
Administrative Office: | | | | | | | | | | | | | | |
4111 E. Joppa Road | | 1994 | | Owned | | | | | 1,144,161 | | 18,000 | | | |
4117 E. Joppa Road | | 2003 | | Owned | | | | | 175,660 | | 2,616 | | | |
| (1) | All leases have at least one five-year option, except for Catonsville, Dundalk, Ellicott City and Timonium locations. |
| (2) | Building is owned, but the land is leased. |
| (3) | The Bank also is leasing a kiosk and drive-in ATM facility at this location. |
| (4) | Branch acquired in WHG Bancshares acquisition. |
The book value of the Bank’s investment in premises and equipment totaled $10.5 million at September 30, 2007. See Note 5 of Notes to Financial Statements.
Item 3. Legal Proceedings.
From time to time, the MHC, the Company and/or the Bank is a party to various legal proceedings incident to its business. Except as set forth below, at September 30, 2007, there were no legal proceedings to which the MHC, the Company or the Bank was a party, or to which any of their property was subject, which were expected by management to result in a material loss to the MHC, the Company or the Bank. There are no pending regulatory proceedings to which the MHC, the Company, the Bank and their subsidiaries is a party or to which any of their properties is subject which are currently expected to result in a material loss, however the Bank is under a supervisory agreement with the OTS. For discussion of the supervisory agreement see the Company’s annual report to stockholders filed as Exhibit 13 hereto.
38
The Bank has submitted a proof of claim and filed related claims in the pending Chapter 11 bankruptcy case of a former commercial deposit customer, Colleen, Inc., in the amount of $10,673,299.56, arising out of a check-kiting scheme that was perpetrated against the Bank by the customer, and its principal owners, Alec C. Satisky and Brian I. Satisky. (In re Colleen, Inc., United States Bankruptcy Court for the District of Maryland, Baltimore Division, Case No.: 06-13748 NVA). The Bank has filed similar claims in the estate of Alec C. Satisky, pending before the Register of Wills of Baltimore County, Maryland (Estate No.: 140026), and in a civil action filed against Brian I. Satisky in the Circuit Court of Baltimore County, Maryland (Case No.: 03-C-06-6942). The civil action against Brian I. Satisky has been stayed by the filing of an involuntary Chapter 7 bankruptcy case against Brian I. Satisky (In re Brian I. Satisky, Case No.: 06-15796-MVA). We continue to aggressively pursue further collection of losses sustained as a result of the check-kiting scheme previously reported and have expensed an additional $296,000 on a pre-tax basis in connection with pursuing and defending various claims in the bankruptcy estate of the former customer and with other litigants with competing claims seeking to recover limited available assets. We feel it is prudent to recognize this expense at this time in light of complex and protracted nature of the ongoing proceeding. At this time, we do not believe, however, that we will incur additional material expenses in connection with this matter.
The Bank obtained judgments on September 17, 2003 in the amount of $705,785.88 against ATG Sales, LLC T/A Auto Gallery and Robert P and Karen R. King before the Circuit Court of Baltimore County, and filed a similar claim against Robert P. King in a pending bankruptcy case in the United States Bankruptcy Court for the District of Maryland (Baltimore) on September 3, 2004. The judgments seek to secure the Bank’s interest in connection with a delinquent commercial loan and over advance liability of the defendants. The Bank has foreclosed upon certain collateral and entered into a forbearance and repayment agreement with the Defendant.
Item 4. Submission of Matters to Vote of Security Holders.
Not applicable.
PART II
Item 5. Market for Registrant’s Common Equity, Related Stockholder Matters and Issuer Purchases of Equity Securities
The Company’s common stock began trading under the symbol “BCSB” on the Nasdaq National Market System on July 9, 1998. There are currently 5,929,743 shares of the common stock outstanding and approximately 1,111 holders of record of the common stock. Following are the high and low bid prices, by fiscal quarter, as reported on the Nasdaq National Market System during the periods indicated, as well as dividends declared on the common stock during each quarter.
| | | | | | | | | |
| | | High | | Low | | Dividends
Per Share |
Fiscal 2007 | | | | | | | | | |
First Quarter | | $ | 15.40 | | | 12.20 | | $ | — |
Second Quarter | | | 17.25 | | | 14.63 | | | — |
Third Quarter | | | 16.10 | | | 10.70 | | | — |
Fourth Quarter | | | 10.92 | | | 7.85 | | | — |
| | | |
Fiscal 2006 | | | | | | | | | |
First Quarter | | $ | 14.08 | | $ | 12.50 | | $ | .125 |
Second Quarter | | | 13.50 | | | 12.10 | | | .125 |
Third Quarter | | | 13.35 | | | 12.01 | | | .125 |
Fourth Quarter | | | 13.00 | | | 10.55 | | | .125 |
The stated high and low bid prices reflect inter-dealer prices, without retail mark-up, mark-down or commission, and may not represent actual transactions.
39
The Company did not repurchase any of its common stock during the quarter ended September 30, 2007.
Stock Performance Graph
The graph and table which follow show the cumulative total return on the Company’s common stock during the period from September 30, 2002 through September 30, 2007 with (1) the total cumulative return of all companies whose equity securities are traded on the Nasdaq Stock Market and (2) the total cumulative return of savings institutions and savings institution holding companies traded on the Nasdaq Stock Market. The comparison assumes $100 was invested on September 30, 2002 in the common stock and in each of the foregoing indices and assumes reinvestment of dividends. The stockholder returns shown on the performance graph are not necessarily indicative of the future performance of the common stock or of any particular index.
CUMULATIVE TOTAL STOCKHOLDER RETURN
COMPARED WITH PERFORMANCE OF SELECTED INDICES
September 30, 2002 through September 30, 2007
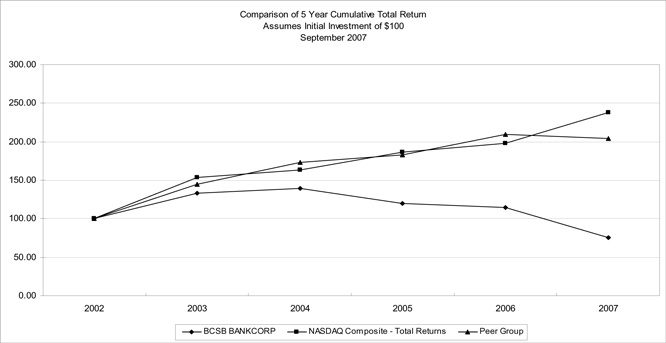
| | | | | | | | | | | | | | | | | | |
| | | 2002 | | 2003 | | 2004 | | 2005 | | 2006 | | 2007 |
| | | | | | |
COMPANY | | $ | 100.00 | | $ | 133.29 | | $ | 139.42 | | $ | 119.76 | | $ | 114.28 | | $ | 75.06 |
| | | | | | |
NASDAQ | | | 100.00 | | | 153.18 | | | 163.47 | | | 186.68 | | | 197.56 | | | 238.11 |
| | | | | | |
NASDAQ SAVINGS INSTITUTIONS | | | 100.00 | | | 144.81 | | | 173.37 | | | 182.72 | | | 209.49 | | | 203.71 |
40
Item 6. Selected Financial Data
Selected Consolidated Financial Condition Data
| | | | | | | | | | | | | | | |
| | | At September 30, |
| | | 2007 | | 2006 | | 2005 | | 2004 | | 2003 |
| | | (In Thousands) |
Total assets | | $ | 642,381 | | $ | 785,857 | | $ | 812,745 | | $ | 773,618 | | $ | 668,198 |
Loans receivable, net | | | 416,302 | | | 463,776 | | | 454,347 | | | 386,136 | | | 365,055 |
Investment securities: | | | | | | | | | | | | | | | |
Available for sale | | | 3,970 | | | 143,068 | | | 151,386 | | | 158,948 | | | 121,290 |
Held to maturity | | | — | | | 4,496 | | | 1,995 | | | 2,497 | | | 2,500 |
Mortgage-backed securities: | | | | | | | | | | | | | | | |
Available for sale | | | 104,999 | | | 86,801 | | | 112,120 | | | 144,260 | | | 116,204 |
Held to maturity | | | — | | | 28,675 | | | 26,470 | | | 26,631 | | | 18,394 |
FHLB stock | | | 2,270 | | | 6,972 | | | 8,060 | | | 6,105 | | | 3,305 |
Deposits | | | 558,457 | | | 604,845 | | | 597,669 | | | 580,622 | | | 551,929 |
FHLB advances | | | 20,000 | | | 118,473 | | | 144,796 | | | 120,920 | | | 32,268 |
Trust Preferred Securities | | | — | | | — | | | — | | | — | | | 22,500 |
Junior Subordinated Debentures | | | 23,197 | | | 23,197 | | | 23,197 | | | 23,197 | | | — |
Stockholders’ equity | | | 34,592 | | | 33,421 | | | 42,040 | | | 44,129 | | | 44,768 |
Selected Consolidated Operations Data
| | | | | | | | | | | | | | | | | |
| | | For the Years Ended September 30, |
| | | 2007 | | | 2006 | | | 2005 | | 2004 | | 2003 |
| | | (In Thousands) |
Interest income | | $ | 39,112 | | | $ | 39,995 | | | $ | 36,223 | | $ | 32,234 | | $ | 33,167 |
Interest expense | | | 25,517 | | | | 25,776 | | | | 20,384 | | | 16,362 | | | 16,107 |
| | | | | | | | | | | | | | | | | |
Net interest income | | | 13,595 | | | | 14,219 | | | | 15,839 | | | 15,872 | | | 17,060 |
Provision for loan losses | | | 117 | | | | 194 | | | | 453 | | | 708 | | | 1,359 |
| | | | | | | | | | | | | | | | | |
Net interest income after provision for loan losses | | | 13,478 | | | | 14,025 | | | | 15,386 | | | 15,164 | | | 15,701 |
Other income | | | (5,335 | ) | | | 1,501 | | | | 2,140 | | | 1,600 | | | 1,587 |
Non-interest expenses | | | 12,809 | | | | 26,968 | | | | 16,814 | | | 15,735 | | | 15,336 |
| | | | | | | | | | | | | | | | | |
(Loss) income before income taxes | | | (4,666 | ) | | | (11,442 | ) | | | 712 | | | 1,029 | | | 1,952 |
Income tax (benefit) provision | | | (1,745 | ) | | | (4,049 | ) | | | 111 | | | 144 | | | 655 |
| | | | | | | | | | | | | | | | | |
Net (loss) income | | $ | (2,921 | ) | | $ | (7,393 | ) | | $ | 601 | | $ | 885 | | $ | 1,297 |
| | | | | | | | | | | | | | | | | |
Net (loss) income per share of Common Stock: | | | | | | | | | | | | | | | | | |
Basic | | $ | (.50 | ) | | $ | (1.26 | ) | | $ | .10 | | $ | .15 | | $ | .23 |
| | | | | | | | | | | | | | | | | |
Diluted | | $ | (.50 | ) | | $ | (1.26 | ) | | $ | .10 | | $ | .15 | | $ | .22 |
| | | | | | | | | | | | | | | | | |
Cash dividend declared per share | | $ | .00 | | | $ | .50 | | | $ | .50 | | $ | .50 | | $ | .50 |
| | | | | | | | | | | | | | | | | |
41
Key Operating Ratios:
| | | | | | | | | | | | | | | |
| | | At or for the Year Ended September 30, | |
| | | 2007 | | | 2006 | | | 2005 | | | 2004 | | | 2003 | |
Performance Ratios: | | | | | | | | | | | | | | | |
Return on average assets (net (loss) income divided by average total assets) | | (.41 | )% | | (0.92 | )% | | .08 | % | | .12 | % | | .21 | % |
Return on average equity (net (loss) income divided by average equity) | | (8.57 | ) | | (19.86 | ) | | 1.40 | | | 2.03 | | | 2.94 | |
Interest rate spread (combined weighted average interest rate earned less combined weighted average interest rate cost) | | 2.04 | | | 1.96 | | | 2.16 | | | 2.43 | | | 2.81 | |
Net interest margin (net interest income divided by average interest-earning assets) | | 2.04 | | | 1.89 | | | 2.15 | | | 2.41 | | | 2.90 | |
Ratio of average interest-earning assets to average interest-bearing liabilities | | 99.83 | | | 98.30 | | | 99.68 | | | 99.48 | | | 103.38 | |
Ratio of non-interest expense to average total assets | | 1.80 | | | 3.35 | | | 2.12 | | | 2.20 | | | 2.46 | |
Dividend payout ratio (dividend declared per share divided by net income per share) | | n/m | | | n/m | | | 500.00 | | | 333.33 | | | 217.39 | |
| | | | | |
Asset Quality Ratios: | | | | | | | | | | | | | | | |
Nonperforming assets to total assets at end of period | | 0.37 | | | 0.32 | | | 0.09 | | | 0.11 | | | 0.09 | |
Nonperforming loans to gross loans at end of period | | 0.55 | | | 0.51 | | | 0.15 | | | 0.21 | | | 0.08 | |
Allowance for loan losses to gross loans at end of period | | 0.56 | | | 0.56 | | | 0.57 | | | 0.63 | | | 0.70 | |
Allowance for loan losses to nonperforming loans at end of period | | 100.96 | | | 109.30 | | | 372.09 | | | 296.67 | | | 899.33 | |
Provision for loan losses to gross loans | | 0.03 | | | 0.04 | | | 0.09 | | | 0.17 | | | 0.12 | |
Net charge-offs to average loans outstanding | | 0.03 | | | 0.06 | | | 0.07 | | | 0.22 | | | 0.22 | |
| | | | | |
Capital Ratios: | | | | | | | | | | | | | | | |
Equity to total assets at end of period | | 5.38 | | | 4.25 | | | 5.17 | | | 5.70 | | | 6.70 | |
Average equity to average assets | | 4.80 | | | 4.63 | | | 5.42 | | | 6.08 | | | 7.09 | |
Item 7. Management’s Discussion and Analysis of Financial Condition and Results of Operations
General
The Company was formed in June 1998 by the Bank to become the holding company for the Bank following the Bank’s reorganization into the mutual holding company form of organization (the “Reorganization”). As part of the Reorganization, the Company became a majority-owned subsidiary of the MHC. The Reorganization was consummated on July 8, 1998.
The Company’s net income is dependent primarily on its net interest income, which is the difference between interest income earned on its interest-earning assets and interest paid on interest-bearing liabilities. Net interest income is determined by (i) the difference between yields earned on interest-earning assets and rates paid on interest-bearing liabilities (“interest rate spread”) and (ii) the relative amounts of interest-earning assets and interest-bearing liabilities. The Company’s interest rate spread is affected by regulatory, economic and competitive factors that influence interest rates, loan demand and deposit flows. To a lesser extent, the Company’s net income also is affected by the level of other income, which primarily consists of fees and charges, and levels of non-interest expenses such as salaries and related expenses.
42
The operations of the Company are significantly affected by prevailing economic conditions, competition and the monetary, fiscal and regulatory policies of governmental agencies. Lending activities are influenced by the demand for and supply of housing, competition among lenders, the level of interest rates and the availability of funds. Deposit flows and costs of funds are influenced by prevailing market rates of interest, primarily on competing investments, account maturities and the levels of personal income and savings in the Company’s market area.
Strategic Overview
With the addition of a new President and Chief Executive Officer, the Company’s Board of Directors has identified certain strategies to improve earnings:
Transformation of the Balance Sheet – We have completed the process of transforming our balance sheet by emphasizing assets and liabilities that allow us to increase our net interest margin while reducing exposure to risk from interest rate fluctuations. During the second and third quarters of our fiscal year ended September 30, 2007, we sold approximately $169.1million of mortgage-backed securities and investment securities with an average yield of 3.51%. We used $73.0 million of the proceeds from these sales to prepay $104 million of Federal Home Loan Bank advances with an average cost of 4.97%. The remainder of the proceeds from the sale of mortgage-backed securities and investment securities initially has been invested in overnight deposits and used, to fund outflows of high cost certificates of deposit.
We also sold $31.9 million of mutual funds and sold $46.4 million fixed-rate, performing single-family mortgage loans with a weighted average yield of 5.11% and a weighted average remaining term to maturity of 119 months. Approximately 75% of the proceeds from these sales were used to purchase investment securities with an approximate yield of 5.4%. We continue to use the remaining proceeds to originate commercial loans as opportunities to do so become available.
As a result of this balance sheet restructuring, we have increased our interest rate spread, reduced our exposure to risks of interest rate fluctuations and improved our capital ratios. The balance sheet restructuring, has reduced our assets and liabilities by approximately $169 million. There were no known credit issues with any of the assets that were sold. The losses associated with the assets sold as a result of the restructuring were generally a reflection of the assets’ yield in the current interest rate environment. Our recent analysis indicated that without taking this action, net interest margins and net income would decline in future periods. We presently do not contemplate any further balance sheet reduction, unless we ultimately decide to sell or close one or more branches in connection with our branch review.
In addition to the balance sheet restructuring, over the long term, we will seek to gradually increase our investment in high quality, commercial real estate loans and commercial business loans, while reducing our current concentrations in single-family mortgage loans and mortgage-backed securities. Commercial real estate loans and commercial business loans generally have higher yields than single-family mortgage loans and mortgage-backed securities and tend to have shorter terms to maturity or adjustable interest rates.
Increase Non-interest Income – We have identified opportunities within the organization to generate increased non-interest income. The Company will seek to capitalize on its existing branch network by developing additional products and/or services to offer its existing customers, such as sales of non-insured annuity and mutual fund products. Introduction of overdraft privilege products and reverse mortgage referral fees during 2007 also helped to improve fee income.
Continued Expense Control – In recent years, management has achieved success in reducing the Company’s non-interest expenses through decreases in personnel cost and data processing charges. The Board of Directors will continue to make it a management priority to identify cost savings opportunities throughout all phases of the Company’s operations.
43
While these initiatives represent strategies pursued, they may not increase the Company’s income for a long period of time, if at all. The success of the Company’s strategy is subject to many factors, including all the factors listed under “Forward-Looking Statements” and the risk factors listed in “Item 1A. Risk Factors” in the Company’s Annual Report on Form 10-K for the year ended September 30, 2007.
In addition, it should be noted that commercial real estate loans generally expose a lender to greater risk of non-payment and loss than single-family residential mortgage loans because repayment of the loans often depends on the successful operation of the property, the income stream of the borrowers and, for construction loans, the accuracy of the estimate of the property’s value at completion of construction and the estimated cost of construction. Such loans typically involve larger loan balances to single borrowers or groups of related borrowers compared to single-family residential mortgage loans. Commercial business loans expose a lender to additional risks since they typically are made on the basis of the borrower’s ability to make repayments from the cash flow of the borrower’s business and are secured by non-real estate collateral that may depreciate over time.
Supervisory Agreement
On December 8, 2005, the Bank entered into a Supervisory Agreement with the Office of Thrift Supervision (“OTS”).
Pursuant to the terms of Supervisory Agreement, the Bank agreed as follows:
| | (1) | To review and revise as necessary the Bank’s written policy for compliance with the Bank Secrecy Act (the “BSA”) laws and regulations (the “BSA Compliance Program”). In amending the BSA Compliance Program, the Board of Directors must: (i) review and revise as necessary the Bank’s written methodology for assigning risk levels; (ii) strengthen the Bank’s customer identification program; (iii) review and revise as necessary the Bank’s written internal controls, due diligence processes and oversight and monitoring procedures; (iv) strengthen the Bank’s currency transaction reporting procedures; (v) review and revise as necessary the Bank’s specific review procedures to ensure the accurate completion and timely filing of all currency transaction reports; and (vi) complete all other actions discussed in the Bank’s 2005 examination. The Board also must review the Bank’s BSA Compliance Program on an annual basis to assess its adequacy and compliance with applicable BSA laws and regulations and, within 60 days, review and revise the Bank’s policies and procedures for conducting annual independent testing of the Bank’s BSA Compliance Program. |
| | (2) | To review and amend as necessary the Bank’s Flood Disaster Protection Act Policy and procedures to ensure that appropriate flood insurance, if required, is obtained and maintained for all properties securing a loan from the Bank. |
| | (3) | To review and revise as necessary the Bank’s written indirect automobile loan underwriting policies and procedures. |
| | (4) | Within 60 days, to prepare, adopt and submit for review and approval by the OTS a comprehensive three year business plan that considers the Bank’s existing operations, business strategies, current market conditions, local demographics, earnings, available resources and existing capital levels. |
The Supervisory Agreement will remain in effect until terminated, modified, or suspended in writing by the OTS.
The Bank has fully adopted and implemented the various plans, policies and procedures required by the Supervisory Agreement. A failure to comply with the Supervisory Agreement could result in the initiation of a formal enforcement action by the OTS, including the imposition of civil monetary penalties. While the Supervisory Agreement has resulted in additional regulatory compliance expense for the Company, the amount of such expense is not considered to have a material financial impact on the Company. The Bank has filed its business plan with the OTS and under the terms of the agreement may not make deviations from the plan without prior OTS approval.
44
The foregoing information does not purport to be a complete summary of the Supervisory Agreement and is qualified in its entirety by reference to the Supervisory Agreement filed as Exhibit 99 to the Company’s Current Report on Form 8-K filed on December 14, 2005.
Significant Events
On June 29, 2006, the Company announced that it had been victimized by a check kiting scheme perpetrated by one of its commercial deposit customers. The Company sustained an after tax loss during the year ended September 30, 2006 of $6.9 million. During the quarter ended March 31, 2007, we reached a settlement with our insurance provider, pursuant to which we received a recovery of $3.4 million pre-tax in settlement of a bond claim with our insurance carrier. Additionally, during the quarter ended September 30, 2007, the Company recorded $296,000 of expense related to the check-kiting scheme on a pre-tax basis, $25,000 of which related to legal fees. Notwithstanding, these losses, the Bank continues to satisfy all regulatory capital requirements and will be “well capitalized” under applicable government regulations.
Critical Accounting Policies and Estimates
Management’s discussion and analysis of the Company’s financial condition is based on the consolidated financial statements, which are prepared in accordance with accounting principles generally accepted in the United States of America. The preparation of such financial statements requires management to make estimates and assumptions that affect the reported amounts of assets, liabilities, revenues and expenses and related disclosure of contingent assets and liabilities. On an ongoing basis, management evaluates its estimates, including those related to the allowance for loan losses.
Management believes the allowance for loan losses is a critical accounting policy that requires the most significant estimates and assumptions used in the preparation of the consolidated financial statements. The allowance for loan losses is based on management’s evaluation of the level of the allowance required in relation to the estimated loss exposure in the loan portfolio. Management believes the allowance for loan losses is a significant estimated loss and therefore regularly evaluates it for adequacy by taking into consideration factors such as prior loan loss experience, the character and size of the loan portfolio, business and economic conditions and management’s estimation of losses. The use of different estimates or assumptions could produce different provisions for loan losses. Refer to the discussion of Allowance for Loan Losses in Note 1 to the Consolidated Financial Statements for a detailed description of management’s estimation process and methodology related to the allowance for loan losses.
Securities are evaluated periodically to determine whether a decline in their value is other than temporary. The term “other than temporary” is not intended to indicate a permanent decline in value. Rather, it means that the prospects for near term recovery of value are not necessarily favorable, or that there is a lack of evidence to support fair values equal to, or greater than, the carrying value of the investment. Management reviews criteria such as the magnitude and duration of the decline, as well as the reasons for the decline, to predict whether the loss in value is other than temporary. Once a decline in value is determined to be other than temporary, the value of the security is reduced and a corresponding charge to earnings is recognized.
The Company accounts for income taxes under the asset/liability method. Deferred tax assets are recognized for the future consequences attributable to differences between the financial statement carrying amounts of existing assets and liabilities and their respective tax bases, as well as operating loss and tax credit carry-forwards. Deferred tax assets and liabilities are measured using enacted tax rates expected to apply to taxable income in the years in which those temporary differences are expected to be recovered or settled. The effect on deferred tax assets and liabilities of a change in tax rates is recognized in income in the period indicated by the enactment date. A valuation allowance is established for deferred tax assets when, in the judgment of management, it is more likely than not that such deferred tax assets will not become realizable. The judgment about the level of future taxable income is dependent to a great extent on matters that may, at least in part, be beyond the Company’s control. It is at least reasonably possible that management’s judgment about the need for a valuation allowance for deferred tax assets could change in the near term.
45
Forward-Looking Statements
When used in this Annual Report, the words or phrases “will likely result,” “are expected to,” “will continue,” “is anticipated,” “estimate,” “project” or similar expressions are intended to identify “forward-looking statements” within the meaning of the Private Securities Litigation Reform Act of 1995. Such statements are subject to certain risks and uncertainties including changes in economic conditions in the Company’s market area, changes in policies by regulatory agencies, fluctuations in interest rates, demand for loans in the Company’s market area, competition and information provided by third-party vendors that could cause actual results to differ materially from historical earnings and those presently anticipated or projected. The Company wishes to caution readers not to place undue reliance on any such forward-looking statements, which speak only as of the date made. The Company wishes to advise readers that the factors listed above could affect the Company’s financial performance and could cause the Company’s actual results for future periods to differ materially from any opinions or statements expressed with respect to future periods in any current statements.
The Company does not undertake, and specifically disclaims any obligation, to publicly release the result of any revisions which may be made to any forward-looking statements to reflect events or circumstances after the date of such statements or to reflect the occurrence of anticipated or unanticipated events.
Asset/Liability Management
The Company strives to achieve consistent net interest income and reduce its exposure to adverse changes in interest rates by attempting to match the terms to re-pricing of its interest-sensitive assets and liabilities. Factors beyond the Bank’s control, such as market interest rates and competition, may also have an impact on the Bank’s interest income and interest expense.
In the absence of any other factors, the overall yield or return associated with the Bank’s earning assets generally will increase from existing levels when interest rates rise over an extended period of time, and conversely interest income will decrease when interest rates decrease. In general, interest expense will increase when interest rates rise over an extended period of time, and conversely interest expense will decrease when interest rates decrease. By managing the increases and decreases in its interest income and interest expense which are brought about by changes in market interest rates, the Bank can significantly influence its net interest income.
The senior officers of the Bank meet on a regular basis to monitor the Bank’s interest rate risk position and to set prices on loans and deposits to manage interest rate risk within the parameters set by the Board of Directors. The President of the Bank reports to the Board of Directors on a regular basis on interest rate risk and trends, as well as liquidity and capital ratios and requirements. The Board of Directors reviews the maturities of the Bank’s assets and liabilities and establishes policies and strategies designed to regulate the Bank’s flow of funds and to coordinate the sources, uses and pricing of such funds. The first priority in structuring and pricing the Bank’s assets and liabilities is to maintain an acceptable interest rate spread while reducing the net effects of changes in interest rates. The Bank’s management is responsible for administering the policies and determinations of the Board of Directors with respect to the Bank’s asset and liability goals and strategies.
As previously discussed, the Bank completed the process of transforming the balance sheet during the second and third quarters of the fiscal year ended September 30, 2007. A primary objective of this restructuring was to reduce exposure to changing interest rates. Lower yielding loans and investment securities were sold, with a substantial portion of the proceeds used to purchase higher yielding investments and to pay off debt. In addition to shortening the average repricing period of its assets, the Bank has sought to reduce its dependence on longer term fixed rate certificates of deposit. This should help the Bank respond more quickly to changing interest rate conditions and prevent long term commitments at higher deposit costs.
Market Risk
Management measures the Bank’s interest rate risk by computing estimated changes in the net portfolio value (“NPV”) of its cash flows from assets, liabilities and off-balance sheet items in the event of a range of assumed changes in market interest rates. NPV represents the market value of portfolio equity and is the difference between incoming and outgoing discounted cash flows from assets and liabilities, with adjustments made for off-balance sheet items. These computations estimate the effect on the Bank’s NPV
46
of sudden and sustained increases and decreases in market interest rates. The Bank’s Board of Directors has adopted an interest rate risk policy which establishes maximum decreases in the Bank’s estimated NPV in the event of increases or decreases in market interest rates. The following table presents the Bank’s projected change in NPV for the various rate shock levels at September 30, 2007. All changes meet the Bank’s policy requirements.
| | | | | | | | | | | | | | |
| | | Net Portfolio Value | | | NPV as % of PV of Assets |
Change in Rates | | $ Amount | | $ Change (1) | | % Change (2) | | | NPV Ratio (3) | | | Change (4) |
| | | (Dollars in Thousands) | | | | | | | | |
+300 bp | | $ | 51,225 | | $ | -17,684 | | -26 | % | | 8.17 | % | | -234bp |
+200 bp | | | 57,353 | | | -11,557 | | -17 | | | 9.01 | | | -150bp |
+100 bp | | | 63,496 | | | -5,413 | | -8 | | | 9.82 | | | -69bp |
0 bp | | | 68,910 | | | | | | | | 10.51 | | | |
-100 bp | | | 72,431 | | | 3,521 | | 5 | | | 10.92 | | | 41bp |
-200 bp | | | 73,450 | | | 4,540 | | 7 | | | 10.99 | | | 48bp |
| (1) | Represents the excess (deficiency) of the estimated NPV assuming the indicated change in interest rates minus the estimated NPV assuming no change in interest rates. |
| (2) | Calculated as the amount of change in the estimated NPV divided by the estimated NPV assuming no change in interest rates. |
| (3) | Calculated as the estimated NPV divided by average total assets. |
| (4) | Calculated as the excess (deficiency) of the NPV ratio assuming the indicated change in interest rates over the estimated NPV ratio assuming no change in interest rates. |
***Risk Measures: 200 bp rate shock***
| | | | | | |
| | | At September 30, | |
| | | 2007 | | | 2006 | |
Pre-Stock NPV Ratio: NPV as % of PV of Assets | | 10.51 | % | | 8.66 | % |
Exposure Measure: Post Shock NPV Ratio | | 9.01 | | | 6.91 | |
Sensitivity Measure: Change in NPV Ratio | | 150 | bp | | 175 | bp |
The above table indicates that at September 30, 2007, in the event of sudden and sustained increases in prevailing market interest rates, the Bank’s NPV would be expected to decrease, and that in the event of a sudden and sustained decrease in prevailing market interest rates, the Bank’s NPV would be expected to increase. The Bank’s Board of Directors reviews the Bank’s NPV position quarterly, and, if estimated changes in NPV are not within the targets established by the Board, the Board may direct management to adjust its asset and liability mix to bring interest rate risk within Board approved targets. At September 30, 2007, the Bank’s estimated changes in NPV were within the targets established by the Board of Directors.
NPV is calculated by the Office of Thrift Supervision (OTS) by using information provided by the Bank. The calculation is based on the net present value of discounted cash flows utilizing market prepayment assumptions and market rates of interest provided by Bloomberg quotations and surveys performed during the quarter ended September 30, 2007, with adjustments made to reflect the shift in the Treasury yield curve between the survey date and the quarter-end date.
Computations of prospective effects of hypothetical interest rate changes are based on numerous assumptions, including relative levels of market interest rates, loan prepayments and deposit decay, and should not be relied upon as indicative of actual results. Further, the computations do not contemplate any actions the Bank may undertake in response to changes in interest rates.
Certain shortcomings are inherent in the method of analysis presented in the computation of NPV. Actual values may differ from those projections set forth in the table, should market conditions vary from assumptions used in the preparation of the table. Additionally, certain assets, such as adjustable-rate loans, have features which restrict changes in interest rates on a short-term basis and over the life of the asset. In addition, the proportion of adjustable-rate loans in the Bank’s portfolio could decrease in future periods if market interest rates remain at or decrease below current levels due to refinance activity. Further, in the event of a change in interest rates, prepayment and early withdrawal levels would likely deviate significantly from those assumed in the tables. Finally, the ability of many borrowers to repay their adjustable-rate debt may decrease in the event of an interest rate increase.
47
Average Balance, Interest and Average Yields and Rates
The following table sets forth certain information relating to the Company’s average balance sheet and reflects the average yield on assets and cost of liabilities for the periods indicated and the average yields earned and rates paid. Such yield and cost are derived by dividing income or expense by the average daily balance of assets or liabilities, respectively, for the years ended September 30, 2007, September 30, 2006 and September 30, 2005. Total average assets are computed using month-end balances. No tax equivalent adjustments have been made as the Company did not invest in any tax exempt assets during the periods presented.
The table also presents information for the periods indicated with respect to the differences between the average yield earned on interest-earning assets and average rate paid on interest-bearing liabilities, or “interest rate spread,” which banks have traditionally used as an indicator of profitability. Another indicator of net interest income is “net interest margin,” which is its net interest income divided by the average balance of interest-earning assets.
| | | | | | | | | | | | | | | | | | | | | | | | | | | |
| | | Year Ended September 30, | |
| | | 2007 | | | 2006 | | | 2005 | |
| | | Average
Balance | | Interest | | Average
Yield/
Cost | | | Average
Balance | | Interest | | Average
Yield/
Cost | | | Average
Balance | | Interest | | Average
Yield/
Cost | |
| | | (Dollars in Thousands) | |
Interest-earning assets: | | | | | | | | | | | | | | | | | | | | | | | | | | | |
Loans receivable (1) | | $ | 444,526 | | $ | 28,578 | | 6.43 | % | | $ | 462,799 | | $ | 28,352 | | 6.13 | % | | $ | 412,093 | | $ | 24,286 | | 5.89 | % |
Mortgage-backed securities | | | 104,323 | | | 4,938 | | 4.73 | | | | 124,458 | | | 5,095 | | 4.09 | | | | 161,415 | | | 6,231 | | 3.86 | |
Investment securities and FHLB stock | | | 75,104 | | | 3,303 | | 4.40 | | | | 160,365 | | | 6,342 | | 3.95 | | | | 162,138 | | | 5,637 | | 3.48 | |
Other interest-earning assets | | | 43,390 | | | 2,293 | | 5.28 | | | | 3,372 | | | 206 | | 6.11 | | | | 2,578 | | | 69 | | 2.68 | |
| | | | | | | | | | | | | | | | | | | | | | | | | | | |
Total interest earning assets | | | 667,343 | | | 39,112 | | 5.86 | | | | 750,994 | | | 39,995 | | 5.33 | | | | 738,224 | | | 36,223 | | 4.91 | |
Bank Owned Life Insurance | | | 13,741 | | | | | | | | | 12,913 | | | | | | | | | 12,242 | | | | | | |
Non-interest-earning assets | | | 28,619 | | | | | | | | | 40,006 | | | | | | | | | 40,869 | | | | | | |
| | | | | | | | | | | | | | | | | | | | | | | | | | | |
Total assets | | $ | 709,703 | | | | | | | | $ | 803,913 | | | | | | | | $ | 791,335 | | | | | | |
| | | | | | | | | | | | | | | | | | | | | | | | | | | |
| | | | | | | | | |
Interest-bearing liabilities: | | | | | | | | | | | | | | | | | | | | | | | | | | | |
Deposits | | $ | 584,077 | | $ | 20,405 | | 3.49 | % | | $ | 607,952 | | $ | 18,379 | | 3.02 | % | | $ | 589,849 | | $ | 14,711 | | 2.49 | % |
FHLB advances short-term | | | 22,717 | | | 1,082 | | 4.76 | | | | 63,457 | | | 2,484 | | 3.91 | | | | 53,632 | | | 1,471 | | 2.74 | |
FHLB advances long-term | | | 36,841 | | | 1,975 | | 5.36 | | | | 67,529 | | | 2,992 | | 4.43 | | | | 72,056 | | | 2,738 | | 3.80 | |
Junior Subordinated Debentures | | | 23,197 | | | 2,055 | | 8.86 | | | | 23,197 | | | 1,921 | | 8.28 | | | | 23,197 | | | 1,464 | | 6.31 | |
Other liabilities | | | 1,635 | | | — | | — | | | | 1,824 | | | — | | — | | | | 1,864 | | | — | | — | |
| | | | | | | | | | | | | | | | | | | | | | | | | | | |
Total interest-bearing liabilities | | | 668,467 | | | 25,517 | | 3.82 | | | | 763,959 | | | 25,776 | | 3.37 | | | | 740,598 | | | 20,384 | | 2.75 | |
| | | | | | | | | | | | | | | | | | | | | | | | | | | |
Non-interest-bearing liabilities | | | 7,183 | | | | | | | | | 2,723 | | | | | | | | | 7,856 | | | | | | |
| | | | | | | | | | | | | | | | | | | | | | | | | | | |
Total liabilities | | | 675,650 | | | | | | | | | 766,682 | | | | | | | | | 748,454 | | | | | | |
Stockholders’ equity | | | 34,053 | | | | | | | | | 37,231 | | | | | | | | | 42,881 | | | | | | |
| | | | | | | | | | | | | | | | | | | | | | | | | | | |
Total liabilities and stockholders’ equity | | $ | 709,703 | | | | | | | | $ | 803,913 | | | | | | | | $ | 791,335 | | | | | | |
| | | | | | | | | | | | | | | | | | | | | | | | | | | |
Net interest income | | | | | $ | 13,595 | | | | | | | | $ | 14,219 | | | | | | | | $ | 15,839 | | | |
| | | | | | | | | | | | | | | | | | | | | | | | | | | |
Interest rate spread | | | | | | | | 2.04 | % | | | | | | | | 1.96 | % | | | | | | | | 2.16 | % |
| | | | | | | | | | | | | | | | | | | | | | | | | | | |
Net interest margin (2) | | | | | | | | 2.04 | % | | | | | | | | 1.89 | % | | | | | | | | 2.15 | % |
| | | | | | | | | | | | | | | | | | | | | | | | | | | |
Ratio of average interest-earning assets to average interest-bearing liabilities | | | | | | | | 99.83 | % | | | | | | | | 98.30 | % | | | | | | | | 99.68 | % |
| | | | | | | | | | | | | | | | | | | | | | | | | | | |
| (1) | Includes nonaccrual loans. |
| (2) | Represents net interest income divided by the average balance of interest-earning assets. |
48
Rate/Volume Analysis
The table below sets forth certain information regarding changes in interest income and interest expense of the Bank for the periods indicated. For each category of interest-earning asset and interest-bearing liability, information is provided on changes attributable to: (i) changes in volume (changes in volume multiplied by old rate); (ii) changes in rates (change in rate multiplied by old volume); and (iii) changes in rate/volume (changes in rate multiplied by the changes in volume).
| | | | | | | | | | | | | | | | | | | | | | | | | | | | | | | | |
| | | Year Ended September 30, | |
| | | 2007 v. 2006 | | | 2006 v. 2005 | |
| | | Increase (Decrease) Due to | |
| | | Volume | | | Rate | | | Rate/
Volume | | | Total | | | Volume | | | Rate | | | Rate/
Volume | | | Total | |
| | | (In Thousands) | |
Interest income: | | | | | | | | | | | | | | | | | | | | | | | | | | | | | | | | |
Loans receivable | | $ | (1,120 | ) | | $ | 1,401 | | | $ | (55 | ) | | $ | 226 | | | $ | 2,955 | | | $ | 989 | | | $ | 122 | | | $ | 4,066 | |
Mortgage-backed securities | | | (825 | ) | | | 797 | | | | (129 | ) | | | (157 | ) | | | (1,422 | ) | | | 371 | | | | (85 | ) | | | (1,136 | ) |
Investment securities and FHLB stock | | | (3,376 | ) | | | 722 | | | | (385 | ) | | | (3,039 | ) | | | (62 | ) | | | 775 | | | | (8 | ) | | | 705 | |
Other interest-earning assets | | | 2,437 | | | | (27 | ) | | | (323 | ) | | | 2,087 | | | | 21 | | | | 89 | | | | 27 | | | | 137 | |
| | | | | | | | | | | | | | | | | | | | | | | | | | | | | | | | |
Total interest-earning assets | | | (2,884 | ) | | | 2,893 | | | | (892 | ) | | | (883 | ) | | | 1,492 | | | | 2,224 | | | | 56 | | | | 3,772 | |
| | | | | | | | |
Interest expense: | | | | | | | | | | | | | | | | | | | | | | | | | | | | | | | | |
Deposits | | | (722 | ) | | | 2,860 | | | | (112 | ) | | | 2,026 | | | | 451 | | | | 3,121 | | | | 96 | | | | 3,668 | |
FHLB advances short-term | | | (1,594 | ) | | | 538 | | | | (346 | ) | | | (1,402 | ) | | | 267 | | | | 632 | | | | 114 | | | | 1,013 | |
FHLB advances long-term | | | (1,360 | ) | | | 628 | | | | (285 | ) | | | (1,017 | ) | | | (144 | ) | | | 420 | | | | (22 | ) | | | 254 | |
Subordinate Debentures | | | — | | | | 134 | | | | — | | | | 134 | | | | — | | | | 457 | | | | — | | | | 457 | |
Other liabilities | | | — | | | | — | | | | — | | | | — | | | | — | | | | — | | | | — | | | | — | |
| | | | | | | | | | | | | | | | | | | | | | | | | | | | | | | | |
Total interest-bearing liabilities | | | (3,676 | ) | | | 4,160 | | | | (743 | ) | | | (259 | ) | | | 574 | | | | 4,630 | | | | 188 | | | | 5,392 | |
| | | | | | | | | | | | | | | | | | | | | | | | | | | | | | | | |
Change in net interest income | | $ | 792 | | | $ | (1,267 | ) | | $ | (149 | ) | | $ | (624 | ) | | $ | 918 | | | $ | (2,406 | ) | | $ | (132 | ) | | $ | (1,620 | ) |
| | | | | | | | | | | | | | | | | | | | | | | | | | | | | | | | |
Comparison of Financial Condition at September 30, 2007 and 2006
During the twelve months ended September 30, 2007, the Company’s assets decreased by $143.5 million, or 18.3% from $785.9 million at September 30, 2006 to $642.4 million at September 30, 2007. The Company’s interest-bearing deposits in other banks increased $14.3 million, from $2.8 million at September 30, 2006 to $17.1 million at September 30, 2007. Federal funds sold also increased by $49.0 million, from $500,000 at September 30, 2006 to $49.5 million at September 30, 2007. Increases in these areas of liquidity resulted from the Company investing the proceeds from sales of mortgage-backed securities and investment securities in short-term instruments. Such funds are expected to be used in funding the outflows of certificate of deposit accounts that are expected to occur as we reduce certificates of deposit rates in an effort to reduce these higher cost deposits as a funding source. The Company’s investment portfolio available for sale decreased $139.1 million, or 97.2%, from $143.1 million at September 30, 2006 to $4.0 million at September 30, 2007 due to the sale of various investment securities in an effort to restructure the balance sheet. The Company’s investment portfolio held to maturity decreased $4.5 million from $4.5 million at September 30, 2006 to $0 at September 30, 2007, as various investments matured and were sold and others were transferred to available for sale as the Company restructured its balance sheet. Net loans receivable, decreased $47.5 million, or 10.2%, from $463.8 million at September 30, 2006 to $416.3 million at September 30, 2007, due to the sale of $46.4 million fixed-rate single family loans in connection with the balance sheet restructuring. The Bank’s lending strategy has shifted such that commercial real estate lending and commercial business lending and short term home equity lending have become key focuses. The Bank ceased its indirect auto lending program in December 2005. The indirect loan portfolio was $42.9 million at September 30, 2006 and $21.7 million at September 30, 2007. It is expected to decline over time as the loans are paid down. The Company’s mortgage-backed securities available for sale increased $18.2 million, or 21.0%, from $86.8 million at September 30, 2006 to $105.0 million at September 30, 2007. This increase was primarily a result of the reclassification of certain held to maturity mortgage-backed securities to available for sale and securities purchased in the restructuring. The Company’s mortgage-backed securities held to maturity decreased $28.7 million, or 100.0%, as all mortgage-backed securities were classified to available for sale for liquidity purposes. The Company no longer intends to classify mortgage-backed securities and investment securities as held to maturity for the foreseeable future. Federal Home Loan Bank of Atlanta stock
49
decreased $4.7 million, or 67.4% from $7.0 million at September 30, 2006 to $2.3 million at September 30, 2007, due to the repayment of borrowed advances with proceeds from assets sold during the balance sheet restructuring. The Bank is seeking to increase core deposits in an effort to decrease the cost of funds. Any increase in deposits may be offset by decreases in levels of borrowings. New loans may be made to offset payments received on existing loans and securities. If payments received on loans exceed demand, then securities may be purchased or borrowings further reduced.
Deposits decreased by $46.4 million, or 7.7%, from $604.8 million at September 30, 2006 to $558.4 million at September 30, 2007. This decrease was primarily due to lower rates offered to reduce deposit costs and increased competition. Short-term advances from the Federal Home Loan Bank of Atlanta decreased by $30.0 million, or 75.0%, from $40.0 million at September 30, 2006 to $10.0 million at September 30, 2007. Long-term advances from the Federal Home Loan Bank of Atlanta decreased $68.5 million, or 87.3%, from $78.5 million at September 30, 2006, to $10.0 million at September 30, 2007. Advances from the Federal Home Loan Bank of Atlanta decreased as the Bank used funds from the sale of securities to pay off $104.0 million in high cost advances as part of the strategy to restructure the balance sheet.
Stockholders’ equity increased by $1.2 million, or 3.5%, from $33.4 million at September 30, 2006 to $34.6 million at September 30, 2007, which was primarily attributable to the decrease in accumulated other comprehensive loss of $3.7 million, from a negative $4.3 million at September 30, 2006 to a negative $682,000 at September 30, 2007, offset, in part, by net losses of $2.9 million for the twelve months ended September 30, 2007. The change in these unrealized losses was mainly due the realization of the losses as the securities were sold. The remaining unrealized losses are considered temporary as they reflect market values on September 30, 2007 and are subject to change daily as interest rates fluctuate.
Comparison of Financial Condition at September 30, 2006 and 2005
During the twelve months ended September 30, 2006, the Company’s assets decreased by $26.9 million, or 3.31% from $812.7 million at September 30, 2005 to $785.8 million at September 30, 2006. The Company’s investment portfolio available for sale decreased $8.3 million or 5.5%, from $151.4 million at September 30, 2005 to $143.1 million at September 30, 2006. Loans receivable, net increased by $9.5 million, or 2.1%, from $454.3 million at September 30, 2005 to $463.8 million at September 30, 2006. The Company’s mortgage-backed securities available for sale decreased by $25.3 million, or 22.6%, from $112.1 million at September 30, 2005 to $86.8 million at September 30, 2006. In an effort to protect against risk from rising rates the Company has placed emphasis on short term loans such as variable rate commercial loans, home equity loans and short term mortgages. The Company increased commercial real estate loans by $35.5 million, or 40.7% from $75.0 million at September 30, 2005 to $110.0 million at September 30, 2006. Construction loans decreased by $14.8 million, or 27.5% from $53.8 million to $39.0 million due to decreased demand from individual builders.
Deposits increased by $7.1 million, or 1.2%, from $597.7 million at September 30, 2005 to $604.8 million at September 30, 2006. The increase in deposits was achieved through normal marketing efforts. The growth in deposits helped to fund loan demand. Advances from Federal Home Loan Bank of Atlanta decreased by $26.3 million, or 18.2% from $144.8 million at September 30, 2005 to $118.5 million at September 30, 2006. Advances will be used when necessary to fund loan demand if deposit growth does not meet this demand.
Stockholders’ equity decreased by $8.6 million or 20.5%, from $42.0 million at September 30, 2005 to $33.4 million at September 30, 2006. This decrease was primarily due to the loss of $6.9 million net of taxes due to the check-kiting fraud perpetrated against the bank. See “The Comparison of Other Operating Results for the Years Ended September 30, 2006 and 2005 Non-Interest Expenses”. Also contributing to the decrease in equity was the increase in accumulated other comprehensive income of $476,000 from a loss of $3.9 million at September 30, 2005 to a loss of $4.4 million at September 30, 2006. These unrealized losses are considered temporary as they reflect market values as of September 30, 2006 and are subject to change daily as interest rates fluctuate.
Asset Quality
At September 30, 2007, the Company had $2.4 million in non-performing assets, consisting of nonaccrual loans, repossessed assets and foreclosed real estate, representing .35% of total assets. At September 30, 2006, non-performing assets were $2.6 million or .33% of assets. There was one impaired commercial loan at September 30, 2007, for $2.3 million and $2.4 million at
50
September 30, 2006. This loan is collateral dependent and the Company does not expect to incur any losses on this loan. This is a single commercial real estate loan that was classified as nonaccrual during the year ended September 30, 2006. This loan is secured by a mixed retail and office use commercial office building in Timonium, Maryland. The property securing the loan was appraised at $2.6 million. The borrower is in bankruptcy. The property securing the loan is approximately 70% leased, the tenant makes rental payments directly to the Bank, and we use these payments to reduce the principal outstanding balance of the loan The collateral securing this loans was sold in October 2007 at auction with the proceeds being retained at the Bank. The Bank’s net charge offs for the year ended September 30, 2007 was $146,000. The Bank’s allowance for loan losses was $2.7 million at September 30, 2007 and $2.6 million at September 30, 2006. The Bank has no sub-prime or Alt-A loan exposure in its loan portfolio.
Comparison of Operating Results for the Years Ended September 30, 2007 and 2006
Net Income. The Company incurred a net loss of $2.9 million during the fiscal year ended September 30, 2007. This loss resulted from our balance sheet restructuring. In March of 2007, we elected to sell approximately $169.1 million of securities held in our investment portfolio (average yield 3.51%) and use the majority of the proceeds from the sale to repay short-term borrowings (average cost 4.97%). We also sold $31.9 million of mutual funds and $46.4 million of fixed-rate single family mortgage loans with a weighted average yield of 5.11%. In conjunction with the restructuring, we realized pre-tax losses on the sales of securities and loans of $7.1 million. The restructure is expected to have a positive impact in future periods. The loss from sales of loans and investment securities was offset to some extent by the partial recovery of $3.4 million on a pre-tax basis from insurance proceeds in connection with a check-kiting scheme perpetrated against the Bank during the preceeding fiscal year. Also contributing to the net loss for the twelve months ended September 30, 2007 was a decrease of $624,000, or 3.9%, in net interest income from $14.2 million for the twelve months ended September 30, 2006 to $13.6 million for the twelve months ended September 30, 2007. During the fiscal year ended Sept 30, 2006 the Company incurred a net loss of $7.4 million. The net loss was primarily attributable to a $10.7 million pre-tax loss from the check-kiting scheme noted above.
Net Interest Income. Net interest income decreased by $624,000 or 3.9% from $14.2 million for the twelve months ended September 30, 2006 compared to $13.6 million for the twelve months ended September 30, 2007. The decrease in net interest income primarily was the result of increases in the average rate on interest bearing liabilities offset partially by decrease in the average balance of Federal Home Loan Bank advances. The net interest margin increased 15 basis points from 1.89% for the twelve months ended September 30, 2006 to 2.04% for the twelve months ended September 30, 2007. The Company’s ratio of average interest-earning assets to average interest-bearing liabilities increased from 98.30% for the twelve months ended September 30, 2006 to 99.8% for the twelve months ended September 30, 2007. With the sale of low yielding assets and the redemption of high cost borrowings as a result of the balance sheet restructuring, improvements in interest spread are expected to continue. Changes in short term rates affect the Company’s interest rate spread as $23.2 million borrowed funds tied to LIBOR re-price quarterly as interest rates fluctuate.
Interest Income. Interest income decreased by $883,000, or 2.21% from $40.0 million for the twelve months ended September 30, 2006 to $39.1 million for the twelve months ended September 30, 2007. Interest and fees on loans increased by $226,000, or .80%, from $28.3 million for the twelve months ended September 30, 2006 to $28.6 million for the twelve months ended September 30, 2007. This was primarily due to an increase in the average yield earned on loans receivable of 30 basis points from 6.13% for the twelve months ended September 30, 2006, to 6.43% for the twelve months ended September 30, 2007. This was partially offset by a decrease in the average balance of loans receivable of $18.3 million from $462.8 million for the twelve months ended September 30, 2006 to $444.5 million for the twelve months ended September 30, 2007. The decrease in the average balance of loans was primarily attributable to the sale of $46.4 million of residential loans, competition and current economic conditions. The increase in the average yield was attributable to a shift within the portfolio from residential mortgages and automobile loans to higher yielding commercial loans. Interest on mortgage-backed securities decreased by $157,000 or 3.1% from $5.1 million for the twelve months ended September 30, 2006 to $4.9 million for the twelve months ended September 30, 2007. This decrease was primarily due to the decrease in the average balance of mortgage-backed securities from $124.4 million for the twelve months ended September 30, 2006 to $104.3 million for the twelve months ended September 30, 2007. The decrease in the average balance more than offset an increase in the average rate from 4.09% at September 30, 2006 to 4.73% at September 30, 2007. Interest and dividends on investment securities decreased $3.0 million, from $6.3 million for the twelve months ended September 30, 2006 to $3.3 million for the
51
twelve months ended September 30, 2007. This was primarily due to a decrease in the average balance of investments of $85.3 million, from $160.4 million for the twelve months ended September 30, 2006 to $75.1 million for the twelve months ended September 30, 2007, which was partially offset by an increase in the average yield on investments of 45 basis points from 3.95% for the twelve months ended September 30, 2006 to 4.40% for the twelve months ended September 30, 2007.
Interest Expense. Interest expense, which consists of interest on deposits, interest on borrowed money and other interest expense, decreased from $25.8 million for the twelve months ended September 30, 2006 to $25.5 million for the twelve months ended September 30, 2007, a decrease of $259,000 or 1.0%. Interest on deposits increased $2.0 million from $18.4 million at September 30, 2006 to $20.4 million at September 30, 2007 due to an increase in the average cost of deposits of 47 basis points from 3.02% for the twelve months ended September 30, 2006 to 3.49% for the twelve months ended September 30, 2007. This was partially offset by a decrease in the average balance of deposits of $23.9 million, or 3.9%, from $608.0 million at September 30, 2006 to $584.1 million at September 30, 2007. The decrease in deposits was primarily due to increased competition for deposit funds. We intend to reduce our reliance on higher cost certificates of deposits. Interest on short-term borrowings decreased by $1.4 million, or 56.4%, for the twelve months ended September 30, 2007 from $2.5 million at September 30, 2006 to $1.1 million at September 30, 2007. Interest on long-term borrowings decreased by $1.0 million, or 34.0% for the twelve months ended September 30, 2007 from $3.0 million for the twelve months ended September 30, 2006 to $2.0 million for the twelve months ended September 30, 2007. The overall decrease in borrowings was primarily due to a decrease of $71.4 million in the average balances of advances from the Federal Home Loan Bank of Atlanta during the twelve months ended September 30, 2007. Also contributing to interest expense was interest on the Junior Subordinated Debentures, which increased by $134,000 for the twelve months ended September 30, 2007 from $1.9 million for the twelve months ended September 30, 2006 to $2.0 million for the twelve months ended September 30, 2007. The average rate paid on the Junior Subordinated Debentures increased 58 basis points from 8.28% during 2006 to 8.86% during 2007. The rates on the Junior Subordinate Debentures are based on LIBOR and adjust quarterly.
Provision for Loan Losses. The Company’s significant accounting policies are set forth in Note 1 of Notes to Consolidated Financial Statements. Of these significant accounting policies, the Company considers its policy regarding the allowance for loan losses to be its most critical accounting policy and estimate, because it requires management’s most subjective and complex judgments. In addition, changes in economic conditions can have a significant impact on the allowance for loan losses and therefore the provision for loan losses and results of operations. The Company has developed appropriate policies and procedures for assessing the adequacy of the allowance for loan losses, recognizing that this process requires a number of assumptions and estimates with respect to its loan portfolio. The Company’s assessments may be impacted in future periods by changes in economic conditions, the impact of regulatory examinations, and the discovery of information with respect to borrowers that is not known to management at the time of the issuance of the consolidated financial statements.
Recent developments in local and national real estate markets have increased loss exposure to certain lenders. In particular, institutions participating in sub-prime lending products have experienced losses which, in some cases, have been material to operating results. The Company’s loan portfolio is considered to have very little exposure to sub-prime loans since the Company has never engaged in this type of lending.
The Company charges or credits to income provisions for loan losses to maintain the total allowance for loan losses at a level management considers adequate to provide for losses inherent in the loan portfolio as of the balance sheet date. In determining the provision, management considers a number of factors such as existing loan levels, prior loss experience, current economic conditions and the probability of these conditions affecting existing loans. The Company established additional provision for losses on loans of $117,000 during the twelve months ended September 30, 2007 as compared to $194,000 for the twelve months ended September 30, 2006. Loan chargeoffs for the twelve months ended September 30, 2007 were $364,000 as compared to $578,000 for the twelve months ended September 30, 2006, a decrease of $214,000. Loan recoveries were $218,000 for the twelve months ended September 30, 2007 compared to $317,000 for the twelve months ended September 30, 2006. Non performing loans at September 30, 2007 were $2.3 million as compared to $2.5 million at September 30, 2006. The total allowance for loan losses is $2.6 million at September 30, 2007. In establishing such provisions, management considered an analysis of the risk inherent in the loan portfolio. See“Asset Quality.”
52
Other Income.Other income was $1.5 million for the twelve months ended September 30, 2006 and negative $5.3 million for the twelve months ended September 30, 2007. During the twelve months ended September 30, 2007, the Company incurred a loss of $5.9 million from the sale of investments and mortgage-backed securities and a loss of $1.2 million from the sale of loans as the Bank implemented its restructuring plan. Fees on transaction accounts increased by $138,000 from $561,000 for the twelve months ended September 30, 2006 to $699,000 for the twelve months ended September 30, 2007. The increase is primarily attributable to the implementation of an overdraft protection program in May of 2007. Income from Bank Owned Life Insurance (BOLI) increased $97,000 from $474,000 for the twelve months ended September 30, 2006, to $571,000 for the twelve months ended September 30, 2007. This increase was due to an adjustment in the rate of dividends earned on the BOLI investment.
Non-interest Expenses.Total non-interest expenses decreased by $14.1 million, or 52.5%, from $27.0 million for the twelve months ended September 30, 2006 to $12.8 million for the twelve months ended September 30, 2007. The decrease in non-interest expenses was primarily due to the net recovery of $3.0 on the loss from the check-kiting scheme perpetrated on the Bank during the fiscal year ended September 30, 2006, of $10.7 million before taxes. Salaries and related expenses decreased by $530,000, or 6.1%, from $8.7 million for the twelve months ended September 30, 2006 to $8.1 million for the twelve months ended September 30, 2007. This decrease was primarily due to a decrease in the work force as the Bank continued with its cost cutting strategies. Data processing fees decreased by $211,000, from $1.7 million for the twelve months ended September 30, 2006 to $1.5 million for the twelve months ended September 30, 2007. This decrease was due to the change of data processors. Professional fees increased $113,000, or 23.0%, from $490,000 for the twelve months ended September 30, 2006 to $603,000 for the twelve months ended September 30, 2007. Professional fees increased due to additional legal fees arising from the supervisory agreement and the check- kiting scheme perpetrated against the Bank. Advertising expense decreased by $95,000, or 15.5%, from $612,000 for the twelve months ended September 30, 2006 to $517,000 for the twelve months ended September 30, 2007. This decrease was due to decreased advertising during the period. There was an increase in other expenses of $420,000, or 47.6%, from $882,000 for the twelve months ended September 30, 2006 to $1.3 million for the twelve months ended September 30, 2007. This increase was primarily due to increased FDIC deposit insurance premiums.
Income Taxes. The Company’s income tax benefit was $1.7 million and $4.0 million for the twelve months ended September 30, 2007 and 2006, respectively. The Company’s tax benefit decreased for the twelve months ended September 30, 2007 as compared to the same period in the prior year as the Company’s loss decreased due to the recovery of $3.0 million on the loss from the check-kiting scheme perpetrated on the Bank discovered in September 2006. The Company also earned certain income that is exempt from state taxes and $571,000 non-taxable income from the Bank Owned Life Insurance during the twelve months ended September 30, 2007.
Comparison of Operating Results for the Years Ended September 30, 2006 and 2005
Net Income.Net income decreased from income of $601,000 for the year ended September 30, 2005 to a net loss of $7.4 million for the year ended September 30, 2006. The decrease was primarily due to an increase in non-interest expenses of $10.2 million, or 60.4% from $16.8 million for the year ended September 30, 2005 to $27.0 million for the year ended September 30, 2006. Non-Interest expenses for the year ended September 30, 2006 includes a $10.8 million loss on dishonored checks as a result of the check-kiting scheme perpetrated on the Bank.
Net Interest Income.Net interest income decreased by $1.6 million or 10.2% from $15.9 million for the year ended September 30, 2005 to $14.2 million for the year ended September 30, 2006. The decrease in net interest income primarily was the result of increases in the average rate on interest bearing liabilities and an increase in the average balance of interest bearing liabilities. Due to rising interest rates and deposits re-pricing faster than loans, the interest rate spread decreased 20 basis points from 2.16% for the year ended September 30, 2005 to 1.96% for the year ended September 30, 2006. The Company’s ratio of average interest-earning assets to average interest-bearing liabilities decreased from 99.68% for the year ended September 30, 2005 to 98.30% for the year ended September 30, 2006. The primary reason for the decrease in this ratio is that funds are being invested in other income producing assets such as Bank Owned Life Insurance. The Company’s interest rate spread has decreased due to the rising rates paid on borrowed funds and deposits not being completely offset by rising rates for new loans. Improvements in interest spread should occur if long-term interest rates rise and the Company has the resources from either re-pricing assets or new funds received to re-pay the borrowed funds. If short term rates fall, the interest rate spread should increase as borrowed funds tied to LIBOR re-price at lower rates.
53
Interest Income. Interest income increased by $3.8 million, or 10.4% from $36.2 million for the year ended September 30, 2005 to $40.0 million for the year ended September 30, 2006. Interest and fees on loans increased by $4.1 million, or 16.7%, from $24.3 million for the year ended September 30, 2005 to $28.4 million for the year ended September 30, 2006. This was primarily due to an increase in the average balance of loans receivable of $50.7 million from $412.1 million at September 30, 2005 to $462.8 at September 30, 2006, and an increase in the average yield earned on loans receivable of 24 basis points from 5.89% at September 30, 2005 to 6.13% at September 30, 2006. The increase in the average balance of loans was primarily attributable to the Bank having competitive rates and current economic conditions and management’s strategy to focus lending on variable rate commercial real estate loans and short term home equity loans. The increase in the average yield was attributable to the prevailing market rates in the economy. Interest on mortgage-backed securities decreased by $1.1 million or 18.2% from $6.2 million for the year ended September 30, 2005 to $5.1 million for the year ended September 30, 2006. This decrease was primarily due to the decrease in the average balance of mortgage-backed securities from $161.4 million at September 30, 2005 to $124.5 million at September 30, 2006. The decrease in the average balance more than offset an increase in the average rate from 3.9% at September 30, 2005 to 4.1% at September 30, 2006. Interest and dividends on investment securities increased by $705,000, or 12.5% from $5.6 million for the year ended September 30, 2005 to $6.3 million for the year ended September 30, 2006. This was primarily due to an increase in the average yield on investments of 47 basis points from 3.48% for the year ended September 30, 2005 to 3.95% for the year ended September 30, 2006 due to step up provisions on some investment securities. However, this was partially offset by a decrease in the average balance of investments of $1.7 million, from $162.1 million for the year ended September 30, 2005 to $160.4 million for the year ended September 30, 2006.
Interest Expense. Interest expense, which consists of interest on deposits, interest on borrowed money and other interest expense increased from $20.4 million for the year ended September 30, 2005 to $25.8 million for the year ended September 30, 2006 a change of $5.4 million or 26.5%. Interest on deposits increased $3.7 million from $14.7 million at September 30, 2005 to $18.4 million at September 30, 2006 due to an increase in the average cost of deposits of 53 basis points from 2.49% for the year ended September 30, 2005 to 3.02% for the year ended September 30, 2006. Also contributing to the increase in interest expense was an increase in the average balance of deposits of $18.1 million, or 3.1% from $589.8 million at September 30, 2005 to $607.9 million at September 30, 2006. The Company was able to increase its deposits through normal marketing efforts. Interest on short-term borrowings increased by $1.0 million or 68.9% for the year ended September 30, 2006. Interest on long-term borrowings increased by $254,000 or 9.3% for the year ended September 30, 2006. The overall increase in interests on borrowings was primarily due to an increase in the average rate paid on short term borrowings which increased by 117 basis points from 2.7% for the year ended September 30, 2005 to 3.9% for the year ended September 30, 2006. The average rate on long term borrowings also increased by 63 basis points from 3.8% for the year ended September 30, 2005 to 4.4% for the year ended September 30, 2006. An increase in the average balance of advances from the Federal Home Loan Bank of Atlanta of $5.3 million during the year ended September 30, 2006 also contributed to the increase in interest on borrowings. Also contributing to interest expense was interest on the Junior Subordinated Debentures which increased by $457,000 from $1.5 million for the year ended September 30, 2005 to $1.9 million for the year ended September 30, 2006. This increase was due to the increase in the average rate paid on the Junior Subordinated Debentures from 6.3%, during 2005 to 8.3% during 2006. The rates on the Junior Subordinate Debentures are based on LIBOR and adjust quarterly.
Provision for Loan Losses.The provision for loan losses was $453,000 for the year ended September 30, 2005 compared to $194,000 for the year ended September 30, 2006, a decrease of $259,000. The decrease was primarily due to the decrease in the consumer loan portfolio from $88.3 million at September 30, 2005 to $53.5 million at September 30, 2006. In December 2005 the Bank ceased offering indirect consumer lending. Loan chargeoffs for the year ended September 30, 2006 were $578,000 as compared to $677,000 for the year ended September 30, 2005 a decrease of $99,000. The decrease in loan chargeoffs was due to prevailing low loan delinquency and a decrease in actual losses in the Bank’s consumer loan portfolio as the automobile loan portfolio decreases due to the discontinuation of indirect auto lending. Loan recoveries were $317,000 for the year ended September 30, 2006 compared to $383,000 for the year ended September 30, 2005. Non performing loans at September 30, 2006 were $2.5 million as compared to $738,000 at September 30, 2005. The total loss allowance allocated to loans is $2.7 million at September 30, 2006. In establishing such provisions, management considered an analysis of the risk inherent in the loan portfolio. For additional information see Asset Quality.
Other Income.Other income decreased by $657,000, or 35.4% from $1.8 million for the year ended September 30, 2005 to $1.2 million for the year ended September 30, 2006. The decrease in other income for the year ended September 30, 2006 was primarily
54
due to the decrease in gain on sale of investments and mortgaged backed securities of $879,000 from $884,000 for the year ended September 30, 2005 to $5,000 for the year ended September 30, 2006. The $884,000 gain on sale of investments for the year ended September 30, 2005 was primarily due to the acquisition of Intrieve, the Bank’s data processing provider, by Harland for cash. The Bank owned shares of Intrieve. This was partially offset by a decrease in losses on repossessed assets of $234,000 from $561,000 for the year ended September 30, 2005 to $327,000 for the year ended September 30, 2006. Also contributing to the decrease in other income was a decrease in fees on transaction accounts of $125,000 from $686,000 for the year ended September 30, 2005 to $561,000 for the year ended September 30, 2006 as we eliminated fees on certain products in an effort to compete in the market and increase our transaction accounts which are our lowest cost source of funding. Income from Bank Owned Life Insurance (BOLI) increased $20,000 for the year ended September 30, 2006 from $454,000 for the year ended September 30, 2005, to $474,000 for the year ended September 30, 2006. This increase was due to an adjustment in the rate of dividends earned on the BOLI investment.
Non-interest Expenses.Total non-interest expenses increased by $10.2 million, or 60.4%, from $16.8 million for the year ended September 30, 2005 to $27.0 million for the year ended September 30, 2006. The increase in non-interest expenses was primarily due to the occurrence of a $10.8 million loss on dishonored checks during the year ended September 30, 2006. This loss was from a check-kiting fraud perpetrated on the Bank. The Company is aggressively pursuing collection of the check-kiting loss from the customer, and there is also the possible recovery from insurance policies. The customer has filed for bankruptcy, and the recovery process is expected to require an extended period of time to resolve. Notwithstanding this loss, the Bank continues to satisfy all regulatory capital requirements and is “well capitalized” under applicable government regulations. This loss was partially offset by a decrease in salaries and related expenses of $477,000 from $9.2 million for the year ended September 30, 2005 to $8.7 million for the year ended September 30, 2006 as the Bank continued with its cost cutting strategies. Certain positions were eliminated allowing for the hiring of staff in the three new offices with a minimum increase in the overall workforce. Employee benefits were adjusted to be less costly while still offering competitive benefits. In December 2005, the Bank ceased its indirect automobile lending operations due to the current interest rate environment. The loan rates necessary to compete in this market made for marginal profitability. This allowed for less staffing in this area. Data processing cost decreased by $515,000 from $2.2 million for the year ended September 30, 2005 to $1.7 million for the year ended September 30, 2006. This decrease was due to the savings generated from the conversion of data processors. In November 2005 the Company entered into a long-term contract with Fiserv to be its data service provider. The Company anticipates net savings over the life of the contract of approximately $2.8 million. The actual number could be more or less depending on the activity and the number of accounts serviced. Occupancy expense increased by $180,000, from $2.0 million for the year ended September 30, 2005 to $2.1 million for the year ended September 30, 2006. This was mainly due to the opening of three offices and normal increases in rent and electricity. Advertising expense decreased by $30,000 or 4.7%, from $642,000 for the year ended September 30, 2005 to $612,000 for the year ended September 30, 2006. This decrease was due to a reduction in advertising during the period.
Income Taxes. The Company’s income tax (benefit) expense was $(4.0) million and $111,000 for the year ended September 30, 2006 and 2005, respectively. The Company’s effective tax rate decreased for the year ended September 30, 2006 as compared to the same quarter in the prior year due to the tax benefit from the loss on dishonored checks.
Liquidity and Capital Resources
The Company has no business other than that of the Bank and investing the net stock issuance proceeds retained by it. The Bank is subject to certain regulatory limitations with respect to the payment of dividends to the Company.
At September 30, 2007, the Bank exceeded all regulatory minimum capital requirements. For information regarding the Bank’s retained earnings as reported in its financial statements at September 30, 2007 to its tangible, core and risk-based capital levels and a comparison of regulatory requirements, see Note 14 of Notes to Consolidated Financial Statements.
The Company’s primary sources of funds are deposits and proceeds from maturing investment securities and mortgage-backed securities and principal and interest payments on loans. While maturities and scheduled amortization of mortgage-backed securities and loans are a predictable source of funds, deposit flows and mortgage prepayments are greatly influenced by general interest rates, economic conditions, competition and other factors.
55
The primary investing activities of the Company are the origination of loans and the purchase of investment securities and mortgage-backed securities. During the years ended September 30, 2007, 2006, and 2005, the Bank had $92.0 million, $149.1 million and $193.9 million respectively, of loan originations. During the years ended September 30, 2007, 2006 and 2005, the Company purchased investment securities in the amounts of $802,000, $4.7 million, and $11.5 million respectively, and mortgage-backed securities in the amounts of $84.8 million, $6.7 million, and $15.9 million respectively. The primary financing activity of the Company is the attraction of savings deposits.
The Company has other sources of liquidity if there is a need for funds. The Bank has the ability to obtain advances from the FHLB of Atlanta. In addition, the Company maintains a portion of its investments in interest-bearing deposits at other financial institutions that will be available, if needed. Management seeks to maintain a relatively high level of liquidity in order to retain flexibility in terms of investment opportunities and deposit pricing. Because liquid assets generally provide for lower rates of return, the Bank’s relatively high liquidity will, to a certain extent, result in lower rates of return on assets.
The Company’s most liquid assets are cash, interest-bearing deposits in other banks and federal funds sold, which are short-term, highly liquid investments with original maturities of less than three months that are readily convertible to known amounts of cash. The levels of these assets are dependent on the Company’s operating, financing and investing activities during any given period. At September 30, 2007, cash, interest-bearing deposits in other banks and federal funds sold totaled $9.5 million, $17.1 million and $49.4 million , respectively.
The Company anticipates that it will have sufficient funds available to meet its current commitments. Certificates of deposit which are scheduled to mature in less than one year at September 30, 2007 totaled $256.5 million. Based on past experience, management believes that a significant portion of such deposits will remain with the Bank. The Bank is a party to financial instruments with off-balance-sheet risk made in the normal course of business to meet the financing needs of its customers. These financial instruments are standby letters of credit, lines of credit and commitments to fund mortgage loans and involve to varying degrees elements of credit risk in excess of the amount recognized in the statement of financial position. The contract amounts of those instruments express the extent of involvement the Bank has in this class of financial instruments and represents the Bank’s exposure to credit loss from nonperformance by the other party. The Bank generally requires collateral or other security to support financial instruments with off-balance-sheet credit risk. At September 30, 2007, the Bank had commitments under standby letters of credit, lines of credit and commitments to originate mortgage loans of $1.0 million, $29.9 million and $8.8 million, respectively. See Note 3 of Notes to Consolidated Financial Statements.
The Company announced a stock repurchase program on February��14, 2002. The company repurchased 420 shares at an aggregate cost of $6,000, 371 shares at an aggregate cost of $5,200 and 184 shares at an aggregate cost of $2,100 during the years ended September 30, 2004, 2005 and 2006 respectively. During the year ended September 30, 2007 the Company did not repurchase any stock.
In June, 2002, the Company issued $12,887,000 of junior subordinated debentures (the debentures) to BCSB Bankcorp Capital Trust I (the Trust), a Delaware business trust, in which the Company owns all of the common equity. The debentures carry a rate of 3.65% over the three month LIBOR rate and resets quarterly. The rate was 9.01% and 9.16% at September 30, 2007 and 2006 respectively.
The debentures are the sole asset of BCSB Bankcorp Capital Trust I. BCSB Bankcorp Capital Trust I issued $12,500,000 of mandatory redeemable preferred securities to investors. The Company’s obligation under the debentures and related documents, taken together, constitute a full and unconditional guarantee by the Company of BCSB Bankcorp Capital Trust I obligations under the preferred securities. The preferred securities are redeemable by the Company on or after June 30, 2007 or under certain conditions in whole but not in part at any time at a redemption price equal to 103% of the principal amount plus any accrued interest.
In September, 2003, the Company issued $10,310,000 of junior subordinated debentures (the debentures) to BCSB Bankcorp Capital Trust II (the Trust), a Delaware business trust, in which the Company owns all of the common equity. The debentures carry a rate of 3.00% over the three month LIBOR rate, and resets quarterly, the rate was 8.65% and 8.51% at September 30, 2007 and
56
2006 respectively. The debentures are the sole asset of BCSB Bankcorp Capital Trust II. BCSB Bankcorp Capital Trust II issued $10,000,000 of mandatory redeemable preferred securities to investors. The Company’s obligation under the debentures and related documents, taken together, constitute a full and unconditional guarantee by the Company of BCSB Bankcorp Capital Trust II obligations under the Preferred securities. The Preferred securities are redeemable by the Company on or after October 7, 2008 or under certain conditions in whole but not in part at any time at a redemption price equal to 103% of the principal amount plus any accrued interest.
Pursuant to these Trust Preferred securities, the Company makes quarterly payments of principal and interest, which totaled $517,000 during the quarter ended September 30, 2007.
At September 30, 2007, the Company had cash and other liquid assets totaling $3.1 million at the holding company level. Assuming that interests rates remain stable and there are no other changes in the Company’s ongoing holding company level expenses, management estimates that, absent cash dividends from the Bank, the Company would deplete its liquid assets by March 2009. The Company would deplete its liquid assets even sooner should LIBOR increase, thereby increasing the interest rate on the Company’s trust preferred securities obligations. In order to conserve liquid assets at the holding company level, at its November 29, 2006 meeting, the Board of Directors voted to suspend the Company’s cash dividend payments to its stockholders and agreed with the OTS not to make further dividend payments without prior OTS approval. Nevertheless, if the Bank is unable to generate earnings to support future dividend payments to the Company, or if the Bank is otherwise limited in its ability to pay dividends to the Company, in amounts sufficient to meet the Company’s debt service obligations, and the Company is unable to raise capital, the Company could at some point in the future default on its trust preferred securities obligations. In such event, the holders of the trust preferred securities could require immediate redemption of such securities, which could cause the Company to suffer a significant decline in capital.
Shortly after the November 29, 2006 Board of Directors meeting, the Company announced that it has determined to suspend its dividend program and has agreed with its primary regulator, the Office of Thrift Supervision, that it will not issue a dividend to its stockholders going forward without the regulator’s consent as the Company seeks to implement its business plan to improve earnings, capital position and liquidity.
Commitments, Contingencies and Off-Balance Sheet Arrangements
The Company is a party to financial instruments with off-balance sheet risk including commitments to extend credit under existing lines of credit and commitments to sell loans. These instruments involve, to varying degrees, elements of credit and interest rate risk in excess of the amount recognized in the consolidated balance sheets.
Off-balance sheet financial instruments whose contract amounts represent credit and interest rate risk are summarized as follows:
| | | | | | |
| | | September 30, |
| | | 2007 | | 2006 |
| | | (Dollars in Thousands) |
Commitments to originate new loans | | $ | 8,835 | | $ | 7,205 |
Unfunded commitments to extend credit under existing equity line and commercial lines of credit | | | 29,942 | | | 30,485 |
Commercial letters of credit | | | 1,010 | | | 754 |
Commitments to originate new loans or to extend credit are agreements to lend to a customer as long as there is no violation of any condition established in the contract. Loan commitments generally expire within 30 to 45 days. Most equity line commitments for the unfunded portion of equity lines are for a term of 20 years, and commercial lines of credit are generally renewable on an annual basis. Commitments generally have fixed expiration dates or other termination clauses and may require payment of a fee. Since many of the commitments are expected to expire without being drawn upon, the total commitment amounts do not necessarily represent future cash requirements. The Company evaluates each customer’s creditworthiness on a case-by-case basis. The amount of collateral obtained, if deemed necessary by the Company upon extension of credit, is based on management’s credit evaluation of the borrower.
57
Contractual Obligations
The following table sets forth the Company’s contractual obligations as of September 30, 2007.
| | | | | | | | | | | | | | | |
| | | Payments Due By Period |
| | | (Dollars in Thousands) |
| | | Less than
1 Year | | 1 – 3 Years | | 4 – 5 Years | | Over 5 Years | | Total |
Time Deposits | | $ | 256,558 | | $ | 132,347 | | $ | 4,199 | | $ | — | | $ | 393,104 |
Long-term borrowings | | | 10,000 | | | 10,000 | | | — | | | — | | | 20,000 |
Junior Subordinated Debenture | | | — | | | — | | | — | | | 23,197 | | | 23,197 |
Lease Obligations | | | 1,118 | | | 1,916 | | | 1,680 | | | 7,882 | | | 12,596 |
| | | | | | | | | | | | | | | |
Total Contractual Cash Obligations | | $ | 267,676 | | $ | 144,263 | | $ | 5,879 | | $ | 31,079 | | $ | 448,897 |
| | | | | | | | | | | | | | | |
Impact of Inflation and Changing Prices
The Consolidated Financial Statements and Notes thereto presented herein have been prepared in accordance with accounting principles generally accepted in the United States of America, which require the measurement of financial position and operating results in terms of historical dollars without considering the change in the relative purchasing power of money over time and due to inflation. The impact of inflation is reflected in the increased cost of the Company’s operations. Unlike most industrial companies, nearly all the assets and liabilities of the Company are monetary in nature. As a result, interest rates have a greater impact on the Company’s performance than do the effects of general levels of inflation. Interest rates do not necessarily move in the same direction or to the same extent as the price of goods and services.
Off-Balance Sheet Arrangements
As of the date of this Annual Report, the Company does not have any off-balance sheet arrangements that have or are reasonably likely to have a current or future effect on the Company’s financial condition, change in financial condition, revenues or expenses, results of operations, liquidity, capital expenditures or capital resources that are material to investors, except for the guarantees made by the Company with respect to the trust preferred securities issued by each of the Business Trust and the Statutory Trust, which are discussed in the “Liquidity and Capital Resources” subsection of this Annual Report and in footnote 9 to the audited financial statements. The term “off-balance sheet arrangement” generally means any transaction, agreement, or other contractual arrangement to which an entity unconsolidated with the Company is a party under which the Company has (i) any obligation arising under a guarantee contract, derivative instrument or variable interest; or (ii) a retained or contingent interest in assets transferred to such entity or similar arrangement that serves as credit, liquidity or market risk support for such assets. Additionally, the Bank does have commitments to originate loans in the ordinary course of business, as disclosed herein.
Impact of New Accounting Standards
In February 2006, The FASB issued SFAS No. 155, “Accounting for Certain Hybrid Financial Instruments—an amendment of FASB Statements No. 133 and 140.” This statement amends Statements No. 133 and 140 by: permitting fair value remeasurement for any hybrid financial instrument that contains an embedded derivative that otherwise would require bifurcation; clarifying which interest-only strips and principal-only strips are not subject to the requirements of Statement No. 133; establishing a requirement to evaluate interests in securitized financial assets to identify interests that are freestanding derivatives or that are hybrid financial instruments that contain an embedded derivative requiring bifurcation; clarifying that concentrations of credit risk in the form of subordination are not embedded derivatives; and amending Statement No. 140 to eliminate the prohibition on a qualifying special-purpose entity from holding a derivative financial instrument that pertains to a beneficial interest other than another derivative financial instrument. The statement became effective for fiscal years beginning after September 15, 2006. The adoption of this standard is not anticipated to have a material impact on the financial condition, results of operations or liquidity.
In March 2006, the FASB issued SFAS No. 156, “Accounting for Servicing of Financial Assets—an amendment of FASB Statement No. 140.” This statement amends Statement No. 140 with respect to the accounting for separately recognized servicing
58
assets and servicing liabilities. It requires an entity to recognize a servicing asset or servicing liability each time an obligation is undertaken to service a financial asset by entering into a servicing contract in certain situations and requires all separately recognized servicing assets and liabilities to be initially measured at fair value, if practicable. The statement permits the choice between the “amortization method” and the “fair value measurement method” for the subsequent measurement of the servicing assets or liabilities and allows for a one-time reclassification of available-for-sale securities to trading securities at initial adoption. The statement also requires separate presentation of servicing assets and servicing liabilities subsequently measured at fair value in the statement of financial position and additional disclosures for all separately recognized servicing assets and servicing liabilities. The statement became effective for fiscal years beginning after September 30, 2006. The adoption of this standard is not anticipated to have a material impact on our financial condition, results of operations or liquidity.
In July 2006, the FASB issued FASB Interpretation No. 48 (FIN 48), “Accounting for Uncertainty in Income Taxes—an interpretation of FASB Statement 109,” which provides guidance on the measurement, recognition, and disclosure of tax positions taken or expected to be taken in a tax return. The interpretation also provides guidance on derecognition, classification, interest and penalties, and disclosure. FIN 48 prescribes that a tax position should only be recognized if it is more-likely-than-not that the position will be sustained upon examination by the appropriate taxing authority. A tax position that meets this threshold is measured as the largest amount of benefit that is greater than 50 percent likely of being realized upon ultimate settlement. The cumulative effect of applying FIN 48 is to be reported as an adjustment to the beginning balance of retained earnings in the period of adoption. FIN 48 is effective for the Company on October 1, 2007. The adoption of this standard is not expected to have a material impact on our financial condition, results of operations or liquidity.
In September 2006, the FASB ratified the consensus reached by the EITF on Issue No. 06-4, “Accounting for Deferred Compensation and Postretirement Benefit Aspects of Endorsement Split-Dollar Life Insurance Arrangements.” EITF 06-4 requires the recognition of a liability and related compensation costs for endorsement split-dollar life insurance policies that provide a benefit to an employee that extends to postretirement periods as defined in SFAS No. 106, “Employers’ Accounting for Postretirement Benefits Other Than Pensions.” The EITF reached a consensus that Bank Owned Life Insurance policies purchased for this purpose do not effectively settle the entity’s obligation to the employee in this regard and thus the entity must record compensation cost and a related liability. Entities should recognize the effects of applying this Issue through either, (a) a change in accounting principle through a cumulative-effect adjustment to retained earnings or to other components of equity or net assets in the balance sheet as of the beginning of the year of adoption, or (b) a change in accounting principle through retrospective application to all prior periods. Management is currently evaluating the impact of adopting this Issue on the Company’s financial statements. This Issue is effective for fiscal years beginning after December 15, 2007.
In September 2006, the FASB issued SFAS No. 157, “Fair Value Measurements.” SFAS 157 establishes a framework for measuring fair value in generally accepted accounting principles (“GAAP”), and expands disclosures about fair value measurements. While the Statement applies under other accounting pronouncements that require or permit fair value measurements, it does not require any new fair value measurements. SFAS No. 157 defines fair value as the price that would be received to sell an asset or paid to transfer a liability (an exit price) in an orderly transaction between market participants at the measurement date. In addition, the Statement establishes a fair value hierarchy, which prioritizes the inputs to valuation techniques used to measure fair value into three broad levels. Lastly, SFAS No. 157 requires additional disclosures for each interim and annual period separately for each major category of assets and liabilities. The Statement is effective for financial statements issued for fiscal years beginning after November 15, 2007 for financial assets and liabilities and November 15, 2008 for non-financial assets and liabilities, and interim periods within those fiscal years. Management does not expect the adoption of this Statement to have a material impact on the Company’s consolidated financial statements.
In February 2007, the FASB issued SFAS No. 159, “The Fair Value for Financial Assets and Financial Liabilities-Including an amendment to FAS No. 115”. This statement option permits entities to choose to measure many financial instruments and certain other items at fair value. This objective is to improve financial reporting by providing entities with the opportunity to mitigate volatility in reported earnings caused by measuring related assets and liabilities differently without having to apply complex hedge accounting provisions. This Statement is expected to expand the use of fair value measurement, which is consistent with FASB’s long-term measurement objectives for accounting for financial instruments. This Statement is effective for financial statements issued for fiscal years beginning after November 15, 2007. Early adoption is permitted as of the beginning of the fiscal year that begins on or before November 15, 2007, provided the entity also elects to apply the provisions of FAS No. 157, “Fair Value Measurements.” The Company is evaluating the effects of this statement on its financial statements and has not made a decision on the possible early adoption option.
59
Item 7A. Quantitative and Qualitative Disclosures About Market Risk
The information contained under the section captioned “Market Risk” in this Annual Report on Form 10-K is incorporated herein by reference.
Item 8. Financial Statements and Supplementary Data
The Information required by this item is included herein beginning on page F-1.
Item 9. Changes in and Disagreements With Accountants on Accounting and Financial Disclosure
Not applicable.
Item 9A. Controls and Procedures
As of the end of the period covered by this report, management of the Company carried out an evaluation, under the supervision and with the participation of the Company’s then acting principal executive officer and principal financial officer, of the effectiveness of the Company’s disclosure controls and procedures. Based on this evaluation, the Company’s principal executive officer and principal financial officer concluded that the Company’s disclosure controls and procedures are effective in ensuring that information required to be disclosed by the Company in reports that it files or submits under the Securities Exchange Act of 1934, as amended, is recorded, processed, summarized and reported, within the time periods specified in the Securities and Exchange Commission’s rules and forms.
There have been no changes in the Company’s internal control over financial reporting identified in connection with the evaluation required by paragraph (d) of Securities and Exchange Commission Rule 13a-15 that occurred during the Company’s last fiscal quarter, that has materially affected, or is reasonably likely to materially affect, the Company’s internal control over financial reporting.
Item 9B. Other Information
None.
PART III
Item 10. Directors and Executive Officers of the Registrant
The information contained under the sections captioned “Proposal IV—Election of Directors” and “Section 16(a) Beneficial Ownership Reporting Compliance” in the Company’s definitive proxy statement for the Company’s 2008 Annual Meeting of Stockholders (the “Proxy Statement”) is incorporated herein by reference.
The Company and its subsidiaries have adopted a code of ethics which applies to all of their directors, officers and employees and thus applies to the Company’s principal executive officer, principal financial officer and principal accounting officer. The code of ethics is incorporated herein by reference in Exhibit 14 to this Annual Report on Form 10-K.
For information regarding the audit committee and its composition and the audit committee financial expert, the sections captioned “Meetings and Committees of the Board of Directors – Audit Committee” in the Proxy Statement are incorporated herein by reference.
60
Item 11. Executive Compensation
The information contained under the sections captioned “Proposal IV—Election of Directors—Executive Compensation,” “—Director Compensation,” “—Compensation Committee Report on Executive Compensation,” “Compensation Committee Interlocks and Insider Participation,” and “—Comparative Stock Performance Graph” in the Proxy Statement is incorporated herein by reference.
Item 12. Security Ownership of Certain Beneficial Owners and Management and Related Stockholder Matters
| | |
(a) and (b) | | Security Ownership of Certain Beneficial Owners and Security Ownership of Management. |
| |
| | Information required by this item is incorporated herein by reference to the section captioned “Voting Securities and Security Ownership” in the Proxy Statement. |
| |
(c) | | Changes in Control. |
| |
| | Management of the Company knows of no arrangements, including any pledge by any person of securities of the Company, the operation of which may at a subsequent date result in a change in control of the registrant. |
| |
| (d) | | Equity Compensation Plans. |
The following table sets forth certain information with respect to the Company’s equity compensation plans as of September 30, 2007.
| | | | | | | |
| | | (a) Number of securities to be
issued upon exercise of
outstanding options, warrants and rights | | (b) Weighted-average exercise price of outstanding options, warrants and rights | | (c) Number of securities remaining available for future issuance under equity compensation plans (excluding securities reflected in column (a)) |
Equity compensation plans approved by security holders | | 121,500 | | $ | 11.16 | | 51,024 |
Equity compensation plans not approved by security holders | | 121,500 | | $ | 11.16 | | 51,024 |
Total | | | | | | | |
Item 13. Certain Relationships and Related Transactions
The information required by this item is incorporated herein by reference to the section captioned “Proposal IV—Election of Directors—Transactions with Management” in the Proxy Statement.
Item 14. Principal Accountant Fees and Services
The information contained under the section captioned “Audit and Other Fees Paid to Independent Accountant” in the Proxy Statement is hereby incorporated by reference.
61
PART IV
Item 15. Exhibits and Financial Statement Schedules
(a)List of Documents Filed as Part of this Report
(1)Financial Statements. The following consolidated financial statements of BCSB Bankcorp, Inc. are incorporated by reference from Item 8 hereof (see Exhibit 13):
Report of Independent Registered Public Accounting Firm
Consolidated Statements of Financial Condition as of September 30, 2007 and 2006
Consolidated Statements of Operations for the Years Ended September 30, 2007, 2006 and 2005
Consolidated Statements of Stockholders’ Equity for the Years Ended September 30, 2007, 2006 and 2005
Consolidated Statements of Cash Flows for the Years Ended September 30, 2007, 2006 and 2005
Notes to Consolidated Financial Statements
(b)Exhibits. The following is a list of exhibits filed as part of this Annual Report on Form 10-K and is also the Exhibit Index.
| | |
| No. | | Description |
| 1.2 | | Agency Agreement |
| |
| 3.1 | | Articles of Incorporation of BCSB Bancorp, Inc. (1) |
| |
| 3.2 | | Bylaws of BCSB Bancorp, Inc. (1) |
| |
| 4.1 | | Form of Common Stock Certificate of BCSB Bancorp, Inc. (1) |
| |
| 10.1 | | Employment Agreement by and between Baltimore County Savings Bank, F. S. B. and Joseph J. Bouffard † (1) |
| |
| 10.2 | | Change in Control Severance Agreement by and between Baltimore County Savings Bank, F.S.B. and Bonnie M. Klein † (1) |
| |
| 10.3 | | Change in Control Severance Agreement by and between Baltimore County Savings Bank, F.S.B. and David M. Meadows † (1) |
| |
| 10.4 | | Baltimore County Savings Bank, F.S.B. Amended and Restated Deferred Compensation Plan † (1) |
| |
| 10.5 | | BCSB Bankcorp, Inc. Management Recognition Plan and Trust † (1) |
| |
| 10.6 | | BCSB Bankcorp, Inc. 1999 Stock Option Plan † (1) |
| |
| 10.7 | | Supplemental Executive Retirement Agreement by Baltimore County Savings Bank, F.S.B. and Bonnie M. Klein † (1) |
| |
| 10.8 | | Supplemental Executive Retirement Agreement by Baltimore County Savings Bank, F.S.B and David M. Meadows † (1) |
| |
| 10.9 | | Baltimore County Savings Bank, F.S.B. Incentive Compensation Plan † (2) |
| |
| 10.10 | | Baltimore County Savings Bank, F.S.B. Cash Deferred Compensation Plan † (2) |
| |
| 10.11 | | Change in Control Severance Agreement between Baltimore County Savings Bank, F.S.B., BCSB Bankcorp, Inc. and Anthony Cole † (2) |
| |
| 10.12 | | Change in Control Severance Agreement between Baltimore County Savings Bank, F.S.B. and Daniel R. Werneke † (2) |
| |
| 31.1 | | Rule 13a-14(a) Certification of President |
| |
| 31.2 | | Rule 13a-14(a) Certification of Chief Financial Officer |
| |
| 32 | | Section 1350 Certifications |
| |
| 99.1 | | Supervisory Agreement (3) |
62
| † | Management contract or compensatory agreement or arrangement. |
| (1) | Incorporated herein by reference from BCSB Bancorp, Inc.’s Registration Statement on Form S-1 (File No. 333-141572). |
| (2) | Incorporated herein by reference from BCSB Bankcorp, Inc.’s Annual Report on Form 10-K for the year ended September 30, 2007 (File No. 0-24589). |
| (3) | Incorporated herein by reference from BCSB Bankcorp, Inc.’s Current Report on Form 8-K filed on December 14, 2005 (File No. 0-24589). |
(c)Financial Statement Schedules. All schedules for which provision is made in the applicable accounting regulations of the Securities and Exchange Commission are omitted because of the absence of conditions under which they are required or because the required information is included in the consolidated financial statements and related notes thereto.
63
Index to Consolidated Financial Statements of BCSB Bankcorp, Inc.
| | |
| | | Page |
Report of Independent Registered Public Accounting Firm | | F-1 |
| |
Consolidated Statements of Condition as of September 30, 2007 and 2006 | | F-2 |
| |
Consolidated Statements of Operations for the Years Ended September 30, 2007, 2006 and 2005 | | F-3 |
| |
Consolidated Statements of Stockholders’ Equity for the Years Ended September 30, 2007, 2006 and 2005 | | F-4 |
| |
Consolidated Statements of Cash Flows for the Years Ended September 30, 2007, 2006 and 2005 | | F-5 |
| |
Notes to Consolidated Financial Statements | | F-7 |

REPORT OF INDEPENDENT REGISTERED PUBLIC ACCOUNTING FIRM
To the Stockholders and Board of Directors
BCSB Bankcorp, Inc.
Baltimore, Maryland
We have audited the consolidated statements of financial condition of BCSB Bankcorp, Inc. and Subsidiaries (‘the Company”) as of September 30, 2007 and 2006 and the related consolidated statements of operations, stockholders’ equity and cash flows for each of the three years in the period ended September 30, 2007. These consolidated financial statements are the responsibility of the Company’s management. Our responsibility is to express an opinion on these consolidated financial statements based on our audits.
We conducted our audits in accordance with the standards of the Public Company Accounting Oversight Board (United States). Those standards require that we plan and perform the audit to obtain reasonable assurance about whether the consolidated financial statements are free of material misstatement. The Company is not required to have, nor were we engaged to perform, an audit of its internal control over financial reporting. Our audit included consideration of internal control over financial reporting as a basis for designing audit procedures that are appropriate in the circumstances, but not for the purpose of expressing an opinion on the effectiveness of the Company’s internal control over financial reporting. Accordingly, we express no such opinion. An audit also includes examining, on a test basis, evidence supporting the amounts and disclosures in the consolidated financial statements, assessing the accounting principles used and significant estimates made by management, as well as evaluating the overall consolidated financial statement presentation. We believe that our audits provide a reasonable basis for our opinion.
In our opinion, the consolidated financial statements referred to above present fairly, in all material respects, the financial position of the Company as of September 30, 2007 and 2006 and the consolidated results of their operations and their cash flows for each of the three years in the period ended September 30, 2007, in conformity with accounting principles generally accepted in the United States of America.
|
/s/ Stegman & Company |
|
Baltimore, Maryland |
December 18, 2007 |
F-1
BCSB BANKCORP, INC.
AND SUBSIDIARIES
Baltimore, Maryland
CONSOLIDATED STATEMENTS OF FINANCIAL CONDITION
| | | | | | | | |
| | | September 30, | |
| | | 2007 | | | 2006 | |
| | | (dollars in thousands except per share data) | |
| Assets | | | | | | | | |
Cash | | $ | 9,468 | | | $ | 8,421 | |
Interest bearing deposits in other banks | | | 17,121 | | | | 2,854 | |
Federal funds sold | | | 49,427 | | | | 462 | |
| | | | | | | | |
Cash and Cash Equivalents | | | 76,016 | | | | 11,737 | |
| | |
Interest bearing time deposits | | | 100 | | | | 100 | |
Investment securities, available for sale | | | 3,970 | | | | 143,068 | |
Investment securities, held to maturity (fair value approximates $4,488 in 2006) | | | — | | | | 4,496 | |
Loans receivable, net of allowances of ($2,650) and ($2,679) | | | 416,302 | | | | 463,776 | |
Mortgage backed securities, available for sale | | | 104,999 | | | | 86,801 | |
Mortgage backed securities, held to maturity (fair value approximates $28,356 in 2006) | | | — | | | | 28,675 | |
Foreclosed real estate | | | 94 | | | | 94 | |
Premises and equipment, net | | | 10,454 | | | | 11,225 | |
Federal Home Loan Bank of Atlanta stock, at cost | | | 2,270 | | | | 6,972 | |
Bank Owned Life Insurance | | | 13,847 | | | | 13,218 | |
Goodwill and other intangible assets | | | 2,477 | | | | 2,536 | |
Accrued interest and other assets | | | 11,852 | | | | 13,159 | |
| | | | | | | | |
Total assets | | $ | 642,381 | | | $ | 785,857 | |
| | | | | | | | |
| Liabilities and Stockholders’ Equity | | | | | | | | |
Liabilities | | | | | | | | |
Deposits: | | | | | | | | |
Non-Interest bearing | | $ | 30,880 | | | $ | 23,406 | |
Interest-bearing | | | 527,577 | | | | 581,439 | |
| | | | | | | | |
Total deposits | | | 558,457 | | | | 604,845 | |
Federal Home Loan Bank of Atlanta advances short-term | | | 10,000 | | | | 40,000 | |
Federal Home Loan Bank of Atlanta advances long-term | | | 10,000 | | | | 78,473 | |
Junior Subordinated Debentures | | | 23,197 | | | | 23,197 | |
Other liabilities | | | 6,135 | | | | 5,921 | |
| | | | | | | | |
Total liabilities | | | 607,789 | | | | 752,436 | |
| | | | | | | | |
Commitments and contingencies (Notes 3, 5, 7, 8, 9, 10, 11, 12 and 13) | | | | | | | | |
| | |
Stockholders’ Equity | | | | | | | | |
Common stock (par value $.01 – 13,500,000 authorized, 5,929,743 and 5,913,743 shares issued and outstanding at September 30, 2007 and 2006, respectively) | | | 59 | | | | 59 | |
Additional paid-in capital | | | 21,620 | | | | 21,390 | |
Obligation under Rabbi Trust | | | 1,146 | | | | 1,246 | |
Retained earnings | | | 13,590 | | | | 16,511 | |
Accumulated other comprehensive (loss) | | | (682 | ) | | | (4,354 | ) |
Employee Stock Ownership Plan | | | (44 | ) | | | (227 | ) |
Stock held by Rabbi Trust | | | (1,097 | ) | | | (1,204 | ) |
| | | | | | | | |
Total stockholders’ equity | | | 34,592 | | | | 33,421 | |
| | | | | | | | |
Total liabilities and stockholders’ equity | | $ | 642,381 | | | $ | 785,857 | |
| | | | | | | | |
The accompanying notes to consolidated financial statements are an integral part of these statements.
F-2
BCSB BANKCORP, INC.
AND SUBSIDIARIES
Baltimore, Maryland
CONSOLIDATED STATEMENTS OF OPERATIONS
| | | | | | | | | | | | |
| | | For Years Ended September 30, | |
| | | 2007 | | | 2006 | | | 2005 | |
| | | (dollars in thousands except per share data) | |
Interest and fees on loans | | $ | 28,578 | | | $ | 28,352 | | | $ | 24,286 | |
Interest on mortgage backed securities | | | 4,938 | | | | 5,095 | | | | 6,231 | |
Interest and dividends on investment securities | | | 3,303 | | | | 6,342 | | | | 5,637 | |
Other interest income | | | 2,293 | | | | 206 | | | | 69 | |
| | | | | | | | | | | | |
Total interest income | | | 39,112 | | | | 39,995 | | | | 36,223 | |
| | | | | | | | | | | | |
Interest on deposits | | | 20,405 | | | | 18,379 | | | | 14,711 | |
Interest on borrowings – short term | | | 1,082 | | | | 2,484 | | | | 1,471 | |
Interest on borrowings – long term | | | 1,975 | | | | 2,992 | | | | 2,738 | |
Other interest expense | | | 2,055 | | | | 1,921 | | | | 1,464 | |
| | | | | | | | | | | | |
Total interest expense | | | 25,517 | | | | 25,776 | | | | 20,384 | |
| | | | | | | | | | | | |
Net interest income | | | 13,595 | | | | 14,219 | | | | 15,839 | |
Provision for losses on loans | | | 117 | | | | 194 | | | | 453 | |
| | | | | | | | | | | | |
Net interest income after provision for losses on loans | | | 13,478 | | | | 14,025 | | | | 15,386 | |
| | | | | | | | | | | | |
Other Income | | | | | | | | | | | | |
Loss on repossessed assets | | | (3 | ) | | | (24 | ) | | | (276 | ) |
Mortgage Banking Operations | | | 25 | | | | 33 | | | | 1 | |
Fees on transaction accounts | | | 699 | | | | 561 | | | | 686 | |
(Loss) gain from sale of investments and mortgage backed securities | | | (5,865 | ) | | | 5 | | | | 884 | |
Loss on sale of loans held for sale | | | (1,207 | ) | | | — | | | | — | |
Income from Bank Owned Life Insurance | | | 571 | | | | 474 | | | | 454 | |
Miscellaneous income | | | 445 | | | | 452 | | | | 391 | |
| | | | | | | | | | | | |
Total other income | | | (5,335 | ) | | | 1,501 | | | | 2,140 | |
| | | | | | | | | | | | |
Non-Interest Expenses | | | | | | | | | | | | |
Salaries and related expense | | | 8,143 | | | | 8,673 | | | | 9,150 | |
Occupancy expense | | | 2,241 | | | | 2,141 | | | | 1,961 | |
Data processing expense | | | 1,469 | | | | 1,680 | | | | 2,195 | |
Federal deposit insurance premiums | | | 508 | | | | 248 | | | | 247 | |
Property and equipment expense | | | 1,189 | | | | 1,301 | | | | 1,151 | |
Professional fees | | | 603 | | | | 490 | | | | 228 | |
Advertising | | | 517 | | | | 612 | | | | 642 | |
Telephone, postage and office supplies | | | 383 | | | | 437 | | | | 579 | |
(Recovery) loss on dishonored checks | | | (3,055 | ) | | | 10,752 | | | | — | |
Debt retirement expense | | | 17 | | | | — | | | | — | |
Other expenses | | | 794 | | | | 634 | | | | 661 | |
| | | | | | | | | | | | |
Total non-interest expenses | | | 12,809 | | | | 26,968 | | | | 16,814 | |
| | | | | | | | | | | | |
(Loss) income before tax (benefit) expense | | | (4,666 | ) | | | (11,442 | ) | | | 712 | |
Income tax (benefit) expense | | | (1,745 | ) | | | (4,049 | ) | | | 111 | |
| | | | | | | | | | | | |
Net (loss) income | | $ | (2,921 | ) | | $ | (7,393 | ) | | $ | 601 | |
| | | | | | | | | | | | |
Net (loss) income Per Share of Common Stock : | | | | | | | | | | | | |
Basic | | $ | (.50 | ) | | $ | (1.26 | ) | | $ | 0.10 | |
| | | | | | | | | | | | |
Diluted | | $ | (.50 | ) | | $ | (1.26 | ) | | $ | 0.10 | |
| | | | | | | | | | | | |
Dividends per share | | $ | 0.00 | | | $ | 0.50 | | | $ | 0.50 | |
| | | | | | | | | | | | |
The accompanying notes to consolidated financial statements are an integral part of these statements.
F-3
BCSB BANKCORP, INC.
AND SUBSIDIARIES
Baltimore, Maryland
CONSOLIDATED STATEMENTS OF STOCKHOLDERS’ EQUITY
FOR THE YEARS ENDED SEPTEMBER 30, 2007, 2006, AND 2005
| | | | | | | | | | | | | | | | | | | | | | | | | | | | | | | |
| | | Common
Stock | | Additional
Paid-In
Capital | | | Obligation
Under
Rabbi Trust | | | Retained
Earnings | | | Accumulated
Other
Comprehensive
Income (loss) | | | Employee
Stock
Ownership
Plan | | | Stock Held
By Rabbi
Trust | | | Total
Stockholders’
Equity | |
| | | (dollars in thousands except per share data) | |
Balance – September 30, 2004 | | $ | 59 | | $ | 20,969 | | | $ | 1,222 | | | $ | 25,407 | | | $ | (1,755 | ) | | $ | (593 | ) | | $ | (1,180 | ) | | $ | 44,129 | |
Compensation under stock based benefit plans | | | — | | | 168 | | | | — | | | | — | | | | — | | | | 183 | | | | — | | | | 351 | |
Exercised options | | | — | | | 115 | | | | — | | | | — | | | | — | | | | — | | | | — | | | | 115 | |
Rabbi Trust Liability | | | — | | | — | | | | 44 | | | | — | | | | — | | | | — | | | | (27 | ) | | | 17 | |
Distribution of stock for Rabbi Trust | | | — | | | — | | | | (28 | ) | | | — | | | | — | | | | — | | | | 28 | | | | — | |
Treasury stock purchased (371 shares) | | | — | | | (5 | ) | | | — | | | | — | | | | — | | | | — | | | | — | | | | (5 | ) |
Cash dividends declared ($.50 per share) | | | — | | | — | | | | | | | | (1,045 | ) | | | | | | | | | | | | | | | (1,045 | ) |
Comprehensive loss | | | | | | | | | | | | | | | | | | | | | | | | | | | | | | | |
Net income for the year ended September 30, 2005 | | | — | | | — | | | | — | | | | 601 | | | | — | | | | — | | | | — | | | | — | |
Net change in unrealized gains on investment securities and mortgage backed securities, net of tax of $1,325 | | | — | | | — | | | | — | | | | — | | | | (2,131 | ) | | | — | | | | — | | | | — | |
Reclassification adjustments for gains included in net income on available for sale securities, net of tax of $5 | | | — | | | — | | | | — | | | | — | | | | 8 | | | | — | | | | — | | | | — | |
Comprehensive loss | | | — | | | — | | | | — | | | | — | | | | — | | | | — | | | | — | | | | (1,522 | ) |
| | | | | | | | | | | | | | | | | | | | | | | | | | | | | | | |
Balance – September 30, 2005 | | | 59 | | | 21,247 | | | | 1,238 | | | | 24,963 | | | | (3,878 | ) | | | (410 | ) | | | (1,179 | ) | | | 42,040 | |
Compensation under stock based benefit plans | | | — | | | 130 | | | | — | | | | — | | | | — | | | | 183 | | | | — | | | | 313 | |
Exercised options | | | — | | | 15 | | | | — | | | | — | | | | — | | | | — | | | | — | | | | 15 | |
Rabbi Trust Liability | | | — | | | — | | | | 37 | | | | — | | | | — | | | | — | | | | | | | | 37 | |
Treasury stock purchased (184 shares) | | | — | | | (2 | ) | | | — | | | | — | | | | — | | | | — | | | | — | | | | (2 | ) |
Acquisition of stock for Rabbi Trust | | | — | | | — | | | | — | | | | — | | | | — | | | | — | | | | (54 | ) | | | (54 | ) |
Distribution of stock for Rabbi Trust | | | — | | | — | | | | (29 | ) | | | — | | | | — | | | | — | | | | 29 | | | | — | |
Cash dividends declared ($.50 per share) | | | — | | | — | | | | | | | | (1,059 | ) | | | | | | | | | | | | | | | (1,059 | ) |
Comprehensive loss | | | | | | | | | | | | | | | | | | | | | | | | | | | | | | | |
Net loss for the year ended September 30, 2006 | | | — | | | — | | | | — | | | | (7,393 | ) | | | — | | | | — | | | | — | | | | — | |
Net change in unrealized gains (loss) on investment securities and mortgage backed securities, net of tax of $1,393 | | | — | | | — | | | | — | | | | — | | | | (476 | ) | | | — | | | | — | | | | — | |
Comprehensive loss | | | — | | | — | | | | — | | | | — | | | | — | | | | — | | | | — | | | | (7,869 | ) |
| | | | | | | | | | | | | | | | | | | | | | | | | | | | | | | |
Balance- September 30, 2006 | | | 59 | | $ | 21,390 | | | $ | 1,246 | | | $ | 16,511 | | | $ | (4,354 | ) | | $ | (227 | ) | | $ | (1,204 | ) | | $ | 33,421 | |
Compensation under stock based benefit plans | | | — | | | 96 | | | | — | | | | — | | | | — | | | | 183 | | | | — | | | | 279 | |
Exercised options | | | — | | | 134 | | | | — | | | | — | | | | — | | | | — | | | | — | | | | 134 | |
Rabbi Trust Liability | | | — | | | — | | | | 18 | | | | — | | | | — | | | | — | | | | | | | | 18 | |
Acquisition of stock for Rabbi Trust | | | — | | | — | | | | — | | | | — | | | | — | | | | — | | | | (11 | ) | | | (11 | ) |
Distribution of stock for Rabbi Trust | | | — | | | — | | | | (118 | ) | | | — | | | | — | | | | — | | | | 118 | | | | — | |
Comprehensive income | | | | | | | | | | | | | | | | | | | | | | | | | | | | | | | |
Net loss for the year ended September 30, 2007 | | | — | | | — | | | | — | | | | (2,921 | ) | | | — | | | | — | | | | — | | | | — | |
Net change in unrealized gains on investment securities and mortgage backed securities, net of tax of $45 | | | — | | | — | | | | — | | | | — | | | | 73 | | | | — | | | | — | | | | — | |
Reclassification adjustments for gains included in net income on available for sale securities, net of tax of $2,265 | | | — | | | — | | | | — | | | | — | | | | 3,599 | | | | — | | | | — | | | | — | |
Comprehensive income | | | — | | | — | | | | — | | | | — | | | | — | | | | — | | | | — | | | | 751 | |
| | | | | | | | | | | | | | | | | | | | | | | | | | | | | | | |
Balance – September 30, 2007 | | $ | 59 | | $ | 21,620 | | | $ | 1,146 | | | $ | 13,590 | | | $ | (682 | ) | | $ | (44 | ) | | $ | (1,097 | ) | | $ | 34,592 | |
| | | | | | | | | | | | | | | | | | | | | | | | | | | | | | | |
The accompany notes to consolidated financial statements are an integral part of these statements.
F-4
BCSB BANKCORP, INC.
AND SUBSIDIARIES
Baltimore, Maryland
CONSOLIDATED STATEMENTS OF CASH FLOWS
| | | | | | | | | | | | |
| | | For Years Ended September 30, | |
| | | 2007 | | | 2006 | | | 2005 | |
| | | (dollars in thousands) | |
Operating Activities | | | | | | | | | | | | |
Net (loss) income | | $ | (2,921 | ) | | $ | (7,393 | ) | | $ | 601 | |
Adjustments to Reconcile Net (Loss) Income to Net Cash Provided (Used) by Operating Activities | | | | | | | | | | | | |
(Loss) gain on sale of investments and mortgage backed securities | | | 5,865 | | | | (5 | ) | | | (884 | ) |
Loss on loans sold | | | 1,207 | | | | — | | | | — | |
Amortization of deferred loan fees, net | | | (166 | ) | | | (173 | ) | | | (157 | ) |
Provision for losses on loans | | | 117 | | | | 194 | | | | 453 | |
Non-cash compensation under Stock-based Benefit Plan | | | 279 | | | | 313 | | | | 351 | |
Amortization of premiums and discounts, net | | | 221 | | | | 319 | | | | 122 | |
Provision for depreciation | | | 1,046 | | | | 1,052 | | | | 890 | |
Loss on sale of repossessed assets | | | 3 | | | | 24 | | | | 276 | |
Income from Bank Owned Life Insurance | | | (571 | ) | | | (474 | ) | | | (452 | ) |
Increase in accrued interest and other assets | | | (1,002 | ) | | | (4,153 | ) | | | (52 | ) |
Increase (decrease) in other liabilities | | | 533 | | | | 1,652 | | | | (444 | ) |
Increase in obligation under Rabbi Trust | | | 18 | | | | 38 | | | | 44 | |
| | | | | | | | | | | | |
Net cash provided (used) by operating activities | | | 4,629 | | | | (8,606 | ) | | | 748 | |
| | | | | | | | | | | | |
Cash Flows from Investing Activities | | | | | | | | | | | | |
Purchase of Bank Owned Life Insurance | | | (57 | ) | | | (78 | ) | | | (303 | ) |
Purchase of investment securities – available for sale | | | (802 | ) | | | (1,707 | ) | | | (11,491 | ) |
Proceeds from maturities of investment securities – available for sale | | | 15,000 | | | | 4,500 | | | | 2,000 | |
Proceeds from sale of investment securities – available for sale | | | 126,480 | | | | 5,405 | | | | 15,536 | |
Purchases of investment securities – held to maturity | | | — | | | | (3,000 | ) | | | — | |
Proceeds from maturities of investment securities – held to maturity | | | 3,500 | | | | 500 | | | | 500 | |
Proceeds from loans sold | | | 45,231 | | | | — | | | | — | |
Net decrease (increase) in loans | | | 641 | | | | (10,090 | ) | | | (69,217 | ) |
Purchase of mortgage backed securities – available for sale | | | (84,867 | ) | | | — | | | | (10,616 | ) |
Principal collected on mortgage backed securities | | | 16,637 | | | | 28,918 | | | | 38,508 | |
Proceeds from sale of mortgage backed securities- available for sale | | | 77,771 | | | | — | | | | 8,351 | |
Purchase of mortgage backed securities – held to maturity | | | — | | | | (6,704 | ) | | | (5,271 | ) |
Proceeds from sales of repossessed assets | | | 275 | | | | 307 | | | | 422 | |
Investment in premises and equipment | | | (276 | ) | | | (1,495 | ) | | | (2,432 | ) |
Redemption (purchase) of Federal Home Loan Bank of Atlanta stock | | | 4,702 | | | | 1,088 | | | | (1,955 | ) |
| | | | | | | | | | | | |
Net cash provided (used) by investing activities | | | 204,235 | | | | 17,644 | | | | (35,968 | ) |
| | | | | | | | | | | | |
F-5
BCSB BANKCORP, INC.
AND SUBSIDIARIES
Baltimore, Maryland
CONSOLIDATED STATEMENTS OF CASH FLOWS (CONTINUED)
| | | | | | | | | | | | |
| | | For Years Ended September 30, | |
| | 2007 | | | 2006 | | | 2005 | |
| | (dollars in thousands) | |
Cash Flows from Financing Activities | | | | | | | | | | | | |
Net (decrease) increase in deposits | | $ | (46,328 | ) | | $ | 6,997 | | | $ | 17,094 | |
Net (decrease) increase in advances by borrowers for taxes and Insurance | | | (380 | ) | | | (577 | ) | | | 752 | |
Proceeds from Federal Home Loan Bank of Atlanta advances | | | 146,550 | | | | 232,125 | | | | 383,600 | |
Repayment of Federal Home Loan Bank of Atlanta advances | | | (244,550 | ) | | | (258,275 | ) | | | (359,550 | ) |
Acquisition of stock for Rabbi Trust | | | (11 | ) | | | (54 | ) | | | (27 | ) |
Treasury stock purchased | | | — | | | | (2 | ) | | | (5 | ) |
Exercised stock options | | | 134 | | | | 15 | | | | 115 | |
Dividends paid | | | — | | | | (1,059 | ) | | | (1,045 | ) |
| | | | | | | | | | | | |
Net cash (used) provided by financing activities | | | (144,585 | ) | | | (20,830 | ) | | | 40,934 | |
| | | | | | | | | | | | |
Increase (decrease) in cash and cash equivalents | | | 64,279 | | | | (11,792 | ) | | | 5,714 | |
Cash and cash equivalents at beginning of period | | | 11,737 | | | | 23,529 | | | | 17,815 | |
| | | | | | | | | | | | |
Cash and cash equivalents at end of period | | $ | 76,016 | | | $ | 11,737 | | | $ | 23,529 | |
| | | | | | | | | | | | |
Supplemental Disclosure of Cash Flows Information: | | | | | | | | | | | | |
Cash paid during the period for: | | | | | | | | | | | | |
| | | |
Interest | | $ | 25,725 | | | $ | 25,371 | | | $ | 20,258 | |
| | | | | | | | | | | | |
Income taxes | | $ | — | | | $ | — | | | $ | 510 | |
| | | | | | | | | | | | |
The accompanying notes to consolidated financial statements are an integral part of these statements.
F-6
BCSB BANKCORP, INC.
AND SUBSIDIARIES
Baltimore, Maryland
NOTES TO CONSOLIDATED FINANCIAL STATEMENTS
Note 1 –Summary of Significant Accounting Policies
Principles of Consolidation – BCSB Bankcorp, Inc. (the “Company”) owns 100% of the voting stock of Baltimore County Savings Bank, F.S.B. (the “Bank”). The Bank owns 100% of Ebenezer Road, Inc. The accompanying consolidated financial statements include the accounts and transactions of these companies on a consolidated basis since date of acquisition. All intercompany transactions have been eliminated in the consolidated financial statements. Ebenezer Road, Inc. sells insurance products. Its operations are not material to the consolidated financial statements.
Reclassifications – Certain prior years’ amounts have been reclassified to conform to the current year’s method of presentation.
Business – The Company’s primary purpose is ownership of the Bank. The Bank’s primary business activity is the acceptance of deposits from the general public in its market area and using the proceeds for investments and loan originations. The Bank is subject to competition from other financial institutions. The Bank is subject to the regulations of certain federal agencies and undergoes periodic examinations by those regulatory authorities.
Basis of Financial Statement Presentation – The consolidated financial statements have been prepared in conformity with accounting principles generally accepted in the United States of America. In preparing the financial statements, management is required to make estimates and assumptions that affect the reported amounts of assets and liabilities as of the date of the statement of financial condition and revenues and expenses for the period. Actual results could differ significantly from those estimates. Material estimates that are particularly susceptible to significant change in the near-term relate to the determination of the allowance for loan losses, valuations of foreclosed real estate, goodwill and intangible assets, deferred income taxes and other than temporary impairment of investment securities.
Investments and Mortgage Backed Securities – We designate securities into one of the three categories at the time of purchase. Debt securities that we have the positive intent and ability to hold to maturity are classified as held to maturity and recorded at amortized cost. Debt and equity securities are classified as trading securities if bought and held principally for the purpose of selling them in the near term. Trading securities are reported at the estimated fair value, with unrealized gains and losses included in earnings. Debt securities not classified as held to maturity and debt and equity securities not classified as trading securities are considered available for sale and are reported at estimated fair value, with unrealized gains and losses reported as a separate component of stockholders’ equity, net of tax effects, in accumulated other comprehensive income.
If a decline in value of an individual security classified as held to maturity or available for sale is judged to be other than temporary, the cost basis of that security is reduced to its fair value and the amount of the write-down is reflected in our earnings. Estimated fair value is determined based on bid prices received from third party pricing services or bid quotations received from securities dealers, Gains or losses on the sale of investments are calculated using a specific-identification basis and are determined on a trade-date basis. Premiums and discounts on investment and mortgage-backed securities are amortized over the term of the security using methods that approximate the interest method.
Restricted Stock Investments – The Bank, as a member of the Federal Home Loan Bank System, is required to maintain an investment in capital stock of the Federal Home Loan Bank of Atlanta (“FHLB’) in varying amounts based on balances of outstanding home loans and on amounts borrowed from the FHLB. Because no ready market exists for this stock and it has no quoted market value, the Bank’s investment in this stock is carried at cost.
F-7
BCSB BANKCORP, INC.
AND SUBSIDIARIES
Baltimore, Maryland
NOTES TO CONSOLIDATED FINANCIAL STATEMENTS
Loans Receivable – Loans receivable are stated at unpaid principal balances, less undisbursed portion of loans in process, unearned interest on consumer loans, deferred loan origination fees and the allowance for loan losses, since management has the ability and intention to hold them to maturity.
Interest income is accrued on the unpaid principal balance. Unearned interest on consumer loans is amortized to income over the terms of the related loans on the level yield method. Loan origination fees and certain direct loan origination costs are deferred and recognized by the interest method over the contractual life of the related loan as an adjustment of yield.
Accrual of interest is discontinued on a loan when management believes, after considering economic and business conditions and collection efforts, that the borrower’s financial condition is such that collection of interest is doubtful or when payment of principal and interest has become ninety days past due unless the obligation is well secured and in the process of collection. When a payment is received on a loan on non-accrual status, the amount received is allocated to principal and interest in accordance with the contractual terms of the loan. A loan is considered past due or delinquent when a contractual payment is not paid in the month it is due.
Loans Held for Sale – Loans held for sale are carried at lower of cost or market value in the aggregate. Market value is derived from secondary market quotations for similar instruments. Net unrealized losses are recognized through a valuation allowance by charges to income.
Allowance for Loan Losses – An allowance for loan losses is provided through charges to income in an amount that management believes will be adequate to absorb losses on existing loans that may become uncollectible, based on evaluations of the collectibility of loans and prior loan loss experience. Loans deemed to be uncollectible are charged against the allowance for loans losses and subsequent recoveries, if any, are credited to the allowance. The evaluations take into consideration such factors as changes in the nature and volume of the loan portfolio, overall portfolio quality, review of specific problem loans, and current economic conditions that may affect the borrowers’ ability to pay. Management believes the allowance for losses on loans is adequate. While management uses available information to estimate losses on loans, future additions to the allowance may be necessary based on changes in economic conditions, particularly in the state of Maryland. In addition, various regulatory agencies, as an integral part of their examination process, periodically review the Bank’s allowance for losses on loans. Such agencies may require the Bank to recognize additions to the allowance based on their judgments about information available to them at the time of their examination.
In accordance with the provisions of Statement of Financial Accounting Standards No. 114, “Accounting by Creditors for Impairment of a Loan,” (“SFAS No. 114”) as amended by SFAS No. 118 “Accounting by Creditors for Impairment of a Loan – Income Recognition and Disclosures”, collectively referred to as “Statement Nos. 114 and 118”, The Bank determines and recognizes impairment of certain loans. A loan is determined to be impaired when, based on current information and events, it is probable that the Bank will be unable to collect all amounts due according to the contractual terms of the loan agreement. A loan is not considered impaired during a period of delay in payment if the Bank expects to collect all amounts due, including past-due interest. The Bank generally considers a period of delay in payment to include delinquency up to and including 90 days. SFAS Nos. 114 and 118 require that impaired loans be measured at the present value of its expected future cash flows discounted at the loan’s effective interest rate, or at the loan’s observable market price or the fair value of the collateral if the loan is collateral dependent.
SFAS Nos. 114 and 118 are generally applicable for all loans except large groups of smaller-balance homogeneous loans that are evaluated collectively for impairment, including residential first and second mortgage loans and consumer installment loans. Impaired loans are therefore generally comprised of commercial mortgage, real estate development, and certain restructured residential loans. In addition, impaired loans are generally loans which management has placed in non-accrual status since loans are placed in non-accrual status on the earlier of the date that management determined that the
F-8
BCSB BANKCORP, INC.
AND SUBSIDIARIES
Baltimore, Maryland
NOTES TO CONSOLIDATED FINANCIAL STATEMENTS
collection of principal and/or interest is in doubt or the date that principal or interest is 90 days or more past due. The Bank recognized interest income for impaired loans consistent with its method for non-accrual loans. Specifically, interest payments received are recognized as interest income or, if the ultimate collectibility of principal is in doubt, are applied to principal.
Foreclosed Real Estate – Real estate acquired through foreclosure is recorded at fair value. Management periodically evaluates the recoverability of the carrying value of the real estate acquired through foreclosure using estimates as described above in Allowance for Loan Losses. In the event of a subsequent decline, management provides an additional allowance to reduce real estate acquired through foreclosure to its fair value less estimated disposal cost. Costs relating to holding such real estate are charged against income in the current period while costs relating to improving such real estate are capitalized until a saleable condition is reached. There was no provision for losses during the years ended September 30, 2007, 2006, and 2005.
Loan Servicing – The cost of mortgage servicing rights is amortized in proportion to, and over the period of, estimated net servicing revenues. Impairment of mortgage servicing rights is assessed based on the fair value of those rights. Fair values are estimated by calculating the net present values of the interest payments over the life of the loans. Impairment is determined on a loan by loan basis. The amount of impairment recognized, if any, is the amount by which the capitalized mortgage servicing rights for a loan exceed its fair value.
F-9
BCSB BANKCORP, INC.
AND SUBSIDIARIES
Baltimore, Maryland
NOTES TO CONSOLIDATED FINANCIAL STATEMENTS
Mortgage Servicing Rights –Following is an analysis of the change in mortgage servicing rights for loans originated and sold during the year and the unamortized balance and change in excess servicing fees from loans originated and sold in prior periods.
| | | | | | | | | | | | |
| | | 2007 | | | 2006 | | | 2005 | |
Balance October 1, | | $ | 124 | | | $ | 134 | | | $ | 178 | |
Capitalized | | | 406 | | | | 24 | | | | — | |
Amortization | | | (57 | ) | | | (34 | ) | | | (44 | ) |
| | | | | | | | | | | | |
Balance September 30, | | $ | 473 | | | $ | 124 | | | $ | 134 | |
| | | | | | | | | | | | |
Premises and Equipment – Premises and equipment are recorded at cost. Depreciation is computed on the straight-line method, based on the useful lives of the respective assets.
Income Taxes – Deferred income taxes are recognized for temporary differences between the financial reporting bases and income tax bases of assets and liabilities based on enacted tax rates expected to be in effect when such amounts are realized or settled. Deferred tax assets are recognized only to the extent that is more likely than not that such amounts will be realized based on consideration of available evidence. The effect on deferred tax assets and liabilities of a change in tax rates is recognized in income in the period that includes the enactment date.
F-10
BCSB BANKCORP, INC.
AND SUBSIDIARIES
Baltimore, Maryland
NOTES TO CONSOLIDATED FINANCIAL STATEMENTS
Transfer of Financial Assets– Transfers of financial assets are accounted for as sales when control over the assets has been surrendered. Control over transferred assets is deemed to be surrendered when: (1) the assets have been isolated from the Bank, (2) the transferee obtains the right (free of conditions that constrain it from taking advantage of that right) to pledge or exchange the transferred assets, and (3) the Bank does not maintain effective control over the transferred assets through an agreement to repurchase them before their maturity.
Significant Group Concentrations of Credit Risk –Most of the Bank’s activities are with customers located within the greater Baltimore metropolitan area. The Bank does not have any significant concentrations to any one industry or customer.
Earnings Per Share – Basic per share amounts are based on the weighted average shares of common stock outstanding. Diluted earnings per share assume the conversion, exercise or issuance of all potential common stock instruments such as options, warrants and convertible securities, unless the effect is to reduce a loss or increase earnings per share. No adjustments were made to net income (numerator). For the years ended September 30, 2007, 2006, 2005 there were no option shares excluded from the computation of diluted earnings per share. The basic and diluted weighted average shares outstanding for the years ended September 30, 2007, 2006 and 2005 are as follows:
| | | | | | | | | | |
| | | 2007 | |
| | | (Loss) Income (Numerator) | | | Shares
(Denominator) | | Per Share Amount | |
| | | ( in thousands except per share data) | |
Basic EPS | | | | | | | | | | |
Loss to shareholders | | $ | (2,921 | ) | | 5,883 | | $ | (.50 | ) |
| | | | | | | | | | |
Diluted EPS | | | | | | | | | | |
Effect of dilutive shares | | | — | | | — | | | — | |
| | | | | | | | | | |
Loss to shareholders plus assumed conversions | | $ | (2,921 | ) | | 5,883 | | $ | (.50 | ) |
| | | | | | | | | | |
| |
| | | 2006 | |
Basic EPS | | | | | | | | | | |
Loss to shareholders | | $ | (7,393 | ) | | 5,855 | | $ | (1.26 | ) |
| | | | | | | | | | |
Diluted EPS | | | | | | | | | | |
Effect of dilutive shares | | | — | | | — | | | — | |
| | | | | | | | | | |
Loss to shareholders plus assumed conversions | | $ | (7,393 | ) | | 5,855 | | $ | (1.26 | ) |
| | | | | | | | | | |
| |
| | | 2005 | |
Basic EPS | | | | | | | | | | |
Income available to shareholders | | $ | 601 | | | 5,877 | | $ | 0.10 | |
| | | | | | | | | | |
Diluted EPS | | | | | | | | | | |
Effect of dilutive shares | | | — | | | 36 | | | — | |
| | | | | | | | | | |
Income available to shareholders plus assumed conversions | | $ | 601 | | | 5,913 | | $ | 0.10 | |
| | | | | | | | | | |
Statement of Cash Flows – In the statement of cash flows, cash and equivalents include cash, Federal Home Loan Bank of Atlanta overnight deposits, federal funds and certificates of deposit and Federal Home Loan Bank of Atlanta time deposits with an original maturity date less than ninety days.
F-11
BCSB BANKCORP, INC.
AND SUBSIDIARIES
Baltimore, Maryland
NOTES TO CONSOLIDATED FINANCIAL STATEMENTS
Employee Stock Ownership Plan – The Company accounts for its Employee Stock Ownership Plan (“ESOP”) in accordance with Statement of Position 93-6 of the Accounting Standards Division of the American Institute of Certified Public Accountants (See Note 11). ESOP shares are considered to be outstanding for the computation of EPS as they are committed to be released.
Rabbi Trust
The Company established a rabbi trust to fund certain benefit plans. The Company accounts for these plans in accordance with EITF 97-14 “Accounting for Deferred Compensation Arrangements Where Amounts Earned Are Held in a Rabbi Trust and Invested”. Until the plan benefits are paid, creditors may make claims against the assets if the Company becomes insolvent.
Loss on Dishonored Checks
The loss incurred during the year ended September 30, 2006 was as a result of a check-kiting scheme perpetrated on the Company by a commercial deposit customer.
Advertising – All advertising costs are expensed as incurred.
Stock-Based Employee Compensation – In December 2004, the Financial Accounting Standards Board (“FASB”) issued Statement of Financial Accounting Standards (“SFAS”) No. 123R, “Share-Based Payment”, which is a revision of SFAS No. 123, “Accounting for Stock Issued to Employees”. SFAS No. 123R requires that all share-based payments to employees, including grants of employee stock options, be valued at fair value on the grant date and be expensed over the applicable vesting period. SFAS No. 123R became effective for the Company on October 1, 2005. The Company adopted SFAS No. 123R using the “modified prospective application”. Under the “modified prospective application”, compensation costs are recognized in the financial statements for all new share-based payments granted after October 1, 2005.
The adoption of SFAS No. 123R resulted in the recognition of compensation expense recognized in earnings of $33,000 for the year ended September 30, 2006. In accordance with the modified prospective application method of SFAS No. 123R, prior period amounts have not been restated to reflect the recognition of stock-based compensation costs.
Prior to October 1, 2005, the Company applied the intrinsic value method of accounting as prescribed by Accounting Principles Board Opinion No. 25, “Accounting for Stock Issued to Employees” (“APB 25”), with a pro forma disclosure of the impact on net income (loss) of using the fair value option expense recognition method. Under the intrinsic value method, compensation cost is the excess, if any, of the quoted market price of the stock at grant date or other measurement date over the amount an employee must pay to acquire the stock. If the Company had used the fair value based method, net earnings and earnings per share for the year ended September 30, 2005 would have been reduced to the pro forma amounts listed in the below table.
F-12
BCSB BANKCORP, INC.
AND SUBSIDIARIES
Baltimore, Maryland
NOTES TO CONSOLIDATED FINANCIAL STATEMENTS
Stock-Based Employee Compensation – continued
| | | | |
| | | For Year Ended
September 30, | |
(dollars in thousands except per share data) | | 2005 | |
Net Income, as reported | | $ | 601 | |
Add: Stock-based compensation included in the determination of net income as reported, net of tax | | | 280 | |
Deduct: Total stock-based compensation expense determined under fair value method for all awards, net of tax | | | (313 | ) |
| | | | |
Pro forma net income | | $ | 568 | |
| | | | |
Earnings per share: | | | | |
Basic-as reported | | $ | 0.10 | |
| | | | |
Basic-pro forma | | $ | 0.10 | |
| | | | |
Diluted-as reported | | $ | 0.10 | |
| | | | |
Diluted-pro forma | | $ | 0.10 | |
| | | | |
Segment Reporting – The Company acts as an independent community financial services provider, offering traditional banking and related financial services to individuals and business customers. The Bank offers a full array of commercial and retail financial services, through its branch and automated teller machine networks. This includes taking time, savings and demand deposits, making of commercial, consumer and mortgage loans, and providing other financial services.
Management does not separately allocate expenses, including the cost of funding loan demand, between the commercial, retail and mortgage banking operations of the Bank. As such, discrete financial information is not available and segment reporting would not be meaningful.
Guarantees – The Company does not issue any guarantees that would require liability recognition or disclosure, other than its standby letters of credit. Standby letters of credit written are conditional commitments issued by the Company to guarantee the performance of a customer to a third party. Generally, all letters of credit, when issued have expiration dates within one year. The credit risk involved in issuing letters of credit is essentially the same as those that are involved in extending loan facilities to customers. The Company generally holds collateral and/or personal guarantees supporting these commitments. The Company has $1.0 million of standby letters of credit as of September 30, 2007. Management believes that the proceeds obtained through a liquidation of collateral and the enforcement of guarantees would be sufficient to cover the potential amount of future payment required under the corresponding guarantees. The current amount of the liability as of September 30, 2007 for guarantees under standby letters of credit issued is not material.
Comprehensive Income – Accounting principles generally require that recognized revenue, expenses, gains and losses be included in net income. Although certain changes in assets and liabilities, such as unrealized gains and losses on available for sale securities, are reported as a separate component of the equity section of the statement of financial condition, such items, along with net income are components of comprehensive income.
Goodwill – The Company accounts for goodwill in accordance with SFAS No. 142, “Goodwill and Other Intangible Assets.” SFAS No. 142 requires that goodwill no longer be amortized, but rather that it be tested for impairment on an annual basis at the reporting unit level, which is either at the same level or one level below an operating segment. Other acquired intangible assets with finite lives, such as purchased customer accounts, are required to be amortized over their
F-13
BCSB BANKCORP, INC.
AND SUBSIDIARIES
Baltimore, Maryland
NOTES TO CONSOLIDATED FINANCIAL STATEMENTS
estimated lives. The Company annually assesses if events or changes in circumstances indicate that the carrying amounts of goodwill and other intangible assets may be impaired. The Company has evaluated goodwill for impairment and found no change in the carrying amount of goodwill. Goodwill was $2,294,000 at September 30, 2007 and 2006.
Bank Owned Life Insurance –The Company purchased single-premium life insurance policies on certain employees of the Company. The net cash surrender value of those policies is classified in other assets. Appreciation in the value of the insurance policies is classified in non-interest income.
Core Deposit Intangible – The Company recognized a core deposit intangible as a result of the merger with WHG Bancshares Corporation. This deposit base is assumed to decay over time as funds are withdrawn by customers. Amortization is calculated using algebraic formulas taking into account current portfolio costs and the current short term LIBOR.
| | | | | | | | | |
(dollars in thousands) | | As of September 30,
2007 | | As of
September 30,
2006 | | As of
September 30,
2005 |
Core Deposit Intangible | | $ | 630 | | $ | 630 | | $ | 600 |
Accumulated Amortization | | | 447 | | | 388 | | | 300 |
| | | | | | | | | |
Net Balance | | $ | 183 | | $ | 242 | | $ | 300 |
| | | | | | | | | |
Aggregate Amortization Expense | | | | | | | | | |
For the year ended September 30, 2007 | | $ | 59 | | | | | | |
For the year ended September 30, 2006 | | | 58 | | | | | | |
For the year ended September 30, 2005 | | | 62 | | | | | | |
| | | |
Estimated Amortization Expense | | | | | | | | | |
For the year ending September 30, 2008 | | | 46 | | | | | | |
For the year ending September 30, 2009 | | | 36 | | | | | | |
For the year ending September 30, 2010 | | | 26 | | | | | | |
For the year ending September 30, 2011 | | | 24 | | | | | | |
For the year ending September 30, 2012 | | | 14 | | | | | | |
F-14
BCSB BANKCORP, INC.
AND SUBSIDIARIES
Baltimore, Maryland
NOTES TO CONSOLIDATED FINANCIAL STATEMENTS
Recent Accounting Pronouncements – In February 2006, The FASB issued SFAS No. 155, “Accounting for Certain Hybrid Financial Instruments—an amendment of FASB Statements No. 133 and 140.” This statement amends Statements No. 133 and 140 by: permitting fair value remeasurement for any hybrid financial instrument that contains an embedded derivative that otherwise would require bifurcation; clarifying which interest-only strips and principal-only strips are not subject to the requirements of Statement No. 133; establishing a requirement to evaluate interests in securitized financial assets to identify interests that are freestanding derivatives or that are hybrid financial instruments that contain an embedded derivative requiring bifurcation; clarifying that concentrations of credit risk in the form of subordination are not embedded derivatives; and amending Statement No. 140 to eliminate the prohibition on a qualifying special-purpose entity from holding a derivative financial instrument that pertains to a beneficial interest other than another derivative financial instrument. The statement became effective for fiscal years beginning after September 15, 2006. The adoption of this standard did not have a material impact on the financial condition, results of operations or liquidity.
In March 2006, the FASB issued SFAS No. 156, “Accounting for Servicing of Financial Assets—an amendment of FASB Statement No. 140.” This statement amends Statement No. 140 with respect to the accounting for separately recognized servicing assets and servicing liabilities. It requires an entity to recognize a servicing asset or servicing liability each time an obligation is undertaken to service a financial asset by entering into a servicing contract in certain situations and requires all separately recognized servicing assets and liabilities to be initially measured at fair value, if practicable. The statement permits the choice between the “amortization method” and the “fair value measurement method” for the subsequent measurement of the servicing assets or liabilities and allows for a one-time reclassification of available-for-sale securities to trading securities at initial adoption. The statement also requires separate presentation of servicing assets and servicing liabilities subsequently measured at fair value in the statement of financial position and additional disclosures for all separately recognized servicing assets and servicing liabilities. The statement became effective for fiscal years beginning after September 30, 2006. The adoption of this standard did not have a material impact on our financial condition, results of operations or liquidity.
In July 2006, the FASB issued FASB Interpretation No. 48 (FIN 48), “Accounting for Uncertainty in Income Taxes—an interpretation of FASB Statement 109”, which provides guidance on the measurement, recognition, and disclosure of tax positions taken or expected to be taken in a tax return. The interpretation also provides guidance on derecognition, classification, interest and penalties, and disclosure. FIN 48 prescribes that a tax position should only be recognized if it is more-likely-than-not that the position will be sustained upon examination by the appropriate taxing authority. A tax position that meets this threshold is measured as the largest amount of benefit that is greater than 50 percent likely of being realized upon ultimate settlement. The cumulative effect of applying FIN 48 is to be reported as an adjustment to the beginning balance of retained earnings in the period of adoption. FIN 48 is effective for the Company on October 1, 2007. The adoption of this standard is not expected to have a material impact on our financial condition, results of operations or liquidity.
F-15
BCSB BANKCORP, INC.
AND SUBSIDIARIES
Baltimore, Maryland
NOTES TO CONSOLIDATED FINANCIAL STATEMENTS
In September 2006, the FASB ratified the consensus reached by the EITF on Issue No. 06-4, “Accounting for Deferred Compensation and Postretirement Benefit Aspects of Endorsement Split-Dollar Life Insurance Arrangements.” EITF 06-4 requires the recognition of a liability and related compensation costs for endorsement split-dollar life insurance policies that provide a benefit to an employee that extends to postretirement periods as defined in SFAS No. 106, “ Employers’ Accounting for Postretirement Benefits Other Than Pensions.” The EITF reached a consensus that Bank Owned Life Insurance policies purchased for this purpose do not effectively settle the entity’s obligation to the employee in this regard and thus the entity must record compensation cost and a related liability. Entities should recognize the effects of applying this Issue through either, (a) a change in accounting principle through a cumulative-effect adjustment to retained earnings or to other components of equity or net assets in the balance sheet as of the beginning of the year of adoption, or (b) a change in accounting principle through retrospective application to all prior periods. Management is currently evaluating the impact of adopting this Issue on the Company’s financial statements. This Issue is effective for fiscal years beginning after December 15, 2007.
In September 2006, the FASB issued SFAS No. 157, “Fair Value Measurements”. SFAS 157 establishes a framework for measuring fair value in generally accepted accounting principles (“GAAP”), and expands disclosures about fair value measurements. While the Statement applies under other accounting pronouncements that require or permit fair value measurements, it does not require any new fair value measurements. SFAS No. 157 defines fair value as the price that would be received to sell an asset or paid to transfer a liability (an exit price) in an orderly transaction between market participants at the measurement date. In addition, the Statement establishes a fair value hierarchy, which prioritizes the inputs to valuation techniques used to measure fair value into three broad levels. Lastly, SFAS No. 157 requires additional disclosures for each interim and annual period separately for each major category of assets and liabilities. The Statement is effective for financial statements issued for fiscal years beginning after November 15, 2007 for financial assets and liabilities and November 15, 2008 for non-financial assets and liabilities, and interim periods within those fiscal years. Management does not expect the adoption of this Statement to have a material impact on the Company’s consolidated financial statements.
In February 2007, the FASB issued SFAS No. 159, “The Fair Value Option for Financial Assets and Financial Liabilities-Including an amendment to FASB Statement No. 115”. This statement permits entities to choose to measure many financial instruments and certain other items at fair value. The objective is to improve financial reporting by providing entities with the opportunity to mitigate volatility in reported earnings caused by measuring related assets and liabilities differently without having to apply complex hedge accounting provisions. This Statement is expected to expand the use of fair value measurement, which is consistent with FASB’s long-term measurement objectives for accounting for financial instruments. This Statement is effective for financial statements issued for fiscal years beginning after November 15, 2007. Early adoption is permitted as of the beginning of the fiscal year that begins on or before November 15, 2007, provided the entity also elects to apply the provisions of FAS No. 157, “Fair Value Measurements”. The Company is evaluating the effects of this statement on its financial statements.
F-16
BCSB BANKCORP, INC.
AND SUBSIDIARIES
Baltimore, Maryland
NOTES TO CONSOLIDATED FINANCIAL STATEMENTS
Note 2 –Investment Securities
The amortized cost and estimated fair values of investment securities are as follows as of September 30, 2007 and 2006.
| | | | | | | | | | | | | |
(in thousands) | | Amortized
Cost | | Gross
Unrealized
Gains | | Gross
Unrealized
Losses | | | Estimated
Fair Value |
Available for sale: | | | | | | | | | | | | | |
| | | | |
September 30, 2007 | | | | | | | | | | | | | |
US Government and Agency obligations | | $ | 4,000 | | $ | — | | $ | (30 | ) | | $ | 3,970 |
| | | | | | | | | | | | | |
| | | | |
| | | Amortized
Cost | | Gross
Unrealized
Gains | | Gross
Unrealized
Losses | | | Estimated
Fair Value |
Available for sale: | | | | | | | | | | | | | |
| | | | |
September 30, 2006 | | | | | | | | | | | | | |
US Government and Agency obligations | | $ | 112,217 | | $ | 2 | | $ | (2,165 | ) | | $ | 110,054 |
Investment in bond mutual funds | | | 34,546 | | | — | | | (1,532 | ) | | | 33,014 |
| | | | | | | | | | | | | |
| | $ | 146,763 | | $ | 2 | | $ | (3,697 | ) | | $ | 143,068 |
| | | | | | | | | | | | | |
Held to maturity: | | | | | | | | | | | | | |
| | | | |
September 30, 2006 | | | | | | | | | | | | | |
US Government and Agency obligations | | $ | 4,496 | | $ | — | | $ | (8 | ) | | $ | 4,488 |
| | | | | | | | | | | | | |
F-17
BCSB BANKCORP, INC.
AND SUBSIDIARIES
Baltimore, Maryland
NOTES TO CONSOLIDATED FINANCIAL STATEMENTS
Note 2 –Investment Securities – Continued
The following is a summary of investment securities by maturity:
| | | | | | |
| | | September 30, 2007 |
(in thousands) | | Amortized Cost | | Fair
Value |
Available for sale: | | | | | | |
| | |
US Government and Agency obligations | | | | | | |
Due within 12 months | | $ | — | | $ | — |
Due beyond 12 months but within five years | | | 2,000 | | | 1,992 |
Due beyond five years but within ten years | | | 1,000 | | | 993 |
Due beyond ten years | | | 1,000 | | | 985 |
| | | | | | |
| | $ | 4,000 | | $ | 3,970 |
| | | | | | |
Proceeds from sales of available for sale securities during the year ended September 30, 2007 were $126.5 million. There were no gains associated with the sale of the securities. Gross losses amounted to $3.1 million. The tax benefit applicable to these realized losses amounted to $1.2 million.
Proceeds from sales of available for sale securities during the year ended September 30, 2006 were $5,405,000. Net gains amounted to $5,000 for the year ended September 30, 2006. This consisted of gross gains of $56,000 and gross losses of $51,000. The tax provisions applicable to these net realized gains amounted to $2,000.
Proceeds from sales of available for sale securities during the year ended September 30, 2005 were $15,536,000. Net gains amounted to $865,000 for the year ended September 30, 2005. This consisted of gross gains of $898,000 and gross losses of $33,000. The tax provisions applicable to these net realized gains amounted to $334,000.
Investments pledged as collateral have an amortized cost of $1.8 million and an estimated fair value of $1.7 million as of September 30, 2007. The only issues over 10% of capital as of September 30, 2007 and 2006 are government sponsored agencies.
As part of the Company’s balance sheet restructuring, investment securities classified as held to maturity were transferred to the available for sale category. A significant portion of these securities were subsequently sold. As of September 20, 2007 all investment securities are classified as available for sale.
F-18
BCSB BANKCORP, INC.
AND SUBSIDIARIES
Baltimore, Maryland
NOTES TO CONSOLIDATED FINANCIAL STATEMENTS
Note 3 – Loans Receivable
Loans receivable at September 30, 2007 and 2006 consist of the following:
| | | | | | | | |
| | | September 30, | |
(in thousands) | | 2007 | | | 2006 | |
Single-family residential mortgages | | $ | 164,522 | | | $ | 214,724 | |
Single-family rental property loans | | | 36,245 | | | | 29,131 | |
Commercial real estate loans | | | 119,598 | | | | 110,179 | |
Construction loans | | | 42,284 | | | | 39,021 | |
Commercial loans secured | | | — | | | | 365 | |
Commercial loans unsecured | | | 336 | | | | 409 | |
Commercial lease loans | | | 4,574 | | | | 4,749 | |
Commercial lines of credit | | | 12,982 | | | | 9,606 | |
Automobile loans | | | 30,490 | | | | 53,530 | |
Home equity lines of credit | | | 16,960 | | | | 17,942 | |
Other consumer loans | | | 2,713 | | | | 2,849 | |
| | | | | | | | |
| | | 430,704 | | | | 482,505 | |
| | |
Add – purchase accounting premiums, net | | | 285 | | | | 451 | |
Less – undisbursed portion of loans in process | | | (9,846 | ) | | | (12,014 | ) |
– unearned interest | | | (1,633 | ) | | | (4,132 | ) |
– deferred loan origination fees and costs | | | (558 | ) | | | (355 | ) |
– allowance for loans losses | | | (2,650 | ) | | | (2,679 | ) |
| | | | | | | | |
| | $ | 416,302 | | | $ | 463,776 | |
| | | | | | | | |
The following is a summary of the allowance for loan losses:
| | | | | | | | | | | | |
| | | Years Ended September 30, | |
(in thousands) | | 2007 | | | 2006 | | | 2005 | |
Balance – beginning of year | | $ | 2,679 | | | $ | 2,746 | | | $ | 2,587 | |
Provision for losses on loans | | | 117 | | | | 194 | | | | 453 | |
Charge-offs | | | (364 | ) | | | (578 | ) | | | (677 | ) |
Recoveries | | | 218 | | | | 317 | | | | 383 | |
| | | | | | | | | | | | |
Balance – end of year | | $ | 2,650 | | | $ | 2,679 | | | $ | 2,746 | |
| | | | | | | | | | | | |
Residential lending is generally considered to involve less risk than other forms of lending, although payment experience on these loans is dependent to some extent on economic and market conditions in the Bank’s lending area. Multifamily residential, commercial, construction and other loan repayments are generally dependent on the operations of the related properties or the financial condition of its borrower or guarantor. Accordingly, repayment of such loans can be more susceptible to adverse conditions in the real estate market and the regional economy.
A significant portion of the Bank’s loans receivable include, mortgage loans secured by residential and commercial real estate properties located in the State of Maryland. Loans are extended only after evaluation by management of customers’ creditworthiness and other relevant factors on a case-by-case basis. The Bank generally does not lend more than 97% of the appraised value of a property and requires private mortgage insurance on residential mortgages with loan-to-value ratios in excess of 90%. In addition, the Bank generally obtains personal guarantees of repayment from borrowers and/or others for multifamily residential, commercial and construction loans and disburses the proceeds of construction and similar loans only as work progresses on the related projects.
F-19
BCSB BANKCORP, INC.
AND SUBSIDIARIES
Baltimore, Maryland
NOTES TO CONSOLIDATED FINANCIAL STATEMENTS
Automobile loans are secured by vehicles and home equity loans are secured by subordinated liens on real estate properties. Repayments of automobile loans and home equity loans are expected primarily from the cash flows of the borrowers.
Non-accrual loans totaled approximately $2.3 million, $2.5 million, and $738,000 at September 30, 2007, 2006 and 2005, respectively. There was one impaired commercial loan at September 30, 2007 and 2006 for $2.3 million as defined by SFAS No. 114. The collateral pledged for this loan was sold at auction in October 2007 with proceeds retained by the Bank. No loss of principal is expected on this loan. There was no interest income recognized on impaired loans during these periods. As of September 30, 2007, $257,000 of loan loss allowances were allocated to all loans classified as impaired. At September 20, 2006, $238,000 of loan loss allowances were allocated to all loans classified as impaired. The Bank was not committed to fund additional amounts on these loans.
Interest income that would have been recorded under the original terms of non-accrual loans and the interest actually recognized for the years ended September 30, are summarized below:
| | | | | | | | | |
| | | Years Ended September 30, |
(in thousands) | | 2007 | | 2006 | | 2005 |
Interest income that would have been recognized | | $ | 192 | | $ | 152 | | $ | 66 |
Interest income recognized | | | 18 | | | 139 | | | 29 |
| | | | | | | | | |
Interest income not recognized | | $ | 174 | | $ | 13 | | $ | 37 |
| | | | | | | | | |
The Bank has had, and may be expected to have in the future, banking transactions in the ordinary course of business with directors, officers, their immediate families and affiliated companies (commonly referred to as related parties), on the same terms including interest rates and collateral, as those prevailing at the time for comparable transactions with others. The following table presents a summary of the activity of loans receivable from related parties:
| | | | | | | | |
| | | Years Ended September 30, | |
(in thousands) | | 2007 | | | 2006 | |
Beginning balance | | $ | 1,000 | | | $ | 921 | |
New loans | | | 189 | | | | 362 | |
Loan repayments | | | (358 | ) | | | (181 | ) |
Change in related party classification | | | (363 | ) | | | (102 | ) |
| | | | | | | | |
Ending balance | | $ | 468 | | | $ | 1,000 | |
| | | | | | | | |
The Bank services loans for others. The amount of such loans serviced at September 30, 2007 and 2006 was $60,750,000 and $21,939,000, respectively. At September 30, 2007 and 2006, the Bank had no loans sold with recourse.
Custodial escrow balances maintained in connection with the foregoing loan servicings were approximately $381,000 and $76,000 at September 30, 2007 and 2006, respectively.
The Bank is a party to financial instruments with off-balance-sheet risk made in the normal course of business to meet the financing needs of its customers. These financial instruments are standby letters of credit, lines of credit and commitments to fund mortgage loans and involve to varying degrees elements of credit risk in excess of the amount recognized in the statement of financial position. The contract amounts of those instruments express the extent of involvement the Bank has in this class of financial instruments and represents the Bank’s exposure to credit loss from nonperformance by the other party.
Unless noted otherwise, the Bank does not require collateral or other security to support financial instruments with off-balance-sheet credit risk.
F-20
BCSB BANKCORP, INC.
AND SUBSIDIARIES
Baltimore, Maryland
NOTES TO CONSOLIDATED FINANCIAL STATEMENTS
Financial Instruments Whose Contract Amounts Represents Credit Risk
| | | | | | |
| | | Contract Amount at, |
(in thousands) | | September 30, 2007 | | September 30, 2006 |
Standby letters of credit | | $ | 1,010 | | $ | 754 |
Commercial lines of credit | | | 12,982 | | | 9,715 |
Home equity lines of credit | | | 16,960 | | | 20,770 |
Loan commitments, fixed rates | | | 5,511 | | | 6,070 |
Loan commitments, variable rates | | | 3,324 | | | 1,135 |
Standby letters of credit are conditional commitments issued by the Bank guaranteeing performance by a customer to a third party. Those guarantees are issued primarily to support private borrowing arrangements, generally limited to real estate transactions. Unless otherwise noted, the standby letters of credit are not collateralized. The credit risk involved in issuing letters of credit is essentially the same as that involved in extending loan facilities to customers.
Home equity and commercial lines of credit are loan commitments to individuals and companies and have fixed expiration dates as long as there is no violation of any condition established in the contract. The Bank evaluates each customer’s credit worthiness on a case-by-case basis.
Rates on mortgage loan commitments for fixed rate loans ranged from 6.0% to 6.5% and 5.875% to 7.0% at September 30, 2007 and 2006, respectively. There were no mortgage loan commitments for variable rate loans at September 30, 2007 and 2006. Rates on home equity loan commitments for fixed rate loans ranged from 6.72% to 6.74% and 6.3% to 7.23% at September 30, 2007 and 2006, respectively. Rates on home equity loan commitments for variable rate loans were at an introductory rate of 6% for the first six months then prime minus 1/2 % for the remainder of the term at September 30, 2007.
Rates on commercial loan commitments for fixed rate loans ranged from 6.75% to 11.00% at September 30, 2007. Rates on commercial loan commitments for variable rate loans ranged from 1.00% over prime to 1.50% over prime at September 30, 2007. Rates on commercial loan commitments for fixed rate loans ranged from 7.00% to 10.00% at September 30, 2006. Rates on commercial loan commitments for variable rate loans ranged from 1.0% over prime to 1.5% over prime at September 30, 2006.
No amount was recognized in the statement of financial condition at September 30, 2007 and 2006, as liability for credit loss nor was any liability recognized for fees received for standby letters of credit.
The Bank grants loans to customers, substantially all of whom are residents of the Metropolitan Baltimore and Harford County areas.
F-21
BCSB BANKCORP, INC.
AND SUBSIDIARIES
Baltimore, Maryland
NOTES TO CONSOLIDATED FINANCIAL STATEMENTS
Note 4 –Mortgage Backed Securities
The amortized cost and estimated fair values of mortgage backed securities are as follows as of September 30, 2007 and 2006:
| | | | | | | | | | | | | |
(in thousands) | | Amortized Cost | | Gross
Unrealized
Gains | | Gross
Unrealized
Losses | | | Estimated Fair Value |
Available for sale: | | | | | | | | | | | | | |
| | | | |
September 30, 2007 | | | | | | | | | | | | | |
GNMA certificates | | $ | 3,906 | | $ | 122 | | $ | — | | | $ | 4,028 |
Collaterized mortgage obligations | | | 27,591 | | | — | | | (296 | ) | | | 27,295 |
FNMA certificates | | | 51,009 | | | 35 | | | (666 | ) | | | 50,378 |
FHLMC participating certificates | | | 23,574 | | | 69 | | | (345 | ) | | | 23,298 |
| | | | | | | | | | | | | |
| | $ | 106,080 | | $ | 226 | | $ | (1,307 | ) | | $ | 104,999 |
| | | | | | | | | | | | | |
September 30, 2006 | | | | | | | | | | | | | |
GNMA certificates | | $ | 6,166 | | $ | — | | $ | (97 | ) | | $ | 6,069 |
FNMA certificates | | | 60,727 | | | — | | | (2,284 | ) | | | 58,443 |
FHLMC participating certificates | | | 23,306 | | | 2 | | | (1,019 | ) | | | 22,289 |
| | | | | | | | | | | | | |
| | $ | 90,199 | | $ | 2 | | $ | (3,400 | ) | | $ | 86,801 |
| | | | | | | | | | | | | |
| | | | |
(in thousands) | | Amortized
Cost | | Gross
Unrealized
Gains | | Gross
Unrealized
Losses | | | Estimated
Fair Value |
Held to maturity: | | | | | | | | | | | | | |
| | | | |
September 30, 2006 | | | | | | | | | | | | | |
GNMA certificates | | $ | 4,124 | | $ | 92 | | $ | — | | | $ | 4,216 |
FNMA certificates | | | 14,560 | | | 40 | | | (345 | ) | | | 14,255 |
FHLMC participating certificates | | | 9,991 | | | 77 | | | (183 | ) | | | 9,885 |
| | | | | | | | | | | | | |
| | $ | 28,675 | | $ | 209 | | $ | (528 | ) | | $ | 28,356 |
| | | | | | | | | | | | | |
During the year ended September 30, 2007, the Bank transferred mortgage backed securities that were classified as held to maturity to available for sale. The decision to transfer these securities will limit the Bank’s ability to use this classification in the near term.
Proceeds from sales of available for sale mortgage backed securities during the year ended September 30, 2007 were $77.8 million. There were no gains associated with the sale of mortgage backed securities. Gross losses amounted to $2.8 million. The tax benefit applicable to these realized losses amounted to $1.1 million.
There were no sales of available for sale mortgage backed securities during the year ended September 30, 2006.
Proceeds from sales of available for sale mortgage backed securities during the year ended September 30, 2005 were $8,351,000. Net gains amounted to $19,000 for the year ended September 30, 2005. This consisted of gross gains of $30,000 and gross losses of $11,000. The tax provision applicable to these net realized gains was $7,000.
F-22
BCSB BANKCORP, INC.
AND SUBSIDIARIES
Baltimore, Maryland
NOTES TO CONSOLIDATED FINANCIAL STATEMENTS
Note 4 –Mortgage Backed Securities-continued
Below are schedules of both investment securities and mortgage backed securities with unrealized losses as of September 30, 2007 and the length of time the individual security has been in a continuous unrealized loss position. Unrealized losses are the result of interest rate levels differing from those existing at the time of purchase of the securities and, as to mortgage backed securities, estimated prepayment speeds. These unrealized losses are considered temporary as they reflect fair values on September 30, 2007 and are subject to change daily as interest rates fluctuate. The Company has the ability and intent to hold these securities until the earlier of recovery or maturity.
| | | | | | | | | | | | | | | | | | | | | |
| | | Less than 12 months | | | 12 months or more | | | Total | |
(in thousands) | | Fair
Value | | Unrealized
Losses | | | Fair Value | | Unrealized
Losses | | | Fair Value | | Unrealized
Losses | |
U.S. Government agencies | | $ | — | | $ | — | | | $ | 2,970 | | $ | (30 | ) | | $ | 2,970 | | $ | (30 | ) |
Mortgage-backed securities | | | 54,919 | | | (521 | ) | | | 10,825 | | | (490 | ) | | | 65,744 | | | (1,011 | ) |
Collateralized mortgage obligations | | | 27,295 | | | (296 | ) | | | — | | | — | | | | 27,295 | | | (296 | ) |
| | | | | | | | | | | | | | | | | | | | | |
Total temporarily impaired securities | | $ | 82,214 | | $ | (817 | ) | | $ | 13,795 | | $ | (520 | ) | | $ | 96,009 | | $ | (1,337 | ) |
| | | | | | | | | | | | | | | | | | | | | |
At September 30, 2007 the Company has thirty-two securities in an unrealized loss position. The bonds in an unrealized loss position at September 30, 2007 were temporarily impaired due to the current interest rate environment and not increased credit risk.
F-23
BCSB BANKCORP, INC.
AND SUBSIDIARIES
Baltimore, Maryland
NOTES TO CONSOLIDATED FINANCIAL STATEMENTS
Note 5 –Premises and Equipment
Premises and equipment at September 30, 2007 and 2006 are summarized by major classification as follows:
| | | | | | | | | | |
| | | September 30, |
(in thousands) | | 2007 | | | 2006 | | | Life |
Office Building | | $ | 9,052 | | | $ | 8,982 | | | 50 Years |
Leasehold improvements | | | 1,176 | | | | 1,173 | | | 7-31 Years |
Furniture, fixtures and equipment | | | 8,332 | | | | 8,641 | | | 10 Years |
| | | | | | | | | | |
| | | 18,560 | | | | 18,796 | | | |
| | | |
Accumulated depreciation | | | (8,106 | ) | | | (7,571 | ) | | |
| | | | | | | | | | |
| | $ | 10,454 | | | $ | 11,225 | | | |
| | | | | | | | | | |
The Bank has entered into long-term leases for the land on which the main office and branches are located. Rental expense under long-term leases for property for the years ended September 30, 2007, 2006 and 2005 was $1.2 million, $1.2 million and $990,000, respectively. At September 30, 2007, minimum rental commitments under noncancellable leases are as follows:
| | | |
Years Ended September 30, | | Amount |
| (in thousands) | | |
2008 | | | 1,118 |
2009 | | | 944 |
2010 | | | 972 |
2011 | | | 906 |
2012 | | | 774 |
After 2012 | | | 7,882 |
| | | |
| | $ | 12,596 |
| | | |
Note 6 –Deposits
Deposits are summarized as follows at September 30, 2007 and 2006:
| | | | | | | | | | | | |
| | | 2007 | | | 2006 | |
(dollars in thousands) | | Amount | | % | | | Amount | | % | |
Type of Account | | | | | | | | | | | | |
NOW | | $ | 34,454 | | 6.17 | % | | $ | 35,225 | | 5.82 | % |
Non-interest bearing NOW | | | 30,880 | | 5.53 | | | | 23,406 | | 3.87 | |
Money market | | | 18,339 | | 3.28 | | | | 17,650 | | 2.92 | |
Passbook savings | | | 81,632 | | 14.62 | | | | 95,890 | | 15.86 | |
Certificates | | | 393,104 | | 70.39 | | | | 432,418 | | 71.49 | |
| | | | | | | | | | | | |
| | | 558,409 | | 99.99 | | | | 604,589 | | 99.96 | |
Accrued interest payable | | | 48 | | .01 | | | | 256 | | .04 | |
| | | | | | | | | | | | |
| | $ | 558,457 | | 100.00 | % | | $ | 604,845 | | 100.00 | % |
| | | | | | | | | | | | |
F-24
BCSB BANKCORP, INC.
AND SUBSIDIARIES
Baltimore, Maryland
NOTES TO CONSOLIDATED FINANCIAL STATEMENTS
Note 6 –Deposits – Continued
The aggregate amount of jumbo certificates of deposit with a minimum denomination of $100,000 was approximately $119,565,951 and $130,642,236 at September 30, 2007 and 2006, respectively. Deposits in excess of $100,000 are not insured by the Savings Association Insurance Fund of the FDIC. The Bank has approximately $897,000 in securities pledged as collateral for deposits held by Maryland government entities.
At September 30, 2007, scheduled maturities of certificates of deposit are as follows:
| | | |
| | | (in thousands) |
2008 | | $ | 253,190 |
2009 | | | 80,749 |
2010 | | | 38,784 |
2011 | | | 15,117 |
2012 | | | 5,204 |
| | | |
| | $ | 393,104 |
| | | |
Interest expense on deposits for the years ended September 30, 2007, 2006 and 2005 is as follows:
| | | | | | | | | |
(in thousands) | | 2007 | | 2006 | | 2005 |
NOW | | $ | 98 | | $ | 98 | | $ | 123 |
Money market | | | 581 | | | 482 | | | 132 |
Passbook savings | | | 699 | | | 1,020 | | | 1,107 |
Certificates | | | 19,027 | | | 16,779 | | | 13,349 |
| | | | | | | | | |
| | $ | 20,405 | | $ | 18,379 | | $ | 14,711 |
| | | | | | | | | |
Note 7 –Federal Home Loan Bank of Atlanta Advances
The Bank has the following outstanding Federal Home Loan Bank advances as of September 30:
| | | | | | | | | | | |
| | | 2007 | | 2006 |
(dollars in thousands) | | Rate | | | Total | | Rate | | Total |
Due | | | | | | | | | | | |
| | | | |
2007 | | | | | $ | — | | 3.66%-5.28% | | $ | 40,000 |
2008 | | 4.34 | % | | | 10,000 | | 4.34%-5.51% | | | 16,000 |
2009 | | 4.44 | % | | | 10,000 | | 4.44%-4.89% | | | 13,000 |
2010 | | | | | | — | | 6.33% | | | 9,000 |
2011 | | | | | | — | | 4.99%-5.01% | | | 40,000 |
2012 and thereafter | | | | | | — | | | | | — |
Purchase accounting premiums | | | | | | — | | | | | 473 |
| | | | | | | | | | | |
Total | | | | | $ | 20,000 | | | | $ | 118,473 |
| | | | | | | | | | | |
The Bank has fixed rate advances totaling $20,000,000 with rates ranging from 4.34% to 4.44% as of September 30, 2007. The Bank has no variable rate advances.
F-25
BCSB BANKCORP, INC.
AND SUBSIDIARIES
Baltimore, Maryland
NOTES TO CONSOLIDATED FINANCIAL STATEMENTS
Note 7 –Federal Home Loan Bank of Atlanta Advances- continued
The Bank has a line of credit with the Federal Home Loan Bank of Atlanta equal to 25% of total assets. This line is secured by blanket floating lien on eligible 1-4 family residential loans, and eligible commercial loans. At September 30, 2007, the Bank had an available unused line of credit of $108.0 million. The line of credit requires no compensating balances.
Note 8 –Junior Subordinated Debentures
In June, 2002, the Company issued $12,887,000 of junior subordinated debentures (the debentures) to BCSB Bankcorp Capital Trust I (the Trust), a Delaware business trust, in which the Company owns all of the common equity. The debentures carry a rate of 3.65% over the three month LIBOR rate, and resets quarterly, the rate was 9.01% and 9.16% at September 30, 2007 and 2006 respectively. The debentures are the sole asset of BCSB Bankcorp Capital Trust I. BCSB Bankcorp Capital Trust I issued $12,500,000 of mandatory redeemable preferred securities to investors. The Company’s obligation under the debentures and related documents, taken together, constitute a full and unconditional guarantee by the Company of BCSB Bankcorp Capital Trust I obligations under the preferred securities. The Preferred securities are redeemable by the Company beginning with the interest rate adjustment date after June 30, 2007 or under certain conditions in whole but not in part at any time at a redemption price equal to 103% of the principal amount plus any accrued interest.
In September, 2003, the Company issued $10,310,000 of junior subordinated debentures (the debentures) to BCSB Bankcorp Capital Trust II (the Trust), a Delaware business trust, in which the Company owns all of the common equity. The debentures carry a rate of 3.00% over the three month LIBOR rate, and resets quarterly, the rate was 8.65% and 8.51% at September 30, 2007 and 2006 respectively. The debentures are the sole asset of BCSB Bankcorp Capital Trust II. BCSB Bankcorp Capital Trust II issued $10,000,000 of mandatory redeemable preferred securities to investors. The Company’s obligation under the debentures and related documents, taken together, constitute a full and unconditional guarantee by the Company of BCSB Bankcorp Capital Trust II obligations under the preferred securities. The Preferred securities are redeemable by the Company on or after October 7, 2008 or under certain conditions in whole but not in part at any time at a redemption price equal to 103% of the principal amount plus any accrued interest.
Note 9 –Pension Plan
The Bank has a 401(k) Retirement Savings Plan. Employees may contribute a percentage of their salary up to a maximum of $15,500 for 2007. The Bank was obligated to contribute 100% of the employee’s contribution, not to exceed 4% of the employee’s annual salary. The 4% contribution was discontinued in April 2006. All employees who have completed one year of service with the Bank are eligible to participate. The Bank’s contribution to this plan amounted to $0, $75,000, and $253,000 for the years ended September 30, 2007, 2006 and 2005, respectively.
Note 10 –Directors Retirement Plan
On October 1, 2004, the Director’s Retirement Plan was amended. The Company’s retirement plan allows directors to defer directors’ fees into Company stock, and will be paid out by delivering only Company stock to the participants, or they can defer their fees into a phantom investment vehicle which allows them to get a return based upon the mutual fund market.
F-26
BCSB BANKCORP, INC.
AND SUBSIDIARIES
Baltimore, Maryland
NOTES TO CONSOLIDATED FINANCIAL STATEMENTS
Note 11 –Employee Stock Ownership Plan
In 1998, the Bank reorganized from a federally chartered mutual savings bank to a federally chartered stock savings bank.
At the same time as the reorganization, the Bank established an Employee Stock Ownership Plan (“ESOP”) for its employees. On July 8, 1998 the ESOP acquired 182,930 shares of the Company’s common stock in connection with the Bank’s Reorganization to a mutual holding company form of organization. The ESOP holds the common stock in a trust for allocation among participating employees, in trust or allocated to the participants’ accounts and an annual contribution from the Bank to the ESOP and earnings thereon.
All employees of the Bank who attain the age of 21 and complete one year of service with the Bank will be eligible to participate in the ESOP. Participants must be employed at least 500 hours in a plan year in order to receive an allocation. Each participant’s vested interest under the ESOP is determined according to the following schedule: 0% for less than 2 years of service with the Company or the Bank, 20% for 2 years of service, 40% for 3 years of service, 60% for 4 years of service, 80% for 5 years of service, and 100% for 6 years of service. For vesting purposes, a year of service means any plan year in which an employee completes at least 1,000 hours of service (whether before or after the ESOP’s January 1, 1998 effective date). Vesting accelerates to 100% upon a participant’s attainment of age 65, death or disability.
The ESOP will be funded by contributions made by the Bank in cash or common stock and dividends on the shares held in the Trust. The Bank will recognize compensation expense as shares are committed for release from collateral at their current market price. Dividends on allocated shares are recorded as a reduction of retained earnings and dividends on unallocated shares are recorded as a reduction of the debt service. The compensation costs for the years ended September 30, 2007, 2006 and 2005 were $250,000, $286,000, and $329,000, respectively.
The ESOP shares were as follows as of September 30:
| | | | | | |
| | | 2007 | | 2006 |
Shares released and allocated | | | 173,779 | | | 160,060 |
Unearned shares | | | 9,151 | | | 22,870 |
| | | | | | |
| | | 182,930 | | | 182,930 |
| | | | | | |
Fair value of unearned shares | | $ | 75,496 | | $ | 287,247 |
| | | | | | |
Note 12 –Management Recognition Plan
On July 15, 1999, the Bank established a Management Recognition Plan (“MRP”) to retain personnel of experience and ability in key positions of responsibility. Members of the Board of Directors and certain executive officers may be awarded a total of 91,464 shares of stock, which will be held in a separate trust that manages the MRP. The Bank funded the MRP by purchasing the shares of common stock in the open market. The Bank initially awarded an aggregate of 45,600 shares of common stock. During the year ended September 30, 2002 the Bank awarded an additional 26,500 shares. During
F-27
BCSB BANKCORP, INC.
AND SUBSIDIARIES
Baltimore, Maryland
NOTES TO CONSOLIDATED FINANCIAL STATEMENTS
Note 12 –Management Recognition Plan-continued
the year ended September 30, 2007 the Bank awarded an additional 10,500 shares and intends to reserve the remaining 8,864 shares for possible future awards. Shares awarded to the participants in the MRP vest at a rate of 25% per year on each anniversary of the effective date of the MRP award. As of September 30, 2007 and 2006, 72,100 shares have vested. No shares were granted during the year ended September 30, 2006. If a participant terminates employment for reasons other than death, disability, change in control or retirement he or she forfeits all rights to unvested shares. Compensation expense in the amount of the fair market value of the common stock at the date of the grant is recognized on a pro-rata basis over the years during which the shares are earned. Compensation expense of $9,000, $28,000, and $53,300 was recognized for the MRP for the years ended September 30, 2007, 2006 and 2005, respectively.
Note 13 –Stock Option Plan
The Company has a Stock Option Plan (the “Plan”) whereby 228,660 shares of common stock have been reserved for issuance under the Plan. Options granted under the Plan may be Incentive Stock Options within the meaning of Section 422 of the Internal Revenue Code of 1986 as amended or Non-Qualified Stock Options. Options are exercisable in four annual installments at the market price of common stock at the date of grant. The Options must be exercised within ten years from the date of grant. There were 82,500 options granted during the year ended September 30, 2002. There were 30,000 options granted during the year ended September 30, 2007. No options were granted during the years ended September 30, 2006, 2005.
The following table summarizes the status of and changes in the Company’s stock option plan during the past three years.
At September 30, 2007 there were 23,250 shares under option with an exercise price of $8.00 and a weighted average contractual life of 2.0 years and 68,250 shares with an exercise price of $11.375 and a weighted average contractual life of 5.0 years. The total exercisable shares of 91,500 have a weighted average contractual life of 4.3 years, and an aggregate intrinsic value of $(158,000).
| | | | | | |
| | | Shares | | | Weighted Average
Exercise Price |
Outstanding at October 1, 2004 | | 128,625 | | | $ | 10.10 |
Options exercised | | (13,375 | ) | | | 8.60 |
Granted | | — | | | | — |
| | | | | | |
Outstanding at September 30, 2005 | | 115,250 | | | $ | 10.28 |
| | |
Options exercised | | (1,750 | ) | | | 10.41 |
Granted | | — | | | | — |
| | | | | | |
Outstanding at September 30, 2006 | | 113,500 | | | $ | 10.30 |
| | |
Options exercised | | (16,000 | ) | | | 8.42 |
Options expired | | (6,000 | ) | | | 11.37 |
Granted | | 30,000 | | | | 13.13 |
| | | | | | |
Outstanding at September 30, 2007 | | 121,500 | | | $ | 11.16 |
| | | | | | |
Exercisable at September 30, 2007 | | 91,500 | | | $ | 10.52 |
| | | | | | |
F-28
BCSB BANKCORP, INC.
AND SUBSIDIARIES
Baltimore, Maryland
NOTES TO CONSOLIDATED FINANCIAL STATEMENTS
Note 13 –Stock Option Plan – continued
The total intrinsic value of options exercised during the year ended September 30, 2007 was approximately $27,845. During the year ended September 30, 2007, 30,000 were granted with weighted average fair values of $6.67. The following weighted average assumptions were used in the Black-Scholes-Myron option pricing model for the year ended September 30, 2007.
| | | |
Dividend Yield | | 0 | % |
Expected volatility | | 26.65 | |
Risk-free interest rate | | 4.64 | % |
Expected lives | | 10.0 years | |
Note 14 –Regulatory Capital
The Bank is subject to various regulatory capital requirements administered by the federal banking agencies. Failure to meet minimum capital requirements can initiate certain mandatory, and possible additional discretionary, actions by the regulators that, if undertaken, could have a direct material effect on the Bank’s financial statements. Under capital adequacy guidelines and the regulatory framework for prompt corrective action, the Bank must meet specific capital guidelines that involve quantitative measures of the Bank’s assets, liabilities, and certain off-balance sheet items as calculated under regulatory accounting practices. The Bank’s capital amounts and classifications are also subject to qualitative judgments by the regulators about components, risk weightings, and other factors.
Quantitative measures established by regulation to ensure capital adequacy require the Bank to maintain minimum amounts and ratios (set forth in the table below) of total and Tier I capital (as defined in the regulations) and risk-weighted assets (as defined), and of Tier I capital (as defined) to average assets (as defined). Management believes, as of September 30, 2007, that the Bank meets all capital adequacy requirements to which it is subject.
As of September 30, 2007, the most recent notification from the Office of Thrift Supervision categorized the Bank as well capitalized under the regulatory framework for prompt corrective action. To be categorized as well capitalized the Bank must maintain minimum total risk-based, Tier I risk- based, and Tier I leverage ratios as set forth in the table. There are no conditions or events since that notification that management believes have changed the Bank’s category. The Bank’s actual capital amounts and ratios are also presented in the table.
F-29
BCSB BANKCORP, INC.
AND SUBSIDIARIES
Baltimore, Maryland
NOTES TO CONSOLIDATED FINANCIAL STATEMENTS
The following table presents the Bank’s capital position based on the September 30 financial statements and the current capital requirements.
| | | | | | | | | | | | | | | | | | |
| | | Actual | | | For Capital
Adequacy Purposes | | | To Be Well
Capitalized Under
Prompt Corrective
Action Provisions | |
| | | Amount | | Ratio | | | Amount | | Ratio | | | Amount | | Ratio | |
| | | (dollars in thousands) | |
September 30, 2007 | | | | | | | | | | | | | | | | | | |
Tangible (1) | | $ | 47,100 | | 7.44 | % | | $ | 9,500 | | 1.5 | % | | $ | N/A | | N/A | % |
Tier I capital (2) | | | 47,100 | | 12.16 | | | | N/A | | N/A | | | | 23,249 | | 6.0 | |
Core (1) | | | 47,100 | | 7.44 | | | | 25,334 | | 4.0 | | | | 31,668 | | 5.0 | |
Risk-weighted (2) | | | 49,413 | | 12.75 | | | | 30,999 | | 8.0 | | | | 38,749 | | 10.0 | |
| | | | | | |
September 30, 2006 | | | | | | | | | | | | | | | | | | |
Tangible (1) | | $ | 46,833 | | 6.01 | % | | $ | 11,685 | | 1.5 | % | | $ | N/A | | N/A | % |
Tier I capital (2) | | | 46,833 | | 10.61 | | | | N/A | | N/A | | | | 26,487 | | 6.0 | |
Core (1) | | | 46,833 | | 6.01 | | | | 31,161 | | 4.0 | | | | 38,951 | | 5.0 | |
Risk-weighted (2) | | | 49,103 | | 11.12 | | | | 35,315 | | 8.0 | | | | 44,144 | | 10.0 | |
| (1) | To adjust total assets |
| (2) | To risk-weighted assets |
The following table provides a reconciliation of total equity per the consolidated financial statements to capital amounts reflected in the above table:
| | | | | | | | | | | | |
| | | September 30, | |
| | | 2007 | | | 2006 | | | 2005 | |
| | | (dollars in thousands) | |
Total equity | | $ | 34,592 | | | $ | 33,421 | | | $ | 42,040 | |
Adjustment for accumulated other comprehensive loss | | | 682 | | | | 3,414 | | | | 3,076 | |
Adjustment for intangible assets | | | (2,477 | ) | | | (2,536 | ) | | | (2,594 | ) |
Adjustment for disallowed deferred tax assets | | | (2,057 | ) | | | (2,482 | ) | | | 0 | |
Adjustment for parent company equity | | | 16,360 | | | | 15,016 | | | | 12,803 | |
| | | | | | | | | | | | |
Tangible, Tier 1 and Core Capital | | | 47,100 | | | | 46,833 | | | | 55,325 | |
Allowance for loan losses | | | 2,313 | | | | 2,270 | | | | 2,209 | |
| | | | | | | | | | | | |
Total risk-based capital | | $ | 49,413 | | | $ | 49,103 | | | $ | 57,534 | |
| | | | | | | | | | | | |
The OTS has adopted an interest rate risk component of regulatory capital requirements effective January 1, 1994. The rule requires additional capital to be maintained if the Bank’s interest rate risk exposure, measured by the decline in the market value of the Bank’s net portfolio value, exceeds 2% of assets as a result of a 200 basis point shift in interest rates. As of September 30, 2007, the Bank is not subject to the interest rate risk requirement.
OTS regulations limit the payment of dividends and other capital distributions by the Bank. The Bank is able to pay dividends during a calendar year without regulatory approval to the extent of the greater of (i) an amount which will reduce by one-half its surplus capital ratio at the beginning of the year plus all its net income determined on the basis of generally accepted accounting principles for that calendar year or (ii) 75% of net income for the last four calendar quarters.
F-30
BCSB BANKCORP, INC.
AND SUBSIDIARIES
Baltimore, Maryland
NOTES TO CONSOLIDATED FINANCIAL STATEMENTS
Note 14 –Regulatory Capital – continued
The Bank is restricted in paying dividends on its stock to the greater of the restrictions described in the preceding paragraph, or an amount that would reduce its retained earnings below its regulatory capital requirement or the accumulated bad debt deduction.
As of December 2, 2005 the Bank formally entered into a Supervisory Agreement with the Office of Thrift Supervision (“OTS”). The entry into the Supervisory Agreement was based on the Bank’s 2005 report of examination in which the OTS concluded that grounds existed for the initiation of administrative proceedings against the Bank. Without admitting or denying that such grounds existed, the Bank determined to enter into the Supervisory Agreement to cooperate with the OTS and as evidence of the Bank’s intent to comply with all applicable laws and regulations and engage in safe and sound practices.
In December 2006 the Company announced that it has determined to suspend its dividend program and has agreed with its primary regulator, the Office of Thrift Supervision that it will not issue a dividend to its stockholders going forward without the regulator’s consent as the Company seeks to implement its business plan to improve earnings, capital position and liquidity.
F-31
BCSB BANKCORP, INC.
AND SUBSIDIARIES
Baltimore, Maryland
NOTES TO CONSOLIDATED FINANCIAL STATEMENTS
Note 15 –Income Taxes
The income tax provision consists of the following for the years ended September 30, 2007, 2006 and 2005:
| | | | | | | | | | | | |
| | | 2007 | | | 2006 | | | 2005 | |
| | | (dollars in thousands) | |
Current expense (benefit) | | $ | (744 | ) | | $ | (4,015 | ) | | $ | 242 | |
Deferred expense (benefit) | | | (1,001 | ) | | | (34 | ) | | | (131 | ) |
| | | | | | | | | | | | |
Total tax expense (benefit) | | $ | (1,745 | ) | | $ | (4,049 | ) | | $ | 111 | |
| | | | | | | | | | | | |
The tax effects of temporary differences that give rise to significant portions of the deferred tax assets and deferred tax liabilities at September 30, 2007 and 2006 are as follows:
| | | | | | | | |
| | | 2007 | | | 2006 | |
Deferred Tax Assets: | | | | | | | | |
ESOP and MRP | | $ | 93 | | | $ | 38 | |
Deferred compensation | | | 869 | | | | 817 | |
Allowance for loan losses | | | 1,023 | | | | 1,035 | |
Allowance for uncollected interest | | | 2 | | | | 10 | |
Net operating loss carry forward | | | 5,154 | | | | 3,981 | |
Unrealized holding losses on securities | | | 429 | | | | 2,739 | |
| | | | | | | | |
Total gross deferred tax assets | | | 7,570 | | | | 8,620 | |
Deferred Tax Liabilities: | | | | | | | | |
Federal Home Loan Bank of Atlanta stock dividends | | | (209 | ) | | | (209 | ) |
Depreciation | | | (745 | ) | | | (602 | ) |
Market value change in Rabbi Trust assets | | | (44 | ) | | | (44 | ) |
Purchase accounting premiums, net | | | (110 | ) | | | 6 | |
| | | | | | | | |
Total gross deferred tax liabilities | | | (1,108 | ) | | | (849 | ) |
| | | | | | | | |
Net Deferred Tax Assets | | $ | 6,462 | | | $ | 7,771 | |
| | | | | | | | |
F-32
BCSB BANKCORP, INC.
AND SUBSIDIARIES
Baltimore, Maryland
NOTES TO CONSOLIDATED FINANCIAL STATEMENTS
Note 15 –Income Taxes – continued
The amount computed by applying the statutory federal income tax rate to income before taxes is greater than the taxes provided for the following reasons:
| | | | | | | | | | | | | | | | | | | | | |
| | | For the Years Ended September 30, | |
| | | 2007 | | | 2006 | | | 2005 | |
(dollars in thousands) | | Amount | | | Percent of
Pretax
Income | | | Amount | | | Percent of
Pretax
Income | | | Amount | | | Percent of
Pretax
Income | |
Statutory federal income tax rate | | $ | (1,586 | ) | | (34.00 | )% | | $ | (3,890 | ) | | (34.00 | )% | | $ | 242 | | | 34.00 | % |
Changes Resulting From | | | | | | | | | | | | | | | | | | | | | |
Income from life insurance | | | (181 | ) | | (3.87 | ) | | | (183 | ) | | (1.60 | ) | | | (154 | ) | | (21.63 | ) |
Other | | | 22 | | | .47 | | | | 24 | | | .21 | | | | 23 | | | 3.23 | |
| | | | | | | | | | | | | | | | | | | | | |
| | $ | (1,745 | ) | | (37.40 | )% | | $ | (4,049 | ) | | (35.39 | )% | | $ | 111 | | | 15.60 | % |
| | | | | | | | | | | | | | | | | | | | | |
The Company and its subsidiaries file a consolidated income tax return on a fiscal year basis. The returns have been audited by the Internal Revenue Service through the year ended September 30, 1994.
As of September 30, 2007, the Company had net operating loss carryforwards of approximately $13.3 million which begin to expire in 2026. These net operating loss carryforwards may be used to offset future income taxes payable, however the Company may be subject to alternative minimum tax. Their realization is dependent on future taxable income.
Qualified thrift lenders such as the Bank are not required to provide a deferred tax liability for bad debt reserves for tax purposes that arose in fiscal years beginning before December 31, 1987. Such bad debt reserves for the Bank amounted to approximately $6.2 million with an income tax effect of approximately $2.4 million at September 30, 2007 This bad debt reserve would become taxable if certain conditions are met by the Bank.
Note 16 –Related Party Transactions
Director Michael J. Klein is a member holding a 20% ownership interest in Colgate Investments, LLC, a limited liability company that owns real property that the Bank leases for a branch office site. The Bank paid $70,000, $65,000 and $67,000 in rent to Colgate Investments, LLC during the years ended September 30, 2007, 2006 and 2005, respectively, and expects to pay $70,000 during the year ended September 30, 2008. The remaining 80% of Colgate Investments, LLC is owned by Mr. Klein’s siblings.
Note 17 –Disclosures About Fair Value of Financial Instruments
The estimated fair values of the Bank’s financial instruments are summarized below. The fair values of a significant portion of these financial instruments are estimates derived using present value techniques prescribed by the FASB and may not be indicative of the net realizable or liquidation values. Also, the calculation of estimated fair values is based on market conditions at a specific point in time and may not reflect current or future fair values.
The carrying amount is a reasonable estimate of fair value for cash, federal funds and interest-bearing deposits in other banks. Fair value is based upon market prices quoted by dealers for investment securities and mortgage backed securities. The carrying amount of Federal Home Loan Bank of Atlanta stock is a reasonable estimate of fair value. Loans receivable were discounted using a single discount rate, comparing the current rates at which similar loans would be made to borrowers
F-33
BCSB BANKCORP, INC.
AND SUBSIDIARIES
Baltimore, Maryland
NOTES TO CONSOLIDATED FINANCIAL STATEMENTS
with similar credit ratings and for the same remaining maturities. These rates were used for each aggregated category of loans as reported on the Office of Thrift Supervision Quarterly Report. The fair value of demand deposits, savings accounts and money market deposits is the amount payable on demand at the reporting date. Trust Preferred Securities are considered to be at fair value. The fair value of fixed-maturity certificates of deposit is estimated using the rates currently offered on deposits of similar remaining maturities. The fair value of Federal Home Loan Bank advances is estimated using rates currently offered on advances of similar remaining maturities. The carrying amounts of accrued interest receivable, accrued interest payable, and mortgage servicing rights approximate fair value. Fair values for off-balance-sheet, credit-related financial instruments are based on fees currently charged to enter into similar agreements, taking into account the remaining terms of the agreements and the counterparties’ credit standing.
The Company charges fees for commitments to extend credit. Interest rates on loans for which these commitments are extended are normally committed for periods of less than one month. Fees charged on standby letters of credit and other financial guarantees are deemed to be immaterial and these guarantees are expected to be settled at face amount or expire unused. It is impractical to assign any fair value to these commitments.
The estimated fair values of the Bank’s financial instruments are as follows:
| | | | | | | | | | | | |
| | | September 30, 2007 | | September 30, 2006 |
| | | Carrying
Amount | | Estimated
Fair Value | | Carrying
Amount | | Estimated
Fair Value |
| | | (Amounts in Thousands) |
Financial Assets | | | | | | | | | | | | |
Cash | | $ | 9,468 | | $ | 9,468 | | $ | 8,421 | | $ | 8,421 |
Interest bearing deposits in other banks | | | 17,121 | | | 17,121 | | | 2,854 | | | 2,854 |
Federal funds sold | | | 49,427 | | | 49,427 | | | 462 | | | 462 |
Interest bearing time deposits | | | 100 | | | 100 | | | 100 | | | 100 |
Investment securities – available for sale | | | 3,970 | | | 3,970 | | | 143,068 | | | 143,068 |
Investment securities – held to maturity | | | — | | | — | | | 4,496 | | | 4,488 |
| | | | |
Loans Receivable | | | | | | | | | | | | |
Mortgage loans | | | 384,426 | | | 379,784 | | | 412,120 | | | 402,508 |
Share loans | | | 1,230 | | | 1,230 | | | 1,256 | | | 1,256 |
Consumer loans | | | 30,646 | | | 31,137 | | | 50,400 | | | 51,063 |
Mortgage backed securities – available for sale | | | 104,999 | | | 104,999 | | | 86,801 | | | 86,801 |
Mortgage backed securities – held to maturity | | | — | | | — | | | 28,675 | | | 28,356 |
Federal Home Loan Bank of Atlanta stock | | | 2,270 | | | 2,270 | | | 6,972 | | | 6,972 |
Accrued interest receivable | | | 2,416 | | | 2,416 | | | 2,752 | | | 2,752 |
Mortgage servicing rights | | | 473 | | | 473 | | | 124 | | | 124 |
| | | | |
Financial Liabilities | | | | | | | | | | | | |
Deposits | | $ | 558,457 | | $ | 558,751 | | $ | 604,845 | | $ | 604,585 |
Federal Home Loan Bank of Atlanta advances | | | 20,000 | | | 19,947 | | | 118,473 | | | 118,378 |
Junior Subordinated Debt | | | 23,197 | | | 23,197 | | | 23,197 | | | 23,197 |
Accrued interest payable | | | 48 | | | 48 | | | 256 | | | 256 |
F-34
BCSB BANKCORP, INC.
AND SUBSIDIARIES
Baltimore, Maryland
NOTES TO CONSOLIDATED FINANCIAL STATEMENTS
Note 18 –Condensed Financial Information (Parent Company Only)
Information as to the financial condition of BCSB Bankcorp, Inc. as of September 30, 2007, and 2006 and the results of operations and cash flows for the years ended September 30, 2007, 2006, and 2005 are summarized below.
Statements of Financial Condition
| | | | | | |
| | | September 30, |
| | | 2007 | | 2006 |
| | | (in thousands) |
Assets | | | | | | |
Cash | | $ | — | | $ | 1,994 |
Interest bearing deposits in other banks | | | 2,116 | | | 33 |
Investment securities – available for sale | | | 1,000 | | | 3,258 |
Investment securities – held to maturity | | | — | | | 1,496 |
Employee Stock Ownership Plan loan | | | 182 | | | 364 |
Accrued interest receivable | | | 26 | | | 39 |
Investment in subsidiaries | | | 50,504 | | | 47,888 |
Prepaid and deferred income taxes | | | 2,307 | | | 48 |
Other assets | | | 1,026 | | | 732 |
| | | | | | |
Total assets | | $ | 57,161 | | $ | 55,852 |
| | | | | | |
Liabilities and Stockholders’ Equity | | | | | | |
| | |
Liabilities | | | | | | |
Junior Subordinated Debentures | | $ | 23,197 | | $ | 23,197 |
Other liabilities | | | 518 | | | 479 |
| | | | | | |
| | | 23,715 | | | 23,676 |
Total stockholders’ equity | | | 33,446 | | | 32,176 |
| | | | | | |
Total liabilities and stockholders’ equity | | $ | 57,161 | | $ | 55,852 |
| | | | | | |
F-35
BCSB BANKCORP, INC.
AND SUBSIDIARIES
Baltimore, Maryland
NOTES TO CONSOLIDATED FINANCIAL STATEMENTS
Note 18 –Condensed Financial Information (Parent Company Only) – Continued
| | | | | | | | | | | | |
| | | Years Ended September 30, | |
| | | 2007 | | | 2006 | | | 2005 | |
| | | (in thousands) | |
Statements of Operations | | | | | | | | | | | | |
Interest and fees on loans | | $ | 18 | | | $ | 27 | | | $ | 29 | |
Interest and dividends on investment securities | | | 222 | | | | 367 | | | | 311 | |
Other interest income | | | 62 | | | | 17 | | | | 35 | |
| | | | | | | | | | | | |
Total interest income | | | 302 | | | | 411 | | | | 375 | |
Interest on borrowings | | | 2,055 | | | | 1,921 | | | | 1,464 | |
| | | | | | | | | | | | |
Net interest (expense) | | | (1,753 | ) | | | (1,510 | ) | | | (1,089 | ) |
| | | |
Other income | | | (117 | ) | | | (46 | ) | | | — | |
| | | |
Non interest expense | | | | | | | | | | | | |
Professional fees | | | 280 | | | | 102 | | | | 93 | |
Other expenses | | | 208 | | | | 215 | | | | 220 | |
| | | | | | | | | | | | |
Total non-interest expense | | | 488 | | | | 317 | | | | 313 | |
| | | | | | | | | | | | |
Loss before tax benefit | | | (2,358 | ) | | | (1,873 | ) | | | (1,402 | ) |
| | | |
Income tax benefit | | | (802 | ) | | | (637 | ) | | | (477 | ) |
| | | | | | | | | | | | |
Loss before equity in net (loss) income of subsidiary | | | (1,556 | ) | | | (1,236 | ) | | | (925 | ) |
Equity in net (loss) income of subsidiary | | | (1,365 | ) | | | (6,157 | ) | | | 1,526 | |
| | | | | | | | | | | | |
Net (loss) income | | $ | (2,921 | ) | | $ | (7,393 | ) | | $ | 601 | |
| | | | | | | | | | | | |
| |
| | | Years Ended September 30, | |
| | | 2006 | | | 2006 | | | 2005 | |
| | | (in thousands) | |
Statements of Cash Flows | | | | | | | | | | | | |
Net (loss) income | | $ | (2,921 | ) | | $ | (7,393 | ) | | $ | 601 | |
Adjustments to reconcile Net Income to Net Cash Used By Operating Activities | | | | | | | | | | | | |
Accretion of discount on investments | | | (4 | ) | | | — | | | | 2 | |
Loss (gain) on sale of investments | | | 117 | | | | 46 | | | | — | |
Equity in net (loss) income of subsidiary | | | 1,365 | | | | 6,157 | | | | (1,526 | ) |
(Increase) decrease in accrued interest receivable | | | 13 | | | | (12 | ) | | | 12 | |
Decrease (increase) in prepaid taxes | | | (2,307 | ) | | | 51 | | | | 461 | |
Decrease in receivable from subsidiary | | | 182 | | | | 183 | | | | 183 | |
Decrease (increase) in other assets | | | (294 | ) | | | 154 | | | | (324 | ) |
Decrease in income taxes payable | | | — | | | | — | | | | (174 | ) |
Increase in other liabilities | | | 40 | | | | 44 | | | | 60 | |
Noncash compensation under stock-based benefit plan | | | — | | | | 52 | | | | 52 | |
| | | | | | | | | | | | |
Net cash used by operating activities | | | (3,810 | ) | | | (718 | ) | | | (653 | ) |
F-36
BCSB BANKCORP, INC.
AND SUBSIDIARIES
Baltimore, Maryland
NOTES TO CONSOLIDATED FINANCIAL STATEMENTS
Note 18 –Condensed Financial Information (Parent Company Only) – Continued
| | | | | | | | | | | | |
| | | Years Ended September 30, | |
| | | 2007 | | | 2006 | | | 2005 | |
| | | (in thousands) | |
Cash Flows from Investing Activities | | | | | | | | | | | | |
Proceeds from maturities of investment securities – held to maturity | | $ | 500 | | | $ | 500 | | | $ | 500 | |
Proceeds from sale of investment securities – available for sale | | | 3,345 | | | | 2,376 | | | | — | |
Purchase of investment securities – available for sale | | | (80 | ) | | | (257 | ) | | | (210 | ) |
| | | | | | | | | | | | |
Net cash provided by investing activities | | | 3,765 | | | | 2,619 | | | | 290 | |
| | | |
Cash Flows from Financing Activities | | | | | | | | | | | | |
Treasury Stock repurchase | | | — | | | | (2 | ) | | | (5 | ) |
Exercised options | | | 134 | | | | 15 | | | | 115 | |
Dividends paid | | | — | | | | (1,059 | ) | | | (1,045 | ) |
| | | | | | | | | | | | |
Net cash provided (used) by financing activities | | | 134 | | | | (1,046 | ) | | | (935 | ) |
| | | |
Increase (decrease) in cash and cash equivalents | | | 89 | | | | 855 | | | | (1,298 | ) |
Cash and cash equivalents at beginning of period | | | 2,027 | | | | 1,172 | | | | 2,470 | |
| | | | | | | | | | | | |
Cash and cash equivalents at end of period | | $ | 2,116 | | | $ | 2,027 | | | $ | 1,172 | |
| | | | | | | | | | | | |
F-37
BCSB BANKCORP, INC.
AND SUBSIDIARIES
Baltimore, Maryland
NOTES TO CONSOLIDATED FINANCIAL STATEMENTS
Note 19 –Quarterly Financial Date (Unaudited)
Summarized unaudited quarterly financial data for the year ended September 30, 2007 is as follows:
Operating Summary:
| | | | | | | | | | | | | | | |
| | | First
Quarter | | | Second Quarter | | | Third
Quarter | | Fourth
Quarter | |
| | | (in thousands except per share data) | |
Interest Income | | $ | 10,230 | | | $ | 9,975 | | | $ | 9,655 | | $ | 9,252 | |
Interest Expense | | | 7,139 | | | | 6,877 | | | | 5,869 | | | 5,632 | |
| | | | | | | | | | | | | | | |
Net Interest Income | | | 3,091 | | | | 3,098 | | | | 3,786 | | | 3,620 | |
Provision for Loan Losses | | | 55 | | | | 62 | | | | — | | | — | |
| | | | | | | | | | | | | | | |
Net Interest Income after provision for loan losses | | | 3,036 | | | | 3,036 | | | | 3,786 | | | 3,620 | |
Other Income | | | 382 | | | | (7,022 | ) | | | 808 | | | 497 | |
Other Expenses | | | 3,829 | | | | 588 | | | | 3,747 | | | 4,645 | |
| | | | | | | | | | | | | | | |
Income (loss) before income tax expense (benefit) | | | (411 | ) | | | (4,574 | ) | | | 847 | | | (528 | ) |
Income taxes expense (benefit) | | | (178 | ) | | | (1,593 | ) | | | 247 | | | (221 | ) |
| | | | | | | | | | | | | | | |
Net Income (loss) | | $ | (233 | ) | | $ | (2,981 | ) | | $ | 600 | | $ | (307 | ) |
| | | | | | | | | | | | | | | |
Per share date: | | | | | | | | | | | | | | | |
Basic and diluted earnings per share | | $ | (.04 | ) | | $ | (.51 | ) | | $ | .11 | | $ | (.06 | ) |
F-38
BCSB BANKCORP, INC.
AND SUBSIDIARIES
Baltimore, Maryland
NOTES TO CONSOLIDATED FINANCIAL STATEMENTS
Note 19 –Quarterly Financial Date (Unaudited) – Continued
Summarized unaudited quarterly financial data for the year ended September 30, 2006 is as follows:
Operating Summary:
| | | | | | | | | | | | | | | | |
| | | First
Quarter | | | Second
Quarter | | | Third
Quarter | | | Fourth
Quarter | |
| | | (in thousands except per share data) | |
Interest Income | | $ | 9,596 | | | $ | 9,881 | | | $ | 10,179 | | | $ | 10,339 | |
Interest Expense | | | 5,970 | | | | 6,135 | | | | 6,607 | | | | 7,064 | |
| | | | | | | | | | | | | | | | |
Net Interest Income | | | 3,626 | | | | 3,746 | | | | 3,572 | | | | 3,275 | |
Provision for Loan Losses | | | 6 | | | | 126 | | | | 20 | | | | 42 | |
| | | | | | | | | | | | | | | | |
Net Interest Income after provision for loan losses | | | 3,620 | | | | 3,620 | | | | 3,552 | | | | 3,233 | |
Other Income | | | 380 | | | | 385 | | | | 400 | | | | 336 | |
Other Expenses | | | 4,275 | | | | 3,893 | | | | 14,445 | | | | 4,355 | |
| | | | | | | | | | | | | | | | |
Income ( loss) before income tax benefit | | | 275 | | | | 112 | | | | (10,493 | ) | | | (786 | ) |
Tax benefit | | | (156 | ) | | | (2 | ) | | | (3,603 | ) | | | (288 | ) |
| | | | | | | | | | | | | | | | |
Net Income (loss) | | $ | (119 | ) | | $ | 114 | | | $ | (6,890 | ) | | $ | (498 | ) |
| | | | | | | | | | | | | | | | |
Per share date: | | | | | | | | | | | | | | | | |
Basic and diluted earnings per share | | $ | (.02 | ) | | $ | .02 | | | $ | (1.18 | ) | | $ | (.08 | ) |
F-39
BCSB BANKCORP, INC.
AND SUBSIDIARIES
Baltimore, Maryland
NOTES TO CONSOLIDATED FINANCIAL STATEMENTS
Note 20 –Conversion and Reorganization
On February 14, 2007, the Board of Directors of BCSB Bankcorp, Inc. (the “Company”), Baltimore County Savings Bank, F.S.B. (the “Bank”) and Baltimore County Savings Bank, M.H.C. (the “MHC”), unanimously adopted a Plan of Conversion and Reorganization (the “Plan”), pursuant to which Baltimore County Savings Bank, F.S.B. will reorganize from the mutual holding company structure to the stock holding company structure. Pursuant to the terms of the Plan, the MHC will convert from the mutual form to a federal interim stock savings association and simultaneously merge with and into Baltimore County Savings Bank, with Baltimore County Savings Bank as survivor. Additionally, BCSB Bankcorp, Inc. will convert to a federal interim stock savings association and simultaneously merge with and into Baltimore County Savings Bank, with Baltimore County Savings Bank as survivor. Baltimore County Savings Bank will form a new Maryland corporation that will acquire all of the outstanding shares of Baltimore County Savings Bank’s common stock. Shares of BCSB Bankcorp, Inc’s common stock, other than those held by the MHC, will be converted into shares of the new Maryland corporation pursuant to an exchange ratio designed to approximate the percentage ownership interests of such persons.
The Plan of Conversion and Reorganization is subject to the approval of: (1) the Office of Thrift Supervision; (2) at least a majority of the total number of votes eligible to be cast by members of the MHC; (3) the holders of at least two-thirds of the outstanding shares BCSB Bankcorp, Inc. common stock; and (4) at least a majority of outstanding shares held by holders of BCSB Bankcorp, Inc. common stock other than the MHC. The new Maryland holding company will offer shares of its common stock for sale to Baltimore County Savings Bank’s eligible account holders, to Baltimore County Savings Bank’s tax-qualified employee benefit plans and to members of the general public in a subscription and community offering in the manner and subject to the priorities set forth in the Plan. The highest priority will be depositors with qualifying deposits as of December 31, 2005. At the time of the Conversion and Reorganization, the Bank will establish a liquidation account. The function of the liquidation account will be to preserve the rights of certain holders of Deposit Accounts in the Bank who maintain such accounts in the Bank following the Conversion and Reorganization to receive a priority in any distributions in the unlikely event of a liquidation of the Bank subsequent to the Conversion and Reorganization.
Through September 30, 2007 the Company has incurred $1.2 million in costs associated with this offering. These costs will be a reduction of the proceeds from the offering. If the Company determines that it is unable to successfully complete the offering, these costs will be expensed in the period in which that determination is made.
F-40
SIGNATURES
Pursuant to the requirements of Section 13 or 15(d) of the Securities Exchange Act of 1934, the registrant has duly caused this report to be signed on its behalf by the undersigned, thereunto duly authorized.
| | | | | | |
| | | | | BCSB BANKCORP, INC. |
| | | |
| December 28, 2007 | | | | | | |
| | | | By: | | /s/ Joseph J. Bouffard |
| | | | | | Joseph J. Bouffard |
| | | | | | President and Chief Executive Officer |
Pursuant to the requirements of the Securities Exchange Act of 1934, this report has been signed below by the following persons on behalf of the registrant and in the capacities and on the dates indicated.
| | | | |
/s/ Joseph J. Bouffard | | | | December 28, 2007 |
| Joseph J. Bouffard | | | | |
| President and Chief Executive Officer | | | | |
| (Principal Executive Officer) | | | | |
| | |
/s/ Anthony R. Cole | | | | December 28, 2007 |
| Anthony R. Cole | | | | |
| Executive Vice President and Chief Financial Officer | | | | |
| (Principal Financial and Accounting Officer) | | | | |
| | |
/s/ Henry V. Kahl | | | | December 28, 2007 |
| Henry V. Kahl | | | | |
| Chairman of the Board | | | | |
| | |
/s/ H. Adrian Cox | | | | December 28, 2007 |
| H. Adrian Cox | | | | |
| Vice Chairman of the Board | | | | |
| | |
/s/ William J. Kappauf, Jr. | | | | December 28, 2007 |
| William J. Kappauf, Jr. | | | | |
| Director | | | | |
| | |
/s/ William M. Loughran | | | | December 28, 2007 |
| William M. Loughran | | | | |
| Director | | | | |
| | |
/s/ John J. Panzer, Jr. | | | | December 28, 2007 |
| John J. Panzer, Jr. | | | | |
| Director | | | | |
| | |
/s/ Michael J. Klein | | | | December 28, 2007 |
| Michael J. Klein | | | | |
| Director | | | | |
| | |
/s/ Ernest A. Moretti | | | | December 28, 2007 |
| Ernest A. Moretti | | | | |
| Director | | | | |