|
Exhibit IV 
|
First Quarter 2016 Earnings Presentation April 26, 2016 Capital Product Partners L.P. www.capitalpplp.com capital product partners l.p. cplp nasdaq listed
|
|
CAPITAL PRODUCT PARTNERS L.P. Forward Looking Statements This presentation contains forward-looking statements (as defined in Section 21E of the Securities Exchange Act of 1934, as amended) which reflect CPLP’s management’s current assumptions and expectations with respect to expected future events and performance. The statements in this presentation that are not historical facts, including, among other things, cash generation, our ability to repay external debt, future earnings, our expectations regarding employment of our vessels, redelivery dates and charter rates, fleet growth, as well as market and charter rate expectations, charterer’s performance, and our expectations or objectives regarding future distribution amounts, our ability to pursue growth opportunities and grow our distributions and annual distribution guidance, may be forward-looking statements (as such term is defined in Section 21E of the Securities Exchange Act of 1934, as amended). These forward-looking statements involve risks and uncertainties that could cause actual results to be materially different from those expressed or implied in the forward-looking statements. Factors that could cause actual results to be materially different include those set forth in the “Risk Factors” section of our annual report on Form 20-F filed with the U.S. Securities and Exchange Commission. Unless required by law, we expressly disclaim any obligation to update or revise any of these forward-looking statements, whether because of future events, new information, a change in our views or expectations, to conform them to actual results or otherwise. We assume no responsibility for the accuracy and completeness of the forward-looking statements. We make no prediction or statement about the performance of our units. For more information about the Partnership, please visit our website: www.capitalpplp.com 1
|
|
CAPITAL PRODUCT PARTNERS L.P. First Quarter 2016 Highlights Cash distribution for 1Q2016 of $0.075 per common unit and $0.21375 per class B unit. 1.7x common unit distribution coverage after setting aside $14.6 million as a new capital reserve. Net income for 1Q2016: $12.1 million. Hyundai Merchant Marine Ltd (‘HMM’) engaged in restructuring process that may, among other things, result in a reduction of the charter hire rate for the 5 vessels currently employed with HMM. Drydocking of the M/T ‘Anemos I’ and M/T ‘Alkiviadis’. Successful delivery of the M/V ‘CMA CGM Magdalena’ with 5-year charter to CMA-CGM in February 2016. Fixed the M/V ‘Agamemnon’ and M/V ‘Archimidis’ for 12+12 months. Average remaining charter duration 6.2 years with 92% charter coverage for 2016 and 73% charter coverage for 2017 (including HMM charters). 2
|
|
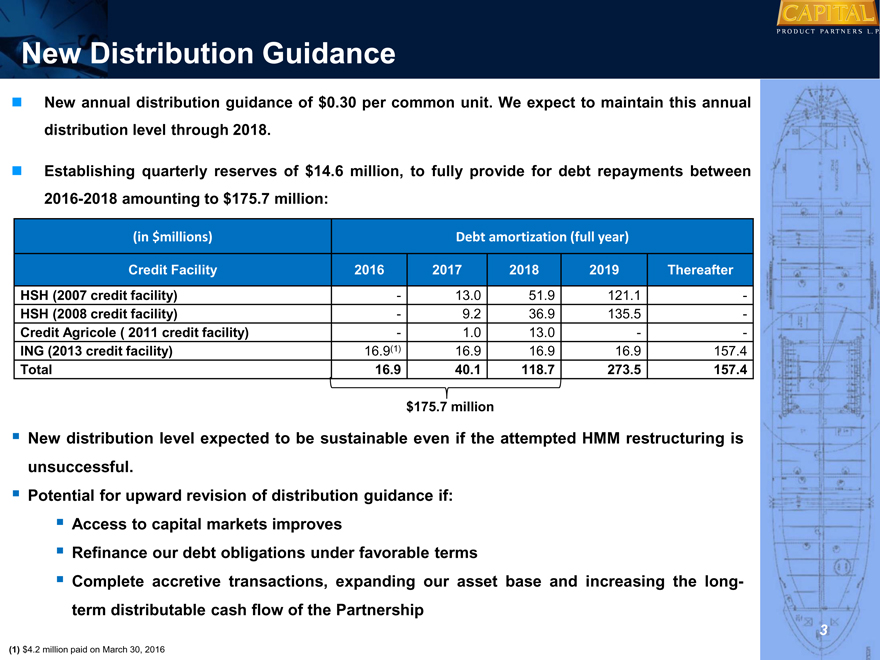
CAPITAL PRODUCT PARTNERS L.P. New Distribution Guidance New annual distribution guidance of $0.30 per common unit. We expect to maintain this annual Revised Distribution Guidance distribution level through 2018. Establishing quarterly reserves of $14.6 million, to fully provide for debt repayments between 2016-2018 amounting to $175.7 million: (in $millions) Debt amortization (full year) Credit Facility 2016 2017 2018 2019 Thereafter HSH (2007 credit facility)—13.0 51.9 121.1—HSH (2008 credit facility)—9.2 36.9 135.5—Credit Agricole ( 2011 credit facility)—1.0 13.0 — ING (2013 credit facility) 16.9(1) 16.9 16.9 16.9 157.4 Total 16.9 40.1 118.7 273.5 157.4 $175.7 million New distribution level expected to be sustainable even if the attempted HMM restructuring is unsuccessful. Potential for upward revision of distribution guidance if: Access to capital markets improves Refinance our debt obligations under favorable terms Complete accretive transactions, expanding our asset base and increasing the long-term distributable cash flow of the Partnership (1) $4.2 million paid on March 30, 2016 3
|
|
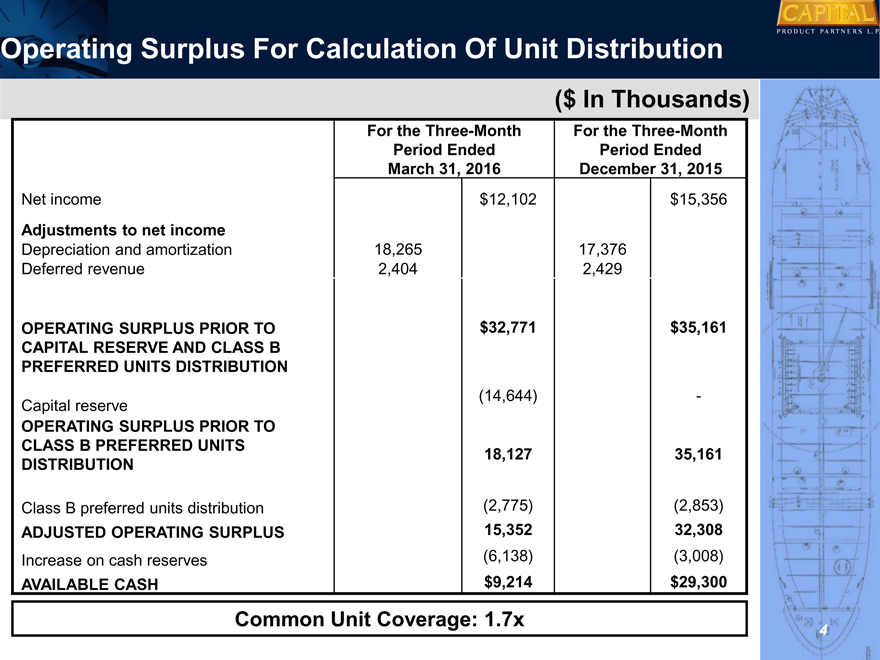
CAPITAL PRODUCT PARTNERS L.P. Operating Surplus For Calculation Of Unit Distribution ($ In Thousands) For the Three-Month For the Three-Month Period Ended Period Ended March 31, 2016 December 31, 2015 Net income $12,102 $15,356 Adjustments to net income Depreciation and amortization 18,265 17,376 Deferred revenue 2,404 2,429 OPERATING SURPLUS PRIOR TO $32,771 $35,161 CAPITAL RESERVE AND CLASS B PREFERRED UNITS DISTRIBUTION Capital reserve(14,644)—OPERATING SURPLUS PRIOR TO CLASS B PREFERRED UNITS 18,127 35,161 DISTRIBUTION Class B preferred units distribution (2,775) (2,853) ADJUSTED OPERATING SURPLUS 15,352 32,308 Increase on cash reserves (6,138) (3,008) AVAILABLE CASH $9,214 $29,300 Common Unit Coverage: 1.7x 4
|

|
Statements Of Comprehensive Income CAPITAL PRODUCT PARTNERS L.P. ($ In Thousands) For the Three- Month Period For the Three- Month Period Ended Ended March 31, 2016 March 31, 2015 Revenues $47,329 $30,130 Revenues – related party 10,718 18,755 Total Revenues 58,047 48,885 Expenses: Voyage expenses 1,852 1,044 Voyage expenses – related party 101 89 Vessel operating expenses 16,719 12,812 Vessel operating expenses – related party 2,616 2,955 General and administrative expenses 1,265 1,837 Depreciation & amortization 17,453 14,374 Operating income 18,041 15,774 Other income (expense), net Interest expense and finance cost(6,097)(4,696) Other income 158 1,073 Total other expense, net(5,939)(3,623) Partnership’s net income $12,102 $12,151 5
|
|
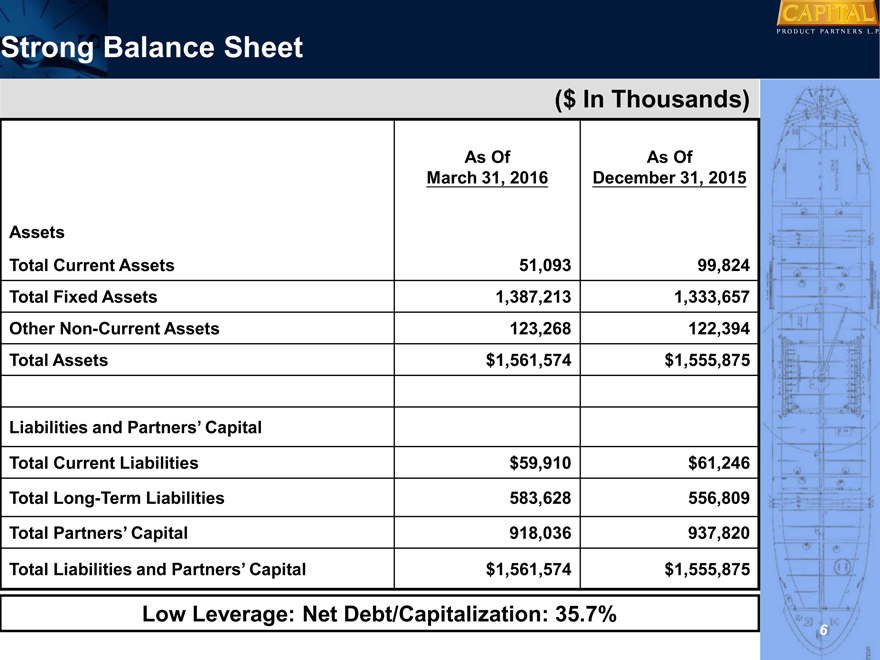
Strong Balance Sheet CAPITAL PRODUCT PARTNERS L.P. ($ In Thousands) As Of As Of March 31, 2016 December 31, 2015 Assets Total Current Assets 51,093 99,824 Total Fixed Assets 1,387,213 1,333,657 Other Non-Current Assets 123,268 122,394 Total Assets $1,561,574 $1,555,875 Liabilities and Partners’ Capital Total Current Liabilities $59,910 $61,246 Total Long-Term Liabilities 583,628 556,809 Total Partners’ Capital 918,036 937,820 Total Liabilities and Partners’ Capital $1,561,574 $1,555,875 Low Leverage: Net Debt/Capitalization: 35.7% 6
|
|
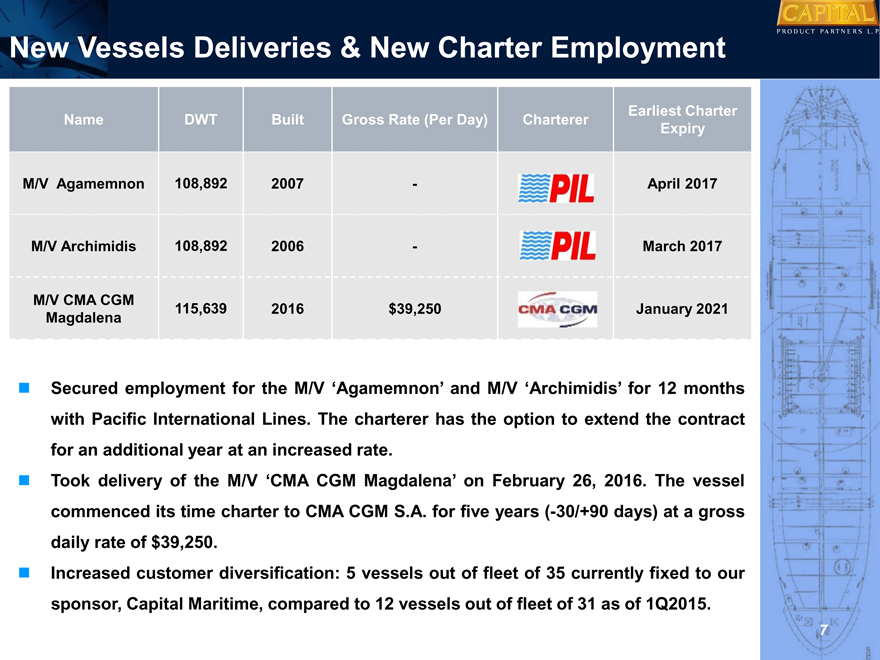
New Vessels Deliveries & New Charter Employment CAPITAL PRODUCT PARTNERS L.P. Earliest Charter Name DWT Built Gross Rate (Per Day) Charterer Expiry M/V Agamemnon 108,892 2007—April 2017 M/V Archimidis 108,892 2006—March 2017 M/V CMA CGM 115,639 2016 $39,250 January 2021 Magdalena Secured employment for the M/V ‘Agamemnon’ and M/V ‘Archimidis’ for 12 months with Pacific International Lines. The charterer has the option to extend the contract for an additional year at an increased rate. Took delivery of the M/V ‘CMA CGM Magdalena’ on February 26, 2016. The vessel commenced its time charter to CMA CGM S.A. for five years (-30/+90 days) at a gross daily rate of $39,250. Increased customer diversification: 5 vessels out of fleet of 35 currently fixed to our sponsor, Capital Maritime, compared to 12 vessels out of fleet of 31 as of 1Q2015. 7
|
|
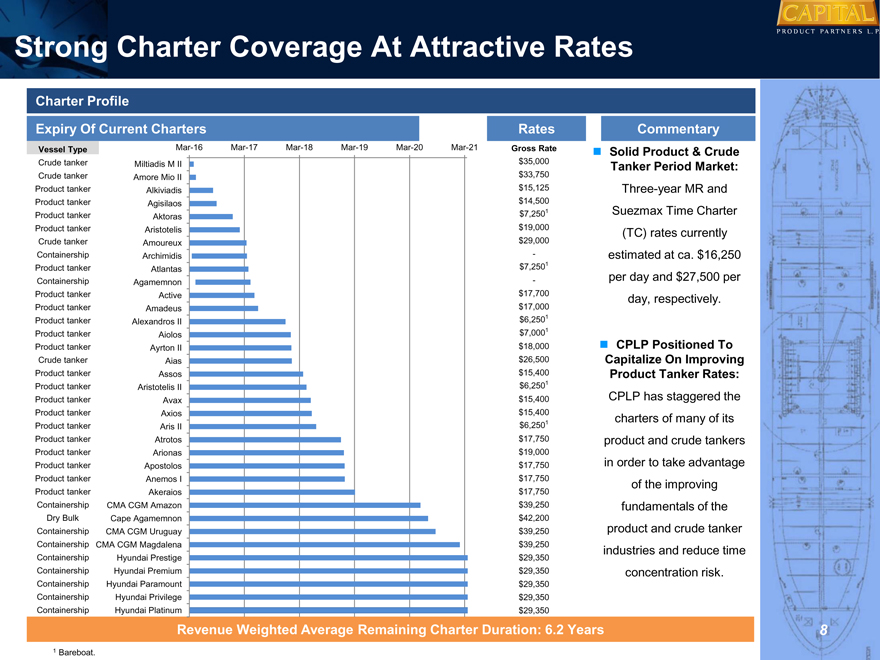
CAPITAL PRODUCT PARTNERS L.P. Strong Charter Coverage At Attractive Rates Charter Profile Expiry Of Current Charters Rates Commentary Vessel Type Mar-16 Mar-17 Mar-18 Mar-19 Mar-20 Mar-21 Gross Rate ? Solid Product & Crude Crude tanker Miltiadis M II $ 35,000 Tanker Period Market: Crude tanker Amore Mio II $ 33,750 Product tanker Alkiviadis $ 15,125 Three-year MR and Product tanker Agisilaos $ 14,500 Product tanker Aktoras $7,2501 Suezmax Time Charter Product tanker Aristotelis $ 19,000(TC) rates currently Crude tanker Amoureux $ 29,000 Containership Archimidis—estimated at ca. $16,250 Product tanker Atlantas $7,2501 Containership Agamemnon—per day and $27,500 per Product tanker Active $ 17,700 day, respectively. Product tanker Amadeus $ 17,000 Product tanker Alexandros II $6,2501 Product tanker Aiolos $7,0001 Product tanker Ayrton II $ 18,000 CPLP Positioned To Crude tanker Aias $ 26,500 Capitalize On Improving Product tanker Assos $ 15,400 Product Tanker Rates: Product tanker Aristotelis II $6,2501 Product tanker Avax $ 15,400 CPLP has staggered the Product tanker Axios $ 15,400 charters of many of its Product tanker Aris II $6,2501 Product tanker Atrotos $ 17,750 product and crude tankers Product tanker Arionas $ 19,000 Product tanker Apostolos $ 17,750 in order to take advantage Product tanker Anemos I $ 17,750 of the improving Product tanker Akeraios $ 17,750 Containership CMA CGM Amazon $ 39,250 fundamentals of the Dry Bulk Cape Agamemnon $ 42,200 Containership CMA CGM Uruguay $ 39,250 product and crude tanker Containership CMA CGM Magdalena $ 39,250 industries and reduce time Containership Hyundai Prestige $ 29,350 Containership Hyundai Premium $ 29,350 concentration risk. Containership Hyundai Paramount $ 29,350 Containership Hyundai Privilege $ 29,350 Containership Hyundai Platinum $ 29,350 Revenue Weighted Average Remaining Charter Duration: 6.2 Years 1 Bareboat. 8
|
|
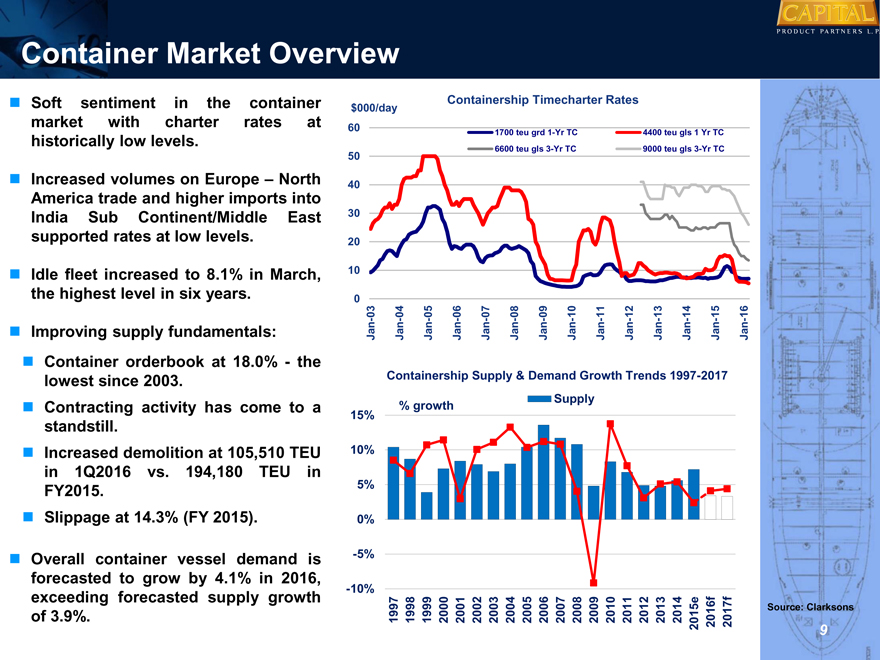
CAPITAL PRODUCT PARTNERS L.P. Container Market Overview Soft sentiment in the container market with charter rates at historically low levels. Increased volumes on Europe – North America trade and higher imports into India Sub Continent/Middle East supported rates at low levels. Idle fleet increased to 8.1% in March, the highest level in six years. Improving supply fundamentals: Container orderbook at 18.0%—the lowest since 2003. Contracting activity has come to a standstill. Increased demolition at 105,510 TEU in 1Q2016 vs. 194,180 TEU in FY2015. Slippage at 14.3% (FY 2015). Overall container vessel demand is forecasted to grow by 4.1% in 2016, exceeding forecasted supply growth of 3.9%. Containership Timecharter Rates $000/day 60 1700 teu grd 1-Yr TC 4400 teu gls 1 Yr TC 6600 teu gls 3-Yr TC 9000 teu gls 3-Yr TC 50 40 30 20 10 0 03 04 05 06 07 08 09 10 11 12 13 14 15 16 — — — — — — — Jan Jan Jan Jan Jan Jan Jan Jan Jan Jan Jan Jan Jan Jan Containership Supply & Demand Growth Trends 1997-2017 % growth Supply 15% 10% 5% 0% -5% -10% 1997 1998 1999 2000 2001 2002 2003 2004 2005 2006 2007 2008 2009 2010 2011 2012 2013 2014 2015e 2016f 2017f Source: Clarksons 9
|
|
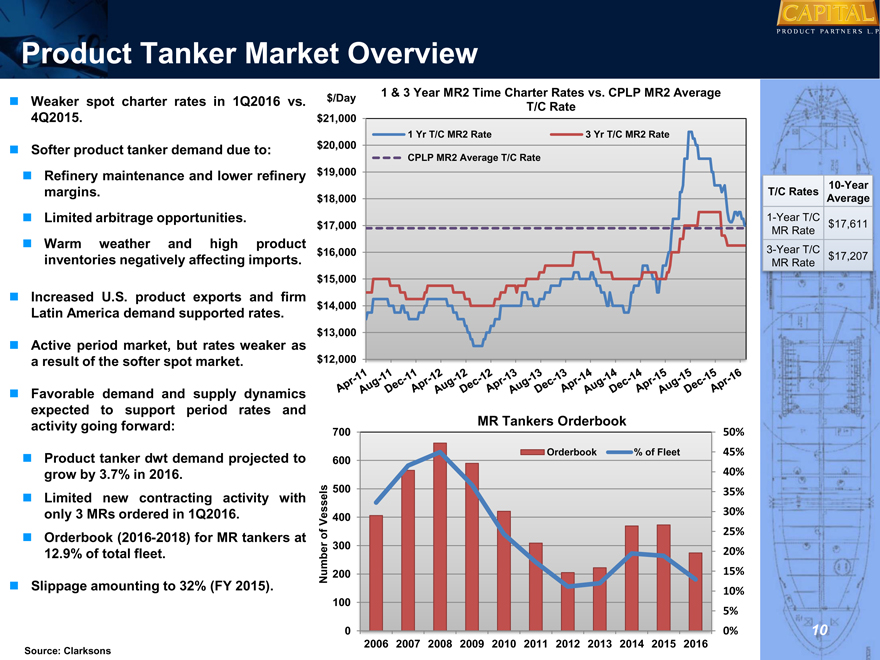
Product Tanker Market Overview CAPITAL PRODUCT PARTNERS L.P. Weaker spot charter rates in 1Q2016 vs. 4Q2015. Softer product tanker demand due to: Refinery maintenance and lower refinery margins. Limited arbitrage opportunities. Warm weather and high product inventories negatively affecting imports. Increased U.S. product exports and firm Latin America demand supported rates. Active period market, but rates weaker as a result of the softer spot market. Favorable demand and supply dynamics expected to support period rates and activity going forward: Product tanker dwt demand projected to grow by 3.7% in 2016. Limited new contracting activity with only 3 MRs ordered in 1Q2016. Orderbook (2016-2018) for MR tankers at 12.9% of total fleet. Slippage amounting to 32% (FY 2015). Source: Clarksons $/Day 1 & 3 Year MR2 Time Charter Rates vs. CPLP MR2 Average T/C Rate $21,000 1 Yr T/C MR2 Rate 3 Yr T/C MR2 Rate $20,000 CPLP MR2 Average T/C Rate $19,000 $18,000 $17,000 $16,000 $15,000 $14,000 $13,000 $12,000 MR Tankers Orderbook 700 50% Orderbook% of Fleet 45% 600 40% 500 35% Vessels 400 30% of 25% 300 20% Number 200 15% 10% 100 5% 0 0% 2006 2007 2008 2009 2010 2011 2012 2013 2014 2015 2016 T/C Rates 10-Year Average 1-Year T/C $ 17,611 MR Rate 3-Year T/C $ 17,207 MR Rate
|
|
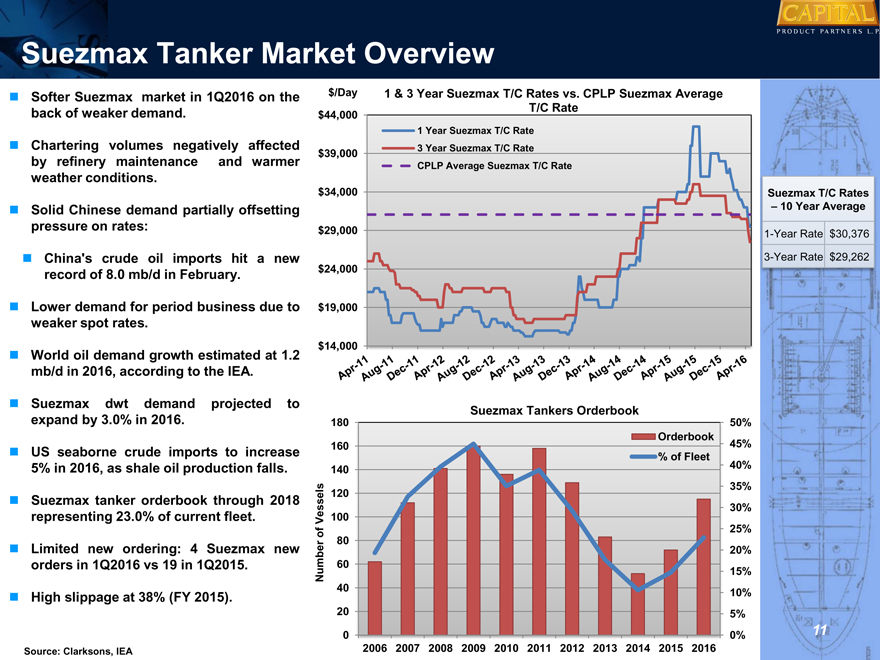
Suezmax Tanker Market Overview CAPITAL PRODUCT PARTNERS L.P. Softer Suezmax market in 1Q2016 on the back of weaker demand. Chartering volumes negatively affected by refinery maintenance and warmer weather conditions. Solid Chinese demand partially offsetting pressure on rates: China’s crude oil imports hit a new record of 8.0 mb/d in February. Lower demand for period business due to weaker spot rates. World oil demand growth estimated at 1.2 mb/d in 2016, according to the IEA. Suezmax dwt demand projected to expand by 3.0% in 2016. US seaborne crude imports to increase 5% in 2016, as shale oil production falls. Suezmax tanker orderbook through 2018 representing 23.0% of current fleet. Limited new ordering: 4 Suezmax new orders in 1Q2016 vs 19 in 1Q2015. High slippage at 38% (FY 2015). Source: Clarksons, IEA $/Day 1 & 3 Year Suezmax T/C Rates vs. CPLP Suezmax Average $44,000 T/C Rate 1 Year Suezmax T/C Rate $39,000 3 Year Suezmax T/C Rate CPLP Average Suezmax T/C Rate $34,000 $29,000 $24,000 $19,000 $14,000 Suezmax Tankers Orderbook 180 50% Orderbook 160 45% % of Fleet 140 40% 120 35% 30% Vessels 100 of 25% 80 20% Number 60 15% 40 10% 20 5% 0 0% 2006 2007 2008 2009 2010 2011 2012 2013 2014 2015 2016 Suezmax T/C Rates – 10 Year Average 1-Year Rate $ 30,376 3-Year Rate $ 29,262 11
|
|
Capital Product Partners L.P. CAPITAL PRODUCT PARTNERS L.P. 12