
©PROS Holdings, Inc. All rights reserved. November 10, 2016 PROS Holdings PROS Holdings 2016 Analyst Day
2©PROS Holdings, Inc. All rights reserved. Forward Looking Statements This presentation contains forward-looking statements based on current management expectations including, but not limited to, those related to our financial and business projections. These forward-looking statements involve known and unknown risks and uncertainties that may cause actual results to differ materially from those anticipated in this presentation. Factors that could cause actual results to differ materially from those described herein include: (a) our ability to execute on our cloud-first strategy, (b) reduced revenue and cash flow resulting from our transition to a cloud-first strategy, (c) threats to the security of our or our customer’s data, (d) potential business or service disruptions from our third party data centers, cloud platform providers or other unrelated service providers, (e) market acceptance of our new products and product enhancements, (f) the risk that the markets for our software does not grow as anticipated, (g) the length of our sales cycles, (h) the risk that we will not be able to maintain historical maintenance, support and subscription renewal rates, (i) competition from vendors of sales, pricing, revenue management and configure-price-quote solutions as well as from companies internally developing their own solutions, (j) potential unauthorized or improper actions of our personnel, (k) the risk that acquisitions we have and may enter into in the future may be difficult to integrate, fail to achieve our objectives, disrupt our business, dilute stockholder value or divert management attention, (l) any downturn in sales to our target markets, (m) potential delays or other challenges related to the implementation of our solutions, (n) the difficulties of making accurate estimates necessary to complete a project and recognize revenue, (o) personnel risks associated with growing a business generally, (p) the impact that a slowdown in the world or any particular economy has on our business sales cycles, prospects’ and customers’ spending decisions, timing of implementation decisions, payment and renewal decision, (q) our debt repayment obligations, (r) the impact of currency fluctuations on our results of operations, and (s) civil and political unrest in geographic regions in which we operate. We refer you to our filings with the Securities and Exchange Commission, which discuss important risk factors that are beyond the ability of the Company to control or predict. Potential investors should not place undue reliance on forward-looking statements, which are based upon management’s plans, estimates and expectations only as of the date of this presentation. Any information regarding our product offerings, future updates or other planned modifications is subject to ongoing evaluation and therefore subject to change. This information is provided without warranty of any kind, express or implied. Customers who purchase our offerings should make their purchase decision based upon features that are currently available. We assume no obligation to update any forward-looking information contained in this presentation.
3©PROS Holdings, Inc. All rights reserved. Use of GAAP and Non-GAAP Financial Information PROS has provided in this release certain financial measures, including, but not limited to, non-GAAP revenue, gross margin, EBITDA and bookings, that have not been prepared in accordance with GAAP. We use non-GAAP financial measures internally in analyzing our financial results and are among the primary factors our management uses in planning for and forecasting future periods. As a result, we believe these measures are useful to investors, as a supplement to GAAP measures, in evaluating our ongoing operational performance. Our use of non-GAAP financial measures may not be consistent with the presentations by similar companies in our industry. These non‐GAAP financial measures are not meant to be considered in isolation or as a substitute for comparable GAAP measures and should be read only in conjunction with our consolidated financial statements prepared in accordance with GAAP. Investors are encouraged to review the reconciliation of our historical non‐GAAP financial measures to the comparable GAAP results, which can be found, along with other financial information, on the investor relations’ page of our website at PROS.com. We are unable to reconcile forward-looking non-GAAP financial measures to their directly comparable GAAP financial measures because the information needed to complete a reconciliation is unavailable at this time without unreasonable effort.
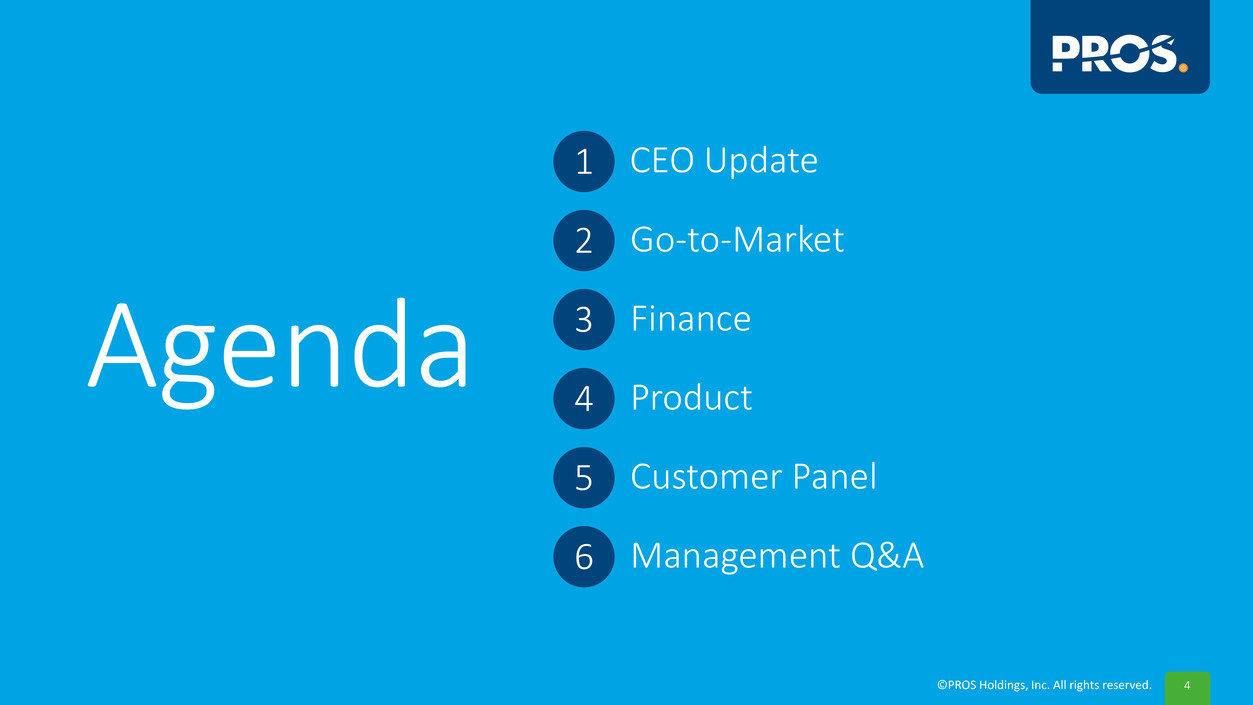
4©PROS Holdings, Inc. All rights reserved. Agenda 1 CEO Update 2 Go-to-Market 3 Finance 4 Product 5 Customer Panel 6 Management Q&A
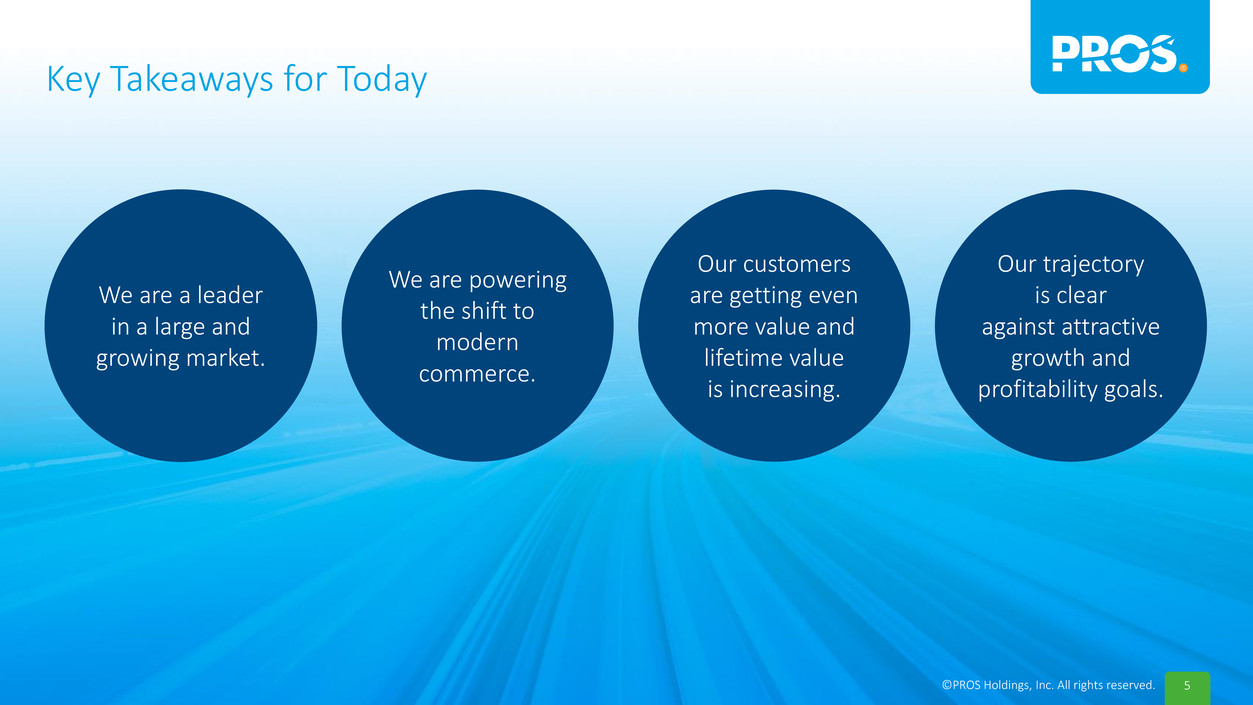
5©PROS Holdings, Inc. All rights reserved. Key Takeaways for Today We are a leader in a large and growing market. We are powering the shift to modern commerce. Our customers are getting even more value and lifetime value is increasing. Our trajectory is clear against attractive growth and profitability goals.
6©PROS Holdings, Inc. All rights reserved. CEO Update Andres Reiner | President and CEO

7©PROS Holdings, Inc. All rights reserved. Culture Video Will Be Here

8©PROS Holdings, Inc. All rights reserved. A Breakthrough Year
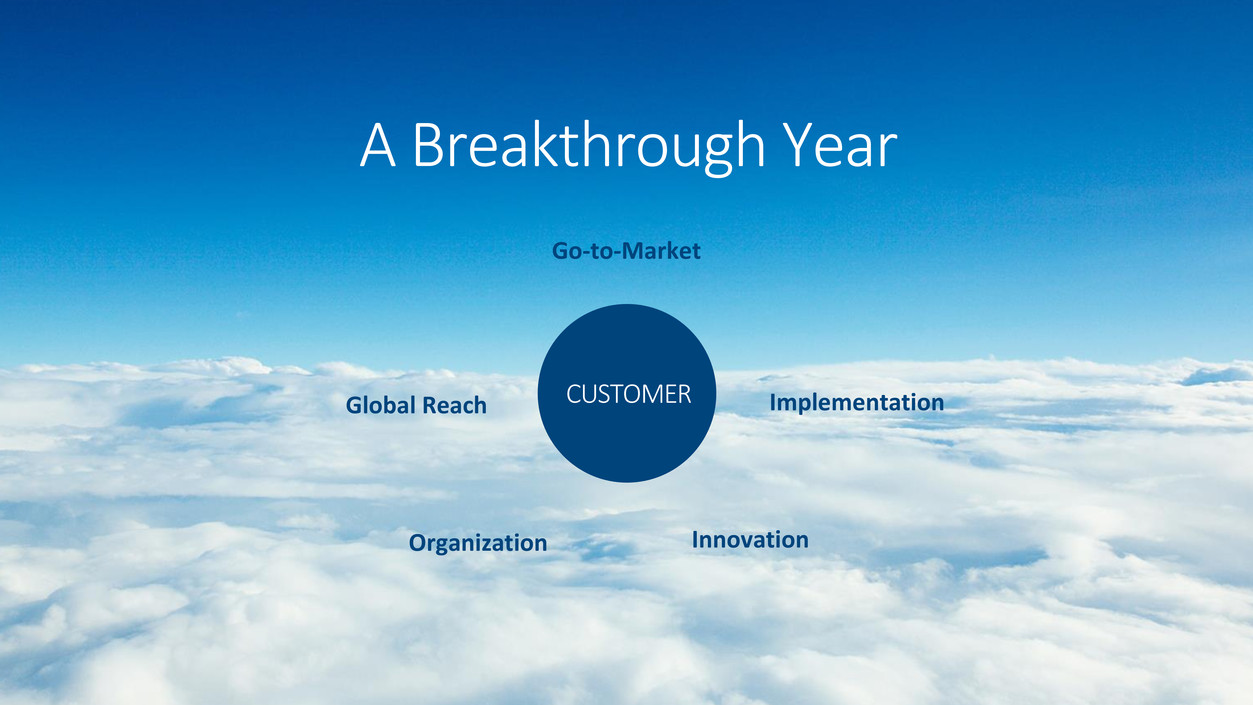
9©PROS Holdings, Inc. All rights reserved. A Breakthrough Year Go-to-Market Implementation Organization Global Reach Innovation CUSTOMER

10©PROS Holdings, Inc. All rights reserved. A Breakthrough Year Faster Sales Cycles and Expansion

11©PROS Holdings, Inc. All rights reserved. St. Gobain video
12©PROS Holdings, Inc. All rights reserved. Companies must move to a modern commerce strategy or risk getting left behind. Frictionless Personalized Rational Real-time

13©PROS Holdings, Inc. All rights reserved. It’s a Home Game Now.

14©PROS Holdings, Inc. All rights reserved. Presenters John Billings John Salch Ajay Damani Stefan SchulzChris Jones

15©PROS Holdings, Inc. All rights reserved. Go-to-Market John Billings | SVP Travel
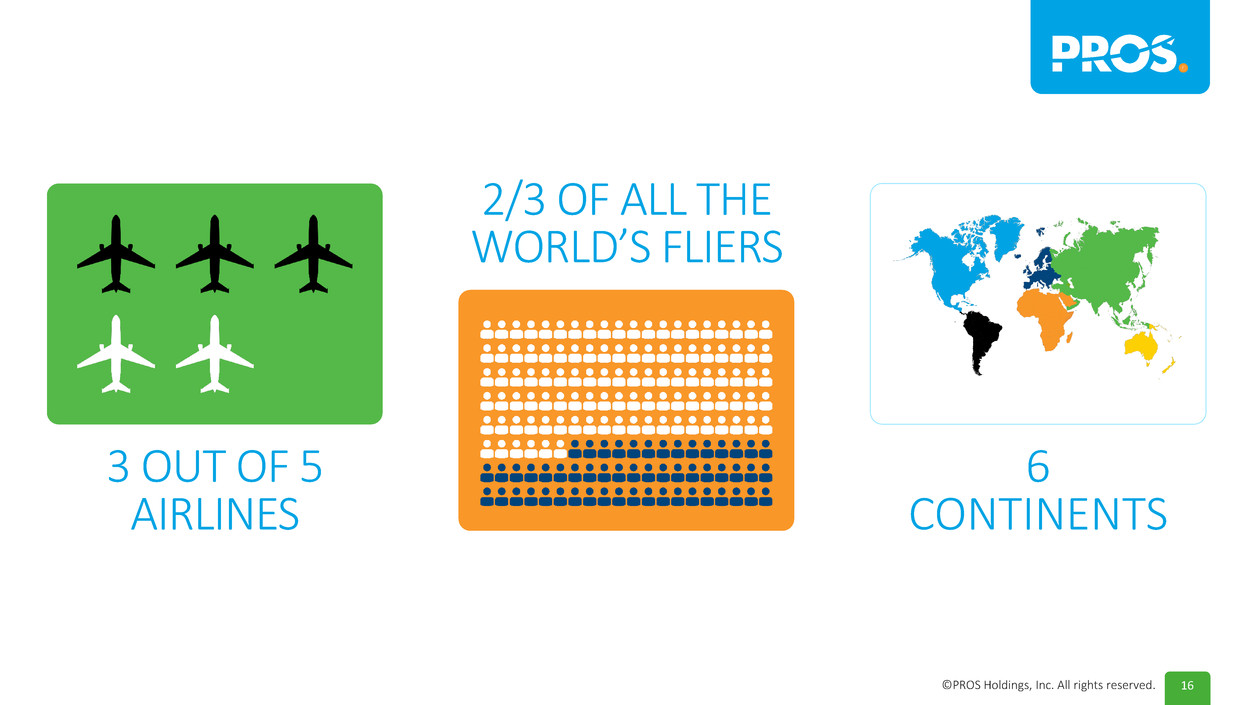
16©PROS Holdings, Inc. All rights reserved. 3 OUT OF 5 AIRLINES 2/3 OF ALL THE WORLD’S FLIERS 6 CONTINENTS
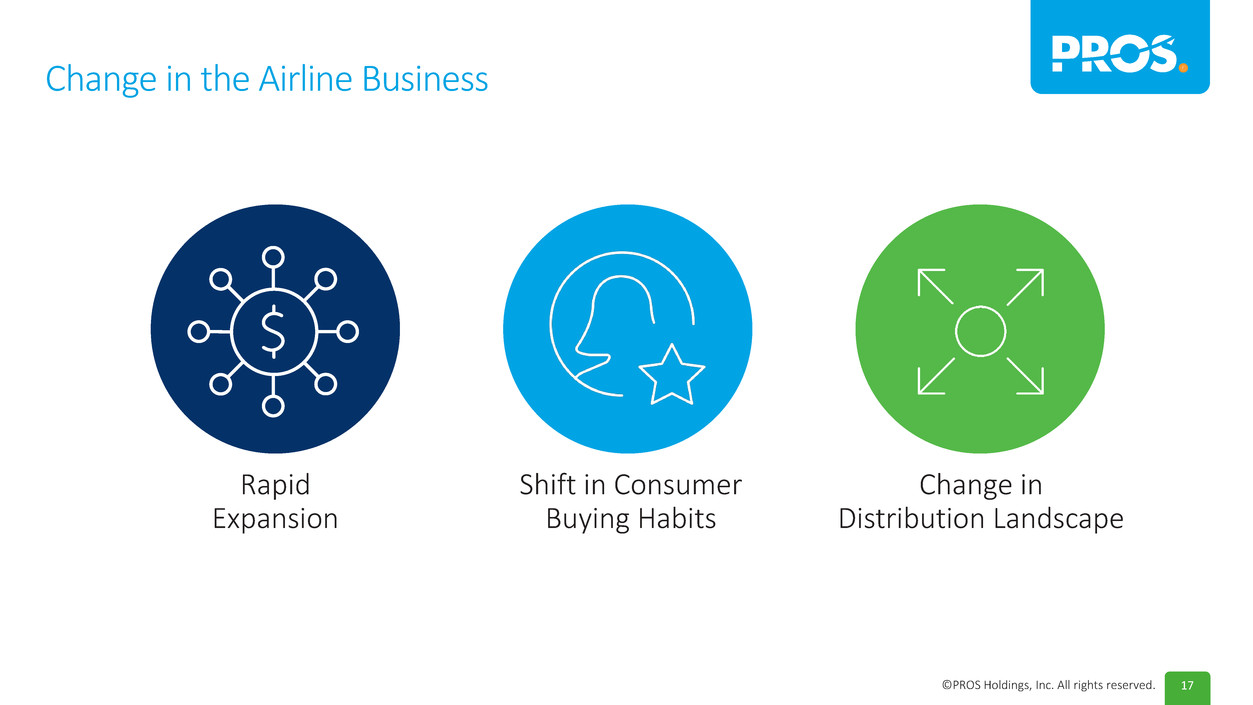
17©PROS Holdings, Inc. All rights reserved. Change in the Airline Business Rapid Expansion Shift in Consumer Buying Habits Change in Distribution Landscape
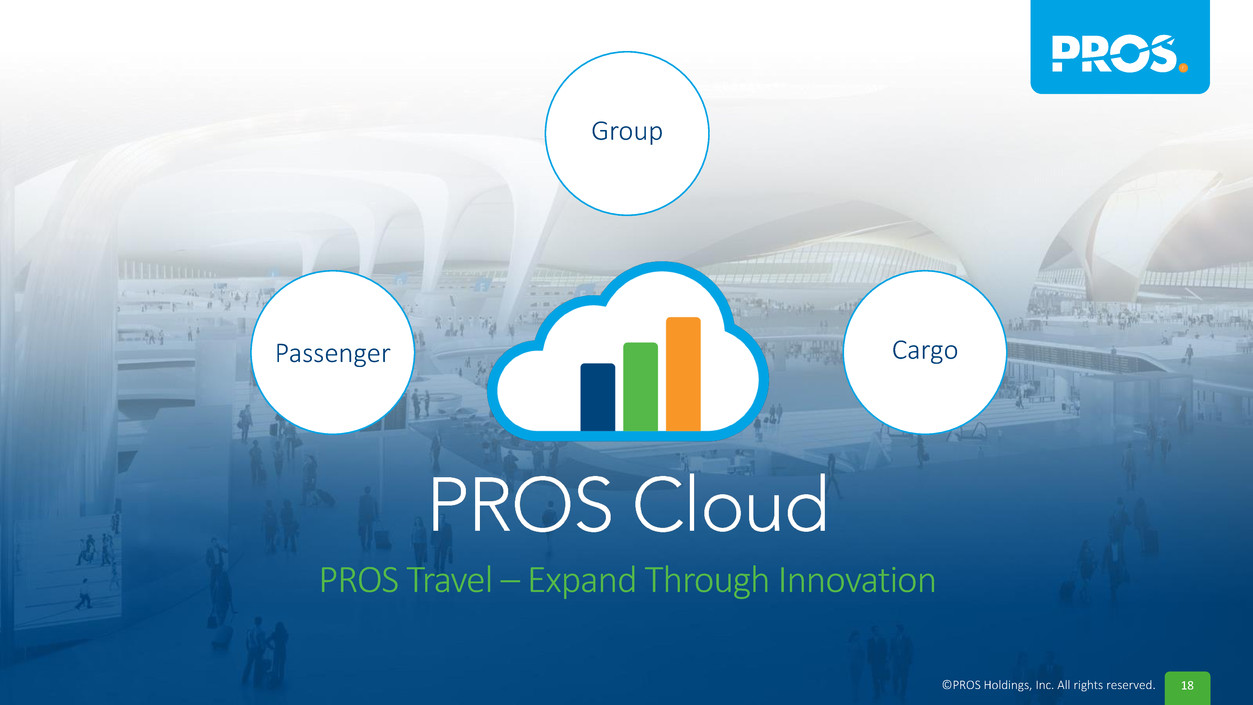
18©PROS Holdings, Inc. All rights reserved. Passenger Group Cargo PROS Travel – Expand Through Innovation

19©PROS Holdings, Inc. All rights reserved. Go-to-Market Chris Jones |SVP Sales, Americas
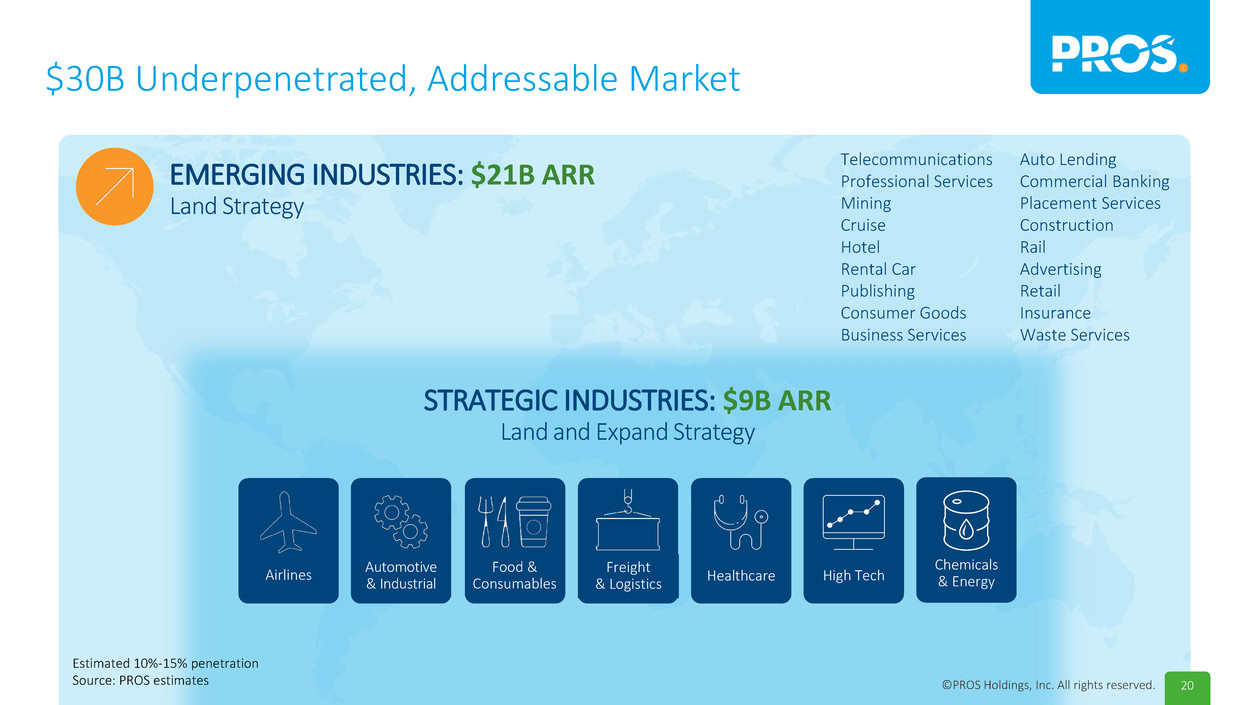
20©PROS Holdings, Inc. All rights reserved. EMERGING INDUSTRIES: $21B ARR Land Strategy STRATEGIC INDUSTRIES: $9B ARR Land and Expand Strategy $30B Underpenetrated, Addressable Market Telecommunications Professional Services Mining Cruise Hotel Rental Car Publishing Consumer Goods Business Services Food & Consumables Healthcare Automotive & Industrial Freight & Logistics Airlines High Tech Chemicals & Energy Estimated 10%-15% penetration Source: PROS estimates Auto Lending Commercial Banking Placement Services Construction Rail Advertising Retail Insurance Waste Services
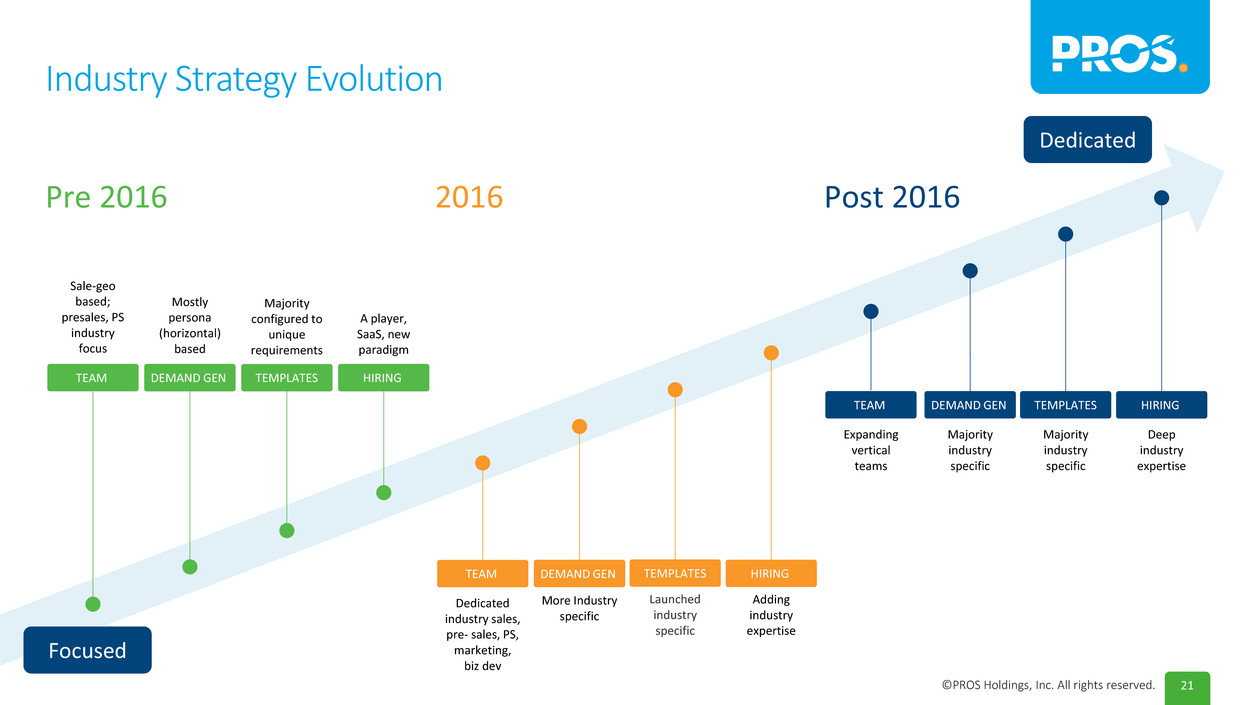
21©PROS Holdings, Inc. All rights reserved. Dedicated Industry Strategy Evolution Post 20162016Pre 2016 Focused TEAM Sale-geo based; presales, PS industry focus Mostly persona (horizontal) based DEMAND GEN Majority configured to unique requirements TEMPLATES A player, SaaS, new paradigm HIRING Dedicated industry sales, pre- sales, PS, marketing, biz dev TEAM More Industry specific DEMAND GEN Launched industry specific TEMPLATES Adding industry expertise HIRING Expanding vertical teams TEAM Majority industry specific DEMAND GEN Majority industry specific TEMPLATES Deep industry expertise HIRING
22©PROS Holdings, Inc. All rights reserved. Execution Behind the Strategy Lessons Learned from 2015 Science of Sales Execution Focus to Drive Productivity and Growth
23©PROS Holdings, Inc. All rights reserved.
24©PROS Holdings, Inc. All rights reserved.
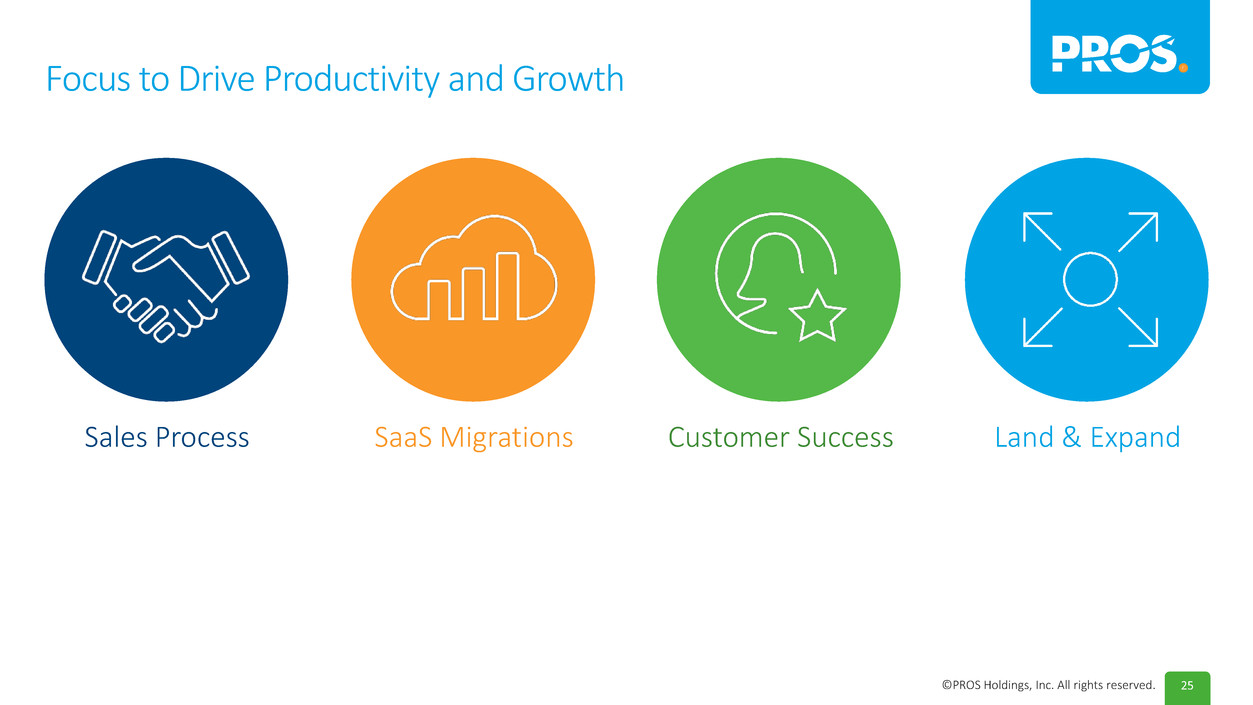
25©PROS Holdings, Inc. All rights reserved. Focus to Drive Productivity and Growth Customer SuccessSaaS MigrationsSales Process Land & Expand
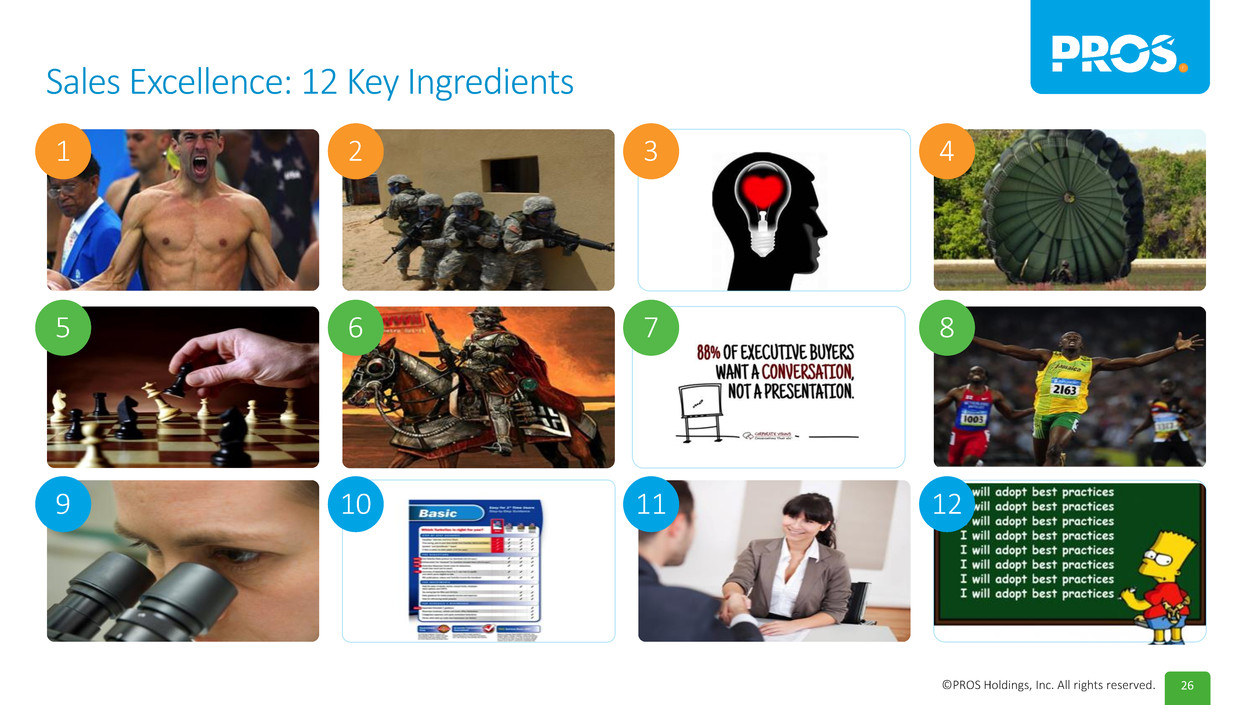
26©PROS Holdings, Inc. All rights reserved. Sales Excellence: 12 Key Ingredients 1 2 3 4 5 6 7 8 9 10 11 12

27©PROS Holdings, Inc. All rights reserved. Finance Stefan Schulz |EVP & Chief Financial Officer

28©PROS Holdings, Inc. All rights reserved. Key Discussion Points What We’ve Learned in the Last 512 Days SaaS Value Measures Financial Model Leading Indicators
29©PROS Holdings, Inc. All rights reserved. What We Thought in June 2015 #1 Customers Are Ready #2 PROS is Ready
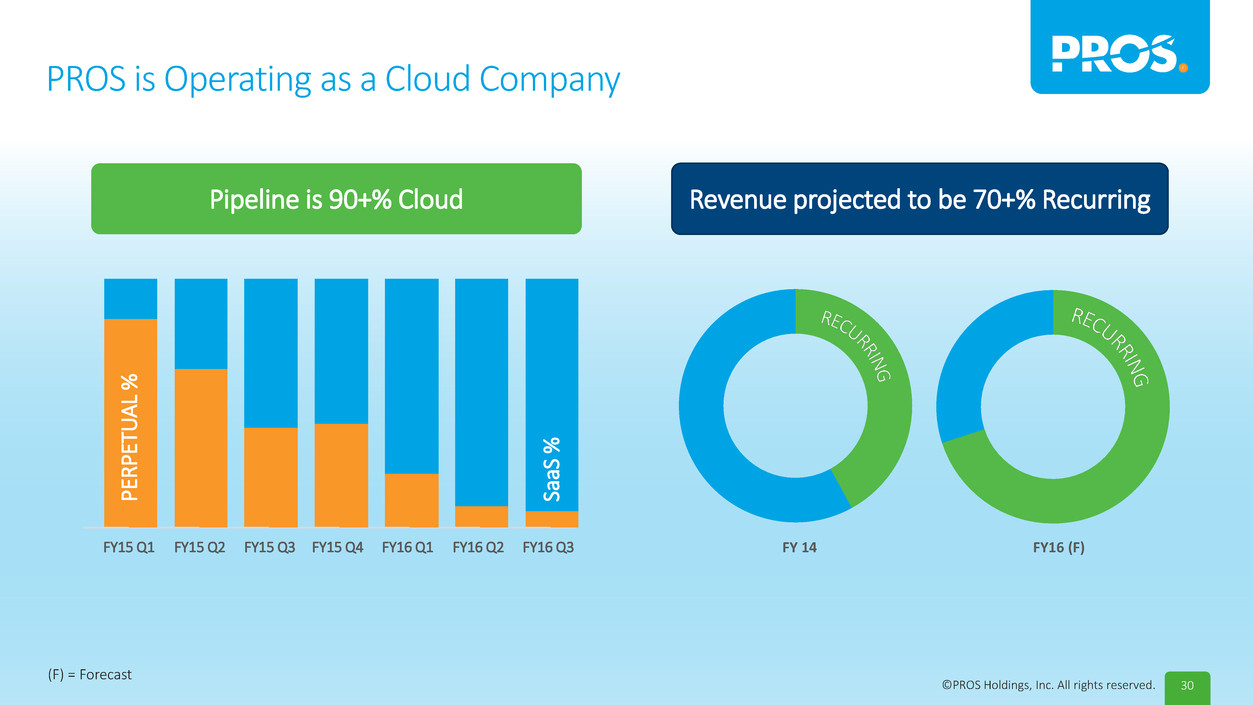
30©PROS Holdings, Inc. All rights reserved. PROS is Operating as a Cloud Company Pipeline is 90+% Cloud FY15 Q1 FY15 Q2 FY15 Q3 FY15 Q4 FY16 Q1 FY16 Q2 FY16 Q3 Revenue projected to be 70+% Recurring FY 14 FY16 (F) P ER PE TU A L % Sa aS % (F) = Forecast
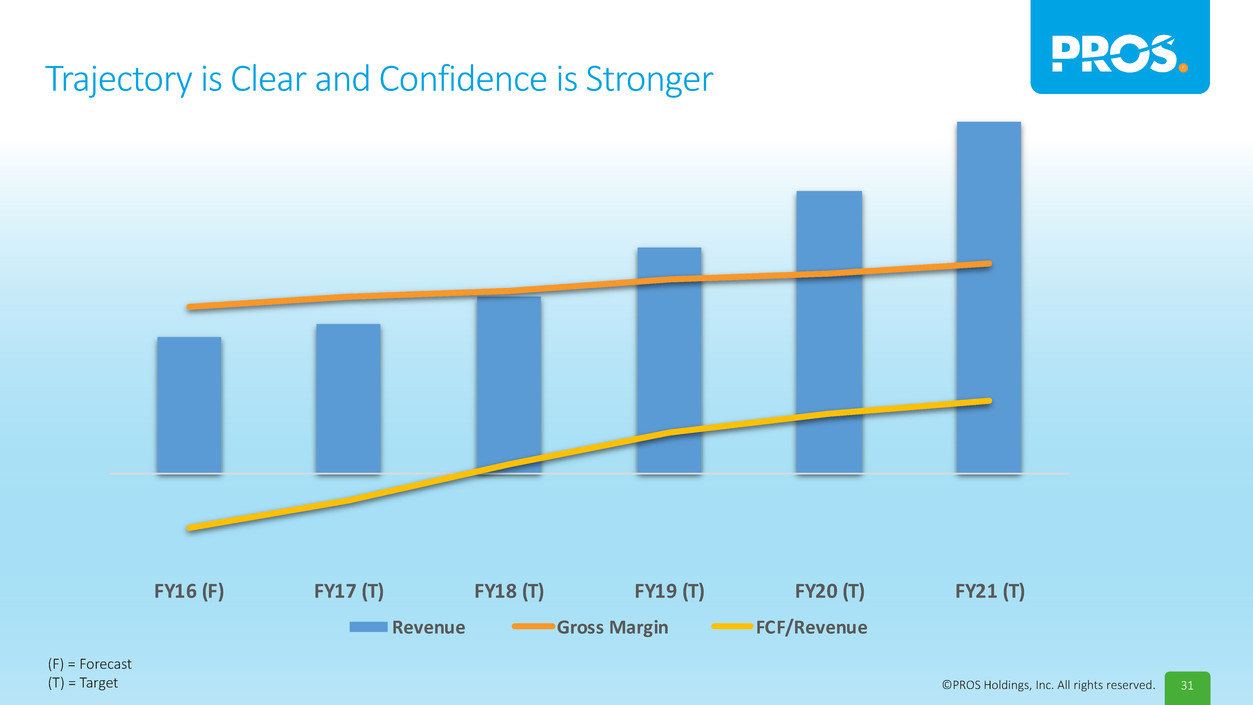
31©PROS Holdings, Inc. All rights reserved. Trajectory is Clear and Confidence is Stronger FY16 (F) FY17 (T) FY18 (T) FY19 (T) FY20 (T) FY21 (T) Revenue Gross Margin FCF/Revenue (F) = Forecast (T) = Target

32©PROS Holdings, Inc. All rights reserved. We Also Learned Some Things Along the Way Underestimated impact of change on sales execution Less variability and seasonality of SaaS versus on premise PROS has all the assets we need to execute as a cloud company

33©PROS Holdings, Inc. All rights reserved. Key Discussion Points What We’ve Learned in the Last 511 Days SaaS Value Measures Financial Model Leading Indicators
34©PROS Holdings, Inc. All rights reserved. OUR MISSION: To help our customers, and the people who work for them, Outperform.
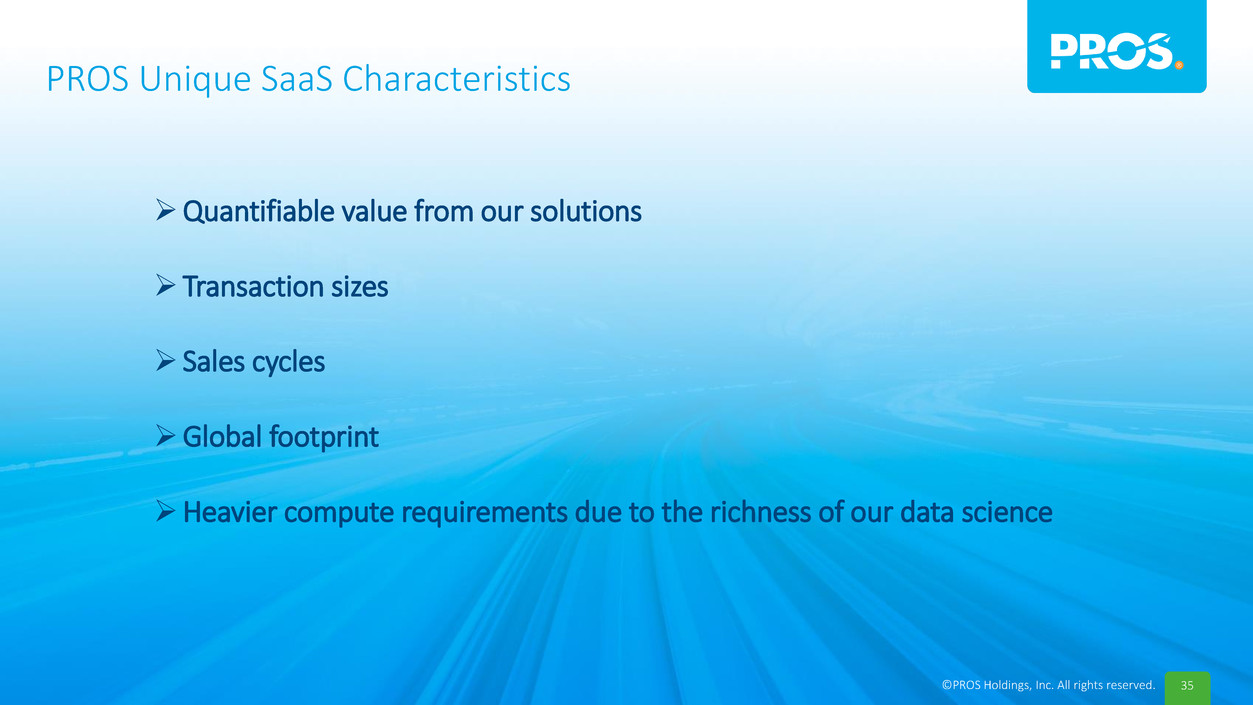
35©PROS Holdings, Inc. All rights reserved. PROS Unique SaaS Characteristics Quantifiable value from our solutions Transaction sizes Sales cycles Global footprint Heavier compute requirements due to the richness of our data science
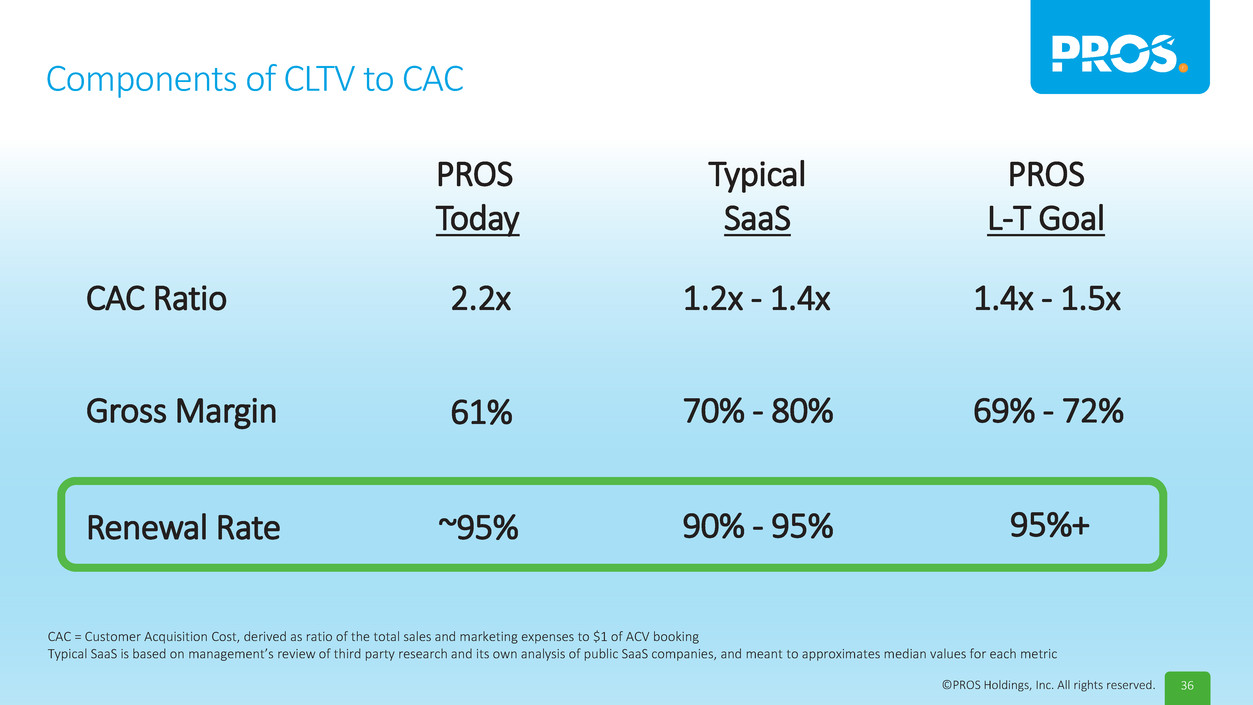
36©PROS Holdings, Inc. All rights reserved. Components of CLTV to CAC CAC = Customer Acquisition Cost, derived as ratio of the total sales and marketing expenses to $1 of ACV booking Typical SaaS is based on management’s review of third party research and its own analysis of public SaaS companies, and meant to approximates median values for each metric CAC Ratio 1.2x - 1.4x 1.4x - 1.5x2.2x Gross Margin 61% 70% - 80% 69% - 72% Renewal Rate ~95% 90% - 95% 95%+ PROS Today Typical SaaS PROS L-T Goal
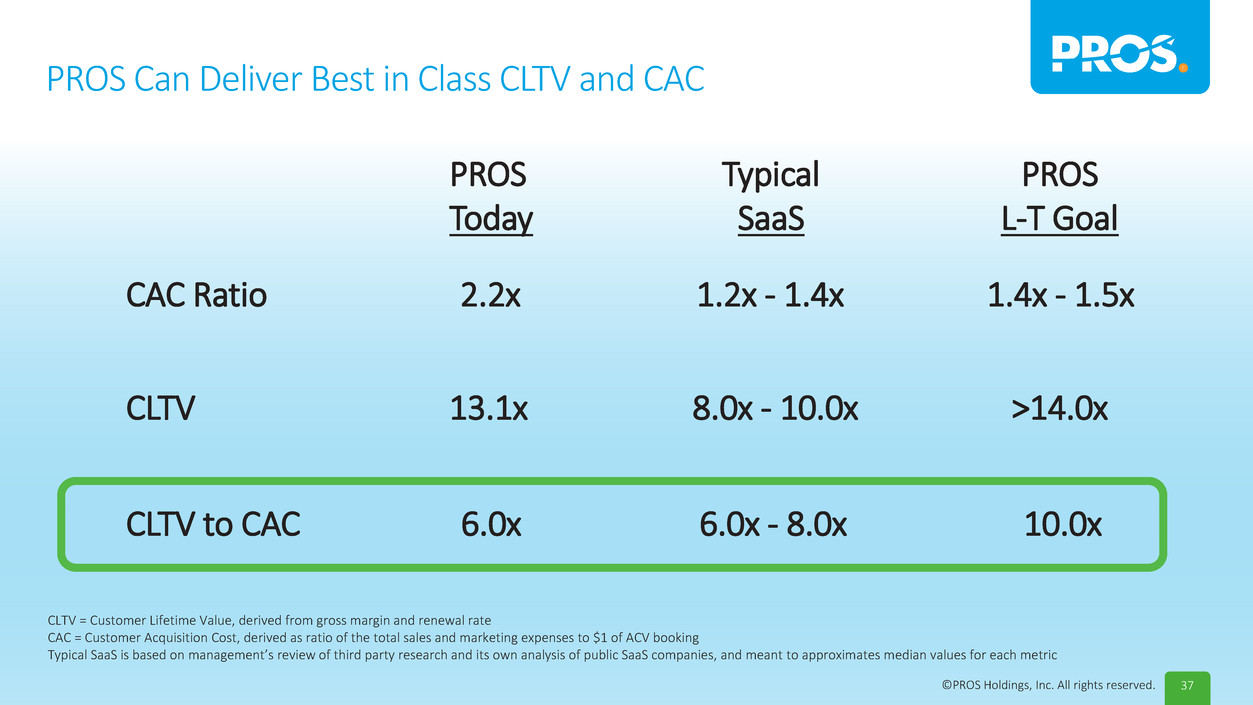
37©PROS Holdings, Inc. All rights reserved. PROS Can Deliver Best in Class CLTV and CAC 1.2x - 1.4x 1.4x - 1.5x2.2x 13.1x 8.0x - 10.0x >14.0x CAC Ratio CLTV CLTV to CAC 6.0x 6.0x - 8.0x 10.0x PROS Today Typical SaaS PROS L-T Goal CLTV = Customer Lifetime Value, derived from gross margin and renewal rate CAC = Customer Acquisition Cost, derived as ratio of the total sales and marketing expenses to $1 of ACV booking Typical SaaS is based on management’s review of third party research and its own analysis of public SaaS companies, and meant to approximates median values for each metric

38©PROS Holdings, Inc. All rights reserved. A Long History of Expansions
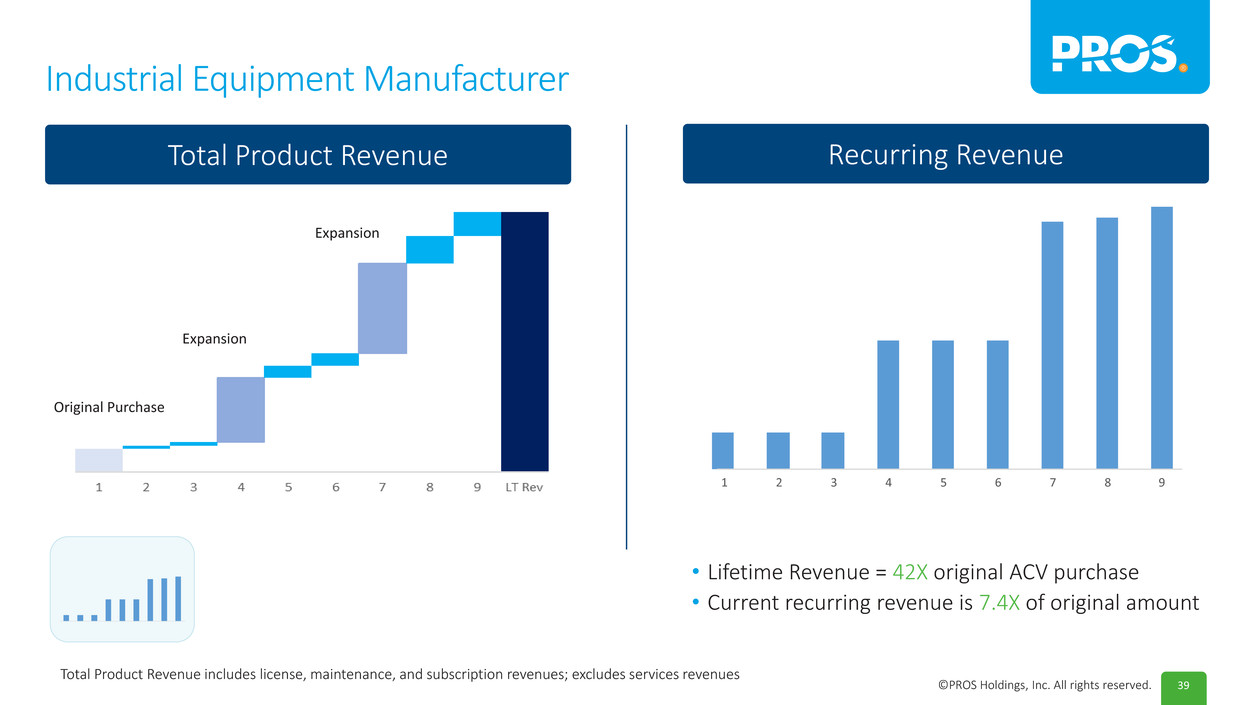
39©PROS Holdings, Inc. All rights reserved. Original Purchase Expansion Expansion Original Purchase Expansion Expansion Industrial Equipment Manufacturer • Lifetime Revenue = 42X original ACV purchase • Current recurring revenue is 7.4X of original amount 9 Recurring Revenue Only Recurring RevenueTotal Product Revenue 1 2 3 4 5 6 7 8 9 Original Purchase Expansion Expansion Total Product Revenue includes license, maintenance, and subscription revenues; excludes services revenues
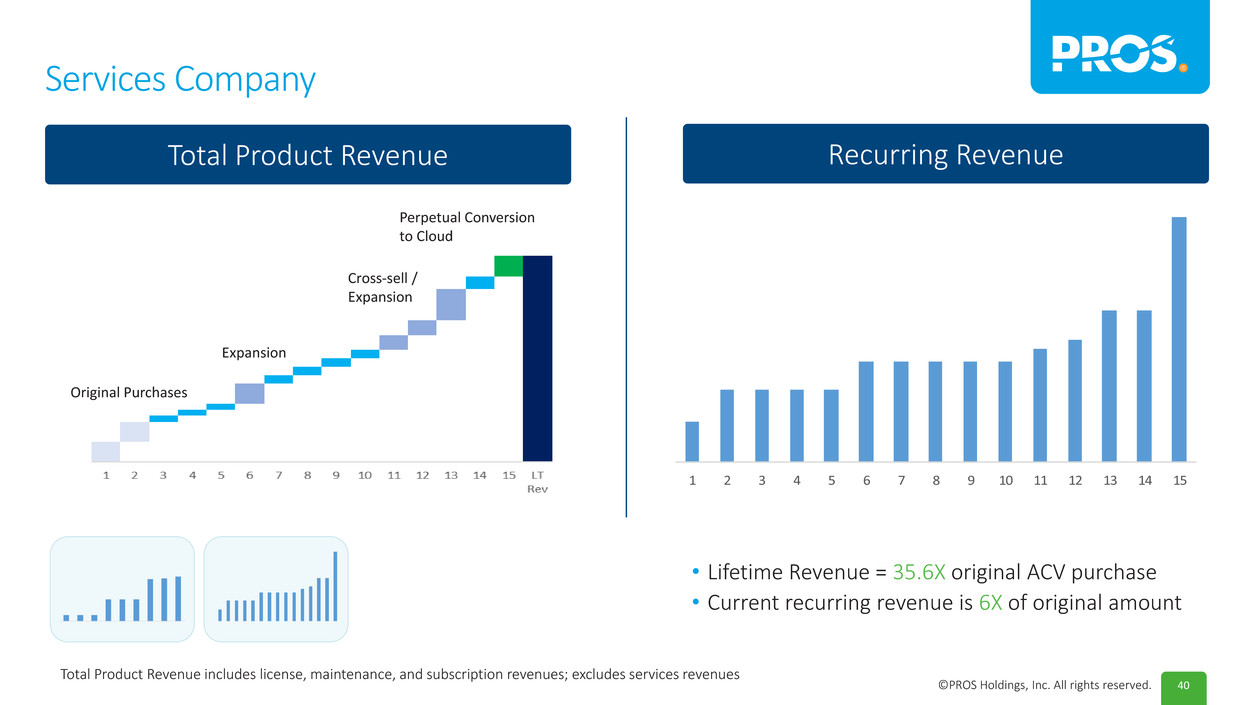
40©PROS Holdings, Inc. All rights reserved. Services Company • Lifetime Revenue = 35.6X original ACV purchase • Current recurring revenue is 6X of original amount Original Purchases Expansion Cross-sell / Expansion Perpetual Conversion to Cloud 1 2 3 4 5 6 7 8 9 10 11 12 13 14 15 Recurring Revenue Only Recurring RevenueTotal Product Revenue Total Product Revenue includes license, maintenance, and subscription revenues; excludes services revenues
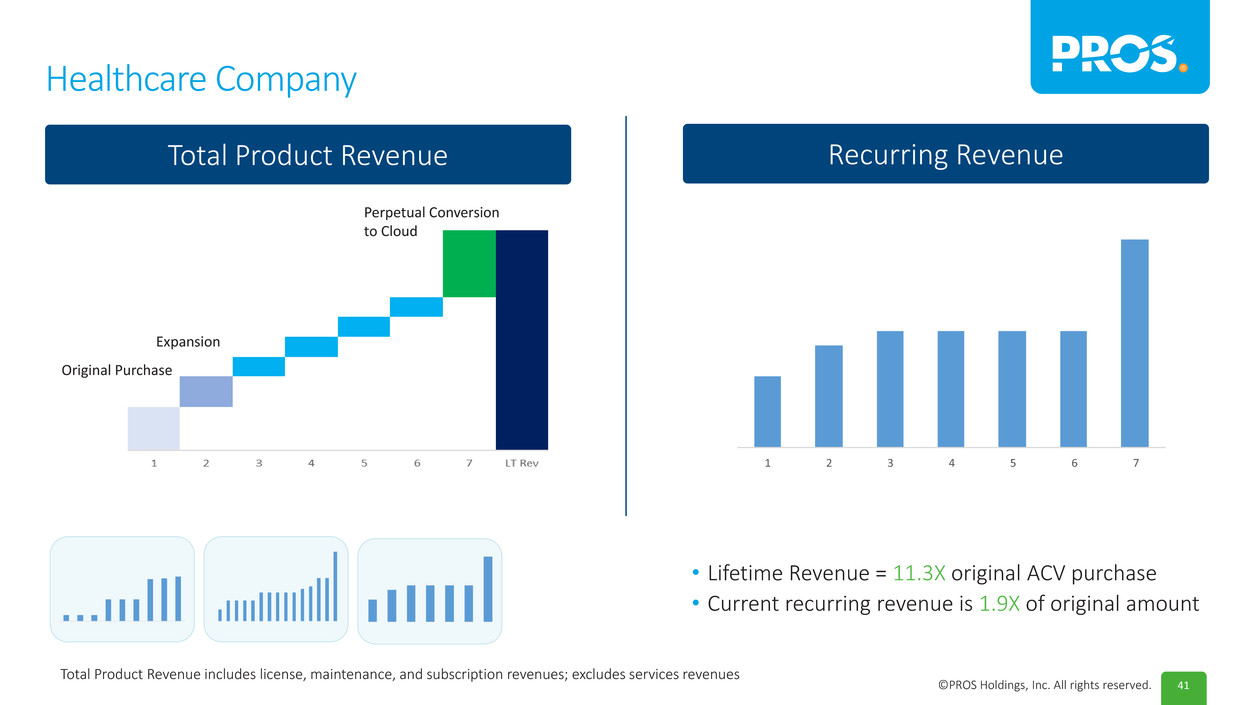
41©PROS Holdings, Inc. All rights reserved. Healthcare Company • Lifetime Revenue = 11.3X original ACV purchase • Current recurring revenue is 1.9X of original amount Original Purchase Expansion Perpetual Conversion to Cloud 1 2 3 4 5 6 7 Recurring Revenue Recurring RevenueTotal Product Revenue Total Product Revenue includes license, maintenance, and subscription revenues; excludes services revenues
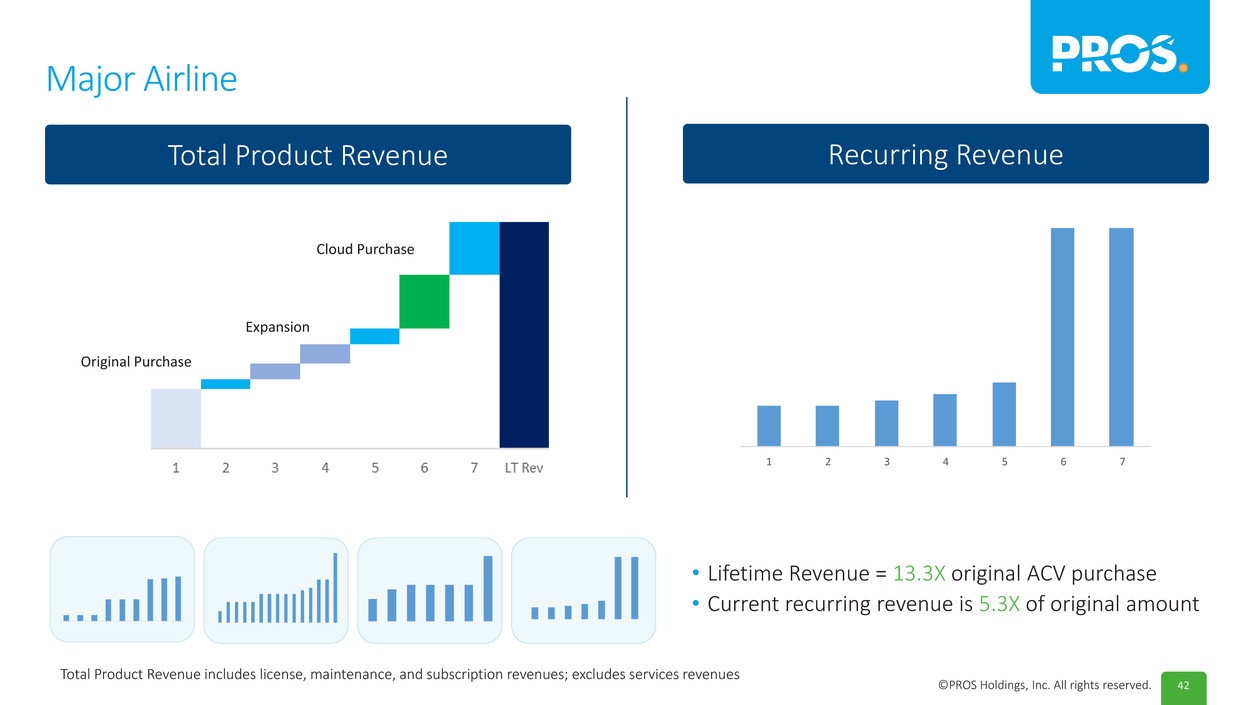
42©PROS Holdings, Inc. All rights reserved. Major Airline • Lifetime Revenue = 13.3X original ACV purchase • Current recurring revenue is 5.3X of original amount Original Purchase Expansion Cloud Purchase Expansion 1 2 3 4 5 6 7 Recurring Revenue Only Total Product Revenue includes license, maintenance, and subscription revenues; excludes services revenues Recurring RevenueTotal Product Revenue

43©PROS Holdings, Inc. All rights reserved. A Long History of Expansions
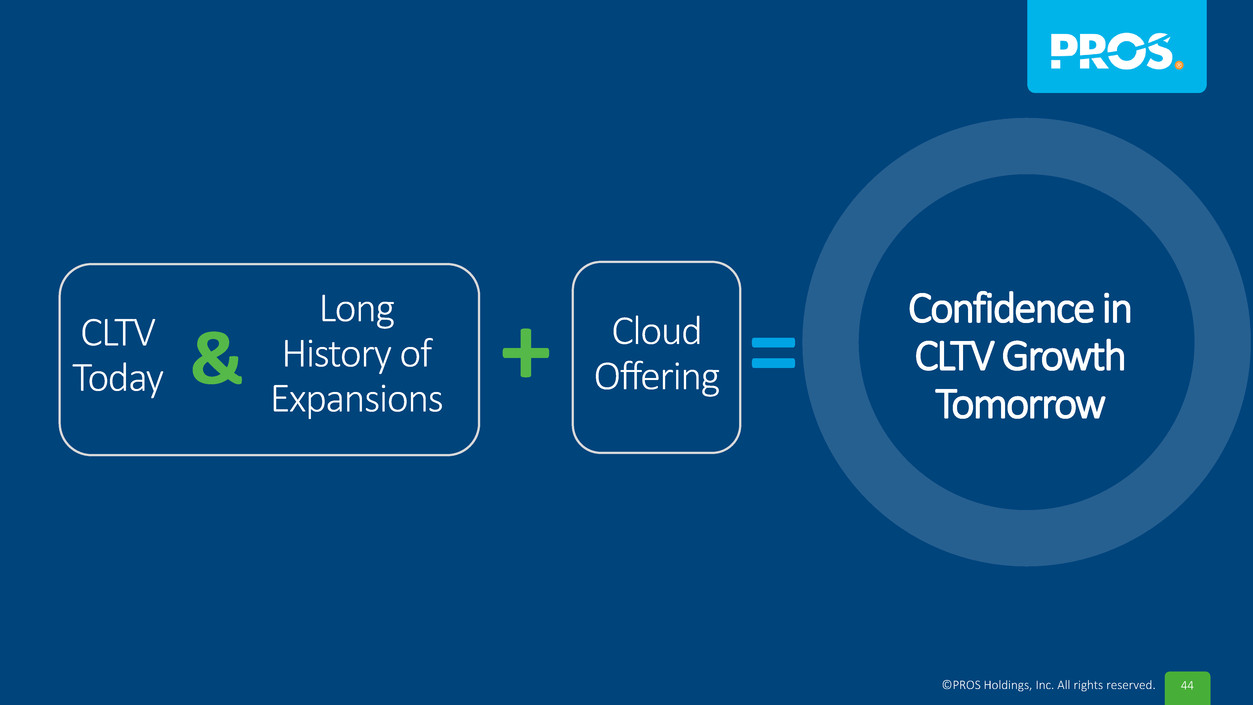
44©PROS Holdings, Inc. All rights reserved. Cloud Offering Confidence in CLTV Growth Tomorrow + =CLTVToday Long History of Expansions &
45©PROS Holdings, Inc. All rights reserved. Key Discussion Points What We’ve Learned in the Last 511 Days SaaS Value Measures Financial Model Leading Indicators
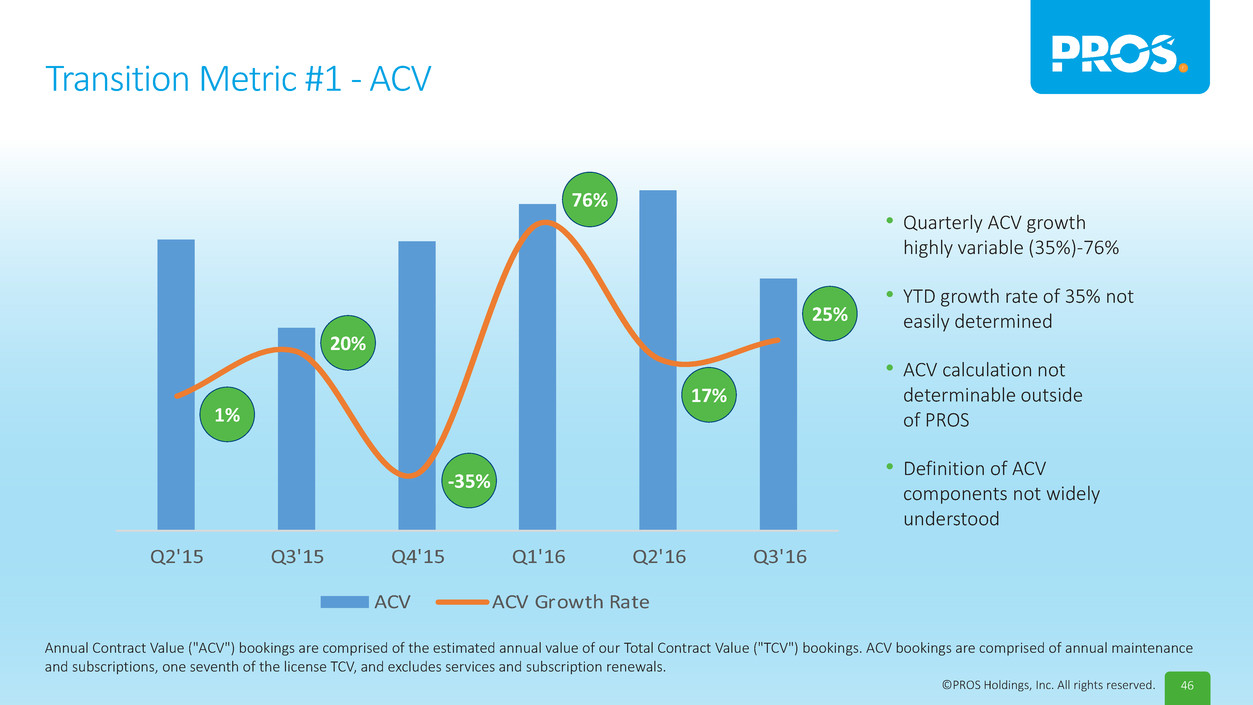
46©PROS Holdings, Inc. All rights reserved. Q2'15 Q3'15 Q4'15 Q1'16 Q2'16 Q3'16 ACV ACV Growth Rate 1% Transition Metric #1 - ACV • Quarterly ACV growth highly variable (35%)-76% • YTD growth rate of 35% not easily determined • ACV calculation not determinable outside of PROS • Definition of ACV components not widely understood 20% -35% 76% 17% 25% Annual Contract Value ("ACV") bookings are comprised of the estimated annual value of our Total Contract Value ("TCV") bookings. ACV bookings are comprised of annual maintenance and subscriptions, one seventh of the license TCV, and excludes services and subscription renewals.
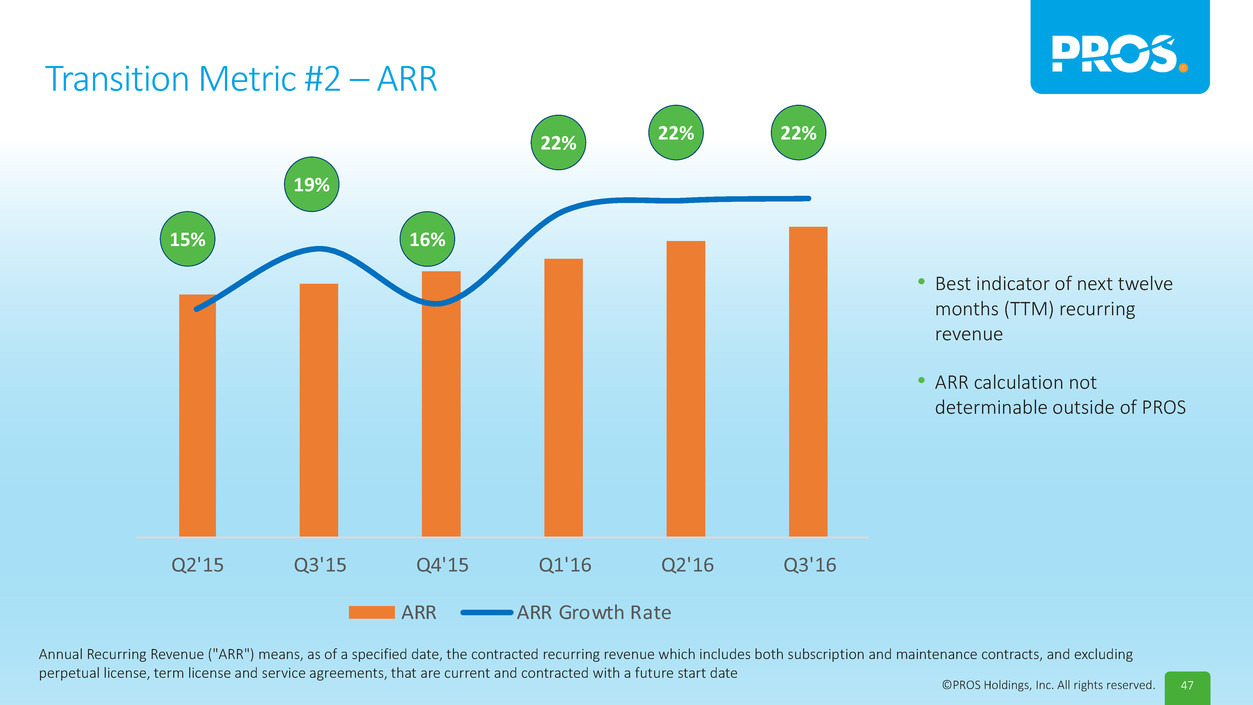
47©PROS Holdings, Inc. All rights reserved. Transition Metric #2 – ARR • Best indicator of next twelve months (TTM) recurring revenue • ARR calculation not determinable outside of PROS 15% 19% 16% 22% 22% 22% Q2'15 Q3'15 Q4'15 Q1'16 Q2'16 Q3'16 ARR ARR Growth Rate Annual Recurring Revenue ("ARR") means, as of a specified date, the contracted recurring revenue which includes both subscription and maintenance contracts, and excluding perpetual license, term license and service agreements, that are current and contracted with a future start date
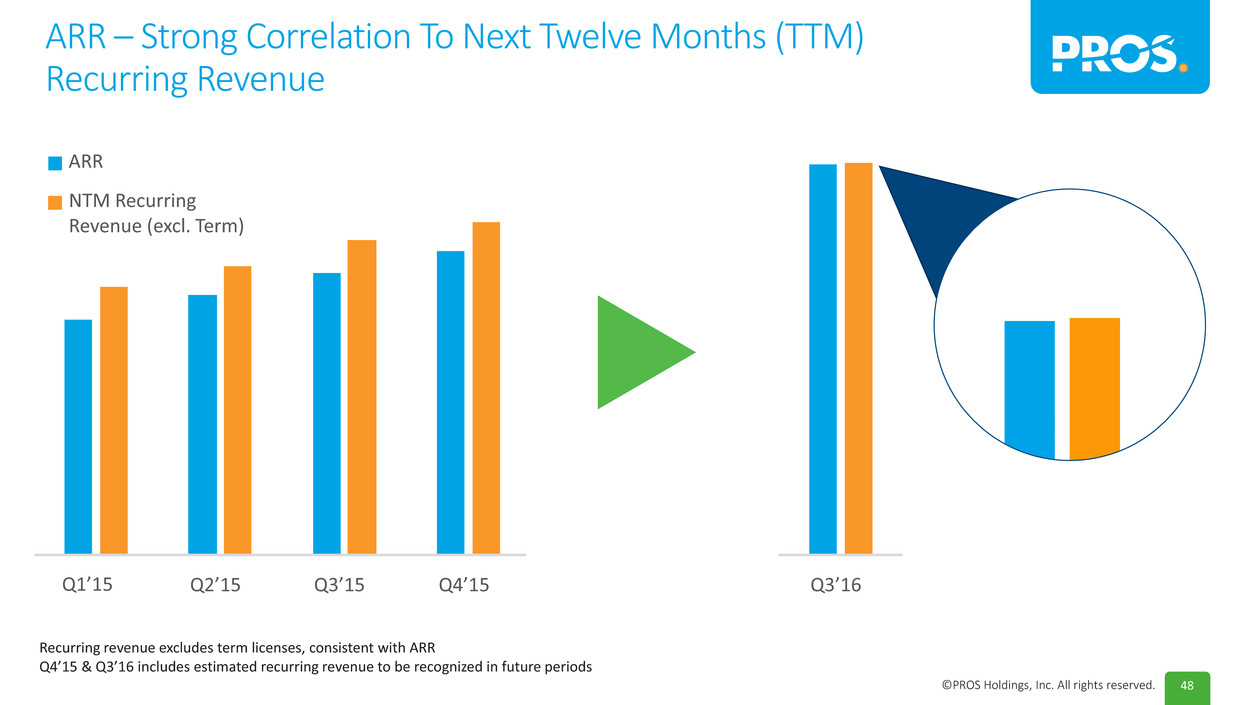
48©PROS Holdings, Inc. All rights reserved. ARR – Strong Correlation To Next Twelve Months (TTM) Recurring Revenue Recurring revenue excludes term licenses, consistent with ARR Q4’15 & Q3’16 includes estimated recurring revenue to be recognized in future periods Q1’15 Q2’15 Q3’15 Q4’15 Q1 2016 Q2 2016 Q3’16 ARR NTM Recurring Revenue (excl. Term)
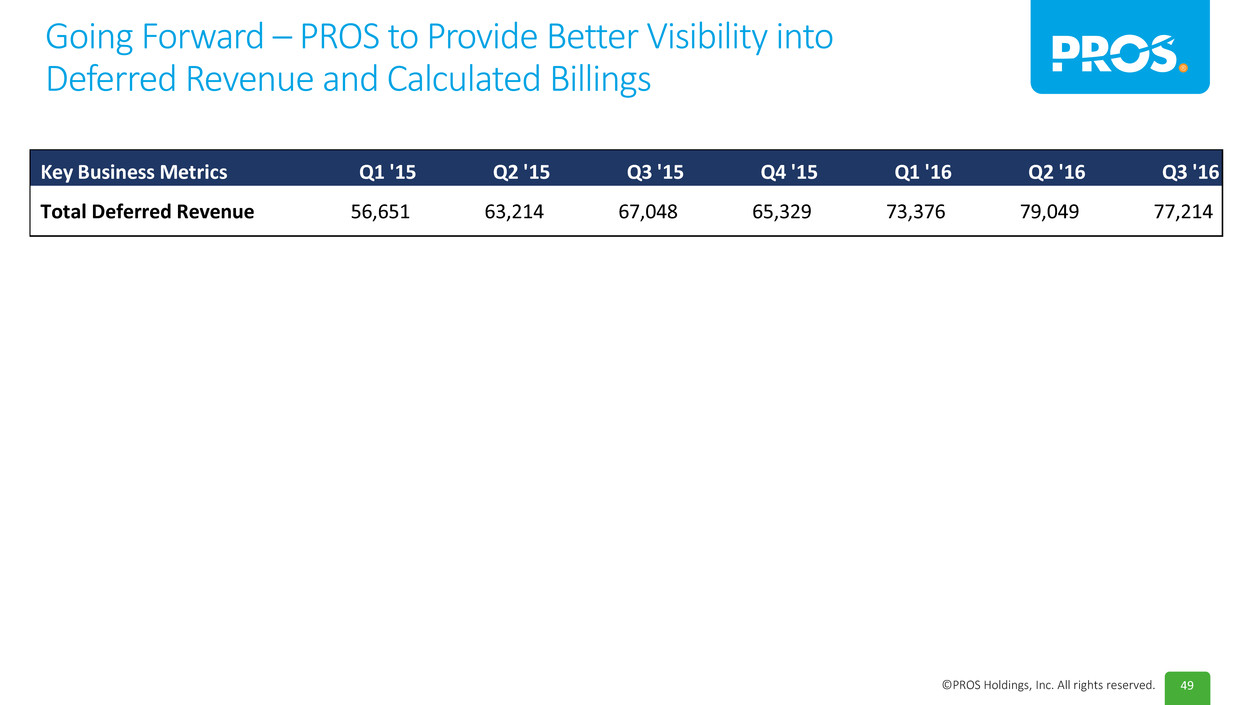
49©PROS Holdings, Inc. All rights reserved. Going Forward – PROS to Provide Better Visibility into Deferred Revenue and Calculated Billings Key Business Metrics Q1 '15 Q2 '15 Q3 '15 Q4 '15 Q1 '16 Q2 '16 Q3 '16 Total Deferred Revenue 56,651 63,214 67,048 65,329 73,376 79,049 77,214 Key Business Metrics Q1 '15 Q2 '15 Q3 '15 Q4 '15 Q1 '16 Q2 '16 Q3 '16 Non-Recurring 16,499 16,045 19,135 18,111 21,825 20,964 17,860 Recurring 40,152 47,169 47,913 47,218 51,551 58,085 59,353 Total Deferred Revenue 56,651 63,214 67,048 65,329 73,376 79,049 77,214 Calculated Billings
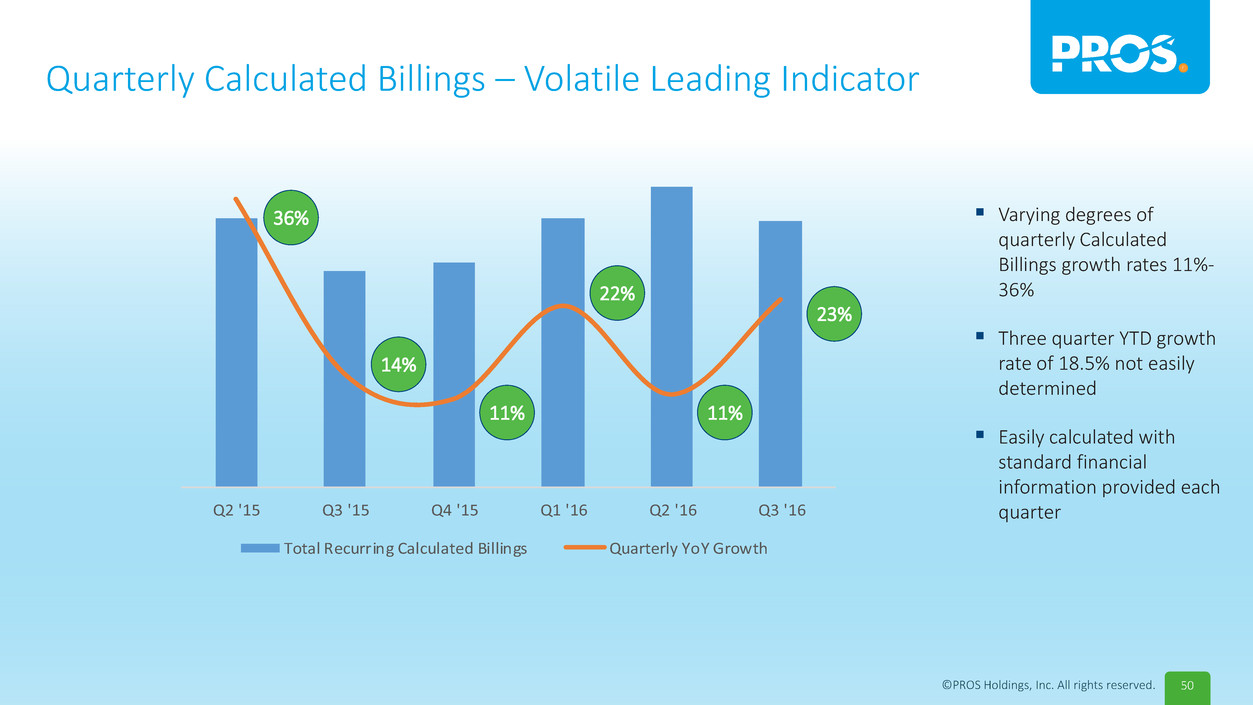
50©PROS Holdings, Inc. All rights reserved. Q2 '15 Q3 '15 Q4 '15 Q1 '16 Q2 '16 Q3 '16 Total Recurring Calculated Billings Quarterly YoY Growth Quarterly Calculated Billings – Volatile Leading Indicator Varying degrees of quarterly Calculated Billings growth rates 11%- 36% Three quarter YTD growth rate of 18.5% not easily determined Easily calculated with standard financial information provided each quarter 36% 11% 22% 11% 14% 23%
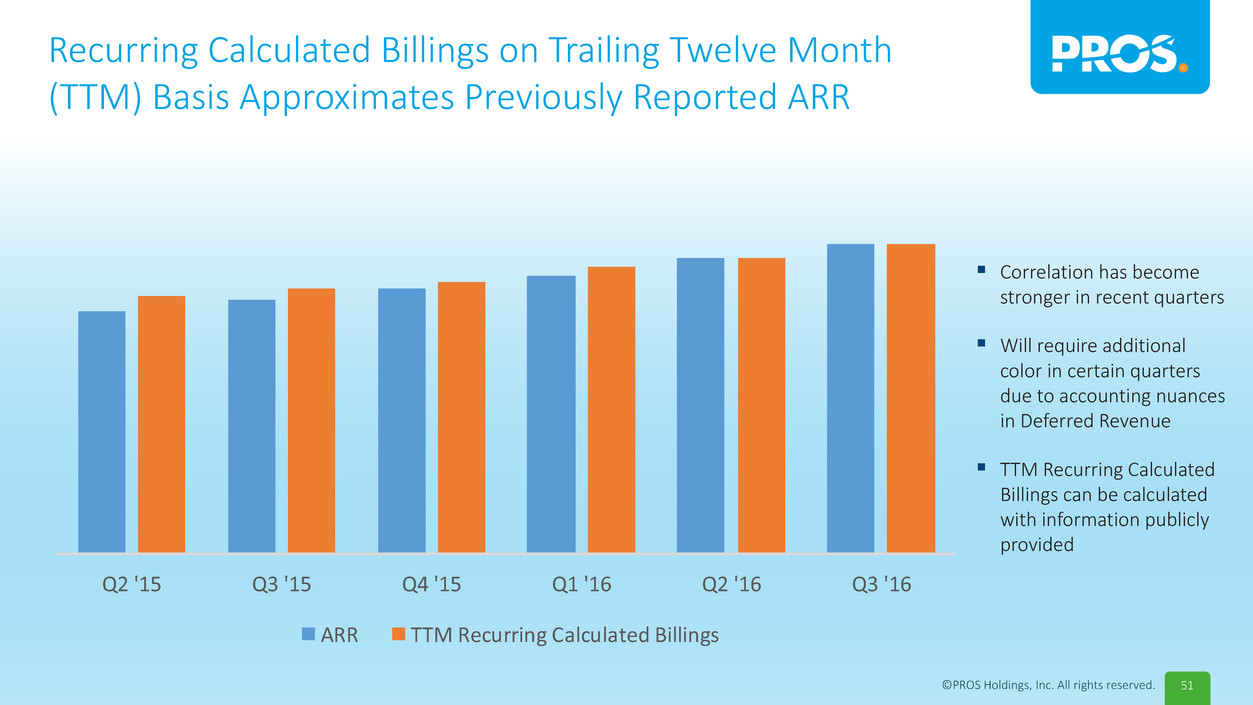
51©PROS Holdings, Inc. All rights reserved. Recurring Calculated Billings on Trailing Twelve Month (TTM) Basis Approximates Previously Reported ARR Correlation has become stronger in recent quarters Will require additional color in certain quarters due to accounting nuances in Deferred Revenue TTM Recurring Calculated Billings can be calculated with information publicly provided Q2 '15 Q3 '15 Q4 '15 Q1 '16 Q2 '16 Q3 '16 ARR TTM Recurring Calculated Billings
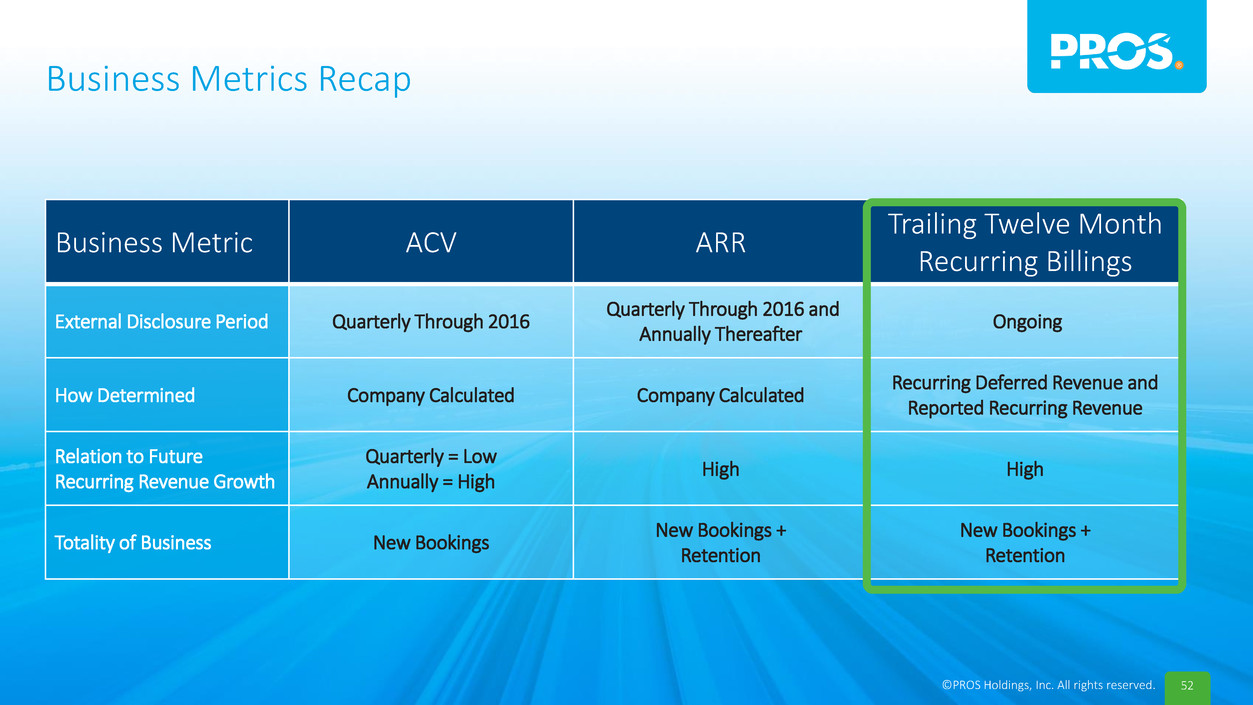
52©PROS Holdings, Inc. All rights reserved. Business Metrics Recap Business Metric ACV ARR Trailing Twelve Month Recurring Billings External Disclosure Period Quarterly Through 2016 Quarterly Through 2016 and Annually Thereafter Ongoing How Determined Company Calculated Company Calculated Recurring Deferred Revenue and Reported Recurring Revenue Relation to Future Recurring Revenue Growth Quarterly = Low Annually = High High High Totality of Business New Bookings New Bookings + Retention New Bookings + Retention
53©PROS Holdings, Inc. All rights reserved. Key Discussion Points What We’ve Learned in the Last 511 Days SaaS Value Measures Financial Model Leading Indicators
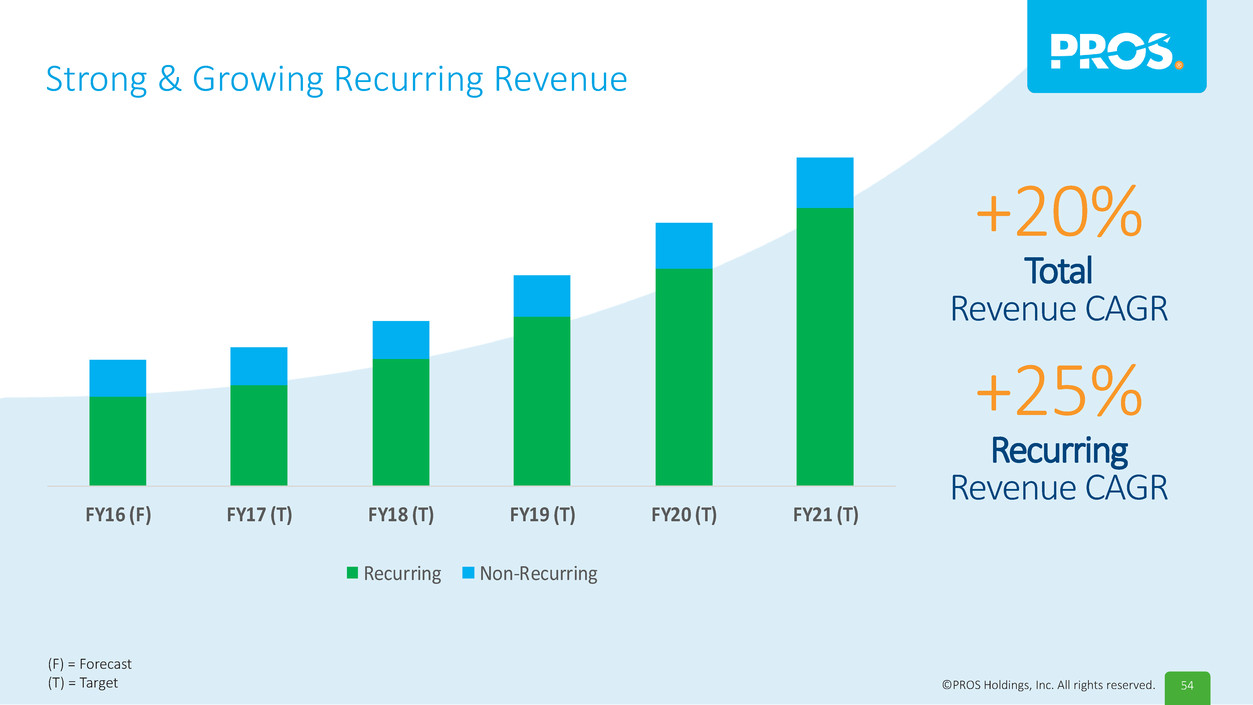
54©PROS Holdings, Inc. All rights reserved. Strong & Growing Recurring Revenue +20% Total Revenue CAGR +25% Recurring Revenue CAGR FY16 (F) FY17 (T) FY18 (T) FY19 (T) FY20 (T) FY21 (T) Recurring Non-Recurring (F) = Forecast (T) = Target
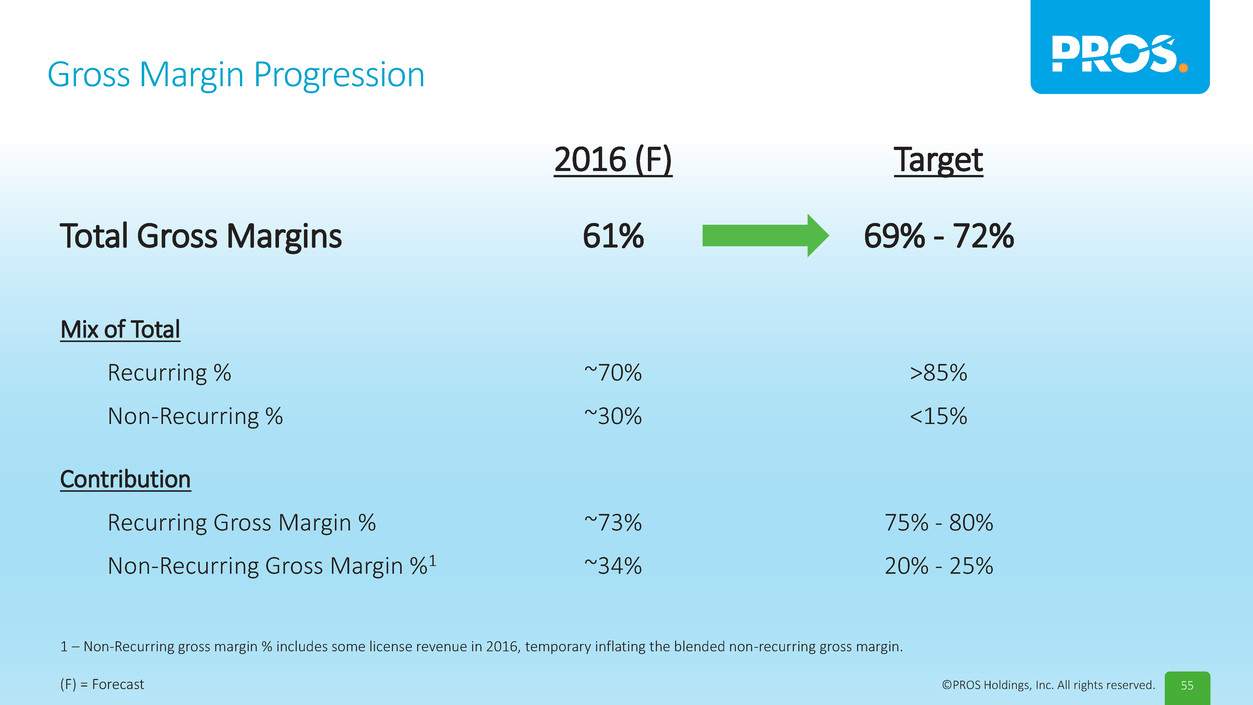
55©PROS Holdings, Inc. All rights reserved. Gross Margin Progression 2016 (F) Target Total Gross Margins 61% 69% - 72% Mix of Total Recurring % ~70% >85% Non-Recurring % ~30% <15% Contribution Recurring Gross Margin % ~73% 75% - 80% Non-Recurring Gross Margin %1 ~34% 20% - 25% 1 – Non-Recurring gross margin % includes some license revenue in 2016, temporary inflating the blended non-recurring gross margin. (F) = Forecast
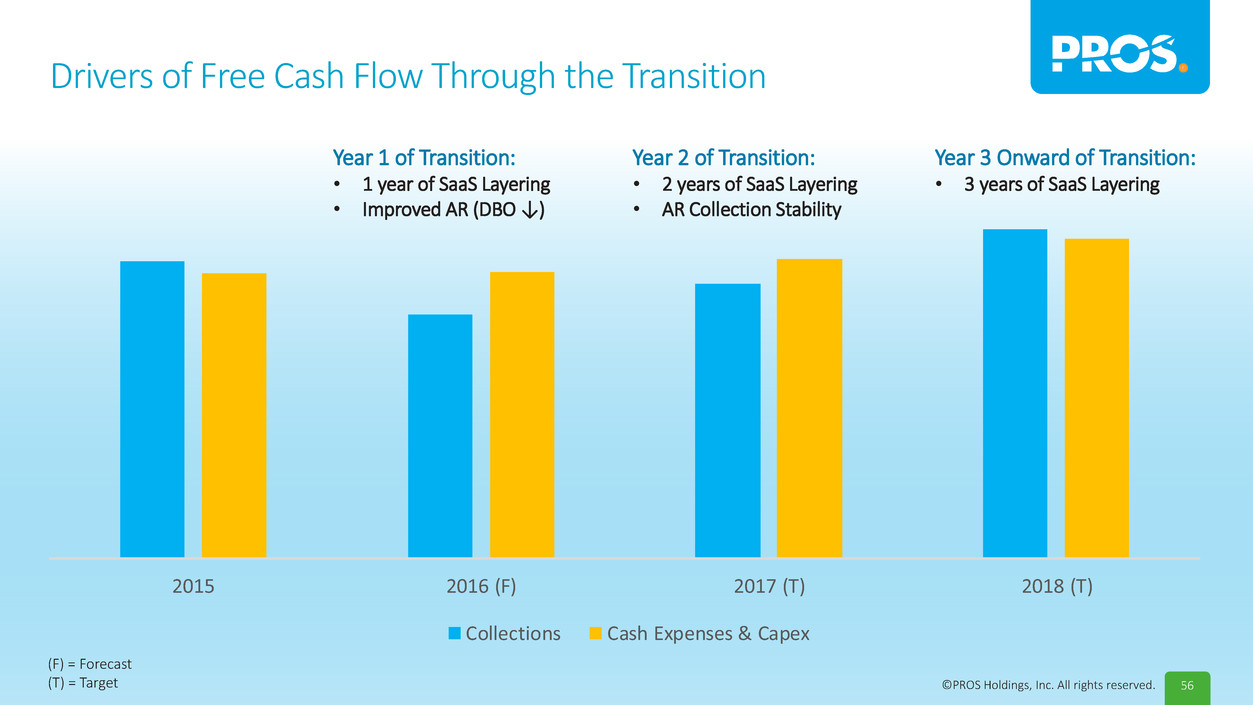
56©PROS Holdings, Inc. All rights reserved. Drivers of Free Cash Flow Through the Transition Year 1 of Transition: • 1 year of SaaS Layering • Improved AR (DBO ↓) Year 2 of Transition: • 2 years of SaaS Layering • AR Collection Stability Year 3 Onward of Transition: • 3 years of SaaS Layering 2015 2016 (F) 2017 (T) 2018 (T) Collections Cash Expenses & Capex (F) = Forecast (T) = Target
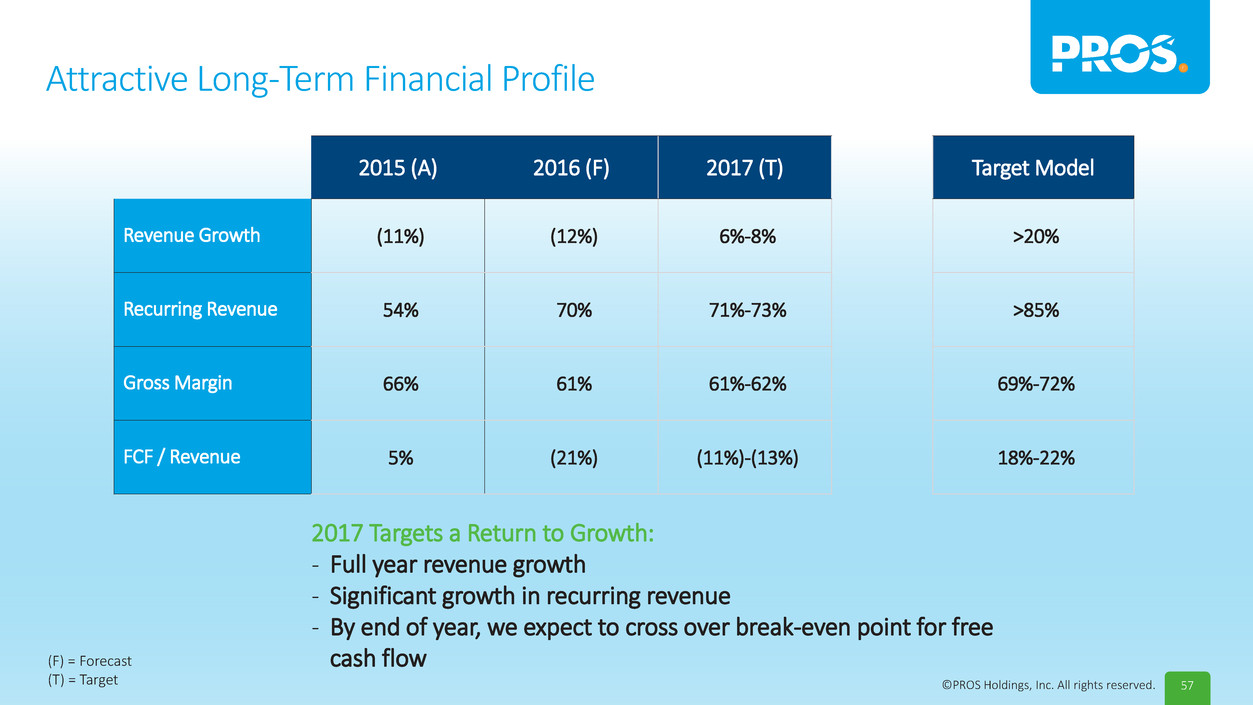
57©PROS Holdings, Inc. All rights reserved. Attractive Long-Term Financial Profile 2015 (A) 2016 (F) 2017 (T) Target Model Revenue Growth (11%) (12%) 6%-8% >20% Recurring Revenue 54% 70% 71%-73% >85% Gross Margin 66% 61% 61%-62% 69%-72% FCF / Revenue 5% (21%) (11%)-(13%) 18%-22% 2017 Targets a Return to Growth: - Full year revenue growth - Significant growth in recurring revenue - By end of year, we expect to cross over break-even point for free cash flow(F) = Forecast (T) = Target
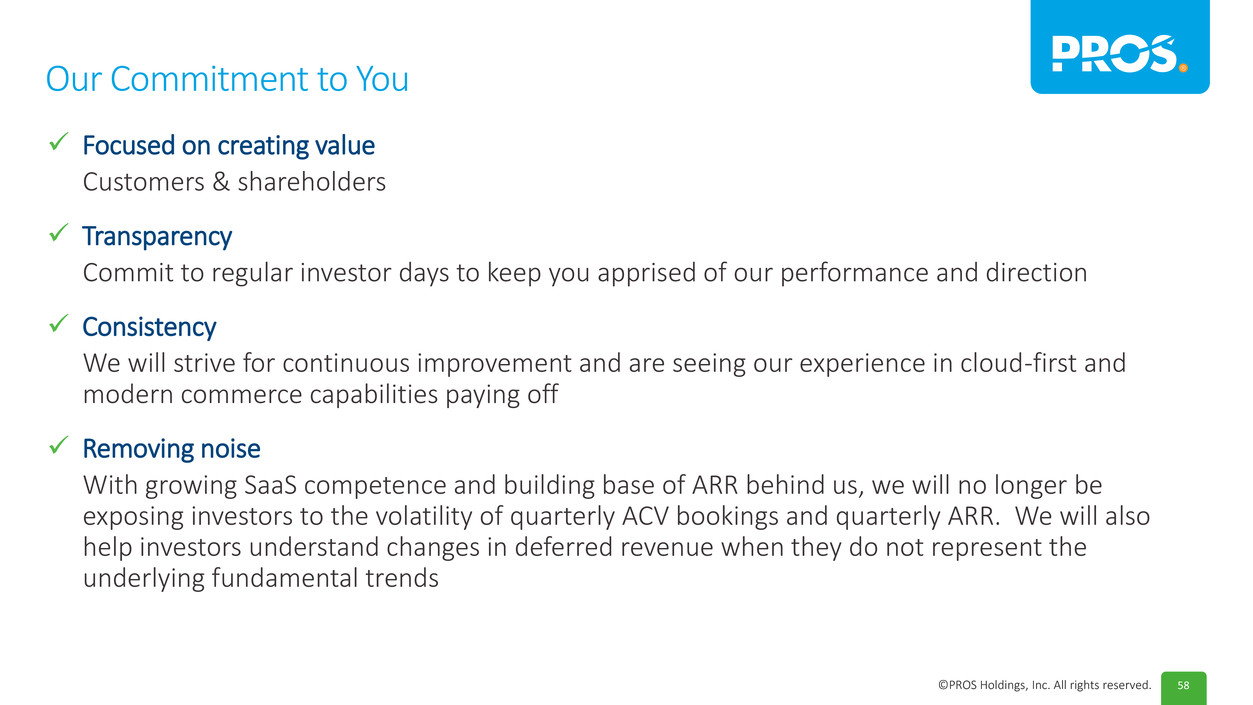
58©PROS Holdings, Inc. All rights reserved. Our Commitment to You Focused on creating value Customers & shareholders Transparency Commit to regular investor days to keep you apprised of our performance and direction Consistency We will strive for continuous improvement and are seeing our experience in cloud-first and modern commerce capabilities paying off Removing noise With growing SaaS competence and building base of ARR behind us, we will no longer be exposing investors to the volatility of quarterly ACV bookings and quarterly ARR. We will also help investors understand changes in deferred revenue when they do not represent the underlying fundamental trends
59©PROS Holdings, Inc. All rights reserved. Product John Salch | VP Technology and Platforms

60©PROS Holdings, Inc. All rights reserved. “I need to go to my office…” Making Better ‘Drivers’
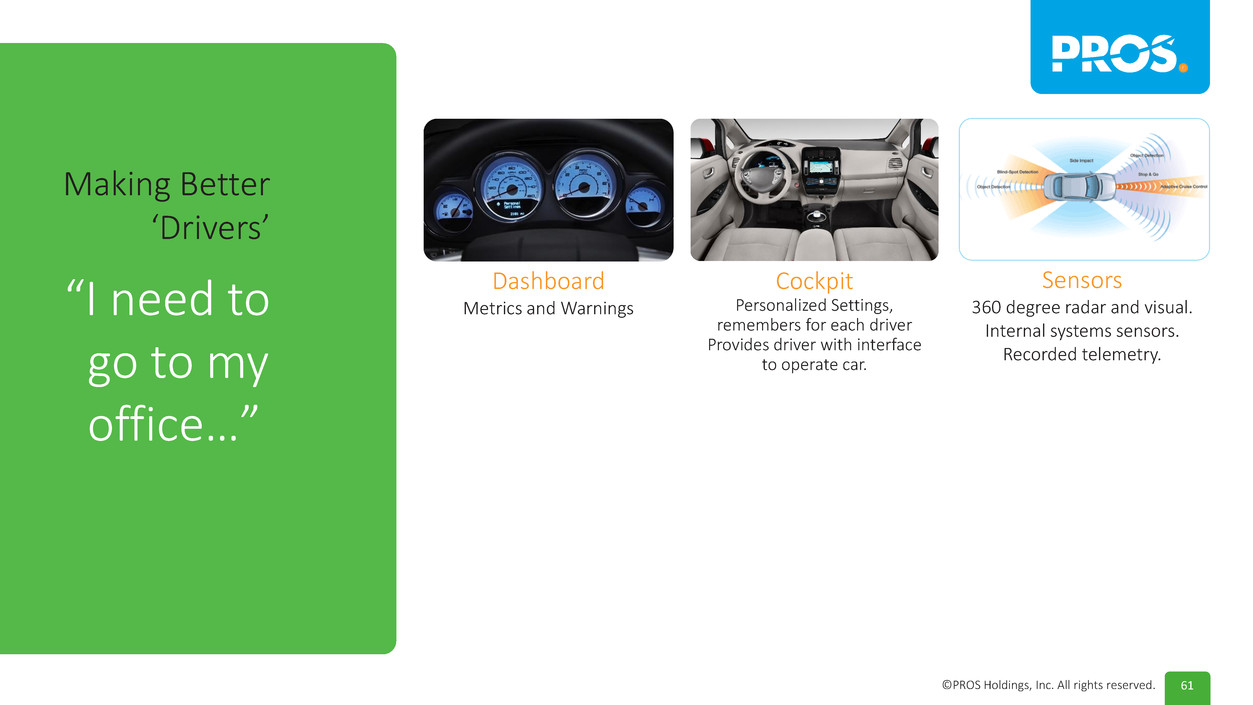
61©PROS Holdings, Inc. All rights reserved. “I need to go to my office…” Dashboard Metrics and Warnings Cockpit Personalized Settings, remembers for each driver Provides driver with interface to operate car. Making Better ‘Drivers’ Sensors 360 degree radar and visual. Internal systems sensors. Recorded telemetry.
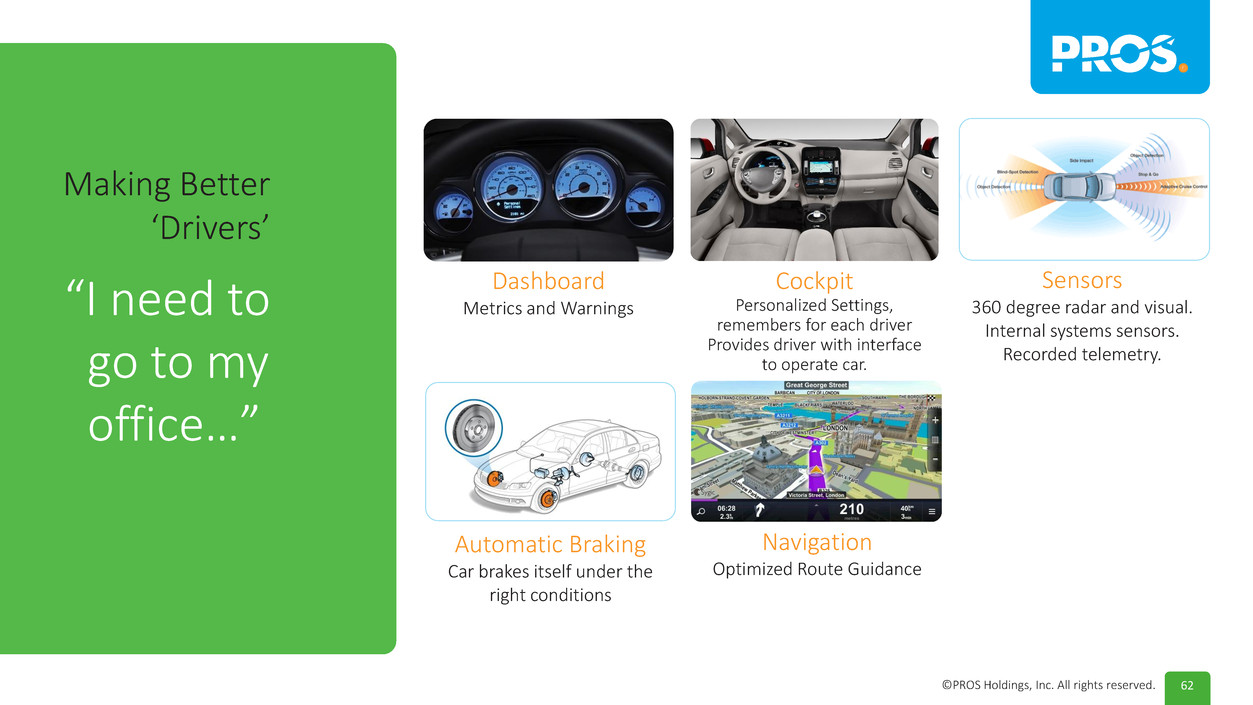
62©PROS Holdings, Inc. All rights reserved. “I need to go to my office…” Navigation Optimized Route Guidance Making Better ‘Drivers’ Dashboard Metrics and Warnings Cockpit Personalized Settings, remembers for each driver Provides driver with interface to operate car. Sensors 360 degree radar and visual. Internal systems sensors. Recorded telemetry. Automatic Braking Car brakes itself under the right conditions

63©PROS Holdings, Inc. All rights reserved. “I need to go to my office…” Navigation Optimized Route Guidance Autopilot Car drives itself under the right conditions. Automatic Braking Car brakes itself under the right conditions Making Better ‘Drivers’ Dashboard Metrics and Warnings Cockpit Personalized Settings, remembers for each driver Provides driver with interface to operate car. Sensors 360 degree radar and visual. Internal systems sensors. Recorded telemetry.

64©PROS Holdings, Inc. All rights reserved. CEOProduct Category Manager Sales Person AnalystRevenue ManagereCommerce Manager “I need to improve results…” Making Better ‘Business People’

65©PROS Holdings, Inc. All rights reserved. Dashboard Metrics and Warnings Cockpit Personalized Settings; Remembers for each seller Provides interface for sales to build quotes and close deals. Sensors Social feeds, Competitor news and customer news; Recorded telemetry of actions by sales and reactions by customers. “I need to go to close ACME…” Making Better ‘Salespeople’
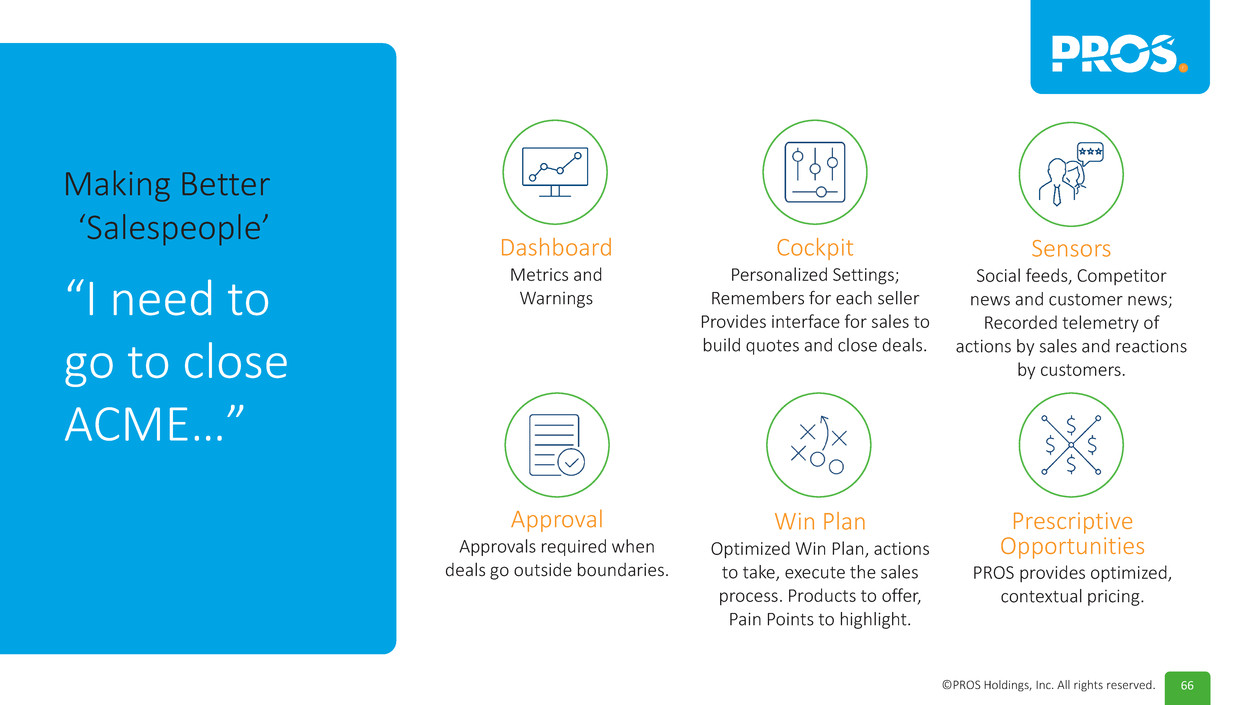
66©PROS Holdings, Inc. All rights reserved. Dashboard Metrics and Warnings Cockpit Personalized Settings; Remembers for each seller Provides interface for sales to build quotes and close deals. Prescriptive Opportunities PROS provides optimized, contextual pricing. Approval Approvals required when deals go outside boundaries. Sensors Social feeds, Competitor news and customer news; Recorded telemetry of actions by sales and reactions by customers. “I need to go to close ACME…” Making Better ‘Salespeople’ Win Plan Optimized Win Plan, actions to take, execute the sales process. Products to offer, Pain Points to highlight.

67©PROS Holdings, Inc. All rights reserved. Anatomy of Real-time Systems It understands a domain It understands a user’s context It personalizes and adapts It predicts, prescribes and automates It learns from data and actions It improves continuously Through all of this, it makes a better user, by helping them make decisions based on: All of the information available Using the computational power of the cloud Using machine learning and other algorithms.
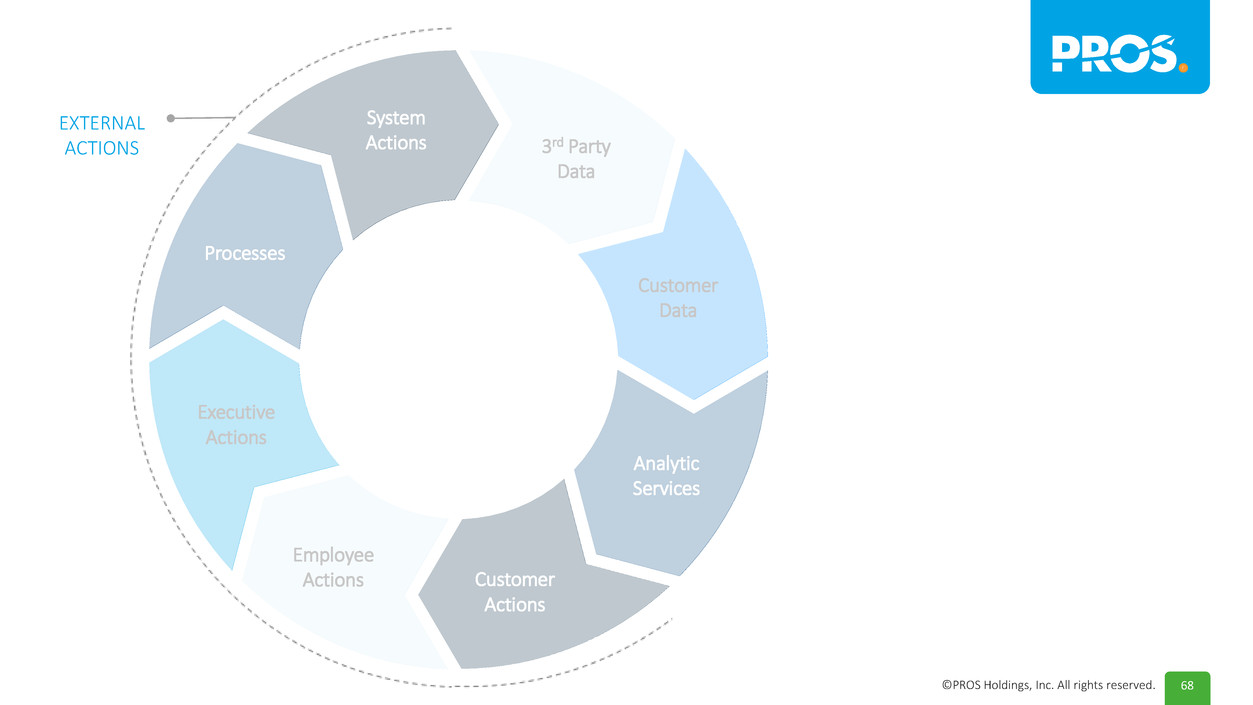
68©PROS Holdings, Inc. All rights reserved. EXTERNAL ACTIONS Analytic Services System Actions Customer Data Customer Actions Employee Actions Processes Executive Actions 3rd Party Data
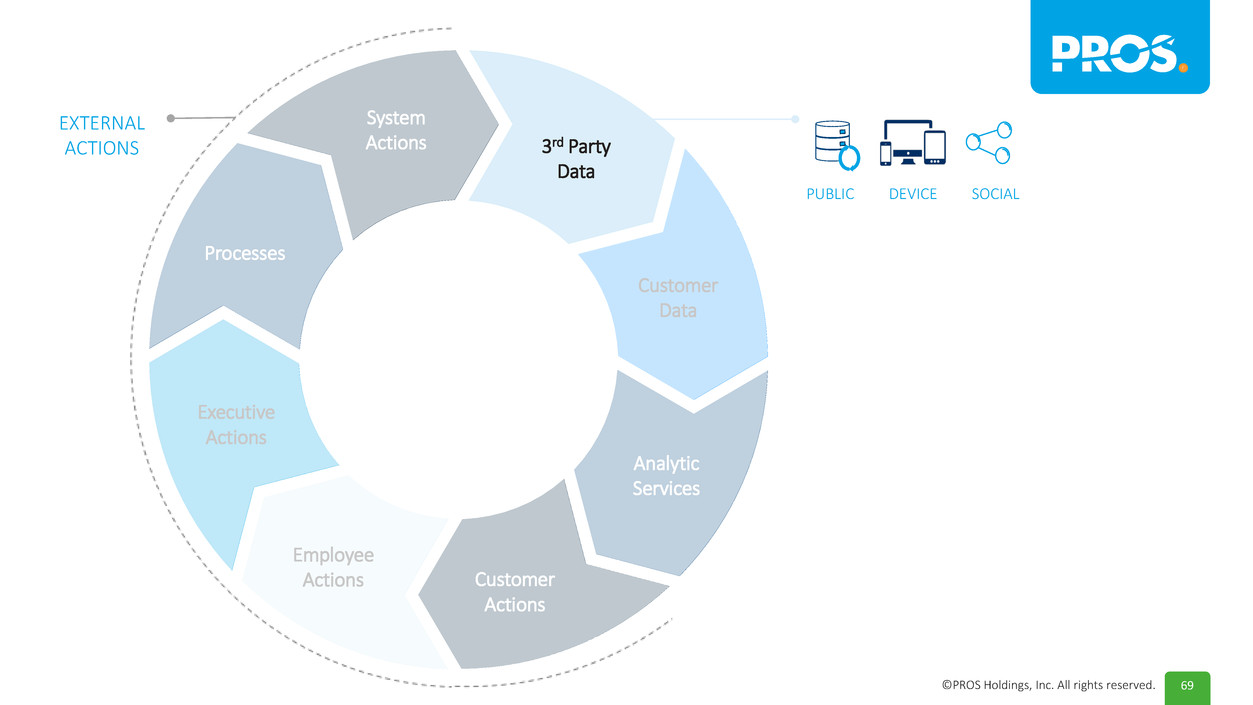
69©PROS Holdings, Inc. All rights reserved. EXTERNAL ACTIONS PUBLIC DEVICE SOCIAL Analytic Services System Actions Customer Data Customer Actions Employee Actions Processes Executive Actions 3rd Party Data
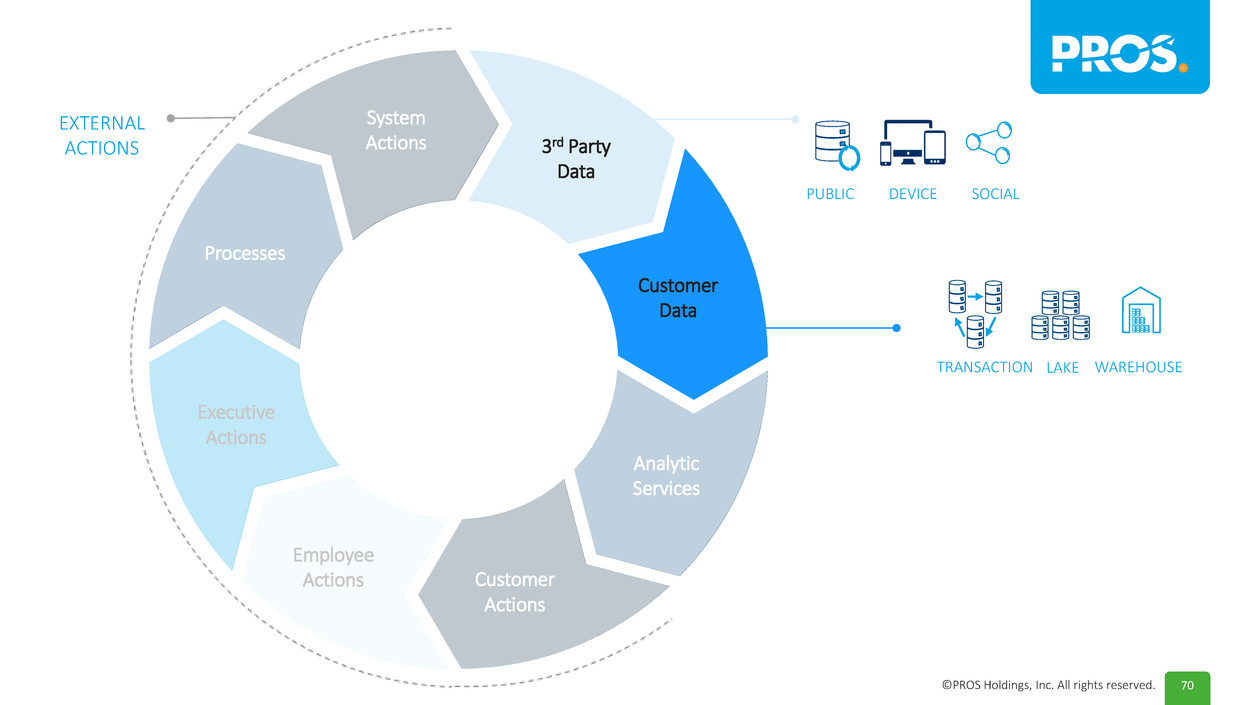
70©PROS Holdings, Inc. All rights reserved. EXTERNAL ACTIONS TRANSACTION LAKE WAREHOUSE PUBLIC DEVICE SOCIAL Analytic Services System Actions Customer Data Customer Actions Employee Actions Processes Executive Actions 3rd Party Data
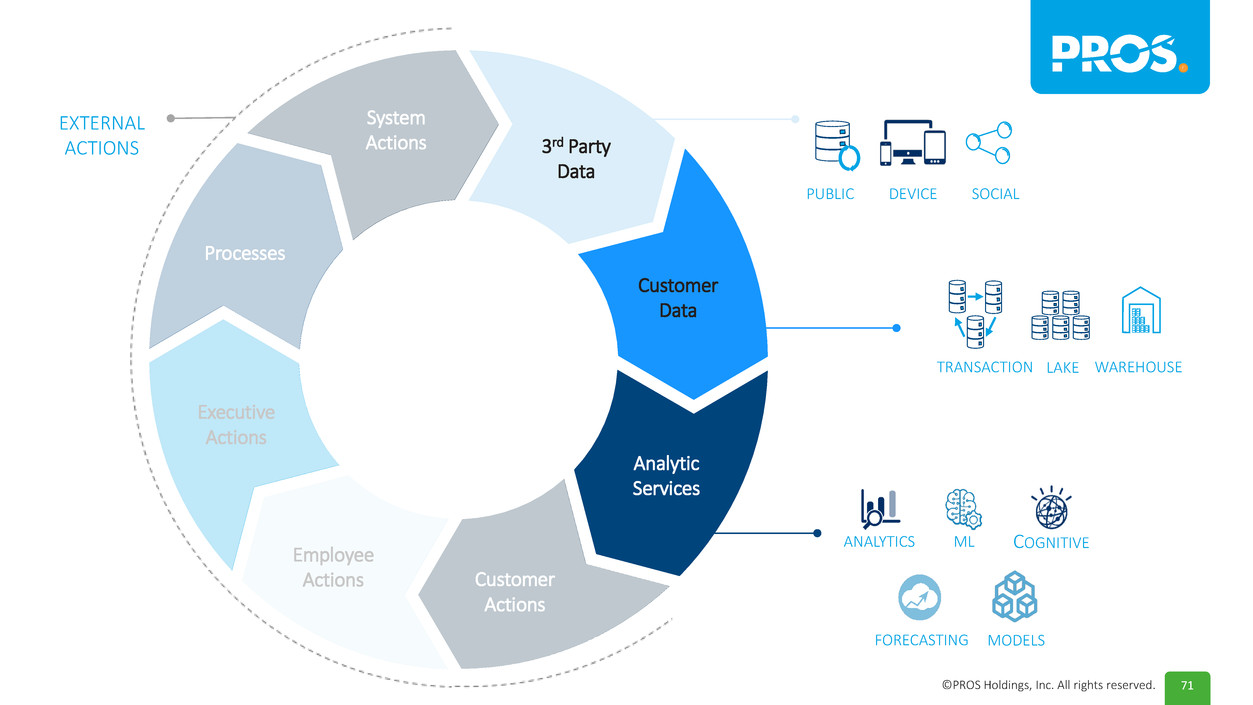
71©PROS Holdings, Inc. All rights reserved. EXTERNAL ACTIONS ANALYTICS ML FORECASTING MODELS COGNITIVE TRANSACTION LAKE WAREHOUSE PUBLIC DEVICE SOCIAL Analytic Services System Actions Customer Data Customer Actions Employee Actions Processes Executive Actions 3rd Party Data
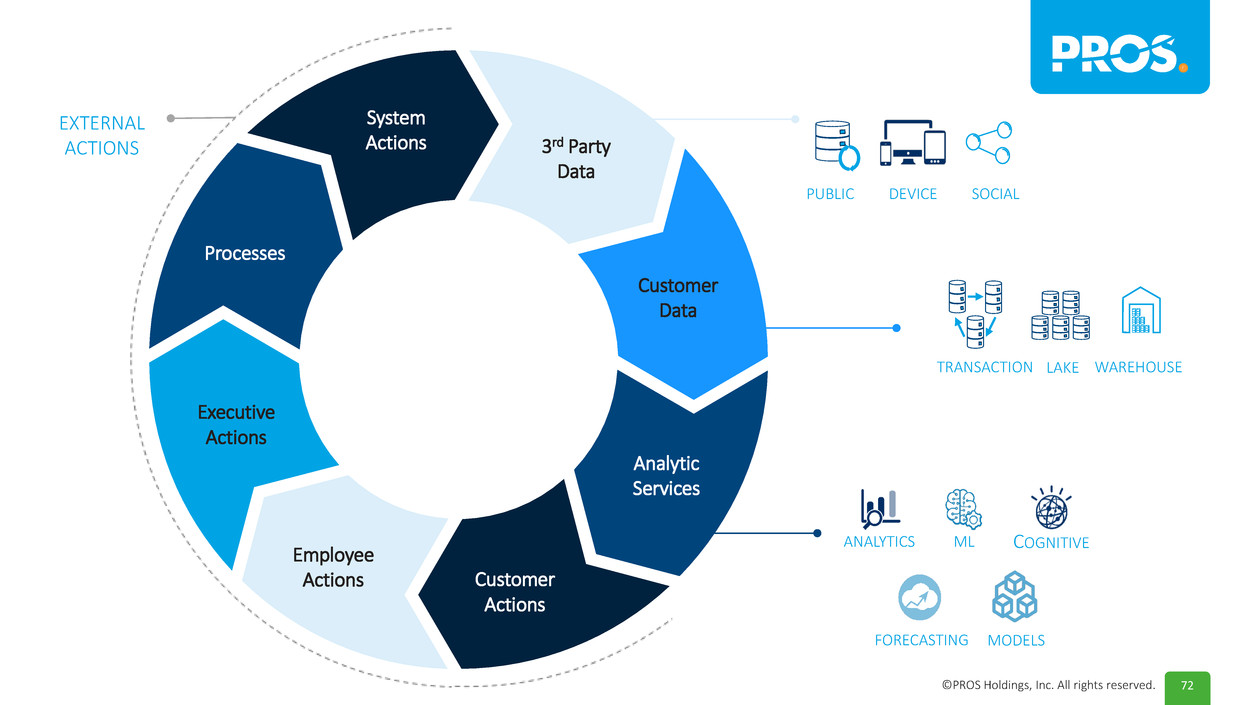
72©PROS Holdings, Inc. All rights reserved. EXTERNAL ACTIONS ANALYTICS ML FORECASTING MODELS COGNITIVE TRANSACTION LAKE WAREHOUSE PUBLIC DEVICE SOCIAL Analytic Services System Actions Customer Data Customer Actions Employee Actions Processes Executive Actions 3rd Party Data
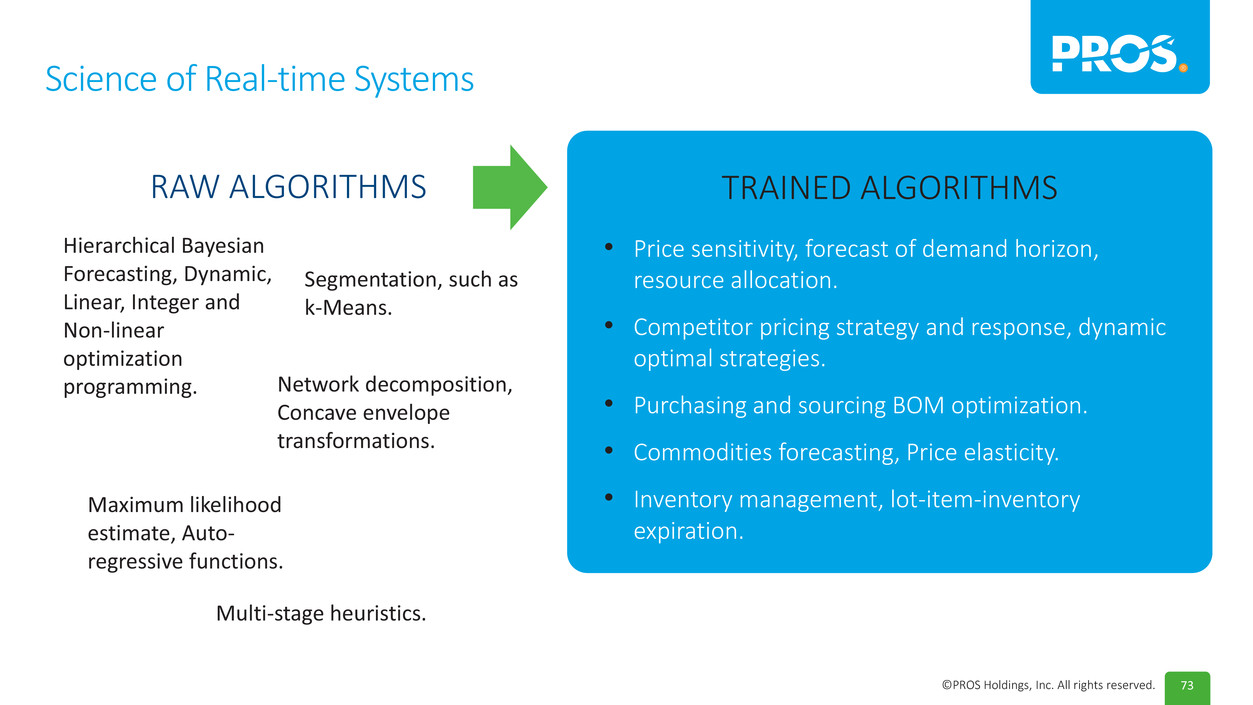
73©PROS Holdings, Inc. All rights reserved. Science of Real-time Systems TRAINED ALGORITHMS • Price sensitivity, forecast of demand horizon, resource allocation. • Competitor pricing strategy and response, dynamic optimal strategies. • Purchasing and sourcing BOM optimization. • Commodities forecasting, Price elasticity. • Inventory management, lot-item-inventory expiration. RAW ALGORITHMS Hierarchical Bayesian Forecasting, Dynamic, Linear, Integer and Non-linear optimization programming. Segmentation, such as k-Means. Network decomposition, Concave envelope transformations. Maximum likelihood estimate, Auto- regressive functions. Multi-stage heuristics.
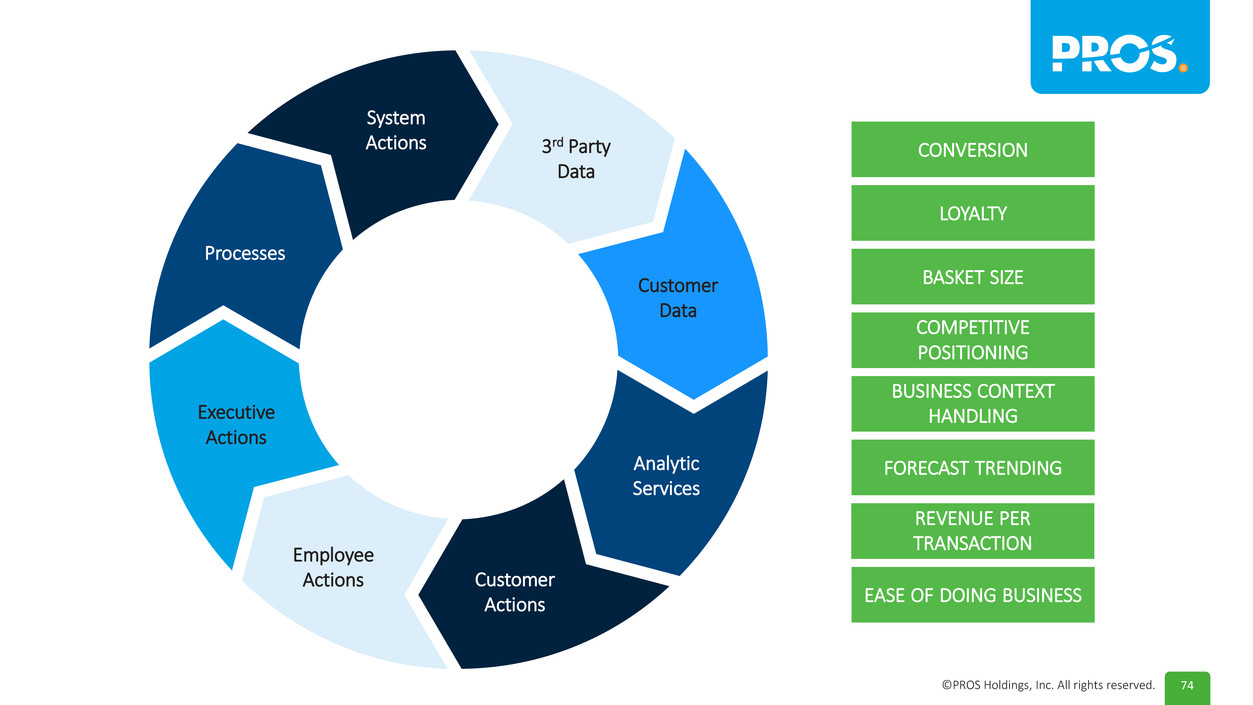
74©PROS Holdings, Inc. All rights reserved. Executive Actions Processes System Actions 3rd Party Data Customer Data Analytic Services Customer Actions Employee Actions EASE OF DOING BUSINESS FORECAST TRENDING BUSINESS CONTEXT HANDLING COMPETITIVE POSITIONING BASKET SIZE LOYALTY CONVERSION REVENUE PER TRANSACTION
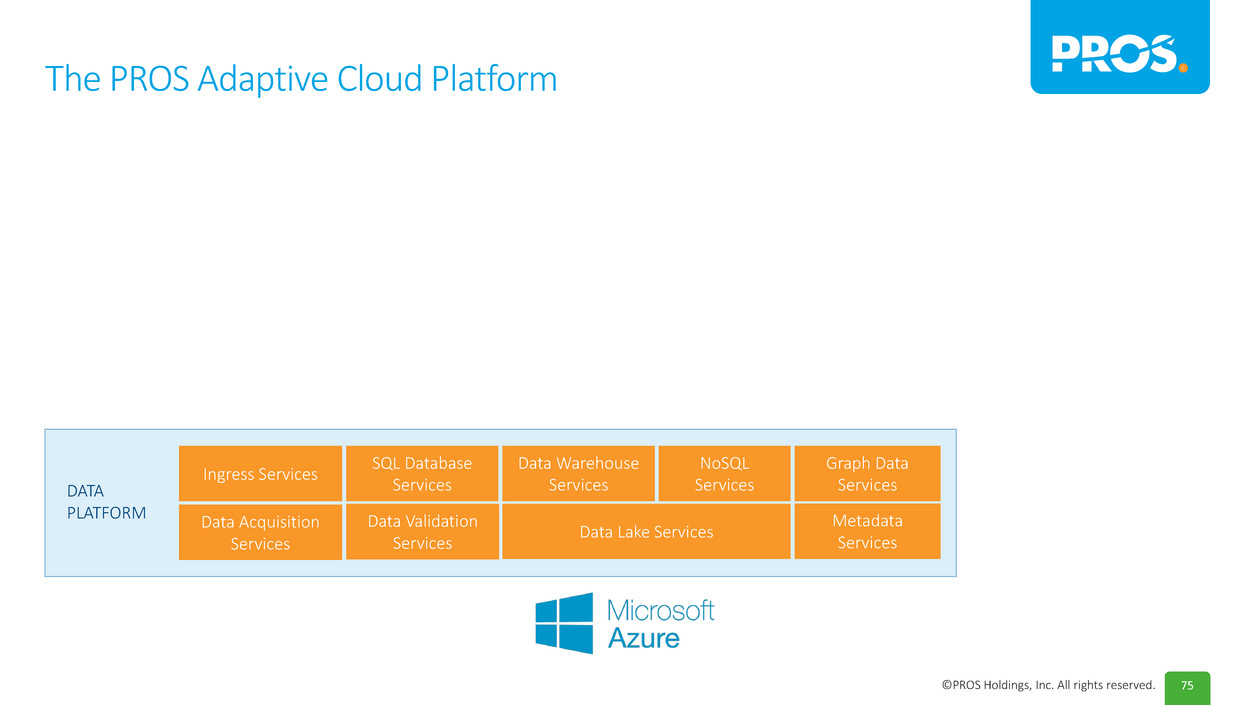
75©PROS Holdings, Inc. All rights reserved. The PROS Adaptive Cloud Platform DATA PLATFORM Graph Data Services Metadata Services NoSQL Services Data Warehouse Services SQL Database Services Ingress Services Data Lake Services Data Validation Services Data Acquisition Services
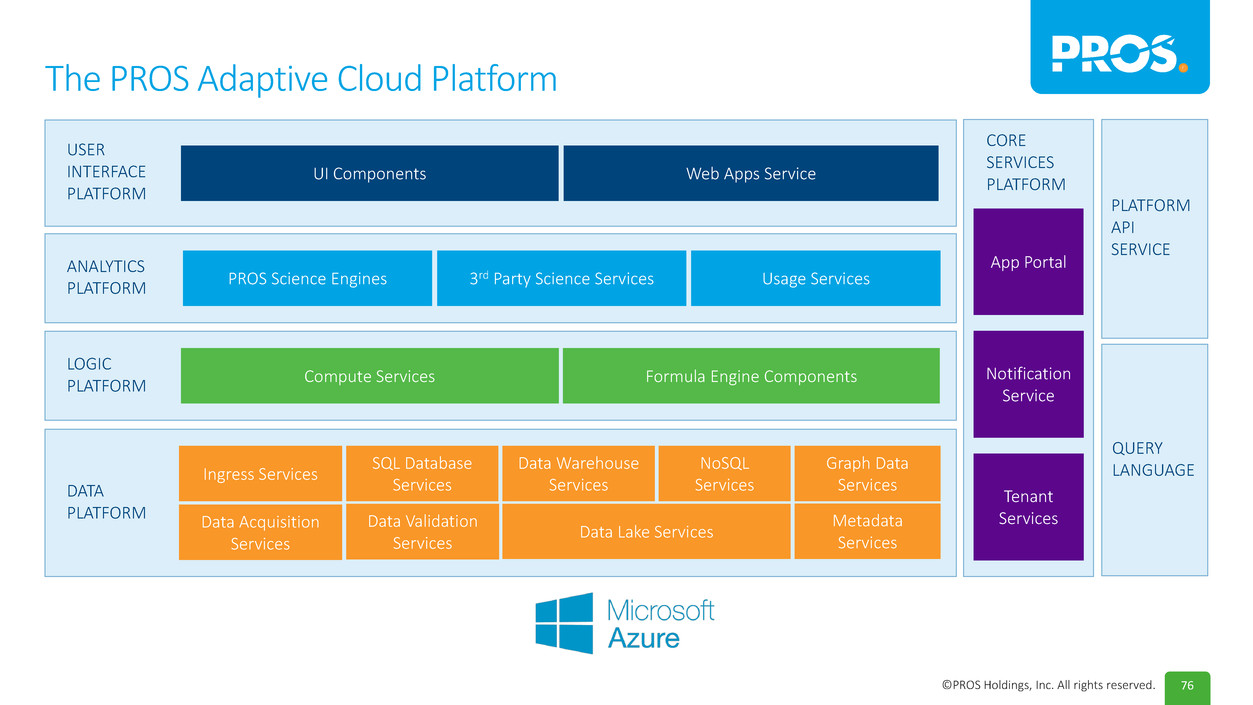
76©PROS Holdings, Inc. All rights reserved. The PROS Adaptive Cloud Platform UI Components USER INTERFACE PLATFORM Web Apps Service PROS Science Engines ANALYTICS PLATFORM 3rd Party Science Services Compute Services LOGIC PLATFORM Formula Engine Components DATA PLATFORM Usage Services CORE SERVICES PLATFORM App Portal Tenant Services Notification Service PLATFORM API SERVICE QUERY LANGUAGEGraph Data Services Metadata Services NoSQL Services Data Warehouse Services SQL Database Services Ingress Services Data Lake Services Data Validation Services Data Acquisition Services
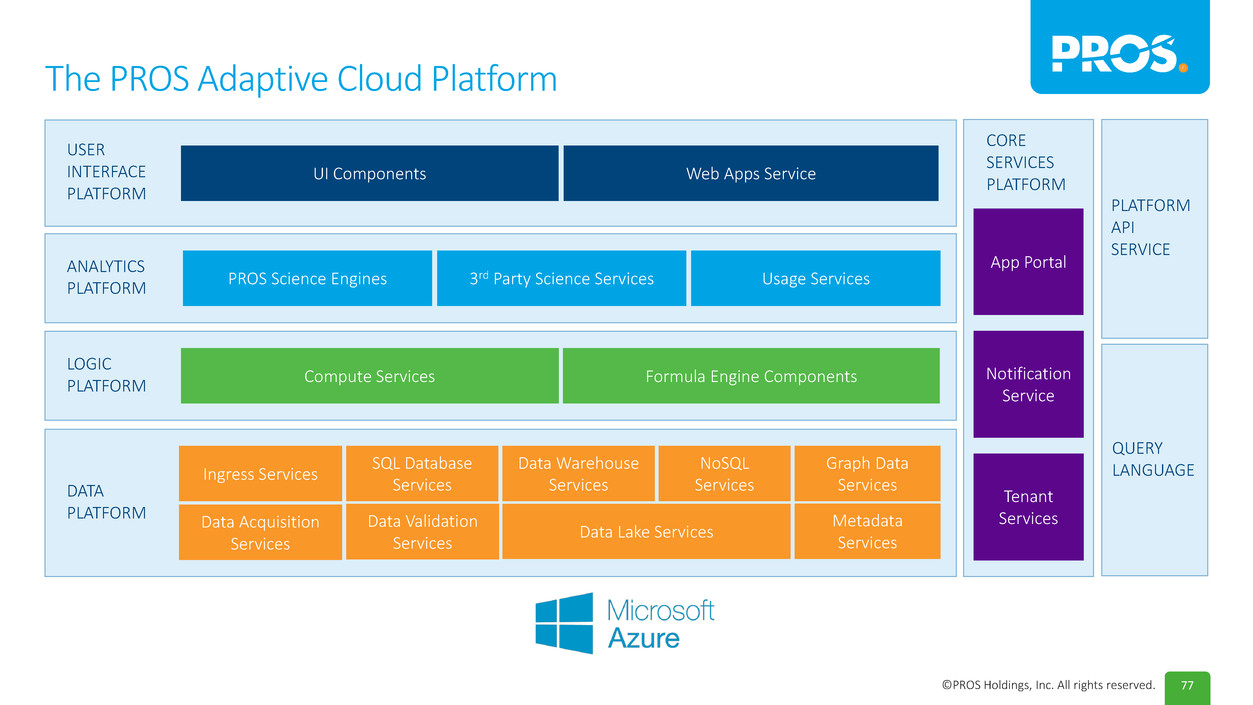
77©PROS Holdings, Inc. All rights reserved. The PROS Adaptive Cloud Platform UI Components USER INTERFACE PLATFORM Web Apps Service PROS Science Engines ANALYTICS PLATFORM 3rd Party Science Services Compute Services LOGIC PLATFORM Formula Engine Components DATA PLATFORM Usage Services CORE SERVICES PLATFORM App Portal Tenant Services Notification Service PLATFORM API SERVICE QUERY LANGUAGEGraph Data Services Metadata Services NoSQL Services Data Warehouse Services SQL Database Services Ingress Services Data Lake Services Data Validation Services Data Acquisition Services
78©PROS Holdings, Inc. All rights reserved. Product Ajay Damani |SVP Engineering
79©PROS Holdings, Inc. All rights reserved.
80 Adaptive Cloud Modern Commerce Data Science
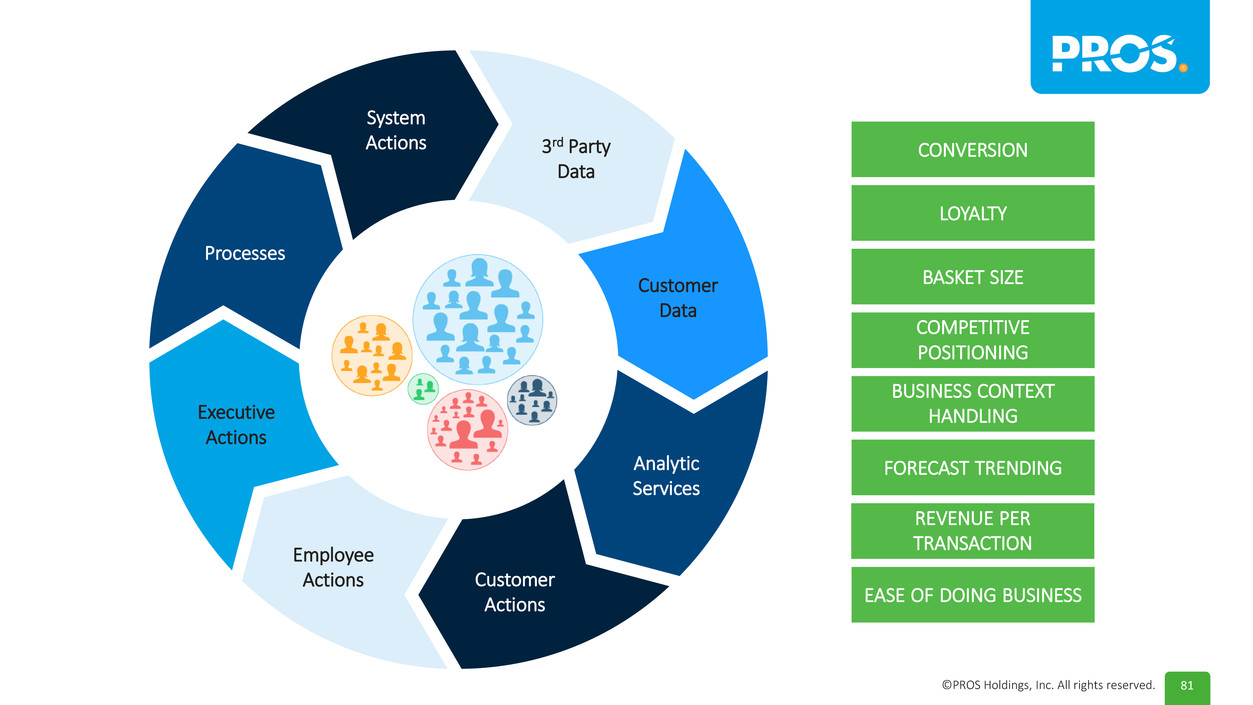
81©PROS Holdings, Inc. All rights reserved. EASE OF DOING BUSINESS FORECAST TRENDING BUSINESS CONTEXT HANDLING COMPETITIVE POSITIONING BASKET SIZE LOYALTY CONVERSION REVENUE PER TRANSACTION Executive Actions Processes System Actions 3rd Party Data Customer Data Analytic Services Customer Actions Employee Actions

82©PROS Holdings, Inc. All rights reserved. EASE OF DOING BUSINESS FORECAST TRENDING BUSINESS CONTEXT HANDLING COMPETITIVE POSITIONING BASKET SIZE LOYALTY CONVERSION REVENUE PER TRANSACTION Executive Actions Processes System Actions 3rd Party Data Customer Data Analytic Services Customer Actions Employee Actions
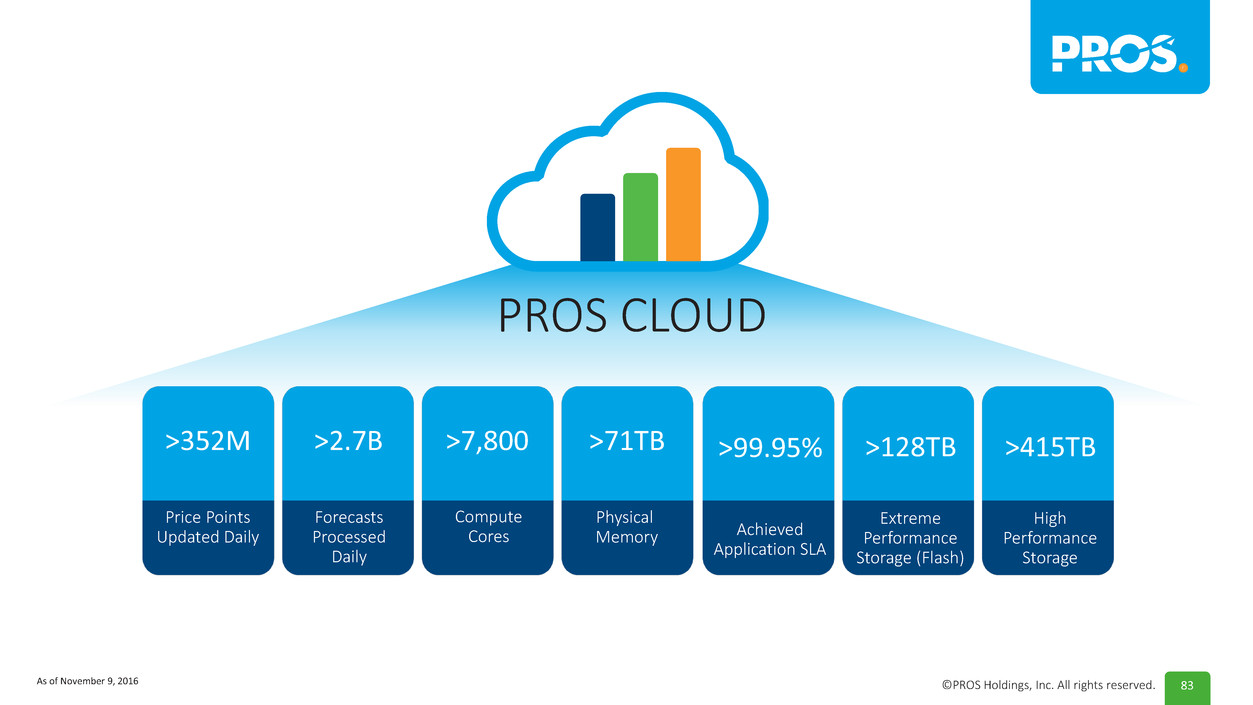
83©PROS Holdings, Inc. All rights reserved. >352M Price Points Updated Daily >2.7B Forecasts Processed Daily >7,800 Compute Cores >71TB Physical Memory >99.95% Achieved Application SLA >128TB Extreme Performance Storage (Flash) >415TB High Performance Storage PROS CLOUD As of November 9, 2016
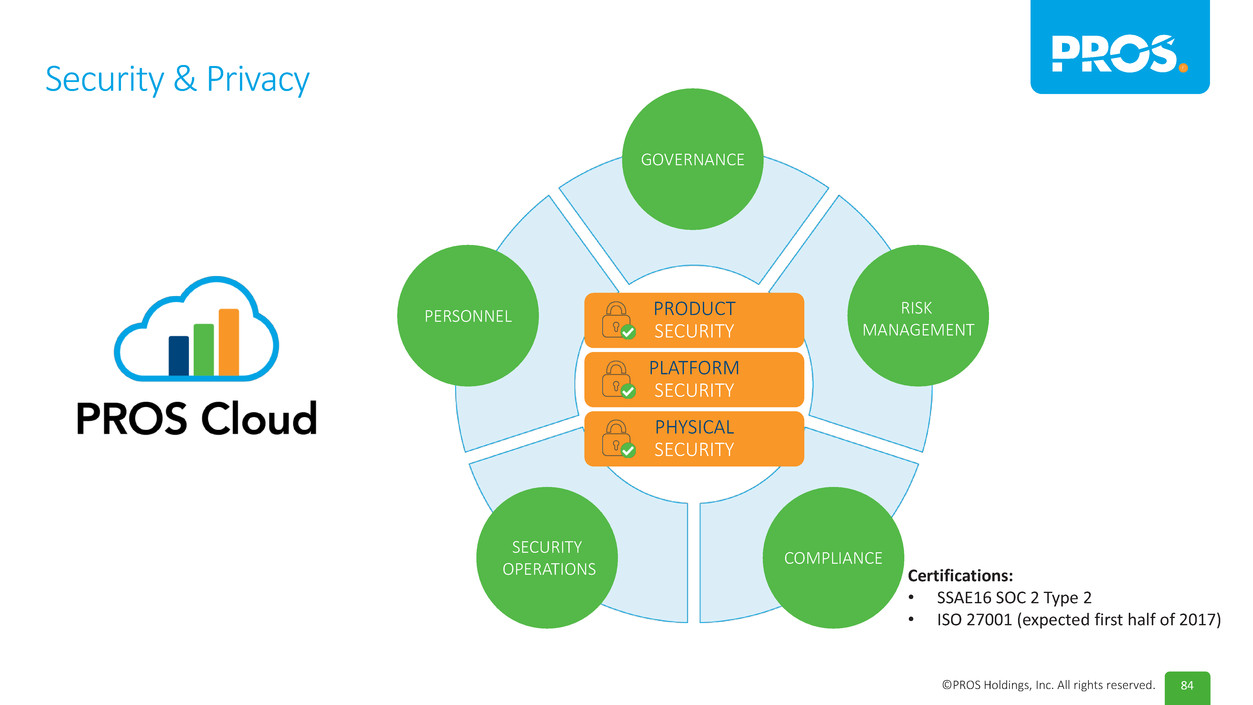
84©PROS Holdings, Inc. All rights reserved. PHYSICAL SECURITY PLATFORM SECURITY PRODUCT SECURITY Security & Privacy GOVERNANCE PERSONNEL COMPLIANCE SECURITY OPERATIONS RISK MANAGEMENT Certifications: • SSAE16 SOC 2 Type 2 • ISO 27001 (expected first half of 2017)
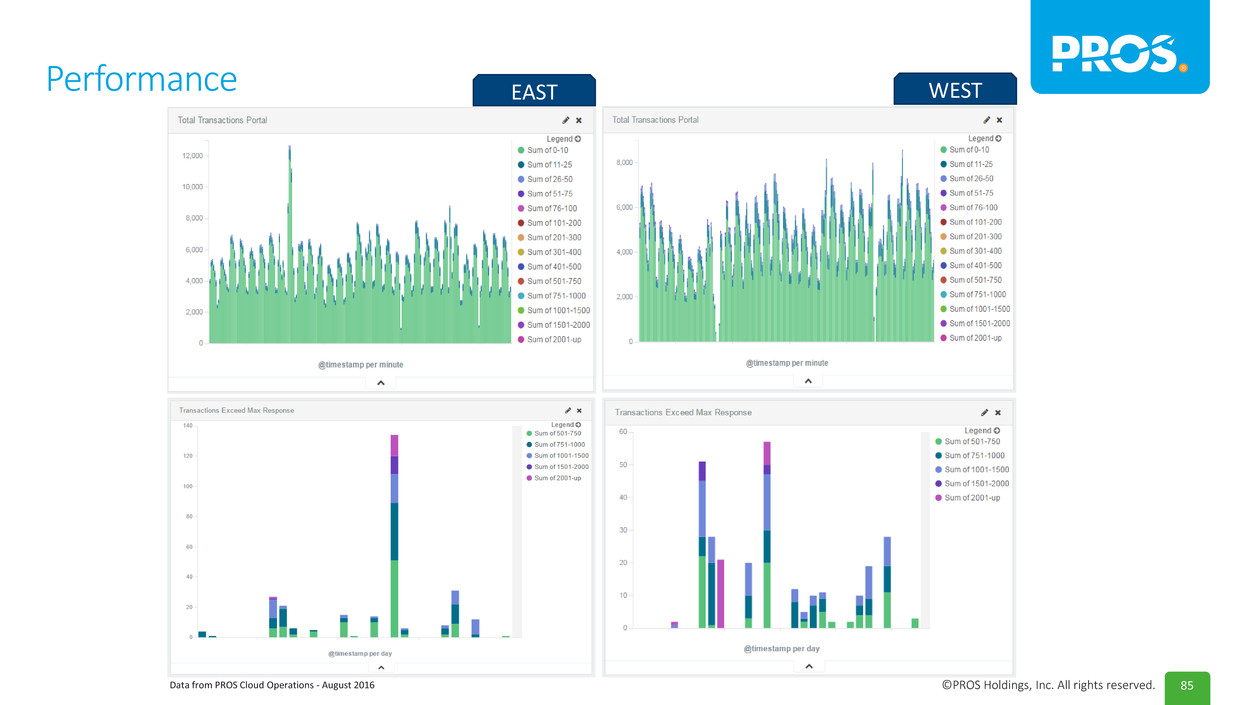
85©PROS Holdings, Inc. All rights reserved. Performance EAST WEST Data from PROS Cloud Operations - August 2016
86©PROS Holdings, Inc. All rights reserved. Customer Panel

87©PROS Holdings, Inc. All rights reserved. Customer Panel David Mok Senior Director, Pricing Strategy & Analytics DePuy Synthes, U.S. (Johnson & Johnson) Carlos Jovel Vice President Revenue Management & Innovation LATAM Brian Thompson Vice President of Pricing & Yield Management YRC Freight John Dillon Strategic Pricing Director Cargill – Global Edible Oils Division

88©PROS Holdings, Inc. All rights reserved. Q&A and Closing Remarks
89©PROS Holdings, Inc. All rights reserved. 89 Appendix

90©PROS Holdings, Inc. All rights reserved. 90 Reconciliation of Select Non-GAAP Financial Metrics Free Cash Flow (ooo's) 2015 (A) 2016 (F) Net cash provided by (used in) operating activities 15,532$ (21,700)$ Purchase of property and equipment (6,794) (8,700) Capitalized internal-use software development costs (233) (1,100) Free Cash Flow 8,505$ (31,500)$


