CANADA | SUPERIOR COURT |
PROVINCE OF QUÉBEC | Commercial Division |
|
|
| IN THE MATTER OF THE PLAN OF COMPROMISE OR ARRANGEMENT OF: |
|
|
| ABITIBIBOWATER INC. , a legal person incorporated under the laws of the State of Delaware, having its principal executive offices at 1155 Metcalfe Street, in the City and District of Montréal, Province of Quebec, H3B 5H2; |
|
And |
| ABITIBI-CONSOLIDATED INC. , a legal person incorporated under the laws of Canada, having its principal executive offices at 1155 Metcalfe Street, in the City and District of Montréal, Province of Quebec, H3B 5H2; |
|
And |
| BOWATER CANADIAN HOLDINGS INC. , a legal person incorporated under the laws of the Province of Nova Scotia, having its principal executive offices at 1155 Metcalfe Street, in the City and District of Montréal, Province of Quebec, H3B 5H2; |
|
And |
| the other Petitioners listed on Appendices "A", "B" and "C"; |
| Petitioners |
| And |
| ERNST & YOUNG INC. , a legal person under the laws of Canada, having a place of business at 800 René-Lévesque Blvd. West, Suite 1900, in the City and District of Montréal, Province of Quebec, H3B 1X9 ; |
| Monitor |
SEVENTH REPORT OF THE MONITOR
June 15, 2009
- -1-
INTRODUCTION
1. On April 17, 2009, Abitibi-Consolidated Inc. ("ACI") and its subsidiaries listed in Appendix "A" hereto (collectively with ACI, the "ACI Petitioners") and Bowater Canadian Holdings Incorporated ("BCHI") and its subsidiaries listed in Appendix "B" hereto (collectively with BCHI, the "Bowater Petitioners") (the ACI Petitioners and the Bowater Petitioners are collectively referred to herein as the "Petitioners") filed for and obtained protection from their creditors under the Companies' Creditors Arrangement Act (the "CCAA" and the "CCAA Proceedings") pursuant to an Order of this Honourable Court (the "Initial Order").
2. Pursuant to the Initial Order, Ernst & Young Inc. (" EYI ") was appointed as monitor of the Petitioners (the "Monitor") under the CCAA and a stay of proceedings in favour of the Petitioners was granted until May 14, 2009 (the "Stay Period"). On May 14, 2009, the Stay Period was extended until September 4, 2009 pursuant to an Order of this Honourable Court (the "First Stay Period Extension Order").
3. On April 16, 2009, AbitibiBowater Inc. ("ABH"), Bowater Inc. ("BI"), and certain of their direct and indirect U.S. and Canadian subsidiaries, including BCHI, Bowater Canadian Forest Products Inc. ("BCFPI") (collectively referred to herein as "U.S. Debtors"), filed voluntary petitions (collectively, the "Chapter 11 Proceedings") for relief under Chapter 11 of the U.S. Bankruptcy Code, 11 U.S.C. 2167§§ 101 et seq. (the "U.S. Bankruptcy Code") in the United States Bankruptcy Court for the District of Delaware (the "U.S. Bankruptcy Court"). On April 17, 2009, the U.S. Bankruptcy Court granted certain interim and final orders (the "First Day Orders") and set dates for the final hearing of the motions for which the U.S. Bankruptcy Court granted the interim orders.
4. The Petitioners are all subsidiaries of ABH (ABH, collectively with its subsidiaries, the "ABH Group").
-2-
5. On April 17, 2009, ABH and the petitioners listed on Appendix "C" hereto (collectively with ABH, the " 18.6 Petitioners ") obtained Orders under Section 18.6 of the CCAA in respect of voluntary proceedings initiated under Chapter 11 and EYI was appointed as the information officer in respect of the 18.6 Petitioners (the " Information Officer ").
6. On April 16, 2009, ACI and ACCC filed petitions for recognition under Chapter 15 of the U.S. Bankruptcy Code. On April 21, 2009, the U.S. Bankruptcy Court granted the recognition orders under Chapter 15 of the U.S. Bankruptcy Code.
7. On April 22, 2009, the Court amended the Initial Order to extend the stay of proceedings to the partnerships listed in Appendix "D" hereto.
BACKGROUND
8. ABH is one of the world's largest publicly traded paper and forest product companies. It produces a wide range of newsprint and commercial printing papers, market pulp and wood products . As at December 31, 2008, the ABH Group employed approximately 15,800 people, approximately 11,300 of which work in ACI's and BI's Canadian operations. The ABH Group owns interests in or operates 35 pulp and paper mills, 24 sawmills (others have been permanently closed), 5 wood products facilities and 32 recycling facilities located in Canada, the United States, the United Kingdom and South Korea.
9. Incorporated in Delaware and headquartered in Montreal, Quebec, ABH functions as a holding company and its business is conducted principally through four direct subsidiaries: BI, Bowater Newsprint South LLC ("Newsprint South") (BI, Newsprint South and their respective subsidiaries are collectively referred to as the "BI Group"), ACI (ACI and its subsidiaries are collectively referred to as the " ACI Group ") and AbitibiBowater US Holding LLC ("ABUSH") (ABUSH and its respective subsidiaries are collectively referred to as the "DCorp Group").
-3-
10. ACI is a direct and indirect wholly-owned subsidiary of ABH. ABH wholly owns BI which in turn, wholly owns BCHI which, in turn, indirectly owns BCFPI which carries on the main Canadian operations of BI.
11. ACCC, a wholly-owned subsidiary of ACI, and BCFPI hold the majority of ABH's Canadian assets and operations.
PURPOSE
12. As set forth in the First Stay Period Extension Order, the Monitor has undertaken to provide this Honourable Court with additional reports on the Petitioners' cash flows for each four week period following the date of the First Stay Period Extension Order. This is the seventh report (the "Seventh Report") of the Monitor in the CCAA Proceedings, the purpose of which is to provide the first report to this Honourable Court with respect to the Petitioners' four week cash flow results, and, in addition, to provide details with respect to the following:
(i) an overview of the current market conditions in the forest products industry;
(ii) the receipts and disbursements of the ACI Group and BCFPI from May 4, 2009 to May 31, 2009 (the "Reporting Period") with a discussion of the variances from the respective forecasts (the "ACI Forecast" and the "BCFPI Forecast") filed with this Honourable Court in the Monitor's Fifth Report dated May 13, 2009;
(iii) the current liquidity and revised cash flow forecasts of the ACI Group and BCFPI through September 6, 2009; and
(iv) the recent trend in certain key performance metrics regarding the Petitioners' businesses.
-4-
TERMS OF REFERENCE
13. In preparing this Seventh Report, the Monitor has been provided with and, in making comments herein, has relied upon unaudited financial information, the ABH Group's books and records, financial information and projections prepared by the ABH Group and discussions with management of the ABH Group (the " Management "). The Monitor has not audited, reviewed or otherwise attempted to verify the accuracy or completeness of such information and, accordingly, the Monitor expresses no opinion or other form of assurance in respect of such information contained in this Seventh Report. Some of the information referred to in this Seventh Report consists of forecasts and projections. An examination or review of the financial forecast and projections, as outlined in the Canadian Institute of Chartered Accountants Handbook, has not been performed. Future-oriented financial information referred to in this Seventh Report was prepared by the ABH Group based on Management's estimates and assumptions. Readers are cautioned that, since these projections are based upon assumptions about future events and conditions, the actual results will vary from the projections, even if the assumptions materialize, and the variations could be significant.
14. Capitalized terms not defined in this Seventh Report are as defined in the previous reports of the Monitor and the Initial Order. All references to dollars are in U.S. currency unless otherwise noted.
15. Copies of all of the Monitor's Reports, in both English and French, including a copy of this Seventh Report, and all motion records and Orders in the CCAA Proceedings will be available on the Monitor's website at www.ey.com/ca/abitibibowater. The Monitor has also established a bilingual toll free telephone number that is referenced on the Monitor's website so that parties may contact the Monitor if they have questions with respect to the CCAA Proceedings.
16. Copies of all of the U.S. Bankruptcy Court's orders are posted on the website for Epiq Bankruptcy Solutions LCC ("Epiq") at http://chapter11.epiqsystems.com/abitibibowater. The Monitor has included a link to Epiq's website from the Monitor's website.
-5-
CURRENT MARKET CONDITIONS IN THE FOREST PRODUCTS INDUSTRY
17. In order to put the Petitioners' cash flow results and revised forecasts in context, the Monitor believes that it would be useful to provide this Honourable Court with a brief overview of the current state of market conditions in the forest products sector in North America generally, as well as the major specific market segments in which the Petitioners operate, including sales and pricing trends.
Overview
18. ABH is a diversified forest products company with four primary product groups: i) newsprint; ii) commercial printing paper; iii) market pulp; and iv) lumber.
19. The Monitor has been advised that the Petitioners continue to face significant economic challenges as a result of the declining demand for newsprint, the continued decline in demand for specialty papers primarily due to sharp declines in advertising, the decrease in global demand for pulp and depressed prices and demand for lumber due to the continued slowdown in the construction of new homes in the U.S. market.
20. As has been widely reported, the North American economy continues to contract, resulting in job losses and reduced buying power of businesses and consumers. Newsprint and pulp prices are both significantly lower than historic norms and the continued downturn in the U.S. housing market has adversely affected many lumber suppliers.
21. These factors have resulted in a continuing challenging environment for most forest products companies in North America. There have been a large number of mill closures announced in the industry to attempt to better match production with market demand.
-6-
22. Attached hereto as Appendix "E" is additional information on the Petitioners' markets. In addition, Appendices "F" and "G" set forth further details regarding pricing trends in recent months in the market segments in which the Petitioners operate.
23. A further significant factor contributing to the challenging market conditions in the forest products sector is the rapid rise of the Canadian dollar relative to the U.S. dollar. Recent changes are highlighted in the graph below. The Petitioners have significant operations in Canada but sell a majority of their products to customers in the United States and abroad. Given that significant operating costs, including payroll, are denominated in Canadian funds, the rapid increase in the value of the Canadian dollar has had, and is forecast to continue to have, a negative impact on operating results and cash flows.
24. The ABH Group estimates that for each $0.01 increase in the $CDN to $U.S. exchange rate the ACI Group's and BCFPI's EBITDA are negatively impacted by approximately $16 million and $9 million per annum, respectively.
-7-
RECEIPTS AND DISBURSEMENTS FROM MAY 4, 2009 TO MAY 31, 2009
The ACI Group
25. The table below summarizes the ACI Group's (including DCorp) actual receipts and disbursements from May 4, 2009 to May 31, 2009, which is detailed in Appendix "H" of this Seventh Report, with a comparison to the ACI Forecast amounts included in the Monitor's Fifth Report:
|
| US$000 | ||||||
|
| Actual |
| Forecast |
| Variance | ||
| Opening Cash | $ | 78,775 | $ | 78,775 | $ | - | |
|
|
|
|
|
|
|
| |
| Receipts |
| 248,381 |
| 214,761 |
| 33,620 | |
| Disbursements |
| (216,476) |
| (187,235) |
| (29,241) | |
| Financing |
|
|
|
|
|
| |
|
| Securitization Inflows / (outflows) |
| (18,338) |
| (30,810) |
| 12,472 |
|
| DIP Drawings / (Repayments) |
| 30,000 |
| 30,000 |
| - |
|
| DIP Interest & Fees |
| (4,406) |
| (4,406) |
| - |
|
| Foreign Exchange Translation |
| (7,533) |
| - |
| (7,533) |
| Financing |
| (277) |
| (5,216) |
| 4,939 | |
|
|
|
|
|
|
|
|
|
| Net Cash Flow |
| 31,628 |
| 22,310 |
| 9,317 | |
|
|
|
|
|
|
|
| |
| Ending Cash | $ | 110,399 | $ | 101,085 | $ | 9,317 | |
|
|
|
|
|
|
|
| |
| DIP Availability | $ | 57,500 | $ | 57,500 | $ | - | |
|
|
|
|
|
|
|
| |
| Available Liquidity | $ | 167,899 | $ | 158,585 | $ | 9,317 | |
26. As demonstrated in the table above, the ACI Group's total receipts for the Reporting Period were $33.6 million (16%) higher than projected in the ACI Forecast and disbursements were $29.2 million (16%) higher than projected in the ACI Forecast. Overall, the ending cash balance was $9.3 million (9%) higher than the ACI Forecast.
Receipts
27. A breakdown of the receipts for the Reporting Period are outlined in the table below:
-8-
|
| US$000 | ||||||
| Receipts | Para. |
| Actual |
| Forecast |
| Variance |
| A/R Collections | 28(i) | $ | 172,731 | $ | 193,735 | $ | (21,004) |
| Intercompany A/R Settlement | 28(i) |
| 19,466 |
| - |
| 19,466 |
| Total A/R Collections |
|
| 192,197 |
| 193,735 |
| (1,538) |
| Collections on Behalf of Joint Ventures | 28(ii) |
| 4,782 |
| 13,294 |
| (8,512) |
| A/R Collections - Affiliates | 28(iii) |
| 32,905 |
| - |
| 32,905 |
| Intercompany A/P Settlement | 28(iv) |
| 11,491 |
| - |
| 11,491 |
| Other Inflows | 28(v) |
| 7,006 |
| 7,733 |
| (727) |
| Total Receipts |
| $ | 248,381 | $ | 214,761 | $ | 33,620 |
28. The variance analysis has been compiled based on discussions with Management and the following represents the more significant reasons for the variances:
(i) Total A/R Collections, inclusive of receipts related to Intercompany A/R Settlements, were approximately $192.2 million during the Reporting Period compared to a forecast amount of $193.7 million.
Intercompany A/R Settlements represent payments to the ACI Group from an affiliate ABH Group entity for ACI accounts receivable that were collected by the affiliated entity, such as BCFPI or BI (as the customer paid the incorrect ABH Group entity).
Management has advised the Monitor that no accounts are in dispute and that a significant portion of accounts receivable are insured up to 90% of their value by Export Development Canada ("EDC"). As such, Management is confident that all amounts will ultimately be collected and any difference is simply due to timing.
(ii) Collections on Behalf of Joint Ventures totalled approximately $4.8 million, which represents accounts receivable collected by the ACI Group which belong to a joint venture and are subsequently paid over to the joint venture partner in accordance with the joint venture agreement. This is compared to a forecast amount of $13.3 million resulting in a negative variance of $8.5 million, in part because certain collections on behalf of joint ventures are included in the A/R Collections line item. Management has advised that it intends to settle these amounts on a monthly basis.
-9-
(iii) A/R Collections - - Affiliates were $32.9 million during the Reporting Period. As part of its normal cash management system, the ACI Group regularly collects accounts receivable on behalf of other ABH Group entities. As it is not possible to forecast which customers will pay the ACI Group on behalf of the other entities, collections on behalf of affiliates is not forecast by the Petitioners. The funds are ultimately paid by the ACI Group to the appropriate ABH Group entity, which payments are reflected in the Intercompany A/R Settlements line of the disbursements section of the cash flow statement.
(iv) Receipts for Intercompany A/P Settlements totalled $11.5 million during the Reporting Period. As the ACI Group regularly makes payments on behalf of affiliated entities for freight or other expenses, this line item represents the reimbursement of such costs by those entities. The ACI Group does not forecast these receipts when it produces its weekly cash flow forecast.
(v) Other Inflows include tax refunds and other miscellaneous types of refunds which totalled approximately $7.0 million during the Reporting Period, which was $0.7 million less than the projected receipt in the ACI Forecast.
Disbursements
29. A breakdown of the disbursements for the Reporting Period is outlined in the table below:
-10-
|
| US$000 | ||||||
| Disbursements | Para. |
| Actual |
| Forecast |
| Variance |
| Trade Payables | 30(i) | $ | (125,382) | $ | (101,072) | $ | (24,310) |
| Capital Expenditures | 30 (ii) |
| - |
| (5,625) |
| 5,625 |
| Marine Freight Payments | 30(iii) |
| (6,264) |
| (4,200) |
| (2,064) |
| Utility Payments | 30 (iv) |
| (20,200) |
| (25,600) |
| 5,400 |
| Payroll & Benefits | 30 (v) |
| (18,400) |
| (22,617) |
| 4,217 |
| Intercompany A/R Settlements | 30(vi) |
| (39,590) |
| - |
| (39,590) |
| Joint Venture Remittances, Net | 30(vii) |
| (4,341) |
| (24,121) |
| 19,780 |
| Restructuring & Other Items | 30(viii) |
| (2,299) |
| (4,000) |
| 1,701 |
| Total Disbursements |
| $ | (216,476) | $ | (187,235) | $ | (29,241) |
30. The variance analysis with respect to the disbursements has been compiled based on discussions with Management and the following represents a summary of the reasons for the variances:
(i) Trade Payables disbursements were approximately $125.4 million during the Reporting Period which is $24.3 million more than had been forecast for the Reporting Period. Management has advised that the variance is primarily due to the following:
(a) Capital Expenditures have been included in the actual amount for Trade Payables disbursements until such time as the ACI Group identifies and allocates the disbursements which are capital in nature;
(b) the ACI Group regularly disburses amounts on behalf of other affiliated entities which are included in the actual Trade Payables. As noted above, during the Reporting Period the ACI Group was reimbursed for $11.5 million of such amounts; and
(c) the ACI Group has paid certain suppliers in advance during the Reporting Period as part of the stabilization process.
(ii) Capital Expenditures are not tracked on a weekly basis. As such, the actual capital disbursements have been included in Trade Payables disbursements. The ACI Group is currently analyzing purchases to identify and allocate the capital expenditures.
-11-
(iii) Marine Freight Payments totalled $6.3 million during the Reporting Period. The ACI Forecast had projected disbursements of $4.2 million, resulting in a negative variance of approximately $2.1 million. The variance is due to greater than forecast marine shipments during the Reporting Period and timing differences as certain marine freight payments were made in advance during the stabilization period.
(iv) Disbursements for Utility Payments were approximately $20.2 million during the Reporting Period, resulting in positive variance of $5.4 million compared to the amount of $25.6 million in the ACI Forecast. The reason for this variance is due to lower than forecast production which decreased the requirement for hydroelectric power.
(v) Amounts disbursed related to Payroll & Benefits totalled approximately $18.4 million compared to a forecast amount of $22.6 million in the ACI Forecast. The positive variance of $4.2 million is primarily due to lower than forecast variable labour costs as a result of lower than forecast production.
(vi) The ACI Forecast did not project Intercompany A/R Settlements of approximately $39.6 million as it is not possible to predict how much the ACI Group will collect from customers on behalf of affiliated entities. The corresponding receipt of these amounts collected from customers is included in the A/R Collections - Affiliates line included in the Receipts section of the cash flow statement.
(vii) Joint Venture Remittances, Net represents payments to the ACI Group's various joint venture partners , net of any management fees. Pursuant to certain joint venture agreements, the ACI Group collects the accounts receivable in respect of the relevant joint venture and remits the cash in accordance with agreed upon terms. The ACI Forecast had projected these amounts as being settled on a weekly basis after the CCAA filing, however, such settlements are continuing to occur on pre-CCAA terms in accordance with the joint venture agreements, resulting in a positive variance of approximately $19.8 million. Such settlements are projected to be settled on a monthly basis in the future.
-12-
(viii) Payments for Restructuring & Other Items totalled approximately $2.3 million during the Reporting Period. This amount compares to a total of $4.0 million in the ACI Forecast. Management believes that the difference is due to timing.
Financing
31. Details regarding the ACI Group's financing activities are summarized in the following table:
|
| US$000 | ||||||
| Financing | Para. |
| Actual |
| Forecast |
| Variance |
| Securitization Inflows / (Outflows) | 32(i) | $ | (18,338) | $ | (30,810) | $ | 12,472 |
| DIP Drawings / (Repayments) | 32 (ii) |
| 30,000 |
| 30,000 |
| - |
| DIP Interest & Fees | 32(ii) |
| (4,406) |
| (4,406) |
| - |
| Foreign Exchange Translation | 32 (iii) |
| (7,533) |
| - |
| (7,533) |
|
|
| $ | (277) | $ | (5,216) | $ | 4,939 |
32. The variance analysis with respect to the ACI Group's financing activities has been compiled based on discussions with Management and the following represents a summary of the reasons for the variances:
(i) Securitization Inflows/(Outflows) totalled approximately $(18.3) million compared to a forecast outflow amount of approximately $(30.8) million during the Reporting Period. The reason for this difference is due to the availability under the existing Securitization Program which was higher as a result of lower than forecast accounts receivable collections.
(ii) Net DIP Drawings and DIP Interest & Fees were in accordance with their projected amounts. Funding pursuant to the DIP and the related fees were received and paid in the week ended May 17, 2009.
-13-
(iii) Amounts on the Foreign Exchange Translation line represent the difference between the actual exchange rate between Canadian and U.S. dollars at the time of conversion as compared to the forecast rate of CDN$1.00=US$0.80.
BCFPI
33. The following table summarizes the receipts and disbursements of BCFPI from May 4, 2009 to May 31, 2009, which is detailed in Appendix "I" of this Seventh Report:
|
| US$000 | |||||
|
| Actual |
| Forecast |
| Variance | |
| Opening Cash | $ | 43,338 | $ | 43,338 | $ | - |
|
|
|
|
|
|
|
|
| Receipts |
| 42,303 |
| 71,510 |
| (29,207) |
| Disbursements |
| (58,347) |
| (66,258) |
| 7,911 |
| Cash Flow from Operations |
| (16,044) |
| 5,252 |
| (21,296) |
|
|
|
|
|
|
|
|
| Ending Cash | $ | 27,294 | $ | 48,590 | $ | (21,296) |
34. As detailed in the table above, BCFPI's total receipts for the Reporting Period were $29.2 million (41%) lower than the BCFPI Forecast and disbursements were $7.9 million (12%) lower than the BCFPI Forecast. Overall, the ending cash balance was $21.3 million (44%) lower than the BCFPI Forecast.
Receipts
35. A breakdown of the BCFPI receipts are summarized in the table below:
-14-
|
| US$000 | ||||||
| Receipts | Para. |
| Actual |
| Forecast |
| Variance |
| A/R Collections | 36(i) | $ | 10,718 | $ | 71,510 | $ | (60,792) |
| Intercompany A/R Settlements | 36 (i) |
| 28,113 |
| - |
| 28,113 |
| Total A/R Collections |
|
| 38,831 |
| 71,510 |
| (32,679) |
| A/R Collections - Affiliates | 36 (ii) |
| 1,516 |
| - |
| 1,516 |
| Other Inflows | 36 (iii) |
| 1,956 |
| - |
| 1,956 |
| Total Receipts |
| $ | 42,303 | $ | 71,510 | $ | (29,207) |
36. The variance analysis with respect to the receipts has been compiled based on discussions with Management and the following represents a summary of the reasons for the variances:
(i) A/R Collections were approximately $10.7 million resulting in a negative variance of $60.8 million. This negative variance is primarily due to the timing of settlement of BCFPI accounts receivable collected by Bowater America Inc. ("BAI"), which normally collects BCFPI's U.S. customer sales and then remits such payments back to BCFPI, and is partially offset by the $28.1 million included in the Intercompany A/R Settlements line representing the payment to BCFPI in respect of collections of BCFPI accounts receivable by BAI from April 17, 2009 to May 27, 2009. Additional amounts have been collected by BAI from BCFPI's U.S. customers in respect of the Reporting Period, but which have not yet been remitted to BCFPI. Such payments are scheduled to be made in the weeks ended June 7 and June 14, 2009. In addition, BCFPI's accounts receivable balance has grown by approximately $14 million which has affected cash flow.
The actual tonnes shipped by BCFPI to customers were also lower than the implicit assumption contained in the forecast submitted with BCFPI's initial petition materials and the forecast contained in the Fifth Report.
(ii) A/R Collections - - Affiliates were not forecast in the BCFPI Forecast. Such amounts are not typically forecast by BCFPI as it is not possible to predict how much customers will remit payment to BCFPI for sales made by ABH- affiliated companies. These funds will ultimately be remitted to the appropriate affiliate through the Intercompany A/R Settlement line in the Disbursements section of the cash flows statement.
-15-
(iii) Amounts received related to Other Inflows were approximately $2.0 million during the Reporting Period. Such receipts primarily represent various tax refunds and deposits made at the mill level. BCFPI does not forecast such amounts.
Disbursements
37. Details regarding disbursements are summarized in the following table:
|
| US$000 | ||||||
| Disbursements | Para. |
| Actual |
| Forecast |
| Variance |
| Trade Payables | 38(i) | $ | (31,056) | $ | (39,268) | $ | 8,212 |
| Intercompany SG&A Allocation | 38 (ii) | - |
| (2,892) |
| 2,892 | ||
| Intercompany A/R Settlements | 38(iii) | (666) |
| - |
| (666) | ||
| Intercompany A/P Settlements | 38 (iv) | (2,955) |
| - |
| (2,955) | ||
| Payments on Behalf of Affiliates | 38 (v) | (3,888) |
| - |
| (3,888) | ||
| Freight | 38 (vi) | (1,936) |
| (6,436) |
| 4,500 | ||
| Payroll & Benefits | 38 (vii) | (13,662) |
| (11,177) |
| (2,485) | ||
| Capital Expenditures | 38 (viii) |
| - |
| (1,808) |
| 1,808 |
| Interest | 38 (ix) |
| (1,393) |
| (1,637) |
| 244 |
| Restructuring Costs | 38 (x) |
| - |
| (3,040) |
| 3,040 |
| Foreign Exchange Translation | 38 (xi) |
| (2,791) |
| - |
| (2,791) |
| Total Disbursements |
| $ | (58,347) | $ | (66,258) | $ | 7,911 |
38. The variance analysis with respect to BCFPI's disbursements has been compiled based on discussions with Management and the following represents a summary of the reasons for the variances:
(i) Disbursements related to Trade Payables were $8.2 million less than forecast during the Reporting Period. The reason for this variance is primarily due to lower supplier prepayments and lower production during the Reporting Period than had been assumed in the BCFPI Forecast.
-16-
(ii) During the Reporting Period, BCFPI did not pay any amounts in respect of the Intercompany SG&A Allocation as the Q1 allocation has not been settled. This resulted in a positive cash flow variance of approximately $2.9 million, which will reverse when intercompany SG&A allocations are settled on a cash basis.
(iii) Payments for Intercompany A/R Settlements totalled approximately $0.7 million during the Reporting Period. Intercompany A/R Settlements represent payments made by BCFPI to reimburse related entities for accounts receivable paid to BCFPI by ABH- affiliated customers.
(iv) Intercompany A/P Settlements represent BCFPI reimbursing related entities for payments made on its behalf. During the Reporting Period such payments totalled approximately $3.0 million.
(v) Payments on Behalf of Affiliates were $3.9 million during the Reporting Period. Due to the integrated nature of the operations of the Petitioners and the Cash Management System, such payments occur on a regular basis. BCFPI does not forecast such payments, nor do they forecast the repayment of these items.
(vi) Disbursements for Freight totalled $1.9 million during the Reporting Period. This compares to an amount of approximately $6.4 million in the BCFPI Forecast. The positive variance is due to the fact that substantially all of the BCFPI freight costs are paid for by the ACI Group. As such, the bulk of disbursements for Intercompany A/P Settlements represent payments by BCFPI back to the ACI Group to reimburse for freight paid on behalf of BCFPI. Shipments were also less than forecast, thereby contributing to this positive variance.
(vii) During the Reporting Period BCFPI disbursed $13.7 million in respect of Payroll and Benefits. The BCFPI Forecast projected disbursements of $11.2 million, thereby resulting in a negative variance of $2.5 million. This variance is primarily due to the timing of payroll and benefit payments.
-17-
(viii) Capital Expenditures are not tracked on a weekly basis. As such, disbursements for this line item have been included in Trade Payables. BCFPI is currently analyzing purchases to identify and allocate capital expenditures.
(ix) Payments with respect to Interest totalled $1.4 million during the Reporting Period. The BCFPI Forecast had projected disbursements of $1.6 million, thereby resulting in a difference of $0.2 million.
(x) Restructuring Costs were not paid during the Reporting Period. The BCFPI Forecast had payments of $3.0 million being made. This variance is primarily due to timing and this variance is expected to reverse.
(xi) Amounts on the Foreign Exchange Translation line represent the difference between the actual exchange rate at the time of conversion between Canadian and U.S. dollars as compared to the forecast rate of CDN$1=US$0.80.
CURRENT LIQUIDITY POSITION AND THE 14 WEEK CASH FLOW FORECASTS
Current Liquidity Position
39. Attached as Appendices "J" and "K", respectively, are the updated 14 week cash flow forecasts of the ACI Group (including DCorp Group) and BCFPI through September 6, 2009.
40. The major changes from the cash flow forecasts contained in the Fifth Report are primarily a result of a drop in anticipated newsprint selling prices for the duration of the period covered by the cash flow forecast and an increase in the value of the Canadian dollar. The cash flow forecasts attached as Appendices "J" and "K" use an exchange rate assumption of CDN$1.00=US$0.90 while the forecasts filed with the Fifth Report used a rate of CDN$1.00=US$0.80.
-18-
41. As at May 31, 2009, the ACI Group had cash on hand of $110.4 million. In addition to this amount, the undrawn portion of the ACI DIP Facility was $70.0 million However, pursuant to the ACI DIP Facility $12.5 million of this amount must remain undrawn, thereby resulting in net available liquidity under the ACI DIP Facility of $57.5 million. Accordingly, the total liquidity of the ACI Group was $167.9 ($110.4 million cash plus $57.5 million of ACI DIP Facility availability) million as at May 31, 2009.
42. The ACI Group's (including DCorp Group's) projected liquidity for the next 14 weeks is set forth in Appendix "J" and is summarized in the graph below.
43. Although the ACI Group's cash balance and available liquidity as at May 31, 2009 is greater than that forecast in the Fifth Report, the ACI Group's liquidity is projected to be $113.2 million as at September 6, 2009 which results in a reduction from the forecast contained in the Fifth Report by $43.7 million, primarily due to lower newsprint prices, the increased value of the Canadian dollar relative to the U.S. dollar and the assumption that DCorp will pay pre-filing and post-filing interest to the ACCC Term Lenders pursuant to the Amended and Restated Securitization Program Order issued by the U.S. Bankruptcy Court, which includes adequate protection for the ACCC Term Lenders from DCorp.
-19-
44. BCFPI had cash on hand as at May 31, 2009 of $27.4 million. BCFPI's forecast liquidity for the 14 weeks ending September 6, 2009, which includes a projected $17 million of intercompany funding from BI, is set forth in Appendix "K" and is summarized in the graph below. The significant decrease in projected liquidity is primarily due to the drop in newsprint selling prices and the impact of the increasing value of the Canadian dollar relative to the U.S. dollar.

45. BCFPI's projected liquidity as at September 6, 2009 is $1.0 million and represents a reduction from the forecast set forth in the Fifth Report of $29.8 million (taking into account the intercompany funding of $17 million). This reduction is primarily a result of a drop in newsprint selling prices and the rising value of the Canadian dollar relative to the U.S. dollar.
Forecast volumes for newsprint sales have also decreased since the forecast included in the Fifth Report. Such a decrease is projected to have a negative impact on the liquidity of BCFPI.
-20-
46. Management has informed the Monitor that BCFPI's forecast cash requirements will be supported by BI through intercompany advances, if necessary.
47. In light of the declining market conditions and the strengthening of Canadian currency and the resultant impact on the ACI Group's and BCFPI's projected liquidity, the ABH Group is reviewing its alternatives to reduce costs and to better balance its mill production to current market demand.
KEY PERFORMANCE INDICATORS
48. Appendices "F" and "G" provide a summary of certain key performance metrics with respect to the operating results of the Petitioners over the past five months, which demonstrates the impact that market conditions have had on the Petitioners' average selling prices.
FINANCIAL STATEMENTS
49. AbitibiBowater Inc. and BCFPI have both posted their first quarter financial statements on either www.sedar.com or www.edgaronline.com. Selected financial information regarding the first quarter of 2009 can also be found at www.abitibibowater.com under the "Investors" tab.
50. The Monitor will report further to this Honourable Court with respect to the Petitioners' cash flow results and projections in four weeks' time.
All of which is respectfully submitted.
ERNST & YOUNG INC.
in its capacity as the Court Appointed Monitor
of the Petitioners
Per: /s/ Alex Morrison
Alex Morrison, CA, CIRP
Senior Vice President
-21-
Greg Adams, CA, CIRP
Senior Vice President
John F. Barrett, CA, CIRP
Vice President
-22-
APPENDIX "A"
ABITIBI PETITIONERS
1. | Abitibi-Consolidated Company of Canada |
2. | Abitibi-Consolidated Inc. |
3. | 3224112 Nova Scotia Limited |
4. | Marketing Donohue Inc. |
5. | Abitibi-Consolidated Canadian Office Products Holding Inc. |
6. | 3834328 Canada Inc. |
7. | 6169678 Canada Inc. |
8. | 4042140 Canada Inc. |
9. | Donohue Recycling Inc. |
10. | 1508756 Ontario Inc. |
11. | 3217925 Nova Scotia Company |
12. | La Tuque Forest Products Inc. |
13. | Abitibi-Consolidated Nova Scotia Incorporated |
14. | Saguenay Forest Products Inc. |
15. | Terra Nova Explorations Ltd. |
16. | The Jonquière Pulp Company |
17. | The International Bridge and Terminal Company |
18. | Scramble Mining Ltd. |
19. | 9150-3383 Québec Inc. |
-23-
APPENDIX "B"
BOWATER PETITIONERS
1. | Bowater Canada Finance Corporation |
2. | Bowater Canadian Limited |
3. | Bowater Canadian Holdings. Inc. |
4. | 3231378 Nova Scotia Company |
5. | AbitibiBowater Canada Inc. |
6. | Bowater Canada Treasury Corporation |
7. | Bowater Canadian Forest Products Inc. |
8. | Bowater Shelburne Corporation |
9. | Bowater LaHave Corporation |
10. | St-Maurice River Drive Company Limited |
11. | Bowater Treated Wood Inc. |
12. | Canexel Hardboard Inc. |
13. | 9068-9050 Québec Inc. |
14. | Alliance Forest Products Inc. (2001) |
15. | Bowater Belledune Sawmill Inc. |
16. | Bowater Maritimes Inc. |
17. | Bowater Mitis Inc. |
18. | Bowater Guérette Inc. |
19. | Bowater Couturier Inc. |
-24-
APPENDIX "C"
18.6 PETITIONERS
1. | AbitibiBowater US Holding 1 Corp. |
2. | AbitibiBowater Inc. |
3. | Bowater Ventures Inc. |
4. | Bowater Incorporated |
5. | Bowater Nuway Inc. |
6. | Bowater Nuway Mid-States Inc. |
7. | Catawba Property Holdings LLC |
8. | Bowater Finance Company Inc. |
9. | Bowater South American Holdings Incorporated |
10. | Bowater America Inc. |
11. | Lake Superior Forest Products Inc. |
12. | Bowater Newsprint South LLC |
13. | Bowater Newsprint South Operations LLC |
14. | Bowater Finance II, LLC |
15. | Bowater Alabama LLC |
16. | Coosa Pines Golf Club Holdings, LLC |
-25-
APPENDIX "D"
PARTNERSHIPS
1. | Bowater Canada Finance Limited Partnership |
2. | Bowater Pulp and Paper Canada Holdings Limited Partnership |
3. | Abitibi-Consolidated Finance LP |
-26-
APPENDIX "E"
MARKET OVERVIEW DETAILS
Newsprint
1. The ABH Group supplies leading publishers in more than 80 countries with newsprint with approximately one-third of the ABH Group's total newsprint production being sold to markets outside North America. Newsprint is used for newspapers, advertising inserts, flyers, brochures, circulars, telephone and other directories and commercial guides.
2. Management has advised the Monitor that newsprint prices are depressed due to a decrease in demand over the last number of years. A report published by the Pulp and Paper Products Council for April 2009 (the "PPPC Report") indicates that North American demand for newsprint was approximately 32.6% lower in April 2009 as compared to the prior year, while global demand decreased by 18.4%. North American mill utilization rates (shipments as a percent of capacity) have fallen from 94.3% in 2008 to 70.5% in 2009, even after adjusting for idled capacity. This indicates there is still a significant overcapacity in both North America and the global newsprint industry despite decreases in industry operating capacity as shown in the graph below:
-27-
3. The industry has responded to the decline in demand by reducing operating capacity including the announced reduction of over 90,000 tonnes of production in the month of April by certain of the Petitioners' competitors. However, Management has advised that industry-wide newsprint inventory levels are approximately 50% higher than the average inventory levels for the past 5 years. The Petitioners have been actively reducing inventory levels to match demand and the Petitioners' current inventory levels are below historic levels.
4. Recently announced closures or production curtailments include those made by White Birch Paper Company, Boise Inc., Catalyst Paper Corporation and Kruger Inc.
Commercial Paper Products ("CPP")
5. The ABH Group produces approximately 3.4 million metric tons of coated and uncoated papers annually for magazines, catalogues, direct-mail inserts, instructional manuals, maps, advertising inserts, flyers, and books.
6. According to the PPPC Report, industry-wide shipments of coated and uncoated mechanical papers for the first four months of 2009 have fallen by approximately 35% and 22%, respectively, when compared to the same time period in 2008. The primary driver of this decline in demand is the reduced sales volume for advertising and magazines.
7. The industry has responded by idling mills and thereby reducing capacity. Management believes that this trend will continue as demand and prices continue to decline.
-28-
Lumber
8. The ABH Group has an annual capacity of over 2.5 billion board feet of lumber, which is enough to build 200,000 homes. ABH also remanufactures and engineers wood for specialized applications such as mobile homes, roofing, flooring, and other products . Management has advised the Monitor that demand for lumber, which is primarily sold to the housing market in the United States, is at historically low levels. A number of sawmills have idled production until such time as the market recovers and the Petitioners are able to generate sufficient margins to restart the operation of the idled sawmills.
9. Housing starts in the United States and Canada are a significant driver of the demand for lumber. In April 2009, the latest month for which statistics are available, housing starts totalled approximately 458,000 on a seasonally adjusted annual basis according to Equity Research Associates, a firm who regularly issues reports on the forest products sector. This compares to approximately 1 million new housing starts in 2008 and 1.8 million in 2006. The demand and price for lumber will likely remain challenged until U.S. housing starts begin to improve.
-29-
Market Pulp
10. The ABH Group typically produces approximately 1.1 million metric tons of market pulp on annual basis. Pulp is used to make a variety of consumer products such as tissues, paper towels, diapers, and printing and writing papers. Although not a large producer compared to other pulp producing entities, the ABH Group does produce pulp at several mills. Global pulp markets have recently been experiencing similar negative market pressures that have been realized in other segments of the business.
11. Despite the recent weakness, however, the pulp market has shown limited signs of recovery. Several large North American pulp producers have recently announced price increases effective June 1, 2009. Foreign markets, especially China, have been increasing purchases of pulp recently.
12. One significant item with respect to pulp is the "black liquor" tax credits being received by pulp mills operated by BI. Pursuant to legislation in the United States, plants that burn black liquor in their mills are eligible for tax credits from the U.S. federal government. While BI continues to receive these tax credits, the future of the program is not certain. There is no similar tax credit available to mills in Canada, which has put many Canadian mills at a disadvantage relative to U.S. mills.
13. The following graph details pulp prices over the last two years and was obtained from RISI, a leading forest products organization.
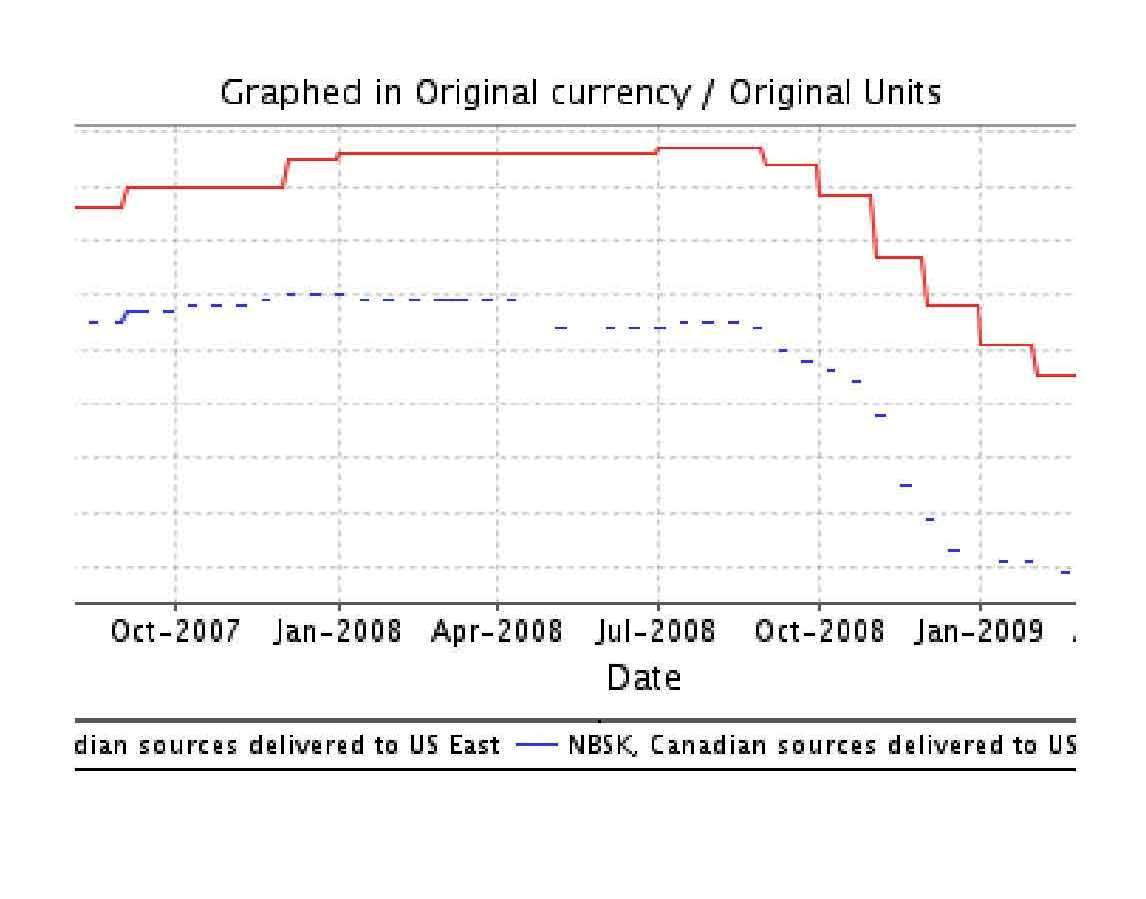
-30-
APPENDIX "F"
KEY PERFORMANCE METRICS
1. The following analysis details certain production metrics that Management uses to track the performance of the ABH Group.
2. Management has advised that while sales tonnages have shown moderate decreases since January 2009, net sales prices have decreased significantly due to the excess production capacity available in North America. The following table details monthly shipments of the ACI Group on a product line basis:
3. Although BCFPI ships a lower amount of tonnage and sells a different product mix than the ACI Group, it has faced similar pressures on pricing as the graph below indicates:
-31-
4. Management has advised that demand and pricing for lumber have improved somewhat during the five month period from January to May due to a slight recovery in the U.S. housing market. However, shipments are still substantially below historic levels. The graph below shows the selling price of lumber shipments at the ACI Group and BCFPI. Average prices are different due to the fact that the product mix at the ACI Group includes more value added products.
-32-
APPENDIX "G"
NUMERIC KEY PERFORMANCE METRICS
ACI Group |
|
|
|
|
|
Key Performance Metrics |
|
|
|
|
|
|
|
|
|
|
|
|
|
|
|
|
|
Newsprint, Specialty Paper & Pulp |
|
|
|
|
|
|
|
|
|
|
|
Sales tonnage (MT) | January | February | March | April | May |
|
|
|
|
|
|
Newsprint | 95,561 | 109,805 | 115,877 | 96,250 | 99,548 |
Specialty Paper | 99,378 | 84,047 | 91,929 | 82,694 | 84,284 |
Pulp | 2,573 | 4,364 | 2,645 | 3,332 | 4,392 |
| 197,512 | 198,215 | 210,450 | 182,276 | 188,223 |
|
|
|
|
|
|
Net sales (US$000) | January | February | March | April | May |
|
|
|
|
|
|
| 154,055 | 153,360 | 161,003 | 127,136 | 127,879 |
|
|
|
|
|
|
Net selling price per tonne (US$) | January | February | March | April | May |
|
|
|
|
|
|
| 780 | 774 | 765 | 697 | 679 |
|
|
|
|
|
|
Mill Uptime (%) | January | February | March | April | May |
|
|
|
|
|
|
| 70.48 | 77.68 | 76.12 | 78.41 | 77.74 |
|
|
|
|
|
|
Lumber |
|
|
|
|
|
|
|
|
|
|
|
Sales (Million mbf) | January | February | March | April | May |
|
|
|
|
|
|
| 58 | 60 | 68 | 61 | 62 |
|
|
|
|
|
|
Net sales (US$000) | January | February | March | April | May |
|
|
|
|
|
|
| 15,153 | 14,356 | 16,868 | 16,161 | 16,893 |
|
|
|
|
|
|
Sales per Million mbf (US$) | January | February | March | April | May |
|
|
|
|
|
|
| 260 | 241 | 249 | 265 | 271 |
|
|
|
|
|
|
Mill Uptime (%) - Sawing | January | February | March | April | May |
|
|
|
|
|
|
| 17 | 19 | 16 | 17 | 17 |
|
|
|
|
|
|
Mill Uptime (%) - Planing | January | February | March | April | May |
|
|
|
|
|
|
| 20 | 20 | 21 | 25 | 24 |
Note: MT represents metric tonnes
-33-
Bowater Canadian Forest Products Inc. |
|
|
|
|
|
Key Performance Metrics |
|
|
|
|
|
|
|
|
|
|
|
|
|
|
|
|
|
Newsprint, Specialty Paper & Pulp |
|
|
|
|
|
|
|
|
|
|
|
Sales tonnage (MT) | January | February | March | April | May |
|
|
|
|
|
|
Newsprint | 40,281 | 16,277 | 37,216 | 35,685 | 37,851 |
Specialty Paper | 19,605 | 17,960 | 18,644 | 20,608 | 20,242 |
Pulp | 23,816 | 17,478 | 18,914 | 20,083 | 24,923 |
| 83,703 | 51,715 | 74,774 | 76,376 | 83,016 |
|
|
|
|
|
|
Net sales (US$000) | January | February | March | April | May |
|
|
|
|
|
|
| 57,535 | 34,757 | 49,972 | 47,329 | 48,904 |
|
|
|
|
|
|
Net selling price per tonne (US$) | January | February | March | April | May |
|
|
|
|
|
|
| 687 | 672 | 668 | 620 | 589 |
|
|
|
|
|
|
Mill Uptime (%) | January | February | March | April | May |
|
|
|
|
|
|
| 82.71 | 80.27 | 83.95 | 84.41 | 84.42 |
|
|
|
|
|
|
Lumber |
|
|
|
|
|
|
|
|
|
|
|
Sales (Million mbf) | January | February | March | April | May |
|
|
|
|
|
|
| 27 | 30 | 34 | 27 | 35 |
|
|
|
|
|
|
Net sales (US$000) | January | February | March | April | May |
|
|
|
|
|
|
| 5,514 | 6,049 | 7,095 | 5,694 | 7,621 |
|
|
|
|
|
|
Sales per Million mbf (US$) | January | February | March | April | May |
|
|
|
|
|
|
| 206 | 199 | 206 | 207 | 221 |
|
|
|
|
|
|
Mill Uptime (%) - Sawing | January | February | March | April | May |
|
|
|
|
|
|
| 49 | 53 | 34 | 53 | 30 |
|
|
|
|
|
|
Mill Uptime (%) - Planing | January | February | March | April | May |
|
|
|
|
|
|
| 18 | 19 | 19 | 20 | 19 |
-34-
APPENDIX "H"
ACI GROUP ACTUAL RECEIPTS AND DISBURSEMENTS
Abitibi-Consolidated Inc. and its Subsidiaries (the "ACI Group") | ||||||||||||||||||
Actual to Forecast Comparison | ||||||||||||||||||
4 Weeks Ended May 31, 2009 | ||||||||||||||||||
US$000 | ||||||||||||||||||
Actual | Forecast | Variance | ||||||||||||||||
Week Ended |
| 10-May-09 | 17-May-09 | 24-May-09 | 31-May-09 | Total |
| 10-May-09 | 17-May-09 | 24-May-09 | 31-May-09 | Total |
| 10-May-09 | 17-May-09 | 24-May-09 | 31-May-09 | Total |
|
|
|
|
|
|
|
|
|
|
|
|
|
|
|
|
|
| |
Opening Cash |
| 78,775 | 85,265 | 98,660 | 93,151 | 78,775 |
| 78,775 | 82,977 | 95,201 | 99,204 | 78,775 |
| - | 2,288 | 3,459 | (6,053) | - |
|
|
|
|
|
|
|
|
|
|
|
|
|
|
|
|
|
| |
Receipts |
|
|
|
|
|
|
|
|
|
|
|
|
|
|
|
|
|
|
A/R Collections |
| 31,356 | 37,470 | 57,207 | 46,698 | 172,731 |
| 36,042 | 46,156 | 36,042 | 75,495 | 193,735 |
| (4,686) | (8,686) | 21,165 | (28,797) | (21,004) |
Intercompany A/R Settlement |
| - | 1,849 | 786 | 16,831 | 19,466 |
| - | - | - | - | - |
| - | 1,849 | 786 | 16,831 | 19,466 |
Total A/R Collections |
| 31,356 | 39,319 | 57,993 | 63,529 | 192,197 |
| 36,042 | 46,156 | 36,042 | 75,495 | 193,735 |
| (4,686) | (6,837) | 21,951 | (11,966) | (1,538) |
Collections on Behalf of Joint Ventures | 4,687 | - | - | 95 | 4,782 |
| 3,323 | 3,323 | 3,323 | 3,323 | 13,294 |
| 1,364 | (3,323) | (3,323) | (3,228) | (8,512) | |
A/R Collections - Affiliates |
| 4,427 | 7,860 | 6,073 | 14,545 | 32,905 |
| - | - | - | - | - |
| 4,427 | 7,860 | 6,073 | 14,545 | 32,905 |
Intercompany A/P Settlement |
| - | 6,380 | 2,148 | 2,963 | 11,491 |
| - | - | - | - | - |
| - | 6,380 | 2,148 | 2,963 | 11,491 |
Other Inflows |
| 460 | 1,886 | 1,522 | 3,138 | 7,006 |
| 1,933 | 1,933 | 1,933 | 1,933 | 7,733 |
| (1,473) | (47) | (411) | 1,205 | (727) |
Total Receipts |
| 40,930 | 55,445 | 67,736 | 84,270 | 248,381 |
| 41,299 | 51,412 | 41,298 | 80,752 | 214,761 |
| (369) | 4,033 | 26,438 | 3,518 | 33,620 |
|
|
|
|
|
|
|
|
|
|
|
|
|
|
|
|
|
| |
Disbursements |
|
|
|
|
|
|
|
|
|
|
|
|
|
|
|
|
|
|
Trade Payables |
| (26,203) | (29,248) | (26,169) | (43,762) | (125,382) |
| (27,393) | (21,893) | (21,893) | (29,893) | (101,072) |
| 1,190 | (7,355) | (4,276) | (13,869) | (24,310) |
Capital Expenditures |
| - | - | - | - | - |
| (1,406) | (1,406) | (1,406) | (1,406) | (5,625) |
| 1,406 | 1,406 | 1,406 | 1,406 | 5,625 |
Marine Freight Payments |
| (793) | (2,347) | (1,354) | (1,770) | (6,264) |
| (1,050) | (1,050) | (1,050) | (1,050) | (4,200) |
| 257 | (1,297) | (304) | (720) | (2,064) |
Utility Payments |
| (3,873) | (4,700) | (6,450) | (5,177) | (20,200) |
| (3,400) | (7,400) | (7,400) | (7,400) | (25,600) |
| (473) | 2,700 | 950 | 2,223 | 5,400 |
Payroll & Benefits |
| (2,976) | (4,370) | (3,265) | (7,789) | (18,400) |
| (1,931) | (8,150) | (1,931) | (10,605) | (22,617) |
| (1,045) | 3,780 | (1,334) | 2,816 | 4,217 |
Intercompany A/R Settlements | (1,188) | (16,689) | (13,669) | (8,044) | (39,590) |
| - | - | - | - | - |
| (1,188) | (16,689) | (13,669) | (8,044) | (39,590) | |
Joint Venture Remittances, Net | - | (4,341) | - | - | (4,341) |
| - | (16,774) | (3,274) | (4,074) | (24,121) |
| - | 12,433 | 3,274 | 4,074 | 19,780 | |
Restructuring & Other Items |
| - | (441) | (156) | (1,702) | (2,299) |
| (1,000) | (1,000) | (1,000) | (1,000) | (4,000) |
| 1,000 | 559 | 844 | (702) | 1,701 |
Total Disbursements |
| (35,033) | (62,136) | (51,063) | (68,244) | (216,476) |
| (36,180) | (57,673) | (37,954) | (55,428) | (187,235) |
| 1,147 | (4,463) | (13,109) | (12,816) | (29,241) |
|
|
|
|
|
|
|
|
|
|
|
|
|
|
|
|
|
| |
Financing |
|
|
|
|
|
|
|
|
|
|
|
|
|
|
|
|
|
|
Securitization Inflows / (Outflows) | 2,563 | (4,502) | (19,359) | 2,960 | (18,338) |
| (917) | (7,108) | 658 | (23,442) | (30,810) |
| 3,480 | 2,606 | (20,017) | 26,402 | 12,472 | |
DIP Drawings / (Repayments) |
| - | 30,000 | - | - | 30,000 |
| - | 30,000 | - | - | 30,000 |
| - | - | - | - | - |
DIP Interest & Fees |
| - | (4,406) | - | - | (4,406) |
| - | (4,406) | - | - | (4,406) |
| - | - | - | - | - |
Foreign Exchange Translation |
| (1,966) | (1,006) | (2,823) | (1,738) | (7,533) |
| - | - | - | - | - |
| (1,966) | (1,006) | (2,823) | (1,738) | (7,533) |
| 597 | 20,086 | (22,182) | 1,222 | (277) |
| (917) | 18,485 | 658 | (23,442) | (5,216) |
| 1,514 | 1,600 | (22,840) | 24,664 | 4,939 | |
|
|
|
|
|
|
|
|
|
|
|
|
|
|
|
|
|
| |
Cash Flow From Operations |
| 6,494 | 13,395 | (5,509) | 17,248 | 31,628 |
| 4,202 | 12,225 | 4,002 | 1,882 | 22,310 |
| 2,292 | 1,170 | (9,511) | 15,366 | 9,317 |
|
|
|
|
|
|
|
|
|
|
|
|
|
|
|
|
|
| |
Opening Cash Balance |
| 78,775 | 85,265 | 98,660 | 93,151 | 78,775 |
| 78,775 | 82,977 | 95,201 | 99,204 | 78,775 |
| - | 2,288 | 3,459 | (6,053) | - |
Cash Flow From Operations |
| 6,494 | 13,395 | (5,509) | 17,248 | 31,628 |
| 4,202 | 12,225 | 4,002 | 1,882 | 22,310 |
| 2,292 | 1,170 | (9,511) | 15,366 | 9,317 |
Ending Cash Balance |
| 85,269 | 98,660 | 93,151 | 110,399 | 110,399 |
| 82,977 | 95,201 | 99,204 | 101,085 | 101,085 |
| 2,292 | 3,459 | (6,053) | 9,314 | 9,317 |
|
|
|
|
|
|
|
|
|
|
|
|
|
|
|
|
|
| |
Note: The above totals are subject to rounding adjustments |
|
|
|
|
|
|
|
|
|
|
|
|
|
|
| |||
|
|
|
|
|
|
|
|
|
|
|
|
|
|
|
|
|
| |
-35-
APPENDIX "I"
BCFPI ACTUAL RECEIPTS AND DISBURSEMENTS
|
|
|
|
|
|
|
| ||||||||||||
Actual to Forecast Comparison |
|
|
|
|
|
|
|
|
|
| |||||||||
4 Weeks Ended May 31, 2009 |
|
|
|
|
|
|
|
|
|
| |||||||||
US$000 |
|
|
|
|
|
|
|
|
|
|
|
| |||||||
|
|
|
|
|
|
|
|
|
|
|
| ||||||||
|
|
|
|
|
|
|
|
|
|
|
| ||||||||
|
|
|
|
|
|
|
|
|
|
|
| ||||||||
|
| Actual |
| Forecast | Variance | ||||||||||||||
Week Ended |
| 10-May-09 | 17-May-09 | 24-May-09 | 31-May-09 | Total |
| 10-May-09 | 17-May-09 | 24-May-09 | 31-May-09 | Total | 10-May-09 | 17-May-09 | 24-May-09 | 31-May-09 | Total | ||
|
|
|
|
|
|
|
|
|
|
|
| ||||||||
|
|
|
|
|
|
|
|
|
|
|
| ||||||||
|
|
|
|
|
|
|
|
|
|
|
| ||||||||
Opening Cash |
| 43,338 | 36,589 | 24,100 | 11,837 | 43,338 |
| 43,338 | 39,956 | 37,553 | 41,661 | 43,338 | - | (3,367) | (13,453) | (29,824) | - | ||
|
|
|
|
|
|
|
|
|
|
|
| ||||||||
Receipts |
|
|
|
|
|
|
|
|
|
|
|
| |||||||
A/R Collections |
| 2,039 | 1,306 | 1,460 | 5,913 | 10,718 |
| 10,642 | 17,712 | 17,428 | 25,728 | 71,510 | (8,603) | (16,406) | (15,968) | (19,815) | (60,792) | ||
Intercompany A/R Settlements | - | 744 | 436 | 26,933 | 28,113 |
| - | - | - | - | - | - | 744 | 436 | 26,933 | 28,113 | |||
Total A/R Collections |
| 2,039 | 2,050 | 1,896 | 32,846 | 38,831 |
| 10,642 | 17,712 | 17,428 | 25,728 | 71,510 | (8,603) | (15,662) | (15,532) | 7,118 | (32,679) | ||
A/R Collections - Affiliates | 1,424 | 92 | - |
| 1,516 |
| - | - | - | - | - | 1,424 | 92 | - | - | 1,516 | |||
Other Inflows |
| - | 1,456 | 215 | 285 | 1,956 |
| - | - | - | - | - | - | 1,456 | 215 | 285 | 1,956 | ||
Total Receipts |
| 3,463 | 3,598 | 2,111 | 33,131 | 42,303 |
| 10,642 | 17,712 | 17,428 | 25,728 | 71,510 | (7,179) | (14,114) | (15,317) | 7,403 | (29,207) | ||
|
|
|
|
|
|
|
|
|
|
|
| ||||||||
Disbursements |
|
|
|
|
|
|
|
|
|
|
| ||||||||
Trade Payables |
| (4,863) | (7,268) | (9,579) | (9,346) | (31,056) |
| (9,317) | (9,317) | (9,317) | (11,317) | (39,268) | 4,454 | 2,049 | (262) | 1,971 | 8,212 | ||
Intercompany SG&A Allocation | - | - | - |
| - |
| - | (1,948) | (472) | (472) | (2,892) | - | 1,948 | 472 | 472 | 2,892 | |||
Intercompany A/R Settlements | - | (351) | (109) | (206) | (666) |
| - | - | - | - | - | - | (351) | (109) | (206) | (666) | |||
Intercompany A/P Settlements | (924) | (767) | (616) | (648) | (2,955) |
| - | - | - | - | - | (924) | (767) | (616) | (648) | (2,955) | |||
Payments on Behalf of Affiliates | - | (2,861) | (1,027) |
| (3,888) |
| - | - | - | - | - | - | (2,861) | (1,027) | - | (3,888) | |||
Freight |
|
| (399) | (666) | (329) | (542) | (1,936) |
| (1,920) | (1,920) | (1,298) | (1,298) | (6,436) | 1,521 | 1,254 | 969 | 756 | 4,500 | |
Payroll and Benefits |
| (3,099) | (3,727) | (1,781) | (5,055) | (13,662) |
| (1,196) | (4,088) | (1,196) | (4,697) | (11,177) | (1,903) | 361 | (585) | (358) | (2,485) | ||
Capital Expenditures |
| - | - | - |
| - |
| (452) | (452) | (452) | (452) | (1,808) | 452 | 452 | 452 | 452 | 1,808 | ||
Interest |
|
| (801) | - | - | (592) | (1,393) |
| (879) | (130) | (325) | (303) | (1,637) | 78 | 130 | 325 | (289) | 244 | |
Restructuring Costs |
| - | - | - |
| - |
| (260) | (2,260) | (260) | (260) | (3,040) | 260 | 2,260 | 260 | 260 | 3,040 | ||
Foreign Exchange Translation | (126) | (447) | (933) | (1,285) | (2,791) |
| - | - | - | - | - | (126) | (447) | (933) | (1,285) | (2,791) | |||
Total Disbursements |
| (10,212) | (16,087) | (14,374) | (17,674) | (58,347) |
| (14,024) | (20,115) | (13,320) | (18,799) | (66,258) | 3,812 | 4,028 | (1,054) | 1,125 | 7,911 | ||
|
|
|
|
|
|
|
|
|
|
|
| ||||||||
Cash Flow From Operations | (6,749) | (12,489) | (12,263) | 15,457 | (16,044) |
| (3,382) | (2,403) | 4,108 | 6,929 | 5,252 | (3,367) | (10,086) | (16,371) | 8,528 | (21,296) | |||
|
|
|
|
|
|
|
|
|
|
|
| ||||||||
Opening Cash Balance | 43,338 | 36,589 | 24,100 | 11,837 | 43,338 |
| 43,338 | 39,956 | 37,553 | 41,661 | 43,338 | - | (3,367) | (13,453) | (29,824) | - | |||
Cash Flow From Operations | (6,749) | (12,489) | (12,263) | 15,457 | (16,044) |
| (3,382) | (2,403) | 4,108 | 6,929 | 5,252 | (3,367) | (10,086) | (16,371) | 8,528 | (21,296) | |||
Ending Cash Balance |
| 36,589 | 24,100 | 11,837 | 27,294 | 27,294 |
| 39,956 | 37,553 | 41,661 | 48,590 | 48,590 | (3,367) | (13,453) | (29,824) | (21,296) | (21,296) | ||
|
|
|
|
|
|
|
|
|
|
|
| ||||||||
Note: The above totals are subject to rounding adjustments |
|
|
|
|
|
|
|
| |||||||||||
-36-
APPENDIX "J"
ACI GROUP CASH FLOW FORECAST
| Abitibi-Consolidated Inc. ("ACI") | |||||||||||||||||
| Weekly Cash Flow Forecast | |||||||||||||||||
| 14 Weeks Ended September 6, 2009 | |||||||||||||||||
| US$000s | |||||||||||||||||
| Week ended | Notes | 7-Jun-09 | 14-Jun-09 | 21-Jun-09 | 28-Jun-09 | 5-Jul-09 | 12-Jul-09 | 19-Jul-09 | 26-Jul-09 | 2-Aug-09 | 9-Aug-09 | 16-Aug-09 | 23-Aug-09 | 30-Aug-09 | 6-Sep-09 | Total | |
| Opening Cash | 1 | 110,401 | 116,117 | 124,641 | 90,848 | 91,110 | 94,751 | 96,776 | 82,101 | 83,377 | 78,441 | 83,166 | 57,377 | 56,867 | 52,363 | 110,401 | |
| Receipts | |||||||||||||||||
| Total A/R Collections | 3 | 28,945 | 46,998 | 31,478 | 45,914 | 57,296 | 42,314 | 37,375 | 42,629 | 42,309 | 29,589 | 28,796 | 36,690 | 34,163 | 45,115 | 549,612 | |
| Collections on Behalf of Joint Ventures | 4 | 4,089 | 4,089 | 4,089 | 4,089 | 4,173 | 4,207 | 4,207 | 4,207 | 4,260 | 4,391 | 4,391 | 4,391 | 4,391 | 4,539 | 59,515 | |
| Other Inflows | 5 | 2,175 | 2,175 | 2,175 | 2,175 | 2,175 | 2,175 | 2,175 | 2,175 | 2,175 | 2,175 | 2,175 | 2,175 | 2,175 | 2,175 | 30,447 | |
| Total Receipts | 35,209 | 53,262 | 37,743 | 52,178 | 63,644 | 48,696 | 43,757 | 49,011 | 48,744 | 36,155 | 35,362 | 43,255 | 40,729 | 51,829 | 639,574 | ||
| Disbursements | |||||||||||||||||
| Trade Payables | 6 | (27,517) | (27,517) | (27,517) | (27,517) | (33,064) | (27,282) | (27,282) | (27,282) | (26,223) | (27,949) | (27,949) | (27,949) | (27,949) | (29,380) | (392,378) | |
| Capital Expenditures | 7 | (1,565) | (1,565) | (1,565) | (1,565) | (1,516) | (1,496) | (1,496) | (1,496) | (1,496) | (1,496) | (1,496) | (1,496) | (1,496) | (1,539) | (21,283) | |
| Marine Freight Payments | 8 | (1,050) | (1,050) | (1,050) | (1,050) | (1,050) | (1,050) | (1,050) | (1,050) | (1,050) | (1,050) | (1,050) | (1,050) | (1,050) | (1,050) | (14,700) | |
| Utility Payments | 9 | (3,870) | (7,870) | (7,870) | (7,870) | (5,013) | (3,870) | (7,870) | (7,870) | (6,727) | (3,870) | (7,870) | (7,870) | (7,870) | (4,441) | (90,751) | |
| Payroll & Benefits | 10 | (2,083) | (8,650) | (2,433) | (8,650) | (4,800) | (8,267) | (2,311) | (1,961) | (11,079) | (1,987) | (8,604) | (1,987) | (8,254) | (4,801) | (75,868) | |
| Joint Venture Remittances, Net | 11 | 61 | 61 | (14,657) | (839) | 63 | 63 | (17,462) | (837) | 64 | 66 | (18,566) | 66 | (834) | 68 | (52,682) | |
| Restructuring & Other Items | 12 | (1,000) | (1,000) | (1,000) | (1,000) | (1,250) | (1,000) | (1,000) | (1,000) | (1,250) | (1,000) | (1,000) | (1,000) | (1,000) | (1,250) | (14,750) | |
| Total Disbursements | (37,023) | (47,590) | (56,091) | (48,490) | (46,630) | (42,903) | (58,472) | (41,496) | (47,762) | (37,287) | (66,535) | (41,287) | (48,453) | (42,394) | (662,412) | ||
| Financing | |||||||||||||||||
| Securitization Inflows / (Outflows) | 13 | 7,530 | 2,996 | 14,408 | (3,427) | (11,060) | (3,618) | 39 | (6,238) | (2,631) | 5,856 | 5,539 | (2,479) | 3,220 | (2,827) | 7,307 | |
| Adequate Protection by DCorp to ACCC Term Lenders | 14 | - | - | (14,352) | - | (2,314) | - | - | - | (3,287) | - | - | - | - | (3,287) | (23,240) | |
| DIP Drawings / (Repayments) | 15 | - | - | - | - | - | - | - | - | - | - | - | - | - | - | - | |
| DIP Interest & Fees | 15 | - | (143) | - | - | - | (150) | - | - | - | - | (155) | - | - | - | (447) | |
| Securitization Closing Fees | 16 | - | - | (15,500) | - | - | - | - | - | - | - | - | - | - | - | (15,500) | |
| Total Change in Cash | 5,716 | 8,525 | (33,793) | 262 | 3,641 | 2,026 | (14,676) | 1,276 | (4,936) | 4,725 | (25,789) | (510) | (4,504) | 3,321 | (54,718) | ||
| Ending Cash Balance (with ACI DIP Facility Draws) | 116,117 | 124,641 | 90,848 | 91,110 | 94,751 | 96,776 | 82,101 | 83,377 | 78,441 | 83,166 | 57,377 | 56,867 | 52,363 | 55,683 | 55,683 | ||
| Available Liquidity (Cash and Undrawn DIP) | 17 | 173,617 | 182,141 | 148,348 | 148,610 | 152,251 | 154,276 | 139,601 | 140,877 | 135,941 | 140,666 | 114,877 | 114,367 | 109,863 | 113,183 | 113,183 | |
| Securitization Schedule | 18 | ||||||||||||||||
| Allowable Receivable Pool Balance | 114,688 | 118,423 | 132,831 | 129,404 | 118,345 | 115,528 | 115,566 | 109,328 | 106,696 | 112,553 | 118,868 | 116,389 | 119,609 | 116,782 | 116,782 | ||
| Interest & Fees | 19 | - | (739) | - | - | - | (801) | - | - | - | - | (776) | - | - | - | (2,316) | |
| Amount Drawn Under Facility | 107,158 | 114,688 | 118,423 | 132,831 | 129,404 | 118,345 | 115,528 | 115,566 | 109,328 | 106,696 | 112,553 | 118,868 | 116,389 | 119,609 | 107,158 | ||
| Availability / (Required Repayment) | 7,530 | 2,996 | 14,408 | (3,427) | (11,060) | (3,618) | 39 | (6,238) | (2,631) | 5,856 | 5,539 | (2,479) | 3,220 | (2,827) | 7,307 | ||
The above forecast uses an exchange rate of CDN$1.00=US$0.90.
Note: The above totals are subject to rounding in the underlying balances.
The information and analysis in this document have not been audited or reviewed and, according, no assurances are provided thereon. In addition, because forecasts are dependent upon numerous assumptions regarding future events, actual results will be different than forecast, and such differences may be material.
Abitibi Consolidated Inc. and its subsidiaries (the "ACI Group")
Notes to Weekly Cash Flow Forecast
14 Weeks Ended September 6, 2009
US$000s
1. | Opening Cash in the forecast includes cash on hand. |
2. | The cash flow forecast includes mills owned by the ACI Group and its subsidiaries and includes the operations of the DCorp Group. |
3. | Total A/R Collections represent amounts estimated to be collected from the ACI Group's customers. The timing of collections is based on the ACI Group's collection terms with its customers and the latest sales forecast. |
4. | Collections on Behalf of Joint Ventures represent amounts estimated to be collected by the ACI Group on behalf of its joint venture partners. The ACI Group has agreements with its joint venture partners whereby the ACI Group collects the joint venture partners' accounts receivable (for a fee) and remits these funds to the joint venture in accordance with their agreement. |
5. | Other Inflows represent miscellaneous receipts, including, but not limited to such items as tax refunds or insurance proceeds, as estimated by the ACI Group. |
6. | Trade Payables represent amounts estimated to be paid to suppliers for the purchase of the ACI Group's raw materials, repairs and maintenance and other goods and services related to production. This line also includes amounts necessary to fund the DCorp Group's recycling operations. |
7. | Capital Expenditures represent amounts estimated to be paid pursuant to the ACI Group's most recent capital expenditure budget. |
8. | Marine Freight Payments represent amounts estimated to be paid to the ACI Group's outbound marine freight suppliers. |
9. | Utility Payments represent amounts estimated to be payable to the ACI Group's hydroelectricity suppliers. |
10. | Payroll and Benefits represent estimated amounts for salaries, wages and current service pension costs. |
11. | Joint Venture Remittances, Net represent the estimated payment of accounts receivable funds collected by the ACI Group on behalf of the respective joint venture, net of any collection/management fees. The forecast assumes the payment for the second half of April 2009 is not made. |
12. | Restructuring and Other Items represent amounts estimated by the ACI Group for restructuring costs and other miscellaneous payments. |
13. | Securitization Inflows/(Outflows) represent the estimated net availability or repayment (including interest) of funds under the ACI Group's Securitization Program. It is assumed for the purposes of the cash flow forecast that the ACI Group's new securitization program takes effect after the week ended June 14, 2009 and has no material impact on liquidity. |
14. | Adequate Protection by DCorp to ACCC Term Lenders represents an estimate of payments pursuant to the adequate protection order being negotiated between DCorp and the ACCC Term Lenders pursuant to Chapter 11 proceedings. This includes an assumption of a LIBOR floor of 3% + 8% of interest of current interest as well as reflecting the initial payment of $11,065 agreed to by the parties during the initial hearings. |
15. | The DIP Drawings/(Repayments) and the DIP Interest & Fees represent cash flows related to the ACI Group's new $100 million DIP term loan. This term loan may be drawn in increments to enable the ACI Group to maintain a adequate amount of working capital. |
16. | The Securitization Closing Fees include fees on the Amended Securitization Program and closing advisory fees payable by the ACI Group. |
17. | Available Liquidity is calculated as cash on hand plus the undrawn portion of the ACI DIP Facility. Drawings on the ACI DIP Facility are limited to $87.5 million per the terms of the ACI DIP Agreement. As a result of the $30 million ACI DIP Facility draw during the week ended May 17, 2009, the undrawn amount under the ACI DIP Facility is $57.5 million through September 6, 2009. |
18. | The Securitization Summary represents the ACI Group's estimated calculation of amounts owing or available under the Securitization Program based on the eligible accounts receivable (net of any fees, interest or allowances). |
19. | The Interest & Fees represent interest and fees related to the Securitization Program. |
-37-
APPENDIX "K"
BCFPI CASH FLOW FORECAST
Chapter 11/CCAA Cash Flow | |||||||||||||||||||
14 Week Period Ended September 6, 2009 | |||||||||||||||||||
US$000s | |||||||||||||||||||
Week Ended | 7-Jun-09 | 14-Jun-09 | 21-Jun-09 | 28-Jun-09 | 5-Jul-09 | 12-Jul-09 | 19-Jul-09 | 26-Jul-09 | 2-Aug-09 | 9-Aug-09 | 16-Aug-09 | 23-Aug-09 | 30-Aug-09 | 6-Sep-09 | Total | ||||
Receipts | Notes | ||||||||||||||||||
Trade Receipts | 1, 10 | 26,372 | 13,159 | 13,067 | 15,535 | 12,149 | 16,697 | 12,592 | 13,002 | 12,747 | 14,422 | 12,739 | 13,389 | 13,403 | 14,353 | 203,626 | |||
Other Receipts | 2 | - | - | - | - | - | - | - | - | - | 15,000 | - | - | - | 2,000 | 17,000 | |||
Total Receipts | 26,372 | 13,159 | 13,067 | 15,535 | 12,149 | 16,697 | 12,592 | 13,002 | 12,747 | 29,422 | 12,739 | 13,389 | 13,403 | 16,353 | 220,626 | ||||
Disbursements | |||||||||||||||||||
Trade Payables | 3 | (11,271) | (11,271) | (11,271) | (12,771) | (11,195) | (11,164) | (11,164) | (11,164) | (11,596) | (12,674) | (12,674) | (11,674) | (11,674) | (12,134) | (163,698) | |||
Intercompany SG&A Allocation | 4 | - | (3,926) | (517) | (517) | (479) | (464) | (464) | (464) | (467) | (474) | (474) | (474) | (474) | (475) | (9,666) | |||
Freight | 5 | (1,656) | (1,656) | (1,656) | (1,656) | (1,644) | (1,639) | (1,639) | (1,639) | (1,651) | (1,680) | (1,680) | (1,680) | (1,680) | (1,764) | (23,322) | |||
Payroll and Benefits | 6 | (1,199) | (2,001) | (2,138) | (2,001) | (2,745) | (2,574) | (2,710) | (2,574) | (3,319) | (2,574) | (2,710) | (2,574) | (2,710) | (3,185) | (35,015) | |||
Capital Expenditures | 7 | (467) | (467) | (467) | (467) | (456) | (452) | (452) | (452) | (452) | (452) | (452) | (452) | (452) | (465) | (6,400) | |||
Interest | 8 | - | - | (289) | - | (901) | - | - | (422) | (880) | - | - | (338) | (880) | - | (3,709) | |||
Restructuring Costs | 9 | (293) | (293) | (293) | (293) | (1,293) | (293) | (293) | (293) | (293) | (293) | (293) | (293) | (293) | (293) | (5,096) | |||
Total Disbursements | (14,885) | (19,614) | (16,630) | (17,705) | (18,713) | (16,586) | (16,722) | (17,008) | (18,657) | (18,145) | (18,282) | (17,483) | (18,162) | (18,315) | (246,906) | ||||
Cash Flow from Operations | 11,487 | (6,455) | (3,564) | (2,170) | (6,564) | 111 | (4,130) | (4,006) | (5,909) | 11,277 | (5,543) | (4,094) | (4,759) | (1,962) | (26,280) | ||||
Opening Bank Balance | 27,295 | 38,782 | 32,327 | 28,763 | 26,594 | 20,030 | 20,141 | 16,011 | 12,005 | 6,096 | 17,373 | 11,830 | 7,736 | 2,977 | 27,295 | ||||
Cash Flow | 11,487 | (6,455) | (3,564) | (2,170) | (6,564) | 111 | (4,130) | (4,006) | (5,909) | 11,277 | (5,543) | (4,094) | (4,759) | (1,962) | (26,280) | ||||
Closing Bank Balance | 10 | 38,782 | 32,327 | 28,763 | 26,594 | 20,030 | 20,141 | 16,011 | 12,005 | 6,096 | 17,373 | 11,830 | 7,736 | 2,977 | 1,015 | 1,015 | |||
Current Revolving Credit Facility | |||||||||||||||||||
Current Credit Facility Balance, Opening | 94,337 | 94,337 | 94,337 | 94,337 | 94,337 | 94,337 | 94,337 | 94,337 | 94,337 | 94,337 | 94,337 | 94,337 | 94,337 | 94,337 | 94,337 | ||||
Current Credit Facility Drawings / (Repayments) | - | - | - | - | - | - | - | - | - | - | - | - | - | - | - | ||||
Current Balance, Closing | 94,337 | 94,337 | 94,337 | 94,337 | 94,337 | 94,337 | 94,337 | 94,337 | 94,337 | 94,337 | 94,337 | 94,337 | 94,337 | 94,337 | 94,337 | ||||
Intercompany A/R Balance | 11 | ||||||||||||||||||
Ending Balance | 65,791 | 66,978 | 68,173 | 67,744 | 69,207 | 68,200 | 69,425 | 70,382 | 71,488 | 71,720 | 72,855 | 73,605 | 74,332 | 74,923 | 74,923 | ||||
The above forecast uses an exchange rate of CDN$1.00=US$0.90 | |||||||||||||||||||
| Amounts in the above table are subject to rounding adjustments from the underlying balances | |||||||||||||||||||
| The information and analysis in this document have not been audited or reviewed and, according, no assurances are provided thereon. In addition, because forecasts are dependent upon numerous assumptions regarding future events, actual results will be different than forecast, | |||||||||||||||||||
| and such difference may be material. | |||||||||||||||||||
Bowater Canadian Forest Products Inc. ("BCFPI")
Notes to CCAA Cash Flow
14 Week Period Ended September 6, 2009
US$000s
1. | Trade Receipts are based on BCFPI's estimate of collection terms and BCFPI's latest sales forecast. |
2. | Other receipts represents a transfer of funds to BCFPI from Bowater Inc. persuant to the BI/BCFPI DIP Facility. |
3. | Trade Payables represent payments for raw materials, repairs and maintenance, utilities and other production items. |
4. | Intercompany SG&A Allocation represents expenses incurred by BCFPI's parent company on behalf of BCFPI which are charged to BCFPI starting the week ended May 31, 2009, pursuant to its normal process for the allocation of such costs. These intercompany SG&A costs are assumed to be settled in cash on a weekly basis. |
5. | Freight represents disbursements in respect of costs to deliver product to customers. |
6. | Payroll and Benefits represent amounts paid to employees for salaries and wages (including the related withholdings), pension payments and other benefits due under employee benefit programs. The forecast assumes that only those pension payments in respect of current service costs will be paid. |
7. | Capital Expenditures are costs scheduled to be made in accordance with agreements with BCFPI's various capital equipment suppliers and reflect requirements pursuant to BCFPI's most recent capital expenditure budget. |
8. | Interest represents interest costs for the company's senior secured revolving facility, the existing secured term loan and the new DIP facility. |
9. | Restructuring Costs represent costs related to the restructuring including transaction fees related to the new DIP facility. |
10. | The cash flows included in the forecast include only those BCFPI mills in Canada. No funding or dividends from foreign subsidiaries are included in the forecast. |
11. | The intercompany accounts receivable balance represents pre-filing and post-filing sales to customers in the United States by BCFPI through Bowater America Inc. This amount is assumed not to be stayed and is collected by BCFPI from Bowater America Inc. in the normal course. This balance represents trade A/R only and does not represent any amounts funded from BI to BCFPI persuant to the BI/BCFPI DIP Facility. |
-38-