Simply Self Storage Acquisition Overview July 2023 Exhibit 99.1
FORWARD-LOOKING STATEMENTS: This presentation contains forward-looking statements within the meaning of the Private Securities Litigation Reform Act of 1995. Forward-looking statements include statements relating to our 2023 outlook and all underlying assumptions, our expected acquisition, disposition, development, and redevelopment activity, supply and demand for our self-storage facilities, information relating to operating trends in our markets, expectations regarding operating expenses, including property tax changes, expectations regarding the impacts from inflation and a potential future recession, our strategic priorities, expectations with respect to financing activities, rental rates, cap rates, and yields, leasing expectations, our credit ratings, and all other statements other than statements of historical fact. Such statements are based on management’s beliefs and assumptions made based on information currently available to management and may be identified by the use of the words “outlook,” “guidance,” “expects,” “believes,” “anticipates,” “should,” “estimates,” and similar expressions. These forward-looking statements involve known and unknown risks and uncertainties, which may cause our actual results and performance to be materially different from those expressed or implied in the forward-looking statements. Risks and uncertainties that may impact future results and performance include, but are not limited to those described in Part 1, Item 1A, “Risk Factors” in our most recent Annual Report on Form 10-K filed with the Securities and Exchange Commission (the “SEC”) on February 21, 2023 and in our other filings with the SEC. These include changes in demand for our facilities, impacts of natural disasters, adverse changes in laws and regulations including governing property tax, evictions, rental rates, minimum wage levels, and insurance, adverse economic effects from the COVID-19 Pandemic, international military conflicts, or similar events impacting public health and/or economic activity, increases in the costs of our primary customer acquisition channels, adverse impacts to us and our customers from inflation, unfavorable foreign currency rate fluctuations, changes in federal or state tax laws related to the taxation of REITs, security breaches, including ransomware, or a failure of our networks, systems, or technology. These forward-looking statements speak only as of the date of this presentation or as of the dates indicated in the statements. All of our forward-looking statements, including those in this presentation, are qualified in their entirety by this cautionary statement. We expressly disclaim any obligation to update publicly or otherwise revise any forward-looking statements, whether as a result of new information, new estimates, or other factors, events, or circumstances after the date of these forward-looking statements, except when expressly required by law. Given these risks and uncertainties, you should not rely on any forward-looking statements in this presentation, or which management may make orally or in writing from time to time, neither as predictions of future events nor guarantees of future performance. NON-GAAP MEASURES: This presentation contains non-GAAP measures, including FFO and NOI. Non-GAAP measures should not be considered as an alternative to, or more meaningful than, net income (determined in accordance with GAAP) or other GAAP financial measures, as an indicator of financial performance and is not an alternative to, or more meaningful than, cash flow from operating activities (determined in accordance with GAAP) as a measure of liquidity. Non-GAAP measures have limitations as they do not include all items of income and expense that affect operations and, accordingly, should always be considered as supplemental financial results to those presented in accordance with GAAP. In addition, other REITs may compute these measures differently, so comparisons among REITs may not be helpful. Please refer to our SEC periodic reports for definitions of our non-GAAP measures and reconciliations to the nearest GAAP measures. Important Information
Transaction Summary Source: Company filings and Simply Self Storage 1. Trailing twelve months as of 5/31/23 2. Purchase price yield based on NOI and tenant insurance income per Public Storage’s forward-looking underwriting Accelerating Accretion Financing and Closing According to Plan Public Storage to enhance operations with significant upside to Simply’s 69% direct NOI margin1 anticipated 6.25% - 6.75% nominal yield expected during year 3 upon stabilization2 Expected to be accretive to 2024 Core FFO per share with accretion accelerating to 1% through stabilization Since 2015, Public Storage has funded growth with unsecured debt and free cash flow Simply acquisition will be funded with unsecured debt Expected to close during the third quarter of 2023 Pro forma leverage of 3.8x net debt and preferred equity to EBITDA positions Public Storage for further growth A Portfolio Poised for Growth Driven by Public Storage’s Competitive Advantages $2.2 billion acquisition of Simply Self Storage (“Simply”), a large, geographically diversified, and growth-oriented portfolio Owned by Blackstone Real Estate Income Trust, Inc. (BREIT) 127 wholly-owned properties and 25 third-party managed properties Stabilized: 121 properties at 92% occupancy Lease-up: 6 properties at 75% occupancy Portfolio market population growth twice the national average since 2018 Strong Sunbelt presence comprising 65% of wholly-owned properties Complementary to our presence in Dallas, Houston, Tampa, and Orlando Transaction benefits enabled by Public Storage’s platform, brand, and growth-oriented balance sheet
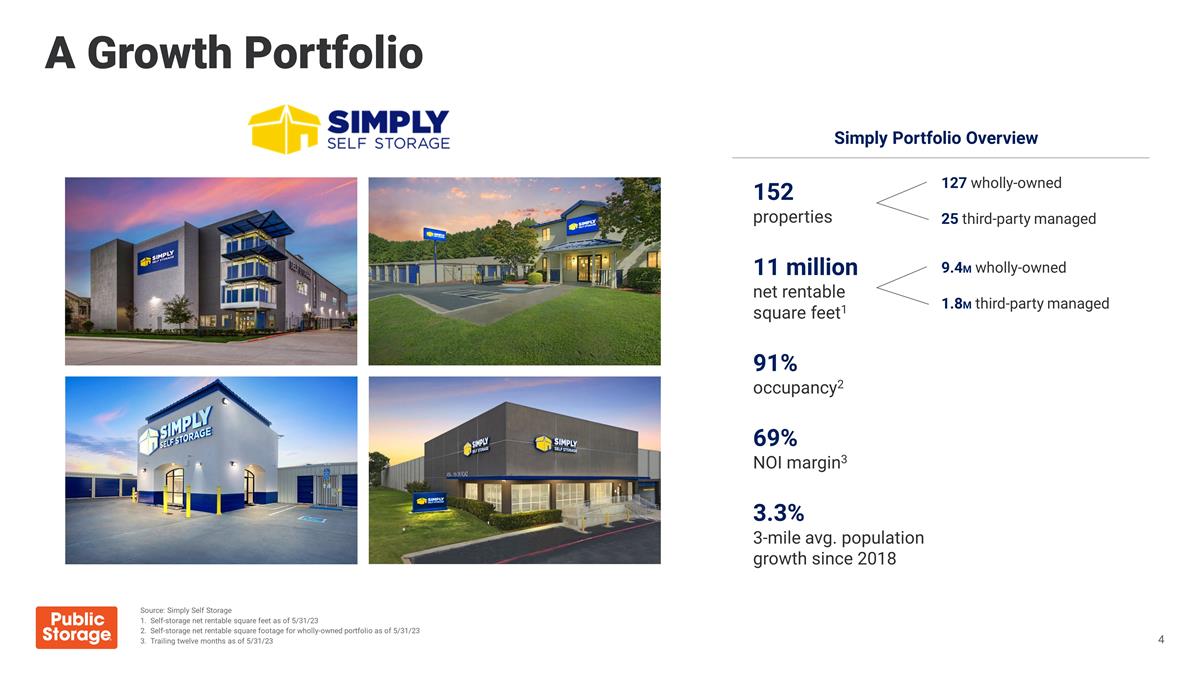
A Growth Portfolio 152 properties 11 million net rentable square feet1 91% occupancy2 69% NOI margin3 3.3% 3-mile avg. population growth since 2018 127 wholly-owned 25 third-party managed 9.4M wholly-owned 1.8M third-party managed Simply Portfolio Overview Source: Simply Self Storage 1. Self-storage net rentable square feet as of 5/31/23 2. Self-storage net rentable square footage for wholly-owned portfolio as of 5/31/23 3. Trailing twelve months as of 5/31/23
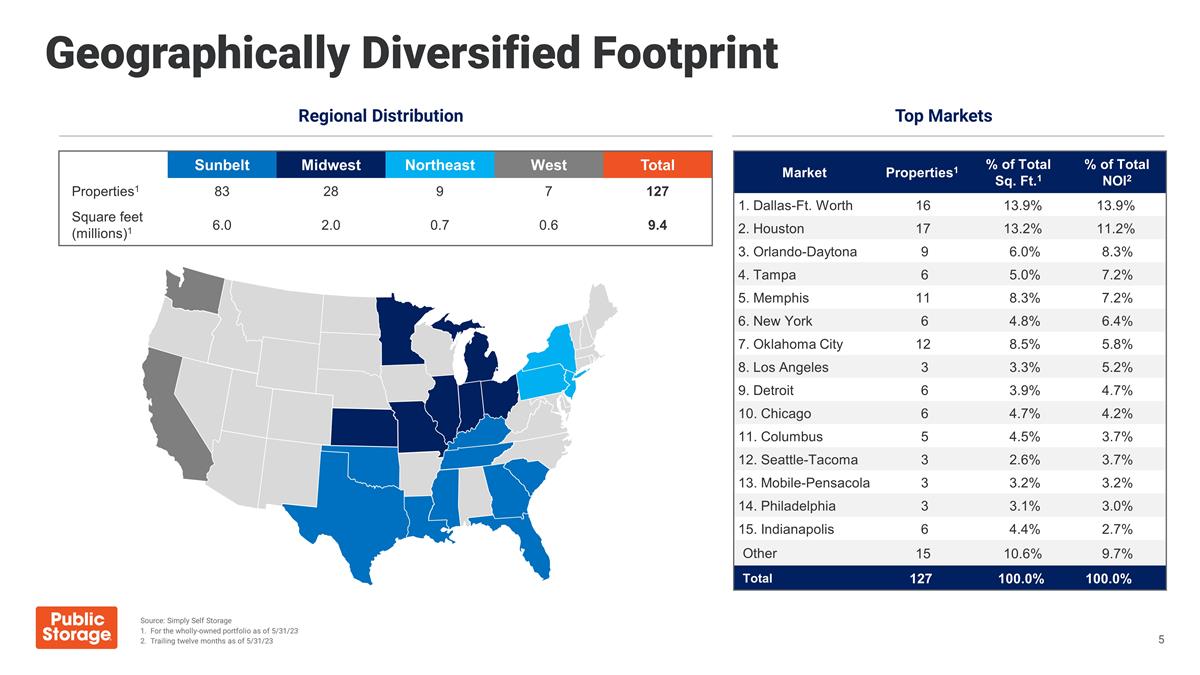
Geographically Diversified Footprint Sunbelt Midwest Northeast West Total Properties1 83 28 9 7 127 Square feet (millions)1 6.0 2.0 0.7 0.6 9.4 Regional Distribution Top Markets Market Properties1 % of Total Sq. Ft.1 % of Total NOI2 1. Dallas-Ft. Worth 16 13.9% 13.9% 2. Houston 17 13.2% 11.2% 3. Orlando-Daytona 9 6.0% 8.3% 4. Tampa 6 5.0% 7.2% 5. Memphis 11 8.3% 7.2% 6. New York 6 4.8% 6.4% 7. Oklahoma City 12 8.5% 5.8% 8. Los Angeles 3 3.3% 5.2% 9. Detroit 6 3.9% 4.7% 10. Chicago 6 4.7% 4.2% 11. Columbus 5 4.5% 3.7% 12. Seattle-Tacoma 3 2.6% 3.7% 13. Mobile-Pensacola 3 3.2% 3.2% 14. Philadelphia 3 3.1% 3.0% 15. Indianapolis 6 4.4% 2.7% Other 15 10.6% 9.7% Total 127 100.0% 100.0% Source: Simply Self Storage 1. For the wholly-owned portfolio as of 5/31/23 2. Trailing twelve months as of 5/31/23
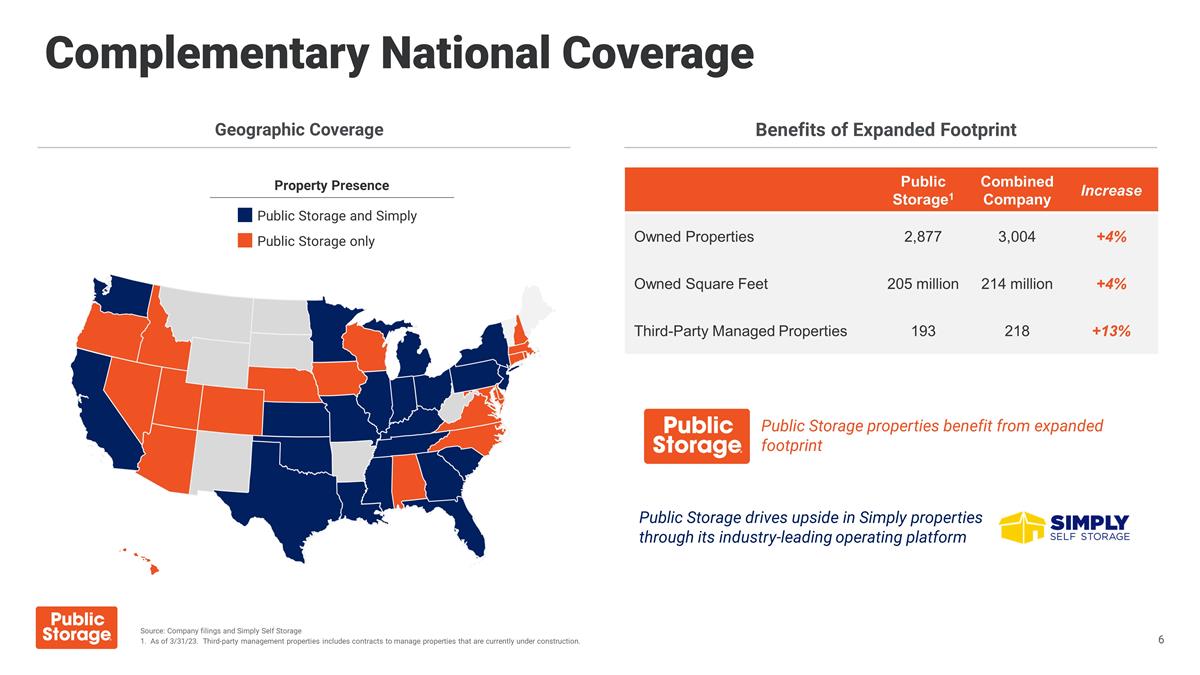
Complementary National Coverage Property Presence Public Storage only Public Storage and Simply Public Storage1 Combined Company Increase Owned Properties 2,877 3,004 +4% Owned Square Feet 205 million 214 million +4% Third-Party Managed Properties 193 218 +13% Geographic Coverage Benefits of Expanded Footprint Public Storage properties benefit from expanded footprint Public Storage drives upside in Simply properties through its industry-leading operating platform Source: Company filings and Simply Self Storage 1. As of 3/31/23. Third-party management properties includes contracts to manage properties that are currently under construction.
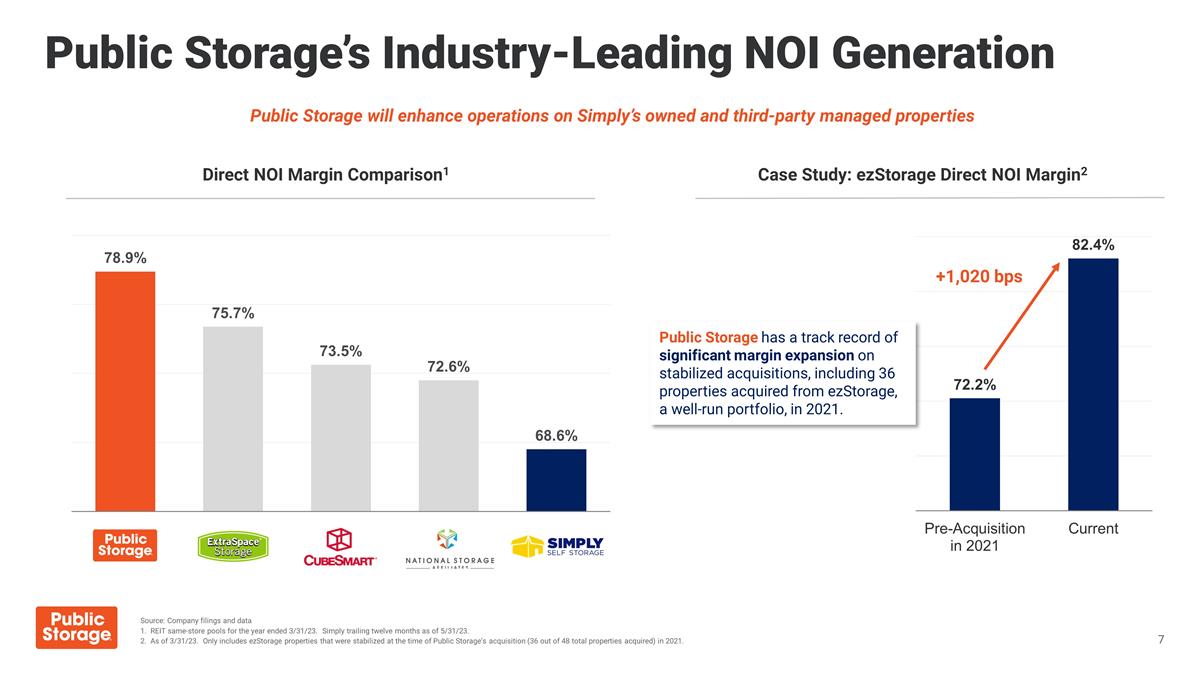
Public Storage’s Industry-Leading NOI Generation Case Study: ezStorage Direct NOI Margin2 Direct NOI Margin Comparison1 Public Storage has a track record of significant margin expansion on stabilized acquisitions, including 36 properties acquired from ezStorage, a well-run portfolio, in 2021. +1,020 bps Public Storage will enhance operations on Simply’s owned and third-party managed properties Source: Company filings and data 1. REIT same-store pools for the year ended 3/31/23. Simply trailing twelve months as of 5/31/23. 2. As of 3/31/23. Only includes ezStorage properties that were stabilized at the time of Public Storage’s acquisition (36 out of 48 total properties acquired) in 2021.
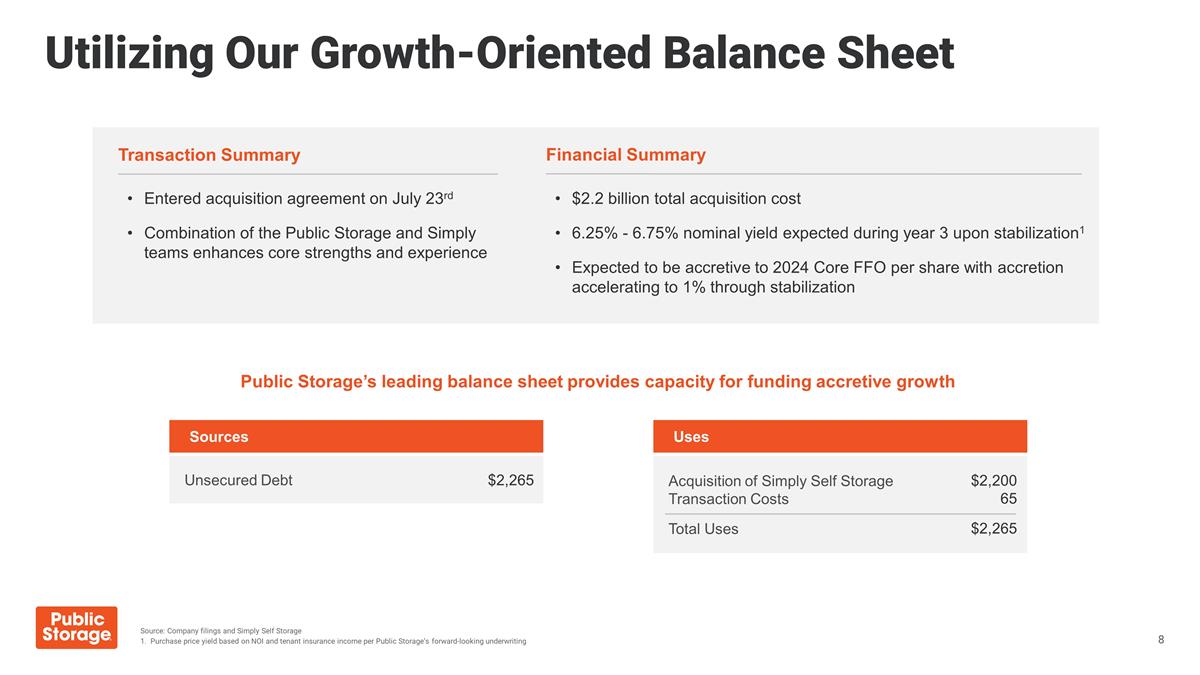
Utilizing Our Growth-Oriented Balance Sheet Transaction Summary Entered acquisition agreement on July 23rd Combination of the Public Storage and Simply teams enhances core strengths and experience Financial Summary $2.2 billion total acquisition cost 6.25% - 6.75% nominal yield expected during year 3 upon stabilization1 Expected to be accretive to 2024 Core FFO per share with accretion accelerating to 1% through stabilization Public Storage’s leading balance sheet provides capacity for funding accretive growth Source: Company filings and Simply Self Storage 1. Purchase price yield based on NOI and tenant insurance income per Public Storage’s forward-looking underwriting Unsecured Debt Sources $2,265 Acquisition of Simply Self Storage Transaction Costs Total Uses Uses $2,200 65 $2,265

Public Storage is the Self-Storage Acquirer of Choice Public Storage Quick Facts World’s leading owner, acquirer, and developer of self-storage properties Most active private-market acquirer since 2019 Execution Certainty with Speed to Close Executing in a “win-win” transaction marketplace Sellers transact at fair valuations Public Storage enhances cash flow growth through its best-in-class operating platform Reputation as a preferred property acquirer with no financing contingencies, execution certainty, and speed to close on a cash basis Acquisitions consistently funded with free cash flow and unsecured debt issued via growth-oriented balance sheet Square feet added, millions Portfolio Expansion via Private Market Transactions (2019 – 2023 YTD)1 Source: Company filings 1. Includes acquisition properties closed or under contract subsequent to 3/31/23.
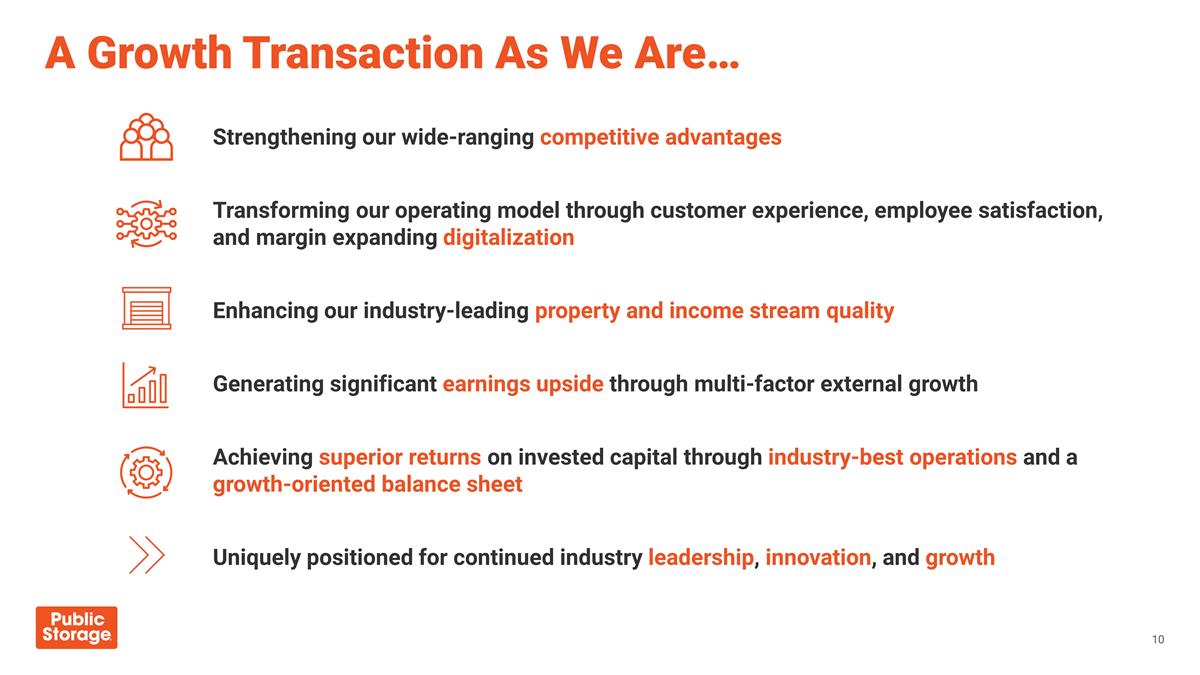
A Growth Transaction As We Are… Strengthening our wide-ranging competitive advantages Transforming our operating model through customer experience, employee satisfaction, and margin expanding digitalization Enhancing our industry-leading property and income stream quality Generating significant earnings upside through multi-factor external growth Achieving superior returns on invested capital through industry-best operations and a growth-oriented balance sheet Uniquely positioned for continued industry leadership, innovation, and growth

Appendix
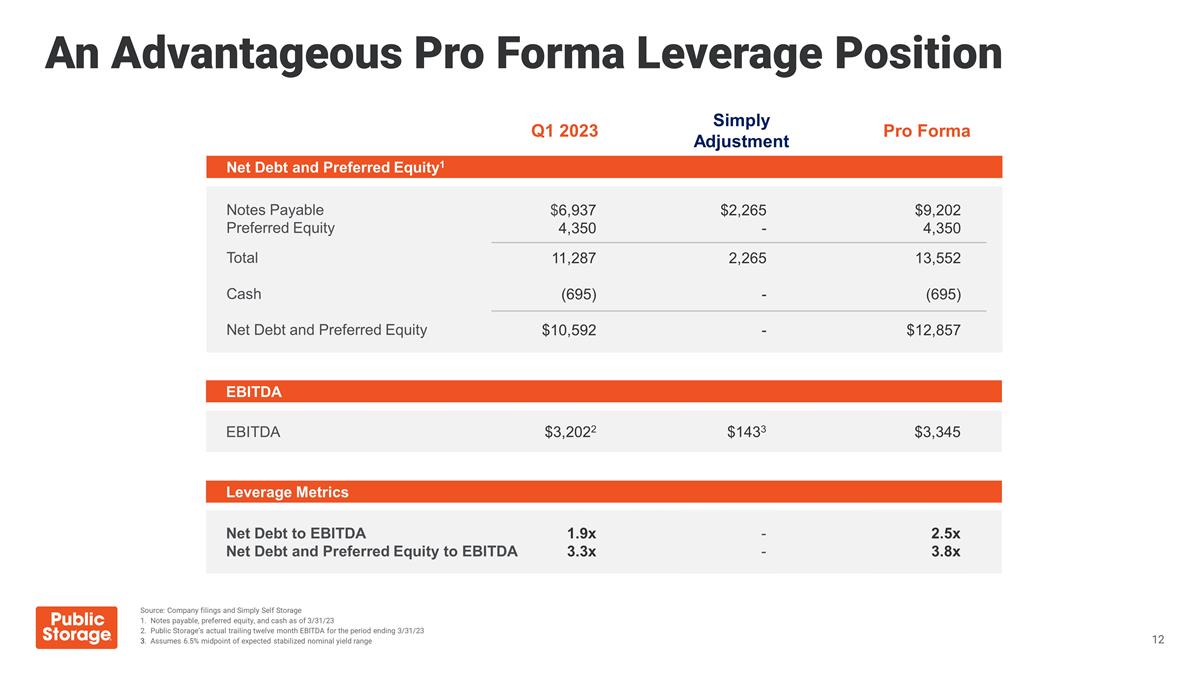
An Advantageous Pro Forma Leverage Position Notes Payable Preferred Equity Total Cash Net Debt and Preferred Equity Net Debt and Preferred Equity1 Q1 2023 Simply Adjustment Pro Forma $6,937 4,350 11,287 (695) $10,592 $2,265 - 2,265 - - $9,202 4,350 13,552 (695) $12,857 EBITDA EBITDA $3,2022 $1433 $3,345 Leverage Metrics Net Debt to EBITDA Net Debt and Preferred Equity to EBITDA 1.9x 3.3x - - 2.5x 3.8x Source: Company filings and Simply Self Storage 1. Notes payable, preferred equity, and cash as of 3/31/23 2. Public Storage’s actual trailing twelve month EBITDA for the period ending 3/31/23 3. Assumes 6.5% midpoint of expected stabilized nominal yield range
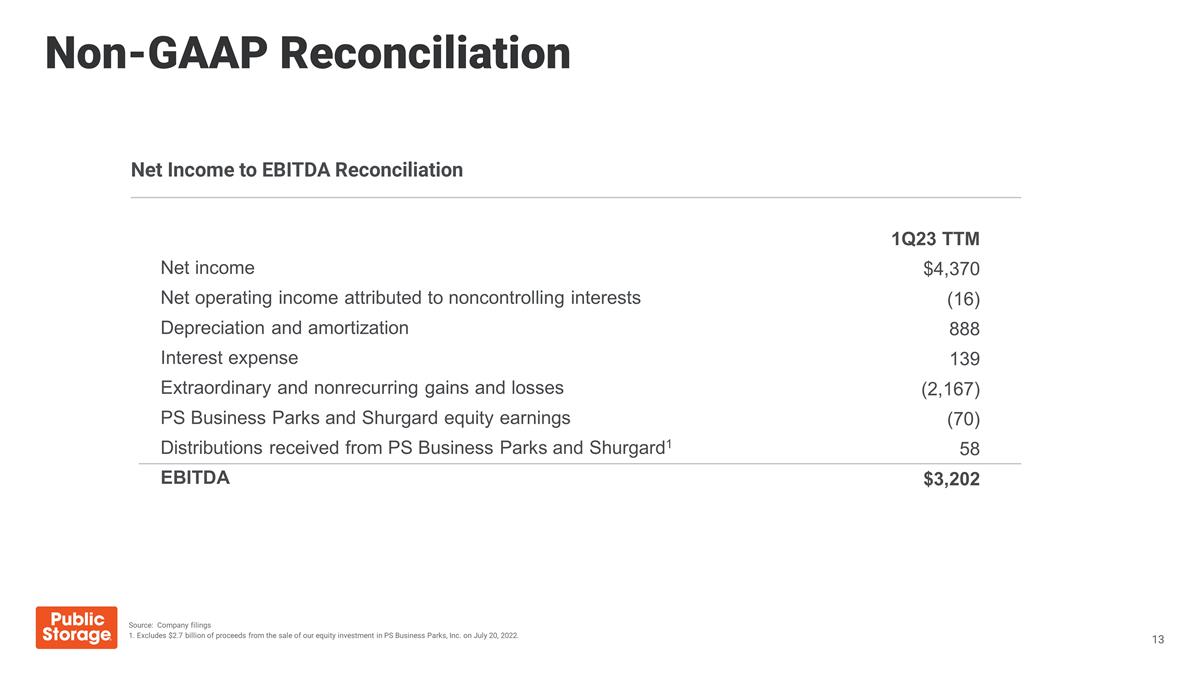
Source: Company filings 1. Excludes $2.7 billion of proceeds from the sale of our equity investment in PS Business Parks, Inc. on July 20, 2022. Net income Net operating income attributed to noncontrolling interests Depreciation and amortization Interest expense Extraordinary and nonrecurring gains and losses PS Business Parks and Shurgard equity earnings Distributions received from PS Business Parks and Shurgard1 EBITDA Net Income to EBITDA Reconciliation 1Q23 TTM $4,370 (16) 888 139 (2,167) (70) 58 $3,202 Non-GAAP Reconciliation


