 ©2008 Discover Financial Services Investor Presentation Citi Financial Services Conference January 29, 2008 Exhibit 99.1 |
2 ©2008 Discover Financial Services Notice The following slides are part of a presentation by Discover Financial Services (the "Company") and are intended to be viewed as part of that presentation. No representation is made that the information in these slides is complete. The presentation has been prepared solely for informational purposes, is neither an offer to sell nor the solicitation of an offer to buy any security or instrument. The information provided herein may include certain non-GAAP financial measures. The reconciliations of such measures to the comparable GAAP figures are included in the Company’s Registration Statement on Form 10, as amended, the Company’s Form 10-Q for the 3 rd Quarter 2007 and the Company’s 4 th Quarter Earnings Release furnished on Form 8-K dated December 20, 2007, each of which is on file with the SEC. The presentation contains forward-looking statements. You are cautioned not to place undue reliance on forward-looking statements, which speak only as of the date on which they are made, which reflect management’s estimates, projections, expectations or beliefs at that time and which are subject to risks and uncertainties that may cause actual results to differ materially. For a discussion of certain risks and uncertainties that may affect the future results of the Company, please see "Special Note Regarding Forward-Looking Statements," "Risk Factors," "Business - Competition," "Business – Regulatory Matters" and "Management’s Discussion and Analysis of Financial Condition and Results of Operations" in the Company’s Information Statement that is included as part of its Registration Statement on Form 10, as amended, and the Company’s Form 10-Q for the 3 rd Quarter 2007, each of which is on file with the SEC. The historical financial information prior to the Company’s spin-off from Morgan Stanley included in the presentation has been derived from Morgan Stanley’s consolidated financial statements and does not necessarily reflect what our financial condition, results of operations or cash flows would have been had we operated as a separate, stand-alone company during such periods presented. |
 3 ©2008 Discover Financial Services David W. Nelms CHIEF EXECUTIVE OFFICER Today’s Agenda • Business Overview and Results • Segment Review • Capital Management • Conclusion |
 4 ©2008 Discover Financial Services • U.K. cards issued by Goldfish Bank – $4.4Bn receivables – Operating on MasterCard and Visa networks • PULSE and Discover Network third-party payments business – 4,500+ financial institutions – 3.8Bn transactions – $91.7Bn network volume • Discover cards issued on Discover Network – 6 th largest issuer – $48.2Bn receivables – 3 rd largest U.S. merchant network International Card Third Party Payments U.S. Card Business Segments and Objectives • Grow third-party credit and debit volume 18%+ • Eliminate U.K. Loss • 2.9% pretax ROMR • Maintain credit quality • Grow loans 4% – 8% Objectives • Complete rollout of acceptance strategy Note(s): All data as of November 30, 2007; full year results where applicable and receivables data on a managed basis |
 5 ©2008 Discover Financial Services Performance Against Objectives Objectives U.S. Card • 2.9% pretax ROMR • Maintain credit quality • Grow loans 4 - 8% Third-Party Payments • Grow credit and debit volume 18%+ International Card • Eliminate loss 4Q Results (1) 28% volume growth Turnaround actions being implemented 2.8% pretax ROMR 3.84% charge-off rate 3.59% 30+ day delinquency 5% growth Note(s): (1) Managed basis |
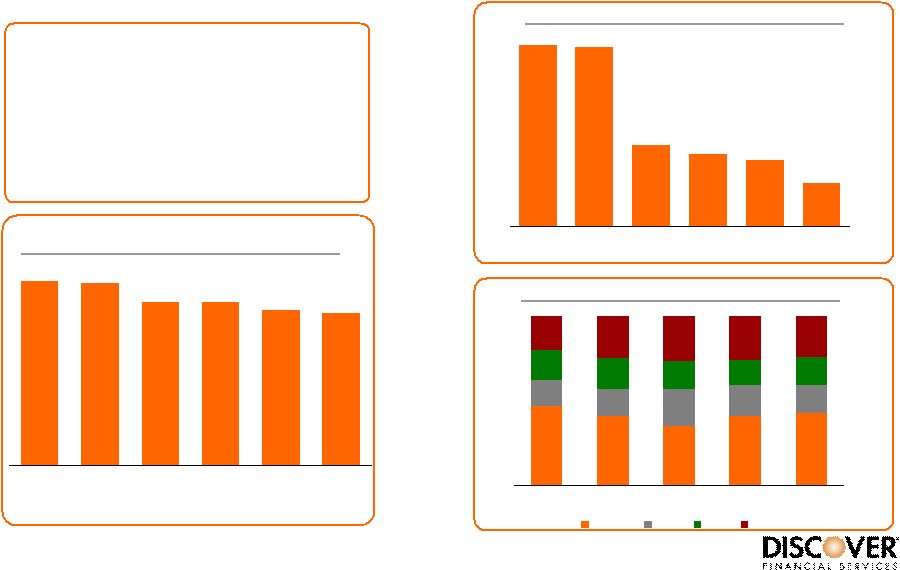
 6 ©2008 Discover Financial Services Prime Account Generation, Seasoned Customer Base 80% 72% 66% 57% 53% 43% Discover Citi AMEX BofA Chase Capital One Note(s): (1) Latest Master Trust balances as of 1/23/08; based on receivables (2) Weighted average tenure of the receivables that are assets of the Chase Issuance Trust > 5 Years Average FICO Score on New Accounts Portfolio Tenure (1) 734 738 737 734 0 100 200 300 400 500 600 700 800 2004 2005 2006 2007 (2) |
 7 ©2008 Discover Financial Services Lower Exposure in Difficult Housing Markets • Prime credit origination • Targeted geographic & marketing criteria • Enhanced collections & credit management / in-house capabilities • Focused on retention and growth from base Risk Mitigation Strategies 9% 12% 12% 15% 13% 17% 6% 6% 6% 8% 9% 15% 18% 18% 21% 22% 25% 6% Discover Capital One Chase Citibank Bank of America American Express California Florida Source: Latest Master Trust data as of 1/23/08 Note(s): (1) As represented by Chase’s CHAIT Master Trust (1) Distribution of Receivables |
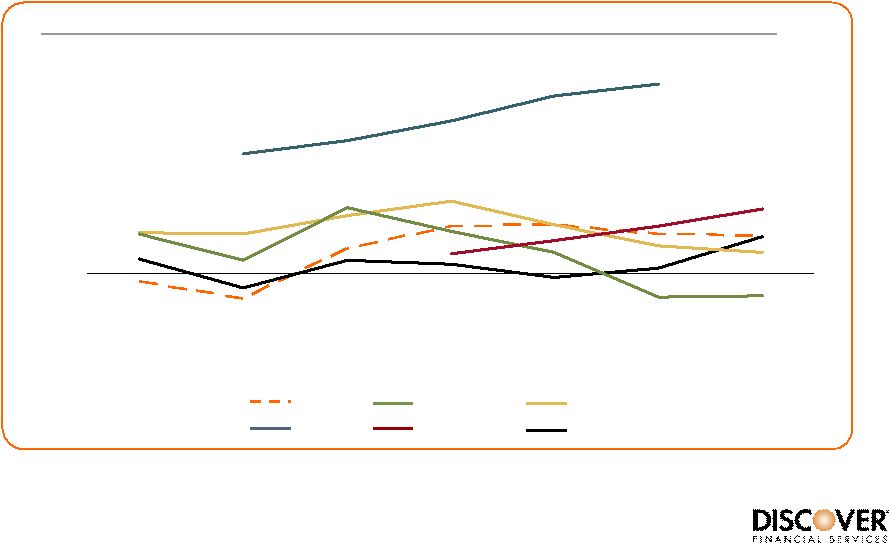
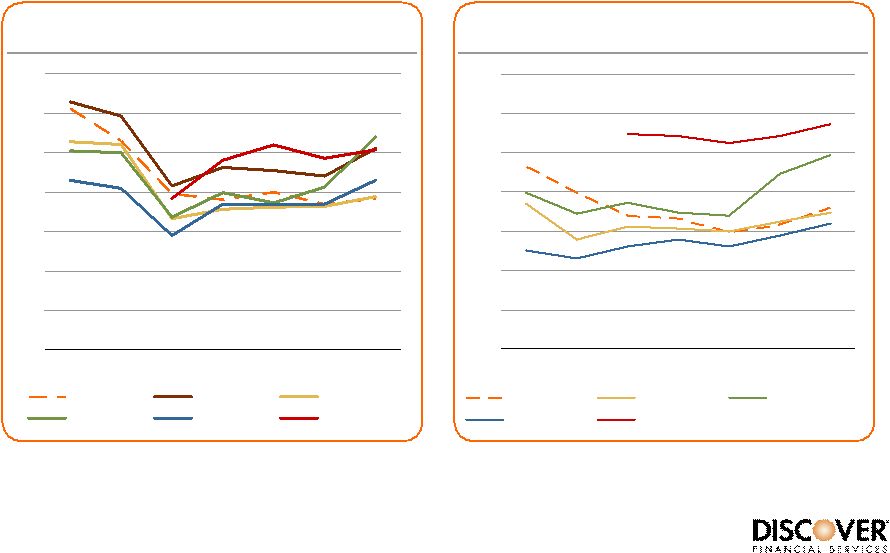 8 ©2008 Discover Financial Services 0% 1% 2% 3% 4% 5% 6% 7% 2004 2005 2006 1Q07 2Q07 3Q07 4Q07 Discover Chase Capital One AMEX BofA Strong Relative Credit Performance Note(s): (1) Discover fiscal year, all others calendar year (2) U.S. Card (3) Card Services (4) U.S. Consumer and Business Card (5) 4Q07 based on earnings pre-release announced 1/10/08 Source: SEC Filings 0% 1% 2% 3% 4% 5% 6% 7% 2004 2005 2006 1Q07 2Q07 3Q07 4Q07 Discover Citigroup Chase Capital One AMEX BofA (2) (2) (2) (2,5) (2) (4) Managed 30+ Day Delinquency Rate (1) (2) (3) (2) (4) (2,5) Managed Charge-off Rate (1) |
 9 ©2008 Discover Financial Services • Rising unemployment • Regional weakness in housing • Slower retail sales growth U.S. Credit Outlook Fiscal 2008 Outlook • Higher fee income • Lower funding costs • Lower expense ratio • Estimated full year Discover Card charge-off rate of 4.75% – 5.00% (1) Note(s): (1) Managed basis |
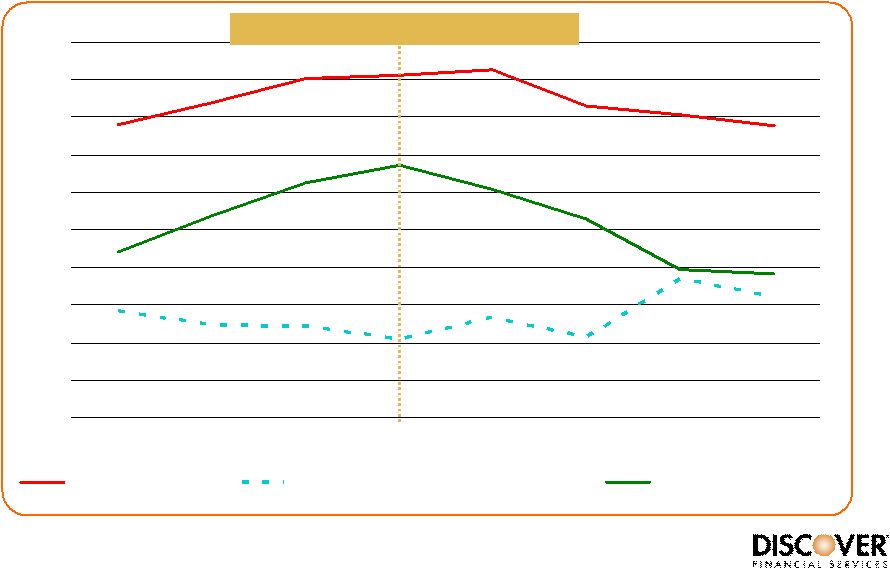 10 ©2008 Discover Financial Services U.S. Card Profitability Through Prior Cycle Note(s): Managed basis 0% 1% 2% 3% 4% 5% 6% 7% 8% 9% 10% 2000 2001 2002 2003 2004 2005 2006 2007 Net Interest Margin Pretax Return on Loan Receivables Net Charge-off Rate Prior cycle peak loss rate |
 11 ©2008 Discover Financial Services Charge-off and Funding Cost Drivers Note(s): U.S. Card – Managed basis 30+ Day Delinquency Rate 1-Month LIBOR 0% 1% 2% 3% 4% 5% 6% 7% 0% 1% 2% 3% 4% 5% 6% 7% 8% 2000 2001 2002 2003 2004 2005 2006 2007 |
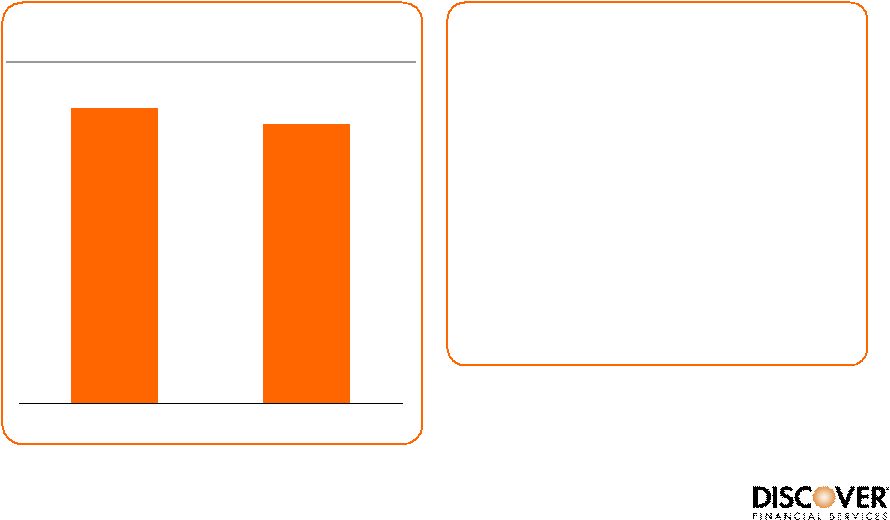 12 ©2008 Discover Financial Services 5.4% 5.1% 2006 2007 Operating Cost Ratio (1) Expense Control • Progress in 2007 despite charges for: – Spin-Off – Visa/MC litigation • Committed to reducing operating cost ratio in 2008 – Separation savings – Efficiency initiatives Note(s): (1) Non-interest expense as % of Total Average Loans; U.S. Card – Managed basis |
 13 ©2008 Discover Financial Services U.S. Receivables Growth -5% 0% 5% 10% 15% 20% 25% 2004 2005 2006 1Q07 2Q07 3Q07 4Q07 Discover Chase (2) Capital One AMEX BofA (3) Citi Note(s): (1) U.S. Card unless otherwise noted (2) Card Services (3) U.S. Consumer and Business Card Managed Receivables (YOY) (1) Source: SEC Filings |
 14 ©2008 Discover Financial Services Differentiators For Profitable Growth 607 617 651 652 728 735 AMEX Discover Citi Chase Capital One BofA 41% 15% 16% 22% 18% 16% 18% 18% 16% 15% 17% 20% 25% 27% 26% 24% 43% 47% 41% 35% 4Q06 1Q07 2Q07 3Q07 4Q07 Discover Chase HSBC Other Cash Reward Mail Share Unaided Issuer Brand Awareness Customer Satisfaction • Brand and service advantage vs. Visa/MasterCard issuers • Leading position in cash rewards marketing Source: 2007 J.D. Power Card Satisfaction Index Source: GfK Arbor, January 2007 Source: Comperemedia 15% 23% 25% 28% 62% 63% AMEX Discover Capital One Citi Chase BofA |
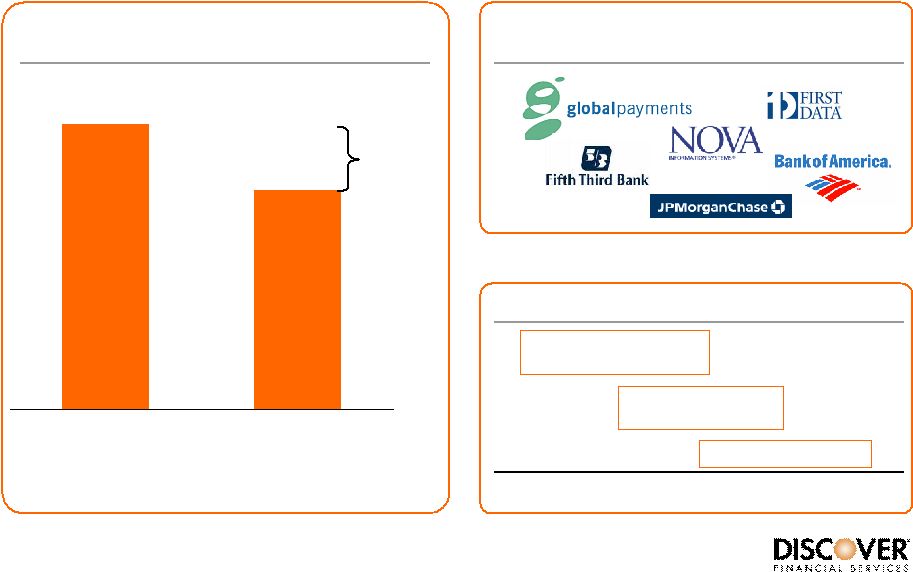 15 ©2008 Discover Financial Services ~100% Large Merchants Small Merchants Merchant Acceptance % of Visa/MasterCard Merchants New Acceptance Strategy Note(s): (1) “A National Retail Census of Product Distribution: Credit Cards” GfK NOP, Spring 2006; based on random sampling of approximately 1% of U.S. retail and service establishments (1) ~77% 3 rd party acquirer opportunity Sample Third-Party Acquirers Signed Third-Party Acquirer Timeline 2005 2009 Internal Systems/Operations Sign 3 rd Party Acquirers 2006 2007 2008 Implementation |
 16 ©2008 Discover Financial Services Optimal Acceptance Model Leverage acquirer scale and coverage Economics similar to Visa and MasterCard Network Interchange Acquirer assessments ~30% of volume ~85% of outlets Indirect through acquirers Outsourced Merchants Retained Merchants Joint marketing opportunities Direct relationships and scale provide efficiencies Advantages Network and acquiring Expenses Merchant discount Merchant fees Revenue ~70% of volume ~15% of outlets Mix (target) Direct Relationship New Model Payoff: Higher Discover Card spend and balances Greater appeal for third party issuers |
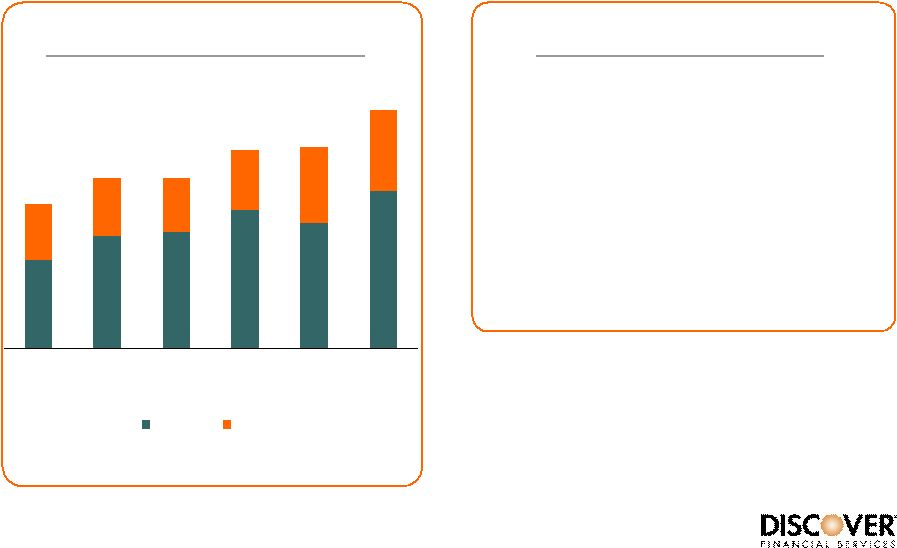
 17 ©2008 Discover Financial Services 1Q07 2Q07 3Q07 4Q07 Network Progress Discover Network PULSE Third-Party Network Volume (Bn) $24.5 $23.9 $21.2 $22.1 YOY +28% Discover Network (Proprietary) $93.8Bn Discover Network (Third Party) $5.5Bn PULSE $86.2Bn 2007 Total Network Volume |
 18 ©2008 Discover Financial Services PULSE Primary Sources of Revenue • Switch fees for ATM, PIN POS and signature debit transactions • Participation fees, connectivity fees, and other product fees Sample Issuers Key Facts • Third largest PIN debit network (1) • Over 4,500 issuers • Past 4 quarters: 2.3 billion transactions • 25% volume growth 4Q07 vs. 4Q06 Value Proposition • A leader in U.S PIN POS acceptance • Highly competitive interchange • Leading issuer services • Broad product line Note(s): (1) ATM & Debit News, EFT Data Book 2008 Edition |
 19 ©2008 Discover Financial Services Discover Network Primary Sources of Revenue • Merchant discount/acquirer interchange • Issuer assessments and fees Sample Issuers Key Facts • One of only four U.S. signature networks • 20+ issuers • 2007 volume – $93.8 billion Discover Card – $5.5 billion third-party issuers Value Proposition • Strong brand choice • Competitive interchange and assessments • Robust product suite and acceptance • Unique marketing programs/features • Flexibility and ease of implementation |
 20 ©2008 Discover Financial Services International Acceptance Partnerships • Long-term reciprocal acceptance agreement signed in May 2005 • #1 network in China • 70% better acceptance than Visa/MasterCard in China • Long-term reciprocal acceptance agreement signed in August 2006 • Leading global payment brand based in Japan • Similar acceptance to Visa/MasterCard in Japan |
 21 ©2008 Discover Financial Services 2008 U.K. Outlook Expect significantly lower loss in 2008 • Removal of one-time charges • Fee and interest income opportunities • Expense and rewards savings opportunities • Business mix shift / shrinking portfolio |
 22 ©2008 Discover Financial Services International Card Turnaround Credit Improvement Actions • Tightened acquisition underwriting, lines based on new scorecards (complete) • Enhanced line management, authorizations, cash strategies (ongoing) • New collections platform (complete) • In-sourcing of Goldfish collections (complete) Revenue Improvement Actions • Risk based re-pricing of cash and retail balances (ongoing) • Introduction of annual fees for rewards-based products (ongoing) • Focus on fee product cross sales (ongoing) • Shifting mix to profitable revolvers (ongoing) Expense Improvement Actions • Consolidation of operation centers (complete) • Technology and platform migrations (complete) • Leveraging of Discover vendors and capabilities (ongoing) • Focus on IVR and internet channels (ongoing) |
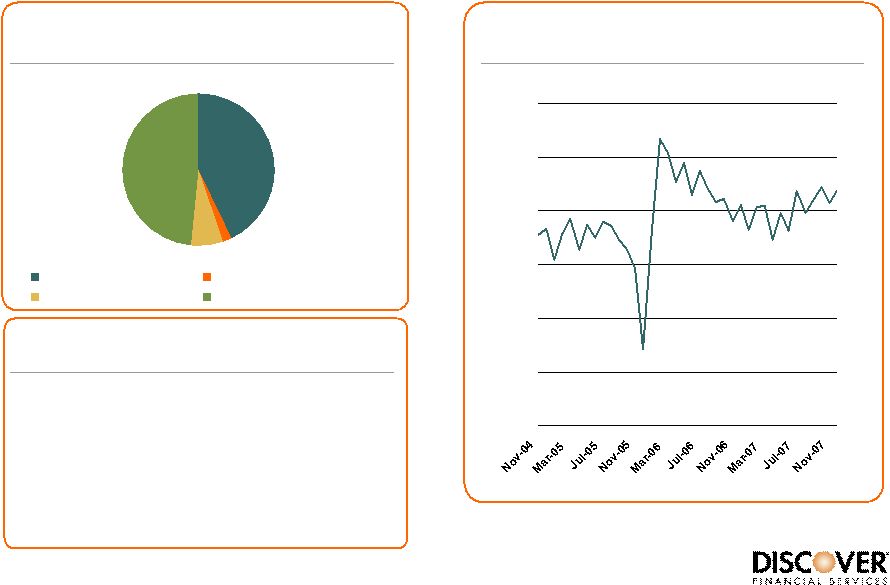 23 ©2008 Discover Financial Services Funding and Liquidity 2% 7% 48% 43% Deposits Other Borrowings External Secured Financing ABS (Term and Private) Total Managed Funding at 11/30/07 Discover Securitizations Excess Spread (2) • $8.8Bn cash • $2.75Bn capacity to issue AAA ABS (1) • $1.9Bn committed conduit capacity • $2.5Bn multi-year unsecured committed credit facility 0% 2% 4% 6% 8% 10% 12% Note(s): (1) $900MM AAA ABS issuance closed on 1/16/2008 (2) U.S. Card; Interchange Subgroup Contingent Liquidity Sources at 11/30/07 $58.3Bn |
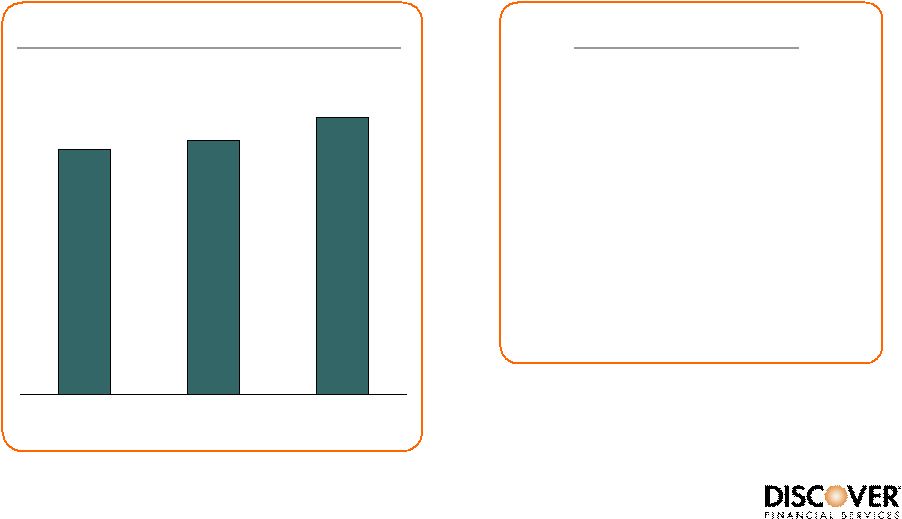 24 ©2008 Discover Financial Services Capital Management • Business growth requirements • Quarterly dividend of $0.06 • Potential for highly targeted acquisitions • Share repurchase ($1Bn authorized) Capital Uses 2007 Tangible Equity Ratio Note(s): (1) Based upon tangible equity over net managed receivables (2) Assumes dividend maintained (1) (2) 10.1% 9.6% 9.4% 6/30 8/31 11/30 |
 25 ©2008 Discover Financial Services Conclusion – Opportunity to Create Value • U.S. Card – Strong profits and well-positioned for continued controlled growth • Payments – Unique assets, rapidly growing • International Card – Significant upside from turnaround • Strong capital generation |