2010 Financial Community Briefing March 17, 2010 Exhibit 99.1 |
Notice The following slides are part of a presentation by Discover Financial Services (the "Company") and are intended to be viewed as part of that presentation. No representation is made that the information in these slides is complete. The information provided herein may include certain non-GAAP financial measures. The reconciliations of such measures to the comparable GAAP figures are included in the Company’s Current Reports on Form 8-K dated March 1, 2010 and March 16, 2010 and Annual Report on Form 10-K for the year ended November 30, 2009, which are on file with the SEC and available on the Company’s website at www.discoverfinancial.com. Certain reconciliations are also included at the end of this presentation. The presentation contains forward-looking statements. You are cautioned not to place undue reliance on forward- looking statements, which speak only as of the date on which they are made, which reflect management’s estimates, projections, expectations or beliefs at that time and which are subject to risks and uncertainties that may cause actual results to differ materially. For a discussion of certain risks and uncertainties that may affect the future results of the Company, please see "Special Note Regarding Forward-Looking Statements," "Risk Factors," "Business – Competition," "Business – Supervision and Regulation" and "Management’s Discussion and Analysis of Financial Condition and Results of Operations" in the Company’s Annual Report on Form 10-K for the year ended November 30, 2009, which is on file with the SEC. Certain historical financial information about the Company that we have included in this presentation has been derived from Morgan Stanley’s consolidated financial statements and does not necessarily reflect what our financial condition, results of operations or cash flows would have been had we operated as a separate, stand-alone company during the periods presented. We own or have rights to use the trademarks, trade names and service marks that we use in conjunction with the operation of our business, including, but not limited to: Discover ® , PULSE ® , Cashback Bonus ® , Discover ® Network and Diners Club International ® . All other trademarks, trade names and service marks included in this presentation are the property of their respective owners. 2 |
David Nelms Chairman & Chief Executive Officer March 17, 2010 |
Becoming the leading direct banking and payments company 4 |
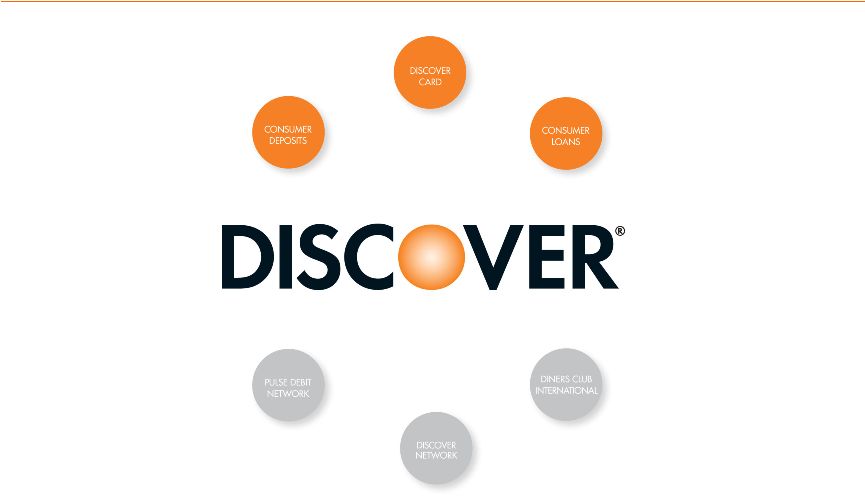
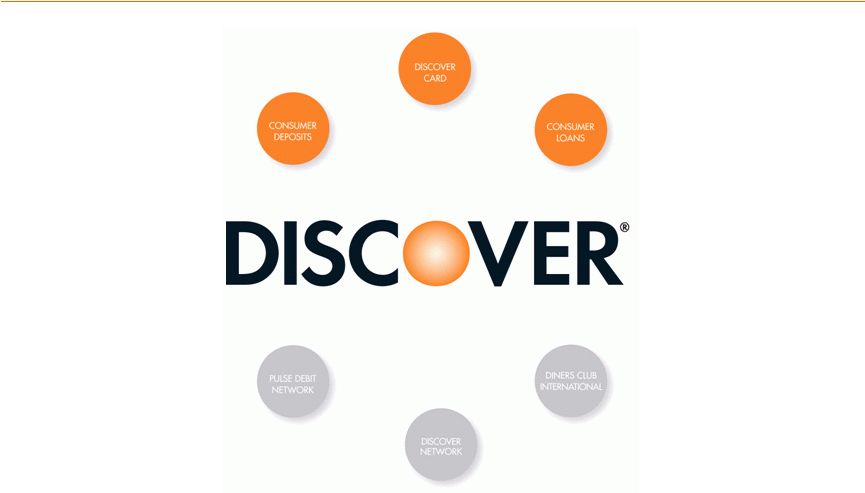
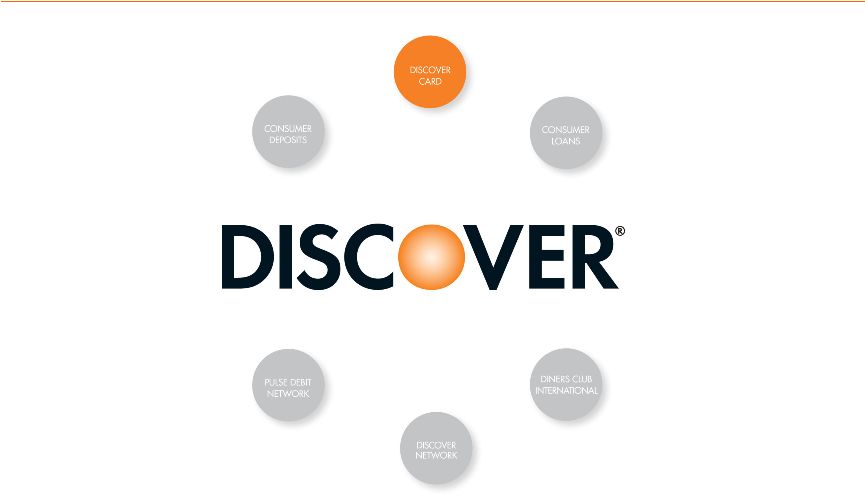
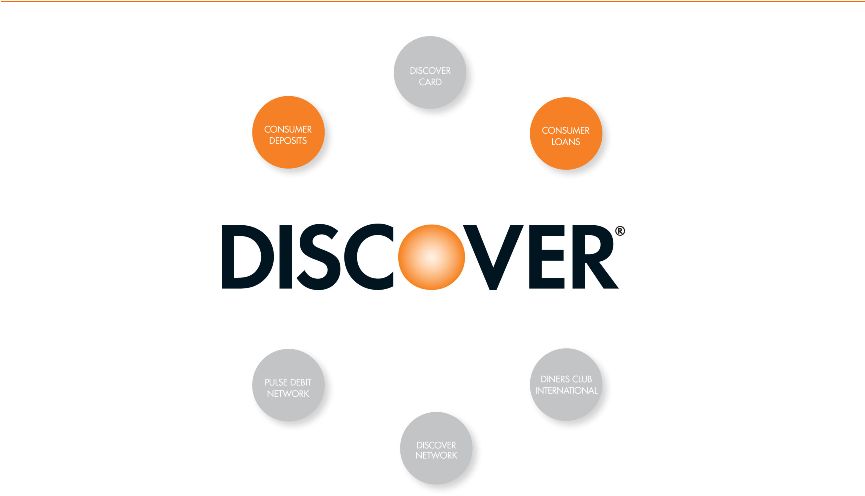
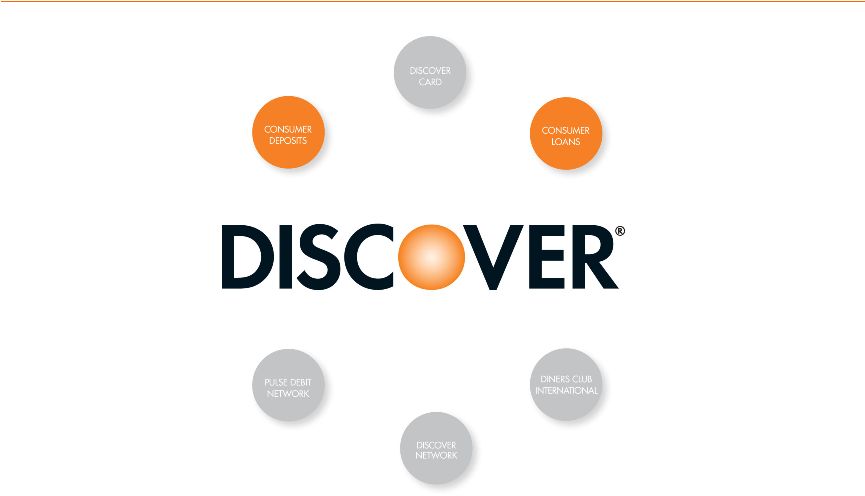
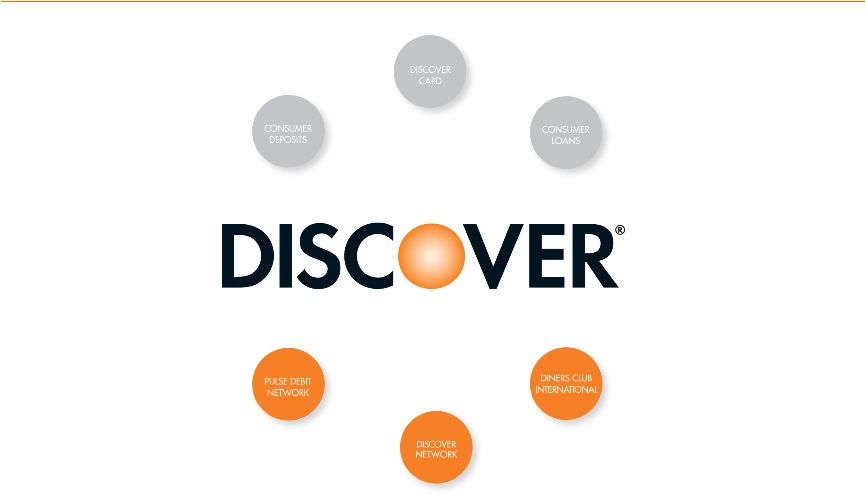
Unique direct banking and payment services assets Note: Balances as of February 28, 2010; volume based on the trailing four quarters ending 1Q10 • $46Bn in receivables • Leading cash rewards program • 1 in 4 U.S. households • $15Bn consumer deposits • $4Bn personal and student loans Deposits and Other Lending Deposits and Other Lending U.S. Card Issuing U.S. Card Issuing • $109Bn volume • 4,400+ issuers • $97Bn volume • 30+ issuers • $26Bn volume • 50 franchises • 185 countries/territories 5 |
• Achieve disciplined, profitable growth in cards • Expand other attractive direct lending and savings products Growth objectives to build shareholder value • Build robust global acceptance network for credit, debit and ATM through direct relationships and alliances • Increase global volume leveraging flexibility, multi-brand network alliances and emerging payments technologies Direct Banking Payment Services Long-Term Financial Targets • 10%+ Volume CAGR • 5-10% Total Loans CAGR • 15%+ ROE • 10%+ EPS Growth 6 |
Today’s agenda Jim Panzarino EVP, CHIEF CREDIT RISK OFFICER Roger Hochschild PRESIDENT & CHIEF OPERATING OFFICER Carlos Minetti EVP, CONSUMER BANKING & OPERATIONS Harit Talwar EVP, CARD PROGRAMS & CHIEF MARKETING OFFICER Diane Offereins EVP, PAYMENT SERVICES Payment Services Personal & Student Loans Deposit Products Card Issuing Credit Risk Management 2009 Review and Growth Outlook Financial Review Roy Guthrie EVP, CHIEF FINANCIAL OFFICER Q&A 7 |
2010 Financial Community Briefing David Nelms Chairman & Chief Executive Officer March 17, 2010 |
2009 Review and Growth Outlook Roger Hochschild President & Chief Operating Officer March 17, 2010 |
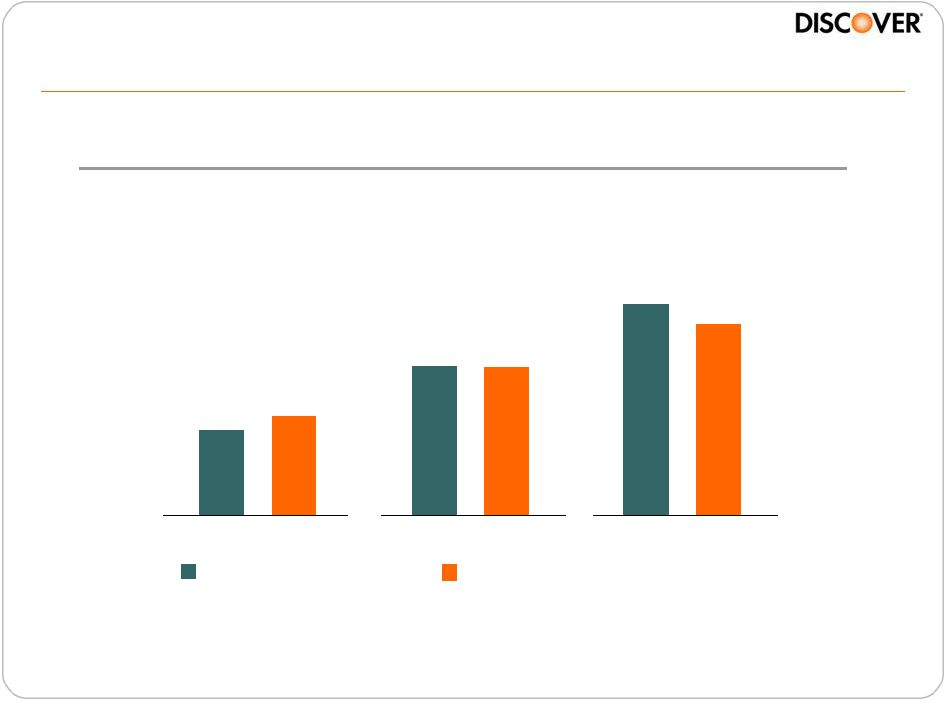
10 • Superior credit performance vs. competitors – Lowest managed net credit card charge-off rate in industry • Conservative loan growth – Most stable credit card receivables and sales • Increase net interest margin and revenues – 82bps increase in net interest margin YOY • Reduce expenses – 7% decrease YOY • Focus on capital/liquidity/funding – 8.2% tangible common equity/tangible managed assets 2009 performance – a year of significant accomplishments Note Refer to appendix for reconciliation of non-GAAP financial measures |
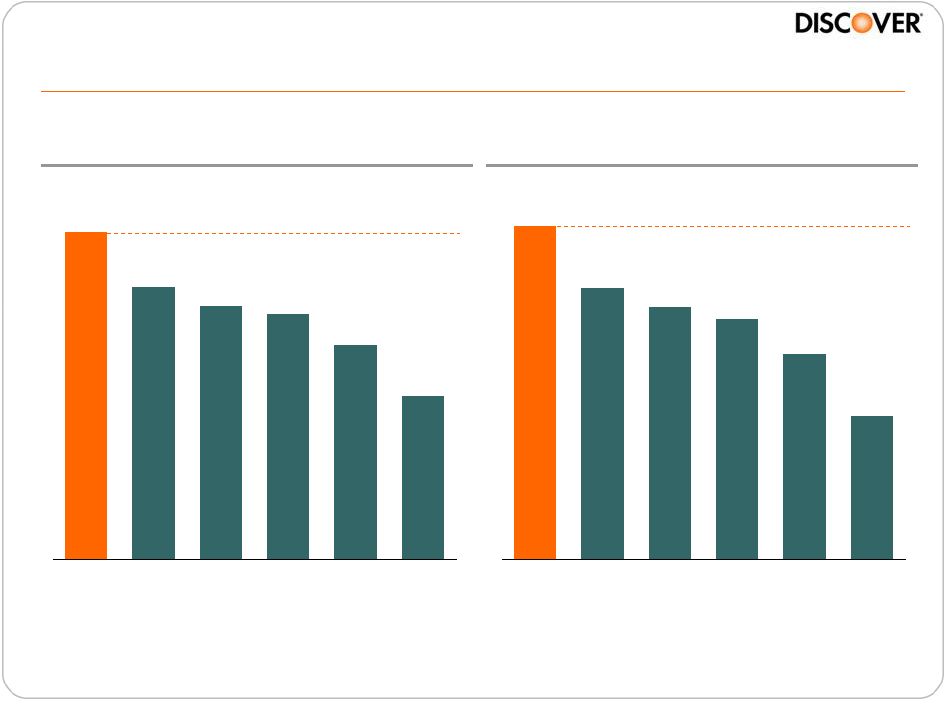
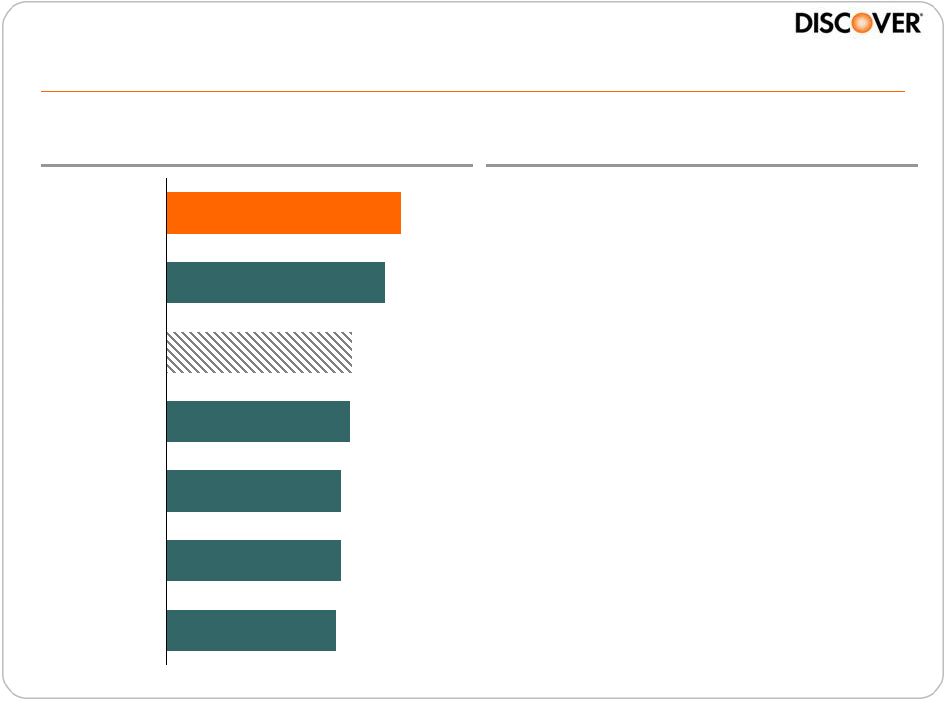
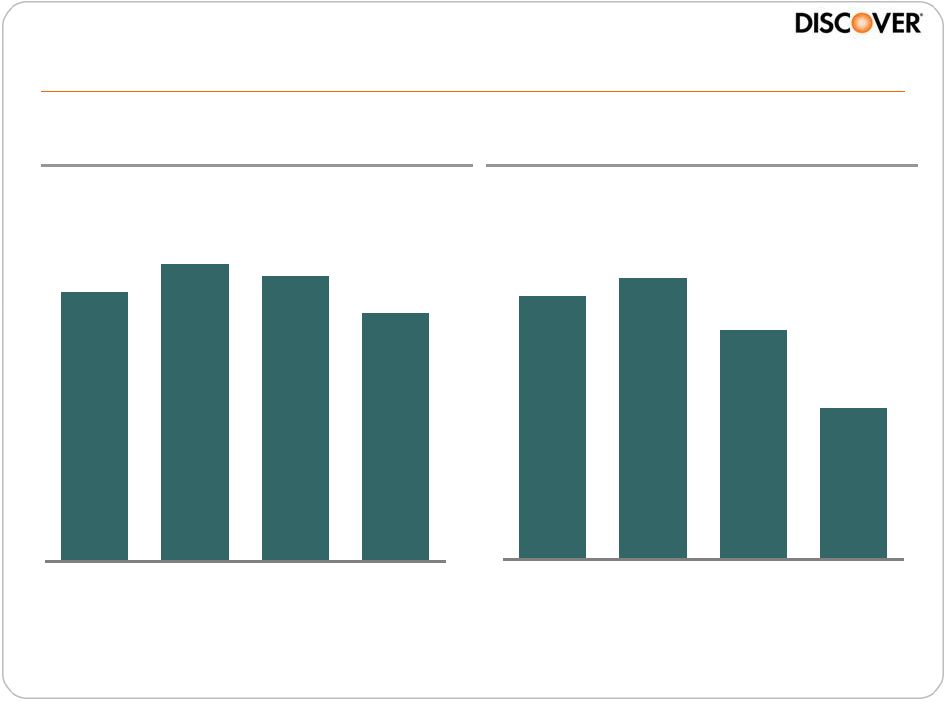
12.1% 9.6% 9.3% 9.2% 8.7% 8.0% DFS AXP COF JPM C BAC Industry leading charge-offs Managed Net Credit Card Charge-off Rate (FY2009) Source: Public company filings Note 1. Does not include Citi Holdings (1) 11 |
Market share growth in volume and receivables Volume YOY Change (FY2009) Receivables YOY Change (FY2009) (3,5) (5) Source: Public company filings Notes 1. Sales volumes only 2. Reflects sales, cash advance + BT volume 3. Reflects sales + cash advance volume 4. Reflects global purchase volume 5. Does not include Citi Holdings (1) (4) (2) (3) 12 -14.7% -14.6% -11.2% -11.0% -9.2% -5.2% DFS COF JPM AXP BAC C -1.3% -4.5% -14.1% -15.0% -15.7% -15.9% C DFS JPM COF AXP BAC |
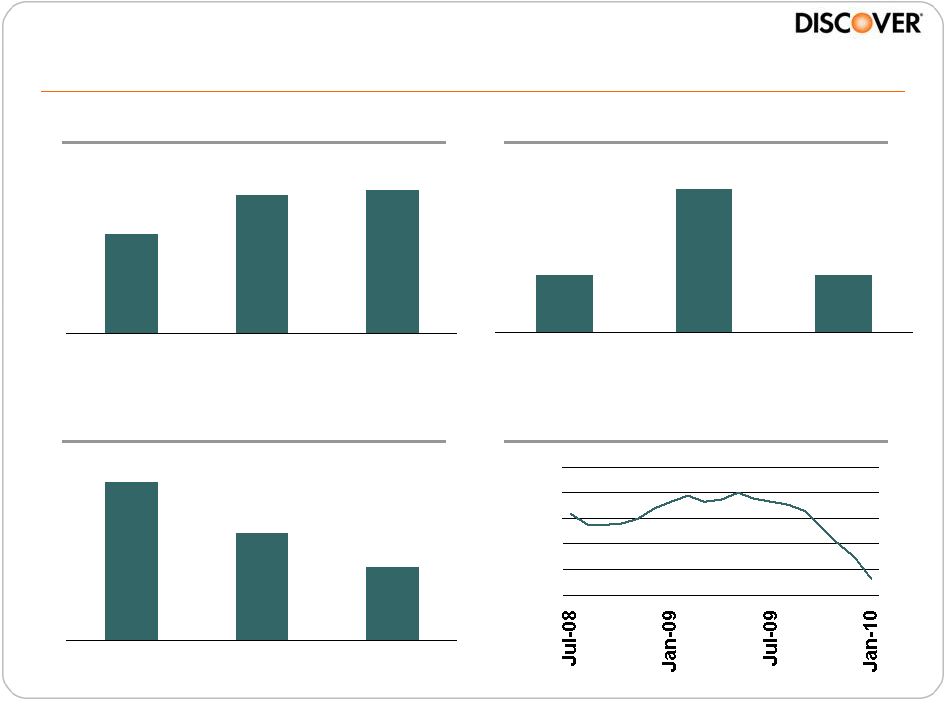
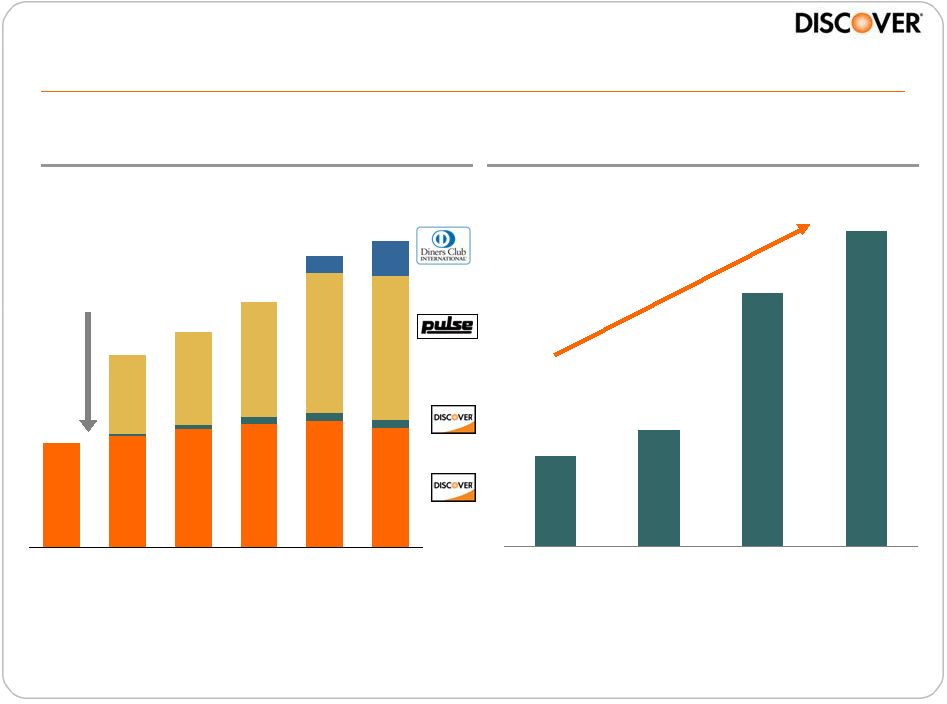
$6.2 $7.0 $8.1 $10.2 $12.6 4Q08 1Q09 2Q09 3Q09 4Q09 Growth in Direct Banking Direct-to-Consumer Deposits (Bn) Personal & Student Loans (Bn) $1.3 $1.8 $2.1 $2.7 $3.3 4Q08 1Q09 2Q09 3Q09 4Q09 13 |
$107 $81 $37 2007 2008 2009 Growth in Payment Services Pretax Income (MM) Number of Transactions (Bn) 4.4 4.2 3.8 2007 2008 2009 Note Number of transactions on the Discover Network and PULSE network 14 |
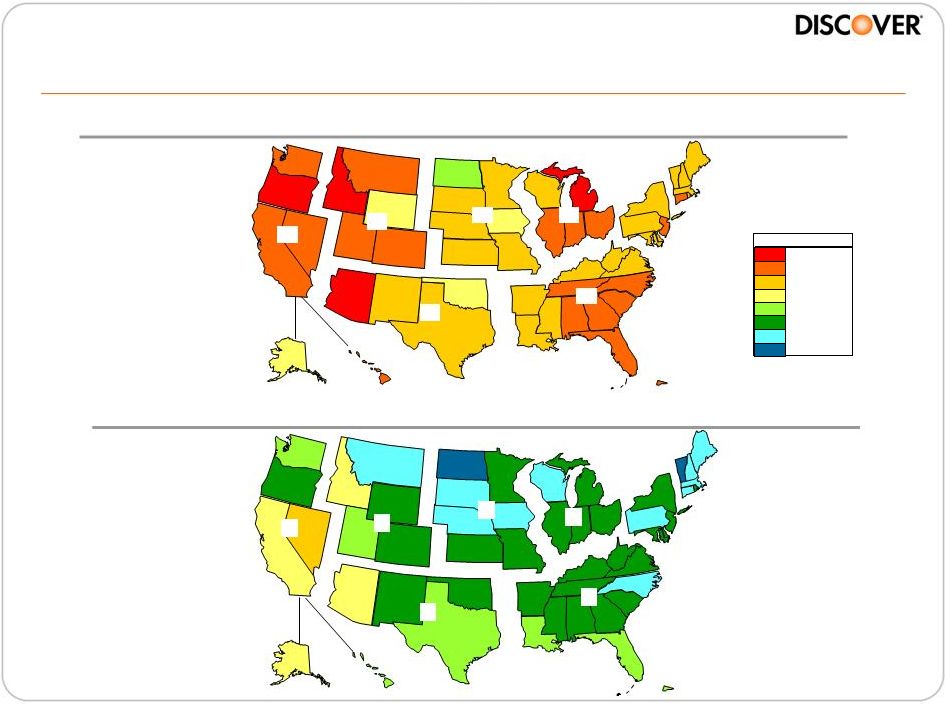
Sales trends are now positive State and Region YOY Sales Change (1Q 2009) State and Region YOY Sales Change (1Q 2010) <-9% -6% to -9% -3% to -6% 0% to -3% 0% to 3% 3% to 6% 6% to 9% >9% YOY Growth 15 -6% -5% -6% -7% -5% -5% -6% -8% 8% 5% 4% 5% 6% 2% 3% 0% |
2010 Focus • Superior credit risk management • Gained share in loans & sales • Expansion of lending products & growth of direct deposits • 31% increase in PBT, improved acceptance • Continued vigilance; transition to growth • Achieve disciplined, profitable growth • Establish leadership position • Increase global acceptance and volume Summary 2009 Accomplishment Area Credit Risk Card Issuing Consumer Banking Payment Services 16 |
2009 Review and Growth Outlook Roger Hochschild President & Chief Operating Officer March 17, 2010 |
Credit Risk Management Jim Panzarino EVP, Chief Credit Risk Officer March 17, 2010 |
Strong credit performance • DFS managed net credit card charge-off rate lowest in peer group (2009) • Balanced and surgical approach to loss mitigation Well positioned for the future • Longer average customer tenure • Favorable geographic distribution • Impact of loss mitigation reflected in average delinquent balance decline Innovative strategies to optimize growth • Enhancements in analytic tools to adapt to the changing environment • Continue to utilize new data sources • Increase judgmental processing Discipline and innovation 19 |
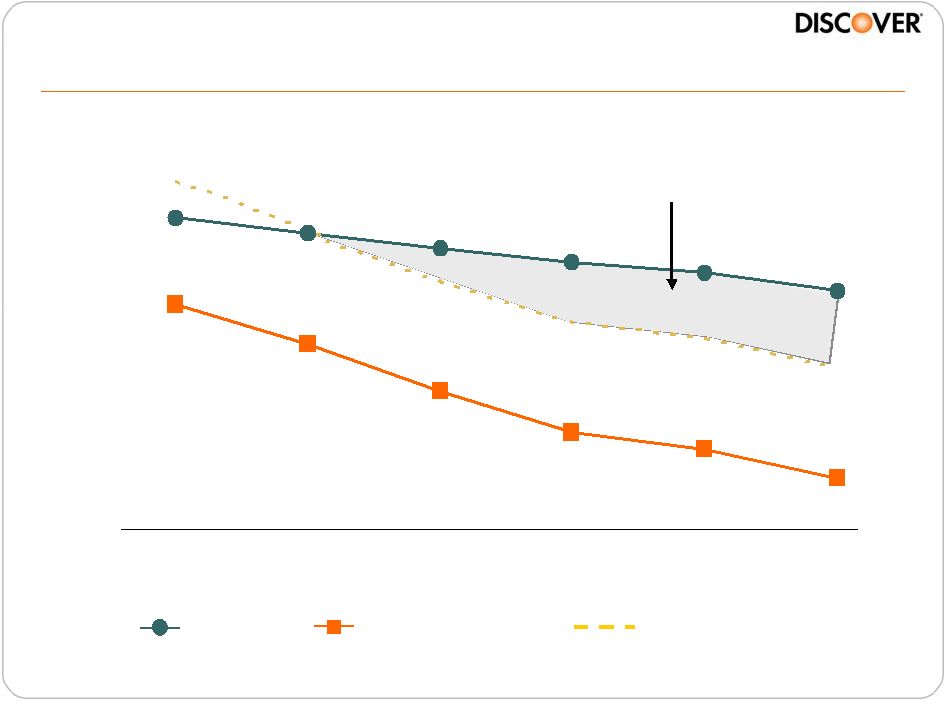
Superior credit capabilities enhance profitability 2007 2008 2009 DFS Industry 20 • First in industry to use tradeline data • Early focus on customer cash flow • Continuous investment in analytics • Disciplined acquisition and account management • New data sources • Trigger based strategies Managed Net Credit Card Charge-off Rate (%) Source: Earnings Releases (1) Note 1. Industry includes AXP, BAC, COF, JPM, & C |
Ongoing refinement of strategies significantly improves performance 21 30+ Delinquency 6 Months After Acquisition 3Q07 3Q08 3Q09 Origination Date Avg Delinquency Balance YOY Change 0% 2% 4% 6% 8% 10% Average Acquisition FICO 737 727 738 1Q08 1Q09 1Q10 Total Contingent Liability (Bn) $228 $193 $170 1Q08 1Q09 1Q10 Note Refer to appendix for reconciliation of non-GAAP financial measures |
Positive indicators of an improving environment 0% 20% 40% 60% 80% 100% Source: Bureau of Labor Statistics Source: National Bankruptcy Research Center 0% 20% 40% 60% 80% 22 Unemployment Rate YOY Change U.S. Bankruptcy Filings YOY Change |
• Ongoing refinement of models and analytic tools • Continued to evaluate and implement new data sources – LTV – home valuation data on customers with a mortgage – ARM – timing and magnitude of resets • Increase customer engagement through manual / judgmental processing of existing and potential customers 23 Innovative strategies to optimize long term profit • Question and challenge everything we do |
Early use of LTV data further reduces risk 24 Loan to Value Source: Trans Union, LTV April 2009 Homeownership Rent, Other Mortgages Own Outright Rent, Other Negative Equity Own Outright Other Mortgages Loan to Value No Additional Treatment Needed Closed Lines Lowered Accounts Actioned |
Getting ahead of the ARM reset wave 25 Source: Credit Suisse RMBS Research Monthly Mortgage Rate Resets ($Bn) $0 $5 $10 $15 $20 $25 $30 $35 $40 $45 Option ARM All Other Mortgage Resets DFS Mortgage Composition Fixed ARM Source: Trans Union, November 2009 |
Judgmental decisioning is a high return investment 26 Every $1 invested generates $10 return. Every $1 invested generates $10 return. As judgmental staffing has increased… 4Q08 1Q10 6x 6x Standard Judgmental …new account card usage has increased… +7% +7% Standard Judgmental +6% +6% …and more portfolio good balances have been retained. Standard Judgmental +9% +9% …new account balances have increased… |
27 • Strong credit performance • Well positioned portfolio • Continued vigilance (LTV, ARM) • Innovative strategies to optimize future growth • Investment in judgmental decisioning Opportunities exist for growth and profit enhancement through credit risk strategies |
Credit Risk Management Jim Panzarino EVP, Chief Credit Risk Officer March 17, 2010 |
Card Issuing Harit Talwar EVP, Card Programs & Chief Marketing Officer March 17, 2010 |
Key takeaways • Discover Card business expected to deliver normalized pre-tax ROA of 2.5% - 3.0% post-CARD Act • Discover well positioned to grow and continue to gain market share leveraging: – Attractive customer base – Expanding merchant acceptance – Leadership position in Rewards, Service and Value 30 |
Key Provisions Discover’s Response • Elimination and/or restrictions on: – Existing balance re-pricing – Future balance re-pricing – Overlimit fees – Late and other fees • Changes in payment hierarchy • Enhanced disclosure requirements • For existing business, re-priced and shifted to variable rates • For new business, modified promotional and standard pricing • Reduced balance transfer volumes • Expanding spend-based revenues • Seize value positioning opportunity – No nuisance fees – Sustain Rewards commitment Response to CARD Act 31 |
Rebalanced portfolio mix 15% 16% 11% 9% 65% 64% 70% 79% 20% 19% 12% 20% 2007 2008 2009 2010F Promo Standard Default 32 Balance Mix Source: Internal data |
Post CARD Act continue to book profitable new accounts 33 Key Initiatives • “As Low As” pricing • Modified promotional pricing • Focus on process enhancements to increase usage and reduce CPA New Account Profitability Notes 1. “Go To” APR Margin – represents difference between contractual non-promotional APR and effective prime rate 2. The percent of balance transfer dollar volume with a promotional rate greater than 12 months 3. Accounts with at least one sales transaction in the first 90 days after account booking 1H 08 2H 09 "Go To" (1) APR Margin 8% 12% Bal Transfer % >12 Months (2) 43% 7% 90 Day Sales Active % (3) 46% 54% Acquisition Cost (indexed to 1H08) (33%) |
Business positioned to deliver target ROA Discover Card Returns (1) Historical 1Q 2010 Normalized Revenue Margin 12.5% 13.5% 12 - 12.5% Principal Charge- offs 5% 9% 5 - 6% Operating Expenses 5% 4% 4 - 4.5% Pre-Tax ROA 2.5% - 3.0% 1% 2.5% - 3.0% (2) (3) • CARD Act impact mitigated by: – Balance mix – Pricing changes – Expanding spend-based revenues • Operating efficiencies allow for investments in growth and marketing • Expect normalized pre-tax returns of 2.5% - 3.0% Notes 1. Revenue margin includes net interest margin and other card-related revenues and fees net of rewards expense. Operating expense % is based on Direct Banking expense ratio 2. Historical represents 10 year average 3. Excludes changes in loan loss reserves 34 |
Key takeaways • Discover Card business expected to deliver normalized pre-tax ROA of 2.5% - 3.0% post-CARD Act • Discover well positioned to grow and continue to gain market share leveraging: – Attractive customer base – Expanding merchant acceptance – Leadership position in Rewards, Service and Value 35 |
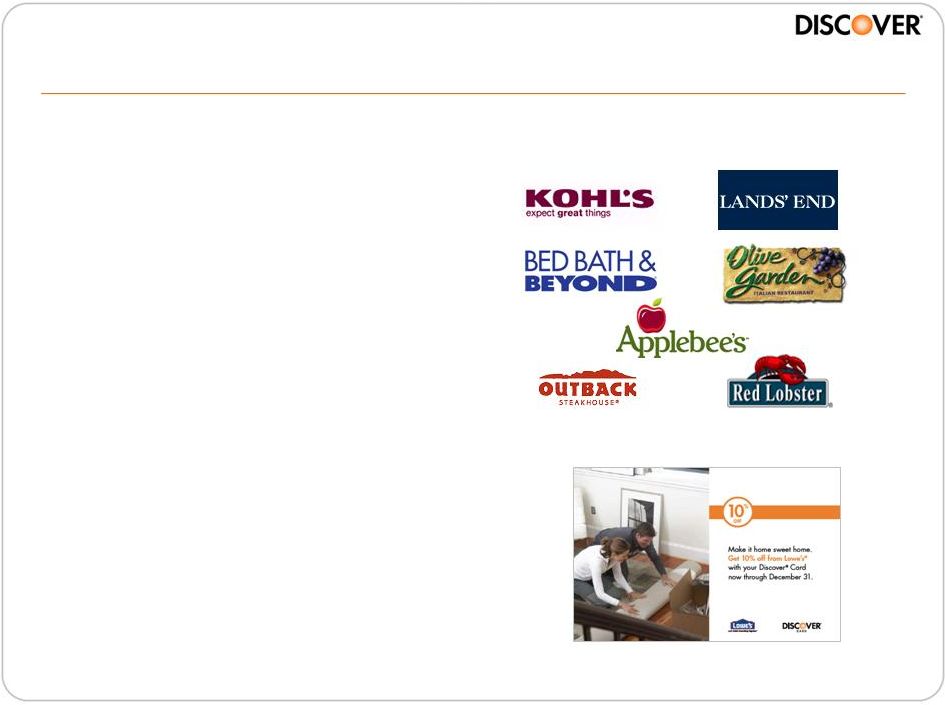
Married with children • Average age: 44 • Average HHI: $97K • 73% married • 21% more likely to have kids • 70% attended college • 80%+ own their home Large, seasoned customer base • 25% of U.S. households • Highest average tenure in industry • Balanced customer base – ~40% revolver / 60% transactor • Geographically diverse Traditional, family focused & responsible • Prioritize dinner with family • Plan for future, avoid splurging • Church and charity activities • Prefer to pay with credit Value and quality • Buy styles built to last • Not easily swayed by others • Kohl’s, Macy’s, Sam’s Club • Chili’s, Olive Garden, and Red Lobster Attractive customer base and target profile 36 Source: Internal Data, MRI / Simmons / TNS |
Brand well positioned Source: Millward Brown Brand & Ad Tracking Survey, 4Q09; Recommend = percent strongly/somewhat agree with statement. Primary cardmembers = those respondents who say they use that brand’s card most often to make purchases. Consideration = percent saying either “it would be my first choice” or “I would seriously consider it.” 30% 32% 38% 38% 40% 44% JPM DFS COF AXP BAC C Consideration (among general population) Recommend to a Friend (among brand’s primary cardmembers) 82% 78% 73% 73% 72% 69% DFS AXP C BAC JPM COF 37 |
56% 61% 65% 4Q07 4Q08 4Q09 Expanding acceptance driving sales 38 Cardmember Perception of Acceptance Source: Brand & Ad Tracking Study, 4Q09, Millward Brown Note: Sales impact based on previously non-accepting and accelerated sign-up of new merchants $1Bn $2Bn $3Bn 2008 2009 2010E Sales Impact “Discover is a card that is accepted everywhere I want to use it” |
Driving growth across customer segments 39 • Brand ambassadors • Nurture / protect • Leverage expanding Acceptance Key Priorities Key Metrics (’09 vs. ’08) • Spend share (1) +120bps • Reinforce Rewards and Service to deepen engagement and shift spend • Leverage expanding Acceptance • Capitalize on competitor missteps • Leverage Rewards, Value, and expanding Acceptance • % Primary (2) +269bps • % Sales Active (3) +750bps • 90-day sales active +400bps • Focus on Brand engagement and usage • Profitable growth Primary Active Inactive New Accounts 1. Spend share represents customer DFS sales as a % of estimated total customer credit card sales –calculated for primary cardmembers 2. Primary cardmembers defined as customers with 15+ transactions in a month; as % of total open & good standing accounts 3. Sales Active accounts defined as customers with at least one sales transaction in a month; as a % of total open & good standing accounts Notes / Source: Internal Data |
40 • Sustainable cash rewards leadership • Driving business results Leveraging our competitive advantages REWARDS SERVICE VALUE |
8% 3% 13% 14% 62% Cash Rewards Airline Miles Gift Cards Gas Rebate Other Reward Preference (1) Best Cash Rewards (2) Notes 1. Among credit card customers who receive rewards 2. Brand Tracker: Monthly survey with 3,000 respondents per quarter; percent unaided brand association with the phrase "best cash rewards” Source: JD Power 2009 Credit Card Satisfaction Study Source: Brand Tracker – 4Q09, Millward Brown Cash Rewards leadership – general population 22% 9% 7% 4% 4% 3% DFS JPM AXP COF C BAC 41 |
42% 55% 63% 65% 70% 84% DFS AXP JPM C BAC COF Source: Brand Tracker – 4Q09, Millward Brown Note: Brand Tracker: monthly survey with 3,000 respondents per quarter, conducted since 1998; % of respondents who somewhat/strongly agree with statement 86% 70% 65% 62% 53% 37% DFS AXP JPM C BAC COF Discover Rewards leadership – primary cardmembers 42 Has Rewards that are Easy to Earn Has Rewards that are Easy to Redeem |
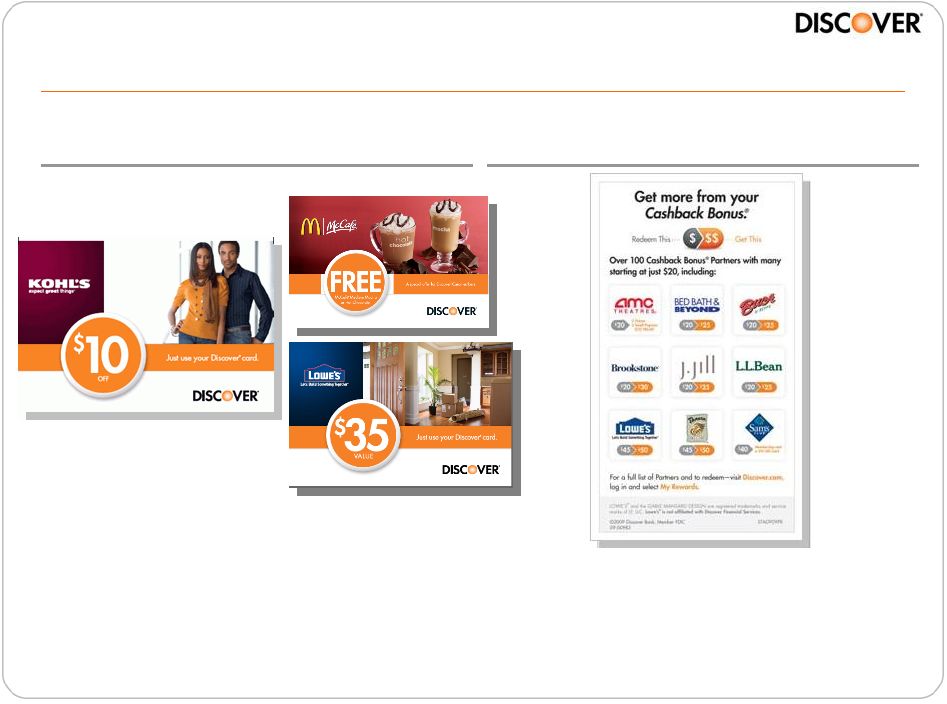
Earn Redeem • Over 275 unique partner relationships • Partner-funded programs more than doubled in 2009. Contributed ~15% incremental Rewards value to our customers Discover Network enhances cash rewards 43 |
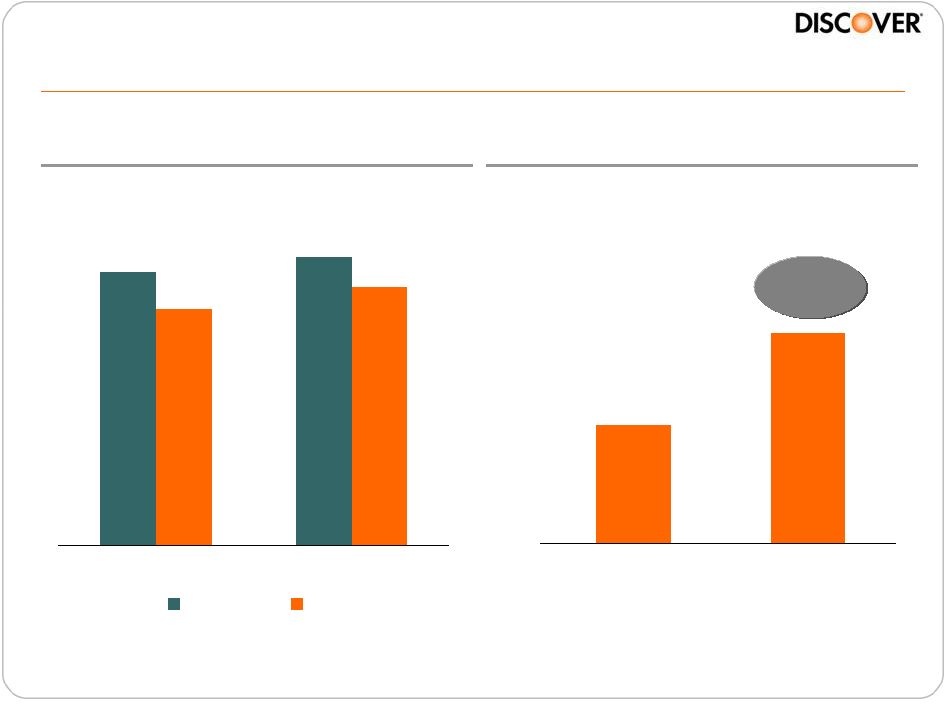
Increasing enrollments while reducing costs 44 Reward Program Enrollments (1) (MM) Rewards Cost (2) (% Sales) 6 8 10 12 14 16 18 20 2005 2006 2007 2008 2009 0.70% 0.72% 0.74% 0.76% 0.78% 0.80% 0.82% 0.84% 2005 2006 2007 2008 2009 Notes 1. Enrollments include 5%, Double and all other programs requiring sign-up 2. Represents Discover Rewards expense as a % of total sales volume |
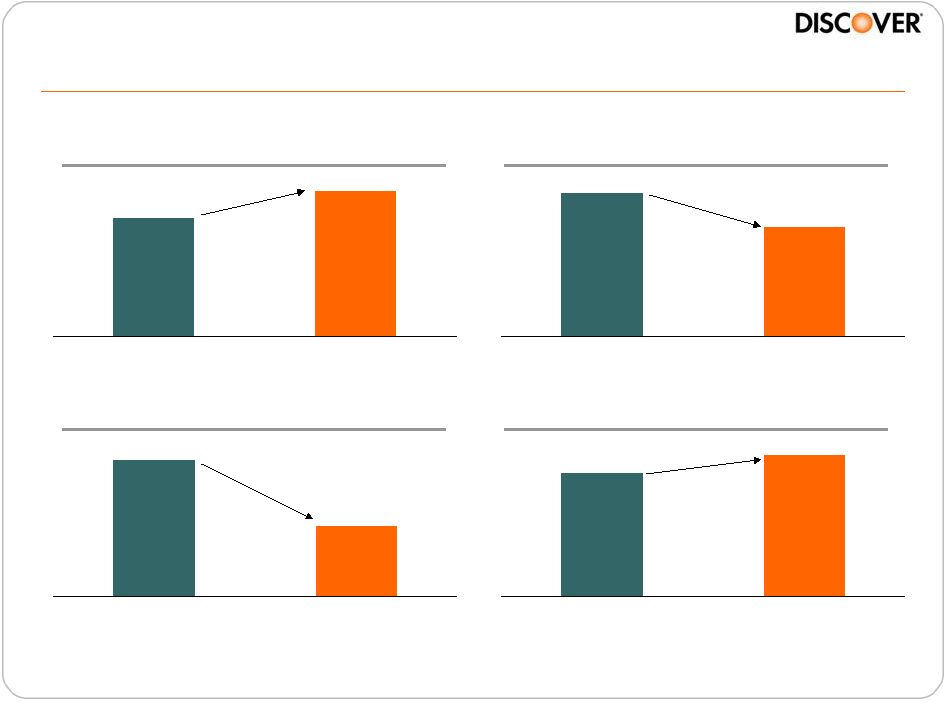
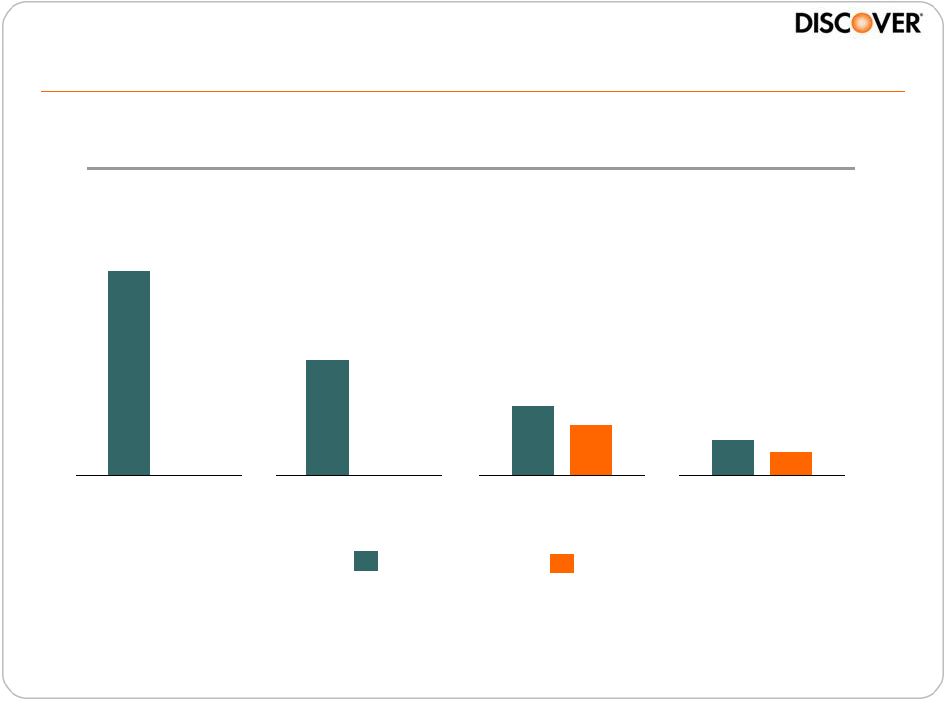
Non-Enrolled Enrolled Rewards enrollment performance Average Annual Sales Charge-off Balance Average Annual PBT Voluntary Attrition Non-Enrolled Enrolled Non-Enrolled Enrolled Non-Enrolled Enrolled 23% (24%) 10% (48%) Note 1. Measured as time series lift in performance before and after enrollment in Rewards programs as compared against a representative group of non-enrollees Source: Internal data analysis, 2009 45 |
46 • Consistent investments • Driving business results Leveraging our competitive advantages REWARDS REWARDS SERVICE VALUE |
Customer service core to brand experience 47 Investments in Call Center Metrics • 100% U.S.-based, average tenure 5+ years • Specialized, industry leading call routing matches customers with target agents • World class (1) first call resolution of 90%+ • Industry leading fee product cross-sell capabilities – 18% penetration vs. industry average of 11% (2) • Key distribution channel – 50% of rewards enrollments – 40% of balance transfer volume Note 1. SQM Benchmark (2008) 2. 3Q 2009 Argus Report |
Online leadership increasingly integral to the business Business Impacts 756 761 761 769 771 802 816 Citi Cards Capital One Bank of America Chase Industry Average American Express Discover Card JD Power – 2009 Discover ranked #1: Web Site Interaction Satisfaction Customer engaged in the channel: • Contribute 75% of the sales volume • Carry 60% of the balances Delivering efficiencies, engagement, usage • 75% of all new customer applications • 62% of rewards redemptions • 50% of rewards enrollments Source: J.D. Power and Associates, 2009 Credit Card Satisfaction Study 48 |
49 • Fair, consistent pricing and credit decisions Leveraging our competitive advantages REWARDS SERVICE VALUE |
Opportunity to claim value leadership 50 • Remain committed to Rewards and Customer Service • Did not introduce nuisance fees • Portfolio quality has allowed balanced approach to credit line and pricing decisions Source: Brand & Ad Tracking Study, 4Q09, Millward Brown Primary Cardmembers Total Population DFS 77 35 AXP 76 34 JPM 68 35 Peer Avg 64 30 BAC 61 26 C 60 27 COF 53 28 Provides Excellent Overall Value (%) |
51 |
Leveraging our competitive advantages 52 Case Study: 4Q 2009 Marketing Case Study: 4Q 2009 Marketing REWARDS SERVICE VALUE |
4Q 2009 Marketing: leveraging Rewards 53 Sales Transfer Offers Sales Transfer Offers Redemption Redemption Offers Offers Earn Programs Earn Programs |
4Q 2009 Marketing: leveraging merchant partners 54 |
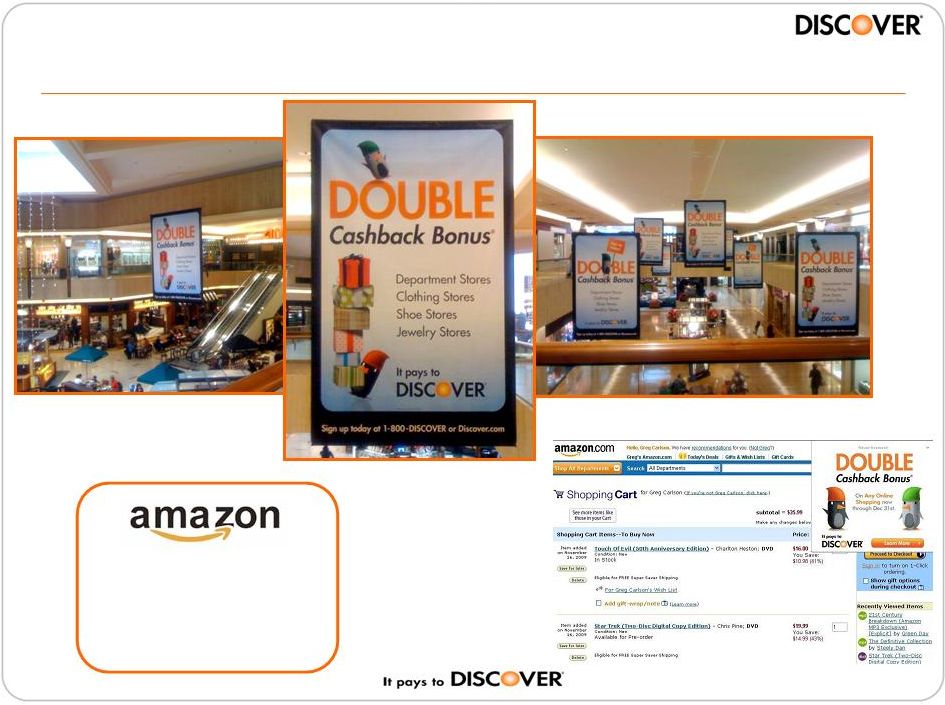
4Q 2009 Marketing: leveraging point of sale Malls Malls $10 Off – Discover cardmember offer Black Friday Home page takeover Cart Marquee unit Pandora/Amazon Partnership 55 Online Online |
4Q 2009 Marketing: leveraging multi-channel advertising Television Television Print Print Radio Radio Strong local market coverage (>30%) with national overlay 56 Online Online |
4Q Calendar Sales Comparison (YOY %) -9.5% -9.1% -3.0% -2.5% 0.1% 2.5% DFS AXP COF BAC C JPM 57 • 8+ billion impressions • Discover Rewards investments higher by 48% • Partner contributions increased 188% • Customer enrollments increased 56% Source: Internal data and public company filings Notes 1. Sales volumes only 2. Reflects sales + cash advance volume 3. Reflects global purchase volume 4. Reflects sales, cash advance + BT volume 4Q 2009 Marketing: results (1) (2) (3) (2) (4) |
Key takeaways • Discover Card business expected to deliver normalized pre-tax ROA of 2.5% - 3.0% post-CARD Act • Discover well positioned to grow and continue to gain market share leveraging: – Attractive customer base – Expanding merchant acceptance – Leadership position in Rewards, Service and Value 58 |
Card Issuing Harit Talwar EVP, Card Programs & Chief Marketing Officer March 17, 2010 |
Personal & Student Loans Deposit Products Carlos Minetti EVP, Consumer Banking & Operations March 17, 2010 |
61 Direct Banking expansion well underway • Expanded into additional lending businesses with attractive economics: – personal loans – student loans • Significantly grown our consumer deposits business • Extended reach of the Discover brand and attracted new customers / segments • Leveraged customer base, marketing & underwriting capabilities, and low cost direct-to-consumer service delivery model |
62 PERSONAL LOANS STUDENT LOANS CONSUMER DEPOSITS |
63 Personal loans are an attractive growth opportunity • Favorable trends in the demand for personal loans – Changing consumer behavior – CARD Act curtails risk based pricing – Sharp decline in alternatives • Compelling value proposition to prospective customers • Leverages Discover’s underwriting competencies • Attractive financial returns with proper risk management |
64 $100Bn+ personal loans market, recent originations impacted by downturn in credit market Source: Experian Information Solutions analysis, 2010 $129.1 $142.6 $136.8 $118.9 2006 2007 2008 2009 $63.1 $67.3 $54.9 $36.2 2006 2007 2008 2009 Receivables (Bn) Loan Originations (Bn) |
Further market growth will be fueled by contraction in personal loan alternatives ~90% decline (Originations – Bn) $0 $20 $40 $60 $80 $100 $120 (New BT – Bn) Source: VISA and MasterCard Supplemental Operational Performance Data 2009, Inside Mortgage Finance study, January 2010 ~60% decline $0 $10 $20 $30 $40 $50 $60 Home Equity Market Visa & MC Cash/BT Volume 65 |
66 Typical Discover Personal Loan customer FICO 740 Annual income $80K Total revolving debt $20K Credit card balances $12K with rates ranging from 16.99% to 20.99% Homeowner Debt consolidation One monthly payment Lower rate & clear timeline to payoff debt Loan of $15K Paid off all outstanding credit card balance Duration – 60 months Fixed APR 13.99% No pre-payment penalties Monthly payment - $350 First year savings $300-$500 Customer Needs Customer Profile Discover Personal Loan Solution |
67 Delivered compelling value proposition and differentiated customer experience • Competitive rates • Personalized experience • Financial control Value Proposition • By invitation only • Judgmental underwriting • Same day creditor payoff Customer Experience |
68 Card industry pricing structure allows us to offer better rates Avg APR Avg Loss Provision Risk based pricing 0% 4% 8% 12% 16% 660-679 680-699 700-719 720-739 740-759 >759 18% Pricing opportunity Source: Argus report 3Q 2009, Fair Isaac card performance data, internal analysis |
69 Disciplined portfolio growth $1.3 $1.4 $1.5 $0.4 $0.6 $0.9 $1.0 $1.2 $1.2 1Q08 2Q08 3Q08 4Q08 1Q09 2Q09 3Q09 4Q09 1Q10 Personal Loan Ending Receivables (Bn) |
Underwriting capabilities have been continuously enhanced • Generic credit bureau score (i.e., FICO) • Income verification for marginal applications • Disposable income criteria • Recent changes in debt levels • Custom risk scores + credit bureau scores • Income, employment verification • Individualized cash flow analysis • Balance build & early delinquency models • LTV / mortgage data 70 |
Credit performance better than industry in all risk segments 13.45% N/A Sub Prime Near Prime Prime Super Prime Industry DFS 7.3% 4.5% 2.4% 1.8% 1.3% Source: TransUnion study 2010 Note: Based on 2008 vintage, industry includes BAC, C, COF, JPM and WFC % of Personal Loans 60+ Days Delinquent 71 N/A |
72 Product is structured to deliver solid financial returns 8.5% 3.0% 4% 1.5% Net Interest Income Loss Provision Operating Expenses ROA Target |
73 PERSONAL LOANS STUDENT LOANS CONSUMER DEPOSITS |
74 Attractive opportunity for growth in student loans • Growing demand driven by rising college enrollments and cost of attendance • Adding new, upwardly mobile customers to Discover • Leveraging Discover’s strengths in marketing and underwriting • Solid financial returns on private loans |
75 Market growth driven by higher enrollment and tuition costs Source: College Board, Trends in Student Aid (2009) 65 66 73 84 18 21 22 12 2005-06 2006-07 2007-08 2008-09 Private Federal $83 $87 $95 $96 5.0% CAGR • ~19MM students enrolled in colleges and graduate schools • Tuition costs have increased at 6% CAGR, faster than inflation Industry Loan Originations by Academic Year (Bn) |
76 Value proposition addresses needs of customers and schools Financial Aid Office 100% solution Simplicity Graduation rewards Student & Parents Reliable lender Responsible borrowing Support school preferences |
77 • 750+ schools have Discover on preferred lender list • 50% of top 100 colleges • 50% of top 50 medical / MBA schools • DiscoverStudentLoans.com • Search (Yahoo, Google) • Comparison sites Diversified acquisition model creates marketing advantage School Channel Online • Discover customers • Broad market • Schools Print Note: Top 100 colleges and top 50 medical/MBA schools based on U.S. News annual rankings |
Federal Loan Ending Receivables (Bn) 78 Established strong presence as a provider of federal loans • Government sets interest rate and guarantees against losses • Department of Education administers ECASLA programs that create liquidity for new loan origination • Discover is eligible to participate in ECASLA $1.9 $0.1 $0.2 $0.4 $0.5 $1.0 $1.3 |
79 Legislative changes proposed for federal loans • Student Aid and Fiscal Responsibility Act (SAFRA) – Requires all new federal loans be originated via Direct Loan program – Invests in Pell Grant scholarships over next 10 years – Reengineers the Perkins Loan Program – Establishes College Access Challenge Grant Program • SAFRA passed in the House in Sept 2009, no action taken in the Senate • Schools are voluntarily migrating to Direct Loan program |
80 Steady growth and future opportunities in private loans $0.3 $0.5 $0.8 $0.3 $0.1 $<0.1 $0.6 • Became top 5 provider of private loans in 2009 • Established position through: – superior customer service – strong school relationships – competitive pricing • High rate of repeat borrowers Private Loan Ending Receivables (Bn) |
High quality portfolio points to strong credit performance FICO Distribution Superior Portfolio Profile • Only 4-year colleges and graduate schools • Proprietary underwriting criteria • High cosigner rate • 100% certified by school • 100% disbursed through school Source: Fitch rating/DBRS, industry data for 2002-07 ABS pools 4% 13% 25% 58% 19% 26% 27% 28% <670 670-710 711-750 750+ Industry Discover 81 |
82 Private loans positioned to deliver solid returns 4.5% 2.5% 1% 1% Net Interest Income Loss Provision Operating Expenses ROA Target |
83 PERSONAL LOANS STUDENT LOANS CONSUMER DEPOSITS |
84 Deposits business is an important component of our Direct Banking model • Direct-to-consumer deposits is the fastest growing segment of the deposits market • Valued source of liquidity with attractive characteristics for asset/liability management • Competitive all-in costs given the direct delivery model • Offers additional relationship building opportunities for Discover |
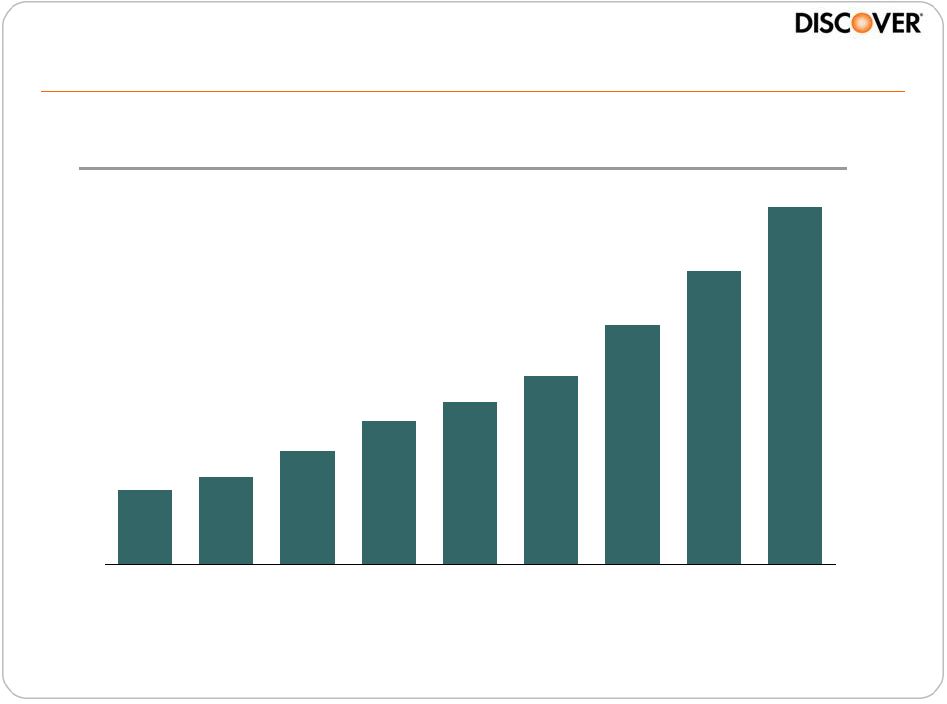
85 Direct banks positioned to take share from traditional banks Overall industry deposits in 2Q 2009 Overall industry deposits in 2Q 2009 100% 100% = = $8.4Tr $8.4Tr (1) (1) Direct bank deposits $0.2Tr (3%) Brokered deposits 3 $0.7Tr (8%) All other deposits (2) $2.3Tr (27%) Deposits largely tied to brick & mortar Source: First Manhattan Consulting Group study; FDIC reports as of 6/30/09 and selected news articles Notes 1. Total deposits taken from sum of branch office data from 2Q 2009 and credit union data; totals within 5% of Fed Flow of Funds total deposit values from schedules L.109, L.114, and L.115 (Commercial Banking, Savings Institutions, and Credit Unions) 2. All other deposits includes: corporate, municipal, escrow, other consumer/small business deposits in HQ branches, etc. 3. Sum of all brokered deposits from regulated depositories as of 2Q 2009 $17 $30 $45 $65 $104 $150 $200 $245 $294 2001 2002 2003 2004 2005 2006 2007 2008 2009 YTD 2001-2009 CAGR: 43% Overall Deposits Mix Direct Deposits Market Growth |
86 Value proposition resonates with consumers Competitive rates Convenience Confidence |
87 Customer service channels reinforce ease and convenience Superior customer service Convenient online access + |
88 Unique acquisition model creates competitive advantage • Lower acquisition costs • Higher loyalty • More attractive demographics • Overall brand awareness Broad market Affinity partners Discover card relationship |
89 Strong quarter over quarter growth % of DFS funding 6% 7% 9% 11% 13% 15% 19% 22% 25% $6.9 $8.1 $10.2 $12.6 $14.8 $6.1 $4.8 $3.8 $3.2 1Q08 2Q08 3Q08 4Q08 1Q09 2Q09 3Q09 4Q09 1Q10 Direct-to-Consumer Deposit Growth (Bn) |
90 Portfolio exhibits desirable loyalty attributes At acquisition 6 months post acquisition +120% higher Source: First Manhattan Consulting Group study, 2010, internal data (% of balance renewing) 12-month CD Renewal Average Savings Balance 63% 69% 77% 73% 1st maturity 2nd maturity Branch DFS |
91 Deposits priced comparably to other funding options 12-month CD 36-month CD 3.37% 60-month CD 3.05% Direct-to-Consumer posted rates ABS AAA benchmark DFS Rates vs. Derived Benchmark (March 2010) 1.59% 1.36% f 2.38% 2.37% f 1. ABS AAA derived benchmark rates based on indicative ABS pricing. Derived benchmark rates adjusted to reflect CD renewal behavior 2. Direct-to-consumer deposit rates as of March 05, 2010 Notes |
Consumer Lending and Deposits well positioned for future expansion in the marketplace • Achieved impressive results in Consumer Lending and Deposits – ~$15Bn in direct-to-consumer deposits – ~$4Bn in consumer lending receivables • Extended the Discover Brand beyond credit cards • Established a solid foundation for further growth • Well positioned to capitalize on shifting market dynamics and consumer behaviors 92 |
Personal & Student Loans Deposit Products Carlos Minetti EVP, Consumer Banking & Operations March 17, 2010 |
Payment Services Diane Offereins EVP, Payment Services March 17, 2010 |
• Domestic PIN debit network with global ATM acceptance • $109Bn volume • 4,400+ issuers • Domestic acceptance network for Discover proprietary cards and third-party issuers • $97Bn volume • 30+ issuers Payment Services – a unique set of assets Note: Balances as of February 28, 2010; volume based on the trailing four quarters ending 1Q10 • Global payments network targeting upscale customers, frequent travelers and corporate clients • $26Bn volume • 50 franchises • 185 countries/territories 95 |
Alliances with regional players – value chain Expanding the payments network globally through alliances Issuers Network Alliances Consumers Network Network Merchants Acquirers 96 |
Key priorities are acceptance and volume Acceptance: • Completing implementation of new merchant acquiring model in U.S. • Achieving card acceptance across Discover and Diners Club networks • Extending global cash access for Diners Club and Discover cards through PULSE • Broadening international footprint Drive Volume Growth: • Leverage network to grow Discover Card • Expand existing issuer programs • Increase issuer base • Build non-traditional volume 97 |
Expanding U.S. acceptance to drive higher sales • Signed agreements with 100+ merchant acquirers representing 98%+ of U.S. merchants • Included with 97% of all new merchant sales in 2009 • Enabled over 1MM previous non-acceptors • Building awareness through cost effective marketing • 30 day active merchants over the last three years has increased 21%+ 77% 90% 97% 77% 79% 85% 2Q06 2Q08 4Q10E Acquirer Enabled Merchants Merchant Stated Acceptance Sources 1. Internal company reports 2. GfK Roper (1) (2) 98 |
Executing on Diners Club Network interoperability • Moved 97%+ of Diners Club North American volume from foreign-issued DCI cards onto Discover Network • Enable Discover Card acceptance at Diners Club locations outside the U.S. – Implementing / validating 43+ countries – Focusing on top 25 markets for U.S. travelers • Goal of 125 countries/territories by year-end 2010 99 |
Building a global ATM network Global Cash Access Build Out Core Volume Opportunities: • Diners Club • Discover international ATM usage • Expand PULSE to Canada / Mexico Emerging Volume Opportunities: • DCI Local / Local ATM acceptance • Network-to-Network programs • Expansion of PULSE cards Global ATM Network • Over 675,000 ATMs • Coverage in over 70 countries and continuing expansion Achieving Global Acceptance 100 |
Beyond interoperability Diners Club Coverage Latin America – 2.0 MM Asia Pacific – 3.3 MM EMEA – 2.0 MM Discover Network Coverage North America – 7.7 MM Asia Pacific – 2.7 MM Coverage (Service Establishments) 101 |
Key priorities are acceptance and volume Acceptance: • Completing implementation of new merchant acquiring model in U.S. • Achieving card acceptance across Discover and Diners Club networks • Extending global cash access for Diners Club and Discover cards through PULSE • Broadening international footprint Drive Volume Growth: • Leverage network to grow Discover Card • Expand existing issuer programs • Increase issuer base • Build non-traditional volume 102 |
Leveraging the closed loop model to drive volume Value-added marketing programs drive additional volume: • Cashback Bonus ® • Shop Discover • Discover Extras 103 |
• Flexible and highly scalable • Creating robust alliances • Variety of innovative products • Payroll / other prepaid • Selective retail co-brands • Closed loop / campus prepaid • Alternative payment providers Discover Network embracing emerging opportunities/technology 104 |
• Deliver superior “all-in” value proposition • Focus on securing PIN debit relationships based on exclusivity • Enhance and expand fee-based products and services • Invest in technology to maintain “best in class” service offerings 1.9 2.3 2.7 2.9 2006 2007 2008 2009 Number of Transactions (Bn) PULSE – expand and optimize 105 |
Investing in Diners Club ® volume growth 106 |
Diners Club – reinvigorated North America 22% LATAM 15% EMEA 36% Asia Pacific 27% Note Includes all Diners Club branded volume Volume by Region (1) Priorities • Completion of interoperability • Accelerating franchise management and business development • Expand issuance in emerging markets • Continue to secure existing and new corporate business • Sharing of intellectual property 107 |
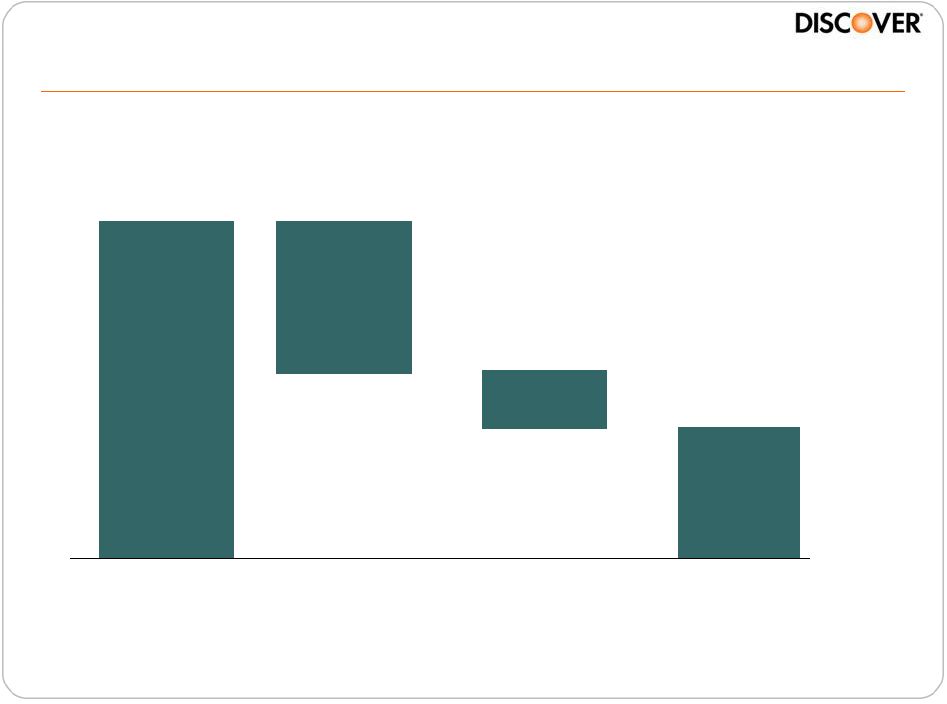
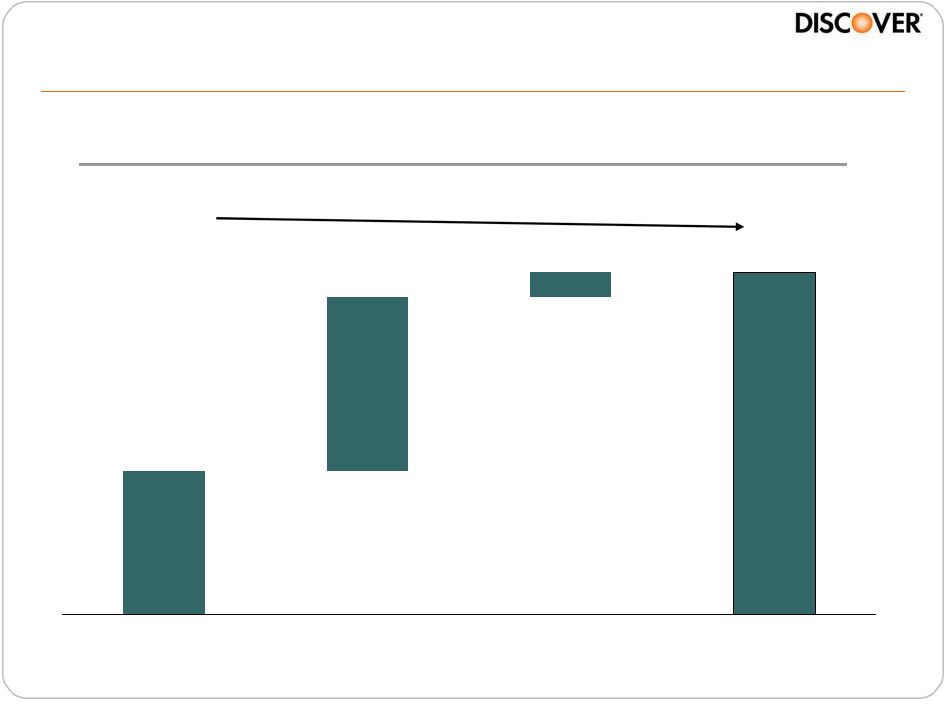
Strong growth in volume and profits $29 $37 $81 2006 2007 2008 2009 $107 $107 94 96 60 70 86 106 $79 $146 $163 $186 $221 91 90 85 79 1 3 5 6 6 109 26 13 $232 2004 2005 2006 2007 2008 2009 V/MA Antitrust ruling Volume Growth by Business (Bn) Strong Profit Growth (MM) (TPI) (Proprietary) Note For fiscal years ending November 30 108 |
Entrenched Industry Model: American mega-brands dominate the market Emerging Global Model: Alliances of key regional players are creating the new global network Discover is poised for the rise of the regional players A new global network model 109 |
BC Card Background: • Largest domestic network in South Korea • 11 Member banks and 2.62 million merchants • ~2 billion transactions processed in 2008 “Our new alliance with Discover opens the door to providing BC Card customers with more opportunities to make purchases and access cash around the world, especially in the U.S.” – Chang Hyung-duk President and CEO of BC Card Opportunity: • BC Card members to gain global acceptance outside S. Korea via Discover, DCI & PULSE • Transactions in S. Korea routed on the BC Card Network • BC Card to expand ATM acceptance for Discover /PULSE / Diners in S. Korea Global opportunity seized 110 |
Payment Services Diane Offereins EVP, Payment Services March 17, 2010 |
Financial Review Roy Guthrie EVP, Chief Financial Officer March 17, 2010 |
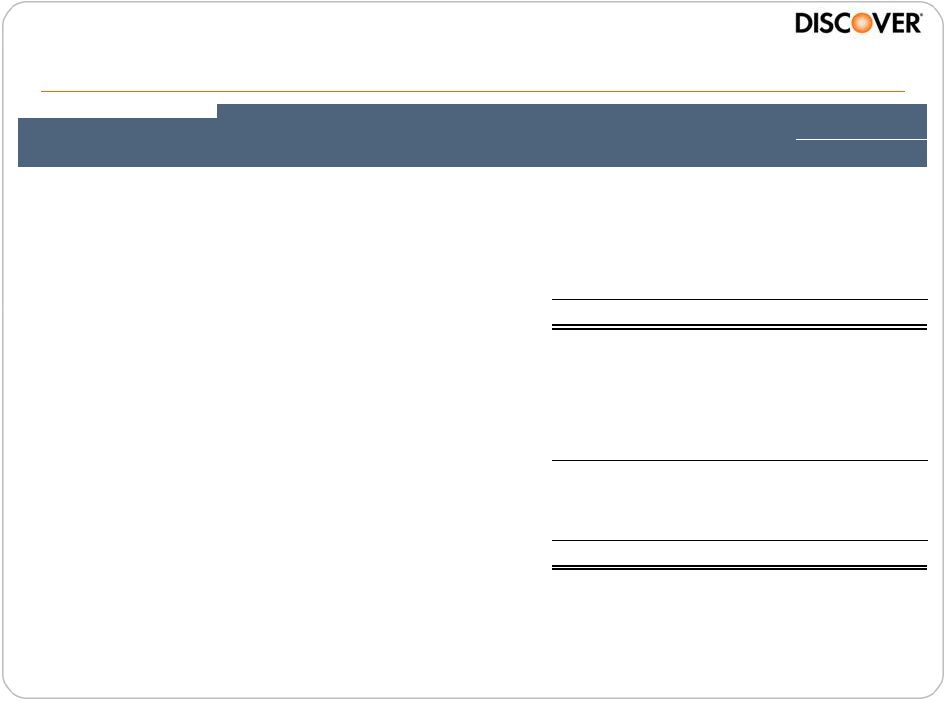
Financial performance As Adjusted 1Q10 1Q09 $ Net Interest Income $1,145 $1,176 ($31) Other Operating Revenue 546 547 (1) Total Revenue $1,691 $1,723 ($32) Net Charge-offs $1,082 $829 $253 Reserve Changes build/(release) 305 648 (343) Total Provision for Loan Loss $1,387 $1,477 ($90) Total Operating Expense 475 559 (84) Pretax Income ($171) ($313) $142 Income Tax Expense (67) (117) 50 Net Income (Loss) ($104) ($196) $92 EPS ($0.22) ($0.41) $0.19 YOY Change Note: 1Q09 amounts have been adjusted to remove the impact of the Visa and MasterCard antitrust litigation settlement. 1Q09 amounts have also been adjusted to reflect the impact that FASB Statements No. 166 and 167 (as defined in the appendix) would have had on the financial information presented. For a reconciliation of “as adjusted” non-GAAP financial measures, see appendix. 113 |
Reserve Balance Loan loss reserves 5.31% 5.05% 30+ delinquency rate declined 25bps 30+ delinquency rate declined 25bps 114 Note Refer to appendix for reconciliation of non-GAAP financial measures $1.8 $2.1 $0.3 $4.2 4Q09 FAS 166/167 Reserve Actions 1Q10 |
Conservative balance sheet As Adjusted 1Q10 1Q09 $ Assets Cash, Cash Equivalents & Investment Securities $13.6 $9.0 $4.6 Loan Receivables 50.1 50.9 (0.8) Allowance for Loan Losses (4.2) (3.4) (0.8) Other Assets 7.3 4.7 2.6 Total Assets $66.8 $61.2 $5.6 Liabilities Deposits $35.1 $28.3 $6.8 Borrowings 22.4 25.4 (3.0) Other Accrued Expenses & Liabilities 2.3 2.5 (0.2) Total Liabilities $59.8 $56.2 $3.6 Equity 7.0 5.0 2.0 Total Liabilities and Equity $66.8 $61.2 $5.6 YOY Change 115 Note: 1Q09 amounts have been adjusted to remove the impact of the Visa and MasterCard antitrust litigation settlement. 1Q09 amounts have also been adjusted to reflect the impact that FASB Statements No. 166 and 167 (as defined in the appendix) would have had on the statements had been effective for the quarter. For additional information and a reconciliation of “as adjusted” non-GAAP financial measures, see appendix. |
Contingent liquidity sources Liquidity Reserve Committed Credit ABCP Open Lines Fed Discount Window 2Q10 – 1Q11 Maturities (Bn) 2.4 3.4 5.6 3.5 $22.1 $18.6 $12.6 $7.7 4.0 1.5 Liquidity (1Q10) Maturities (2Q10-1Q11) 4Q10 3Q10 2Q10 1Q11 116 |
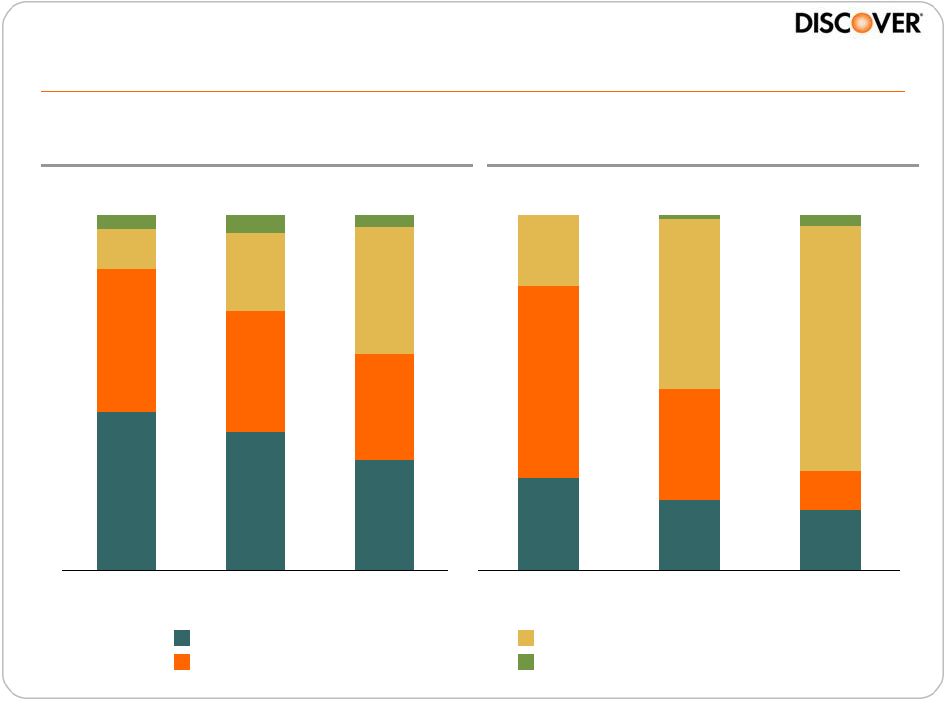
Funding mix 45% 39% 31% 40% 34% 30% 22% 36% 11% 5% 3% 4% 2008 2009 2010E 31% 11% 17% 20% 26% 54% 20% 69% 48% 1% 3% 2008 2009 2010E Asset Backed Securitizations Brokered Deposits Direct-to-Consumer and Affinity Deposits Other Year End Balance Mix Issuance Mix $55 $57 $21 $18 117 |
13.2% 8.6% 9.7% 9.8% 10.3% 10.7% 10.8% DFS JPM C COF BAC AXP Strong capital ratios 4Q09 Tier 1 Capital Ratio (1) Notes Refer to appendix for reconciliation of non-GAAP financial measures 1. Pro forma capital ratios including the impact of FAS166/167, DFS Tier 1 capital includes TARP. Sourced from 2009 10-K. For FAS 166 / 167 adjustments, if range provided, uses midpoint of the range. 2. Total capital includes $350 million of sub debt that Discover Bank intends to issue in the second quarter, subject to market conditions DFS 1Q10 Capital Ratios – Pro Forma Excluding TARP • Total capital (2) 14.4% • Tier 1 capital 10.9% • Tier 1 common 10.9% • Tangible common equity/ 8.1% tangible assets Excl. TARP 118 |
119 Well positioned for growth • Discover represents unique set of direct banking and payment services assets • See opportunities for profitable growth and share gains leveraging: – Rewards – Service – Value – Direct-to-consumer banking platform – Growing global acceptance – Network alliances • Solid foundation of credit management capabilities and strong capital and liquidity reserve |
Appendix 120 |
Reconciliation of GAAP to Non-GAAP data 121 Financial Performance (in millions) As Reported (GAAP) Managed Adjustments Managed (Non-GAAP) Adjustments As Adjusted (Non-GAAP) Net Interest Income 503 $ 662 $ 1,165 $ 11 $ 1,176 $ Net Charge-offs 434 396 830 - 830 Reserve Changes build/(release) 504 - 504 144 648 Total Provision for Loan Loss 938 396 1,334 144 1,478 Antitrust Litigation Settlement 475 - 475 (475) - Other Operating Revenue 715 (266) 449 98 547 Total Operating Revenue 1,190 (266) 924 (377) 547 Total Operating Expense 559 - 559 - 559 Pre-tax Income 196 - 196 (510) (314) Income Tax Expense 76 - 76 (193) (117) Net Income (Loss) 120 $ - $ 120 $ (317) $ (197) $ Earnings Per Share 0.25 $ - $ 0.25 $ (0.66) $ (0.41) $ 1Q 2009 |
Reconciliation of GAAP to Non-GAAP data (cont’d) 122 Balance Sheet (in billions) As Reported (GAAP) Managed Adjustments Managed (Non-GAAP) Adjustments As Adjusted (Non-GAAP) Assets Cash, Cash Equivalents and Investment Securities 10.0 $ - $ 10.0 $ (1.0) $ 9.0 $ Total Loan Receivables 28.1 22.8 50.9 - 50.9 Total Allowance for Loan Loss (1.9) - (1.9) (1.5) (3.4) Other Assets 4.4 (0.2) 4.2 0.5 4.7 Total Assets 40.6 $ 22.6 $ 63.2 $ (2.0) $ 61.2 $ Liabilities Total Deposits 28.3 $ - $ 28.3 $ - $ 28.3 $ Total Borrowings 3.8 22.6 26.4 (1.0) 25.4 Other Accrued Expenses and Liabilities 2.5 - 2.5 - 2.5 Total Liabilities 34.6 22.6 57.2 (1.0) 56.2 Equity 6.0 - 6.0 (1.0) 5.0 Total Liabilities and Equity 40.6 $ 22.6 $ 63.2 $ (2.0) $ 61.2 $ 1Q 2009 |
1Q 2010 4Q 2009 Tangible Common Equity ("TCE") (in millions) Common Equity (GAAP) 5,854 $ 7,277 $ Less: Goodwill and Intangibles (450) (451) Less: Adjustments - (1,332) TCE (as adjusted) 5,404 $ 5,494 $ TCE as a % of Tangible Assets 8.8% 15.0% Less: Adjustments - (6.8) TCE as a % of Tangible Assets as adjusted (non-GAAP) 8.1% 8.2% TCE as a % of Total Loans (GAAP) 12.8% 31.2% Less: Adjustments - (19.5) TCE as a % of Total Loans as adjusted (non-GAAP) 11.8% 11.7% 123 Note: Tangible common equity ("TCE"), a non-GAAP financial measure, represents common equity less goodwill and intangibles. Other financial services companies may also use TCE and definitions may vary, so we advise users of this information to exercise caution in comparing TCE of different companies. TCE is included because management believes that common equity excluding goodwill and intangibles is a more meaningful valuation to investors of the true net asset value of the company. Reconciliation of GAAP to Non-GAAP data (cont’d) |
2010 Financial Community Briefing March 17, 2010 |