Exhibit 99.1
2014 Financial Community Briefing
February 27, 2014
©2014 DISCOVER FINANCIAL SERVICES
Notice
The following slides are part of a presentation by Discover Financial Services (the “Company”) and are intended to be viewed as part of that presentation. No representation is made that the information in these slides is complete.
Company financial data presented herein is based on a calendar year. As previously reported, the Company changed its fiscal year end from November 30 to December 31 of each year, effective beginning with the 2013 fiscal year. For historical calendar year financial data, see the Company’s Current Report on Form 8-K dated March 5, 2013 and the Company’s Annual Report on Form
10-K for the year ended December 31, 2013.
The information provided herein includes certain non-GAAP financial measures. The reconciliations of such measures to the comparable GAAP figures are included at the end of this presentation, which is available on the Company s website at www.discoverfinancial.com.
The presentation contains forward-looking statements. You are cautioned not to place undue reliance on forward-looking statements, which speak only as of the date on which they are made, which reflect management’s estimates, projections, expectations or beliefs at that time, and which are subject to risks and uncertainties that may cause actual results to differ materially. For a discussion of certain risks and uncertainties that may affect the future results of the Company, please see “Special Note Regarding Forward-Looking Statements,” “Risk Factors,” “Business – Competition,” “Business – Supervision and Regulation” and “Management’s Discussion and Analysis of Financial Condition and Results of Operations” in the Company’s Annual Report on Form 10-K for the year ended December 31, 2013 which is available on the Company’s website and the SEC’s website. The Company does not undertake to update or revise forward-looking statements as more information becomes available.
We own or have rights to use the trademarks, trade names and service marks that we use in conjunction with the operation of our business, including, but not limited to: Discover®, PULSE®, Cashback Bonus®, Discover Cashback CheckingSM, Discover it®, Discover® Network and Diners Club International®. All other trademarks, trade names and service marks included in this presentation are the property of their respective owners.
Agenda
David Nelms
CHAIRMAN & CHIEF EXECUTIVE OFFICER
Roger Hochschild
PRESIDENT & CHIEF OPERATING OFFICER
David Nelms
CHAIRMAN & CHIEF EXECUTIVE OFFICER
Roger Hochschild
PRESIDENT & CHIEF OPERATING OFFICER
Mark Graf
EVP & CHIEF FINANCIAL OFFICER
Strategy
U.S. Card
Direct Banking Products
Payment Services
Break
Financials
Q&A

2014 Financial Community Briefing
Strategy
David Nelms
Chairman & Chief Executive Officer
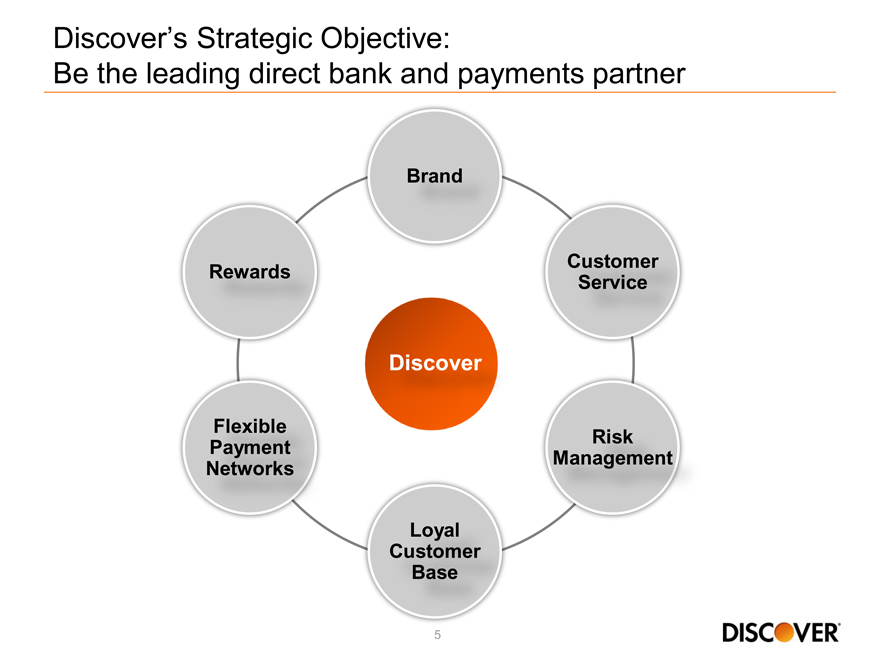
Discover’s Strategic Objective:
Be the leading direct bank and payments partner
Brand
Customer Rewards Service
Discover
Flexible
Risk Payment Management Networks
Loyal Customer Base
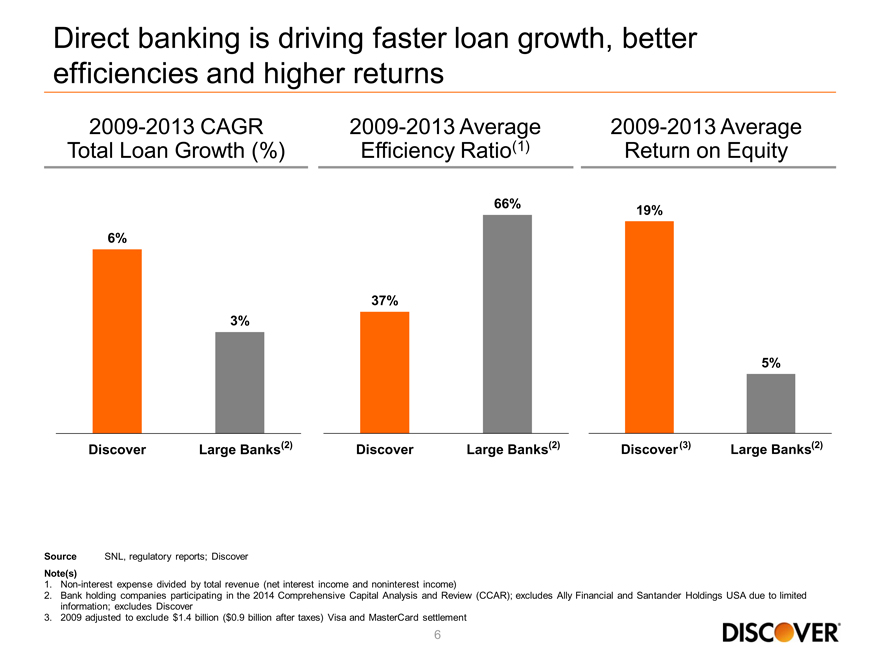
Direct banking is driving faster loan growth, better efficiencies and higher returns
2009-2013 CAGR Total Loan Growth (%)
2009-2013 Average Efficiency Ratio(1)
2009-2013 Average Return on Equity
6%
3%
37%
66%
19%
5%
Discover Large Banks(2) Discover Large Banks(2) Discover(3) Large Banks(2)
Source SNL, regulatory reports; Discover
Note(s)
1.
Non-interest expense divided by total revenue (net interest income and noninterest income)
2.
Bank holding companies participating in the 2014 Comprehensive Capital Analysis and Review (CCAR); excludes Ally Financial and Santander Holdings USA due to limited
information; excludes Discover
3.
2009 adjusted to exclude $1.4 billion ($0.9 billion after taxes) Visa and MasterCard settlement
6
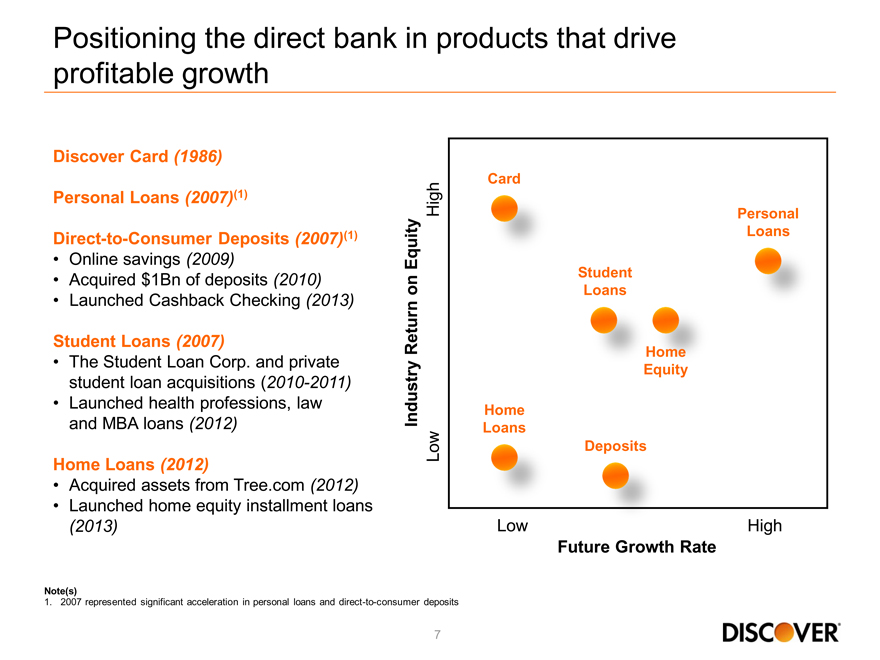
Discover Card (1986)
Personal Loans (2007)(1)
Direct-to-Consumer Deposits (2007)(1)
Online savings (2009)
Acquired $1Bn of deposits (2010)
Launched Cashback Checking (2013)
Student Loans (2007)
The Student Loan Corp. and private student loan acquisitions (2010-2011)
Launched health professions, law and MBA loans (2012)
Home Loans (2012)
Acquired assets from Tree.com (2012)
Launched home equity installment loans
(2013)
Industry Return on Equity
Low High
Card
Personal Loans
Student Loans
Home Equity
Home Loans
Deposits
Low High
Future Growth Rate
Note(s)
1. 2007 represented significant acceleration in personal loans and direct-to-consumer deposits
7
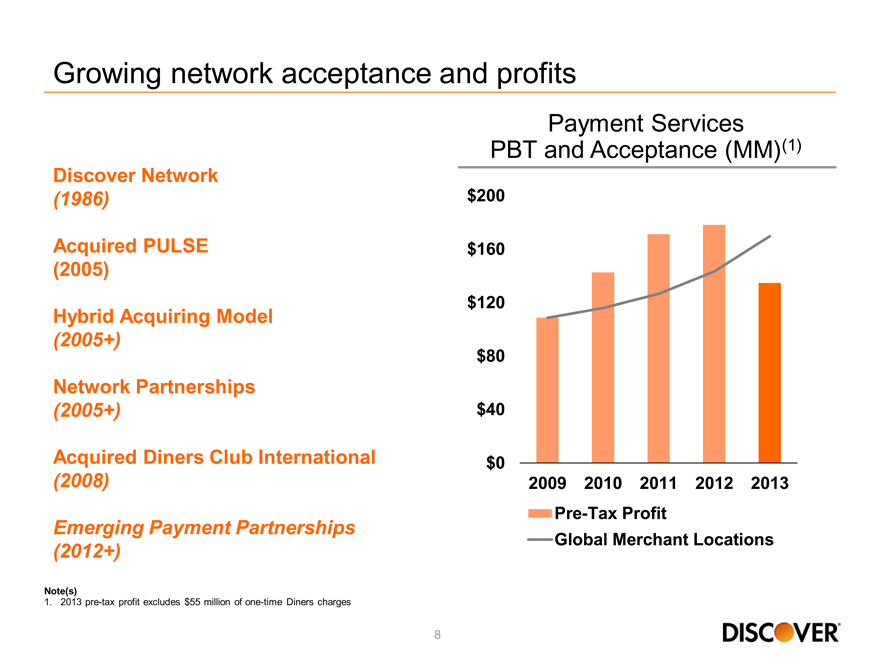
Growing network acceptance and profits
Discover Network
(1986)
Acquired PULSE (2005)
Hybrid Acquiring Model
(2005+)
Network Partnerships
(2005+)
Acquired Diners Club International
(2008)
Emerging Payment Partnerships (2012+)
Note(s)
1. 2013 pre-tax profit excludes $55 million of one-time Diners charges
Payment Services PBT and Acceptance (MM)(1)
$200 $160 $120 $80 $40 $0
2009 2010 2011 2012 2013
Pre-Tax Profit
Global Merchant Locations
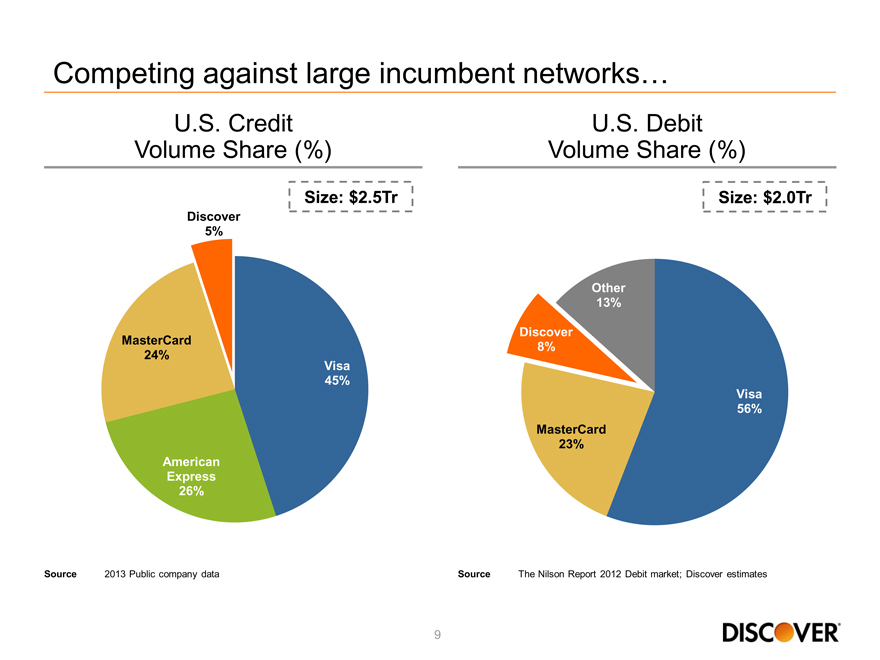
Competing against large incumbent networks…
U.S. Credit Volume Share (%)
U.S. Debit Volume Share (%)
Discover 5%
Size: $2.5Tr
MasterCard
24% Visa 45%
American Express 26%
Source 2013 Public company data
Size: $2.0Tr
Other 13%
Discover 8%
Visa 56% MasterCard 23%
Source The Nilson Report 2012 Debit market; Discover estimates
9
10
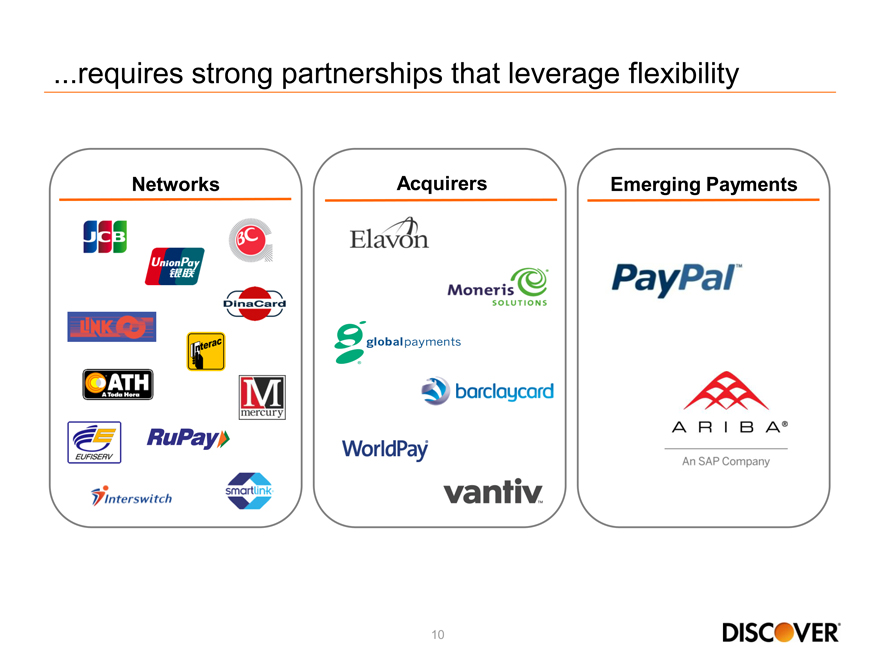
...requires strong partnerships that leverage flexibility
Networks
Acquirers
Emerging Payments
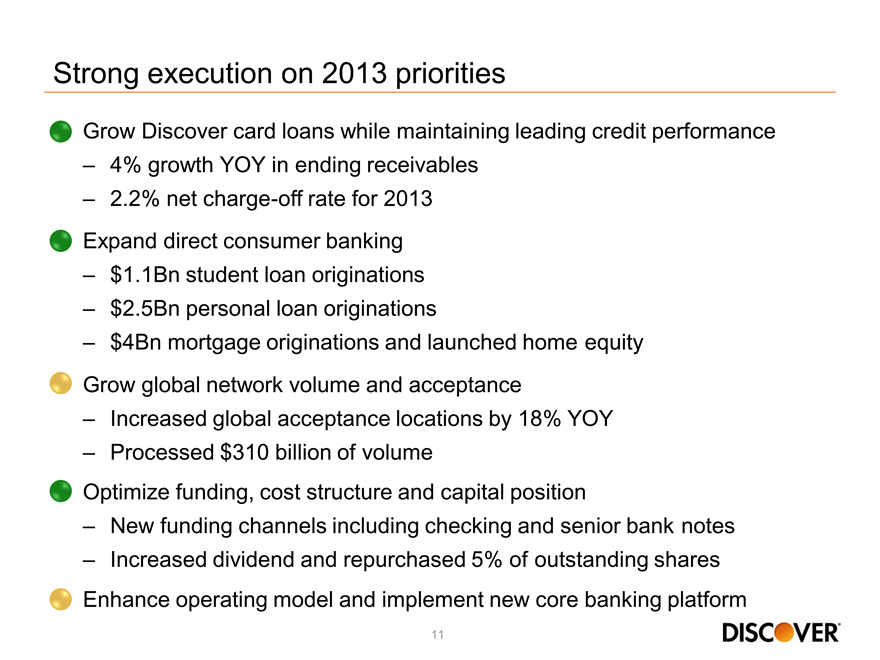
Strong execution on 2013 priorities
Grow Discover card loans while maintaining leading credit performance
– 4% growth YOY in ending receivables
– 2.2% net charge-off rate for 2013 Expand direct consumer banking
– $1.1Bn student loan originations
– $2.5Bn personal loan originations
– $4Bn mortgage originations and launched home equity Grow global network volume and acceptance
– Increased global acceptance locations by 18% YOY
– Processed $310 billion of volume
Optimize funding, cost structure and capital position
– New funding channels including checking and senior bank notes
– Increased dividend and repurchased 5% of outstanding shares Enhance operating model and implement new core banking platform
11
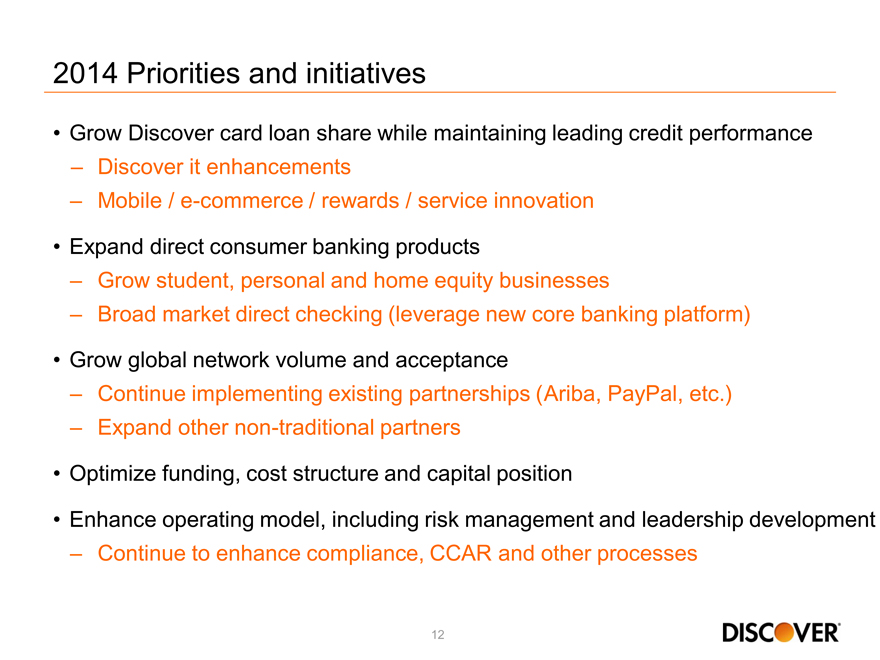
2014 Priorities and initiatives
Grow Discover card loan share while maintaining leading credit performance
– Discover it enhancements
– Mobile / e-commerce / rewards / service innovation
Expand direct consumer banking products
– Grow student, personal and home equity businesses
– Broad market direct checking (leverage new core banking platform)
Grow global network volume and acceptance
– Continue implementing existing partnerships (Ariba, PayPal, etc.)
– Expand other non-traditional partners
Optimize funding, cost structure and capital position
Enhance operating model, including risk management and leadership development
– Continue to enhance compliance, CCAR and other processes
12
2014 Financial Community Briefing
U.S. Card
Roger Hochschild
President & Chief Operating Officer
Leveraging unique assets and capabilities as a prime-focused card lender
Large and loyal customer base
Exceptional customer experience across online, mobile and phone interactions
Cash rewards leadership leveraging proprietary network
Strong loan growth through existing customers and new accounts (YOY):
– 4% growth in loans
‒ 100bps increase in wallet share with customers(1)
‒ 9% increase in new accounts
Note(s)
1. Wallet share is the amount of customer loans with Discover versus other cards in wallet as of October 2013; share based upon Argus and credit bureau data
14
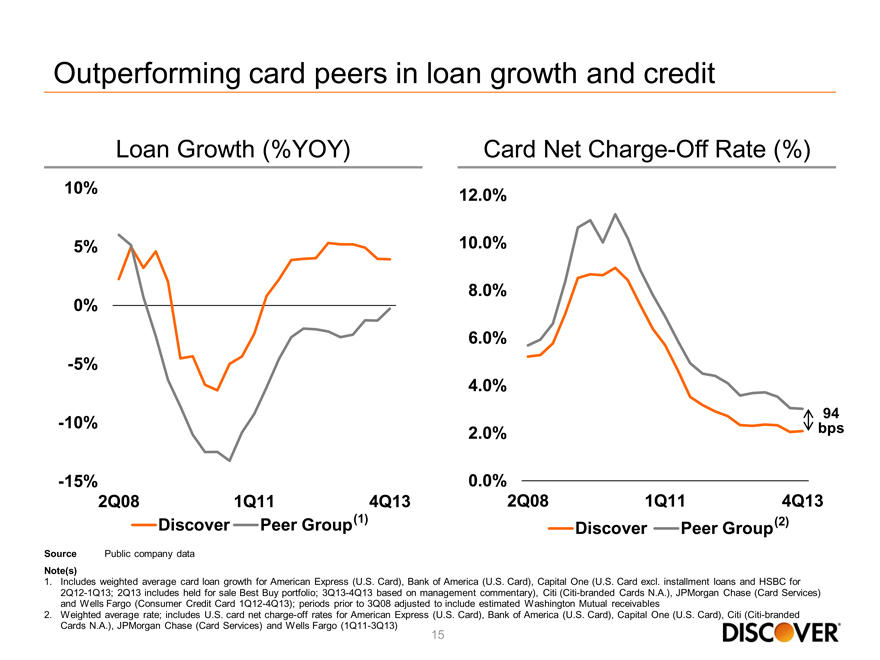
Outperforming card peers in loan growth and credit
Loan Growth (%YOY) Card Net Charge-Off Rate (%)
10% 5% 0% -5% -10% -15%
2Q08 1Q11 4Q13
Discover Peer Group(1)
12.0% 10.0% 8.0% 6.0% 4.0% 2.0% 0.0%
2Q08 1Q11 4Q13 Discover Peer Group(2)
Source Public company data
Note(s)
1. Includes weighted average card loan growth for American Express (U.S. Card), Bank of America (U.S. Card), Capital One (U.S. Card excl. installment loans and HSBC for 2Q12-1Q13; 2Q13 includes held for sale Best Buy portfolio; 3Q13-4Q13 based on management commentary), Citi (Citi-branded Cards N.A.), JPMorgan Chase (Card Services) and Wells Fargo (Consumer Credit Card 1Q12-4Q13); periods prior to 3Q08 adjusted to include estimated Washington Mutual receivables
2. Weighted average rate; includes U.S. card net charge-off rates for American Express (U.S. Card), Bank of America (U.S. Card), Capital One (U.S. Card), Citi (Citi-branded Cards N.A.), JPMorgan Chase (Card Services) and Wells Fargo (1Q11-3Q13)
15
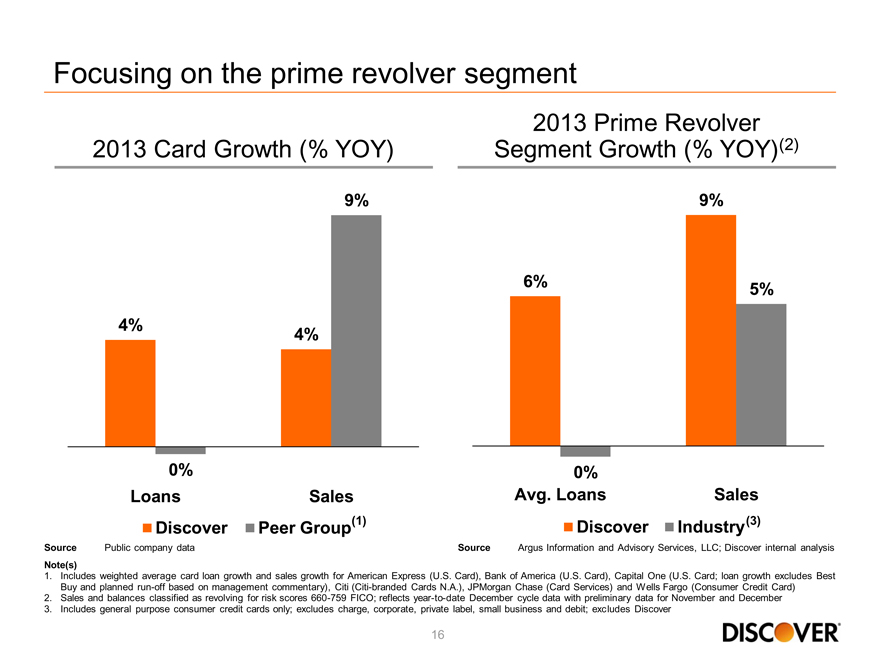
Focusing on the prime revolver segment
2013 Prime Revolver 2013 Card Growth (% YOY) Segment Growth (% YOY)(2)
9% 9%
6% 5% 4% 4%
0% 0%
Loans Sales Avg. Loans Sales
Discover Peer Group(1) Discover Industry(3)
Source Public company data Source Argus Information and Advisory Services, LLC; Discover internal analysis
Note(s)
1. Includes weighted average card loan growth and sales growth for American Express (U.S. Card), Bank of America (U.S. Card), Capital One (U.S. Card; loan growth excludes Best Buy and planned run-off based on management commentary), Citi (Citi-branded Cards N.A.), JPMorgan Chase (Card Services) and Wells Fargo (Consumer Credit Card)
2. Sales and balances classified as revolving for risk scores 660-759 FICO; reflects year-to-date December cycle data with preliminary data for November and December
3. Includes general purpose consumer credit cards only; excludes charge, corporate, private label, small business and debit; excludes Discover
16
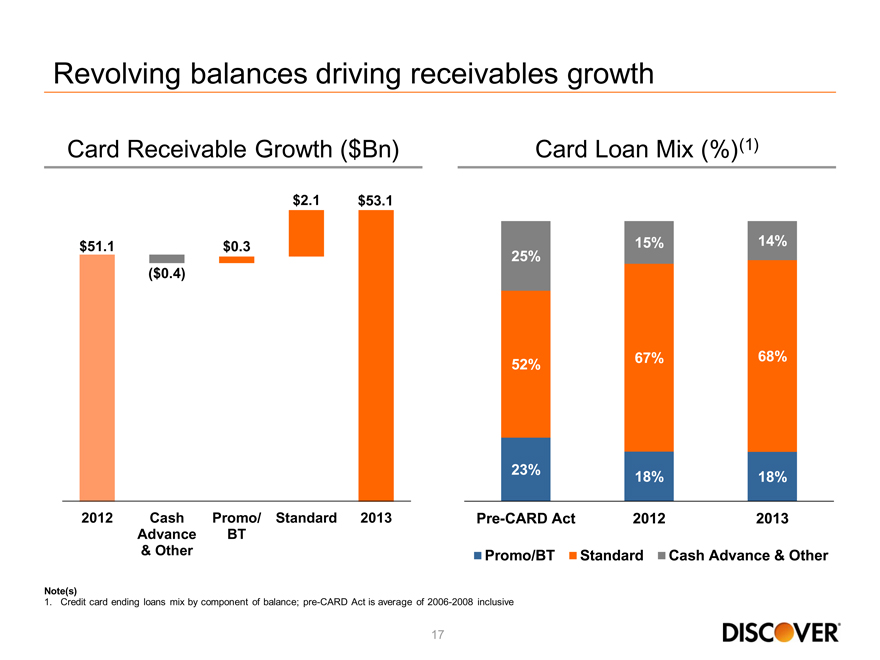
Revolving balances driving receivables growth
Card Receivable Growth ($Bn) Card Loan Mix (%)(1)
$2.1 $53.1
$51.1 $0.3 15% 14% 25%
($0.4)
67% 68% 52%
23%
18% 18%
2012 Cash Promo/ Standard 2013 Pre-CARD Act 2012 2013 Advance BT
& Other Promo/BT Standard Cash Advance & Other
Note(s)
1. Credit card ending loans mix by component of balance; pre-CARD Act is average of 2006-2008 inclusive
17
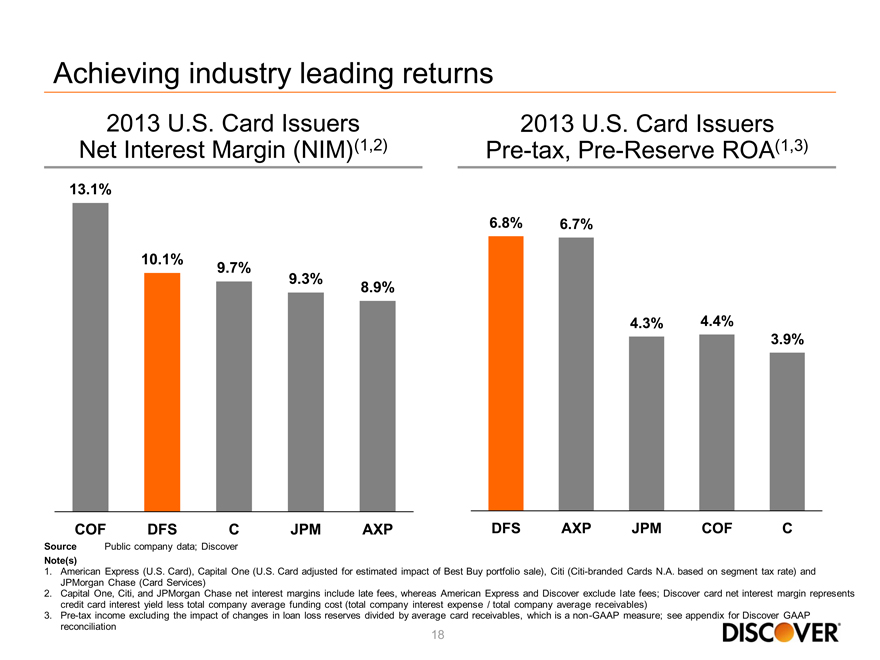
Achieving industry leading returns
2013 U.S. Card Issuers 2013 U.S. Card Issuers Net Interest Margin (NIM)(1,2) Pre-tax, Pre-Reserve ROA(1,3)
13.1%
6.8% 6.7%
10.1%
9.7%
9.3%
8.9%
4.3% 4.4%
3.9%
COF DFS C JPM AXP DFS AXP JPM COF C
Source Public company data; Discover
Note(s)
1. American Express (U.S. Card), Capital One (U.S. Card adjusted for estimated impact of Best Buy portfolio sale), Citi (Citi-branded Cards N.A. based on segment tax rate) and JPMorgan Chase (Card Services)
2. Capital One, Citi, and JPMorgan Chase net interest margins include late fees, whereas American Express and Discover exclude late fees; Discover card net interest margin represents credit card interest yield less total company average funding cost (total company interest expense / total company average receivables)
3. Pre-tax income excluding the impact of changes in loan loss reserves divided by average card receivables, which is a non-GAAP measure; see appendix for Discover GAAP reconciliation
18
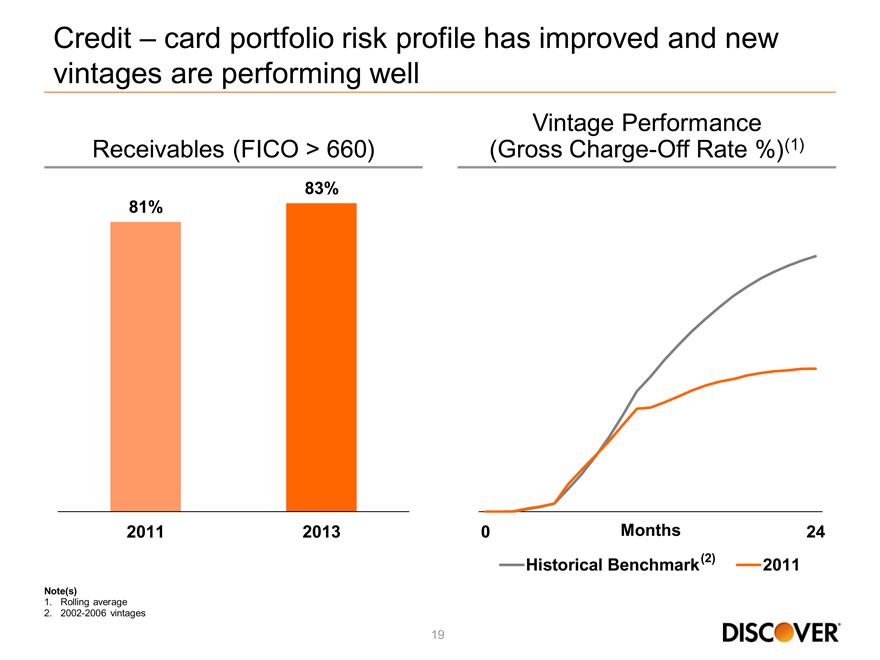
Credit – card portfolio risk profile has improved and new vintages are performing well
Vintage Performance Receivables (FICO > 660) (Gross Charge-Off Rate %)(1)
81%
83%
2011 2013
024 Months
Historical Benchmark(2) 2011
Note(s)
1. Rolling average
2. 2002-2006 vintages
19
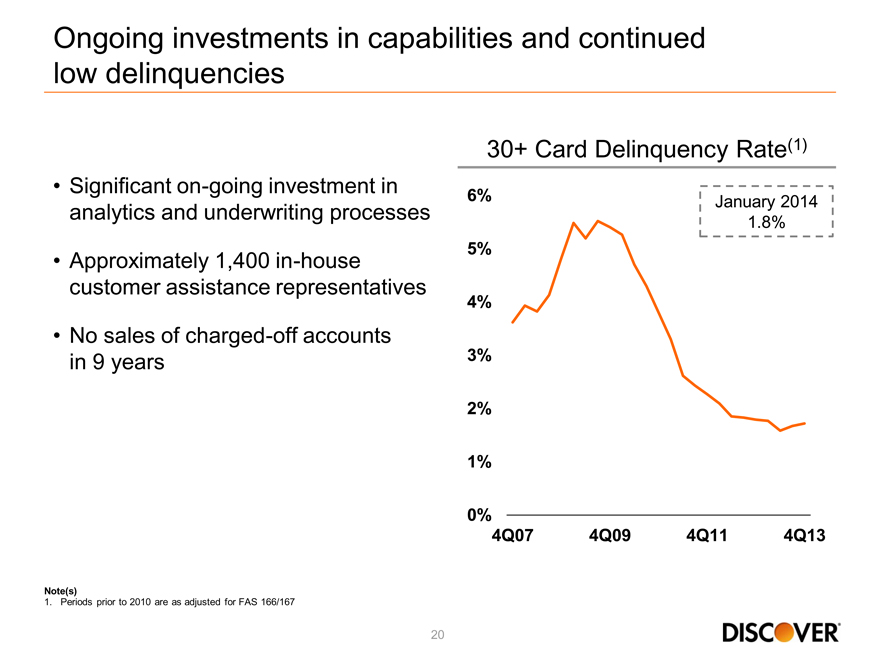
Ongoing investments in capabilities and continued low delinquencies
Significant on-going investment in analytics and underwriting processes
Approximately 1,400 in-house customer assistance representatives
No sales of charged-off accounts in 9 years
30+ Card Delinquency Rate(1)
6% 5% 4% 3% 2% 1% 0%
4Q07 4Q09 4Q11 4Q13
January 2014 1.8%
Note(s)
1. Periods prior to 2010 are as adjusted for FAS 166/167
20
Accelerating new customer acquisition through Discover it
21% increase in application volume
83% of applications submitted on-line
9% increase in new accounts
21% fewer customers with a balance transfer
Note(s)
– 2013 year-over-year comparison
21
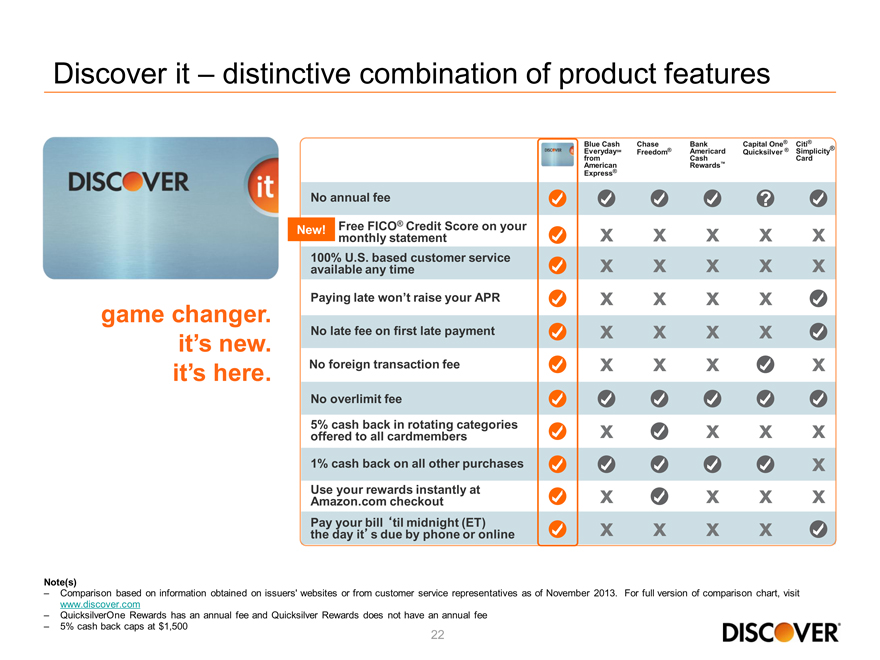
Discover it – distinctive combination of product features
game changer. it’s new. it’s here.
Blue Cash chase Capital One® Citi®
Every daySM Freedom® BankAmeri card Quicksilver ®
fromAmerican CashRewardstm SimplicityCard
ExpressR
No annual fee
New! Free FICO® Credit Score on your
monthly statement x x x x x
100% U.S. based customer service
available any time x x x x x
Paying late won’t raise your APR x x x x
No late fee on first late payment x x x x
No foreign transaction fee x x x x
No overlimit fee
5% cash back in rotating categories
offered to all cardmembers x x x x
1% cash back on all other purchases x
Use your rewards instantly at
Amazon.com checkout x x x x
Pay your bill ‘til midnight (ET)
the day it’s due by phone or online x x x x
Note(s)
– Comparison based on information obtained on issuers’ websites or from customer service representatives as of November 2013. For full version of comparison chart, visit www.discover.com
– QuicksilverOne Rewards has an annual fee and Quicksilver Rewards does not have an annual fee
– 5% cash back caps at $1,500
22
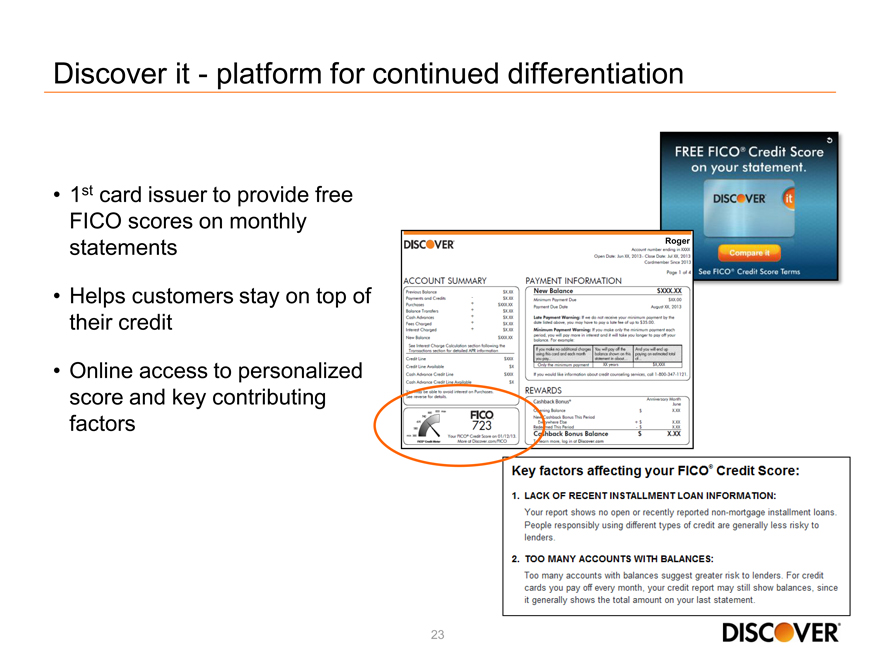
Discover it - platform for continued differentiation
1st card issuer to provide free FICO scores on monthly statements
Helps customers stay on top of their credit
Online access to personalized score and key contributing factors
23
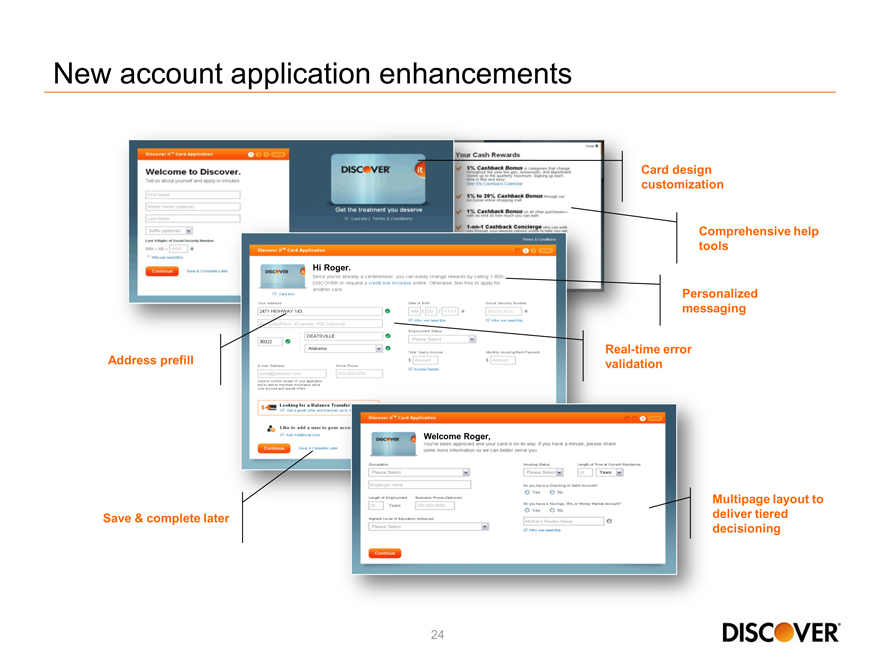
New account application enhancements
Card design
customization
Comprehensive help
tools
Hi Roger.
Personalized
messaging
Real-time error
Address prefill validation
Welcome Roger,
Multipage layout to
Save & complete later deliver tiered
decisioning
Welcome to Discover
24
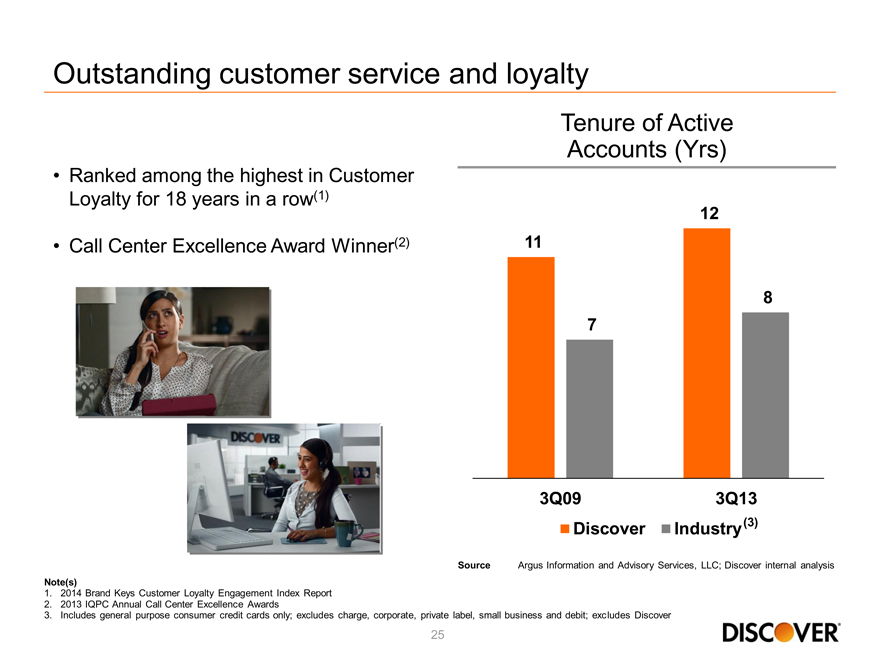
Outstanding customer service and loyalty
Tenure of Active Accounts (Yrs)
Ranked among the highest in Customer Loyalty for 18 years in a row(1)
Call Center Excellence Award Winner(2)
12 11
8 7
3Q09 3Q13 Discover Industry(3)
Source Argus Information and Advisory Services, LLC; Discover internal analysis
Note(s)
1. 2014 Brand Keys Customer Loyalty Engagement Index Report
2. 2013 IQPC Annual Call Center Excellence Awards
3. Includes general purpose consumer credit cards only; excludes charge, corporate, private label, small business and debit; excludes Discover
25
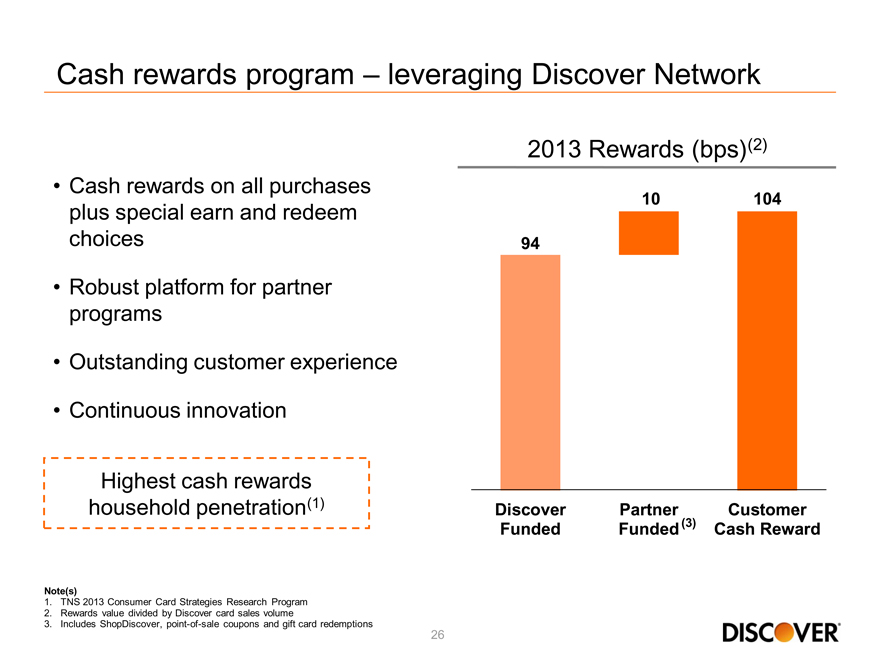
Cash rewards program – leveraging Discover Network
Cash rewards on all purchases plus special earn and redeem choices
Robust platform for partner programs
Outstanding customer experience
Continuous innovation
Highest cash rewards household penetration(1)
2013 Rewards (bps)(2)
10 104
94
Discover Partner Customer
Funded Funded (3) Cash Reward
Note(s)
1. TNS 2013 Consumer Card Strategies Research Program
2. Rewards value divided by Discover card sales volume
3. Includes ShopDiscover, point-of-sale coupons and gift card redemptions
26
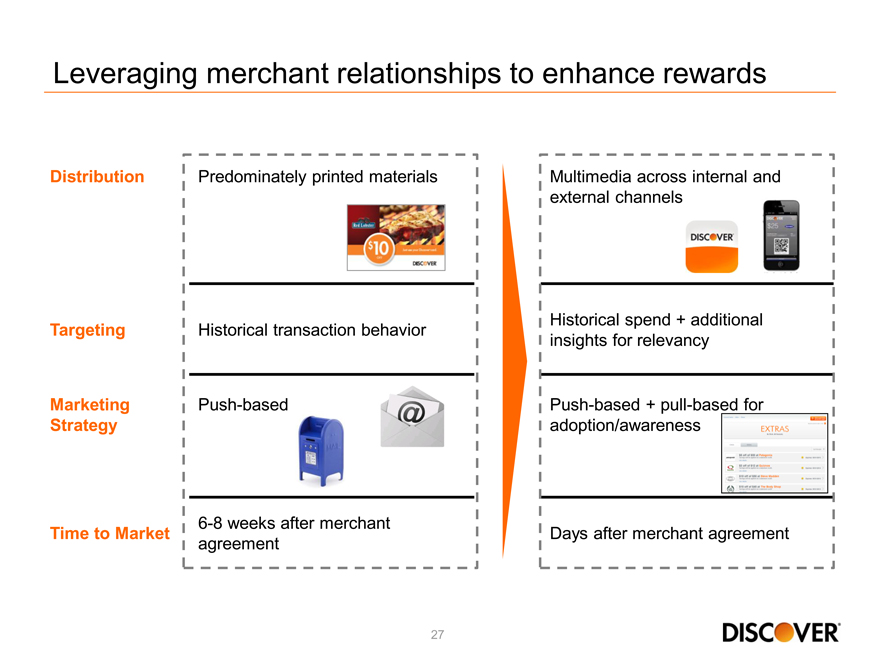
Leveraging merchant relationships to enhance rewards
Distribution Predominately printed materials Multimedia across internal and
external channels
Historical spend + additional
Targeting Historical transaction behavior insights for relevancy
Marketing Push-based Push-based + pull-based for
Strategy adoption/awareness
6-8 weeks after merchant
Time to Market Days after merchant agreement
agreement
27
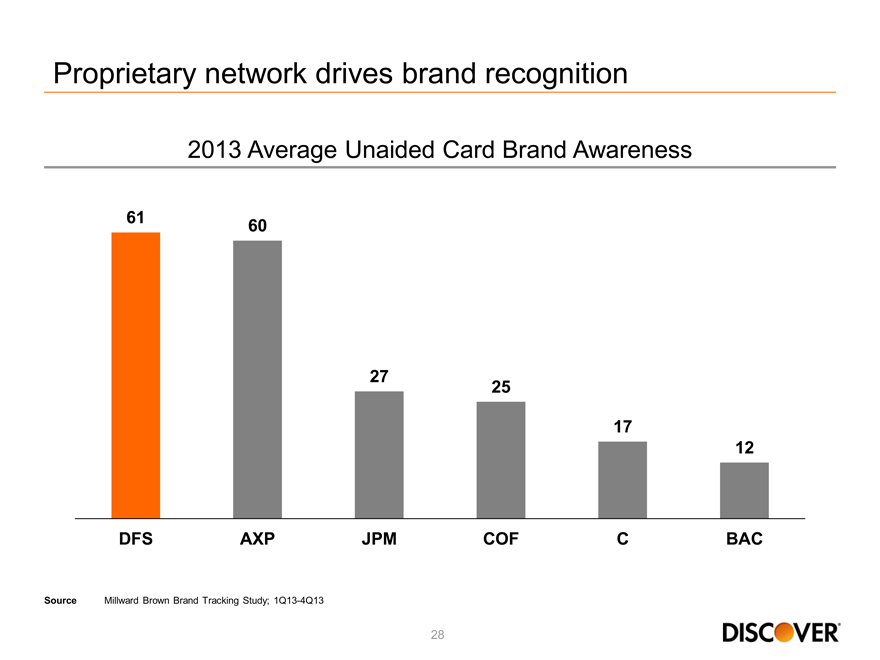
Proprietary network drives brand recognition
2013 Average Unaided Card Brand Awareness
61 60
27 25
17
12
DFS AXP JPM COF C BAC
Source Millward Brown Brand Tracking Study; 1Q13-4Q13
28

Strengthening the Discover brand through advertising and sponsorships
Key 2013 Sponsorships
National Hockey League
Discover Orange Bowl
Bowl Championship Series
Six Flags
29
Leveraging unique assets and capabilities as prime-focused card lender
Brand positioning
Leading credit risk management
Leadership in cash rewards leveraging payments network
Outstanding customer service and online/mobile
Products and features that differentiate
30

2014 Financial Community Briefing
Direct Banking Products
David Nelms
Chairman & Chief Executive Officer
Leveraging unique capabilities to diversify assets and funding
Grew private student loans and personal loans YOY
– 5% growth in private student loans ($1.1Bn of originations)
27% growth in personal loans (~$2.5Bn of originations)
Continued expansion with launch of home equity installment loans
Optimized deposit customer mix to reduce rate sensitivity
Launched Cashback Checking (cross-sell only)
32
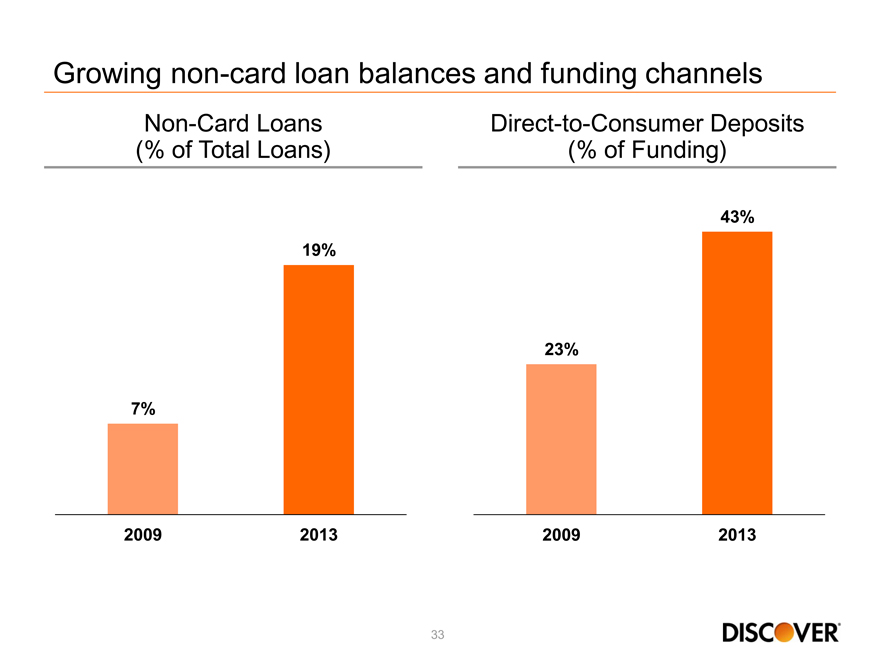
Growing non-card loan balances and funding channels
Non-Card Loans Direct-to-Consumer Deposits
(% of Total Loans)(% of Funding)
43%
19%
23%
7%
2009 2013 2009 2013
33
Private student loans are an attractive asset for Discover
Addresses funding gaps in Federal loan programs
The universe of private student loan providers has shrunk
Differentiated value proposition to students and parents (zero origination fees, competitive pricing, rewards)
Cosigners are involved in overall education financial planning
Private student loans have long duration and relatively low credit losses compared to other unsecured loans
Provides brand exposure to an upwardly mobile customer base
34
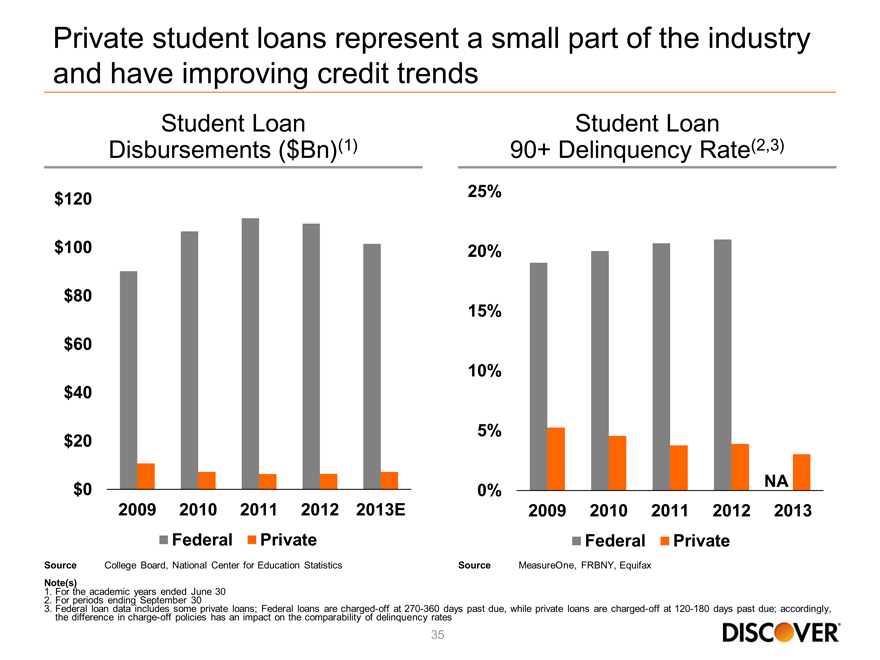
Private student loans represent a small part of the industry and have improving credit trends
Student Loan Student Loan Disbursements ($Bn)(1) 90+ Delinquency Rate(2,3)
$120 25%
$100 20%
$80 15% $60 10% $40
5% $20
NA
$0 0%
2009 2010 2011 2012 2013E 2009 2010 2011 2012 2013 Federal Private Federal Private
Source College Board, National Center for CBVEducation Statistics Source MeasureOne, FRBNY, Equifax
Note(s)
1. For the academic years ended June 30
2. For periods ending September 30
3. 2. Federal loan data includes some private loans; Federal loans are charged-off at 270-360 days past due, while private loans are charged-off at 120-180 days past due; accordingly, the difference in charge-off policies has an impact on the comparability of delinquency rates
35
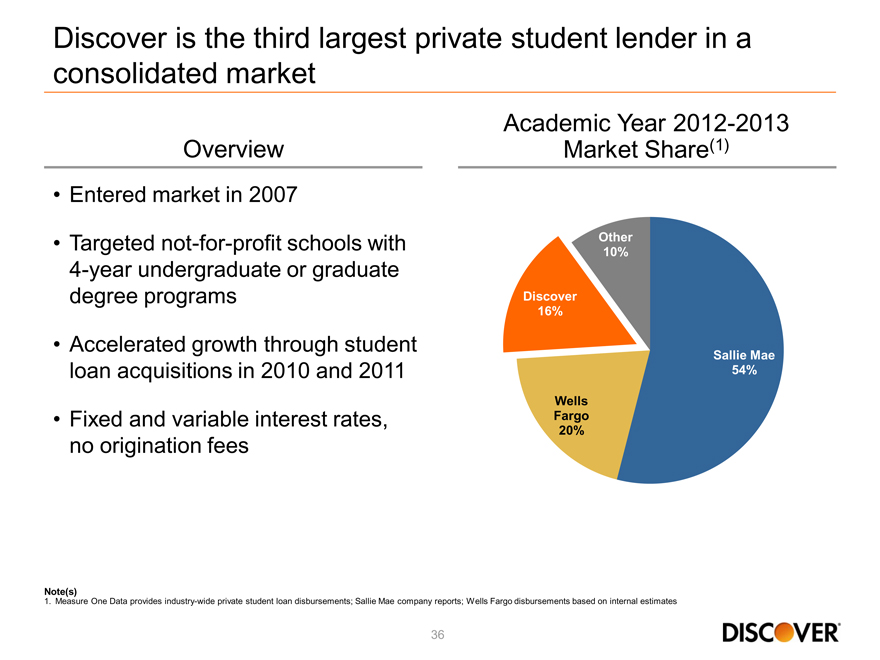
Discover is the third largest private student lender in a consolidated market
Academic Year 2012-2013 Overview Market Share(1)
Entered market in 2007
• Targeted not-for-profit schools with Other
10%
4-year undergraduate or graduate degree programs Discover
16%
Accelerated growth through student
Sallie Mae
loan acquisitions in 2010 and 2011 54%
Wells
• Fixed and variable interest rates, Fargo
20%
no origination fees
Note(s)
1. Measure One Data provides industry-wide private student loan disbursements; Sallie Mae company reports; Wells Fargo disbursements based on internal estimates
36
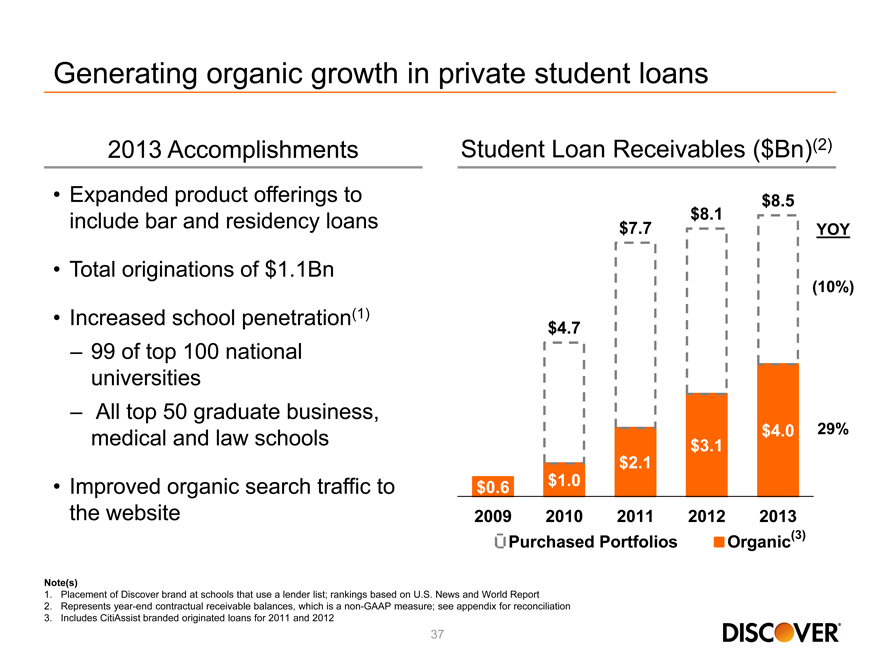
Generating organic growth in private student loans
2013 Accomplishments Student Loan Receivables ($Bn)(2)
Expanded product offerings to $ 8.5
include bar and residency loans $ 7.7 $ 8.1 YOY
Total originations of $1.1Bn
(10%)
Increased school penetration(1) $ 4.7
– 99 of top 100 national
universities
– All top 50 graduate business,
medical and law schools $ 3.1 $ 4.0 29%
$ 2.1
• Improved organic search traffic to $ 0.6 $ 1.0
the website 2009 2010 2011 2012 2013
Purchased Portfolios Organic(3)
Note(s)
1. Placement of Discover brand at schools that use a lender list; rankings based on U.S. News and World Report
2. Represents year-end contractual receivable balances, which is a non-GAAP measure; see appendix for reconciliation
3. Includes CitiAssist branded originated loans for 2011 and 2012
37
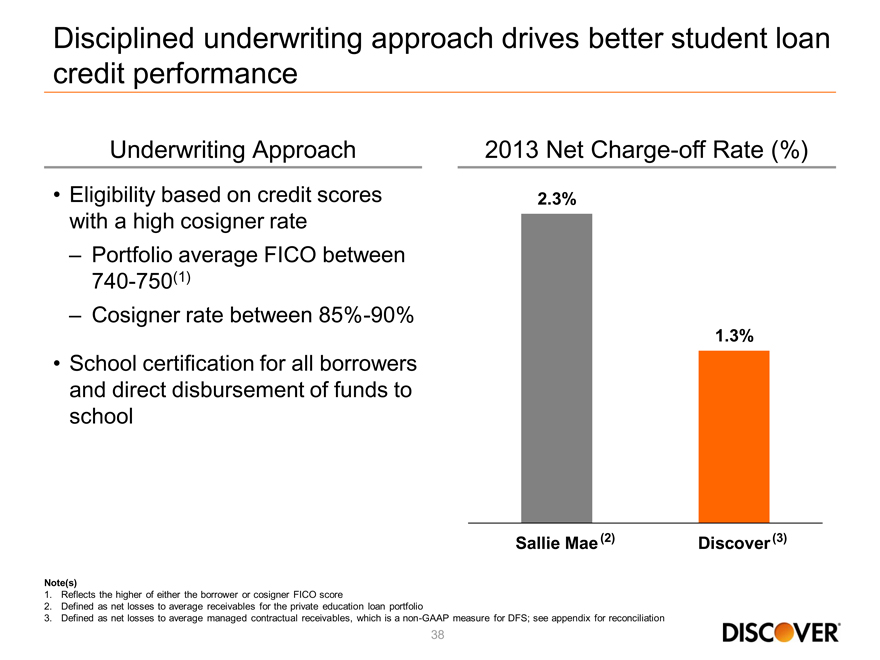
Disciplined underwriting approach drives better student loan credit performance
Underwriting Approach 2013 Net Charge-off Rate (%)
Eligibility based on credit scores 2.3% with a high cosigner rate
– Portfolio average FICO between 740-750(1)
– Cosigner rate between 85%-90%
1.3%
School certification for all borrowers and direct disbursement of funds to school
Sallie Mae(2) Discover(3)
Note(s)
1. Reflects the higher of either the borrower or cosigner FICO score
2. Defined as net losses to average receivables for the private education loan portfolio
3. Defined as net losses to average managed contractual receivables, which is a non-GAAP measure for DFS; see appendix for reconciliation
38
2014 priorities for private student loans
Increase awareness of Discover brand by reaching consumers early in the decision making process
Launch additional products
– In-school repayment
– Consolidation loans
Streamline operations to gain efficiencies and reduce cycle times
39
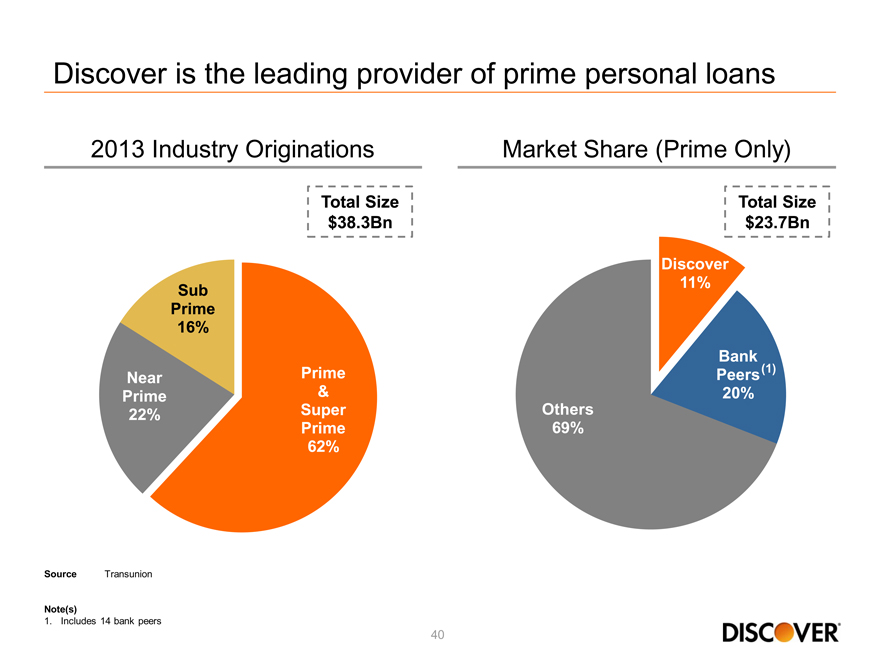
Discover is the leading provider of prime personal loans
2013 Industry Originations Market Share (Prime Only)
Total Size Total Size
Discover
Sub 11%
Prime
16%
Near Prime Peers Bank (1)
Prime & 20%
22% Super Others
Prime 69%
62%
Source Transunion
Note(s)
1.Includes 14 bank peers
40
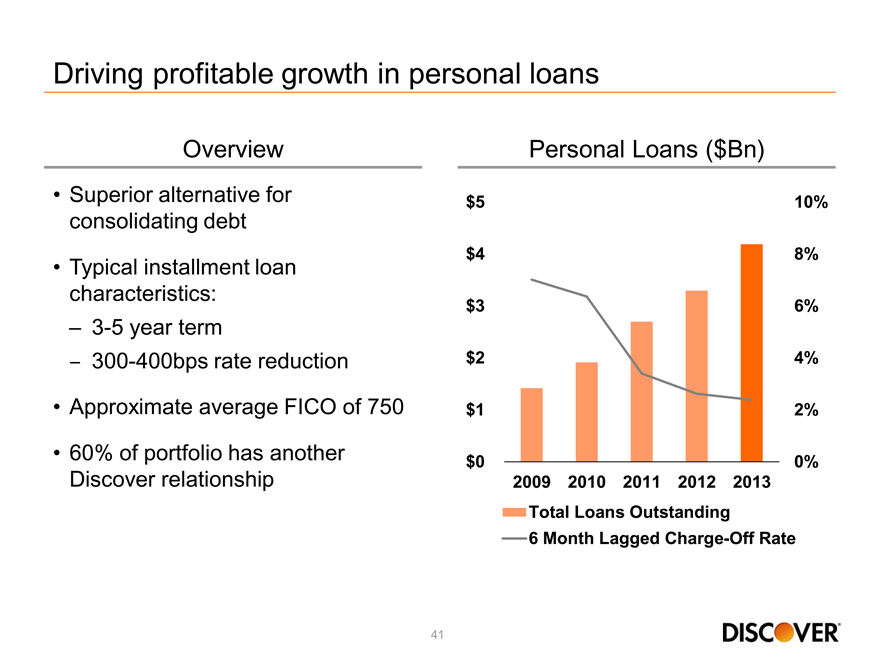
Driving profitable growth in personal loans
Overview Personal Loans ($Bn)
Superior alternative for $5 10%
consolidating debt
Typical installment loan $4 8%
characteristics: $ 3 6%
– 3-5 year term
– 300-400bps rate reduction $2 4%
Approximate average FICO of 750 $1 2%
60% of portfolio has another $0 0%
Discover relationship 2009 2010 2011 2012 2013
Total Loans Outstanding
6 Month Lagged Charge-Off Rate
41
2014 Priorities for personal loans
Maintain growth and strong credit performance
Test expansion into unsolicited population
Enhance operations and functionality
42
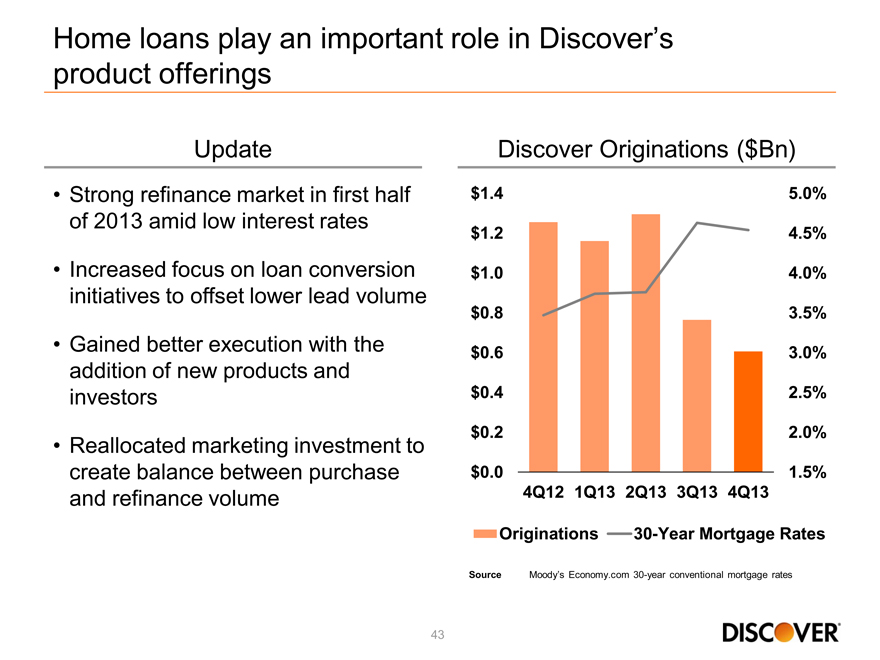
Home loans play an important role in Discover’s
product offerings
Update Discover Originations ($Bn)
Strong refinance market in first half $1.4 5.0%
of 2013 amid low interest rates $1.2 4.5%
Increased focus on loan conversion $1.0 4.0%
initiatives to offset lower lead volume
$0.8 3.5%
Gained better execution with the $0.6 3.0%
addition of new products and
investors $0.4 2.5%
Reallocated marketing investment to $ 0.2 2.0%
create balance between purchase $ 0.0 1.5%.
and refinance volume 4Q12 1Q13 2Q13 3Q13 4Q13
Originations 30-Year Mortgage Rates
Source Moody’s Economy.com 30-year conventional mortgage rates
43
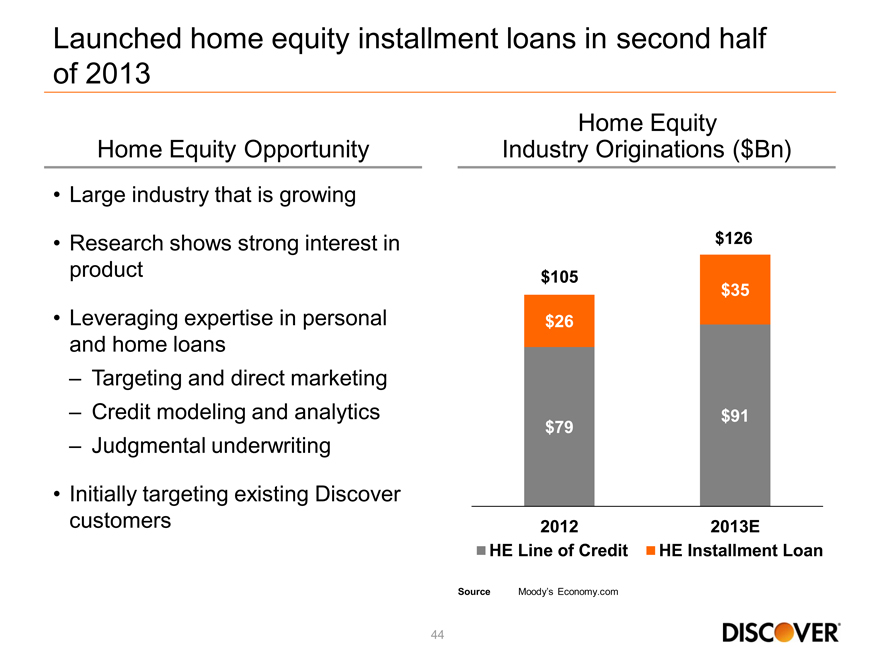
Launched home equity installment loans in second half
of 2013
Home Equity
Home Equity Opportunity Industry Originations ($Bn)
Large industry that is growing
Research shows strong interest in $126
product $105
$35
Leveraging expertise in personal $26
and home loans
– Targeting and direct marketing
– Credit modeling and analytics $91
$79
– Judgmental underwriting
Initially targeting existing Discover
customers 2012 2013E
HE Line of Credit HE Installment Loan
Source Moody’s Economy.com
44
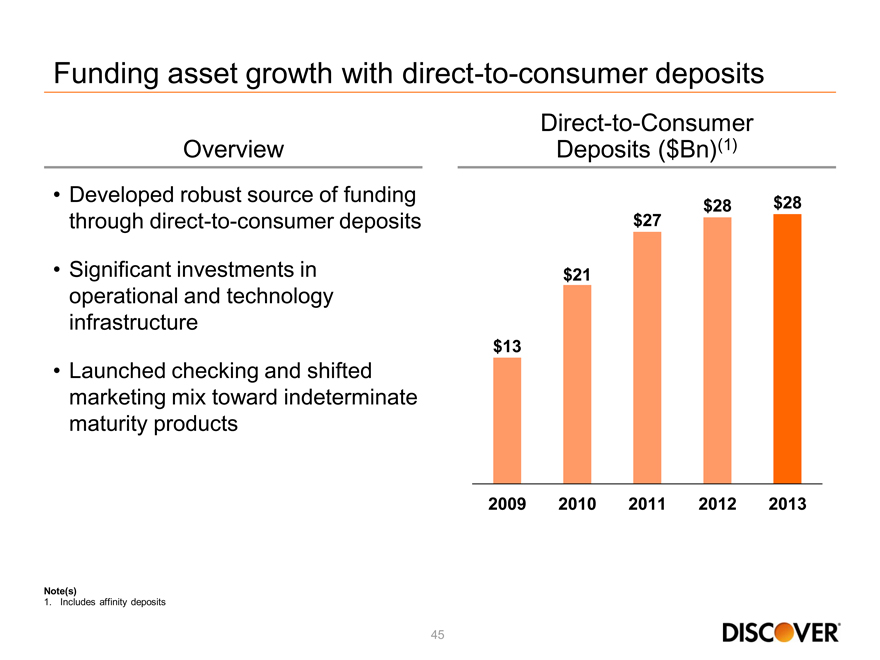
Funding asset growth with direct-to-consumer deposits
Direct-to-Consumer
Overview Deposits ($Bn)(1)
Developed robust source of funding $28 $28
through direct-to-consumer deposits $27
Significant investments in $21
operational and technology
infrastructure
$13
Launched checking and shifted
marketing mix toward indeterminate
maturity products
2009 2010 2011 2012 2013
Note(s)
1. Includes affinity deposits
45
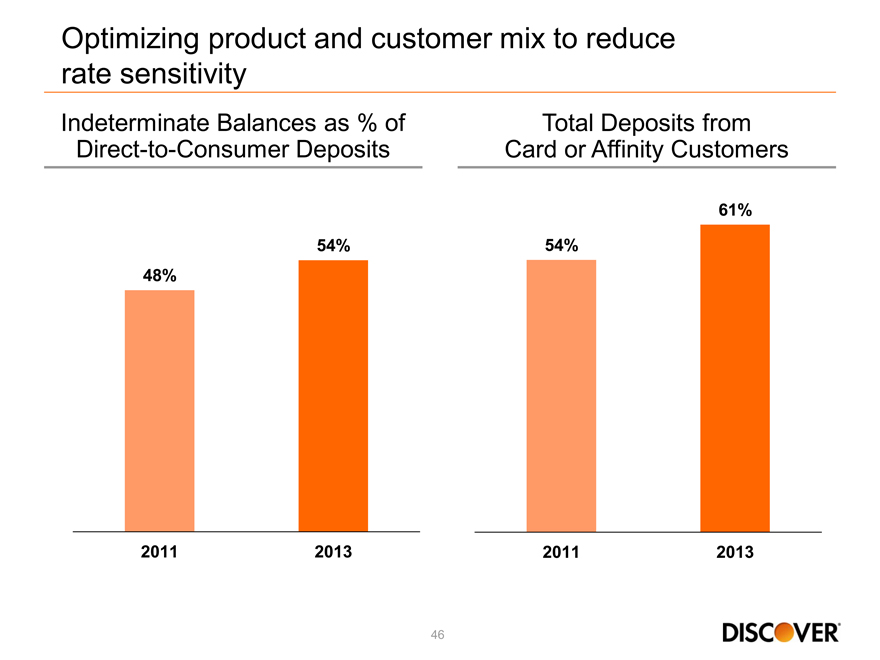
Optimizing product and customer mix to reduce
rate sensitivity
Indeterminate Balances as % of Total Deposits from
Direct-to-Consumer Deposits Card or Affinity Customers
61%
54% 54%
48%
2011 2013 2011 2013
46
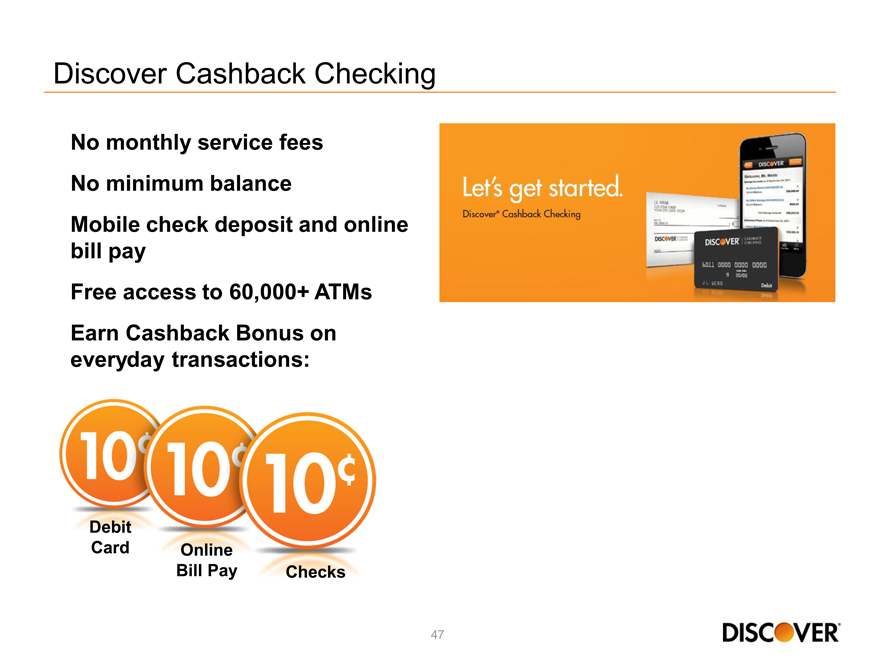
Discover Cashback Checking
No monthly service fees No minimum balance
Mobile check deposit and online bill pay Free access to 60,000+ ATMs Earn Cashback Bonus on everyday transactions:
Debit
Card Online
Bill Pay Checks
47
2014 Priorities for checking
Implement new core deposit system
Broad market launch
Affinity partners
Continue to enhance features and functionality
48
Leveraging unique capabilities to diversify assets and funding
Continue with disciplined growth in student and personal loans
Refine mortgage and home equity operating model
Manage deposit mix and opportunistically grow as rates increase
Focus on operational excellence and mobile/online capabilities
49

2014 Financial Community Briefing
Payment Services
Roger Hochschild
President & Chief Operating Officer
Competing in payments with partnership strategy
• | | Increasing domestic and global acceptance |
• | | Supporting U.S. card growth |
• | | Adapting to an evolving U.S. debit environment |
• | | Adding new Diners franchises and working through challenges in Europe |
• | | Implementing emerging payments initiatives |
51
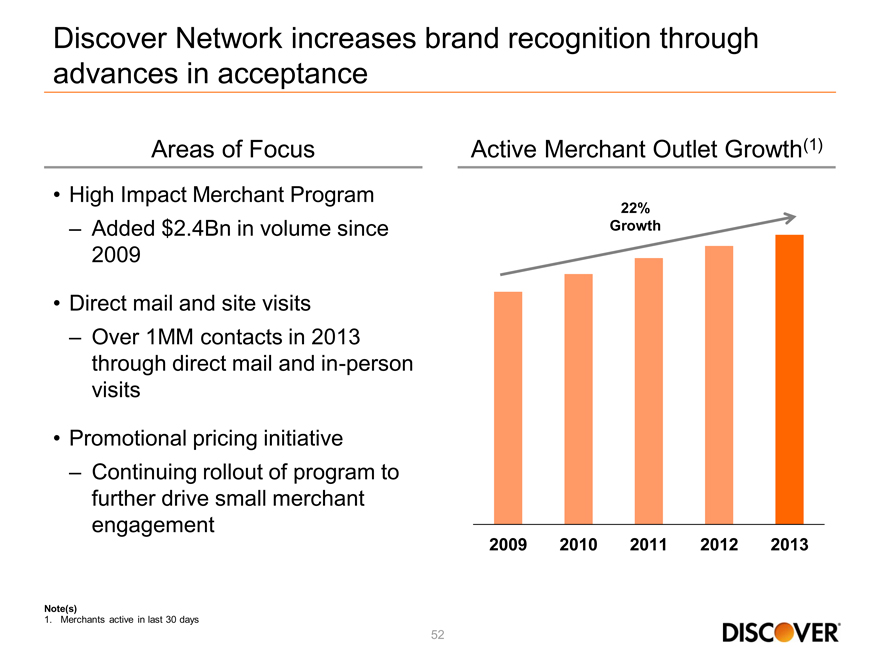
Discover Network increases brand recognition through
advances in acceptance
Areas of Focus
• | | High Impact Merchant Program |
– Added $2.4Bn in volume since 2009
• | | Direct mail and site visits |
– Over 1MM contacts in 2013 through direct mail and in-person visits
• | | Promotional pricing initiative Continuing rollout of program to further drive small merchant engagement |
Active Merchant Outlet Growth(1)
22% Growth
2009 2010 2011 2012 2013
Note(s)
1. Merchants active in last 30 days
52

Growing global acceptance through network alliances
North America
EMEA
Asia Pacific
34%
8%
8%
Latin America
22%
(May 2013)
( November 2013)
(March 2013)
53
Note(s)
– The map denotes countries or territories with transactional activity in the last year (bright orange)
– Outlet growth percentages reflect year-over-year change
– Merchant locations based on third party estimates and internal reporting
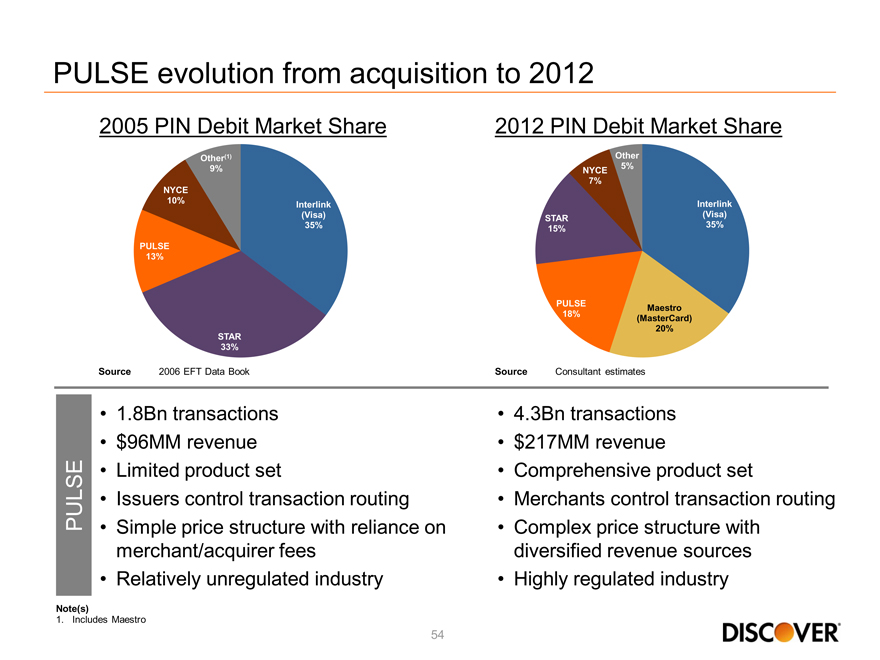
PULSE evolution from acquisition to 2012
NYCE
7%
Other
5%
NYCE
Other(1)
9%
2005 PIN Debit Market Share 2012 PIN Debit Market Share
Interlink
(Visa)
STAR 35%
15%
Interlink
(Visa)
35%
PULSE
13%
10%
Maestro
(MasterCard)
20%
PULSE
18%
STAR
33%
Source 2006 EFT Data Book Source Consultant estimates
• | | Limited 4.3Bn transactions |
product set
• | | Issuers control transaction routing |
• | | Simple price structure with reliance on |
merchant/acquirer fees
Comprehensive product set
• | | Merchants control transaction routing |
• | | Complex price structure with |
diversified revenue sources
PULSE
54
• | | Relatively unregulated industry Highly regulated industry |
Note(s)
1. Includes Maestro
source public company data
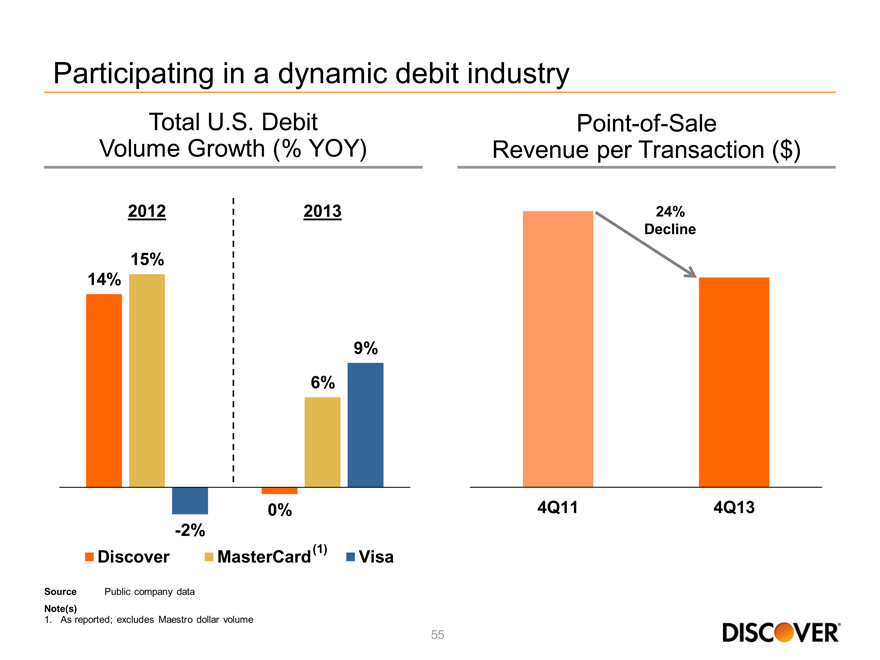
Participating in a dynamic debit industry
Total U.S. Debit
Volume Growth (% YOY)
Point-of-Sale
Revenue per Transaction ($)
14%
15%
2012 2013 24%
Decline
6%
9%
0%
-2%
Discover MasterCard(1) Visa
4Q11 4Q13
55
Note(s)
1. As reported; excludes Maestro dollar volume
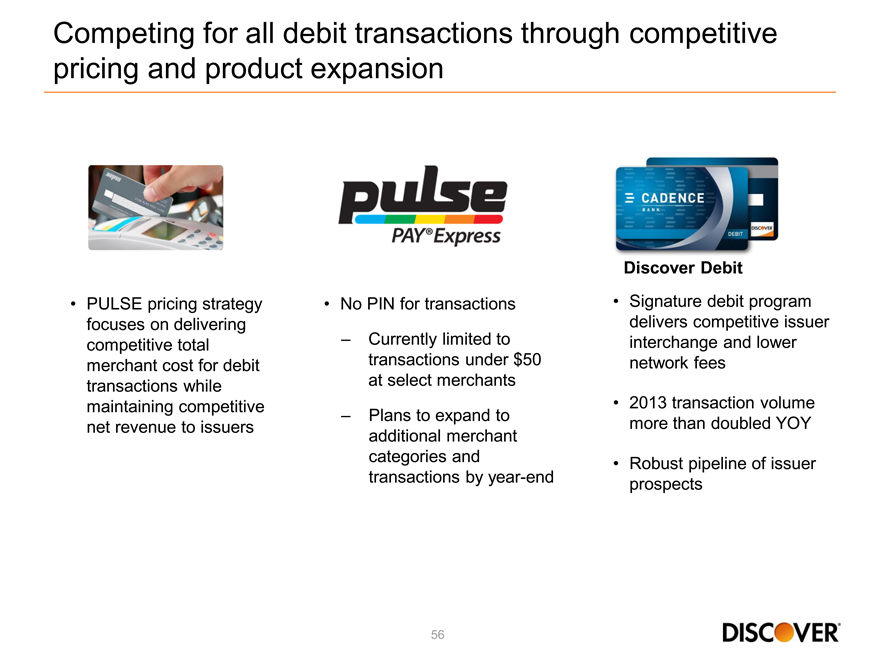
Competing for all debit transactions through competitive
pricing and product expansion
PULSE pricing strategy focuses on delivering competitive total merchant cost for debit transactions while maintaining competitive net revenue to issuers
No PIN for transactions
– Currently limited to transactions under $50 at select merchants
– Plans to expand to additional merchant categories and transactions by year-end
Discover Debit
• | | Signature debit program delivers competitive issuer interchange and lower network fees |
• | | 2013 transaction volume more than doubled YOY |
• | | Robust pipeline of issuer prospects |
56
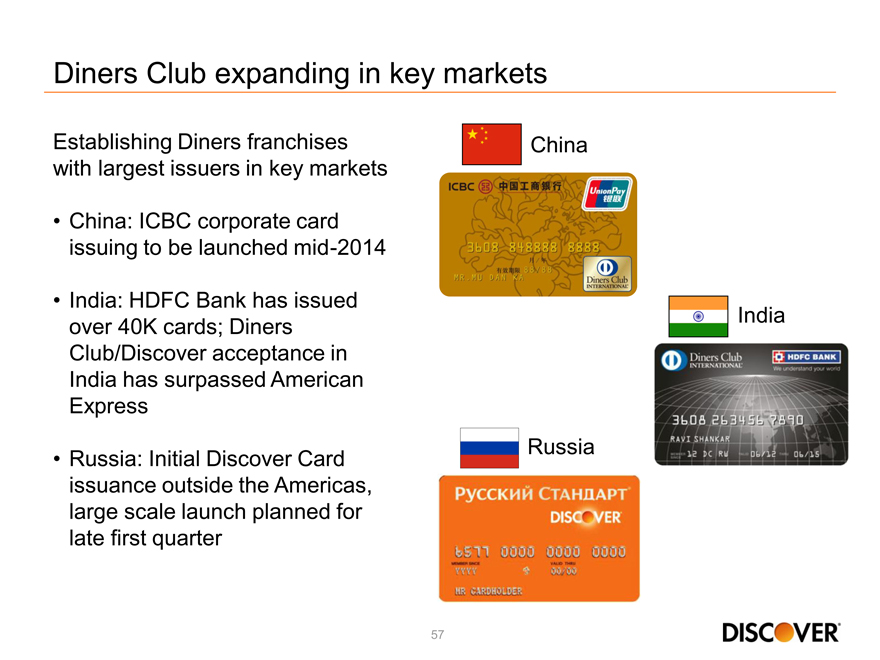
Diners Club expanding in key markets
Establishing Diners franchises with largest issuers in key markets
• | | China: ICBC corporate card issuing to be launched mid-2014 |
• | | India: HDFC Bank has issued over 40K cards; Diners Club/Discover acceptance in India has surpassed American |
Express
• | | Russia: Initial Discover Card issuance outside the Americas, large scale launch planned for late first quarter |
China
India
Russia
57
Discover’s PayPal relationship continues to progress
Background
• | | Leverages Discover’s domestic merchant footprint |
• | | Allows for access to PayPal’s 60MM+ active U.S. account holders |
• | | Establishes PayPal as a payment option in brick & mortar locations |
• | | Distribute a robust mobile application to a large set of account holders |
Update
Signed 61 merchant acquirers
Enabled 1.2 million merchant locations
Integrating PayPal’s mobile POS technology with Discover’s hardware and software providers
58
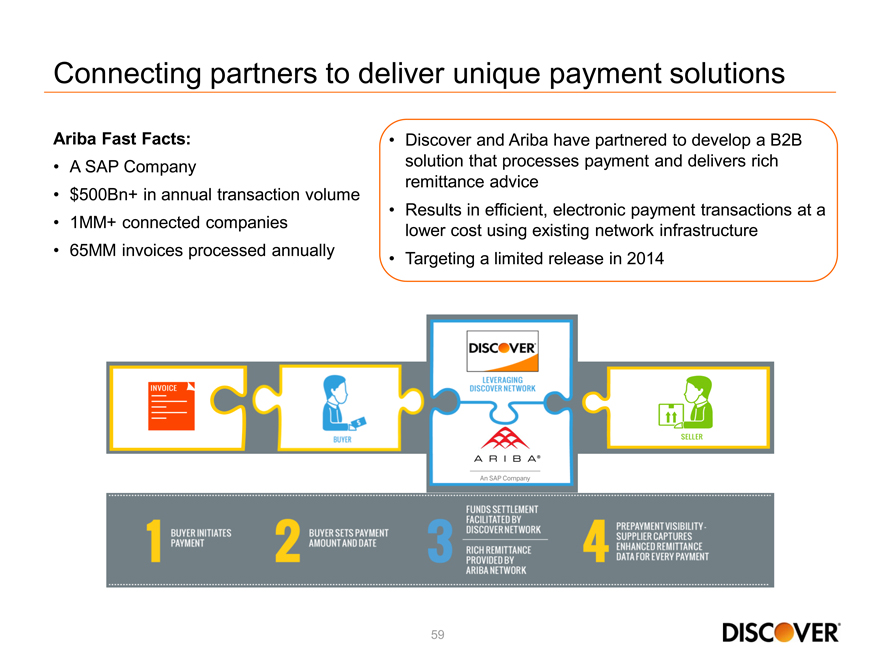
Connecting partners to deliver unique payment solutions
• | | Discover and Ariba have partnered to develop a B2B |
solution that processes payment and delivers rich
remittance advice
Ariba Fast Facts:
• | | Results in efficient, electronic payment transactions at a |
lower cost using existing network infrastructure
• | | Targeting a limited release in 2014 |
• | | 500Bn+ in annual transaction volume |
• | | 1MM+ connected companies |
• | | 65MM invoices processed annually |
59
Continued focus on payments security
• | | Merchant breaches dramatically increased industry focus on payments security |
• | | Discover is preparing for a multi-year industry migration to chip and pin for |
point-of-sale and tokenization for card not present transactions
• | | Open access and collaboration between networks is needed to provide |
consumers with the highest level of security and global interoperability
• | | Discover’s multilayered approach addresses security across all payment |
channels
60
Leveraging payments assets with partners to drive volume
• | | Broad product suite including credit, debit, prepaid and ATM |
• | | Hybrid closed loop acceptance model |
• | | Building global acceptance |
• | | Flexibility provides opportunity to participate in alternative payment strategies |
61
2014 Financial Community Briefing
Financials
Mark Graf
EVP & Chief Financial Officer
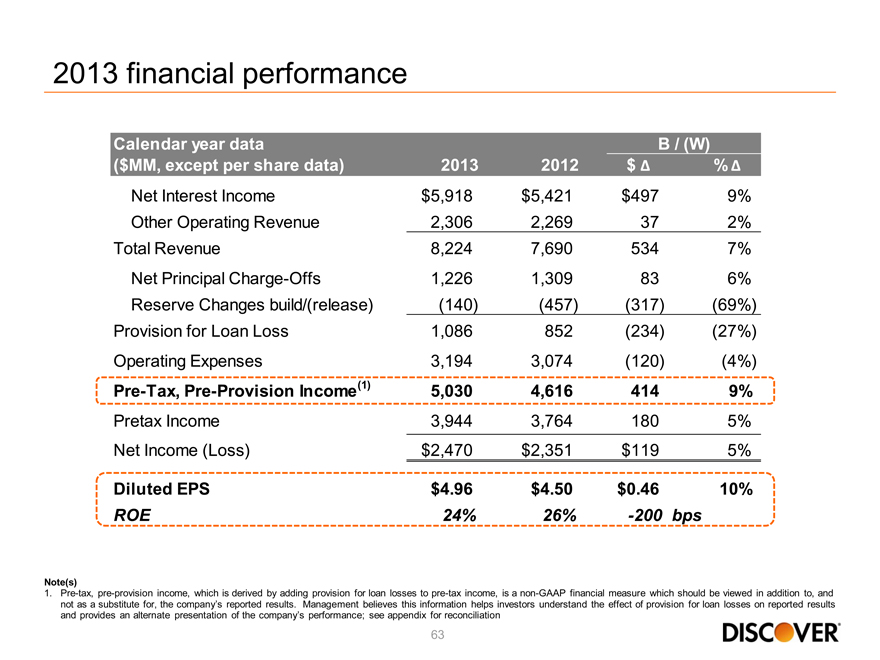
2013 financial performance
($MM, except per share data) 2013 2012 $ %
Calendar year data B / (W)
Net Interest Income $5,918 $5,421 $497 9% Other Operating Revenue 2,306 2,269 37 2% Total Revenue 8,224 7,690 534 7% Net Principal Charge-Offs 1,226 1,309 83 6% Reserve Changes build/(release) (140) (457) (317) (69%) Provision for Loan Loss 1,086 852 (234) (27%) Operating Expenses 3,194 3,074 (120) (4%)
Pre-Tax, Pre-Provision Income(1) 5,030 4,616 414 9%
Pretax Income 3,944 3,764 180 5% Net Income (Loss) $2,470 $2,351 $119 5%
Diluted EPS $4.96 $4.50 $0.46 10%
ROE 24% 26% -200 bps
Note(s)
1. Pre-tax, pre-provision income, which is derived by adding provision for loan losses to pre-tax income, is a non-GAAP financial measure which should be viewed in addition to, and
not as a substitute for, the company’s reported results. Management believes this information helps investors understand the effect of provision for loan losses on reported results
and provides an alternate presentation of the company’s performance; see appendix for reconciliation
63
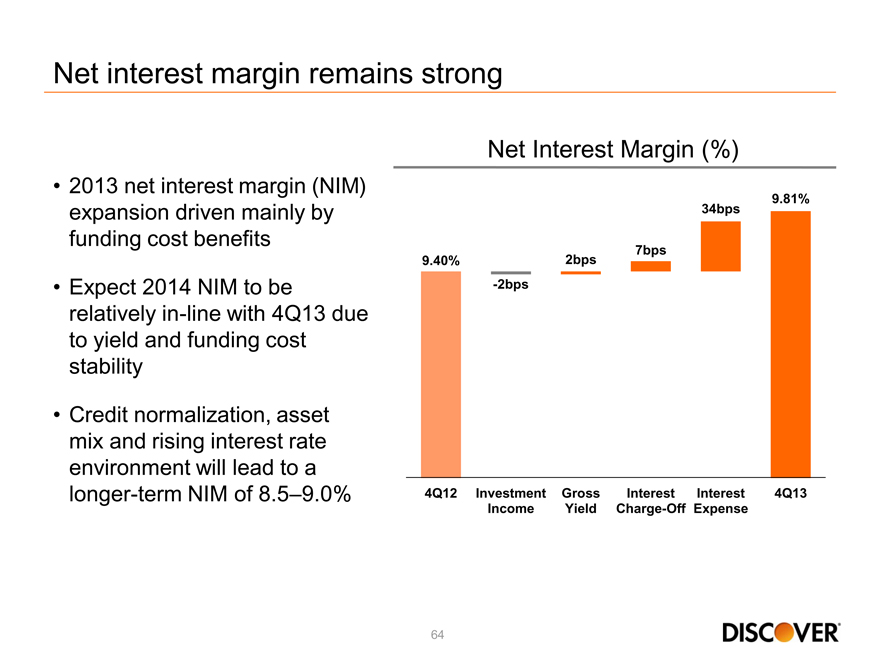
Net interest margin remains strong
2013 net interest margin (NIM) expansion driven mainly by funding cost benefits
Expect 2014 NIM to be relatively in-line with 4Q13 due to yield and funding cost stability
Credit normalization, asset mix and rising interest rate environment will lead to a longer-term NIM of 8.5–9.0%
Net Interest Margin (%)
9.81% 34bps
7bps 9.40% 2bps -2bps
4Q12 Investment Gross Interest Interest 4Q13 Income Yield Charge-Off Expense
64
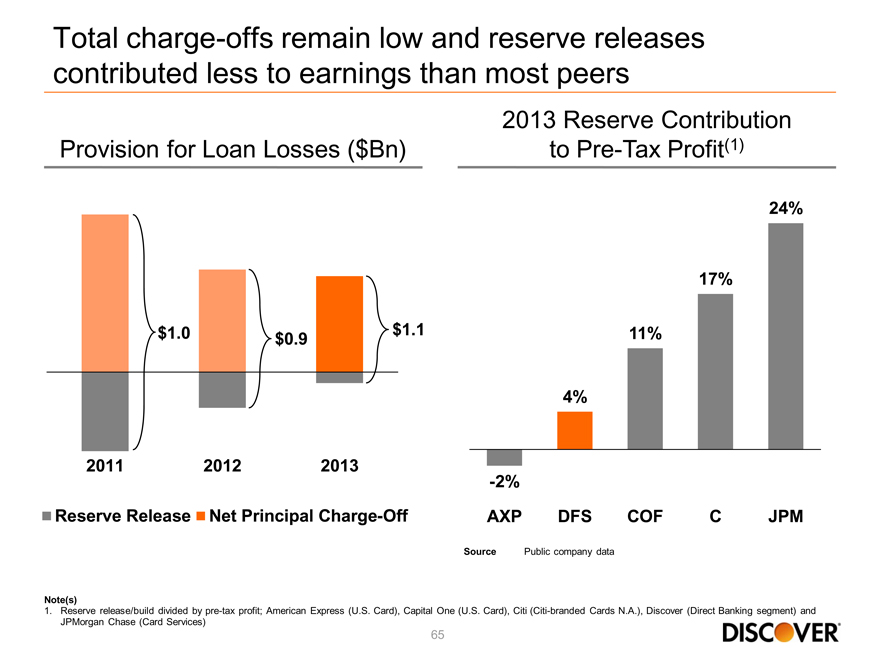
Total charge-offs remain low and reserve releases
contributed less to earnings than most peers
Provision for Loan Losses ($Bn)
$1.0 $0.9 $1.1
2011 2012 2013
Reserve Release Net Principal Charge-Off
2013 Reserve Contribution
to Pre-Tax Profit(1)
AXP DFS COF C JPM
4%
11%
17%
24%
– 2%
Note(s)
1. Reserve release/build divided by pre-tax profit; American Express (U.S. Card), Capital One (U.S. Card), Citi (Citi-branded Cards N.A.), Discover (Direct Banking segment) and
JPMorgan Chase (Card Services)
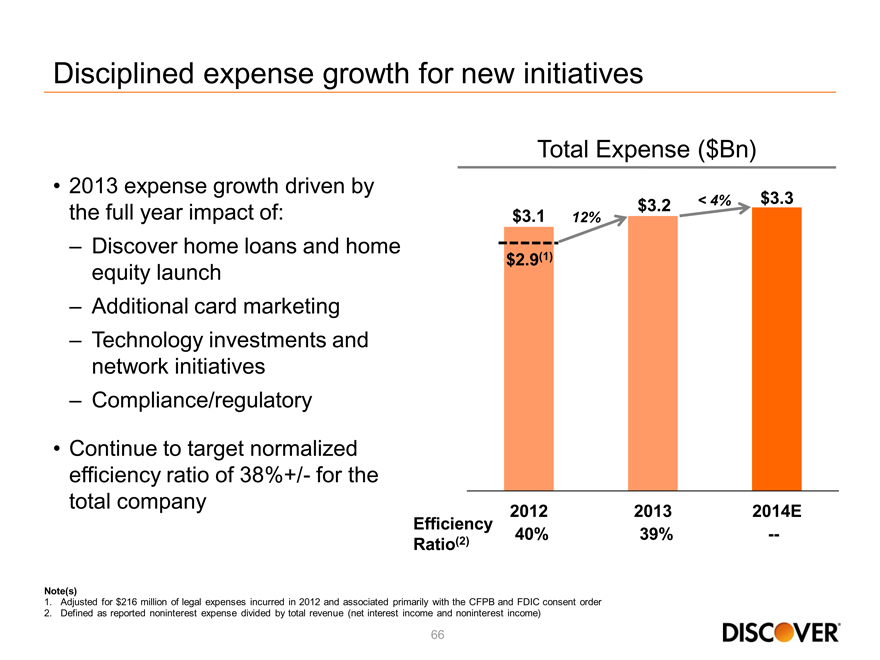
Disciplined expense growth for new initiatives
Total Expense ($Bn)
2013 expense driven by
the full year impact of:
– Discover home loans and home
equity launch
12%
< 4% $3.1 #3.2 $3.3 $2.9(1)
– Additional card marketing
– Technology investments and
network initiatives
– Compliance/regulatory
• | | Continue to target normalized |
38%+/ for the
2012 2013 2014E
Efficiency
Ratio(2) 40% 39% —
efficiency ratio of - total company
Note(s)
1. Adjusted for $216 million of legal expenses incurred in 2012 and associated primarily with the CFPB and FDIC consent order
2. Defined as reported noninterest expense divided by total revenue (net interest income and noninterest income)
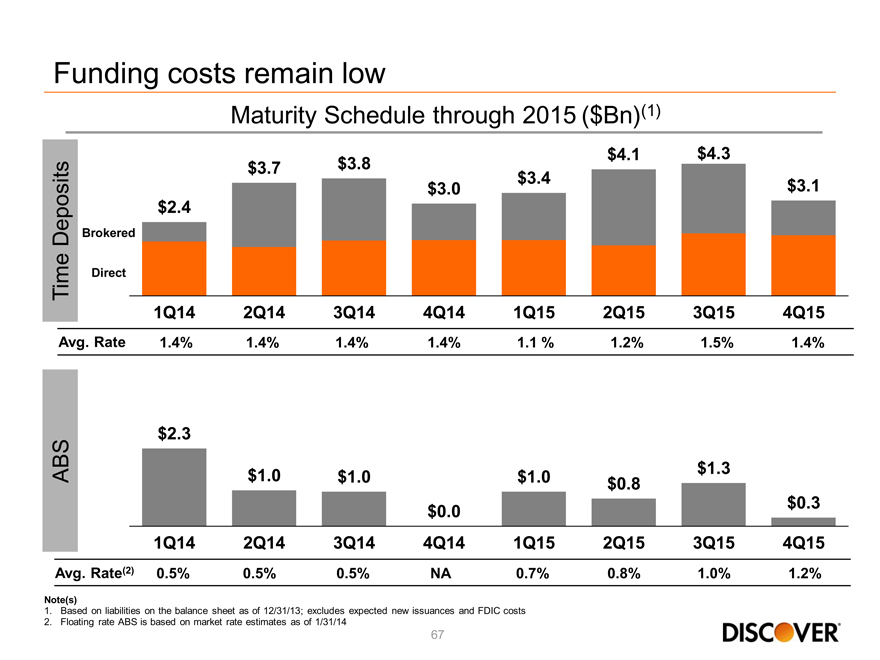
Funding costs remain low
Maturity Schedule through 2015 ($Bn)(1)
$3.7 $3.8
$3.0 $3.4
$4.1 $4.3
$3.1
Time Deposits
Brokered
Direct
$2.4
$4.1 $4.3
Ti
Avg. Rate 1.4% 1.4% 1.4% 1.4% 1.1% 1.2% 1.5% 1.4%
1Q14 2Q14 3Q14 4Q14 1Q15 2Q15 3Q15 4Q15
ABS
$2.3
$1.0 $1.0 $1.0 $1.3
$0.8 $0.3
1Q14 2Q14 3Q14 4Q14 1Q15 2Q15 3Q15 4Q15
67
Note(s)
1. Based on liabilities on the balance sheet as of 12/31/13; excludes expected new issuances and FDIC costs
2. Floating rate ABS is based on market rate estimates as of 1/31/14
Avg. Rate(2) 0.5% 0.5% 0.5% NA 0.7% 0.8% 1.0% 1.2%
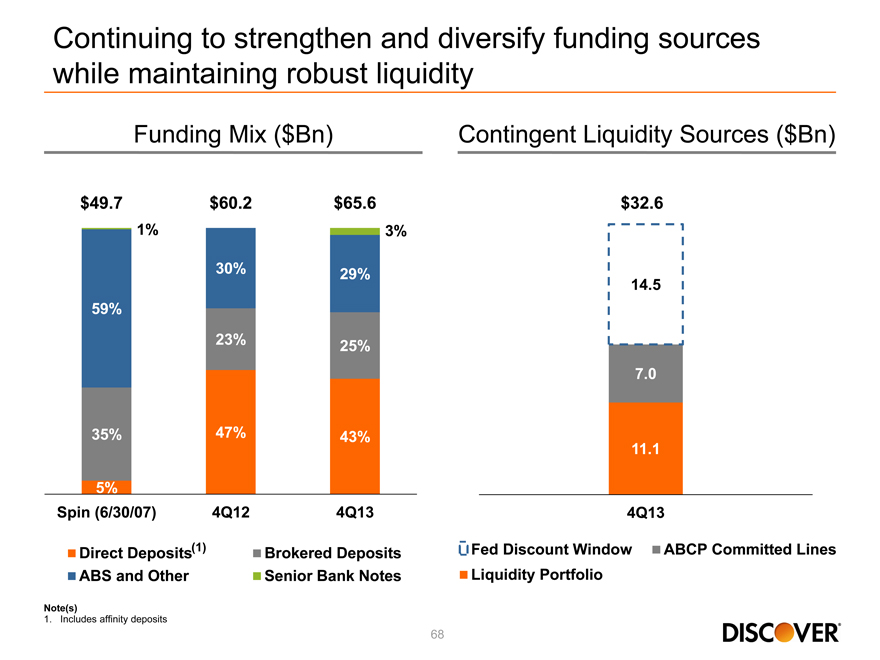
Continuing to strengthen and diversify funding sources
while maintaining robust liquidity
Funding Mix ($Bn) Contingent Liquidity Sources ($Bn)
30% 29%
1% 3%
$49.7 $60.2 $65.6 $32.6
23% 25%
59%
7.0
35% 47% 43%
11.1
5%
Spin (6/30/07) 4Q12 4Q13
Direct Deposits(1) Brokered Deposits
4Q13
Fed Discount Window ABCP Committed Lines
68
ABS and Other Senior Bank Notes
Note(s)
1. Includes affinity deposits
Liquidity Portfolio
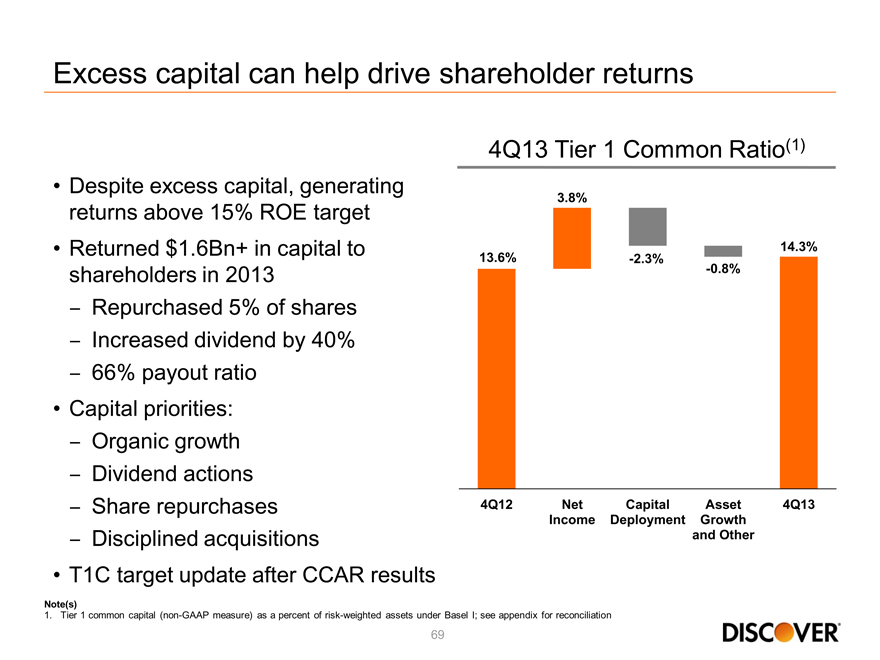
Excess capital can help drive shareholder returns
4Q13 Tier 1 Common Ratio(1)
• | | Despite excess capital, generating |
returns above 15% ROE target
• | | Returned $1.6Bn+ in capital to |
shareholders in 2013
13.6%
3.8%
-2.3%
-0.8%
14.3%
Repurchased 5% of shares
Increased dividend by 40%
66% payout ratio
Capital priorities:
Organic growth
Dividend actions
Share repurchases
Disciplined acquisitions
4Q12 Net
Income
Capital
Deployment
Asset
Growth
and Other
4Q13
69
T1C target update after CCAR results
Note(s)
1. Tier 1 common capital (non-GAAP measure) as a percent of risk-weighted assets under Basel I; see appendix for reconciliation
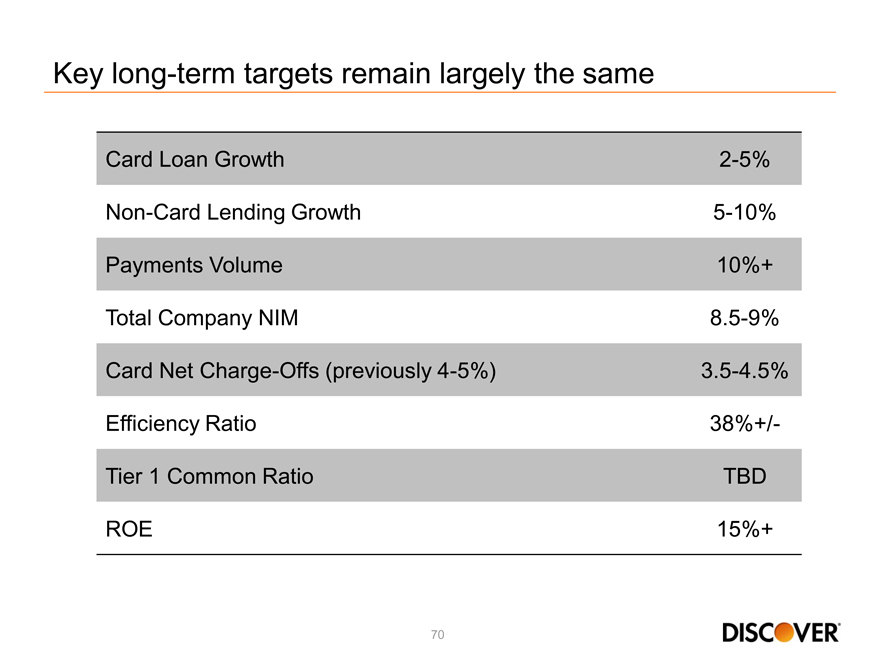
Key long-term targets remain largely the same
Card Loan Growth 2-5%
Non-Card Lending Growth 5-10%
Payments Volume 10%+
Total Company NIM 8.5-9%
Card Net Charge-Offs (previously 4-5%) 3.5-4.5%
Efficiency Ratio 38%+/-
Tier 1 Common Ratio TBD
ROE 15%+

Well positioned for 2014
• | | Greater than industry average card loan growth |
• | | Net interest margin expected to remain above long-term target |
• | | Modest increase in operating expenses |
• | | Card delinquency trends do not indicate a change in credit environment |
• | | Capital position/generation supports growth, dividend actions, share |
repurchases and potential acquisitions
71
2014 Financial Community Briefing
Q&A

Appendix
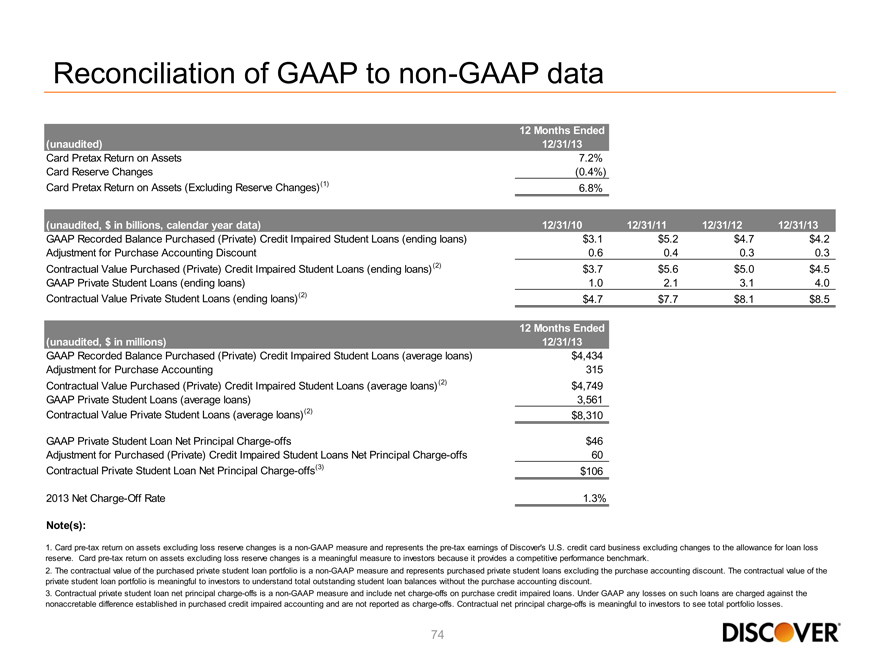
Reconciliation of GAAP to non-GAAP data
(unaudited) 12/31/13
Card Pretax Return on Assets 7.2%
Card Reserve Changes(0.4%)
Card Pretax Return on Assets (Excluding Reserve Changes)(1) 6.8%
(unaudited, $ in billions, calendar year data) 12/31/10 12/31/11 12/31/12 12/31/13
GAAP Recorded Balance Purchased (Private) Credit Impaired Student Loans (ending loans) $3.1 $ 5.2 $ 4.7 $ 4.2
Adjustment for Purchase Accounting Discount 0.6 0.4 0.3 0.3
Contractual Value Purchased (Private) Credit Impaired Student Loans (ending loans)(2) $3.7 $ 5.6 $ 5.0 $ 4.5
GAAP Private Student Loans (ending loans) 1.0 2.1 3.1 4.0
Contractual Value Private Student Loans (ending loans)(2) $4.7 $ 7.7 $ 8.1 $ 8.5
12 Months Ended
(unaudited, $ in millions) 12/31/13
GAAP Recorded Balance Purchased (Private) Credit Impaired Student Loans (average loans) $4,434
Adjustment for Purchase Accounting 315
Contractual Value Purchased (Private) Credit Impaired Student Loans (average loans)(2) $4,749
GAAP Private Student Loans (average loans) 3,561
Contractual Value Private Student Loans (average loans)(2) $8,310
GAAP Private Student Loan Net Principal Charge-offs $46
Adjustment for Purchased (Private) Credit Impaired Student Loans Net Principal Charge-offs 60
Contractual Private Student Loan Net Principal Charge-offs(3) $106
2013 Net Charge-Off Rate 1.3%
Note(s):
1. Card pre-tax return on assets excluding loss reserve changes is a non-GAAP measure and represents the pre-tax earnings of Discover’s U.S. credit card business excluding changes to the allowance for loan loss reserve. Card pre-tax return on assets excluding loss reserve changes is a meaningful measure to investors because it provides a competitive performance benchmark.
2. The contractual value of the purchased private student loan portfolio is a non-GAAP measure and represents purchased private student loans excluding the purchase accounting discount. The contractual value of the private student loan portfolio is meaningful to investors to understand total outstanding student loan balances without the purchase accounting discount.
3. Contractual private student loan net principal charge-offs is a non-GAAP measure and include net charge-offs on purchase credit impaired loans. Under GAAP any losses on such loans are charged against the nonaccretable difference established in purchased credit impaired accounting and are not reported as charge-offs. Contractual net principal charge-offs is meaningful to investors to see total portfolio losses.
74
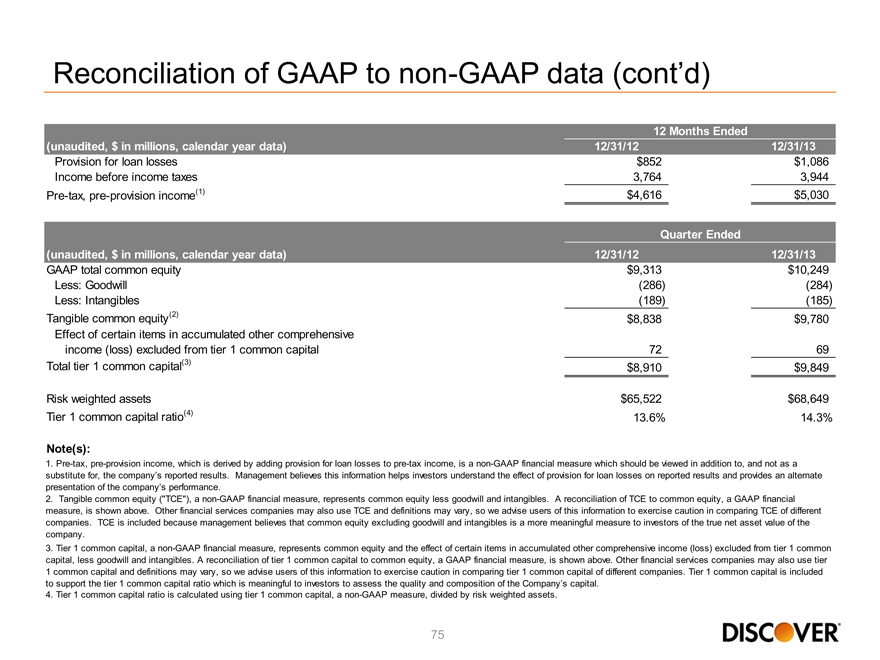
Reconciliation of GAAP to non-GAAP data (cont’d)
(unaudited, $ in millions, calendar year data) 12/31/12 12/31/13
Provision for loan losses $852 $1,086
Income before income taxes 3,764 3,944
Pre-tax, pre-provision income(1) $4,616 $5,030
Quarter Ended
(unaudited, $ in millions, calendar year data) 12/31/12 12/31/13
GAAP total common equity $9,313 $10,249
Less: Goodwill(286)(284)
Less: Intangibles(189)(185)
Tangible common equity(2) $8,838 $9,780
Effect of certain items in accumulated other comprehensive
income (loss) excluded from tier 1 common capital 72 69
Total tier 1 common capital(3) $8,910 $9,849
Risk weighted assets $65,522 $68,649
Tier 1 common capital ratio(4) 13.6% 14.3%
Note(s):
1. Pre-tax, pre-provision income, which is derived by adding provision for loan losses to pre-tax income, is a non-GAAP financial measure which should be viewed in addition to, and not as a substitute for, the company’s reported results. Management believes this information helps investors understand the effect of provision for loan losses on reported results and provides an alternate presentation of the company’s performance.
2. Tangible common equity (“TCE”), a non-GAAP financial measure, represents common equity less goodwill and intangibles. A reconciliation of TCE to common equity, a GAAP financial measure, is shown above. Other financial services companies may also use TCE and definitions may vary, so we advise users of this information to exercise caution in comparing TCE of different companies. TCE is included because management believes that common equity excluding goodwill and intangibles is a more meaningful measure to investors of the true net asset value of the company.
3. Tier 1 common capital, a non-GAAP financial measure, represents common equity and the effect of certain items in accumulated other comprehensive income (loss) excluded from tier 1 common capital, less goodwill and intangibles. A reconciliation of tier 1 common capital to common equity, a GAAP financial measure, is shown above. Other financial services companies may also use tier 1 common capital and definitions may vary, so we advise users of this information to exercise caution in comparing tier 1 common capital of different companies. Tier 1 common capital is included to support the tier 1 common capital ratio which is meaningful to investors to assess the quality and composition of the Company’s capital.
4. Tier 1 common capital ratio is calculated using tier 1 common capital, a non-GAAP measure, divided by risk weighted assets.
75