![]() Mark Graf EVP & Chief Financial Officer September 9, 2014 Barclays 2014 Global Financial Services Conference ©2014 DISCOVER FINANCIAL SERVICES Exhibit 99.1 |
![]() Notice The following slides are part of a presentation by Discover Financial Services (the "Company") and are intended to be viewed as part of that presentation. No representation is made that the information in these slides is complete. The information provided herein includes certain non-GAAP financial measures. The reconciliations of such measures to the comparable GAAP figures are included at the end of this presentation, which is available on the Company's website at www.discoverfinancial.com. The presentation contains forward-looking statements. You are cautioned not to place undue reliance on forward-looking statements, which speak only as of the date on which they are made, which reflect management’s estimates, projections, expectations or beliefs at that time, and which are subject to risks and uncertainties that may cause actual results to differ materially. For a discussion of certain risks and uncertainties that may affect the future results of the Company, please see "Special Note Regarding Forward-Looking Statements," "Risk Factors," "Business – Competition," "Business – Supervision and Regulation" and "Management’s Discussion and Analysis of Financial Condition and Results of Operations" in the Company’s Annual Report on Form 10-K for the year ended December 31, 2013 and "Management’s Discussion and Analysis of Financial Condition and Results of Operations" in the Company's Quarterly Reports on Form 10-Q for the quarters ended March 31, 2014 and June 30, 2014, which are available on the Company’s website and the SEC’s website. The Company does not undertake to update or revise forward- looking statements as more information becomes available. We own or have rights to use the trademarks, trade names and service marks that we use in conjunction with the operation of our business, including, but not limited to: Discover ® , PULSE ® , Cashback Bonus ® , Discover Cashback CheckingSM, Discover it ® , Discover ® Network and Diners Club International ® . All other trademarks, trade names and service marks included in this presentation are the property of their respective owners. 2 SM |
![]() Executive summary • Gaining profitable card market share through a loyal customer base, a new flagship product, cash rewards leadership and superior customer service • Growing student and personal loans while expanding other direct banking products beyond the existing customer base • Leveraging payments assets to support card and other direct banking products, in addition to partnering to build volume and acceptance over the long-term • Driving superior returns and creating shareholder value through effective capital management 3 |
![]() Positioning to be the leading direct bank U.S. Card Issuing • $53Bn in card receivables • Leading cash rewards program • 1 in 4 U.S. households Deposits and Lending • $29Bn direct-to-consumer deposits • $13Bn personal loans and private student loans • $2.5Bn home loan originations • Home equity installment loans • Cashback checking Direct Banking Strategy • Discover to become the leading direct bank by leveraging our unique assets and capabilities to grow credit card market share and pursue other high- return direct consumer banking opportunities in the U.S. • Key Investments: Direct Banking Segment (97% of DFS Pre-Tax Profit) Note(s): Balances as of June 30, 2014; direct mortgage originations and pre-tax profit based on the trailing four quarters ending 2Q14; direct-to-consumer deposits includes affinity deposits – Rewards Program – Customer Service – Mobile – New Banking Platform 4 |
![]() U.S. Card – Driving better loan growth and credit performance Card Loans (%YOY) (1) Source: SEC filings, calendar year data, internal estimates Note(s): 1. Includes weighted average card receivables growth for American Express (U.S. Card), Bank of America (U.S. Card), Capital One (U.S. Card excl. HSBC for 2Q12-1Q13 and installment loans), Citi (Citi-branded Cards N.A.), Wells Fargo (Consumer Credit Card Portfolio), and JPMorgan Chase (Card Services); periods prior to 3Q08 adjusted to include estimated Washington Mutual receivables 2. Weighted average rate; includes U.S. card net charge-off rates for Citi (Citi-branded Cards N.A.), JPMorgan Chase (Card Services), Capital One (U.S. Card), American Express (U.S. Card) and Bank of America (U.S. Card) Card Net Charge-off Rate (%) (2) July 2014 2.1% 5.9% 1.0% 10.0% 5.0% 0.0% -10.0% -15.0% -5.0% 12.0% 10.0% 8.0% 4.0% 0.0% 6.0% 2.0% 2Q08 2Q09 2Q10 2Q11 2Q12 2Q13 2Q14 2Q08 2Q09 2Q10 2Q11 2Q12 2Q13 2Q14 Discover Peer Group Discover Peer Group 5 |
![]() Strong growth in standard balances and funding cost improvement offsetting modest yield compression Note(s): 1. Pre-CARD Act reflects an average of 2006-2008 inclusive 2. Total company interest expense divided by total company average receivables 3. Discover card net interest margin represents credit card interest yield less total company average funding cost (total company interest expense divided by total company average receivables) Card Loan Mix by APR (%) Card Net Interest Margin (%) (1) (2) (3) (1) -3.0% -1.0% 1.0% 3.0% 5.0% 7.0% 9.0% 11.0% 13.0% Total Yield Cost of Funds Pre-CARD Act YTD 2Q14 Pre-CARD Act 2Q14 Promotional Standard Cash and Other 6 NIM 25% 52% 23% 18% 69% 13% |
![]() Achieving industry leading returns 2014 YTD U.S. Card Issuers Net Interest Margin (NIM) (1,2) 2014 YTD U.S. Card Issuers Pre-tax, Pre-Reserve ROA (1,3) Note(s): 1. American Express (U.S. Card), Capital One (U.S. Card adjusted for estimated impact of Best Buy portfolio sale), Citi (Citi-branded Cards N.A. based on segment tax rate) and JPMorgan Chase (Card Services) 2. Capital One, Citi, and JPMorgan Chase net interest margins include late fees, whereas American Express and Discover exclude late fees; Discover card net interest margin represents credit card interest yield less total company average funding cost (total company interest expense / total company average receivables) 3. Pre-tax income excluding the impact of changes in loan loss reserves divided by average card receivables, which is a non-GAAP measure; see appendix for Discover GAAP reconciliation Source: Public company data; Discover 12.9% 10.4% 9.9% 9.1% 9.0% 7.0% 6.7% 6.5% 6.3% 4.9% COF DFS DFS AXP AXP COF C C JPM JPM (1,3) 7 |
![]() Private Student Loans – Strong organic growth with disciplined underwriting Total Contractual Net Charge Off Rate (4) Student Loan Receivables ($Bn) (1) (2) % in Repay (3) 20% 66% 68% 68% 67% 8% $0.6 $1.0 $2.1 $3.1 $4.0 4.3 $3.7 $5.6 $5.0 $4.5 4.2 $4.7 $7.7 $8.1 $8.5 $8.5 Purchased Portfolios Organic 2009 2010 2011 2012 2013 2Q14 0.03% 0.37% 0.96% 1.14% 1.28% 0.94% 2009 2010 2011 2012 2013 YTD 2Q14 8 Note(s): 1. Contractual receivables is a non-GAAP measure; amounts represent year-end/quarter-end balances, see appendix for reconciliation 2. Includes CitiAssist branded originated loans for 2011 and 2012 3. Based on contractual loan data; includes loans in forbearance 4. Defined as net losses to average managed contractual receivables which is a non-GAAP measure for DFS; see appendix for reconciliation |
![]() Personal Loans - Driving disciplined profitable growth Overview Personal Loans ($Bn) • Superior alternative for consolidating debt • Typical installment loan characteristics: $5 $4 $3 $2 $1 $0 10% 8% 6% 4% 2% 0% 2009 2010 2011 2012 2013 2Q14 Total Loans Outstanding 6 Month Lagged Charge-Off Rate – 3-5 year term – 300-400bps rate reduction • Average FICO of ~750 • ~60% of portfolio has another Discover relationship 9 |
![]() Direct-to-Consumer Deposits - Funding asset growth with deposits Overview Direct-to-Consumer Deposits ($Bn) (1) • Developed robust source of funding through direct-to-consumer deposits • Shifting marketing mix toward indeterminate maturity products • Launched Cashback Checking - No monthly service fees or minimum balance - Mobile check deposit & online bill pay - Free access to 60,000+ ATMs - Cashback on everyday transactions (debit, bill pay, checks) Note(s): 1. Includes affinity deposits 23% 38% 46% 47% 43% % of Funding 44% 10 $13 $21 $27 $28 $28 $29 2009 2010 2011 2012 2013 2Q14 |
![]() • $10Bn volume • 30+ issuers • $163Bn volume • 4,000 issuers • $27Bn volume • 80 licensees • 185+ countries / territories Network Partners Payments - Increasing domestic and global acceptance Payments Strategy • Our networks offer our direct bank a unique platform for growth and differentiation • Discover to become the leading payments partner by leveraging our capabilities, flexibility, and non- traditional alliances to grow global acceptance and volume • Key Investments: – EMV – Tokenization – Emerging Payments – Global Network Payment Services Segment (3% of DFS Pre-Tax Profit) Note(s): Volume and pre-tax profit based on the trailing four quarters ending 2Q14 11 |
![]() Financial Results - 2Q14 Summary financial results Note(s): 1. 2Q13 operating expense includes $40 million of charges related to Diners Europe 2. Pre-tax, pre-provision income, which is derived by adding provision for loan losses to pre-tax income, is a non-GAAP financial measure which should be viewed in addition to, and not as a substitute for, the company’s reported results. Management believes this information helps investors understand the effect of provision for loan losses on reported results and provides an alternate presentation of the company’s performance; see appendix for reconciliation ($MM, except per share data) 2Q14 2Q13 $ % Revenue Net of Interest Expense $2,172 $2,041 $131 6% Provision for Loan Losses 360 240 (120) (50%) Operating Expense (1) 797 820 23 3% Direct Banking 984 1,002 (18) (2%) Payment Services 31 (21) 52 NM Total Pre-Tax Income 1,015 981 34 3% Pre-Tax, Pre-Provision Income (2) 1,375 1,221 154 13% Income Tax Expense 371 379 8 2% Net Income (Loss) $644 $602 $42 7% Diluted EPS $1.35 $1.20 $0.15 13% ROE 23% 23% B / (W) 12 |
![]() Benefiting from low provisions and controlling expense growth Total Expense ($Bn) (1) Provision for Loan Losses ($Bn) Note(s): 1. 2012 adjusted for $216 million in legal expenses associated primarily with the CFPB and FDIC consent order; 2013 adjusted for $40 million of charges related to Diners Europe 2. Defined as reported noninterest expense divided by total revenue (net interest income and noninterest Income) 13 $4.0 $3.0 $2.0 $1.0 $0.0 40% 30% 20% 10% 0% Non-Interest Expense Efficiency Ratio (2) 2011 2012 2013 LTM 2014 Provision for Loan Losses Reserve Release/(Build) 2011 2012 2013 LTM 2014 $1.0 $0.9 $1.1 $1.3 $2.2 $1.7 $1.2 $0.7 $0.2 ($0.3) |
![]() Driving superior returns on strong capital base Estimated 2Q14 Basel III Common Equity Tier 1 Ratio (1) Note(s): 1. Common equity tier 1 (a non-GAAP measure; see appendix for reconciliation) as a percent of risk-weighted assets under Basel III; DFS is estimated fully phased in Basel III 2. Bank holding companies participating in the 2014 Comprehensive Capital Analysis and Review (CCAR); excludes Ally Financial and Santander Holdings USA due to limited information; excludes Discover Return on Equity (%) Source: SNL, regulatory reports Source: Company filings, DFS internal estimates 14 15.1% 13.4% 12.7% 10.6% 10.1% 9.9% 9.8% DFS AXP COF C WFC BAC JPM 26% 8% 8% 24% 2012 2013 Discover Large Banks (2) |
![]() Appendix |
![]() Reconciliation of GAAP to Non-GAAP data 16 6 Months Ended (unaudited) 6/30/14 Card Pretax Return on Assets 7.2% Card Reserve Changes (0.2%) Card Pretax Return on Assets (Excluding Reserve Changes) (1) 7.0% (unaudited, $ in billions, calendar year data) 12/31/10 12/31/11 12/31/12 12/31/13 6/30/14 GAAP Recorded Balance Purchased (Private) Credit Impaired Student Loans (ending loans) $3.1 $5.2 $4.7 $4.2 $3.9 Adjustment for Purchase Accounting 0.6 0.4 0.3 0.3 0.3 Contractual Value Purchased (Private) Credit Impaired Student Loans (ending loans) (2) $3.7 $5.6 $5.0 $4.5 $4.2 GAAP Private Student Loans (ending loans) 1.0 2.1 3.1 4.0 4.3 Contractual Value Private Student Loans (ending loans) (2) $4.7 $7.7 $8.1 $8.5 $8.5 (unaudited, $ in billions, calendar year data) 12/31/10 12/31/11 12/31/12 12/31/13 6/30/14 GAAP Recorded Balance Purchased (Private) Credit Impaired Student Loans (average loans) $0.0 $3.5 $5.0 $4.4 $4.0 Adjustment for Purchase Accounting 0.0 0.5 0.4 0.3 0.3 Contractual Value Purchased (Private) Credit Impaired Student Loans (average loans) (2) $0.0 $4.1 $5.4 $4.7 $4.3 GAAP Private Student Loans (average loans) 0.9 1.7 2.6 3.6 4.3 Contractual Value Private Student Loans (average loans) (2) $0.9 $5.8 $8.0 $8.3 $8.6 (unaudited, $ in millions, calendar year data) 12/31/10 12/31/11 12/31/12 12/31/13 6/30/14 GAAP Private Student Loan Net Principal Charge-offs $3.3 $8.1 $19.8 $46.1 $27.8 Adjustment for Purchased (Private) Credit Impaired Student Loans Net Principal Charge-offs - 47.5 70.8 60.1 12.5 $3.3 $55.6 $90.6 $106.2 $40.3 Contractual Net Charge-off Rate 0.37% 0.96% 1.14% 1.28% 0.94% Note(s): 2. The contractual value of the purchased private student loan portfolio is a non-GAAP measure and represents purchased private student loans excluding the purchase accounting discount. The contractual value of the private student loan portfolio is meaningful to investors to understand total outstanding student loan balances without the purchase accounting discount 3. Contractual private student loan net principal charge-offs is a non-GAAP measure and include net charge-offs on purchase credit impaired loans. Under GAAP any losses on such loans are charged against the nonaccretable difference established in purchased credit impaired accounting and are not reported as charge-offs. Contractual net principal charge-offs is meaningful to investors to see total portfolio losses 1. Card pre-tax return on assets excluding loss reserve changes is a non-GAAP measure and represents the pre-tax earnings of Discover's U.S. credit card business excluding changes to the allowance for loan loss reserve. Card pre-tax return on assets excluding loss reserve changes is a meaningful measure to investors because it provides a competitive performance benchmark Contractual Private Student Loan Net Principal Charge-offs (3) |
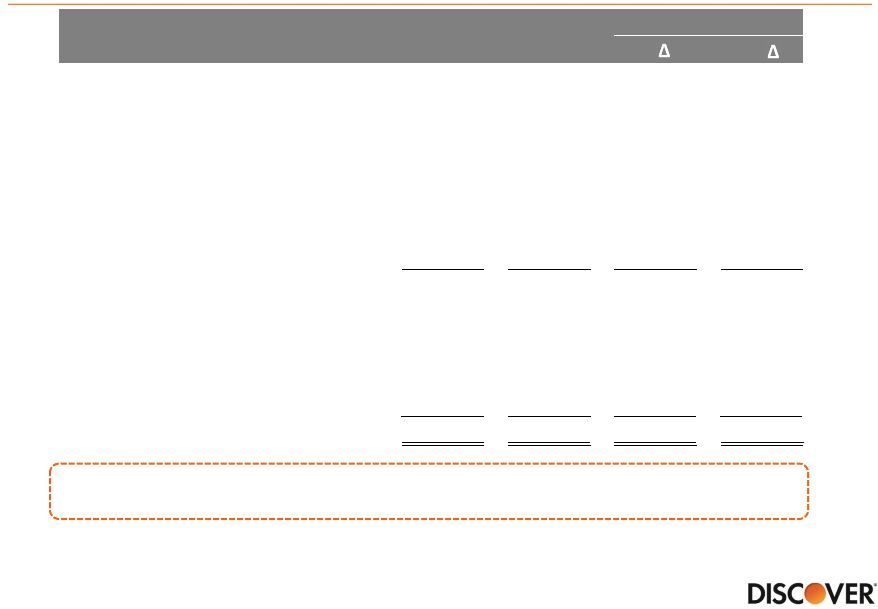
![]() Reconciliation of GAAP to Non-GAAP data (cont’d) Note(s): 1. Pre-tax, pre-provision income, which is derived by adding provision for loan losses to pre-tax income, is a non-GAAP financial measure which should be viewed in addition to, and not as a substitute for, the company's reported results. Management believes this information helps investors understand the effect of provision for loan losses on reported results and provides an alternate presentation of the company's performance 2. Common equity tier 1, a non-GAAP financial measure, represents common equity and the effect of certain items in accumulated other comprehensive income (loss) excluded from common equity tier 1, less goodwill and intangibles. A reconciliation of common equity tier 1 to common equity, a GAAP financial measure, is shown above. Other financial services companies may also use common equity tier 1 and definitions may vary, so we advise users of this information to exercise caution in comparing common equity tier 1 of different companies. Common equity tier 1 is included to support the common equity tier 1 ratio which is meaningful to investors to assess the quality and composition of the Company’s capital 3. Calculations based on fully phased in Basel III 4. Common equity tier 1 ratio is calculated using total common equity tier 1, a non-GAAP measure, divided by risk weighted assets 17 Quarter Ended (unaudited,$ in millions) 6/30/14 6/30/13 Provision for loan losses $360 $240 Income before income taxes 1,015 981 Pre-tax, pre-provision income (1) $1,375 $1,221 (unaudited, $ in millions) 6/30/14 Common Equity Tier 1 Capital Reconciliation GAAP total common equity $10,821 Effect of certain items in accumulated other comprehensive income (loss) excluded from tier 1 common equity 73 Less: ineligible goodwill and intangible assets (439) Estimated total common equity tier 1 (2)(3) $10,455 Estimated risk weighted assets (3) $69,104 Estimated common equity tier 1 ratio (3)(4) 15.1% |