 David Nelms, Chairman & CEO Mark Graf, EVP & CFO December 10, 2014 2014 Goldman Sachs U.S. Financial Services Conference ©2014 DISCOVER FINANCIAL SERVICES Exhibit 99.1 |
 2 Notice The following slides are part of a presentation by Discover Financial Services (the "Company") and are intended to be viewed as part of that presentation. No representation is made that the information in these slides is complete. The presentation contains forward-looking statements. You are cautioned not to place undue reliance on forward-looking statements, which speak only as of the date on which they are made, which reflect management’s estimates, projections, expectations or beliefs at that time, and which are subject to risks and uncertainties that may cause actual results to differ materially. For a discussion of certain risks and uncertainties that may affect the future results of the Company, please see "Special Note Regarding Forward-Looking Statements," "Risk Factors," "Business – Competition," "Business – Supervision and Regulation" and "Management’s Discussion and Analysis of Financial Condition and Results of Operations" in the Company’s Annual Report on Form 10-K for the year ended December 31, 2013 and "Management’s Discussion and Analysis of Financial Condition and Results of Operations" in the Company's Quarterly Reports on Form 10-Q for the quarters ended March 31, 2014, June 30, 2014 and September 30, 2014, which are available on the Company’s website and the SEC’s website. The Company does not undertake to update or revise forward-looking statements as more information becomes available. of We own or have rights to use the trademarks, trade names and service marks that we use in conjunction with the operation our business, including, but not limited to: Discover ® , PULSE ® , Cashback Bonus ® , Discover Cashback Checking SM , Discover it ® , Discover ® Network and Diners Club International ® . All other trademarks, trade names and service marks included in this presentation are the property of their respective owners. |
 3 Executive summary • Positioning to be the leading direct bank and payments partner • Achieving higher returns through direct banking strategy • Driving better card loan growth with disciplined credit risk • Additional topics of interest: – Enhancing cardmember security – Extending funding duration to partially mitigate the impact of rising rates – Dedicating significant resources to regulatory and compliance initiatives |
 4 Company Overview - Positioning to be leading direct bank and payments partner • $4.8Bn personal loans - $2.8Bn in originations - 1.9% net charge-off rate • $8.5Bn private student loans - $1.2Bn in originations - 1.1% net charge-off rate (excl. PCI loans) • $29Bn direct-to-consumer deposits - 43% of funding - 62% of accounts have a loan product relationship with DFS - >100k Cashback Checking accounts Discover Consumer Lending & Banking Note(s) Balances as of 9/30/14; net charge-off rates as of 3Q14; originations and volumes based on the trailing four quarters ending 3Q14; direct-to-consumer deposits includes affinity deposits • $54Bn in card receivables • Leading cash rewards program • 1 in 4 U.S. households Discover Card • $319Bn volume (incl. proprietary cards) • 30MM+ acceptance locations globally • $140MM+ in merchant funded rewards annually Payments |
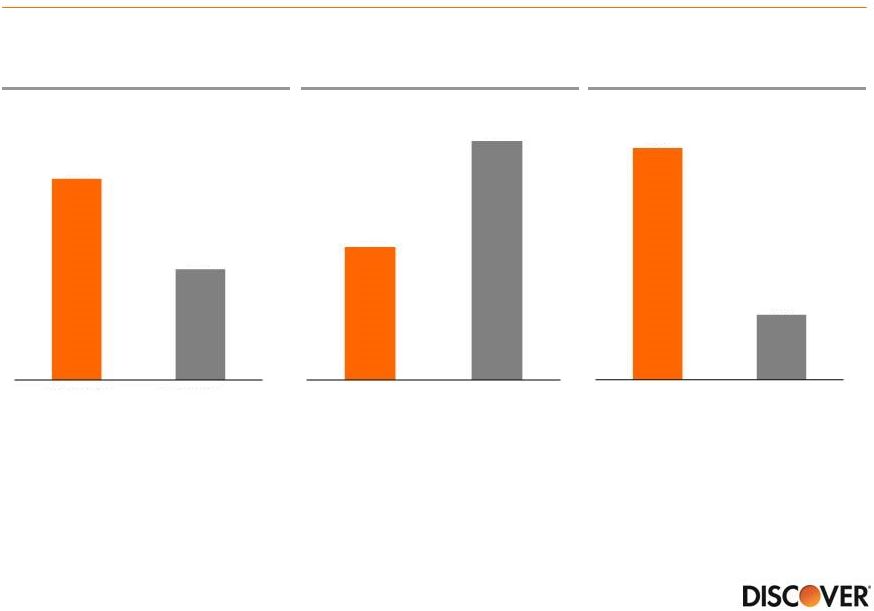 5 Company Overview - Driving faster loan growth, better efficiencies and returns 2009-2013 Average Efficiency Ratio (1) (2) Note(s) 1. Defined as total operating expense divided by revenue net of interest expense 2. Bank holding companies participating in the 2014 Comprehensive Capital Analysis and Review (CCAR); excludes Ally Financial and Santander Holdings USA due to limited information; excludes Discover 3. 2009 adjusted to exclude $1.4 billion ($0.9 billion after taxes) Visa and MasterCard settlement 2009-2013 Average Return on Equity (3) (2) Source SNL, regulatory reports; Discover 2009-2013 CAGR Total Loan Growth (%) (2) 6% 3% Discover Large Banks 37% 66% Discover Large Banks 19% 5% Discover Large Banks |
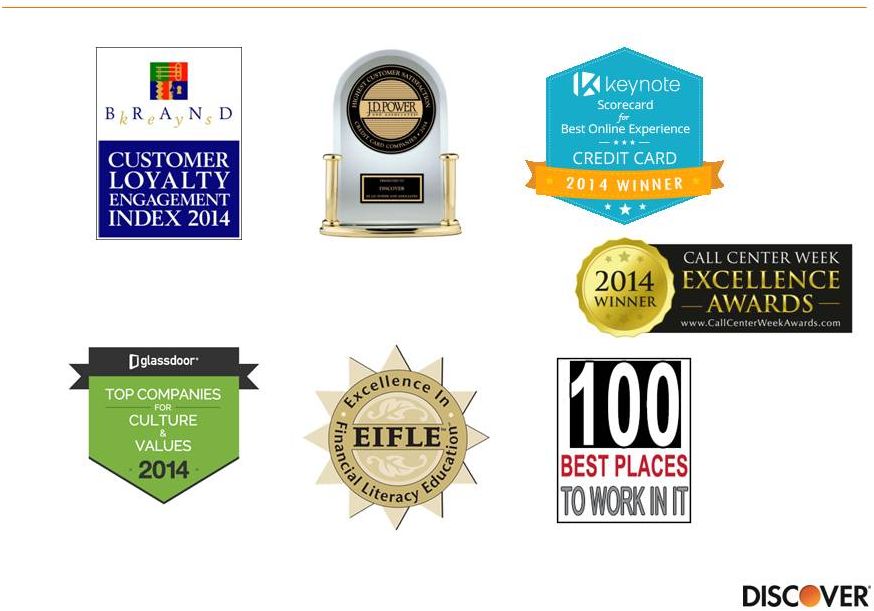 6 “Highest in Customer Satisfaction with Credit Card Company Overview – Recognized industry leader #1 or tied for #1 18 years in a row Note(s) 1. Discover received the highest numerical score among credit card issuers in a tie in the proprietary J.D. Power 2014 Credit Card Satisfaction Study SM . Study based on responses from 19,913 consumers measuring 11 card issuers and measures opinions of consumers about the issuer of their primary credit card. Proprietary study results are based on experiences and perceptions of consumers surveyed in September 2013-May 2014. Your experiences may vary. Visit jdpower.com According to Computerworld.com in 2014 Companies - Tied in 2014” (1) |
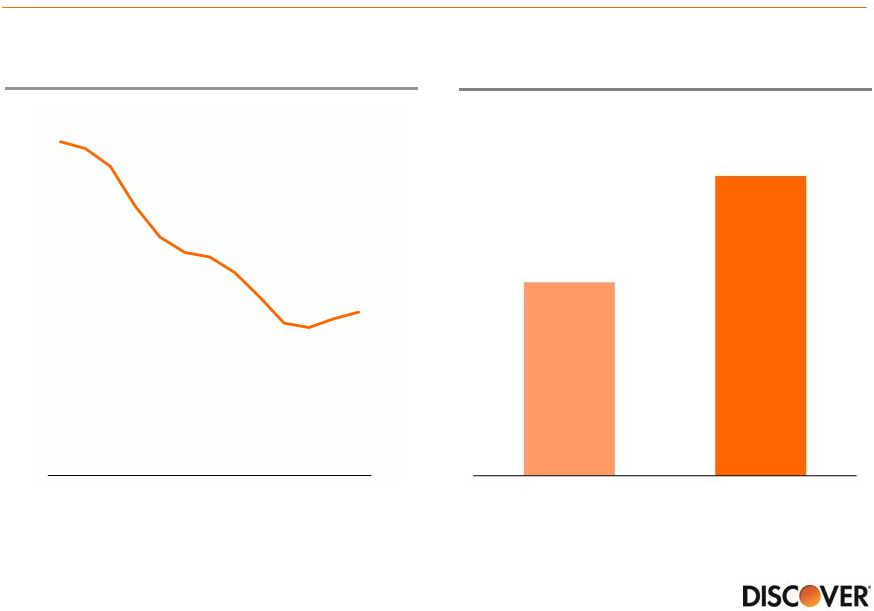
 Card – Driving better loan growth and credit performance Card Loans (%YOY) (1) Source SEC filings, calendar year data, internal estimates Card Net Charge-off Rate (%) (2) 0.0% 2.0% 4.0% 6.0% 8.0% 10.0% 12.0% 3Q08 3Q09 3Q10 3Q11 3Q12 3Q13 3Q14 Discover Peer Group October 2014 2.1% -15.0% -10.0% -5.0% 0.0% 5.0% 10.0% 3Q08 3Q09 3Q10 3Q11 3Q12 3Q13 3Q14 Discover Peer Group 6.6% 2.1% 1. Includes weighted average card receivables growth for American Express (U.S. Card), Bank of America (U.S. Card), Capital One (U.S. Card excl. HSBC for 2Q12-1Q13 and installment loans), Citi (Citi-branded Cards N.A.), Wells Fargo (Consumer Credit Card Portfolio), and JPMorgan Chase (Card Services) 2. Weighted average rate; includes U.S. card net charge-off rates for Citi (Citi-branded Cards N.A.), JPMorgan Chase (Card Services), Capital One (U.S. Card), American Express (U.S. Card) and Bank of America (U.S. Card) Note(s) 7 |
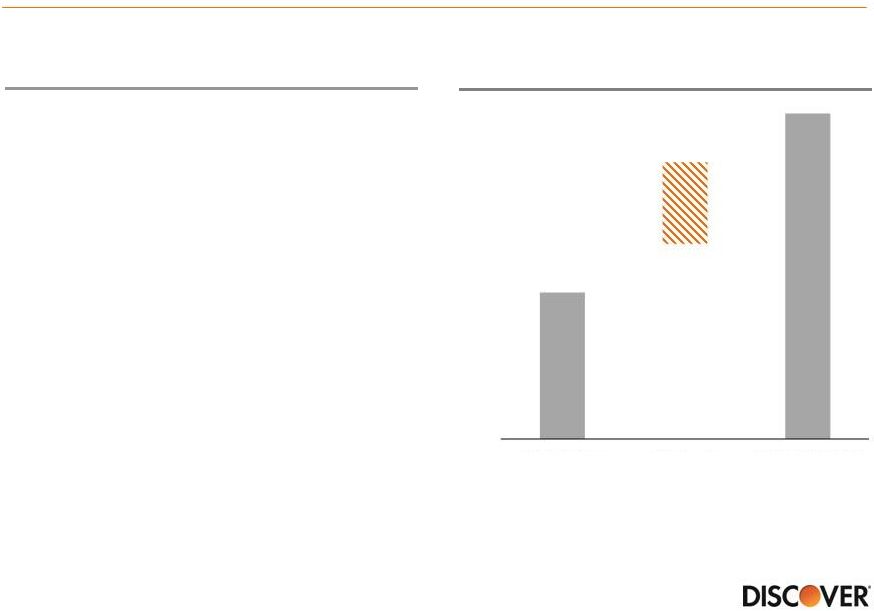
 Card - Provisioning will be driven by loan growth % of Card Portfolio on Book for <3 Years 2010-2013 Card Vintage Gross Loss Rate (1) Note(s) 1. 2010 to 2013 blended vintage 6-month moving average gross principal charge-off rate (excludes recoveries) 8 0 6 12 18 24 30 36 42 48 10% 11% 12% 13% 14% 15% 16% 17% 18% Jan-12 Jan-13 Jan-14 |
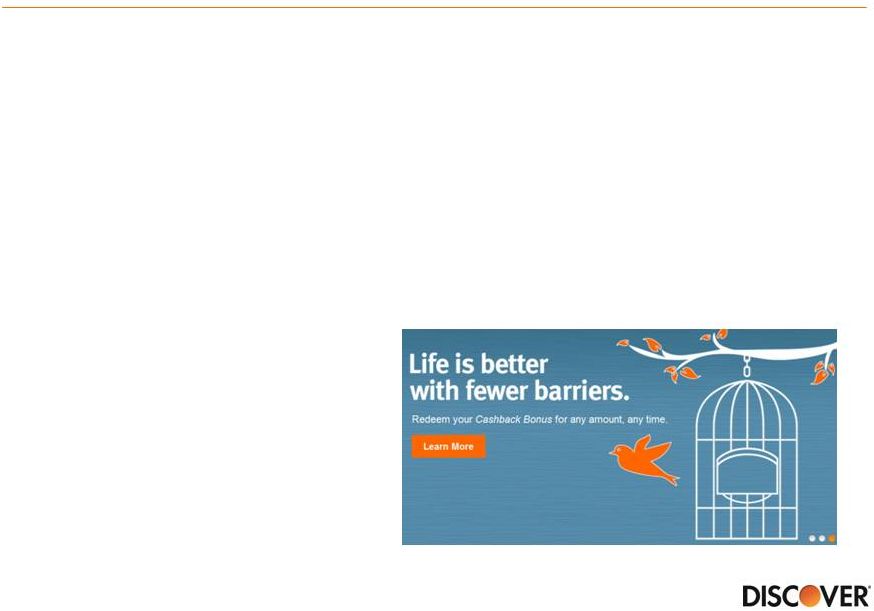 Card – Making cash rewards easier • Redemption experience is as important to a customer as earn rate • Removed redemption threshold to use rewards and eliminated forfeiture (1) – Resulted in one-time charge of approximately $178MM in 4Q14 and manageable ongoing impact of <5 bps expected annually – Delivering on brand promise: “We treat you like you’d treat you” • Continue to target features and benefits that increase loyalty and attract new customers Note(s) 1. Removed redemption thresholds for statement credits, charitable contributions, and electronic deposits in bank accounts and forfeiture of rewards due to delinquency, inactivity or account closure 9 |
 Investor Topics - Continued focus on payments security • Merchant breaches dramatically increased industry focus on payments security • Discover is preparing for migration to EMV chip and choice (PIN or SIG) for point-of-sale and tokenization for card not present transactions in 2015 • EMV card issuance and network costs expected to be an incremental $35MM+ for 2015 but should result in some expense savings longer-term • Discover’s multilayered approach designed to address security across all payment channels 10 |
 Investor Topics - NIM – less funding cost tailwind and extending duration Cost of Funds (1) Average Months to Liability Repricing (2) Note(s) 1. Rate on total interest-bearing liabilities 2. Excludes all indeterminate maturity deposits (savings and money market) and preferred stock; includes derivatives and hedging activities 11 Source Internal estimates 1.0% 1.2% 1.4% 1.6% 1.8% 2.0% 2.2% 2.4% 2.6% 3Q11 1Q12 3Q12 1Q13 3Q13 1Q14 3Q14 4Q12 4Q14E 16 25 |
 12 Investor Topics - NIM - Discover direct deposit betas will be less than “1” DFS vs. Traditional Bank Illustrative Betas (1) • Similar to “traditional” bank, strong synergy between right and left hand side of balance sheet – 62% of current accounts have a loan product relationship with DFS – 78% of new accounts have a loan product relationship with DFS • Different from “traditional” bank… – Checking deposits are still relatively small (<1% of DFS funding) – Funding stack relies on ABS, direct deposits and brokered deposits Note(s) 1. Defined as the ratio of expected change in deposit pricing relative to Federal Reserve increases in short term interest rates 0.0 0.5 1.0 Traditional Bank Deposit Pricing Discover Direct Deposit Pricing Brokered CD Pricing |
 Investor Topics - AML & BSA Update • FDIC issued consent order on 6/13/14 which requires – Improvements in Anti-Money Laundering and Bank Secrecy Act compliance (AML & BSA) program – “Look Back Review” for all transactions back to 6/30/12 – Additional staff, training and internal controls • Made progress adding staff, new technology and enhanced program in 2014 – Expect continued time and effort will be required to meet regulatory expectations – Limitations on certain expansionary transactions during remediation 13 • Federal Reserve intends to issue a supervisory action requiring enhancements to enterprise-wide AML & BSA program |
 14 Summary – YTD performance against 2014 business priorities • Grow Discover card loan share while maintaining leading credit performance • Expand direct consumer banking products – Mortgages • Grow global network volume and acceptance – Third party payments • Optimize funding, cost structure and capital position • Enhance operating model, including risk management and leadership development |