
October 20, 2015 ©2015 DISCOVER FINANCIAL SERVICES 3Q15 Financial Results Exhibit 99.3
Notice The following slides are part of a presentation by Discover Financial Services (the "Company") in connection with reporting quarterly financial results and are intended to be viewed as part of that presentation. No representation is made that the information in these slides is complete. For additional financial, statistical, and business related information, as well as information regarding business and segment trends, see the earnings release and financial supplement included as exhibits to the Company’s Current Report on Form 8-K filed today and available on the Company’s website (www.discover.com) and the SEC’s website (www.sec.gov). The information provided herein includes certain non-GAAP financial measures. The reconciliations of such measures to the comparable GAAP figures are included at the end of this presentation, which is available on the Company’s website and the SEC’s website. The presentation contains forward-looking statements. You are cautioned not to place undue reliance on forward-looking statements, which speak only as of the date on which they are made, which reflect management’s estimates, projections, expectations or beliefs at that time, and which are subject to risks and uncertainties that may cause actual results to differ materially. For a discussion of certain risks and uncertainties that may affect the future results of the Company, please see "Special Note Regarding Forward-Looking Statements," "Risk Factors," "Business – Competition," "Business – Supervision and Regulation" and "Management’s Discussion and Analysis of Financial Condition and Results of Operations" in the Company’s Annual Report on Form 10-K for the year ended December 31, 2014 and under “Management's Discussion and Analysis of Financial Condition and Results of Operations” in the company's Quarterly Report on Form 10-Q for the quarters ended March 31, 2015 and June 30, 2015, which are filed with the SEC and available at the SEC's website (www.sec.gov). The Company does not undertake to update or revise forward-looking statements as more information becomes available. 2
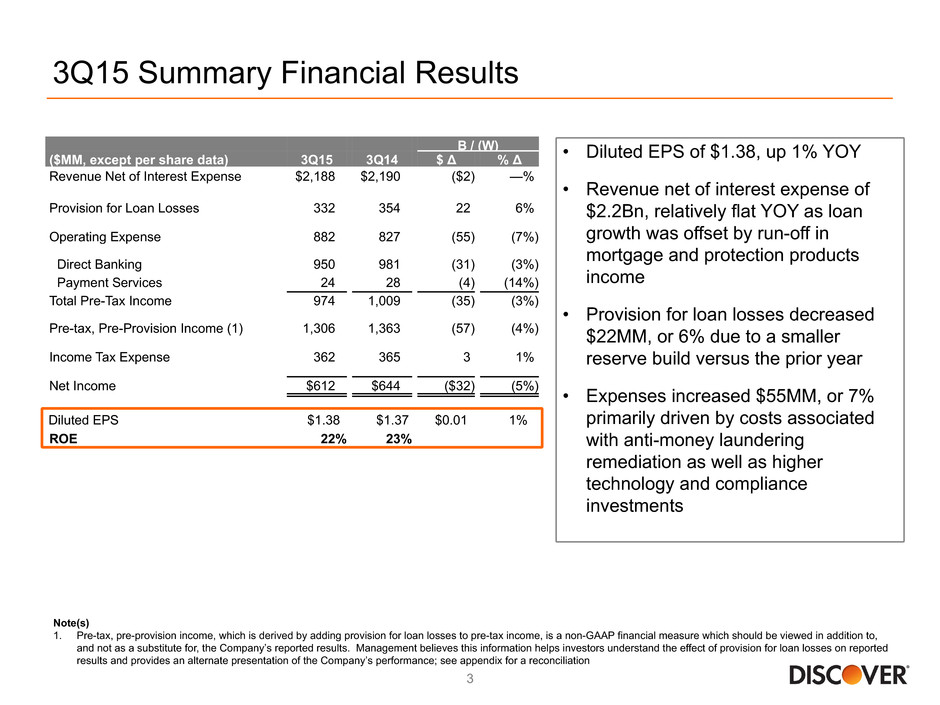
B / (W) ($MM, except per share data) 3Q15 3Q14 $ Δ % Δ Revenue Net of Interest Expense $2,188 $2,190 ($2) —% Provision for Loan Losses 332 354 22 6% Operating Expense 882 827 (55) (7%) Direct Banking 950 981 (31) (3%) Payment Services 24 28 (4) (14%) Total Pre-Tax Income 974 1,009 (35) (3%) Pre-tax, Pre-Provision Income (1) 1,306 1,363 (57) (4%) Income Tax Expense 362 365 3 1% Net Income $612 $644 ($32) (5%) ROE 22% 23% 3Q15 Summary Financial Results • Diluted EPS of $1.38, up 1% YOY • Revenue net of interest expense of $2.2Bn, relatively flat YOY as loan growth was offset by run-off in mortgage and protection products income • Provision for loan losses decreased $22MM, or 6% due to a smaller reserve build versus the prior year • Expenses increased $55MM, or 7% primarily driven by costs associated with anti-money laundering remediation as well as higher technology and compliance investments 3 Diluted EPS $1.38 $1.37 $0.01 1% Note(s) 1. Pre-tax, pre-provision income, which is derived by adding provision for loan losses to pre-tax income, is a non-GAAP financial measure which should be viewed in addition to, and not as a substitute for, the Company’s reported results. Management believes this information helps investors understand the effect of provision for loan losses on reported results and provides an alternate presentation of the Company’s performance; see appendix for a reconciliation
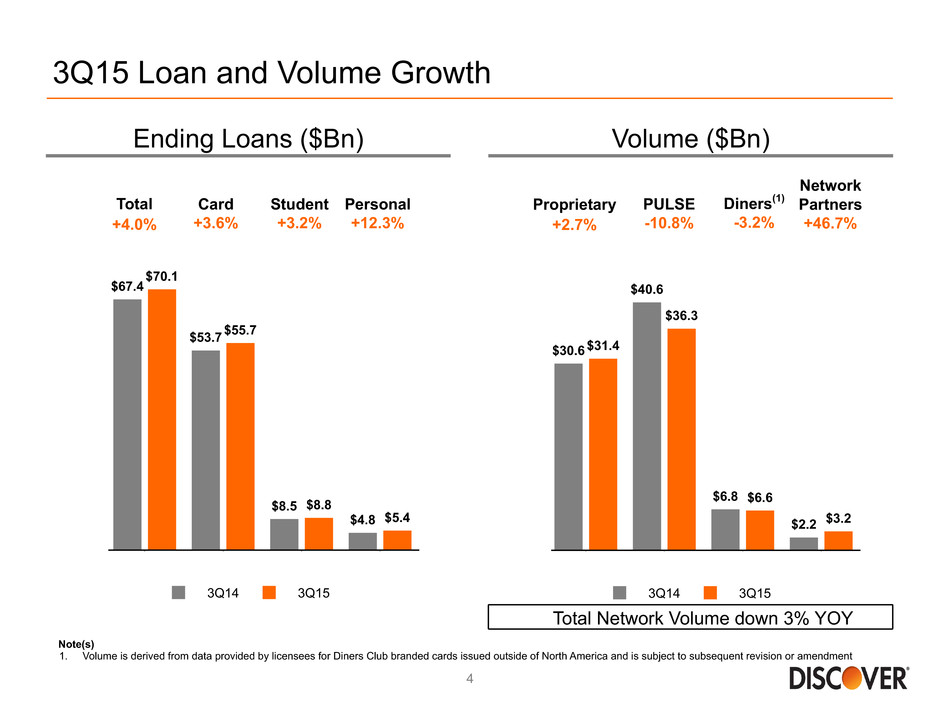
3Q14 3Q15 80 70 60 50 40 30 20 10 0 $67.4 $53.7 $8.5 $4.8 $70.1 $55.7 $8.8 $5.4 3Q14 3Q15 50 40 30 20 10 0 $30.6 $40.6 $6.8 $2.2 $31.4 $36.3 $6.6 $3.2 3Q15 Loan and Volume Growth 4 Volume ($Bn)Ending Loans ($Bn) Note(s) 1. Volume is derived from data provided by licensees for Diners Club branded cards issued outside of North America and is subject to subsequent revision or amendment Total +4.0% Card +3.6% Student +3.2% Personal +12.3% PULSE -10.8% Diners(1) -3.2% Network Partners +46.7% Proprietary +2.7% Total Network Volume down 3% YOY
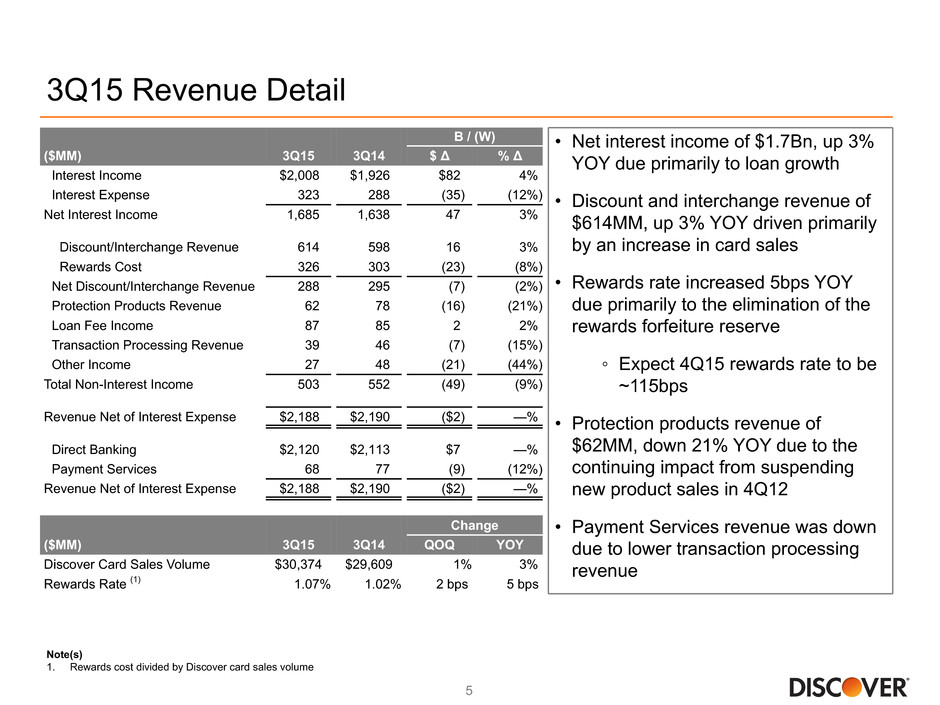
3Q15 Revenue Detail • Net interest income of $1.7Bn, up 3% YOY due primarily to loan growth • Discount and interchange revenue of $614MM, up 3% YOY driven primarily by an increase in card sales • Rewards rate increased 5bps YOY due primarily to the elimination of the rewards forfeiture reserve ◦ Expect 4Q15 rewards rate to be ~115bps • Protection products revenue of $62MM, down 21% YOY due to the continuing impact from suspending new product sales in 4Q12 • Payment Services revenue was down due to lower transaction processing revenue Note(s) 1. Rewards cost divided by Discover card sales volume 5 B / (W) ($MM) 3Q15 3Q14 $ Δ % Δ Interest Income $2,008 $1,926 $82 4% Interest Expense 323 288 (35) (12%) Net Interest Income 1,685 1,638 47 3% Discount/Interchange Revenue 614 598 16 3% Rewards Cost 326 303 (23) (8%) Net Discount/Interchange Revenue 288 295 (7) (2%) Protection Products Revenue 62 78 (16) (21%) Loan Fee Income 87 85 2 2% Transaction Processing Revenue 39 46 (7) (15%) Other Income 27 48 (21) (44%) Total Non-Interest Income 503 552 (49) (9%) Revenue Net of Interest Expense $2,188 $2,190 ($2) —% Direct Banking $2,120 $2,113 $7 —% Payment Services 68 77 (9) (12%) Revenue Net of Interest Expense $2,188 $2,190 ($2) —% Change ($MM) 3Q15 3Q14 QOQ YOY Discover Card Sales Volume $30,374 $29,609 1% 3% Rewards Rate (1) 1.07% 1.02% 2 bps 5 bps
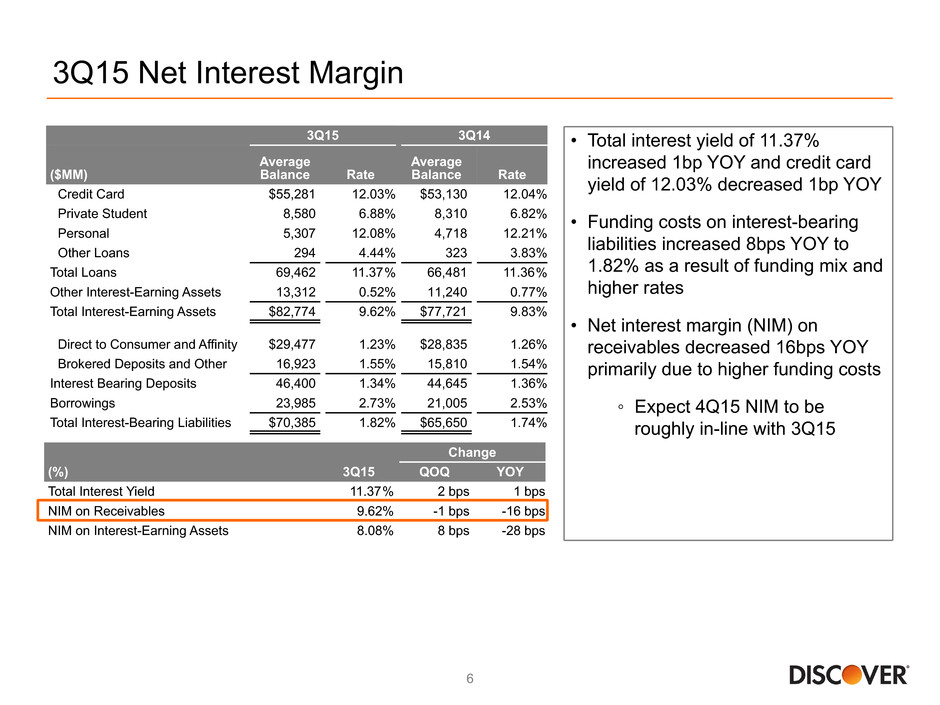
3Q15 Net Interest Margin 6 • Total interest yield of 11.37% increased 1bp YOY and credit card yield of 12.03% decreased 1bp YOY • Funding costs on interest-bearing liabilities increased 8bps YOY to 1.82% as a result of funding mix and higher rates • Net interest margin (NIM) on receivables decreased 16bps YOY primarily due to higher funding costs ◦ Expect 4Q15 NIM to be roughly in-line with 3Q15 Change (%) 3Q15 QOQ YOY Total Interest Yield 11.37% 2 bps 1 bps NIM on Receivables 9.62% -1 bps -16 bps NIM on Interest-Earning Assets 8.08% 8 bps -28 bps 3Q15 3Q14 ($MM) Average Balance Rate Average Balance Rate Credit Card $55,281 12.03% $53,130 12.04% Private Student 8,580 6.88% 8,310 6.82% Personal 5,307 12.08% 4,718 12.21% Other Loans 294 4.44% 323 3.83% Total Loans 69,462 11.37% 66,481 11.36% Other Interest-Earning Assets 13,312 0.52% 11,240 0.77% Total Interest-Earning Assets $82,774 9.62% $77,721 9.83% Direct to Consumer and Affinity $29,477 1.23% $28,835 1.26% Brokered Deposits and Other 16,923 1.55% 15,810 1.54% Interest Bearing Deposits 46,400 1.34% 44,645 1.36% Borrowings 23,985 2.73% 21,005 2.53% Total Interest-Bearing Liabilities $70,385 1.82% $65,650 1.74%
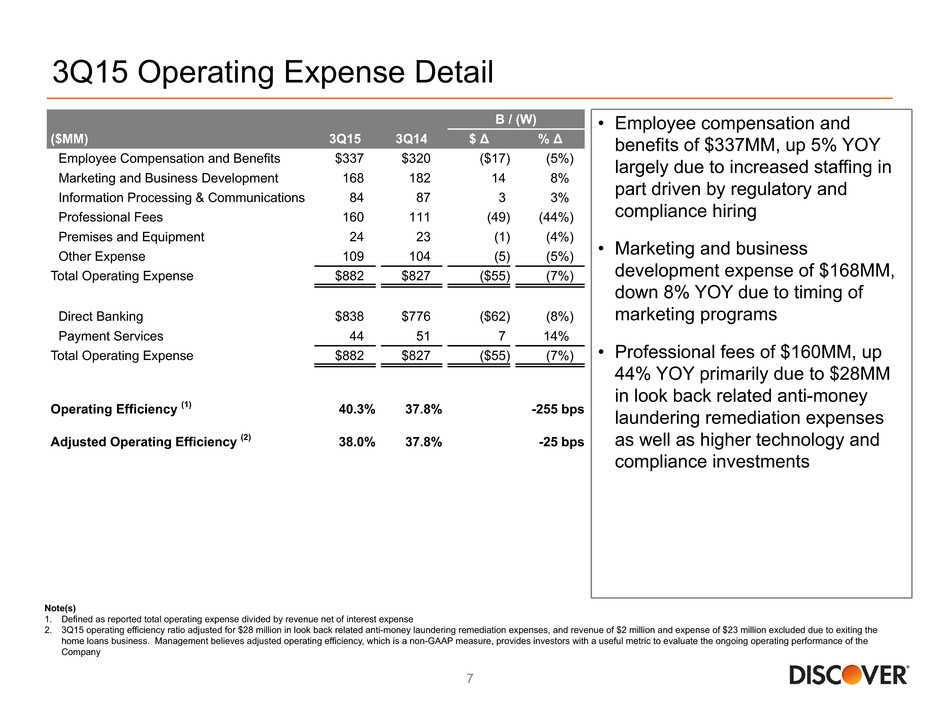
B / (W) ($MM) 3Q15 3Q14 $ Δ % Δ Employee Compensation and Benefits $337 $320 ($17) (5%) Marketing and Business Development 168 182 14 8% Information Processing & Communications 84 87 3 3% Professional Fees 160 111 (49) (44%) Premises and Equipment 24 23 (1) (4%) Other Expense 109 104 (5) (5%) Total Operating Expense $882 $827 ($55) (7%) Direct Banking $838 $776 ($62) (8%) Payment Services 44 51 7 14% Total Operating Expense $882 $827 ($55) (7%) Operating Efficiency (1) 40.3% 37.8% -255 bps Adjusted Operating Efficiency (2) 38.0% 37.8% -25 bps 3Q15 Operating Expense Detail 7 • Employee compensation and benefits of $337MM, up 5% YOY largely due to increased staffing in part driven by regulatory and compliance hiring • Marketing and business development expense of $168MM, down 8% YOY due to timing of marketing programs • Professional fees of $160MM, up 44% YOY primarily due to $28MM in look back related anti-money laundering remediation expenses as well as higher technology and compliance investments Note(s) 1. Defined as reported total operating expense divided by revenue net of interest expense 2. 3Q15 operating efficiency ratio adjusted for $28 million in look back related anti-money laundering remediation expenses, and revenue of $2 million and expense of $23 million excluded due to exiting the home loans business. Management believes adjusted operating efficiency, which is a non-GAAP measure, provides investors with a useful metric to evaluate the ongoing operating performance of the Company
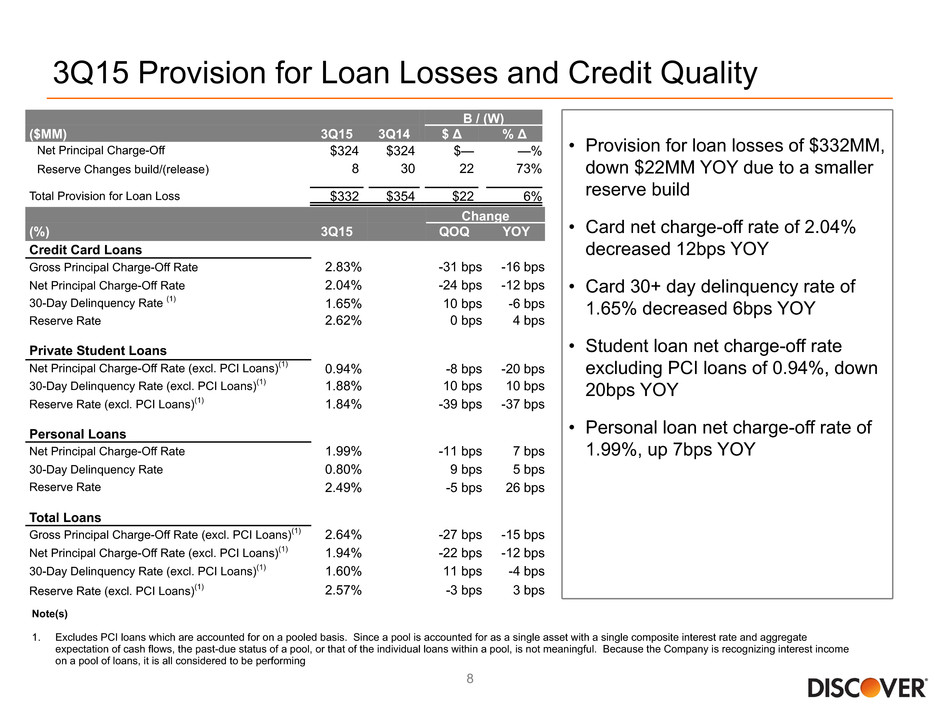
3Q15 Provision for Loan Losses and Credit Quality 8 • Provision for loan losses of $332MM, down $22MM YOY due to a smaller reserve build • Card net charge-off rate of 2.04% decreased 12bps YOY • Card 30+ day delinquency rate of 1.65% decreased 6bps YOY • Student loan net charge-off rate excluding PCI loans of 0.94%, down 20bps YOY • Personal loan net charge-off rate of 1.99%, up 7bps YOY Note(s) 1. Excludes PCI loans which are accounted for on a pooled basis. Since a pool is accounted for as a single asset with a single composite interest rate and aggregate expectation of cash flows, the past-due status of a pool, or that of the individual loans within a pool, is not meaningful. Because the Company is recognizing interest income on a pool of loans, it is all considered to be performing B / (W) ($MM) 3Q15 3Q14 $ Δ % Δ Net Principal Charge-Off $324 $324 $— —% Reserve Changes build/(release) 8 30 22 73% Total Provision for Loan Loss $332 $354 $22 6% Change (%) 3Q15 QOQ YOY Credit Card Loans Gross Principal Charge-Off Rate 2.83% -31 bps -16 bps Net Principal Charge-Off Rate 2.04% -24 bps -12 bps 30-Day Delinquency Rate (1) 1.65% 10 bps -6 bps Reserve Rate 2.62% 0 bps 4 bps Private Student Loans Net Principal Charge-Off Rate (excl. PCI Loans)(1) 0.94% -8 bps -20 bps 30-Day Delinquency Rate (excl. PCI Loans)(1) 1.88% 10 bps 10 bps Reserve Rate (excl. PCI Loans)(1) 1.84% -39 bps -37 bps Personal Loans Net Principal Charge-Off Rate 1.99% -11 bps 7 bps 30-Day Delinquency Rate 0.80% 9 bps 5 bps Reserve Rate 2.49% -5 bps 26 bps Total Loans Gross Principal Charge-Off Rate (excl. PCI Loans)(1) 2.64% -27 bps -15 bps Net Principal Charge-Off Rate (excl. PCI Loans)(1) 1.94% -22 bps -12 bps 30-Day Delinquency Rate (excl. PCI Loans)(1) 1.60% 11 bps -4 bps Reserve Rate (excl. PCI Loans)(1) 2.57% -3 bps 3 bps
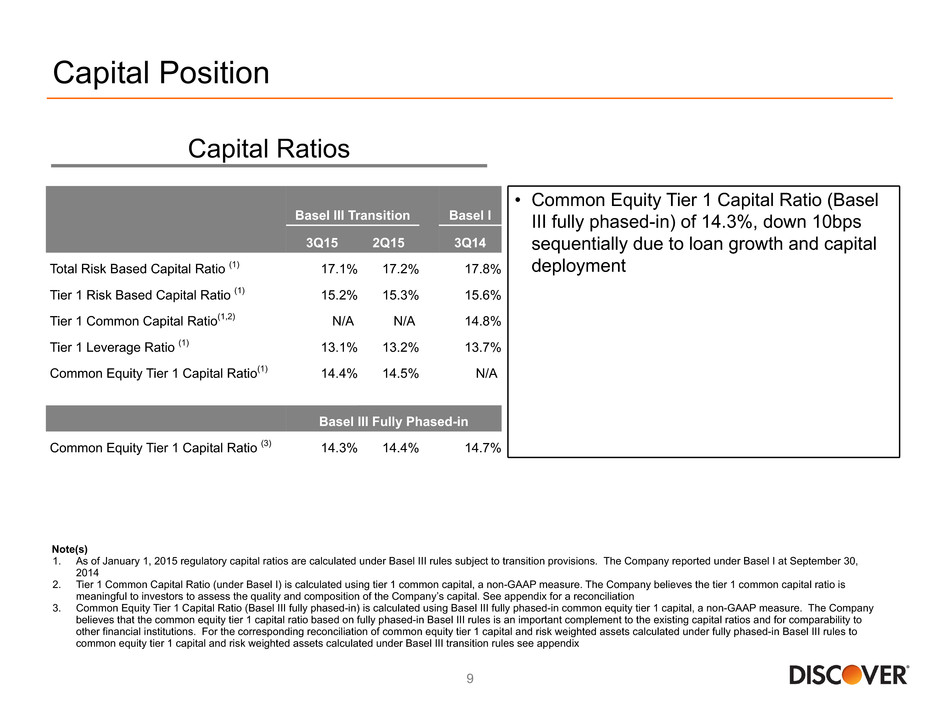
Capital Position 9 Note(s) 1. As of January 1, 2015 regulatory capital ratios are calculated under Basel III rules subject to transition provisions. The Company reported under Basel I at September 30, 2014 2. Tier 1 Common Capital Ratio (under Basel I) is calculated using tier 1 common capital, a non-GAAP measure. The Company believes the tier 1 common capital ratio is meaningful to investors to assess the quality and composition of the Company’s capital. See appendix for a reconciliation 3. Common Equity Tier 1 Capital Ratio (Basel III fully phased-in) is calculated using Basel III fully phased-in common equity tier 1 capital, a non-GAAP measure. The Company believes that the common equity tier 1 capital ratio based on fully phased-in Basel III rules is an important complement to the existing capital ratios and for comparability to other financial institutions. For the corresponding reconciliation of common equity tier 1 capital and risk weighted assets calculated under fully phased-in Basel III rules to common equity tier 1 capital and risk weighted assets calculated under Basel III transition rules see appendix Capital Ratios • Common Equity Tier 1 Capital Ratio (Basel III fully phased-in) of 14.3%, down 10bps sequentially due to loan growth and capital deployment Basel III Transition Basel I 3Q15 2Q15 3Q14 Total Risk Based Capital Ratio (1) 17.1% 17.2% 17.8% Tier 1 Risk Based Capital Ratio (1) 15.2% 15.3% 15.6% Tier 1 Common Capital Ratio(1,2) N/A N/A 14.8% Tier 1 Leverage Ratio (1) 13.1% 13.2% 13.7% Common Equity Tier 1 Capital Ratio(1) 14.4% 14.5% N/A Basel III Fully Phased-in Common Equity Tier 1 Capital Ratio (3) 14.3% 14.4% 14.7%

Appendix

Reconciliation of GAAP to Non-GAAP Data Note(s) 1. Pre-tax, pre-provision income, which is derived by adding provision for loan losses to pre-tax income, is a non-GAAP financial measure which should be viewed in addition to, and not as a substitute for, the company's reported results. Management believes this information helps investors understand the effect of provision for loan losses on reported results and provides an alternate presentation of the Company's performance 2. Adjusted operating efficiency is calculated using adjusted operating expense, a non-GAAP measure, divided by revenue net of interest expense. Management believes this information provides investors with a useful metric to evaluate the ongoing operating performance of the Company 11 Quarter Ended (unaudited, in millions) Sep 30, 2015 Sep 30, 2014 Provision for loan losses $332 $354 Income before income taxes 974 1,009 Pre-tax, pre-provision income (1) $1,306 $1,363 Revenue net of interest expense $2,188 $2,190 Excluding 3Q15 revenue associated with the Home Loans business 2 — Adjusted revenue net of interest expense $2,186 $2,190 Total operating expense 882 827 Excluding 3Q15 look back related anti-money laundering remediation expenses 28 — Excluding 3Q15 expense associated with the Home Loans business 23 — Adjusted operating expense $831 $827 Adjusted operating efficiency (2) 38.0% 37.8%
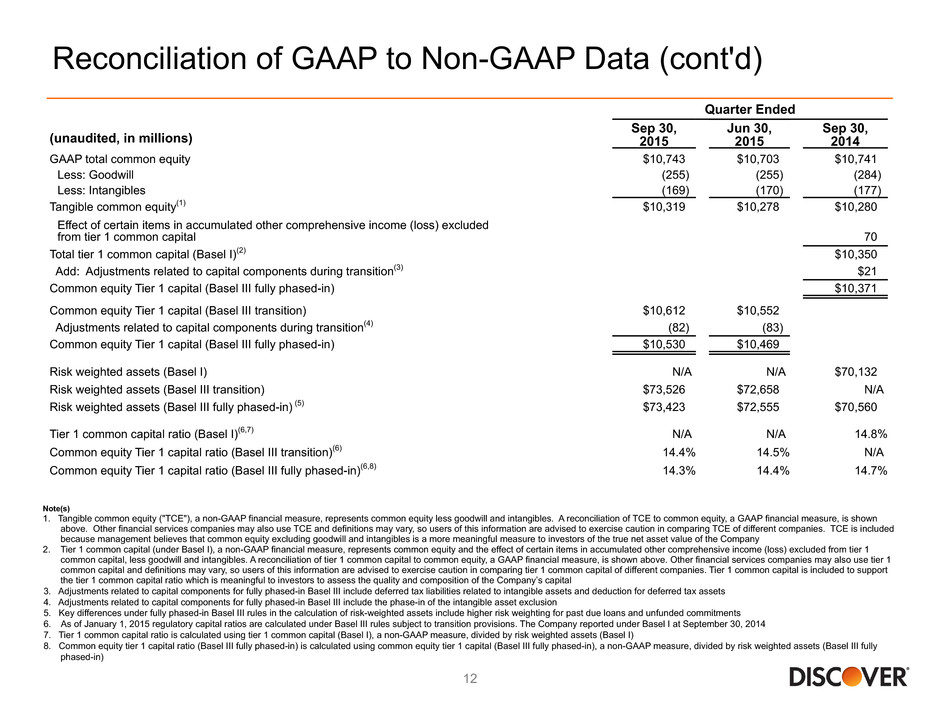
Reconciliation of GAAP to Non-GAAP Data (cont'd) Quarter Ended (unaudited, in millions) Sep 30, 2015 Jun 30, 2015 Sep 30, 2014 Note(s) 1. Tangible common equity ("TCE"), a non-GAAP financial measure, represents common equity less goodwill and intangibles. A reconciliation of TCE to common equity, a GAAP financial measure, is shown above. Other financial services companies may also use TCE and definitions may vary, so users of this information are advised to exercise caution in comparing TCE of different companies. TCE is included because management believes that common equity excluding goodwill and intangibles is a more meaningful measure to investors of the true net asset value of the Company 2. Tier 1 common capital (under Basel I), a non-GAAP financial measure, represents common equity and the effect of certain items in accumulated other comprehensive income (loss) excluded from tier 1 common capital, less goodwill and intangibles. A reconciliation of tier 1 common capital to common equity, a GAAP financial measure, is shown above. Other financial services companies may also use tier 1 common capital and definitions may vary, so users of this information are advised to exercise caution in comparing tier 1 common capital of different companies. Tier 1 common capital is included to support the tier 1 common capital ratio which is meaningful to investors to assess the quality and composition of the Company’s capital 3. Adjustments related to capital components for fully phased-in Basel III include deferred tax liabilities related to intangible assets and deduction for deferred tax assets 4. Adjustments related to capital components for fully phased-in Basel III include the phase-in of the intangible asset exclusion 5. Key differences under fully phased-in Basel III rules in the calculation of risk-weighted assets include higher risk weighting for past due loans and unfunded commitments 6. As of January 1, 2015 regulatory capital ratios are calculated under Basel III rules subject to transition provisions. The Company reported under Basel I at September 30, 2014 7. Tier 1 common capital ratio is calculated using tier 1 common capital (Basel I), a non-GAAP measure, divided by risk weighted assets (Basel I) 8. Common equity tier 1 capital ratio (Basel III fully phased-in) is calculated using common equity tier 1 capital (Basel III fully phased-in), a non-GAAP measure, divided by risk weighted assets (Basel III fully phased-in) 12 GAAP total common equity $10,743 $10,703 $10,741 Less: Goodwill (255) (255) (284) Less: Intangibles (169) (170) (177) Tangible common equity(1) $10,319 $10,278 $10,280 Effect of certain items in accumulated other comprehensive income (loss) excluded from tier 1 common capital 70 Total tier 1 common capital (Basel I)(2) $10,350 Add: Adjustments related to capital components during transition(3) $21 Common equity Tier 1 capital (Basel III fully phased-in) $10,371 Common equity Tier 1 capital (Basel III transition) $10,612 $10,552 Adjustments related to capital components during transition(4) (82) (83) Common equity Tier 1 capital (Basel III fully phased-in) $10,530 $10,469 Risk weighted assets (Basel I) N/A N/A $70,132 Risk weighted assets (Basel III transition) $73,526 $72,658 N/A Risk weighted assets (Basel III fully phased-in) (5) $73,423 $72,555 $70,560 Tier 1 common capital ratio (Basel I)(6,7) N/A N/A 14.8% Common equity Tier 1 capital ratio (Basel III transition)(6) 14.4% 14.5% N/A Common equity Tier 1 capital ratio (Basel III fully phased-in)(6,8) 14.3% 14.4% 14.7%