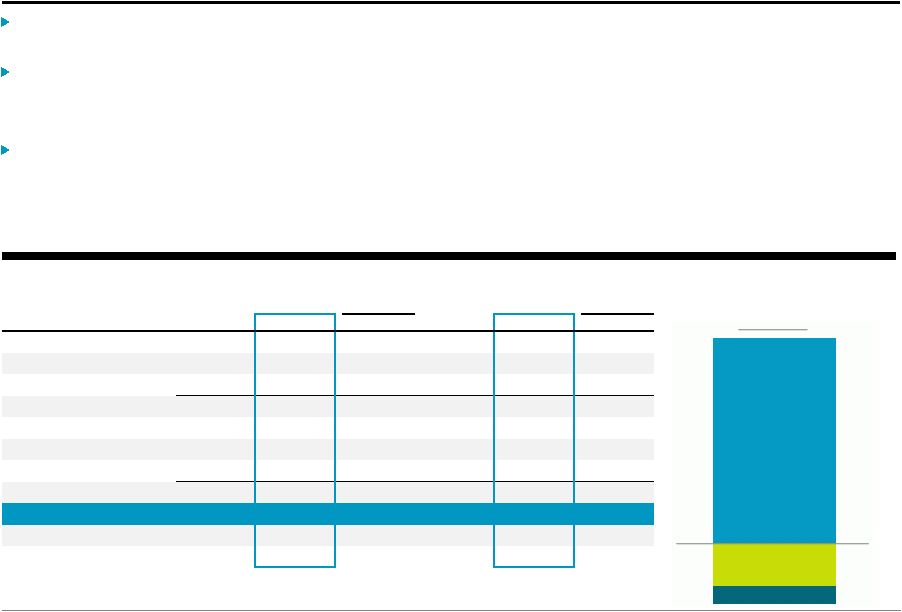
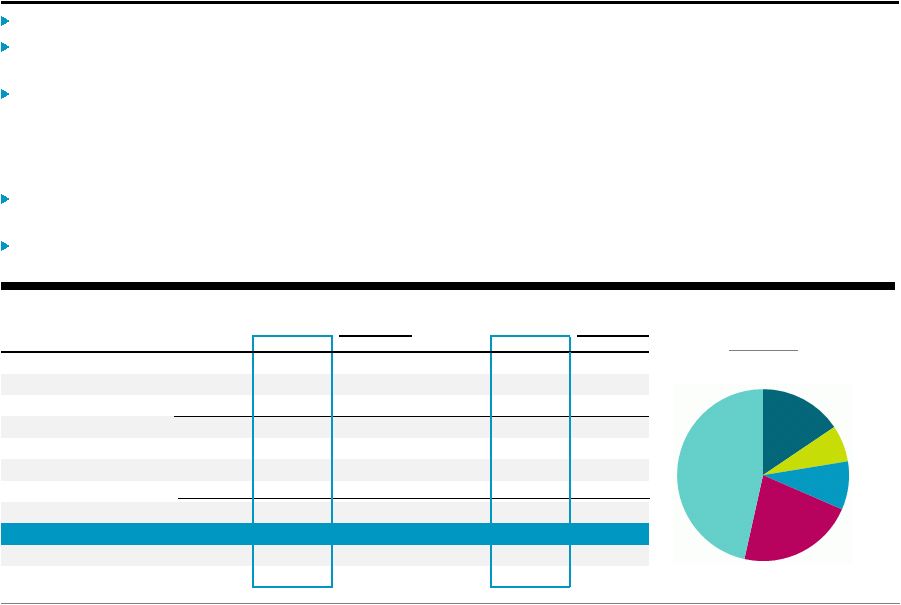
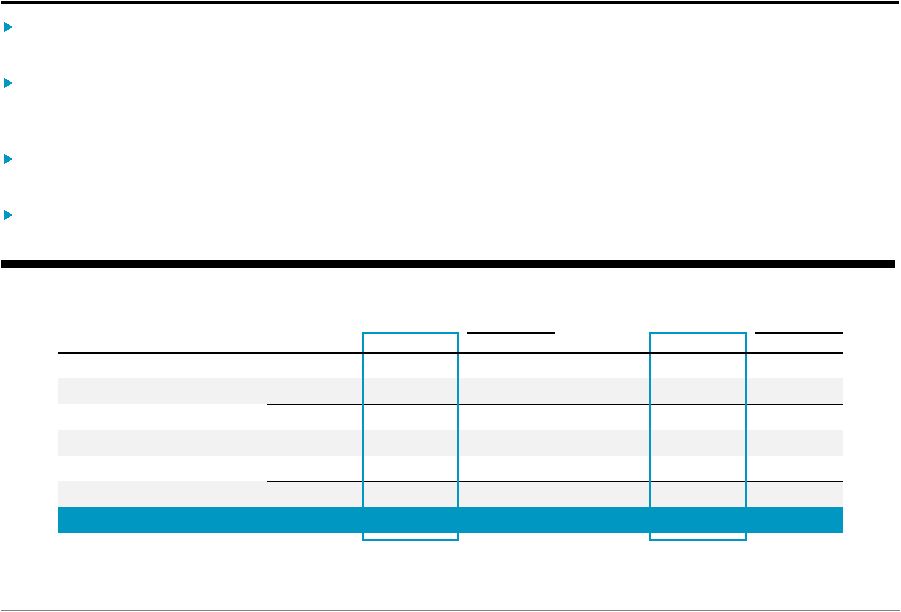
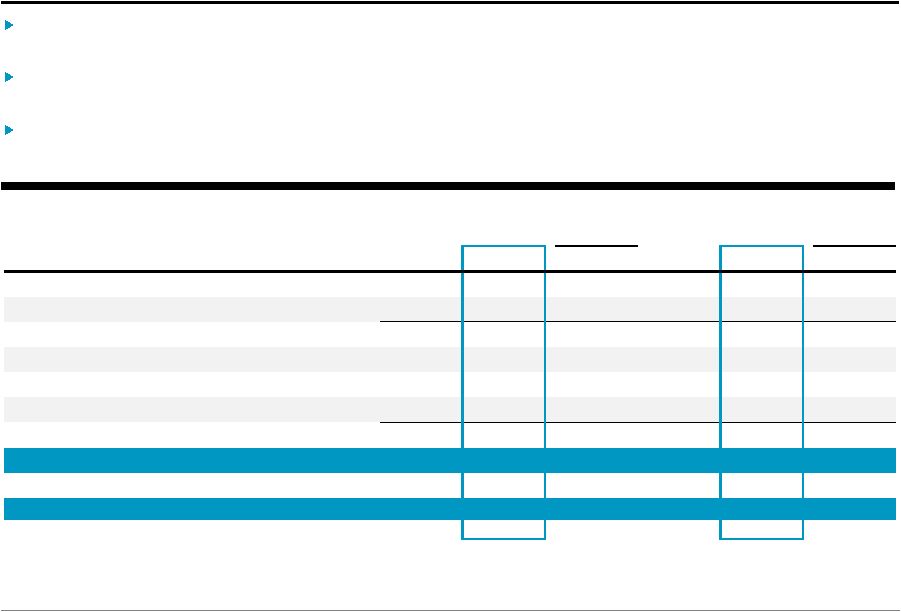
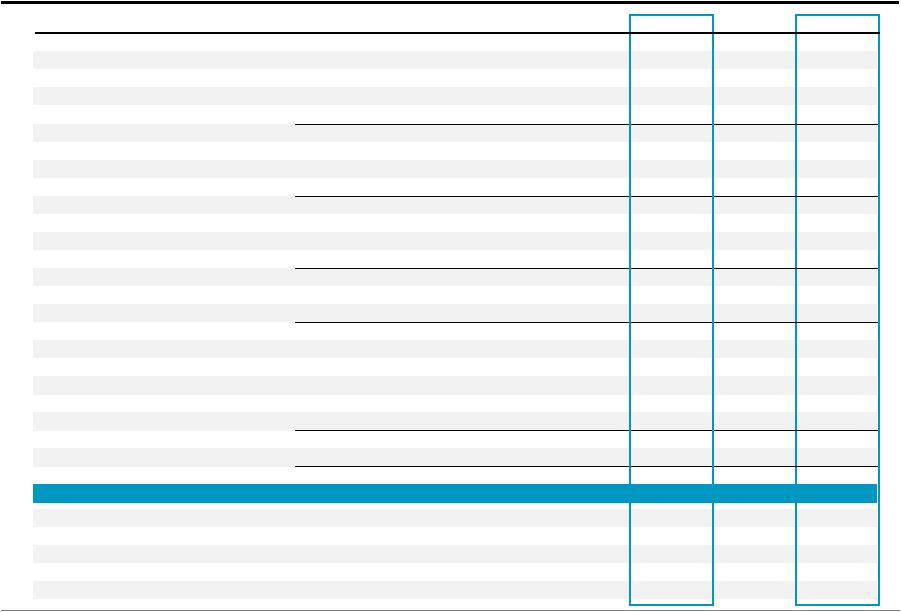
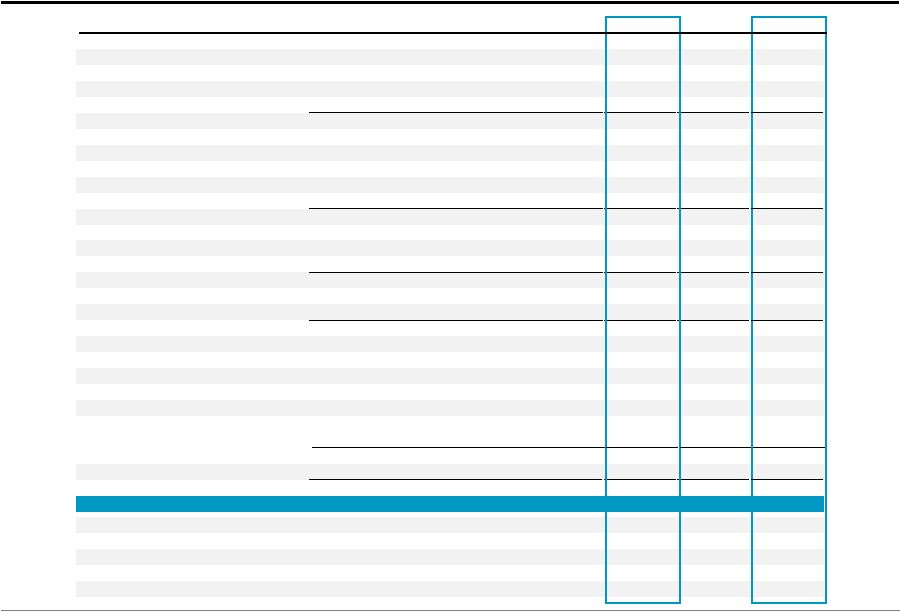
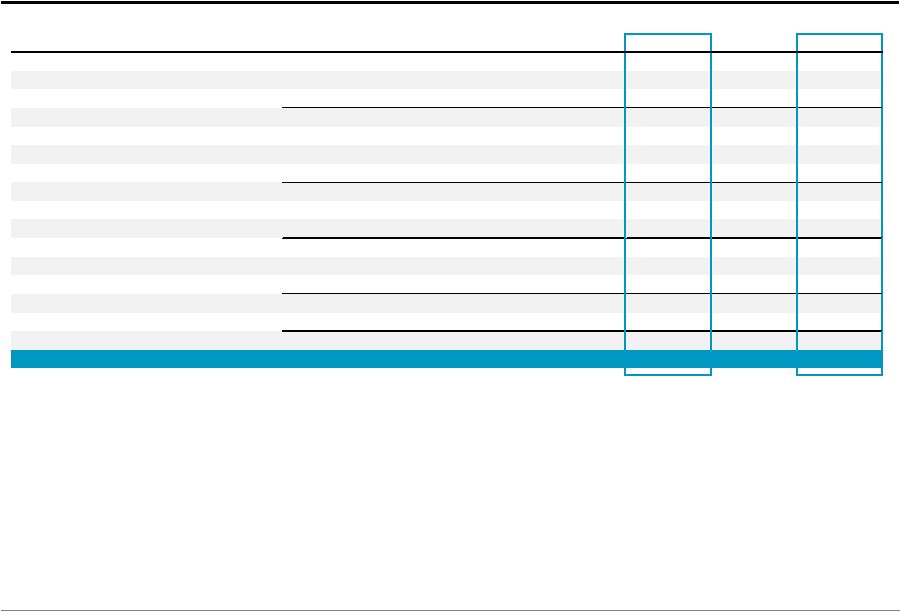
Blackstone 15 Total Segments (a) Transaction and Other Fees, Net, are net of amounts, if any, shared with limited partners including, for Private Equity, broken deal expenses. (b) Primarily placement fees. (Dollars in Thousands) 3Q'11 4Q'11 1Q'12 2Q'12 3Q'12 YTD'11 YTD'12 Revenues Management and Advisory Fees, Net Base Management Fees 322,371 $ 336,753 $ 395,506 $ 381,344 $ 398,088 $ 944,432 $ 1,174,938 $ Advisory Fees 86,178 123,567 75,846 93,372 59,951 258,673 229,169 Transaction and Other Fees, Net (a) 41,793 43,796 38,471 49,453 45,126 203,717 133,050 Management Fee Offsets (b) (7,703) (8,479) (13,050) (7,973) (8,454) (24,914) (29,477) Total Management and Advisory Fees, Net 442,639 495,637 496,773 516,196 494,711 1,381,908 1,507,680 Performance Fees Realized Carried Interest (9,633) 12,387 13,560 55,929 83,765 126,520 153,254 Realized Incentive Fees 17,530 51,837 5,279 11,692 11,620 37,192 28,591 Unrealized Carried Interest (382,949) 311,162 298,796 84,290 403,465 660,356 786,551 Unrealized Incentive Fees (82,227) (17,436) 68,121 (17,074) 104,149 (7,492) 155,196 Total Performance Fees (457,279) 357,950 385,756 134,837 602,999 816,576 1,123,592 Investment Income (Loss) Realized 31,647 16,697 23,492 9,360 25,098 85,878 57,950 Unrealized (165,753) 39,028 59,914 (25,624) 82,334 43,661 116,624 Total Investment Income (Loss) (134,106) 55,725 83,406 (16,264) 107,432 129,539 174,574 Interest Income and Dividend Revenue 10,110 10,003 9,345 10,391 12,004 28,841 31,740 Other (1,667) 5,695 (1,207) (828) 2,477 1,720 442 Total Revenues (140,303) 925,010 974,073 644,332 1,219,623 2,358,584 2,838,028 Expenses Compensation 238,207 225,438 254,772 268,884 259,561 735,131 783,217 Performance Fee Compensation Realized Carried Interest (1,835) 13,206 7,938 7,899 22,023 30,409 37,860 Realized Incentive Fees 12,378 33,524 4,252 5,575 4,457 22,388 14,284 Unrealized Carried Interest (74,123) 62,399 84,543 36,815 128,863 175,545 250,221 Unrealized Incentive Fees (37,312) (14,401) 12,779 (9,596) 44,254 (6,358) 47,437 Total Compensation and Benefits 137,315 320,166 364,284 309,577 459,158 957,115 1,133,019 Other Operating Expenses 96,932 122,072 109,521 113,038 127,456 299,270 350,015 Total Expenses 234,247 442,238 473,805 422,615 586,614 1,256,385 1,483,034 Economic Income (Loss) (374,550) $ 482,772 $ 500,268 $ 221,717 $ 633,009 $ 1,102,199 $ 1,354,994 $ Economic Net Income (Loss) (379,999) $ 468,154 $ 491,217 $ 212,349 $ 621,752 $ 1,071,054 $ 1,325,318 $ Fee Related Earnings 112,932 $ 166,096 $ 146,928 $ 145,729 $ 135,052 $ 380,397 $ 427,709 $ Distributable Earnings 125,745 $ 178,186 $ 162,121 $ 188,404 $ 189,635 $ 518,538 $ 540,160 $ Total Assets Under Management 157,698,448 $ 166,228,504 $ 190,074,167 $ 190,267,831 $ 204,551,572 $ 157,698,448 $ 204,551,572 $ Fee-Earning Assets Under Management 132,934,377 $ 136,756,753 $ 156,261,446 $ 157,646,521 $ 168,630,082 $ 132,934,377 $ 168,630,082 $ Weighted Average Fee-Earning AUM 131,458,996 $ 136,876,758 $ 154,354,070 $ 156,426,744 $ 162,377,631 $ 126,903,959 $ 157,608,079 $ LP Capital Invested 4,753,161 $ 3,406,264 $ 2,719,433 $ 2,403,623 $ 3,085,441 $ 10,066,631 $ 8,208,497 $ Total Capital Invested 5,012,167 $ 3,992,488 $ 3,134,385 $ 2,525,648 $ 3,754,061 $ 10,611,146 $ 9,414,094 $ |