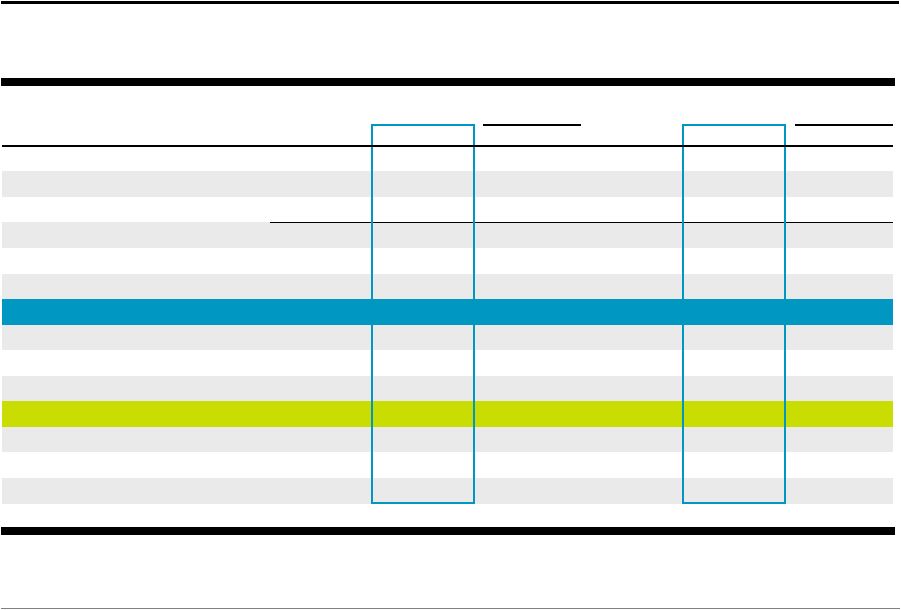
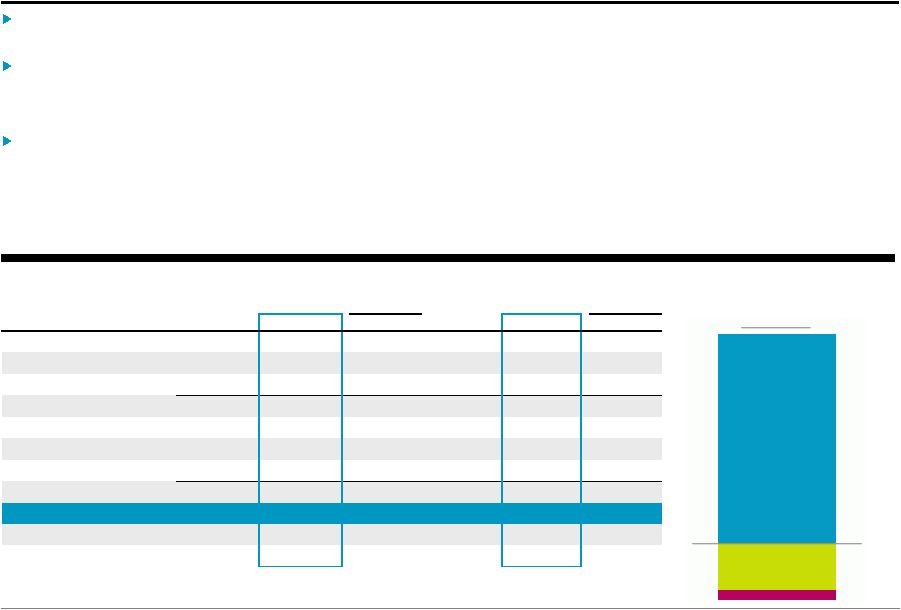
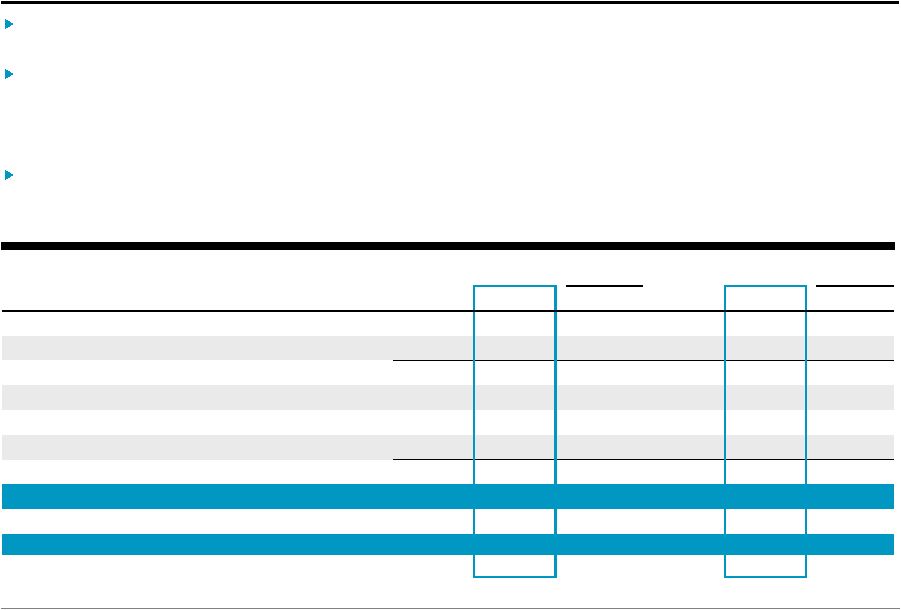
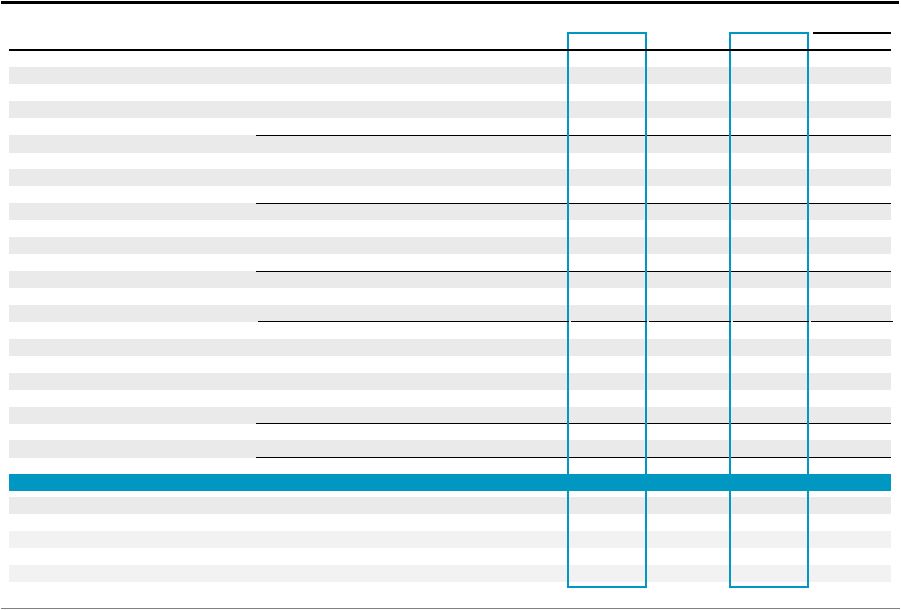
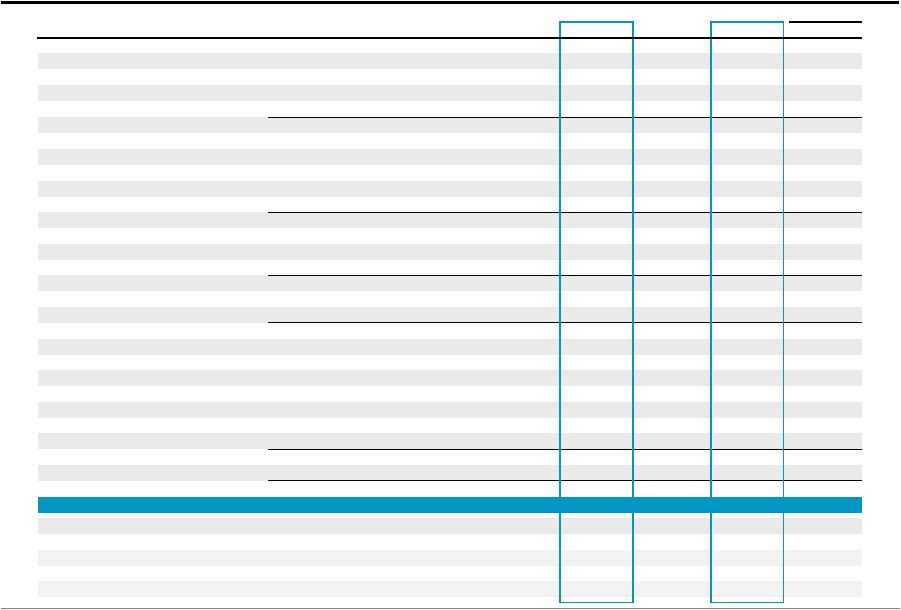
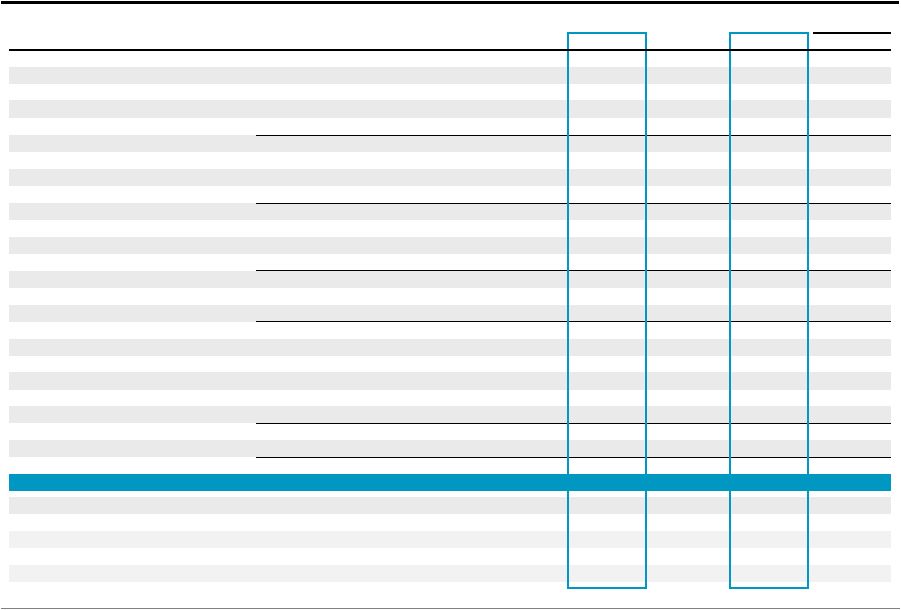
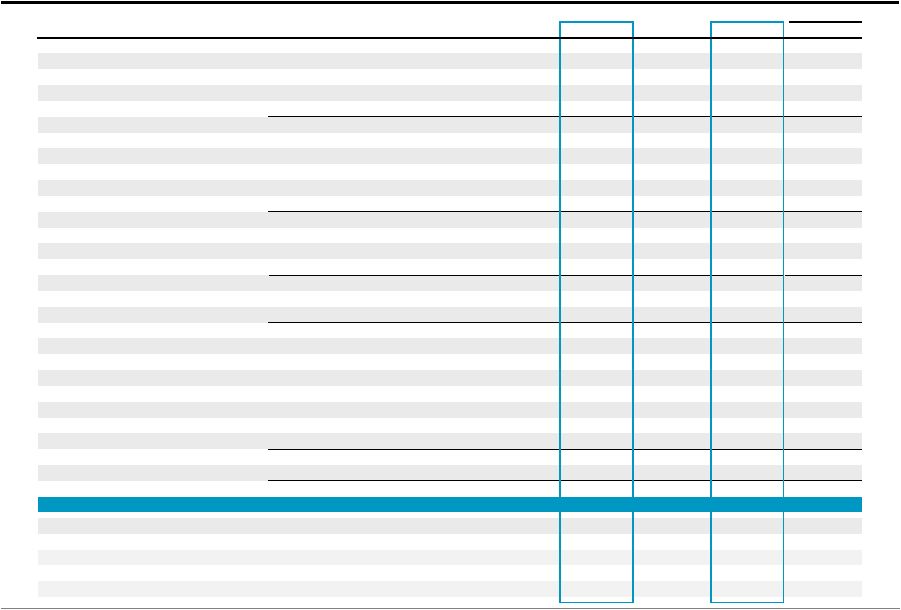
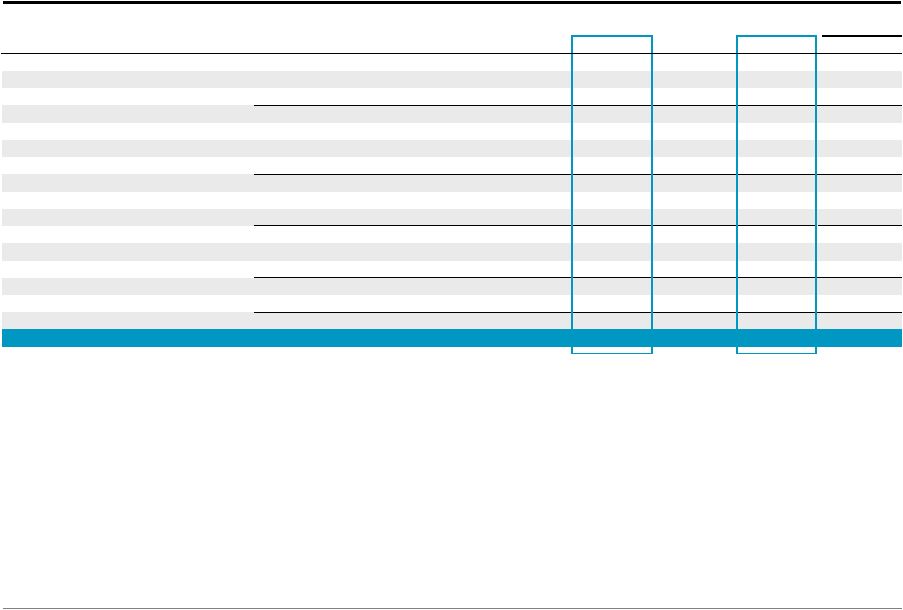
Blackstone 15 Total Segments (a) Transaction and Other Fees, Net, are net of amounts, if any, shared with limited partners including, for Private Equity, broken deal expenses. (b) Primarily placement fees. % Change (Dollars in Thousands) 4Q'11 1Q'12 2Q'12 3Q'12 4Q'12 FY'11 FY'12 vs. FY'11 Revenues Management and Advisory Fees, Net Base Management Fees 336,753 $ 395,506 $ 381,344 $ 398,088 $ 416,465 $ 1,281,185 $ 1,591,403 $ 24% Advisory Fees 123,567 75,846 93,372 59,951 128,248 382,240 357,417 (6)% Transaction and Other Fees, Net (a) 43,796 38,471 49,453 45,126 94,069 247,513 227,119 (8)% Management Fee Offsets (b) (8,479) (13,050) (7,973) (8,454) (11,476) (33,393) (40,953) (23)% Total Management and Advisory Fees, Net 495,637 496,773 516,196 494,711 627,306 1,877,545 2,134,986 14% Performance Fees Realized Carried Interest 12,387 13,560 55,929 83,765 174,168 138,907 327,422 136% Realized Incentive Fees 51,837 5,279 11,692 11,620 272,873 89,029 301,464 239% Unrealized Carried Interest 311,162 298,796 84,290 403,465 207,639 971,518 994,190 2% Unrealized Incentive Fees (17,436) 68,121 (17,074) 104,149 (184,507) (24,928) (29,311) (18)% Total Performance Fees 357,950 385,756 134,837 602,999 470,173 1,174,526 1,593,765 36% Investment Income (Loss) Realized 16,697 23,492 9,360 25,098 37,448 102,575 95,398 (7)% Unrealized 39,028 59,914 (25,624) 82,334 74,222 82,689 190,846 131% Total Investment Income (Loss) 55,725 83,406 (16,264) 107,432 111,670 185,264 286,244 55% Interest Income and Dividend Revenue 10,003 9,345 10,391 12,004 14,890 38,844 46,630 20% Other 5,695 (1,207) (828) 2,477 4,707 7,415 5,149 (31)% Total Revenues 925,010 974,073 644,332 1,219,623 1,228,746 3,283,594 4,066,774 24% Expenses Compensation 225,438 254,772 268,884 259,561 247,559 960,569 1,030,776 7% Performance Fee Compensation Realized Carried Interest 13,206 7,938 7,899 22,023 58,573 43,615 96,433 121% Realized Incentive Fees 33,524 4,252 5,575 4,457 125,758 55,912 140,042 150% Unrealized Carried Interest 62,399 84,543 36,815 128,863 71,378 237,944 321,599 35% Unrealized Incentive Fees (14,401) 12,779 (9,596) 44,254 (91,965) (20,759) (44,528) (114)% Total Compensation and Benefits 320,166 364,284 309,577 459,158 411,303 1,277,281 1,544,322 21% Other Operating Expenses 122,072 109,521 113,038 127,456 131,430 421,342 481,445 14% Total Expenses 442,238 473,805 422,615 586,614 542,733 1,698,623 2,025,767 19% Economic Income 482,772 $ 500,268 $ 221,717 $ 633,009 $ 686,013 $ 1,584,971 $ 2,041,007 $ 29% Economic Net Income 468,154 $ 491,217 $ 212,349 $ 621,752 $ 669,981 $ 1,539,208 $ 1,995,299 $ 30% Fee Related Earnings 166,096 $ 146,928 $ 145,729 $ 135,052 $ 272,604 $ 546,493 $ 700,313 $ 28% Distributable Earnings 178,186 $ 162,121 $ 188,404 $ 189,635 $ 493,765 $ 696,724 $ 1,033,925 $ 48% Total Assets Under Management 166,228,504 $ 190,074,167 $ 190,267,831 $ 204,551,572 $ 210,219,960 $ 166,228,504 $ 210,219,960 $ 26% Fee-Earning Assets Under Management 136,756,753 $ 156,261,446 $ 157,646,521 $ 168,630,082 $ 167,880,440 $ 136,756,753 $ 167,880,440 $ 23% Weighted Average Fee-Earning AUM 136,876,758 $ 154,354,070 $ 156,426,744 $ 162,377,631 $ 168,328,454 $ 129,473,025 $ 160,130,295 $ 24% LP Capital Invested 3,406,264 $ 2,719,433 $ 2,403,623 $ 3,085,441 $ 5,690,474 $ 13,529,766 $ 13,898,971 $ 3% Total Capital Invested 3,992,488 $ 3,134,385 $ 2,525,648 $ 3,754,061 $ 6,200,755 $ 14,664,407 $ 15,614,849 $ 6% |