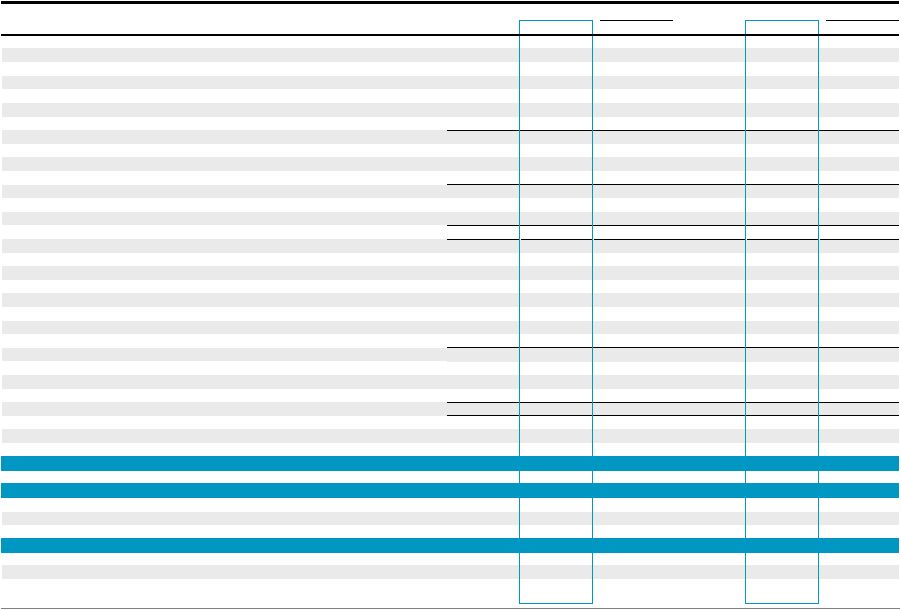
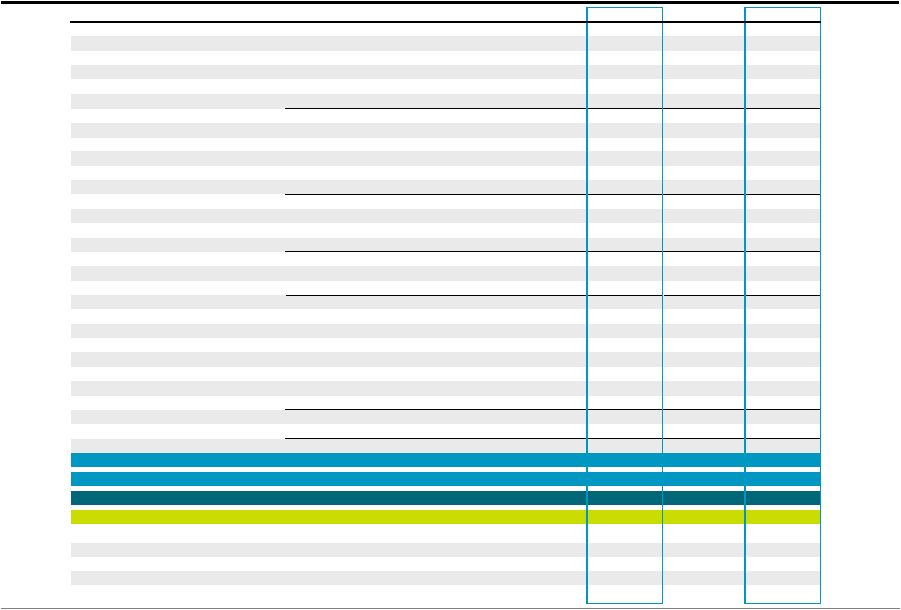
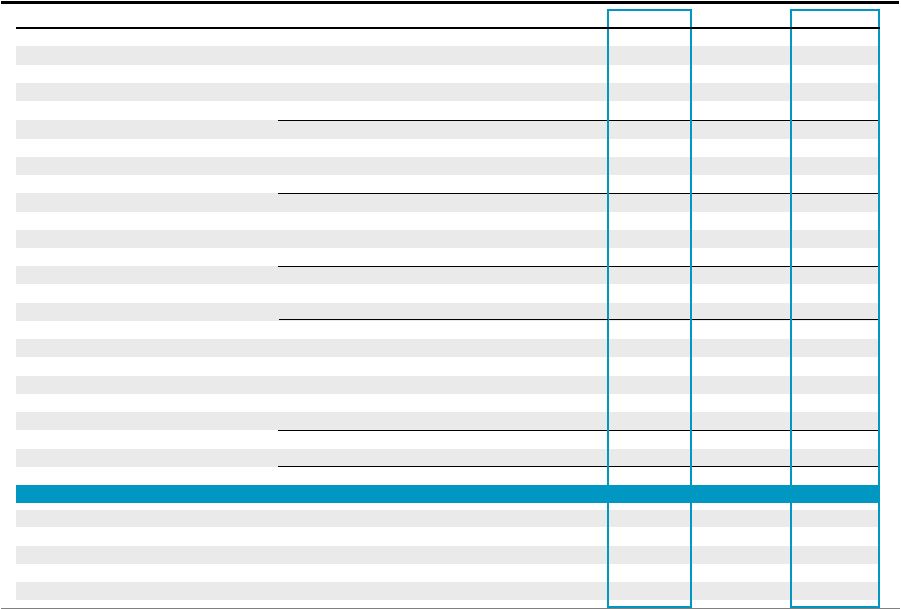
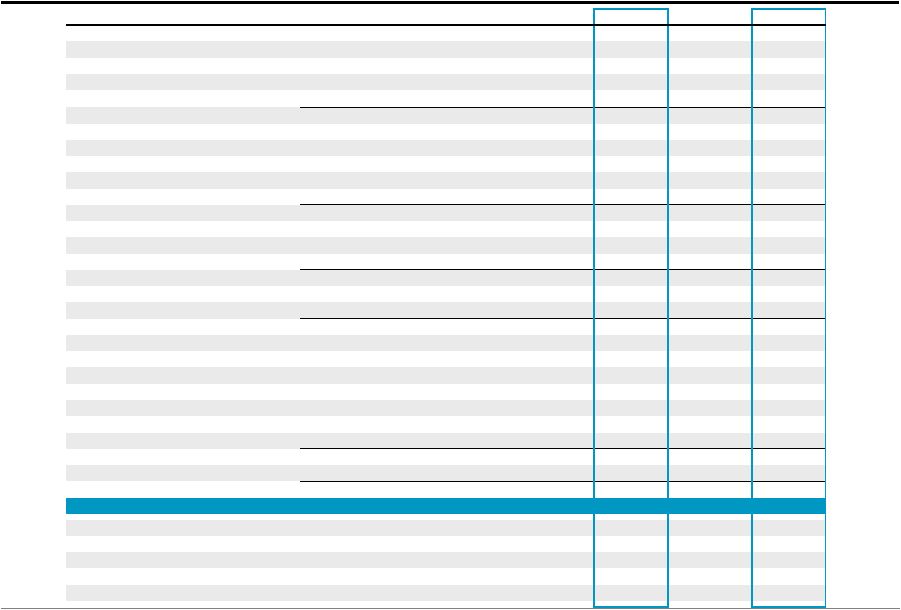
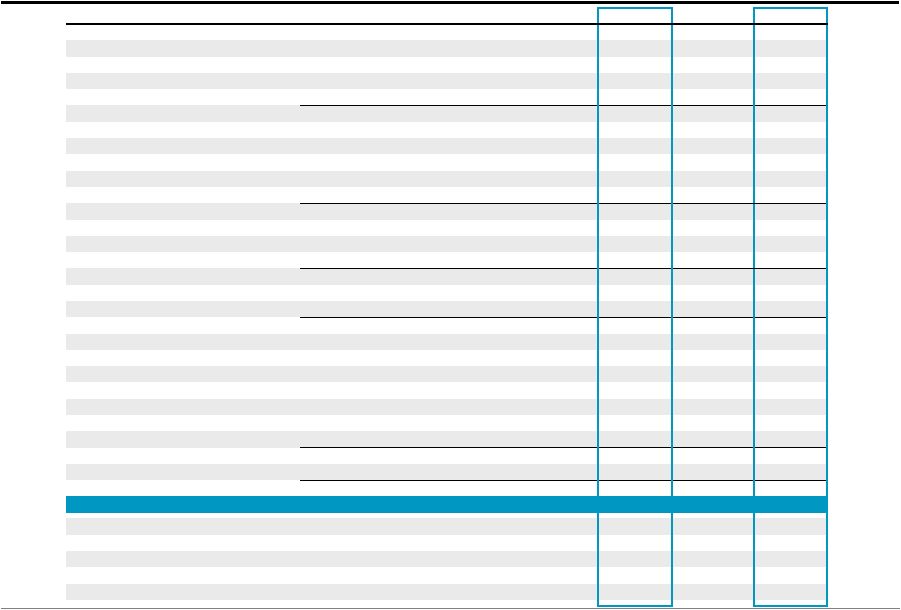
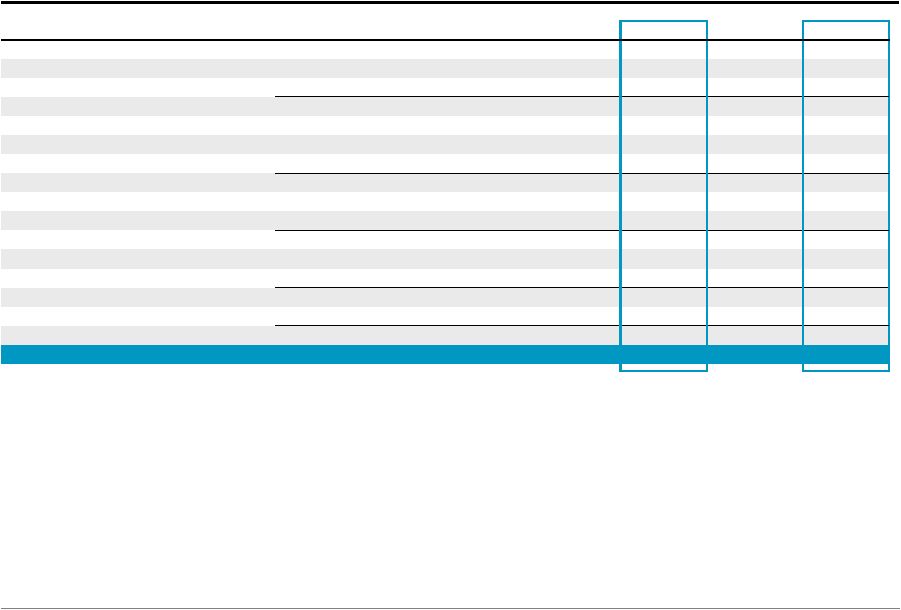
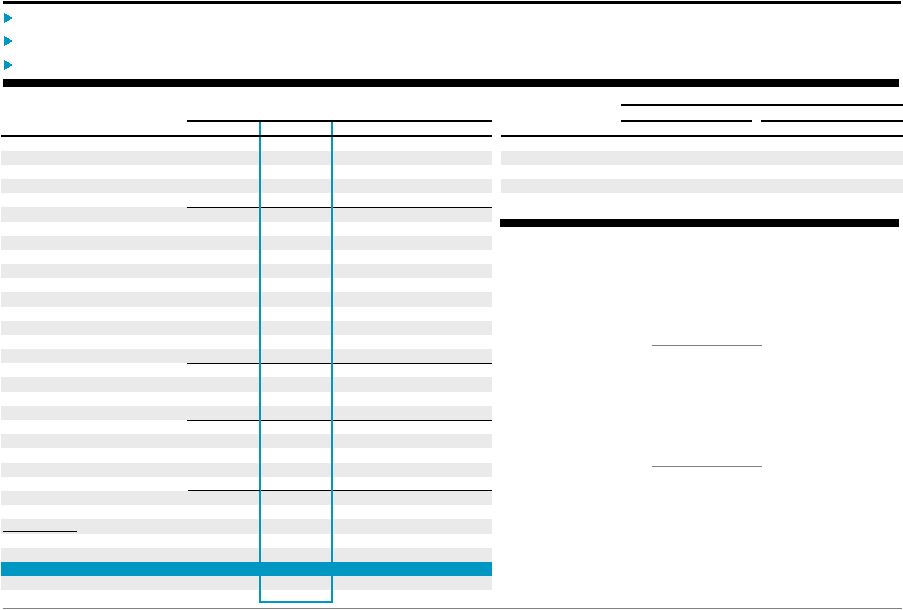
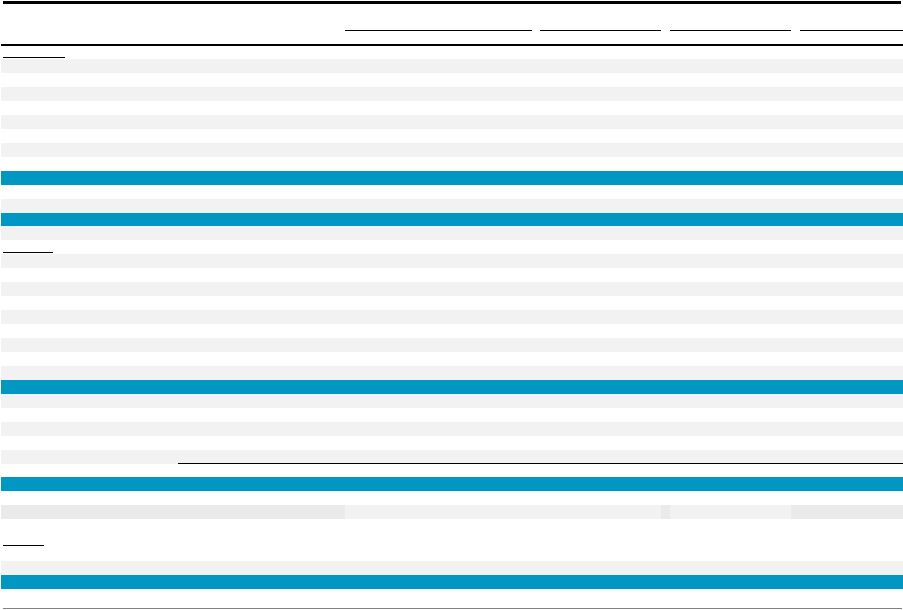
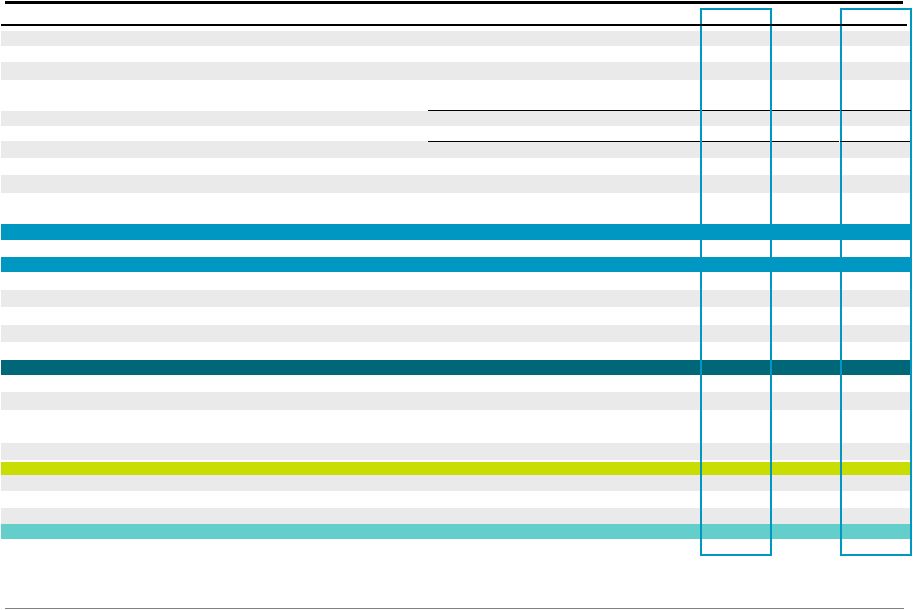
Blackstone 17 Total Segments (a) Transaction and Other Fees, Net, are net of amounts, if any, shared with limited partners including, for Private Equity, broken deal expenses. (b) Primarily placement fees. (Dollars in Thousands) 1Q'12 2Q'12 3Q'12 4Q'12 1Q'13 1Q'12 LTM 1Q'13 LTM Revenues Management and Advisory Fees, Net Base Management Fees 395,506 $ 381,344 $ 398,088 $ 416,465 $ 408,747 $ 1,371,104 $ 1,604,644 $ Advisory Fees 75,846 93,372 59,951 128,248 67,020 387,834 348,591 Transaction and Other Fees, Net (a) 38,471 49,453 45,126 94,069 37,974 227,621 226,622 Management Fee Offsets (b) (13,050) (7,973) (8,454) (11,476) (9,662) (37,907) (37,565) Total Management and Advisory Fees, Net 496,773 516,196 494,711 627,306 504,079 1,948,652 2,142,292 Performance Fees Realized Carried Interest 13,560 55,929 83,765 174,168 294,170 59,066 608,032 Realized Incentive Fees 5,279 11,692 11,620 272,873 24,727 92,109 320,912 Unrealized Carried Interest 298,796 84,290 403,465 207,639 177,347 838,166 872,741 Unrealized Incentive Fees 68,121 (17,074) 104,149 (184,507) 107,755 (29,856) 10,323 Total Performance Fees 385,756 134,837 602,999 470,173 603,999 959,485 1,812,008 Investment Income (Loss) Realized 23,492 9,360 25,098 37,448 38,110 102,568 110,016 Unrealized 59,914 (25,624) 82,334 74,222 96,661 40,026 227,593 Total Investment Income (Loss) 83,406 (16,264) 107,432 111,670 134,771 142,594 337,609 Interest Income and Dividend Revenue 9,345 10,391 12,004 14,890 14,661 38,741 51,946 Other (1,207) (828) 2,477 4,707 2,143 3,949 8,499 Total Revenues 974,073 644,332 1,219,623 1,228,746 1,259,653 3,093,421 4,352,354 Expenses Compensation 254,772 268,884 259,561 247,559 266,977 990,809 1,042,981 Performance Fee Compensation Realized Carried Interest 7,938 7,899 22,023 58,573 89,437 37,984 177,932 Realized Incentive Fees 4,252 5,575 4,457 125,758 10,508 �� 59,190 146,298 Unrealized Carried Interest 84,543 36,815 128,863 71,378 95,472 196,532 332,528 Unrealized Incentive Fees 12,779 (9,596) 44,254 (91,965) 44,478 (44,550) (12,829) Total Compensation and Benefits 364,284 309,577 459,158 411,303 506,872 1,239,965 1,686,910 Other Operating Expenses 109,521 113,038 127,456 131,430 114,444 427,888 486,368 Total Expenses 473,805 422,615 586,614 542,733 621,316 1,667,853 2,173,278 Economic Income 500,268 $ 221,717 $ 633,009 $ 686,013 $ 638,337 $ 1,425,568 $ 2,179,076 $ Economic Net Income 491,217 $ 212,349 $ 621,752 $ 669,981 $ 628,306 $ 1,383,553 $ 2,132,388 $ Fee Related Earnings 146,928 $ 145,729 $ 135,052 $ 272,604 $ 137,733 $ 582,253 $ 691,118 $ Distributable Earnings 162,121 $ 188,404 $ 189,635 $ 493,765 $ 378,827 $ 656,930 $ 1,250,631 $ Total Assets Under Management 190,074,167 $ 190,267,831 $ 204,551,572 $ 210,219,960 $ 218,210,672 $ 190,074,167 $ 218,210,672 $ Fee-Earning Assets Under Management 156,261,446 $ 157,646,521 $ 168,630,082 $ 167,880,440 $ 170,949,347 $ 156,261,446 $ 170,949,347 $ Weighted Average Fee-Earning AUM 154,354,070 $ 156,426,744 $ 162,377,631 $ 168,328,454 $ 169,551,186 $ 137,681,607 $ 164,747,339 $ LP Capital Invested 2,719,433 $ 2,403,623 $ 3,085,441 $ 5,690,474 $ 1,784,463 $ 14,533,678 $ 12,964,001 $ Total Capital Invested 3,134,385 $ 2,525,648 $ 3,754,061 $ 6,200,755 $ 1,840,474 $ 15,995,211 $ 14,320,938 $ |