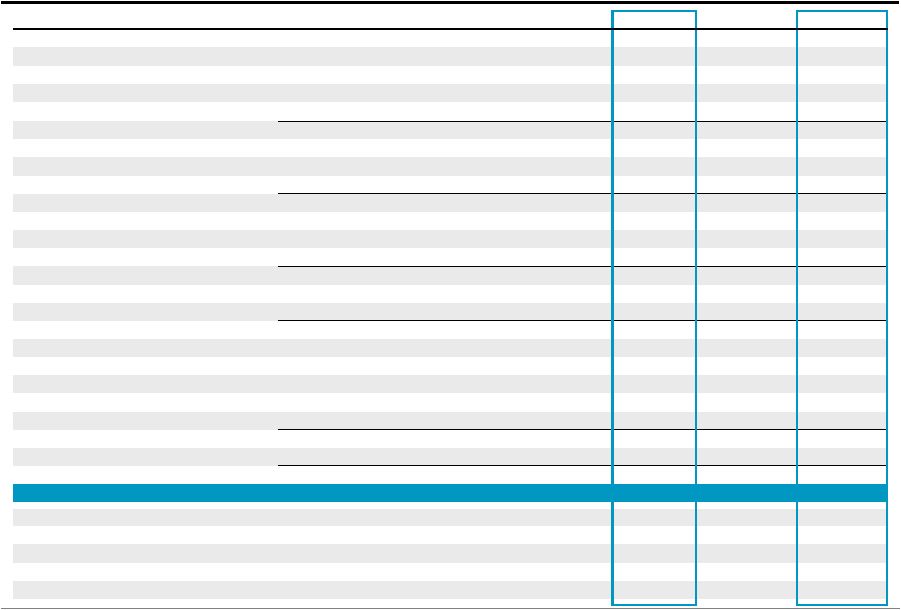
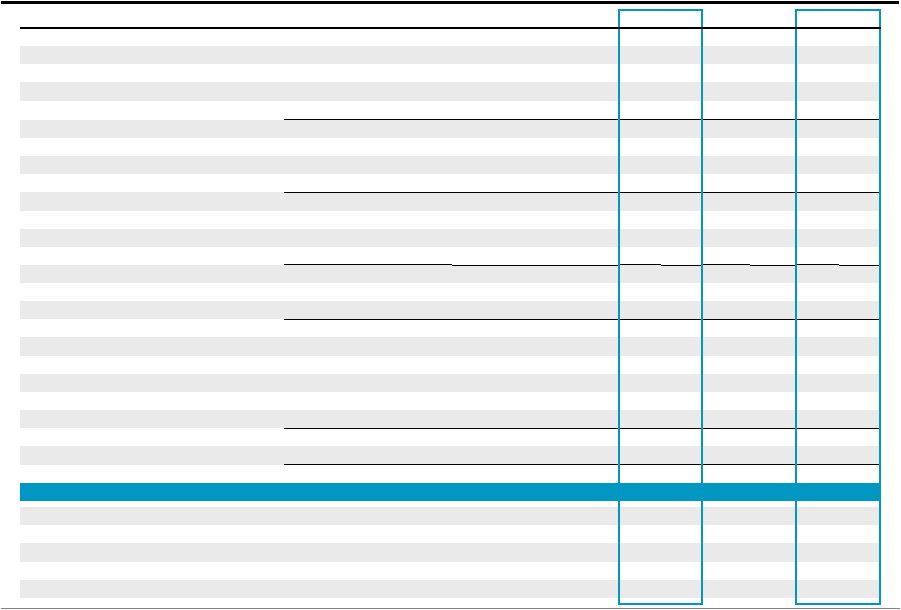
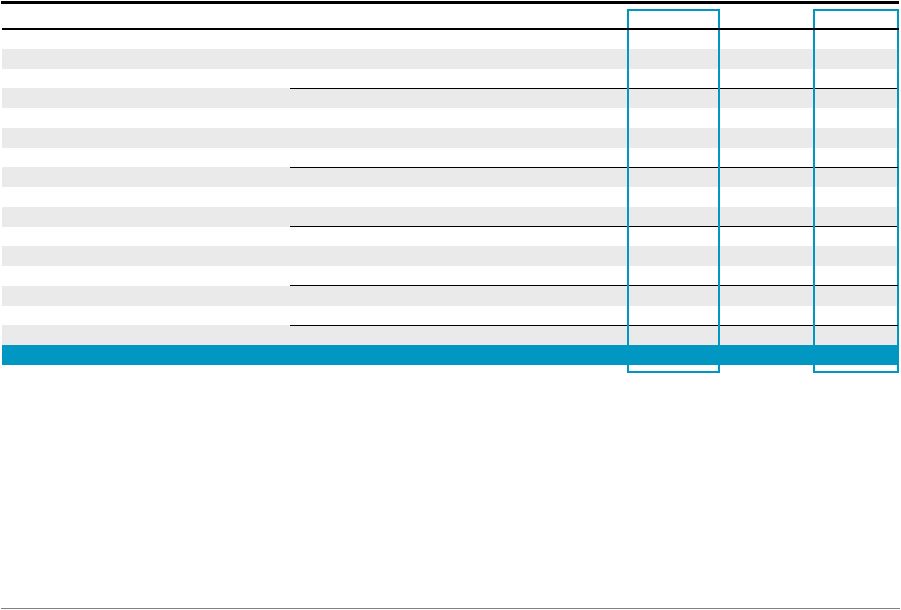
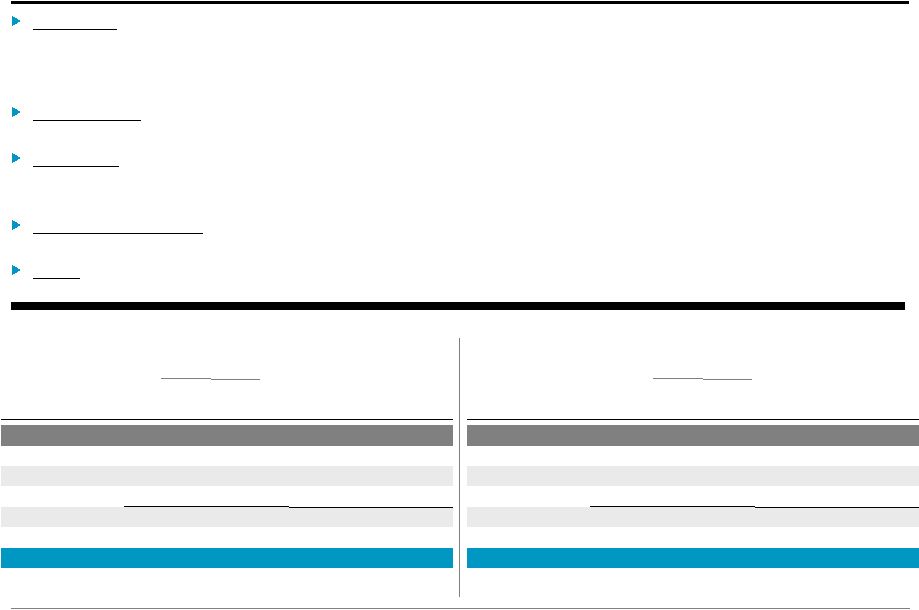
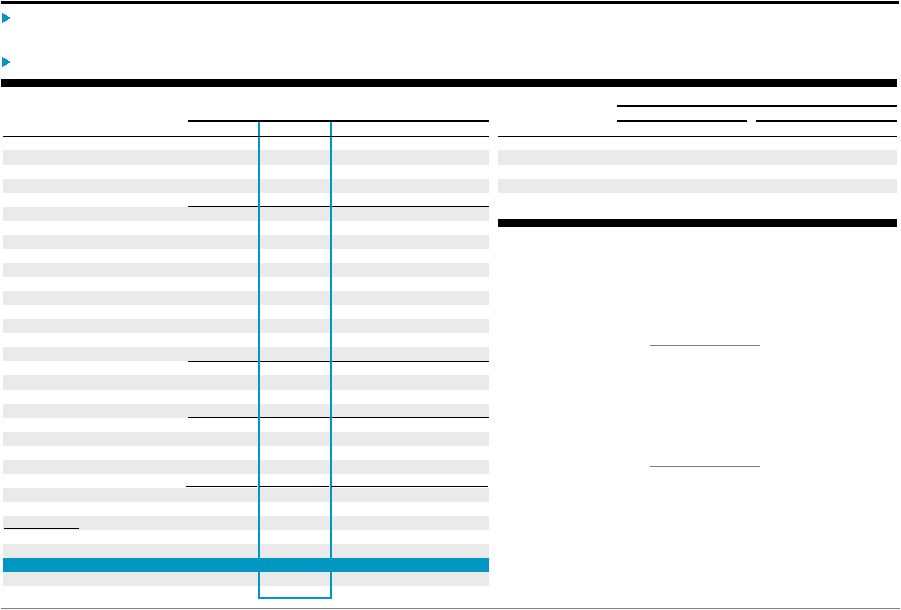
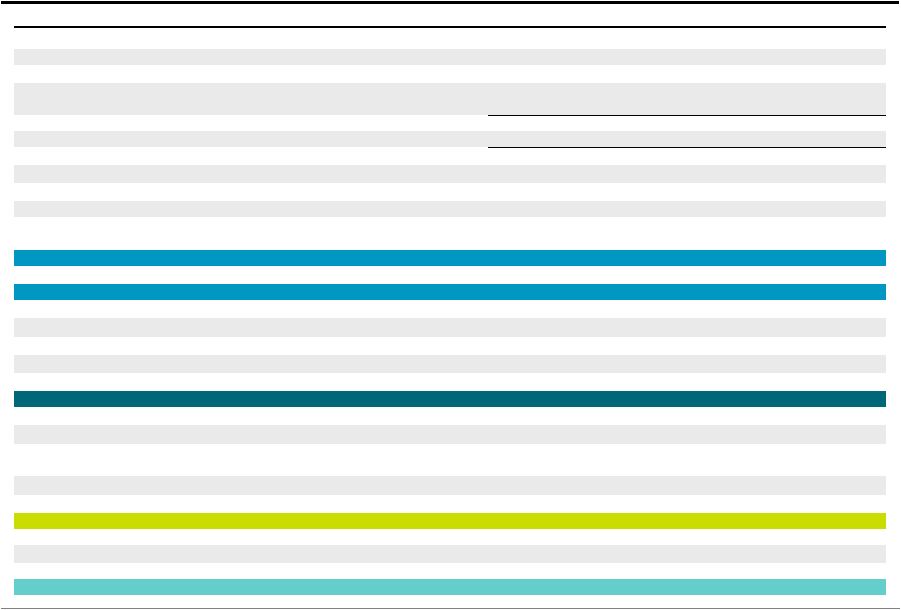
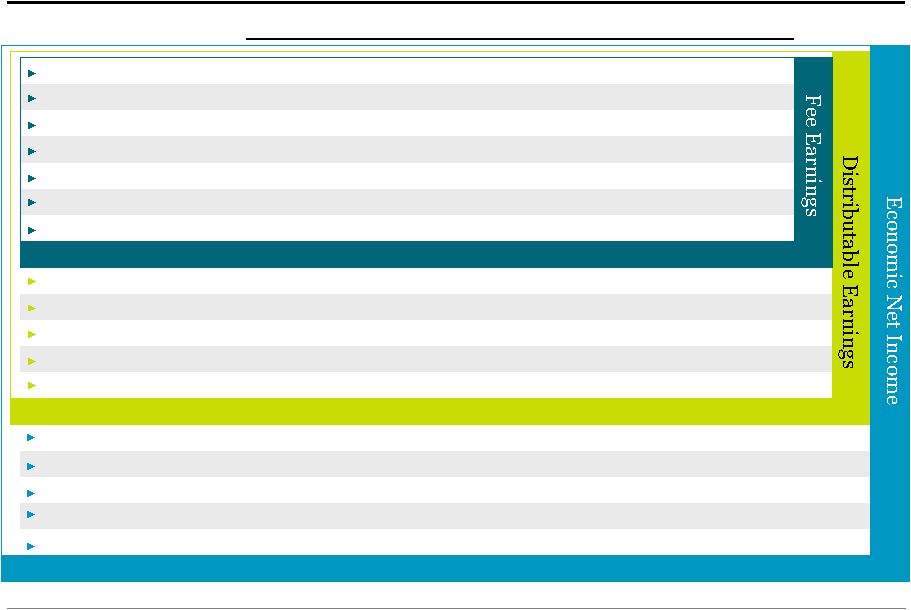
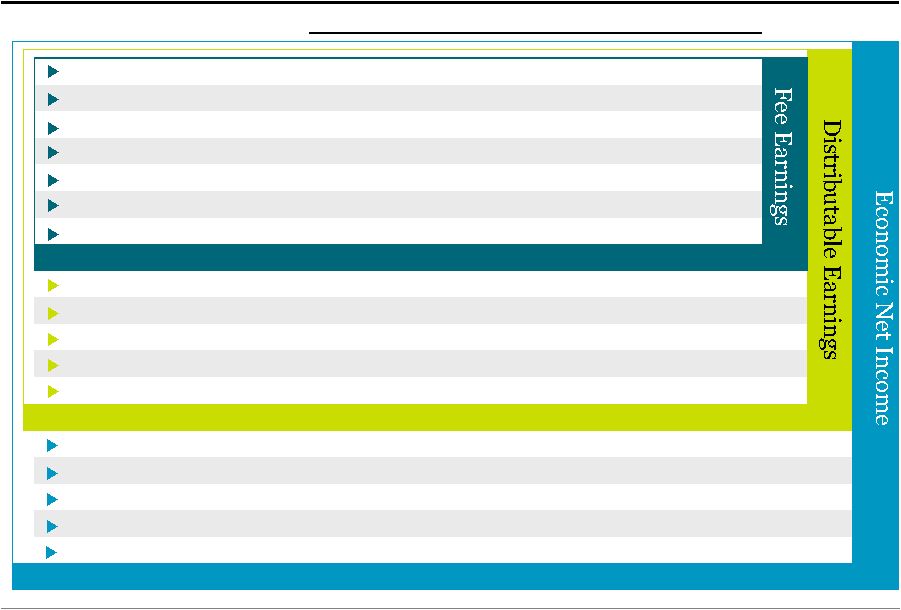
Blackstone 16 Total Segments (a) Transaction and Other Fees, Net, are net of amounts, if any, shared with limited partners including, for Private Equity, broken deal expenses. (b) Primarily placement fees. (Dollars in Thousands) 2Q'12 3Q'12 4Q'12 1Q'13 2Q'13 YTD'12 YTD'13 Revenues Management and Advisory Fees, Net Base Management Fees 381,344 $ 398,088 $ 416,465 $ 408,747 $ 425,674 $ 776,850 $ 834,421 $ Advisory Fees 93,372 59,951 128,248 67,020 120,734 169,218 187,754 Transaction and Other Fees, Net (a) 49,453 45,126 94,069 37,974 66,464 87,924 104,438 Management Fee Offsets (b) (7,973) (8,454) (11,476) (9,662) (10,535) (21,023) (20,197) Total Management and Advisory Fees, Net 516,196 494,711 627,306 504,079 602,337 1,012,969 1,106,416 Performance Fees Realized Carried Interest 55,929 83,765 174,168 294,170 183,288 69,489 477,458 Realized Incentive Fees 11,692 11,620 272,873 24,727 74,867 16,971 99,594 Unrealized Carried Interest 84,290 403,465 207,639 177,347 456,706 383,086 634,053 Unrealized Incentive Fees (17,074) 104,149 (184,507) 107,755 4,358 51,047 112,113 Total Performance Fees 134,837 602,999 470,173 603,999 719,219 520,593 1,323,218 Investment Income (Loss) Realized 9,360 25,098 37,448 38,110 54,586 32,852 92,696 Unrealized (25,624) 82,334 74,222 96,661 42,533 34,290 139,194 Total Investment Income (Loss) (16,264) 107,432 111,670 134,771 97,119 67,142 231,890 Interest Income and Dividend Revenue 10,391 12,004 14,890 14,661 15,342 19,736 30,003 Other (828) 2,477 4,707 2,143 (1,164) (2,035) 979 Total Revenues 644,332 1,219,623 1,228,746 1,259,653 1,432,853 1,618,405 2,692,506 Expenses Compensation 268,884 259,561 247,559 266,977 306,477 523,656 573,454 Performance Fee Compensation Realized Carried Interest 7,899 22,023 58,573 89,437 75,910 15,837 165,347 Realized Incentive Fees 5,575 4,457 125,758 10,508 35,014 9,827 45,522 Unrealized Carried Interest 36,815 128,863 71,378 95,472 172,824 121,358 268,296 Unrealized Incentive Fees (9,596) 44,254 (91,965) 44,478 3,084 3,183 47,562 Total Compensation and Benefits 309,577 459,158 411,303 506,872 593,309 673,861 1,100,181 Other Operating Expenses 113,038 127,456 131,430 114,444 120,152 222,559 234,596 Total Expenses 422,615 586,614 542,733 621,316 713,461 896,420 1,334,777 Economic Income 221,717 $ 633,009 $ 686,013 $ 638,337 $ 719,392 $ 721,985 $ 1,357,729 $ Economic Net Income 212,349 $ 621,752 $ 669,981 $ 628,306 $ 703,240 $ 703,566 $ 1,331,546 $ Fee Related Earnings 145,729 $ 135,052 $ 272,604 $ 137,733 $ 168,434 $ 292,657 $ 306,167 $ Distributable Earnings 195,213 $ 196,448 $ 562,337 $ 390,912 $ 338,485 $ 365,180 $ 729,397 $ Total Assets Under Management 190,267,831 $ 204,551,572 $ 210,219,960 $ 218,210,672 $ 229,571,741 $ 190,267,831 $ 229,571,741 $ Fee-Earning Assets Under Management 157,646,521 $ 168,630,082 $ 167,880,440 $ 170,949,347 $ 176,338,947 $ 157,646,521 $ 176,338,947 $ Weighted Average Fee-Earning AUM 156,426,744 $ 162,377,631 $ 168,328,454 $ 169,551,186 $ 173,706,678 $ 155,224,593 $ 172,372,395 $ LP Capital Invested 2,403,623 $ 3,085,441 $ 5,690,474 $ 1,784,463 $ 3,634,404 $ 5,123,056 $ 5,418,867 $ Total Capital Invested 2,525,648 $ 3,754,061 $ 6,200,755 $ 1,840,474 $ 3,757,591 $ 5,660,033 $ 5,598,065 $ |