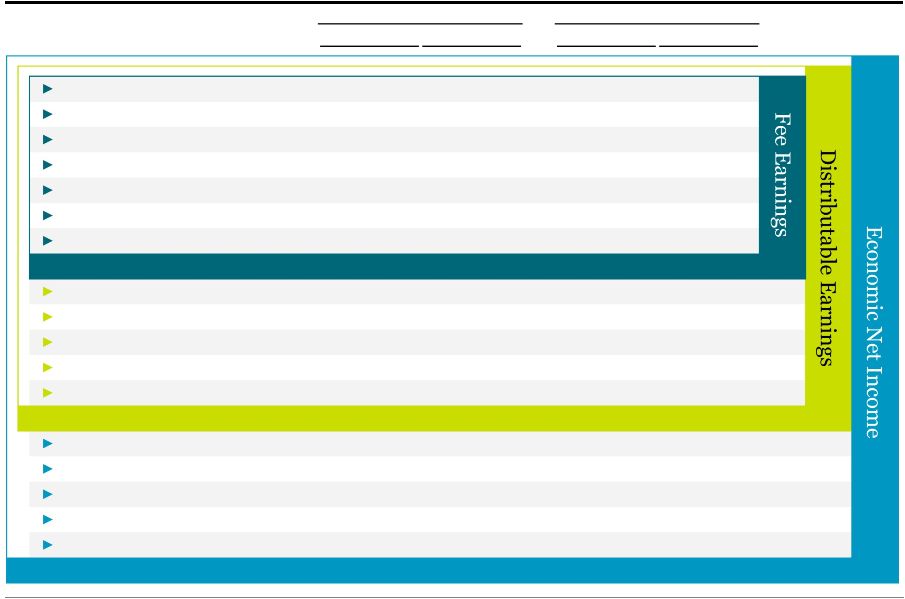
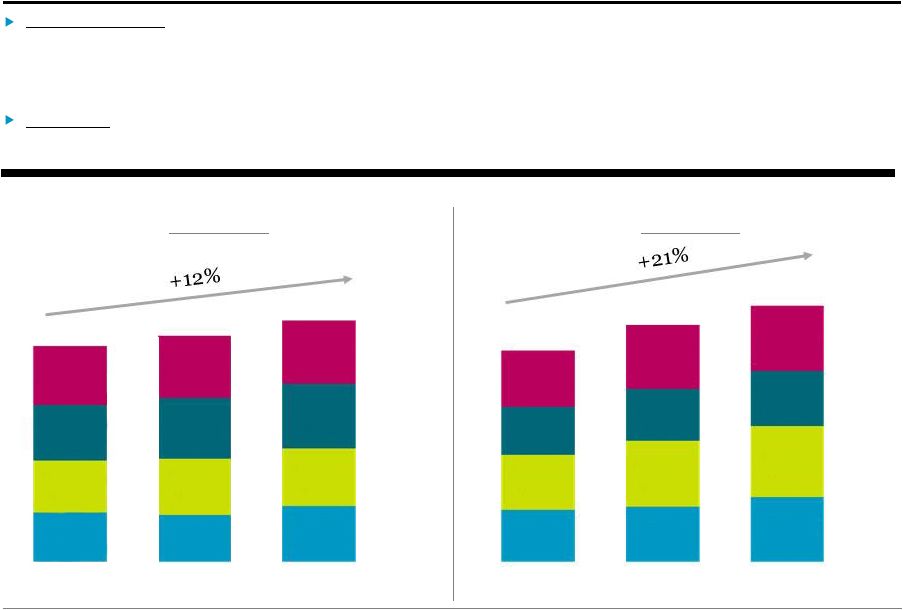
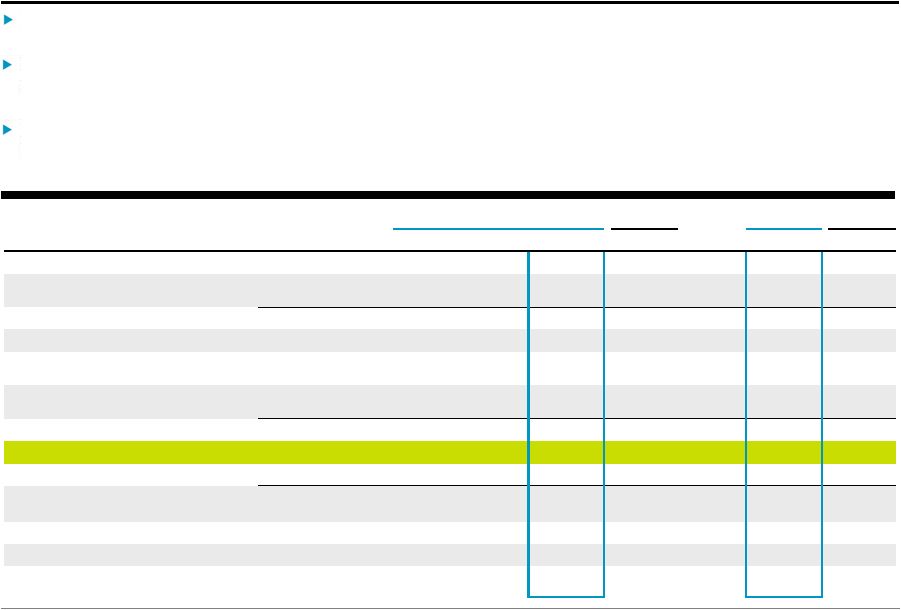
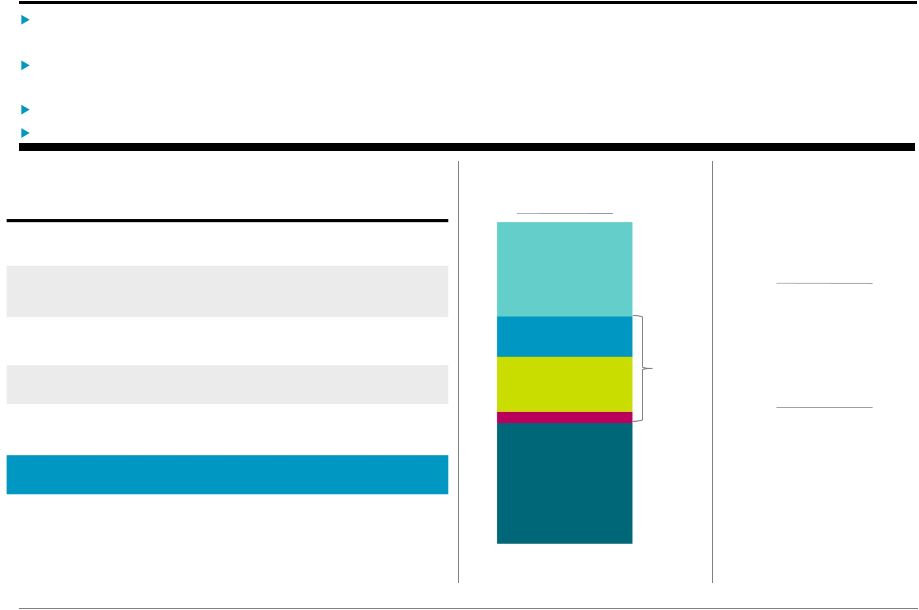
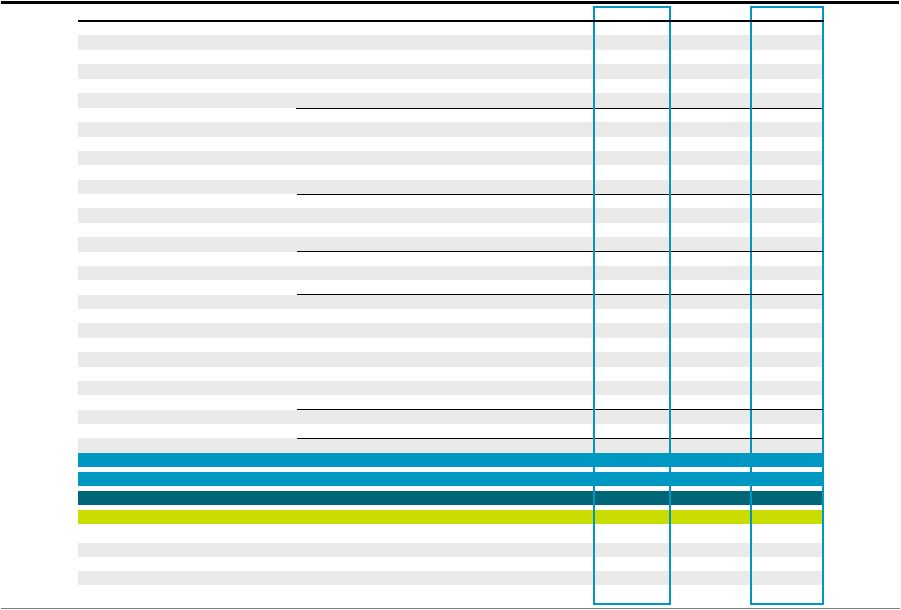
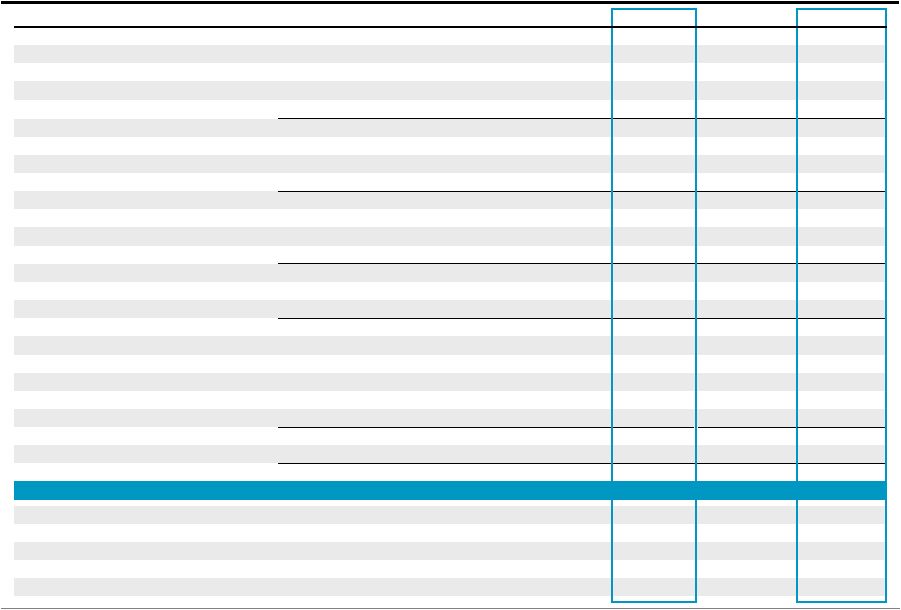
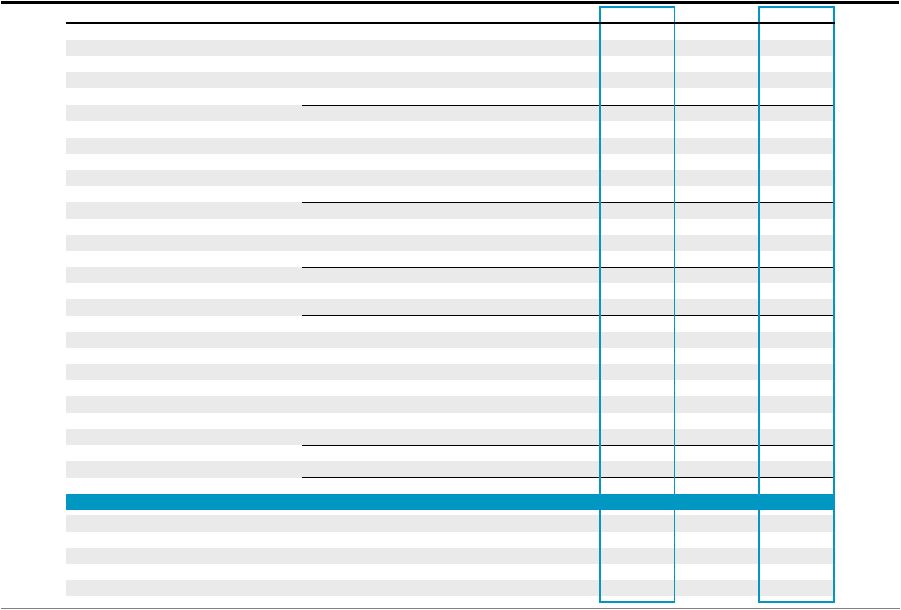
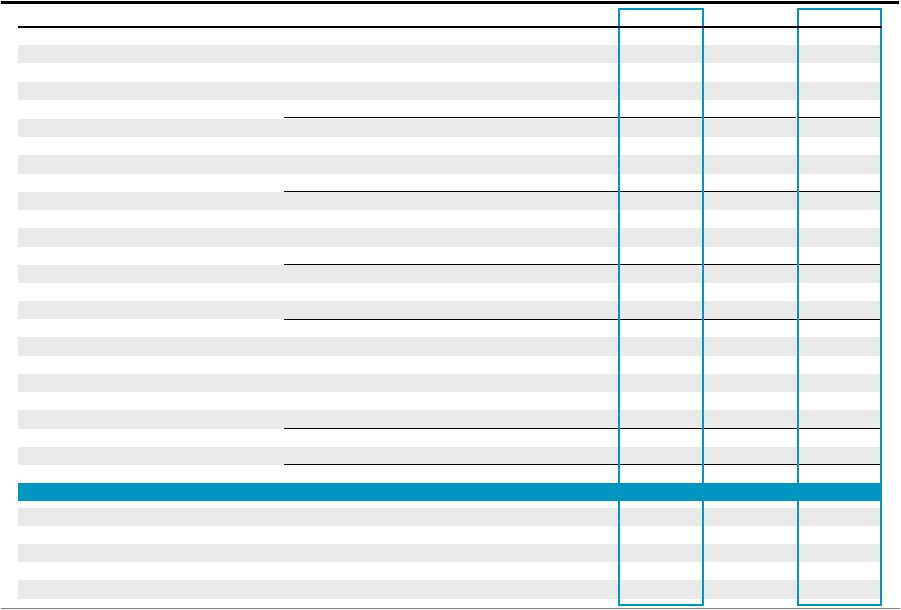
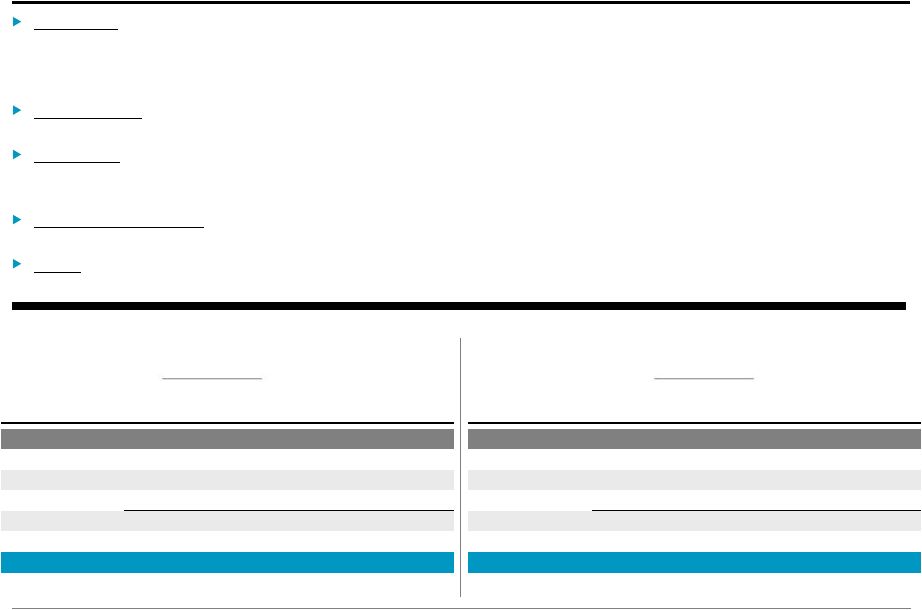
Blackstone 16 Total Segments (a) Transaction and Other Fees, Net, are net of amounts, if any, shared with limited partners including, for Private Equity, broken deal expenses. (b) Primarily placement fees. (Dollars in Thousands) 3Q'12 4Q'12 1Q'13 2Q'13 3Q'13 YTD'12 YTD'13 Revenues Management and Advisory Fees, Net Base Management Fees 398,088 $ 416,465 $ 408,747 $ 425,674 $ 437,294 $ 1,174,938 $ 1,271,715 $ Advisory Fees 59,951 128,248 67,020 120,734 83,602 229,169 271,356 Transaction and Other Fees, Net (a) 45,126 94,069 37,974 66,464 42,806 133,050 147,244 Management Fee Offsets (b) (8,454) (11,476) (9,662) (10,535) (8,271) (29,477) (28,468) Total Management and Advisory Fees, Net 494,711 627,306 504,079 602,337 555,431 1,507,680 1,661,847 Performance Fees Realized Carried Interest 83,765 174,168 294,170 183,288 182,654 153,254 660,112 Realized Incentive Fees 11,620 272,873 24,727 74,867 31,238 28,591 130,832 Unrealized Carried Interest 403,465 207,639 177,347 456,706 290,052 786,551 924,105 Unrealized Incentive Fees 104,149 (184,507) 107,755 4,358 40,992 155,196 153,105 Total Performance Fees 602,999 470,173 603,999 719,219 544,936 1,123,592 1,868,154 Investment Income Realized 25,098 37,448 38,110 54,586 11,492 57,950 104,188 Unrealized 82,334 74,222 96,661 42,533 87,680 116,624 226,874 Total Investment Income 107,432 111,670 134,771 97,119 99,172 174,574 331,062 Interest Income and Dividend Revenue 12,004 14,890 14,661 15,342 21,539 31,740 51,542 Other 2,477 4,707 2,143 (1,164) 4,708 442 5,687 Total Revenues 1,219,623 1,228,746 1,259,653 1,432,853 1,225,786 2,838,028 3,918,292 Expenses Compensation 259,561 247,559 266,977 306,477 279,498 783,217 852,952 Performance Fee Compensation Realized Carried Interest 22,023 58,573 89,437 75,910 60,369 37,860 225,716 Realized Incentive Fees 4,457 125,758 10,508 35,014 14,599 14,284 60,121 Unrealized Carried Interest 128,863 71,378 95,472 172,824 82,341 250,221 350,637 Unrealized Incentive Fees 44,254 (91,965) 44,478 3,084 11,084 47,437 58,646 Total Compensation and Benefits 459,158 411,303 506,872 593,309 447,891 1,133,019 1,548,072 Other Operating Expenses 127,456 131,430 114,444 120,152 122,872 350,015 357,468 Total Expenses 586,614 542,733 621,316 713,461 570,763 1,483,034 1,905,540 Economic Income 633,009 $ 686,013 $ 638,337 $ 719,392 $ 655,023 $ 1,354,994 $ 2,012,752 $ Economic Net Income 621,752 $ 669,981 $ 628,306 $ 703,240 $ 640,231 $ 1,325,318 $ 1,971,777 $ Fee Related Earnings 135,052 $ 272,604 $ 137,733 $ 168,434 $ 178,596 $ 427,709 $ 484,763 $ Distributable Earnings 196,448 $ 562,337 $ 390,912 $ 338,485 $ 312,673 $ 561,628 $ 1,042,070 $ Total Assets Under Management 204,551,572 $ 210,219,960 $ 218,210,672 $ 229,571,741 $ 248,064,888 $ 204,551,572 $ 248,064,888 $ Fee-Earning Assets Under Management 168,630,082 $ 167,880,440 $ 170,949,347 $ 176,338,947 $ 188,649,817 $ 168,630,082 $ 188,649,817 $ Weighted Average Fee-Earning AUM 162,377,631 $ 168,328,454 $ 169,551,186 $ 173,706,678 $ 185,628,676 $ 157,608,079 $ 182,031,703 $ LP Capital Invested 3,085,441 $ 5,690,474 $ 1,784,463 $ 3,634,404 $ 3,378,067 $ 8,208,497 $ 8,796,934 $ Total Capital Invested 3,754,061 $ 6,200,755 $ 1,840,474 $ 3,757,591 $ 3,536,365 $ 9,414,094 $ 9,134,430 $ |