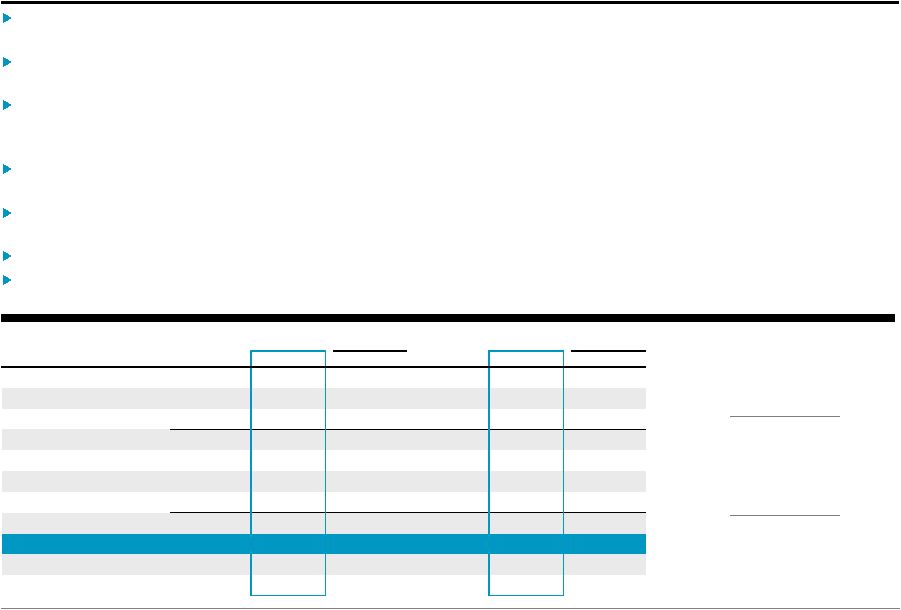
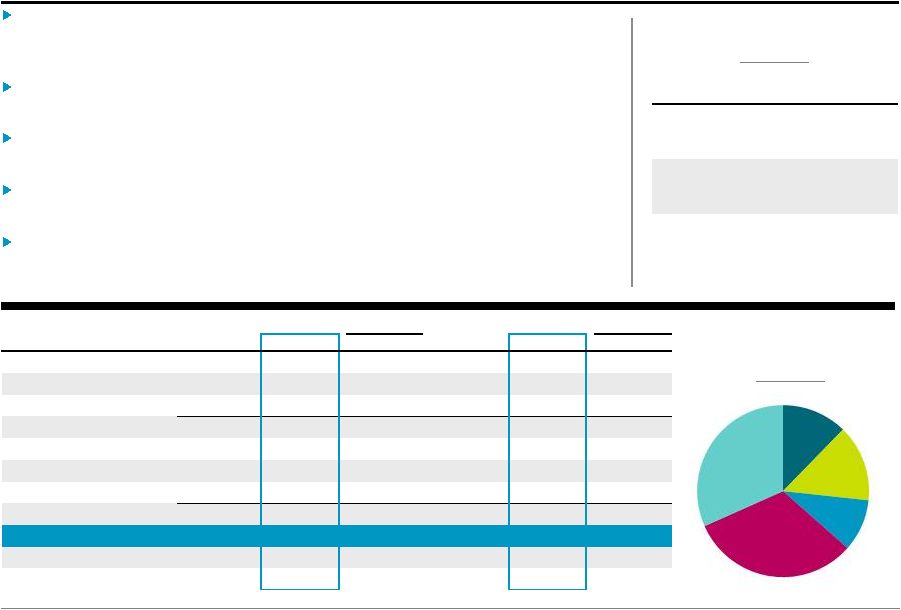
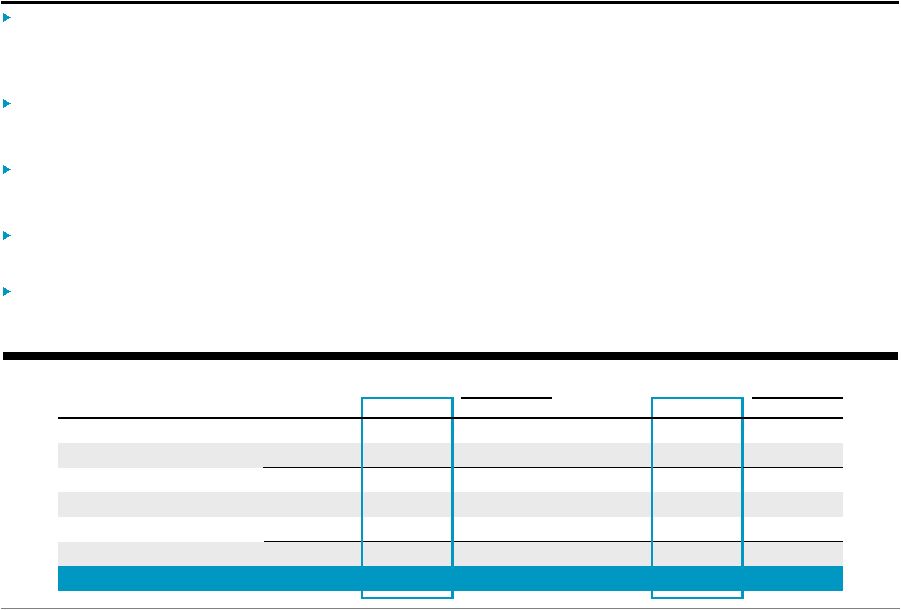
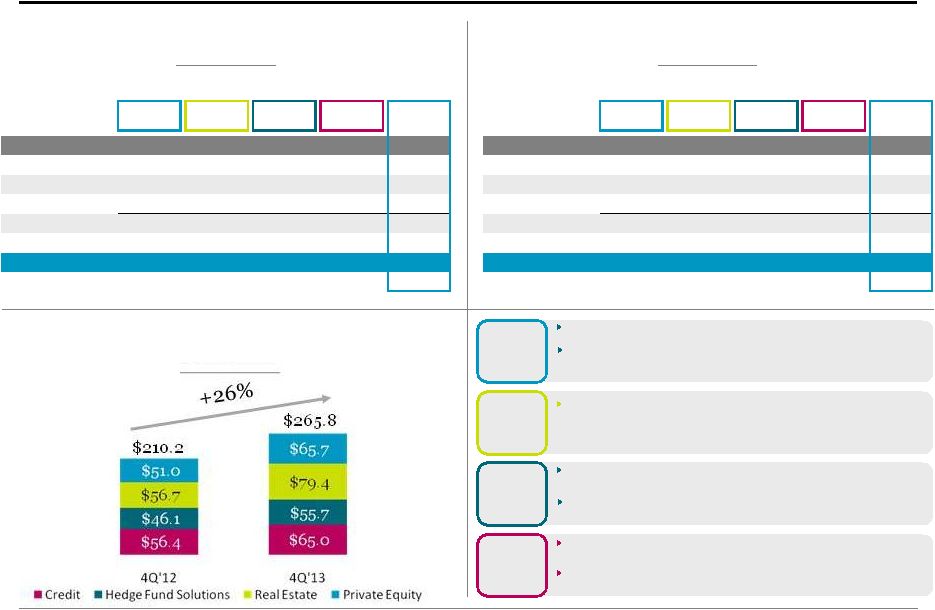
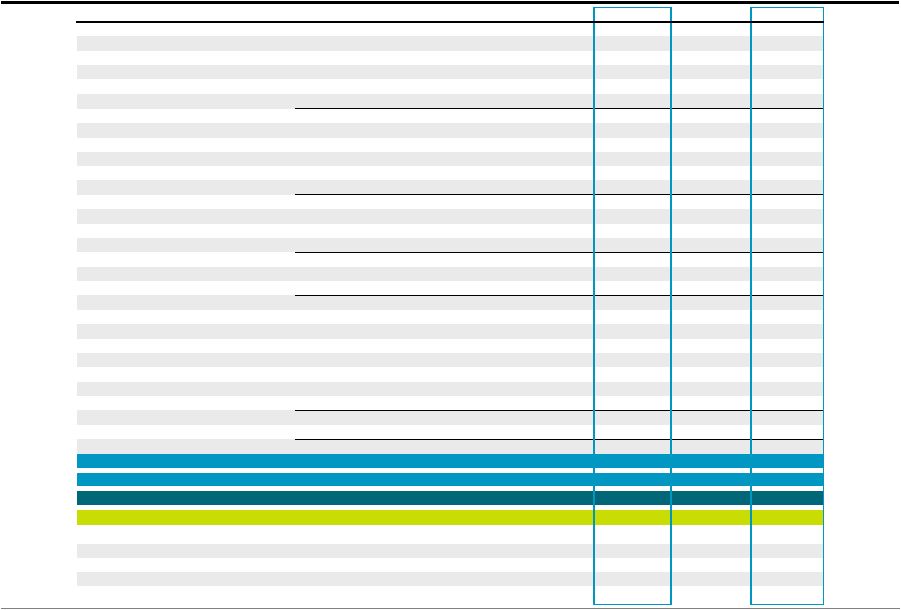
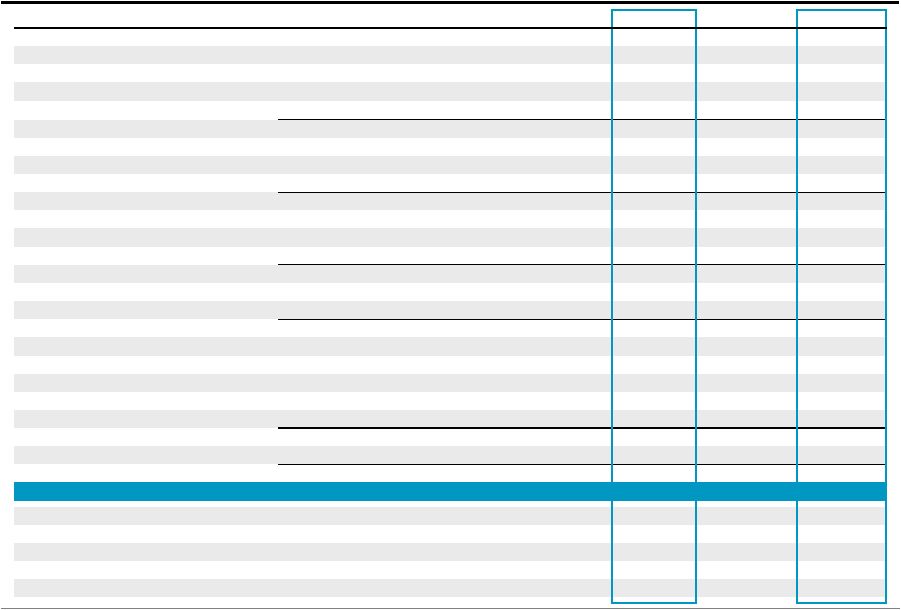
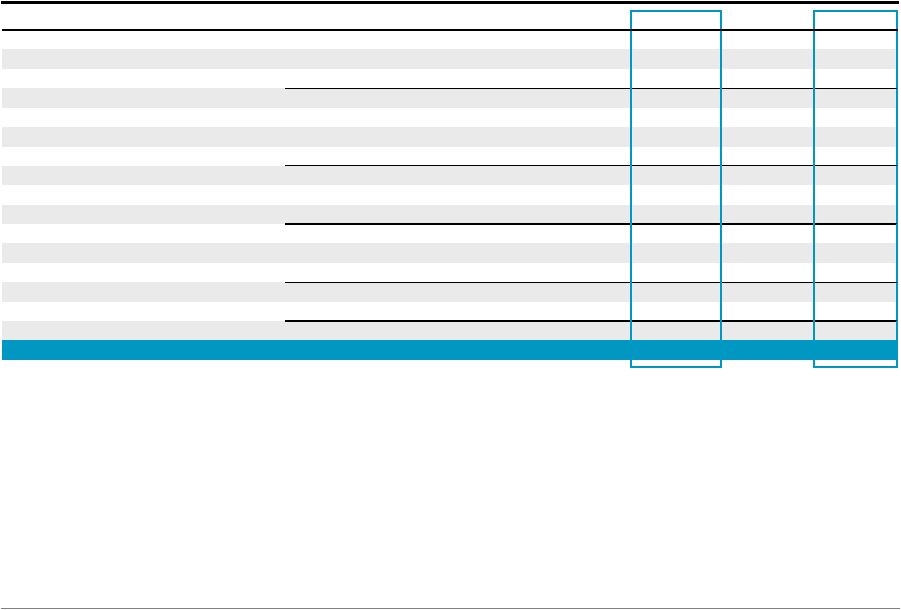
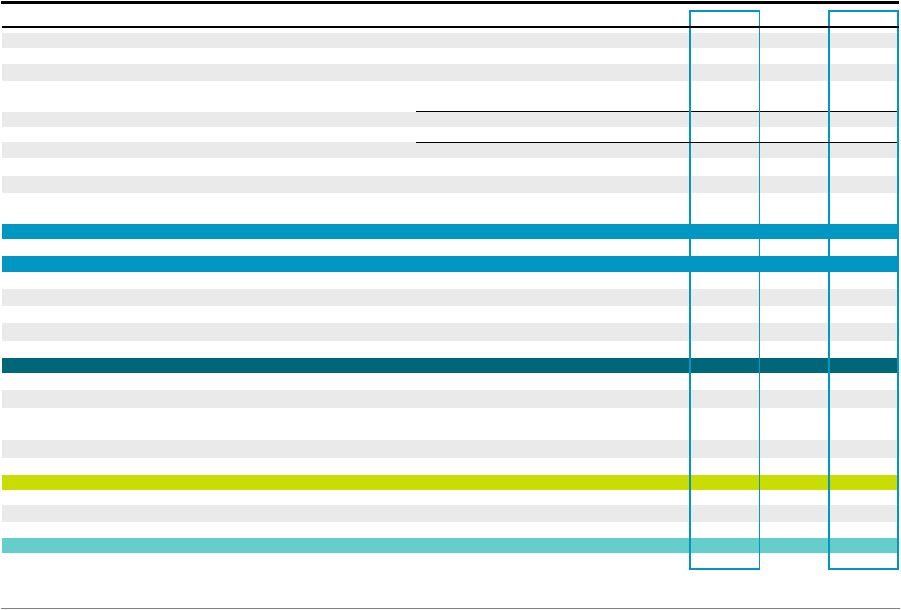
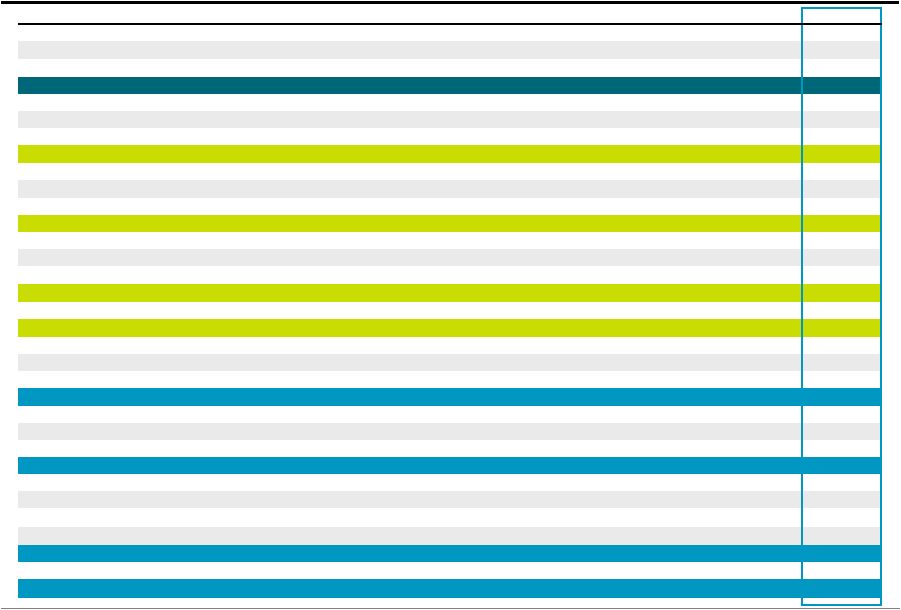
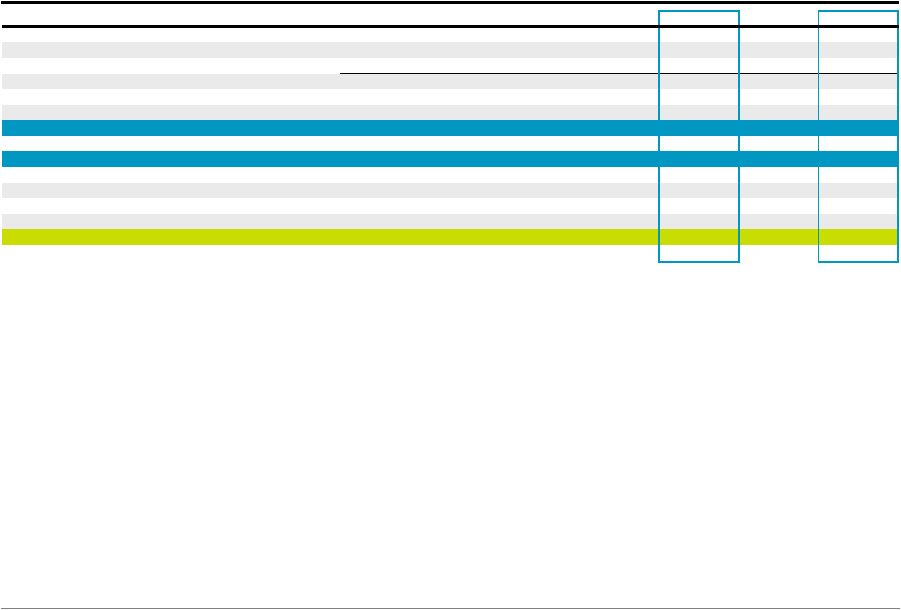
Blackstone 20 Total Segments (a) Transaction and Other Fees, Net, are net of amounts, if any, shared with limited partners including, for Private Equity, broken deal expenses. (b) Primarily placement fees. (Dollars in Thousands) 4Q'12 1Q'13 2Q'13 3Q'13 4Q'13 FY'12 FY'13 Revenues Management and Advisory Fees, Net Base Management Fees 416,465 $ 408,747 $ 425,674 $ 437,294 $ 469,092 $ 1,591,403 $ 1,740,807 $ Advisory Fees 128,248 67,020 120,734 83,602 139,158 357,417 410,514 Transaction and Other Fees, Net (a) 94,069 37,974 66,464 42,806 59,733 227,119 206,977 Management Fee Offsets (b) (11,476) (9,662) (10,535) (8,271) (43,752) (40,953) (72,220) Total Management and Advisory Fees, Net 627,306 504,079 602,337 555,431 624,231 2,134,986 2,286,078 Performance Fees Realized Carried Interest 174,168 294,170 183,288 182,654 283,846 327,422 943,958 Realized Incentive Fees 272,873 24,727 74,867 31,238 343,501 301,464 474,333 Unrealized Carried Interest 207,639 177,347 456,706 290,052 1,233,905 994,190 2,158,010 Unrealized Incentive Fees (184,507) 107,755 4,358 40,992 (173,033) (29,311) (19,928) Total Performance Fees 470,173 603,999 719,219 544,936 1,688,219 1,593,765 3,556,373 Investment Income Realized 37,448 38,110 54,586 11,492 66,283 95,398 170,471 Unrealized 74,222 96,661 42,533 87,680 290,460 190,846 517,334 Total Investment Income 111,670 134,771 97,119 99,172 356,743 286,244 687,805 Interest Income and Dividend Revenue 14,890 14,661 15,342 21,539 19,394 46,630 70,936 Other 4,707 2,143 (1,164) 4,708 4,621 5,149 10,308 Total Revenues 1,228,746 1,259,653 1,432,853 1,225,786 2,693,208 4,066,774 6,611,500 Expenses Compensation 247,559 266,977 306,477 279,498 262,688 1,030,776 1,115,640 Performance Fee Compensation Realized Carried Interest 58,573 89,437 75,910 60,369 31,485 96,433 257,201 Realized Incentive Fees 125,758 10,508 35,014 14,599 140,794 140,042 200,915 Unrealized Carried Interest 71,378 95,472 172,824 82,341 616,080 321,599 966,717 Unrealized Incentive Fees (91,965) 44,478 3,084 11,084 (70,297) (44,528) (11,651) Total Compensation and Benefits 411,303 506,872 593,309 447,891 980,750 1,544,322 2,528,822 Other Operating Expenses 131,430 114,444 120,152 122,872 129,171 481,445 486,639 Total Expenses 542,733 621,316 713,461 570,763 1,109,921 2,025,767 3,015,461 Economic Income 686,013 $ 638,337 $ 719,392 $ 655,023 $ 1,583,287 $ 2,041,007 $ 3,596,039 $ Economic Net Income 669,981 $ 628,306 $ 703,240 $ 640,231 $ 1,542,098 $ 1,995,299 $ 3,513,875 $ Fee Related Earnings 272,604 $ 137,733 $ 168,434 $ 178,596 $ 260,706 $ 700,313 $ 745,469 $ Distributable Earnings 562,337 $ 390,912 $ 338,485 $ 312,673 $ 820,629 $ 1,123,965 $ 1,862,699 $ Total Assets Under Management 210,219,960 $ 218,210,672 $ 229,571,741 $ 248,064,888 $ 265,757,630 $ 210,219,960 $ 265,757,630 $ Fee-Earning Assets Under Management 167,880,440 $ 170,949,347 $ 176,338,947 $ 188,649,817 $ 197,981,739 $ 167,880,440 $ 197,981,739 $ Weighted Average Fee-Earning AUM 168,328,454 $ 169,551,186 $ 173,706,678 $ 185,628,676 $ 196,309,547 $ 160,130,294 $ 186,133,604 $ LP Capital Invested 5,690,474 $ 1,784,463 $ 3,634,404 $ 3,378,067 $ 5,382,770 $ 13,898,971 $ 14,179,704 $ Total Capital Invested 6,200,755 $ 1,840,474 $ 3,757,591 $ 3,536,365 $ 6,115,856 $ 15,614,849 $ 15,250,286 $ |