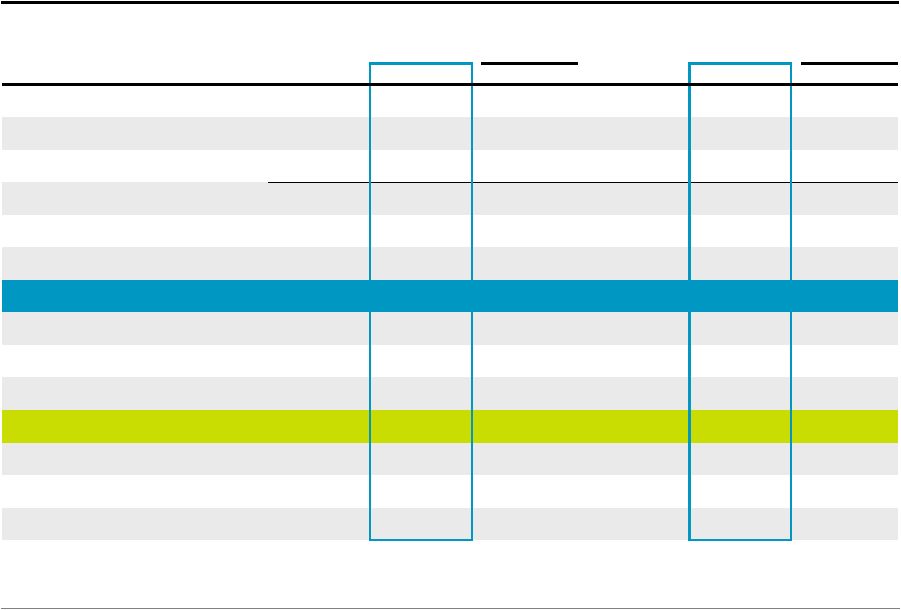
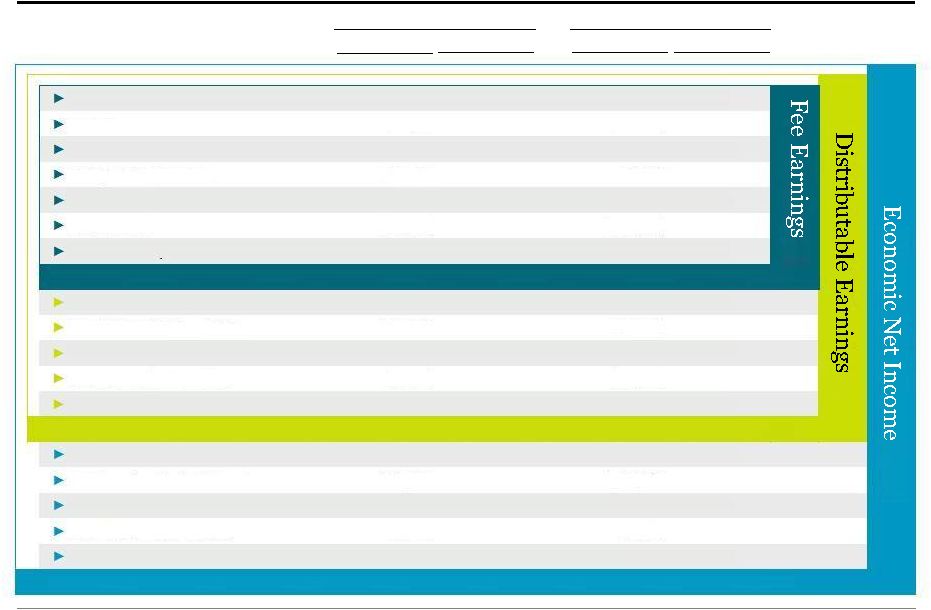
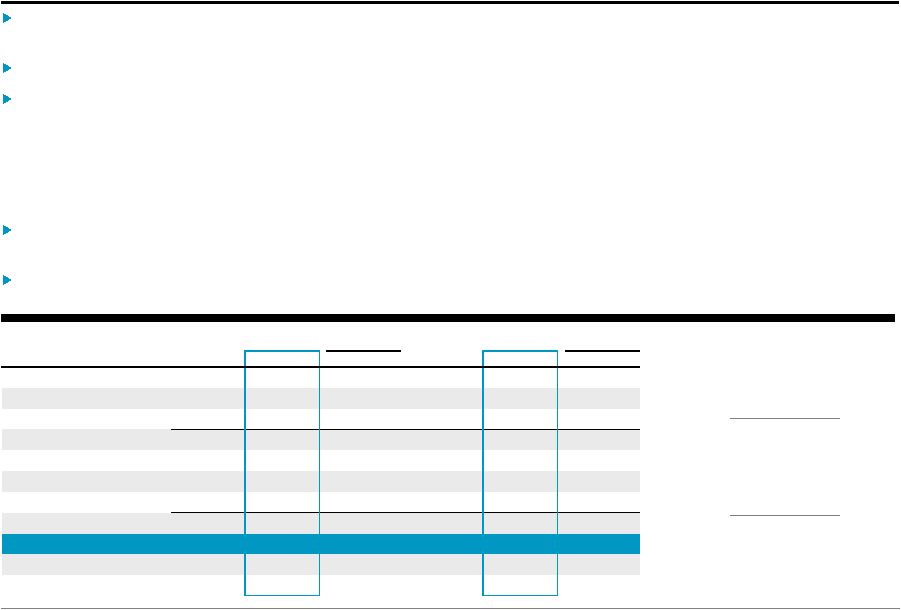
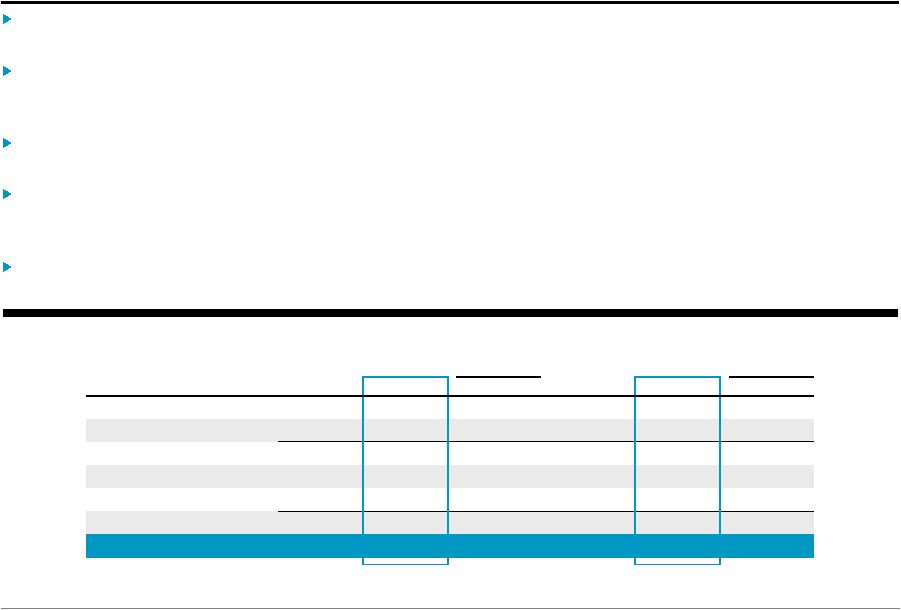
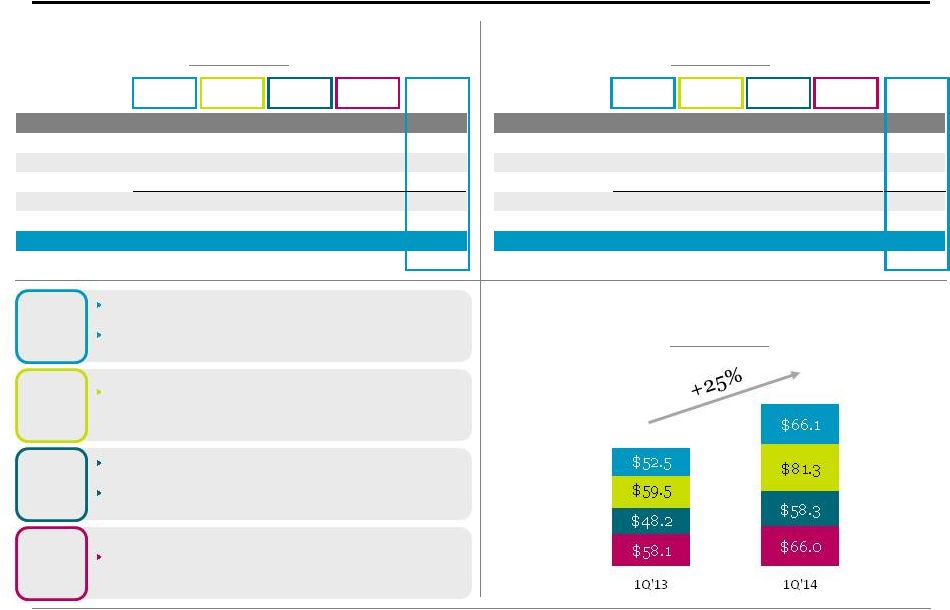
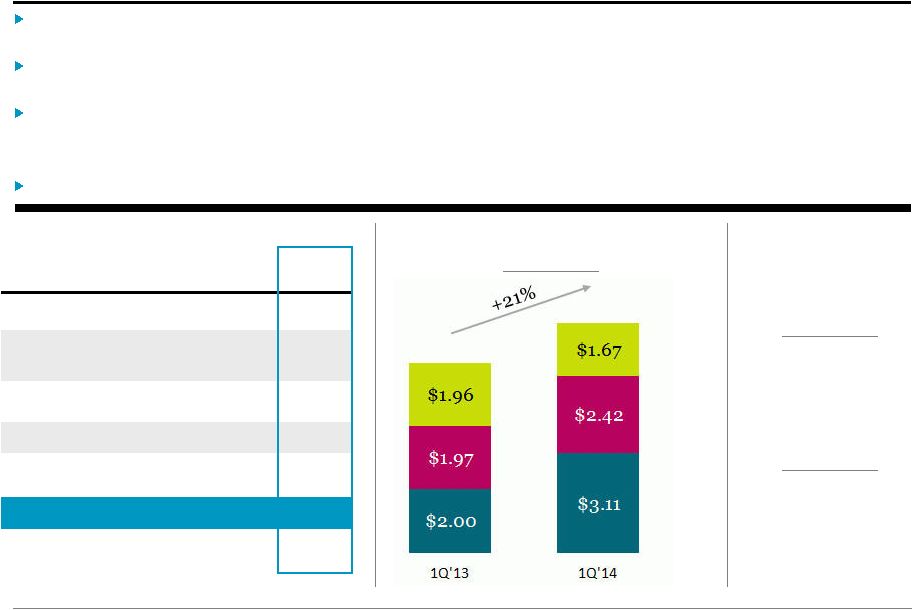
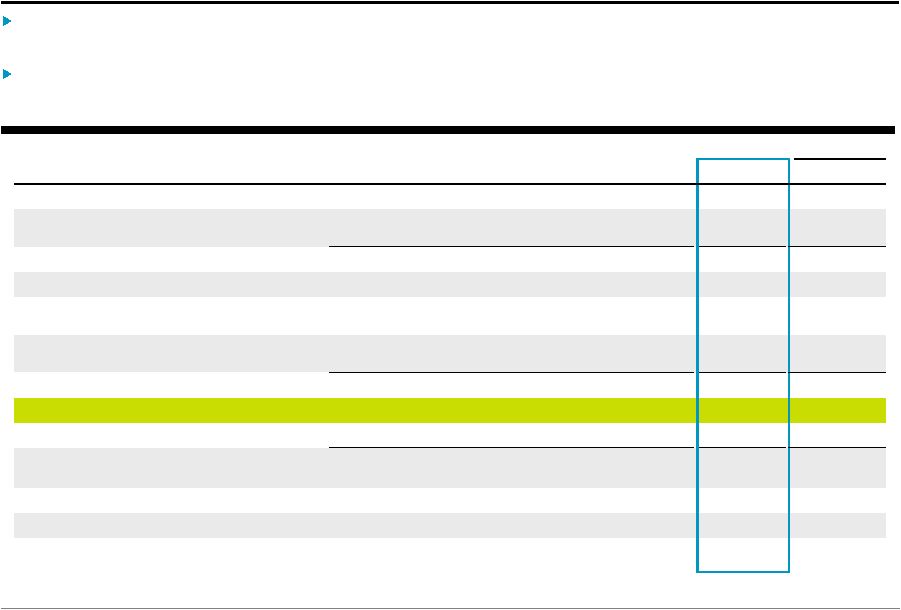
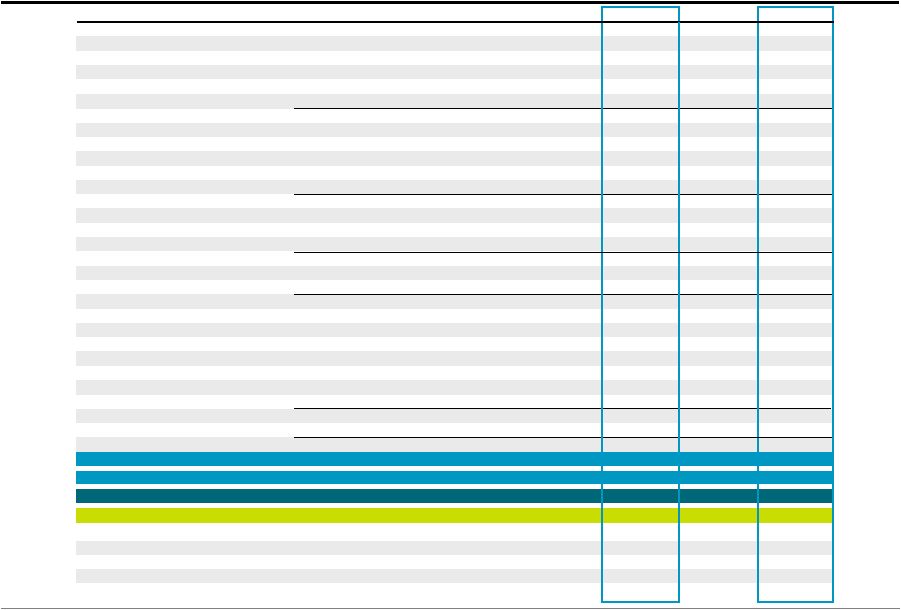
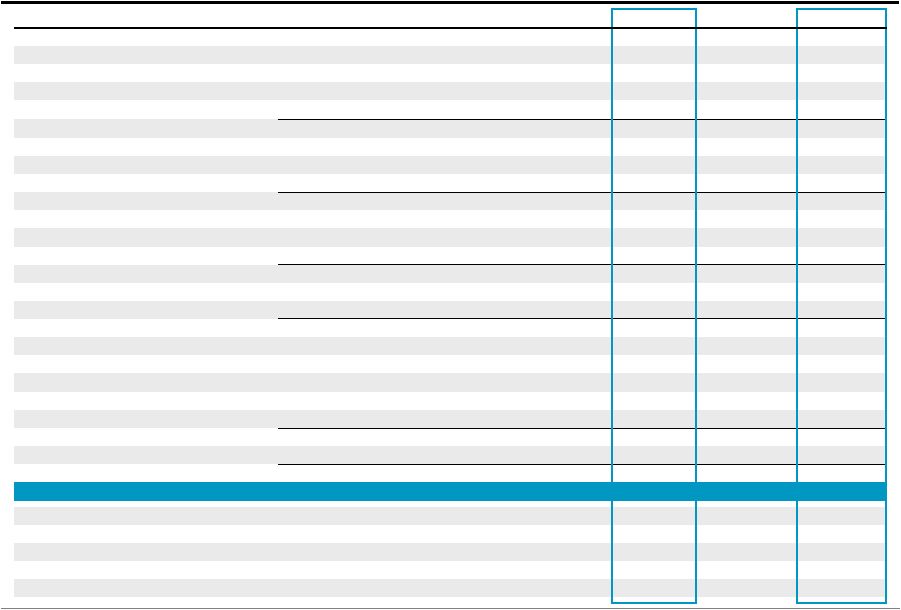
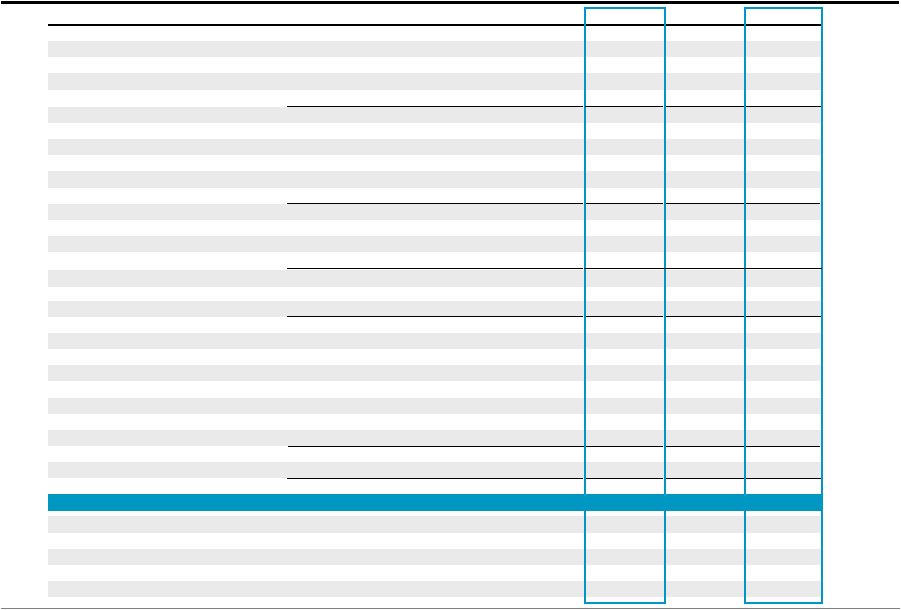
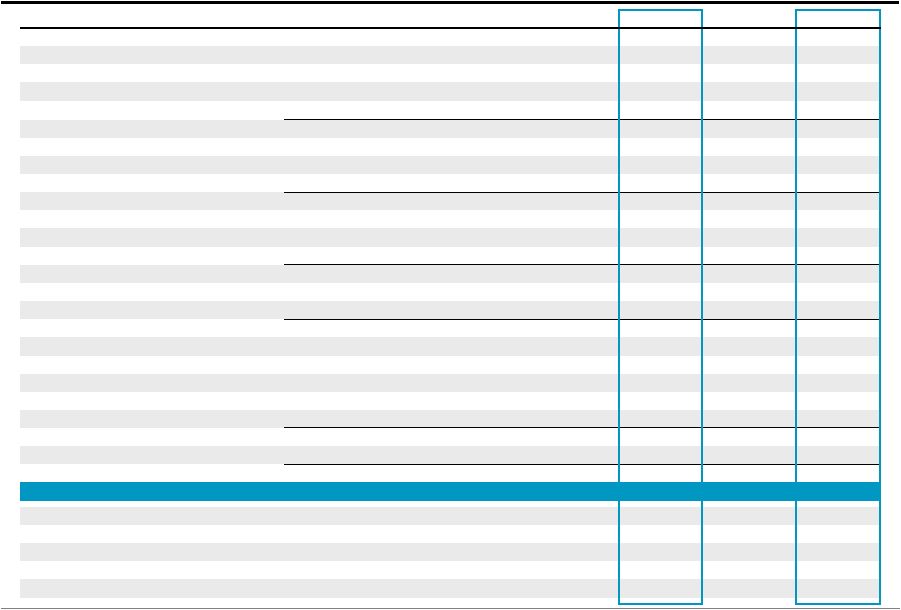
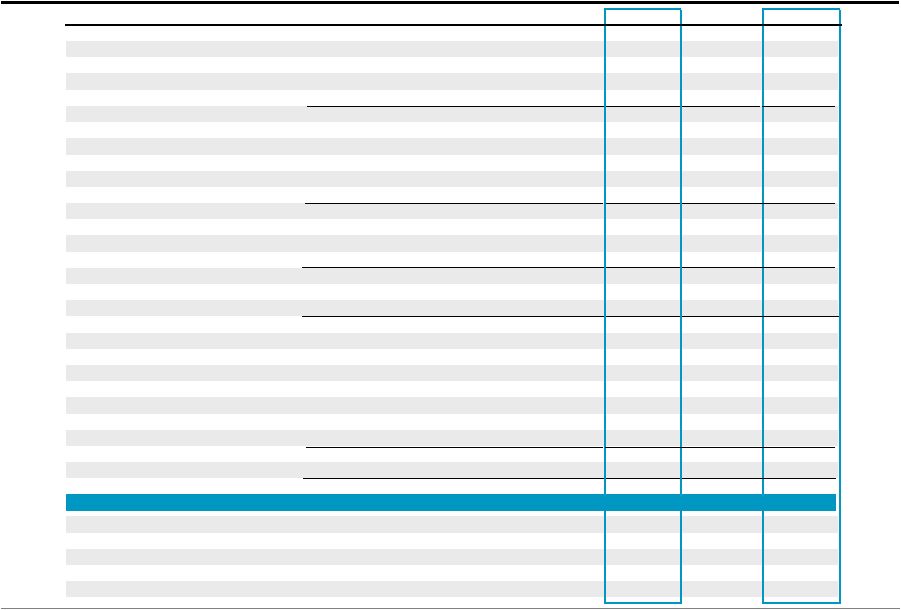
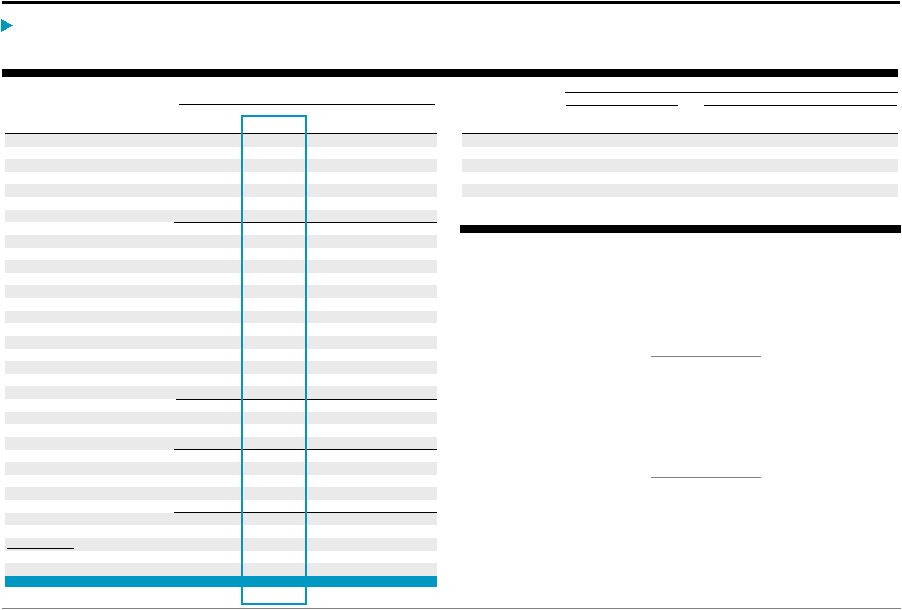
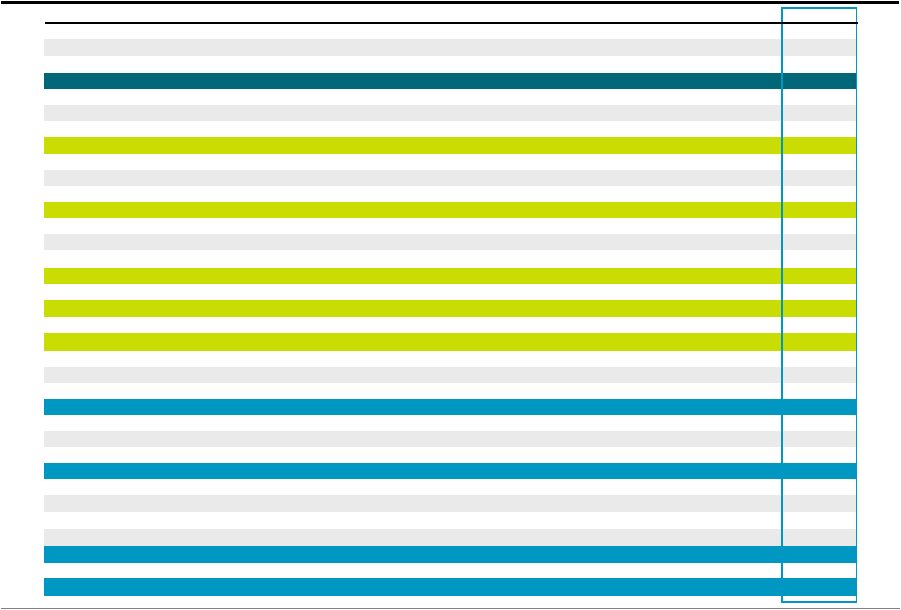
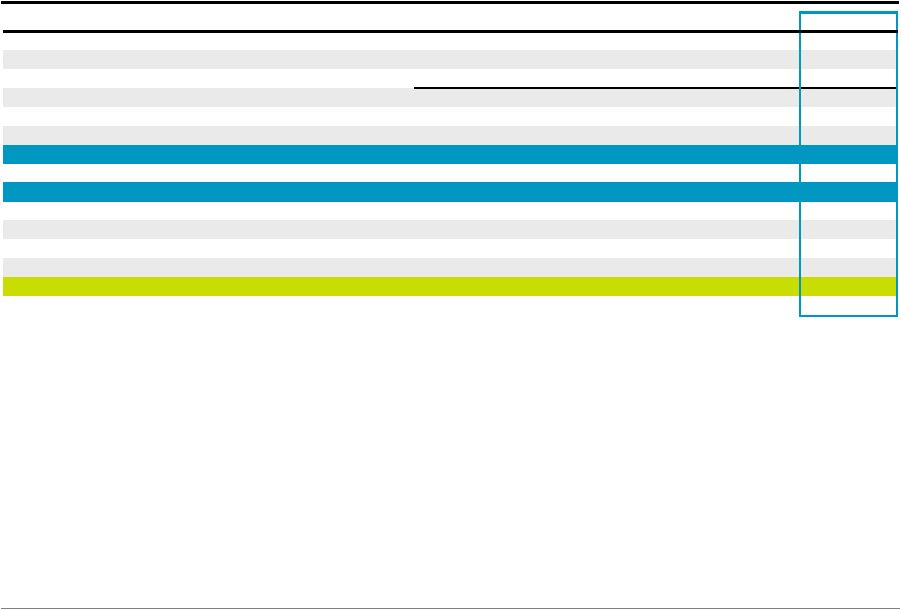
Blackstone 18 Total Segments (a) Transaction and Other Fees, Net, are net of amounts, if any, shared with limited partners including, for Private Equity, broken deal expenses. (b) Primarily placement fees. (Dollars in Thousands) 1Q'13 2Q'13 3Q'13 4Q'13 1Q'14 1Q'13 LTM 1Q'14 LTM Revenues Management and Advisory Fees, Net Base Management Fees 408,747 $ 425,674 $ 437,294 $ 469,092 $ 476,878 $ 1,604,644 $ 1,808,938 $ Advisory Fees 67,020 120,734 83,602 139,158 69,963 348,591 413,457 Transaction and Other Fees, Net (a) 37,974 66,464 42,806 59,733 59,910 226,622 228,913 Management Fee Offsets (b) (9,662) (10,535) (8,271) (43,752) (16,644) (37,565) (79,202) Total Management and Advisory Fees, Net 504,079 602,337 555,431 624,231 590,107 2,142,292 2,372,106 Performance Fees Realized Carried Interest 294,170 183,288 182,654 283,846 333,623 608,032 983,411 Realized Incentive Fees 24,727 74,867 31,238 343,501 53,837 320,912 503,443 Unrealized Carried Interest 177,347 456,706 290,052 1,233,905 330,288 872,741 2,310,951 Unrealized Incentive Fees 107,755 4,358 40,992 (173,033) 61,266 10,323 (66,417) Total Performance Fees 603,999 719,219 544,936 1,688,219 779,014 1,812,008 3,731,388 Investment Income Realized 38,110 54,586 11,492 66,283 111,917 110,016 244,278 Unrealized 96,661 42,533 87,680 290,460 4,550 227,593 425,223 Total Investment Income 134,771 97,119 99,172 356,743 116,467 337,609 669,501 Interest Income and Dividend Revenue 14,661 15,342 21,539 19,394 22,362 51,946 78,637 Other 2,143 (1,164) 4,708 4,621 869 8,499 9,034 Total Revenues 1,259,653 1,432,853 1,225,786 2,693,208 1,508,819 4,352,354 6,860,666 Expenses Compensation 266,977 306,477 279,498 262,688 306,545 1,042,981 1,155,208 Performance Fee Compensation Realized Carried Interest 89,437 75,910 60,369 31,485 149,398 177,932 317,162 Realized Incentive Fees 10,508 35,014 14,599 140,794 23,635 146,298 214,042 Unrealized Carried Interest 95,472 172,824 82,341 616,080 40,690 332,528 911,935 Unrealized Incentive Fees 44,478 3,084 11,084 (70,297) 23,531 (12,829) (32,598) Total Compensation and Benefits 506,872 593,309 447,891 980,750 543,799 1,686,910 2,565,749 Other Operating Expenses 114,444 120,152 122,872 129,171 139,774 486,368 511,969 Total Expenses 621,316 713,461 570,763 1,109,921 683,573 2,173,278 3,077,718 Economic Income 638,337 $ 719,392 $ 655,023 $ 1,583,287 $ 825,246 $ 2,179,076 $ 3,782,948 $ Economic Net Income 628,306 $ 703,240 $ 640,231 $ 1,542,098 $ 813,934 $ 2,132,388 $ 3,699,503 $ Fee Related Earnings 137,733 $ 168,434 $ 178,596 $ 260,706 $ 174,829 $ 691,118 $ 782,565 $ Distributable Earnings 390,912 $ 338,485 $ 312,673 $ 820,629 $ 485,112 $ 1,344,910 $ 1,956,899 $ Total Assets Under Management 218,210,672 $ 229,571,741 $ 248,064,888 $ 265,757,630 $ 271,745,583 $ 218,210,672 $ 271,745,583 $ Fee-Earning Assets Under Management 170,949,347 $ 176,338,947 $ 188,649,817 $ 197,981,739 $ 203,599,604 $ 170,949,347 $ 203,599,604 $ Weighted Average Fee-Earning AUM 169,551,186 $ 173,706,678 $ 185,628,676 $ 196,309,547 $ 200,246,002 $ 164,747,339 $ 188,952,701 $ LP Capital Invested 1,784,463 $ 3,634,404 $ 3,378,067 $ 5,382,770 $ 4,468,527 $ 12,964,001 $ 16,863,768 $ Total Capital Invested 1,840,474 $ 3,757,591 $ 3,536,365 $ 6,115,856 $ 4,807,663 $ 14,320,938 $ 18,217,475 $ |