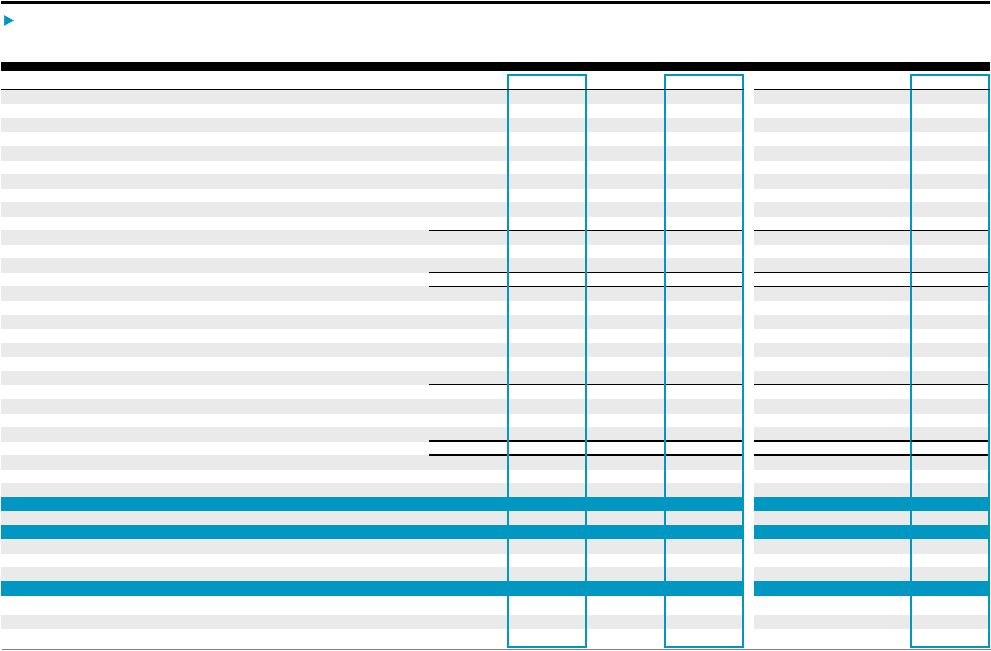
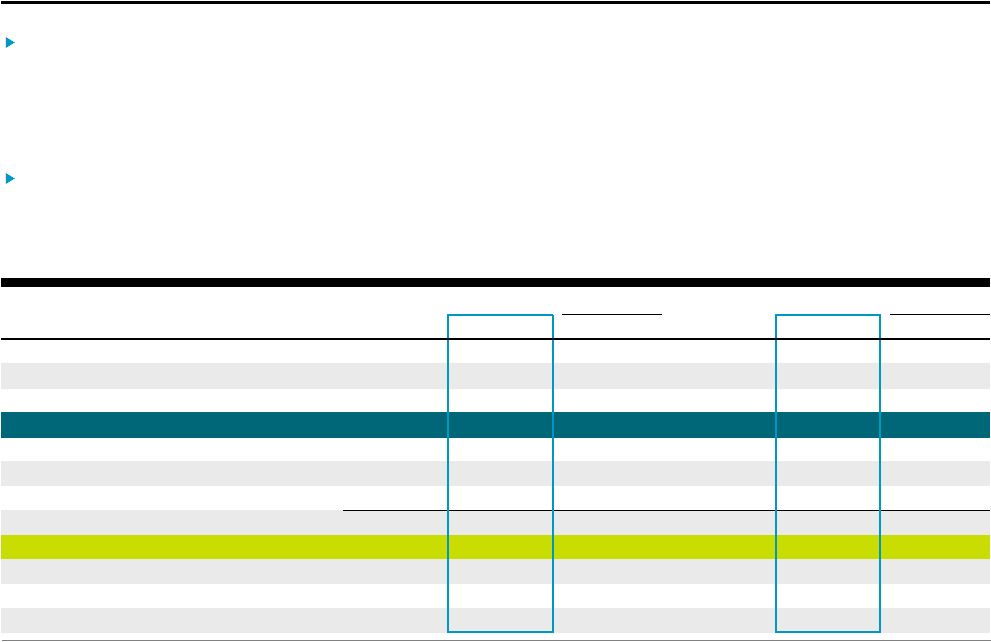
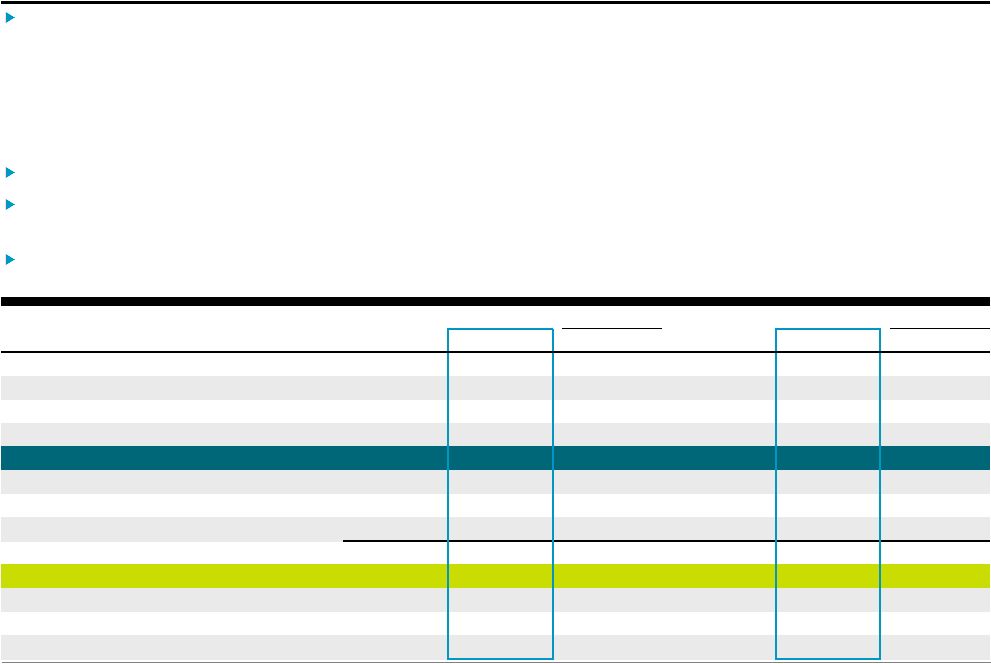
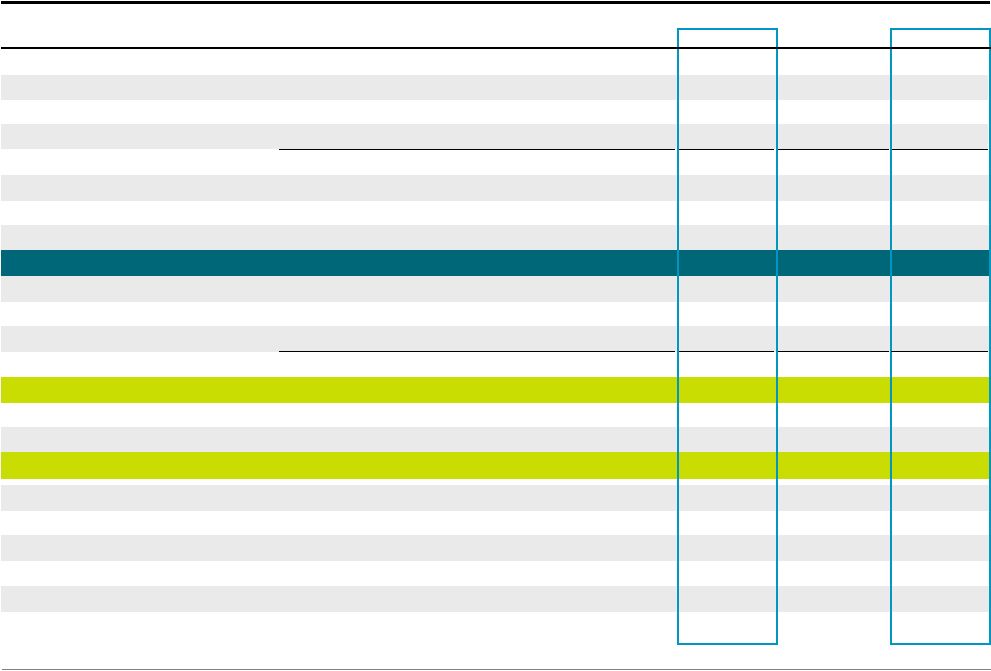
Blackstone 25 Notes on pages 26-27. Reconciliation of GAAP to Non-GAAP Measures QTD YTD LTM (Dollars in Thousands) 3Q'18 4Q'18 1Q'19 2Q'19 3Q'19 3Q'18 3Q'19 3Q'17 3Q'18 3Q'19 Net Income (Loss) Attributable to The Blackstone Group Inc. 442,742 $ (10,868) $ 481,304 $ 305,792 $ 779,437 $ 1,552,656 $ 1,566,533 $ 1,537,705 $ 1,856,794 $ 1,555,665 $ Net Income Attributable to Non-Controlling Interests in Blackstone Holdings 360,576 5,253 402,260 259,330 299,900 1,359,736 961,490 1,377,060 1,719,174 966,743 Net Income (Loss) Attributable to Non-Controlling Interests in Consolidated Entities 143,101 (68,800) 186,833 80,744 88,406 427,678 355,983 423,759 560,042 287,183 Net Income (Loss) Attributable to Redeemable Non-Controlling Interests in Consolidated Entities 2,569 (4,303) 2,480 1,095 (8) 2,199 3,567 7,869 9,799 (736) Net Income (Loss) 948,988 $ (78,718) $ 1,072,877 $ 646,961 $ 1,167,735 $ 3,342,269 $ 2,887,573 $ 3,346,393 $ 4,145,809 $ 2,808,855 $ Provision for Taxes 26,798 29,366 41,155 38,736 (156,786) 220,024 (76,895) 194,644 816,614 (47,529) Income (Loss) Before Provision for Taxes 975,786 $ (49,352) $ 1,114,032 $ 685,697 $ 1,010,949 $ 3,562,293 $ 2,810,678 $ 3,541,037 $ 4,962,423 $ 2,761,326 $ Transaction-Related Charges (a) 79,242 76,431 89,451 106,994 (82,547) (338,347) 113,898 241,340 (685,402) 190,329 Amortization of Intangibles (b) 14,856 15,392 16,483 16,483 16,483 44,602 49,449 50,028 58,867 64,841 Impact of Consolidation (c) (145,670) 73,103 (189,313) (81,839) (88,398) (429,877) (359,550) (431,628) (569,841) (286,447) Unrealized Performance Revenues (d) (298,931) 806,531 (664,333) (157,398) (176,604) (1,367,694) (998,335) (629,267) (883,208) (191,804) Unrealized Performance Allocations Compensation (e) 178,184 (302,868) 287,015 64,518 94,907 622,610 446,440 412,927 456,427 143,572 Unrealized Principal Investment (Income) Loss (f) (28,704) 160,659 (139,925) 56,353 5,219 (94,808) (78,353) 111,102 (78,320) 82,306 Other Revenues (g) (9,092) (46,854) (13,189) 20,150 (92,843) (42,614) (85,882) 52,061 (7,463) (132,736) Equity-Based Compensation (h) 36,576 43,102 66,776 53,105 58,570 115,118 178,451 106,561 136,514 221,553 Taxes and Related Payables (i) (32,963) (54,063) (29,039) (55,201) (35,815) (99,802) (120,055) (178,098) (179,370) (174,118) Distributable Earnings 769,284 $ 722,081 $ 537,958 $ 708,862 $ 709,921 $ 1,971,481 $ 1,956,741 $ 3,276,063 $ 3,210,627 $ 2,678,822 $ Taxes and Related Payables (i) 32,963 54,063 29,039 55,201 35,815 99,802 120,055 178,098 179,370 174,118 Net Interest (Income) Loss (j) (9,013) (11,923) (5,061) (2,761) 7,767 (10,002) (55) 30,951 19,507 (11,978) Total Segment Distributable Earnings 793,234 $ 764,221 $ 561,936 $ 761,302 $ 753,503 $ 2,061,281 $ 2,076,741 $ 3,485,112 $ 3,409,504 $ 2,840,962 $ Realized Performance Revenues (k) (572,159) (483,697) (246,769) (341,386) (420,840) (1,328,074) (1,008,995) (2,625,683) (2,824,872) (1,492,692) Realized Performance Compensation (l) 190,773 199,645 85,240 125,466 143,870 478,496 354,576 886,038 1,051,795 554,221 Realized Principal Investment Income (m) (65,620) (47,098) (25,908) (123,557) (36,148) (188,960) (185,613) (459,635) (261,185) (232,711) Fee Related Earnings 346,228 $ 433,071 $ 374,499 $ 421,825 $ 440,385 $ 1,022,743 $ 1,236,709 $ 1,285,832 $ 1,375,242 $ 1,669,780 $ Adjusted EBITDA Reconciliation Distributable Earnings 769,284 $ 722,081 $ 537,958 $ 708,862 $ 709,921 $ 1,971,481 $ 1,956,741 $ 3,276,063 $ 3,210,627 $ 2,678,822 $ Interest Expense (n) 40,923 41,792 41,638 43,230 52,815 118,046 137,683 159,579 190,391 179,475 Taxes and Related Payables (i) 32,963 54,063 29,039 55,201 35,815 99,802 120,055 178,098 179,370 174,118 Depreciation and Amortization 5,681 5,964 5,789 6,000 6,895 17,918 18,684 30,645 24,511 24,648 Adjusted EBITDA 848,851 $ 823,900 $ 614,424 $ 813,293 $ 805,446 $ 2,207,247 $ 2,233,163 $ 3,644,385 $ 3,604,899 $ 3,057,063 $ |