Exhibit 99.1

|
Blackstone Reports Second Quarter 2021 Results
New York, July 22, 2021: Blackstone (NYSE:BX) today reported its second quarter 2021 results.
Stephen A. Schwarzman, Chairman and Chief Executive Officer, said, “Blackstone again reported outstanding
results in the second quarter, including our best-ever quarter of fund appreciation. Strong investment performance
and our culture of innovation have allowed us to meaningfully broaden the clients we serve, including individual
investors and insurance companies, and the types of investments we can make. The result is 21% year-over-year
growth in total assets under management to a record $684 billion and continued elevation in the power and quality
of Blackstone’s earnings.”
Blackstone issued a full detailed presentation of its second quarter 2021 results, which can be viewed at
www.blackstone.com.
Dividend
Blackstone has declared a quarterly dividend of $0.70 per share to record holders of common stock at the close of
business on August 2, 2021. This dividend will be paid on August 9, 2021.
Quarterly Investor Call Details
Blackstone will host its second quarter 2021 investor conference via public webcast on July 22, 2021 at
9:00 a.m. ET. To register, please use the following link:
https://event.webcasts.com/starthere.jsp?ei=1478895&tp_key=6a815c6a88. For those unable to listen to the live
Blackstone
345 Park Avenue New York NY 10154
T 212 583 5000
www.blackstone.com
broadcast, there will be a webcast replay on the Shareholders section of Blackstone’s website at
https://ir.blackstone.com/.
About Blackstone
Blackstone is one of the world’s leading investment firms. We seek to create positive economic impact and long-
term value for our investors, the companies we invest in, and the communities in which we work. We do this by
using extraordinary people and flexible capital to help companies solve problems. Our $684 billion in assets under
management include investment vehicles focused on private equity, real estate, public debt and equity, life
sciences, growth equity, opportunistic, non-investment grade credit, real assets and secondary funds, all on a
global basis. Further information is available at www.blackstone.com. Follow Blackstone on Twitter @Blackstone.
Forward-Looking Statements
This presentation may contain forward-looking statements within the meaning of Section 27A of the Securities Act
of 1933, as amended, and Section 21E of the Securities Exchange Act of 1934, as amended, which reflect our
current views with respect to, among other things, our operations, taxes, earnings and financial performance, share
repurchases and dividends. You can identify these forward-looking statements by the use of words such as
“outlook,” “indicator,” “believes,” “expects,” “potential,” “continues,” “may,” “will,” “should,” “seeks,”
“approximately,” “predicts,” “intends,” “plans,” “scheduled,” “estimates,” “anticipates” or the negative version
of these words or other comparable words. Such forward-looking statements are subject to various risks and
uncertainties. Accordingly, there are or will be important factors that could cause actual outcomes or results to
differ materially from those indicated in these statements. We believe these factors include but are not limited to
the impact of the novel coronavirus (“COVID-19”), as well as those described under the section entitled “Risk
Factors” in our Annual Report on Form 10-K for the year ended December 31, 2020, as such factors may be updated
from time to time in our periodic filings with the United States Securities and Exchange Commission (“SEC”), which
are accessible on the SEC’s website at www.sec.gov. These factors should not be construed as exhaustive and
should be read in conjunction with the other cautionary statements that are included in this report and in our other
periodic filings. The forward-looking statements speak only as of the date of this report, and we undertake no
obligation to publicly update or review any forward-looking statement, whether as a result of new information,
future developments or otherwise.
2
This presentation does not constitute an offer of any Blackstone Fund.
Investor and Media Relations Contacts
Weston Tucker Blackstone Tel: +1 (212) 583-5231 tucker@blackstone.com | Christine Anderson Blackstone Tel: +1 (212) 583-5182 christine.anderson@blackstone.com |
3

Blackstone’s Second
Quarter 2021 Earnings
JULY 22, 2021
BLACKSTONE’S SECOND QUARTER 2021 GAAP RESULTS
§ | GAAP Net Income was $2.9 billion for the quarter and $6.2 billion year-to-date (“YTD”). GAAP Net Income |
| ($ in thousands, except per share data) (unaudited) | 2Q’20 | 2Q’21 | 2Q’20 YTD | 2Q’21 YTD | 2Q’20 LTM | 2Q’21 LTM | ||||||||||||||||||||||
Revenues | ||||||||||||||||||||||||||||
Management and Advisory Fees, Net | $ | 969,728 |
| $ | 1,212,549 |
| $ | 1,904,560 |
| $ | 2,390,364 |
| $ | 3,726,611 |
| $ | 4,578,353 |
| ||||||||||
Incentive Fees |
| 15,300 |
|
| 33,207 |
|
| 27,461 |
|
| 69,331 |
|
| 123,325 |
|
| 180,531 |
| ||||||||||
Investment Income (Loss) | ||||||||||||||||||||||||||||
Performance Allocations | ||||||||||||||||||||||||||||
Realized |
| 101,910 |
|
| 808,620 |
|
| 269,440 |
|
| 1,342,987 |
|
| 1,433,545 |
|
| 3,179,547 |
| ||||||||||
Unrealized |
| 1,067,923 |
|
| 2,697,170 |
|
| (2,385,158) |
|
| 5,161,667 |
|
| (2,080,557) |
|
| 7,162,432 |
| ||||||||||
Principal Investments | ||||||||||||||||||||||||||||
Realized |
| 61,102 |
|
| 152,060 |
|
| 109,797 |
|
| 507,098 |
|
| 284,974 |
|
| 788,929 |
| ||||||||||
Unrealized |
| 331,762 |
|
| 328,835 |
|
| (627,603) |
|
| 968,150 |
|
| (544,299) |
|
| 1,481,146 |
| ||||||||||
Total Investment Income (Loss) |
| 1,562,697 |
|
| 3,986,685 |
|
| (2,633,524) |
|
| 7,979,902 |
|
| (906,337) |
|
| 12,612,054 |
| ||||||||||
Interest and Dividend Revenue |
| 23,924 |
|
| 31,017 |
|
| 59,008 |
|
| 62,429 |
|
| 153,636 |
|
| 128,652 |
| ||||||||||
Other |
| (55,580) |
|
| 27,896 |
|
| 82,600 |
|
| 88,200 |
|
| 169,463 |
|
| (247,542) |
| ||||||||||
Total Revenues | $ | 2,516,069 |
| $ | 5,291,354 |
| $ | (559,895) |
| $ | 10,590,226 |
| $ | 3,266,698 |
| $ | 17,252,048 |
| ||||||||||
Expenses | ||||||||||||||||||||||||||||
Compensation and Benefits | ||||||||||||||||||||||||||||
Compensation |
| 458,457 |
|
| 507,104 |
|
| 935,000 |
|
| 1,049,742 |
|
| 1,845,412 |
|
| 1,970,361 |
| ||||||||||
Incentive Fee Compensation |
| 8,432 |
|
| 14,431 |
|
| 14,954 |
|
| 27,756 |
|
| 44,962 |
|
| 57,227 |
| ||||||||||
Performance Allocations Compensation | ||||||||||||||||||||||||||||
Realized |
| 38,569 |
|
| 347,423 |
|
| 110,992 |
|
| 560,450 |
|
| 561,714 |
|
| 1,292,688 |
| ||||||||||
Unrealized |
| 454,813 |
|
| 1,150,219 |
|
| (942,565) |
|
| 2,200,188 |
|
| (753,813) |
|
| 2,988,237 |
| ||||||||||
Total Compensation and Benefits |
| 960,271 |
|
| 2,019,177 |
|
| 118,381 |
|
| 3,838,136 |
|
| 1,698,275 |
|
| 6,308,513 |
| ||||||||||
General, Administrative and Other |
| 169,051 |
|
| 205,057 |
|
| 326,617 |
|
| 390,179 |
|
| 684,655 |
|
| 775,344 |
| ||||||||||
Interest Expense |
| 39,276 |
|
| 44,322 |
|
| 80,920 |
|
| 89,305 |
|
| 194,970 |
|
| 174,547 |
| ||||||||||
Fund Expenses |
| 4,083 |
|
| 3,774 |
|
| 8,688 |
|
| 6,157 |
|
| 17,953 |
|
| 10,333 |
| ||||||||||
Total Expenses | $ | 1,172,681 |
| $ | 2,272,330 |
| $ | 534,606 |
| $ | 4,323,777 |
| $ | 2,595,853 |
| $ | 7,268,737 |
| ||||||||||
Other Income (Loss) | ||||||||||||||||||||||||||||
Change in Tax Receivable Agreement Liability |
| 76 |
|
| (392) |
|
| (519) |
|
| 2,518 |
|
| 161,048 |
|
| (32,346) |
| ||||||||||
Net Gains (Losses) from Fund Investment Activities |
| 158,297 |
|
| 127,116 |
|
| (169,077) |
|
| 247,469 |
|
| (77,704) |
|
| 447,088 |
| ||||||||||
Income (Loss) Before Provision (Benefit) for Taxes | $ | 1,501,761 |
| $ | 3,145,748 |
| $ | (1,264,097) |
| $ | 6,516,436 |
| $ | 754,189 |
| $ | 10,398,053 |
| ||||||||||
Provision (Benefit) for Taxes |
| 147,415 |
|
| 288,250 |
|
| (11,288) |
|
| 287,803 |
|
| (139,131) |
|
| 655,105 |
| ||||||||||
Net Income (Loss) | $ | 1,354,346 |
| $ | 2,857,498 |
| $ | (1,252,809) |
| $ | 6,228,633 |
| $ | 893,320 |
| $ | 9,742,948 |
| ||||||||||
Net Income (Loss) Attributable to Redeemable Non-Controlling Interests in Consolidated Entities |
| (3,426) |
|
| 637 |
|
| (18,895) |
|
| 1,266 |
|
| (22,591) |
|
| 6,263 |
| ||||||||||
Net Income (Loss) Attributable to Non-Controlling Interests in Consolidated Entities |
| 294,378 |
|
| 431,516 |
|
| (350,699) |
|
| 818,366 |
|
| (141,497) |
|
| 1,386,182 |
| ||||||||||
Net Income (Loss) Attributable to Non-Controlling Interests in Blackstone Holdings |
| 495,128 |
|
| 1,116,193 |
|
| (384,989) |
|
| 2,351,977 |
|
| 293,048 |
|
| 3,749,890 |
| ||||||||||
Net Income (Loss) Attributable to The Blackstone Group Inc. (“BX”) | $ | 568,266 |
| $ | 1,309,152 |
| $ | (498,226) |
| $ | 3,057,024 |
| $ | 764,360 |
| $ | 4,600,613 |
| ||||||||||
Net Income (Loss) Per Share of Common Stock, Basic | $ | 0.81 |
| $ | 1.82 |
| $ | (0.74) |
| $ | 4.27 |
| $ | 1.12 |
| $ | 6.51 |
| ||||||||||
Net Income (Loss) Per Share of Common Stock, Diluted | $ | 0.81 |
| $ | 1.82 |
| $ | (0.74) |
| $ | 4.27 |
| $ | 1.12 |
| $ | 6.51 |
| ||||||||||
Income (Loss) Before Provision (Benefit) for Taxes Margin |
| 59.7% |
|
| 59.5% |
|
| 225.8% |
|
| 61.5% |
|
| 23.1% |
|
| 60.3% |
| ||||||||||
Throughout this presentation, all current period amounts are preliminary and unaudited. Totals may not add due to rounding. See pages 34-36, Definitions and Dividend Policy, for definitions of terms used throughout this presentation. See additional notes on page 32. |
Blackstone | 1 |
BLACKSTONE’S SECOND QUARTER 2021 HIGHLIGHTS
| Financial Measures |
§ Fee Related Earnings (“FRE”) of $704 million ($0.58/share) in the quarter, up 30% year-
– FRE was $2.8 billion over the last twelve months (“LTM”) ($2.33/share), up
§ Distributable Earnings (“DE”) of $1.1 billion ($0.82/share) in the quarter, up 95% year-
– DE was $4.5 billion over the LTM ($3.54/share), up 65% year-over-year
§ Net Accrued Performance Revenues of $6.8 billion ($5.60/share), up 150% year-over- | |
| Capital Metrics |
§ Total Assets Under Management (“AUM”) of $684.0 billion, up 21% year-over-year
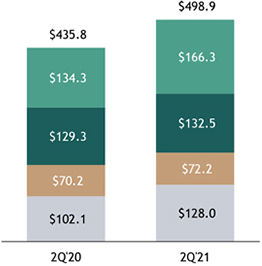
– Fee-Earning AUM of $498.9 billion, up 14% year-over-year
§ Inflows of $37.3 billion in the quarter and $116.3 billion over the LTM
§ Realizations of $19.6 billion in the quarter and $63.4 billion over the LTM
§ Deployment of $23.8 billion in the quarter and $75.6 billion over the LTM | |
| Capital Returned to Shareholders |
§ Dividend of $0.70 per common share payable on August 9, 2021
– Dividends of $3.02 per common share over the LTM
§ Repurchased 3.2 million common shares in the quarter and 5.2 million common shares over the LTM
§ $1.2 billion to be distributed to shareholders with respect to the second quarter
| |
| AIG L&R Strategic Partnership |
§ Subsequent to quarter end, Blackstone agreed to acquire a 9.9% stake in AIG Life &
| |
| Notes on page 32. |
Blackstone | 2 |
BLACKSTONE’S SECOND QUARTER 2021 SEGMENT EARNINGS
| % Change | % Change | |||||||||||||||||||
($ in thousands, except per share data) | 2Q’20 | 2Q’21 | vs. 2Q’20 | 2Q’20 YTD | 2Q’21 YTD | vs. 2Q’20 YTD | ||||||||||||||
Management and Advisory Fees, Net | $ | 976,733 |
| $ | 1,212,742 |
| 24% | $ | 1,917,300 |
| $ | 2,390,947 |
| 25% | ||||||
Fee Related Performance Revenues |
| 15,033 |
|
| 48,889 |
| 225% |
| 27,499 |
|
| 218,057 |
| 693% | ||||||
Fee Related Compensation |
| (306,904 | ) |
| (375,385 | ) | 22% |
| (653,168 | ) |
| (820,495 | ) | 26% | ||||||
Other Operating Expenses |
| (143,583 | ) |
| (182,178 | ) | 27% |
| (282,468 | ) |
| (343,602 | ) | 22% | ||||||
Fee Related Earnings | $ | 541,279 |
| $ | 704,068 |
| 30% | $ | 1,009,163 |
| $ | 1,444,907 |
| 43% | ||||||
Realized Performance Revenues |
| 102,177 |
|
| 792,938 |
| 676% |
| 269,410 |
|
| 1,194,261 |
| 343% | ||||||
Realized Performance Compensation |
| (37,787 | ) |
| (338,271 | ) | 795% |
| (109,089 | ) |
| (489,195 | ) | 348% | ||||||
Realized Principal Investment Income |
| 18,938 |
|
| 63,132 |
| 233% |
| 39,228 |
|
| 361,288 |
| 821% | ||||||
Net Realizations |
| 83,328 |
|
| 517,799 |
| 521% |
| 199,549 |
|
| 1,066,354 |
| 434% | ||||||
Total Segment Distributable Earnings | $ | 624,607 |
| $ | 1,221,867 |
| 96% | $ | 1,208,712 |
| $ | 2,511,261 |
| 108% | ||||||
Net Interest Income (Loss) |
| (12,634 | ) |
| (11,201 | ) | (11)% |
| (16,575 | ) |
| (24,129 | ) | 46% | ||||||
Taxes and Related Payables |
| (63,990 | ) |
| (140,673 | ) | 120% |
| (87,043 | ) |
| (224,895 | ) | 158% | ||||||
Distributable Earnings | $ | 547,983 |
| $ | 1,069,993 |
| 95% | $ | 1,105,094 |
| $ | 2,262,237 |
| 105% | ||||||
Additional Metrics: | ||||||||||||||||||||
FRE per Share | $ | 0.45 |
| $ | 0.58 |
| 29% | $ | 0.84 |
| $ | 1.20 |
| 43% | ||||||
DE per Common Share | $ | 0.43 |
| $ | 0.82 |
| 91% | $ | 0.89 |
| $ | 1.78 |
| 100% | ||||||
Total Segment Revenues | $ | 1,112,881 |
| $ | 2,117,701 |
| 90% | $ | 2,253,437 |
| $ | 4,164,553 |
| 85% | ||||||
Total Assets Under Management | $ | 564,330,088 |
| $ | 684,028,712 |
| 21% | $ | 564,330,088 |
| $ | 684,028,712 |
| 21% | ||||||
Fee-Earning Assets Under Management | $ | 435,825,935 |
| $ | 498,932,526 |
| 14% | $ | 435,825,935 |
| $ | 498,932,526 |
| 14% | ||||||
| Fee Related Earnings per Share is based on end of period DE Shares Outstanding (see page 23, Share Summary). DE per Common Share is based on DE Attributable to Common Shareholders (see page 22, Shareholder Dividends) and end of period Participating Common Shares outstanding. YTD per Share amounts represent the sum of the last two quarters. See pages 30-31 for the Reconciliation of GAAP to Total Segment Measures. |
Blackstone | 3 |
SUMMARY OF FINANCIALS
§ | LTM Fee Related Earnings of $2.33 per share, an increase of 40% year-over-year. |
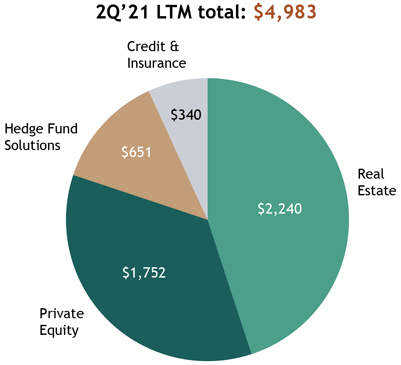
§ | LTM Total Segment Distributable Earnings were $5.0 billion, an increase of 69% year-over-year. |
Fee Related Earnings per Share
| Segment Distributable Earnings
($ in millions)
|
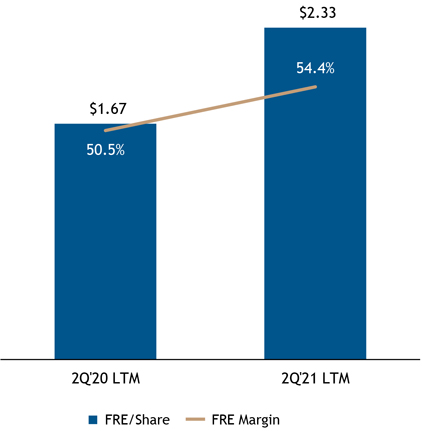
| FRE Margin is calculated by dividing Fee Related Earnings by Fee Related Revenues (defined as the sum of Total Segment Management and Advisory Fees, Net and Fee Related Performance Revenues). |
Blackstone | 4 | |||
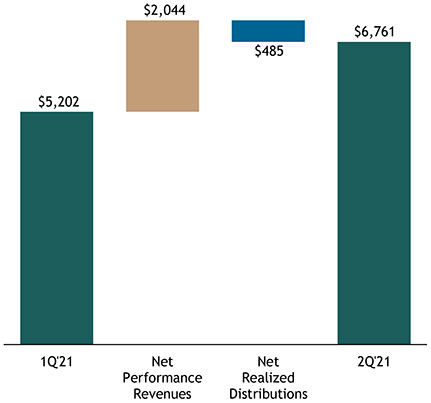
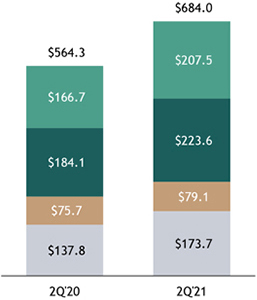
INVESTMENT PERFORMANCE AND NET ACCRUED PERFORMANCE REVENUES
§ | Strong appreciation across strategies led to a 30% increase in Net Accrued Performance Revenues quarter-over-quarter to $6.8 billion ($5.60/share). |
Investment Performance
(appreciation / gross returns)
2Q’21 | 2Q’21 LTM | |||
Real Estate | ||||
Opportunistic | 9.4% | 25.4% | ||
Core+ | 5.7% | 18.0% | ||
Private Equity | ||||
Corporate Private Equity | 13.8% | 52.2% | ||
Tactical Opportunities | 7.2% | 44.3% | ||
Secondaries | 17.7% | 23.3% | ||
Hedge Fund Solutions | ||||
BPS Composite | 3.5% | 15.3% | ||
Credit & Insurance | ||||
Private Credit | 4.8% | 29.4% | ||
Liquid Credit | 1.7% | 11.1% |
Net Accrued Performance Revenues
($ in millions)
| Investment Performance represents fund appreciation for Real Estate and Private Equity and gross returns for Hedge Fund Solutions and Credit & Insurance. BPS Composite net returns were 3.2% and 14.2% for 2Q’21 and 2Q’21 LTM, respectively. Private Credit net returns were 3.8% and 23.2% for 2Q’21 and 2Q’21 LTM, respectively. Liquid Credit net returns were 1.6% and 10.7% for 2Q’21 and 2Q’21 LTM, respectively. See notes on page 32 for additional details on investment performance. |
Blackstone | 5 |
CAPITAL METRICS – ADDITIONAL DETAIL
§ | Inflows were $37.3 billion in the quarter, bringing LTM inflows to $116.3 billion. |
§ | Realizations were $19.6 billion in the quarter and $63.4 billion over the LTM. |
§ | Deployed $23.8 billion in the quarter and $75.6 billion over the LTM. |
| – | Committed an additional $28.5 billion that was not yet deployed in the quarter. |
| Inflows | Realizations | Capital Deployed | ||||||||||||||||||||||||||
| ($ in millions) | 2Q’21 | 2Q’21 LTM | 2Q’21 | 2Q’21 LTM | 2Q’21 | 2Q’21 LTM | ||||||||||||||||||||||
Real Estate | $ | 8,880 |
| $ | 33,350 |
| $ | 5,306 |
| $ | 18,733 |
| $ | 4,766 |
| $ | 24,837 |
| ||||||||||
Opportunistic |
| 176 |
|
| 968 |
|
| 3,967 |
|
| 13,778 |
|
| 2,219 |
|
| 6,621 |
| ||||||||||
Core+ |
| 7,500 |
|
| 29,226 |
|
| 878 |
|
| 3,006 |
|
| 1,795 |
|
| 15,316 |
| ||||||||||
BREDS |
| 1,204 |
|
| 3,155 |
|
| 461 |
|
| 1,949 |
|
| 752 |
|
| 2,900 |
| ||||||||||
Private Equity |
| 7,335 |
|
| 24,126 |
|
| 8,633 |
|
| 29,010 |
|
| 9,457 |
|
| 27,403 |
| ||||||||||
Corporate Private Equity |
| 2,589 |
|
| 11,220 |
|
| 4,113 |
|
| 14,287 |
|
| 3,194 |
|
| 10,911 |
| ||||||||||
Tactical Opportunities |
| 1,161 |
|
| 8,432 |
|
| 1,909 |
|
| 8,927 |
|
| 2,237 |
|
| 6,929 |
| ||||||||||
Secondaries |
| 3,573 |
|
| 4,441 |
|
| 2,556 |
|
| 5,634 |
|
| 2,878 |
|
| 6,149 |
| ||||||||||
Infrastructure |
| 12 |
|
| 33 |
|
| 54 |
|
| 162 |
|
| 1,148 |
|
| 3,415 |
| ||||||||||
Hedge Fund Solutions |
| 2,197 |
|
| 8,109 |
|
| 304 |
|
| 1,235 |
|
| 1,249 |
|
| 3,012 |
| ||||||||||
Credit & Insurance |
| 18,870 |
|
| 50,733 |
|
| 5,390 |
|
| 14,408 |
|
| 8,347 |
|
| 20,332 |
| ||||||||||
Total Blackstone | $ | 37,281 |
| $ | 116,317 |
| $ | 19,633 |
| $ | 63,387 |
| $ | 23,820 |
| $ | 75,584 |
| ||||||||||
Corporate Private Equity also includes Life Sciences and BTAS. Tactical Opportunities also includes Blackstone Growth. |
Blackstone | 6 |
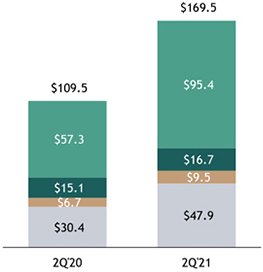
ASSETS UNDER MANAGEMENT
§ | Total AUM increased to $684.0 billion, up 21% year-over-year, with $37.3 billion of inflows in the quarter |
§ | Fee-Earning AUM of $498.9 billion was up 14% year-over-year, with $28.7 billion of inflows in the quarter |
§ | Perpetual Capital AUM reached $169.5 billion, up 55% year-over-year. |
Total AUM
($ in billions)
| Fee-Earning AUM
($ in billions)
| Perpetual Capital AUM
($ in billions)
| ||
 |  |  | ||
| ||||

Blackstone | 7 |
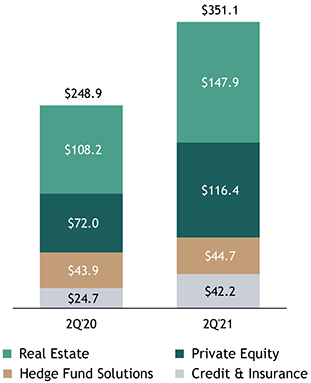
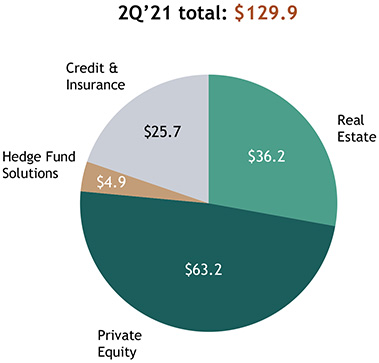
ADDITIONAL CAPITAL DETAIL
§ | Invested Performance Eligible AUM reached $351.1 billion at quarter end, up 41% year-over-year. |
§ | Undrawn capital (“Total Dry Powder”) available for investment of $129.9 billion. |
| Invested Performance Eligible AUM | Total Dry Powder | |||||
($ in billions) | ($ in billions) | |||||
 |  | |||||
| Invested Performance Eligible AUM represents the fair value of invested assets that are eligible to earn performance revenues. |
Blackstone | 8 | |||
Segment Highlights
Blackstone | 9 |
REAL ESTATE
§ | Total AUM: Increased 24% to $207.5 billion with inflows of $8.9 billion in the quarter and $33.3 billion over the LTM. |
| – | Inflows during the quarter driven by Core+, including a record $5.8 billion in BREIT and $1.7 billion across BPP. |
| – | Strong momentum for BREIT with July 1 subscriptions of $2.6 billion not yet included in Total AUM. |
§ | Realizations: $5.3 billion in the quarter and $18.7 billion over the LTM. |
| – | Realizations in the quarter included the sale of Milestone, a 14.6 million square-foot Australian logistics platform, which is the largest ever private real estate transaction in Australia. |
§ | Capital Deployed: $4.8 billion in the quarter and $24.8 billion over the LTM; deployment in the quarter included the privatization of Extended Stay America, the largest owner of economy extended stay hotels in the U.S. |
| – | Committed an additional $11.0 billion in the quarter; commitments included the acquisition of one of the largest private owners of single-family rental homes and a U.S. data center REIT. |
§ | Appreciation: Opportunistic funds and Core+ funds appreciated 9.4% and 5.7% for the quarter, and 25.4% and 18.0% over the LTM, respectively. |
% Change | % Change | |||||||||||||||||||||||
($ in thousands) | 2Q’20 | 2Q’21 | vs. 2Q’20 | 2Q’20 YTD | 2Q’21 YTD | vs. 2Q’20 YTD | ||||||||||||||||||
Management Fees, Net | $ | 412,307 | $ | 491,251 | 19% | $ | 798,428 | $ | 942,833 | 18% | ||||||||||||||
Fee Related Performance Revenues |
| 6,505 |
| 33,776 | 419% |
| 11,056 |
| 189,168 | n/m | ||||||||||||||
Fee Related Compensation |
| (116,640 | ) |
| (121,957 | ) | 5% |
| (236,936 | ) |
| (310,449 | ) | 31% | ||||||||||
Other Operating Expenses |
| (44,525 | ) |
| (54,760 | ) | 23% |
| (85,001 | ) |
| (99,122 | ) | 17% | ||||||||||
Fee Related Earnings | $ | 257,647 | $ | 348,310 | 35% | $ | 487,547 | $ | 722,430 | 48% | ||||||||||||||
| ||||||||||||||||||||||||
Realized Performance Revenues |
| 34,209 |
| 351,053 | 926% |
| 77,929 |
| 439,691 | 464% | ||||||||||||||
Realized Performance Compensation |
| (12,547 | ) |
| (154,928 | ) | n/m |
| (25,939 | ) |
| (177,690 | ) | 585% | ||||||||||
Realized Principal Investment Income |
| 1,573 |
| 28,129 | n/m |
| 8,873 |
| 128,949 | n/m | ||||||||||||||
Net Realizations |
| 23,235 |
| 224,254 | 865% |
| 60,863 |
| 390,950 | 542% | ||||||||||||||
Segment Distributable Earnings | $ | 280,882 | $ | 572,564 | 104% | $ | 548,410 | $ | 1,113,380 | 103% | ||||||||||||||
| ||||||||||||||||||||||||
Segment Revenues | $ | 454,594 | $ | 904,209 | 99% | $ | 896,286 | $ | 1,700,641 | 90% | ||||||||||||||
Total AUM | $ | 166,723,844 | $ | 207,548,236 | 24% | $ | 166,723,844 | $ | 207,548,236 | 24% | ||||||||||||||
Fee-Earning AUM | $ | 134,260,348 | $ | 166,263,493 | 24% | $ | 134,260,348 | $ | 166,263,493 | 24% | ||||||||||||||
Blackstone | 10 |
PRIVATE EQUITY
§ | Total AUM: Increased 21% to $223.6 billion with inflows of $7.3 billion in the quarter and $24.1 billion over the LTM. |
| – | Inflows in the quarter included $2.1 billion for subsequent closes of the second Corporate Private Equity Asia |
§ | Realizations: $8.6 billion in the quarter and $29.0 billion over the LTM; realizations in the quarter included proceeds from Sona Comstar IPO and Custom Truck One Source sale. |
§ | Capital Deployed: $9.5 billion in the quarter and $27.4 billion over the LTM, including Signature Aviation, Huws Gray and Interior Logic Group during the quarter. |
| – | Committed an additional $12.4 billion that was not yet deployed in the quarter, including to investments in |
§ | Appreciation: Corporate Private Equity increased 13.8% in the quarter and 52.2% over the LTM, driven by IPOs of TaskUs and Sona Comstar in Asia as well as broad-based appreciation across industries and sectors. |
| – | Tactical Opportunities increased 7.2% in the quarter and 44.3% over the LTM; Secondaries increased 17.7% in the quarter and 23.3% over the LTM. |
% Change | % Change | |||||||||||||||||||||||
($ in thousands) | 2Q’20 | 2Q’21 | vs. 2Q’20 | 2Q’20 YTD | 2Q’21 YTD | vs. 2Q’20 YTD | ||||||||||||||||||
Management and Advisory Fees, Net | $ | 269,560 | $ | 393,277 | 46% | $ | 535,732 | $ | 799,725 | 49% | ||||||||||||||
Fee Related Compensation |
| (92,825 | ) |
| (136,767 | ) | 47% |
| (203,193 | ) |
| (277,364 | ) | 37% | ||||||||||
Other Operating Expenses |
| (44,827 | ) |
| (61,041 | ) | 36% |
| (85,828 | ) |
| (112,096 | ) | 31% | ||||||||||
Fee Related Earnings | $ | 131,908 | $ | 195,469 | 48% | $ | 246,711 | $ | 410,265 | 66% | ||||||||||||||
| ||||||||||||||||||||||||
Realized Performance Revenues |
| 64,513 |
| 383,010 | 494% |
| 176,589 |
| 638,855 | 262% | ||||||||||||||
Realized Performance Compensation |
| (25,016 | ) |
| (159,375 | ) | 537% |
| (79,659 | ) |
| (270,584 | ) | 240% | ||||||||||
Realized Principal Investment Income |
| 17,416 |
| 27,796 | 60% |
| 27,763 |
| 143,199 | 416% | ||||||||||||||
Net Realizations |
| 56,913 |
| 251,431 | 342% |
| 124,693 |
| 511,470 | 310% | ||||||||||||||
Segment Distributable Earnings | $ | 188,821 | $ | 446,900 | 137% | $ | 371,404 | $ | 921,735 | 148% | ||||||||||||||
| ||||||||||||||||||||||||
Segment Revenues | $ | 351,489 | $ | 804,083 | 129% | $ | 740,084 | $ | 1,581,779 | 114% | ||||||||||||||
Total AUM | $ | 184,118,135 | $ | 223,621,359 | 21% | $ | 184,118,135 | $ | 223,621,359 | 21% | ||||||||||||||
Fee-Earning AUM | $ | 129,284,112 | $ | 132,475,486 | 2% | $ | 129,284,112 | $ | 132,475,486 | 2% | ||||||||||||||
| Secondaries’ appreciation reflects a reporting lag of its underlying funds. |
Blackstone | 11 |
HEDGE FUND SOLUTIONS
§ | Total AUM: $79.1 billion with inflows of $2.2 billion in the quarter and $8.1 billion over the LTM. |
| – | July 1 subscriptions of $655 million are not yet included in Total AUM. |
| – | Subsequent to quarter end, held the first close for Horizon of $1.9 billion. |
§ | Returns: BPS Composite gross return of 3.5% in the quarter (3.2% net), outperforming the HFRX Global Hedge Fund Return Index, which was up 2.4%. |
| – | YTD gross returns of 6.0% (5.5% net), with significantly less volatility than the broader markets, compared to |
% Change | % Change | |||||||||||||||||||||||
($ in thousands) | 2Q’20 | 2Q’21 | vs. 2Q’20 | 2Q’20 YTD | 2Q’21 YTD | vs. 2Q’20 YTD | ||||||||||||||||||
Management Fees, Net | $ | 146,318 | $ | 156,599 | 7% | $ | 286,690 | $ | 311,420 | 9% | ||||||||||||||
Fee Related Compensation |
| (40,353 | ) |
| (38,638 | ) | (4)% |
| (86,544 | ) |
| (77,488 | ) | (10)% | ||||||||||
Other Operating Expenses |
| (17,807 | ) |
| (21,873 | ) | 23% |
| (36,474 | ) |
| (41,045 | ) | 13% | ||||||||||
Fee Related Earnings | $ | 88,158 | $ | 96,088 | 9% | $ | 163,672 | $ | 192,887 | 18% | ||||||||||||||
| ||||||||||||||||||||||||
Realized Performance Revenues |
| 1,482 |
| 17,056 | n/m |
| 3,249 |
| 48,629 | n/m | ||||||||||||||
Realized Performance Compensation |
| 0 |
| (5,626 | ) | n/m |
| (945 | ) |
| (12,534 | ) | n/m | |||||||||||
Realized Principal Investment Income |
| (331 | ) |
| 2,125 | n/m |
| (940 | ) |
| 37,675 | n/m | ||||||||||||
Net Realizations |
| 1,151 |
| 13,555 | n/m |
| 1,364 |
| 73,770 | n/m | ||||||||||||||
Segment Distributable Earnings | $ | 89,309 | $ | 109,643 | 23% | $ | 165,036 | $ | 266,657 | 62% | ||||||||||||||
| ||||||||||||||||||||||||
Segment Revenues | $ | 147,469 | $ | 175,780 | 19% | $ | 288,999 | $ | 397,724 | 38% | ||||||||||||||
Total AUM | $ | 75,668,139 | $ | 79,145,263 | 5% | $ | 75,668,139 | $ | 79,145,263 | 5% | ||||||||||||||
Fee-Earning AUM | $ | 70,200,141 | $ | 72,240,152 | 3% | $ | 70,200,141 | $ | 72,240,152 | 3% | ||||||||||||||
Blackstone | 12 | ||
CREDIT & INSURANCE
§ | Total AUM: Increased 26% to $173.7 billion with inflows of $18.9 billion in the quarter and $50.7 billion over the LTM. |
| – | $2.8 billion of equity capital raised in the quarter for BCRED, a continuously offered non-traded BDC, bringing |
| – | Liquid Credit strategies had inflows of $7.8 billion in the quarter including $3.6 billion across 5 new CLOs (4 U.S. |
§ | Realizations: Record $5.4 billion in the quarter and record $14.4 billion over the LTM; realizations in the quarter included repayments and refinancings in our Mezzanine / Opportunistic and Global Direct Lending funds. |
§ | Capital Deployed: Record $8.3 billion in the quarter driven by U.S. Direct Lending, and record $20.3 billion over the LTM; committed an additional $4.9 billion that was not yet deployed in the quarter. |
§ | Returns: Private Credit gross return of 4.8% (3.8% net) and Liquid Credit gross return of 1.7% (1.6% net) for the quarter. |
% Change | % Change | |||||||||||||||||||||||
($ in thousands) | 2Q’20 | 2Q’21 | vs. 2Q’20 | 2Q’20 YTD | 2Q’21 YTD | vs. 2Q’20 YTD | ||||||||||||||||||
Management Fees, Net | $ | 148,548 | $ | 171,615 | 16% | $ | 296,450 | $ | 336,969 | 14% | ||||||||||||||
Fee Related Performance Revenues |
| 8,528 |
| 15,113 | 77% |
| 16,443 |
| 28,889 | 76% | ||||||||||||||
Fee Related Compensation |
| (57,086 | ) |
| (78,023 | ) | 37% |
| (126,495 | ) |
| (155,194 | ) | 23% | ||||||||||
Other Operating Expenses |
| (36,424 | ) |
| (44,504 | ) | 22% |
| (75,165 | ) |
| (91,339 | ) | 22% | ||||||||||
Fee Related Earnings | $ | 63,566 | $ | 64,201 | 1% | $ | 111,233 | $ | 119,325 | 7% | ||||||||||||||
| ||||||||||||||||||||||||
Realized Performance Revenues |
| 1,973 |
| 41,819 | n/m |
| 11,643 |
| 67,086 | 476% | ||||||||||||||
Realized Performance Compensation |
| (224 | ) |
| (18,342 | ) | n/m |
| (2,546 | ) |
| (28,387 | ) | n/m | ||||||||||
Realized Principal Investment Income |
| 280 |
| 5,082 | n/m |
| 3,532 |
| 51,465 | n/m | ||||||||||||||
Net Realizations |
| 2,029 |
| 28,559 | n/m |
| 12,629 |
| 90,164 | 614% | ||||||||||||||
Segment Distributable Earnings | $ | 65,595 | $ | 92,760 | 41% | $ | 123,862 | $ | 209,489 | 69% | ||||||||||||||
| ||||||||||||||||||||||||
Segment Revenues | $ | 159,329 | $ | 233,629 | 47% | $ | 328,068 | $ | 484,409 | 48% | ||||||||||||||
Total AUM | $ | 137,819,970 | $ | 173,713,854 | 26% | $ | 137,819,970 | $ | 173,713,854 | 26% | ||||||||||||||
Fee-Earning AUM | $ | 102,081,334 | $ | 127,953,395 | 25% | $ | 102,081,334 | $ | 127,953,395 | 25% | ||||||||||||||
|
Blackstone | 13 | |
Supplemental Details
|
Blackstone | 14 |
| ||
TOTAL SEGMENTS
($ in thousands) | 2Q’20 | 3Q’20 | 4Q’20 | 1Q’21 | 2Q’21 | 2Q’20 YTD | 2Q’21 YTD | |||||||||||||||||||||
Base Management Fees | $ | 941,794 |
| $ | 1,043,770 |
| $ | 1,076,094 |
| $ | 1,117,290 |
| $ | 1,140,051 |
| $ | 1,852,190 |
| $ | 2,257,341 |
| |||||||
Transaction, Advisory and Other Fees, Net |
| 48,292 |
|
| 33,628 |
|
| 75,290 |
|
| 78,640 |
|
| 78,125 |
|
| 98,957 |
|
| 156,765 |
| |||||||
Management Fee Offsets |
| (13,353 | ) |
| (19,558 | ) |
| (15,359 | ) |
| (17,725 | ) |
| (5,434 | ) |
| (33,847 | ) |
| (23,159 | ) | |||||||
Total Management and Advisory Fees, Net |
| 976,733 |
|
| 1,057,840 |
|
| 1,136,025 |
|
| 1,178,205 |
|
| 1,212,742 |
|
| 1,917,300 |
|
| 2,390,947 |
| |||||||
Fee Related Performance Revenues |
| 15,033 |
|
| 64,950 |
|
| 286,227 |
|
| 169,168 |
|
| 48,889 |
|
| 27,499 |
|
| 218,057 |
| |||||||
Fee Related Compensation |
| (306,904 | ) |
| (360,633 | ) |
| (482,769 | ) |
| (445,110 | ) |
| (375,385 | ) |
| (653,168 | ) |
| (820,495 | ) | |||||||
Other Operating Expenses |
| (143,583 | ) |
| (151,213 | ) |
| (189,536 | ) |
| (161,424 | ) |
| (182,178 | ) |
| (282,468 | ) |
| (343,602 | ) | |||||||
Fee Related Earnings | $ | 541,279 |
| $ | 610,944 |
| $ | 749,947 |
| $ | 740,839 |
| $ | 704,068 |
| $ | 1,009,163 |
| $ | 1,444,907 |
| |||||||
Realized Performance Revenues |
| 102,177 |
|
| 319,954 |
|
| 1,276,629 |
|
| 401,323 |
|
| 792,938 |
|
| 269,410 |
|
| 1,194,261 |
| |||||||
Realized Performance Compensation |
| (37,787 | ) |
| (121,730 | ) |
| (483,528 | ) |
| (150,924 | ) |
| (338,271 | ) |
| (109,089 | ) |
| (489,195 | ) | |||||||
Realized Principal Investment Income |
| 18,938 |
|
| 15,884 |
|
| 103,821 |
|
| 298,156 |
|
| 63,132 |
|
| 39,228 |
|
| 361,288 |
| |||||||
Total Net Realizations |
| 83,328 |
|
| 214,108 |
|
| 896,922 |
|
| 548,555 |
|
| 517,799 |
|
| 199,549 |
|
| 1,066,354 |
| |||||||
Total Segment Distributable Earnings | $ | 624,607 |
| $ | 825,052 |
| $ | 1,646,869 |
| $ | 1,289,394 |
| $ | 1,221,867 |
| $ | 1,208,712 |
| $ | 2,511,261 |
| |||||||
Net Interest Income (Loss) |
| (12,634 | ) |
| (12,731 | ) |
| (5,604 | ) |
| (12,928 | ) |
| (11,201 | ) |
| (16,575 | ) |
| (24,129 | ) | |||||||
Taxes and Related Payables |
| (63,990 | ) |
| (40,225 | ) |
| (176,859 | ) |
| (84,222 | ) |
| (140,673 | ) |
| (87,043 | ) |
| (224,895 | ) | |||||||
Distributable Earnings | $ | 547,983 |
| $ | 772,096 |
| $ | 1,464,406 |
| $ | 1,192,244 |
| $ | 1,069,993 |
| $ | 1,105,094 |
| $ | 2,262,237 |
| |||||||
Additional Metrics: | ||||||||||||||||||||||||||||
Total Segment Revenues | $ | 1,112,881 |
| $ | 1,458,628 |
| $ | 2,802,702 |
| $ | 2,046,852 |
| $ | 2,117,701 |
| $ | 2,253,437 |
| $ | 4,164,553 |
| |||||||
Total Assets Under Management | $ | 564,330,088 |
| $ | 584,376,213 |
| $ | 618,556,928 |
| $ | 648,803,007 |
| $ | 684,028,712 |
| $ | 564,330,088 |
| $ | 684,028,712 |
| |||||||
Fee-Earning Assets Under Management | $ | 435,825,935 |
| $ | 444,511,078 |
| $ | 469,433,114 |
| $ | 481,225,407 |
| $ | 498,932,526 |
| $ | 435,825,935 |
| $ | 498,932,526 |
| |||||||
Blackstone | 15 | ||
ASSETS UNDER MANAGEMENT - ROLLFORWARD
Total AUM Rollforward
($ in millions)
| Three Months Ended June 30, 2021 | Twelve Months Ended June 30, 2021 | |||||||||||||||||||||||||||||||||||||||||||
Real Estate | Private Equity | Hedge Fund Solutions | Credit & Insurance | Total | Real Estate | Private Equity | Hedge Fund Solutions | Credit & Insurance | Total | |||||||||||||||||||||||||||||||||||
Beginning Balance | $ | 196,277 |
| $ | 211,801 |
| $ | 81,819 |
| $ | 158,906 |
| $ | 648,803 |
| $ | 166,724 |
| $ | 184,118 |
| $ | 75,668 |
| $ | 137,820 |
| $ | 564,330 |
| ||||||||||||||
Inflows |
| 8,880 |
|
| 7,335 |
|
| 2,197 |
|
| 18,870 |
|
| 37,281 |
|
| 33,350 |
|
| 24,126 |
|
| 8,109 |
|
| 50,733 |
|
| 116,317 |
| ||||||||||||||
Outflows |
| (579) |
|
| (1,078) |
|
| (7,299) |
|
| (2,717) |
|
| (11,672) |
|
| (4,718) |
|
| (3,469) |
|
| (14,776) |
|
| (12,701) |
|
| (35,663) |
| ||||||||||||||
Net Flows |
| 8,301 |
|
| 6,257 |
|
| (5,102) |
|
| 16,153 |
|
| 25,609 |
|
| 28,632 |
|
| 20,656 |
|
| (6,667) |
|
| 38,032 |
|
| 80,654 |
| ||||||||||||||
Realizations |
| (5,306) |
|
| (8,633) |
|
| (304) |
|
| (5,390) |
|
| (19,633) |
|
| (18,733) |
|
| (29,010) |
|
| (1,235) |
|
| (14,408) |
|
| (63,387) |
| ||||||||||||||
Market Activity |
| 8,277 |
|
| 14,196 |
|
| 2,731 |
|
| 4,045 |
|
| 29,250 |
|
| 30,925 |
|
| 47,857 |
|
| 11,379 |
|
| 12,270 |
|
| 102,431 |
| ||||||||||||||
Ending Balance | $ | 207,548 |
| $ | 223,621 |
| $ | 79,145 |
| $ | 173,714 |
| $ | 684,029 |
| $ | 207,548 |
| $ | 223,621 |
| $ | 79,145 |
| $ | 173,714 |
| $ | 684,029 |
| ||||||||||||||
% Change |
| 6% |
|
| 6% |
|
| (3)% |
|
| 9% |
|
| 5% |
|
| 24% |
|
| 21% |
|
| 5% |
|
| 26% |
|
| 21% |
| ||||||||||||||
Fee-Earning AUM Rollforward
($ in millions)
| Three Months Ended June 30, 2021 | Twelve Months Ended June 30, 2021 | |||||||||||||||||||||||||||||||||||||||||||
Real Estate | Private Equity | Hedge Fund Solutions | Credit & Insurance | Total | Real Estate | Private Equity | Hedge Fund Solutions | Credit & Insurance | Total | |||||||||||||||||||||||||||||||||||
Beginning Balance | $ | 155,852 |
| $ | 131,903 |
| $ | 76,614 |
| $ | 116,856 |
| $ | 481,225 |
| $ | 134,260 |
| $ | 129,284 |
| $ | 70,200 |
| $ | 102,081 |
| $ | 435,826 |
| ||||||||||||||
Inflows |
| 9,834 |
|
| 2,320 |
|
| 1,795 |
|
| 14,734 |
|
| 28,684 |
|
| 33,466 |
|
| 12,842 |
|
| 7,666 |
|
| 40,768 |
|
| 94,742 |
| ||||||||||||||
Outflows |
| (582) |
|
| (458) |
|
| (8,277) |
|
| (2,502) |
|
| (11,819) |
|
| (3,202) |
|
| (1,464) |
|
| (14,962) |
|
| (12,214) |
|
| (31,841) |
| ||||||||||||||
Net Flows |
| 9,253 |
|
| 1,863 |
|
| (6,482) |
|
| 12,232 |
|
| 16,865 |
|
| 30,264 |
|
| 11,378 |
|
| (7,296) |
|
| 28,554 |
|
| 62,900 |
| ||||||||||||||
Realizations |
| (3,070) |
|
| (3,304) |
|
| (295) |
|
| (4,030) |
|
| (10,698) |
|
| (10,237) |
|
| (11,623) |
|
| (1,182) |
|
| (10,275) |
|
| (33,316) |
| ||||||||||||||
Market Activity |
| 4,229 |
|
| 2,013 |
|
| 2,403 |
|
| 2,895 |
|
| 11,540 |
|
| 11,976 |
|
| 3,436 |
|
| 10,518 |
|
| 7,593 |
|
| 33,523 |
| ||||||||||||||
Ending Balance | $ | 166,263 |
| $ | 132,475 |
| $ | 72,240 |
| $ | 127,953 |
| $ | 498,933 |
| $ | 166,263 |
| $ | 132,475 |
| $ | 72,240 |
| $ | 127,953 |
| $ | 498,933 |
| ||||||||||||||
% Change |
| 7% |
|
| 0% |
|
| (6)% |
|
| 9% |
|
| 4% |
|
| 24% |
|
| 2% |
|
| 3% |
|
| 25% |
|
| 14% |
| ||||||||||||||
Inflows include contributions, capital raised, other increases in available capital (recallable capital and increased side-by-side commitments), purchases, inter-segment |
Blackstone | 16 |
DECONSOLIDATED BALANCE SHEET HIGHLIGHTS
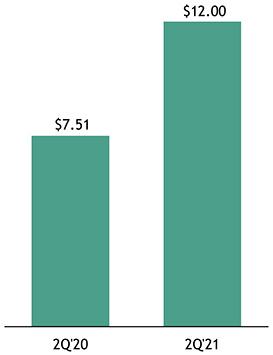
§ | At June 30, 2021, Blackstone had $5.1 billion in total cash, cash equivalents, and corporate treasury investments and $14.5 billion of cash and net investments, or $12.00 per share. |
§ | Blackstone has a $2.3 billion undrawn credit revolver and maintains A+/A+ ratings. |
($ in millions) | 2Q’21 | |||
Cash and Cash Equivalents | $ | 2,467 | ||
Corporate Treasury | 2,616 | |||
GP/Fund Investments | 2,646 | |||
Net Accrued Performance | 6,761 | |||
Cash and Net Investments | $ | 14,490 | ||
Outstanding Bonds (at par) | 5,679 | |||
Cash and Net Investments
(per share)
A+ / A+
rated by S&P and Fitch
$2.3B
undrawn credit revolver
with November 2025 maturity
$5.1B
total cash
and corporate treasury
| Balance Sheet Highlights exclude the consolidated Blackstone Funds. GP/Fund Investments include Blackstone investments in Real Estate, Private Equity, Hedge Fund Solutions, and Credit & Insurance, which were $1.1 billion, $999 million, $251 million, and $307 million, respectively, as of June 30, 2021. Cash and Net Investments per share amounts are calculated using period end DE Shares Outstanding (see page 23, Share Summary). |
Blackstone | 17 | |
NET ACCRUED PERFORMANCE REVENUES – ADDITIONAL DETAIL
($ in millions, except per share data) | 2Q’20 | 1Q’21 | 2Q’21 | 2Q’21 | ||||||||||||
| Per Share | ||||||||||||||||
Real Estate | ||||||||||||||||
BREP IV | $ | 7 |
| $ | 18 |
| $ | 19 |
| $ | 0.02 |
| ||||
BREP V |
| 1 |
|
| 18 |
|
| 26 |
|
| 0.02 |
| ||||
BREP VI |
| 45 |
|
| 39 |
|
| 42 |
|
| 0.03 |
| ||||
BREP VII |
| 238 |
|
| 253 |
|
| 300 |
|
| 0.25 |
| ||||
BREP VIII |
| 604 |
|
| 519 |
|
| 626 |
|
| 0.52 |
| ||||
BREP IX |
| 6 |
|
| 198 |
|
| 359 |
|
| 0.30 |
| ||||
BREP Europe IV |
| 105 |
|
| 92 |
|
| 89 |
|
| 0.07 |
| ||||
BREP Europe V |
| 99 |
|
| 244 |
|
| 312 |
|
| 0.26 |
| ||||
BREP Europe VI |
| - |
|
| - |
|
| 60 |
|
| 0.05 |
| ||||
BREP Asia I |
| 85 |
|
| 179 |
|
| 107 |
|
| 0.09 |
| ||||
BREP Asia II |
| - |
|
| 78 |
|
| 98 |
|
| 0.08 |
| ||||
BPP |
| 225 |
|
| 189 |
|
| 265 |
|
| 0.22 |
| ||||
BREIT |
| - |
|
| 82 |
|
| 247 |
|
| 0.20 |
| ||||
BREDS |
| 3 |
|
| 31 |
|
| 32 |
|
| 0.03 |
| ||||
BTAS |
| 22 |
|
| 1 |
|
| 6 |
|
| 0.01 |
| ||||
Real Estate | $ | 1,441 |
| $ | 1,941 |
| $ | 2,591 |
| $ | 2.15 |
| ||||
Private Equity | ||||||||||||||||
BCP IV |
| 19 |
|
| 9 |
|
| 9 |
|
| 0.01 |
| ||||
BCP V |
| - |
|
| 37 |
|
| 39 |
|
| 0.03 |
| ||||
BCP VI |
| 521 |
|
| 746 |
|
| 740 |
|
| 0.61 |
| ||||
BCP VII |
| 307 |
|
| 987 |
|
| 1,351 |
|
| 1.12 |
| ||||
BCP VIII |
| - |
|
| 41 |
|
| 89 |
|
| 0.07 |
| ||||
BCP Asia I |
| 18 |
|
| 105 |
|
| 213 |
|
| 0.18 |
| ||||
BEP I |
| 63 |
|
| 52 |
|
| 28 |
|
| 0.02 |
| ||||
BEP III |
| 3 |
|
| 34 |
|
| 47 |
|
| 0.04 |
| ||||
BCEP I |
| 43 |
|
| 147 |
|
| 170 |
|
| 0.14 |
| ||||
Tactical Opportunities |
| 55 |
|
| 359 |
|
| 432 |
|
| 0.36 |
| ||||
Secondaries |
| 155 |
|
| 157 |
|
| 262 |
|
| 0.22 |
| ||||
Infrastructure |
| - |
|
| 43 |
|
| 81 |
|
| 0.07 |
| ||||
Life Sciences |
| 8 |
|
| 19 |
|
| 23 |
|
| 0.02 |
| ||||
BTAS/Other |
| 7 |
|
| 93 |
|
| 151 |
|
| 0.13 |
| ||||
Private Equity | $ | 1,199 |
| $ | 2,831 |
| $ | 3,637 |
| $ | 3.01 |
| ||||
Hedge Fund Solutions | $ | 26 |
| $ | 214 |
| $ | 300 |
| $ | 0.25 |
| ||||
Credit & Insurance | $ | 42 |
| $ | 216 |
| $ | 233 |
| $ | 0.19 |
| ||||
Net Accrued Performance Revenues | $ | 2,708 |
| $ | 5,202 |
| $ | 6,761 |
| $ | 5.60 |
| ||||
2Q’21 QoQ Rollforward
($ in millions)
Net | Net | |||||||||||||||
| Performance | Realized | |||||||||||||||
| 1Q’21 | Revenues | Distributions | 2Q’21 | |||||||||||||
Real Estate | $ | 1,941 | $ | 865 | $ | (215 | ) | $ | 2,591 | |||||||
Private Equity | 2,831 | 1,032 | (226 | ) | 3,637 | |||||||||||
HFS | 214 | 98 | (12 | ) | 300 | |||||||||||
Credit & Insurance | 216 | 49 | (32 | ) | 233 | |||||||||||
Total | $ | 5,202 | $ | 2,044 | $ | (485 | ) | $ | 6,761 | |||||||
QoQ Change | 30% | |||||||||||||||
2Q’21 LTM Rollforward
($ in millions)
Net | Net | |||||||||||||||
| Performance | Realized | |||||||||||||||
| 2Q’20 | Revenues | Distributions | 2Q’21 | |||||||||||||
Real Estate | $ | 1,441 | $ | 2,128 | $ | (978 | ) | $ | 2,591 | |||||||
Private Equity | 1,199 | 3,226 | (788 | ) | 3,637 | |||||||||||
HFS | 26 | 458 | (184 | ) | 300 | |||||||||||
Credit & Insurance | 42 | 268 | (77 | ) | 233 | |||||||||||
Total | $ | 2,708 | $ | 6,080 | $ | (2,027 | ) | $ | 6,761 | |||||||
YoY Change | 150% | �� | ||||||||||||||
| Net Accrued Performance Revenues (“NAPR”) are presented net of performance compensation and excludes Performance Revenues realized but not yet distributed as of the reporting date and clawback amounts, if any, which are disclosed in the 10-K/Q. Real Estate and Private Equity include co-investments, as applicable. Tactical Opportunities includes Blackstone Growth. Per Share calculations are based on end of period DE Shares Outstanding (see page 23, Share Summary). |
Blackstone | 18 |
INVESTMENT RECORDS AS OF JUNE 30, 2021(a)
($/€ in thousands, except where noted) | Committed | Available | Unrealized Investments | Realized Investments | Total Investments | Net IRRs (d) | ||||||||||||||||||||||||
Fund (Investment Period Beginning Date / Ending Date) | Capital | Capital (b) | Value | MOIC (c) | Value | MOIC (c) | Value | MOIC (c) | Realized | Total | ||||||||||||||||||||
Real Estate | ||||||||||||||||||||||||||||||
Pre-BREP | $ | 140,714 |
| $ | - |
| $ | - |
| n/a | $ | 345,190 |
| 2.5x | $ | 345,190 |
| 2.5x | 33% | 33% | ||||||||||
BREP I (Sep 1994 / Oct 1996) |
| 380,708 |
|
| - |
|
| - |
| n/a |
| 1,327,708 |
| 2.8x |
| 1,327,708 |
| 2.8x | 40% | 40% | ||||||||||
BREP II (Oct 1996 / Mar 1999) |
| 1,198,339 |
|
| - |
|
| - |
| n/a |
| 2,531,614 |
| 2.1x |
| 2,531,614 |
| 2.1x | 19% | 19% | ||||||||||
BREP III (Apr 1999 / Apr 2003) |
| 1,522,708 |
|
| - |
|
| - |
| n/a |
| 3,330,406 |
| 2.4x |
| 3,330,406 |
| 2.4x | 21% | 21% | ||||||||||
BREP IV (Apr 2003 / Dec 2005) |
| 2,198,694 |
|
| - |
|
| 67,097 |
| 1.3x |
| 4,579,740 |
| 1.7x |
| 4,646,837 |
| 1.7x | 13% | 12% | ||||||||||
BREP V (Dec 2005 / Feb 2007) |
| 5,539,418 |
|
| 231,857 |
|
| 255,300 |
| 1.1x |
| 13,090,349 |
| 2.4x |
| 13,345,649 |
| 2.3x | 12% | 11% | ||||||||||
BREP VI (Feb 2007 / Aug 2011) |
| 11,060,444 |
|
| 550,596 |
|
| 493,096 |
| 2.3x |
| 27,272,291 |
| 2.5x |
| 27,765,387 |
| 2.5x | 13% | 13% | ||||||||||
BREP VII (Aug 2011 / Apr 2015) |
| 13,496,823 |
|
| 1,525,932 |
|
| 5,918,553 |
| 1.3x |
| 23,280,621 |
| 2.1x |
| 29,199,174 |
| 1.9x | 22% | 14% | ||||||||||
BREP VIII (Apr 2015 / Jun 2019) |
| 16,576,617 |
|
| 2,571,042 |
|
| 14,572,997 |
| 1.3x |
| 14,848,690 |
| 2.4x |
| 29,421,687 |
| 1.7x | 29% | 15% | ||||||||||
*BREP IX (Jun 2019 / Dec 2024) |
| 21,007,890 |
|
| 11,839,168 |
|
| 12,675,878 |
| 1.4x |
| 1,585,131 |
| 1.7x |
| 14,261,009 |
| 1.4x | n/m | 29% | ||||||||||
Total Global BREP | $ | 73,122,355 |
| $ | 16,718,595 |
| $ | 33,982,921 |
| 1.4x | $ | 92,191,740 |
| 2.3x | $ | 126,174,661 |
| 1.9x | 18% | 16% | ||||||||||
BREP Int’l (Jan 2001 / Sep 2005) | € | 824,172 |
| € | - |
| € | - |
| n/a | € | 1,373,170 |
| 2.1x | € | 1,373,170 |
| 2.1x | 23% | 23% | ||||||||||
BREP Int’l II (Sep 2005 / Jun 2008) (e) |
| 1,629,748 |
|
| - |
|
| - |
| n/a |
| 2,576,670 |
| 1.8x |
| 2,576,670 |
| 1.8x | 8% | 8% | ||||||||||
BREP Europe III (Jun 2008 / Sep 2013) |
| 3,205,167 |
|
| 460,260 |
|
| 339,108 |
| 0.5x |
| 5,738,120 |
| 2.5x |
| 6,077,228 |
| 2.1x | 20% | 14% | ||||||||||
BREP Europe IV (Sep 2013 / Dec 2016) |
| 6,675,950 |
|
| 1,328,875 |
|
| 2,226,614 |
| 1.4x |
| 9,238,374 |
| 1.9x |
| 11,464,988 |
| 1.8x | 20% | 14% | ||||||||||
BREP Europe V (Dec 2016 / Oct 2019) |
| 7,937,730 |
|
| 1,579,708 |
|
| 8,147,321 |
| 1.4x |
| 1,530,272 |
| 2.5x |
| 9,677,593 |
| 1.5x | 41% | 11% | ||||||||||
*BREP Europe VI (Oct 2019 / Apr 2025) |
| 9,835,049 |
|
| 6,410,782 |
|
| 3,935,114 |
| 1.2x |
| 9,200 |
| n/a |
| 3,944,314 |
| 1.2x | n/m | 13% | ||||||||||
Total BREP Europe | € | 30,107,816 |
| € | 9,779,625 |
| € | 14,648,157 |
| 1.3x | € | 20,465,806 |
| 2.1x | € | 35,113,963 |
| 1.7x | 16% | 12% | ||||||||||
BREP Asia I (Jun 2013 / Dec 2017) | $ | 4,261,983 |
| $ | 916,901 |
| $ | 2,505,476 |
| 1.4x | $ | 5,788,923 |
| 2.1x | $ | 8,294,399 |
| 1.8x | 21% | 13% | ||||||||||
*BREP Asia II (Dec 2017 / Jun 2023) |
| 7,349,172 |
|
| 3,091,837 |
|
| 5,381,616 |
| 1.3x |
| 491,184 |
| 1.7x |
| 5,872,800 |
| 1.3x | 55% | 11% | ||||||||||
BREP Co-Investment (f) |
| 7,055,974 |
|
| 32,158 |
|
| 670,425 |
| 1.6x |
| 14,812,488 |
| 2.2x |
| 15,482,913 |
| 2.2x | 16% | 16% | ||||||||||
Total BREP | $ | 127,579,181 |
| $ | 32,356,170 |
| $ | 59,378,266 |
| 1.3x | $ | 138,957,222 |
| 2.2x | $ | 198,335,488 |
| 1.9x | 17% | 15% | ||||||||||
*Core+ BPP (Various) (g) |
| n/a |
|
| n/a |
|
| 48,143,297 |
| n/a |
| 8,480,471 |
| n/a |
| 56,623,768 |
| n/a | n/a | 9% | ||||||||||
*Core+ BREIT (Various) (h) |
| n/a |
|
| n/a |
|
| 31,518,967 |
| n/a |
| 1,008,038 |
| n/a |
| 32,527,005 |
| n/a | n/a | 11% | ||||||||||
*BREDS High-Yield (Various) (i) |
| 19,991,125 |
|
| 7,767,589 |
|
| 5,179,211 |
| 1.1x |
| 13,732,462 |
| 1.3x |
| 18,911,673 |
| 1.2x | 11% | 10% | ||||||||||
Private Equity | ||||||||||||||||||||||||||||||
Corporate Private Equity | ||||||||||||||||||||||||||||||
BCP I (Oct 1987 / Oct 1993) | $ | 859,081 |
| $ | - |
| $ | - |
| n/a | $ | 1,741,738 |
| 2.6x | $ | 1,741,738 |
| 2.6x | 19% | 19% | ||||||||||
BCP II (Oct 1993 / Aug 1997) |
| 1,361,100 |
|
| - |
|
| - |
| n/a |
| 3,256,819 |
| 2.5x |
| 3,256,819 |
| 2.5x | 32% | 32% | ||||||||||
BCP III (Aug 1997 / Nov 2002) |
| 3,967,422 |
|
| - |
|
| - |
| n/a |
| 9,184,688 |
| 2.3x |
| 9,184,688 |
| 2.3x | 14% | 14% | ||||||||||
BCOM (Jun 2000 / Jun 2006) |
| 2,137,330 |
|
| 24,575 |
|
| 16,589 |
| n/a |
| 2,953,649 |
| 1.4x |
| 2,970,238 |
| 1.4x | 6% | 6% | ||||||||||
BCP IV (Nov 2002 / Dec 2005) |
| 6,773,182 |
|
| 179,524 |
|
| 118,662 |
| 1.3x |
| 21,478,010 |
| 2.9x |
| 21,596,672 |
| 2.8x | 36% | 36% | ||||||||||
BCP V (Dec 2005 / Jan 2011) |
| 21,009,112 |
|
| 1,035,259 |
|
| 553,720 |
| 37.5x |
| 37,876,327 |
| 1.9x |
| 38,430,047 |
| 1.9x | 8% | 8% | ||||||||||
BCP VI (Jan 2011 / May 2016) |
| 15,202,246 |
|
| 1,164,816 |
|
| 11,003,889 |
| 2.0x |
| 20,142,109 |
| 2.1x |
| 31,145,998 |
| 2.1x | 17% | 13% | ||||||||||
BCP VII (May 2016 / Feb 2020) |
| 18,846,349 |
|
| 1,622,124 |
|
| 27,335,958 |
| 1.8x |
| 5,130,267 |
| 1.9x |
| 32,466,225 |
| 1.8x | 29% | 21% | ||||||||||
*BCP VIII (Feb 2020 / Feb 2026) |
| 24,884,732 |
|
| 21,948,631 |
|
| 4,226,476 |
| 1.5x |
| - |
| n/a |
| 4,226,476 |
| 1.5x | n/a | n/m | ||||||||||
Energy I (Aug 2011 / Feb 2015) |
| 2,441,558 |
|
| 142,138 |
|
| 728,983 |
| 1.4x |
| 3,618,876 |
| 1.9x |
| 4,347,859 |
| 1.8x | 14% | 11% | ||||||||||
Energy II (Feb 2015 / Feb 2020) |
| 4,914,647 |
|
| 833,132 |
|
| 4,214,573 |
| 1.3x |
| 1,197,747 |
| 0.9x |
| 5,412,320 |
| 1.2x | (8)% | 2% | ||||||||||
*Energy III (Feb 2020 / Feb 2026) |
| 4,257,011 |
|
| 3,679,798 |
|
| 1,091,715 |
| 2.1x |
| 238,516 |
| 2.0x |
| 1,330,231 |
| 2.0x | 94% | 95% | ||||||||||
*BCP Asia I (Dec 2017 / Dec 2023) |
| 2,414,503 |
|
| 1,370,026 |
|
| 3,079,369 |
| 3.1x |
| 603,472 |
| 4.8x |
| 3,682,841 |
| 3.3x | 97% | 65% | ||||||||||
BCP Asia II (TBD) |
| 5,243,475 |
|
| 5,243,475 |
|
| - |
| n/a |
| - |
| n/a |
| - |
| n/a | n/a | n/a | ||||||||||
Core Private Equity I (Jan 2017 / Mar 2021) (j) |
| 4,756,020 |
|
| 1,076,792 |
|
| 7,024,913 |
| 1.8x |
| 1,284,639 |
| 2.3x |
| 8,309,552 |
| 1.9x | 31% | 25% | ||||||||||
*Core Private Equity II (Mar 2021 / Mar 2026) (j) |
| 8,165,403 |
|
| 8,156,099 |
|
| (4,266 | ) | n/a |
| - |
| n/a |
| (4,266 | ) | n/a | n/a | n/a | ||||||||||
Total Corporate Private Equity | $ | 127,233,171 |
| $ | 46,476,389 |
| $ | 59,390,581 |
| 1.8x | $ | 108,706,857 |
| 2.1x | $ | 168,097,438 |
| 2.0x | 16% | 15% | ||||||||||
| Notes on page 21. BREP – Blackstone Real Estate Partners, BREIT – Blackstone Real Estate Income Trust, BPP – Blackstone Property Partners, BREDS – Blackstone Real Estate Debt Strategies, BCP – Blackstone Capital Partners, BCOM – Blackstone Communications. |
Blackstone | 19 | |
| * Represents funds that are currently in their investment period and open ended funds. |
INVESTMENT RECORDS AS OF JUNE 30, 2021(a) – (CONT’D)
($/€ in thousands, except where noted) | Committed | Available | Unrealized Investments | Realized Investments | Total Investments | Net IRRs (d) | ||||||||||||||||||||||||||
Fund (Investment Period Beginning Date / Ending Date) | Capital | Capital (b) | Value | MOIC (c) | Value | MOIC (c) | Value | MOIC (c) | Realized | Total | ||||||||||||||||||||||
Private Equity (continued) | ||||||||||||||||||||||||||||||||
Tactical Opportunities | ||||||||||||||||||||||||||||||||
*Tactical Opportunities (Various) | $ | 22,862,522 |
| $ | 7,088,393 |
| $ | 14,979,562 |
|
| 1.5x |
| $ | 14,307,619 |
| 1.8x | $ | 29,287,181 |
| 1.6x | 17% | 13% | ||||||||||
*Tactical Opportunities Co-Investment and Other (Various) |
| 9,238,885 |
|
| 1,445,766 |
|
| 4,253,052 |
|
| 1.4x |
|
| 6,072,437 |
| 1.6x |
| 10,325,489 |
| 1.5x | 20% | 16% | ||||||||||
Total Tactical Opportunities | $ | 32,101,407 |
| $ | 8,534,159 |
| $ | 19,232,614 |
|
| 1.5x |
| $ | 20,380,056 |
| 1.7x | $ | 39,612,670 |
| 1.6x | 18% | 14% | ||||||||||
*Blackstone Growth (Jul 2020 / Jul 2025) |
| 4,761,851 |
|
| 3,500,609 |
|
| 2,101,698 |
|
| 1.6x |
|
| 220,087 |
| 3.8x |
| 2,321,785 |
| 1.7x | n/m | n/m | ||||||||||
Strategic Partners (Secondaries) | ||||||||||||||||||||||||||||||||
Strategic Partners I-V (Various) (k) |
| 11,863,351 |
|
| 1,047,300 |
|
| 722,607 |
|
| n/m |
|
| 17,234,545 |
| n/m |
| 17,957,152 |
| 1.6x | n/a | 13% | ||||||||||
Strategic Partners VI (Apr 2014 / Apr 2016) (k) |
| 4,362,750 |
|
| 1,316,363 |
|
| 1,278,661 |
|
| n/m |
|
| 3,596,948 |
| n/m |
| 4,875,609 |
| 1.5x | n/a | 15% | ||||||||||
Strategic Partners VII (May 2016 / Mar 2019) (k) |
| 7,489,970 |
|
| 2,049,841 |
|
| 5,268,290 |
|
| n/m |
|
| 3,509,459 |
| n/m |
| 8,777,749 |
| 1.6x | n/a | 20% | ||||||||||
Strategic Partners Real Assets II (May 2017 / Jun 2020) (k) |
| 1,749,807 |
|
| 379,942 |
|
| 1,047,927 |
|
| n/m |
|
| 535,504 |
| n/m |
| 1,583,431 |
| 1.2x | n/a | 12% | ||||||||||
*Strategic Partners VIII (Mar 2019 / Jul 2023) (k) |
| 10,763,600 |
|
| 5,454,255 |
|
| 5,691,944 |
|
| n/m |
|
| 1,991,266 |
| n/m |
| 7,683,210 |
| 1.5x | n/a | 44% | ||||||||||
*Strategic Partners Real Estate, SMA and Other (Various) (k) |
| 7,878,498 |
|
| 2,537,778 |
|
| 2,999,839 |
|
| n/m |
|
| 2,015,737 |
| n/m |
| 5,015,576 |
| 1.3x | n/a | 15% | ||||||||||
*Strategic Partners Infra III (Jun 2020 / Jul 2024) (k) |
| 3,250,100 |
|
| 2,627,042 |
|
| 101,030 |
|
| n/m |
|
| 14,819 |
| n/a |
| 115,849 |
| 1.7x | n/a | n/m | ||||||||||
Total Strategic Partners (Secondaries) | $ | 47,358,076 |
| $ | 15,412,521 |
| $ | 17,110,298 |
|
| n/m |
| $ | 28,898,278 |
| n/m | $ | 46,008,576 |
| 1.5x | n/a | 15% | ||||||||||
*Infrastructure (Various) |
| 13,658,063 |
|
| 9,103,132 |
|
| 6,168,496 |
|
| 1.4x |
|
| - |
| n/a |
| 6,168,496 |
| 1.4x | n/a | 20% | ||||||||||
Life Sciences | ||||||||||||||||||||||||||||||||
Clarus IV (Jan 2018 / Jan 2020) |
| 910,000 |
|
| 275,501 |
|
| 821,098 |
|
| 1.5x |
|
| 34,970 |
| 0.8x |
| 856,068 |
| 1.5x | (27)% | 16% | ||||||||||
*BXLS V (Jan 2020 / Jan 2025) |
| 4,772,543 |
|
| 4,124,567 |
|
| 822,115 |
|
| 1.4x |
|
| - |
| n/a |
| 822,115 |
| 1.4x | n/a | n/m | ||||||||||
Credit | ||||||||||||||||||||||||||||||||
Mezzanine / Opportunistic I (Jul 2007 / Oct 2011) | $ | 2,000,000 |
| $ | 97,114 |
| $ | 20,784 |
|
| 1.1x |
| $ | 4,775,786 |
| 1.6x | $ | 4,796,570 |
| 1.6x | n/a | 17% | ||||||||||
Mezzanine / Opportunistic II (Nov 2011 / Nov 2016) |
| 4,120,000 |
|
| 1,013,932 |
|
| 876,247 |
|
| 0.6x |
|
| 5,787,118 |
| 1.6x |
| 6,663,365 |
| 1.3x | n/a | 10% | ||||||||||
Mezzanine / Opportunistic III (Sep 2016 / Jan 2021) |
| 6,639,133 |
|
| 1,073,044 |
|
| 5,120,278 |
|
| 1.1x |
|
| 3,756,163 |
| 1.7x |
| 8,876,441 |
| 1.3x | n/a | 11% | ||||||||||
*Mezzanine / Opportunistic IV (Jan 2021 / Jan 2026) |
| 3,738,771 |
|
| 3,304,044 |
|
| 444,960 |
|
| 1.0x |
|
| 5,321 |
| n/a |
| 450,281 |
| 1.0x | n/a | n/a | ||||||||||
Stressed / Distressed I (Sep 2009 / May 2013) |
| 3,253,143 |
|
| 76,000 |
|
| - |
|
| n/a |
|
| 5,776,922 |
| 1.3x |
| 5,776,922 |
| 1.3x | n/a | 9% | ||||||||||
Stressed / Distressed II (Jun 2013 / Jun 2018) |
| 5,125,000 |
|
| 547,430 |
|
| 642,546 |
|
| 0.7x |
|
| 4,956,906 |
| 1.2x |
| 5,599,452 |
| 1.1x | n/a | 1% | ||||||||||
*Stressed / Distressed III (Dec 2017 / Dec 2022) |
| 7,356,380 |
|
| 3,665,909 |
|
| 2,142,557 |
|
| 1.0x |
|
| 2,002,481 |
| 1.4x |
| 4,145,038 |
| 1.1x | n/a | 8% | ||||||||||
Energy I (Nov 2015 / Nov 2018) |
| 2,856,867 |
|
| 1,003,583 |
|
| 1,437,797 |
|
| 1.0x |
|
| 1,523,775 |
| 1.6x |
| 2,961,572 |
| 1.3x | n/a | 8% | ||||||||||
*Energy II (Feb 2019 / Feb 2024) |
| 3,616,081 |
|
| 2,639,556 |
|
| 1,109,599 |
|
| 1.1x |
|
| 338,649 |
| 1.7x |
| 1,448,248 |
| 1.2x | n/a | 27% | ||||||||||
European Senior Debt I (Feb 2015 / Feb 2019) | € | 1,964,689 |
| € | 262,076 |
| € | 1,403,591 |
|
| 1.0x |
| € | 1,824,750 |
| 1.4x | € | 3,228,341 |
| 1.2x | n/a | 6% | ||||||||||
*European Senior Debt II (Jun 2019 / Jun 2024) | € | 4,088,344 |
| € | 3,344,258 |
| € | 1,777,997 |
|
| 1.0x |
| € | 581,142 |
| 1.2x | € | 2,359,139 |
| 1.1x | n/a | 19% | ||||||||||
Total Credit Drawdown Funds (l) | $ | 45,611,033 |
| $ | 17,697,364 |
| $ | 15,567,813 |
|
| 1.0x |
| $ | 31,707,914 |
| 1.4x | $ | 47,275,727 |
| 1.3x | n/a | 10% | ||||||||||
*Direct Lending BDC (Various) (m) |
| 3,926,295 |
|
| 356,250 |
|
| 3,741,102 |
|
| n/a |
|
| 379,307 |
| n/a |
| 4,120,409 |
| n/a | n/a | 10% | ||||||||||
| Notes on page 21. BXLS – Blackstone Life Sciences. |
Blackstone | 20 | |
* Represents funds that are currently in their investment period and open ended funds. |
INVESTMENT RECORDS AS OF JUNE 30, 2021 – NOTES
The returns presented herein represent those of the applicable Blackstone Funds and not those of The Blackstone Group Inc.
| n/m | Not meaningful generally due to the limited time since initial investment. |
| n/a | Not applicable. |
| (a) | Excludes investment vehicles where Blackstone does not earn fees. |
| (b) | Available Capital represents total investable capital commitments, including side-by-side, adjusted for certain expenses and expired or recallable capital and may include leverage, less invested capital. This amount is not reduced by outstanding commitments to investments. |
| (c) | Multiple of Invested Capital (“MOIC”) represents carrying value, before management fees, expenses and Performance Revenues, divided by invested |
| (d) | Unless otherwise indicated, Net Internal Rate of Return (“IRR”) represents the annualized inception to June 30, 2021 IRR on total invested capital |
| (e) | The 8% Realized Net IRR and 8% Total Net IRR exclude investors that opted out of the Hilton investment opportunity. Overall BREP International II |
| (f) | BREP Co-Investment represents co-investment capital raised for various BREP investments. The Net IRR reflected is calculated by aggregating each |
| (g) | BPP represents the Core+ real estate funds which invest with a more modest risk profile and lower leverage. Committed Capital and Available Capital |
| (h) | Unrealized Investment Value reflects BREIT’s net asset value as of June 30, 2021. Realized Investment Value represents BREIT’s cash distributions, net |
| (i) | BREDS High-Yield represents the flagship real estate debt drawdown funds only and excludes BREDS High-Grade. |
| (j) | Blackstone Core Equity Partners is a core private equity strategy which invests with a more modest risk profile and longer hold period than traditional |
| (k) | Realizations are treated as return of capital until fully recovered and therefore unrealized and realized MOICs are not meaningful. If information |
| (l) | Funds presented represent the flagship credit drawdown funds only. The Total Credit Net IRR is the combined IRR of the credit drawdown funds |
| (m) | Unrealized Investment Value reflects Blackstone Secured Lending Fund’s (“BXSL”) net asset value as of June 30, 2021. Realized Investment Value |
Blackstone | 21 |
SHAREHOLDER DIVIDENDS
§ | Generated $0.82 of Distributable Earnings per common share during the quarter, bringing the year-to-date amount |
§ | Blackstone declared a quarterly dividend of $0.70 per common share to record holders as of August 2, 2021; payable on August 9, 2021. |
% Change | % Change | |||||||||||||||||||||||||||||||
($ in thousands, except per share data) | 2Q’20 | 3Q’20 | 4Q’20 | 1Q’21 | 2Q’21 | vs. 2Q’20 | 2Q’20 YTD | 2Q’21 YTD | vs. 2Q’20 YTD | |||||||||||||||||||||||
Distributable Earnings | $ | 547,983 |
| $ | 772,096 |
| $ | 1,464,406 |
| $ | 1,192,244 |
| $ | 1,069,993 |
| 95% | $ | 1,105,094 |
| $ | 2,262,237 |
| 105% | |||||||||
Add: Other Payables Attributable to Common Shareholders |
| 45,673 |
|
| 23,461 |
|
| 154,783 |
|
| 61,249 |
|
| 120,336 |
| 163% |
| 54,873 |
|
| 181,585 |
| 231% | |||||||||
DE before Certain Payables |
| 593,656 |
|
| 795,557 |
|
| 1,619,189 |
|
| 1,253,493 |
|
| 1,190,329 |
| 101% |
| 1,159,967 |
|
| 2,443,822 |
| 111% | |||||||||
Percent to Common Shareholders |
| 58 | % |
| 58 | % |
| 59 | % |
| 59 | % |
| 60 | % |
| 58 | % |
| 59 | % | |||||||||||
DE before Certain Payables Attributable to Common Shareholders |
| 344,390 |
|
| 464,233 |
|
| 949,854 |
|
| 741,662 |
|
| 710,081 |
| 106% |
| 670,380 |
|
| 1,451,743 |
| 117% | |||||||||
Less: Other Payables Attributable to Common Shareholders |
| (45,673 | ) |
| (23,461 | ) |
| (154,783 | ) |
| (61,249 | ) |
| (120,336 | ) | 163% |
| (54,873 | ) |
| (181,585 | ) | 231% | |||||||||
DE Attributable to Common Shareholders |
| 298,717 |
|
| 440,772 |
|
| 795,071 |
|
| 680,413 |
|
| 589,745 |
| 97% |
| 615,507 |
|
| 1,270,158 |
| 106% | |||||||||
DE per Common Share | $ | 0.43 |
| $ | 0.63 |
| $ | 1.13 |
| $ | 0.96 |
| $ | 0.82 |
| 91% | $ | 0.89 |
| $ | 1.78 |
| 100% | |||||||||
Less: Retained Capital per Common Share | $ | (0.06 | ) | $ | (0.09 | ) | $ | (0.17 | ) | $ | (0.14 | ) | $ | (0.12 | ) | 100% | $ | (0.13 | ) | $ | (0.26 | ) | 100% | |||||||||
Actual Dividend per Common Share | $ | 0.37 |
| $ | 0.54 |
| $ | 0.96 |
| $ | 0.82 |
| $ | 0.70 |
| 89% | $ | 0.76 |
| $ | 1.52 |
| 100% | |||||||||
Record Date |
| Aug 2, 2021 |
| |||||||||||||||||||||||||||||
Payable Date |
| Aug 9, 2021 |
| |||||||||||||||||||||||||||||
| A detailed description of Blackstone’s dividend policy and the definition of Distributable Earnings can be found on pages 34-36, Definitions and Dividend Policy. See additional notes on page 33. |
Blackstone | 22 | |
SHARE SUMMARY
§ | Distributable Earnings Shares Outstanding as of quarter end of 1.208 billion shares. |
| – | Repurchased 3.2 million common shares in the quarter and 5.2 million common shares over the LTM. |
| – | Available authorization remaining was $758 million at June 30, 2021. |
| 2Q’20 | 3Q’20 | 4Q’20 | 1Q’21 | 2Q’21 | ||||||||||||||||
Participating Common Shares | 697,597,036 | 700,649,135 | 703,959,789 | 711,065,543 | 720,474,539 | |||||||||||||||
Participating Partnership Units | 504,912,855 | 500,054,874 | 496,060,455 | 490,716,529 | 487,276,882 | |||||||||||||||
Distributable Earnings Shares Outstanding | 1,202,509,891 | 1,200,704,009 | 1,200,020,244 | 1,201,782,072 | 1,207,751,421 | |||||||||||||||
| Participating Common Shares and Participating Partnership Units include both issued and outstanding shares and unvested shares that participate in dividends. |
Blackstone | 23 | |
Reconciliations and Disclosures
| Blackstone | 24 |
RECONCILIATION OF GAAP TO NON-GAAP MEASURES
QTD
| YTD
| LTM
| ||||||||||||||||||||||||||||||||||||||||
($ in thousands)
|
2Q’20
| 3Q’20
| 4Q’20
| 1Q’21
| 2Q’21
| 2Q’20
| 2Q’21
| 2Q’20
| 2Q’21
| |||||||||||||||||||||||||||||||||
Net Income (Loss) Attributable to The Blackstone Group Inc. | $ | 568,266 | $ | 794,719 | $ | 748,870 | $ | 1,747,872 | $ | 1,309,152 | $ | (498,226 | ) | $ | 3,057,024 | $ | 764,360 | $ | 4,600,613 | |||||||||||||||||||||||
Net Income (Loss) Attributable to Non-Controlling Interests in Blackstone Holdings | 495,128 | 638,803 | 759,110 | 1,235,784 | 1,116,193 | (384,989 | ) | 2,351,977 | 293,048 | 3,749,890 | ||||||||||||||||||||||||||||||||
Net Income (Loss) Attributable to Non-Controlling Interests in Consolidated Entities | 294,378 | 259,761 | 308,055 | 386,850 | 431,516 | (350,699 | ) | 818,366 | (141,497 | ) | 1,386,182 | |||||||||||||||||||||||||||||||
Net Income (Loss) Attributable to Redeemable Non-Controlling Interests in Consolidated Entities | (3,426 | ) | 6,868 | (1,871 | ) | 629 | 637 | (18,895 | ) | 1,266 | (22,591 | ) | 6,263 | |||||||||||||||||||||||||||||
Net Income (Loss) | $ | 1,354,346 | $ | 1,700,151 | $ | 1,814,164 | $ | 3,371,135 | $ | 2,857,498 | $ | (1,252,809 | ) | $ | 6,228,633 | $ | 893,320 | $ | 9,742,948 | |||||||||||||||||||||||
Provision (Benefit) for Taxes | 147,415 | 100,960 | 266,342 | (447 | ) | 288,250 | (11,288 | ) | 287,803 | (139,131 | ) | 655,105 | ||||||||||||||||||||||||||||||
Income (Loss) Before Provision (Benefit) for Taxes | $ | 1,501,761 | $ | 1,801,111 | $ | 2,080,506 | $ | 3,370,688 | $ | 3,145,748 | $ | (1,264,097 | ) | $ | 6,516,436 | $ | 754,189 | $ | 10,398,053 | |||||||||||||||||||||||
Transaction-Related Charges (a) | 76,160 | 47,283 | 70,292 | 27,888 | 35,533 | 123,154 | 63,421 | 135,322 | 180,996 | |||||||||||||||||||||||||||||||||
Amortization of Intangibles (b) | 16,483 | 16,483 | 16,535 | 17,124 | 17,044 | 32,966 | 34,168 | 65,931 | 67,186 | |||||||||||||||||||||||||||||||||
Impact of Consolidation (c) | (290,952 | ) | (266,629 | ) | (306,184 | ) | (387,479 | ) | (432,153 | ) | 369,594 | (819,632 | ) | 164,088 | (1,392,445 | ) | ||||||||||||||||||||||||||
Unrealized Performance Revenues (d) | (1,067,923 | ) | (1,403,480 | ) | (597,285 | ) | (2,464,497 | ) | (2,697,170 | ) | 2,385,523 | (5,161,667 | ) | 2,080,586 | (7,162,432 | ) | ||||||||||||||||||||||||||
Unrealized Performance Allocations Compensation (e) | 454,813 | 509,474 | 278,575 | 1,049,969 | 1,150,219 | (942,565 | ) | 2,200,188 | (753,813 | ) | 2,988,237 | |||||||||||||||||||||||||||||||
Unrealized Principal Investment (Income) Loss (f) | (223,316 | ) | (177,125 | ) | (114,427 | ) | (423,934 | ) | (104,658 | ) | 393,294 | (528,592 | ) | 363,539 | (820,144 | ) | ||||||||||||||||||||||||||
Other Revenues (g) | 55,606 | 192,623 | 143,615 | (60,273 | ) | (27,870 | ) | (82,545 | ) | (88,143 | ) | (168,953 | ) | 248,095 | ||||||||||||||||||||||||||||
Equity-Based Compensation (h) | 89,341 | 89,862 | 67,092 | 144,272 | 121,422 | 176,813 | 265,694 | 287,126 | 422,648 | |||||||||||||||||||||||||||||||||
Administrative Fee Adjustment (i) | - | 2,719 | 2,546 | 2,708 | 2,551 | - | 5,259 | - | 10,524 | |||||||||||||||||||||||||||||||||
Taxes and Related Payables (j) | (63,990 | ) | (40,225 | ) | (176,859 | ) | (84,222 | ) | (140,673 | ) | (87,043 | ) | (224,895 | ) | (198,962 | ) | (441,979 | ) | ||||||||||||||||||||||||
Distributable Earnings | $ | 547,983 | $ | 772,096 | $ | 1,464,406 | $ | 1,192,244 | $ | 1,069,993 | $ | 1,105,094 | $ | 2,262,237 | $ | 2,729,053 | $ | 4,498,739 | ||||||||||||||||||||||||
Taxes and Related Payables (j) | 63,990 | 40,225 | 176,859 | 84,222 | 140,673 | 87,043 | 224,895 | 198,962 | 441,979 | |||||||||||||||||||||||||||||||||
Net Interest (Income) Loss (k) | 12,634 | 12,731 | 5,604 | 12,928 | 11,201 | 16,575 | 24,129 | 26,838 | 42,464 | |||||||||||||||||||||||||||||||||
Total Segment Distributable Earnings | $ | 624,607 | $ | 825,052 | $ | 1,646,869 | $ | 1,289,394 | $ | 1,221,867 | $ | 1,208,712 | $ | 2,511,261 | $ | 2,954,853 | $ | 4,983,182 | ||||||||||||||||||||||||
Realized Performance Revenues (l) | (102,177 | ) | (319,954 | ) | (1,276,629 | ) | (401,323 | ) | (792,938 | ) | (269,410 | ) | (1,194,261 | ) | (1,341,897 | ) | (2,790,844 | ) | ||||||||||||||||||||||||
Realized Performance Compensation (m) | 37,787 | 121,730 | 483,528 | 150,924 | 338,271 | 109,089 | 489,195 | 502,318 | 1,094,453 | |||||||||||||||||||||||||||||||||
Realized Principal Investment Income (n) | (18,938 | ) | (15,884 | ) | (103,821 | ) | (298,156 | ) | (63,132 | ) | (39,228 | ) | (361,288 | ) | (113,918 | ) | (480,993 | ) | ||||||||||||||||||||||||
Fee Related Earnings | $ | 541,279 | $ | 610,944 | $ | 749,947 | $ | 740,839 | $ | 704,068 | $ | 1,009,163 | $ | 1,444,907 | $ | 2,001,356 | $ | 2,805,798 | ||||||||||||||||||||||||
Adjusted EBITDA Reconciliation | ||||||||||||||||||||||||||||||||||||||||||
Distributable Earnings | $ | 547,983 | $ | 772,096 | $ | 1,464,406 | $ | 1,192,244 | $ | 1,069,993 | $ | 1,105,094 | $ | 2,262,237 | $ | 2,729,053 | $ | 4,498,739 | ||||||||||||||||||||||||
Interest Expense (o) | 38,924 | 39,228 | 45,330 | 44,340 | 44,132 | 80,464 | 88,472 | 190,630 | 173,030 | |||||||||||||||||||||||||||||||||
Taxes and Related Payables (j) | 63,990 | 40,225 | 176,859 | 84,222 | 140,673 | 87,043 | 224,895 | 198,962 | 441,979 | |||||||||||||||||||||||||||||||||
Depreciation and Amortization (p) | 8,110 | 9,568 | 9,946 | 12,293 | 12,581 | 15,622 | 24,874 | 30,183 | 44,388 | |||||||||||||||||||||||||||||||||
Adjusted EBITDA | $ | 659,007 | $ | 861,117 | $ | 1,696,541 | $ | 1,333,099 | $ | 1,267,379 | $ | 1,288,223 | $ | 2,600,478 | $ | 3,148,828 | $ | 5,158,136 | ||||||||||||||||||||||||
Notes on page 26-27. | Blackstone | 25 |
RECONCILIATION OF GAAP TO NON-GAAP MEASURES – NOTES
Note: See pages 34-36, Definitions and Dividend Policy.
| (a) | This adjustment removes Transaction-Related Charges, which are excluded from Blackstone’s segment presentation. Transaction-Related Charges arise |
| (b) | This adjustment removes the amortization of transaction-related intangibles, which are excluded from Blackstone’s segment presentation. This amount includes amortization of intangibles associated with Blackstone’s investment in Pátria, which was historically accounted for under the equity method. As a |
| (c) | This adjustment reverses the effect of consolidating Blackstone Funds, which are excluded from Blackstone’s segment presentation. This adjustment |
| (d) | This adjustment removes Unrealized Performance Revenues on a segment basis. The Segment Adjustment represents the add back of performance |
| QTD | YTD | LTM | ||||||||||||||||||||||||||||||||||||||
($ in thousands) | 2Q’20 | 3Q’20 | 4Q’20 | 1Q’21 | 2Q’21 | 2Q’20 | 2Q’21 | 2Q’20 | 2Q’21 | |||||||||||||||||||||||||||||||
GAAP Unrealized Performance | $ | 1,067,923 | $ | 1,403,480 | $ | 597,285 | $ | 2,464,497 | $ | 2,697,170 | $ | (2,385,158 | ) | $ | 5,161,667 | $ | (2,080,557 | ) | $ | 7,162,432 | ||||||||||||||||||||
Segment Adjustment | - | - | - | - | - | (365 | ) | - | (29 | ) | - | |||||||||||||||||||||||||||||
Unrealized Performance Revenues | $ | 1,067,923 | $ | 1,403,480 | $ | 597,285 | $ | 2,464,497 | $ | 2,697,170 | $ | (2,385,523 | ) | $ | 5,161,667 | $ | (2,080,586 | ) | $ | 7,162,432 | ||||||||||||||||||||
(e) This adjustment removes Unrealized Performance Allocations Compensation. (f) This adjustment removes Unrealized Principal Investment Income (Loss) on a segment basis. The Segment Adjustment represents (1) the add back of
|
| |||||||||||||||||||||||||||||||||||||||
| QTD | YTD | LTM | ||||||||||||||||||||||||||||||||||||||
($ in thousands) | 2Q’20 | 3Q’20 | 4Q’20 | 1Q’21 | 2Q’21 | 2Q’20 | 2Q’21 | 2Q’20 | 2Q’21 | |||||||||||||||||||||||||||||||
GAAP Unrealized Principal | $ | 331,762 | $ | 295,308 | $ | 217,688 | $ | 639,315 | $ | 328,835 | $ | (627,603 | ) | $ | 968,150 | $ | (544,299 | ) | $ | 1,481,146 | ||||||||||||||||||||
Segment Adjustment | (108,446 | ) | (118,183 | ) | (103,261 | ) | (215,381 | ) | (224,177 | ) | 234,309 | (439,558 | ) | 180,760 | (661,002 | ) | ||||||||||||||||||||||||
Unrealized Principal Investment | $ | 223,316 | $ | 177,125 | $ | 114,427 | $ | 423,934 | $ | 104,658 | $ | (393,294 | ) | $ | 528,592 | $ | (363,539 | ) | $ | 820,144 | ||||||||||||||||||||
(g) This adjustment removes Other Revenues on a segment basis. The Segment Adjustment represents (1) the add back of Other Revenues earned from
|
| |||||||||||||||||||||||||||||||||||||||
| QTD | YTD | LTM | ||||||||||||||||||||||||||||||||||||||
($ in thousands) | 2Q’20 | 3Q’20 | 4Q’20 | 1Q’21 | 2Q’21 | 2Q’20 | 2Q’21 | 2Q’20 | 2Q’21 | |||||||||||||||||||||||||||||||
GAAP Other Revenue | $ | (55,580 | ) | $ | (192,159 | ) | $ | (143,583 | ) | $ | 60,304 | $ | 27,896 | $ | 82,600 | $ | 88,200 | $ | 169,463 | $ | (247,542 | ) | ||||||||||||||||||
Segment Adjustment | (26 | ) | (464 | ) | (32 | ) | (31 | ) | (26 | ) | (55 | ) | (57 | ) | (510 | ) | (553 | ) | ||||||||||||||||||||||
Other Revenues | $ | (55,606 | ) | $ | (192,623 | ) | $ | (143,615 | ) | $ | 60,273 | $ | 27,870 | $ | 82,545 | $ | 88,143 | $ | 168,953 | $ | (248,095 | ) | ||||||||||||||||||
| (h) | This adjustment removes Equity-Based Compensation on a segment basis. |
| (i) | This adjustment adds an amount equal to an administrative fee collected on a quarterly basis from certain holders of Blackstone Holdings Partnership |
Blackstone | 26 |
RECONCILIATION OF GAAP TO NON-GAAP MEASURES – NOTES (CONT’D)
(j) | Taxes represent the total GAAP tax provision adjusted to include only the current tax provision (benefit) calculated on Income (Loss) Before Provision (Benefit) for Taxes and adjusted to exclude the tax impact of any divestitures. Related Payables represent tax-related payables including the amount payable under the Tax Receivable Agreement. Please refer to page 34 for the full definition of Taxes and Related Payables. |
| QTD | YTD | LTM | ||||||||||||||||||||||||||||||||||||||
($ in thousands) | 2Q’20 | 3Q’20 | 4Q’20 | 1Q’21 | 2Q’21 | 2Q’20 | 2Q’21 | 2Q’20 | 2Q’21 | |||||||||||||||||||||||||||||||
Taxes | $ | 48,462 | $ | 32,518 | $ | 163,315 | $ | 69,609 | $ | 127,809 | $ | 64,736 | $ | 197,418 | $ | 155,599 | $ | 393,251 | ||||||||||||||||||||||
Related Payables | 15,528 | 7,707 | 13,544 | 14,613 | 12,864 | 22,307 | 27,477 | 43,363 | 48,728 | |||||||||||||||||||||||||||||||
Taxes and Related Payables | $ | 63,990 | $ | 40,225 | $ | 176,859 | $ | 84,222 | $ | 140,673 | $ | 87,043 | $ | 224,895 | $ | 198,962 | $ | 441,979 | ||||||||||||||||||||||
(k) This adjustment removes Interest and Dividend Revenue less Interest Expense on a segment basis. The Segment Adjustment represents (1) the add back of |
| |||||||||||||||||||||||||||||||||||||||
| QTD | YTD | LTM | ||||||||||||||||||||||||||||||||||||||
($ in thousands) | 2Q’20 | 3Q’20 | 4Q’20 | 1Q’21 | 2Q’21 | 2Q’20 | 2Q’21 | 2Q’20 | 2Q’21 | |||||||||||||||||||||||||||||||
GAAP Interest and Dividend Revenue | $ | 23,924 | $ | 26,497 | $ | 39,726 | $ | 31,412 | $ | 31,017 | $ | 59,008 | $ | 62,429 | $ | 153,636 | $ | 128,652 | ||||||||||||||||||||||
Segment Adjustment | 2,366 | - | - | - | 1,914 | 4,881 | 1,914 | 10,156 | 1,914 | |||||||||||||||||||||||||||||||
Interest and Dividend Revenue | $ | 26,290 | $ | 26,497 | $ | 39,726 | $ | 31,412 | $ | 32,931 | $ | 63,889 | $ | 64,343 | $ | 163,792 | $ | 130,566 | ||||||||||||||||||||||
GAAP Interest Expense | $ | 39,276 | $ | 39,540 | $ | 45,702 | $ | 44,983 | $ | 44,322 | $ | 80,920 | $ | 89,305 | $ | 194,970 | $ | 174,547 | ||||||||||||||||||||||
Segment Adjustment | (352 | ) | (312 | ) | (372 | ) | (643 | ) | (190 | ) | (456 | ) | (833 | ) | (4,340 | ) | (1,517 | ) | ||||||||||||||||||||||
Interest Expense | $ | 38,924 | $ | 39,228 | $ | 45,330 | $ | 44,340 | $ | 44,132 | $ | 80,464 | $ | 88,472 | $ | 190,630 | $ | 173,030 | ||||||||||||||||||||||
Net Interest Income (Loss) | $ | (12,634) | $ | (12,731) | $ | (5,604) | $ | (12,928) | $ | (11,201) | $ | (16,575) | $ | (24,129) | $ | (26,838) | $ | (42,464) | ||||||||||||||||||||||
(l) This adjustment removes the total segment amount of Realized Performance Revenues.
(m) This adjustment removes the total segment amount of Realized Performance Compensation.
(n) This adjustment removes the total segment amount of Realized Principal Investment Income.
(o) This adjustment adds back Interest Expense on a segment basis, excluding interest expense related to the Tax Receivable Agreement.
(p) This adjustment adds back Depreciation and Amortization on a segment basis.
Reconciliation of GAAP Shares of Common Stock Outstanding to Distributable Earnings Shares Outstanding |
| |||||||||||||||||||||||||||||||||||||||
| QTD | ||||||||||||||||||||||||||||||||||||||||
| 2Q’20 | 3Q’20 | 4Q’20 | 1Q’21 | 2Q’21 | ||||||||||||||||||||||||||||||||||||
GAAP Shares of Common Stock Outstanding | 676,874,583 | 680,680,748 | 683,875,544 | 690,569,563 | 691,093,463 | |||||||||||||||||||||||||||||||||||
Unvested Participating Common Shares | 20,722,453 | 19,968,387 | 20,084,245 | 20,495,980 | 29,381,076 | |||||||||||||||||||||||||||||||||||
Total Participating Common Shares | 697,597,036 | 700,649,135 | 703,959,789 | 711,065,543 | 720,474,539 | |||||||||||||||||||||||||||||||||||
Participating Partnership Units | 504,912,855 | 500,054,874 | 496,060,455 | 490,716,529 | 487,276,882 | |||||||||||||||||||||||||||||||||||
Distributable Earnings Shares Outstanding | 1,202,509,891 | 1,200,704,009 | 1,200,020,244 | 1,201,782,072 | 1,207,751,421 | |||||||||||||||||||||||||||||||||||
Disclosure of Weighted-Average Shares Common Stock Outstanding |
| |||||||||||||||||||||||||||||||||||||||
| QTD | YTD | LTM | ||||||||||||||||||||||||||||||||||||||
| 2Q’20 | 3Q’20 | 4Q’20 | 1Q’21 | 2Q’21 | 2Q’20 | 2Q’21 | 2Q’20 | 2Q’21 | ||||||||||||||||||||||||||||||||
Total GAAP Weighted-Average Shares of Common Stock | 698,534,168 | 700,184,580 | 702,543,279 | 709,033,212 | 721,141,954 | 677,041,769 | 715,121,029 | 685,032,993 | 706,212,361 | |||||||||||||||||||||||||||||||
Weighted-Average Shares of Unvested Deferred Restricted | 123,340 | 343,386 | 436,255 | 879,132 | 123,226 | - | 501,179 | 262,625 | 445,500 | |||||||||||||||||||||||||||||||
Weighted-Average Blackstone Holdings Partnership Units | 505,754,449 | - | - | - | - | - | - | - | - | |||||||||||||||||||||||||||||||
Total GAAP Weighted-Average Shares of Common Stock | 1,204,411,957 | 700,527,966 | 702,979,534 | 709,912,344 | 721,265,180 | 677,041,769 | 715,622,208 | 685,295,618 | 706,657,861 | |||||||||||||||||||||||||||||||
Blackstone | 27 |
BLACKSTONE’S SECOND QUARTER 2021 GAAP BALANCE SHEET RESULTS
| ($ in thousands) (unaudited) | 2Q’20 | 3Q’20 | 4Q’20 | 1Q’21 | 2Q’21 | |||||||||||||||
Assets | ||||||||||||||||||||
Cash and Cash Equivalents | $ | 1,976,512 |
| $ | 2,628,895 |
| $ | 1,999,484 |
| $ | 2,862,422 |
| $ | 2,467,444 |
| |||||
Cash Held by Blackstone Funds and Other |
| 343,201 |
|
| 85,218 |
|
| 64,972 |
|
| 109,285 |
|
| 109,676 |
| |||||
Investments |
| 18,973,373 |
|
| 14,423,456 |
|
| 15,617,142 |
|
| 17,943,309 |
|
| 22,163,322 |
| |||||
Accounts Receivable |
| 498,600 |
|
| 477,601 |
|
| 866,158 |
|
| 975,610 |
|
| 582,542 |
| |||||
Due from Affiliates |
| 2,431,512 |
|
| 2,817,304 |
|
| 3,221,515 |
|
| 3,015,318 |
|
| 3,159,829 |
| |||||
Intangible Assets, Net |
| 362,008 |
|
| 344,258 |
|
| 347,955 |
|
| 340,478 |
|
| 321,780 |
| |||||
Goodwill |
| 1,869,860 |
|
| 1,869,860 |
|
| 1,901,485 |
|
| 1,890,185 |
|
| 1,890,202 |
| |||||
Other Assets |
| 501,351 |
|
| 544,905 |
|
| 481,022 |
|
| 434,475 |
|
| 556,714 |
| |||||
Right-of-Use Assets |
| 568,663 |
|
| 544,361 |
|
| 526,943 |
|
| 736,633 |
|
| 723,539 |
| |||||
Deferred Tax Assets |
| 1,319,301 |
|
| 1,305,707 |
|
| 1,242,576 |
|
| 1,402,271 |
|
| 1,322,144 |
| |||||
Total Assets | $ | 28,844,381 |
| $ | 25,041,565 |
| $ | 26,269,252 |
| $ | 29,709,986 |
| $ | 33,297,192 |
| |||||
Liabilities and Equity | ||||||||||||||||||||
Loans Payable | $ | 10,839,568 |
| $ | 5,570,888 |
| $ | 5,644,653 |
| $ | 5,573,965 |
| $ | 5,594,648 |
| |||||
Due to Affiliates |
| 1,268,571 |
|
| 1,064,336 |
|
| 1,135,041 |
|
| 1,161,775 |
|
| 1,226,504 |
| |||||
Accrued Compensation and Benefits |
| 2,551,056 |
|
| 3,349,418 |
|
| 3,433,260 |
|
| 4,376,226 |
|
| 5,789,662 |
| |||||
Securities Sold, Not Yet Purchased |
| 51,395 |
|
| 51,231 |
|
| 51,033 |
|
| 33,160 |
|
| 35,783 |
| |||||
Repurchase Agreements |
| 80,620 |
|
| 80,597 |
|
| 76,808 |
|
| 58,050 |
|
| 57,247 |
| |||||
Operating Lease Liabilities |
| 637,946 |
|
| 621,408 |
|
| 620,844 |
|
| 842,692 |
|
| 841,152 |
| |||||
Accounts Payable, Accrued Expenses and Other Liabilities |
| 919,195 |
|
| 804,009 |
|
| 717,104 |
|
| 838,930 |
|
| 1,205,182 |
| |||||
Total Liabilities |
| 16,348,351 |
|
| 11,541,887 |
|
| 11,678,743 |
|
| 12,884,798 |
|
| 14,750,178 |
| |||||
Redeemable Non-Controlling Interests in Consolidated Entities |
| 68,564 |
|
| 63,384 |
|
| 65,161 |
|
| 65,546 |
|
| 65,568 |
| |||||
Equity | ||||||||||||||||||||
Common Stock, $0.00001 par value (691,093,463 shares issued |
| 7 |
|
| 7 |
|
| 7 |
|
| 7 |
|
| 7 |
| |||||
Series I Preferred Stock, $0.00001 par value (1 share issued |
| — |
|
| — |
|
| — |
|
| — |
|
| — |
| |||||
Series II Preferred Stock, $0.00001 par value (1 share issued |
| — |
|
| — |
|
| — |
|
| — |
|
| — |
| |||||
Additional Paid-in-Capital |
| 6,272,040 |
|
| 6,243,722 |
|
| 6,332,105 |
|
| 6,446,829 |
|
| 6,282,600 |
| |||||
Retained Earnings |
| (574,295 | ) |
| (36,432 | ) |
| 335,762 |
|
| 1,408,768 |
|
| 2,133,794 |
| |||||
Accumulated Other Comprehensive Loss |
| (36,758 | ) |
| (27,407 | ) |
| (15,831 | ) |
| (11,454 | ) |
| (10,245 | ) | |||||
Non-Controlling Interests in Consolidated Entities |
| 3,900,429 |
|
| 3,946,190 |
|
| 4,042,157 |
|
| 4,390,594 |
|
| 4,860,442 |
| |||||
Non-Controlling Interests in Blackstone Holdings |
| 2,866,043 |
|
| 3,310,214 |
|
| 3,831,148 |
|
| 4,524,898 |
|
| 5,214,848 |
| |||||
Total Equity |
| 12,427,466 |
|
| 13,436,294 |
|
| 14,525,348 |
|
| 16,759,642 |
|
| 18,481,446 |
| |||||
Total Liabilities and Equity | $ | 28,844,381 |
| $ | 25,041,565 |
| $ | 26,269,252 |
| $ | 29,709,986 |
| $ | 33,297,192 |
| |||||
During 3Q’20, Blackstone deconsolidated CLO vehicles as a result of ownership restructuring. The deconsolidation of CLO vehicles reduced Blackstone’s GAAP consolidated Total Assets, Total Liabilities and Non-Controlling Interests in Consolidated Entities by $6.8 billion, $6.6 billion, and $216 million, respectively. See page 29, Reconciliation of GAAP to Non-GAAP Balance Sheet Measures. |
Blackstone | 28 |
RECONCILIATION OF GAAP TO NON-GAAP BALANCE SHEET MEASURES
| ($ in thousands) | 2Q’20 | 3Q’20 | 4Q’20 | 1Q’21 | 2Q’21 | |||||||||||||||
Investments of Consolidated Blackstone Funds | $ | 7,943,531 |
| $ | 1,500,398 |
| $ | 1,455,008 |
| $ | 1,459,804 |
| $ | 1,871,269 |
| |||||
Equity Method Investments | ||||||||||||||||||||
Partnership Investments |
| 3,873,346 |
|
| 4,144,249 |
|
| 4,353,234 |
|
| 4,676,341 |
|
| 5,082,695 |
| |||||
Accrued Performance Allocations |
| 4,715,510 |
|
| 6,112,904 |
|
| 6,891,262 |
|
| 9,367,251 |
|
| 12,101,142 |
| |||||
Corporate Treasury Investments |
| 2,205,843 |
|
| 2,390,982 |
|
| 2,579,716 |
|
| 1,726,285 |
|
| 2,440,325 |
| |||||
Other Investments |
| 235,143 |
|
| 274,923 |
|
| 337,922 |
|
| 713,628 |
|
| 667,891 |
| |||||
Total GAAP Investments | $ | 18,973,373 |
| $ | 14,423,456 |
| $ | 15,617,142 |
| $ | 17,943,309 |
| $ | 22,163,322 |
| |||||
| ||||||||||||||||||||
Accrued Performance Allocations - GAAP | $ | 4,715,510 |
| $ | 6,112,904 |
| $ | 6,891,262 |
| $ | 9,367,251 |
| $ | 12,101,142 |
| |||||
Impact of Consolidation (a) |
| 19 |
|
| 1 |
|
| 1 |
|
| 1 |
|
| 1 |
| |||||
Due from Affiliates - GAAP (b) |
| 20,642 |
|
| 21,499 |
|
| 165,678 |
|
| 56,274 |
|
| 59,304 |
| |||||
Less: Net Realized Performance Revenues (c) |
| (38,592 | ) |
| (75,328 | ) |
| (313,610 | ) |
| (269,426 | ) |
| (261,760 | ) | |||||
Less: Accrued Performance Compensation - GAAP (d) |
| (1,989,219 | ) |
| (2,509,357 | ) |
| (2,917,609 | ) |
| (3,952,253 | ) |
| (5,137,933 | ) | |||||
Net Accrued Performance Revenues | $ | 2,708,360 |
| $ | 3,549,719 |
| $ | 3,825,722 |
| $ | 5,201,847 |
| $ | 6,760,754 |
| |||||
Corporate Treasury Investments - GAAP | $ | 2,205,843 |
| $ | 2,390,982 |
| $ | 2,579,716 |
| $ | 1,726,285 |
| $ | 2,440,325 |
| |||||
Impact of Consolidation (a) |
| 141,371 |
|
| 143,131 |
|
| 148,911 |
|
| 154,306 |
|
| 189,724 |
| |||||
Other Assets (e) |
| 271,615 |
|
| 525,864 |
|
| 947,565 |
|
| 766,285 |
|
| 479,591 |
| |||||
Other Liabilities (f) |
| (69,326 | ) |
| (124,734 | ) |
| (30,355 | ) |
| (61,599 | ) |
| (494,119 | ) | |||||
Corporate Treasury Investments - Deconsolidated | $ | 2,549,503 |
| $ | 2,935,243 |
| $ | 3,645,837 |
| $ | 2,585,277 |
| $ | 2,615,521 |
| |||||
Partnership and Other Investments - GAAP | $ | 4,108,489 |
| $ | 4,419,172 |
| $ | 4,691,156 |
| $ | 5,389,969 |
| $ | 5,750,586 |
| |||||
Impact of Consolidation (g) |
| (2,316,855 | ) |
| (2,470,797 | ) |
| (2,626,765 | ) |
| (2,935,148 | ) |
| (3,104,579 | ) | |||||
GP/Fund Investments - Deconsolidated | $ | 1,791,634 |
| $ | 1,948,375 |
| $ | 2,064,391 |
| $ | 2,454,821 |
| $ | 2,646,007 |
| |||||
Loans Payable - GAAP | $ | 10,839,568 |
| $ | 5,570,888 |
| $ | 5,644,653 |
| $ | 5,573,965 |
| $ | 5,594,648 |
| |||||
Impact of Consolidation (h) |
| (6,232,787 | ) |
| (99 | ) |
| (99 | ) |
| (100 | ) |
| (99 | ) | |||||
Outstanding Bonds - Carrying Value |
| 4,606,781 |
|
| 5,570,789 |
|
| 5,644,554 |
|
| 5,573,865 |
|
| 5,594,549 |
| |||||
Unamortized Discount |
| 78,319 |
|
| 87,361 |
|
| 87,846 |
|
| 85,635 |
|
| 84,151 |
| |||||
Outstanding Bonds (at par) - Deconsolidated | $ | 4,685,100 |
| $ | 5,658,150 |
| $ | 5,732,400 |
| $ | 5,659,500 |
| $ | 5,678,700 |
| |||||
| (a) | This adjustment adds back investments in consolidated Blackstone Funds which have been eliminated in consolidation. |
| (b) | Represents GAAP accrued performance revenue recorded within Due from Affiliates. |
| (c) | Represents Performance Revenues realized but not yet distributed as of the reporting date and are included in Distributable Earnings in the period they are realized. |
| (d) | Represents GAAP accrued performance compensation associated with Accrued Performance Allocations and is recorded within Accrued Compensation and Benefits and |
| (e) | This adjustment adds other assets related to Treasury Operations that are recorded within Accounts Receivable, reverse repurchase agreements and Due from Affiliates. |
| (f) | This adjustment adds other liabilities related to Treasury Operations that are recorded within Accounts Payable, Accrued Expenses and Other Liabilities, Repurchase Agreements and securities sold short, not yet purchased. |
| (g) | This adjustment removes amounts associated with the ownership of Blackstone consolidated operating partnerships held by non-controlling interests and adds back investments in consolidated Blackstone Funds which have been eliminated in consolidation. |
| (h) | This adjustment removes amounts related to consolidated Blackstone Funds. |
Blackstone | 29 |
RECONCILIATION OF GAAP TO TOTAL SEGMENTS
($ in thousands) | QTD | YTD | LTM | |||||||||||||||||||||||||||||||||||||||||
| 2Q’20 | 3Q’20 | 4Q’20 | 1Q’21 | 2Q’21 | 2Q’20 | 2Q’21 | 2Q’20 | 2Q’21 | ||||||||||||||||||||||||||||||||||||
Management and Advisory Fees, Net | ||||||||||||||||||||||||||||||||||||||||||||
GAAP | $ | 969,728 |
| $ | 1,053,851 |
| $ | 1,134,138 |
| $ | 1,177,815 |
| $ | 1,212,549 |
| $ | 1,904,560 |
| $ | 2,390,364 |
| $ | 3,726,611 |
| $ | 4,578,353 |
| |||||||||||||||||
Segment Adjustment (a) |
| 7,005 |
|
| 3,989 |
|
| 1,887 |
|
| 390 |
|
| 193 |
|
| 12,740 |
|
| 583 |
|
| 16,707 |
|
| 6,459 |
| |||||||||||||||||
Total Segment | $ | 976,733 |
| $ | 1,057,840 |
| $ | 1,136,025 |
| $ | 1,178,205 |
| $ | 1,212,742 |
| $ | 1,917,300 |
| $ | 2,390,947 |
| $ | 3,743,318 |
| $ | 4,584,812 |
| |||||||||||||||||
GAAP Realized Performance Revenues to Total Segment Fee Related Performance Revenues |
| |||||||||||||||||||||||||||||||||||||||||||
GAAP | ||||||||||||||||||||||||||||||||||||||||||||
Incentive Fees |
| 15,300 |
|
| 13,498 |
|
| 97,702 |
|
| 36,124 |
|
| 33,207 |
|
| 27,461 |
|
| 69,331 |
|
| 123,325 |
|
| 180,531 |
| |||||||||||||||||
Investment Income—Realized Performance Allocations |
| 101,910 |
|
| 371,406 |
|
| 1,465,154 |
|
| 534,367 |
|
| 808,620 |
|
| 269,440 |
|
| 1,342,987 |
|
| 1,433,545 |
|
| 3,179,547 |
| |||||||||||||||||
GAAP | $ | 117,210 |
| $ | 384,904 |
| $ | 1,562,856 |
| $ | 570,491 |
| $ | 841,827 |
| $ | 296,901 |
| $ | 1,412,318 |
| $ | 1,556,870 |
| $ | 3,360,078 |
| |||||||||||||||||
Total Segment | ||||||||||||||||||||||||||||||||||||||||||||
Less: Realized Performance Revenues |
| (102,177 | ) |
| (319,954 | ) |
| (1,276,629 | ) |
| (401,323 | ) |
| (792,938 | ) |
| (269,410 | ) |
| (1,194,261 | ) |
| (1,341,897 | ) |
| (2,790,844 | ) | |||||||||||||||||
Segment Adjustment (b) |
| - |
|
| - |
|
| - |
|
| - |
|
| - |
|
| 8 |
|
| - |
|
| 3,124 |
|
| - |
| |||||||||||||||||
Total Segment | $ | 15,033 |
| $ | 64,950 |
| $ | 286,227 |
| $ | 169,168 |
| $ | 48,889 |
| $ | 27,499 |
| $ | 218,057 |
| $ | 218,097 |
| $ | 569,234 |
| |||||||||||||||||
GAAP Compensation to Total Segment Fee Related Compensation |
| |||||||||||||||||||||||||||||||||||||||||||
GAAP | ||||||||||||||||||||||||||||||||||||||||||||
Compensation |
| 458,457 |
|
| 460,983 |
|
| 459,636 |
|
| 542,638 |
|
| 507,104 |
|
| 935,000 |
|
| 1,049,742 |
|
| 1,845,412 |
|
| 1,970,361 |
| |||||||||||||||||
Incentive Fees Compensation |
| 8,432 |
|
| 7,385 |
|
| 22,086 |
|
| 13,325 |
|
| 14,431 |
|
| 14,954 |
|
| 27,756 |
|
| 44,962 |
|
| 57,227 |
| |||||||||||||||||
Realized Performance Allocations Compensation |
| 38,569 |
|
| 142,149 |
|
| 590,089 |
|
| 213,027 |
|
| 347,423 |
|
| 110,992 |
|
| 560,450 |
|
| 561,714 |
|
| 1,292,688 |
| |||||||||||||||||
GAAP | $ | 505,458 |
| $ | 610,517 |
| $ | 1,071,811 |
| $ | 768,990 |
| $ | 868,958 |
| $ | 1,060,946 |
| $ | 1,637,948 |
| $ | 2,452,088 |
| $ | 3,320,276 |
| |||||||||||||||||
Total Segment | ||||||||||||||||||||||||||||||||||||||||||||
Less: Realized Performance Compensation |
| (37,787 | ) |
| (121,730 | ) |
| (483,528 | ) |
| (150,924 | ) |
| (338,271 | ) |
| (109,089 | ) |
| (489,195 | ) |
| (502,318 | ) |
| (1,094,453 | ) | |||||||||||||||||
Less: Equity-Based Compensation - Operating Compensation |
| (87,205 | ) |
| (88,180 | ) |
| (65,397 | ) |
| (141,674 | ) |
| (119,491 | ) |
| (172,539 | ) |
| (261,165 | ) |
| (280,290 | ) |
| (414,742 | ) | |||||||||||||||||
Less: Equity-Based Compensation - Performance Compensation |
| (2,136 | ) |
| (1,682 | ) |
| (1,695 | ) |
| (2,598 | ) |
| (1,931 | ) |
| (4,274 | ) |
| (4,529 | ) |
| (6,836 | ) |
| (7,906 | ) | |||||||||||||||||
Segment Adjustment (c) |
| (71,426 | ) |
| (38,292 | ) |
| (38,422 | ) |
| (28,684 | ) |
| (33,880 | ) |
| (121,876 | ) |
| (62,564 | ) |
| (290,763 | ) |
| (139,278 | ) | |||||||||||||||||
Total Segment | $ | 306,904 |
| $ | 360,633 |
| $ | 482,769 |
| $ | 445,110 |
| $ | 375,385 |
| $ | 653,168 |
| $ | 820,495 |
| $ | 1,371,881 |
| $ | 1,663,897 |
| |||||||||||||||||
GAAP General, Administrative and Other to Total Segment Other Operating Expenses |
| |||||||||||||||||||||||||||||||||||||||||||
GAAP | $ | 169,051 |
| $ | 171,041 |
| $ | 214,124 |
| $ | 185,122 |
| $ | 205,057 |
| $ | 326,617 |
| $ | 390,179 |
| $ | 684,655 |
| $ | 775,344 |
| |||||||||||||||||
Segment Adjustment (d) |
| (25,468 | ) |
| (19,828 | ) |
| (24,588 | ) |
| (23,698 | ) |
| (22,879 | ) |
| (44,149 | ) |
| (46,577 | ) |
| (96,477 | ) |
| (90,993 | ) | |||||||||||||||||
Total Segment | $ | 143,583 |
| $ | 151,213 |
| $ | 189,536 |
| $ | 161,424 |
| $ | 182,178 |
| �� | $ | 282,468 |
| $ | 343,602 |
| $ | 588,178 |
| $ | 684,351 |
| ||||||||||||||||
Realized Performance Revenues | ||||||||||||||||||||||||||||||||||||||||||||
GAAP | ||||||||||||||||||||||||||||||||||||||||||||
Incentive Fees |
| 15,300 |
|
| 13,498 |
|
| 97,702 |
|
| 36,124 |
|
| 33,207 |
|
| 27,461 |
|
| 69,331 |
|
| 123,325 |
|
| 180,531 |
| |||||||||||||||||
Investment Income - Realized Performance Allocations |
| 101,910 |
|
| 371,406 |
|
| 1,465,154 |
|
| 534,367 |
|
| 808,620 |
|
| 269,440 |
|
| 1,342,987 |
|
| 1,433,545 |
|
| 3,179,547 |
| |||||||||||||||||
GAAP | $ | 117,210 |
| $ | 384,904 |
| $ | 1,562,856 |
| $ | 570,491 |
| $ | 841,827 |
| $ | 296,901 |
| $ | 1,412,318 |
| $ | 1,556,870 |
| $ | 3,360,078 |
| |||||||||||||||||
Total Segment | ||||||||||||||||||||||||||||||||||||||||||||
Less: Fee Related Performance Revenues |
| (15,033 | ) |
| (64,950 | ) |
| (286,227 | ) |
| (169,168 | ) |
| (48,889 | ) |
| (27,499 | ) |
| (218,057 | ) |
| (218,097 | ) |
| (569,234 | ) | |||||||||||||||||
Segment Adjustment (b) |
| - |
|
| - |
|
| - |
|
| - |
|
| - |
|
| 8 |
|
| - |
|
| 3,124 |
|
| - |
| |||||||||||||||||
Total Segment | $ | 102,177 |
| $ | 319,954 |
| $ | 1,276,629 |
| $ | 401,323 |
| $ | 792,938 |
| $ | 269,410 |
| $ | 1,194,261 |
| $ | 1,341,897 |
| $ | 2,790,844 |
| |||||||||||||||||
| �� |
Blackstone | 30 |
RECONCILIATION OF GAAP TO TOTAL SEGMENTS – (CONT’D)
($ in thousands) | QTD | YTD | LTM | |||||||||||||||||||||||||||||||||||||||||
| 2Q’20 | 3Q’20 | 4Q’20 | 1Q’21 | 2Q’21 | 2Q’20 | 2Q’21 | 2Q’20 | 2Q’21 | ||||||||||||||||||||||||||||||||||||
Realized Performance Compensation | ||||||||||||||||||||||||||||||||||||||||||||
GAAP | ||||||||||||||||||||||||||||||||||||||||||||
Incentive Fee Compensation | $ | 8,432 |
| $ | 7,385 |
| $ | 22,086 |
| $ | 13,325 |
| $ | 14,431 |
| $ | 14,954 |
| $ | 27,756 |
| $ | 44,962 |
| $ | 57,227 |
| |||||||||||||||||
Realized Performance Allocations Compensation |
| 38,569 |
|
| 142,149 |
|
| 590,089 |
|
| 213,027 |
|
| 347,423 |
|
| 110,992 |
|
| 560,450 |
|
| 561,714 |
|
| 1,292,688 |
| |||||||||||||||||
GAAP | $ | 47,001 |
| $ | 149,534 |
| $ | 612,175 |
| $ | 226,352 |
| $ | 361,854 |
| $ | 125,946 |
| $ | 588,206 |
| $ | 606,676 |
| $ | 1,349,915 |
| |||||||||||||||||
Total Segment | ||||||||||||||||||||||||||||||||||||||||||||
Less: Fee Related Performance Compensation |
| (7,078 | ) |
| (26,122 | ) |
| (126,952 | ) |
| (72,830 | ) |
| (21,652 | ) |
| (12,583 | ) |
| (94,482 | ) |
| (97,522 | ) |
| (247,556 | ) | |||||||||||||||||
Less: Equity-Based Compensation - Performance |
| (2,136 | ) |
| (1,682 | ) |
| (1,695 | ) |
| (2,598 | ) |
| (1,931 | ) |
| (4,274 | ) |
| (4,529 | ) |
| (6,836 | ) |
| (7,906 | ) | |||||||||||||||||
Total Segment | $ | 37,787 |
| $ | 121,730 |
| $ | 483,528 |
| $ | 150,924 |
| $ | 338,271 |
| $ | 109,089 |
| $ | 489,195 |
| $ | 502,318 |
| $ | 1,094,453 |
| |||||||||||||||||
Realized Principal Investment Income |
| |||||||||||||||||||||||||||||||||||||||||||
GAAP | $ | 61,102 |
| $ | 61,017 |
| $ | 220,814 |
| $ | 355,038 |
| $ | 152,060 |
| $ | 109,797 |
| $ | 507,098 |
| $ | 284,974 |
| $ | 788,929 |
| |||||||||||||||||
Segment Adjustment (e) |
| (42,164 | ) |
| (45,133 | ) |
| (116,993 | ) |
| (56,882 | ) |
| (88,928 | ) |
| (70,569 | ) |
| (145,810 | ) |
| (171,056 | ) |
| (307,936 | ) | |||||||||||||||||
Total Segment | $ | 18,938 |
| $ | 15,884 |
| $ | 103,821 |
| $ | 298,156 |
| $ | 63,132 |
| $ | 39,228 |
| $ | 361,288 |
| $ | 113,918 |
| $ | 480,993 |
| |||||||||||||||||
GAAP Interest and Dividend Revenue net of Interest Expense to Total Segment Net Interest Income (Loss) |
| |||||||||||||||||||||||||||||||||||||||||||
GAAP | ||||||||||||||||||||||||||||||||||||||||||||
Interest and Dividend Revenue |
| 23,924 |
|
| 26,497 |
|
| 39,726 |
|
| 31,412 |
|
| 31,017 |
|
| 59,008 |
|
| 62,429 |
|
| 153,636 |
|
| 128,652 |
| |||||||||||||||||
Interest Expense |
| (39,276 | ) |
| (39,540 | ) |
| (45,702 | ) |
| (44,983 | ) |
| (44,322 | ) |
| (80,920 | ) |
| (89,305 | ) |
| (194,970 | ) |
| (174,547 | ) | |||||||||||||||||
GAAP | $ | (15,352 | ) | $ | (13,043 | ) | $ | (5,976 | ) | $ | (13,571 | ) | $ | (13,305 | ) | $ | (21,912 | ) | $ | (26,876 | ) | $ | (41,334 | ) | $ | (45,895 | ) | |||||||||||||||||
Segment Adjustment (f) |
| 2,718 |
|
| 312 |
|
| 372 |
|
| 643 |
|
| 2,104 |
|
| 5,337 |
|
| 2,747 |
|
| 14,496 |
|
| 3,431 |
| |||||||||||||||||
Total Segment | $ | (12,634 | ) | $ | (12,731 | ) | $ | (5,604 | ) | $ | (12,928 | ) | $ | (11,201 | ) | $ | (16,575 | ) | $ | (24,129 | ) | $ | (26,838 | ) | $ | (42,464 | ) | |||||||||||||||||
This analysis reconciles the components of Total Segment Distributable Earnings (page 3) to their equivalent GAAP measures, reported on the Consolidated Statement of Operations (page 1). Segment basis presents revenues and expenses on a basis that deconsolidates the investment funds Blackstone manages and excludes the amortization of intangibles, the expense of equity-based awards and Transaction-Related Charges.
| (a) | Represents (1) the add back of net management fees earned from consolidated Blackstone Funds which have been eliminated in consolidation, and (2) the removal of revenue from the reimbursement of certain expenses by the Blackstone Funds, which are presented gross under GAAP but netted against Management and Advisory Fees, Net in the Total Segment measures. |
| (b) | Represents the add back of Performance Revenues earned from consolidated Blackstone Funds which have been eliminated in consolidation. |
| (c) | Represents the removal of Transaction-Related Charges that are not recorded in the Total Segment measures. |
| (d) | Represents the removal of (1) the amortization of transaction-related intangibles, and (2) certain expenses reimbursed by the Blackstone Funds, which are presented gross under GAAP but netted against Management and Advisory Fees, Net in the Total Segment measures. Beginning in 3Q’20, includes a reduction equal to an administrative fee collected on a quarterly basis from certain holders of Blackstone Holdings Partnership Units which is accounted |
| (e) | Represents (1) the add back of Principal Investment Income, including general partner income, earned from consolidated Blackstone Funds which have been eliminated in consolidation, and (2) the removal of amounts associated with the ownership of Blackstone consolidated operating partnerships held by non-controlling interests. |
| (f) | Represents (1) the add back of Interest and Dividend Revenue earned from consolidated Blackstone Funds which have been eliminated in consolidation, |
Blackstone | 31 |
NOTES
Notes to page 1 - Blackstone’s Second Quarter 2021 GAAP Results
| § | Effective February 26, 2021, Blackstone effectuated changes to rename its Class A common stock as “common stock,” and to reclassify its Class B and Class C common stock into a new “Series I preferred stock” and “Series II preferred stock,” respectively (the “share reclassification”). Each new stock has the same rights and powers of its predecessor. All references to common stock, Series I preferred |
| § | Income (Loss) Before Provision (Benefit) for Taxes Margin is calculated by dividing Income (Loss) Before Provision (Benefit) for Taxes by Total Revenues. |
Notes to page 2 - Blackstone’s Second Quarter 2021 Highlights
| § | The changes in carrying value, fund returns and composite returns presented throughout this presentation represent those of the applicable Blackstone Funds and not those of Blackstone. |
Notes to page 5 - Investment Performance and Net Accrued Performance Revenues
| § | Core+ appreciation represents a weighted average of BREIT’s per share appreciation and BPP appreciation for the period. The returns are |
| § | Results for the Secondaries business (also referred to as Strategic Partners) are reported on a three month lag from the Secondaries’ fund |
| § | The BPS Composite gross and net returns are based on the BAAM Principal Solutions (“BPS”) Composite, which includes only BAAM-managed commingled and customized multi-manager funds and accounts and does not include BAAM’s individual investor solutions (liquid alternatives), strategic capital (seeding and GP minority stakes), strategic opportunities (co-invests), and advisory (non-discretionary) platforms, except for investments by BPS funds directly into those platforms. BAAM-managed funds in liquidation and, in the case of net returns, non fee-paying assets are also excluded. The funds/accounts that comprise the BPS Composite are not managed within a single fund or account and are managed with different mandates. There is no guarantee that BAAM would have made the same mix of investments in a stand-alone fund/account. The BPS Composite is not an investible product and, as such, the performance of the BPS Composite does not represent the performance of an actual fund or account. |
| § | Effective 1Q’21, Credit returns are presented as separate returns for Private Credit and Liquid Credit instead of as a Credit Composite. Private |
Blackstone | 32 |
NOTES – (CONT’D)
Notes to page 16 – Assets Under Management - Rollforward
§ | In 4Q’20, the methodology for Total AUM was updated with respect to the relevant segment for certain real estate, secondaries and credit funds |
| Three Months Ended June 30, 2021 | Twelve Months Ended June 30, 2021 | |||||||||||||||||||||||||||||||||||||||||||||||||||||||||||
($ in millions) | Real Estate | Private Equity | Hedge Fund Solutions | Credit & Insurance | Total | Real Estate | Private Equity | Hedge Fund Solutions | Credit & Insurance | Total | ||||||||||||||||||||||||||||||||||||||||||||||||||
Market Activity | $ | 10,103 | $ | 14,196 | $ | 2,731 | $ | 4,045 | $ | 31,076 | $ | 28,973 | $ | 45,988 | $ | 11,379 | $ | 13,784 | $ | 100,125 | ||||||||||||||||||||||||||||||||||||||||
One-Time Methodology Adjustment | (1,826 | ) | — | — | — | (1,826 | ) | 1,952 | 1,869 | — | (1,514 | ) | 2,306 | |||||||||||||||||||||||||||||||||||||||||||||||
Reported Market Activity | $ | 8,277 | $ | 14,196 | $ | 2,731 | $ | 4,045 | $ | 29,250 | $ | 30,925 | $ | 47,857 | $ | 11,379 | $ | 12,270 | $ | 102,431 | ||||||||||||||||||||||||||||||||||||||||
§ | Subsequent to 4Q’20, increases/decreases in permanent fund level leverage included in Total AUM and uncalled capital commitments that have not legally expired where investors do not have complete discretion over investment for the aforementioned funds will be reflected as inflows, outflows, realizations and/or market activity, as the case may be. |
Notes to page 22 – Shareholder Dividends
§ | DE before Certain Payables represents Distributable Earnings before the deduction for the Payable Under Tax Receivable Agreement and tax expense (benefit) of wholly owned subsidiaries. Common Shareholders receive tax benefits from deductions taken by Blackstone’s corporate tax paying subsidiaries and bear responsibility for the deduction from Distributable Earnings of the Payable Under Tax Receivable Agreement and certain other tax-related payables. |
§ | Per Share calculations are based on end of period Participating Common Shares (page 23, Share Summary); actual dividends are paid to shareholders as of the applicable record date. |
§ | Retained capital is withheld pro rata from common and Blackstone Holdings Partnership unitholders. Common shareholders’ share was |
Blackstone | 33 | ||
DEFINITIONS AND DIVIDEND POLICY
Blackstone discloses the following operating metrics and financial measures that are calculated and presented on the basis of methodologies other
than in accordance with generally accepted accounting principles in the United States of America (“non-GAAP”) in this presentation:
§ | Segment Distributable Earnings, or “Segment DE”, is Blackstone’s segment profitability measure used to make operating decisions and assess |
| – | Net Realizations is presented on a segment basis and is the sum of Realized Principal Investment Income and Realized Performance |
| – | Total Segment Revenues and Segment Revenues represent Net Management and Advisory Fees, Fee Related Performance Revenues, |
§ | Distributable Earnings, or “DE”, is derived from Blackstone’s segment reported results. DE is used to assess performance and amounts available |
| – | Net Interest Income (Loss) is presented on a segment basis and is equal to Interest and Dividend Revenue less Interest Expense, adjusted for |
| – | Taxes and Related Payables represent the total GAAP tax provision adjusted to include only the current tax provision (benefit) calculated on |
§ | Fee Related Earnings, or “FRE”, is a performance measure used to assess Blackstone’s ability to generate profits from revenues that are |
|
Blackstone | 34 | |
DEFINITIONS AND DIVIDEND POLICY – (CONT’D)
| – | Fee Related Compensation is presented on a segment basis and refers to the compensation expense, excluding Equity-Based Compensation, |
| – | Fee Related Performance Revenues refers to the realized portion of Performance Revenues from Perpetual Capital that are (a) measured |
| – | Other Operating Expenses is presented on a segment basis and is equal to General, Administrative and Other Expenses, adjusted to (a) |
| – | Perpetual Capital refers to the component of assets under management with an indefinite term, that is not in liquidation, and for which |
§ | Adjusted Earnings Before Interest, Taxes and Depreciation and Amortization, or “Adjusted EBITDA”, is a supplemental measure used to |
§ | Performance Revenues collectively refers to: (a) Incentive Fees, and (b) Performance Allocations. |
§ | Performance Compensation collectively refers to: (a) Incentive Fee Compensation, and (b) Performance Allocations Compensation. |
| – | Performance Compensation reflects an increase in the aggregate Realized Performance Compensation paid to certain of our professionals |
§ | Transaction-Related Charges arise from corporate actions including acquisitions, divestitures, and Blackstone’s initial public offering. They consist primarily of equity-based compensation charges, gains and losses on contingent consideration arrangements, changes in the balance of the Tax Receivable Agreement resulting from a change in tax law or similar event, transaction costs and any gains or losses associated with these corporate actions. |
|
Blackstone | 35 | |
DEFINITIONS AND DIVIDEND POLICY – (CONT’D)
Dividend Policy. Blackstone’s intention is to pay to holders of common stock a quarterly dividend representing approximately 85% of The Blackstone Group Inc.’s share of Distributable Earnings, subject to adjustment by amounts determined by Blackstone’s board of directors to be necessary or appropriate to provide for the conduct of its business, to make appropriate investments in its business and funds, to comply with applicable law, any of its debt instruments or other agreements, or to provide for future cash requirements such as tax-related payments, clawback obligations and dividends to shareholders for any ensuing quarter. The dividend amount could also be adjusted upward in any one quarter. All of the foregoing is subject to the qualification that the declaration and payment of any dividends are at the sole discretion of Blackstone’s board of directors and our board of directors may change our dividend policy at any time, including, without limitation, to reduce such quarterly dividends or even to eliminate such dividends entirely.
Blackstone | 36 | ||
FORWARD-LOOKING STATEMENTS
This presentation may contain forward-looking statements within the meaning of Section 27A of the Securities Act of 1933, as amended, and Section
21E of the Securities Exchange Act of 1934, as amended, which reflect our current views with respect to, among other things, our operations, taxes,
earnings and financial performance, share repurchases and dividends. You can identify these forward-looking statements by the use of words such as
“outlook,” “indicator,” “believes,” “expects,” “potential,” “continues,” “may,” “will,” “should,” “seeks,” “approximately,” “predicts,” “intends,”
“plans,” “scheduled,” “estimates,” “anticipates” or the negative version of these words or other comparable words. Such forward-looking statements
are subject to various risks and uncertainties. Accordingly, there are or will be important factors that could cause actual outcomes or results to differ
materially from those indicated in these statements. We believe these factors include but are not limited to the impact of the novel coronavirus
(“COVID-19”), as well as those described under the section entitled “Risk Factors” in our Annual Report on Form 10-K for the year ended December 31, 2020, as such factors may be updated from time to time in our periodic filings with the United States Securities and Exchange Commission
(“SEC”), which are accessible on the SEC’s website at www.sec.gov. These factors should not be construed as exhaustive and should be read in
conjunction with the other cautionary statements that are included in this report and in our other periodic filings. The forward-looking statements
speak only as of the date of this report, and we undertake no obligation to publicly update or review any forward-looking statement, whether as a
result of new information, future developments or otherwise.
This presentation does not constitute an offer of any Blackstone Fund.
Blackstone | 37 | ||