UNITED STATES
SECURITIES AND EXCHANGE COMMISSION
| x | ANNUAL REPORT PURSUANT TO SECTION 13 OR 15 (d) OF THE SECURITIES EXCHANGE ACT OF 1934 |
For the fiscal year ended December 29, 2012
OR
| o | TRANSITION REPORT PURSUANT TO SECTION 13 OR 15 (d) OF THE SECURITIES EXCHANGE ACT OF 1934 |
For the transition period from to
Commission file number 333-141699-05 and 333-173505
YCC HOLDINGS LLC
(Exact name of registrant as specified in its charter)
| DELAWARE | | 20-8284193 |
| (State or other jurisdiction of incorporation or organization) | | (I.R.S. Employer Identification No.) |
16 YANKEE CANDLE WAY
SOUTH DEERFIELD, MASSACHUSETTS 01373
(Address of principal executive office and zip code)
(413) 665-8306
(Registrant’s telephone number, including area code)
YANKEE HOLDING CORP.
(Exact name of registrant as specified in its charter)
| Delaware | | 20-8304743 |
| (State or other jurisdiction of incorporation or organization) | | (I.R.S. Employer Identification No.) |
16 YANKEE CANDLE WAY
SOUTH DEERFIELD, MASSACHUSETTS 01373
(Address of principal executive office and zip code)
(413) 665-8306
(Registrant’s telephone number, including area code)
Indicate by check mark whether either registrant is a well-known seasoned issuer, as defined in Rule 405 of the Securities Act. Yes ¨ No x
Indicate by check mark if the registrant is not required to file reports pursuant to Section 13 or Section 15(d) of the Act.
| | YCC Holdings LLC | Yes x No o |
| | Yankee Holding Corp. | Yes x No o |
Indicate by check mark whether each registrant (1) has filed all reports required to be filed by Section 13 or 15(d) of the Securities Exchange Act of 1934 during the preceding 12 months (or for such shorter period that such registrant was required to file such reports), and (2) has been subject to such filing requirements for the past 90 days.
| | YCC Holdings LLC | Yes o No x |
| | Yankee Holding Corp. | Yes o No x |
YCC Holdings LLC and Yankee Holding Corp. are voluntary filers of reports required of companies with public securities under Section 13 or 15(d) of the Securities Exchange Act of 1934, and each of YCC Holdings LLC and Yankee Holding Corp. would have filed all reports which would have been required of it during the past 12 months had it been subject to such provisions.
Indicate by check mark whether each registrant has submitted electronically and posted on its corporate Web site, if any, every Interactive Data File required to be submitted and posted pursuant to Rule 405 of Regulation S-T (§232.405 of this chapter) during the preceding 12 months (or for such shorter period that such registrant was required to submit and post such files).
| | YCC Holdings LLC | Yes x No o |
| | Yankee Holding Corp. | Yes x No o |
Indicate by check mark if disclosure of delinquent filers pursuant to Item 405 of Regulation S-K is not contained herein, and will not be contained, to the best of registrant’s knowledge, in definitive proxy or information statements incorporated by reference in Part III of this Form 10-K or any amendment to this Form 10-K. x
Indicate by check mark whether each registrant is a large accelerated filer, an accelerated filer, a non-accelerated filer, or a smaller reporting company. See the definitions of “large accelerated filer,” “accelerated filer” and “smaller reporting company” in Rule 12b-2 of the Exchange Act.
| YCC Holdings LLC | | | | | | | |
| | | | | | | | |
| Large accelerated filer | o | Accelerated filer | o | Non-accelerated filer | x | Smaller Reporting Company | o |
| |
| Yankee Holding Corp. | | | | | | | |
| | | | | | | | |
| Large accelerated filer | o | Accelerated filer | o | Non-accelerated filer | x | Smaller Reporting Company | o |
Indicate by check mark whether either registrant is a shell company (as defined in Rule 12b-2 of the Exchange Act). Yes ¨ No x
The registrants had no common equity held by non-affiliates as of the last business day of the most recently completed second fiscal quarter.
YCC Holdings LLC does not issue common stock but has one member’s interest issued and outstanding. YCC Holdings LLC’s sole member is Yankee Candle Investments LLC.
As of February 28, 2013, there were 497,981 shares of Yankee Holding Corp. common stock, $.01 par value, outstanding, all of which are owned YCC Holdings LLC.
Documents incorporated by reference (to the extent indicated herein).
None
| | | |
| Item | | Page |
| PART I | | |
| | | |
| Item 1. | | 5 |
| | | |
| Item 1A. | | 10 |
| | | |
| Item 1B. | | 20 |
| | | |
| Item 2. | | 20 |
| | | |
| Item 3. | | 22 |
| | | |
| Item 4. | | 22 |
| | | |
| PART II | | |
| | | |
| Item 5. | | 22 |
| | | |
| Item 6. | | 23 |
| | | |
| Item 7. | | 28 |
| | | |
| Item 7A. | | 48 |
| | | |
| Item 8. | | 50 |
| | | |
| Item 9. | | 97 |
| | | |
| Item 9A. | | 97 |
| | | |
| Item 9B. | | 100 |
| | | |
| PART III | | |
| | | |
| Item 10. | | 100 |
| | | |
| Item 11. | | 104 |
| | | |
| Item 12. | | 125 |
| | | |
| Item 13. | | 126 |
| | | |
| Item 14. | | 128 |
| | | |
| PART IV | | |
| | | |
| Item 15. | | 129 |
EXPLANATORY NOTE
This Annual Report on Form 10-K is a combined report of YCC Holdings LLC (“YCC Holdings”) and Yankee Holding Corp. (“Holding Corp.”), a direct 100% owned subsidiary of YCC Holdings. Unless the context indicates otherwise, any reference in this report to the “Companies,” “Company,” “we,” “us” and “our” refers to YCC Holdings together with its direct and indirect subsidiaries, including Holding Corp.
All of the operating results of YCC Holdings and Holding Corp. are derived from the operating results of The Yankee Candle Company, Inc. (“Yankee Candle”), a wholly owned subsidiary of Holding Corp. Where information or an explanation is provided that is substantially the same for each company, such information or explanation has been combined. Where information or an explanation is not substantially the same for each company, we have provided separate information and explanation. In addition, separate financial data and financial statements for each company are included in Part II (Item 6 and Item 8).
FORWARD LOOKING STATEMENTS
This Annual Report on Form 10-K contains a number of forward-looking statements. Any statements contained herein, including without limitation statements to the effect that the Company or its management “believes,” “expects,” “anticipates,” “plans” and similar expressions that relate to prospective events or developments should be considered forward-looking statements. Readers are cautioned not to place undue reliance on these forward-looking statements, which speak only as of the date the statement was made. There are a number of important factors that could cause our actual results to differ materially from those indicated by such forward-looking statements. These factors include, without limitation, those set forth below in “Management’s Discussion and Analysis of Financial Condition and Results of Operations—Future Operating Results.” We undertake no obligation to publicly update or revise any forward-looking statements, whether as a result of new information, future events or otherwise.
PART I
Organization
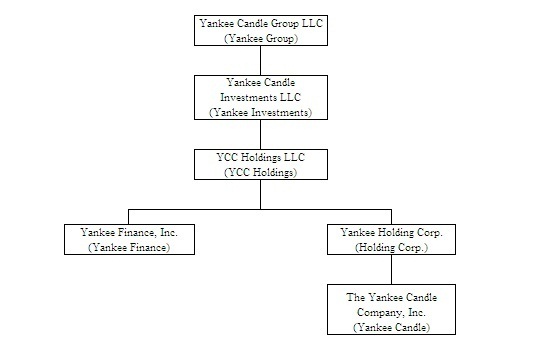
On February 6, 2007, Yankee Candle, our “Predecessor” public company, merged (the “Merger”) with an affiliate of Madison Dearborn Partners, LLC (“MDP” or “Madison Dearborn”). In connection with the Merger, YCC Holdings acquired all of the outstanding capital stock of the Predecessor for approximately $1,413.5 million in cash. YCC Holdings was owned by affiliates of MDP and certain members of our senior management subsequent to the merger. YCC Holdings owns 100% of the stock of Holding Corp., together the “Successor” companies, which in turn owns 100% of the stock of Yankee Candle.
In February 2011, YCC Holdings formed a wholly-owned subsidiary, Yankee Finance, Inc. (“Yankee Finance”), for the purpose of issuing, in conjunction with YCC Holdings, $315.0 million aggregate principal amount of 10.25%/11.00% Senior Notes due 2016 (the “Senior PIK Notes”) pursuant to an indenture, dated February 9, 2011. Simultaneously, all equity interests in YCC Holdings previously held by MDP and certain members of management were exchanged for like interests in Yankee Candle Investments LLC (“Yankee Investments”), the newly formed parent of YCC Holdings.
In the fiscal second quarter of 2011, the Companies formed Yankee Candle Group LLC, a Delaware limited liability company (“Yankee Group”). Yankee Group is the parent of Yankee Investments. The members of Yankee Group include certain funds affiliated with Madison Dearborn, as well as certain management and directors of Holding Corp. In connection with the formation of Yankee Group, a second exchange of equity interests occurred, whereby holders of Class A, Class B and Class C common units in Yankee Investments exchanged such units on a one for one basis for an identical interest in Class A, Class B, and Class C common units of Yankee Group. After the exchange, each unit holder had the same ownership interest with the same rights and features in Yankee Group that it previously had in Yankee Investments. As of December 29, 2012, all outstanding common units of Yankee Investments were owned by Yankee Group.
See the entity chart below:
Overview
We are the largest specialty branded premium scented candle company in the United States based on our annual sales. We have a 43-year history of category leadership and growth by marketing Yankee Candle products as affordable luxuries, consumable products, and valued gifts. We offer approximately 3,700 stock-keeping units (SKUs) of candle products in approximately 440 fragrances, which include a wide variety of jar candles, Samplers® votive candles, Tarts® wax potpourri, pillars and other candle products, the vast majority of which are marketed under the Yankee Candle® brand. We also sell a wide range of other home fragrance products, including electric plug home fragrancers, decorative reed diffusers, room sprays, potpourri, scented oils and coordinated candle related and home decor accessories. Additionally, we offer products such as the Yankee Candle Car Jars® auto air freshener product line, travel sprays and other products to fragrance cars and small spaces. We operate a vertically integrated business model with approximately 76% of our gross sales for the fifty-two weeks ended December 29, 2012 generated by products we manufactured at our Whately, Massachusetts facility.
Candle products are the foundation of our business, and are available in a wide range of fragrances and colors across a variety of jar candles. Our candle prices range from $1.99 for a Samplers® votive candle to $27.99 for a large 22-ounce jar candle. This variety ensures each customer can find Yankee Candle products appropriate for the consumer's lifestyle and budget. In addition to our "everyday" product offerings, we also offer seasonally-appropriate fragrances, products, home décor accessories, and giftsets on a limited edition, seasonal basis. These themed temporary programs occur four times a year: Spring, Summer, Fall, and the Christmas/Holiday season.
Distribution: Customer Touchpoints
We sell our products in multiple channels of distribution across many countries. Our customer touchpoints include our own company-operated retail stores, the Consumer Direct business, the Fundraising business as well as a global network of both national account and independent specialty gift customers and channels. We have an extensive and growing national and international wholesale segment with a diverse customer base. As of December 29, 2012, we had a domestic wholesale network of approximately 27,800 locations in North America, typically in non-mall locations. Outside of North America, we sell our products primarily through our subsidiary Yankee Candle Company (Europe), Ltd. (“YCE”), which has an international wholesale customer network of approximately 5,900 locations and distributors covering 55 countries as of December 29, 2012. We also sell our products in Japan, Korea, China and other Asian countries through our Asian distributors and in Latin America through multiple distributors.
We have a growing retail store base primarily located in shopping malls and lifestyle centers. As of December 29, 2012, we operated 568 Yankee Candle retail stores, 562 in the United States and 6 in Canada. We operate two flagship stores, a 90,000-square-foot store in South Deerfield, Massachusetts, which is a major tourist destination in Massachusetts, and a second 42,000-square-foot flagship store in Williamsburg, Virginia. Our Consumer Direct business is an important brand building opportunity with catalog circulation of approximately 6.2 million and email circulation of over 548 million in 2012. The Fundraising business distributed selected Yankee Candle brand and non-branded products through approximately 21,600 fundraising groups and worked with approximately 3.2 million individual sellers as of December 29, 2012.
We operate primarily in the domestic giftware industry. Within this industry we compete in sub-markets, including, primarily, the domestic total candle, home fragrance, scented candle and premium scented candle markets. Based upon market data from Kline & Company, we believe that the domestic home fragrance market, including candles, has grown at an approximately 2% compound annual rate from 2006 to 2011, reaching sales of approximately $7.4 billion; the domestic premium scented candle market, which is our primary market, represented 63% of the domestic scented candle market in 2011, versus 57% in 2006, reaching sales of approximately $2.0 billion.
Segments
We operate our business using three reportable segments: Retail, Wholesale and International. We present information pertaining to our segments and the geographic areas in which we operate in Note 19, Segments of Enterprise and Related Information, of the Notes to Consolidated Financial Statements in "Item 8. Financial Statements and Supplementary Data" of this Form 10-K.
Retail Operations
Our retail operations include our retail stores, our Consumer Direct business, our Fundraising business, and Chandler's restaurant (located at our South Deerfield, Massachusetts flagship store). All of our retail stores are Yankee Candle-owned and operated; none are franchised. Retail sales, as a percentage of total sales, increased slightly from 57% in fiscal 2011 to 58% in fiscal 2012.
Retail Stores
During fiscal 2012, we increased our Yankee Candle retail sales base by 16 net stores, ending the period with 568 Yankee Candle retail stores in 46 states and in one province in Canada. The average capital requirement to open a new Yankee Candle store, including initial working capital, is approximately $0.2 million.
In opening new stores, we target high traffic retail locations in shopping malls and lifestyle centers. Our retail stores, excluding our two flagship stores, average approximately 1,630 gross square feet. Of our 568 Yankee Candle retail stores, 361 are located in shopping malls.
The non-shopping mall locations include our South Deerfield, Massachusetts and Williamsburg, Virginia flagship stores. We believe that our flagship stores are the world's largest candle and holiday-themed stores with approximately 90,000 square feet of retail and entertainment space in South Deerfield and 42,000 square feet in Williamsburg. These stores promote Yankee Candle's brand image and culture and allow us to test new product and fragrance introductions. The South Deerfield flagship store is a major tourist destination and provides visitors with a total shopping and entertainment experience including the Yankee Candlemaking Museum and Chandler's, a 240-seat restaurant. This flagship store also includes our Yankee Candle Home "store within a store," which showcases home goods, accessories, furnishings and decorative accents in sophisticated country décor settings. The Williamsburg flagship store features candle dipping, candle-making demonstrations, animated musical entertainment and an old-time photo studio. In addition to our retail stores, we also sell our products directly to consumers through the Consumer Direct business, and the Fundraising business. We believe these two businesses will continue to serve as important sources of revenue growth and profitability, while also helping to build brand awareness, introduce our products to new customers and drive traffic to our retail stores.
Outstanding customer service and a knowledgeable employee base are key elements of our retail strategy. We emphasize formal employee training, particularly with respect to product quality, candle manufacturing and the heritage of Yankee Candle. We also have a well-developed, eleven-day training program for managers and assistant managers and an in-store training program for sales associates. Our high customer service standards are an integral part of our ongoing success. Each store is responsible for implementing and maintaining these customer service standards.
Consumer Direct Business
As part of the Consumer Direct business, which is a component of our retail operations, we market our products through our consumer direct mail catalogs and Internet web site. The Consumer Direct business generated $53.1 million of sales in 2012, compared to $38.4 million of sales in 2011.
Our consumer direct mail catalogs feature a wide selection of our most popular products, together with additional products and offerings exclusive to our catalog channel. We believe that our consumer direct mail catalog constitutes an important marketing tool, serving to increase the awareness and strength of the Yankee Candle® brand and driving sales to both our retail stores and Internet web site.
Our web site, www.yankeecandle.com provides our on-line customers with an easy and convenient way to purchase a wide variety of our most popular products. The web site also offers features designed to promote sales and provide enhanced customer service and convenience, including personalized guest registration, gift cards and other gift giving programs, a store locator, decorating ideas, sites dedicated to corporate gifts, weddings and other customized purchasing opportunities. We plan to implement various initiatives designed to drive further growth in this business, including continued enhancements to our website, strategic investments designed to increase conversion, build out of our web database, and increased catalog and email circulation as part of our segmented marketing.
Fundraising Business
Our fundraising business, which is a component of our retail operations, distributes selected Yankee Candle® branded products through fundraising organizations. As of December 29, 2012, we sold our products to approximately 21,600 fundraising organizations which in turn resulted in approximately 3.2 million individual sellers selling Yankee Candle products in their local schools and communities. The Fundraising business generated $43.2 million in sales in 2012, compared to $39.8 million in sales in 2011. We have increased both our internal sales force and our independent sales representatives over the past several years, and plan to continue to do so as we expand this business into additional geographies. We believe this channel presents significant growth opportunities and also serves to increase our brand awareness and introduce our products to new groups of potential customers.
Wholesale Operations
Our wholesale strategy focuses on home decor, gift and other image appropriate retailers. The wholesale business is an integral part of our growth strategy and, together with our other distribution channels, helps to further build our brand awareness. We believe the Yankee Candle® brand name is the most recognized brand in the premium scented candle market. Our wholesale customers are also loyal, with approximately 79% of our U.S. wholesale accounts having been customers for more than five years. We believe that our ability to provide industry leading category management expertise to our wholesale customers regarding product knowledge, display suggestions, promotional ideas and geographical consumer preferences is a significant competitive advantage that we plan to continue to leverage.
Over the past five years, we have increased our wholesale locations from approximately 16,700 to approximately 27,800 locations in North America as of December 29, 2012. We have done this by continuing to be the leading candle and home fragrance company in the gift channel, working with a diverse customer base which includes independent gift retailers and leading national gift retailers such as Hallmark, while also expanding our business in new channels and national accounts. These channels include leading home specialty retailers such as Bed Bath & Beyond, leading national department stores such as Kohl's, regional department stores, "premium mass" retailers such as Target and Meijer, home improvement retailers and selected club stores and other national accounts. We plan to continue this multi channel approach, using new brands and products to allow us to gain additional selling space in our existing customers and to penetrate new channels and customers as well. In the gift channel, we plan to grow our business by, among other things, employing dedicated gift channel sales teams to work closely with retailers like Hallmark and some of our larger independent gift retailers to provide tailored marketing and merchandising programs specific to the channel and to provide enhanced category management expertise and account level sales planning. We also plan to continue to expand our presence in the specialty retail channels by driving further expansion into other home fragrance categories in retailers and by exploring the use of new brands and products to allow us to penetrate new channels, such as the specialty craft channel and the development of branded businesses in other complimentary channels of distribution. Our non-Yankee branded Scent BeadsTM product line continues to be well received and is allowing us to gain entry into the food drug and mass channel in a brand appropriate and innovative way.
We use a dedicated in-house direct telemarketing sales force along with a third party service to service our wholesale customers. In addition, we have several account managers located in field offices across the United States to help us service our larger accounts. This provides us with greater control over the sales process, and allows us to provide customers with better and more accurate information, faster order turn-around and improved customer service, to create more consistent merchandising nationwide and to reduce costs.
International Operations
We sell our products in the United Kingdom and elsewhere in Europe primarily through international distributors and our wholly-owned subsidiary YCE, which utilizes our distribution center located in Bristol, England. YCE has an international wholesale customer network of approximately 5,900 locations and distributors covering 55 countries as of December 29, 2012. YCE sells our products through multiple channels, with the majority of its sales occurring in the United Kingdom and Ireland through independent gift stores, national accounts and also through its "store within a store" retail concessions business. YCE also sells directly to wholesale accounts in countries such as Germany, Italy and France, and to numerous other countries through distributors. We intend to continue to grow our business outside of North America by leveraging our wholesale distribution network and our existing distribution center in Bristol, England, and by further expanding our international business, including further geographic expansion in Asia, primarily in Japan, China and Korea and in Latin America.
New Product Innovation
We target approximately 25% to 35% of our total company sales to result from the introduction of new products each year. Our long history as a product innovator in the premium scented candle segment has been supported by our strong and experienced in-house Product Development, Brand Merchant, Consumer Insights, Marketing, Design, and Creative Development teams, which include artists, master fragrance specialists, designers, package developers, trend agents, Research & Development lab professionals, market researchers, and brand managers. These internal experts work closely together, along with a network of outside partners, to identify key market trends, to translate these key insights into business strategies, and to develop new product concepts.
In 2012, we introduced 22 new fragrances to our flagship Housewarmer® product line, 26 new fragrances in our seasonal Limited Editions, 4 new fragrances to our Pure Radiance brand, and an additional 29 new fragrances across our Simply Home™, Yankee Candle Home Classics® and other specialty brands. We also added several new technologies and product forms to our existing candle portfolio, including the launch of our new Pure Radiance Crackling Lumiwick. We continued to expand our home fragrance, car and small space product offerings; introducing the ScentPlug® air freshener separates line, With a Twist™ room fragrancers, Almost Anywhere Jar™ air fresheners and Fragrance Spheres™ odor neutralizing beads.
Manufacturing
Approximately 76% of our gross sales for each of the fifty-two weeks ended December 29, 2012 and December 31, 2011 were generated by products manufactured at our 294,000 square foot facility in Whately, Massachusetts. As a vertically integrated manufacturer, we are able to closely monitor the quality of our products, control our production costs and effectively manage inventory. We believe this is an important competitive advantage that enables us to ensure high quality products, maintain affordable pricing and provide reliable customer service.
Our products are manufactured using filled, molded, compressed and dipped manufacturing methods. The majority of our products are filled products which are produced by pouring colored, scented liquid wax into a glass container with a wick. Tapers are produced through a dipping process and Tarts® wax potpourri and Samplers® votive candles are made by compression.
We use high quality fragrances, premium grade, highly refined paraffin and soy waxes, and superior wicks and dyes to maintain the premium quality characteristics of our products. Our manufacturing processes are designed to ensure the highest quality of candle fragrance, wick quality and placement, color, fill level, shelf life and burn rate. We are continuously engaged in efforts to further improve our quality and lower our costs by using efficient production and distribution methods and technological advancements.
Suppliers
We maintain strong relationships with our principal fragrance and wax suppliers. We believe we use the highest-quality suppliers in our industry. We have been in the business of manufacturing premium scented candles for many years and are therefore knowledgeable about the different levels of quality of raw materials used in manufacturing candles. As a result, we have developed, jointly with our suppliers, proprietary fragrances which are exclusive to Yankee Candle. Most raw materials used in the manufacturing process, including glassware, wick and packaging materials, are readily available from alternative sources at comparable prices. For each of 2012, 2011 and 2010, no single supplier represented more than 10% of our total cost of goods sold.
Order Processing and Distribution
Our systems allow us to maintain efficient order processing from the time an order enters the system through shipping and payment collection from customers. We operate uniform computer and communication software systems allowing for online information access between our headquarters and retail stores. We use a software package that allows us to forecast demand for our products and efficiently plan our production schedules. We also utilize a pick-to-light system which allows Yankee Candle employees at our distribution center to receive information directly from the order collection center and quickly identify, by way of blinking lights, the products and quantity necessary to fill a particular order. We also use handheld optical scanners and bar coded labels to accurately track shipments and provide better service to customers. Our manufacturing and distribution software platforms enable us to further enhance our inventory management and customer service capabilities and also support a larger infrastructure. We believe that our systems for the processing and shipment of orders from our distribution center have enabled us to improve our overall customer service through enhanced order accuracy and reduced turnaround time.
The products we sell in the United States are generally shipped by various national small-parcel carriers or other freight carriers. Our products are shipped to our retail stores, with the frequency of deliveries based upon a store's sales volume and seasonal variances in demand. We ship to wholesale customers as orders are received. We believe that our timely and accurate distribution is an important differentiating factor for our wholesale customers. This belief is based on regular conversations between our management and sales force and feedback from our wholesale customers.
Intellectual Property
As of December 29, 2012, Yankee Candle has 123 U.S. registered trademarks, several of which are the subject of multiple registrations, including Yankee® (for candles), Yankee Candle® , Housewarmer® , Samplers® , Tarts® and Car Jars®, and has pending several additional trademark applications with respect to its products. We also register certain of our trademarks in various foreign countries. Trademark registrations allow us to use those trademarks on an exclusive basis in connection with our products. If we continue to use our trademarks and make all required filings and payments these trademarks can continue in perpetuity. These registrations are in addition to various copyright registrations and patents held by us, and all trademark, trade dress, copyright, patent and other intellectual property rights of Yankee Candle under statutory and common law. Our intellectual property further includes various proprietary product formulas, business methods and manufacturing and design "know how."
We believe that our trademarks and intellectual property rights are valuable assets and we intend to maintain and renew our trademarks and their registrations and to vigorously defend them and all of our intellectual property rights against infringement.
Environmental Matters
We are subject to various federal, state, local and foreign laws and regulations governing the generation, storage, use, emission, discharge, transportation and disposal of hazardous materials and the health and safety of our employees. In addition, we are subject to environmental laws which may require investigation and cleanup of any contamination at facilities we own or operate or at third party waste disposal sites we use. These laws could impose liability even if we did not know of, or were not responsible for, the contamination.
We have in the past and will in the future incur costs to comply with environmental laws. We are not, however, aware of any costs or liabilities relating to environmental matters, including any claims or actions under environmental laws or obligations to perform any cleanups at any of our facilities or any third party waste disposal sites, that are expected to have a material adverse effect on our operations, cash flow or financial position. It is possible, however, that such costs or liabilities may arise in the future.
Competition
We compete generally for the disposable income of consumers with other manufacturers and retailers in the giftware industry. The giftware industry is highly competitive with a large number of both large and small participants. Our products compete with other scented and unscented candle, home fragrance, personal care and other fragrance-inspired products and with other gifts within a comparable price range, like boxes of candy, flowers, wine, fine soap and related merchandise. Our competitors distribute their products through independent gift retailers, department stores, mass market stores and mail order houses and some of our competitors are part of large, diversified companies having greater financial resources and a wider range of product offerings than us.
In the premium scented candle segment of the market, in which we primarily compete, our manufacturing competitors include branded and private label manufacturers. There has been some consolidation in recent years in the manufacturing segment of the candle market and based on our current knowledge and understanding of the industry we expect that this trend may continue.
Our retail stores compete primarily with specialty candle and personal care retailers and a variety of other retailers including department stores, gift stores and national specialty retailers that carry candles along with personal care items, giftware and houseware. In addition, while we focus primarily on the premium scented candle segment, candles are also sold outside of that segment by a variety of retailers including mass merchandisers.
Employees
As of December 29, 2012, we employed approximately 2,500 full-time employees and approximately 2,700 part-time employees, excluding seasonal and temporary employees. We are not subject to any collective bargaining agreements, and we believe that our relations with our employees are good. We also use seasonal and temporary workers, as necessary, to supplement our labor force during peak selling or manufacturing seasons.
Available Information
YCC Holdings and Holding Corp. make their Annual Reports on Form 10-K, Quarterly Reports on Form 10-Q and Current Reports on Form 8-K, and any related amendments, available free of charge through our website at www.yankeecandle.com as soon as reasonably practicable after we electronically file such material with (or furnish such material to) the Securities and Exchange Commission (the “SEC”).
Risks Relating to Economic Conditions
Economic conditions in the United States and certain international markets could adversely affect our business and financial results.
As a retailer that is dependent upon consumer discretionary spending, our results of operations are sensitive to changes in macro-economic conditions. Our customers may have less money for discretionary purchases as a result of job losses, foreclosures, bankruptcies, increased fuel and energy costs, higher interest rates, higher taxes, reduced access to credit and lower home prices. Consumer confidence and discretionary spending may also be adversely affected by geopolitical events, such as wars, acts of terrorism, or political instability. Any resulting decreases in customer traffic and/or average value per transaction will negatively impact our financial performance as reduced revenues result in sales de-leveraging which creates downward pressure on margins. Similarly, these factors may negatively impact the financial and operating condition of our wholesale customer base which in turn could cause them to reduce or delay their purchases of our products and increase our exposure to losses from bad debts. There is also a risk that if negative economic conditions persist for a long period of time or worsen, consumers may make long-lasting changes to their discretionary purchasing behavior, including less frequent discretionary purchases on a more permanent basis.
In addition, the ongoing credit and financial market issues in the Euro-Zone and the resulting austerity measures and pressure on all economies may negatively impact our International operations, which are focused primarily in Europe.
Risks Relating to Our Business
Our failure to protect our reputation could have a material adverse effect on our brand image.
We compete primarily in the premium segment of the scented candle and home fragrance markets. Our products are sold at a premium to the cost of competitive products sold in mass market channels. Our ability to charge a premium price depends upon the high quality of our products and the strength of and reputation for quality associated with our brand. Our ability to maintain our reputation is critical to our brand image. Our reputation could be jeopardized if we fail to maintain high standards for merchandise quality. Any negative publicity about these types of concerns may reduce demand for our merchandise. Failure to comply with ethical, social, product, labor and environmental standards, or related political considerations, could also jeopardize our reputation and potentially lead to various adverse consumer actions. Failure to comply with applicable laws and regulations, to maintain an effective system of internal controls or to provide accurate and timely financial statement information could also hurt our reputation. Damage to our reputation or a resulting loss of consumer confidence for any of these or other reasons could have a material adverse effect on our results of operations, financial condition and cash flows, as well as require additional resources to rebuild our reputation.
Many aspects of our manufacturing and distribution facilities are customized for our business; as a result, the loss of one of these facilities would materially disrupt our operations.
Approximately 76% of our gross sales for the fifty-two weeks ended December 29, 2012 were generated by products we manufactured at our manufacturing facility in Whately, Massachusetts and we rely primarily on our distribution facilities in South Deerfield, Massachusetts to distribute our products. Because most of our machinery is designed or customized by us to manufacture our products, and because we have strict quality control standards for our products, the loss of our manufacturing facility, due to natural disaster or otherwise, would materially affect our operations. Similarly, our distribution facilities rely upon customized machinery, systems and operations, the loss of which would materially affect our operations. Although our manufacturing and distribution facilities are adequately insured, if our facilities were destroyed we believe it would take up to twelve months to resume operations at a level equivalent to current operations.
We depend upon our information technology systems, and we can not assume that we will successfully maintain and upgrade where necessary, our information systems to support our future growth.
We are dependent on information technology systems to operate our websites, process transactions, manage inventory, purchase, sell and ship goods on a timely basis and maintain cost-efficient operations. Our information technology systems depend on global communication providers, telephone systems, hardware, software and other aspects of Internet infrastructure that have experienced significant system failures and outages in the past. Our systems are susceptible to outages due to fire, floods, power loss, telecommunication failures, and similar events. Despite the implementation of network security measures, our systems may be vulnerable to computer viruses, hacking or other attacks, break-ins and similar disruptions from unauthorized tampering with our systems. The occurrence of these or other events could disrupt or damage our information technology systems and inhibit internal operations, the ability to provide customer service or the ability of customers or sales personnel to access our information systems.
Management uses information systems to support decision making and to monitor business performance. We may fail to generate accurate financial and operational reports essential for making decisions at various levels of management. Failure to adopt systematic procedures to maintain quality information technology general controls could disrupt our business. In addition, if we do not maintain adequate controls such as reconciliations, segregation of duties and verification to prevent errors or incomplete information, our ability to operate our business could be materially adversely affected.
We are also implementing enterprise-wide information systems initiatives and investments to optimize our business processes, including the planned implementation of new enterprise resource planning and warehouse management information systems. There is substantial potential risk of disruption to key business operations whenever complex systems are implemented, including with respect to unanticipated implementation costs, systems integration risks, employee training and process redesign. If our systems implementation initiatives fail or are significantly delayed, our ability to continue to improve existing operations and support future growth could be materially adversely affected.
It will be difficult to maintain our historical growth rates. If we fail to grow our business as planned, our future operating results may suffer.
We intend to continue to pursue a long-term business strategy of increasing sales and earnings by expanding our retail and wholesale operations both in the U.S. and internationally. Our ability to grow these operations successfully is dependent in part on several factors beyond our control, including economic conditions, consumer preferences, and the competitive environment in the markets in which we compete, and we may not be able to achieve our planned growth or sustain our financial performance. Our ability to anticipate changes in the candle, home fragrance and giftware industries, and identify industry trends, will be critical factors in our ability to remain competitive.
We expect that it will become more difficult to maintain our historical earnings growth rate, which could negatively impact our operating margins and results of operations. New stores typically generate lower operating margin contributions than mature stores because (i) fixed costs, as a percentage of sales, are higher and (ii) pre-opening costs are fully expensed in the year of opening. In addition, our retail sales generate lower segment margins than our wholesale sales. Over the past several years, our wholesale business has grown by increasing sales to existing customers and by adding new customers. If we are not able to continue this, our sales and profitability could be adversely affected. In addition, as we expand our wholesale business into new channels of trade that we believe to be appropriate, sales in some of these new channels may, for competitive reasons within the channels, generate lower margins than do our existing wholesale sales. Similarly, as we continue to broaden our product offerings in order to meet consumer demand, we may do so in part by adding products that have lower product margins than those of our core candle products.
Our profitability may be affected by increases in the cost of raw materials. Further increases in wax prices above the rate of inflation may negatively impact our cost of goods sold and margins. Any shortages in refined oil supplies could impact our wax supply.
Our cost of goods sold is impacted by the fluctuations in the price of various raw materials, including wax, dye, fragrance oils and glass. Price and availability of these raw materials could be negatively impacted by numerous factors, including weather, supply disruptions, governmental regulation, transportation delays, or other factors.
In the past several years significant increases in the price of crude oil have adversely impacted our transportation and freight costs and have contributed to significant increases in the cost of various raw materials, including wax, which is a petroleum-based product. This, in turn, negatively impacts our cost of goods sold and margins. Future significant increases in wax prices could have an adverse affect on our cost of goods sold and could lower our margins.
In addition to the impact of increased wax prices, any shortages in refined oil supplies may impact our wax supply. The closing or disruption of oil refineries could significantly limit our ability to source wax and negatively impact our operations. Any future prolonged interruption or reduction in wax supplies could negatively impact our operations, sales and earnings.
We rely on a small number of key vendors to supply a significant amount of the commodities we use to manufacture our candle and wax products.
We source a majority of our petroleum-based and soy-based wax from a limited number of premium wax suppliers. In addition, we source a majority of the fragrance we incorporate in our home fragrance products from a small number of prominent fragrance companies. While we have long-term contractual and business relationships with our key vendors, there can be no assurance that we will be able to source all of the wax and fragrance necessary for us to meet market demand for our products, particularly if our business continues to grow. In addition, we are dependent on our key wax and fragrance vendors shipping us adequate volumes of the commodities they supply to us correctly and in a timely manner. If our supply of wax or fragrance is disrupted, or if our wax and fragrance supplies do not meet our quality requirements, there could be a material adverse effect on our results of operations, financial condition and cash flows.
The failure or delay of a third party to supply goods to our customers could adversely impact our business.
For certain of our operations, we rely on third-party vendors to supply goods to our customers. The failure of such vendors to deliver our goods in a timely or appropriate manner could adversely impact our customer relationships, which would adversely impact our business. For example, we currently utilize third party fulfillment providers for the Fundraising business and the Consumer Direct business. Delays or other problems encountered by our third-party vendors could have an adverse effect on our business, including our reputation and ability to grow our operations as planned.
The loss or significant deterioration in the financial condition of a significant wholesale customer, or a bankruptcy filing and subsequent bankruptcy proceedings by such a customer, could negatively impact our sales and operating results.
The loss or significant deterioration in the financial condition of one of our major customers could have a material adverse effect on our sales, profitability and cash flow to the extent that we are unable to offset any revenue losses with additional revenue from existing customers or by opening new accounts. We continually monitor and evaluate the credit status of our customers and attempt to adjust trade and credit terms as appropriate. Given the current economic environment, there is an increased risk that wholesale customers could be forced to cease or significantly reduce their purchases from us. The loss of one or more significant wholesale customers, or a significant reduction in their operations, could materially adversely impact our results of operations and financial position. In addition, in the event that one of our significant wholesale customers files for bankruptcy protection, there are various potential claims that may arise in connection therewith that, if filed and adversely decided, could potentially negatively impact our operating results and financial position.
Sustained interruptions in the supply of products from overseas may affect our operating results.
We source various accessories and other products from Asia. A sustained interruption of the operations of our suppliers, as a result of economic difficulties, the impact of global shipping capacity constraints, the impact of health epidemics, natural disasters or other factors, could have an adverse effect on our ability to receive timely shipments of certain of our products, which might in turn negatively impact our sales and operating results.
Failure to adequately protect our intellectual property and curb the sale of counterfeit merchandise could injure the brand and negatively affect sales.
We believe that our trade names, trademarks and patents are an essential element of our strategy. We have obtained or applied for federal registration of these trade names, trademarks and patents and have applied for or obtained registrations in many foreign countries. There can be no assurance that we will obtain such registrations or that the registrations we obtain will prevent the imitation of our products or infringement of our intellectual property rights by others. Unauthorized third parties may counterfeit our products, typically in a manner that projects lesser quality or carries a negative connotation, thereby damaging our brand in markets where counterfeit product is prevalent. Despite our efforts to curb counterfeiting, we may not be able to successfully protect our brand and enforce our intellectual property rights. In addition, the laws of many counties do not protect intellectual property rights to the same degree as the laws of the United States.
Cyber security threats, including a privacy or data breach, could damage our relationships with our customers, harm our reputation, expose us to litigation and adversely affect our business.
As part of our normal course of business, we collect, process and retain sensitive and confidential customer information, including credit card information. Despite the security measures we have in place, our facilities and systems, and those of our third-party service providers, may be vulnerable to cyber security breaches, acts of vandalism, computer viruses, misplaced or lost data, programming and/or human errors or other similar events. Any cyber security breach involving the misappropriation, loss or other unauthorized disclosure of confidential information, whether by us or our third-party service providers, could severely damage our reputation and our relationship with our clients, expose us to risks of litigation and adversely affect our business. In addition, we may incur significant remediation costs in the event of a cyber security breach, including liability for stolen client or associate information, repairing system damage or providing credit monitoring or other benefits to clients affected by the breach. We may also incur increased cyber security protection costs to guard against future cyber incidents. These and other cyber security-related compliance, prevention and remediation costs may adversely impact our financial position, results of operations and cash flows.
We face risks associated with conducting business via the Internet in our Consumer Direct and Fundraising businesses.
We sell our products via the Internet through “yankeecandle.com” and associated websites that support our business divisions. Our Internet operations are subject to a number of risks, including:
| | ● | successful implementation of new systems, Internet platforms, and system integrations |
| | ● | failure of our computer systems, and those of key business partners, resulting in web downtimes and other technical failures |
| | ● | rapid technological change |
| | ● | reliance on third-party fulfillment providers; |
| | ● | diversion of sales from other sales channels; |
| | ● | liability for online content; |
| | ● | third party software and hardware dependencies; |
| | ● | cyber-security and data breach risks; and |
Our business could be materially adversely affected if we do not successfully manage and mitigate these risks.
Our international operations subject us to a number of risks, including regulatory, labor, tax and political conditions in foreign countries.
Sales from our international operations were $115.7 million for the fifty-two weeks ended December 29, 2012 and were primarily generated in Europe. As a result, we are subject to the legal, political, social and regulatory requirements and economic conditions of many jurisdictions other than the U.S. Risks inherent to maintaining international operations, include, but are not limited to, the following:
| | ● | withholding taxes or other taxes on our foreign income, tariffs or other restrictions on foreign trade and investment, including currency exchange controls imposed by or in other countries; |
| | ● | fluctuations in currency exchange rates; |
| | ● | the inability to obtain, maintain or enforce intellectual property rights in other jurisdictions, at a reasonable cost or at all; |
| | ● | difficulty with staffing and managing widespread operations; |
| | ● | trade barriers such as export requirements, tariffs, taxes and other restrictions and expenses, which could increase the prices of our products and make our product offering less competitive in some countries; and |
| | ● | our ability to establish ourselves and become a tax resident in foreign jurisdictions. |
Our business in foreign markets requires us to respond to rapid changes in market conditions in these countries. Our overall success in these international markets depends, in part, on our ability to succeed under differing legal, regulatory, economic, social and political conditions. There can be no assurance that we will be able to develop, implement and maintain policies and strategies that will be effective in each location where we do business. As a result of any of the foregoing factors, our financial position, results of operations, business and/or prospects could be materially adversely affected.
Because we are not a diversified company and are primarily dependent upon one industry, we have less flexibility in reacting to unfavorable consumer trends, adverse economic conditions or business cycles.
We rely primarily on the sale of premium scented candles and related products in the giftware industry. In the event that sales of these products decline or do not meet our expectations, we cannot rely on the sales of other products to offset such a shortfall. As a significant portion of our expenses is comprised of fixed costs, such as lease payments, our ability to decrease expenses in response to adverse business conditions is limited in the short term. As a result, unfavorable consumer trends, adverse economic conditions or changes in the business cycle could have a material and adverse impact on our earnings.
We may be unable to continue to open new stores successfully or renew leases for existing locations.
Our retail strategy depends in large part on our ability to successfully open new stores in both existing and new geographic markets. For our strategy to be successful, we must identify and lease favorable store sites on favorable economic terms, hire and train managers and associates and adapt management and operational systems to meet the needs of our expanded operations. These tasks may be difficult to accomplish successfully and any changes in the availability of suitable real estate locations on acceptable terms could adversely impact our retail growth. If we are unable to open new stores as quickly as planned or not at all, then our future sales and profits could be materially adversely affected. Even if we succeed in opening new stores, these new stores may not achieve the same sales or profit levels as our existing stores. Also, our retail strategy includes opening new stores in markets where we already have a presence so we can take advantage of economies of scale in marketing, distribution and supervision costs, or the opening of new malls or lifestyle centers in the market. However, these new stores may result in the loss of sales in existing stores in nearby areas, thereby negatively impacting our comparable store sales. A decrease in our retail comparable store sales will have an adverse impact on our cash flows and earnings. This is due to the fact that a significant portion of our expenses are comprised of fixed costs, such as lease payments, and our ability to decrease expenses in response to negative comparable store sales is limited in the short term. Our retail strategy also depends upon our ability to successfully renew the expiring leases of our profitable existing stores. If we are unable to do so at planned levels and on favorable economic terms, our future sales and profits could be negatively affected.
Seasonal, quarterly and other fluctuations in our business, and general industry and market conditions, could affect the market for our results of operations.
Our sales and operating results vary from quarter to quarter. We have historically realized higher sales and operating income in our fourth quarter, particularly in our retail business, which accounts for a larger portion of our sales. We believe that this has been due primarily to an increase in giftware industry sales during the holiday season of the fourth quarter. In addition, in anticipation of increased holiday sales activity, we incur certain significant incremental expenses, including the hiring of a substantial number of temporary employees to supplement our existing workforce. As a result of this seasonality, we believe that quarter to quarter comparisons of our operating results are not necessarily meaningful and that these comparisons cannot be relied upon as indicators of future performance. In addition, we may also experience quarterly fluctuations in our sales and income depending on various factors, including, among other things, the number of new retail stores we open in a particular quarter, changes in the ordering patterns of our wholesale customers during a particular quarter, pricing and promotional activities of our competitors, and the mix of products sold. Most of our operating expenses, such as rent expense, advertising and promotional expense and employee wages and salaries, do not vary directly with sales and are difficult to adjust in the short term. As a result, if sales for a particular quarter are below our expectations, we might not be able to proportionately reduce operating expenses for that quarter, and therefore a sales shortfall could have a disproportionate effect on our operating results for that quarter. Further, our comparable store sales from our retail business in a particular quarter could be adversely affected by competition, the opening nearby of new retail stores or wholesale locations, economic or other general conditions or our inability to execute a particular business strategy. As a result of these factors, we may report in the future sales, operating results or comparable store sales that do not match the expectations of analysts and investors.
We incur product liability claims, which increase our costs and impact our financial condition and operating results.
We may be subjected to various product liability claims, including claims that relate to the use of candles and claims that products include inadequate instructions as to their uses or inadequate warnings concerning possible side effects. It is possible that widespread product liability claims could increase our costs, and adversely affect our revenues and operating income. Moreover, liability claims arising from a serious adverse event may increase our costs through higher insurance premiums and deductibles, and may make it more difficult to secure adequate insurance coverage in the future.
If we lose our senior executive officers, or are unable to attract and retain the talent required for our business, our business could be disrupted and our financial performance could suffer.
Our success is in part dependent upon the retention of our senior executive officers. Our senior management team has extensive consumer packaged goods, retail, wholesale and manufacturing experience with an average of 25 years of relevant experience. If our senior executive officers become unable or unwilling to participate in our business, our future business and financial performance could be materially affected. In addition, as our business grows in size and complexity we must be able to continue to attract, develop and retain qualified personnel sufficient to allow us to adequately manage and grow our business. If we are unable to do so, our operating results could be negatively impacted. We cannot guarantee that we will be able to attract and retain personnel as and when necessary in the future.
Current environmental laws and regulations, or those enacted in the future, could result in additional liabilities and costs.
The manufacturing of our products may require the use of materials that are subject to a variety of environmental, health and safety laws and regulations. For example, various federal and state agencies regulate the petroleum used to produce our wax products and certain ingredients contained in our fragrance oils. Compliance with these laws and regulations could increase our costs and impact the availability of components required to manufacture our products. Violation of these laws and regulations may subject us to significant fines, penalties or disposal costs, which could negatively impact our results of operations, financial condition or cash flows.
In addition, a number of governmental authorities in the U.S. and abroad have introduced or are contemplating enacting legal requirements, including emissions limitations, cap and trade systems and other measures to reduce production of greenhouse gases, in response to the potential impacts of climate change. These measures may have an indirect effect on us by affecting the prices of products made from fossil fuels, including paraffin.
We face significant competition in the giftware industry. This competition could cause our revenues or margins to fall short of expectations which could adversely affect our future operating results, financial condition, liquidity and our ability to continue to grow our business.
We compete generally for the disposable income of consumers with other producers and retailers in the giftware industry. The giftware industry is highly competitive with a large number of both large and small participants and relatively low barriers to entry.
Our products compete with other scented and unscented candle, home fragrance and personal care products and with other gifts within a comparable price range, like boxes of candy, flowers, wine, fine soap and related merchandise. Our retail stores compete primarily with specialty candle retailers and a variety of other retailers including department stores, gift stores and national specialty retailers that carry candles along with personal care items, giftware and houseware. In addition, while we focus primarily on the premium scented candle segment, scented and unscented candles are also sold outside of that segment by a variety of retailers, including mass merchandisers. In our wholesale business, we compete with numerous manufacturers and importers of candles, home fragrance products and other home decor and gift items for the limited space available in our wholesale customer locations for the display and sale of such products to consumers. Some of our competitors are part of large, diversified companies which have greater financial resources and a wider range of product offerings than we do. Many of our competitors source their products from low cost manufacturers outside of the U.S. This competitive environment could adversely affect our future revenues and profits, financial condition and liquidity and our ability to continue to grow our business. Among other things, increased competition could result in increased marketing and promotional expenses, price reductions, and loss of market share, any of which could have a material adverse effect on our results of operations, financial condition or cash flow.
In the past we have been required to recognize a pre-tax, non-cash impairment charge related to goodwill and other intangible assets, and we may be required to recognize additional impairment charges against goodwill or intangible assets in the future.
At December 29, 2012, the net carrying value of our goodwill and intangible assets totaled approximately $643.6 million and $268.0 million, respectively. Our amortizing intangible assets are subject to impairment testing in accordance with the Accounting Standards Codification (the “ASC”) Topic 350 “Intangibles – Goodwill and Other,” and our non-amortizing goodwill and trade names are subject to impairment tests in accordance with the Intangibles, Goodwill and Other Topic of the ASC. We review the carrying value of our intangible assets and goodwill for impairment whenever events or circumstances indicate that their carrying value may not be recoverable, and at least annually for our goodwill and trade names. Significant negative industry or economic trends, including disruptions to our business, unexpected significant changes or planned changes in the use of our intangible assets, could result in impairment charges for any of our intangible assets, goodwill or other long-lived assets that could have a significant impact on our financial condition and results of operations.
Risks Relating to Our Capital Structure
Our substantial level of indebtedness could adversely affect our financial condition and operations.
We have a substantial amount of debt. At December 29, 2012, YCC Holdings and its subsidiaries had $1,156.8 million of total debt, $648.2 million of which is secured debt.
Our substantial level of indebtedness could have a material future impact to the company, its investors, and debtors as well as its other stakeholders. For example, it could:
| | ● | make it more difficult for us to satisfy our obligations; |
| | ● | increase our vulnerability to adverse economic and industry conditions; |
| | ● | limit our ability to obtain additional financing for future working capital, capital expenditures, raw materials, strategic acquisitions and other general corporate requirements; |
| | ● | expose us to interest rate fluctuations because the interest on the debt under our senior secured term loan facility (the “Term Loan Facility”) and under our senior secured asset-based credit facility (the “ABL Facility”) are imposed at variable rates; |
| | ● | require us to dedicate a substantial portion of our cash flow from operations to payments on our debt, thereby reducing the availability of our cash flow for operations and other purposes, including making cash available to YCC Holdings and Yankee Finance, by dividend, debt repayment or otherwise to enable us to make payments on our indebtedness; |
| | ● | make it more difficult for us to satisfy our obligations to our lenders, resulting in possible defaults on and acceleration of such indebtedness; |
| | ● | limit our ability to refinance indebtedness or increase the associated costs; |
| | ● | require us to sell assets to reduce debt or influence our decision about whether to do so; |
| | ● | limit our flexibility in planning for, or reacting to, changes in our business and the industry in which we operate or prevent us from carrying out capital spending that is necessary or important to our growth strategy and efforts to improve operating margins or our business; and |
| | ● | place us at a competitive disadvantage compared to any competitors that have less debt or comparable debt at more favorable interest rates and that, as a result, may be better positioned to withstand economic downturns. |
If we do not generate sufficient cash flows, we may be unable to service all of our indebtedness.
To service our indebtedness, we will require a significant amount of cash. Our ability to generate cash, make scheduled payments or to refinance our debt obligations depends on our successful financial and operating performance, which will be affected by a range of economic, competitive and business factors, many of which are outside of our control.
If our subsidiaries' cash flow and capital resources are insufficient to fund our and our subsidiaries' debt service obligations and to repay amounts outstanding under Yankee Candle's 9 3/4% Senior Subordinated Notes due 2017 (the “Senior Subordinated Notes”) when they mature, we may have to undertake alternative financing plans, such as refinancing or restructuring our debt, selling assets or operations, reducing or delaying capital investments, or seeking to raise additional capital. Any refinancing of our debt could be at higher interest rates and may require us to comply with more restrictive covenants which could further restrict our business operations and Yankee Candle's ability to make cash available to YCC Holdings, by dividend, debt repayment or otherwise to enable YCC Holdings to repay the amounts due under the Senior PIK Notes. Our ability to implement successfully any such alternative financing plans will be dependent on a range of factors, including general economic conditions, the level of activity in mergers and acquisitions and capital markets generally and the terms of our various debt instruments then in effect. In addition, the Term Loan Facility and the ABL Facility are secured by a lien on substantially all of Yankee Candle's and its subsidiaries’ assets, and any successor credit facility is likely to be secured on a similar basis. As such, our ability to refinance the Senior PIK Notes or seek additional financing, or Yankee Candle’s ability to make cash available to YCC Holdings, by dividend, debt repayment or otherwise to enable YCC Holdings to repay the amounts due under the Senior PIK Notes, could be impaired as a result of such security interest and the agreements governing such security interests.
Our inability to generate sufficient cash flow to satisfy our debt obligations or to refinance our obligations on commercially reasonable terms could have a material adverse effect on our business, including our financial condition and results of operations, as well as on Yankee Candle's ability to make cash available to YCC Holdings, by dividend, debt repayment or otherwise to enable YCC Holdings to satisfy its obligations on the Senior PIK Notes.
Restrictive covenants in the indenture governing the Senior PIK Notes, the indenture governing Yankee Candle’s senior subordinated notes and Yankee Candle’s Term Loan Facility and ABL Facility could restrict our operating flexibility.
The indenture governing the Senior PIK Notes currently contains covenants that limit YCC Holdings’ and its subsidiaries’ ability to take certain actions, and the indenture governing Yankee Candle's senior subordinated notes and Yankee Candle’s Term Loan Facility and ABL Facility currently contain covenants that limit Holding Corp.’s and its restricted subsidiaries' ability to take certain actions. These restrictions and restrictions in YCC Holdings’ or Yankee Candle's future indebtedness may limit our ability to operate our businesses and may prohibit or limit our ability to enhance our operations or take advantage of potential business opportunities as they arise.
The indenture governing the Senior PIK Notes currently contains covenants that limit Holding Corp.’s and its subsidiaries’ ability to, and the indenture governing Yankee Candle's senior subordinated notes currently contain covenants that limit Yankee Candle's and its restricted subsidiaries' ability to:
| | ● | incur additional indebtedness or issue preferred stock; |
| | ● | pay dividends, redeem stock or make other distributions, including distributions to YCC Holdings and Yankee Finance to make payments in respect of their indebtedness, including the Senior PIK Notes; |
| | ● | make other restricted payments or investments; |
| | ● | create restrictions on payment of dividends or other amounts by us to our restricted subsidiaries; |
| | ● | transfer or sell assets; |
| | ● | engage in mergers or consolidations; |
| | ● | engage in certain transactions with affiliates; and |
| | ● | designate subsidiaries as unrestricted subsidiaries. |
The Term Loan Facility and the ABL Facility restrict, among other things and subject to certain exceptions, Yankee Candle's ability to:
| | ● | incur additional indebtedness; |
| | ● | pay dividends or other payments on capital stock; |
| | ● | guarantee other obligations; |
| | ● | make loans, acquisitions or other investments; |
| | ● | make optional payments or modify certain debt instruments; |
| | ● | engage in transactions with affiliates; |
| | ● | amend organizations documents; |
| | ● | engage in mergers or consolidations; |
| | ● | enter into sale and leaseback transactions; |
| | ● | enter into arrangements that restrict our and our restricted subsidiaries' ability to pay dividends; |
| | ● | change the nature of the business conducted by Yankee and its subsidiaries; |
| | ● | designate our subsidiaries as unrestricted subsidiaries. |
| | ● | enter into certain hedging agreements; and |
| | ● | enter into certain burdensome agreements. |
In addition, these agreements require Yankee Candle to maintain specified financial ratios and satisfy other financial positions, including a “consolidated net total leverage ratio” (as defined in the Term Loan Facility) and a “consolidated fixed charge coverage ratio” (as defined in the ABL Facility).
Our ability to comply with the covenants and restrictions contained in the indenture governing the Senior PIK Notes, the indenture governing Yankee Candle's senior subordinated notes and Yankee Candle’s Term Loan Facility and ABL Facility may be affected by economic conditions and by financial, market and competitive factors, many of which are beyond our control. Our ability to comply with these covenants in future periods will also depend substantially on the pricing and sales volume of our products, our success at implementing cost reduction initiatives and our ability to successfully implement our overall business strategy. The breach of any of these covenants or restrictions could result in a default under the indenture governing the Senior PIK Notes, the indenture governing Yankee Candle's senior subordinated notes and Yankee Candle’s Term Loan Facility and ABL Facility that would permit the holders or applicable lenders to declare all amounts outstanding thereunder to be due and payable, together with accrued and unpaid interest and any applicable redemption premium. In that case, Yankee Candle may be unable to make borrowings under its Term Loan Facility and ABL Facility, may not be able to repay the amounts due under Yankee Candle's senior subordinated notes and Yankee Candle’s Term Loan Facility and ABL Facility and may not be able make cash available to YCC Holdings, by dividend, debt repayment or otherwise to enable YCC Holdings to make payments on the Senior PIK Notes. This could have serious consequences to our financial position, results of operations and/or cash flows and could cause us to become bankrupt or insolvent.
YCC Holdings and Holding Corp. have no independent operations or assets. Their ability to repay their debt is dependent on cash flow generated by Yankee Candle and its subsidiaries. Restrictions in our subsidiaries' debt instruments and under applicable law limit their ability to provide funds to us.
YCC Holdings has no assets other than the stock of Yankee Finance, which has no assets, and the stock of Holding Corp., which has no assets other than the stock of Yankee Candle. Furthermore, YCC Holdings and Holding Corp. conduct no operations. Accordingly, repayment of their indebtedness is dependent, on the generation of cash flows by Yankee Candle and its subsidiaries and their ability to make such cash available to YCC Holdings and Holding Corp., by dividend, debt repayment or otherwise. Yankee Candle and its subsidiaries are distinct legal entities and they do not have any obligation to pay amounts due on the notes or to make funds available for that purpose or other obligations in the form of loans, distributions or otherwise. Yankee Candle and its subsidiaries may not be able to, or may not be permitted to, make distributions to YCC Holdings and Holding Corp. in order to enable them to make payments in respect of their indebtedness. The Term Loan Facility, the ABL Facility and the indenture governing the Senior Subordinated Notes significantly restrict the ability of Holding Corp. and its other subsidiaries to pay dividends or make distributions or any other payments with respect to the Senior PIK Notes. In addition, under certain circumstances, legal restrictions may limit the YCC Holdings’ and Holding Corp.’s ability to obtain cash from Yankee Candle. Under the Delaware General Corporation Law (the "DGCL"), Holding Corp.’s subsidiaries may only make dividends (i) out of their "surplus" as defined in the DGCL or (ii) if there is no such surplus, out of their net profits for the fiscal year in which the dividend is declared and/or the preceding fiscal year.
Under fraudulent transfer laws, our subsidiaries may not pay dividends if the relevant entity is insolvent or is rendered insolvent thereby. The measures of insolvency for purposes of these fraudulent transfer laws vary depending upon the law applied in any proceeding to determine whether a fraudulent transfer has occurred. Generally, however, an entity would be considered insolvent if:
| | ● | the sum of its debts, including contingent liabilities, was greater than the fair saleable value of all of its assets; |
| | ● | the present fair saleable value of its assets was less than the amount that would be required to pay its probable liability on its existing debts, including contingent liabilities, as they become absolute and mature; or |
| | ● | it could not pay its debts as they became due. |
While we believe that our relevant subsidiaries currently have surplus and are not insolvent, there can otherwise be no assurance that these subsidiaries will not become insolvent or will be permitted to make distributions in the future in compliance with these restrictions in amounts needed to service our indebtedness.
The interests of our controlling stockholders may differ from the interests of the noteholders.
Private equity funds managed by Madison Dearborn indirectly own substantially all of Holding Corp.’s common stock. As a result, Madison Dearborn exercises a controlling influence over matters requiring stockholder approval and our policies and affairs. The interests of Madison Dearborn may conflict with those of noteholders. The controlling stockholders may have an incentive to increase the value of their investment or cause us to distribute funds to the detriment of our financial condition and affect our ability to make payments on outstanding notes. In addition, these funds have the power to elect a majority of our board of directors and appoint new officers and management and, therefore, effectively control many other major decisions regarding our operations. Additionally, our controlling stockholders are in the business of making investments in companies and may, from time to time, acquire and hold interests in businesses that compete directly or indirectly with us. Our controlling stockholders may also pursue acquisition opportunities that may be complementary to our business and, as a result, those acquisition opportunities may not be available to us. Finally, the indenture governing the Senior PIK Notes and the Senior Subordinated Notes currently permit us to pay advisory fees and dividends or make other restricted payments under certain circumstances, and Madison Dearborn may have an interest in our doing so.
Other factors may also cause our actual results to differ materially from our estimates and projections.
In addition to the foregoing, there are other factors which may cause our actual results to differ materially from our estimates and projections. Such factors include the following:
| | ● | changes in the general economic conditions in the U.S. including, but not limited to, consumer debt levels, financial market performance, interest rates, consumer sentiment, inflation, commodity prices, unemployment and other factors that impact consumer confidence and spending; |
| | ● | changes in levels of competition from our current competitors and potential new competition from both retail stores and alternative methods or channels of distribution; |
| | ● | loss of a significant vendor or prolonged disruption of product supply; |
| | ● | the successful introduction of new products and technologies in our product categories, including the frequency of such introductions, the level of consumer acceptance of new products and technologies, and their impact on demand for existing products and technologies; |
| | ● | the impact of changes in pricing and profit margins associated with our sourced products or raw materials; |
| | ● | changes in income tax laws or regulations, or in interpretations of existing income tax laws or regulations; |
| | ● | adverse outcomes from significant litigation matters; |
| | ● | changes in the interpretation or enforcement of laws and regulations regarding our business or the sale of our products, or the ingredients contained in our products; or the imposition of new or additional restrictions or regulations regarding the same; |
| | ● | changes in our ability to attract, retain and develop highly-qualified employees or changes in the cost or availability of a sufficient labor force to manage and support our operations; |
| | ● | changes in our ability to meet objectives with regard to business acquisitions or new business ventures; |
| | ● | the occurrence of severe weather events prohibiting or discouraging consumers from traveling to retail or wholesale locations; |
| | ● | the disruption of global, national or regional transportation systems; |
| | ● | the occurrence of certain material events including natural disasters, acts of terrorism, the outbreak of war or other significant national or international events; |
| | ● | an outbreak of certain public health issues, including contagious diseases; |
| | ● | our ability to react in a timely manner and maintain our critical business processes and information systems capabilities in a disaster recovery situation; and |
| | ● | changes in our ability to manage our existing computer systems and technology infrastructures, and our ability to implement successfully new computer systems and technology infrastructures. |
| ITEM 1B. | UNRESOLVED STAFF COMMENTS |
None.
We own or lease several facilities located in Massachusetts, Virginia and the United Kingdom, as described in the table below:
| TYPE OF FACILITY | | LOCATION | | SIZE |
| Manufacturing | | Whately, MA | | 294,000 sq.ft. |
| Distribution center (1) (2) | | South Deerfield, MA | | 256,000 sq ft. |
| Corporate offices and distribution center (1) | | Bristol, England | | 164,880 sq. ft. |
| Warehouse (1) | | South Hadley, MA | | 150,000 sq ft. |
| Warehouse (1) (3) | | South Deerfield, MA | | 138,000 sq.ft |
| Flagship retail store and restaurant (4) | | South Deerfield, MA | | 90,000 sq.ft. |
| Corporate offices (1) (5) | | South Deerfield, MA | | 75,000 sq.ft. |
| Distribution center (1) (6) | | Bristol, England | | 62,000 sq.ft. |
| Distribution center | | South Deerfield, MA | | 60,000 sq.ft. |
| Office and warehouse space | | South Deerfield, MA | | 44,000 sq.ft. |
| Flagship retail store (1) (7) | | Williamsburg, VA | | 42,000 sq.ft. |
| Employee health and fitness center | | South Deerfield, MA | | 12,000 sq.ft. |
Notes:
| We have the right under the lease to expand this facility from time to time. We believe that the facility has the capacity to be expanded by up to an additional 105,000 sq. ft. |
| This lease term began on January 1, 2008 and is currently set to expire on December 31, 2013. |
| (4) | This building includes an additional 11,000 sq. ft. of office space. |
| (5) | We have the right under the lease to expand this facility from time to time. We believe that the facility has the capacity to be expanded by up to an additional 30,000 square feet. |
| (6) | This facility is the former YCE corporate headquarters and distribution center. As a result of the relocation of YCE corporate headquarters and distribution center to the facility listed above, we are obligated to pay rent through the end of the lease of the former facility. This lease expires in June 2014. Obligations under this lease are part of restructuring charges in the accompanying consolidated statements of operations. |
| (7) | This building includes an additional 23,000 sq. ft. of non-retail space. |
We believe these facilities are suitable and adequate to meet our current needs. In addition to the foregoing facilities, and the retail stores referenced below, we own various other properties in the Deerfield/Whately area, none of which are material to our operations.
Other than the South Deerfield flagship store and three smaller retail locations, we lease our retail stores. Initial store leases for mall locations typically range from five to ten years. For non-mall locations, most leases are five years, with a five-year renewal option.
Our Retail Operations include Yankee Candle retail stores located in the following 46 states and one province in Canada as of December 29, 2012:
| STATE/PROVINCE | MALL | | NON-MALL | | TOTAL |
| ALABAMA | 2 | | 2 | | 4 |
| ARKANSAS | - | | 1 | | 1 |
| ARIZONA | 4 | | - | | 4 |
| CALIFORNIA | 17 | | 1 | | 18 |
| COLORADO | 3 | | 6 | | 9 |
| CONNECTICUT | 9 | | 5 | | 14 |
| DELAWARE | 3 | | 1 | | 4 |
| FLORIDA | 29 | | 12 | | 41 |
| GEORGIA | 7 | | 6 | | 13 |
| IOWA | 6 | | - | | 6 |
| IDAHO | 1 | | - | | 1 |
| ILLINOIS | 13 | | 16 | | 29 |
| INDIANA | 11 | | 6 | | 17 |
| KANSAS | 3 | | 2 | | 5 |
| KENTUCKY | 5 | | 2 | | 7 |
| LOUISIANA | 2 | | 1 | | 3 |
| MASSACHUSETTS | 17 | | 18 | | 35 |
| MARYLAND | 11 | | 8 | | 19 |
| MAINE | 2 | | 2 | | 4 |
| MICHIGAN | 15 | | 6 | | 21 |
| MINNESOTA | 6 | | 3 | | 9 |
| MISSOURI | 9 | | 6 | | 15 |
| MISSISSIPPI | 1 | | 1 | | 2 |
| NORTH CAROLINA | 12 | | 4 | | 16 |
| NORTH DAKOTA | 1 | | - | | 1 |
| NEBRASKA | 3 | | 3 | | 6 |
| NEW HAMPSHIRE | 5 | | 4 | | 9 |
| NEW JERSEY | 13 | | 12 | | 25 |
| NEW MEXICO | 1 | | - | | 1 |
| NEVADA | 2 | | 1 | | 3 |
| NEW YORK | 30 | | 9 | | 39 |
| OHIO | 17 | | 13 | | 30 |
| OKLAHOMA | 2 | | 2 | | 4 |
| ONTARIO, CANADA | 6 | | - | | 6 |
| OREGON | 2 | | 2 | | 4 |
| PENNSYLVANIA | 22 | | 12 | | 34 |
| RHODE ISLAND | 1 | | 3 | | 4 |
| SOUTH CAROLINA | 6 | | 6 | | 12 |
| SOUTH DAKOTA | 1 | | - | | 1 |
| TENNESSEE | 8 | | 5 | | 13 |
| TEXAS | 13 | | 11 | | 24 |
| UTAH | 4 | | 1 | | 5 |
| VIRGINIA | 13 | | 8 | | 21 |
| VERMONT | 1 | | 3 | | 4 |
| WASHINGTON | 9 | | - | | 9 |
| WISCONSIN | 9 | | 2 | | 11 |
| WEST VIRGINIA | 4 | | 1 | | 5 |
| TOTAL | 361 | | 207 | | 568 |
We are party to various litigation matters, in most cases involving ordinary and routine claims incidental to our business. We cannot estimate with certainty our ultimate legal and financial liability with respect to such pending litigation matters. However, we believe, based on our examination of such matters, that our ultimate liability will not have a material adverse effect on our financial position, results of operations or cash flows.
Not applicable.
PART II
| ITEM 5. | MARKET FOR REGISTRANT’S COMMON EQUITY, RELATED STOCKHOLDER MATTERS AND ISSUER PURCHASES OF EQUITY SECURITIES |
There is no market for our equity securities, all of which are currently held indirectly by Yankee Group, an indirect parent company. On February 8, 2011, all then-existing equity interests in YCC Holdings, our predecessor parent company, were exchanged for identical equity interests in Yankee Investments. In the fiscal second quarter of 2011, the Companies formed Yankee Group, a Delaware limited liability company. Yankee Group is the parent of Yankee Investments. The members of Yankee Group include certain funds affiliated with Madison Dearborn, as well as certain management and directors of the company. In connection with the formation of Yankee Group, a second exchange of equity interests occurred, whereby holders of Class A, Class B and Class C common units in Yankee Investments exchanged such units on a one for one basis for an identical interest in Class A, Class B, and Class C common units of Yankee Group. After the exchange, each unit holder had the same ownership interest with the same rights and features in Yankee Group that it previously had in Yankee Investments. As of December 29, 2012, there were 66 holders of Yankee Group’s Class A common units, 35 holders of Yankee Group’s Class B common units and 90 holders of Yankee Group’s Class C common units. See “Security Ownership of Certain Beneficial Owners and Management and Related Stockholder Matters.”
The Term Loan Facility, the ABL Facility and the indenture governing the Senior Subordinated Notes generally restrict the making of dividends to YCC Holdings from its subsidiaries and from YCC Holdings to our parent companies, other than tax distributions in accordance with its operating agreement and subject to certain exceptions. The indenture governing our Senior PIK Notes also restricts the making of dividends by Holding Corp., and its subsidiaries. During the fifty-two weeks ended December 29, 2012 and December 31, 2011, Holding Corp. declared and paid dividends of $32.4 million and $19.3 million, respectively to YCC Holdings to fund interest payments for the Senior PIK Notes, which decreased the amount available for future dividends. See “Management’s Discussion and Analysis of Financial Condition and Results of Operations — Liquidity and Capital Resources” for a description of these restrictions, including restrictions on the ability of Yankee Candle to pay dividends to enable YCC Holdings to pay cash interest on the Senior PIK Notes.
The declaration and payment of all future dividends, if any, will be at the discretion of our board of directors and will depend upon our financial condition, earnings, contractual conditions, restrictions imposed by the Term Loan Facility, the ABL Facility and the indentures governing the Senior Subordinated Notes and the Senior PIK Notes, or applicable laws and other factors that our board of directors may deem relevant.
The following sets forth information regarding all unregistered securities sold from January 3, 2010 through December 29, 2012:
During 2012, Yankee Group granted 89,409 of its Class C units to our named executive officers and certain members of management as equity awards.
The offers, sales and issuances of the securities described in this Item 5 were deemed to be exempt from registration under the Securities Act under either (1) Rule 701 promulgated under the Securities Act as offers and sale of securities pursuant to certain compensatory benefit plans and contracts relating to compensation in compliance with Rule 701 or (2) Section 4(2) of the Securities Act as transactions by an issuer not involving any public offering. The recipients of securities in each of these transactions represented their intention to acquire the securities for investment only and not with view to or for sale in connection with any distribution thereof. All recipients had adequate access, through their relationships with us, to information about us.
Securities Authorized for Issuance Under Equity Compensation Plans
The information required by this item is incorporated by reference to the information in Part III, Item 12 of this Annual Report on Form 10-K.
Financial information of YCC Holdings LLC and Yankee Holding Corp. as of and for the years ended December 29, 2012, December 31, 2011, January 1, 2011, January 2, 2010, and January 3, 2009 is presented below. The selected historical consolidated financial and other data that follows should be read in conjunction with the “Consolidated Financial Statements,” the accompanying notes thereto and “Management’s Discussion and Analysis of Financial Condition and Results of Operations” included in this Annual Report on Form 10-K. The historical financial data as of December 29, 2012, and December 31, 2011 and for the fifty-two weeks ended December 29, 2012, December 31, 2011, and January 1, 2011 has been derived from the audited consolidated financial statements and the accompanying notes in Item 8 herein.
The historical financial data as of January 1, 2011, January 2, 2010, and January 3, 2009, and for the fifty-two weeks ended January 2, 2010 and the fifty-three weeks ended January 3, 2009 has been derived from audited financial statements for the corresponding periods, which are not contained in this document.
The selected historical financial data may not be indicative of our future performance.
| YCC Holdings LLC | | Fifty-Two Weeks Ended December 29, 2012 | | | Fifty-Two Weeks Ended December 31, 2011 | | | Fifty-Two Weeks Ended January 1, 2011 | | | Fifty-Two Weeks Ended January 2, 2010 | | | Fifty-Three Weeks Ended January 3, 2009 | |
| (In thousands) | | | | | | | | | | | | | | | |
| Statement of Income Data: | | | | | | | | | | | | | | | |
| Sales | | $ | 844,186 | | | $ | 785,762 | | | $ | 733,717 | | | $ | 681,064 | | | $ | 689,146 | |
| Cost of sales | | | 363,839 | | | | 340,336 | | | | 307,103 | | | | 276,793 | | | | 291,445 | |
| | | | | | | | | | | | | | | | | | | | | |
| Gross profit | | | 480,347 | | | | 445,426 | | | | 426,614 | | | | 404,271 | | | | 397,701 | |
| Selling expenses | | | 238,035 | | | | 234,982 | | | | 212,580 | | | | 198,116 | | | | 196,098 | |
| General and administrative expenses | | | 72,184 | | | | 62,451 | | | | 62,609 | | | | 69,598 | | | | 53,485 | |
| Restructuring charges | | | 1,725 | | | | - | | | | 829 | | | | 1,881 | | | | 393 | |
| Goodwill and intangible asset impairments | | | - | | | | - | | | | - | | | | - | | | | 452,427 | (1) |
| | | | | | | | | | | | | | | | | | | | | |
| Operating income (loss) | | | 168,403 | | | | 147,993 | | | | 150,596 | | | | 134,676 | | | | (304,702 | ) |
| Other expense, net | | | 113,450 | | | | 94,184 | | | | 84,620 | | | | 94,064 | | | | 94,410 | |
| | | | | | | | | | | | | | | | | | | | | |
| Income (loss) from continuing operations before provision for (benefit from) income taxes | | | 54,953 | | | | 53,809 | | | | 65,976 | | | | 40,612 | | | | (399,112 | ) |
| Provision for (benefit from) income taxes | | | 21,896 | | | | 20,040 | | | | 23,688 | | | | 16,544 | | | | (13,036 | ) |
| | | | | | | | | | | | | | | | | | | | | |
| Income (loss) from continuing operations | | | 33,057 | | | | 33,769 | | | | 42,288 | | | | 24,068 | | | | (386,076 | ) |
| Loss from discontinued operations, net of income taxes | | | (134 | ) | | | (262 | ) | | | (379 | ) | | | (7,696 | ) | | | (23,248 | ) |
| | | | | | | | | | | | | | | | | | | | | |
| Net income (loss) | | $ | 32,923 | | | $ | 33,507 | | | $ | 41,909 | | | $ | 16,372 | | | $ | (409,324 | ) |
| YCC Holdings LLC | | Fifty-Two Weeks Ended December 29, 2012 | | | Fifty-Two Weeks Ended December 31, 2011 | | | Fifty-Two Weeks Ended January 1, 2011 | | | Fifty-Two Weeks Ended January 2, 2010 | | | Fifty-Three Weeks Ended January 3, 2009 | |
| (In thousands) | | | | | | | | | | | | | | | |
| Balance Sheet Data (as of end of fiscal year): | | | | | | | | | | | | | | | |
| Cash | | $ | 39,979 | | | $ | 50,833 | | | $ | 12,713 | | | $ | 9,095 | | | $ | 130,577 | |
| Working capital | | | 79,789 | | | | 77,972 | | | | 25,739 | | | | 35,144 | | | | 116,260 | |
| Total assets | | | 1,248,382 | | | | 1,250,122 | | | | 1,209,700 | | | | 1,219,080 | | | | 1,372,569 | |
| Total debt | | | 1,156,840 | | | | 1,210,701 | | | | 901,125 | | | | 989,125 | | | | 1,183,125 | |
| Total stockholders' (deficit) equity | | | (161,584 | ) | | | (194,155 | ) | | | 70,008 | | | | 23,243 | | | | (2,821 | ) |
| Other Data: | | | | | | | | | | | | | | | | | | | | |
| Number of retail stores (at end of fiscal year) | | | 568 | | | | 552 | | | | 515 | | | | 498 | | | | 463 | |
| Comparable store sales | | | 2.5 | % | | | 0.0 | % | | | 0.1 | % | | | (3.2 | )% | | | (7.8 | )% |
| Comparable sales including Consumer Direct | | | 5.9 | % | | | 1.7 | % | | | 0.7 | % | | | (3.0 | )% | | | (6.1 | )% |
| Gross profit margin | | | 56.9 | % | | | 56.7 | % | | | 58.1 | % | | | 59.4 | % | | | 57.7 | % |
| Depreciation and amortization | | $ | 34,721 | | | $ | 43,934 | | | $ | 42,978 | | | $ | 46,778 | | | $ | 46,995 | |
| Capital expenditures | | | 26,344 | | | | 24,632 | | | | 18,019 | | | | 15,587 | | | | 19,983 | |
| EBITDA | | | 181,358 | | | | 186,319 | | | | 188,370 | | | | 165,861 | | | | (286,112 | ) (1) |
| Cash Flow Data: | | | | | | | | | | | | | | | | | | | | |
| Net cash flows from operating activities | | $ | 92,905 | | | $ | 63,666 | | | $ | 110,405 | | | $ | 90,633 | | | $ | 88,641 | |
| Net cash flows from investing activities | | | (25,516 | ) | | | (24,248 | ) | | | (17,449 | ) | | | (17,965 | ) | | | (18,747 | ) |
| Net cash flows from financing activities | | | (78,381 | ) | | | (1,298 | ) | | | (89,242 | ) | | | (194,287 | ) | | | 55,390 | |
| (1) | As a result of the annual impairment testing, we recorded an impairment charge of $452.4 million related to our goodwill and indefinite lived intangible assets during 2008. |
| Yankee Holding Corp. | | Fifty-Two Weeks Ended December 29, 2012 | | | Fifty-Two Weeks Ended December 31, 2011 | | | Fifty-Two Weeks Ended January 1, 2011 | | | Fifty-Two Weeks Ended January 2, 2010 | | | Fifty-Three Weeks Ended January 3, 2009 | |
| (In thousands) | | | | | | | | | | | | | | | |
| Statement of Income Data: | | | | | | | | | | | | | | | |
| Sales | | $ | 844,186 | | | $ | 785,762 | | | $ | 733,717 | | | $ | 681,064 | | | $ | 689,146 | |
| Cost of sales | | | 363,839 | | | | 340,336 | | | | 307,103 | | | | 276,793 | | | | 291,445 | |
| | | | | | | | | | | | | | | | | | | | | |
| Gross profit | | | 480,347 | | | | 445,426 | | | | 426,614 | | | | 404,271 | | | | 397,701 | |
| Selling expenses | | | 238,035 | | | | 234,982 | | | | 212,580 | | | | 198,116 | | | | 196,098 | |
| General and administrative expenses | | | 72,089 | | | | 62,009 | | | | 62,609 | | | | 69,598 | | | | 53,485 | |
| Restructuring charges | | | 1,725 | | | | - | | | | 829 | | | | 1,881 | | | | 393 | |
| Goodwill and intangible asset impairments | | | - | | | | - | | | | - | | | | - | | | | 452,427 | (1) |
| | | | | | | | | | | | | | | | | | | | | |
| Operating income (loss) | | | 168,498 | | | | 148,435 | | | | 150,596 | | | | 134,676 | | | | (304,702 | ) |
| Other expense, net | | | 78,508 | | | | 63,129 | | | | 84,620 | | | | 94,064 | | | | 94,410 | |
| | | | | | | | | | | | | | | | | | | | | |
| Income (loss) from continuing operations before provision for (benefit from) income taxes | | | 89,990 | | | | 85,306 | | | | 65,976 | | | | 40,612 | | | | (399,112 | ) |
| Provision for (benefit from) income taxes | | | 33,533 | | | | 30,497 | | | | 23,688 | | | | 16,544 | | | | (13,036 | ) |
| | | | | | | | | | | | | | | | | | | | | |
| Income (loss) from continuing operations | | | 56,457 | | | | 54,809 | | | | 42,288 | | | | 24,068 | | | | (386,076 | ) |
| Loss from discontinued operations, net of income taxes | | | (134 | ) | | | (262 | ) | | | (379 | ) | | | (7,696 | ) | | | (23,248 | ) |
| | | | | | | | | | | | | | | | | | | | | |
| Net income (loss) | | $ | 56,323 | | | $ | 54,547 | | | $ | 41,909 | | | $ | 16,372 | | | $ | (409,324 | ) |
| Yankee Holding Corp. | | Fifty-Two Weeks Ended December 29, 2012 | | | Fifty-Two Weeks Ended December 31, 2011 | | | Fifty-Two Weeks Ended January 1, 2011 | | | Fifty-Two Weeks Ended January 2, 2010 | | | Fifty-Three Weeks Ended January 3, 2009 | |
| (In thousands) | | | | | | | | | | | | | | | |
| Balance Sheet Data (as of end of fiscal year): | | | | | | | | | | | | | | | |
| Cash | | $ | 39,979 | | | $ | 50,833 | | | $ | 12,713 | | | $ | 9,095 | | | $ | 130,577 | |
| Working capital | | | 91,722 | | | | 90,080 | | | | 25,739 | | | | 35,144 | | | | 116,260 | |
| Total assets | | | 1,241,497 | | | | 1,241,504 | | | | 1,209,700 | | | | 1,219,080 | | | | 1,372,569 | |
| Total debt | | | 846,174 | | | | 901,125 | | | | 901,125 | | | | 989,125 | | | | 1,183,125 | |
| Total stockholders' equity (deficit) | | | 154,130 | | | | 118,911 | | | | 70,008 | | | | 23,243 | | | | (2,821 | ) |
| Other Data: | | | | | | | | | | | | | | | | | | | | |
| Number of retail stores (at end of fiscal year) | | | 568 | | | | 552 | | | | 515 | | | | 498 | | | | 463 | |
| Comparable store sales | | | 2.5 | % | | | 0.0 | % | | | 0.1 | % | | | (3.2 | )% | | | (7.8 | )% |
| Comparable sales including Consumer Direct | | | 5.9 | % | | | 1.7 | % | | | 0.7 | % | | | (3.0 | )% | | | (6.1 | )% |
| Gross profit margin | | | 56.9 | % | | | 56.7 | % | | | 58.1 | % | | | 59.4 | % | | | 57.7 | % |
| Depreciation and amortization | | $ | 31,898 | | | $ | 41,669 | | | $ | 42,978 | | | $ | 46,778 | | | $ | 46,995 | |
| Capital expenditures | | | 26,344 | | | | 24,632 | | | | 18,019 | | | | 15,587 | | | | 19,983 | |
| EBITDA | | | 181,453 | | | | 186,761 | | | | 188,370 | | | | 165,861 | | | | (286,112 | )(1) |
| Cash Flow Data: | | | | | | | | | | | | | | | | | | | | |
| Net cash flows from operating activities | | $ | 125,294 | | | $ | 80,787 | | | $ | 110,405 | | | $ | 90,633 | | | $ | 88,641 | |
| Net cash flows from investing activities | | | (25,516 | ) | | | (24,248 | ) | | | (17,449 | ) | | | (17,965 | ) | | | (18,747 | ) |
| Net cash flows from financing activities | | | (110,770 | ) | | | (18,419 | ) | | | (89,242 | ) | | | (194,287 | ) | | | 55,390 | |
| (1) | As a result of the annual impairment testing, we recorded an impairment charge of $452.4 million related to our goodwill and indefinite lived intangible assets during 2008. |
Other Data – EBITDA
Management presents EBITDA, which is a non-GAAP liquidity measure, because we believe that it is a useful tool for us and our investors to measure our ability to meet debt service, capital expenditure and working capital requirements. EBITDA, as presented, may not be comparable to similarly titled measures reported by other companies since not all companies necessarily calculate EBITDA in an identical manner and therefore is not necessarily an accurate means of comparison between companies. EBITDA is not intended to represent cash flows for the period or funds available for management’s discretionary use nor has it been represented as an alternative to operating income as an indicator of operating performance and should not be considered in isolation or as a substitute for measures of performance prepared in accordance with generally accepted accounting principles in the United States of America (“GAAP”). In order to compensate for differences in the calculation of EBITDA across companies, EBITDA should be evaluated in conjunction with GAAP measures such as operating income, net income, cash flow from operations and other measures of equal importance. In addition, the Company’s debt covenants in the credit agreement relating to our Credit Facility contain ratios based on an EBITDA measure as defined in Note 3, “Long-term Debt,” to the consolidated financial statements. EBITDA differs from the definition used in our Credit Facility, as further described under “Management’s Discussion and Analysis of Financial Condition and Results of Operations - Liquidity and Capital Resources.”
A reconciliation of EBITDA to cash flows provided by operations is as follows:
| YCC Holdings LLC | | Fifty-Two Weeks Ended December 29, 2012 | | | Fifty-Two Weeks Ended December 31, 2011 | | | Fifty-Two Weeks Ended January 1, 2011 | | | Fifty-Two Weeks Ended January 2, 2010 | | | Fifty-Three Weeks Ended January 3, 2009 | |
| (In thousands) | | | | | | | | | | | | | | | |
| EBITDA | | $ | 181,358 | | | $ | 186,319 | | | $ | 188,370 | | | $ | 165,861 | | | $ | (286,112 | ) |
| (Provision for) benefit from income taxes | | | (21,896 | ) | | | (20,040 | ) | | | (23,688 | ) | | | (16,544 | ) | | | 13,036 | |
| Interest expense, net | | | (99,237 | ) | | | (95,195 | ) | | | (84,638 | ) | | | (92,345 | ) | | | (95,263 | ) |
| Amortization of deferred financing costs | | | 7,419 | | | | 6,357 | | | | 4,840 | | | | 5,998 | | | | 4,504 | |
| Equity-based compensation expense | | | 753 | | | | 820 | | | | 962 | | | | 857 | | | | 892 | |
| Deferred taxes | | | 11,506 | | | | 10,321 | | | | 3,931 | | | | 12,312 | | | | (19,059 | ) |
| Non-cash adjustments related to restructuring | | | - | | | | - | | | | 10 | | | | (816 | ) | | | 12,050 | |
| Goodwill and intangible asset impairments | | | - | | | | - | | | | - | | | | 1,182 | | | | 462,616 | |
| Other non-cash items | | | 7,005 | | | | (4,942 | ) | | | 8,750 | | | | 6,918 | | | | (458 | ) |
| Net changes in assets and liabilities | | | 5,997 | | | | (19,974 | ) | | | 11,868 | | | | 7,210 | | | | (3,565 | ) |
| | | | | | | | | | | | | | | | | | | | | |
| Cash flows from operating activities | | $ | 92,905 | | | $ | 63,666 | | | $ | 110,405 | | | $ | 90,633 | | | $ | 88,641 | |
| Yankee Holding Corp. | | Fifty-Two Weeks Ended December 29, 2012 | | | Fifty-Two Weeks Ended December 31, 2011 | | | Fifty-Two Weeks Ended January 1, 2011 | | | Fifty-Two Weeks Ended January 2, 2010 | | | Fifty-Three Weeks Ended January 3, 2009 | |
| (In thousands) | | | | | | | | | | | | | | | |
| EBITDA | | $ | 181,453 | | | $ | 186,761 | | | $ | 188,370 | | | $ | 165,861 | | | $ | (286,112 | ) |
| (Provision for) benefit from income taxes | | | (33,533 | ) | | | (30,497 | ) | | | (23,688 | ) | | | (16,544 | ) | | | 13,036 | |
| Interest expense, net | | | (64,294 | ) | | | (64,141 | ) | | | (84,638 | ) | | | (92,345 | ) | | | (95,263 | ) |
| Amortization of deferred financing costs | | | 4,595 | | | | 4,093 | | | | 4,840 | | | | 5,998 | | | | 4,504 | |
| Equity-based compensation expense | | | 753 | | | | 820 | | | | 962 | | | | 857 | | | | 892 | |
| Deferred taxes | | | 11,506 | | | | 10,321 | | | | 3,931 | | | | 12,312 | | | | (19,059 | ) |
| Non-cash adjustments related to restructuring | | | - | | | | - | | | | 10 | | | | (816 | ) | | | 12,050 | |
| Goodwill and intangible asset impairments | | | - | | | | - | | | | - | | | | 1,182 | | | | 462,616 | |
| Other non-cash items | | | 7,005 | | | | (4,942 | ) | | | 8,750 | | | | 6,918 | | | | (458 | ) |
| Net changes in assets and liabilities | | | 17,809 | | | | (21,628 | ) | | | 11,868 | | | | 7,210 | | | | (3,565 | ) |
| | | | | | | | | | | | | | | | | | | | | |
| Cash flows from operating activities | | $ | 125,294 | | | $ | 80,787 | | | $ | 110,405 | | | $ | 90,633 | | | $ | 88,641 | |
| ITEM 7. | MANAGEMENT’S DISCUSSION AND ANALYSIS OF FINANCIAL CONDITION AND RESULTS OF OPERATIONS |
ORGANIZATION AND CURRENT EVENTS
YCC Holdings LLC (“YCC Holdings”) and Yankee Holding Corp. (“Holding Corp.”) are holding companies with no direct operations. Their principal assets are the indirect equity interests in The Yankee Candle Company, Inc. (“Yankee Candle”), and all of their operations are conducted through Yankee Candle, the wholly owned operating subsidiary of Holding Corp. Holding Corp. is a wholly owned subsidiary of YCC Holdings. YCC Holdings is a wholly owned subsidiary of Yankee Candle Investments LLC (“Yankee Investments”), which is in turn a wholly owned subsidiary of Yankee Candle Group LLC (“Yankee Group”).
Refinancing of the Senior Secured Credit Facility and Repurchase of $315 million of Yankee Candle’s 8 ½% Senior Notes Due 2015
On April 2, 2012, Yankee Candle refinanced its existing Senior Secured Credit Facility and $315.0 million of its Senior Notes due 2015 by entering into a senior secured term loan facility (the “Term Loan Facility”) and by entering into a senior secured asset-based credit facility (the “ABL Facility”).
Under the Term Loan Facility, Yankee Candle borrowed $725.0 million resulting in proceeds of $717.8 million, net of original issue discount. At closing, on April 2, 2012, a portion of the proceeds from the Term Loan Facility were used to (i) redeem $180.0 million of Yankee Candle’s Senior Notes due 2015 at a call premium of 2.125%, (ii) repay $403.1 million of outstanding debt on the Company’s old Senior Secured Credit Facility (consisting of $388.1 million outstanding under the senior secured term loan facility (the “Prior Term Facility”) and $15.0 million outstanding under the senior secured revolving credit facility (“Prior Revolving Facility”)), and (iii) pay fees and expenses of $11.5 million related to the foregoing. On April 13, 2012, the Company used the remaining proceeds and borrowings under the ABL Facility to redeem an additional $135.0 million of the Senior Notes due 2015 at a call premium of 2.125%. As a result of the refinancing the Company recorded a loss on extinguishment of debt of $13.4 million comprised of the write-off of unamortized deferred financing fees of $6.7 million and call premiums of $6.7 million. The Company also recorded total deferred financing costs of $11.6 million, $9.0 million related to the Term Loan Facility and $2.6 million related to the ABL Facility. The costs associated with the Term Loan Facility are being amortized using the interest method through the expiration date of the Term Loan Facility and the costs associated with the ABL Facility are being amortized on a straight line basis through the expiration date of the ABL Facility. Amortization of the discount is recorded as interest expense using the interest method.
CRITICAL ACCOUNTING POLICIES AND ESTIMATES
"Management's Discussion and Analysis of Financial Condition and Results of Operations" discusses our consolidated financial statements, which have been prepared in accordance with GAAP. The preparation of these financial statements requires management to make estimates and judgments that affect the reported amounts of assets and liabilities, the disclosure of contingent assets and liabilities at the date of the financial statements and the reported amounts of revenues and expenses during the reporting period. Management bases its estimates and judgments on historical experience and on various other factors that are believed to be reasonable under the circumstances, the results of which form the basis for making judgments about operating results and the carrying values of assets and liabilities that are not readily apparent from other sources. Actual results may differ from these estimates under different assumptions or conditions. Management believes the following critical accounting policies involve its more significant estimates and judgments and are therefore particularly important to an understanding of our results of operations and financial position.
Valuation of Long-Lived Assets, Including Intangibles and Goodwill
Long-lived assets on our consolidated balance sheets consist primarily of property and equipment, customer lists, tradenames and goodwill. We group retail long-lived assets for impairment by store location. Manufacturing assets, information systems, and corporate assets do not have identifiable cash flows that are largely independent of the cash flows of other assets and liabilities and of other asset groups, and therefore, such long-lived assets are included in an asset group that includes all assets and liabilities of the entity. An intangible asset with a finite useful life is amortized; an intangible asset with an indefinite useful life, including goodwill, is not amortized, but is evaluated annually for impairment. Reaching a determination on useful life requires significant judgments and assumptions regarding the future effects of obsolescence, competition and other economic factors. We have determined that our tradenames have an indefinite useful life and, therefore, are not being amortized.
Pursuant to ASC Topic 360 "Property, Plant, and Equipment," we periodically review long-lived assets for impairment whenever events or changes in circumstances indicate that the carrying value of an asset may not be recoverable. Such events or circumstances include, but are not limited to, a significant decrease in the fair value of the underlying business or store, or a change in utilization of property and equipment. If such facts or circumstances are determined to exist, an estimate of the undiscounted future cash flows produced by the long-lived asset, or the appropriate grouping of assets, is compared to the carrying value to determine whether impairment exists. If an asset or grouping of assets is determined to be impaired, the loss is measured based on the difference between the asset's fair value and its carrying value. An estimate of the asset's fair value is based on quoted market prices in active markets, if available. If quoted market prices are not available, the estimate of fair value is based on various valuation techniques, including a discounted value of estimated future cash flows.
For goodwill, the annual impairment evaluation compares the fair value of a reporting unit to its carrying value and consists of two steps. First, we determine the fair value of each of our reporting units and compare them to the corresponding carrying values. Second, if the carrying amount of a reporting unit exceeds its fair value, an impairment loss is recognized for any excess of the carrying amount of the reporting unit's goodwill over the implied fair value of the goodwill. The implied fair value of goodwill is determined by allocating the fair value of the reporting unit in a manner similar to a purchase price allocation, in accordance with ASC Topic 805 "Business Combinations." The residual fair value after this allocation is the implied fair value of the reporting unit goodwill.
We perform our annual impairment testing at the reporting unit level. We reviewed the provisions of ASC Topic 350 "Intangibles—Goodwill and Other" with respect to the criteria necessary to evaluate the number of reporting units that exist. We also considered the way we manage our operations and the nature of those operations. As of November 3, 2012, the date of our most recent annual impairment test, we had three reporting units: Retail, Wholesale and International. The international reporting unit does not have any recorded goodwill.
Fair values of the reporting units are derived through a combination of market-based and income-based approaches, each of which were weighted at 50% for the impairment test performed as of November 3, 2012. The market-based approach estimates fair value by applying multiples of potential earnings, such as EBITDA and revenue, of publicly traded comparable companies. We believe this approach is appropriate because it provides a fair value using multiples from companies with operations and economic characteristics similar to our reporting units. The income-based approach is based on projected future debt-free cash flow that is discounted to present value using factors that consider the timing and risk of the future cash flows. We believe this approach is appropriate because it provides a fair value estimate based upon the reporting units expected long-term operations and cash flow performance. The income-based approach is based on a reporting unit's future projections of operating results and cash flows. These projections are discounted to present value using a weighted average cost of capital for market participants, who are generally thought to be industry participants. The future projections are based on both past performance and the projections and assumptions used in our current operating plan. Such assumptions are subject to change as a result of changing economic and competitive conditions.
The income-based approach is based on future projections of operating results and cash flows. These projections are discounted to present value using a weighted average cost of capital for market participants, who are generally thought to be industry participants. Our future projections of operating results are based on both past performance and the projections and assumptions used in our current operating plan. Changes to our discount rate assumptions or our operating projections as a result of changing economic and competitive conditions could result in impairment charges. Further, if the economic market conditions worsen and our estimated future discounted cash flows decrease, we may incur additional impairment charges. Additional impairment charges related to our goodwill, tradenames or other intangible assets could have a significant impact on our financial condition and results of operations.
We completed our 2012 annual impairment testing of goodwill and indefinite-lived intangible assets as of November 3, 2012 and no impairment was recorded as the fair value of these assets was substantially in excess of book value.
Sales/Receivables
We sell our products both directly to retail customers and through wholesale channels. Merchandise sales are recognized upon transfer of ownership, including passage of title to the customer and transfer of the risk of loss related to those goods. In our wholesale and international segments, products are shipped "free on board" shipping point. In cases where the customer bears the risk of loss during shipment, we recognize revenue upon shipment. In some cases we have a policy of absorbing losses in the event of damaged and lost shipments. For these customers we recognize revenue based on the receipt date by the customer. In our retail stores transfer of title takes place at the point of sale and in respect to Consumer Direct and Fundraising when the risk of loss transfers. There are no situations, either in our wholesale or retail segments, where legal risk of loss does not transfer immediately upon receipt by our customers. Although we do not provide a contractual right of return, in the course of arriving at practical business solutions to various claims, we have allowed sales returns and allowances. In these situations, customer claims for credit or return due to damage, defect, shortage or other reason must be pre-approved by us before credit is issued or such product is accepted for return. Such returns have not precluded sales recognition because we have a long history with such returns, which we use in establishing a reserve. In our wholesale and international segments, we have included a reserve in our financial statements representing our estimated obligation related to promotional marketing activities. In addition to returns, we bear credit risk relative to our wholesale customers. We have provided a reserve for bad debts in our financial statements based on our estimates of the creditworthiness of our customers. Actual results could differ from these estimates and could affect our operating results.
Cost of Sales, Selling Expense and General and Administrative Expense
Included within cost of sales on our consolidated statements of operations are the cost of the merchandise we sell through our retail and wholesale segments, inbound and outbound freight costs, the operational costs of our distribution facilities (which include receiving costs, inspection and warehousing costs and salaries) and expenses incurred by our merchandising and buying operations.
Included within selling expenses are costs directly related to both wholesale and retail operations and primarily consist of payroll, occupancy, advertising and other operating costs, as well as pre-opening costs, which are expensed as incurred.
Included within general and administrative expenses are costs associated with corporate overhead departments, including senior management, accounting, information systems, human resources, legal, marketing, management incentive programs and bonus and other costs that are not readily allocable to either the retail or wholesale segments.
Inventory
We write down our inventory for estimated obsolescence or unmarketable inventory in an amount equal to the difference between the cost of inventory and the estimated market value, based upon assumptions about future demand and market conditions. If actual future demand or market conditions are less favorable than those projected by management, additional inventory write-downs may be required. We value our inventory at the lower of cost or market on a first-in first-out ("FIFO") basis. Fluctuations in inventory levels along with the cost of raw materials could impact the carrying value of our inventory. Changes in the carrying value of inventory could affect our operating results.
Derivative Instruments
We use interest rate swaps to eliminate the variability of a portion of cash flows associated with the forecasted interest payments on the Term Loan Facility. This is achieved through converting a portion of the floating rate Term Loan Facility to a fixed rate by entering into pay-fixed interest rate swaps.
During the second quarter of 2009, Yankee Candle changed the interest rate election on its Prior Term Facility from the three-month LIBOR rate to the one-month LIBOR rate. As a result, Yankee Candle's existing interest rate swaps were de-designated as cash flow hedges and we no longer account for these instruments using hedge accounting with changes in fair value recognized in the consolidated statement of operations. The unrealized loss included in other comprehensive income "OCI" on the date Yankee Candle changed its interest rate election was being amortized to other expense over the remaining terms of the two interest rate swap agreements. One of the swap agreements expired in March of 2010 and the other expired in March of 2011.
During the second and third quarters of 2009, Yankee Candle entered into new interest rate swap agreements to further reduce the variability of cash flows associated with the forecasted interest payments on its Prior Term Facility, which amounts were refinanced under the Term Loan Facility in April 2012. These swaps are not designated as cash flow hedges and, are measured at fair value with changes in fair value recognized in the consolidated statement of operations as a component of other income (expense).
Segment Reporting
We have segmented our operations in a manner that reflects how our chief operating decision-maker (the Chief Executive Officer) currently reviews our results and our subsidiaries' businesses. During fiscal years 2010 and earlier, we had two reportable segments—retail and wholesale. Wholesale had been an aggregation of the wholesale and international operating segments. Because of the increased importance of the international segment to the Company's operations, as evidenced by, among other things, higher sales volumes and the appointment of a full time international president, we disaggregated the international operations from the domestic wholesale operations during the first quarter of 2011 and now report three segments.
The Chief Executive Officer evaluates our retail, wholesale and international operations based on an "operating earnings" measure. Such measure gives recognition to specifically identifiable operating costs such as cost of sales and selling expenses. Costs and income not specifically identifiable are included within the unallocated/corporate/other column and include administrative charges, interest expense, fair value changes of derivative contracts, restructuring charges for continuing operations and other costs not allocated to specific operating segments and are accordingly reflected in the unallocated/corporate/other column of the Company's segment footnote. The effects of purchase accounting adjustments related to the Merger are not included in segment operations below, consistent with internal reports used by the Chief Executive Officer. These amounts are also included in the unallocated/corporate/other column. We do not account for or report assets, capital expenditures or depreciation and amortization by segment to the Chief Executive Officer. See Segments of Enterprise and Related Information footnote for additional information related to our segment reporting.
Income Taxes
We account for income taxes based on the separate return method for the consolidated group. Under this method, current and deferred tax expense or benefit for the period is determined for the Company and its subsidiaries as a separate group on a standalone basis.
We file income tax returns in the U.S. federal jurisdiction, various states, Canada, the United Kingdom, Germany and Italy. Significant judgment is required in evaluating our tax positions and determining our provision for income taxes. During the ordinary course of business there are many transactions and calculations for which the ultimate tax determination is uncertain. We establish reserves for tax-related uncertainties based on estimates of whether, and to what extent, additional taxes will be due. We adjust these reserves in light of changing facts and circumstances. The provision for income taxes includes the impact of our reserve positions and changes to those reserves when appropriate. We also recognize deferred tax liabilities and assets for the expected future tax consequences of temporary differences between the carrying amounts and the tax basis of assets and liabilities using enacted tax rates in effect in the years in which the differences are expected to reverse.
We have significant deferred tax liabilities recorded on our financial statements, which are attributable to the effect of purchase accounting adjustments recorded as a result of the Merger. We also have a deferred tax asset recorded on our financial statements. This asset arose at the time of our recapitalization in 1998 and reflects the tax benefit of future tax deductions for us from the recapitalization. The recoverability of this future tax deduction is dependent upon our future profitability. We have made an assessment that this asset is more likely than not to be recovered and is appropriately reflected on the balance sheet. Should we find that we are not able to utilize this deduction in the future we would have to record a reserve for all or a part of this asset, which would adversely affect our operating results and cash flows.
Equity-based Compensation
We account for our equity-based compensation in accordance with ASC Topic 718 "Compensation—Stock Compensation." Equity-based compensation charges of $0.8 million and $3.9 million were recorded in the accompanying consolidated statements of operations for the fifty-two weeks ended December 29, 2012 and the fifty-two weeks ended December 31, 2011, respectively. Included in the $3.9 million of equity-based compensation for the fifty-two weeks ended December 31, 2011 was a $3.0 million payment to the holders of Class B common units and Class C common units in relation to the issuance of the Senior PIK Notes. For the fifty-two weeks ended January 1, 2011, equity-based compensation charges of $1.0 million were recorded in the accompanying consolidated statements of operations.
With respect to the Class B and Class C common units, as our equity is no longer publicly traded, we base our estimate of expected volatility on the median historical volatility of a group of eight comparable public companies. The historical volatilities of the comparable companies were measured over a 5-year historical period. The expected term of the Class B and Class C common units granted represents the period of time that the units are expected to be outstanding and is assumed to be approximately 5 years based on management's estimates of the time to a liquidity event. We do not expect to pay dividends, and accordingly, the dividend yield is zero. The risk free interest rate reflects a five-year period commensurate with the expected time to a liquidity event and was based on the U.S. Treasury yield curve. We do not estimate a forfeiture rate as our unvested shares vest daily.
PERFORMANCE MEASURES
We measure the performance of our retail, wholesale and international segments through a segment margin calculation, which specifically identifies not only gross profit on the sales of products through the three channels but also costs and expenses specifically related to each segment.
Fluctuations in Quarterly Operating Results
We have experienced, and will experience in the future, fluctuations in our quarterly operating results. There are numerous factors that can contribute to these fluctuations; however, the principal factors are seasonality, new store openings and store closings and wholesale activity.
Seasonality
We have historically realized higher revenues and operating income in our fourth quarter, particularly in our retail business. This has been primarily due to increased sales in the giftware industry during the holiday season in the fourth quarter.
Retail Store Openings and Closings
The timing of our new store openings and closings may have an impact on our quarterly results. First, we incur certain initial expenses related to opening each new store. These expenses, which consist primarily of occupancy, salaries, supplies and marketing costs, are expensed as incurred. Second, most store expenses vary proportionately with sales, but there is a fixed cost component. This typically results in lower store profitability when a new store opens because new stores generally have lower sales than mature stores. Due to both of these factors, during periods when new store openings as a percentage of the base are higher, operating profit may decline in dollars and/or as a percentage of sales. As the overall store base matures, the fixed cost component of selling expenses is spread over an increased level of sales, assuming sales increase as stores age, resulting in a decrease in selling and other expenses as a percentage of sales.
Wholesale Account Activity
The timing of new wholesale accounts may have an impact on our quarterly results due to the size of initial opening orders and promotional programs associated with the roll-out of orders. In addition, the loss of wholesale accounts may impact our quarterly results.
OVERVIEW
The following tables present our results of operations for the fifty-two weeks ended December 29, 2012, December 31, 2011 and January 1, 2011:
| | | Fifty-two | | | Fifty-two | | | Fifty-two | |
| | | Weeks Ended | | | Weeks Ended | | | Weeks Ended | |
| (in thousands) | | December 29, 2012 | | | December 31, 2011 | | | January 1, 2011 | |
| YCC Holdings LLC Statements of Operations Data: | | | | | | | | | |
| Sales | | $ | 844,186 | | | $ | 785,762 | | | $ | 733,717 | |
| Cost of sales | | | 363,839 | | | | 340,336 | | | | 307,103 | |
| | | | | | | | | | | | | |
| Gross profit | | | 480,347 | | | | 445,426 | | | | 426,614 | |
| Selling expenses | | | 238,035 | | | | 234,982 | | | | 212,580 | |
| General and administrative expenses | | | 72,184 | | | | 62,451 | | | | 62,609 | |
| Restructuring charges | | | 1,725 | | | | - | | | | 829 | |
| | | | | | | | | | | | | |
| Income from operations | | | 168,403 | | | | 147,993 | | | | 150,596 | |
| Other expense, net | | | 113,450 | | | | 94,184 | | | | 84,620 | |
| | | | | | | | | | | | | |
| Income from continuing operations before provision for income taxes | | | 54,953 | | | | 53,809 | | | | 65,976 | |
| Provision for income taxes | | | 21,896 | | | | 20,040 | | | | 23,688 | |
| | | | | | | | | | | | | |
| Income from continuing operations | | | 33,057 | | | | 33,769 | | | | 42,288 | |
| Loss from discontinued operations, net of taxes | | | (134 | ) | | | (262 | ) | | | (379 | ) |
| | | | | | | | | | | | | |
| Net income | | $ | 32,923 | | | $ | 33,507 | | | $ | 41,909 | |
| | | Fifty-two | | | Fifty-two | | | Fifty-two | |
| | | Weeks Ended | | | Weeks Ended | | | Weeks Ended | |
| (in thousands) | | December 29, 2012 | | | December 31, 2011 | | | January 1, 2011 | |
| Yankee Holding Corp. Statements of Operations Data: | | | | | | | | | |
| Sales | | $ | 844,186 | | | $ | 785,762 | | | $ | 733,717 | |
| Cost of sales | | | 363,839 | | | | 340,336 | | | | 307,103 | |
| | | | | | | | | | | | | |
| Gross profit | | | 480,347 | | | | 445,426 | | | | 426,614 | |
| Selling expenses | | | 238,035 | | | | 234,982 | | | | 212,580 | |
| General and administrative expenses | | | 72,089 | | | | 62,009 | | | | 62,609 | |
| Restructuring charges | | | 1,725 | | | | - | | | | 829 | |
| | | | | | | | | | | | | |
| Income from operations | | | 168,498 | | | | 148,435 | | | | 150,596 | |
| Other expense, net | | | 78,508 | | | | 63,129 | | | | 84,620 | |
| | | | | | | | | | | | | |
| Income from continuing operations before provision for income taxes | | | 89,990 | | | | 85,306 | | | | 65,976 | |
| Provision for income taxes | | | 33,533 | | | | 30,497 | | | | 23,688 | |
| | | | | | | | | | | | | |
| Income from continuing operations | | | 56,457 | | | | 54,809 | | | | 42,288 | |
| Loss from discontinued operations, net of taxes | | | (134 | ) | | | (262 | ) | | | (379 | ) |
| | | | | | | | | | | | | |
| Net income | | $ | 56,323 | | | $ | 54,547 | | | $ | 41,909 | |
The following tables set forth the various components of our consolidated statements of operations, expressed as a percentage of sales, for the periods indicated that are used in connection with the discussion herein.
| | | Fifty-two | | | Fifty-two | | | Fifty-two | |
| | | Weeks Ended | | | Weeks Ended | | | Weeks Ended | |
| | | December 29, 2012 | | | December 31, 2011 | | | January 1, 2011 | |
| YCC Holdings LLC Statements of Operations Data: | | | | | | | | | |
| Sales: | | | | | | | | | |
| Retail | | | 58.1 | % | | | 57.2 | % | | | 58.1 | % |
| Wholesale | | | 28.2 | | | | 29.9 | | | | 31.7 | |
| International | | | 13.7 | | | | 12.9 | | | | 10.2 | |
| Total sales | | | 100.0 | | | | 100.0 | | | | 100.0 | |
| Cost of sales | | | 43.1 | | | | 43.3 | | | | 41.9 | |
| Gross profit | | | 56.9 | | | | 56.7 | | | | 58.1 | |
| Selling expenses | | | 28.2 | | | | 29.9 | | | | 29.0 | |
| General and administrative expenses | | | 8.6 | | | | 7.9 | | | | 8.5 | |
| Restructuring charges | | | 0.2 | | | | - | | | | 0.1 | |
| Operating income | | | 19.9 | | | | 18.9 | | | | 20.5 | |
| Other expense, net | | | 13.4 | | | | 12.0 | | | | 11.5 | |
| Income from continuing operations before provision for income taxes | | | 6.5 | | | | 6.9 | | | | 9.0 | |
| Provision for income taxes | | | 2.6 | | | | 2.6 | | | | 3.2 | |
| Income from continuing operations | | | 3.9 | | | | 4.3 | | | | 5.8 | |
| Loss from discontinued operations, net of taxes | | | - | | | | - | | | | (0.1 | ) |
| Net income | | | 3.9 | % | | | 4.3 | % | | | 5.7 | % |
| | | Fifty-two | | | Fifty-two | | | Fifty-two | |
| | | Weeks Ended | | | Weeks Ended | | | Weeks Ended | |
| | | December 29, 2012 | | | December 31, 2011 | | | January 1, 2011 | |
| Yankee Holding Corp. Statements of Operations Data: | | | | | | | | | |
| Sales: | | | | | | | | | |
| Retail | | | 58.1 | % | | | 57.2 | % | | | 58.1 | % |
| Wholesale | | | 28.2 | | | | 29.9 | | | | 31.7 | |
| International | | | 13.7 | | | | 12.9 | | | | 10.2 | |
| Total sales | | | 100.0 | | | | 100.0 | | | | 100.0 | |
| Cost of sales | | | 43.1 | | | | 43.3 | | | | 41.9 | |
| Gross profit | | | 56.9 | | | | 56.7 | | | | 58.1 | |
| Selling expenses | | | 28.2 | | | | 29.9 | | | | 29.0 | |
| General and administrative expenses | | | 8.5 | | | | 7.9 | | | | 8.5 | |
| Restructuring charges | | | 0.2 | | | | - | | | | 0.1 | |
| Operating income | | | 20.0 | | | | 18.9 | | | | 20.5 | |
| Other expense, net | | | 9.3 | | | | 8.0 | | | | 11.5 | |
| Income from continuing operations before provision for income taxes | | | 10.7 | | | | 10.9 | | | | 9.0 | |
| Provision for income taxes | | | 4.0 | | | | 3.9 | | | | 3.2 | |
| Income from continuing operations | | | 6.7 | | | | 7.0 | | | | 5.8 | |
| Loss from discontinued operations, net of taxes | | | - | | | | - | | | | (0.1 | ) |
| Net income | | | 6.7 | % | | | 7.0 | % | | | 5.7 | % |
EXECUTIVE SUMMARY
The following is a summary of our fifty-two weeks ended December 29, 2012 (“2012”):
| | ● | Despite the continued challenging economic environment sales increased 7.4% to $844.2 million in 2012 from $785.8 million during the fifty-two weeks ended December 31, 2011 (“2011”), driven primarily by double digit growth in our international operations and consumer direct business, new store openings and an increase in our comparable store sales. |
| | ● | Total retail sales increased 9.1% in 2012 compared to 2011 driven by an increase in Consumer Direct sales of 38.1% as compared to the prior year coupled with a 2.5% increase in our comparable store sales as compared to the prior year. In addition, during 2012 we increased our Yankee Candle retail sales base by 16 net stores, ending the year with 568 Yankee Candle retail stores located in 46 states in the United States and one province in Canada. |
| | ● | Wholesale sales increased 1.3% in 2012 compared to 2011, driven primarily by an increase in sales to our “All Other” channel, partially offset by decreased sales in our premium mass and gift store channels. We ended the year with approximately 33,700 wholesale locations, including our European operations. |
| | ● | International sales increased 14.2% in 2012 compared to 2011, despite the order management and shipping issues during the third quarter of 2012 associated with our new ERP system implementation. The increase in sales was driven primarily by growth in our United Kingdom and European wholesale business combined with increased sales in our retail concession business. |
| | ● | We ended the fourth quarter of 2012 with approximately $40.0 million of cash on hand and no borrowings on our ABL Facility. During 2012, we repaid $70.6 million of the Term Loan Facility. |
We believe at a macro level consumer spending and the general retail outlook in the near term is likely to be impacted by uncertainty over tax and fiscal matters and rising gas prices. We will certainly be prudent as we manage through any periods of consumer uncertainty, but believe that our focused investment strategy and our ongoing commitment to driving cost efficiencies and managing our working capital will leave us well positioned for further growth and momentum in 2013 and beyond.
FIFTY-TWO WEEKS ENDED DECEMBER 29, 2012 COMPARED TO FIFTY-TWO WEEKS ENDED DECEMBER 31, 2011
Sales
Sales increased 7.4% to $844.2 million in 2012 from $785.8 million in 2011.
Retail Sales
Retail sales increased 9.1% to $490.2 million for 2012 from $449.2 million for 2011.
The increase in retail sales was achieved primarily through (i) a 38.1% comparable sales growth in our consumer direct business resulting in approximately $14.6 million in increased sales, (ii) the addition of 26 new Yankee Candle retail stores opened in 2012 which increased sales by approximately $10.4 million, (iii) increased comparable store sales of approximately $9.1 million, (iv) increased sales attributable to stores opened in 2011 that have not entered the comparable store base (which in 2011 were open for less than a full year) of approximately $3.5 million, and (v) increased sales in our fundraising business of approximately $3.4 million.
Comparable sales for our Retail business, including Consumer Direct, increased 5.9% for 2012 compared to 2011. Yankee Candle comparable store sales for 2012 increased 2.5% compared to 2011. Comparable store sales represent a comparison of sales during the corresponding fiscal periods on stores in our comparable stores sales base. A store first enters our comparable store sales base in the fourteenth fiscal month of operation. Permanently closed stores are excluded from the comparable store calculation beginning in the month in which the store closes. The increase in comparable store sales was driven by an increase in the average ticket price of 6.1% offset by a decrease in transactions of 3.6%. There were 542 stores included in the Yankee Candle comparable store base as of December 29, 2012 as compared to 512 stores included in the Yankee Candle comparable store base as of December 31, 2011. There were 568 total retail stores open as of December 29, 2012, compared to 552 total retail stores open as of December 31, 2011.
Wholesale Sales
Wholesale sales increased 1.3% to $238.3 million for 2012 from $235.2 million for 2011.
The increase in wholesale sales was primarily due to (i) increased sales in our “all other” channel of approximately $13.5 million and (ii) increased sales in our specialty and department store channel of approximately $0.2 million, partially offset by (i) decreased sales in our gift store account channel of approximately $2.7 million and (ii) decreased sales to our premium mass channel of approximately $7.9 million.
International Sales
International sales increased 14.2% to $115.7 million for 2012 from $101.3 million for 2011, delivering strong year over year results despite order management and shipping issues and delays during the third quarter of 2012 associated with the implementation of our new ERP system.
The increase in international sales was primarily due to (i) increased sales in our United Kingdom wholesale business of $7.1 million, (ii) increased sales in our retail concession channel of $2.9 million, (iii) an increase in our international distributor channels of $2.7 million, and (iv) increased sales in our European wholesale business (outside of the United Kingdom) of $2.0 million. These increases in our international sales were partially offset by a decrease of $0.3 million due to the effect of changes in foreign currency exchange rates, primarily the British Pound.
Gross Profit
Gross profit is sales less cost of sales. Included within cost of sales are the cost of the merchandise we sell through our retail and wholesale segments, inbound and outbound freight costs, the operational costs of our distribution facilities, which include receiving costs, inspection and warehousing costs, and salaries and expenses incurred by Yankee Candle's buying and merchandising operations.
Gross profit increased 7.8% to $480.3 million in 2012 from $445.4 million in 2011. As a percentage of sales, gross profit increased to 56.9% in 2012 from 56.7% in 2011. Included in the calculation of gross profit for fiscal 2012 and 2011 are purchase accounting costs of $1.4 million and $0.5 million, respectively. These costs were not allocated to our segments.
Retail Gross Profit
Retail gross profit increased 9.3% to $320.5 million for 2012 from $293.1 million for 2011. The increase in gross profit was primarily due to (i) price increases taken during the first quarter of 2012, which assuming no elasticity contributed $21.3 million, (ii) increased sales volume contributed approximately $20.9 million, (iii) sales volume increases from our Yankee Candle fundraising division which contributed additional gross profit of approximately $2.1 million and (iv) decreased costs in our supply chain operations of approximately $0.2 million. These retail gross profit increases were partially offset by increased promotional and marketing activity of approximately $15.4 million, coupled with unfavorable product mix of approximately $1.7 million.
As a percentage of retail sales, retail gross profit increased to 65.4% for 2012 from 65.2% for 2011. The increase in gross profit rate consisted of price increases taken during the first quarter of 2012, which assuming no elasticity increased gross profit by approximately 1.6% coupled with decreased costs in our supply chain operations resulting in an increase in gross profit rate of 0.1%. These increases in gross profit rate were offset by increased promotional activity which decreased gross profit by approximately 1.1% and unfavorable product mix which also decreased gross profit rate by approximately 0.4%.
Wholesale Gross Profit
Wholesale gross profit increased 2.9% to $113.3 million for 2012 from $110.1 million for 2011. The increase in wholesale gross profit was primarily attributable to price increases taken during the first quarter of 2012, which assuming no elasticity increased gross profit by approximately $11.6 million, coupled with decreased costs in our supply chain operations of approximately $3.2 million. These increases were partially offset by (i) unfavorable product cost related to shift in channel mix of approximately $5.7 million, (ii) increased promotional and marketing activity of approximately $3.5 million and (iii) decreased sales volume, which decreased gross profit by approximately $2.3 million.
As a percentage of sales, wholesale gross profit increased slightly to 47.6% for 2012 from 46.8% for 2011. The increase in gross profit rate was primarily attributable to (i) price increases taken during the first quarter of 2012, which assuming no elasticity contributed approximately 2.7% and (ii) decreased costs in our supply chain operations which increased gross profit rate by approximately 1.3%. These increases were partially offset by unfavorable product cost mix of 2.5% coupled with promotional and marketing activity which decreased gross profit rate by 0.8%.
International Gross Profit
International gross profit increased 12.1% to $48.0 million for 2012 from $42.8 million for 2011. The increase in international gross profit was primarily attributable to increased sales volume of $8.4 million and favorable product cost and channel mix of $3.4 million. These increases in gross profit were partially offset by (i) increased allowances and promotional activity which decreased gross profit by approximately $5.1 million, (ii) increased supply chain operations costs, which decreased gross profit by approximately $1.3 million, that were primarily related to additional labor and processing costs to address shipping issues associated with the implementation of the new ERP system for YCE, in addition to a (iii) decrease of $0.2 million due to the effect of changes in foreign currency exchange rates, primarily the British Pound.
As a percentage of international sales, international gross profit decreased to 41.5% for 2012 from 42.3% for 2011.
The decrease in gross profit rate was primarily attributable to increased allowances and promotional activity which decreased gross profit rate by 2.5% coupled with increased supply chain operations costs of 1.2%. These decreases were partially offset by a favorable product and channel mix of approximately 2.9% largely attributable to increased sales within our retail concessions channel, which has the highest margins within our international business.
Selling Expenses
Selling expenses increased 1.3% to $238.0 million for 2012 as compared to $235.0 million for 2011. These expenses are related to both wholesale and retail operations and consist of payroll, occupancy, advertising and other operating costs, as well as pre-opening costs, which are expensed as incurred. As a percentage of sales, selling expenses were 28.2% and 29.9% for 2012 and 2011, respectively. Included in selling expenses for fiscal 2012 and 2011 are purchase accounting costs of $2.9 million and $13.7 million respectively, consisting primarily of the amortization of intangible assets. These costs were not allocated to our segments.
Retail Selling Expenses
Retail selling expenses increased 4.3% to $192.9 million for 2012 as compared to $185.0 million for 2011. These expenses relate to payroll, occupancy, advertising and other store operating costs, as well as pre-opening costs, which are expensed as incurred. This increase in retail selling expenses was primarily related to expenses incurred in new Yankee Candle retail stores opened in 2012 and 2011, which together accounted for approximately $9.4 million. This increase was partially offset by (i) decreases in marketing related spend of approximately $0.5 million, (ii) decreased occupancy expenses of $0.4 million, (iii) decreased supplies expenses of $0.3 million and (iv) decreases in other selling expenses.
As a percentage of retail sales, retail selling expenses were 39.4% and 41.2% for 2012 and 2011, respectively. The decrease in selling expense rate was primarily due to the leveraging of selling expenses by 0.7% as a result of increased comparable store sales, coupled with the decrease in labor, occupancy and other costs of approximately 1.4% as a result of increased sales volume in our consumer direct business and at retail stores. These decreases were partially offset by increases from new Yankee Candle retail stores opened in 2012 and 2011, which together negatively impacted selling expense by approximately 0.5%. New stores typically generate higher selling expenses as a percentage of sales than mature stores since fixed costs, as a percent of sales, are higher in the early period of a store’s operation.
Wholesale Selling Expenses
Wholesale selling expenses decreased 3.8% to $12.8 million for 2012 as compared to $13.3 million for 2011. These expenses relate to payroll, advertising and other operating costs. As a percentage of wholesale sales, wholesale selling expenses were 5.4% and 5.6% for 2012 and 2011, respectively. The decrease in selling expenses and as a percentage of sales was primarily attributable to decreased marketing and labor costs year over year, partially offset by increased commissions expense for the gift and premium mass channels.
International Selling Expenses
International selling expenses increased 28.4% to $29.4 million for 2012 from $22.9 million for 2011. As a percentage of international sales, international selling expenses were 25.4% and 22.6% for 2012 and 2011, respectively. The increase in selling expenses was primarily related to (i) increased commissions and labor expenses of $2.8 million, (ii) the write-off of a portion of a receivables balance from one of our wholesale accounts that went into receivership of approximately $1.2 million and other operating costs of approximately $2.5 million related to the increased sales volume in this business. The increase in selling expenses as a percentage of sales was primarily related to the write-off mentioned above which had a negative impact of approximately 1.1%, increased commissions and labor costs of approximately 0.7% related to the revenue growth in the business and increases in other selling expenses of approximately 1.0%.
General and Administrative Expenses
General and administrative expenses, which are shown in the unallocated/corporate/other column of the Company's segment footnote, consist primarily of personnel-related costs including senior management, accounting, information systems, human resources, legal, marketing, management incentive programs and bonus and other costs that are not readily allocable to either the retail or wholesale operations.
YCC Holdings’ general and administrative expenses were $72.2 million and $62.5 million for 2012 and 2011, respectively. As a percentage of sales, general and administrative expenses were 8.6% and 7.9% for 2012 and 2011, respectively. The general and administrative expenses of $62.5 million for 2011 includes the $3.0 million paid to Class B and Class C common unit holders in February 2011 in connection with the issuance of the Senior PIK Notes. Excluding such expenses, general and administrative costs increased by $12.7 million in 2012 over the prior year driven largely by (i) increased incentive program expenses of $6.9 million driven by positive performance to plans, (ii) increased consulting and advertising expenses of $2.1 million, (iii) increased medical costs of $1.7 million, (iv) increased labor expenses of $1.7 million and (v) additional operating expenses driven by increased sales over prior year of $0.3 million.
Holding Corp.’s general and administrative expenses were $72.1 million and $62.0 million for 2012 and 2011, respectively. As a percentage of sales, general and administrative expenses were 8.5% and 7.9% for 2012 and 2011, respectively. The general and administrative expenses of $62.0 million for 2011 includes the $3.0 million paid to Class B and Class C common unit holders in February 2011 in connection with the issuance of the Senior PIK Notes. Excluding such expenses, general and administrative costs increased by $13.1 million in 2012 over the prior year driven by (i) increased incentive program expenses of $6.9 million driven by positive performance to plans, (ii) increased consulting and advertising expenses of $2.1 million, (iii) increased medical costs of $1.7 million, (iv) increased labor expenses of $1.7 million and (v) additional operating expenses driven by increased sales over prior year of $0.7 million.
Restructuring Charges
During the first quarter of 2012, the Company restructured its Wholesale and Retail operations. The Company also initiated a change in reporting structure and changes of roles and responsibilities within the organization that resulted in workforce reductions. These changes included changes to the executive committee, changes to the reporting structure and operational focus within the retail segment, alignment of the brand innovation and merchandising teams across all channels of the business, and other administrative changes. In addition, during the second quarter of 2012, YCE relocated its corporate headquarters and distribution center in England. The Company incurred restructuring charges of $1.7 million during 2012 related to these activities.
During 2008 and 2009, the Company initiated restructuring plans related to its Aroma Naturals and Illuminations businesses and certain corporate workforce restructuring activities. During 2010, the Company initiated a restructuring plan primarily related to the elimination of a facility and certain employee positions as a result of the restructuring of the Company’s shipping and warehousing activities.
The Company made payments of $1.1 million, $0.2 million and $2.7 million during 2012, 2011 and 2010, respectively related to these restructuring activities. As of December 29, 2012, the balance of $1.5 million in the restructuring accrual was related to (i) continuing operations employee related expenses of $0.1 million as a result of the first quarter of 2012 organization changes detailed above, (ii) continuing operations occupancy related expenses of $0.7 million related to YCE exiting the old facility prior to the termination of the lease agreement and (iii) discontinued operations of $0.7 million primarily related to lease agreements for one Illuminations retail store and a lease related the former Illuminations corporate headquarters in Petaluma, California. The lease at the old YCE facility expires in May of 2014, the lease for the Illuminations retail store expires in January 2017 and the lease for the property in Petaluma California expires in March 2013. These leases will continue to be paid through their lease termination dates unless the Company is able to structure buyout agreements with the landlords or find replacement tenants.
Interest and Other (Income) Expense, Net
YCC Holdings’ interest and other (income) expense, net, which is shown in YCC Holdings’ unallocated/corporate/other column of YCC Holdings’ segment footnotes was $113.5 million for 2012 compared to $94.2 million for 2011. The primary component of this expense is interest expense, which was $106.9 million and $101.6 million for 2012 and 2011, respectively. During 2012, in connection with the refinancing of our Senior Secured Credit Facility we recorded a loss on extinguishment of debt of $13.4 million comprised of the write-off of unamortized deferred financing fees of $6.7 million and call premiums of $6.7 million. The $13.4 million loss on extinguishment of debt is also included in interest and other expense, net, in the segment footnote.
The increase in interest expense primarily relates to additional interest expense of $3.3 million of related to the Senior PIK Notes which were outstanding for the full fifty-two weeks ended December 29, 2012.
Holding Corp.’s interest and other expense, net, which is shown in Holding Corp.’s unallocated/corporate/other column of Holding Corp.’s segment footnote was $78.5 million for 2012 compared to $63.1 million for 2011. The primary component of this expense is interest expense, which was $71.9 million and $70.5 million for 2012 and 2011 respectively. During 2012, in connection with the refinancing of our senior secured credit facility (“Senior Secured Credit Facility”) we recorded a loss on extinguishment of debt of $13.4 million comprised of the write-off of unamortized deferred financing fees of $6.7 million and call premiums of $6.7 million. The $13.4 million loss on extinguishment of debt is also included in interest and other expense, net, in the segment footnote.
Changes in the fair value of our derivative contracts are recognized in the consolidated statement of operations. During 2012 and 2011 we recognized a gain of $7.7 million and $6.4 million, respectively, related to derivative contracts.
Provision for Income Taxes
The provision for income taxes for YCC Holdings for 2012 and 2011, was $21.9 million and $20.0 million, respectively. The effective tax rates for 2012 and 2011 were 39.8% and 37.2%, respectively.
The increase in the YCC Holdings effective tax rate for 2012 compared to 2011 is primarily attributable to a valuation allowance against net operating loss carryforwards in Germany, interest and penalties accrued on our uncertain tax positions, a reduced benefit of the foreign tax rate differential and lower income tax credits.
The provision for income taxes for Holding Corp. for 2012 was $33.5 million compared to $30.5 million for 2011. The effective tax rates for 2012 and 2011 were 37.3% and 35.8%, respectively.
The increase in the Holding Corp. effective tax rate for 2012 compared to 2011 is primarily attributable to a recording a valuation allowance against net operating loss carryforwards in Germany, interest and penalties accrued on our uncertain tax positions, a reduced benefit of the foreign tax rate differential and lower income tax credits.
Loss from Discontinued Operations, Net of Tax
The discontinued operations of both the Illuminations and Aroma Naturals businesses are as follows:
| | | Fifty-two | | | Fifty-two | | | Fifty-two | |
| | | Weeks Ended | | | Weeks Ended | | | Weeks Ended | |
| | | December 29, 2012 | | | December 31, 2011 | | | January 1, 2011 | |
| Sales | | $ | - | | | $ | - | | | $ | - | |
| Loss from discontinued operations | | $ | (214 | ) | | $ | (417 | ) | | $ | (615 | ) |
| Benefit from income taxes | | | (80 | ) | | | (155 | ) | | | (236 | ) |
| Loss from discontinued operations, net of income taxes | | $ | (134 | ) | | $ | (262 | ) | | $ | (379 | ) |
FIFTY-TWO WEEKS ENDED DECEMBER 31, 2011 (“2011”) COMPARED TO FIFTY-TWO WEEKS ENDED JANUARY 1, 2011 (“2010”)
Sales
Sales increased 7.1% to $785.8 million in 2011 from $733.7 million in 2010.
Retail Sales
Retail sales increased 5.4% to $449.2 million for 2011 from $426.3 million for 2010.
The increase in retail sales was achieved primarily through (i) the addition of 40 new Yankee Candle retail stores opened in 2011, which increased sales by approximately $11.0 million, (ii) a 20.8% comparable sales growth in our consumer direct business resulting in approximately $6.6 million in increased sales, (iii) increased sales attributable to stores opened in 2010 that have not entered the comparable store base (which in 2010 were open for less than a full year) of approximately $3.4 million and (iv) increased sales in our fundraising business of approximately $1.9 million.
Our comparable store sales for 2011 were flat to the prior year. Total comparable retail store sales including our consumer direct business increased approximately 1.7% in 2011 compared to 2010. Retail comparable store sales represent a comparison of sales during the corresponding fiscal periods for stores in our comparable stores sales base. A store first enters our comparable store sales base in the fourteenth fiscal month of operation. Permanently closed stores are excluded from the comparable store calculation beginning in the month in which the store closes. Our comparable store sales experienced a decrease in traffic of approximately 2.4%, however that was fully offset by in increase in average ticket of 2.4% over the prior year. There were 512 stores in the Yankee Candle comparable store base as of December 31, 2011 as compared to 489 stores included in the Yankee Candle comparable store base as of January 1, 2011. There were 552 total retail stores open as of December 31, 2011, compared to 515 total retail stores open as of January 1, 2011.
Wholesale Sales
Wholesale sales increased 1.2% to $235.2 million for 2011 from $232.5 million for 2010.
The increase in wholesale sales was primarily due to increased sales to the premium mass and specialty/department store channels of approximately $14.6 million, partially offset by (i) decreased sales in our gift store account channel of $8.2 million, (ii) decreased sales in our co-packaging and licensing activities of approximately $2.8 million and (iii) decreased sales in other wholesale channels of approximately $0.9 million.
International Sales
International sales increased 35.4% to $101.3 million for 2011 from $74.8 million for 2010.
The increase in international sales was primarily due to (i) increased sales in our United Kingdom wholesale business of $11.2 million driven primarily by new locations opened in the last 12 months and increased volume to existing customers, (ii) increased sales in our concession channel of $6.6 million, (iii) increased sales in our export direct channel of $4.1 million and (iv) an increase of $2.9 million due to the effect of changes in foreign currency exchange rates, primarily the British Pound.
Gross Profit
Gross profit is sales less cost of sales. Included within cost of sales are the cost of the merchandise we sell through our retail and wholesale segments, inbound and outbound freight costs, the operational costs of our distribution facilities, which include receiving costs, inspection and warehousing costs, and salaries and expenses incurred by Yankee Candle's buying and merchandising operations.
Gross profit increased 4.4% to $445.4 million in 2011 from $426.6 million in 2010. As a percentage of sales, gross profit decreased to 56.7% in 2011 from 58.1% in 2010. Included in the calculation of gross profit for fiscal 2011 and 2010 were purchase accounting costs of $0.5 million and $0.3 million, respectively. These costs were not allocated to our segments.
Retail Gross Profit
Retail gross profit increased 4.3% to $293.1 million for 2011 from $281.0 million for 2010. The increase in gross profit was primarily attributed to (i) sales volume increases in our retail operations, which contributed approximately $16.5 million, (ii) price increases taken during the second quarter of 2011, which assuming no elasticity contributed approximately $7.1 million, (iii) sales volume increases from our Yankee Candle fundraising division which contributed additional gross profit of approximately $0.8 million, and (iv) favorable product mix of approximately $0.7 million, partially offset by (i) increased promotional activity of approximately $10.7 million and (ii) increased costs in our supply chain operations of approximately $2.3 million driven largely by inflation in wax and transportation costs.
As a percentage of retail sales, retail gross profit decreased to 65.2% for 2011 from 65.9% for 2010. The decrease in retail gross profit rate was primarily the result of (i) increased promotional activity of approximately 0.8%, (ii) decreased profitability in our Yankee Candle fundraising division of approximately 0.1%, and (iii) increased costs in our supply chain operations of approximately 0.5%, partially offset by price increases taken during the second quarter of 2011, which assuming no elasticity increased gross profit by approximately 0.5% and favorable product mix of approximately 0.2%.
Wholesale Gross Profit
Wholesale gross profit decreased 5.1% to $110.1 million for 2011 from $116.0 million for 2010. The decrease in gross profit was primarily attributable to (i) increased costs in our supply chain operations of approximately $4.5 million driven largely by inflation in wax and transportation costs, (ii) unfavorable product mix of approximately $3.6 million driven largely by a shift in sales mix to our premium mass customers, (iii) increased promotional activity of approximately $3.5 million, and (iv) decreased sales volume in our co-packaging and licensing activities producing unfavorable margin dollars of approximately $0.4 million, partially offset by (i) price increases taken during the second quarter of 2011, which assuming no elasticity contributed approximately $3.8 million and (ii) sales volume increases within our wholesale operations which contributed approximately $2.3 million.
As a percentage of wholesale sales, wholesale gross profit decreased to 46.8% for 2011 from 49.9% for 2010. The decrease in wholesale gross profit rate was primarily the result of (i) increased costs in our supply chain operations of approximately 1.9%, (ii) unfavorable product mix of approximately 1.7% driven largely by a shift in sales mix to our premium mass customers, and (iii) increased promotional activity of approximately 0.8%, partially offset by (i) price increases taken during the second quarter of 2011, which assuming no elasticity contributed approximately 0.9% and (ii) decreased sales volume within our co-packaging and licensing activities, which has a lower profit margin, and which has become a smaller portion of the wholesale business resulting in favorable margin rate of approximately 0.4% relative to the prior year.
International Gross Profit
International gross profit increased 42.9% to $42.8 million for 2011 from $30.0 million for 2010. The increase in international gross profit was primarily attributable to (i) increased sales volume of $10.2 million, (ii) favorable product cost and channel mix of $3.9 million and (iii) an increase of $1.2 million due to the effect of changes in foreign currency exchange rates, primarily the British Pound. These increases in gross profit were partially offset by increased allowances and promotional activity which decreased gross profit by approximately $2.0 million and increased costs in our supply chain operations of approximately $0.5 million driven largely by inflation in transportation costs.
As a percentage of international sales, international gross profit increased to 42.3% for 2011 from 40.0% for 2010. The increase in gross profit rate was primarily attributable to favorable product and channel mix of approximately 3.8% driven primarily by increased sales within our concessions channel and increased sales of our candle products, which both have higher margins, partially offset by increased allowances and promotional activity which decreased gross profit rate by 1.1% and increased costs in our supply chain operations of 0.5% driven largely by inflation in transportation costs.
Selling Expenses
Selling expenses increased 10.5% to $235.0 million for 2011 as compared to $212.6 million for 2010. These expenses are related to both wholesale and retail operations and consist of payroll, occupancy, advertising and other operating costs, as well as pre-opening costs, which are expensed as incurred. As a percentage of sales, selling expenses were 29.9% and 29.0% for 2011 and 2010, respectively. Included in selling expenses for fiscal 2011 and 2010 are purchase accounting costs of $13.7 million and $14.2 million respectively, consisting primarily of the amortization of intangible assets. These costs were not allocated to our segments.
Retail Selling Expenses
Retail selling expenses increased 8.8% to $185.0 million for 2011 as compared to $170.0 million for the 2010. These expenses relate to payroll, occupancy, advertising and other store operating costs, as well as pre-opening costs, which are expensed as incurred. As a percentage of retail sales, retail selling expenses were 41.2% and 39.9% for 2011 and 2010, respectively. This increase in retail selling expenses was primarily related to expenses incurred in new Yankee Candle retail stores opened in 2011 and 2010, which together contributed approximately $8.9 million, increases in marketing related spend of approximately $3.8 million, increases in commissions related to the sales growth in our Yankee Candle fundraising division of approximately $0.5 million and other incremental selling costs as a result of increased sales volume.
The increase in selling expenses as a percentage of sales was primarily due to increases in marketing related expenses, which negatively impacted selling expense by approximately 0.8%, and increases from new Yankee Candle retail stores opened in 2011 and 2010, which together negatively impacted selling expense by approximately 0.6%. New stores typically generate higher selling expenses as a percentage of sales than mature stores since fixed costs, as a percent of sales, are higher in the early period of a store’s operation.
Wholesale Selling Expenses
Wholesale selling expenses increased 10.8% to $13.3 million for 2011 as compared to $12.0 million for 2010. These expenses relate to payroll, advertising and other operating costs. As a percentage of wholesale sales, wholesale selling expenses were 5.6% and 5.2% for 2011 and 2010, respectively.
The increase in selling expenses in dollars and as a percentage of sales in our wholesale business was driven primarily by increased marketing costs and other related selling expenses related to the increased sales volume.
International Selling Expenses
International selling expenses increased 40.2% to $22.9 million for 2011 as compared to $16.4 million for 2010. These expenses relate to payroll, commissions, advertising and other operating costs. As a percentage of international sales, international selling expenses were 22.6% for 2011 and 21.9% for 2010.
The increase in selling expenses in dollars was primarily attributable to increased commissions, labor and other related selling expenses of approximately $5.8 million driven by the revenue growth in that business as well as an increase of $0.7 million due to the effect of changes in foreign currency exchange rates, primarily the British Pound.
The increase in selling expenses as a percentage of sales was primarily driven by increased commissions of approximately 0.7% driven by the revenue growth in our concessions channel.
General and Administrative Expenses
General and administrative expenses, which are shown in the unallocated/corporate/other column of the Company's segment footnote, consist primarily of personnel-related costs including senior management, accounting, information systems, human resources, legal, marketing, management incentive programs and bonus and other costs that are not readily allocable to either the retail or wholesale operations.
YCC Holdings’ general and administrative expenses were $62.5 million and $62.6 million for 2011 and 2010, respectively. As a percentage of sales, general and administrative expenses were 7.9% and 8.5% for 2011 and 2010, respectively.
Holding Corp.’s general and administrative expenses were $62.0 million and $62.6 million for 2011 and 2010, respectively. As a percentage of sales, general and administrative expenses were 7.9% and 8.5% for 2011 and 2010, respectively.
The decrease in general and administrative expense as a percentage of sales resulted primarily by holding general and administrative expenses for both YCC Holdings and Holding Corp. relatively flat to the prior year as compared to a 7.1% increase in revenue.
Restructuring Charges
During 2008 and 2009, the Company initiated restructuring plans related to its Aroma Naturals and Illuminations businesses and certain corporate workforce restructuring activities. During 2010, the Company initiated a restructuring plan primarily related to the elimination of a facility and certain employee positions as a result of the restructuring of the Company’s shipping and warehousing activities.
The Company incurred restructuring charges of $1.2 million during 2010. The Company made payments of $0.2 million and $2.7 million during 2011 and 2010, respectively. As of December 31, 2001, the balance in the restructuring accrual of $0.9 million was primarily related to lease agreements for one Illuminations retail store and a lease related the former Illuminations corporate headquarters in Petaluma, California. The lease for the Illuminations retail store expires in January 2017 and the lease for the property in Petaluma California expires in March 2013.
Interest and Other (Income) Expense, Net
YCC Holdings’ interest and other (income) expense, net, which is shown in YCC Holdings’ unallocated/corporate/other column of YCC Holdings’ segment footnotes was $94.2 million for 2011 compared to $84.6 million for 2010. The primary component of this expense is interest expense, which was $101.6 million and $75.6 million for 2011 and 2010, respectively. The increase in interest expense primarily relates to $31.1 million of interest expense related to the Senior PIK Notes, partially offset by a decrease in interest expense of $5.1 million related to lower average borrowings relative to 2010 and a lower average notional amount of our pay fixed interest rate swaps.
Changes in the fair value of our derivative contracts are recognized in the consolidated statement of operations. During 2011 we recognized a gain of $6.4 million related to derivative contracts. During 2010 we recognized $9.0 million in expense related to derivative contracts.
Holding Corp.’s interest and other (income) expense, net, which is shown in Holding Corp.’s unallocated/corporate/other column of Holding Corp.’s segment footnote was $63.1 million for 2011 compared to $84.6 million for 2010. The primary component of this expense is interest expense, which was $70.5 million and $75.6 million for 2011 and 2010, respectively. The decrease in interest expense primarily relates to a decrease in interest expense of $5.1 million related to lower average borrowings relative to 2010 and a lower average notional amount of our pay fixed interest rate swaps.
Changes in the fair value of our derivative contracts are recognized in the consolidated statement of operations. During 2011 we recognized a gain of $6.4 million related to derivative contracts. During 2010 we recognized $9.0 million in expense related to derivative contracts.
Provision for Income Taxes
The provision for income taxes for YCC Holdings for 2011 and 2010, was $20.0 million and $23.7 million, respectively. The effective tax rates 2011 and 2010 were 37.2% and 35.9%, respectively.
The increase in the YCC Holdings effective tax rate for 2011 compared 2010 is primarily attributable to a reduction in the manufacturing deduction.
The provision for income taxes for Holding Corp. for 2011 was $30.5 million compared to $23.7 million for 2010. The effective tax rates for 2011 and 2010 were 35.8% and 35.9%, respectively.
Loss from Discontinued Operations, Net of Tax
The discontinued operations of both the Illuminations and Aroma Naturals businesses are as follows:
| | | Fifty-two Weeks Ended December 31, 2011 | | | Fifty-two Weeks Ended January 1, 2011 | |
| Sales | | $ | - | | | $ | - | |
| Loss from discontinued operations | | $ | (417 | ) | | $ | (615 | ) |
| Benefit from income taxes | | | (155 | ) | | | (236 | ) |
| Loss from discontinued operations, net of income taxes | | $ | (262 | ) | | $ | (379 | ) |
Liquidity and Capital Resources
Senior Secured Credit Facility
As of December 31, 2011, the “Senior Secured Credit Facility consisted of a $650.0 million Prior Term Facility with outstanding borrowings of $388.1 million and a Prior Revolving Facility of $140.0 million with no outstanding borrowings.
Refinancing of the Senior Secured Credit Facility and Repurchase of $315 million of Yankee Candle’s 8 ½% Senior Notes Due 2015
On April 2, 2012, Yankee Candle refinanced its old Senior Secured Credit Facility and $315.0 million of its Senior Notes due 2015 by entering into a senior secured term loan facility (the “Term Loan Facility”) and by entering into a senior secured asset-based credit facility (the “ABL Facility”).
Under the Term Loan Facility, Yankee Candle borrowed $725.0 million resulting in proceeds of $717.8 million, net of original issue discount. At closing, on April 2, 2012, a portion of the proceeds from the Term Loan Facility were used to (i) redeem $180.0 million of Yankee Candle’s Senior Notes due 2015 at a call premium of 2.125%, (ii) repay $403.1 million of outstanding debt on the Company’s old Senior Secured Credit Facility (consisting of $388.1 million outstanding under the Prior Term Facility and $15.0 outstanding under the Prior Revolving Facility), and (iii) pay fees and expenses of $11.5 million related to the foregoing. On April 13, 2012, the Company used the remaining proceeds and borrowings under the ABL Facility to redeem an additional $135.0 million of the Senior Notes due 2015 at a call premium of 2.125%. As a result of the refinancing the Company recorded a loss on extinguishment of debt of $13.4 million comprised of the write-off of unamortized deferred financing fees of $6.7 million and call premiums of $6.7 million. The Company also recorded total deferred financing costs of $11.6 million, $9.0 million related to the Term Loan Facility and $2.6 million related to the ABL Facility. The costs associated with the Term Loan Facility are being amortized using the interest method through the expiration date of the Term Loan Facility and the costs associated with the ABL Facility are being amortized on a straight line basis through the expiration date of the ABL Facility.
Term Loan Facility
The Term Loan Facility will mature on April 2, 2019; however, the maturity date of the Term Loan Facility will accelerate if the Senior Subordinated Notes and the Senior PIK Notes are not defeased, repurchased, refinanced or redeemed 91 days prior to their respective maturity dates. The Term Loan Facility is repayable in quarterly principal payments of $1.8 million with the balance due at maturity. However, in December 2012 the Company made a principal payment of $67.0 million, a portion of which was related to the excess cash flow provisions of the Term Loan Facility, as discussed below. As a result of the $67.0 million payment, no quarterly principal payments are due on the Term Loan Facility through its maturity and no amounts are classified as current in the accompanying consolidated balance sheet.
Interest is payable on the Term Loan Facility at either (i) the Eurodollar Rate (subject to a 1.25% floor) plus 4.00% or (ii) the ABR (subject to a 2.25% floor) plus 3.00%. The default rate of interest will accrue (i) on the overdue principal amount of any loan at a rate of 2% in excess of the rate otherwise applicable to such loan and (ii) on any overdue interest or any other outstanding overdue amount at a rate of 2% in excess of the non-default interest rate then applicable to ABR loans. As of December 29, 2012, the interest rate applicable to the Term Loan Facility was 5.25%.
The Term Loan Facility contains a financial covenant which requires that Yankee Candle maintain at the end of each fiscal quarter, commencing with the quarter ended December 29, 2012 through the quarter ending September 28, 2013, a consolidated net debt (net of cash and cash equivalents not to exceed $75.0 million) to Consolidated EBITDA ratio of no more than 7.00 to 1.00. As of December 29, 2012, Yankee Candle's actual net total leverage ratio was 4.06 to 1.00, as defined in the Term Loan Facility. As of December 29, 2012, total debt (including Yankee Candle's capital lease obligations of $5.4 million and net of $40.0 million in cash) was approximately $817.8 million. Under Yankee Candle's Term Loan Facility, Consolidated EBITDA is defined as net income plus, interest, taxes, depreciation and amortization, further adjusted to add back extraordinary, unusual or non-recurring losses, non-cash stock option expense, fees and expenses related to the Merger, fees and expenses under the Management Agreement with our equity sponsor, restructuring charges or reserves, as well as other non-cash charges, expenses or losses, and further adjusted to subtract extraordinary, unusual or non-recurring gains, other non-cash income or gains, and certain cash contributions to our common equity.
Set forth below is a reconciliation of Yankee Candle’s Consolidated EBITDA, as calculated under Yankee Candle's Term Loan Facility, to EBITDA and net income for the four quarters ended December 29, 2012 (in thousands):
| Net income | | $ | 56,323 | |
| Income tax provision | | | 33,533 | |
| Interest expense, net (excluding amortization of deferred financing fees) | | | 59,700 | |
| Depreciation and amortization | | | 31,897 | |
| EBITDA | | | 181,453 | |
| Share-based compensation expense | | | 753 | |
| Restructuring charges | | | 1,725 | |
| Fees paid pursuant to the Management Agreement | | | 1,500 | |
| Other non-cash expense | | | 16,055 | |
| Consolidated Adjusted EBITDA under the Credit Facility | | $ | 201,486 | |
Under the Term Loan Facility, Yankee Candle is permitted to make dividends to YCC Holdings provided there is no event of default and the dividend payment would not cause the consolidated net interest coverage ratio (as defined in the Term Loan agreement) to be less than 2.0 to 1.0, in an amount equal to the sum of (a) $10.0 million and (b) the available excess cash flow based on provisions determined in Yankee Candle’s Term Loan Facility, together with certain equity and debt issuances which, to date, have not occurred and together with the receipt of certain cash and cash equivalents and certain investments. Available excess cash flow for Yankee Candle’s Term Loan Facility is defined as the aggregate cumulative amount of excess cash flow for all fiscal years commencing with the fiscal year ending December 29, 2012 and for all fiscal years ending after December 29, 2012 that is not required to prepay the term debt. On an annual basis, Yankee Candle is required to prepay the term debt by 50% of excess cash flow, which percentage is reduced to 25% if the consolidated net total leverage ratio (as defined in the Term Loan agreement) is not greater than 4.0 to 1.0. Yankee Candle is not required to make a payment if the consolidated net total leverage ratio is not greater than 3.0 to 1.0. Excess cash flow is defined in the Term Loan agreement as consolidated net income of Holding Corp. and its restricted subsidiaries plus all non-cash charges (including depreciation, amortization, and deferred tax expense), non-cash losses on disposition of certain property, decreases in working capital and the net increase in deferred tax liabilities or net decrease in deferred tax assets, decreased by non-cash gains including gains or credits, cash paid for capital expenditures, acquisitions, certain other investments, regularly scheduled principal payments, voluntary prepayments and certain mandatory prepayments of principal on debt, transaction costs for certain debt, equity, recapitalization, acquisition and investment transactions, purchase price adjustments in connection with acquisitions and certain payments to the Company’s equity sponsor, increases in working capital and the net decrease in deferred tax liabilities or net increase in deferred tax assets, call premiums in connection with cancellation of indebtedness, and certain amounts paid in connection with an asset sale or recovery event.
Additionally, as of April 2, 2012, a basket of $137.1 million consisting of the cumulative retained (and not yet applied) available excess amount from the former Senior Secured Credit Facility was available for dividends from Yankee Candle to YCC Holdings to be applied to cash interest payments on the Senior PIK Notes.
As of December 29, 2012, a total basket of $168.2 million was available for dividends from Yankee Candle to YCC Holdings to be applied to cash interest payments on the Senior PIK Notes.
The calculation to determine if the Company has excess cash flow per the Term Loan Facility is prepared on an annual basis at the end of each fiscal year. The Company generated excess cash flow during 2012 of $74.6 million, of which 50% is required to prepay the Term Loan Facility in accordance with the agreement. During the fourth quarter of 2012, the Company repaid $67.0 million of the Term Loan Facility which satisfied the excess cash flow payment.
In addition, the Term Loan Facility contains customary covenants and restrictions on Holding Corp. and its subsidiaries’ activities, including but not limited to, limitations on the incurrence of additional indebtedness, liens, negative pledges, guarantees, investments, loans, asset sales, mergers, acquisitions, prepayment of other debt, distributions, dividends, the repurchase of capital stock, transactions with affiliates and the ability to change the nature of its business or its fiscal year. All obligations under the Term Loan Facility are guaranteed by Holding Corp.’s and Yankee Candle’s domestic subsidiaries and secured by a lien on substantially all of the assets of Holding Corp. and its domestic subsidiaries.
Yankee Candle uses interest rate swaps to eliminate the variability of a portion of cash flows associated with the forecasted interest payments on the Term Loan Facility. During the second and third quarters of 2009, Yankee Candle entered into forward starting amortizing interest rate swaps to eliminate the variability in future interest payments by having Yankee Candle pay fixed-rate amounts in exchange for receipt of floating-rate interest payments. The effective date of the forward starting swaps was March 31, 2011. The aggregate notional value amortizes over the life of the swaps. As of December 29, 2012, the aggregate notional value of the swaps was $219.8 million, or 33.6% of the Term Loan Facility, resulting in a blended fixed rate of 3.49%. The forward starting swaps are not designated as cash flow hedges and, are measured at fair value with changes in fair value recognized in the consolidated statements of operations as a component of other income (expense). The forward starting swap agreements terminate in March 2013.
Asset-Based Credit Facility
On April 2, 2012, Yankee Candle, together with certain of its foreign subsidiaries, also entered into a Credit Agreement (the “ABL Facility”) with (“Bank of America, N.A.”) BofA, as agent, the other lenders party thereto, Barclays, as syndication agent, U.S. Bank National Association and Wells Fargo Capital Finance LLC, as co-documentation agents, and Merrill Lynch, Pierce, Fenner & Smith Incorporated and Barclays, as joint lead arrangers and joint book runners.
The ABL Facility is scheduled to expire on April 2, 2017; however, the expiration date of the ABL Facility will accelerate if the Senior Subordinated Notes and the Senior PIK Notes are not defeased, repurchased, refinanced or redeemed 91 days prior to their respective maturity dates. The ABL Facility permits revolving borrowings of up to $175.0 million subject to eligible inventory and trade accounts receivable balances. The ABL Facility is inclusive of sub-facilities for up to $25.0 million in swing line advances, up to $25.0 million for letters of credit, up to $10.0 million for borrowings by Yankee Candle’s Canadian subsidiary, up to $10.0 million for borrowings by Yankee Candle’s German subsidiary and up to $75.0 million for borrowing by YCE. Borrowings under the ABL Facility bear interest at a rate equal to either (i) LIBOR or the BofA rate plus the applicable margin or (ii) the prime rate plus the applicable margin. The applicable margin ranges from 0.50% to 2.00%, dependent on the currency of the borrowing. For purposes of determining interest rates, the applicable margin is subject to a variable grid, dependent on average daily excess availability calculated as of the immediately preceding fiscal quarter. As of December 29, 2012 the interest rate applicable to the ABL Facility was 2.0%.
The unused line fee payable under the ABL Facility is equal to (i) 0.50% per annum if less than 50% of the ABL Facility has been used on average during the immediately preceding fiscal quarter or (ii) 0.375% per annum if 50% or more of the ABL Facility has been utilized on average during the immediately preceding fiscal quarter.
The ABL Facility requires Yankee Candle and its subsidiaries to maintain a consolidated fixed charge coverage ratio of at least 1.0:1.0 during a covenant compliance event, which occurs if unused borrowing availability is less than the greater of (x) 10% of the maximum amount that can be borrowed under the ABL Facility, which amount is the lesser of $175.0 million and a borrowing formula based on receivables and inventory (the “ABL Loan Cap”) or (y) $15.0 million and continues until excess availability has exceeded the amounts set forth herein for 30 consecutive days. As of December 29, 2012, the ABL Loan Cap was $141.3 million. As of December 29, 2012 Yankee Candle had outstanding letters of credit of $2.2 million resulting in available borrowing capacity of $139.1 million, or 98.5% of the Loan Cap. As such, Yankee Candle was not subject to the fixed charge coverage ratio.
Under the ABL Facility, Yankee Candle is permitted to declare dividends to Holding Corp. (1) on an unlimited basis if certain tests are met and (2) also solely to fund interest payments on the Senior PIK notes subject to the restrictions described below.
(1) Yankee Candle is permitted to make dividends to Holding Corp. in an unlimited amount so long as (a) unused borrowing availability is greater than or equal to 15% of the ABL Loan Cap at the time of the making of such dividend and projected on a pro forma basis for the immediately succeeding six months following such dividend, except that, to the extent that the dividend is made during the “August Period”, or the August Period is included in such six month projections, then unused borrowing availability shall only be required to be greater than or equal to 10% of the ABL Loan Cap and (b) to the extent unused borrowing availability is less than 25% of the ABL Loan Cap and is projected to be less than 25% of the ABL Loan Cap for the immediately succeeding six months following such dividend (or 10%, in the case that the dividend is made in the August Period or the August Period is included in such six month projections), the consolidated fixed charge coverage ratio for the most recently ended period of twelve fiscal months preceding such dividend on a pro forma basis is greater than or equal to 1.1 to 1.0.
“August Period”, as used herein, means August 1st through the earlier of the date that the borrowing base certificate is filed for the month of August and the fifteenth business day after the end of the August fiscal month.
(2) Yankee Candle is permitted to make dividends to Holding Corp and Holding Corp is permitted to make dividends to YCC Holdings solely for the purpose of funding interest payments due on the Senior PIK Notes if (a) except for payments to be made during the August Period as to which there is no minimum unused borrowing availability requirement, unused borrowing availability is greater than or equal to 15% of the ABL Loan Cap at the time of the making of such dividend and projected on a pro forma basis for the immediately succeeding six months following such dividend and (b) to the extent unused borrowing availability is less than 25% of the ABL Loan Cap and is projected to be less than 25% of the ABL Loan Cap for the immediately succeeding six months following such dividend (or 10%, in the case that the August Period is included in such projected six month period), the consolidated fixed charge coverage ratio for the most recently ended period of twelve fiscal months preceding such dividend on a pro forma basis is greater than or equal to 1.1 to 1.0; provided that for purposes of satisfying the test in this clause (b), no dividend made during the month of August for the purpose of funding, in whole or in part, an interest payment on the Senior PIK Notes shall be included in the calculation of consolidated fixed charge coverage ratio.
In addition, the ABL Facility contains customary covenants and restrictions on Yankee Candle and its subsidiaries’ activities, including but not limited to, limitations on the incurrence of additional indebtedness, liens, negative pledges, guarantees, investments, loans, asset sales, mergers, acquisitions, prepayment of other debt, distributions, dividends, the repurchase of capital stock, transactions with affiliates, the ability to change the nature of its business or its fiscal year, enter into certain hedging agreements and enter into certain burdensome agreements. All obligations under the ABL Facility are guaranteed by Yankee Candle’s domestic subsidiaries and secured by a lien on substantially all of the assets of Yankee Candle and its domestic subsidiaries. Certain of the obligations under the ABL Facility are guaranteed by Yankee Candle’s foreign subsidiaries and are secured by a lien on substantially all of the assets of such foreign subsidiaries, which consist primarily of inventory and receivables.
Senior PIK Notes of YCC Holdings
In February 2011, YCC Holdings formed a 100% owned subsidiary, Yankee Finance, for the purpose of co-issuing in conjunction with YCC Holdings $315.0 million Senior PIK Notes. Cash interest accrues at a rate of 10.25% per annum, and PIK Interest (defined below) accrues at the cash interest rate plus 0.75%. YCC Holdings is required to pay interest on the Senior PIK Notes entirely in cash interest, unless the conditions described in the indenture are satisfied with respect to the related interest period, in which case, YCC Holdings may pay interest on Senior PIK Notes for such interest period by increasing the principal amount of the Senior PIK Notes or by issuing new PIK Notes for up to the entire amount of the interest payment (in each case, "PIK Interest"), to the extent described in the related indenture. The amount of cash interest required to be paid for an interest period is determined prior to the beginning of an interest period and is calculated based upon the amount that would be permitted to be paid as a dividend as of such determination date to YCC Holdings by its subsidiaries for the purpose of paying cash interest on the Senior PIK Notes (based upon restrictions imposed by applicable law and such subsidiaries' debt agreements) plus the amount of cash on hand at YCC Holdings on the determination date (subject to certain exceptions set forth in the indenture). If the amount that would be available is less than the amount of interest due for that interest period, then YCC Holdings is permitted to pay all or a specified portion of such interest as PIK Interest rather than in cash on the interest payment date as provided in the indenture. As of December 29, 2012, the Senior PIK Notes were structurally subordinated to approximately $846.2 million of indebtedness of Holding Corp.
The $315.0 million aggregate principal amount of the Senior PIK Notes were issued at a discount of $6.3 million and YCC Holdings paid deferred financing fees of $7.8 million. YCC Holdings is amortizing the discount and the deferred financing fees using the effective interest rate method over the term of the Senior PIK Notes. The proceeds from the Senior PIK Notes were used to pay transaction costs (exclusive of the amounts paid by Holding Corp.) and to make a payment of $300.8 million to Yankee Investments, which in turn made payments of $297.8 million to holders of Yankee Investments' Class A common units and payments of $3.0 million to holders of Yankee Investments' Class B and Class C common units.
YCC Holdings is a holding company with no direct operations. Its principal asset is the indirect equity interests it holds in Yankee Candle, and all of its operations are conducted through Yankee Candle. As a result, YCC Holdings is indirectly dependent upon dividends from Yankee Candle to generate the funds necessary to meet its outstanding debt service obligations. Neither Yankee Candle nor Holding Corp. guaranteed the Senior PIK Notes. Yankee Candle is not obligated to pay dividends to Holding Corp. and Holding Corp. is not obligated to pay dividends to YCC Holdings. Yankee Candle’s ability to pay dividends to Holding Corp. to permit Holding Corp. to pay dividends to YCC Holdings was restricted at December 29, 2012 by Yankee Candle’s Term Loan Facility, ABL Facility and the indentures governing the senior notes and senior subordinated notes. Yankee Candle redeemed the remaining $10.0 million in aggregate principal amount of the Senior Notes on February 15, 2013, at which time the obligations of Yankee Candle and the guarantors under the related indenture were discharged.
The indenture governing Yankee Candle’s Senior Subordinated Notes permit Yankee Candle to pay dividends to Holding Corp. if: (i) there is no default or event of default under the indentures governing the Yankee Candle Senior Notes; (ii) Yankee Candle would have a fixed charge coverage ratio of at least 2.0 to 1.0; and (iii) such dividend, together with the aggregate amount of all other "restricted payments" (as defined in such indentures) made by Yankee Candle and its restricted subsidiaries after February 6, 2007 (excluding certain restricted payments), is less than the sum of (a) 50% of the Consolidated Net Income (as defined in such indentures) of Yankee Candle for the period (taken as one accounting period) from December 31, 2006 to the end of Yankee Candle's most recently ended fiscal quarter for which internal financial statements are available at the time of such dividend (or, in the case such Consolidated Net Income for such period is a deficit, minus 100% of such deficit), plus (b) the proceeds from specified equity contributions or issuances of equity.
In addition to the capacity described above, Yankee Candle has a "basket" of $35.0 million under the Senior Subordinated Notes indenture from which it may make dividends in amount not to exceed $35.0 million (since the date of the issuance of Yankee Candle's notes), so long there is no default or event of defaults under the indenture.
Because the Term Loan Facility, ABL Facility and the indenture governing Yankee Candle’s Senior Subordinated Notes each contain limitations on dividends, Yankee Candle is permitted to make dividends only to the extent it is permitted to do so under each of these agreements.
During the fifty-two weeks ended December 29, 2012 Holding Corp. declared and paid dividends of $32.4 million to YCC Holdings to fund interest payments for the Senior PIK Notes, which decreased the amount available for future dividends. As of December 29, 2012, the amount available for dividends from Yankee Candle to YCC Holdings was approximately $168.2 million. We currently anticipate that Yankee Candle will be permitted under the terms of its debt agreements to make dividends sufficient to pay cash interest on the Senior PIK Notes in the next twelve months.
Cash Flows and Funding of our Operations
Our cash includes interest bearing and non-interest bearing accounts. We maintain cash balances at several domestic and foreign financial institutions. Accounts at each institution are insured by the Federal Deposit Insurance Corporation (FDIC) up to $250 thousand, and by equivalent regulatory agencies in foreign countries. Uninsured balances aggregated $5.4 million at December 29, 2012. Cash as of December 29, 2012, was $40.0 million compared to $50.8 million as of December 31, 2011.
Cash provided by operating activities for Holding Corp. for the fifty-two weeks ended December 29, 2012 was $125.3 million as compared to cash provided by operating activities of $80.8 million for the fifty-two weeks ended December 31, 2011. The increase in cash provided by operations relative to the prior year was primarily driven by (i) an increase in operating income net of depreciation and amortization of $10.3 million, (ii) a decrease in income tax payments of $11.1 million which was largely related to the tax benefit from interest expense of the $315.0 million Senior PIK Notes that were issued in 2011, (iii) management of inventory levels to be in line with 2011 despite an increase in sales of 7.4% resulting in a benefit of $6.5 million, (iv) favorable changes in receivables of $4.5 million driven by collection processes, (v) additional favorable changes in working capital of approximately $22.1 million driven largely by bonus incentive accruals and favorable timing of accounts payable and accrued expenses, offset slightly by additional interest paid of $7.6 million primarily attributable to the debt refinancing that occurred in April 2012. The refinancing resulted in slightly higher interest rates overall and also resulted in paying interest monthly on the $725.0 million Term Loan Facility as opposed to paying interest semi-annually on the $315.0 million of Senior Notes.
Cash provided by operating activities for YCC Holdings during the fifty-two weeks ended December 29, 2012 was $92.9 million as compared to cash provided by operating activities of $63.7 million for the fifty-two weeks ended December 31, 2011. The difference in cash provided by operating activities between YCC Holdings and Holding Corp. was primarily related to interest paid on the Senior PIK Notes. Those interest payments are funded by dividends from Holding Corp. to YCC Holdings and are recorded as a financing activity by Holding Corp. as compared to an operating activity for YCC Holdings.
Net cash used in investing activities was $25.5 million and $24.2 million for the fifty-two weeks ended December 29, 2012 and December 31, 2011, respectively and was used for the purchase of property and equipment, primarily related to new stores, store renovations, investments in information technology and supply chain initiatives.
For the fifty-two weeks ended December 29, 2012, net cash used in financing activities for Holding Corp. was $110.8 million compared to cash used in financing activities of $18.4 million for the fifty-two weeks ended December 31, 2011. The increase in cash used in financing activities was primarily driven by repayments under the Term Loan Facility of $70.6 million during 2012, coupled with increased dividends of $16.1 million paid to YCC Holdings related primarily to the interest expense and payment of financing fees from the $315.0 million of Senior PIK Notes.
For the fifty-two weeks ended December 29, 2012, net cash used in financing activities for YCC Holdings was $78.4 million compared to cash used in financing activities of $1.3 million for the fifty-two weeks ended December 31, 2011. The difference in cash provided by financing activities between YCC Holdings and Holding Corp. for the fifty-two weeks ended December 29, 2012 is driven by $32.4 million in dividends paid to YCC Holdings primarily to fund interest payments on the Senior PIK notes.
In February 2011, YCC Holdings and Yankee Finance co-issued $315.0 million Senior PIK Notes at a discount of $6.3 million for net proceeds of $308.7 million. Issuance costs related to the Senior PIK Notes were $9.7 million, of which $7.8 million were paid for by YCC Holdings and $1.9 million were paid for by Holding Corp. The net proceeds were used make a payment of $300.8 million to Yankee Investments which in turn made payments of $297.8 million to holders of Yankee Investments’ Class A common units and payments of $3.0 million to holders of Yankee Investments’ Class B and Class C common units.
YCC Holdings is dependent upon dividends from Holding Corp., which are subject to restrictions under the agreements governing Yankee Candle's indebtedness, to generate the funds necessary to meet its outstanding debt service obligations. We fund our operations through a combination of internally generated cash from operations and from borrowings under the ABL Facility. Our primary uses of cash are working capital requirements, new store expenditures, new store inventory purchases and debt service requirements. We anticipate that cash generated from operations together with amounts available under the ABL Facility will be sufficient to meet our future working capital requirements, new store expenditures, new store inventory purchases and debt service obligations as they become due over the next twelve months. However, our ability to fund future operating expenses and capital expenditures and our ability to make scheduled payments of interest on, to pay principal on or refinance indebtedness and to satisfy any other present or future debt obligations will depend on future operating performance which will be affected by general economic, financial and other factors beyond our control. While we do not yet have sufficient visibility to the 2012 retail environment, based upon current trends and our preliminary budget expectations we remain confident that for the foreseeable future we will have sufficient cash flow and liquidity to fund our working capital requirements and meet our debt service obligations. In addition, borrowings under the ABL Facility are dependent upon our continued compliance with the financial and other covenants contained therein.
Due to the seasonality of the business, we typically do not generate positive cash flow from operations through the first three quarters of our fiscal year. As such, we draw on the ABL Facility during these times to fund operations. In the fourth quarter, these borrowings are typically repaid in full using cash generated from operations during the fourth quarter holiday season. We typically reach our peak borrowings during the latter part of the third quarter. In fiscal 2012, our peak borrowings were $81.0 million. We review and forecast our cash flow on a daily basis for the current year and on a quarterly basis for the upcoming year to ensure we have adequate liquidity to fund our business. We believe that we will, for the foreseeable future, be able to meet our debt service obligations, fund our working capital requirements, fund our capital expenditures and be in compliance with our covenants under the Term Loan Facility and the ABL Facility.
Contractual Commitments
In addition to obligations to repay our debt obligations, we lease the majority of our retail stores under operating leases. The following table summarizes our contractual commitments including both our debt and lease obligations:
| YCC Holdings | |
| (In thousands) | | Payment due by period | |
| Contractual obligations | | Total | | | 2013 | | | 2014 | | | 2015 | | | 2016 | | | 2017 | | | Thereafter | |
Debt obligations 1, 4, 6 | | $ | 1,167,375 | | | $ | 10,000 | | | $ | - | | | $ | - | | | $ | 315,000 | | | $ | 188,000 | | | $ | 654,375 | |
| Operating leases | | | 224,423 | | | | 38,921 | | | | 34,218 | | | | 30,742 | | | | 25,224 | | | | 21,841 | | | | 73,477 | |
Capital leases 2 | | | 5,492 | | | | 1,872 | | | | 1,701 | | | | 1,016 | | | | 777 | | | | 126 | | | | - | |
Purchase commitments 3 | | | 33,195 | | | | 31,236 | | | | 620 | | | | 514 | | | | 300 | | | | 300 | | | | 225 | |
Estimated interest payments 4 | | | 427,717 | | | | 91,125 | | | | 86,022 | | | | 85,354 | | | | 69,210 | | | | 43,901 | | | | 52,105 | |
Total contractual obligations 5 | | $ | 1,858,202 | | | $ | 173,154 | | | $ | 122,561 | | | $ | 117,625 | | | $ | 410,511 | | | $ | 254,168 | | | $ | 780,181 | |
1 Includes the $315.0 million aggregate principal amount of the Senior PIK notes.
2 Includes capital lease payments relating to computer and warehouse equipment, and a fleet of vehicles. Includes interest, excludes lessee guarantee residual value of $0.4 million.
3 Includes open purchase orders for goods purchased in the ordinary course of our business, whether or not we are able to cancel such purchase orders.
4 During the first quarter of 2013, Yankee Candle redeemed the remaining $10.0 million in aggregate principal amount of its Senior Notes. Because all of the Senior Notes have been redeemed, the obligations of Yankee Candle and the guarantors under the related indenture have been discharged. Accordingly, estimated interest payments are based on the outstanding debt balance of $1,167.4 million at December 29, 2012, less the $10.0 million related to the Senior Notes. The rates used in the calculation of the estimated interest payments were the rates outstanding at December 29, 2012 on the Term Loan Facility, the Senior PIK Notes and the Senior Subordinated Notes. They also include estimated payments on interest rate swaps. The interest rate swaps expire in March 2013. These payments when made are part of interest expense in the consolidated statement of operations.
5 The table above excludes $3.5 million in uncertain tax positions, as we are unable to make reasonably reliable estimates of the period of cash settlement, if any, with the respective taxing authorities.
Due to the principal payment of $67.0 million in December 2012 no quarterly principal payments are due on the Term Loan Facility until maturity.
| Holding Corp. | |
| (In thousands) | | Payment due by period | |
| Contractual obligations | | Total | | | 2013 | | | 2014 | | | 2015 | | | 2016 | | | 2017 | | | Thereafter | |
Debt obligations 3, 5 | | $ | 852,375 | | | $ | 10,000 | | | $ | - | | | $ | - | | | $ | - | | | $ | 188,000 | | | $ | 654,375 | |
| Operating leases | | | 224,423 | | | | 38,921 | | | | 34,218 | | | | 30,742 | | | | 25,224 | | | | 21,841 | | | | 73,477 | |
Capital leases 1 | | | 5,492 | | | | 1,872 | | | | 1,701 | | | | 1,016 | | | | 777 | | | | 126 | | | | - | |
Purchase commitments 2 | | | 33,195 | | | | 31,236 | | | | 620 | | | | 514 | | | | 300 | | | | 300 | | | | 225 | |
Estimated interest payments 3 | | | 314,711 | | | | 58,837 | | | | 53,734 | | | | 53,066 | | | | 53,066 | | | | 43,901 | | | | 52,105 | |
Total contractual obligations 4 | | $ | 1,430,196 | | | $ | 140,867 | | | $ | 90,274 | | | $ | 85,338 | | | $ | 79,368 | | | $ | 254,168 | | | $ | 780,181 | |
1 Includes capital lease payments relating to computer and warehouse equipment, and a fleet of vehicles. Includes interest, excludes lessee guarantee residual value of $0.4 million.
2 Includes open purchase orders for goods purchased in the ordinary course of our business, whether or not we are able to cancel such purchase orders.
3 During the first quarter of 2013, Yankee Candle redeemed the remaining $10.0 million in aggregate principal amount of its Senior Notes. Because all of the Senior Notes have been redeemed, the obligations of Yankee Candle and the guarantors under the related indenture have been discharged. Accordingly, estimated interest payments are based on the outstanding debt balance of $852.4 million at December 29, 2012, less the $10.0 million related to the Senior Notes. The rates used in the calculation of the estimated interest payments were the rates outstanding at December 29, 2012 on the Term Loan Facility and the Senior Subordinated Notes. They also include estimated payments on interest rate swaps. The interest rate swaps expire in March 2013. These payments when made are part of interest expense in the consolidated statement of operations.
4 The table above excludes $3.5 million in uncertain tax positions, as we are unable to make reasonably reliable estimates of the period of cash settlement, if any, with the respective taxing authorities.
5 Due to the principal payment of $67.0 million in December 2012 no quarterly principal payments are due on the Term Loan Facility until maturity.
Recent Accounting Pronouncements
Disclosures Relating To Comprehensive Income (Loss)
In December 2011, the FASB issued ASU No. 2011-12, Comprehensive Income (Topic 220): Deferral of the Effective Date for Amendments to the Presentation of Reclassifications of Items Out of Accumulated Other Comprehensive Income in Accounting Standards Update No. 2011-05 (“ASU 2011-12”). ASU 2011-12 defers the presentation of the reclassification adjustments in the income statement but does not defer the presentation of the reclassification adjustments in other comprehensive income. The Companies have presented the reclassification adjustments in other comprehensive income in the Condensed Consolidated Statements of Comprehensive Income herein in accordance with ASU 2011-12.
In February 2013, the FASB issued ASU No. 2013-02, Comprehensive Income (Topic 220): Reporting of Amounts Reclassified Out of Accumulated Other Comprehensive Income (“ASU 2013-02”) to improve the reporting of reclassifications out of Accumulated Other Comprehensive Income ("AOCI"). ASU 2013-12 does not change the current requirements for reporting net income or other comprehensive income in the financial statements. Under ASU 2013-02, an entity is required to provide information about the amounts reclassified out of AOCI by component. In addition, an entity is required to present, either on the face of the financial statements or in the notes, significant amounts reclassified out of AOCI by the respective line items of net income, but only if the amount reclassified is required under U.S. GAAP to be reclassified in its entirety in the same reporting period. For amounts that are not required under U.S. GAAP to be reclassified in their entirety to net income, an entity is required to cross-reference to other disclosures that provide additional details about those amounts. The adoption of ASU 2013-02 is effective for the Companies on December 30, 2012 and will affect disclosures only. Therefore the adoption of this accounting standard is not expected to have a material impact of the Companies’ consolidated financial statements.
Recently Adopted Accounting Pronouncements
Goodwill
The FASB issued updated authoritative guidance in September 2011 to amend previous guidance on the testing of goodwill for impairment; the guidance is effective for annual and interim goodwill impairment tests performed for fiscal years beginning after December 15, 2011, with early adoption permitted. The guidance provides entities with the option of first assessing qualitative factors to determine whether it is more likely than not that the fair value of a reporting unit is less than its carrying amount. If it is determined, on the basis of qualitative factors, that the fair value of the reporting unit is more likely than not less than the carrying amount, the two-step impairment test would be required. The Companies adopted this new accounting standard during 2012 choosing not to elect the qualitative option for purposes of the 2012 impairment testing.
Fair Value Measurements
The FASB issued updated authoritative guidance in May 2011 to amend fair value measurements and related disclosures; the guidance became effective for the Company on a prospective basis at the beginning of its 2012 fiscal year. This guidance relates to a major convergence project of the FASB and the International Accounting Standards Board to improve International Financial Reporting Standards (“IFRS”) and U.S. GAAP. This guidance results in a consistent definition of fair value and common requirements for measurement of and disclosure about fair value between IFRS and U.S. GAAP. The guidance also changes some fair value measurement principles and enhances disclosure requirements related to activities in Level 3 of the fair value hierarchy. The Companies adopted this new accounting standard on January 1, 2012 and the adoption of this new accounting standard did not have a significant impact on the Companies’ consolidated financial statements.
| ITEM 7A. | QUANTITATIVE AND QUALITATIVE DISCLOSURES ABOUT MARKET RISK |
Interest Rate Risk
Our market risks relate primarily to changes in interest rates. At December 29, 2012, Yankee Candle had $654.4 million of floating rate debt and $198.0 million of fixed rate debt. At December 29, 2012, YCC Holdings had an additional $315.0 million of fixed rate debt. For fixed rate debt, interest rate changes affect the fair market value, but do not impact earnings or cash flows. Conversely for floating rate debt, interest rate changes do not affect the fair market value but do impact future earnings and cash flows, assuming other factors are held constant. The $654.4 million outstanding under Yankee Candle’s Term Loan Facility bears interest at variable rates. Borrowings under Yankee Candle’s Term Loan Facility bear interest at either (i) the Eurodollar Rate (subject to a 1.25% floor) plus 4.00% or (ii) the ABR (subject to a 2.25% floor) plus 3.00%. The default rate of interest will accrue (i) on the overdue principal amount of any loan at a rate of 2% in excess of the rate otherwise applicable to such loan and (ii) on any overdue interest or any other outstanding overdue amount at a rate of 2% in excess of the non-default interest rate then applicable to ABR loans. As of December 29, 2012, the interest rate on Yankee Candle’s Term Loan Facility was 5.25%. Because Yankee Candle’s Term Loan Facility and ABL Facility bear interest at a variable interest rates based on market indices, our results of operations and cash flows will be exposed to changes in interest rates.
The variable nature of our obligations under Yankee Candle’s Term Loan Facility and ABL Facility creates interest rate risk. In order to mitigate this risk we use interest rate swaps to manage the variability of a portion of cash flows associated with the forecasted interest payments on Yankee Candle’s Term Loan Facility. This is achieved through converting a portion of the floating rate Term Loan Facility to a fixed rate by entering into pay-fixed interest rate swaps. In essence, Yankee Candle converted a portion of its Term Loan Facility, which is floating-rate debt, to a fixed-rate up to the aggregate notional value of the swaps by paying fixed-rate amounts in exchange for the receipt of floating-rate interest payments. As of December 29, 2012, the aggregate notional value of the swaps was $219.8 million, or 33.6% of Yankee Candle’s Term Loan Facility, resulting in a blended fixed rate of 3.49%. Based on Yankee Candle’s outstanding floating rate debt under the Term Loan Facility and the notional amount of our interest rate swaps, as of December 29, 2012, a 10.0% increase or decrease in current market interest rates would have no effect on our current term loan interest expense because of the Libor floor, but would impact interest expense related to our swaps by approximately $0.1 million on an annual basis.
Commodity Price Risk
We buy a variety of raw materials for inclusion in our products. The only raw material that is considered to be of a commodity nature is wax. Wax is a petroleum based product. Its market price has not historically fluctuated with the movement of oil prices and has instead generally moved with inflation. However, in the past several years the price of wax has increased at a rate significantly above the rate of inflation. Future increases in wax prices could have an adverse affect on our cost of goods sold and could lower our margins. In 2012, 2011, and 2010, we did not manage commodity price risk with derivative instruments.
Foreign Currency Risk
A portion of our sales and a portion of our costs are denominated in currencies other than the U.S. dollar. These currencies could appreciate or depreciate relative to the U.S. dollar. Any movement of these currencies may materially and adversely affect our cash flows, revenues, operating results and financial position.
| REPORT OF INDEPENDENT REGISTERED PUBLIC ACCOUNTING FIRM |
| |
| To the Board of Directors and Member of |
| YCC Holdings LLC |
| South Deerfield, Massachusetts |
We have audited the accompanying consolidated balance sheets of YCC Holdings LLC and subsidiaries (the "Company") as of December 29, 2012 and December 31, 2011, and the related consolidated statements of operations, comprehensive income, changes in member’s equity (deficit), and cash flows for each of the three years in the period ended December 29, 2012. These financial statements are the responsibility of the Company's management. Our responsibility is to express an opinion on these financial statements based on our audits.
We conducted our audits in accordance with the standards of the Public Company Accounting Oversight Board (United States). Those standards require that we plan and perform the audit to obtain reasonable assurance about whether the financial statements are free of material misstatement. The Company is not required to have, nor were we engaged to perform, an audit of its internal control over financial reporting. Our audits included consideration of internal control over financial reporting as a basis for designing audit procedures that are appropriate in the circumstances, but not for the purpose of expressing an opinion on the effectiveness of the Company's internal control over financial reporting. Accordingly, we express no such opinion. An audit also includes examining, on a test basis, evidence supporting the amounts and disclosures in the financial statements, assessing the accounting principles used and significant estimates made by management, as well as evaluating the overall financial statement presentation. We believe that our audits provide a reasonable basis for our opinion.
In our opinion, such consolidated financial statements present fairly, in all material respects, the financial position of YCC Holdings LLC and subsidiaries as of December 29, 2012 and December, 31, 2011, and the results of their operations and their cash flows for each of the three years in the period ended December 29, 2012, in conformity with accounting principles generally accepted in the United States of America.
| /s/ Deloitte & Touche LLP |
| Hartford, Connecticut |
| |
| March 29, 2013 |
| REPORT OF INDEPENDENT REGISTERED PUBLIC ACCOUNTING FIRM |
| |
| To the Board of Directors and Stockholder of |
| Yankee Holding Corp. |
| South Deerfield, Massachusetts |
We have audited the accompanying consolidated balance sheets of Yankee Holding Corp. and subsidiaries (the "Company") as of December 29, 2012 and December 31, 2011, and the related consolidated statements of operations, comprehensive income, changes in stockholder’s equity, and cash flows for each of the three years in the period ended December 29, 2012. These financial statements are the responsibility of the Company's management. Our responsibility is to express an opinion on these financial statements based on our audits.
We conducted our audits in accordance with the standards of the Public Company Accounting Oversight Board (United States). Those standards require that we plan and perform the audit to obtain reasonable assurance about whether the financial statements are free of material misstatement. An audit includes examining, on a test basis, evidence supporting the amounts and disclosures in the financial statements. An audit also includes assessing the accounting principles used and significant estimates made by management, as well as evaluating the overall financial statement presentation. We believe that our audits provide a reasonable basis for our opinion.
In our opinion, such consolidated financial statements present fairly, in all material respects, the financial position of Yankee Holding Corp. and subsidiaries as of December 29, 2012 and December 31, 2011, and the results of their operations and their cash flows for each of the three years in the period ended December 29, 2012, in conformity with accounting principles generally accepted in the United States of America.
We have also audited, in accordance with the standards of the Public Company Accounting Oversight Board (United States), the Company's internal control over financial reporting as of December 29, 2012, based on the criteria established in Internal Control—Integrated Framework issued by the Committee of Sponsoring Organizations of the Treadway Commission and our report dated March 29, 2013 expressed unqualified opinion on the Company's internal control over financial reporting.
| /s/ Deloitte & Touche LLP |
| Hartford, Connecticut |
| |
| March 29, 2013 |
YCC HOLDINGS LLC AND SUBSIDIARIES
CONSOLIDATED BALANCE SHEETS
(in thousands)
| | | December 29, | | | December 31, | |
| 2012 | 2011 |
| ASSETS | | | | | | | | |
| CURRENT ASSETS: | | | | | | | | |
| Cash | | $ | 39,979 | | | $ | 50,833 | |
| Accounts receivable, net | | | 63,572 | | | | 57,013 | |
| Inventory | | | 77,969 | | | | 75,563 | |
| Prepaid expenses and other current assets | | | 4,882 | | | | 4,924 | |
| Deferred tax assets | | | 6,814 | | | | 8,724 | |
| | | | | | | | | |
| TOTAL CURRENT ASSETS | | | 193,216 | | | | 197,057 | |
| | | | | | | | | |
| PROPERTY AND EQUIPMENT, NET | | | 121,553 | | | | 118,402 | |
| MARKETABLE SECURITIES | | | 1,971 | | | | 1,670 | |
| GOODWILL | | | 643,570 | | | | 643,570 | |
| INTANGIBLE ASSETS | | | 268,033 | | | | 269,405 | |
| DEFERRED FINANCING COSTS | | | 19,684 | | | | 19,624 | |
| OTHER ASSETS | | | 355 | | | | 394 | |
| | | | | | | | | |
| TOTAL ASSETS | | $ | 1,248,382 | | | $ | 1,250,122 | |
| | | | | | | | | |
| LIABILITIES AND MEMBER'S DEFICIT | | | | | | | | |
| | | |
| CURRENT LIABILITIES: | | | | | | | | |
| Accounts payable | | $ | 25,309 | | | $ | 21,109 | |
| Accrued payroll | | | 13,680 | | | | 6,910 | |
| Accrued interest | | | 22,547 | | | | 29,485 | |
| Accrued income taxes | | | 7,110 | | | | 7,269 | |
| Accrued purchases of property and equipment | | | 3,434 | | | | 2,606 | |
| Current portion of long-term debt | | | - | | | | 12,042 | |
| Current portion of capital leases | | | 1,661 | | | | 975 | |
| Other accrued liabilities | | | 39,686 | | | | 38,689 | |
| | | | | | | | | |
| TOTAL CURRENT LIABILITIES | | | 113,427 | | | | 119,085 | |
| | | | | | | | | |
| DEFERRED TAX LIABILITIES | | | 117,135 | | | | 107,123 | |
| LONG-TERM DEBT, NET OF CURRENT PORTION | | | 1,156,840 | | | | 1,198,659 | |
| DEFERRED RENT | | | 12,886 | | | | 12,833 | |
| CAPITAL LEASES, NET OF CURRENT PORTION | | | 3,767 | | | | 2,597 | |
| OTHER LONG-TERM LIABILITIES | | | 5,911 | | | | 3,980 | |
| COMMITMENTS AND CONTINGENCIES (See Note 14) | | | | | | | | |
| MEMBER'S DEFICIT | | | | | | | | |
| Common Units | | | 120,204 | | | | 122,038 | |
| Accumulated deficit | | | (280,086) | | | | (313,009) | |
| Accumulated other comprehensive loss | | | (1,702) | | | | (3,184) | |
| | | | | | | | | |
| Total member's deficit | | | (161,584) | | | | (194,155) | |
| | | | | | | | | |
| TOTAL LIABILITIES AND MEMBER'S DEFICIT | | $ | 1,248,382 | | | $ | 1,250,122 | |
See notes to consolidated financial statements.
YCC HOLDINGS LLC AND SUBSIDIARIES
CONSOLIDATED STATEMENTS OF OPERATIONS
(in thousands)
| | | Fifty-Two Weeks Ended | | | Fifty-Two Weeks Ended | | | Fifty-Two Weeks Ended | |
| | | December 29, 2012 | | | December 31, 2011 | | | January 1, 2011 | |
| Sales | | $ | 844,186 | | | $ | 785,762 | | | $ | 733,717 | |
| Cost of sales | | | 363,839 | | | | 340,336 | | | | 307,103 | |
| | | | | | | | | | | | | |
| Gross profit | | | 480,347 | | | | 445,426 | | | | 426,614 | |
| Selling expenses | | | 238,035 | | | | 234,982 | | | | 212,580 | |
| General and administrative expenses | | | 72,184 | | | | 62,451 | | | | 62,609 | |
| Restructuring charges | | | 1,725 | | | | - | | | | 829 | |
| | | | | | | | | | | | | |
| Operating income | | | 168,403 | | | | 147,993 | | | | 150,596 | |
| Interest expense | | | 106,889 | | | | 101,598 | | | | 75,648 | |
| Loss on extinguishment of debt | | | 13,376 | | | | - | | | | - | |
| Other (income) expense, net | | | (6,815 | ) | | | (7,414 | ) | | | 8,972 | |
| | | | | | | | | | | | | |
| Income from continuing operations before provision for income taxes | | | 54,953 | | | | 53,809 | | | | 65,976 | |
| Provision for income taxes | | | 21,896 | | | | 20,040 | | | | 23,688 | |
| | | | | | | | | | | | | |
| | | | | | | | | | | | | |
| Income from continuing operations | | | 33,057 | | | | 33,769 | | | | 42,288 | |
| Loss from discontinued operations, net of income taxes | | | (134 | ) | | | (262 | ) | | | (379 | ) |
| | | | | | | | | | | | | |
| Net income | | $ | 32,923 | | | $ | 33,507 | | | $ | 41,909 | |
See notes to consolidated financial statements.
YCC HOLDINGS LLC AND SUBSIDIARIES
CONSOLIDATED STATEMENTS OF COMPREHENSIVE INCOME
(in thousands)
| | | Fifty-Two Weeks Ended | | | Fifty-Two Weeks Ended | | | Fifty-Two Weeks Ended | |
| | | December 29, 2012 | | | December 31, 2011 | | | December 31, 2011 | |
| | | | | | | | | | |
| Net income | | $ | 32,923 | | | $ | 33,507 | | | $ | 41,909 | |
| Other comprehensive income (loss), net of tax: | | | | | | | | | | | | |
| Foreign currency translation adjustments | | | 1,482 | | | | (535 | ) | | | (462 | ) |
| Unrealized gain on interest rate swaps, net of tax | | | - | | | | 712 | | | | 5,249 | |
| Other comprehensive income, net of tax | | | 1,482 | | | | 177 | | | | 4,787 | |
| | | | | | | | | | | | | |
| Comprehensive income | | $ | 34,405 | | | $ | 33,684 | | | $ | 46,696 | |
See notes to consolidated financial statements.
YCC HOLDINGS LLC AND SUBSIDIARIES
CONSOLIDATED STATEMENTS OF CHANGES IN MEMBER'S EQUITY (DEFICIT)
(in thousands, except units)
| | | Common Units | | | Class A | | | Class B | | | Class C | | | Total A, B and C Common Units | | | | | | Accumulated Other Loss | | | Total Member's Equity (Deficit) | |
| | | Units | | | Amount | | | Common Units | | | Amount | | | Common Units | | | Amount | | | Common Units | | | Amount | | | | | | | | | |
| | | | | | | | | | | | | | | | | | | | | | | | | | | | | | | | | | | | | |
| BALANCE, JANUARY 2, 2010 | | | - | | | $ | - | | | | 4,268,723 | | | $ | 417,127 | | | | 363,080 | | | $ | 2,407 | | | | 97,564 | | | $ | 282 | | | $ | 419,816 | | | $ | (388,425 | ) | | $ | (8,148 | ) | | $ | 23,243 | |
| Issuance of Class A and C common units | | | - | | | | - | | | | 286 | | | | 40 | | | | - | | | | - | | | | 44,712 | | | | - | | | | 40 | | | | - | | | | - | | | | 40 | |
| Repurchase of Class A, B and C common units | | | - | | | | - | | | | (1,781 | ) | | | (211 | ) | | | (29,614 | ) | | | (410 | ) | | | (55,450 | ) | | | (312 | ) | | | (933 | ) | | | - | | | | - | | | | (933 | ) |
| Equity-based compensation | | | - | | | | - | | | | - | | | | - | | | | - | | | | 640 | | | | - | | | | 322 | | | | 962 | | | | - | | | | - | | | | 962 | |
| Net income | | | - | | | | - | | | | - | | | | - | | | | - | | | | - | | | | - | | | | - | | | | - | | | | 41,909 | | | | - | | | | 41,909 | |
Other comprehensive income, net of tax | | | - | | | | - | | | | - | | | | - | | | | - | | | | - | | | | - | | | | - | | | | - | | | | - | | | | 4,787 | | | | 4,787 | |
| | | | | | | | | | | | | | | | | | | | | | | | | | | | | | | | | | | | | | | | | | | | | | | | | |
| BALANCE, JANUARY 1, 2011 | | | - | | | | - | | | | 4,267,228 | | | | 416,956 | | | | 333,466 | | | | 2,637 | | | | 86,826 | | | | 292 | | | | 419,885 | | | | (346,516 | ) | | | (3,361 | ) | | | 70,008 | |
| | | | | | | | | | | | | | | | | | | | | | | | | | | | | | | | | | | | | | | | | | | | | | | | | |
| Issuance of Class A common units | | | - | | | | - | | | | - | | | | 3 | | | | - | | | | - | | | | - | | | | - | | | | 3 | | | | - | | | | - | | | | 3 | |
| Repurchase of Class B and C common units | | | - | | | | - | | | | - | | | | - | | | | (21,423 | ) | | | (47 | ) | | | (900 | ) | | | (39 | ) | | | (86 | ) | | | - | | | | - | | | | (86 | ) |
| Conversion of Class A, B and C common units to Common Units | | | 1,000 | | | | 419,888 | | | | (4,267,228 | ) | | | (416,959 | ) | | | (312,043 | ) | | | (2,648 | ) | | | (85,926 | ) | | | (281 | ) | | | (419,888 | ) | | | - | | | | - | | | | - | |
| Return of capital to Common Units | | | - | | | | (297,825 | ) | | | - | | | | - | | | | - | | | | - | | | | - | | | | - | | | | - | | | | - | | | | - | | | | (297,825 | ) |
| Issuance of Common Units | | | - | | | | 17 | | | | - | | | | - | | | | - | | | | - | | | | - | | | | - | | | | - | | | | - | | | | - | | | | 17 | |
| Repurchase of Common Units | | | - | | | | (776 | ) | | | - | | | | - | | | | - | | | | - | | | | - | | | | - | | | | - | | | | - | | | | - | | | | (776 | ) |
| Equity-based compensation expense | | | - | | | | 734 | | | | - | | | | - | | | | - | | | | 58 | | | | - | | | | 28 | | | | 86 | | | | - | | | | - | | | | 820 | |
| Net income | | | - | | | | - | | | | - | | | | - | | | | - | | | | - | | | | - | | | | - | | | | - | | | | 33,507 | | | | - | | | | 33,507 | |
Other comprehensive income, net of tax | | | - | | | | - | | | | - | | | | - | | | | - | | | | - | | | | - | | | | - | | | | - | | | | - | | | | 177 | | | | 177 | |
| | | | | | | | | | | | | | | | | | | | | | | | | | | | | | | | | | | | | | | | | | | | | | | | | |
| BALANCE, DECEMBER 31, 2011 | | | 1,000 | | | | 122,038 | | | | - | | | | - | | | | - | | | | - | | | | - | | | | - | | | | - | | | | (313,009 | ) | | | (3,184 | ) | | | (194,155 | ) |
| | | | | | | | | | | | | | | | | | | | | | | | | | | | | | | | | | | | | | | | | | | | | | | | | |
| Issuance of Common Units | | | - | | | | 36 | | | | - | | | | - | | | | - | | | | - | | | | - | | | | - | | | | - | | | | - | | | | - | | | | 36 | |
| Repurchase of Common Units | | | - | | | | (2,623 | ) | | | - | | | | - | | | | - | | | | - | | | | - | | | | - | | | | - | | | | - | | | | - | | | | (2,623 | ) |
| Equity-based compensation expense | | | - | | | | 753 | | | | - | | | | - | | | | - | | | | - | | | | - | | | | - | | | | - | | | | - | | | | - | | | | 753 | |
| Net income | | | - | | | | - | | | | - | | | | - | | | | - | | | | - | | | | - | | | | - | | | | - | | | | 32,923 | | | | - | | | | 32,923 | |
Other comprehensive income, net of tax | | | - | | | | - | | | | - | | | | - | | | | - | | | | - | | | | - | | | | - | | | | - | | | | - | | | | 1,482 | | | | 1,482 | |
| | | | | | | | | | | | | | | | | | | | | | | | | | | | | | | | | | | | | | | | | | | | | | | | | |
| BALANCE, DECEMBER 29, 2012 | | | 1,000 | | | $ | 120,204 | | | | - | | | $ | - | | | | - | | | $ | - | | | | - | | | $ | - | | | $ | - | | | $ | (280,086 | ) | | $ | (1,702 | ) | | $ | (161,584 | ) |
See notes to consolidated financial statements.
YCC HOLDINGS LLC AND SUBSIDIARIES
CONSOLIDATED STATEMENTS OF CASH FLOWS
(in thousands)
| | | Fifty-Two Weeks Ended December 29, 2012 | | | Fifty-Two Weeks Ended December 31, 2011 | | | Fifty-Two Weeks Ended January 1, 2011 | |
| CASH FLOWS PROVIDED BY OPERATING ACTIVITIES: | | | | | | | | | |
| Net income | | $ | 32,923 | | | $ | 33,507 | | | $ | 41,909 | |
| Adjustments to reconcile net income to net cash provided by operating activities: | | | | | | | | | | | | |
| Realized (gain) loss on derivative contracts | | | (7,652 | ) | | | (6,403 | ) | | | 9,166 | |
| Depreciation and amortization | | | 34,721 | | | | 43,934 | | | | 42,978 | |
| Unrealized (gain) loss on marketable securities | | | (171 | ) | | | 50 | | | | (83 | ) |
| Equity-based compensation expense | | | 753 | | | | 820 | | | | 962 | |
| Deferred taxes | | | 11,506 | | | | 10,321 | | | | 3,931 | |
| Loss on extinguishment of debt | | | 13,376 | | | | - | | | | - | |
| Non-cash adjustments related to restructuring | | | - | | | | - | | | | 10 | |
| Loss on disposal and impairment of property and equipment | | | 382 | | | | 1,411 | | | | 213 | |
| Restructuring charges | | | 1,070 | | | | - | | | | - | |
| Marketable securities | | | - | | | | - | | | | 22 | |
| Changes in assets and liabilities: | | | | | | | | | | | | |
| Accounts receivable | | | (5,569 | ) | | | (10,076 | ) | | | (3,482 | ) |
| Inventory | | | (1,696 | ) | | | (8,175 | ) | | | (8,450 | ) |
| Prepaid expenses and other assets | | | (405 | ) | | | 4,757 | | | | (617 | ) |
| Accounts payable | | | 4,064 | | | | (5,182 | ) | | | 4,682 | |
| Income taxes | | | 1,517 | | | | (10,289 | ) | | | 18,175 | |
| Accrued expenses and other liabilities | | | 8,086 | | | | 8,991 | | | | 989 | |
| | | | | | | | | | | | | |
| NET CASH PROVIDED BY OPERATING ACTIVITIES | | | 92,905 | | | | 63,666 | | | | 110,405 | |
| | | | | | | | | | | | | |
| CASH FLOWS USED IN INVESTING ACTIVITIES: | | | | | | | | | | | | |
| Purchases of property and equipment | | | (25,516 | ) | | | (24,295 | ) | | | (17,651 | ) |
| Proceeds from sale of property and equipment | | | - | | | | 47 | | | | 202 | |
| | | | | | | | | | | | | |
| NET CASH USED IN INVESTING ACTIVITIES | | | (25,516 | ) | | | (24,248 | ) | | | (17,449 | ) |
| | | | | | | | | | | | | |
| CASH FLOWS USED IN FINANCING ACTIVITIES: | | | | | | | | | | | | |
| Borrowings under Senior Secured Credit Facility | | | 15,000 | | | | 150,000 | | | | 76,000 | |
| Borrowings under Senior Secured Asset-Based Credit Facility | | | 81,000 | | | | - | | | | - | |
| Borrowings under Term Loan Facility | | | 717,750 | | | | - | | | | - | |
| Repayments under Senior Secured Credit Facility and Senior Notes | | | (718,125 | ) | | | (150,000 | ) | | | (164,000 | ) |
| Payments of call premiums and fees for extinguishment of debt | | | (6,763 | ) | | | - | | | | - | |
| Repayments under Term Loan Facility | | | (70,625 | ) | | | - | | | | - | |
| Repayments under Senior Secured Asset-Based Credit Facility | | | (81,000 | ) | | | - | | | | - | |
| Borrowings under Senior PIK Notes | | | - | | | | 308,700 | | | | - | |
| Financing costs | | | (11,579 | ) | | | (10,478 | ) | | | - | |
| Return of capital | | | - | | | | (297,825 | ) | | | - | |
| Proceeds from issuance of Class A and C common units | | | - | | | | 3 | | | | 40 | |
| Proceeds from issuance of Common Units | | | 36 | | | | 17 | | | | - | |
| Repurchase of Class A, B and C common units | | | - | | | | (86 | ) | | | (933 | ) |
| Repurchase of Common Units | | | (2,623 | ) | | | (776 | ) | | | - | |
| Principal payments on capital lease obligations | | | (1,452 | ) | | | (853 | ) | | | (349 | ) |
| | | | | | | | | | | | | |
| NET CASH USED IN FINANCING ACTIVITIES | | | (78,381 | ) | | | (1,298 | ) | | | (89,242 | ) |
| | | | | | | | | | | | | |
| EFFECT OF EXCHANGE RATE CHANGES ON CASH | | | 138 | | | | - | | | | (96 | ) |
| | | | | | | | | | | | | |
| NET (DECREASE) INCREASE IN CASH | | | (10,854 | ) | | | 38,120 | | | | 3,618 | |
| CASH, BEGINNING OF YEAR | | | 50,833 | | | | 12,713 | | | | 9,095 | |
| | | | | | | | | | | | | |
| CASH, END OF YEAR | | $ | 39,979 | | | $ | 50,833 | | | $ | 12,713 | |
| | | | | | | | | | | | | |
| SUPPLEMENTAL DISCLOSURES OF CASH FLOW INFORMATION: | | | | | | | | | | | | |
| Cash paid during the year for: | | | | | | | | | | | | |
| Interest | | $ | 106,438 | | | $ | 83,273 | | | $ | 71,016 | |
| | | | | | | | | | | | | |
| Income taxes | | $ | 8,754 | | | $ | 19,832 | | | $ | 1,345 | |
| | | | | | | | | | | | | |
| Net change in accrued purchases of property and equipment | | $ | (828 | ) | | $ | (337 | ) | | $ | (368 | ) |
| Noncash Financing Activities: | | | | | | | | | | | | |
| Conversion of Class A, B and C common units to Common Units | | $ | - | | | $ | 419,888 | | | $ | - | |
| Capital lease obligations related to equipment purchase | | $ | 3,321 | | | $ | 2,097 | | | $ | 2,694 | |
See notes to consolidated financial statements.
YANKEE HOLDING CORP. AND SUBSIDIARIES
CONSOLIDATED BALANCE SHEETS
(in thousands except share data)
| | | December 29, | | December 31, |
| 2012 | 2011 |
| ASSETS | | | | | | |
| CURRENT ASSETS: | | | | | | |
| Cash | | $ | 39,979 | | $ | 50,833 |
| Accounts receivable, net | | | 63,572 | | | 57,013 |
| Inventory | | | 77,969 | | | 75,563 |
| Prepaid expenses and other current assets | | | 4,882 | | | 4,924 |
| Deferred tax assets | | | 6,814 | | | 8,724 |
| | | | | | | |
| TOTAL CURRENT ASSETS | | | 193,216 | | | 197,057 |
| | | | | | | |
| PROPERTY AND EQUIPMENT, NET | | | 121,553 | | | 118,402 |
| MARKETABLE SECURITIES | | | 1,971 | | | 1,670 |
| GOODWILL | | | 643,570 | | | 643,570 |
| INTANGIBLE ASSETS | | | 268,033 | | | 269,405 |
| DEFERRED FINANCING COSTS | | | 12,799 | | | 11,006 |
| OTHER ASSETS | | | 355 | | | 394 |
| | | | | | | |
| TOTAL ASSETS | | $ | 1,241,497 | | $ | 1,241,504 |
| | | | | | | |
| LIABILITIES AND STOCKHOLDER'S EQUITY | | | | | | |
| | | | |
| CURRENT LIABILITIES: | | | | | | |
| Accounts payable | | $ | 25,309 | | $ | 21,109 |
| Accrued payroll | | | 13,680 | | | 6,910 |
| Accrued interest | | | 10,614 | | | 17,377 |
| Accrued income taxes | | | 7,110 | | | 7,269 |
| Accrued purchases of property and equipment | | | 3,434 | | | 2,606 |
| Current portion of long-term debt | | | - | | | 12,042 |
| Current portion of capital leases | | | 1,661 | | | 975 |
| Other accrued liabilities | | | 39,686 | | | 38,689 |
| | | | | | | |
| TOTAL CURRENT LIABILITIES | | | 101,494 | | | 106,977 |
| | | | | | | |
| DEFERRED TAX LIABILITIES | | | 117,135 | | | 107,123 |
| LONG-TERM DEBT, NET OF CURRENT PORTION | | | 846,174 | | | 889,083 |
| DEFERRED RENT | | | 12,886 | | | 12,833 |
| CAPITAL LEASES, NET OF CURRENT PORTION | | | 3,767 | | | 2,597 |
| OTHER LONG-TERM LIABILITIES | | | 5,911 | | | 3,980 |
| COMMITMENTS AND CONTINGENCIES (See Note 14) | | | | | | |
| STOCKHOLDER'S EQUITY: | | | | | | |
| | | | | | | |
| Common stock: $.01 par value; 500,000 issued and 497,981 outstanding at December 29, 2012 and December 31, 2011 | | | 414,788 | | | 417,411 |
| Additional paid-in capital | | | 30,144 | | | 17,718 |
| | | | | | | |
| Treasury stock: at cost, 2,019 shares at December 29, 2012 and December 31, 2011 | | | (1,809) | | | (1,809) |
| Accumulated deficit | | | (287,291) | | | (311,225) |
| Accumulated other comprehensive loss | | | (1,702) | | | (3,184) |
| | | | | | | |
| Total stockholder's equity | | | 154,130 | | | 118,911 |
| | | | | | | |
| TOTAL LIABILITIES AND STOCKHOLDER'S EQUITY | | $ | 1,241,497 | | $ | 1,241,504 |
See notes to consolidated financial statements
YANKEE HOLDING CORP. AND SUBSIDIARIES
CONSOLIDATED STATEMENTS OF OPERATIONS
(in thousands)
| | | Fifty-Two Weeks Ended | | | Fifty-Two Weeks Ended | | Fifty-Two Weeks Ended |
| December 29, 2012 | December 31, 2011 | January 1, 2011 |
| Sales | | $ | 844,186 | | $ | 785,762 | | $ | 733,717 |
| Cost of sales | | | 363,839 | | | 340,336 | | | 307,103 |
| | | | | | | | | | | |
| Gross profit | | 480,347 | | | 445,426 | | | 426,614 |
| Selling expenses | | 238,035 | | | 234,982 | | | 212,580 |
| General and administrative expenses | | 72,089 | | | 62,009 | | | 62,609 |
| Restructuring charges | | | 1,725 | | | - | | | 829 |
| | | | | | | | | | | |
| Operating income | | 168,498 | | | 148,435 | | | 150,596 |
| Interest expense | | 71,947 | | | 70,543 | | | 75,648 |
| Loss on extinguishment of debt | | | 13,376 | | | | - | | | - |
| Other (income) expense, net | | | (6,815) | | | (7,414) | | | 8,972 |
| | | | | | | | | | | |
| Income from continuing operations before provision for income taxes | | 89,990 | | | 85,306 | | | 65,976 |
| Provision for income taxes | | | 33,533 | | | 30,497 | | | 23,688 |
| | | | | | | | | | | |
| Income from continuing operations | | 56,457 | | | 54,809 | | | 42,288 |
| Loss from discontinued operations, net of income taxes | | | (134) | | | | (262) | | | (379) |
| | | | | | | | | | | |
| Net income | | $ | 56,323 | | $ | 54,547 | | $ | 41,909 |
See notes to consolidated financial statements.
YANKEE HOLDING CORP. AND SUBSIDIARIES
CONSOLIDATED STATEMENTS OF COMPREHENSIVE INCOME
(in thousands)
| | Fifty-Two | | | Fifty-Two | | | Fifty-Two | |
| | Weeks Ended | | | Weeks Ended | | | Weeks Ended | |
| | December 29, 2012 | | | December 31, 2011 | | | December 31, 2011 | |
| | | | | | | | | | |
| Net income | | $ | 56,323 | | | $ | 54,547 | | | $ | 41,909 | |
| Other comprehensive income (loss), net of tax: | | | | | | | | | | | | |
| Foreign currency translation adjustments | | | 1,482 | | | | (535 | ) | | | (462 | ) |
| Unrealized gain on interest rate swaps, net of tax | | | - | | | | 712 | | | | 5,249 | |
| Other comprehensive income, net of tax | | | 1,482 | | | | 177 | | | | 4,787 | |
| | | | | | | | | | | | | |
| Comprehensive income | | $ | 57,805 | | | $ | 54,724 | | | $ | 46,696 | |
See notes to consolidated financial statements.
YANKEE HOLDING CORP. AND SUBSIDIARIES
CONSOLIDATED STATEMENTS OF CHANGES IN STOCKHOLDER'S EQUITY
(in thousands, except treasury shares)
| | | | Common Stock | | | | | | | | Treasury Stock | | | | Accumulated | | | | Accumulated | | | | | |
| | | | Shares | | | | Amount | | | | Capital | | | | Shares | | | | Amount | | | | Deficit | | | | Loss | | | | Total | |
| | | | | | | | | | | | | | | | | | | | | | | | | | | | | | | | | |
| BALANCE, JANUARY 2, 2010 | | | 500 | | | | 418,187 | | | | 2,419 | | | | 1,120 | | | | (790 | ) | | | (388,425 | ) | | | (8,148 | ) | | | 23,243 | |
| Issuance of common stock | | | — | | | | — | | | | 40 | | | | — | | | | — | | | | — | | | | — | | | | 40 | |
| Repurchase of common stock | | | — | | | | — | | | | — | | | | 838 | | | | (933 | ) | | | — | | | | — | | | | (933 | ) |
| Equity-based compensation expense | | | — | | | | — | | | | 962 | | | | — | | | | — | | | | — | | | | — | | | | 962 | |
| Net income | | | — | | | | — | | | | — | | | | — | | | | — | | | | 41,909 | | | | — | | | | 41,909 | |
| Other comprehensive income, net of tax | | | — | | | | — | | | | — | | | | — | | | | — | | | | — | | | | 4,787 | | | | 4,787 | |
| | | | | | | | | | | | | | | | | | | | | | | | | | | | | | | | | |
| | | | | | | | | | | | | | | | | | | | | | | | | | | | | | | | | |
| BALANCE, JANUARY 1, 2011 | | | 500 | | | | 418,187 | | | | 3,421 | | | | 1,958 | | | | (1,723 | ) | | | (346,516 | ) | | | (3,361 | ) | | | 70,008 | |
| | | | | | | | | | | | | | | | | | | | | | | | | | | | | | | | | |
| Issuance of common stock | | | - | | | | - | | | | 20 | | | | - | | | | - | | | | - | | | | - | | | | 20 | |
| Repurchase of common stock | | | - | | | | (776 | ) | | | - | | | | 61 | | | | (86 | ) | | | - | | | | - | | | | (862 | ) |
| Equity-based compensation expense | | | - | | | | - | | | | 820 | | | | - | | | | - | | | | - | | | | - | | | | 820 | |
| Contributions by YCC Holdings LLC | | | - | | | | - | | | | 13,457 | | | | - | | | | - | | | | - | | | | - | | | | 13,457 | |
| Dividend to YCC Holdings LLC | | | - | | | | - | | | | - | | | | - | | | | - | | | | (19,256 | ) | | | - | | | | (19,256 | ) |
| Net income | | | - | | | | - | | | | - | | | | - | | | | - | | | | 54,547 | | | | - | | | | 54,547 | |
| Other comprehensive income, net of tax | | | - | | | | - | | | | - | | | | - | | | | - | | | | - | | | | 177 | | | | 177 | |
| | | | | | | | | | | | | | | | | | | | | | | | | | | | | | | | | |
| BALANCE, DECEMBER 31, 2011 | | | 500 | | | | 417,411 | | | | 17,718 | | | | 2,019 | | | | (1,809 | ) | | | (311,225 | ) | | | (3,184 | ) | | | 118,911 | |
| | | | | | | | | | | | | | | | | | | | | | | | | | | | | | | | | |
| Issuance of common stock | | | - | | | | - | | | | 36 | | | | - | | | | - | | | | - | | | | - | | | | 36 | |
| Repurchase of common stock | | | - | | | | (2,623 | ) | | | - | | | | - | | | | - | | | | - | | | | - | | | | (2,623 | ) |
| Equity-based compensation expense | | | - | | | | - | | | | 753 | | | | - | | | | - | | | | - | | | | - | | | | 753 | |
| Contributions by YCC Holdings LLC | | | - | | | | - | | | | 11,637 | | | | - | | | | - | | | | - | | | | - | | | | 11,637 | |
| Dividend to YCC Holdings LLC | | | - | | | | - | | | | - | | | | - | | | | - | | | | (32,389 | ) | | | - | | | | (32,389 | ) |
| Net income | | | - | | | | - | | | | - | | | | - | | | | - | | | | 56,323 | | | | - | | | | 56,323 | |
| Other comprehensive income, net of tax | | | - | | | | - | | | | - | | | | - | | | | - | | | | - | | | | 1,482 | | | | 1,482 | |
| | | | | | | | | | | | | | | | | | | | | | | | | | | | | | | | | |
| BALANCE, DECEMBER 29, 2012 | | | 500 | | | $ | 414,788 | | | $ | 30,144 | | | | 2,019 | | | $ | (1,809 | ) | | $ | (287,291 | ) | | $ | (1,702 | ) | | $ | 154,130 | |
See notes to consolidated financial statements
YANKEE HOLDING CORP. AND SUBSIDIARIES
CONSOLIDATED STATEMENTS OF CASH FLOWS
(in thousands)
| | | Fifty-Two Weeks Ended December 29, 2012 | | | Fifty-Two Weeks Ended December 31, 2011 | | | Fifty-Two Weeks Ended January 1, 2011 | |
| CASH FLOWS PROVIDED BY OPERATING ACTIVITIES: | | | | | | | | | |
| Net income | | $ | 56,323 | | | $ | 54,547 | | | $ | 41,909 | |
| Adjustments to reconcile net income to net cash provided by operating activities: | | | | | | | | | | | | |
| Realized (gain) loss on derivative contracts | | | (7,652 | ) | | | (6,403 | ) | | | 9,166 | |
| Depreciation and amortization | | | 31,898 | | | | 41,669 | | | | 42,978 | |
| Unrealized (gain) loss on marketable securities | | | (171 | ) | | | 50 | | | | (83 | ) |
| Equity-based compensation expense | | | 753 | | | | 820 | | | | 962 | |
| Deferred taxes | | | 11,506 | | | | 10,321 | | | | 3,931 | |
| Loss on extinguishment of debt | | | 13,376 | | | | - | | | | - | |
| Restructuring charges | | | 1,070 | | | | - | | | | - | |
| Non-cash adjustments related to restructuring | | | - | | | | - | | | | 10 | |
| Loss on disposal and impairment of property and equipment | | | 382 | | | | 1,411 | | | | 213 | |
| Marketable securities | | | - | | | | - | | | | 22 | |
| Changes in assets and liabilities: | | | | | | | | | | | | |
| Accounts receivable | | | (5,569 | ) | | | (10,076 | ) | | | (3,482 | ) |
| Inventory | | | (1,696 | ) | | | (8,175 | ) | | | (8,450 | ) |
| Prepaid expenses and other assets | | | (405 | ) | | | 4,757 | | | | (617 | ) |
| Accounts payable | | | 4,064 | | | | (5,182 | ) | | | 4,682 | |
| Income taxes | | | 13,154 | | | | 168 | | | | 18,175 | |
| Accrued expenses and other liabilities | | | 8,261 | | | | (3,120 | ) | | | 989 | |
| | | | | | | | | | | | | |
| | | | | | | | | | | | | |
| NET CASH PROVIDED BY OPERATING ACTIVITIES | | | 125,294 | | | | 80,787 | | | | 110,405 | |
| | | | | | | | | | | | | |
| CASH FLOWS USED IN INVESTING ACTIVITIES: | | | | | | | | | | | | |
| Purchases of property and equipment | | | (25,516 | ) | | | (24,295 | ) | | | (17,651 | ) |
| Proceeds from sale of property and equipment | | | - | | | | 47 | | | | 202 | |
| | | | | | | | | | | | | |
| | | | | | | | | | | | | |
| NET CASH USED IN INVESTING ACTIVITIES | | | (25,516 | ) | | | (24,248 | ) | | | (17,449 | ) |
| | | | | | | | | | | | | |
| CASH FLOWS USED IN FINANCING ACTIVITIES: | | | | | | | | | | | | |
| Borrowings under Senior Secured Credit Facility | | | 15,000 | | | | 150,000 | | | | 76,000 | |
| Borrowings under Senior Secured Asset-Based Credit Facility | | | 81,000 | | | | - | | | | - | |
| Borrowings under Term Loan Facility | | | 717,750 | | | | - | | | | - | |
| Repayments under Senior Secured Credit Facility and Senior Notes | | | (718,125 | ) | | | (150,000 | ) | | | (164,000 | ) |
| Payments of call premiums and fees for extinguishment of debt | | | (6,763 | ) | | | - | | | | - | |
| Repayments under Term Loan Facility | | | (70,625 | ) | | | - | | | | - | |
| Repayments under Senior Secured Asset-Based Credit Facility | | | (81,000 | ) | | | | | | | | |
| Financing costs | | | (11,579 | ) | | | (468 | ) | | | - | |
| Contributions by YCC Holdings LLC | | | - | | | | 3,000 | | | | - | |
| Dividend to YCC Holdings LLC | | | (32,389 | ) | | | (19,256 | ) | | | - | |
| Proceeds from issuance of common stock | | | 36 | | | | 20 | | | | 40 | |
| Repurchase of common stock | | | (2,623 | ) | | | (862 | ) | | | (933 | ) |
| Principal payments on capital lease obligations | | | (1,452 | ) | | | (853 | ) | | | (349 | ) |
| | | | | | | | | | | | | |
| | | | | | | | | | | | | |
| NET CASH USED IN FINANCING ACTIVITIES | | | (110,770 | ) | | | (18,419 | ) | | | (89,242 | ) |
| | | | | | | | | | | | | |
| EFFECT OF EXCHANGE RATE CHANGES ON CASH | | | 138 | | | | - | | | | (96 | ) |
| | | | | | | | | | | | | |
| NET (DECREASE) INCREASE IN CASH | | | (10,854 | ) | | | 38,120 | | | | 3,618 | |
| CASH, BEGINNING OF YEAR | | | 50,833 | | | | 12,713 | | | | 9,095 | |
| | | | | | | | | | | | | |
| | | | | | | | | | | | | |
| CASH, END OF YEAR | | $ | 39,979 | | | $ | 50,833 | | | $ | 12,713 | |
| | | | | | | | | | | | | |
| SUPPLEMENTAL DISCLOSURES OF CASH FLOW INFORMATION: | | | | | | | | | | | | |
| Cash paid during the year for: | | | | | | | | | | | | |
| Interest | | $ | 74,149 | | | $ | 66,591 | | | $ | 71,016 | |
| | | | | | | | | | | | | |
| Income taxes | | $ | 8,754 | | | $ | 19,832 | | | $ | 1,345 | |
| | | | | | | | | | | | | |
| Net change in accrued purchases of property and equipment | | $ | (828 | ) | | $ | (337 | ) | | $ | (368 | ) |
| Noncash Financing Activities: | | | | | | | | | | | | |
| Noncash contribution by YCC Holdings LLC | | $ | 11,637 | | | $ | 10,457 | | | $ | - | |
| Capital lease obligations related to equipment purchase | | $ | 3,321 | | | $ | 2,097 | | | $ | 2,694 | |
See notes to consolidated financial statements.
YCC HOLDINGS LLC AND SUBSIDIARIES
YANKEE HOLDING CORP. AND SUBSIDIARIES
NOTES TO CONSOLIDATED FINANCIAL STATEMENTS
FOR THE FIFTY-TWO WEEKS ENDED DECEMBER 29, 2012, DECEMBER 31, 2011
AND JANUARY 1, 2011
1. NATURE OF BUSINESS
This Annual Report on Form 10-K is a combined report of YCC Holdings LLC (“YCC Holdings”) and Yankee Holding Corp. (“Holding Corp.”), a direct 100% owned subsidiary of YCC Holdings. Unless the context indicates otherwise, references to the “Companies” and “Company” refers to YCC Holdings together with its direct and indirect subsidiaries, including Holding Corp.
YCC Holdings and subsidiaries (“Yankee Candle” or the “Company”) is a leading designer, manufacturer and branded marketer of premium scented candles in the giftware industry. The strong brand equity of the Yankee Candle brand, coupled with its vertically integrated multi-channel business model, have enabled the Company to be a market leader in the premium scented candle market for many years. The Company designs, develops, manufactures, and distributes the majority of the products it sells which allows the Company to offer distinctive, trend-appropriate products for every season, every customer, and every room in your home. The Company has a 43-year history of offering its distinctive products and marketing them as affordable luxuries for everyone on your list. The Company offers a broad assortment of highly scented candles, innovative home fragrance products, and candle related home décor accessories in a variety of compelling fragrances, colors, styles, and price points.
The Company sells its products through several channels including wholesale customers who operate approximately 27,800 locations in North America, 568 Company-owned and operated Yankee Candle retail stores in 46 states and in one province in Canada as of December 29, 2012, a direct mail catalog, an Internet web site ( www.yankeecandle.com ) and the Company’s subsidiary Yankee Candle Company (Europe) LTD (“YCE”), which has an international wholesale customer network of approximately 5,900 locations and distributors covering 55 countries.
2. ORGANIZATION AND SUMMARY OF SIGNIFICANT ACCOUNTING POLICIES
Organization
YCC Holdings and Holding Corp. are holding companies with no direct operations. Their principal assets are the indirect equity interests in The Yankee Candle Company, Inc. (“Yankee Candle”), and all of their operations are conducted through Yankee Candle, the wholly owned operating subsidiary of Holding Corp. Holding Corp. is a wholly owned subsidiary of YCC Holdings. YCC Holdings is a wholly owned subsidiary of Yankee Candle Investments LLC (“Yankee Investments”), which is in turn a wholly owned subsidiary of Yankee Candle Group LLC (“Yankee Group”). See the entity chart below:

In February 2011, Yankee Investments and Yankee Finance, Inc. (“Yankee Finance”) were formed in connection with the co-issuance of $315.0 million Senior PIK Notes (as defined below) by YCC Holdings and Yankee Finance. In connection with the issuance of the Senior PIK Notes, the equity interests in YCC Holdings were exchanged for new equity interests in its newly formed parent, Yankee Investments. Pursuant to this exchange, holders of Class A, Class B and Class C common units in YCC Holdings exchanged such units on a one for one basis for an identical interest in Class A, Class B, and Class C common units of Yankee Investments. After the exchange, each unit holder had the same ownership interest with the same rights and features in Yankee Investments that it previously had in YCC Holdings. Subsequent to the exchange, all outstanding Class A, B and C common units in YCC Holdings were converted to 1,000 Common Units in YCC Holdings, all of which are now held by its parent and sole member, Yankee Investments.
In February 2011, YCC Holdings and Yankee Finance co-issued $315.0 million of 10.25%/11.00% Senior Notes due 2016 (the “Senior PIK Notes”) pursuant to an Indenture at a discount of $6.3 million for net proceeds of $308.7 million. Issuance costs related to the Senior PIK Notes were $9.7 million, of which $7.8 million were paid for by YCC Holdings and $1.9 million were paid for by Holding Corp. The costs paid for by Holding Corp. have been reflected as a dividend to YCC Holdings in the accompanying Holding Corp.’s consolidated statement of stockholder’s equity.
The proceeds from the Senior PIK Notes were used to pay transaction costs (exclusive of the amounts paid by Holding Corp.) and make a payment of $300.8 million to Yankee Investments which in turn made payments of $297.8 million to holders of Yankee Investments’ Class A common units and payments of $3.0 million in aggregate to holders of Yankee Investments’ Class B and Class C common units. The payments to the Class A common unit holders represent a partial return of their original investment and are reflected as an equity transaction by Yankee Investments. The payments to the Class B and Class C common unit holders who are members of management and directors of Holding Corp. did not affect the liquidation amounts for such units and accordingly are reflected as general and administrative expense in both YCC Holdings’ and Holding Corp.’s accompanying consolidated statements of operations for the fifty-two weeks ended December 31, 2011 and as a contribution by YCC Holdings in Holding Corp.’s accompanying consolidated statement of stockholder’s equity for the fifty-two weeks ended December 31, 2011.
In the fiscal second quarter of 2011, the Companies formed Yankee Group, a Delaware limited liability company. Yankee Group is the parent of Yankee Investments. The members of Yankee Group include certain funds affiliated with Madison Dearborn Partners, LLC (“Madison Dearborn”), as well as certain management and directors of Holding Corp. In connection with the formation of Yankee Group, a second exchange of equity interests occurred, whereby holders of Class A, Class B and Class C common units in Yankee Investments exchanged such units on a one for one basis for an identical interest in Class A, Class B, and Class C common units of Yankee Group. After the exchange, each unit holder had the same ownership interest with the same rights and features in Yankee Group that it previously had in Yankee Investments. As of December 31, 2011, all outstanding common units of Yankee Investments were owned by Yankee Group.
Summary of Significant Accounting Policies
FISCAL YEAR—The Company's fiscal year is the fifty-two or fifty-three weeks ending the Saturday closest to December 31.
PRINCIPLES OF CONSOLIDATION—The accompanying consolidated financial statements include the accounts of the Company and its wholly owned subsidiaries. All intercompany accounts and transactions have been eliminated.
ACCOUNTING ESTIMATES—The preparation of financial statements in conformity with accounting principles generally accepted in the United States of America requires management to make estimates and assumptions that affect the reported amounts of assets and liabilities and disclosure of contingent assets and liabilities at the date of the financial statements and the reported amounts of revenues and expenses during the reporting period. Actual results could differ from those estimates.
SALES RECOGNITION—The Company sells its products both directly to retail customers and through wholesale channels. Merchandise sales are recognized upon transfer of ownership, including passage of title to the customer and transfer of the risk of loss related to those goods. In the wholesale segment, products are shipped "free on board" shipping point. In cases where the customer bears the risk of loss during shipment, the Company recognizes revenue upon shipment. In some cases the Company has a policy of absorbing losses in the event of damaged and lost shipments. For these customers the Company recognizes revenue based on the receipt date by the customer. In the retail stores, transfer of title takes place at the point of sale and in respect to Consumer Direct and Fundraising when the risk of loss transfers. There are no situations, either in the wholesale or retail segments, where legal risk of loss does not transfer immediately upon receipt by customers. Although the Company does not provide a contractual right of return, in the course of arriving at practical business solutions to various claims, the Company has allowed sales returns and allowances. In these situations, customer claims for credit or return due to damage, defect, shortage or other reason must be pre-approved by the Company before credit is issued or such product is accepted for return. Such returns have not precluded sales recognition because the Company has a long history with such return activity, which is used in estimating a reserve. This accrual, however, is subject to change if actual returns differ from historical and expected return rates. In the wholesale and international segments, the Company has included an allowance in its financial statements representing its estimated obligation related to promotional marketing activities. In addition to returns, the Company bears credit risk relative to wholesale customers. The Company has provided an allowance for bad debts in the financial statements based on estimates of the creditworthiness of customers. Actual results could differ from these estimates and could affect operating results.
The Company sells gift cards to customers in both Yankee Candle and other third party retail stores and through consumer direct operations. The gift cards do not have an expiration date. At the point of sale of a gift card, the Company records deferred revenue. The Company recognizes income from gift cards when the gift card is redeemed by the customer. Gift card breakage income is recorded based on the Company's historical redemption pattern (which is subject to change if or when actual patterns of redemptions change). Based on historical information, the Company determined that redemptions decreased to a de minimis amount 36 months after issuance and that approximately 8% of the gift cards value will never be redeemed. Gift card breakage income is recorded monthly in proportion to the actual redemption of gift cards in that month based on the Company's historical redemption pattern. Gift card breakage income is included in sales in the consolidated statements of operations.
SALES INCENTIVES AND TRADE PROMOTIONAL ALLOWANCES—The Company offers a variety of incentives and discounts to retail, wholesale and international customers through various programs to support the sales of its products. In our wholesale and international segments, these incentives and discounts include cash discounts, price allowances, volume-based rebates, slotting fees and cooperative advertising. In retail, discounts include direct to consumer incentives such as coupons and temporary price reductions. These incentives and discounts are reflected as a reduction of gross sales to arrive at net sales, with the exception of some cooperative advertising expenses, which are recorded in advertising expense. Estimates of trade promotion liabilities for promotional program costs incurred, but unpaid, are generally based on estimates of the quantity of customer sales, timing of promotional activities and forecasted costs for activities within the promotional programs. Settlement of these liabilities sometimes occurs in periods subsequent to the date of the promotion activity.
SHIPPING AND HANDLING COSTS—The Company classifies shipping and handling costs associated with moving merchandise to our retail and wholesale facilities in costs of sales on the consolidated statements of operations.
CASH AND CASH EQUIVALENTS—The Company considers all short-term investments with maturities of three months or less at the date of purchase to be cash equivalents. The Company had no cash equivalents as of December 29, 2012 and December 31, 2011. The Company's cash includes interest-bearing and non-interest bearing accounts.
INVENTORY—The Company values its inventories using the first-in first-out ("FIFO") basis. Inventory quantities on hand are regularly reviewed, and where necessary provisions for excess and obsolete inventory are recorded based primarily on the Company's forecast of product demand and production requirements.
PROPERTY AND EQUIPMENT—Property and equipment are stated at cost and are depreciated on the straight-line method based on the estimated useful lives of the various assets. The estimated useful lives are as follows:
| | | Years | |
| Buildings and improvements | | | 5-40 | |
| Computer equipment | | | 2-6 | |
| Furniture and fixtures | | | 5-10 | |
| Equipment | | | 2-10 | |
| Vehicles | | | 3-5 | |
Leasehold improvements are amortized using the straight-line method over the lesser of the estimated life of the improvement or the remaining life of the lease. Expenditures for normal maintenance and repairs are charged to expense as incurred
MARKETABLE SECURITIES—The Company classifies the marketable securities held in its deferred compensation plan as trading securities under Accounting Standards Codification ("ASC") Topic 320 "Investments—Debt and Equity Securities." In accordance with the provisions of this topic, the investment balance is stated at fair market value, which is based on observable market prices. Unrealized gains and losses are reflected in earnings; realized gains and losses are also reflected in earnings and are computed using the specific-identification method. The assets held in the deferred compensation plan reflect amounts due to employees, but are available for general creditors of the Company in the event the Company becomes insolvent. The Company has recorded the investment balance as a non-current asset within “other assets” and a long-term liability within "other long-term liabilities" on the accompanying consolidated balance sheets.
SEGMENT REPORTING—The Company has segmented its operations in a manner that reflects how its chief operating decision-maker (the "CEO") currently reviews the results of the Company and its subsidiaries' businesses. The CEO evaluates the Company’s retail, wholesale, and international operations based on an "operating earnings" measure. Such measure gives recognition to specifically identifiable operating costs such as cost of sales and selling expenses. Costs and income not specifically identifiable are included within the unallocated/corporate/other column and include administrative costs, interest expense, fair value changes of derivative contracts, restructuring charges for continuing operations and other costs not allocated to specific operating segments and are accordingly reflected in the unallocated/corporate/other column of the Company's segment footnote. The Company does not account for or report assets, capital expenditures or depreciation and amortization by segment to the CEO.
GOODWILL AND INTANGIBLE ASSETS—The Company accounts for goodwill and intangible assets in accordance with ASC Topic 350 "Intangibles—Goodwill and Other." Under this guidance, goodwill and certain intangible assets with indefinite lives are not amortized but are subject to an annual impairment test which is conducted in the Company’s fourth fiscal quarter. For goodwill, the annual impairment evaluation compares the fair value of each of the Company's reporting units to their respective carrying values. Fair values of the reporting units are derived through a combination of market-based and income-based approaches, each of which were weighted at 50% for the impairment test performed as of November 3, 2012.
IMPAIRMENT OF OTHER LONG-LIVED ASSETS—The Company reviews its other long-lived assets (property and equipment and customer lists) periodically for impairment whenever events or changes in circumstances occur that indicate that the carrying value of the assets may not be recoverable. This review is based on the Company's ability to recover the carrying value of the assets from expected undiscounted future cash flows. If an impairment is indicated, the Company measures the loss based on the fair value of the assets using various valuation techniques. If an impairment loss exists, the amount of the loss is recorded in the consolidated statements of operations.
RESTRUCTURING CHARGES—The Company accounts for its restructuring plans in accordance with the ASC Topic 420 “Exit or Disposal Cost Obligations.” Under this guidance, a liability for costs associated with an exit or disposal activity is recognized and measured at fair value when the liability is incurred.
ADVERTISING—The Company expenses advertising costs as they are incurred. Advertising expense, which includes cooperative advertising programs, was $18.8 million, $20.6 million and $15.6 million for the fifty-two weeks ended December 29, 2012, December 31, 2011, and January 1, 2011, respectively. Cooperative advertising expense, included in advertising expense, was $0.7 million, $1.0 million and $0.7 million for the fifty-two weeks ended December 29, 2012, December 31, 2011, and January 1, 2011, respectively. Advertising expenses are presented in selling expenses in the consolidated statements of operations.
INCOME TAXES—Holding Corp. and YCC Holdings recognize deferred tax liabilities and assets for the expected future tax consequences of temporary differences between the carrying amounts and the tax basis of assets and liabilities using enacted tax rates in effect in the years in which the differences are expected to reverse. Holding Corp. and YCC Holdings recognize the expected future tax consequences of uncertain tax positions in accordance with ASC 740-10 (FIN 48). Uncertain tax position reserves are subject to change in subsequent periods to reflect audit settlements, expired statutes of limitation for assessing additional taxes, relevant case law developments, and changes in tax law. The Company recognizes accrued interest and penalties, if any, related to unrecognized tax benefits in the provision for income taxes. Valuation allowances are established when necessary to reduce deferred tax assets to the amount that is more likely than not to be realized.
Holding Corp. and YCC Holdings are included in the consolidated federal income tax return of parent company, Yankee Investments. Yankee Investments has elected to be taxed as a corporation for federal income tax purposes. Holding Corp. and YCC Holdings, a single-member limited liability company of Yankee Investments, account for income taxes under the separate return method, as if Holding Corp. and YCC Holdings filed separate federal corporate income tax returns.
Holding Corp.’s income taxes payable balance as of December 29, 2012, is reduced by the tax benefit of interest and other expense deductions related to the February 2011 debt offering by YCC Holdings. The tax benefit of the deductions is treated as a capital contribution from YCC Holdings to Holding Corp. Thus, the net income taxes payable balance for the consolidated group is recorded at the Holding Corp. level.
FAIR VALUE OF FINANCIAL INSTRUMENTS—The Company follows the guidance prescribed by ASC Topic 820 "Fair Value Measurement." The Fair Value Measurements and Disclosures Topic defines fair value and provides a consistent framework for measuring fair value under generally accepted accounting principles (“GAAP”), including financial statement disclosure requirements. As specified under this Topic, valuation techniques are based on observable and unobservable inputs. Observable inputs reflect readily obtainable data from independent sources, while unobservable inputs reflect market assumptions.
FOREIGN OPERATIONS—Assets and liabilities of foreign operations are translated into U.S. dollars at the exchange rate on the balance sheet date. The results of foreign subsidiary operations are translated using average rates of exchange during each reporting period. Gains and losses upon translation are deferred and reported as a component of accumulated other comprehensive loss. Foreign currency transaction gains or losses, whether realized or unrealized, are recorded directly in the consolidated statements of operations and are generally not material.
Recent Accounting Pronouncements
Disclosures Relating To Comprehensive Income (Loss)
In December 2011, the FASB issued ASU No. 2011-12, Comprehensive Income (Topic 220): Deferral of the Effective Date for Amendments to the Presentation of Reclassifications of Items Out of Accumulated Other Comprehensive Income in Accounting Standards Update No. 2011-05 (“ASU 2011-12”) .ASU 2011-12 defers the presentation of the reclassification adjustments in the income statement but does not defer the presentation of the reclassification adjustments in other comprehensive income. The Companies have presented the reclassification adjustments in other comprehensive income in the Condensed Consolidated Statements of Comprehensive Income herein in accordance with ASU 2011-12.
In February 2013, the FASB issued ASU No. 2013-02, Comprehensive Income (Topic 220): Reporting of Amounts Reclassified Out of Accumulated Other Comprehensive Income (“ASU 2013-02”) to improve the reporting of reclassifications out of Accumulated Other Comprehensive Income ("AOCI"). ASU 2013-12 does not change the current requirements for reporting net income or other comprehensive income in the financial statements. Under ASU 2013-02, an entity is required to provide information about the amounts reclassified out of AOCI by component. In addition, an entity is required to present, either on the face of the financial statements or in the notes, significant amounts reclassified out of AOCI by the respective line items of net income, but only if the amount reclassified is required under U.S. GAAP to be reclassified in its entirety in the same reporting period. For amounts that are not required under U.S. GAAP to be reclassified in their entirety to net income, an entity is required to cross-reference to other disclosures that provide additional details about those amounts. The adoption of ASU 2013-02 is effective for the Companies on December 30, 2012 and will affect disclosures only. Therefore the adoption of this accounting standard is not expected to have a material impact of the Companies’ consolidated financial statements.
Recently Adopted Accounting Pronouncements
Goodwill
The FASB issued updated authoritative guidance in September 2011 to amend previous guidance on the testing of goodwill for impairment; the guidance is effective for annual and interim goodwill impairment tests performed for fiscal years beginning after December 15, 2011, with early adoption permitted. The guidance provides entities with the option of first assessing qualitative factors to determine whether it is more likely than not that the fair value of a reporting unit is less than its carrying amount. If it is determined, on the basis of qualitative factors, that the fair value of the reporting unit is more likely than not less than the carrying amount, the two-step impairment test would be required. The Companies adopted this new accounting standard during 2012 choosing not to elect the qualitative option for purposes of 2012 impairment testing.
Fair Value Measurements
The FASB issued updated authoritative guidance in May 2011 to amend fair value measurements and related disclosures; the guidance became effective for the Company on a prospective basis at the beginning of its 2012 fiscal year. This guidance relates to a major convergence project of the FASB and the International Accounting Standards Board to improve International Financial Reporting Standards (“IFRS”) and U.S. GAAP. This guidance results in a consistent definition of fair value and common requirements for measurement of and disclosure about fair value between IFRS and U.S. GAAP. The guidance also changes some fair value measurement principles and enhances disclosure requirements related to activities in Level 3 of the fair value hierarchy. The Companies adopted this new accounting standard on January 1, 2012 and the adoption of this new accounting standard did not have an impact on the Companies’ consolidated financial statements.
3. LONG-TERM DEBT
Long-term debt consisted of the following at December 29, 2012 and December 31, 2011 (in thousands):
| | | December 29, | | December 31, |
| 2012 | 2011 |
| Holding Corp. | | | | | | |
| Senior secured term loan facility | | $ | - | | $ | 388,125 |
| Senior secured term loan facility, net of unamortized discount of $6,201 at December 29, 2012 | | | 648,174 | | | - |
| Senior notes due 2015 | | | 10,000 | | | 325,000 |
| Senior subordinated notes due 2017 | | | 188,000 | | | 188,000 |
| Less current portion | | | - | | | (12,042) |
| Total Holding Corp. | | | 846,174 | | | 889,083 |
| Senior PIK notes due 2016, net of unamortized discount of $4,334 at December 29, 2012 and $5,424 at December 31, 2011 | | | 310,666 | | | 309,576 |
| Total YCC Holdings | | $ | 1,156,840 | | $ | 1,198,659 |
Senior Secured Credit Facility
As of December 31, 2011, Yankee Candle’s senior secured credit facility (the “Senior Secured Credit Facility”) consisted of a $650.0 million senior secured term loan facility (the “Prior Term Facility”) with outstanding borrowings of $388.1 million and a senior secured revolving credit facility (“Prior Revolving Facility”) of $140.0 million with no outstanding borrowings.
Refinancing of the Senior Secured Credit Facility and Repurchase of $315 million of Yankee Candle’s 8 ½% Senior Notes Due 2015
On April 2, 2012, Yankee Candle refinanced its Senior Secured Credit Facility and $315.0 million of its Senior Notes due 2015 by entering into a senior secured term loan facility (the “Term Loan Facility”) and by entering into a senior secured asset-based credit facility (the “ABL Facility”).
Under the Term Loan Facility, Yankee Candle borrowed $725.0 million resulting in proceeds of $717.8 million, net of original issue discount. At closing, on April 2, 2012, a portion of the proceeds from the Term Loan Facility were used to (i) redeem $180.0 million of Yankee Candle’s Senior Notes due 2015 at a call premium of 2.125%, (ii) repay $403.1 million of outstanding debt on the Company’s old Senior Secured Credit Facility (consisting of $388.1 million outstanding under the Prior Term Facility and $15.0 outstanding under the Prior Revolving Facility), and (iii) pay fees and expenses of $11.5 million related to the foregoing. On April 13, 2012, the Company used the remaining proceeds and borrowings under the ABL Facility to redeem an additional $135.0 million of the Senior Notes due 2015 at a call premium of 2.125%. As a result of the refinancing the Company recorded a loss on extinguishment of debt of $13.4 million during the fifty-two weeks ended December 29, 2012, comprised of the write-off of unamortized deferred financing fees of $6.7 million and call premiums of $6.7 million. The Company also recorded total deferred financing costs of $11.6 million, including $9.0 million related to the Term Loan Facility and $2.6 million related to the ABL Facility. The costs associated with the Term Loan Facility are being amortized using the interest method through the expiration date of the Term Loan Facility and the costs associated with the ABL Facility are being amortized on a straight line basis through the expiration date of the ABL Facility. Amortization of the discount is recorded as interest expense using the interest method.
Term Loan Facility
The Term Loan Facility matures on April 2, 2019; however, the maturity date of the Term Loan Facility will accelerate if the Senior Subordinated Notes and the Senior PIK Notes are not defeased, repurchased, refinanced or redeemed 91 days prior to their respective maturity dates. The Term Loan Facility is repayable in quarterly principal payments of $1.8 million with the balance due at maturity. However, in December 2012 the Company made a principal payment of $67.0 million, a portion of which was related to the excess cash flow provisions of the Term Loan Facility, as discussed below. As a result of the $67.0 million payment, no quarterly principal payments are due on the Term Loan Facility through its maturity and no amounts are classified as current in the accompanying consolidated balance sheet. Amounts repaid under the Term Loan Facility cannot be reborrowed. As of December 29, 2012, Yankee Candle’s Term Loan Facility had outstanding borrowings of $654.4 million.
Interest is payable on the Term Loan Facility at either (i) the Eurodollar Rate (subject to a 1.25% floor) plus 4.00% or (ii) the ABR (subject to a 2.25% floor) plus 3.00%. The default rate of interest will accrue (i) on the overdue principal amount of any loan at a rate of 2% in excess of the rate otherwise applicable to such loan and (ii) on any overdue interest or any other outstanding overdue amount at a rate of 2% in excess of the non-default interest rate then applicable to ABR loans. As of December 29, 2012, the interest rate applicable to the Term Loan Facility was 5.25%.
Yankee Candle's Term Loan Facility contains a financial covenant which requires that Yankee Candle maintain at the end of each fiscal quarter, commencing with the quarter ended December 29, 2012 through the quarter ending September 28, 2013, a consolidated net debt (net of cash and cash equivalents not to exceed $75.0 million) to Consolidated EBITDA ratio of no more than 7.00 to 1.00. As of December 29, 2012, Yankee Candle's actual net total leverage ratio was 4.06 to 1.00, as defined in the Term Loan Facility. As of December 29, 2012, total Holding Corp. debt (including Yankee Candle's capital lease obligations of $5.4 million and net of $40.0 million in cash) was approximately $817.8 million. Under Yankee Candle's Term Loan Facility, Consolidated EBITDA is defined as net income plus, interest, taxes, depreciation and amortization, further adjusted to add back extraordinary, unusual or non-recurring losses, non-cash stock option expense, fees and expenses related to the Merger, fees and expenses under the Management Agreement with our equity sponsor, restructuring charges or reserves, as well as other non-cash charges, expenses or losses, and further adjusted to subtract extraordinary, unusual or non-recurring gains, other non-cash income or gains, and certain cash contributions to our common equity.
In addition, the Term Loan Facility contains customary covenants and restrictions on Holding Corp. and its subsidiaries’ activities, including but not limited to, limitations on the incurrence of additional indebtedness, liens, negative pledges, guarantees, investments, loans, asset sales, mergers, acquisitions, prepayment of other debt, distributions, dividends, the repurchase of capital stock, transactions with affiliates and the ability to change the nature of its business or its fiscal year. All obligations under the Term Loan Facility are guaranteed by Holding Corp.’s and Yankee Candle’s domestic subsidiaries and are secured by a lien on substantially all of the assets of Holding Corp. and its domestic subsidiaries.
Asset-Based Credit Facility
On April 2, 2012, Yankee Candle, together with certain of its foreign subsidiaries, also entered into the ABL Facility with BofA, as agent, the other lenders party thereto.
The ABL Facility expires on April 2, 2017; however, the expiration date of the ABL Facility will accelerate if the Senior Subordinated Notes and the Senior PIK Notes are not defeased, repurchased, refinanced or redeemed 91 days prior to their respective maturity dates. The ABL Facility permits revolving borrowings of up to $175.0 million subject to eligible inventory and eligible accounts receivable balances. The ABL Facility is inclusive of sub-facilities for up to $25.0 million in swing line advances, up to $25.0 million for letters of credit, up to $10.0 million for borrowings by Yankee Candle’s Canadian subsidiary, up to $10.0 million for borrowings by Yankee Candle’s German subsidiary and up to $75.0 million for borrowing by YCE. Borrowings under the ABL Facility bear interest at a rate equal to either (i) LIBOR or the BofA rate plus the applicable margin or (ii) the prime rate plus the applicable margin. The applicable margin ranges from 0.50% to 2.00%, dependent on the currency of the borrowing. For purposes of determining interest rates, the applicable margin is subject to a variable grid, dependent on average daily excess availability calculated as of the immediately preceding fiscal quarter. As of December 29, 2012 the interest rate applicable to the ABL Facility was 2.0%.
The unused line fee payable under the ABL Facility is equal to (i) 0.50% per annum if less than 50% of the ABL Facility has been used on average during the immediately preceding fiscal quarter or (ii) 0.375% per annum if 50% or more of the ABL Facility has been utilized on average during the immediately preceding fiscal quarter.
The ABL Facility requires Yankee Candle and its subsidiaries to maintain a consolidated fixed charge coverage ratio of at least 1.0:1.0 during a covenant compliance event, which occurs if unused borrowing availability is less than the greater of (x) 10% of the maximum amount that can be borrowed under the ABL Facility, which amount is the lesser of $175.0 million and a borrowing formula based on eligible receivables and inventory (the “ABL Loan Cap”) and (y) $15.0 million and continues until excess availability has exceeded the amounts set forth herein for 30 consecutive days. As of December 29, 2012, the ABL Loan Cap was $141.3 million. As of December 29, 2012 Yankee Candle had outstanding letters of credit of $2.2 million resulting in available borrowing capacity of $139.1 million, or 98.5% of the Loan Cap. As such, Yankee Candle was not subject to the fixed charge coverage ratio.
In addition, the ABL Facility contains customary covenants and restrictions on Yankee Candle and its subsidiaries’ activities, including but not limited to, limitations on the incurrence of additional indebtedness, liens, negative pledges, guarantees, investments, loans, asset sales, mergers, acquisitions, prepayment of other debt, distributions, dividends, the repurchase of capital stock, transactions with affiliates, the ability to change the nature of its business or its fiscal year, enter into certain hedging agreements and enter into certain burdensome agreements. All obligations under the ABL Facility are guaranteed by Yankee Candle’s domestic subsidiaries and secured by a lien on substantially all of the assets of Yankee Candle and its domestic subsidiaries. Certain of the obligations under the ABL Facility are guaranteed by Yankee Candle’s foreign subsidiaries and are secured by a lien on substantially all of the assets of such foreign subsidiaries, which consist primarily of inventory and receivables.
Senior Notes and Senior Subordinated Notes
Yankee Candle's senior notes due 2015 bear interest at a per annum rate equal to 8.50%. Interest is paid every six months on February 15 and August 15. Yankee Candle’s senior subordinated notes due 2017 bear interest at a per annum rate equal to 9.75%. Interest is paid every six months on February 15 and August 15. The senior notes mature on February 15, 2015 and the senior subordinated notes mature on February 15, 2017. In April 2012, $315.0 million of the Senior Notes were redeemed in connection with the refinancing of the Senior Secured Credit Facility detailed above. As of December 29, 2012, the Company had $10.0 million outstanding under the Senior Notes and $188.0 million outstanding under the Senior Subordinated Notes. See Subsequent Event footnote for repayment of Senior Notes.
The indentures governing the senior notes and senior subordinated notes restrict the ability of Yankee Holding Corp., Yankee Candle and most or all of Yankee Candle’s subsidiaries to: incur additional debt; pay dividends or make other distributions on the Company's capital stock or repurchase capital stock or subordinated indebtedness; make investments or other specified restricted payments; create liens; sell assets and subsidiary stock; enter into transactions with affiliates; and enter into mergers, consolidations and sales of substantially all assets.
Obligations under the senior notes are guaranteed on an unsecured senior basis and obligations under the senior subordinated notes are guaranteed on an unsecured senior subordinated basis, by Yankee Holding Corp. and Yankee Candle's existing and future domestic subsidiaries. If Yankee Candle cannot make any payment on either or both series of notes, the guarantors must make the payment instead.
In the event of certain change in control events specified in the indentures governing these notes, Yankee Candle must offer to repurchase all or a portion of such notes at 101% of the principal amount of the such notes on the date of purchase, plus any accrued and unpaid interest to the date of repurchase.
Senior PIK Notes - YCC Holdings
In February 2011, YCC Holdings and Yankee Finance co-issued $315.0 million of Senior PIK Notes pursuant to an Indenture at a discount of $6.3 million for net proceeds of $308.7 million. Issuance costs related to the Senior PIK Notes were $9.7 million, of which $7.8 million were paid for by YCC Holdings and $1.9 million were paid for by Holding Corp.
Cash interest on the Senior PIK Notes accrues at a rate of 10.25% per annum, and PIK Interest (defined below) accrues at the cash interest rate plus 0.75%. YCC Holdings is required to pay interest on the Senior PIK Notes entirely in cash interest, unless the conditions described in the indenture are satisfied with respect to the related interest period, in which case, YCC Holdings may pay interest on the Senior PIK Notes for such interest period by increasing the principal amount of the Senior PIK Notes or by issuing new PIK Notes for up to the entire amount of the interest payment (in each case, “PIK Interest”) to the extent described in the related indenture.
YCC Holdings is indirectly dependent upon dividends from Yankee Candle to generate the funds necessary to meet its outstanding debt service obligations. Neither Yankee Candle nor Holding Corp. guarantees the Senior PIK Notes. Yankee Candle is not obligated to pay dividends to Holding Corp. and Holding Corp. is not obligated to pay dividends to YCC Holdings. Yankee Candle’s ability to pay dividends to Holding Corp. to permit Holding Corp. to pay dividends to YCC Holdings was restricted at December 29, 2012 by A) Yankee Candle’s Term Loan Facility, B) Yankee Candle’s ABL Facility and C) the indentures governing the Senior Notes and Senior Subordinated Notes. Because the Term Loan Facility, ABL Facility and the indentures governing Yankee Candle’s senior notes and senior subordinated notes each contain limitations on dividends, Yankee Candle is permitted to make dividends only to the extent it is permitted to do so at the time the dividend is made under each of these agreements. Yankee Candle redeemed the remaining $10.0 million in aggregate principal amount of the Senior Notes on February 15, 2013, at which time the obligations of Yankee Candle and the guarantors under the related indenture were discharged.
A) The ability of Yankee Candle to declare dividends to Holding Corp. is limited under the Term Loan Facility. Under the Term Loan Facility, Yankee Candle is permitted to make dividends to YCC Holdings, provided there is no default or event of default and the dividend payment would not cause the applicable Consolidated Net Interest Coverage Ratio (as defined in the agreement governing the Term Loan Facility) to be less than 2.0 to 1.0, in an amount equal to the sum of (a) $10.0 million and (b) the available excess cash flow based on provisions determined in Yankee Candle’s Term Loan Facility, together with certain equity and debt issuances which, to date, have not occurred and together with the receipt of certain cash and cash equivalents and certain investments. Available excess cash flow for Yankee Candle’s Term Loan Facility is defined as the aggregate cumulative amount of excess cash flow for all fiscal years commencing with the fiscal year ending December 29, 2012 and for all fiscal years ending after December 29, 2012 that is not required to prepay the term debt. On an annual basis, Yankee Candle is required to prepay the term debt by 50% of excess cash flow, which percentage is reduced to 25% if the Consolidated Net Total Leverage Ratio (as defined in the Term Loan Facility) is not greater than 4.0 to 1.0. Yankee Candle is not required to make a payment if the consolidated net total leverage ratio is not greater than 3.0 to 1.0. Excess cash flow is defined in the Term Loan Facility as consolidated net income of Holding Corp. and its restricted subsidiaries plus all non-cash charges (including depreciation, amortization, and deferred tax expense), non-cash losses on disposition of certain property, decreases in working capital and the net increase in deferred tax liabilities or net decrease in deferred tax assets, decreased by non-cash gains including gains or credits, cash paid for capital expenditures, acquisitions, certain other investments, regularly scheduled principal payments, voluntary prepayments and certain mandatory prepayments of principal on debt, transaction costs for certain debt, equity, recapitalization, acquisition and investment transactions, purchase price adjustments in connection with acquisitions and certain payments to the Company’s equity sponsor, increases in working capital and the net decrease in deferred tax liabilities or net increase in deferred tax assets, call premiums in connection with cancellation of indebtedness, and certain amounts paid in connection with an asset sale or recovery event.
Additionally, a basket of $137.1 million consisting of the cumulative retained (and not yet applied) available excess amount from the former Senior Secured Credit Facility was made available for dividends from Yankee Candle to YCC Holdings to be applied to cash interest payments on the Senior PIK Notes. As of December 29, 2012, a total basket of $168.2 million was available for dividends from Yankee Candle to YCC Holdings to be applied to cash interest payments on the Senior PIK Notes.
The calculation to determine if the Company has excess cash flow per the Term Loan Facility is prepared on an annual basis at the end of each fiscal year. The Company generated excess cash flow during 2012 of $74.6 million, of which 50% was required to prepay the term loan facility in accordance with the agreement. During the fourth quarter of 2012, the Company repaid $67.0 million of the Term Loan Facility which satisfied the excess cash flow payment.
For the fifty-two weeks ended December 31, 2011, Yankee Candle’s required excess cash flow payment was $12.0 million. This amount was classified as short-term debt on the accompanying condensed consolidated balance sheet at December 31, 2011 and was subsequently refinanced on a long term basis in April 2012.
B) Under the ABL Facility, Yankee Candle is permitted to make dividends to Holding Corp. (1) on an unlimited basis if certain tests are met and (2) also solely to fund interest payments on the Senior PIK notes subject to the restrictions described below.
(1) Yankee Candle is permitted to make dividends to Holding Corp. in an unlimited amount so long as (a) unused borrowing availability is greater than or equal to 15% of the ABL Loan Cap at the time of the making of such dividend and projected on a pro forma basis for the immediately succeeding six months following such dividend, except that, to the extent that the dividend is made during the “August Period”, or the August Period is included in such six month projections, then unused borrowing availability shall only be required to be greater than or equal to 10% of the ABL Loan Cap and (b) to the extent unused borrowing availability is less than 25% of the ABL Loan Cap and is projected to be less than 25% of the ABL Loan Cap for the immediately succeeding six months following such dividend (or 10%, in the case that the dividend is made in the August Period or the August Period is included in such six month projections), the consolidated fixed charge coverage ratio for the most recently ended period of twelve fiscal months preceding such dividend on a pro forma basis is greater than or equal to 1.1 to 1.0.
“August Period”, as used herein, means August 1st through the earlier of the date that the borrowing base certificate is filed for the month of August and the fifteenth business day after the end of the August fiscal month.
(2) Yankee Candle is permitted to make dividends to Holding Corp. and Holding Corp. is permitted to make dividends to YCC Holdings solely for the purpose of funding interest payments due on the Senior PIK Notes if (a) except for payments to be made during the August Period as to which there is no minimum unused borrowing availability requirement, unused borrowing availability is greater than or equal to 15% of the ABL Loan Cap at the time of the making of such dividend and projected on a pro forma basis for the immediately succeeding six months following such dividend and (b) to the extent unused borrowing availability is less than 25% of the ABL Loan Cap and is projected to be less than 25% of the ABL Loan Cap for the immediately succeeding six months following such dividend (or 10%, in the case that the August Period is included in such projected six month period), the consolidated fixed charge coverage ratio for the most recently ended period of twelve fiscal months preceding such dividend on a pro forma basis is greater than or equal to 1.1 to 1.0; provided that for purposes of satisfying the test in this clause (b), no dividend made during the month of August for the purpose of funding, in whole or in part, an interest payment on the Senior PIK Notes shall be included in the calculation of consolidated fixed charge coverage ratio.
C) The indentures governing Yankee Candle's Senior Notes and Senior Subordinated Notes permit Yankee Candle to pay dividends to Holding Corp. if: (i) there is no default or event of default under the indentures governing Yankee Candle’s notes; (ii) Yankee Candle would have a fixed charge coverage ratio of at least 2.0 to 1.0; and (iii) such dividend, together with the aggregate amount of all other “restricted payments” (as defined in such indentures) made by Yankee Candle and its restricted subsidiaries after February 6, 2007 (excluding certain restricted payments), is less than the sum (a) 50% of the Consolidated Net Income (as defined in such indentures) of Yankee Candle for the period (taken as one accounting period) from December 31, 2006 to the end of Yankee Candle’s most recently ended fiscal quarter for which internal financial statements are available at the time of such dividend (or, in the case such Consolidated Net Income for such period is a deficit, minus 100% of such deficit), plus (b) the proceeds from specified equity contributions or issuances of equity. In addition to the capacity described above, Yankee Candle has a “basket” of $35.0 million under the indentures from which it may make dividends in amount not to exceed $35.0 million (since the date of the issuance of Yankee Candle’s notes), so long as there is no default or event of defaults under the indentures. The ability of Yankee Candle and Holding Corp. to pay dividends to YCC Holdings and thus pay cash interest on the Senior PIK Notes is limited by Delaware law.
During the fifty-two weeks ended December 29, 2012 and December 31, 2011, Holding Corp. declared and paid dividends of $32.4 million and $19.3 million, respectively, to YCC Holdings to fund interest payments for the Senior PIK Notes, which decreased the amount available for future dividends. At December 29, 2012, the amount available for dividends from Yankee Candle to YCC Holdings was approximately $168.2 million.
Holding Corp. receives the tax benefit of the interest expense for YCC Holdings’ Senior PIK Notes. As such, in fiscal 2012 and fiscal 2011 Holding Corp. recorded non-cash contributions of $11.6 million and $10.5 million, respectively, from YCC Holdings. The contributions for fiscal 2012 and fiscal 2011 are shown as a contribution by YCC Holdings LLC in Holding Corp.’s respective consolidated statement of changes in stockholder’s equity and in Holding Corp.’s non-cash financing section of the respective consolidated statements of cash flows.
4. MEMBER’S DEFICIT, STOCKHOLDER’S EQUITY AND EQUITY-BASED COMPENSATION
On February 6, 2007, Yankee Candle, our “Predecessor” public company, merged (the “Merger”) with an affiliate of Madison Dearborn Partners, LLC (“MDP” or “Madison Dearborn”). In connection with the Merger, YCC Holdings acquired all of the outstanding capital stock of the Predecessor for approximately $1,413.5 million in cash. YCC Holdings was owned by affiliates of MDP and certain members of our senior management subsequent to the merger. YCC Holdings owns 100% of the stock of Holding Corp., together the “Successor” companies, which in turn owns 100% of the stock of The Yankee Candle Company, Inc. Effective as of the closing of the Merger, all of the prior equity plans of the Predecessor Company ceased to be effective and all existing equity grants and awards were paid out.
Class A Common Units
At the time of the Merger, an affiliate of Madison Dearborn purchased 4,233,353 Class A common units and certain eligible members of senior management of Yankee Holding Corp. (the “Management Investors”) purchased 40,933 Class A common units for $101.22 per unit. The Class A common units are not subject to vesting. The Class A common units are first entitled to a return of capital. Then the class B common units are entitled to a return of capital. Thereafter, all A, B and C units participate in any residual distributions on a pro rata basis.
Class B Common Units
Class B common units, and commencing in October 2007 Class C common units, constitute the Company’s long-term equity incentive program. At the time of the Merger, the Board of Managers of the Company (the “Board of Managers”) authorized 474,897 shares of Class B common units of which the Management Investors purchased 427,643 Class B common units for $1 per share, the estimated fair value as of such date. The number of authorized Class B common units is reduced by subsequent Class B issuances and any Class C common units and the aggregate of Class B and Class C issuances cannot exceed the 474,897 shares authorized. As of December 29, 2012, an aggregate of 66,256 Class B and Class C common units were available for issuance.
The Class B common units are subject to a five-year vesting period, with 10% of the units vesting immediately upon the date of purchase and the remainder vesting daily beginning on the sixth month anniversary of the purchase date, continuing over the subsequent 54 month period. If any Management Investor dies or becomes permanently disabled, such Management Investor will be credited with an additional 12 months of vesting for his or her Class B common units. All unvested Class B common units will vest upon a sale of all or substantially all of the Company so long as the employee holding such units continues to be an employee of the Company at the closing of the sale. YCC Holdings or MDP has the right to repurchase unvested class B units for $1 per unit upon a termination of employment.
Class C Common Units
In October 2007, the Board of Managers approved the creation of a new class of equity interest, Class C common units, for issuance under the Company’s long-term equity incentive program. Class C units are issued for no consideration. Class C common units typically have the same vesting provisions as Class B common units. Unvested Class C common units are forfeited in the event of a termination of employment. Recipients of Class C common units are required to simultaneously purchase a corresponding number of Class A common units, at then fair market value of the Class A common units.
In February 2012, the Board of Managers approved the issuance of 13,650 Class C performance based common units to Vice Presidents and above. Typically, the Company’s Class C units vest daily over five years. However, the March 2012 Class C common units (“Class C performance units”) are partially performance based and generally vest as follows, subject to the terms of the applicable agreements: (i) 25% of the units granted shall vest on a daily basis over five years, (ii) 25% of the units granted shall vest in the event that the Company’s Adjusted EBITDA performance in fiscal 2012 meets or exceeds a pre-approved target established by the Compensation Committee of the Board of Managers (the “2012 units”) and (iii) 50% of the units granted shall vest following the end of any fiscal year during which the Company attains an additional Adjusted EBITDA target established by the Compensation Committee of the Board of Managers. The Company did not achieve the 2012 Adjusted EBITDA target referenced in clause (ii) above, therefore the 2012 units remain eligible for vesting under clause (iii) above in the event the Company subsequently achieves the applicable Adjusted EBITDA target. References to “Class C common units” herein shall include these Class C performance units unless otherwise indicated.
Voting Rights and Transfers
Holders of Class A common units, vested Class B common units and vested Class C common units are entitled to one vote per unit, on all matters voted on by the members. All Class A common units, vested Class B common units and vested Class C common units’ votes count the same.
Class A, Class B and Class C common units are all subject to various restrictions on transfer and other conditions, all as more fully set forth in the equity agreements. YCC Holdings may issue additional units subject to the terms and conditions of certain of the equity agreements.
Prior to February 2011, member’s equity was held in the form of Class A, Class B and Class C common units in YCC Holdings. As discussed in Note 2, in February 2011 equity interests in YCC Holdings were exchanged for new equity interests in its newly formed parent, Yankee Investments. Pursuant to this exchange, holders of Class A, Class B and Class C common units in YCC Holdings exchanged such units on a one for one basis for an identical interest in Class A, Class B, and Class C common units of Yankee Investments. After the exchange, each unit holder had the same ownership interest with the same rights and features in Yankee Investments that it previously had in YCC Holdings. Subsequent to the exchange, all outstanding Class A, B and C common units in YCC Holdings were converted to 1,000 Common Units in YCC Holdings, all of which are now held by its parent and sole member, Yankee Investments.
Subsequently, in the second fiscal quarter of 2011, in connection with the formation of Yankee Candle Group LLC (“Yankee Group”) a second exchange of equity interests occurred, whereby holders of Class A, Class B and Class C common units in Yankee Investments exchanged such units on a one for one basis for an identical interest in Class A, Class B, and Class C common units of Yankee Group. After the exchange, each unit holder had the same ownership interest with the same rights and features in Yankee Group that it previously had in Yankee Investments. All outstanding interests in Yankee Investments were exchanged pursuant to this transaction. As of December 31, 2011, all outstanding common units of Yankee Investments were owned by Yankee Group.
A summary of nonvested units for Yankee Group as of December 29, 2012 and December 31, 2011 and the activity for the fifty-two weeks ended December 29, 2012 is presented below (there are no units remaining in Yankee Investments):
| | | Class A Common Units | | Weighted Average Calculated Value | | Class B Common Units | | Weighted Average Calculated Value | | Class C Common Units | | Weighted Average Calculated Value |
| Nonvested stock at December 31, 2011 | | | - | | - | | 4,577 | | $ | 9.39 | | 54,614 | | $ | 24.99 |
| Granted | | | 356 | | - | | - | | | - | | 89,409 | | $ | 26.63 |
| Forfeited | | | - | | - | | (13) | | $ | 9.39 | | (23,125) | | $ | 34.75 |
| Vested | | | (356) | | - | | (4,564) | | $ | 9.39 | | (25,743) | | $ | 21.53 |
| | | | | | | | | | | | | | | | |
| Nonvested stock at December 29, 2012 | | | - | | - | | - | | $ | 9.39 | | 95,155 | | $ | 25.42 |
During fiscal 2012, 692 Class A common units, 34,892 vested Class B common units and 15,767 vested Class C common units were repurchased for $2.6 million. The weighted average calculated value for equity awards vested during the fifty-two weeks ended December 29, 2012, December 31, 2011 and January 1, 2011 was $19.70, $12.82 and $11.25, respectively. Yankee Group anticipates that all of its nonvested common units will vest with the exception of performance shares for which an estimated forfeiture rate has been applied.
The total estimated fair value of equity awards vested during the fifty-two weeks ended December 29, 2012, December 31, 2011 and January 1, 2011 was $0.8 million, $0.8 million and $1.0 million, respectively. Equity-based compensation expense for the fifty-two weeks ended December 29, 2012, December 31, 2011 and January 1, 2011 was $0.8 million, $3.9 million and $1.0 million, respectively. Included in the $3.9 million of equity-based compensation for the fifty-two weeks ended December 31, 2011 was the $3.0 million payment to the holders of Class B common units and Class C common units. The $3.0 million payment was recorded as additional paid in capital and is shown as a contribution by YCC Holdings LLC in Holding Corp.’s consolidated statement of changes in stockholder’s equity and in Holding Corp.’s consolidated statements of cash flows.
As of December 29, 2012, there was approximately $2.2 million of total unrecognized compensation cost related to Yankee Group’s Class C common unit equity awards and there was no unrecognized expense related to Yankee Group’s Class A common unit equity awards. This cost is expected to be recognized over the remaining vesting period, of approximately 4.5 years (January 2013 to October 2017).
Presented below is a summary of assumptions for the indicated periods. During the fifty-two weeks ended December 29, 2012, there were 89,409 Class C grants and no Class B grants. During the fifty-two weeks ended December 31, 2011, there were 11,650 Class C grants and no Class B grants. There were 44,712 Class C grants and no Class B grants for the fifty-two weeks ended January 1, 2011.
| Assumptions | | Fifty-Two Weeks Ended December 29, 2012 Option Pricing Method Black-Scholes | | | Fifty-Two Weeks Ended December 31, 2011 Option Pricing Method Black-Scholes | | | Fifty-Two Weeks Ended January 1, 2011 Option Pricing Method Black-Scholes | |
| Weighted average calculated value of awards granted | | $ | 26.63 | | | $ | 28.97 | | | $ | 34.34 | |
| Weighted average volatility | | | 77.7 | % | | | 76.1 | % | | | 39.8 | % |
| Weighted average expected term (in years) | | | 5.0 | | | | 5.0 | | | | 5.0 | |
| Dividend yield | | | — | | | | — | | | | — | |
| Weighted average risk-free interest rate | | | 0.9 | % | | | 2.2 | % | | | 2.6 | % |
With respect to the Class B and Class C common units, since YCC Holdings and Yankee Group are not publicly traded, the estimate of expected volatility is based on the median historical volatility of a group of eight comparable public companies, adjusted for differences in leverage. The historical volatilities of the comparable companies were measured over a 5-year historical period. The expected term of the Class B and Class C common units granted represents the period of time that the units are expected to be outstanding and is assumed to be approximately five years based on management’s estimate of the time to a liquidity event. Yankee Group does not expect to pay dividends, and accordingly, the dividend yield is zero. The risk free interest rate reflects a five-year period commensurate with the expected time to a liquidity event and was based on the U.S. Treasury yield curve.
5. INVENTORY
The components of inventory were as follows (in thousands):
| | | December 29, 2012 | | December 31, 2011 |
| Finished goods | | $ | 69,293 | | $ | 64,195 |
| Work-in-process | | | 678 | | | 319 |
| Raw materials and packaging | | | 7,998 | | | 11,049 |
| | | | | | | |
| | | | | | | |
| Total inventory | | $ | 77,969 | | $ | 75,563 |
6. PROPERTY AND EQUIPMENT
The components of property and equipment were as follows (in thousands):
| | | December 29, 2012 | | | December 31, 2011 | |
| Land and improvements | | $ | 8,788 | | | $ | 8,679 | |
| Buildings and improvements | | | 124,077 | | | | 115,969 | |
| Computer equipment | | | 39,937 | | | | 32,427 | |
| Furniture and fixtures | | | 44,687 | | | | 43,135 | |
| Equipment | | | 32,493 | | | | 29,482 | |
| Vehicles | | | 1,494 | | | | 1,159 | |
| Construction in progress | | | 9,286 | | | | 5,714 | |
| | | | | | | | | |
| Total | | | 260,762 | | | | 236,565 | |
| Less: accumulated depreciation and amortization | | | (139,209 | ) | | | (118,163 | ) |
| | | $ | 121,553 | | | $ | 118,402 | |
Depreciation and amortization expense related to property and equipment was $26.2 million, $25.6 million and $26.2 million for the fifty-two weeks ended December 29, 2012, December 31, 2011, and January 1, 2011, respectively. For the fifty-two weeks ended December 29, 2012, December 31, 2011, and January 1, 2011, $0.3 million, $0.2 million and $0.2 million of interest was capitalized, respectively.
7. FAIR VALUE MEASUREMENTS
The Company follows the guidance prescribed by ASC Topic 820 "Fair Value Measurement." The Fair Value Measurements and Disclosures Topic defines fair value and provides a consistent framework for measuring fair value under GAAP, including financial statement disclosure requirements. As specified under this Topic, valuation techniques are based on observable and unobservable inputs. Observable inputs reflect readily obtainable data from independent sources, while unobservable inputs reflect market assumptions. The Fair Value Measurements and Disclosures Topic classifies these inputs into the following hierarchy:
Level 1 Inputs—Quoted prices for identical instruments in active markets.
Level 2 Inputs—Quoted prices for similar instruments in active markets; quoted prices for identical or similar instruments in markets that are not active; and model-derived valuations whose inputs are observable or whose significant value drivers are observable.
Level 3 Inputs—Instruments with primarily unobservable value drivers.
The following tables represent the fair value hierarchy for those financial assets and liabilities measured at fair value on a recurring basis as of December 29, 2012 and December 31, 2011 (in thousands):
| | | Fair Value Measurements on a Recurring Basis |
| as of December 29, 2012 |
| | | Level 1 | | | Level 2 | | | Level 3 | | Total |
| Assets | | | | | | | | | | | | | | |
| Marketable securities | | $ | 1,971 | | | $ | - | | | $ | - | | $ | 1,971 |
| | | | | | | | | | | | | | | |
| | | | | |
| Total Assets | | $ | 1,971 | | | $ | - | | | $ | - | | $ | 1,971 |
| | | | | | | | | | | | | | | |
| | | | | |
| Liabilities | | | | | | | | | | | | | | |
| Interest rate swap agreements | | $ | - | | | $ | 1,757 | | | $ | - | | $ | 1,757 |
| | | | | | | | | | | | | | | |
| | | | | |
| Total Liabilities | | $ | - | | | $ | 1,757 | | | $ | - | | $ | 1,757 |
| | | Fair Value Measurements on a Recurring Basis |
| as of December 31, 2011 |
| | | Level 1 | | | Level 2 | | | Level 3 | | Total |
| Assets | | | | | | | | | | | | | | |
| Marketable securities | | $ | 1,670 | | | $ | - | | | $ | - | | $ | 1,670 |
| | | | | | | | | | | | | | | |
| | | | | |
| Total Assets | | $ | 1,670 | | | $ | - | | | $ | - | | $ | 1,670 |
| | | | | | | | | | | | | | | |
| | | | | |
| Liabilities | | | | | | | | | | | | | | |
| Interest rate swap agreements | | $ | - | | | $ | 9,409 | | | $ | | | $ | 9,409 |
| | | | | | | | | | | | | | | |
| | | | | |
| Total Liabilities | | $ | - | | | $ | 9,409 | | | $ | - | | $ | 9,409 |
The Company holds marketable securities in Yankee Candle’s deferred compensation plan. The marketable securities consist of investments in mutual funds and are recorded at fair value based on observable market prices. The Company uses an income approach to value the asset and liability for its interest rate swaps using a discounted cash flow model that takes into account the present value of future cash flows under the terms of the contract using current market information as of the reporting date such as the one month LIBOR curve and the creditworthiness of the Company and its counterparties.
Financial Instruments Not Measured at Fair Value
The Company’s long-term debt is recorded at historical amounts. The Company estimates the fair value of its long-term debt based on current quoted market prices. The following table represents the carrying value and fair value of Yankee Candle’s senior notes, senior subordinated notes and Term Loan Facility and YCC Holdings’ Senior PIK Notes as of December 29, 2012 and December 31, 2011 (in thousands):
| | | December 29, 2012 |
| Holding Corp.: | | Carrying Value | | Fair Value |
| Term loan facility, net of unamortized discount of $6,201 | | $ | 648,174 | | $ | 661,573 |
| Senior notes due 2015 | | $ | 10,000 | | $ | 10,025 |
| Senior subordinated notes due 2017 | | $ | �� 188,000 | | $ | 195,285 |
| YCC Holdings: | | | | | | |
| Senior PIK notes due 2016, net of unamortized discount of $4,334 | | $ | 310,666 | | $ | 324,450 |
| | | December 31, 2011 |
| Holding Corp.: | | Carrying Value | | Fair Value |
| Senior secured term loan facility | | $ | 388,125 | | $ | 381,605 |
| Senior notes due 2015 | | $ | 325,000 | | $ | 327,031 |
| Senior subordinated notes due 2017 | | $ | 188,000 | | $ | 182,125 |
| YCC Holdings: | | | | | | |
| Senior PIK notes due 2016, net of unamortized discount of $5,424 | | $ | 309,576 | | $ | 274,444 |
8. GOODWILL AND INTANGIBLE ASSETS
Goodwill
As of December 29, 2012, the carrying amount of goodwill totaled $643.6 million, of which $286.3 million was allocated to retail and $357.3 million was allocated to wholesale. There is no goodwill associated with our international reporting unit. There were no changes in the carrying amount of goodwill during the fifty-two weeks ended December 29, 2012 and December 31, 2011. As of December 29, 2012, there were accumulated impairment losses of $375.4 million, with $68.2 million attributable to retail and $307.2 million attributable to wholesale.
The Company has determined that its tradenames have an indefinite useful life and, therefore, are not being amortized. In accordance with Accounting Standards Codification (“ASC”) Topic 350 “Intangibles - Goodwill and Other,” goodwill and indefinite lived intangible assets are not amortized but are subject to an annual impairment test.
Annual Impairment Testing
The Company performs its annual goodwill and indefinite lived intangible assets impairment testing at the reporting unit level. For the impairment testing as of November 3, 2012, and November 5, 2011, the Company had three reporting units: retail, wholesale and international.
Fair values of the reporting units are derived through a combination of market-based and income-based approaches, each of which were weighted at 50% for the impairment test performed as of November 3, 2012, and November 5, 2011. The market-based approach estimates fair value by applying multiples of potential earnings, such as EBITDA and revenue, of publicly traded comparable companies. The Company believes this approach is appropriate because it provides a fair value using multiples from companies with operations and economic characteristics similar to our reporting units.
The income-based approach is based on projected future debt-free cash flow that is discounted to present value using factors that consider the timing and risk of the future cash flows. The Company believes this approach is appropriate because it provides a fair value estimate based upon the reporting units expected long-term operations and cash flow performance. The income-based approach is based on a reporting unit's future projections of operating results and cash flows. These projections are discounted to present value using a weighted average cost of capital for market participants, who are generally thought to be industry participants.
The Company completed its annual impairment testing of goodwill and indefinite lived intangible assets as of November 3, 2012, and November 5, 2011 and determined that the fair value of each reporting unit exceeded its carrying value.
Intangible Assets
The carrying amount and accumulated amortization of intangible assets consisted of the following (in thousands):
| | | Weighted Average Useful Life (in years) | | | Gross Carrying Amount | | | Accumulated Amortization | | Net Book Value |
| December 29, 2012 | | | | | | | | | | | | | | |
| Indefinite life: | | | | | | | | | | | | | | |
| Tradenames | | | N/A | | | $ | 267,700 | | | $ | - | | $ | 267,700 |
| | | | | | | | | | | | | | | |
| | | | | | | | | | | | | | | |
| Finite-lived intangible assets: | | | | | | | | | | | | | | |
| Customer lists | | | 5 | | | | 63,788 | | | | (63,663) | | | 125 |
| Favorable lease agreements | | | 5 | | | | 2,330 | | | | (2,122) | | | 208 |
| Other | | | 3 | | | | 36 | | | | (36) | | | - |
| | | | | | | | | | | | | | | |
| | | | | | | | | | | | | | | |
| Total finite-lived intangible assets | | | | | | | 66,154 | | | | (65,821) | | | 333 |
| | | | | | | | | | | | | | | |
| | | | | | | | | | | | | | | |
| Total intangible assets | | | | | | $ | 333,854 | | | $ | (65,821) | | $ | 268,033 |
| | | | | | | | | | | | | | | |
| | | | | | | | | | | | | | | |
| December 31, 2011 | | | | | | | | | | | | | | |
| Indefinite life: | | | | | | | | | | | | | | |
| Tradenames | | | N/A | | | $ | 267,700 | | | $ | - | | $ | 267,700 |
| | | | | | | | | | | | | | | |
| | | | | | | | | | | | | | | |
| Finite-lived intangible assets: | | | | | | | | | | | | | | |
| Customer lists | | | 5 | | | | 63,650 | | | | (62,324) | | | 1,326 |
| Favorable lease agreements | | | 5 | | | | 2,330 | | | | (1,952) | | | 378 |
| Other | | | 3 | | | | 36 | | | | (35) | | | 1 |
| | | | | | | | | | | | | | | |
| | | | | | | | | | | | | | | |
| Total finite-lived intangible assets | | | | | | | 66,016 | | | | (64,311) | | | 1,705 |
| | | | | | | | | | | | | | | |
| | | | | | | | | | | | | | | |
| Total intangible assets | | | | | | $ | 333,716 | | | $ | (64,311) | | $ | 269,405 |
Total amortization expense from finite-lived intangible assets was $1.5 million, $12.3 million and $12.4 million for the fifty-two weeks ended December 29, 2012, December 31, 2011 and January 1, 2011, respectively. The intangible assets are amortized on a straight line basis. Favorable lease agreements are amortized over the remaining lease term of each respective lease.
Aggregate amortization expense related to intangible assets at December 29, 2012 is expected to be as follows (in thousands):
| 2013 | | $ | 268 | |
| 2014 | | | 61 | |
| 2015 | | | 4 | |
| | | | | |
| Total | | $ | 333 | |
9. CONCENTRATION OF CREDIT RISK
The Company maintains cash balances at several domestic and foreign financial institutions. At December 29, 2012 accounts at each institution are insured by the Federal Deposit Insurance Corporation (“FDIC”) up to $250 thousand, and by equivalent regulatory agencies in foreign countries. Uninsured balances aggregated to $5.4 million and $3.5 million at December 29, 2012 and December 31, 2011, respectively.
The Company extends credit to its wholesale customers. No single customer accounted for more than 10% of total sales for any period presented herein.
10. DERIVATIVE FINANCIAL INSTRUMENTS
The Company follows the guidance under ASC Topic 815 "Derivatives and Hedging," which establishes accounting and reporting standards for derivative instruments. Specifically, the guidance requires an entity to recognize all derivatives as either assets or liabilities in the statement of financial condition and to measure those instruments at fair value. Additionally, the fair value adjustments affect either stockholder’s equity or member’s deficit as accumulated other comprehensive loss ("OCI") or net income depending on whether the derivative instrument qualifies as a hedge for accounting purposes and, if so, the nature of the hedging activity.
Interest Rate Swaps
Yankee Candle uses interest rate swaps to eliminate the variability of a portion of cash flows associated with the forecasted interest payments on its Term Loan Facility. This is achieved through converting a portion of the floating rate Term Loan Facility to a fixed rate by entering into pay-fixed interest rate swaps.
During the second quarter of 2009 Yankee Candle changed the interest rate election on its Term Facility from the three-month LIBOR rate to the one-month LIBOR rate. As a result, Yankee Candle’s existing interest rate swaps were de-designated as cash flow hedges and Yankee Candle no longer accounts for these instruments using hedge accounting. Accordingly, changes in fair value are now recognized in the consolidated statements of operations as a component of other (income) expense. The unrealized loss of $21.7 million which was included in OCI on the date Yankee Candle changed its interest rate election was amortized to other expense over the remaining term of the respective interest rate swap agreements. The unrealized loss was fully amortized during the fifty-two weeks ended December 31, 2011.
During the second and third quarters of 2009, Yankee Candle entered into interest rate swaps to eliminate the variability in future interest payments by having Yankee Candle pay fixed-rate amounts in exchange for receipt of floating-rate interest payments. The effective date of these swaps was March 31, 2011. The aggregate notional value amortizes over the life of the swaps. As of December 29, 2012, the aggregate notional value of the swaps was $219.8 million resulting in a blended fixed rate of 3.49%. These swaps are not designated as cash flow hedges and, are measured at fair value with changes in fair value recognized in the consolidated statements of operations as a component of other income (expense). These swap agreements terminate in March 2013.
The fair values of the Company's derivative instruments as of December 29, 2012 and December 31, 2011, were as follows (in thousands):
| | Fair Value of Derivative Instruments | |
| | Liability Derivatives | |
| | Balance Sheet Location | December 29, | | December 31, | |
| 2012 | | 2011 | |
| Derivatives not designated as hedging instruments | | | | | | | |
| Interest rate swap agreements | Other accrued liabilities | | $ | 1,757 | | | $ | 9,409 | |
| | | | | | | | | | |
| Total Derivative Liabilities | | | $ | 1,757 | | | $ | 9,409 | |
The effect of derivative instruments on the consolidated statements of operations for the fifty-two weeks ended December 29, 2012, December 31, 2011 and January 1, 2011, was as follows (in thousands):
| | | | Amount of Realized (Gain) Recognized on Derivatives | | | Amount of Realized (Gain) Recognized on Derivatives | | | Amount of Realized Loss Recognized on Derivatives | |
| | Location of Realized (Gain) Loss Recognized on Derivatives | | Fifty-Two Weeks Ended December 29, 2012 | | | Fifty-Two Weeks Ended December 31, 2011 | | | Fifty-Two Weeks Ended January 1, 2011 | |
| Derivatives not designated as hedging instruments | | | | | | | | | | |
| Interest rate swap agreements | Other expense | | $ | (7,652 | ) | | $ | (6,403 | ) | | $ | 9,166 | |
| | | | | | | | | | | | | | |
| Total | | | $ | (7,652 | ) | | $ | (6,403 | ) | | $ | 9,166 | |
| | | | Amount of Loss Reclassified from Accumulated OCI Into Income (Effective Portion) | | | Amount of Loss Reclassified from Accumulated OCI Into Income (Effective Portion) | | | Amount of Loss Reclassified from Accumulated OCI Into Income (Effective Portion) | |
| | Location of loss Reclassified from Accumulated OCI into Income (Effective Portion) | | Fifty-Two Weeks Ended December 29, 2012 | | | Fifty-Two Weeks Ended December 31, 2011 | | | Fifty-Two Weeks Ended January 1, 2011 | |
| Cash Flow Hedges | | | | | | | | | | |
| Interest rate swap agreements | Other expense | | $ | - | | | $ | 1,169 | | | $ | 8,623 | |
| | | | | | | | | | | | | | |
| Total | | | $ | - | | | $ | 1,169 | | | $ | 8,623 | |
11. INCOME TAXES
The provision for income tax expense consists of the following (in thousands):
| YCC Holdings | | Fifty-Two Weeks Ended December 29, 2012 | | | Fifty-Two Weeks Ended December 31, 2011 | | | Fifty-Two Weeks Ended January 1, 2011 | |
| Federal: | | | | | | | | | |
| Current | | $ | 8,194 | | | $ | 7,313 | | | $ | 17,434 | |
| Deferred | | | 10,207 | | | | 9,910 | | | | 3,554 | |
| Total federal | | | 18,401 | | | | 17,223 | | | | 20,988 | |
| State: | | | | | | | | | | | | |
| Current | | | 1,916 | | | | 1,671 | | | | 2,122 | |
| Deferred | | | 1,141 | | | | 607 | | | | 285 | |
| Total state | | | 3,057 | | | | 2,278 | | | | 2,407 | |
| Foreign: | | | | | | | | | | | | |
| Current | | | 280 | | | | 735 | | | | 201 | |
| Deferred | | | 158 | | | | (196 | ) | | | 92 | |
| Total foreign | | | 438 | | | | 539 | | | | 293 | |
| Total income tax provision | | $ | 21,896 | | | $ | 20,040 | | | $ | 23,688 | |
| Holding Corp. | | Fifty-Two Weeks Ended December 29, 2012 | | | Fifty-Two Weeks Ended December 31, 2011 | | | Fifty-Two Weeks Ended January 1, 2011 | |
| Federal: | | | | | | | | | |
| Current | | $ | 19,376 | | | $ | 17,364 | | | $ | 17,434 | |
| Deferred | | | 10,207 | | | | 9,910 | | | | 3,554 | |
| Total federal | | | 29,583 | | | | 27,274 | | | | 20,988 | |
| State: | | | | | | | | | | | | |
| Current | | | 2,371 | | | | 2,077 | | | | 2,122 | |
| Deferred | | | 1,141 | | | | 607 | | | | 285 | |
| Total state | | | 3,512 | | | | 2,684 | | | | 2,407 | |
| Foreign: | | | | | | | | | | | | |
| Current | | | 280 | | | | 735 | | | | 201 | |
| Deferred | | | 158 | | | | (196 | ) | | | 92 | |
| Total foreign | | | 438 | | | | 539 | | | | 293 | |
| Total income tax provision | | $ | 33,533 | | | $ | 30,497 | | | $ | 23,688 | |
In connection with the recapitalization of the Company in 1998, an election was made for federal and state income tax purposes to value the assets and liabilities of the Company at fair value. As a result of such election, there is a difference between the financial reporting and tax bases of the Company's assets and liabilities. This difference was accounted for by recording a deferred tax asset of approximately $175.7 million with a corresponding credit to additional paid-in capital. The deferred tax asset is being realized as these differences, including tax goodwill, are deducted, principally over a period of 15 years. In the opinion of management, the Company will have sufficient profits in the future to realize the remaining unrecognized deferred tax asset.
The tax effect of significant items comprising the Company’s net deferred tax assets (liabilities) were as follows (in thousands):
| | | December 29, 2012 | | | December 31, 2011 | |
| |
| YCC Holdings and Holding Corp. | | Current | | | Non-current | | | Current | | | Non-current | |
| |
| Deferred tax assets: | | | | | | | | | | | | |
| Basis differential as a result of a basis step-up for tax | | $ | - | | | $ | 2,729 | | | $ | - | | | $ | 14,554 | |
| Interest rate swaps | | | 689 | | | | - | | | | 3,688 | | | | - | |
| Foreign net operating loss carryforwards | | | - | | | | 724 | | | | - | | | | 685 | |
| Deferred compensation arrangements | | | 825 | | | | - | | | | 725 | | | | - | |
| Other | | | 5,300 | | | | 3,684 | | | | 4,311 | | | | 2,882 | |
| Valuation allowance | | | - | | | | (447 | ) | | | - | | | | - | |
| Deferred tax liabilities: | | | | | | | | | | | | | | | | |
| Fixed assets | | | - | | | | (17,272 | ) | | | - | | | | (19,094 | ) |
| Intangible assets | | | - | | | | (106,553 | ) | | | - | | | | (106,150 | ) |
| | | $ | 6,814 | | | $ | (117,135 | ) | | $ | 8,724 | | | $ | (107,123 | ) |
A reconciliation of the statutory federal income tax rate and the effective rate of the provision for income taxes consisted of the following:
| | | | | | | | | | |
| | | Fifty-Two Weeks Ended December 29, 2012 | | | Fifty-Two Weeks Ended December 31, 2011 | | | Fifty-Two Weeks Ended January 1, 2011 | |
| |
| YCC Holdings |
| Statutory federal income tax rate | | | 35.0 | % | | | 35.0 | % | | | 35.0 | % |
| State income taxes net of federal benefit | | | 3.8 | | | | 4.2 | | | | 3.3 | |
| Combined federal and state statutory income tax rates | | | 38.8 | | | | 39.2 | | | | 38.3 | |
| Domestic production activities deduction | | | (1.2 | ) | | | (1.4 | ) | | | (2.7 | ) |
| Non-deductible stock compensation expense | | | 0.5 | | | | 0.5 | | | | 0.5 | |
| Other, including change in valulation allowance | | | 1.7 | | | | (1.1 | ) | | | (0.2 | ) |
| | | | 39.8 | % | | | 37.2 | % | | | 35.9 | % |
| | | | | | | | | | |
| | | Fifty-Two Weeks Ended December 29, 2012 | | | Fifty-Two Weeks Ended December 31, 2011 | | | Fifty-Two Weeks Ended January 1, 2011 | |
| |
| Holding Corp. |
| Statutory federal income tax rate | | | 35.0 | % | | | 35.0 | % | | | 35.0 | % |
| State income taxes net of federal benefit | | | 2.9 | | | | 3.1 | | | | 3.3 | |
| Combined federal and state statutory income tax rates | | | 37.9 | | | | 38.1 | | | | 38.3 | |
| Domestic production activities deduction | | | (1.9 | ) | | | (2.0 | ) | | | (2.7 | ) |
| Non-deductible stock compensation expense | | | 0.3 | | | | 0.3 | | | | 0.5 | |
| Other, including change in valulation allowance | | | 1.0 | | | | (0.6 | ) | | | (0.2 | ) |
| | | | 37.3 | % | | | 35.8 | % | | | 35.9 | % |
The Company asserts that any earnings of its foreign subsidiaries are indefinitely reinvested. Consideration has been given to the Company’s U.S. and foreign financial requirements, short-term and long-term operational and fiscal objectives, and tax consequences associated with the repatriation of earnings. Accordingly, the Company does not accrue the tax cost (nor recognize any potential tax benefit) of repatriating the earnings from its foreign subsidiaries until there is a plan and intention to actually repatriate such earnings. As of December 29, 2012, there are unremitted foreign earnings of $2.4 million.
The Company files income tax returns in the U.S. federal jurisdiction, various states, the United Kingdom, Germany, Canada and Italy. The Company's earliest open U.S. federal tax year, United Kingdom tax year and German tax year is 2009, 2010 and 2009, respectively. The Company’s earliest open Canadian and Italian tax years are 2011 and 2012, respectively.
The Company recognizes accrued interest and penalties, if any, related to unrecognized tax benefits in the provision for income taxes.
As of December 29, 2012, the Company had uncertain tax positions of $3.5 million and accrued interest and penalties of $0.3 million. As of December 29, 2012, the amount of unrecognized tax benefits that, if recognized, would affect the effective tax rate is $3.5 million.
As of December 31, 2011, the Company had uncertain tax positions of $2.1 million and accrued interest and penalties of $33 thousand. As of December 31, 2011, the amount of unrecognized tax benefits that, if recognized, would affect the effective tax rate is $2.1 million.
A reconciliation of the beginning and ending amount of the uncertain tax positions was as follows (in thousands):
| YCC Holdings and Holding Corp. | | Fifty-Two Weeks Ended December 29, 2012 | | | Fifty-Two Weeks Ended December 31, 2011 | | | Fifty-Two Weeks Ended January 1, 2011 | |
| Balance—beginning of year | | $ | 2,096 | | | $ | 806 | | | $ | 2,147 | |
| Increases related to prior periods | | | - | | | | 137 | | | | 106 | |
| Increases related to current period | | | 1,642 | | | | 1,428 | | | | 344 | |
| Decreases due to settlements with authorities | | | (23 | ) | | | - | | | | (1,691 | ) |
| Decreases due to lapse of statutes | | | (187 | ) | | | (275 | ) | | | (100 | ) |
| Balance—end of year | | $ | 3,528 | | | $ | 2,096 | | | $ | 806 | |
12. PROFIT SHARING PLAN
The Company maintains a profit sharing plan (the "Plan") under section 401(k) of the Internal Revenue Code of 1986, as amended (the "Internal Revenue Code"). Under the plan the Company makes a discretionary matching payment consisting of a weekly match of 25% of the first 4% of eligible compensation, with an additional discretionary match of 25% of the first 4% of eligible compensation to be made at the end of the year at the discretion of the Company's Compensation Committee.
The employer matching contributions amounted to $0.7 million for each of the fifty-two weeks ended December 29, 2012, December 31, 2011 and January 1, 2011. In addition, under the Plan the Company made discretionary matching contributions, which were determined annually based on a percentage of the employee's pretax contributions, of $0.7 million for both the fifty-two weeks December 29, 2012 and December 31, 2011, and $0.6 million during the fifty-two weeks ended January 1, 2011. Matching contributions were subject to a cap based on a percentage of the employee's eligible compensation, as defined in the Plan.
13. EXECUTIVE DEFERRED COMPENSATION PLAN
The Company has an executive deferred compensation agreement with certain key employees. Under this agreement, the Company at its election may match certain elective salary deferrals of eligible employees' compensation up to a maximum of $20 thousand per employee per year.
For the fifty-two weeks ended December 29, 2012, December 31, 2011 and January 1, 2011 employer contributions totaled $0.1 million, $0.2 million and $0.1 million, respectively. Benefits paid to retired or terminated employees for the fifty-two weeks ended December 29, 2012 and January 1, 2011 totaled $0.4 million and $0.3 million, respectively. There were no benefits paid to retired or terminated employees for the fifty-two weeks ended December 31, 2011.
14. COMMITMENTS AND CONTINGENCIES
Leases
The Company leases most store locations, its corporate office building, a distribution facility, equipment and vehicles. The operating leases, which expire in various years through 2024, contain renewal options ranging from six months to five years and provide for base rentals plus contingent rentals, which are a function of sales volume. In addition, the Company is required to pay real estate taxes, maintenance and other operating expenses applicable to the leased premises. Furthermore, several leases contain rent escalation clauses, capital improvement funding or other lease concessions which are accounted for on a straight-line basis as a reduction of rent expense over the applicable lease term as accounted for under ASC Topic 840 "Leases."
The aggregate annual future minimum lease commitments under operating leases as of December 29, 2012 are as follows (in thousands):
| | | Operating | |
| | | Leases | |
| 2013 | | $ | 38,921 | |
| 2014 | | | 34,218 | |
| 2015 | | | 30,742 | |
| 2016 | | | 25,224 | |
| 2017 | | | 21,841 | |
| Thereafter | | | 73,477 | |
| Total minimum lease payments | | $ | 224,423 | |
Rent expense, including contingent rentals, for the fifty-two weeks ended December 29, 2012, December 31, 2011 and January 1, 2011 was $42.7 million, $40.1 million and $39.5 million, respectively. Included in rent expense were contingent rental payments of approximately $0.4 million, $0.5 million and $0.5 million for the fifty-two weeks ended December 29, 2012, December 31, 2011 and January 1, 2011, respectively. Contingent rental payments are based primarily on sales at respective retail locations.
Contingencies
The Company is engaged in various claims and litigation relating to matters incidental to the Company’s business, either as plaintiff or defendant. In the opinion of management, the ultimate outcome of these lawsuits will not have a material adverse effect on the Company's financial position, results of operations or cash flows.
15. CAPITAL LEASES
During the fifty-two weeks ended December 29, 2012 and December 31, 2011, the Company entered into various capital leases for computer and warehouse equipment, and vehicles. As of December 29, 2012 and December 31, 2011, the recorded value of the leased property under capital leases was $5.4 million and $3.4 million, respectively, and is included in property and equipment in the consolidated balance sheet. Accumulated amortization on the property under capital lease was $2.8 million and $1.4 million as of December 29, 2012 and December 31, 2011. The related amortization is included in general and administrative expense.
Future minimum lease payments under the capital lease obligations as of December 29, 2012 are as follows (in thousands):
| 2013 | | $ | 1,872 | |
| 2014 | | | 1,701 | |
| 2015 | | | 1,016 | |
| 2016 | | | 777 | |
| 2017 | | | 126 | |
| Lessee guarantee of residual value at the end of lease term | | | 354 | |
| Total minimum lease payments | | | 5,846 | |
| Less amounts representing interest | | | (418 | ) |
| Total | | $ | 5,428 | |
16. RELATED PARTY TRANSACTIONS
Upon closing of the Merger, the Company entered into a management services contract with an affiliate of Madison Dearborn Partners (“MDP”) pursuant to which MDP provides the Company with management and consulting services and financial and advisory services on an ongoing basis for a fee of $1.5 million per year, payable in equal quarterly installments, and reimbursement of out-of-pocket expenses incurred in connection with the provision of such services. For each of the fifty-two weeks ended December 29, 2012, December 31, 2011, and January 1, 2011, the Company recorded $1.5 million associated with the annual management fee. Under this management services agreement, the Company also agreed to provide customary indemnification.
17. DISCONTINUED OPERATIONS
During 2009, the Board of Directors of Yankee Holding Corp. (the "Board of Directors") approved the decisions to discontinue the Company's Aroma Naturals division, and to discontinue the Illuminations division. Accordingly, the Company has classified the results of the Aroma Naturals division and the Illuminations division as discontinued operations on the consolidated statement of operations for all periods presented.
18. RESTRUCTURING CHARGES
During the first quarter of 2012, the Company restructured its Wholesale and Retail operations. The Company also initiated a change in reporting structure and changes of roles and responsibilities within the organization that resulted in workforce reductions. These changes included changes to the executive committee, changes to the reporting structure and operational focus within the retail segment, alignment of the brand innovation and merchandising teams across all channels of the business, and other administrative changes. As a result of these changes the Company incurred restructuring charges of $0.7 million during 2012 for employee related severance costs. During the second quarter of 2012, the Company’s wholly-owned subsidiary YCE, relocated its corporate headquarters and distribution center in England. As a result of these changes the Company incurred restructuring charges of $1.1 million during 2012 related to exiting the old facility and non-cash writeoffs for the impairment of equipment and deferred rent.
During 2010, the company initiated a restructuring plan primarily related to the elimination of a facility and certain employee positions as a result of the restructuring of the Company’s shipping and warehousing activities. During 2008 and 2009, the Company initiated restructuring plans related to its Aroma Naturals and Illuminations businesses and certain corporate workforce restructuring activities.
The Company made payments of $1.1 million, $0.2 million and $2.7 million during 2012, 2011 and 2010, respectively related to these plans. As of December 29, 2012, the balance of $1.5 million in the restructuring accrual was related to (i) continuing operations employee related expenses of $0.1 million as a result of the first quarter of 2012 organization changes detailed above, (ii) continuing operations occupancy related expenses of $0.7 million related to YCE exiting the old facility prior to the termination of the lease agreement and (iii) discontinued operations of $0.7 million primarily related to lease agreements for one Illuminations retail store and a lease related the former Illuminations corporate headquarters in Petaluma, California. The lease at the old YCE facility expires in May of 2014, the lease for the Illuminations retail store expires in January 2017 and the lease for the property in Petaluma California expires in March 2013. These leases will continue to be paid through their lease termination dates unless the Company is able to structure buyout agreements with the landlords or find replacement tenants.
19. SEGMENTS OF ENTERPRISE AND RELATED INFORMATION
The Company has segmented its operations in a manner that reflects how their chief operating decision–maker (the “CEO”) currently reviews the results of the Company and its subsidiaries’ businesses. The CEO evaluates its retail, wholesale, and international operations based on an “operating earnings” measure. Such measure gives recognition to specifically identifiable operating costs such as cost of sales and selling expenses. Costs and income not specifically identifiable are included within the unallocated/corporate/other column and include administrative charges, interest expense, fair value changes of derivative contracts, restructuring charges for continuing operations and other costs not allocated to specific operating segments and are accordingly reflected in the unallocated/corporate/other column. The Company does not account for or report assets, capital expenditures or depreciation and amortization by segment to the CEO.
The following were the relevant data for the fifty-two weeks ended December 29, 2012, December 31, 2011 and January 1, 2011 (in thousands):
| YCC Holdings | |
| Fifty-Two Weeks Ended December 29, 2012 | | Retail | | | | | | International | | | Unallocated/ Corporate/ Other | | Balance per Consolidated Statement of Operations | |
| Sales | | $ | 490,244 | | | $ | 238,253 | | | $ | 115,689 | | | $ | - | | $ | 844,186 | |
| Gross profit | | | 320,532 | | | | 113,291 | | | | 47,960 | | | | (1,436) | | | 480,347 | |
| Selling expenses | | | 192,912 | | | | 12,757 | | | | 29,423 | | | | 2,943 | | | 238,035 | |
| Operating income | | | 127,620 | | | | 100,534 | | | | 18,537 | | | | (78,288) | | | 168,403 | |
| Interest and other expense, net | | | - | | | | - | | | | - | | | | (113,450) | | | (113,450) | |
| | | | | | | | | | | | | | | | | | | | |
| Income from continuing operations before provision for income taxes | | | | | | | | | | | | | | $ | 54,953 | |
| | | Retail | | | | | | International | | | Unallocated/ Corporate/ Other | | Balance per Consolidated Statement of Operations | |
| Sales | | $ | 449,176 | | | $ | 235,247 | | | $ | 101,339 | | | $ | - | | $ | 785,762 | |
| Gross profit | | | 293,058 | | | | 110,073 | | | | 42,816 | | | | (521) | | | 445,426 | |
| Selling expenses | | | 185,041 | | | | 13,278 | | | | 22,933 | | | | 13,730 | | | 234,982 | |
| Operating income | | | 108,017 | | | | 96,795 | | | | 19,883 | | | | (76,702) | | | 147,993 | |
| Interest and other expense, net | | | - | | | | - | | | | - | | | | (94,184) | | | (94,184) | |
| | | | | | | | | | | | | | | | | | | | |
| Income from continuing operations before provision for income taxes | | | | | | | | | | | | | | $ | 53,809 | |
| Fifty-Two Weeks Ended January 1, 2011 | | Retail | | | Wholesale | | | International | | | Unallocated/ Corporate/ Other | | Balance per Consolidated Statement of Operations | |
| Sales | | $ | 426,325 | | | $ | 232,544 | | | $ | 74,848 | | | $ | - | | $ | 733,717 | |
| Gross profit | | | 281,018 | | | | 115,975 | | | | 29,965 | | | | (344) | | | 426,614 | |
| Selling expenses | | | 170,028 | | | | 11,984 | | | | 16,361 | | | | 14,207 | | | 212,580 | |
| Operating income | | | 110,990 | | | | 103,991 | | | | 13,604 | | | | (77,989) | | | 150,596 | |
| Interest and other expense, net | | | - | | | | - | | | | - | | | | (84,620) | | | (84,620) | |
| | | | | | | | | | | | | | | | | | | | |
| Income from continuing operations before benefit from income taxes | | | | | | | | | | | | | | $ | 65,976 | |
| Holding Corp. | |
| Fifty-Two Weeks Ended December 29, 2012 | | Retail | | | Wholesale | | | International | | | Unallocated/ Corporate/ Other | | Balance per Consolidated Statement of Operations | |
| Sales | | $ | 490,244 | | | $ | 238,253 | | | $ | 115,689 | | | $ | - | | $ | 844,186 | |
| Gross profit | | | 320,532 | | | | 113,291 | | | | 47,960 | | | | (1,436) | | | 480,347 | |
| Selling expenses | | | 192,912 | | | | 12,757 | | | | 29,423 | | | | 2,943 | | | 238,035 | |
| Operating income | | | 127,620 | | | | 100,534 | | | | 18,537 | | | | (78,193) | | | 168,498 | |
| Interest and other expense, net | | | - | | | | - | | | | - | | | | (78,508) | | | (78,508) | |
| | | | | | | | | | | | | | | | | | | | |
| Income from continuing operations before provision for income taxes | | | | | | | | | | | | | | $ | 89,990 | |
| Fifty-Two Weeks Ended December 31, 2011 | | Retail | | | Wholesale | | | International | | | Unallocated/ Corporate/ Other | | Balance per Consolidated Statement of Operations | |
| Sales | | $ | 449,176 | | | $ | 235,247 | | | $ | 101,339 | | | $ | - | | $ | 785,762 | |
| Gross profit | | | 293,058 | | | | 110,073 | | | | 42,816 | | | | (521) | | | 445,426 | |
| Selling expenses | | | 185,041 | | | | 13,278 | | | | 22,933 | | | | 13,730 | | | 234,982 | |
| Operating income | | | 108,017 | | | | 96,795 | | | | 19,883 | | | | (76,260) | | | 148,435 | |
| Interest and other expense, net | | | - | | | | - | | | | - | | | | (63,129) | | | (63,129) | |
| | | | | | | | | | | | | | | | | | | | |
| Income from continuing operations before provision for income taxes | | | | | | | | | | | | | | $ | 85,306 | |
| Fifty-Two Weeks Ended January 1, 2011 | | Retail | | | Wholesale | | | International | | | Unallocated/ Corporate/ Other | | Balance per Consolidated Statement of Operations | |
| Sales | | $ | 426,325 | | | $ | 232,544 | | | $ | 74,848 | | | $ | - | | $ | 733,717 | |
| Gross profit | | | 281,018 | | | | 115,975 | | | | 29,965 | | | | (344) | | | 426,614 | |
| Selling expenses | | | 170,028 | | | | 11,984 | | | | 16,361 | | | | 14,207 | | | 212,580 | |
| Operating income | | | 110,990 | | | | 103,991 | | | | 13,604 | | | | (77,989) | | | 150,596 | |
| Interest and other expense, net | | | - | | | | - | | | | - | | | | (84,620) | | | (84,620) | |
| | | | | | | | | | | | | | | | | | | | |
| Income from continuing operations before benefit from income taxes | | | | | | | | | | | | | | $ | 65,976 | |
Sales by geographic location are based on the location of the customer. The following tables set forth sales by geographic location:
| | | Fifty-Two Weeks Ended December 29, 2012 | | | Fifty-Two Weeks Ended December 31, 2011 | | | Fifty-Two Weeks Ended January 1, 2011 | |
| United States | | $ | 723,037 | | | $ | 681,294 | | | $ | 656,780 | |
| United Kingdom | | | 89,725 | | | | 69,404 | | | | 52,487 | |
| Other foreign countries | | | 31,424 | | | | 35,064 | | | | 24,450 | |
| | | $ | 844,186 | | | $ | 785,762 | | | $ | 733,717 | |
Long lived assets of the Companies’ foreign operations were approximately $9.8 million and $3.9 million as of December 29, 2012 and December 31, 2011, respectively.
20. VALUATION AND QUALIFYING ACCOUNTS
| Allowance for Doubtful Accounts | | Balance at Beginning of Fiscal Year | | | Charged to Costs and Expenses | | | Deductions From Reserves | | | Balance at End of Fiscal Year | |
| Year Ended December 29, 2012: | | | | | | | | | | | | |
| Allowance for doubtful accounts | | $ | 2,166 | | | $ | 1,657 | | | $ | (2,894 | ) | | $ | 929 | |
| Year Ended December 31, 2011: | | | | | | | | | | | | | | | | |
| Allowance for doubtful accounts | | $ | 2,001 | | | $ | 290 | | | $ | (125 | ) | | $ | 2,166 | |
| Year Ended January 1, 2011: | | | | | | | | | | | | | | | | |
| Allowance for doubtful accounts | | $ | 1,882 | | | $ | 387 | | | $ | (268 | ) | | $ | 2,001 | |
Amounts charged to deductions from reserves represent the write-off of uncollectible balances.
21. FINANCIAL INFORMATION RELATED TO GUARANTOR SUBSIDIARIES UNDER YANKEE CANDLE’S SENIOR NOTES AND SENIOR SUBORDINATED NOTES
Obligations under the senior notes of Yankee Candle are guaranteed on an unsecured senior basis and obligations under the senior subordinated notes are guaranteed on an unsecured senior subordinated basis by Holding Corp. and 100% of Yankee Candle’s existing and future domestic subsidiaries. The senior notes are fully and unconditionally guaranteed by all of Yankee Candle’s 100% owned U.S. subsidiaries (the “Guarantor Subsidiaries” and collectively with the Holding Corp., the “Guarantors”) on a senior unsecured basis. These guarantees are joint and several obligations of the Guarantors. Yankee Candle’s foreign subsidiary does not guarantee these notes.
The following tables present condensed consolidating supplementary financial information for Yankee Candle, as the issuer of the senior and senior subordinated notes, Holding Corp., Yankee Candle’s domestic guarantor subsidiaries and the non guarantor subsidiaries together with eliminations as of and for the periods indicated. Holding Corp. is also a guarantor of the notes. Separate complete financial statements of the respective Guarantors would not provide additional material information that would be useful in assessing the financial composition of the Guarantors.
Condensed consolidating financial information is as follows:
YANKEE HOLDING CORP. AND SUBSIDIARIES
CONDENSED CONSOLIDATING BALANCE SHEET
December 29, 2012
(in thousands)
| | | | | | | | | | | | Non | | | | | | | |
| | | Holding | | | | | | Guarantor | | | Guarantor | | | Intercompany | | | | |
| | | Corp. | | | Issuer | | | Subsidiaries | | | Subsidiaries | | | Eliminations | | | Consolidated | |
| ASSETS | | | | | | | | | | | | | | | | | | |
| CURRENT ASSETS: | | | | | | | | | | | | | | | | | | |
| Cash | | $ | - | | | $ | 32,678 | | | $ | 2,122 | | | $ | 5,179 | | | $ | - | | | $ | 39,979 | |
| Accounts receivable, net | | | - | | | | 32,767 | | | | 48 | | | | 30,757 | | | | - | | | | 63,572 | |
| Inventory | | | - | | | | 61,566 | | | | 95 | | | | 16,308 | | | | - | | | | 77,969 | |
| Prepaid expenses and other current assets | | | - | | | | 3,714 | | | | 47 | | | | 1,121 | | | | - | | | | 4,882 | |
| Deferred tax assets | | | - | | | | 6,518 | | | | 33 | | | | 263 | | | | - | | | | 6,814 | |
| | | | | | | | | | | | | | | | | | | | | | | | | |
| TOTAL CURRENT ASSETS | | | - | | | | 137,243 | | | | 2,345 | | | | 53,628 | | | | - | | | | 193,216 | |
| | | | | | | | | | | | | | | | | | | | | | | | | |
| PROPERTY AND EQUIPMENT, NET | | | - | | | | 111,604 | | | | 135 | | | | 9,814 | | | | - | | | | 121,553 | |
| MARKETABLE SECURITIES | | | - | | | | 1,971 | | | | - | | | | - | | | | - | | | | 1,971 | |
| GOODWILL | | | - | | | | 643,570 | | | | - | | | | - | | | | - | | | | 643,570 | |
| INTANGIBLE ASSETS | | | - | | | | 267,966 | | | | - | | | | 67 | | | | - | | | | 268,033 | |
| DEFERRED FINANCING COSTS | | | - | | | | 12,799 | | | | - | | | | - | | | | - | | | | 12,799 | |
| OTHER ASSETS | | | - | | | | 349 | | | | - | | | | 6 | | | | - | | | | 355 | |
| INTERCOMPANY RECEIVABLES | | | - | | | | 42,822 | | | | - | | | | - | | | | (42,822 | ) | | | - | |
| INVESTMENT IN SUBSIDIARIES | | | 154,130 | | | | 4,730 | | | | - | | | | - | | | | (158,860 | ) | | | - | |
| | | | | | | | | | | | | | | | | | | | | | | | | |
| TOTAL ASSETS | | $ | 154,130 | | | $ | 1,223,054 | | | $ | 2,480 | | | $ | 63,515 | | | $ | (201,682 | ) | | $ | 1,241,497 | |
| | | | | | | | | | | | | | | | | | | | | | | | | |
| LIABILITIES AND STOCKHOLDER'S EQUITY | | | | | | | | | | | | | | | | | | | | | | | | |
| | | | | | | | | | | | | | | | | | | | | | | | | |
| CURRENT LIABILITIES: | | | | | | | | | | | | | | | | | | | | | | | | |
| Accounts payable | | $ | - | | | $ | 20,787 | | | $ | 34 | | | $ | 4,488 | | | $ | - | | | $ | 25,309 | |
| Accrued payroll | | | - | | | | 12,824 | | | | 26 | | | | 830 | | | | - | | | | 13,680 | |
| Accrued interest | | | - | | | | 10,614 | | | | - | | | | - | | | | - | | | | 10,614 | |
| Accrued income taxes | | | - | | | | 6,457 | | | | - | | | | 653 | | | | - | | | | 7,110 | |
| Accrued purchases of property and equipment | | | - | | | | 3,434 | | | | - | | | | - | | | | - | | | | 3,434 | |
| Current portion of capital leases | | | - | | | | 1,222 | | | | - | | | | 439 | | | | - | | | | 1,661 | |
| Other accrued liabilities | | | - | | | | 29,470 | | | | 2,233 | | | | 7,983 | | | | - | | | | 39,686 | |
| | | | | | | | | | | | | | | | | | | | | | | | | |
| TOTAL CURRENT LIABILITIES | | | - | | | | 84,808 | | | | 2,293 | | | | 14,393 | | | | - | | | | 101,494 | |
| | | | | | | | | | | | | | | | | | | | | | | | | |
| DEFERRED TAX LIABILITIES | | | - | | | | 117,135 | | | | - | | | | - | | | | - | | | | 117,135 | |
| LONG-TERM DEBT, NET OF CURRENT PORTION | | | - | | | | 846,174 | | | | - | | | | - | | | | - | | | | 846,174 | |
| DEFERRED RENT | | | - | | | | 12,748 | | | | - | | | | 138 | | | | - | | | | 12,886 | |
| CAPITAL LEASES, NET OF CURRENT PORTION | | | - | | | | 2,148 | | | | - | | | | 1,619 | | | | - | | | | 3,767 | |
| OTHER LONG-TERM LIABILITIES | | | - | | | | 5,911 | | | | - | | | | - | | | | - | | | | 5,911 | |
| INTERCOMPANY PAYABLES | | | - | | | | - | | | | 92 | | | | 42,730 | | | | (42,822 | ) | | | - | |
| STOCKHOLDER'S EQUITY | | | 154,130 | | | | 154,130 | | | | 95 | | | | 4,635 | | | | (158,860 | ) | | | 154,130 | |
| | | | | | | | | | | | | | | | | | | | | | | | | |
| TOTAL LIABILITIES AND STOCKHOLDER'S EQUITY | | $ | 154,130 | | | $ | 1,223,054 | | | $ | 2,480 | | | $ | 63,515 | | | $ | (201,682 | ) | | $ | 1,241,497 | |
YANKEE HOLDING CORP. AND SUBSIDIARIES
CONDENSED CONSOLIDATING BALANCE SHEET
December 31, 2011
(in thousands)
| | | | | | | | | | | | Non | | | | | | | |
| | | Holding | | | | | | Guarantor | | | Guarantor | | | Intercompany | | | | |
| | | Corp. | | | Issuer | | | Subsidiaries | | | Subsidiaries | | | Eliminations | | | Consolidated | |
| ASSETS | | | | | | | | | | | | | | | | | | |
| CURRENT ASSETS: | | | | | | | | | | | | | | | | | | |
| Cash | | $ | - | | | $ | 45,777 | | | $ | 1,830 | | | $ | 3,226 | | | $ | - | | | $ | 50,833 | |
| Accounts receivable, net | | | - | | | | 34,641 | | | | 79 | | | | 22,293 | | | | - | | | | 57,013 | |
| Inventory | | | - | | | | 63,710 | | | | 94 | | | | 11,759 | | | | - | | | | 75,563 | |
| Prepaid expenses and other current assets | | | - | | | | 4,037 | | | | 69 | | | | 818 | | | | - | | | | 4,924 | |
| Deferred tax assets | | | - | | | | 8,585 | | | | 40 | | | | 99 | | | | - | | | | 8,724 | |
| | | | | | | | | | | | | | | | | | | | | | | | | |
| TOTAL CURRENT ASSETS | | | - | | | | 156,750 | | | | 2,112 | | | | 38,195 | | | | - | | | | 197,057 | |
| | | | | | | | | | | | | | | | | | | | | | | | | |
| PROPERTY AND EQUIPMENT, NET | | | - | | | | 114,447 | | | | 78 | | | | 3,877 | | | | - | | | | 118,402 | |
| MARKETABLE SECURITIES | | | - | | | | 1,670 | | | | - | | | | - | | | | - | | | | 1,670 | |
| GOODWILL | | | - | | | | 643,570 | | | | - | | | | - | | | | - | | | | 643,570 | |
| INTANGIBLE ASSETS | | | - | | | | 269,230 | | | | - | | | | 175 | | | | - | | | | 269,405 | |
| DEFERRED FINANCING COSTS | | | - | | | | 11,006 | | | | - | | | | - | | | | - | | | | 11,006 | |
| OTHER ASSETS | | | - | | | | 390 | | | | - | | | | 4 | | | | - | | | | 394 | |
| INTERCOMPANY RECEIVABLES | | | - | | | | 31,160 | | | | 164 | | | | - | | | | (31,324 | ) | | | - | |
| INVESTMENT IN SUBSIDIARIES | | | 118,911 | | | | 3,886 | | | | - | | | | - | | | | (122,797 | ) | | | - | |
| | | | | | | | | | | | | | | | | | | | | | | | | |
| TOTAL ASSETS | | $ | 118,911 | | | $ | 1,232,109 | | | $ | 2,354 | | | $ | 42,251 | | | $ | (154,121 | ) | | $ | 1,241,504 | |
| | | | | | | | | | | | | | | | | | | | | | | | | |
| LIABILITIES AND STOCKHOLDER'S EQUITY | | | | | | | | | | | | | | | | | | | | | | | | |
| | | | | | | | | | | | | | | | | | | | | | | | | |
| CURRENT LIABILITIES: | | | | | | | | | | | | | | | | | | | | | | | | |
| Accounts payable | | $ | - | | | $ | 18,259 | | | $ | 104 | | | $ | 2,746 | | | $ | - | | | $ | 21,109 | |
| Accrued payroll | | | - | | | | 6,523 | | | | 25 | | | | 362 | | | | - | | | | 6,910 | |
| Accrued interest | | | - | | | | 17,377 | | | | - | | | | - | | | | - | | | | 17,377 | |
| Accrued income taxes | | | - | | | | 6,727 | | | | - | | | | 542 | | | | - | | | | 7,269 | |
| Accrued purchases of property and equipment | | | - | | | | 2,310 | | | | - | | | | 296 | | | | - | | | | 2,606 | |
| Current portion of long-term debt | | | - | | | | 12,042 | | | | - | | | | - | | | | - | | | | 12,042 | |
| Current portion of capital leases | | | - | | | | 975 | | | | - | | | | - | | | | - | | | | 975 | |
| Other accrued liabilities | | | - | | | | 33,433 | | | | 1,856 | | | | 3,400 | | | | - | | | | 38,689 | |
| | | | | | | | | | | | | | | | | | | | | | | | | |
| TOTAL CURRENT LIABILITIES | | | - | | | | 97,646 | | | | 1,985 | | | | 7,346 | | | | - | | | | 106,977 | |
| | | | | | | | | | | | | | | | | | | | | | | | | |
| DEFERRED TAX LIABILITIES | | | - | | | | 107,123 | | | | - | | | | - | | | | - | | | | 107,123 | |
| LONG-TERM DEBT, NET OF CURRENT PORTION | | | - | | | | 889,083 | | | | - | | | | - | | | | - | | | | 889,083 | |
| DEFERRED RENT | | | - | | | | 12,769 | | | | - | | | | 64 | | | | - | | | | 12,833 | |
| CAPITAL LEASES, NET OF CURRENT PORTION | | | - | | | | 2,597 | | | | - | | | | - | | | | - | | | | 2,597 | |
| OTHER LONG-TERM LIABILITIES | | | - | | | | 3,980 | | | | - | | | | - | | | | - | | | | 3,980 | |
| INTERCOMPANY PAYABLES | | | - | | | | - | | | | - | | | | 31,324 | | | | (31,324 | ) | | | - | |
| STOCKHOLDER'S EQUITY | | | 118,911 | | | | 118,911 | | | | 369 | | | | 3,517 | | | | (122,797 | ) | | | 118,911 | |
| | | | | | | | | | | | | | | | | | | | | | | | | |
| TOTAL LIABILITIES AND STOCKHOLDER'S EQUITY | | $ | 118,911 | | | $ | 1,232,109 | | | $ | 2,354 | | | $ | 42,251 | | | $ | (154,121 | ) | | $ | 1,241,504 | |
YANKEE HOLDING CORP. AND SUBSIDIARIES
CONDENSED CONSOLIDATING STATEMENTS OF OPERATIONS
For the Fifty-Two Weeks Ended December 29, 2012
(in thousands)
| | | | | | | | | | | | Non | | | | | | | |
| | | Holding | | | | | | Guarantor | | | Guarantor | | | Intercompany | | | | |
| | | Corp. | | | Issuer | | | Subsidiaries | | | Subsidiaries | | | Eliminations | | | Consolidated | |
| | | | | | | | | | | | | | | | | | | |
| Sales | | $ | - | | | $ | 786,857 | | | $ | 2,684 | | | $ | 115,308 | | | $ | (60,663 | ) | | $ | 844,186 | |
| Cost of sales | | | - | | | | 329,678 | | | | 812 | | | | 92,998 | | | | (59,649 | ) | | | 363,839 | |
| | | | | | | | | | | | | | | | | | | | | | | | | |
| Gross profit | | | - | | | | 457,179 | | | | 1,872 | | | | 22,310 | | | | (1,014 | ) | | | 480,347 | |
| Selling expenses | | | - | | | | 205,291 | | | | 2,082 | | | | 30,902 | | | | (240 | ) | | | 238,035 | |
| General and administrative expenses | | | - | | | | 71,783 | | | | - | | | | 144 | | | | 162 | | | | 72,089 | |
| Restructuring charges | | | - | | | | 655 | | | | - | | | | 1,070 | | | | - | | | | 1,725 | |
| | | | | | | | | | | | | | | | | | | | | | | | | |
| Operating income (loss) | | | - | | | | 179,450 | | | | (210 | ) | | | (9,806 | ) | | | (936 | ) | | | 168,498 | |
| | | | | | | | | | | | | | | | | | | | | | | | | |
| Interest expense | | | - | | | | 71,850 | | | | - | | | | 97 | | | �� | - | | | | 71,947 | |
| Loss on extinguishment of debt | | | - | | | | 13,376 | | | | - | | | | - | | | | - | | | | 13,376 | |
| Other expense (income) | | | - | | | | 3,160 | | | | - | | | | (9,975 | ) | | | - | | | | (6,815 | ) |
| | | | | | | | | | | | | | | | | | | | | | | | | |
| Income (loss) from continuing operations before provision for (benefit from) income taxes | | | - | | | | 91,064 | | | | (210 | ) | | | 72 | | | | (936 | ) | | | 89,990 | |
| | | | | | | | | | | | | | | | | | | | | | | | | |
| Provision for (benefit from) income taxes | | | - | | | | 33,607 | | | | (77 | ) | | | 350 | | | | (347 | ) | | | 33,533 | |
| | | | | | | | | | | | | | | | | | | | | | | | | |
| Income (loss) from continuing operations | | | - | | | | 57,457 | | | | (133 | ) | | | (278 | ) | | | (589 | ) | | | 56,457 | |
| | | | | | | | | | | | | | | | | | | | | | | | | |
| Loss from discontinued operations, net of income taxes | | | - | | | | (134 | ) | | | - | | | | - | | | | - | | | | (134 | ) |
| Income (loss) before equity in (earnings) losses of subsidiaries, net of income tax | | | - | | | | 57,323 | | | | (133 | ) | | | (278 | ) | | | (589 | ) | | | 56,323 | |
| | | | | | | | | | | | | | | | | | | | | | | | | |
| Equity in (earnings) losses of subsidiaires, net of income tax | | | (56,323 | ) | | | 411 | | | | - | | | | - | | | | 55,912 | | | | - | |
| | | | | | | | | | | | | | | | | | | | | | | | | |
| Net income (loss) | | $ | 56,323 | | | $ | 56,912 | | | $ | (133 | ) | | $ | (278 | ) | | $ | (56,501 | ) | | $ | 56,323 | |
YANKEE HOLDING CORP. AND SUBSIDIARIES
CONDENSED CONSOLIDATING STATEMENTS OF OPERATIONS
For the Fifty-Two Weeks Ended December 31, 2011
(in thousands)
| | | | | | | | | | | | Non | | | | | | | |
| | | Holding | | | | | | Guarantor | | | Guarantor | | | Intercompany | | | | |
| | | Corp. | | | Issuer | | | Subsidiaries | | | Subsidiaries | | | Eliminations | | | Consolidated | |
| | | | | | | | | | | | | | | | | | | |
| Sales | | $ | - | | | $ | 732,421 | | | $ | 2,787 | | | $ | 100,091 | | | $ | (49,537 | ) | | $ | 785,762 | |
| Cost of sales | | | - | | | | 309,396 | | | | 851 | | | | 79,456 | | | | (49,367 | ) | | | 340,336 | |
| | | | | | | | | | | | | | | | | | | | | | | | | |
| Gross profit | | | - | | | | 423,025 | | | | 1,936 | | | | 20,635 | | | | (170 | ) | | | 445,426 | |
| Selling expenses | | | - | | | | 209,531 | | | | 2,255 | | | | 23,436 | | | | (240 | ) | | | 234,982 | |
| General and administrative expenses | | | - | | | | 61,852 | | | | - | | | | - | | | | 157 | | | | 62,009 | |
| | | | | | | | | | | | | | | | | | | | | | | | | |
| Operating income (loss) | | | - | | | | 151,642 | | | | (319 | ) | | | (2,801 | ) | | | (87 | ) | | | 148,435 | |
| | | | | | | | | | | | | | | | | | | | | | | | | |
| Interest expense | | | - | | | | 70,543 | | | | - | | | | - | | | | - | | | | 70,543 | |
| Other income | | | - | | | | (2,561 | ) | | | - | | | | (4,853 | ) | | | - | | | | (7,414 | ) |
| | | | | | | | | | | | | | | | | | | | | | | | | |
| Income (loss) before provision for (benefit from) income taxes | | | - | | | | 83,660 | | | | (319 | ) | | | 2,052 | | | | (87 | ) | | | 85,306 | |
| | | | | | | | | | | | | | | | | | | | | | | | | |
| Provision for (benefit from) income taxes | | | - | | | | 30,131 | | | | (115 | ) | | | 512 | | | | (31 | ) | | | 30,497 | |
| | | | | | | | | | | | | | | | | | | | | | | | | |
| Income (loss) from continuing operations | | | - | | | | 53,529 | | | | (204 | ) | | | 1,540 | | | | (56 | ) | | | 54,809 | |
| | | | | | | | | | | | | | | | | | | | | | | | | |
| Loss from discontinued operations, net of income taxes | | | - | | | | (262 | ) | | | - | | | | - | | | | - | | | | (262 | ) |
| Income (loss) before equity in (earnings) losses of subsidiaries, net of income tax | | | - | | | | 53,267 | | | | (204 | ) | | | 1,540 | | | | (56 | ) | | | 54,547 | |
| | | | | | | | | | | | | | | | | | | | | | | | | |
| Equity in (earnings) losses of subsidiaires, net of income tax | | | (54,547 | ) | | | (1,336 | ) | | | - | | | | - | | | | 55,883 | | | | - | |
| | | | | | | | | | | | | | | | | | | | | | | | | |
| Net income (loss) | | $ | 54,547 | | | $ | 54,603 | | | $ | (204 | ) | | $ | 1,540 | | | $ | (55,939 | ) | | $ | 54,547 | |
YANKEE HOLDING CORP. AND SUBSIDIARIES
CONDENSED CONSOLIDATING STATEMENTS OF OPERATIONS
For the Fifty-Two Weeks Ended January 1, 2011
(in thousands)
| | | | | | | | | | | | Non | | | | | | | |
| | | Holding | | | | | | Guarantor | | | Guarantor | | | Intercompany | | | | |
| | | Corp. | | | Issuer | | | Subsidiaries | | | Subsidiary | | | Eliminations | | | Consolidated | |
| | | | | | | | | | | | | | | | | | | |
| Sales | | $ | - | | | $ | 702,280 | | | $ | 2,856 | | | $ | 72,432 | | | $ | (43,851 | ) | | $ | 733,717 | |
| Cost of sales | | | - | | | | 286,485 | | | | 832 | | | | 60,988 | | | | (41,202 | ) | | | 307,103 | |
| | | | | | | | | | | | | | | | | | | | | | | | | |
| Gross profit | | | - | | | | 415,795 | | | | 2,024 | | | | 11,444 | | | | (2,649 | ) | | | 426,614 | |
| Selling expenses | | | - | | | | 194,571 | | | | 2,165 | | | | 16,084 | | | | (240 | ) | | | 212,580 | |
| General and administrative expenses | | | - | | | | 62,433 | | | | - | | | | - | | | | 176 | | | | 62,609 | |
| Restructuring charges | | | - | | | | 829 | | | | - | | | | - | | | | - | | | | 829 | |
| | | | | | | | | | | | | | | | | | | | | | | | | |
| Operating income (loss) | | | - | | | | 157,962 | | | | (141 | ) | | | (4,640 | ) | | | (2,585 | ) | | | 150,596 | |
| | | | | | | | | | | | | | | | | | | | | | | | | |
| Interest expense | | | - | | | | 75,648 | | | | - | | | | - | | | | - | | | | 75,648 | |
| Other expense (income) | | | - | | | | 14,609 | | | | 3 | | | | (5,640 | ) | | | - | | | | 8,972 | |
| | | | | | | | | | | | | | | | | | | | | | | | | |
| Income (loss) before provision for (benefit from) income taxes | | | - | | | | 67,705 | | | | (144 | ) | | | 1,000 | | | | (2,585 | ) | | | 65,976 | |
| | | | | | | | | | | | | | | | | | | | | | | | | |
| Provision for (benefit from) income taxes | | | - | | | | 24,388 | | | | (52 | ) | | | 280 | | | | (928 | ) | | | 23,688 | |
| | | | | | | | | | | | | | | | | | | | | | | | | |
| Income (loss) from continuing operations | | | - | | | | 43,317 | | | | (92 | ) | | | 720 | | | | (1,657 | ) | | | 42,288 | |
| | | | | | | | | | | | | | | | | | | | | | | | | |
| Loss from discontinued operations, net of income taxes | | | - | | | | (379 | ) | | | - | | | | - | | | | - | | | | (379 | ) |
| Income (loss) before equity in (earnings) losses of subsidiaries, net of income tax | | | - | | | | 42,938 | | | | (92 | ) | | | 720 | | | | (1,657 | ) | | | 41,909 | |
| | | | | | | | | | | | | | | | | | | | | | | | | |
| Equity in (earnings) losses of subsidiaires, net of income tax | | | (41,909 | ) | | | (628 | ) | | | - | | | | - | | | | 42,537 | | | | - | |
| | | | | | | | | | | | | | | | | | | | | | | | | |
| Net income (loss) | | $ | 41,909 | | | $ | 43,566 | | | $ | (92 | ) | | $ | 720 | | | $ | (44,194 | ) | | $ | 41,909 | |
YANKEE HOLDING CORP. AND SUBSIDIARIES
CONDENSED CONSOLIDATING STATEMENTS OF COMPREHENSIVE INCOME (LOSS)
For the Fifty-Two Weeks December 29, 2012
(in thousands)
| | | | | | | | | | | | Non | | | | | | | |
| | | Holding | | | | | | Guarantor | | | Guarantor | | | Intercompany | | | | |
| | | Corp. | | | Issuer | | | Subsidiaries | | | Subsidiaries | | | Eliminations | | | Consolidated | |
| Net income (loss) | | $ | 56,323 | | | $ | 56,912 | | | $ | (133 | ) | | $ | (278 | ) | | $ | (56,501 | ) | | $ | 56,323 | |
| Other comprehensive income, net of tax: | | | | | | | | | | | | | | | | | | | | | | | | |
| Foreign currency translation adjustments | | | - | | | | - | | | | - | | | | 1,482 | | | | - | | | | 1,482 | |
| Other comprehensive income, net of tax | | | - | | | | - | | | | - | | | | 1,482 | | | | - | | | | 1,482 | |
| Equity in other comprehensive income of subsidiaries, net of tax | | | 1,482 | | | | - | | | | - | | | | - | | | | (1,482 | ) | | | - | |
| | | | | | | | | | | | | | | | | | | | | | | | | |
| Comprehensive income (loss) | | $ | 57,805 | | | $ | 56,912 | | | $ | (133 | ) | | $ | 1,204 | | | $ | (57,983 | ) | | $ | 57,805 | |
YANKEE HOLDING CORP. AND SUBSIDIARIES
CONDENSED CONSOLIDATING STATEMENTS OF COMPREHENSIVE INCOME (LOSS)
For the Fifty-Two Weeks December 31, 2011
(in thousands)
| | | | | | | | | | | | Non | | | | | | | |
| | | Holding | | | | | | Guarantor | | | Guarantor | | | Intercompany | | | | |
| | | Corp. | | | Issuer | | | Subsidiaries | | | Subsidiaries | | | Eliminations | | | Consolidated | |
| Net income (loss) | | $ | 54,547 | | | $ | 54,603 | | | $ | (204 | ) | | $ | 1,540 | | | $ | (55,939 | ) | | $ | 54,547 | |
| Other comprehensive income (loss), net of tax: | | | | | | | | | | | | | | | | | | | | | | | | |
| Foreign currency translation adjustments | | | - | | | | - | | | | - | | | | (535 | ) | | | - | | | | (535 | ) |
| Unrealized gain on interest rate swaps | | | - | | | | 712 | | | | - | | | | - | | | | - | | | | 712 | |
| Other comprehensive income (loss), net of tax | | | - | | | | 712 | | | | - | | | | (535 | ) | | | - | | | | 177 | |
| Equity in other comprehensive income of subsidiaries, net of tax | | | 177 | | | | - | | | | - | | | | - | | | | (177 | ) | | | - | |
| | | | | | | | | | | | | | | | | | | | | | | | | |
| Comprehensive income (loss) | | $ | 54,724 | | | $ | 55,315 | | | $ | (204 | ) | | $ | 1,005 | | | $ | (56,116 | ) | | $ | 54,724 | |
YANKEE HOLDING CORP. AND SUBSIDIARIES
CONDENSED CONSOLIDATING STATEMENTS OF COMPREHENSIVE INCOME (LOSS)
For the Fifty-Two Weeks January 1, 2011
(in thousands)
| | | | | | | | | | | | Non | | | | | | | |
| | | Holding | | | | | | Guarantor | | | Guarantor | | | Intercompany | | | | |
| | | Corp. | | | Issuer | | | Subsidiaries | | | Subsidiary | | | Eliminations | | | Consolidated | |
| Net income (loss) | | $ | 41,909 | | | $ | 43,566 | | | $ | (92 | ) | | $ | 720 | | | $ | (44,194 | ) | | $ | 41,909 | |
| Other comprehensive income (loss), net of tax: | | | | | | | | | | | | | | | | | | | | | | | | |
| Foreign currency translation adjustments | | | - | | | | - | | | | - | | | | (462 | ) | | | - | | | | (462 | ) |
| Unrealized gain on interest rate swaps | | | - | | | | 5,249 | | | | - | | | | - | | | | - | | | | 5,249 | |
| Other comprehensive income (loss), net of tax | | | - | | | | 5,249 | | | | - | | | | (462 | ) | | | - | | | | 4,787 | |
| Equity in other comprehensive income of subsidiaries, net of tax | | | 4,787 | | | | - | | | | - | | | | - | | | | (4,787 | ) | | | - | |
| | | | | | | | | | | | | | | | | | | | | | | | | |
| Comprehensive income (loss) | | $ | 46,696 | | | $ | 48,815 | | | $ | (92 | ) | | $ | 258 | | | $ | (48,981 | ) | | $ | 46,696 | |
YANKEE HOLDING CORP. AND SUBSIDIARIES
CONDENSED CONSOLIDATING STATEMENTS OF CASH FLOWS
For the Fifty-Two Weeks December 29, 2012
(in thousands)
| | | | | | | | | | | | Non | | | | | | | |
| | | Holding | | | | | | Guarantor | | | Guarantor | | | Intercompany | | | | |
| | | Corp. | | | Issuer | | | Subsidiaries | | | Subsidiaries | | | Eliminations | | | Consolidated | |
| CASH FLOWS PROVIDED BY (USED IN) OPERATING ACTIVITIES: | | | | | | | | | | | | | | | | | | |
| Net income (loss) | | $ | 56,323 | | | $ | 56,912 | | | $ | (133 | ) | | $ | (278 | ) | | $ | (56,501 | ) | | $ | 56,323 | |
| Adjustments to reconcile net income (loss) to net cash provided by (used in) operating activities: | | | | | | | | | | | | | | | | | | | | | | | | |
| Realized gain on derivative contracts | | | - | | | | (7,652 | ) | | | - | | | | - | | | | - | | | | (7,652 | ) |
| Depreciation and amortization | | | - | | | | 30,298 | | | | 25 | | | | 1,575 | | | | - | | | | 31,898 | |
| Unrealized gain on marketable securities | | | - | | | | (171 | ) | | | - | | | | - | | | | - | | | | (171 | ) |
| Equity-based compensation expense | | | - | | | | 753 | | | | - | | | | - | | | | - | | | | 753 | |
| Deferred taxes | | | - | | | | 11,663 | | | | 7 | | | | (164 | ) | | | - | | | | 11,506 | |
| Loss on extinguishment of debt | | | - | | | | 13,376 | | | | - | | | | - | | | | - | | | | 13,376 | |
| Loss on disposal and impairment of property and equipment | | | - | | | | 380 | | | | - | | | | 2 | | | | - | | | | 382 | |
| Restructuring charges | | | - | | | | - | | | | - | | | | 1,070 | | | | - | | | | 1,070 | |
| Equity in (earnings) losses of subsidiaries | | | (56,323 | ) | | | 411 | | | | - | | | | (589 | ) | | | 56,501 | | | | - | |
| Changes in assets and liabilities: | | | | | | | | | | | | | | | | | | | | | | | | |
| Accounts receivable | | | - | | | | 1,874 | | | | 31 | | | | (7,474 | ) | | | - | | | | (5,569 | ) |
| Inventory | | | - | | | | 2,145 | | | | (1 | ) | | | (3,840 | ) | | | - | | | | (1,696 | ) |
| Prepaid expenses and other assets | | | - | | | | (152 | ) | | | 22 | | | | (275 | ) | | | - | | | | (405 | ) |
| Accounts payable | | | - | | | | 2,528 | | | | (70 | ) | | | 1,606 | | | | - | | | | 4,064 | |
| Income taxes | | | - | | | | 13,043 | | | | - | | | | 111 | | | | - | | | | 13,154 | |
| Accrued expenses and other liabilities | | | - | | | | 3,714 | | | | 378 | | | | 4,169 | | | | - | | | | 8,261 | |
| | | | | | | | | | | | | | | | | | | | | | | | | |
| NET CASH PROVIDED BY (USED IN) OPERATING ACTIVITIES | | | - | | | | 129,122 | | | | 259 | | | | (4,087 | ) | | | - | | | | 125,294 | |
| CASH FLOWS (USED IN) PROVIDED BY INVESTING ACTIVITIES: | | | | | | | | | | | | | | | | | | | | | | | | |
| Purchases of property and equipment | | | - | | | | (20,191 | ) | | | (89 | ) | | | (5,236 | ) | | | - | | | | (25,516 | ) |
| Intercompany payables/receivables | | | - | | | | (11,621 | ) | | | - | | | | - | | | | 11,621 | | | | - | |
| NET CASH (USED IN) PROVIDED BY INVESTING ACTIVITIES | | | - | | | | (31,812 | ) | | | (89 | ) | | | (5,236 | ) | | | 11,621 | | | | (25,516 | ) |
| CASH FLOWS (USED IN) PROVIDED BY FINANCING ACTIVITIES: | | | | | | | | | | | | | | | | | | | | | | | | |
| Borrowings under Senior Secured Credit Facility | | | - | | | | 15,000 | | | | - | | | | - | | | | - | | | | 15,000 | |
| Borrowings under Senior Secured Asset-Based Credit Facility | | | - | | | | 81,000 | | | | - | | | | - | | | | - | | | | 81,000 | |
| Borrowings under Term Loan Facility | | | | | | | 717,750 | | | | - | | | | - | | | | - | | | | 717,750 | |
| Repayments under Senior Secured Credit Facility | | | - | | | | (718,125 | ) | | | - | | | | - | | | | - | | | | (718,125 | ) |
| Payments of call premiums and fees for extinguishment of debt | | | | | | | (6,763 | ) | | | - | | | | - | | | | - | | | | (6,763 | ) |
| Repayments under Term Loan Facility | | | - | | | | (70,625 | ) | | | - | | | | - | | | | - | | | | (70,625 | ) |
| Repayments under Senior Secured Asset-Based Credit Facility | | | - | | | | (81,000 | ) | | | - | | | | - | | | | - | | | | (81,000 | ) |
| Financing costs | | | - | | | | (11,579 | ) | | | - | | | | - | | | | - | | | | (11,579 | ) |
| Dividend to YCC Holdings LLC | | | - | | | | (32,389 | ) | | | - | | | | - | | | | - | | | | (32,389 | ) |
| Proceeds from issuance of common stock | | | - | | | | 36 | | | | - | | | | - | | | | - | | | | 36 | |
| Repurchase of common stock | | | - | | | | (2,623 | ) | | | - | | | | - | | | | - | | | | (2,623 | ) |
| Principal payments on capital lease obligations | | | - | | | | (1,091 | ) | | | - | | | | (361 | ) | | | - | | | | (1,452 | ) |
| Intercompany payables/receivables | | | - | | | | - | | | | 122 | | | | 11,499 | | | | (11,621 | ) | | | - | |
| | | | | | | | | | | | | | | | | | | | | | | | | |
| NET CASH (USED IN) PROVIDED BY FINANCING ACTIVITIES | | | - | | | | (110,409 | ) | | | 122 | | | | 11,138 | | | | (11,621 | ) | | | (110,770 | ) |
| | | | | | | | | | | | | | | | | | | | | | | | | |
| EFFECT OF EXCHANGE RATE CHANGES ON CASH | | | - | | | | - | | | | - | | | | 138 | | | | - | | | | 138 | |
| | | | | | | | | | | | | | | | | | | | | | | | | |
| NET (DECREASE) INCREASE IN CASH | | | - | | | | (13,099 | ) | | | 292 | | | | 1,953 | | | | - | | | | (10,854 | ) |
| | | | | | | | | | | | | | | | | | | | | | | | | |
| CASH, BEGINNING OF YEAR | | | - | | | | 45,777 | | | | 1,830 | | | | 3,226 | | | | - | | | | 50,833 | |
| | | | | | | | | | | | | | | | | | | | | | | | | |
| CASH, END OF YEAR | | $ | - | | | $ | 32,678 | | | $ | 2,122 | | | $ | 5,179 | | | $ | - | | | $ | 39,979 | |
YANKEE HOLDING CORP. AND SUBSIDIARIES
CONDENSED CONSOLIDATING STATEMENTS OF CASH FLOWS
For the Fifty-Two Weeks December 31, 2011
(in thousands)
| | | | | | | | | | | | Non | | | | | | | |
| | | Holding | | | | | | Guarantor | | | Guarantor | | | Intercompany | | | | |
| | | Corp. | | | Issuer | | | Subsidiaries | | | Subsidiaries | | | Eliminations | | | Consolidated | |
| CASH FLOWS PROVIDED BY (USED IN) OPERATING ACTIVITIES: | | | | | | | | | | | | | | | | | | |
| Net income (loss) | | $ | 54,547 | | | $ | 54,603 | | | $ | (204 | ) | | $ | 1,540 | | | $ | (55,939 | ) | | $ | 54,547 | |
| Adjustments to reconcile net income (loss) to net cash provided by (used in) operating activities: | | | | | | | | | | | | | | | | | | | | | | | | |
| Realized gain on derivative contracts | | | - | | | | (6,403 | ) | | | - | | | | - | | | | - | | | | (6,403 | ) |
| Depreciation and amortization | | | - | | | | 40,738 | | | | 22 | | | | 909 | | | | - | | | | 41,669 | |
| Unrealized loss on marketable securities | | | - | | | | 50 | | | | - | | | | - | | | | - | | | | 50 | |
| Equity-based compensation expense | | | - | | | | 820 | | | | - | | | | - | | | | - | | | | 820 | |
| Deferred taxes | | | - | | | | 10,395 | | | | 25 | | | | (99 | ) | | | - | | | | 10,321 | |
| Loss on disposal of property and equipment | | | - | | | | 1,411 | | | | - | | | | - | | | | - | | | | 1,411 | |
| Equity in losses (earnings) of subsidiaries | | | (54,547 | ) | | | (1,336 | ) | | | - | | | | (56 | ) | | | 55,939 | | | | - | |
| Changes in assets and liabilities: | | | | | | | | | | | | | | | | | | | | | | | | |
| Accounts receivable | | | - | | | | (2,681 | ) | | | 97 | | | | (7,492 | ) | | | - | | | | (10,076 | ) |
| Inventory | | | - | | | | (6,281 | ) | | | (7 | ) | | | (1,887 | ) | | | - | | | | (8,175 | ) |
| Prepaid expenses and other assets | | | - | | | | 4,872 | | | | 126 | | | | (241 | ) | | | - | | | | 4,757 | |
| Accounts payable | | | - | | | | (6,766 | ) | | | 58 | | | | 1,526 | | | | - | | | | (5,182 | ) |
| Income taxes | | | - | | | | (173 | ) | | | - | | | | 341 | | | | - | | | | 168 | |
| Accrued expenses and other liabilities | | | - | | | | (3,946 | ) | | | (110 | ) | | | 936 | | | | - | | | | (3,120 | ) |
| | | | | | | | | | | | | | | | | | | | | | | | | |
| NET CASH PROVIDED BY (USED IN) OPERATING ACTIVITIES | | | - | | | | 85,303 | | | | 7 | | | | (4,523 | ) | | | - | | | | 80,787 | |
| | | | | | | | | | | | | | | | | | | | | | | | | |
| CASH FLOWS (USED IN) PROVIDED BY INVESTING ACTIVITIES: | | | | | | | | | | | | | | | | | | | | | | | | |
| Purchases of property and equipment | | | - | | | | (22,221 | ) | | | (47 | ) | | | (2,027 | ) | | | - | | | | (24,295 | ) |
| Proceeds from the sale of property and equipment | | | - | | | | 47 | | | | - | | | | - | | | | - | | | | 47 | |
| Intercompany payables/receivables | | | - | | | | (7,275 | ) | | | - | | | | - | | | | 7,275 | | | | - | |
| | | | | | | | | | | | | | | | | | | | | | | | | |
| NET CASH (USED IN) PROVIDED BY INVESTING ACTIVITIES | | | - | | | | (29,449 | ) | | | (47 | ) | | | (2,027 | ) | | | 7,275 | | | | (24,248 | ) |
| | | | | | | | | | | | | | | | | | | | | | | | | |
| CASH FLOWS (USED IN) PROVIDED BY FINANCING ACTIVITIES: | | | | | | | | | | | | | | | | | | | | | | | | |
| Borrowings under Senior Secured Credit Facility | | | - | | | | 150,000 | | | | - | | | | - | | | | - | | | | 150,000 | |
| Repayments under Senior Secured Credit Facility | | | - | | | | (150,000 | ) | | | - | | | | - | | | | - | | | | (150,000 | ) |
| Financing costs | | | - | | | | (468 | ) | | | - | | | | - | | | | - | | | | (468 | ) |
| Contributions by YCC Holdings LLC | | | - | | | | 3,000 | | | | - | | | | - | | | | - | | | | 3,000 | |
| Investment in subsidiary | | | - | | | | (360 | ) | | | - | | | | - | | | | 360 | | | | - | |
| Contributions by YCC Holdings LLC | | | - | | | | - | | | | - | | | | 360 | | | | (360 | ) | | | - | |
| Dividend to YCC Holdings LLC | | | - | | | | (19,256 | ) | | | - | | | | - | | | | - | | | | (19,256 | ) |
| Proceeds from issuance of common stock | | | - | | | | 20 | | | | - | | | | - | | | | - | | | | 20 | |
| Repurchase of common stock | | | - | | | | (862 | ) | | | - | | | | - | | | | - | | | | (862 | ) |
| Principal payments on capital lease obligations | | | - | | | | (853 | ) | | | - | | | | - | | | | - | | | | (853 | ) |
| Intercompany payables/receivables | | | - | | | | - | | | | 2 | | | | 7,273 | | | | (7,275 | ) | | | - | |
| | | | | | | | | | | | | | | | | | | | | | | | | |
| NET CASH (USED IN) PROVIDED BY FINANCING ACTIVITIES | | | - | | | | (18,779 | ) | | | 2 | | | | 7,633 | | | | (7,275 | ) | | | (18,419 | ) |
| | | | | | | | | | | | | | | | | | | | | | | | | |
| EFFECT OF EXCHANGE RATE CHANGES ON CASH | | | - | | | | - | | | | - | | | | - | | | | - | | | | - | |
| | | | | | | | | | | | | | | | | | | | | | | | | |
| NET INCREASE (DECREASE) IN CASH | | | - | | | | 37,075 | | | | (38 | ) | | | 1,083 | | | | - | | | | 38,120 | |
| | | | | | | | | | | | | | | | | | | | | | | | | |
| CASH, BEGINNING OF YEAR | | | - | | | | 8,702 | | | | 1,868 | | | | 2,143 | | | | - | | | | 12,713 | |
| | | | | | | | | | | | | | | | | | | | | | | | | |
| CASH, END OF YEAR | | $ | - | | | $ | 45,777 | | | $ | 1,830 | | | $ | 3,226 | | | $ | - | | | $ | 50,833 | |
YANKEE HOLDING CORP. AND SUBSIDIARIES
CONDENSED CONSOLIDATING STATEMENTS OF CASH FLOWS
For the Fifty-Two Weeks Ended January 1, 2011
(in thousands)
| | | | | | | | | | | | Non | | | | | | | |
| | | Holding | | | | | | Guarantor | | | Guarantor | | | Intercompany | | | | |
| | | Corp. | | | Issuer | | | Subsidiaries | | | Subsidiary | | | Eliminations | | | Consolidated | |
| CASH FLOWS PROVIDED BY (USED IN) OPERATING ACTIVITIES: | | | | | | | | | | | | | | | | | | |
| Net income (loss) | | $ | 41,909 | | | $ | 43,566 | | | $ | (92 | ) | | $ | 720 | | | $ | (44,194 | ) | | $ | 41,909 | |
| Adjustments to reconcile net income (loss) to net cash provided by (used in) operating activities: | | | | | | | | | | | | | | | | | | | | | | | | |
| Realized loss on derivative contracts | | | - | | | | 9,166 | | | | - | | | | - | | | | - | | | | 9,166 | |
| Depreciation and amortization | | | - | | | | 42,403 | | | | 16 | | | | 559 | | | | - | | | | 42,978 | |
| Unrealized gain on marketable securities | | | - | | | | (83 | ) | | | - | | | | - | | | | - | | | | (83 | ) |
| Equity-based compensation expense | | | - | | | | 962 | | | | - | | | | - | | | | - | | | | 962 | |
| Deferred taxes | | | - | | | | 3,809 | | | | 122 | | | | - | | | | - | | | | 3,931 | |
| Non-cash adjustments relating to restructuring | | | - | | | | 10 | | | | - | | | | - | | | | - | | | | 10 | |
| Loss on disposal of property and equipment | | | - | | | | 213 | | | | - | | | | - | | | | - | | | | 213 | |
| Marketable securities | | | - | | | | 22 | | | | - | | | | - | | | | - | | | | 22 | |
| Equity in earnings of subsidiaries | | | (41,909 | ) | | | (628 | ) | | | - | | | | (1,657 | ) | | | 44,194 | | | | - | |
| Changes in assets and liabilities: | | | | | | | | | | | | | | | | | | | | | | | | |
| Accounts receivable | | | - | | | | 2,342 | | | | 51 | | | | (5,875 | ) | | | - | | | | (3,482 | ) |
| Inventory | | | - | | | | (6,049 | ) | | | (8 | ) | | | (2,393 | ) | | | - | | | | (8,450 | ) |
| Prepaid expenses and other assets | | | - | | | | (710 | ) | | | 67 | | | | 26 | | | | - | | | | (617 | ) |
| Accounts payable | | | - | | | | 4,082 | | | | (42 | ) | | | 642 | | | | - | | | | 4,682 | |
| Income taxes | | | - | | | | 17,974 | | | | - | | | | 201 | | | | - | | | | 18,175 | |
| Accrued expenses and other liabilities | | | - | | | | 428 | | | | (77 | ) | | | 638 | | | | - | | | | 989 | |
| | | | | | | | | | | | | | | | | | | | | | | | | |
| NET CASH PROVIDED BY (USED IN) OPERATING ACTIVITIES | | | - | | | | 117,507 | | | | 37 | | | | (7,139 | ) | | | - | | | | 110,405 | |
| | | | | | | | | | | | | | | | | | | | | | | | | |
| CASH FLOWS (USED IN) PROVIDED BY INVESTING ACTIVITIES: | | | | | | | | | | | | | | | | | | | | | | | | |
| Purchases of property and equipment | | | - | | | | (16,306 | ) | | | (21 | ) | | | (1,324 | ) | | | - | | | | (17,651 | ) |
| Proceeds from the sale of property and equipment | | | - | | | | 202 | | | | - | | | | - | | | | - | | | | 202 | |
| Intercompany payables/receivables | | | | | | | (8,047 | ) | | | | | | | | | | | 8,047 | | | | - | |
| | | | | | | | | | | | | | | | | | | | | | | | | |
| NET CASH (USED IN) PROVIDED BY INVESTING ACTIVITIES | | | - | | | | (24,151 | ) | | | (21 | ) | | | (1,324 | ) | | | 8,047 | | | | (17,449 | ) |
| | | | | | | | | | | | | | | | | | | | | | | | | |
| CASH FLOWS (USED IN) PROVIDED BY FINANCING ACTIVITIES: | | | | | | | | | | | | | | | | | | | | | | | | |
| Borrowings under Senior Secured Credit Facility | | | - | | | | 76,000 | | | | - | | | | - | | | | - | | | | 76,000 | |
| Repayments under Senior Secured Credit Facility | | | - | | | | (164,000 | ) | | | - | | | | - | | | | - | | | | (164,000 | ) |
| Proceeds from issuance of common stock | | | - | | | | 40 | | | | - | | | | - | | | | - | | | | 40 | |
| Repurchase of common stock | | | - | | | | (933 | ) | | | - | | | | - | | | | - | | | | (933 | ) |
| Principal payments on capital lease obligations | | | - | | | | (349 | ) | | | - | | | | - | | | | - | | | | (349 | ) |
| Intercompany payables/receivables | | | - | | | | - | | | | (299 | ) | | | 8,346 | | | | (8,047 | ) | | | - | |
| NET CASH (USED IN) PROVIDED BY FINANCING ACTIVITIES | | | - | | | | (89,242 | ) | | | (299 | ) | | | 8,346 | | | | (8,047 | ) | | | (89,242 | ) |
| | | | | | | | | | | | | | | | | | | | | | | | | |
| EFFECT OF EXCHANGE RATE CHANGES ON CASH | | | - | | | | - | | | | - | | | | (96 | ) | | | - | | | | (96 | ) |
| | | | | | | | | | | | | | | | | | | | | | | | | |
| NET INCREASE (DECREASE) IN CASH | | | - | | | | 4,114 | | | | (283 | ) | | | (213 | ) | | | - | | | | 3,618 | |
| | | | | | | | | | | | | | | | | | | | | | | | | |
| CASH, BEGINNING OF YEAR | | | - | | | | 4,588 | | | | 2,151 | | | | 2,356 | | | | - | | | | 9,095 | |
| | | | | | | | | | | | | | | | | | | | | | | | | |
| CASH, END OF YEAR | | $ | - | | | $ | 8,702 | | | $ | 1,868 | | | $ | 2,143 | | | $ | - | | | $ | 12,713 | |
22. QUARTERLY FINANCIAL DATA (UNAUDITED)
| YCC Holdings | |
| | | Thirteen Weeks | | | Thirteen Weeks | | | Thirteen Weeks | | | Thirteen Weeks | |
| | Ended | | | Ended | | | Ended | | | Ended | |
| | March 31, 2012 | | | June 30, 2012 | | | September 29, 2012 | | | December 29, 2012 | |
| Sales | | $ | 155,067 | | | $ | 145,327 | | | $ | 201,661 | | | $ | 342,131 | |
| Cost of sales | | | 71,277 | | | | 63,906 | | | | 92,305 | | | | 136,351 | |
| Gross profit | | | 83,790 | | | | 81,421 | | | | 109,356 | | | | 205,780 | |
| Selling expenses | | | 55,482 | | | | 53,231 | | | | 56,643 | | | | 72,679 | |
| General and administrative expenses | | | 16,946 | | | | 17,951 | | | | 16,875 | | | | 20,412 | |
| Restructuring charges | | | 655 | | | | 1,070 | | | | - | | | | - | |
| Income from operations | | | 10,707 | | | | 9,169 | | | | 35,838 | | | | 112,689 | |
| Interest expense | | | 25,945 | | | | 27,320 | | | | 27,010 | | | | 26,614 | |
| Loss on extinguishment of debt | | | - | | | | 13,376 | | | | - | | | | - | |
| Other income | | | (1,092 | ) | | | (1,735 | ) | | | (2,097 | ) | | | (1,891 | ) |
| (Loss) income before (benefit from) provision for income taxes | | | (14,146 | ) | | | (29,792 | ) | | | 10,925 | | | | 87,966 | |
| (Benefit from) provision for income taxes | | | (5,217 | ) | | | (11,105 | ) | | | 4,226 | | | | 33,992 | |
| (Loss) income from continuing operations | | | (8,929 | ) | | | (18,687 | ) | | | 6,699 | | | | 53,974 | |
| Loss from discontinued operations, net of income taxes | | | (43 | ) | | | (31 | ) | | | (31 | ) | | | (29 | ) |
| Net (loss) income | | $ | (8,972 | ) | | $ | (18,718 | ) | | $ | 6,668 | | | $ | 53,945 | |
| | | Thirteen Weeks Ended April 2, 2011 | | | Thirteen Weeks Ended July 2, 2011 | | | Thirteen Weeks Ended October 1, 2011 | | | Thirteen Weeks Ended December 31, 2011 | |
| Sales | | $ | 144,114 | | | $ | 129,913 | | | $ | 195,109 | | | $ | 316,627 | |
| Cost of sales | | | 64,863 | | | | 58,291 | | | | 87,958 | | | | 129,225 | |
| Gross profit | | | 79,251 | | | | 71,622 | | | | 107,151 | | | | 187,402 | |
| Selling expenses | | | 53,059 | | | | 52,130 | | | | 57,865 | | | | 71,927 | |
| General and administrative expenses | | | 18,794 | | | | 14,029 | | | | 15,486 | | | | 14,143 | |
| Income from operations | | | 7,398 | | | | 5,463 | | | | 33,800 | | | | 101,332 | |
| Interest expense | | | 22,745 | | | | 26,308 | | | | 26,665 | | | | 25,879 | |
| Other income | | | (1,875 | ) | | | (1,085 | ) | | | (2,372 | ) | | | (2,082 | ) |
| (Loss) income before (benefit from) provision for income taxes | | | (13,472 | ) | | | (19,760 | ) | | | 9,507 | | | | 77,535 | |
| (Benefit from) provision for income taxes | | | (4,999 | ) | | | (7,196 | ) | | | 3,090 | | | | 29,145 | |
| (Loss) income from continuing operations | | | (8,473 | ) | | | (12,564 | ) | | | 6,417 | | | | 48,390 | |
| Loss from discontinued operations, net of income taxes | | | (54 | ) | | | (132 | ) | | | (42 | ) | | | (35 | ) |
| Net (loss) income | | $ | (8,527 | ) | | $ | (12,696 | ) | | $ | 6,375 | | | $ | 48,355 | |
| | | Thirteen Weeks Ended April 3, 2010 | | | Thirteen Weeks Ended July 3, 2010 | | | Thirteen Weeks Ended October 2, 2010 | | | Thirteen Weeks Ended January 1, 2011 | |
| Sales | | $ | 140,975 | | | $ | 125,368 | | | $ | 175,750 | | | $ | 291,624 | |
| Cost of sales | | | 62,312 | | | | 55,687 | | | | 74,103 | | | | 115,001 | |
| Gross profit | | | 78,663 | | | | 69,681 | | | | 101,647 | | | | 176,623 | |
| Selling expenses | | | 49,568 | | | | 48,258 | | | | 51,842 | | | | 62,912 | |
| General and administrative expenses | | | 16,679 | | | | 13,952 | | | | 15,676 | | | | 16,302 | |
| Restructuring charges | | | 800 | | | | 29 | | | | - | | | | - | |
| Income from operations | | | 11,616 | | | | 7,442 | | | | 34,129 | | | | 97,409 | |
| Interest expense | | | 19,807 | | | | 18,462 | | | | 20,525 | | | | 16,854 | |
| Other expense (income) | | | 4,732 | | | | 4,751 | | | | 484 | | | | (995 | ) |
| (Loss) income before (benefit from) provision for income taxes | | | (12,923 | ) | | | (15,771 | ) | | | 13,120 | | | | 81,550 | |
| (Benefit from) provision for income taxes | | | (4,676 | ) | | | (5,621 | ) | | | 4,247 | | | | 29,738 | |
| (Loss) income from continuing operations | | | (8,247 | ) | | | (10,150 | ) | | | 8,873 | | | | 51,812 | |
| Loss from discontinued operations, net of income taxes | | | (255 | ) | | | (38 | ) | | | (49 | ) | | | (37 | ) |
| Net (loss) income | | $ | (8,502 | ) | | $ | (10,188 | ) | | $ | 8,824 | | | $ | 51,775 | |
| Holding Corp. | |
| | | Thirteen Weeks Ended March 31, 2012 | | | Thirteen Weeks Ended June 30, 2012 | | | Thirteen Weeks Ended September 29, 2012 | | | Thirteen Weeks Ended December 29, 2012 | |
| Sales | | $ | 155,067 | | | $ | 145,327 | | | $ | 201,661 | | | $ | 342,131 | |
| Cost of sales | | | 71,277 | | | | 63,906 | | | | 92,305 | | | | 136,351 | |
| Gross profit | | | 83,790 | | | | 81,421 | | | | 109,356 | | | | 205,780 | |
| Selling expenses | | | 55,482 | | | | 53,231 | | | | 56,643 | | | | 72,679 | |
| General and administrative expenses | | | 16,902 | | | | 17,951 | | | | 16,862 | | | | 20,374 | |
| Restructuring charges | | | 655 | | | | 1,070 | | | | - | | | | - | |
| Income from operations | | | 10,751 | | | | 9,169 | | | | 35,851 | | | | 112,727 | |
| Interest expense | | | 17,234 | | | | 18,553 | | | | 18,266 | | | | 17,894 | |
| Loss on extinguishment of debt | | | - | | | | 13,376 | | | | - | | | | - | |
| Other income | | | (1,092 | ) | | | (1,735 | ) | | | (2,097 | ) | | | (1,891 | ) |
| (Loss) income before (benefit from) provision for income taxes | | | (5,391 | ) | | | (21,025 | ) | | | 19,682 | | | | 96,724 | |
| (Benefit from) provision for income taxes | | | (1,921 | ) | | | (7,515 | ) | | | 7,389 | | | | 35,580 | |
| (Loss) income from continuing operations | | | (3,470 | ) | | | (13,510 | ) | | | 12,293 | | | | 61,144 | |
| Loss from discontinued operations, net of income taxes | | | (43 | ) | | | (31 | ) | | | (31 | ) | | | (29 | ) |
| Net (loss) income | | $ | (3,513 | ) | | $ | (13,541 | ) | | $ | 12,262 | | | $ | 61,115 | |
| | | Thirteen Weeks Ended April 2, 2011 | | | Thirteen Weeks Ended July 2, 2011 | | | Thirteen Weeks Ended October 1, 2011 | | | Thirteen Weeks Ended December 31, 2011 | |
| Sales | | $ | 144,114 | | | $ | 129,913 | | | $ | 195,109 | | | $ | 316,627 | |
| Cost of sales | | | 64,863 | | | | 58,291 | | | | 87,958 | | | | 129,225 | |
| Gross profit | | | 79,251 | | | | 71,622 | | | | 107,151 | | | | 187,402 | |
| Selling expenses | | | 53,059 | | | | 52,130 | | | | 57,865 | | | | 71,927 | |
| General and administrative expenses | | | 18,594 | | | | 14,024 | | | | 15,273 | | | | 14,118 | |
| Income from operations | | | 7,598 | | | | 5,468 | | | | 34,013 | | | | 101,357 | |
| Interest expense | | | 17,679 | | | | 17,777 | | | | 17,847 | | | | 17,240 | |
| Other income | | | (1,875 | ) | | | (1,085 | ) | | | (2,372 | ) | | | (2,082 | ) |
| (Loss) income before (benefit from) provision for income taxes | | | (8,206 | ) | | | (11,224 | ) | | | 18,538 | | | | 86,199 | |
| (Benefit from) provision for income taxes | | | (2,912 | ) | | | (3,980 | ) | | | 6,044 | | | | 31,345 | |
| (Loss) income from continuing operations | | | (5,294 | ) | | | (7,244 | ) | | | 12,494 | | | | 54,854 | |
| Loss from discontinued operations, net of income taxes | | | (54 | ) | | | (132 | ) | | | (42 | ) | | | (35 | ) |
| Net (loss) income | | $ | (5,348 | ) | | $ | (7,376 | ) | | $ | 12,452 | | | $ | 54,819 | |
| | | Thirteen Weeks Ended April 3, 2010 | | | Thirteen Weeks Ended July 3, 2010 | | | Thirteen Weeks Ended October 2, 2010 | | | Thirteen Weeks Ended January 1, 2011 | |
| Sales | | $ | 140,975 | | | $ | 125,368 | | | $ | 175,750 | | | $ | 291,624 | |
| Cost of sales | | | 62,312 | | | | 55,687 | | | | 74,103 | | | | 115,001 | |
| Gross profit | | | 78,663 | | | | 69,681 | | | | 101,647 | | | | 176,623 | |
| Selling expenses | | | 49,568 | | | | 48,258 | | | | 51,842 | | | | 62,912 | |
| General and administrative expenses | | | 16,679 | | | | 13,952 | | | | 15,676 | | | | 16,302 | |
| Restructuring charges | | | 800 | | | | 29 | | | | - | | | | - | |
| Income from operations | | | 11,616 | | | | 7,442 | | | | 34,129 | | | | 97,409 | |
| Interest expense | | | 19,807 | | | | 18,462 | | | | 20,525 | | | | 16,854 | |
| Other expense (income) | | | 4,732 | | | | 4,751 | | | | 484 | | | | (995 | ) |
| (Loss) income before (benefit from) provision for income taxes | | | (12,923 | ) | | | (15,771 | ) | | | 13,120 | | | | 81,550 | |
| (Benefit from) provision for income taxes | | | (4,676 | ) | | | (5,621 | ) | | | 4,247 | | | | 29,738 | |
| (Loss) income from continuing operations | | | (8,247 | ) | | | (10,150 | ) | | | 8,873 | | | | 51,812 | |
| Loss from discontinued operations, net of income taxes | | | (255 | ) | | | (38 | ) | | | (49 | ) | | | (37 | ) |
| Net (loss) income | | $ | (8,502 | ) | | $ | (10,188 | ) | | $ | 8,824 | | | $ | 51,775 | |
23. SUBSEQUENT EVENT
During the first quarter of 2013, Yankee Candle redeemed the remaining $10.0 million in aggregate principal amount of its Senior Notes due 2015 at par. Because all of the Senior Notes have been redeemed, the obligations of Yankee Candle and the guarantors under the related indenture have been discharged.
| ITEM 9. | CHANGES IN AND DISAGREEMENTS WITH ACCOUNTANTS ON ACCOUNTING AND FINANCIAL DISCLOSURE |
Not applicable.
1. Disclosure Controls and Procedures
Disclosure Controls and Procedures for YCC Holdings LLC
Our management, with the participation of our chief executive officer and chief financial officer, evaluated the effectiveness of our disclosure controls and procedures as of December 29, 2012. The term “disclosure controls and procedures,” as defined in Rules 13a-15(e) and 15d-15(e) under the Exchange Act, means controls and other procedures of a company that are designed to ensure that information required to be disclosed by a company in the reports that it files or submits under the Securities Exchange Act of 1934 (as amended, the “Exchange Act”) is recorded, processed, summarized and reported, within the time periods specified in the SEC’s rules and forms. Disclosure controls and procedures include, without limitation, controls and procedures designed to ensure that information required to be disclosed by a company in the reports that it files or submits under the Exchange Act is accumulated and communicated to the company’s management, including its principal executive and principal financial officers, as appropriate to allow timely decisions regarding required disclosure. Management recognizes that any controls and procedures, no matter how well designed and operated, can provide only reasonable assurance of achieving their objectives and management necessarily applies its judgment in evaluating the cost-benefit relationship of possible controls and procedures. Based on the evaluation of our disclosure controls and procedures as of December 29, 2012, our chief executive officer and chief financial officer concluded that, as of such date, our disclosure controls and procedures were effective at the reasonable assurance level.
Disclosure Controls and Procedures for Yankee Holding Corp.
Our management, with the participation of our chief executive officer and chief financial officer, evaluated the effectiveness of our disclosure controls and procedures as of December 29, 2012. The term “disclosure controls and procedures,” as defined in Rules 13a-15(e) and 15d-15(e) under the Exchange Act, means controls and other procedures of a company that are designed to ensure that information required to be disclosed by a company in the reports that it files or submits under the Securities Exchange Act of 1934 (as amended, the “Exchange Act”) is recorded, processed, summarized and reported, within the time periods specified in the SEC’s rules and forms. Disclosure controls and procedures include, without limitation, controls and procedures designed to ensure that information required to be disclosed by a company in the reports that it files or submits under the Exchange Act is accumulated and communicated to the company’s management, including its principal executive and principal financial officers, as appropriate to allow timely decisions regarding required disclosure. Management recognizes that any controls and procedures, no matter how well designed and operated, can provide only reasonable assurance of achieving their objectives and management necessarily applies its judgment in evaluating the cost-benefit relationship of possible controls and procedures. Based on the evaluation of our disclosure controls and procedures as of December 29, 2012, our chief executive officer and chief financial officer concluded that, as of such date, our disclosure controls and procedures were effective at the reasonable assurance level.
2. Internal Control over Financial Reporting
(a) Management’s Report on Internal Control over Financial Reporting
YCC Holdings LLC
Our management is responsible for establishing and maintaining adequate internal control over financial reporting. Internal control over financial reporting is defined in Rule 13a-15(f) or 15d-15(f) promulgated under the Exchange Act as a process designed by, or under the supervision of, a company’s principal executive and principal financial officers and effected by the company’s board of directors, management and other personnel, to provide reasonable assurance regarding the reliability of financial reporting and the preparation of financial statements for external purposes in accordance with generally accepted accounting principles and includes those policies and procedures that:
| | ● | Pertain to the maintenance of records that in reasonable detail accurately and fairly reflect the transaction and dispositions of the assets of the company; |
| | ● | Provide reasonable assurance that transactions are recorded as necessary to permit preparation of financial statements in accordance with generally accepted accounting principles, and that receipts and expenditures of the company are being made only in accordance with authorizations of management and directors of the company; and |
| | ● | Provide reasonable assurance regarding prevention or timely detection of unauthorized acquisition, use or disposition of the company’s assets that could have a material effect on the financial statements. |
Management assessed the effectiveness of YCC Holdings LLC's internal control over financial reporting as of December 29, 2012. In making this assessment, our management used the criteria set forth by the Committee of Sponsoring Organizations of the Treadway Commission (COSO) in its Internal Control-Integrated Framework.
Based on our assessment, management believes that, as of December 29, 2012 YCC Holdings LLC's internal control over financial reporting is effective based on the above criteria.
Because of its inherent limitations, internal control over financial reporting, no matter how well designed, may not prevent or detect all material misstatements. Projections of any current evaluation of effectiveness to future periods are subject to the risk that controls may become inadequate because of changes in conditions, or that the degree of compliance with the policies or procedures may deteriorate, or other such factors.
Yankee Holding Corp.
Our management is responsible for establishing and maintaining adequate internal control over financial reporting. Internal control over financial reporting is defined in Rule 13a-15(f) or 15d-15(f) promulgated under the Exchange Act as a process designed by, or under the supervision of, a company’s principal executive and principal financial officers and effected by the company’s board of directors, management and other personnel, to provide reasonable assurance regarding the reliability of financial reporting and the preparation of financial statements for external purposes in accordance with generally accepted accounting principles and includes those policies and procedures that:
| | ● | Pertain to the maintenance of records that in reasonable detail accurately and fairly reflect the transaction and dispositions of the assets of the company; |
| | ● | Provide reasonable assurance that transactions are recorded as necessary to permit preparation of financial statements in accordance with generally accepted accounting principles, and that receipts and expenditures of the company are being made only in accordance with authorizations of management and directors of the company; and |
| | ● | Provide reasonable assurance regarding prevention or timely detection of unauthorized acquisition, use or disposition of the company’s assets that could have a material effect on the financial statements. |
Management assessed the effectiveness of Yankee Holding Corp.'s internal control over financial reporting as of December 29, 2012. In making this assessment, our management used the criteria set forth by the Committee of Sponsoring Organizations of the Treadway Commission (COSO) in its Internal Control-Integrated Framework.
Based on our assessment, management believes that, as of December 29, 2012 Yankee Holding Corp.'s internal control over financial reporting is effective based on the above criteria.
Deloitte & Touche LLP, our independent auditors, has issued an audit report on the effectiveness of Yankee Holding Corp.'s internal control over financial reporting. This report appears below.
Because of its inherent limitations, internal control over financial reporting, no matter how well designed, may not prevent or detect all material misstatements. Projections of any current evaluation of effectiveness to future periods are subject to the risk that controls may become inadequate because of changes in conditions, or that the degree of compliance with the policies or procedures may deteriorate, or other such factors.
(b) Attestation Report of Independent Auditor for Yankee Holding Corp.
REPORT OF INDEPENDENT REGISTERED PUBLIC ACCOUNTING FIRM
To the Board of Directors and Stockholder of
Yankee Holding Corp.
South Deerfield, Massachusetts
We have audited the internal control over financial reporting of Yankee Holding Corp. and subsidiaries (the "Company") as of December 29, 2012, based on criteria established in Internal Control — Integrated Framework issued by the Committee of Sponsoring Organizations of the Treadway Commission. The Company's management is responsible for maintaining effective internal control over financial reporting and for its assessment of the effectiveness of internal control over financial reporting, included in the accompanying Management’s Report on Internal Control over Financial Reporting for Yankee Holding Corp. Our responsibility is to express an opinion on the Company's internal control over financial reporting based on our audit.
We conducted our audit in accordance with the standards of the Public Company Accounting Oversight Board (United States). Those standards require that we plan and perform the audit to obtain reasonable assurance about whether effective internal control over financial reporting was maintained in all material respects. Our audit included obtaining an understanding of internal control over financial reporting, assessing the risk that a material weakness exists, testing and evaluating the design and operating effectiveness of internal control based on the assessed risk, and performing such other procedures as we considered necessary in the circumstances. We believe that our audit provides a reasonable basis for our opinion.
A company's internal control over financial reporting is a process designed by, or under the supervision of, the company's principal executive and principal financial officers, or persons performing similar functions, and effected by the company's board of directors, management, and other personnel to provide reasonable assurance regarding the reliability of financial reporting and the preparation of financial statements for external purposes in accordance with generally accepted accounting principles. A company's internal control over financial reporting includes those policies and procedures that (1) pertain to the maintenance of records that, in reasonable detail, accurately and fairly reflect the transactions and dispositions of the assets of the company; (2) provide reasonable assurance that transactions are recorded as necessary to permit preparation of financial statements in accordance with generally accepted accounting principles, and that receipts and expenditures of the company are being made only in accordance with authorizations of management and directors of the company; and (3) provide reasonable assurance regarding prevention or timely detection of unauthorized acquisition, use, or disposition of the company's assets that could have a material effect on the financial statements.
Because of the inherent limitations of internal control over financial reporting, including the possibility of collusion or improper management override of controls, material misstatements due to error or fraud may not be prevented or detected on a timely basis. Also, projections of any evaluation of the effectiveness of the internal control over financial reporting to future periods are subject to the risk that the controls may become inadequate because of changes in conditions, or that the degree of compliance with the policies or procedures may deteriorate.
In our opinion, the Company maintained, in all material respects, effective internal control over financial reporting as of December 29, 2012, based on the criteria established in Internal Control — Integrated Framework issued by the Committee of Sponsoring Organizations of the Treadway Commission.
We have also audited, in accordance with the standards of the Public Company Accounting Oversight Board (United States), the consolidated financial statements as of and for the year ended December 29, 2012 of Yankee Holding Corp. and our report dated March 29, 2013 expressed an unqualified opinion on those financial statements.
/s/ Deloitte & Touche LLP
(c) Changes in Internal Control over Financial Reporting
YCC Holdings LLC
No change in our internal control over financial reporting (as defined in Rules 13a-15(f) and 15d-15(f) under the Exchange Act) occurred during the fourth quarter ended December 29, 2012 that has materially affected, or is reasonably likely to materially affect, our internal control over financial reporting.
Yankee Holding Corp.
No change in our internal control over financial reporting (as defined in Rules 13a-15(f) and 15d-15(f) under the Exchange Act) occurred during the fourth quarter ended December 29, 2012 that has materially affected, or is reasonably likely to materially affect, our internal control over financial reporting.
Not applicable.
PART III
| ITEM 10. | DIRECTORS, EXECUTIVE OFFICERS AND CORPORATE GOVERNANCE |
The following table sets forth the names, ages and positions of our executive officers and directors as of March 1, 2013:
| Name | | Age | | Position |
| Craig W. Rydin | | 61 | | Chairman of the Board of Directors |
| | | |
| Harlan M. Kent | | 50 | | President and Chief Executive Officer, Director |
| | | |
| Lisa K. McCarthy | | 33 | | Senior Vice President, Finance and Chief Financial Officer |
| | | |
| Martha S. LaCroix | | 47 | | Executive Vice President, Chief Human Resources Officer |
| | | |
| James A. Perley | | 50 | | Executive Vice President, Chief Administrative Officer |
| | | |
| Howard Barron | | 52 | | Vice President, Chief Information Officer |
| | | |
| Nathel John Fontana, III | | 54 | | President, International |
| | | | | |
| Hope Margala Klein | | 46 | | Executive Vice President , Brand, Innovation and Merchandising |
| | | | | |
| Deborah Norris | | 44 | | Senior Vice President, Business Analytics and Fundraising |
| | | | | |
| Alexander Winiecki | | 64 | | Senior Vice President, Retail |
| | | | | |
| Michael Thorne | | 48 | | President, Wholesale |
| | | |
| Arthur F. Rubeck | | 48 | | Senior Vice President, Supply Chain |
| | | | | |
| Brad H. Wolansky | | 48 | | President, Consumer Direct, Chief Marketing Officer |
| | | |
| Frank P. Bifulco, Jr. | | 63 | | Director |
| | | |
| Richard H. Copans | | 36 | | Director |
| | | |
| Robin P. Selati | | 46 | | Director |
| | | |
| Terry Burman | | 67 | | Director |
| | | |
| Thomas T. Macejko, Jr. | | 38 | | Director |
| | | |
| Trudy Sullivan | | 63 | | Director |
CRAIG W. RYDIN is Chairman of the Board of Directors. Mr. Rydin has served as a director of Yankee Candle since February 2007. Prior to being named Executive Chairman in October 2009, Mr. Rydin served as Chief Executive Officer of Yankee Candle from April 2001 until October 2009. Prior to joining Yankee Candle in April 2001, Mr. Rydin was the President of the Away From Home food services division of Campbell Soup Company since 1998, and President of the Godiva Chocolatier division of Campbell from 1996 to 1998. Prior to Godiva, Mr. Rydin held a number of senior management positions at Pepperidge Farm, Inc., also a part of Campbell. Mr. Rydin also serves on the Board of Directors of Priceline.com Incorporated, where he sits on the audit and compensation committees, and Phillips-Van Heusen Corporation, where he sits on the compensation committee. The Board of Directors believes that Mr. Rydin is qualified to serve as a director due, among other things, to his extensive experience with premium branded consumer product companies, his service as Chief Executive Officer, his knowledge of and experience in the candle and home fragrance industry, consumer package goods and retail, and his general business and financial acumen.
HARLAN M. KENT is the President and Chief Executive Officer and has served as a director of Yankee Candle since February 2007. Mr. Kent joined Yankee Candle in June 2001 and has held several positions of increasing responsibility since joining Yankee Candle. Mr. Kent was promoted to his current position of Chief Executive Officer in October 2009. Prior to that, Mr. Kent had served as President and Chief Operating Officer since December 2005. Prior to joining Yankee Candle, Mr. Kent was Senior Vice President and General Manager of the Wholesale Division of Totes Isotoner Corporation from 1997 to 2001, and Vice President of Global Sales and Marketing for the Winchester Division of Olin Corporation from 1995 to 1997. Mr. Kent has also held a number of senior marketing and strategic planning positions at both the Campbell Soup Company and its Pepperidge Farm Division. Mr. Kent also serves on the Board of Directors of the A.T. Cross Company. The Board of Directors believes that Mr. Kent is qualified to serve as a director due, among other things, to his extensive experience with wholesale and consumer product companies, his service as Chief Executive Officer, his knowledge of and experience in the candle and home fragrance industry, consumer package goods and retail, and his general business and financial acumen.
LISA K. McCARTHY is Senior Vice President, Finance and Chief Financial Officer. Ms. McCarthy was promoted to her current position in April 2012 and previously served as the Company's Vice President, Finance and Controller. Ms. McCarthy joined Yankee Candle in 2004 and has subsequently held several Finance positions of increasing responsibility until being promoted to her current position in 2012. Prior to joining Yankee Candle, she served as Audit Senior Accountant with Deloitte & Touche LLP, where she worked from 2001 to 2004.
MARTHA S. LACROIX is the Executive Vice President, Chief Human Resources Officer. Ms. LaCroix joined Yankee Candle in February 1993 as Director of Employee Relations and has since held various positions of increasing responsibility in Yankee Candle’s Human Resources Department. Ms. LaCroix was appointed to her current position in October 2009.
JAMES A. PERLEY is the Executive Vice President, Chief Administrative Officer of Yankee Candle. Prior to his promotion to his current position in April 2012, Mr. Perley served as the Company's Executive Vice President, General Counsel. From April 2006 to December 2010, Mr. Perley also served as President, International Division. Prior to joining Yankee Candle in September 1999, Mr. Perley was Vice President and General Counsel of Star Markets Company, Inc., where he served from 1997 to 1999. From 1987 to 1997, Mr. Perley was a member of the Boston-based law firm of Hale and Dorr LLP, now Wilmer Hale LLP, where he served as an Associate from 1987 to 1992 and as a Junior Partner from 1992 to 1997.
HOWARD BARRON is the Vice President, Chief Information Officer. Mr. Barron joined Yankee Candle in 2003 and has held several positions of increasing responsibility, including serving as Vice President of Corporate Inventory Planning & Control from 2005 until his promotion to his current position in 2011.
NATHEL JOHN FONTANA, III is the President, International Division. Prior to joining Yankee Candle in January 2011, Mr. Fontana served as Chief Executive Officer of Smith Mountain Industries (Virginia Candle Company), from April 2009 to May 2010. Prior to that, Mr. Fontana was associated with Allied Capital, first serving as Managing Director, International & Portfolio Development from 2004 to February 2007 and then as Chief Executive Officer for Hot Stuff Foods, an Allied Capital portfolio company. He has also held senior positions at Electrolux, LLC, Frito Lay and Deloitte & Touche, LLP.
HOPE MARAGALA KLEIN is the Executive Vice President, Brand, Innovation and Merchandising. Ms. Margala Klein rejoined Yankee Candle in 2009 as Vice President, Wholesale Marketing and Merchandising and was promoted to her current position in January 2011. She had previously served with Yankee Candle as its General Merchandising Manager, Retail from 2005 to 2006. Prior to rejoining Yankee in 2009, Ms. Margala Klein held several senior leadership positions with The Longaberger Company from 2006 to 2009, the most recent of which was Vice President, Chief Marketing Officer. She also previously held various leadership positions with Limited Brands, including Vice President, Category Leader of its Bath and Body Works Division and Vice President, Group Product Director of its Victoria’s Secrets Beauty Division, and with American Eagle Outfitters.
DEBORAH NORRIS is the Senior Vice President, Business Analytics and Fundraising. Ms. Norris joined Yankee Candle in 2001 as Vice President/Group Manager, Consumer Direct, Fundraising and Outlets and Vice President, General Merchandise Manager. Ms. Norris was appointed to her current position in April 2012.
ALEXANDER WINIECKI is the Senior Vice President, Retail. Mr. Winiecki joined Yankee Candle in 2007 as Vice President Retail Operations and has since held various positions of increasing responsibility. Mr. Winiecki was appointed to his current position in April 2012. Prior to joining Yankee Candle Company, Mr. Winiecki held the position of Executive Vice-President of Store Operations at Brookstone Company, Inc. Before Brookstone, Mr. Winiecki held the positions of EVP, Décor Corporation at Claire’s Boutiques, Inc., VP at Household Merchandising and Regional Manager at Gap Inc.
MICHAEL THORNE is the President, Wholesale. Prior to joining Yankee Candle in June 2006, Mr. Thorne was employed by Spalding Sports and the Russell Corp. from 2000 to 2006, where he most recently served as President, Russell Athletic Team and Bike Athletic Divisions. Mr. Thorne also previously held senior sales management positions within Pentland LLC, Franklin Sporting Goods and Wilson Sporting Goods.
ARTHUR F. RUBECK is the Senior Vice President, Supply Chain. Mr. Rubeck joined Yankee Candle in 1981 and has held several operational positions of increasing responsibility, including serving as Vice President, Manufacturing from 2003 until his promotion to his current position in February 2009.
BRAD H. WOLANSKY is President, Consumer Direct and Chief Marketing Officer. Prior to joining the Company Mr. Wolansky was the Founder of Powered by TGW and served as Chief Executive Officer of The Golf Warehouse from September 2009 to February 2012. Prior to that Mr. Wolansky held several leadership positions with The Orvis Company from 2005-2009, the most recent of which was Vice President Global E-Commerce.
FRANK P. BIFULCO, JR. has served as a director of YCC Holdings since February 2012. Mr. Bifulco most recently served as Senior Vice President and Chief Marketing Officer of The Home Depot from 2008-2011. Before joining Home Depot, Mr. Bifulco held several senior executive positions of increasing responsibility with Hasbro, Inc. from 2003-2007, including President, Hasbro Sales North America from 2006-2007. Prior to Hasbro, Mr. Bifulco served as Senior Vice President and Chief Marketing Officer of Timberland, Inc. from 2001-2003 and Senior Vice President, Marketing, Coca-Cola North America from 1994-2000. The Board of Directors believes that Mr. Bifulco is qualified to serve as a director due to, among other things, his extensive marketing expertise in the retail and consumer goods industries, extensive executive, management, sales and brand marketing experience and strong financial and general business acumen.
RICHARD H. COPANS has served as a director of YCC Holdings since February 2007. Mr. Copans is a Director of Madison Dearborn and joined the firm in 2005. Prior to joining Madison Dearborn in 2005, Mr. Copans was an analyst with Morgan Stanley & Co., from 1998 to 2001, and Thomas H. Lee Partners from 2001 to 2003. The Board of Directors believes that Mr. Copans is qualified to serve as a director due, among other things, to his extensive financial and management expertise and experience, his status as a “financial expert” for audit committee purposes, his extensive knowledge of and experience in the consumer package goods, manufacturing and retail sectors, and his general business and financial acumen. Mr. Copans also serves on the board of directors of Schrader International.
ROBIN P. SELATI has served as a director of YCC Holdings since February 2007. Mr. Selati is a Managing Director of Madison Dearborn and joined the firm in 1993. Prior to joining Madison Dearborn in 1993, Mr. Selati was associated with Alex. Brown & Sons Incorporated in the consumer/retail investment banking group. The Board of Directors believes that Mr. Selati is qualified to serve as a director due, among other things, to his extensive financial and management expertise and experience, his status as a “financial expert” for audit committee purposes, his extensive knowledge of and experience in the consumer package goods, manufacturing and retail sectors, and his general business and financial acumen. Mr. Selati also serves on the board of directors of Ruth’s Hospitality Group, Inc., CDW Corporation, and Things Remembered, Inc.
TERRY BURMAN has served as a director of YCC Holdings since October 2007. Mr. Burman was the Chief Executive Officer of Signet Jewelers Limited (“Signet”) until January 29, 2011. Mr. Burman joined Signet in 1995 as the Chairman and CEO of Sterling Jewelers, Inc., a U.S. division of Signet. Before joining Signet, Mr. Burman held various senior executive positions of increasing responsibility with Barry’s Jewelers, Inc. from 1980 to 1995, including President and Chief Executive Officer from 1993 to 1995. Prior to that, Mr. Burman was a Partner with Roberts Department Stores, a regional department store chain specializing in apparel. Mr. Burman also served on the Board of Directors of Signet until January 29, 2011. The Board of Directors believes that Mr. Burman is qualified to serve as a director due, among other things, to his extensive executive, financial and management expertise and experience, his experience as a chief executive officer in the retail industry, his significant international management experience and particularly in the UK retail sector, and his general business and financial acumen. Mr. Burman serves on the board of directors of Tuesday Morning Corporation.
THOMAS T. MACEJKO, JR. has served as a director of YCC Holdings since June 2011. Mr. Macejko is a Director of Madison Dearborn. Mr. Macejko also serves as a member of the Audit Committee and Compensation Committees of the Board of Directors of YCC Holdings and of the board of managers of YCC Holdings. Prior to joining Madison Dearborn in 2004, Mr. Macejko was an analyst with Deutsche Banc Alex. Brown. The Board of Directors believes Mr. Macejko is qualified to serve as a director due, among other things, to his extensive financial and management expertise and experience, his status as a “financial expert” for audit committee purposes, his extensive knowledge of and experience in the consumer package goods, manufacturing and retail sectors, and his general business and financial acumen. Mr. Macejko also serves on the board of directors of Things Remembered, Inc.
TRUDY SULLIVAN has served as a director of YCC Holdings since September 2010. Ms. Sullivan previously served as the President and Chief Executive Officer of The Talbots, Inc., a leading specialty retail and direct marketer of women’s apparel, shoes and accessories with operations in both the United States and Canada. Ms. Sullivan joined The Talbots, Inc. as President and CEO in 2007. Before joining The Talbots, Inc., Ms. Sullivan held various senior executive positions of increasing responsibility with Liz Claiborne, Inc. from 2001 to 2007, including President from January 2006 to July 2007. Prior to that, Ms. Sullivan held senior leadership roles with J. Crew Group, Inc. The Board of Directors believes that Ms. Sullivan is qualified to serve as a director due to, among other things, her extensive executive and management experience, financial expertise, extensive retail, wholesale and merchandising experience and her general financial and business acumen.
There are no family relationships among any of the executive officers or directors.
Code of Business Conduct and Ethics
We have adopted a written code of conduct that applies to all of our directors, executive officers and employees, including our principal executive officer, principal financial officer, and principal accounting officer. The code of conduct includes provisions covering compliance with laws and regulations, insider trading practices, conflicts of interest, confidentiality, protection and proper use of our assets, accounting and record keeping, fair competition and fair dealing, business gifts and entertainment, payments to government personnel and the reporting of illegal or unethical behavior. You can obtain a copy of our code of conduct through the Investor Relations page of our website at www.yankeecandle.com. Our website is not part of this Annual Report on Form 10-K. The code is reviewed annually by the Board of Directors.
Board Committees
The Board of Directors is responsible for the general supervision and oversight of the affairs of the Company. In order to assist it in carrying out these duties, the Board has established and delegated certain authority to the following standing committees: the Audit Committee and the Compensation Committee. Each of these committees operates under a charter that has been approved by the Board.
Audit Committee
YCC Holdings is not required to have a separately-designated standing Audit Committee composed of independent directors, as its securities are not listed on a national securities exchange. However, in April 2007 the Board of Directors established a separately-designated standing Audit Committee. The current members of the Audit Committee are Richard H. Copans (Chair), Terry Burman, Thomas T. Macejko and Craig Rydin. Messrs. Copans and Burman were appointed in 2007 and Mr. Macejko was appointed in 2011. Mr. Rydin was formally a management director, having served as Chief Executive Officer, as Executive Chairman, and formally became a member of the Audit Committee in October 2010 when he became a non-employee director. The Board of Directors has determined that each of Messrs. Copans, Burman, Macejko and Rydin is an Audit Committee financial expert, as such term is defined in the Securities Exchange Act of 1934, as amended (the “Exchange Act”). Messrs. Copans and Macejko are employed by Madison Dearborn, a private equity investment firm affiliated with our controlling stockholder, and are therefore not independent.
Management is responsible for the preparation of our financial statements and our internal control over financial reporting and the financial reporting process. Our independent auditors are responsible for performing an independent audit of our financial statements in accordance with the Standards of the Public Company Accounting Oversight Board (“PCAOB”) (United States) and to issue a report on those financial statements and a report on internal controls. The Audit Committee assists the Board of Directors in its oversight of our financial statements and its internal accounting policies and procedures. The Audit Committee’s primary duties and responsibilities include (i) monitoring the integrity of YCC Holdings’ financial reporting process and systems of internal controls regarding finance, accounting and legal compliance, (ii) monitoring the independence and performance of YCC Holdings’ independent auditor and monitoring the performance of YCC Holdings’ internal audit function, (iii) hiring and firing our independent auditor and approving any non-audit work performed for us by the independent auditor, (iv) providing an avenue of communication among the independent auditor, management and the Board, and (v) such other functions as may from time to time be delegated to it by the Board of Directors.
Compensation Committee
The current members of the Compensation Committee of the Board of Directors are Robin P. Selati (Chair), Terry Burman, Richard H. Copans, Thomas T. Macejko, Craig Rydin and Trudy Sullivan. Messrs. Selati, Burman and Copans have served on the Compensation Committee since 2007, Ms. Sullivan was appointed in 2010 and Mr. Macejko was appointed in 2011. Mr. Rydin was formally a management director, having served as Chief Executive Officer, as Executive Chairman, and formally became a member of the Compensation Committee in October 2010 when he became a non-employee director.
The Compensation Committee assists the Board of Directors in its oversight of our executive compensation policies and practices. The Compensation Committee’s primary responsibilities include (i) establishing total compensation for the Board of Directors, (ii) reviewing and approving total compensation for YCC Holdings’ executive officers, including oversight of all executive officer benefit plans and approve all of the goals, (iii) determining and annually reviewing total compensation for YCC Holdings’ Chief Executive Officer, including reviewing and approving corporate goals and objectives relevant to the Chief Executive Officer’s compensation, (iv) overseeing YCC Holdings’ cash-based and equity-based incentive plans, (v) producing a compensation committee report on executive compensation as required by the SEC to be included in YCC Holdings’ Form 10-K or, if applicable, proxy statement and (vi) such other functions as may from time to time be delegated to it by the Board of Directors.
The Compensation Committee Report required by SEC rules is included on page 112 of this Annual Report.
Director Nomination Procedures
Pursuant to the unit holders agreement of Yankee Group, the Board of Managers of Holdings (the “Board”) shall consist of (i) four members designated by Madison Dearborn, (ii) our Chief Executive Officer, who is currently Harlan Kent, and (iii) any independent representatives designated by the Board (which today include Terry Burman, Frank Bifulco and Trudy Sullivan.) Except as otherwise determined by the Board, the composition of the board of directors or managers of each of Yankee Group’s subsidiaries shall be the same as that of the Board. In general, the Company’s obligations with respect to Board composition will terminate upon the earlier to occur of the consummation of a sale of the Company or the consummation of an initial public offering. At Madison Dearborn’s option, Madison Dearborn Board designees shall constitute a majority of any committees of the Board or the boards of directors of any subsidiary of Yankee Group.
Compensation Discussion and Analysis
General Overview
On February 6, 2007, our predecessor public company (the “Predecessor”) merged with an entity formed by Madison Dearborn Partners LLC, a private equity firm (“Madison Dearborn”), and the Company became privately-held (the “Merger”). While several components of our former executive compensation program remain largely unchanged following the Merger, the public company equity component of our prior compensation program has been replaced by an equity program more typical of privately held companies. In connection with the Merger each of our executive officers and certain members of senior management were given the opportunity to purchase equity as described below under “—Long-Term Incentives (Equity Awards).” Newly hired employees for certain senior management or other key positions, or employees promoted to such positions, are also eligible for equity awards under the program. Madison Dearborn believes that equity ownership by management further aligns the interests of our executive officers with those of our other equity investors and encourages our executive officers to operate the business in a manner that enhances the Company’s equity value. The Company’s equity compensation is discussed in more detail below.
The Compensation Committee of our Board of Directors (the “Compensation Committee”), which in 2012 consisted of the non-employee members of the Board of Directors (other than Mr. Bifulco), is responsible for the administration of the Company’s executive compensation program. As such, decisions with respect to our Chief Executive Officer’s compensation are made by the Compensation Committee and those relating to the compensation of our other executive officers are made by the Compensation Committee in consultation with our Chief Executive Officer. As it has in the past, the Compensation Committee has retained and continues to work as needed with an independent compensation consultant, Towers Watson, to assist the Compensation Committee in its ongoing administration and review of the Company’s executive compensation program. Towers Watson did not perform any other services for the Company in 2012.
Throughout this analysis, our Chief Executive Officer, Chief Financial Officer and the other individuals included in the Summary Compensation Table below are collectively referred to as the “named executive officers.”
Explanatory Note Regarding Current Organizational Structure
Prior to February 2011, the equity interests held by Madison Dearborn and senior management, including those purchased in connection with the Merger, were ownership interests in YCC Holdings the indirect parent of the Company. In February 2011, in connection with the issuance of $315 million of Senior PIK Notes by YCC Holdings and Yankee Finance, the equity interests in YCC Holdings were exchanged for new equity interests in its newly formed parent, Yankee Investments. Pursuant to this exchange, holders of Class A, Class B and Class C common units in YCC Holdings exchanged such units on a one for one basis for an identical interest in Class A, Class B, and Class C common units of Yankee Investments. After the exchange, each unit holder had the same ownership interest with the same rights and features in Yankee Investments that it previously had in YCC Holdings.
In June 2011, a new parent entity, Yankee Group, a Delaware limited liability company, was formed. Yankee Group is the parent of Yankee Investments. The members of Yankee Group include certain funds affiliated with Madison Dearborn, as well as certain management and directors of the Company. In connection with the formation of Yankee Group, a second exchange of equity interests occurred, whereby holders of Class A, Class B and Class C common units in Yankee Investments exchanged such units on a one for one basis for an identical interest in Class A, Class B, and Class C common units of Yankee Group. After the exchange, each unit holder had the same ownership interest with the same rights and features in Yankee Group that it previously had in Yankee Investments.
Compensation Objectives and Program Structure
The Company’s executive compensation philosophy is designed to achieve value for our investors by using all elements of executive compensation to reinforce a results-oriented management culture focusing on our financial and operating performance, the achievement of longer-term strategic goals and objectives, and specific individual performance. The objectives of our compensation policies are (i) to provide a level of compensation that will allow us to attract, motivate, retain and reward talented executives who have the ability to contribute to our success, (ii) to link executive compensation to our success through the use of bonus payments based in whole or in part upon our performance (or that of a particular business unit), (iii) to align the interests of the executives with those of our investors, including through management co-investment with Madison Dearborn in the equity ownership of Yankee Group under its “Management Equity Plan” (as defined below), thereby providing incentive for, and rewarding the attainment of, objectives that inure to the benefit of our investors and (iv) to motivate and reward high levels of individual performance or achievement.
Overview of Compensation and Process
The Compensation Committee works with management and its independent compensation consultant, Towers Watson, to administer and oversee a comprehensive executive compensation program covering those members of management at the Vice President level or higher, together with other key management personnel, if any, that may be included from time to time by the Company and the Compensation Committee in their discretion (the “Program”). The Compensation Committee annually reviews and approves our executive compensation philosophy, which sets forth the objectives of the Program and covers all elements of the Company’s rewards for executives, including base salary, annual cash incentive opportunities, equity incentive opportunities and other benefits, and serves as the basis for the Compensation Committee’s decisions regarding compensation of our senior management. The executive compensation philosophy and the resulting Program are designed to support the Company’s compensation objectives, the key elements of which are discussed below.
Among other services provided, Towers Watson assists the Compensation Committee in evaluating the Program by providing information on general market pay practices and levels and those of our peer group and other comparable companies, and reviewing the Company’s pay policies as compared to those market practices. We would anticipate continuing to use the services of an independent consulting firm in the future on an as-needed basis in order to continue to provide advice and marketplace benchmarking data and to insure that our actual compensation practices remain competitive and consistent with our stated goals and executive compensation philosophy.
Peer Group. We are committed to providing competitive compensation opportunities to participants in the Program who are performing at a fully satisfactory level. Accordingly, as part of the Program the Compensation Committee’s consultant conducts extensive market research of comparable companies in order to develop the data necessary to establish appropriate market compensation levels. For purposes of determining market levels of compensation, we benchmark ourselves against a group of organizations within the retail/wholesale sector using industry surveys and other available data that reflect, to the extent possible, pay levels at such companies.
Given the fact that we are a manufacturer, retailer and wholesaler, finding the appropriate peer group is challenging. The organizations comprising our peer group have been selected over time based upon the following characteristics: (i) strong or emerging brands, (ii) strong financial performance (based on objective metrics such as earnings, growth, return on invested capital and other such measures), (iii) multi-channel business and distribution models and (iv) specialty retailing focus. The composition of our peer group is reviewed at least annually by the Compensation Committee. The peer group currently consists of publicly-traded companies, in large part because there is more publicly available compensation information from public companies.
In 2012 there were a total of 17 companies in the peer group. The companies comprising the peer group are:
| Aeropostale, Inc. | Chico’s FAS, Inc. | Pacific Sunwear of California, Inc. |
| American Eagle Outfitters | Children’s Place Retail Stores, Inc. | Pier 1 Imports, Inc. |
| Ann Taylor Stores, Corporation | Coldwater Creek, Inc. | Tiffany & Company |
| Bebe Stores, Inc. | Destination Maternity Corp. | Urban Outfitters, Inc. |
| Carter’s | Hot Topic, Inc. | Williams-Sonoma, Inc. |
| Charming Shoppes, Inc. | Kenneth Cole Productions, Inc. | |
Given the number of companies in our peer group, minor changes in the peer group’s composition should not have a significant impact on year to year market pay levels targeted by the Company. We anticipate continuing to use peer group analysis to establish market compensation levels going forward. The peer group information is supplemented by additional market information provided by Towers Watson, which typically includes a compilation of survey data and reports from national compensation consulting firms and Towers Watson’s own market and research information.
Using the market information from our peer group, together with additional market information from Towers Watson, the Compensation Committee estimates market rates of pay for base salary, total cash compensation (base salary, plus annual cash incentives) and total compensation (total cash, plus the expected value of long-term incentives). These market rates were used to create targeted salary and bonus ranges. The ranges for each component of cash compensation were developed to ensure they were competitive with the appropriate market and targeted at approximately the 50th percentile of the market (the “median”). Over time, depending upon budgetary considerations and other factors, most participants who are performing satisfactorily are intended to be provided total cash compensation generally consistent with the market median. With respect to long-term incentive awards, as a privately-held company we now seek to provide equity opportunities to our senior management that are intended to be generally consistent with the practices of other comparable privately-held companies. Madison Dearborn and the Compensation Committee believe that management’s co-investment and other equity incentive awards in Yankee Group will provide long-term incentives to grow our overall equity value. As a result, it is currently anticipated that while additional long-term equity incentive grants (“supplemental equity awards”) beyond those awarded in 2007 in connection with the Merger (or those made or to be made (i) with respect to new management employees hired or promoted into eligible positions subsequent to the Merger, or (ii) to existing management employees in connection with a promotion or retention agreement) may be appropriate from time to time as circumstances warrant in the Compensation Committee’s discretion, such supplemental equity awards will not be made on an annual basis as was done previously by our public company Predecessor as part of its annual executive compensation award. The Compensation Committee did, however, authorize a one-time, supplemental equity award to certain members of management in February 2012, as described below. Given the differences between public company and private company equity programs and the absence of annual long-term equity incentive grants, the Compensation Committee benchmarks against the peer group with respect to total cash compensation (base salary plus annual cash incentives) rather than total compensation (base salary, plus annual cash incentives, plus the annualized expected value of long-term incentives). As such, total compensation (including long-term equity compensation) in a given year may be lower than total compensation of our public company peer group, as those companies tend to grant equity annually.
The Program is structured to tie a significant portion of the executive’s overall compensation to the performance of the Company and/or specific business units within the Company through the use of performance-based reward elements such as annual and long-term incentives. The following elements were included in the Program in fiscal 2012:
| | | ● | Annual cash-based incentives (the “Management Incentive Plan” or “MIP”); |
| | | ● | Long-term equity-based incentives under the Company’s Management Equity Plan described below; and |
| | | ● | Other benefits based upon prevailing market norms. |
The Company does not have a pre-established policy or target for the allocation between either cash and non-cash or short-term and long-term incentive compensation. Rather, the Compensation Committee reviews information provided by Towers Watson to determine the appropriate level and mix of incentive compensation, with the goal of total cash compensation being targeted at approximately the 50th percentile of the market median developed using the Company’s peer group data and other market information.
The following summary of our compensation plans should be read in conjunction with the narrative disclosure contained in the section entitled “Executive Compensation Tables.”
Base Salary. Each participant in the Program is provided a salary based upon market compensation levels for his or her specific position or job function. These market levels are based upon peer group compensation levels, compensation levels at other comparable companies as reported in market data surveys compiled by Towers Watson and general market compensation information, all of which are considered to arrive at a market “going rate.” We provide a base salary to attract and retain executive officers and to compensate them for their services rendered during the fiscal year. An individual will be paid a base salary on the basis of his or her skills (based on training, education and experience), contributions over time and annual performance. In establishing base salaries for each of our executive officers, the Compensation Committee considers numerous factors, including (i) its assessment of the executive’s performance, (ii) the executive’s leadership in executing Company initiatives and his or her potential future contributions and ability to enhance long-term enterprise value, (iii) the nature and scope of the executive’s responsibilities, (iv) the executive’s contributions and importance to the Company, (v) the executive’s integrity and compliance with law and with our Code of Business Conduct and Ethics, and (vi) the executive’s historical compensation and the nature and extent of the executive’s other forms of compensation. Most participants who are performing satisfactorily will be provided salaries that are generally consistent with the market median based upon similarly-situated executives of the companies in our peer group. Variations to this objective may occur at the discretion of the Compensation Committee and Chief Executive Officer, as applicable, based on the experience level of the individual and market factors as well as Company performance, retention concerns and other individual circumstances. Each year, the participant’s salary will be reviewed and may be increased if warranted. In general, if a participant’s role and performance level have not changed significantly, and his or her salary is consistent with market levels of pay, the participant can typically expect a modest increase in base salary in a given year.
In October 2009, Harlan M. Kent was appointed Chief Executive Officer. In connection with his appointment Mr. Kent entered into an employment agreement which was approved by the Board of Directors. The base salary of Mr. Kent in 2010 was determined pursuant to the employment agreement as described below under “—Employment Contracts.” Mr. Kent’s performance is reviewed annually by the Compensation Committee and his base salary and compensation for 2012 was established and approved by the Compensation Committee. The base salaries of the other executive officers were established and approved by the Compensation Committee based upon input and recommendations from the Chief Executive Officer.
Annual Cash Incentives (Bonuses). We believe that a significant portion of an executive’s compensation should be tied to our performance. Therefore, in addition to a base salary, we provide a Management Incentive Plan (the “MIP”) which constitutes the variable, performance-based component of an executive’s cash compensation. The MIP is designed to reward members of management and other key individuals for performance within the applicable fiscal year. The MIP provides for a target incentive opportunity for each participant consistent with market practice for his or her position or job function. If the Company, business unit (if applicable) and individual performance are each at target levels (as pre-approved by the Compensation Committee), the participant’s total cash compensation (base salary, plus MIP incentive) is designed to be competitive with market practice for that role (i.e., generally consistent with the 50th percentile of market ranges established using the peer group and other market data provided by Towers Watson). If performance is above or below target, total cash compensation is likewise designed to be above or below market levels, respectively.
A. Funding the MIP Pool
The MIP is structured to provide a ‘‘pool’’ of incentive dollars based on our attainment of certain financial and operating results for the applicable year established and pre-approved by the Compensation Committee. Management calculates a proposed MIP pool based upon target bonuses as a percentage of salary for each participant in the MIP (other than the Chief Executive Officer, whose target bonus is set directly by the Compensation Committee). The Compensation Committee approves the overall size of the MIP pool as well as the target bonus as a percentage of salary for each participant in the MIP above the vice president level.
The 2012 MIP pool target was set at $5.3 million. Our actual performance versus the pre-established performance objectives determines the actual funding of the MIP incentive pool. The actual pool may exceed the target pool, or may be less than target, or even zero, based on our actual performance during such fiscal year. In addition, the Compensation Committee may also, in its discretion, consider additional factors in determining the actual funding level of the MIP incentive pool.
The financial and operating metrics used to measure Company performance for purposes of funding the MIP, as determined by the Compensation Committee, are “Adjusted EBITDA” and “Free Cash Flow.” For MIP purposes, “Adjusted EBITDA” is defined as net income before net interest expense, income taxes, depreciation and amortization, amortization of deferred financing costs, equity compensation expense, and any other nonrecurring or similar costs as may be deemed appropriate by the Board of Directors or Compensation Committee in its discretion. As a privately held company, the Compensation Committee believes that Adjusted EBITDA is a very important financial and operating metric to our investors and that using it as the measure of Company performance under the MIP will best align the interests of management with those of our investors. For MIP purposes, “Free Cash Flow” is defined as (i) the Company's Adjusted EBITDA less (ii) capital expenditures made during the fiscal year, interest expense paid, cash taxes paid, cash charges recorded in connection with a restructuring charge, and management fees and any related payments made to Madison Dearborn Partners; each only to the extent the same were "added back" or included in the Adjusted EBITDA, and (iii) increased or decreased, as the case may be, by the net change in working capital for the fiscal year. The Compensation Committee believes that as a leveraged company the Company’s prudent management of its working capital and cash flow from operations is an important measure of its financial and operating performance and that adding Free Cash Flow as a second metric for purposes of MIP will further align management’s interests with those of the Company’s equity holders.
The applicable financial and operating objectives to be used for purposes of determining the funding of the MIP pool, in this case Adjusted EBITDA and Free Cash Flow, are determined by the Compensation Committee in the first quarter of the fiscal year in connection with the Board’s review and approval of the Company’s annual operating budget for the fiscal year. In establishing the pre-approved performance targets used for purposes of the MIP incentive payments, the Compensation Committee seeks to establish a target objective that is not easily attainable and is instead intended to require a level of Company financial performance commensurate with that which could reasonably be expected to reward the Company’s equity holders. The performance targets are generally based upon the Company’s approved operating budget for the applicable fiscal year, as modified by the Compensation Committee in its discretion, based upon various factors it deems relevant (including, by way of example, its view of the expected level of difficulty of attaining the approved budget). In 2012, the targets were consistent with the Company’s 2012 operating budget approved by the Board of Directors. For a discussion of these targets, see “C. 2012 Performance versus Pre-Approved Targets” below.
Based upon the foregoing, the 2012 MIP plan design was structured as follows:
Adjusted EBITDA Component. The Adjusted EBITDA Component was designed to fund 80% of the overall target incentive pool. The actual funding amount under this portion of the Adjusted EBITDA Component is determined based upon a calibration schedule approved by the Compensation Committee, and could exceed the target, or be less or even zero, depending upon the Company’s actual Adjusted EBITDA performance.
Free Cash Component. The Free Cash Component was designed to fund 20% of the overall target MIP incentive pool. The funding amount under the Free Cash Component is determined based upon a calibration schedule approved by the Compensation Committee and could exceed the target, or be less or even zero, depending upon the Company’s actual Free Cash performance as compared to the Free Cash objective pre-approved by the Compensation Committee. Funding under the Free Cash Component is separate and independent from funding under the Adjusted EBITDA Component.
B. Individual Awards Under MIP
Each individual participant’s target MIP incentive bonus payment is established annually by the Compensation Committee and expressed as percentage of the participant’s base salary earned in the fiscal year. The 2012 target percentages expressed as a percentage of base salary for each of the named executive officers eligible to receive a bonus is set forth below:
| Named Executive | | Target % | |
| Harlan M. Kent | | | 100 | % |
| Lisa K. McCarthy (1) | | | 50 | % |
| James A. Perley (2) | | | 60 | % |
| Brad H. Wolansky | | | 60 | % |
| Nathel John Fontana, III | | | 60 | % |
| Gregory W. Hunt (3) | | | N/A | |
| | (1) | Represents Ms. McCarthy’s target MIP incentive bonus following her promotion to SVP, Chief Financial Officer on May 16, 2012. Ms. McCarthy’s target MIP bonus prior to that date was 25% of her then annual salary. |
| | (2) | Represents Mr. Perley’s target MIP incentive bonus following his promotion to EVP, Chief Administrative Officer on April 29, 2012. Mr. Perley’s target MIP bonus prior to that date was 55% of his then annual salary. |
| | (3) | Mr. Hunt served as the Company’s Chief Financial Officer until May 15, 2012, after which date he was no longer employed by the Company. |
The applicable percentage used to establish the participant’s target MIP award is based upon the participant’s position in the Company, performance and market benchmarks. Actual incentive bonus awards paid to individual participants are generally based upon the following factors:
1. Free Cash Component: 20% of the individual’s target incentive bonus will be determined based upon the Company’s performance under the Free Cash Flow Component described above. The payouts to the individual participants will be determined based upon the Company’s actual Free Cash Flow performance, using the calibration schedule established by the Compensation Committee. For 2012, the calibration schedule was as follows, with points between these amounts being approximately linearly interpolated:
| Free Cash Flow | | % of Target | | | Payout % | |
| $49 million | | | 88 | % | | | 0 | % |
| $56 million | | | 100 | % | | | 100 | % |
| $70 million | | | 125 | % | | | 200 | % |
2. Adjusted EBITDA Component and Individual Performance: 80% of the individual’s target incentive bonus (the “Adjusted EBITDA and Individual Portion”) will be determined based upon a combination of (i) the Company’s performance under the Adjusted EBITDA Component described above, as modified to incorporate business unit performance where applicable (see below), and (ii) in the case of all participants other than the Chief Executive Officer, Chief Financial Officer, and Chief Administrative Officer, individual performance. Bonus award amounts to be paid under this component will typically be determined as follows (the percentage allocations provided below with respect to each factor are those applicable to participants who are managers and above; percentages may vary slightly for participants below the manager level):
Corporate Participants. For those MIP participants who do not work in one of the Company’s specified business units (for example, the Company’s Retail, Wholesale and International divisions), the Adjusted EBITDA and Individual Portion of their total MIP incentive award is determined as follows: (i) 80% of such amount shall be determined by the Company’s actual Adjusted EBITDA performance versus the Adjusted EBITDA objective pre-approved by the Compensation Committee and (ii) in the case of all participants other than the Chief Executive Officer, Chief Financial Officer, and Chief Administrative Officer, 20% of the participant’s award level under the Adjusted EBITDA and Individual Portion shall be determined based on the individual’s performance against his or her pre-determined key performance objectives established by his or her supervisor at the start of the fiscal year, which amount may be increased or decreased further based upon the Chief Executive Officer’s overall assessment of the participant’s individual contribution and performance in the applicable year, longer-term potential and other considerations deemed appropriate by the Chief Executive Officer. In the case of the Chief Executive Officer, Chief Financial Officer, and Chief Administrative Officer, 100% of the individual’s bonus amount under this component is determined by the Company’s actual Adjusted EBITDA performance.
Business Unit Participants. For those MIP participants who do work in one of the Company’s specified business units (for example, the Company’s Retail, Wholesale and International divisions), the Adjusted EBITDA and Individual Portion of their total MIP incentive award is determined as follows: (i) 40% of such amount shall be determined by the Company’s actual Adjusted EBITDA performance versus the Adjusted EBITDA objective pre-approved by the Compensation Committee, (ii) 40% of such amount shall be determined by the segment profit achieved by such business unit as compared to the segment profit objectives pre-determined by the Compensation Committee (the pre-approved segment profit objectives for each business unit are aligned with the pre-approved total Company Adjusted EBITDA objective), and (iii) 20% of such amount under the Adjusted EBITDA and Individual Portion shall be determined based on the individual’s performance against his or her pre-determined key performance objectives as described under “ – Corporate Participants.”
Amounts awarded under this Component with respect to Adjusted EBITDA and, where applicable, business unit segment profit, will be determined based upon the actual Adjusted EBITDA and segment profit achievement in the applicable fiscal year, using the calibration schedules approved by the Compensation Committee. For 2012, the calibration schedule was as follows, with points between these amounts being approximately linearly interpolated:
| Adjusted EBITDA | | % of Target | | | Payout % | |
| $193 million | | | 94.6 | % | | | 0 | % |
| $204 million | | | 100.0 | % | | | 100 | % |
| $234.5 million | | | 107.8 | % | | | 200 | % |
The corresponding segment profit targets established for each of the three business units are those segment profit amounts taken directly from the Company’s approved operating budget used to establish the Adjusted EBITDA performance target approved by the Compensation Committee, with the percentage of target corresponding to a payout amount that is proportional to the Adjusted EBITDA chart above. Please see ‘‘Compensation Discussion and Analysis—Compensation Objectives and Program Structure—Annual Cash Incentives (Bonuses)—C. 2012 Performance Versus Pre-Approved Targets’’ below for a discussion of the computation of 2012 actual bonus amounts.
All awards made to the Company’s executive officers shall be reviewed and approved by the Compensation Committee. The Compensation Committee is also responsible for determining the annual incentive amount for the Chief Executive Officer.
The Compensation Committee has the discretion to modify all or any portion of any award as it deems necessary or appropriate. While there are no express factors which must be considered by the Compensation Committee in exercising this discretion, among the factors that may be considered by the Compensation Committee are input from the Company’s Chief Executive Officer as to individual performance, the relative performance of the Company or business unit as compared to its peers or the market generally, unforeseen economic conditions, matters beyond the Company’s control, other matters or conditions not foreseen at the time any applicable performance targets were established, the prior history of MIP payouts, the current status of the Company’s total cash and total direct compensation in relation to its peer group, retention concerns and other matters that the Compensation Committee may deem appropriate.
C. 2012 Performance Versus Pre-Approved Targets
In 2012, our actual Adjusted EBITDA performance as determined by the Compensation Committee for MIP purposes was $201.4 million, which was below the pre-approved Adjusted EBITDA target of $204 million established in March 2012, resulting in a payout of 77% of target under the Adjusted EBITDA component. Our actual Free Cash Flow performance in 2012 as determined by the Compensation Committee for MIP purposes was $66.0 million versus a pre-approved target of $56.0 million, resulting in a payout of 171% of target under the Free Cash component. The combination of these two measures resulted in the MIP pool being funded at 96% of target, or $5.07 million (against the target of $5.28 million). The Compensation Committee determined to fund the 2012 at 100% of target, or $5.28 million, due to management’s achievement of key strategic objectives set by the Board of Directors for 2012.
The Company’s Retail Segment achieved 155% of its segment profit target, which equated to an individual payout under the segment profit component, expressed as a percentage of the total target MIP payment, of 50% (as compared to 32% that would have been paid if segment profit had been achieved at 100% of target). The Company’s Wholesale Segment achieved 45% of its segment profit target, which equated to an individual payout under the segment profit component, expressed as a percentage of the total target MIP payment, of 15% (as compared to 32% that would have been paid if its segment profit target had been achieved). The Company’s International Segment achieved 0% of its segment profit target, which equated to an individual payout under the segment profit component, expressed as a percentage of the total target MIP payment, of 0% (as compared to 32% that would have been paid if its segment profit target had been achieved).
In 2012, for those named executive officers whose MIP payouts included an evaluation under the Individual Component of their performance against individual key performance objectives, the determination was made as follows:
Lisa K. McCarthy – Ms. McCarthy’s key performance objectives included (i) achieving productivity and earnings objectives, (ii) retain executive talent for the Company’s financial organization, (iii) manage the Company’s asset-backed loan facility, (iv) lead the Company’s delivery of its Adjusted EBITDA and Free Cash Flow targets, and (v) leadership on initiatives related to talent development, including employee engagement, internal promotion of employees, and the coaching and development of identified employees. Based on her performance of these objectives, the Company’s chief executive officer recommended a payout to Ms. McCarthy of 100% of her targeted payout under the Individual Component. The Compensation Committee approved this recommendation.
James A. Perley - Mr. Perley’s key performance objectives included (i) manage and deliver improved supply chain & customer service fill rates, (ii) deliver safety and quality improvements, (iii) manage to the Company’s pre-determined inventory and productivity goals, (iv) deliver key business information systems project on or better than projected budgets, (iv) deliver a new strategic plan for the Company’s business information systems, (v) manage Board of Directors and Company communications, reporting and planning, and (vi) leadership on initiatives related to talent development, including employee engagement, internal promotion of employees, and the coaching and development of identified employees. Based upon his performance on these objectives the Company’s chief executive officer recommended a payout for Mr. Perley of 90% of his targeted payout under the Individual Component. The Compensation Committee approved this recommendation.
Brad H. Wolansky – Mr. Wolansky’s key performance objectives included (i) meeting business unit sales and profits targets, (ii) deliver a strategic plan for the Company’s consumer direct business, (iii) support the Company’s wholesale, international, and fundraising marketing and digital initiatives, (iv) steward the creation of the Company’s brand and marketing plans, and (v) leadership on initiatives related to talent development, including employee engagement, internal promotion of employees, and the coaching and development of identified employees. Based upon his performance on these objectives, the Company’s chief executive officer recommended a payout for Mr. Wolansky of 100% of his targeted payout under the Individual Component. The Compensation Committee approved this recommendation.
Nathel John Fontana, III – Mr. Fontana’s key performance objectives included (i) meeting business unit sales and profits targets, (ii) achieve targeted growth in Yankee Candle International’s business in continental Europe, (iii) establish plans for growth in the Company’s business in Asia, (iv) develop the Company’s international business support infrastructure, (v) manage to the Company’s pre-determined inventory and service level goals, and (vi) leadership on initiatives related to talent development, including employee engagement, internal promotion of employees, and the coaching and development of identified employees. Based on his performance on these objectives, the Company’s chief executive officer recommended a payout to Mr. Fontana of 75% of his targeted payout under the Individual Component. The Compensation Committee approved this recommendation.
The actual 2012 bonus for each named executive officer was computed as set forth in the following table:
Actual Bonuses Based Upon Adjusted EBITDA/ Segment Profit Component and Individual Performance
| % of target total bonus for each of (a) Adjusted EBITDA, (b) Segment Profit, (c) Individual Performance and (d) Free Cash Flow Components (x) | | Target Bonus Amount (y) ($) | | | Payout % based on actual (a) Adjusted EBITDA, (b) Segment Profit, (c) Individual Performance (1) and (d) Free Cash Flow Components (z) (%) | | | Payout $ per component (x)*(y)*(z) ($) | | | Discretionary Bonus ($) | | | Total Bonus ($) | |
| Harlan M. Kent | (a) 80% | | | 620,000 | | | | 77 | | | | 477,400 | | | | 35,000 | | | | 777,450 | |
| | (d) 20% | | | 155,000 | | | | 171 | | | | 265,050 | | | | | | | | | |
| | | | | | | | | | | | | | | | | | | | | | |
| Lisa K. McCarthy (2) | (a) 78% | | | 83,095 | | | | 77 | | | | 63,983 | | | | 10,000 | | | | 112,295 | |
| | (c) 2% | | | 2,329 | | | | 100 | | | | 1,793 | | | | | | | | | |
| | (d) 20% | | | 21,356 | | | | 171 | | | | 36,519 | | | | | | | | | |
| | | | | | | | | | | | | | | | | | | | | | |
| James A. Perley (3) | (a) 76% | | | 180,624 | | | | 77 | | | | 139,080 | | | | 10,000 | | | | 237,017 | |
| | (c) 4% | | | 9,567 | | | | 90 | | | | 6,630 | | | | | | | | | |
| | (d) 20% | | | 47,548 | | | | 171 | | | | 81.307 | | | | | | | | | |
| | | | | | | | | | | | | | | | | | | | | | |
| Brad H. Wolansky | (a) 32% | | | 31,902 | | | | 77 | | | | 24,564 | | | | — | | | | 134,744 | |
| | (b) 32% | | | 31,902 | | | | 200 | | | | 63,803 | | | | | | | | | |
| | (c) 16% | | | 15,951 | | | | 100 | | | | 12,282 | | | | | | | | | |
| | (d) 20% | | | 19,938 | | | | 171 | | | | 34,095 | | | | | | | | | |
| | | | | | | | | | | | | | | | | | | | | | |
| Nathel John Fontana, III | (a) 32% | | | 53,633 | | | | 77 | | | | 41,297 | | | | 30,000 | | | | 144,103 | |
| | (b) 32% | | | 53,633 | | | | 0 | | | | 0 | | | | | | | | | |
| | (c) 16% | | | 26,816 | | | | 75 | | | | 15,486 | | | | | | | | | |
| | (d) 20% | | | 33,520 | | | | 171 | | | | 57,320 | | | | | | | | | |
| | | | | | | | | | | | | | | | | | | | | | |
| Gregory W. Hunt (4) | n/a | | | 0 | | | | 0 | | | | 0 | | | | 0 | | | | 0 | |
| | (1) | Individual Performance is determined by (a) multiplying the total MIP bonus target by the percentage achievement on Yankee Candle Adjusted EBITDA, and (b) multiplying the result by 20% (representing the proportion of the Adjusted EBITDA and Individual Performance Component attributable to Individual Performance), and (c) multiplying the result by the achievement percentage. |
| | (2) | Reflects the aggregation of (a) the period from January 1, 2012, through May 15, 2012, when Ms. McCarthy served as VP and Controller, during which period Ms. McCarthy’s bonus was partially determined based on individual performance, and (b) the period from May 16, 2012 through December 31, 2012, after Ms. McCarthy’s promotion to SVP and Chief Financial Officer, during which period Ms. McCarthy’s bonus was determined solely based on the Adjusted EBITDA and Free Cash Flow of the Company. |
| | (3) | Reflects the aggregation of (a) the period from January 1, 2012, through April 27, 2012, when Mr. Perley served as EVP and General Counsel, during which period Mr. Perley’s bonus was partially determined based on individual performance, and (b) the period from April 29, 2012 through December 31, 2012, after Mr. Perley’s promotion to EVP and Chief Administrative Officer, during which period Mr. Perley’s bonus was determined solely based on the Adjusted EBITDA and Free Cash Flow of the Company. |
| | (4) | Mr. Hunt resigned as EVP and Chief Financial Officer on May 15, 2012. |
Long-Term Incentives (Equity Awards). Our equity program consists of ownership interests in Yankee Group issued pursuant to the Yankee Candle Group LLC 2011 Incentive Equity Plan adopted in June 2011 (the ‘‘Management Equity Plan’’). See “-- Explanatory Note Regarding Current Organizational Structure ” for a description of the two equity exchange transactions, one in February 2011 and one in June 2011, which resulted in the current equity structure. The objective of the Management Equity Plan is to align the interests of management with those of Madison Dearborn and our other investors through direct personal investment that provides the potential for financial benefit to management if it operates Yankee Candle in a manner that enhances our equity value. The value of these investments will only be realized to the extent that significant equity value in Yankee Candle Investments is created and realized in the future.
The Class A, Class B and Class C common units were issued to our executive officers under the Management Equity Plan in June 2011. The rights and obligations of Yankee Candle Investments and the holders of its Class A, Class B and Class C common units are generally set forth in Yankee Group’s limited liability company agreement, Yankee Group’s unitholders agreement and the Class A, Class B and Class C unit exchange agreements.
Holders of the Class A, Class B and Class C common units are entitled to one vote per Class A common unit and one vote per vested Class B and Class C common unit held on all matters submitted to a vote of unitholders. The unitholders are entitled to allocations of profits and losses (as such terms are defined in the limited liability company agreement) of Yankee Group and to distributions of cash and other property of Yankee Group as set forth in the limited liability company agreement. The Class A common units are first entitled to a return of capital. Then the class B common units are entitled to a return of capital. Thereafter, all A, B and C units participate in any residual distributions on a pro rata basis.
Both the Class A common units and Class B and Class C common units are subject to restrictions on transfer, and the Class B common units are also subject to the right of Yankee Group or, if not exercised by Yankee Group, Madison Dearborn’s right, to repurchase these Class B common units upon a termination of employment. If an employee’s employment with Yankee Candle terminates for any reason other than for cause, vested units can be repurchased at fair market value and unvested units can be repurchased at the lower of original cost and fair market value. Upon a termination for cause, both vested and unvested Class B common units can be repurchased at the lower of original cost and fair market value.
Class C common units will otherwise have the same general characteristics as Class B common units, including with respect to time vesting and repurchase terms (except that unvested Class C common units are forfeited rather than repurchased as there is no initial capital outlay for the Class C common units). We currently anticipate that all future long-term equity incentive grants will be made using Class C common units.
Yankee Group may issue additional units subject to the terms and conditions of the limited liability agreement. Any units issued will be subject to the transfer restrictions set forth in the limited liability agreement and the unitholders agreement. If Madison Dearborn seeks to sell all or substantially all of Yankee Group, the Management Investors must consent to the sale and cooperate with Madison Dearborn, which may include selling their securities to the buyer on the terms and at the price negotiated by Madison Dearborn and signing whatever documents are reasonably necessary to consummate the sale.
Prior to an initial public offering, if Madison Dearborn sells a significant portion of its ownership interest in Yankee Group
to a third party (disregarding sales in the public market, transfers to its affiliates and certain other exceptions), the Management Investors will have the option (but will not be required to, except in the case of a sale of all or substantially all of the assets or equity of Yankee Candle) to participate in the sale and sell alongside Madison Dearborn on a pro rata basis.
Prior to an initial public offering or a sale of all or substantially all of Yankee Group, each Management Investor will be required to vote his or her units in favor of a board of managers consisting of four representatives of Madison Dearborn, Harlan Kent (for so long as he is employed by us as CEO) and any independent managers appointed by the board of managers of Yankee Group.
In structuring and determining participation in the Management Equity Plan, as well as specific amounts provided to each participant thereunder, Madison Dearborn considered the practices of other comparable privately-held companies (including other companies in which it holds an investment) as well as the required returns Madison Dearborn will provide its investors. The Compensation Committee believes the opportunities provided to our senior management through the long-term equity incentive awards are competitive with typical practice in the private company/management buy-out sector. As opposed to our practice during the time we were a public company, we do not currently anticipate that we will be making any annual grants or awards to current equity holders under the Management Equity Plan in the near future.
February 2011 Issuance of Senior PIK Notes; Equity-Related Payments
In February 2011, YCC Holdings and Yankee Finance co-issued $315 million of Senior PIK Notes. YCC Holdings used the net proceeds from the Notes to make a distribution to its newly formed parent, Yankee Investments, who in turn made a distribution of $297.9 million to the holders of its Class A common units. This distribution was a partial return of previously invested capital by Class A unit holders and was not deemed to be compensatory. Because it was only a partial return of capital to Class A holders, who have a priority right to the return of capital before any capital is returned to the holders of Class B and Class C units, the holders of Class B and C units were not entitled to and did not receive a distribution in connection with this transaction. However, in recognition of this fact and of the contributions made by Class B and C unit holders in enabling the Company to increase its equity value, the Board and the Compensation Committee authorized the payment by Yankee Investments of a special payment in the aggregate amount of $3.0 million to all then employed holders of Class B and Class C units. This $3.0 million special payment was deemed to be compensatory in nature and the amounts paid to management are reflected as compensation expense of the Company in fiscal 2011. The amount received by each of the named executive officers in connection with this special payment is reflected in column (d) of the Summary Compensation Table set forth below.
February 2012 Supplemental Equity Award
On February 23, 2012, the Compensation Committee approved a supplemental grant of equity to the Company’s named executive officers and other members of management. The award consisted of an aggregate of 30,000 Class C Units (the “Supplemental Award”), of which 13,650 were granted to Vice Presidents and above (excluding 2,000 Class C Units granted to Mr. Hunt that lapsed unvested following Mr. Hunt’s termination of employment). The Compensation Committee approved the Supplemental Award primarily to continue to provide equity incentives to members of management whose prior grants had substantially vested and to further align management’s interest with Madison Dearborn. For those members of management below the level of Vice President the supplemental award vests daily over five years. For Vice Presidents and above the Supplemental Award vests (a) 25% on a daily basis over the five years following the date of grant, (b) 25% upon the achievement by the Company of pre-determined 2012 performance targets, and (c) 50% (along with any previously unvested units) following the achievement by the Company of pre-determined, cumulative performance targets. The Company did not achieve its 2012 performance targets, so the 25% of the Supplemental Award that could have vested if the Company had achieved its 2012 performance targets shall remain unvested, and shall be eligible to vest following a fiscal year in which the Company achieves the pre-determined, cumulative targets set by the Compensation Committee.
Other Programs and Perquisites. We also provide our named executive officers, among others, with 401(k) and nonqualified deferred compensation matching programs, and certain named executive officers are provided a car allowance (typically determined by position and/or anticipated travel demands). Specifically, under our 401(k) Plan, we provided (i) a weekly discretionary match for each week during the 2012 plan year that was equal to 25% of the first 4% of eligible earnings and (ii) an additional discretionary match of up to an additional 25% of the first 4% of eligible earnings, which is awarded at the end of the fiscal year at the discretion of the Compensation Committee. Under our nonqualified deferred compensation program an eligible participant may defer up to 100% of total annual salary and incentive compensation. For senior vice presidents and above, the program will match 100% of the first $10,000 deferred and 50% of the next $20,000 deferred, up to a maximum matching contribution of $20,000. Vehicles are provided to certain executives based on the travel required in their position and their level at the Company. The Company either leases a vehicle for eligible executives or provides a monthly vehicle allowance. We provide such perquisites and other personal benefits as we believe are reasonable and consistent with our overall compensation program to better enable us to attract and retain superior employees for key positions.
Welfare Benefits. The named executive officers are offered health coverage, life and disability insurance under the same programs as all other salaried employees. In addition, the named executive officers are offered Personal Umbrella Liability Insurance under a program also covering all other employees at the level of vice president and above and certain other key personnel.
COMPENSATION COMMITTEE REPORT
The Compensation Committee of the Board of Directors has reviewed and discussed the Compensation Discussion and Analysis required by Item 402(b) of Regulation S-K with management and, based on such review and discussions, and recommended that the Compensation Discussion and Analysis be included in this Annual Report on Form 10-K. The current members of the Compensation Committee are Robin P. Selati, Terry Burman, Richard H. Copans, Thomas T. Macejko, Jr., Craig Rydin and Trudy Sullivan.
| | Robin P. Selati (Chair) |
| | Terry Burman |
| | Richard H. Copans |
| | Thomas T. Macejko, Jr. |
| | Craig W. Rydin |
| | Trudy Sullivan |
Executive Compensation Tables
Summary Compensation Table
The following table summarizes the total compensation earned in 2012, 2011, and 2010 by our named executive officers:
| Name and Principal Position | | Year | | Salary ($) | | | Bonus ($) | | | Stock Awards ($) | | | Option Awards ($) | | | Non-Equity Incentive Plan Compensation ($) | | | Change in Pension Value and Nonqualified Deferred Compensation Earnings ($) | | | All Other Compensation ($) | | | Total ($) | |
| (a) | | (b) | | (c) | | | (d) | | | (e) | | | (f) | | | (g) | | | (h) | | | (i) | | | (j) | |
| | | | | | | | (1) | | | (2) | | | (3) | | | (4) | | | (5) | | | (6) | | | (7) | |
| Harlan M. Kent | | | | | | | | | | | | | | | | | | | | | | | | | | | | | | | | | |
| President and Chief Executive Officer | | | | | | | | | | | | | | | | | | | | | | | | | | | | | | | | | |
| | | 2012 | | $ | 775,580 | | | $ | 35,000 | | | $ | - | | | $ | - | | | $ | 742,450 | | | $ | - | | | $ | 41,604 | | | $ | 1,594,634 | |
| | | 2011 | | $ | 775,359 | | | $ | 752,466 | | | $ | - | | | $ | - | | | $ | 130,119 | | | $ | - | | | $ | 28,800 | | | $ | 1,686,743 | |
| | | 2010 | | $ | 742,176 | | | $ | - | | | $ | - | | | $ | - | | | $ | 827,787 | | | $ | - | | | $ | 27,694 | | | $ | 1,597,657 | |
| Lisa K. McCarthy | | | | | | | | | | | | | | | | | | | | | | | | | | | | | | | | | | |
| Senior Vice President Finance, Chief Financial Officer | | | | | | | | | | | | | | | | | | | | | | | | | | | | | | | | | | |
| | | 2012 | | $ | 242,669 | | | $ | 10,000 | | | $ | 348,500 | | | $ | - | | | $ | 102,295 | | | $ | - | | | $ | 4,853 | | | $ | 708,318 | |
| | | 2011 | | $ | 175,835 | | | $ | 16,199 | | | $ | - | | | $ | - | | | $ | 7,385 | | | $ | - | | | $ | 3,517 | | | $ | 202,937 | |
| | | 2010 | | $ | 150,887 | | | $ | 25,000 | | | $ | 65,400 | | | $ | - | | | $ | 38,264 | | | $ | - | | | $ | 3,018 | | | $ | 282,569 | |
| James A. Perley | | | | | | | | | | | | | | | | | | | | | | | | | | | | | | | | | | |
| Executive Vice President, Chief Administrative Officer | | | | | | | | | | | | | | | | | | | | | | | | | | | | | | | | | | |
| | | 2012 | | $ | 405,290 | | | $ | 10,000 | | | $ | 295,300 | | | $ | - | | | $ | 227,017 | | | $ | - | | | $ | 25,000 | | | $ | 962,607 | |
| | | 2011 | | $ | 339,299 | | | $ | 188,129 | | | $ | - | | | $ | - | | | $ | 31,351 | | | $ | - | | | $ | 24,900 | | | $ | 583,679 | |
| | | 2010 | | $ | 317,367 | | | $ | - | | | $ | - | | | $ | - | | | $ | 246,269 | | | $ | - | | | $ | 24,900 | | | $ | 588,535 | |
| Brad H. Wolansky | | | | | | | | | | | | | | | | | | | | | | | | | | | | | | | | | | |
| President, Consumer Direct and Chief Marketing Officer | | | | | | | | | | | | | | | | | | | | | | | | | | | | | | | | | | |
| | | 2012 | | $ | 166,154 | | | $ | - | | | $ | 474,000 | | | $ | - | | | $ | 134,744 | | | $ | - | | | $ | 58,530 | | | $ | 833,428 | |
| | | 2011 | | $ | - | | | $ | - | | | $ | - | | | $ | - | | | $ | - | | | $ | - | | | $ | - | | | $ | - | |
| | | 2010 | | $ | - | | | $ | - | | | $ | - | | | $ | - | | | $ | - | | | $ | - | | | $ | - | | | $ | - | |
| Nathel John Fontana, III | | | | | | | | | | | | | | | | | | | | | | | | | | | | | | | | | | |
| President, International | | | | | | | | | | | | | | | | | | | | | | | | | | | | | | | | | | |
| | | 2012 | | $ | 350,711 | | | $ | 30,000 | | | $ | - | | | $ | - | | | $ | 114,103 | | | $ | - | | | $ | 95,148 | | | $ | 589,962 | |
| | | 2011 | | $ | 294,231 | | | $ | - | | | $ | - | | | $ | - | | | $ | 30,697 | | | $ | - | | | $ | 174,324 | | | $ | 499,251 | |
| | | 2010 | | $ | - | | | $ | - | | | $ | - | | | $ | - | | | $ | - | | | $ | - | | | $ | - | | | $ | - | |
| Gregory W. Hunt | | | | | | | | | | | | | | | | | | | | | | | | | | | | | | | | | | |
| Executive Vice President, Chief Financial Officer | | | | | | | | | | | | | | | | | | | | | | | | | | | | | | | | | | |
| | | 2012 | | $ | 206,611 | | | $ | - | | | $ | - | | | $ | - | | | $ | - | | | $ | - | | | $ | 5,000 | | | $ | 211,611 | |
| | | 2011 | | $ | 509,462 | | | $ | 156,713 | | | $ | - | | | $ | - | | | $ | 59,913 | | | $ | - | | | $ | 36,900 | | | $ | 762,988 | |
| | | 2010 | | $ | 378,846 | | | $ | 80,580 | | | $ | 1,204,000 | | | $ | - | | | $ | 316,114 | | | $ | - | | | $ | 30,346 | | | $ | 2,009,886 | |
| (1) | With respect to 2012, this column represents amounts paid to the named executive officers under the Company’s 2012 Management Incentive Plan pursuant to the Compensation Committee’s exercise of its discretion as provided under the Plan in excess of the incentive award payments that would have been paid pursuant to the terms of the MIP based upon the Company’s achievement of its pre-approved performance target and prior to the exercise of such discretion. The Committee believes these payments were made pursuant to the MIP, which expressly contemplates the exercise of discretion by the Committee and the CEO, but the Company is reporting these amounts separately from those in column (g) in accordance with applicable SEC guidance. The amounts paid based upon the formula in the MIP are presented in column (g). With respect to 2011, the amount shown in this column for each executive represents the amount paid to the applicable executive in connection with the $3.0 million special payment made by Yankee Investments to its Class B and Class C unit holders in connection with the February 2011 issuance of $315 million Senior PIK Notes. With respect to 2010, the amount shown in this column for Mr. Hunt represents a relocation bonus paid to Mr. Hunt in connection with his hiring. With respect to 2010, the amount shown in this column for Ms. McCarthy represents a retention bonus of $10,000, and a $15,000 discretionary award provided under the Plan in excess of the incentive award payments that would have been paid pursuant to the terms of the MIP based upon the Company’s achievement of its pre-approved performance target and prior to the exercise of such discretion. The Committee believes these payments were made pursuant to the MIP, which expressly contemplates the exercise of discretion by the Committee and the CEO, but the Company is reporting these amounts separately from those in column (g) in accordance with applicable SEC guidance. The amounts paid based upon the formula in the MIP are presented in column (g). |
| (2) | This column represents the aggregate fair value of the Class B or Class C common units, if any, granted to the executive during the applicable fiscal year, determined as of the date of grant in accordance with FASB ASC Topic 718. See the “Grants of Plan-Based Awards” table for information on awards granted in fiscal 2012. These amounts do not necessarily correspond to the actual value that will be recognized by the named executive officers. Please refer to Note 5 in the Notes to Consolidated Financial Statements included elsewhere in this Annual Report on Form 10-K for the year ended December 29, 2012 for the relevant assumptions used to determine the compensation expense for our unit awards. |
| (3) | No stock option awards are included in the Company’s long term incentive (equity) program. |
| (4) | This column represents amounts earned during the corresponding fiscal year (and paid in the subsequent fiscal year) under the Company’s Management Incentive Plan, which is described below under “Management Incentive Plan.” |
| (5) | The Company has no defined benefit pension plans. Earnings under the Company’s nonqualified deferred compensation plans are not “above market.” The Company’s deferred compensation plan provides for investment options through a third party administrator in a variety of mutual funds all of which are widely available. See the text accompanying the “Non-Qualified Deferred Compensation” table below for a description of this plan. |
| (6) | The dollar value of the amounts shown in this column for 2012 include the following: |
| Name | | Vehicle Expense | | | Matching Contributions Under 401(k) Plan | | | Executive Deferred Compensation Plan Matching Contributions | | | Relocation | | | Dividend Payments | | | Total | |
| | | | | | | | | (a) | | | | | | | | | | |
| Harlan M. Kent | | | 16,604 | | | | 5,000 | | | | 20,000 | | | | - | | | | - | | | | 41,604 | |
| Lisa K. McCarthy | | | - | | | | 4,853 | | | | - | | | | - | | | | - | | | | 4,853 | |
| James A. Perley | | | - | | | | 5,000 | | | | 20,000 | | | | - | | | | - | | | | 25,000 | |
| Brad H. Wolansky | | | 3,600 | | | | - | | | | 20,000 | | | | 34,930 | | | | - | | | | 58,530 | |
| Nathel John Fontana, III | | | 4,849 | | | | 3,507 | | | | 20,000 | | | | 66,791 | | | | - | | | | 95,148 | |
| Gregory W. Hunt | | | 5,000 | | | | - | | | | - | | | | - | | | | - | | | | 5,000 | |
(a) Amounts in this column represent amounts earned in 2012 and contributed to the plan in 2013.
| (7) | The salary plus bonus plus the management incentive plan cash compensation received and reported in the Summary Compensation Table for 2012 represents between 36% and 97% of the total compensation received and reported for each named executive officer. |
| (8) | Mr. Perley also served as President, International Division in 2010 and 2009. |
| (9) | Mr. Hunt resigned effective May 15, 2012. |
Grants of Plan-Based Awards
The following table summarizes information regarding awards granted under the Company’s equity and non-equity incentive plans during 2012:
| | | | | Board Approval | | Estimated Possible Payouts Under Non-Equity Incentive Plan Awards (1) | | | Estimated Future Payouts Under Performance Based Awards (3) | | | All Other Stock Awards: Number of Shares of | | | Grant Date Fair Value of | |
| Name | | Grant Date | | Date | | Threshold | | | Target | | | Maximum | | | Threshold | | | Target | | | Maximum | | | Stock or Units (#) | | | Stock Awards | |
| | | | | | | (2) | | | | | | | | | (4) | | | | | | | | | (5) | | | (6) | |
| (a) | | (b) | | | | (c) | | | (d) | | | (e) | | | (f) | | | (g) | | | (h) | | | (i) | | | (l) | |
| Harlan M. Kent | | | | | | | | | | | | | | | | | | | | | | | | | | | | | | | | |
| -2012 Management Incentive Plan | | | | | | $ | 78,585 | | | $ | 775,000 | | | $ | 1,550,000 | | | | | | | | | | | | | | | | | | | |
| Lisa K. McCarthy | | | | | | | | | | | | | | | | | | | | | | | | | | | | | | | | | | |
| -2012 Management Incentive Plan | | | | | | $ | 10,827 | | | $ | 106,779 | | | $ | 194,930 | | | | | | | | | | | | | | | | | | | |
| -Class C Common Units | | 6/11/2012 | | 4/30/2012 | | | | | | | | | | | | | | | | | | | | | | | | | 12,000 | | | $ | 319,200 | |
| -Class C Common Units (Perfomance based) | | 3/30/2012 | | 2/23/2012 | | | | | | | | | | | | | | | 250 | | | | 750 | | | | 750 | | | | 250 | | | $ | 29,300 | |
| James A. Perley | | | | | | | | | | | | | | | | | | | | | | | | | | | | | | | | | | | | |
| -2012 Management Incentive Plan | | | | | | $ | 24,020 | | | $ | 237,738 | | | $ | 473,563 | | | | | | | | | | | | | | | | | | | | | |
| -Class C Common Units | | 6/11/2012 | | 4/30/2012 | | | | | | | | | | | | | | | | | | | | | | | | | | | 10,000 | | | $ | 266,000 | |
| -Class C Common Units (Perfomance based) | | 3/30/2012 | | 2/23/2012 | | | | | | | | | | | | | | | 250 | | | | 750 | | | | 750 | | | | 250 | | | $ | 29,300 | |
| Brad H. Wolansky | | | | | | | | | | | | | | | | | | | | | | | | | | | | | | | | | | | | |
| -2012 Management Incentive Plan | | | | | | $ | 10,109 | | | $ | 134,744 | | | $ | 199,385 | | | | | | | | | | | | | | | | | | | | | |
| -Class C Common Units | | 7/9/2012 | | 6/14/2012 | | | | | | | | | | | | | | | | | | | | | | | | | | | 20,000 | | | $ | 474,000 | |
| Nathel John Fontana, III | | | | | | | | | | | | | | | | | | | | | | | | | | | | | | | | | | | | |
| -2012 Management Incentive Plan | | | | | | $ | 16,385 | | | $ | 167,602 | | | $ | 321,796 | | | | | | | | | | | | | | | | | | | | | |
| Gregory W. Hunt | | | | | | | | | | | | | | | | | | | | | | | | | | | | | | | | | | | | |
| -2012 Management Incentive Plan | | | | | | $ | - | | | $ | - | | | $ | - | | | | | | | | | | | | | | | | | | | | | |
| (1) | These columns show the potential value of the payout for each named executive officer under the MIP in 2012 if the threshold, target and maximum goals are satisfied. The methodology for determining payout is based on Company performance (based on Adjusted EBITDA and “Free Cash Flow”), business unit performance (if applicable) and individual performance as described above under “Compensation Discussion and Analysis – Annual Cash Incentives (Bonuses)”. Actual bonus payments for the fiscal year are listed in column (g) of the “Summary Compensation Table”. |
| (2) | Under the 2012 MIP, if the Company’s actual Adjusted EBITDA or Free Cash Flow performance is less than the pre-approved minimum threshold for each measure, then the applicable portion of the MIP award allocated to such measure is $0. If the actual Adjusted EBITDA performance of the Company in 2012 had been below $193.0 million, no bonus payments would be made under the Adjusted EBITDA Component. If the actual Free Cash Flow achieved by the Company in 2012 had been below $49 million, no bonus payments would be made under the Free Cash Component. The amounts shown in this column reflect the amounts that would theoretically be paid under the 2012 MIP assuming (i) the Company achieved the minimum “threshold” Adjusted EBITDA and Free Cash performances and (ii) no adjustments to that award were made under the Individual Performance component of the 2012 MIP. |
| (3) | These columns show the potential number of Class C common units that vest with respect to the named executive officer if pre-determined performance targets are achieved by the Company in 2012 and future periods. See “Long-Term Incentives (Equity Awards) – February 2012 Supplemental Equity Award.” |
| (4) | This column represents the performance-based Class C common units that would vest upon the achievement by the Company of pre-determined performance targets applicable to 2012, assuming that the Company did not achieve the cumulative performance targets applicable to the remainder of the performance-based Class C common units. |
| (5) | Reflects grants of Class C common units made to the named executive officers in 2012, including the portion of the February 2012 supplemental equity award that vests solely based on the passage of time. |
| (6) | The “fair value” shown in this column represents the value established by the Company as of the grant date for financial statement reporting purposes in accordance with FASB ASC Topic 718. These amounts do not necessarily correspond to the actual value that will be recognized by the named executive officers. |
Employment Contracts
In 2009, in accordance with an approved plan of transition, Harlan M. Kent was appointed President and Chief Executive Officer of the Company, effective as of October 1, 2009. Mr. Kent succeeded Craig W. Rydin, who served as CEO until October 1, 2009, at which time he was named Executive Chairman of the Board of Directors of the Company. Mr. Rydin currently serves as Non-Executive Chairman of the Board. The Company entered into employment agreements with Messrs. Rydin and Kent with respect to the above transition. Mr. Kent’s employment agreement is described below.
Harlan M. Kent
On March 4, 2009, the Company entered into an Employment Agreement with Harlan M. Kent whereby Mr. Kent became Chief Executive Officer of the Company effective October 1, 2009 (the “Kent Agreement”). The agreement is for a term of 36 months, with automatic one year renewals unless either Mr. Kent or the Company give notice of non-renewal within 30 days prior to the end of the initial 36 month term or any subsequent one year term. The Employment Agreement terminates immediately upon Mr. Kent’s resignation, disability (as defined in the Executive Severance Agreement) or death and is also terminable by the Company with or without cause. Mr. Kent’s Executive Severance Agreement with the Company, dated September 15, 2006, as amended, remains in full force and effect as modified by the Kent Agreement and contains certain non-competition and non-solicitation covenants to which Mr. Kent is subject. See “—Termination and Change in Control Arrangements.”
The terms and conditions of the Company’s compensatory arrangement with Mr. Kent with respect to his appointment as Chief Executive Officer are included in the Kent Agreement. Mr. Kent’s compensation arrangement includes (i) an annual base salary of $650,000 per annum for the period beginning March 1, 2009 through September 30, 2009, $700,000 per annum for the period beginning October 1, 2009 through February 28, 2010, and $750,000 per annum for the period beginning March 1, 2010 through December 31, 2010, and which shall be subject to annual review for increases thereafter, (ii) eligibility for an annual bonus in a target amount equal to 100% of his salary actually paid in the applicable fiscal year, subject to the terms and provisions of the Company’s Management Incentive Plan applicable to such fiscal year, (iii) receipt of 23,744 Class C equity units in YCC Holdings effective as of October 1, 2009, 20% of which units shall be vested as of the date of grant and the remainder of which shall vest on a daily basis over a four year period, such grant to be subject to the terms and conditions of YCC Holdings’ 2007 Incentive Equity Plan and (iv) potential severance payments pursuant to the Company’s Executive Severance Agreement. Nothing contained in the foregoing summary shall in any way modify or supersede the terms and conditions of the Kent Agreement.
All of the named executive officers have signed Executive Severance Agreements with the Company described below under “—Termination and Change in Control Arrangements.”
Management Incentive Plan
The MIP is structured to provide an initial funding pool, the size of which is determined by the Company’s attainment of certain financial and operating results for the applicable year established and pre-approved by the Compensation Committee. In 2012, those performance measures were Adjusted EBITDA and Free Cash Flow. The individual award level for each participant under the MIP is determined by the Company’s performance versus those pre-approved financial and operating objectives, business unit performance (where applicable) and individual performance. Individual awards may be further adjusted by the Compensation Committee or the Chief Executive Officer pursuant to discretion afforded under the terms of the MIP. Individual targets under the MIP are typically determined as a percentage multiplied by base salary earned in the fiscal year. The percentage is set based upon a participant’s level in the Company, performance, and market rates. See “Compensation Discussion and Analysis – Annual Cash Incentives (Bonuses)” for a more detailed discussion of the structure of the 2012 MIP.
Outstanding Equity Awards at Fiscal Year-End
The following table summarizes the outstanding equity awards held by our named executive officers at the end of fiscal 2012:
| | | Stock Awards | |
| Name | | Number of Shares or Units of Stock That Have Not Vested (#) | | | Market Value of Shares or Units of Stock That Have Not Vested ($) | |
| (a) | | (g) (1) | | | (h) (2) | |
| Harlan M. Kent | | | | | | |
| 10/1/09 Class C | | | 4,100 | | | $ | 489,428 | |
| Lisa K. McCarthy | | | | | | | | |
| 9/20/10 Class C | | | 1,036 | | | $ | 102,215 | |
| 6/11/12 Class C | | | 10,524 | | | $ | 696,507 | |
| Perfomance shares Class C | | | 962 | | | $ | 61,640 | |
| James A. Perley | | | | | | | | |
| 6/11/12 Class C | | | 8,666 | | | $ | 573,539 | |
| Perfomance shares Class C | | | 962 | | | $ | 61,640 | |
| Brad H. Wolansky | | | | | | | | |
| 7/9/12 Class C | | | 18,000 | | | $ | 1,170,409 | |
| Nathel John Fontana, III | | | - | | | $ | - | |
| Gregory W. Hunt | | | | | | | | |
| 4/2/10 Class C | | | - | | | $ | - | |
| (1) | Represents the number of unvested Class C common units and performance-based Class C common units held by the named executive officer. Class C common units are subject to a five-year vesting period, with 10% of the units vesting immediately upon the date of purchase or grant and the remainder vesting daily beginning on the six month anniversary of the purchase or grant date, continuing over the subsequent 54 month period. Performance-based Class C common units vest (a) 25% based on the achievement by the Company of pre-determined performance targets for 2012, and (b) 50% (and any unvested Class C common units with respect to 2012) based on the achievement of cumulative pre-determined performance targets with respect to future periods. See “Long-Term Equity Incentives (Equity Awards) – Supplemental Equity Award.” With respect to Mr. Kent, pursuant to his employment agreement referenced above, 20% of the units granted October 1, 2009 were vested as of the date of the grant and the remainder vest on a daily basis over a four-year period. |
| (2) | Represents the “fair market value” as of December 29, 2012 based upon an independent valuation of total Company equity performed on a quarterly basis. |
Option Exercises and Stock Vested
The following table summarizes the number of Class B and/or Class C common units which vested in 2012 for each of our named executive officers:
| | | Stock Awards | |
| Name | | Number of Shares Acquired on Vesting (#) | | | Value Realized On Vesting ($) | |
| | | (1) | | | (2) | |
| (a) | | (b) | | | (c) | |
| Harlan M. Kent | | | | | | | | |
| Class B Units | | | 1,443 | | | | n/a | |
| Class C Units | | | 5,406 | | | | n/a | |
| Lisa K. McCarthy | | | | | | | | |
| Class B Units | | | 20 | | | | n/a | |
| Class C Units | | | 1,875 | | | | n/a | |
| Perfomance shares Class C | | | 38 | | | | n/a | |
| James A. Perley | | | | | | | | |
| Class B Units | | | 481 | | | | n/a | |
| Class C Units | | | 1,334 | | | | n/a | |
| Perfomance shares Class C | | | 38 | | | | n/a | |
| Brad H. Wolansky | | | | | | | | |
| Class C Units | | | 2,000 | | | | n/a | |
| Nathel John Fontana, III | | | - | | | | n/a | |
| Gregory W. Hunt | | | | | | | | |
| Class C Units | | | 2,604 | | | | n/a | |
| (1) | Class B and Class C common units are subject to a five-year vesting period, with 10% of the units vesting immediately upon the date of purchase or grant and the remainder vesting daily beginning on the six month anniversary of the purchase or grant date, continuing over the subsequent 54 month period. With respect to Mr. Kent’s employment agreement, referenced above, 20% of the units granted October 1, 2009 shall be vested as of the date of the grant and the remainder will vest on a daily basis over a four year period. |
| (2) | Because Class B and Class C common units vest on a daily basis, it is not practical to present a cumulative value as of each vesting date. No value is realized as a result of vesting of the Class B and Class C common units. See “– Compensation Discussion and Analysis – Long-Term Incentive (Equity Awards) for a description of the vesting of the Class B and Class C units. |
Non-Qualified Deferred Compensation
The following table summarizes the benefits to our named executive officers under our Executive Deferred Compensation Plan:
| Name | | Executive Contributions in Last FY ($) (1) | | | Registrant Contributions in Last FY ($) (2) | | | Aggregate Earnings in Last FY ($) (3) | | | Aggregate Withdrawals/ Distributions ($) | | | Aggregate Balance at Last FYE ($) (4) | |
| Harlan M. Kent | | $ | 30,000 | | | $ | 20,000 | | | $ | 35,298 | | | $ | - | | | $ | 341,295 | |
| Lisa K. McCarthy | | $ | - | | | $ | - | | | $ | - | | | $ | - | | | $ | - | |
| James A. Perley | | $ | 30,000 | | | $ | 20,000 | | | $ | 41,513 | | | $ | - | | | $ | 355,102 | |
| Brad H. Wolansky | | $ | 30,000 | | | $ | 20,000 | | | $ | 724 | | | $ | - | | | $ | 30,724 | |
| Nathel John Fontana, III | | $ | 30,000 | | | $ | 20,000 | | | $ | 4,052 | | | $ | - | | | $ | 82,607 | |
| Gregory W. Hunt | | $ | 12,115 | | | $ | - | | | $ | 796 | | | $ | (114,954 | ) | | $ | - | |
| (1) | With respect to Mr. Kent, the amount in this column represents contributions deferred by the named executive officer from his 2011 MIP bonus payment (paid in March 2012) and is therefore also included in the amount reported in column (g) of the Summary Compensation Table for 2011. With respect to Mr. Perley and Mr. Fontana, the amount in this column represents amounts deferred by Mr. Perley from base salary paid in 2012 and contributions deferred by Mr. Perley from his 2011 MIP bonus payment (paid in March 2012), and are therefore also included in the amounts reported in column (c) of the Summary Compensation Table for 2012 and column (g) for 2011, respectively. With respect to Mr. Hunt and Mr. Wolansky the amounts in this column represent amounts deferred by the named executive officer from base salary paid in 2012 and are therefore also included in the amounts reported in column (c) of the Summary Compensation Table for 2012. |
| (2) | The amounts in this column are also reflected in column (i) of the Summary Compensation Table. Amounts in this column represent matching contributions of amounts earned by the executive in 2012 and contributed by the Company to the plan in 2012. |
| (3) | Earnings on deferred compensation are not included in the Summary Compensation Table because the earnings are not considered above-market or at a preferential rate of earning. Amounts in this column represent the aggregate earnings and/or (losses) for the plan year ended December 31, 2012. |
| (4) | With respect to Messrs. Kent and Perley, the amounts in this column also include (i) a Company Contribution of $20,000 made by the Company in each of 2011 and 2010 to the named executive officer, which amounts are therefore reported in column (i) of the Summary Compensation Table for the applicable year, and (ii) Executive Contributions of $30,000 by the named executive officer made in each of 2011 and 2010. With respect to Mr. Kent, this Executive Contribution amount was deferred from his 2011 and 2010 MIP bonus payments (paid in 2012 and 2011, respectively) and are therefore included in the amounts previously reported in column (g) for each applicable year. With respect to Mr. Perley, these Executive Contribution amounts were deferred by Mr. Perley from both base salary paid in 2011 and 2010 and from his 2011 and 2010 MIP bonus payment (paid in 2012 and 2011, respectively), and are therefore also included in the amounts reported in columns (c) and (g) of the Summary Compensation Table for 2011 and 2010. |
The Company’s Executive Deferred Compensation Plan (the “Plan”) is available to certain eligible management employees, including the named executive officers, and allows eligible employees the opportunity to defer no more than 100% of his or her annual base salary and 100% of his or her annual bonus or incentive compensation during a calendar year. The Company will make a matching company contribution to any participant who holds the title of senior vice president or higher and any other participant approved by the Compensation Committee as eligible. The amount of the company matching contribution equals 100% of the participant’s first $10,000 contributed to his deferral account during the calendar year and 50% of the next $20,000 contributed to his or her deferral account during the calendar year. To receive a company matching contribution, generally participants must be employed by the Company on the last day of the calendar year. Executives invested their account balances in investment accounts selected by the executive from an array of investment options determined by the Company’s Investment Committee, which is charged with the administration of the Plan. Executives may change such elections on a daily electronic basis.
Participants who are otherwise eligible to receive matching contributions under the terms of the Plan will receive pro-rata matching contributions in the event of a “change of control” of the Company (as defined in the Plan), termination of the Plan, death or disability of the participant or an amendment to the Plan to eliminate or reduce matching contributions. Accordingly, upon consummation of the Merger, participants received matching contributions to which they were entitled for the portion of the fiscal year prior to the Merger.
Upon termination of employment with the Company, benefits are payable from the deferral account in lump sum form on or about the January 15th immediately following the termination date or if later, 45 days following the participant’s termination of employment. Upon death of a participant before commencement of payment, the Company will pay a lump sum representing the account balance to the participant’s beneficiary. Upon death of a participant after commencement of payment, the Company will pay a lump sum representing the account balance to the participant’s beneficiary at the same time and in the same manner as if the participant had survived. Upon a change in control event, benefits shall be distributed to the participant in lump sum form within 30 days following a change in control. A participant forfeits all matching company contributions in the event of his or her termination for “cause” (as defined in the Plan). The Company shall indemnify and hold harmless participants from all costs and expenses (including without limitation reasonable fees and expenses of counsel) incurred by any participant in connection with any effort or litigation to enforce his or her rights under the Plan.
Participants may apply for a withdrawal of all or a portion of their deferred compensation funds to meet a severe financial hardship, plus amounts necessary to pay any income and employment taxes reasonably anticipated as a result of the distribution. The hardship application must be reviewed and approved by the Compensation Committee.
Termination and Change in Control Arrangements
Assuming each named executive officer’s employment was terminated under each of the circumstances set forth below on December 29, 2012, the estimated values of payments and benefits to each named executive officer are set forth in the following table:
| Name | Benefit (1) | | Termination Without Cause more than 24 months after a CIC (1) | | | Termination Without Cause or Voluntary Termination for Good Reason by the Executive within 24 months of a CIC (2) | | | Voluntary Termination by the Executive without Good Reason | |
| Harlan M. Kent | Cash Severance (3) | | $ | 2,325,000 | | | $ | 3,875,001 | | | $ | - | |
| | Medical and Dental Benefits (4) | | $ | 21,485 | | | $ | 21,485 | | | $ | - | |
| | Outplacement Services | | $ | 10,000 | | | $ | 10,000 | | | $ | - | |
| | Total (5) | | $ | 2,356,485 | | | $ | 3,906,486 | | | $ | - | |
| | | | | | | | | | | | | | |
| Lisa K. McCarthy | Cash Severance (3) | | $ | 631,780 | | | $ | 738,560 | | | $ | - | |
| | Medical and Dental Benefits (4) | | $ | 463 | | | $ | 463 | | | $ | - | |
| | Outplacement Services | | $ | 10,000 | | | $ | 10,000 | | | $ | - | |
| | Total (5) | | $ | 642,243 | | | $ | 749,023 | | | $ | - | |
| | | | | | | | | | | | | | |
| James A. Perley | Cash Severance (3) | | $ | 920,238 | | | $ | 1,157,977 | | | $ | - | |
| | Medical and Dental Benefits (4) | | $ | 10,743 | | | $ | 10,743 | | | $ | - | |
| | Outplacement Services | | $ | 10,000 | | | $ | 10,000 | | | $ | - | |
| | Total (5) | | $ | 940,981 | | | $ | 1,178,719 | | | $ | - | |
| | | | | | | | | | | | | | |
| Brad H. Wolansky | Cash Severance (3) | | $ | 514,744 | | | $ | 649,488 | | | $ | - | |
| | Medical and Dental Benefits (4) | | $ | 10,743 | | | $ | 10,743 | | | $ | - | |
| | Outplacement Services | | $ | 10,000 | | | $ | 10,000 | | | $ | - | |
| | Total (5) | | $ | 535,487 | | | $ | 670,231 | | | $ | - | |
| | | | | | | | | | | | | | |
| Nathel John Fontana, III | Cash Severance (3) | | $ | 542,602 | | | $ | 710,204 | | | $ | - | |
| | Medical and Dental Benefits (4) | | $ | 10,743 | | | $ | 10,743 | | | $ | - | |
| | Outplacement Services | | $ | 10,000 | | | $ | 10,000 | | | $ | - | |
| | Total (5) | | $ | 563,345 | | | $ | 730,947 | | | $ | - | |
| | | | | | | | | | | | | | |
| Gregory W. Hunt | Cash Severance (3) | | | N/A | | | | N/A | | | $ | - | |
| | Medical and Dental Benefits (4) | | | N/A | | | | N/A | | | $ | - | |
| | Outplacement Services | | | N/A | | | | N/A | | | $ | - | |
| | Total (5) | | | N/A | | | | N/A | | | $ | - | |
| (1) | The executive severance agreements provide for differing levels of certain benefits if the named executive officer is terminated within 24 months of a “change in control event” (as defined below). The amounts in this column reflect the estimated values of payments and benefits to each named executive officer if his or her employment had been terminated on December 31, 2012. Had there been a “change of control event” within 24 months prior to such termination date, the estimated values of payments and benefits to each named executive officer would be calculated in accordance with the column “Termination without Cause or Voluntary termination for Good Reason by the Executive within 24 months of a Change in Control.” |
| (2) | Under the column “Termination without Cause more than 24 Months after a Change in Control,” these amounts represent: (i) cash severance in the form of continued payment of base salary, in accordance with regular payroll practices (subject to applicable delay periods for benefits that constitute nonqualified deferred compensation under Section 409A of the Internal Revenue Code), for the following periods: Mr. Kent – two years; Messrs. Hunt and Perley and Ms. McCarthy – 18 months; Messrs. Fontana and Wolansky – one year; plus (ii) a one-time payment of 100% of the incentive award target under the MIP, based on the assumption that the named executive officer was terminated on the last day of fiscal 2012. |
| (3) | Under the column “Termination without Cause or Voluntary termination for Good Reason by the Executive within 24 Months of a Change in Control,” these amounts represent: (i) cash severance in the form of a one-time payment of the following percentages of the sum of the individual’s base salary plus incentive award target under the MIP: Mr. Kent – 200%; Mr. Perley and Ms. McCarthy – 150% and Messrs. Wolansky and Fontana – 100%; plus (ii) a one-time payment of 100% of the incentive award target under the MIP, based on the assumption that the named executive officer was terminated on the last day of fiscal 2012. |
| (4) | These amounts represent payment of insurance premiums by the Company for continued health and dental benefits as if the named executive officer were still an active employee of the Company, for the following periods after termination of employment: Mr. Kent – 2 years; Messrs. Hunt, Perley and Ms. McCarthy – 18 months; and Messrs. Wolansky and Fontana – one year. The amount is based on the type of insurance coverage we carried for each named executive officer as of December 31, 2012 and is valued using the assumptions used for financial reporting purposes. |
| (5) | In addition to these benefits, each of the named executive officers would be entitled to the vested portion of is account balance under the Executive Deferred Compensation Plan in the event of his termination of employment, death or a change in control. See “Non-Qualified Deferred Compensation.” |
Executive Severance Agreements
We are a party to various executive severance agreements with certain of our officers, including the named executive officers. These agreements provide for certain severance benefits to the executive in the event his or her employment is terminated (i) by the Company other than for cause (as defined below), disability or death prior to a change in control event or more than two years following a change in control event or (ii) by the Company other than for cause, disability or death or by the executive for good reason (as defined below) within two years of a change in control event. The consummation of the Merger in February 2007 constituted a change in control event as defined in the executive severance agreements.
“Change in control event” means an event or occurrence set forth in any one or more of paragraphs (a) through (c) below:
(a) the acquisition by an individual, entity or group (within the meaning of Section 13(d)(3) or 14(d)(2) of the Securities Exchange Act of 1934, as amended (the “Exchange Act”)) (a “Person”) of beneficial ownership of any capital stock of the Company if, after such acquisition, such Person beneficially owns (within the meaning of Rule 13d–3 promulgated under the Exchange Act) more than 50% of either (x) the then–outstanding shares of common stock of the Company (the “Outstanding Company Common Stock”) or (y) the combined voting power of the then–outstanding securities of the Company entitled to vote generally in the election of directors (the “Outstanding Company Voting Securities”); provided, however, that for purposes of this paragraph (a), the following acquisitions shall not constitute a Change in Control Event: (i) any acquisition directly from the Company (excluding an acquisition pursuant to the exercise, conversion or exchange of any security exercisable for, convertible into or exchangeable for common stock or voting securities of the Company, unless the Person exercising, converting or exchanging such security acquired such security directly from the Company or an underwriter or agent of the Company), (ii) any acquisition by any employee benefit plan (or related trust) sponsored or maintained by the Company or any corporation controlled by the Company, or (iii) any acquisition by any company pursuant to a Business Combination (as defined below) which complies with clauses (i) and (ii) of paragraph (c) below; or
(b) such time as the Continuing Directors (as defined below) do not constitute a majority of the Board (or, if applicable, the Board of Directors of a successor corporation to the Company), where the term “Continuing Director” means at any date a member of the Board (x) who was a member of the Board on the date of this Agreement or (y) who was nominated or elected subsequent to such date by at least two–thirds of the directors who were Continuing Directors at the time of such nomination or election or whose election to the Board was recommended or endorsed by at least two–thirds of the directors who were Continuing Directors at the time of such nomination or election; provided, however, that there shall be excluded from this clause (y) any individual whose initial assumption of office occurred as a result of an actual or threatened election contest with respect to the election or removal of directors or other actual or threatened solicitation of proxies or consents, by or on behalf of a person other than the Board; or
(c) the consummation of a Merger, consolidation, reorganization, recapitalization or share exchange involving the Company or a sale or other disposition of all or substantially all of the assets of the Company (a “Business Combination”), unless, immediately following such Business Combination, each of the following two conditions is satisfied: (i) all or substantially all of the individuals and entities who were the beneficial owners of the Outstanding Company Common Stock and Outstanding Company Voting Securities immediately prior to such Business Combination beneficially own, directly or indirectly, at least 50% of the then–outstanding shares of common stock and the combined voting power of the then–outstanding securities entitled to vote generally in the election of directors, respectively, of the resulting or acquiring company in such Business Combination (which shall include, without limitation, a company which as a result of such transaction owns the Company or substantially all of the Company’s assets either directly or through one or more subsidiaries) (such resulting or acquiring company is referred to herein as the “Acquiring Company”) in substantially the same proportions as their ownership of the Outstanding Company Common Stock and Outstanding Company Voting Securities, respectively, immediately prior to such Business Combination; and (ii) no Person (excluding any employee benefit plan (or related trust) maintained or sponsored by the Company or by the Acquiring Company) beneficially owns, directly or indirectly, more than 50% of the then–outstanding shares of common stock of the Acquiring Company, or of the combined voting power of the then–outstanding securities of such company entitled to vote generally in the election of directors (except to the extent that such ownership existed prior to the Business Combination).
“Cause” means the executive’s (a) intentional failure to perform his or her reasonably assigned duties, (b) dishonesty or willful misconduct in the performance of his or her duties, (c) involvement in a transaction in connection with the performance of his or her duties to the Company or any of its subsidiaries which transaction is adverse to the interests of the Company or any of its subsidiaries and which is engaged in for personal profit or (d) willful violation of any law, rule or regulation in connection with the performance of his or her duties to the Company or any of its subsidiaries (other than traffic violations or similar offenses).
“Good reason” is defined as (a) a reduction of more than 5% in the executive’s annual base salary in effect immediately prior to the change in control event or a material reduction in the cash incentive compensation opportunities or other employee benefits available to the executive under the executive compensation plan for the fiscal year in which the change in control event occurs, (b) a material adverse change in the executive’s duties and responsibilities (other than reporting responsibilities) from those in effect immediately prior to the change in control event or (c) a requirement that the officer relocate his or her principal place of business to a location that is in excess of 50 miles from his or her principal place of business immediately prior to the change in control event. The Merger constituted a change in control event.
Upon a termination by the Company other than for cause, disability or death prior to a change in control event or more than two years following a change in control event; an executive is generally entitled, in addition to earned but unpaid compensation, to the following:
| | ● | cash severance in the form of continued payment of his or her base salary, in accordance with regular payroll practices, for the following periods: (1) in the case of the Chief Executive Officer, two years; (2) in the case of the Chief Financial Officer and Chief Administrative Officer, 18 months; (3) in the case of Executive Vice Presidents and Senior Vice Presidents, one year; and (4) in the case of Vice Presidents, six months; |
| | | ● | a one time payment of his or her incentive award target under the management compensation plan, pro rata based on the number of days of that fiscal year for which he or she was terminated; and |
| | | ● | a continuation of medical and dental benefits for the period of time during which severance will be paid or until the executive is eligible to receive such benefits from another employer, whichever is earlier. |
Upon a termination by the Company other than for cause, disability or death by the executive for good reason within two years of a change in control event, an executive is generally entitled, in addition to earned but unpaid compensation, to the following:
| | | ● | cash severance in the form of a one-time payment of the following amount: (1) in the case of the Chief Executive Officer, 200% of the sum of his base salary plus his incentive award target under the management compensation plan; (2) in the case of the Chief Financial Officer and the Chief Administrative Officer, 150% of the sum of his or her base salary and his or her incentive award target under the management compensation plan; (3) in the case of Executive Vice Presidents and Senior Vice Presidents, 100% of the sum of his or her base salary plus his or her incentive award target under the management compensation plan; and (4) in the case of Vice Presidents, the sum of 50% of his or her base salary plus 100% of his or her incentive award target under the management compensation plan; |
| | | ● | a one-time payment of his or her incentive award target under the executive compensation plan, pro rated based on the number of days of that fiscal year for which he or she was terminated; and |
| | | ● | a continuation of medical and dental benefits and all other employee benefits for the period of time during which severance will be paid or until the executive is eligible to receive such benefits from another employer, whichever is earlier. The Agreements provide for certain severance benefits to the executive in the event his or her employment is terminated under specified circumstances, as well as certain benefits upon a change in control event. |
The executive severance agreements also provided for accelerated vesting of stock options and restricted shares and specialized treatment of performance shares awards upon a change in control event. As the Merger constituted a change in control event, all of such awards were cancelled in exchange for cash payments in 2007.
As partial consideration for the benefits provided under the executive severance agreements, the executive is bound by a confidentiality agreement as well as non-compete and non-solicitation provisions included in the executive severance agreements. The non-compete provision prohibits the executive from engaging in or being affiliated with any business which is competitive with the Company while employed by the Company and for a period of two years after the termination of such employment for any reason. The non-solicitation provision prohibits the executive, either alone or in association with others, from soliciting any employee of the Company to leave the employ of the Company unless such individual’s employment with the Company has been terminated for a period of six months or longer. In addition, the executive’s receipt of the severance benefits would be contingent upon the executive signing a customary general release of claims against the Company.
In connection with the Merger, Madison Dearborn agreed that if any executive committee officer is terminated without “cause” (as defined in the executive severance agreements) within the two years following the Merger, and as a result becomes subject to an excise tax under Section 4999 of the Code, the Board of Directors and the executive will in good faith determine the amount of any payment to be made to such Executive Committee officer to offset in whole or in part the cost of such excise tax, provided that in no event will the aggregate of all such payments made to all executive committee officers exceed $2 million.
Additionally, if following an initial public offering of the Company, Holdings or Parent’s equity securities, a change in “the ownership or effective control” or “a substantial portion of the assets” occurs within the meaning of Section 280G of the Code of the company whose equity securities are offered in the initial public offering, the Company will pay to the executive committee officers an amount that, on an after-tax basis, equals any excise tax payable by such officer pursuant to Section 4999 of the Code, by reason of any entitlements that are described in Section 280G(b)(2)(A)(i) of the Code, to the extent such entitlements result from such change in control event.
Repurchase of Class A, Class B and Class C common units upon Termination of Employment
Certain members of our management team hold Class A, Class B and/or Class C common units under our Management Equity Plan. The terms of the Management Equity Plan and the individual award documents issued thereunder provide various rights in the event of a termination of employment.
Class A Unit Repurchase. Pursuant to the Class A unit purchase agreements issued in connection with the Merger-Related Class A Units, if, at any time prior to the second anniversary of the date of such agreement the executive is terminated by the Company without “cause” or the executive resigns for “good reason” (each as defined in the unit purchase agreement), the executive may elect to require the Company to repurchase all, but not less than all, of the executive’s Class A common units pursuant to the terms of a “put option.” The purchase price for the repurchased Class A common units is the original cost of such units paid by the executive. Original cost for units purchased in connection with the merger transactions was $101.22 per Class A common unit. The two year term of this “put option” expired in February 2009 and no such put options remain applicable. With respect to the Post-Merger Class A Units, in the event the executive ceases to be employed by the Company for any reason, all Class A common units shall be subject to repurchase at the Company’s option as more fully set forth in the unit purchase agreement. The purchase price for each Class A common unit shall be the Fair Market Value of such unit as determined in good faith by the Board in its sole discretion in accordance with the provisions of the applicable equity documents.
Class B Unit Repurchase. Pursuant to the Class B unit purchase agreement, in the event the executive ceases to be employed by the Company for any reason, all Class B common units shall be subject to repurchase at the Company’s option. In the event of a termination of employment, (i) the purchase price for each unvested Class B common unit shall be the lesser of (A) executive’s “original cost” for such unvested unit and (B) the Fair Market Value (as defined below) of such unvested unit as of the date of repurchase, and (ii) the purchase price for each vested Class B common unit shall be the Fair Market Value of such vested unit as of the date of repurchase; provided, however, if Executive employment is terminated with Cause (as defined in the unit purchase agreement), the purchase price for each Class B common unit (whether vested or not) shall be the lesser of (A) executive’s original cost for such unit and (B) the Fair Market Value of such unit as of the date of repurchase. The original cost for all of the outstanding Class B common units was $1.00 per unit. “Fair Market Value” of any unit will be determined in good faith by the Board in its sole discretion in accordance with the provisions of the applicable equity documents.
Class C Unit Repurchase. Pursuant to the Class C unit grant agreement, in the event the executive ceases to be employed by the Company for any reason, all vested Class C common units shall be subject to repurchase at the Company’s option. All unvested Class C units shall be automatically canceled without payment of any consideration therefore. In the event of a termination of employment, the purchase price for each vested Class C common unit shall be the Fair Market Value of such vested unit as of the date of repurchase; provided, however, if Executive employment is terminated with Cause (as defined in the unit grant agreement), all Class C units whether vested or not shall be automatically canceled without payment of any consideration therefore. “Fair Market Value” of any unit will be determined in good faith by the Board in its sole discretion in accordance with the provisions of the applicable equity documents.
Acceleration of Class B and Class C Units. If the executive’s employment is terminated as a result of death or disability, an additional amount of Class B, Class C common and performance units equal to the lesser of (i) twenty percent (20%) of the aggregate number of units held by the executive and (ii) the remainder of executive’s unvested units, shall automatically become vested units. In addition, upon the occurrence of a Sale of the Company (as defined in the unit purchase agreement), on or prior to the fifth anniversary of the date of the unit purchase agreement, all unvested Class B and Class C common units, with the exception of Class C Performance Units, shall become vested units so long as the executive is, and has been continuously, employed by the Company from the date of the unit purchase agreement, or unit grant agreement, as the case may be, through the date on which such Sale of the Company occurs. With respect to the Class C Performance Units upon a sale of the Company (i) all time-vesting units which have not yet become vested time vesting units shall become vested time vesting units and (ii) any Performance Units which have not yet become vested Performance – Vesting Units may become vested performance vesting units as determined by the Board in its sole discretion.
Treatment of Units upon Sale of the Company.
In the event a “Sale of the Company” (as defined below) occurs, all unvested Class B and Class C common units vest automatically, and each holder of Class A common units, Class B common units and Class C common units (including unvested Class B and Class C common units) shall receive in exchange for such units an amount equal to the amount that such holder would have received in a complete liquidation of Holdings LLC (after satisfaction or assumption of all debts and liabilities, and in the case of Class C units taking into account the applicable participation thresholds) in accordance the terms of Holdings LLC’s Limited Liability Company Agreement. In addition, each unit holder will bear his pro rata share of the expenses incurred in connection with the Sale of the Company.
“Sale of the Company”, as defined in the Limited Liability Company Agreement, means the sale of Yankee Group (or the Company) to an independent third party or group of independent third parties pursuant to which such party or parties acquire (i) equity securities of Yankee Group (or the Company) possessing the voting power to elect a majority of the Board (or the board of directors of the Company) (whether by merger, consolidation or sale or transfer of Yankee Group or the Company’s equity securities) or (ii) all or substantially all of Yankee Group’s or the Company’s assets, in each case determined on a consolidated basis; provided that the term “Sale of the Company” shall not include a public offering.
Director Compensation
The following table sets forth the compensation of the named directors during fiscal 2012:
Name (a) | | Fees Earned or Paid in Cash ($) (b) | | | Stock Awards ($) (c) (1) | | | Total ($) (h) | |
| Robin P. Selati | | $ | - | | | $ | - | | | $ | - | |
| Terry Burman | | $ | 73,304 | | | $ | - | | | $ | 73,304 | |
| Richard H. Copans | | $ | - | | | $ | - | | | $ | - | |
| Thomas T. Macejko, Jr. | | $ | - | | | $ | - | | | $ | - | |
| Frank Bifulco, Jr. | | $ | 41,495 | | | $ | 63,172 | | | $ | 104,667 | |
| Trudy Sullivan | | $ | 59,148 | | | $ | - | | | $ | 59,148 | |
| | (1) | Mr. Burman holds 2,070 Class C Common Units, but received no grants in 2012. Ms. Sullivan holds 1,812 Class C Common Units, but received no grants in 2012. Mr. Bifulco was granted 2,159 Class C Common Units in 2012. |
Overview of Director Compensation
As of December 29, 2012, our Board of Managers consisted of Robin P. Selati, Terry Burman, Richard H. Copans, Thomas T. Macejko, Jr., Trudy Sullivan, Frank Bifulco, Craig W. Rydin and Harlan M. Kent. Messrs. Selati, Macejko and Copans are affiliates of Madison Dearborn (“Madison Dearborn Managers”). Mr. Rydin is the former Chief Executive Officer of the Company and was an employee through October 2010, and Mr. Kent is an employee of the Company (Messrs. Rydin and Kent are collectively the “Management Managers”). Mr. Burman, Mr. Bifulco and Ms. Sullivan are independent managers.
Under the Director Compensation Plan adopted by the Compensation Committee, which is reviewed annually, neither Madison Dearborn Managers nor Management Managers are entitled to fees or equity compensation for their services as directors. The Director Compensation Plan provides for compensation for independent managers (defined as those who are neither Madison Dearborn Managers nor Management Managers) consisting of the following elements: (i) a base annual retainer of $45,000, (ii) board and/or committee meeting fees of $1,500 per meeting attended in person and $750 per meeting participated in via telephone, and (iii) an equity award designed to provide a target net equity value of $500,000 based upon a liquidation value model approved by the Compensation Committee. Pursuant to this Director Compensation Plan, Mr. Burman received a grant of 2,070 Class C common units effective as of June 27, 2008, Ms. Sullivan received a grant of 1,812 Class C common units effective as of September 29, 2010 and Mr. Bifulco received a grant of 2,159 Class C common units effective March 30, 2012. Mr. Burman, Ms. Sullivan and Mr. Bifulco also receive an annual retainer and board meeting fees as set forth above.
All of our directors are reimbursed for out-of-pocket expenses incurred in connection with attending all board and other committee meetings.
Compensation Committee Interlocks and Insider Participation
None of the Compensation Committee members were officers or employees of the Company or its subsidiaries. No executive officer of the Company has served as a member of the Board of Directors or Compensation Committee of another entity, one of whose executive officers served as a member of the Board of Directors or Compensation Committee of the Company.
| ITEM 12. | SECURITY OWNERSHIP OF CERTAIN BENEFICIAL OWNERS AND MANAGEMENT RELATED STOCKHOLDER MATTERS |
We are an indirect, wholly-owned subsidiary of Yankee Group. On February 8, 2011, all then-existing equity interests in YCC Holdings, LLC, were exchanged for identical equity interests in Yankee Candle Investments LLC. In June 2011, all then-existing equity interests in Yankee Candle Investments LLC were exchanged for identical equity interests in Yankee Group. YCC Holdings, LLC was capitalized in connection with the 2007 Merger with approximately $433.1 million of equity capital in the form of Class A and Class B common units. As of February 1, 2013, Yankee Group had 4,266,486 Class A Units, 260,993 Class B Units and 147,648 Class C Units outstanding. The following table sets forth information with respect to the beneficial ownership of the capital stock of Yankee Group by:
| | | ● | each person known to us to beneficially hold five percent or more of Yankee Group’s equity; |
| | | ● | each member of the board of managers of Yankee Group; |
| | | ● | each of our named executive officers; and |
| | | ● | all of our executive officers and directors as a group. Except as noted below, the address for each of the directors and Named Executive Officers is c/o The Yankee Candle Company, 16 Yankee Candle Way, South Deerfield, Massachusetts 01373. |
Beneficial ownership has been determined in accordance with the applicable rules and regulations promulgated under the Exchange Act. None of the equity units listed in the table are pledged as security pursuant to any pledge arrangement or agreement.
| | | Class A Common Units | | | Class B Common Units | | | Class C Common Units | | | Total Voting Percent (1) (2) | |
Principal Stockholders: | | Number | | | Percent of Class | | | Number (1) | | | Percent of Class | | | Number (1) | | | Percent of Class | |
| | | | | | | | | | | | | | | | | | | | | | |
| Madison Dearborn (3) | | | 4,233,353 | | | | 99.2 | % | | | - | | | | - | | | | - | | | | - | | | | 92.3 | % |
| | | | | | | | | | | | | | | | | | | | | | | | | | | | | |
| Directors and Named Executive Officers: | | | | | | | | | | | | | | | | | | | | | | | | | | | | |
| Harlan M. Kent | | | 2,692 | | | | * | | | | 71,235 | | | | 27.3 | % | | | 21,041 | | | | 34.9 | % | | | 2.1 | % |
| Lisa K. McCarthy | | | 39 | | | | * | | | | 950 | | | | * | | | | 3,211 | | | | 5.4 | % | | | * | |
| James A. Perley | | | 2,729 | | | | * | | | | 23,745 | | | | 9.1 | % | | | 1,899 | | | | 3.2 | % | | | * | |
| Brad H. Wolansky | | | 76 | | | | * | | | | - | | | | - | | | | 2,941 | | | | 4.9 | % | | | * | |
| Nathel John Fontana, III | | | - | | | | - | | | | - | | | | - | | | | - | | | | - | | | | * | |
| Craig W. Rydin | | | 22,772 | | | | * | | | | 74,121 | | | | 28.4 | % | | | - | | | | - | | | | 2.1 | % |
| Terry Burman | | | 46 | | | | * | | | | - | | | | - | | | | 2,070 | | | | 3.5 | % | | | * | |
| Trudy Sullivan | | | 39 | | | | * | | | | - | | | | - | | | | 909 | | | | 1.5 | % | | | * | |
| Frank Bifulco | | | 25 | | | | * | | | | - | | | | - | | | | 478 | | | | * | | | | * | |
| Robin P. Selati (3) | | | 4,233,353 | | | | 99.2 | % | | | - | | | | - | | | | - | | | | - | | | | 92.3 | % |
| Richard H. Copans (3) | | | - | | | | - | | | | - | | | | - | | | | - | | | | - | | | | - | |
| Thomas T. Macejko, Jr. (3) | | | - | | | | - | | | | - | | | | - | | | | - | | | | - | | | | - | |
| All Directors and Executive Officers as a group (19 persons) | | | 4,265,784 | | | | 99.9 | % | | | 229,651 | | | | 83.7 | % | | | 49,048 | | | | 78.1 | % | | | 99.0 | % |
* Denotes less than one percent.
| (1) | This amounts set forth in this column for each applicable individual represent the number of Class B and Class C common units vested as of February 1, 2013, plus the number of Class B or Class C common units that are scheduled to vest within 60 days of such date. Class B and Class C common units vest on a daily basis. Unvested Class B and Class C common units are not included in this column as such unvested units do not provide the holder with voting or dispositive power. For more information about the terms of the Class B and Class C common units see “— Certain Relationships and Related Transactions and Director Independence.” |
| (2) | The Class A, Class B and Class C common units vote together as a single class. The unvested Class B and Class C common units do not have voting rights. Pursuant to Holdings LLC’s limited liability company agreement, action of the members can be taken by the affirmative vote of a majority of the common units entitled to vote. For purposes of determining percentage of voting power, each person’s percentage represents such person’s percentage of the shares entitled to vote and excludes the unvested Class B and Class C common units. |
| (3) | Madison Dearborn Capital Partners V–A, L.P. (“MDP V–A”) is the direct beneficial owner of 3,319,416 Class A Units, Madison Dearborn Capital Partners V–C, L.P. (“MDP V–C”) is the direct beneficial owner of 880,584 Class A Units and Madison Dearborn Capital Partners V Executive–A, L.P. (“MDP Executive”) is the direct beneficial owner of 33,353 Class A Units. Madison Dearborn Partners V–A&C, L.P. (“MDP A&C”) is the general partner of MDP V–A, MDP V–C and MDP Executive. Madison Dearborn Partners LLC (“MDP LLC”) is the general partner of MDP A&C and Robin P. Selati is a managing director of MDP LLC. Paul J. Finnegan and Samuel M. Mencoff are the sole members of a limited partner committee of MDP A&C that have the power, acting by majority vote, to vote or dispose of the shares directly held by MDP V–A, MDP V–C and MDP Executive. Messrs. Finnegan and Mencoff, MDP A&C and MDP LLC each hereby disclaims any beneficial ownership of any shares directly held by MDP V–A, MDP V–C and MDP Executive. Each of Messrs. Selati, Macejko and Copans are employed by MDP LLC and disclaim beneficial ownership of the Class A Units held by MDP V–A, MDP V–C and MDP Executive except to the extent of his pecuniary interest therein. The address for MDP V-A, MDP V-C, MDP Executive, MDP A&C, MDP LLC and Messrs. Selati, Copans and Macejko is c/o Madison Dearborn Partners, LLC, Three First National Plaza, Suite 4600, 70 West Madison Street, Chicago, Illinois 60602. |
Securities Authorized for Issuance Under Equity Compensation Plans
The following table provides information as of February 2, 2013, with respect to our common units that may be issued under our existing equity compensation plans.
| Plan Category | Number of securities to be issued upon exercise of outstanding options, warrants and rights (a) | Weighted average exercise price of outstanding options, warrants and rights (b) | Number of securities remaining available for future issuance under equity compensation plans (excluding securities reflected in column (a)) (c) |
Equity compensation plans approved by security holders | _ | _ | _ |
| Equity compensation plans not approved by security holders - Yankee Group’s Incentive Compensation Equity Plan | | | |
| Class B common units | _ | _ | 66,256 |
| Class C common units | _ | _ | 66,256 |
Yankee Group’s Incentive Equity Plan provides for the issuance of 474,897 Class B common units, The Company authorized a new class of units, Class C common units, in October 2007, which are available for issuance under the Incentive Equity Plan. Any issuance of Class C common units reduces the amount of Class B common units available for future grant.
| ITEM 13. | CERTAIN RELATIONSHIPS AND RELATED TRANSACTIONS AND DIRECTOR INDEPENDENCE |
Payments to Madison Dearborn
In connection with the Merger, we entered into a management services agreement with an affiliate of Madison Dearborn pursuant to which they will provide us with management and consulting services and financial and other advisory services. Pursuant to such agreement, they receive an aggregate annual management fee of $1.5 million and reimbursement of out-of-pocket expenses incurred in connection with the provision of such services. The management services agreement includes customary indemnification provisions in favor of the affiliates of Madison Dearborn.
Limited Liability Company Agreement and Unitholders Agreement
The Class A, Class B and Class C common units were issued to the Company’s executive officers under the Yankee Group Incentive Equity Plan, as amended. The rights and obligations of Yankee Group and the holders of its Class A, Class B and Class C common units are generally set forth in Yankee Group’s limited liability company agreement, Yankee Group’s unitholders agreement and the Class A, Class B and Class C unit agreements, copies of which are filed as exhibits with the SEC.
Holders of the Class A, Class B and Class C common units are entitled to one vote per Class A common unit and one vote per vested Class B and Class C common unit held on all matters submitted to a vote of unitholders. The unitholders are entitled to allocations of profits and losses (as such terms are defined in the limited liability company agreement) of Yankee Group and to distributions of cash and other property of Yankee Group as set forth in the limited liability company agreement. Pursuant to the limited liability company agreement, the Class A common units are first entitled to a return of capital. Then the Class B common units are entitled to a return of capital. Thereafter, all Class A, Class B and Class C common units will share in any residual distributions on a pro rata basis.
The Class A, Class B and Class C common units are subject to restrictions on transfer. The Post-Merger Class A common units and the Class B and Class C common units are also subject to the right of Yankee Group or, if not exercised by Yankee Group, Madison Dearborn’s right, to repurchase these common units upon a termination of employment. If an employee’s employment with the Company terminates for any reason other than for cause, vested units can be repurchased at fair market value and unvested units can be repurchased at the lower of original cost and fair market value. Upon a termination for cause, both vested and unvested Class B and Class C common units can be repurchased at the lower of original cost and fair market value.
Yankee Group may issue additional units subject to the terms and conditions of the limited liability agreement. Any units issued will be subject to the transfer restrictions set forth in the limited liability agreement and the unitholders agreement.
If Madison Dearborn seeks to sell all or substantially all of the Company, the Management Investors must consent to the sale and cooperate with Madison Dearborn, which may include selling their securities to the buyer on the terms and at the price negotiated by Madison Dearborn and signing whatever documents are reasonably necessary to consummate the sale.
Prior to an initial public offering, if Madison Dearborn sells a significant portion of its ownership interest in Yankee Group to a third party (disregarding sales in the public market, transfers to its affiliates and certain other exceptions), the Management Investors will have the option (but will not be required to, except in the case of a sale of all or substantially all of the assets of the Company) to participate in the sale and sell alongside Madison Dearborn on a pro rata basis.
Prior to an initial public offering or a sale of all or substantially all of the Company, each Management Investor will be required to vote his or her units in favor of a board of managers consisting of four representatives of Madison Dearborn, Harlan Kent (for so long as he is employed by the Company), and any independent managers appointed by the board of managers.
Class C common units will otherwise have the same general characteristics as Class B common units, including with respect to time vesting and repurchase terms (except that unvested Class C common units are forfeited rather than repurchased as there is no initial capital outlay for the Class C common units). The Company currently anticipates that all future long-term equity incentive grants will be made using Class C common units.
Registration Rights Agreement
In connection with the Merger transactions, certain of the Management Investors and Madison Dearborn entered into a registration agreement with Yankee Group under which Madison Dearborn has the right to require Yankee Group to register any or all of its securities under the Securities Act on Form S–1 or Form S–3, at Yankee Group’s expense. Additionally, certain Management Investors are entitled to request the inclusion of their registrable securities in any registration statement at Yankee Group’s expense whenever Yankee Group proposes to register any offering of its securities.
Director Independence
The Company has no securities listed for trading on a national securities exchange or in an automated inter-dealer quotation system of a national securities association which has requirements that a majority of its board of directors be independent. For purposes of complying with the disclosure requirements of the SEC, the Company has adopted the definition of independence used by The New York Stock Exchange (“NYSE”). Based on the director independence tests set forth in Rule 303A.02 of the NYSE Listing Standards, we believe Mr. Burman and Ms. Sullivan each qualify as an independent director. Note that under Rule 303A.00 of the NYSE Listing Standard, we would be considered a “controlled company” because more than 50% of our voting power is held by another company. Accordingly, even if we were a listed company on NYSE, we would not be required to maintain a majority of independent directors on the Board of Directors.
Related Party Approval Policy
We do not have a formal related party approval policy for transactions required to be disclosed pursuant to Item 404(a) of Regulation S–K. However, it is our policy to comply with the covenant related to transactions with affiliates that is contained in the indentures governing our outstanding notes.
The following table summarizes the fees of Deloitte & Touche LLP, including the member firms of Deloitte Touche Tohmatsu, our independent registered public accounting firm, billed to us for each of the last two fiscal years for audit services and for other professional services:
| Type of Fees | | 2012 | | | 2011 | |
| Audit Fees (1) | | $ | 953,000 | | | $ | 1,256,000 | |
| Audit-Related Fees (2) | | | — | | | | — | |
| Tax Fees (3) | | | — | | | | 36,000 | |
| All Other Fees (4) | | | — | | | | 219,000 | |
| | | | | | | | | |
| Total | | $ | 953,000 | | | $ | 1,511,000 | |
| (1) | In accordance with the applicable SEC definitions and rules, “Audit Fees” are fees billed by Deloitte & Touche LLP for professional services rendered for the audit of the Company’s financial statements for the applicable fiscal year, the audit of the Company’s internal control over financial reporting, and the reviews of the financial statements included in each of the Company’s Quarterly Reports on Form 10-Q during the applicable fiscal year, or any services that are normally provided by the accountant in connection with statutory and regulatory filings or engagements for the applicable fiscal year. |
| (2) | In accordance with the applicable SEC definitions and rules, “Audit-Related Fees” are fees billed by Deloitte & Touche LLP for assurance and related services rendered during the applicable fiscal year that are reasonably related to the performance of the audit or review of the Company’s financial statements, and which are not reported as Audit Fees. |
| (3) | In accordance with the applicable SEC definitions and rules, “Tax Fees” are fees billed by Deloitte & Touche LLP for professional services rendered for tax compliance, tax advice and tax planning. For fiscal 2011 tax fees relate to a transfer pricing study between Yankee Candle Company and Yankee Candle Canada, Inc. |
| (4) | In accordance with the applicable SEC definitions and rules, “All Other Fees” are fees billed by Deloitte & Touche LLP for products and services other than those reported as Audit Fees, Audit-Related Fees or Tax Fees. For fiscal 2011 all other fees related to the review of the Company’s responses associated with an SEC comment letter related to the Company’s S-4 registration statement and amendments thereto. |
Pre-Approval Policies and Procedures
The Audit Committee of the Board of Directors has adopted policies and procedures relating to the approval of all audit and non-audit services that are to be performed by the Company’s independent registered public accounting firm. This policy generally provides that the Company will not engage its independent registered public accounting firm to render audit or non-audit services unless the service is specifically approved in advance by the Audit Committee or the engagement is entered into pursuant to one of the pre-approval procedures described below.
From time to time, the Audit Committee may pre-approve specified types of services that are expected to be provided to the Company by its independent registered public accounting firm during the next 12 months. Any such pre-approval is detailed as to the particular service or type of services to be provided and is also generally subject to a maximum dollar amount.
The Audit Committee has also delegated to the chairman of the Audit Committee the authority to approve any audit or non-audit services to be provided to the Company by its independent registered public accounting firm. Any approval of services by a member of the Audit Committee pursuant to this delegated authority is typically reported on at the next meeting of the Audit Committee.
All of the fees disclosed above with respect to 2012 related to services that were approved by the Audit Committee in accordance with the foregoing pre-approval policies and procedures.
PART IV
| ITEM 15. | EXHIBITS AND FINANCIAL STATEMENT SCHEDULES |
| (a) | Consolidated Financial Statements |
The consolidated financial statements listed below are included in this document under Item 8.
| YCC Holdings LLC |
| Report of Independent Registered Public Accounting Firm |
| Consolidated Balance Sheets |
| Consolidated Statements of Operations |
| Consolidated Statements of Comprehensive Income |
| Consolidated Statements of Changes in Member’s Equity (Deficit) |
| Consolidated Statements of Cash Flows |
| Notes to Consolidated Financial Statements |
| |
| Yankee Holding Corp. |
| Report of Independent Registered Public Accounting Firm |
| Consolidated Balance Sheets |
| Consolidated Statements of Operations |
| Consolidated Statements of Comprehensive Income |
| Consolidated Statements of Changes in Stockholders’ Equity |
| Consolidated Statements of Cash Flows |
| Notes to Consolidated Financial Statements |
See the exhibit index accompanying this filing.
| (c) | Financial Statement Schedules |
All schedules for which provision is made in the applicable regulations of the Securities and Exchange Commission have been omitted because the information is disclosed in the Consolidated Financial Statements or because such schedules are not required or not applicable.
SIGNATURES
Pursuant to the requirements of Section 13 of 15(d) of the Securities Exchange Act of 1934, YCC Holdings LLC has duly caused this report to be signed on its behalf by the undersigned, thereunto duly authorized, on March 29, 2013.
| YCC HOLDINGS LLC | |
| | | |
| By | | /s/ HARLAN M. KENT | |
| | | Harlan M. Kent | |
| | | President and Chief Executive Officer | |
Pursuant to the requirements of the Securities and Exchange Act of 1934, this report has been signed below by the following persons on behalf of YCC Holdings LLC and in the capacities and on the dates noted.
| Signature | | Capacity | | Date |
| | | |
| /s/ HARLAN M. KENT | | Chief Executive Officer (Principal Executive Officer), Manager | | March 29, 2013 |
| Harlan M. Kent | | | | |
| | | |
| /s/ LISA K. MCCARTHY | | Treasurer (Principal Financial and Accounting Officer) | | March 29, 2013 |
| Lisa K. McCarthy | | | | |
| | | |
| /s/ CRAIG W. RYDIN | | Manager | | March 29, 2013 |
| Craig W. Rydin | | |
| | | |
| /s/ ROBIN P. SELATI | | Manager | | March 29, 2013 |
| Robin P. Selati | | | | |
| | | |
| /s/ FRANK P. BIFULCO JR. | | Manager | | March 29, 2013 |
| Frank P. Bifulco Jr. | | | | |
| | | |
| /s/ RICHARD COPANS | | Manager | | March 29, 2013 |
| Richard Copans | | | | |
| | | |
| /s/ TERRY BURMAN | | Manager | | March 29, 2013 |
| Terry Burman | | | | |
| | | | | |
| /s/ TRUDY SULLIVAN | | Manager | | March 29, 2013 |
| Trudy Sullivan | | | | |
| | | | | |
| /s/ THOMAS T. MACEJKO, JR. | | Manager | | March 29, 2013 |
| Thomas T. Macejko Jr. | | | | |
Pursuant to the requirements of Section 13 of 15(d) of the Securities Exchange Act of 1934, Yankee Holding Corp. has duly caused this report to be signed on its behalf by the undersigned, thereunto duly authorized, on March 29, 2013.
| YANKEE HOLDING CORP. | |
| | | |
| By | | /s/ HARLAN M. KENT | |
| | | Harlan M. Kent | |
| | | President and Chief Executive Officer | |
Pursuant to the requirements of the Securities and Exchange Act of 1934, this report has been signed below by the following persons on behalf of Yankee Holding Corp. and in the capacities and on the dates noted.
| Signature | | Capacity | | Date |
| | | |
| /s/ CRAIG W. RYDIN | | Chairman of the Board of Directors | | March 29, 2013 |
| Craig W. Rydin | | | | |
| | | | | |
| /s/ HARLAN M. KENT | | Chief Executive Officer (Principal Executive Officer), Director | | March 29, 2013 |
| Harlan M. Kent | | | | |
| | | |
| /s/ LISA K. MCCARTHY | | Senior Vice President and Chief Financial Officer (Principal Financial and Accounting Officer) | | March 29, 2013 |
| Lisa K. McCarthy | | | | |
| | | |
| /s/ ROBIN P. SELATI | | Director | | March 29, 2013 |
| Robin P. Selati | | | | |
| | | |
| /s/ FRANK P. BIFULCO JR. | | Director | | March 29, 2013 |
| Frank P. Bifulco Jr. | | | | |
| | | |
| /s/ RICHARD COPANS | | Director | | March 29, 2013 |
| Richard Copans | | | | |
| | | |
| /s/ TERRY BURMAN | | Director | | March 29, 2013 |
| Terry Burman | | | | |
| | | | | |
| /s/ TRUDY SULLIVAN | | Director | | March 29, 2013 |
| Trudy Sullivan | | | | |
| | | | | |
| /s/ THOMAS T. MACEJKO, JR. | | Director | | March 29, 2013 |
| Thomas T. Macejko Jr. | | | | |
EXHIBIT INDEX
| EXHIBIT NO. | | DESCRIPTION |
| | |
| 2.1 | | Agreement and Plan of Merger, dated October 24, 2006, among YCC Holdings LLC, Yankee Acquisition Corp. and The Yankee Candle Company, Inc., filed with The Yankee Candle Company’s Form S-4 filed on March 30, 2007 (Reg No. 333-141699) and incorporated herein by reference. |
| | |
| 3.1 | | Amended and Restated Certificate of Incorporation of The Yankee Candle Company, Inc., filed with The Yankee Candle Company’s Form S-4 filed on March 30, 2007 (Reg No. 333-141699) and incorporated herein by reference. |
| 3.2 | | Amended and Restated By-laws of The Yankee Candle Company, Inc., filed with The Yankee Candle Company’s Form S-4 filed on March 30, 2007 (Reg No. 333-141699) and incorporated herein by reference. |
| | |
| 3.3 | | Certificate of Incorporation of Yankee Holding Corp., filed with The Yankee Candle Company’s Form S-4 filed on March 30, 2007 (Reg No. 333-141699) and incorporated herein by reference. |
| | |
| 3.4 | | Certificate of Amendment to the Certificate of Incorporation of Yankee Holding Corp., filed as Exhibit 3.1 to Yankee Holding Corp.’s Form 10-Q for the quarter ended September 29, 2007 filed on November 8, 2007 (Reg No. 333-141699) and incorporated herein by reference. |
| | |
| 3.5 | | By-Laws of Yankee Holding Corp., filed with The Yankee Candle Company’s Form S-4 filed on March 30, 2007 (Reg No. 333-141699) and incorporated herein by reference. |
| | |
| 3.6 | | Certificate of Formation of Yankee Candle Admin LLC, filed with The Yankee Candle Company’s Form S-4 filed on March 30, 2007 (Reg No. 333-141699) and incorporated herein by reference. |
| | |
| 3.7 | | Operating Agreement of Yankee Candle Admin LLC, filed with The Yankee Candle Company’s Form S-4 filed on March 30, 2007 (Reg No. 333-141699) and incorporated herein by reference. |
| | |
| 3.8 | | Certificate of Incorporation of Yankee Candle Restaurant Corp., filed with The Yankee Candle Company’s Form S-4 filed on March 30, 2007 (Reg No. 333-141699) and incorporated herein by reference. |
| | |
| 3.9 | | By-Laws of Yankee Candle Restaurant Corp., filed with The Yankee Candle Company’s Form S-4 filed on March 30, 2007 (Reg No. 333-141699) and incorporated herein by reference. |
| | |
| 3.10 | | Certificate of Incorporation of Quality Gift Distributors, Inc., filed with The Yankee Candle Company’s Form S-4 filed on March 30, 2007 (Reg No. 333-141699) and incorporated herein by reference. |
| | |
| 3.11 | | By-Laws of Quality Gift Distributors, Inc., filed with The Yankee Candle Company’s Form S-4 filed on March 30, 2007 (Reg No. 333-141699) and incorporated herein by reference. |
| | |
| 3.12 | | Certificate of Incorporation of Yankee Finance, Inc., filed with YCC Holidngs LLC’s Form S-4 filed on April 14, 2011 (Reg No. 333-173505) and incorporated herein by reference. |
| | |
| 3.13 | | Bylaws of Yankee Finance, Inc., filed with YCC Holdings LLC’s Form S-4 filed on April 14, 2011 (Reg No. 333-173505) and incorporated herein by reference. |
| | |
| 3.14 | | Certificate of Formation of YCC Holdings LLC, filed with The Yankee Candle Company’s Form S-4 filed on March 30, 2007 (Reg No. 333-141699) and incorporated herein by reference. |
| | |
| 3.15 | | Limited Liability Company Agreement of YCC Holdings LLC, dated as of February 6, 2007, by and among the initial members identified therein, filed with The Yankee Candle Company’s Form S-4 filed on March 30, 2007 (Reg No. 333-141699) and incorporated herein by reference. |
| 3.16 | | Certificate of Incorporation of Yankee Candle Brand Management, Inc. |
| | |
| 3.17 | | By-Laws of Yankee Candle Brand Management, Inc. |
| | |
| 4.1 | | Senior Note Indenture, dated as of February 6, 2007, among Yankee Acquisition Corp., Yankee Holding Corp. and HSBC BANK, USA, NATIONAL ASSOCIATION, as Trustee, filed with The Yankee Candle Company’s Form S-4 filed on March 30, 2007 (Reg No. 333-141699) and incorporated herein by reference. |
| | | |
| 4.2 | | Senior Note Supplemental Indenture, dated February 6, 2007, among The Yankee Candle Company, Inc., Yankee Candle Admin LLC, Yankee Candle Restaurant Corp., Quality Gift Distributors, Inc. and Aroma Naturals, Inc. and HSBC BANK, USA, NATIONAL ASSOCIATION, as Trustee, filed with The Yankee Candle Company’s Form S-4 filed on March 30, 2007 (Reg No. 333-141699) and incorporated herein by reference. |
| | |
| 4.3 | | Senior Note Notation of Guaranty, dated February 6, 2007, among Yankee Candle Admin LLC, Yankee Candle Restaurant Corp., Quality Gift Distributors, Inc. and Aroma Naturals, Inc., filed with The Yankee Candle Company’s Form S-4 filed on March 30, 2007 (Reg No. 333-141699) and incorporated herein by reference. |
| | | |
| 4.4 | | Senior Note Notation of Guaranty, dated February 6, 2007 of Yankee Holding Corp., filed with The Yankee Candle Company’s Form S-4 filed on March 30, 2007 (Reg No. 333-141699) and incorporated herein by reference. |
| | |
| 4.5 | | Senior Subordinated Note Indenture, dated as of February 6, 2007, among Yankee Acquisition Corp., Yankee Holding Corp. and HSBC BANK, USA, NATIONAL ASSOCIATION, as Trustee, filed with The Yankee Candle Company’s Form S-4 filed on March 30, 2007 (Reg No. 333-141699) and incorporated herein by reference. |
| | |
| 4.6 | | Senior Subordinated Note Supplemental Indenture, dated February 6, 2007, among The Yankee Candle Company, Inc., Yankee Candle Admin LLC, Yankee Candle Restaurant Corp., Quality Gift Distributors, Inc. and Aroma Naturals, Inc. and HSBC BANK, USA, NATIONAL ASSOCIATION, as Trustee, filed with The Yankee Candle Company’s Form S-4 filed on March 30, 2007 (Reg No. 333-141699) and incorporated herein by reference. |
| | |
| 4.7 | | Senior Subordinated Note Notation of Guaranty, dated February 6, 2007, among Yankee Candle Admin LLC, Yankee Candle Restaurant Corp., Quality Gift Distributors, Inc. and Aroma Naturals, Inc., filed with The Yankee Candle Company’s Form S-4 filed on March 30, 2007 (Reg No. 333-141699) and incorporated herein by reference. |
| | |
| 4.8 | | Form of Senior Note (attached as exhibit to Exhibit 4.1), filed with The Yankee Candle Company’s Form S-4 filed on March 30, 2007 (Reg No. 333-141699) and incorporated herein by reference. |
| | |
| 4.9 | | Form of Senior Subordinated Note (attached to Exhibit 4.5), filed with The Yankee Candle Company’s Form S-4 filed on March 30, 2007 (Reg No. 333-141699) and incorporated herein by reference. |
| | |
| 4.10 | | Second Supplemental Indenture, dated as of August 21, 2007, by and among The Yankee Candle Company, Inc and the guarantors listed therein and HSBC Bank USA N.A., as trustee relating to the 9 3 / 4 % Senior Subordinated Notes due 2017, filed as Exhibit 4.1 to Yankee Holding Corp.’s Form 10-Q for the quarter ended September 29, 2007 filed on November 8, 2007 (Reg No. 333-141699) and incorporated herein by reference. |
| | |
| 4.11 | | Second Supplemental Indenture, dated as of August 21, 2007, by and among The Yankee Candle Company, Inc and the guarantors listed therein and HSBC Bank USA N.A., as trustee 8 1 / 2 % Senior Notes due 2017, filed as Exhibit 4.2 to Yankee Holding Corp.’s Form 10-Q for the quarter ended September 29, 2007 filed on November 8, 2007 (Reg No. 333-141699) and incorporated herein by reference. |
| 4.12 | | Third Supplemental Indenture, dated as of January 31, 2011, by and among The Yankee Candle Company, Inc and the guarantors listed therein and HSBC Bank USA N.A., as trustee relating to the 9 3/4 % Senior Subordinated Notes due 2017, filed as Exhibit 4.1 to Yankee Holding Corp.’s Form 8-K filed on February 3, 2011 (Reg No. 333-141699) and incorporated herein by reference. |
| | |
| 4.13 | | Third Supplemental Indenture, dated as of January 31, 2011, by and among The Yankee Candle Company, Inc and the guarantors listed therein and HSBC Bank USA N.A., as trustee relating to the 8 1/2 % Senior Notes due 2017, filed as Exhibit 4.2 to Yankee Holding Corp.’s Form 8-K filed on February 3, 2011 (Reg No. 333-141699) and incorporated herein by reference. |
| | | |
| 4.14 | | Indenture, dated as of February 9, 2011, among YCC Holdings LLC, Yankee Finance, Inc. and HSBC BANK USA, NATIONAL ASSOCIATION, as Trustee, filed with Yankee Holding Corp.'s Form 8-K filed on February 10, 2011(Reg. No. 333-141699) and incorporated herein by reference. |
| | |
| 4.15 | | Form of Senior Note due 2016 (attached to Exhibit 4.14), filed with Yankee Holding Corp.’s Form 8-K filed on February 10, 2011 (Reg. No. 333-141699) and incorporated herein by reference. |
| | | |
| 4.16 | | Fourth Supplemental Indenture, dated as of March 2, 2012, among The Yankee Candle Company, Inc., Yankee Candle Restaurant Corp., Yankee Candle Admin LLC, Yankee Candle Brand Management, Inc. and HSBC Bank, USA National Association. |
| | | |
| 10.1 | | Credit Agreement, dated as of February 6, 2007, among Yankee Acquisition Corp., Yankee Holding Corp., The Yankee Candle Company, Inc., the lenders party thereto, Lehman Commercial Paper Inc., Sovereign Bank, Wells Fargo Retail Finance, LLC, Lehman Brothers Inc. and Merrill Lynch, Pierce, Fenner & Smith Incorporated, filed with YCC Holdings’ Form S-4/A filed on July 1, 2011 (Reg. No. 333-173505) and incorporated herein by reference. |
| | |
| 10.2 | | Guarantee and Collateral Agreement, dated as of February 6, 2007 among Lehman Commercial Paper Inc., Yankee Holding Corp., Yankee Acquisition Corp., The Yankee Candle Company, Inc., Merrill Lynch Capital Corporation, Sovereign Bank, Wells Fargo Retail Finance, LLC, Lehman Brothers Inc. and Merrill Lynch, Pierce, Fenner & Smith Incorporated, filed with The Yankee Candle Company’s Form S-4 filed on March 30, 2007 (Reg No. 333-141699) and incorporated herein by reference. |
| | |
| 10.3 | | Term Loan Promissory Note, dated February 6, 2007, by the Borrowers party thereto, in favor of Sovereign Bank, filed with The Yankee Candle Company’s Form S-4 filed on March 30, 2007 (Reg No. 333-141699) and incorporated herein by reference. |
| | | |
| 10.4 | | Term Loan Promissory Note, dated February 6, 2007, by the Borrowers party thereto, in favor of Citizens Bank of Massachusetts, filed with The Yankee Candle Company’s Form S-4 filed on March 30, 2007 (Reg No. 333-141699) and incorporated herein by reference. |
| | |
| 10.5 | | Term Loan Promissory Note, dated February 6, 2007, by the Borrowers party thereto, in favor of CIT, filed with The Yankee Candle Company’s Form S-4 filed on March 30, 2007 (Reg No. 333-141699) and incorporated herein by reference. |
| | | |
| 10.6 | | Revolving Credit Note, dated February 6, 2007, by the Borrowers party thereto, in favor of Sovereign Bank, filed with The Yankee Candle Company’s Form S-4 filed on March 30, 2007 (Reg No. 333-141699) and incorporated herein by reference. |
| | |
| 10.7 | | Revolving Credit Note, by the Borrowers party thereto, in favor of Citizens Bank of Massachusetts, filed with The Yankee Candle Company’s Form S-4 filed on March 30, 2007 (Reg No. 333-141699) and incorporated herein by reference. |
| | |
| 10.8 | | Credit Agreement, dated as of April 2, 2012, by and among The Yankee Candle Company, Inc., Yankee Holding Corp., certain of The Yankee Candle Company, Inc.’s domestic subsidiaries, the lenders party thereto, Bank of America, N.A., as administrative agent, Barclays Bank PLC, as syndication agent, and Bank of America, N.A., and Barclays Bank PLC, as joint lead arrangers and joint book runners, filed with YCC Holdings LLC’s Form 8-K filed on April 11, 2012 (Reg. No. 333-173505) and incorporated herein by reference. |
| | |
| 10.9 | | Credit Agreement, dated as of April 2, 2012, by and among The Yankee Candle Company, Inc., Yankee Holding Corp., certain of the Yankee Candle Company, Inc.’s subsidiaries, Bank of America, N.A., as agent, the other lenders party thereto, Barclays Bank PLC, as syndication agent, U.S. Bank National Association and Wells Fargo Capital Finance LLC, as co-documentation agents, and Merrill Lynch, Pierce, Fenner & Smith Incorporated and Barclays Bank PLC, as joint lead arrangers and joint book runners, filed with YCC Holdings LLC’s Form 8-K filed on April 11, 2012 (Reg. No. 333-173505) and incorporated herein by reference. |
| | |
| 10.10 | | Amended and Restated Employment Agreement, dated March 4, 2009, between The Yankee Candle Company, Inc. and Craig W. Rydin, filed with Yankee Holding Corp.’s Form 8-K filed on March 5, 2009 (Reg No. 333-141699) and incorporated herein by reference. |
| | | |
| 10.11 | | Employment Agreement dated March 4, 2009, between The Yankee Candle Company, Inc. and Harlan Kent, filed with Yankee Holding Corp.’s Form 8-K filed on March 5, 2009 (Reg No. 333-141699) and incorporated herein by reference. |
| | |
| †10.12 | | Form of Class A Unit Exchange Agreement (executive committee), filed with YCC Holdings’ Form S-4 filed on April 14, 2011 (Reg. No. 333-173505) and incorporated herein by reference . |
| | |
| †10.13 | | Form of Class A Unit Exchange Agreement (non-executive committee), filed with YCC Holdings’ Form S-4 filed on April 14, 2011 (Reg. No. 333-173505) and incorporated herein by reference. |
| | |
| †10.14 | | Form of Class A Unit Exchange Agreement (director form), filed with YCC Holdings’ Form S-4 filed on April 14, 2011 (Reg. No. 333-173505) and incorporated herein by reference. |
| | |
| †10.15 | | Form of Class B Executive Unit Exchange Agreement (executive committee), filed with YCC Holdings’ Form S-4 filed on April 14, 2011 (Reg. No. 333-173505) and incorporated herein by reference. |
| | |
| †10.16 | | Form of Class B Executive Unit Exchange Agreement (non-executive committee), filed with YCC Holdings’ Form S-4 filed on April 14, 2011 (Reg. No. 333-173505) and incorporated herein by reference. |
| | |
| +†10.17 | | Unitholders Agreement, dated February 6, 2007, by and among YCC Holdings LLC, Madison Dearborn Capital Partners V-A, L.P., Madison Dearborn Capital Partners C-A, L.P., Madison Dearborn Capital Partners V Executive-A, L.P., and each of the other persons listed therein, filed with YCC Holdings’ Form S-4 filed on April 14, 2011 (Reg. No. 333-173505) and incorporated herein by reference. |
| | |
| 10.18 | | Management Services Agreement, dated as of February 6, 2007, by and between the Yankee Candle Company, Inc. and Madison Dearborn Partners V-B, L.P., filed with The Yankee Candle Company’s Form S-4 filed on March 30, 2007 (Reg No. 333-141699) and incorporated herein by reference. |
| | |
| †10.19 | | Form of Class C Unit Exchange Agreement (executive committee), filed with YCC Holdings’ Form S-4 filed on April 14, 2011 (Reg. No. 333-173505) and incorporated by reference. |
| | |
| †10.20 | | Form of Class C Unit Exchange Agreement (non-executive committee), filed with YCC Holdings’ Form S-4 filed on April 14, 2011 (Reg. No. 333-173505) and incorporated by reference. |
| †10.21 | | Form of Class C Unit Exchange Agreement (director form), filed with YCC Holdings’ Form S-4 filed on April 14, 2011 (Reg. No. 333-173505) and incorporated by reference. |
| | | |
| †10.22 | | Form of Executive Severance Agreement, filed as Exhibit 10.1 to The Yankee Candle Company, Inc.’s Form 8-K filed on September 20, 2006 (Reg No. 333-141699), is incorporated herein by reference. |
| | |
| †10.23 | | Form of Amendment of Executive Severance Agreement, dated December 31, 2008, filed with Yankee Holding Corp.’s Form 10-K filed on April 3, 2009 (Reg No. 333-141699) and incorporated by reference. |
| †10.24 | | Amended and Restated Executive Deferred Compensation Plan, dated December 23, 2008, filed with Yankee Holding Corp.’s Form 10-K filed on April 3, 2009 (Reg No. 333-141699) and incorporated by reference. |
| | |
| 10.25 | | Amendment to the Yankee Candle Company, Inc. 401(K) and Profit Sharing Plan, filed with Yankee Holding Corp.’s Form 10-K filed on April 3, 2009 (Reg No. 333-141699) and incorporated by reference. |
| | |
| †10.26 | | Form of Management Incentive Plan for fiscal year 2009 for participants of Executive Compensation Plan, filed with Yankee Holding Corp.’s Form 8-K filed on April 8, 2009 (Reg No. 333-141699) and incorporated by reference. |
| | |
| 10.27 | | Form of Indemnification Agreement between The Yankee Candle Company, Inc. and its directors and executive officers, filed as Exhibit 99.3 to The Yankee Candle Company, Inc.’s Form 8-K filed on June 8, 2005 (Reg No. 333-141699) is incorporated herein by reference. |
| | |
| 10.28 | | Yankee Candle Investments LLC 2011 Incentive Equity Plan, filed with YCC Holdings’ Form S-4 filed on April 14, 2011 (Reg. No. 333-173505) and incorporated herein by reference. |
| | | |
| | Subsidiaries of YCC Holdings LLC. |
| | |
| | Certification of Chief Executive Officer, as adopted pursuant to Section 302 of the Sarbanes-Oxley Act of 2002. |
| | |
| | Certification of Chief Financial Officer, as adopted pursuant to Section 302 of the Sarbanes-Oxley Act of 2002. |
| | | |
| | Certification of Chief Executive Officer, as adopted pursuant to Section 302 of the Sarbanes-Oxley Act of 2002. |
| | | |
| | Certification of Chief Financial Officer, as adopted pursuant to Section 302 of the Sarbanes-Oxley Act of 2002. |
| | |
| | Certification of Chief Executive Officer pursuant to 18 U.S.C. §1350, as adopted pursuant to Section 906 of the Sarbanes-Oxley Act of 2002. |
| | |
| | Certification of Chief Financial Officer pursuant to 18 U.S.C. §1350, as adopted pursuant to Section 906 of the Sarbanes-Oxley Act of 2002. |
| | | |
| | Certification of Chief Executive Officer pursuant to 18 U.S.C. §1350, as adopted pursuant to Section 906 of the Sarbanes-Oxley Act of 2002. |
| | | |
| | Certification of Chief Financial Officer pursuant to 18 U.S.C. §1350, as adopted pursuant to Section 906 of the Sarbanes-Oxley Act of 2002. |
| † | Indicates management contract or compensatory plan or arrangement. |
| + | Indicates confidential portions have been omitted pursuant to a confidential treatment request filed separately with the SEC. |
136