Exhibit 99.2

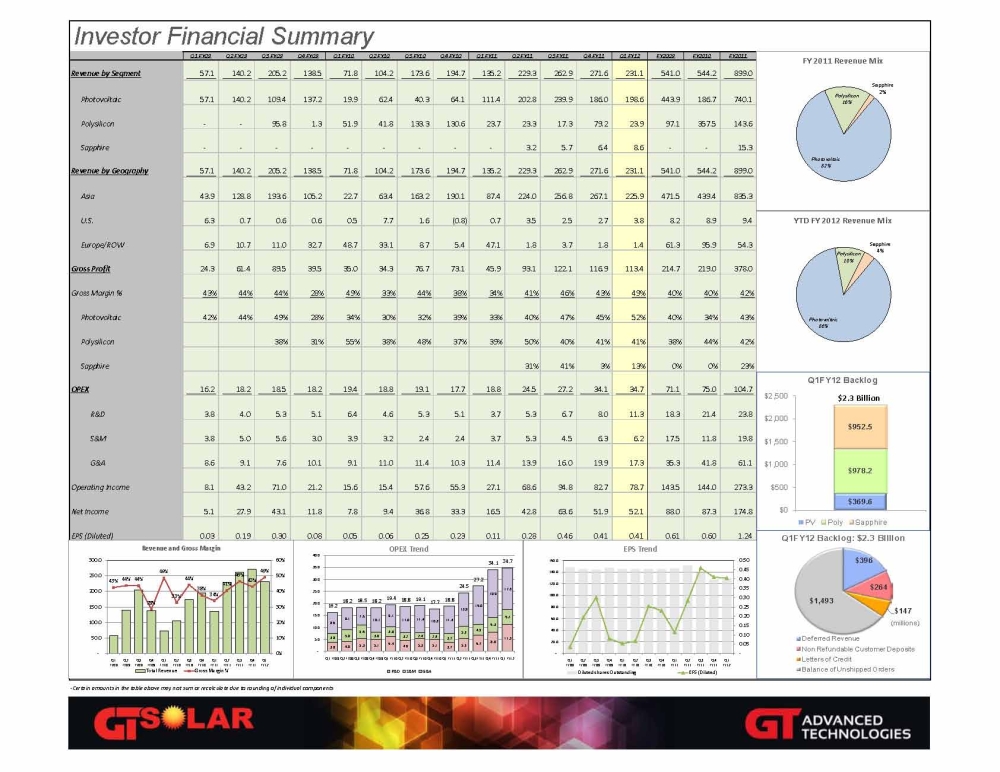
Investor Financial Summary Q1 FY09 Q2 FY09 Q3 FY09 Q4 FY09 Q1 FY10 Q2 FY10 Q3 FY10 Q4 FY10 Q1 FY11 Q2 FY11 Q3 FY11 Q4 FY11 Q1 FY12 FY2009 FY2010 FY2011 Revenue by Segment 57.1 140.2 205.2 138.5 71.8 104.2 173.6 194.7 135.2 229.3 262.9 271.6 231.1 541.0 544.2 899.0 Photovoltaic 57.1 140.2 109.4 137.2 19.9 62.4 40.3 64.1 111.4 202.8 239.9 186.0 198.6 443.9 186.7 740.1 Polysilicon - - 95.8 1.3 51.9 41.8 133.3 130.6 23.7 23.3 17.3 79.2 23.9 97.1 357.5 143.6 Sapphire - 3.2 5.7 6.4 8.6 - - 15.3 Revenue by Geography 57.1 140.2 205.2 138.5 71.8 104.2 173.6 194.7 135.2 229.3 262.9 271.6 231.1 541.0 544.2 899.0 Asia 43.9 128.8 193.6 105.2 22.7 63.4 163.2 190.1 87.4 224.0 256.8 267.1 225.9 471.5 439.4 835.3 U.S. 6.3 0.7 0.6 0.6 0.5 7.7 1.6 (0.8) 0.7 3.5 2.5 2.7 3.8 8.2 8.9 9.4 Europe/ROW6.9 10.7 11.0 32.7 48.7 33.1 8.7 5.4 47.1 1.8 3.7 1.8 1.4 61.3 95.9 54.3 Gross Profit 24.3 61.4 89.5 39.5 35.0 34.3 76.7 73.1 45.9 93.1 122.1 116.9 113.4 214.7 219.0 378.0 Gross Margin % 43% 44% 44% 28% 49% 33% 44% 38% 34% 41% 46% 43% 49% 40% 40% 42% Photovoltaic 42% 44% 49% 28% 34% 30% 32% 39% 33% 40% 47% 45% 52% 40% 34% 43% Polysilicon 38% 31% 55% 38% 48% 37% 39% 50% 40% 41% 41% 38% 44% 42% Sapphire 31% 41% 3% 13% 0% 0% 23% OPEX 16.2 18.2 18.5 18.2 19.4 18.8 19.1 17.7 18.8 24.5 27.2 34.1 34.7 71.1 75.0 104.7 R&D 3.8 4.0 5.3 5.1 6.4 4.6 5.3 5.1 3.7 5.3 6.7 8.0 11.3 18.3 21.4 23.8 S&M 3.8 5.0 5.6 3.0 3.9 3.2 2.4 2.4 3.7 5.3 4.5 6.3 6.2 17.5 11.8 19.8 G&A 8.6 9.1 7.6 10.1 9.1 11.0 11.4 10.3 11.4 13.9 16.0 19.9 17.3 35.3 41.8 61.1 Operating Income 8.1 43.2 71.0 21.2 15.6 15.4 57.6 55.3 27.1 68.6 94.8 82.7 78.7 143.5 144.0 273.3 Net Income 5.1 27.9 43.1 11.8 7.8 9.4 36.8 33.3 16.5 42.8 63.6 51.9 52.1 88.0 87.3 174.8 EPS (Diluted) 0.03 0.19 0.30 0.08 0.05 0.06 0.25 0.23 0.11 0.28 0.46 0.41 0.41 0.61 0.60 1.24 -Certain amounts in the table above may not sum or recalculate due to rounding of individual components $2.3 Billion

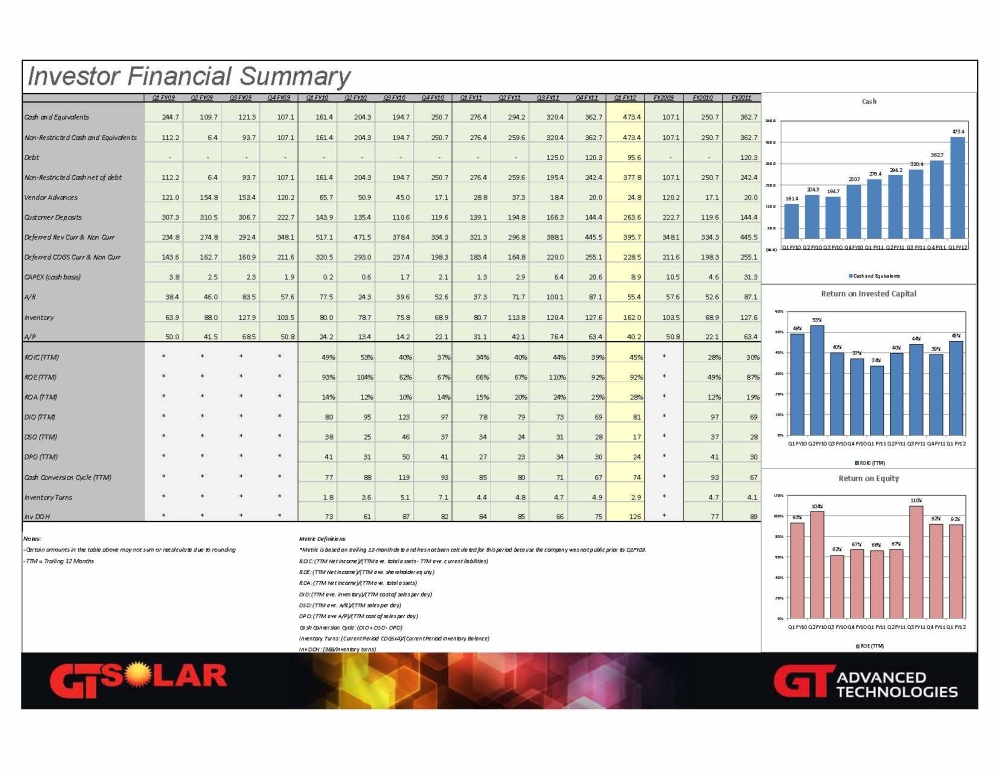
Investor Financial Summary Q1 FY09 Q2 FY09 Q3 FY09 Q4 FY09 Q1 FY10 Q2 FY10 Q3 FY10 Q4 FY10 Q1 FY11 Q2 FY11 Q3 FY11 Q4 FY11 Q1 FY12 FY2009 FY2010 FY2011 Cash and Equivalents 244.7 109.7 121.3 107.1 161.4 204.3 194.7 250.7 276.4 294.2 320.4 362.7 473.4 107.1 250.7 362.7 1,254 Non-Restricted Cash and Equivalents 112.2 6.4 93.7 107.1 161.4 204.3 194.7 250.7 276.4 259.6 320.4 362.7 473.4 107.1 250.7 362.7 1,219 Debt - - - - - - - - - - 125.0 120.3 95.6 - - 120.3 245 Non-Restricted Cash net of debt 112.2 6.4 93.7 107.1 161.4 204.3 194.7 250.7 276.4 259.6 195.4 242.4 377.8 107.1 250.7 242.4 Vendor Advances 121.0 154.8 153.4 120.2 65.7 50.9 45.0 17.1 28.8 37.3 18.4 20.0 24.8 120.2 17.1 20.0 104 Customer Deposits 307.3 310.5 306.7 222.7 143.9 135.4 110.6 119.6 139.1 194.8 166.3 144.4 263.6 222.7 119.6 144.4 645 Deferred Rev Curr & Non Curr 234.8 274.8 292.4 348.1 517.1 471.5 378.4 334.3 321.3 296.8 388.1 445.5 395.7 348.1 334.3 445.5 1,452 Deferred COGS Curr & Non Curr 143.6 162.7 160.9 211.6 320.5 293.0 237.4 198.3 183.4 164.8 220.0 255.1 228.5 211.6 198.3 255.1 823 CAPEX (cash basis) 3.8 2.5 2.3 1.9 0.2 0.6 1.7 2.1 1.3 2.9 6.4 20.6 8.9 10.5 4.6 31.3 31 A/R 38.4 46.0 83.5 57.6 77.5 24.3 39.6 52.6 37.3 71.7 100.1 87.1 55.4 57.6 52.6 87.1 296 Inventory 63.9 88.0 127.9 103.5 80.0 78.7 75.8 68.9 80.7 113.8 120.4 127.6 162.0 103.5 68.9 127.6 442 A/P 50.0 41.5 68.5 50.8 24.2 13.4 14.2 22.1 31.1 42.1 76.4 63.4 40.2 50.8 22.1 63.4 213 ROIC (TTM) * * * * 49% 53% 40% 37% 34% 40% 44% 39% 45% * 28% 30% 2 ROE (TTM) * * * * 93% 104% 62% 67% 66% 67% 110% 92% 92% * 49% 87% 3 ROA (TTM) * * * * 14% 12% 10% 14% 15% 20% 24% 25% 28% * 12% 19% DIO (TTM) * * * * 80 95 123 97 78 79 73 69 81 * 97 69 DSO (TTM) * * * * 38 25 46 37 34 24 31 28 17 * 37 28 DPO (TTM) * * * * 41 31 50 41 27 23 34 30 24 * 41 30 Cash Conversion Cycle (TTM) * * * * 77 88 119 93 85 80 71 67 74 * 93 67 Inventory Turns * * * * 1.8 3.6 5.1 7.1 4.4 4.8 4.7 4.9 2.9 * 4.7 4.1 Inv DOH * * * * 73 61 87 82 84 85 66 75 126 * 77 89 Notes: Metric Definitions: -Certain amounts in the table above may not sum or recalculate due to rounding *Metric is based on trailing 12-month data and has not been calculated for this period because the company was not public prior to Q1FY09. -TTM = Trailing 12 Months ROIC: (TTM Net Income)/(TTM ave. total assets - TTM ave. current liabilities) ROE: (TTM Net Income)/(TTM ave. shareholder equity) ROA: (TTM Net Income)/(TTM ave. total assets) DIO: (TTM ave. inventory)/(TTM cost of sales per day) DSO: (TTM ave. A/R)/(TTM sales per day) DPO: (TTM ave A/P)/(TTM cost of sales per day) Cash Conversion Cycle: (DIO + DSO - DPO) Inventory Turns: (Current Period COGSx4)/(Current Period Inventory Balance) Inv DOH: (365/inventory turns)