UNITED STATES
SECURITIES AND EXCHANGE COMMISSION
Washington, D.C. 20549
FORM N-CSR
CERTIFIED SHAREHOLDER REPORT OF REGISTERED
MANAGEMENT INVESTMENT COMPANIES
Investment Company Act file number | 811-22057 | |||||||
| ||||||||
Cohen & Steers Global Income Builder, Inc. | ||||||||
(Exact name of registrant as specified in charter) | ||||||||
| ||||||||
280 Park Avenue, New York, NY |
| 10017 | ||||||
(Address of principal executive offices) |
| (Zip code) | ||||||
| ||||||||
Francis C. Poli Cohen & Steers Capital Management, Inc. 280 Park Avenue New York, New York 10017 | ||||||||
(Name and address of agent for service) | ||||||||
| ||||||||
Registrant’s telephone number, including area code: | (212) 832-3232 |
| ||||||
| ||||||||
Date of fiscal year end: | December 31 |
| ||||||
| ||||||||
Date of reporting period: | June 30, 2017 |
| ||||||
Item 1. Reports to Stockholders.
COHEN & STEERS GLOBAL INCOME BUILDER, INC.
To Our Shareholders:
We would like to share with you our report for the six months ended June 30, 2017. The net asset value (NAV) at that date was $10.34 per common share. The Fund's common stock is traded on the New York Stock Exchange (NYSE) and its share price can differ from its NAV; at period end, the Fund's market price was $9.52.
The total returns for the Fund and its comparative benchmarks were:
| Six Months Ended June 30, 2017 | |||||||
| Cohen & Steers Global Income Builder at NAVa | 10.40 | % | |||||
| Cohen & Steers Global Income Builder at Market Valuea | 16.66 | % | |||||
| MSCI World Index—netb | 10.66 | % | |||||
| Blended Benchmark—55% CBOE S&P 500 BuyWrite Index/15% S&P 500 Index/15% BofA Merrill Lynch Fixed-Rate Preferred Securities Index/15% MSCI EAFE Indexb | 8.80 | % | |||||
| S&P 500 Indexb | 9.34 | % | |||||
The performance data quoted represent past performance. Past performance is no guarantee of future results. The investment return and the principal value of an investment will fluctuate and shares, if sold, may be worth more or less than their original cost. Current performance may be lower or higher than the performance data quoted. Performance results reflect the effects of leverage, resulting from borrowings under a credit agreement. Current total returns of the Fund can be obtained by visiting our website at cohenandsteers.com. The Fund's returns assume the reinvestment of all dividends and distributions at prices obtained under the Fund's dividend reinvestment plan. Index performance does not reflect the deduction of any fees, taxes or expenses. An investor cannot invest directly in an index. Performance figures for periods shorter than one year are not annualized.
The Fund makes regular monthly distributions at a level rate (the Policy). Distributions paid by the Fund are subject to recharacterization for tax purposes and are taxable up to the amount of the Fund's investment company taxable income and net realized gains. As a result of the Policy, the Fund may pay distributions in excess of the Fund's investment company taxable income and net realized gains. This
a As a closed-end investment company, the price of the Fund's exchange-traded shares will be set by market forces and can deviate from the NAV per share of the Fund.
b The MSCI World Index—net is a free-float-adjusted index that measures performance of large- and mid-capitalization companies representing developed market countries and is net of dividend withholding taxes. The CBOE S&P 500 BuyWrite Index tracks the performance of a hypothetical buy-write strategy on the S&P 500 Index. The BofA Merrill Lynch Fixed-Rate Preferred Securities Index tracks the performance of fixed-rate U.S. dollar-denominated preferred securities issued in the U.S. domestic market. The MSCI EAFE Index is an equity index which captures large- and mid-capitalization companies in developed market countries excluding the U.S. and Canada. The S&P 500 Index is an unmanaged index of 500 large-capitalization stocks that is frequently used as a general measure of U.S. stock market performance.
1
COHEN & STEERS GLOBAL INCOME BUILDER, INC.
excess would be a return of capital distributed from the Fund's assets. Distributions of capital decrease the Fund's total assets and, therefore, could have the effect of increasing the Fund's expense ratio. In addition, in order to make these distributions, the Fund may have to sell portfolio securities at a less than opportune time.
The Fund's assets are allocated among five proprietary strategies: global large-cap value stocks, global real estate securities, global infrastructure stocks, global preferred securities and closed-end funds. As of June 30, 2017, 73% of the Fund's assets were invested in the global large-cap value strategy.
Market Review
The six-month period ended June 30, 2017 was broadly favorable for equities, aided by improving economic data, expectations of business-friendly government initiatives and generally positive year-ahead corporate guidance. Stocks also drew support from a benign interest-rate backdrop. While the Federal Reserve raised short-term interest rates by a total of 0.50% during the period in response to an improving economy, U.S. bond yields declined as inflation expectations dropped along with retreating oil prices. The yield on the 10-year Treasury fell from 2.5% at the start of the period to 2.3% at the end of June.
Sovereign bond yields in Europe and Asia were mostly lower as well. However, yields globally were volatile late in the period in reaction to comments from the president of the European Central Bank (ECB) that suggested the bank may begin to decrease its quantitative easing programs. The president reiterated that any policy changes would be gradual, and other ECB officials quickly released comments with a softer tone.
Fund Performance
The Fund had a positive total return in the period and outperformed its blended benchmark on both a NAV and market price basis. At 73% of the Fund's assets, the global large-cap value allocation was the main driver of relative performance. Within the strategy, stock selection in the consumer staples and industrial sectors contributed to relative returns. Stock selection in the energy and consumer discretionary sectors detracted from relative performance.
Stock selection in the Fund's allocation to global infrastructure aided performance compared with the blended benchmark, as did stock selection in the global real estate strategy, due in part to our underweight in struggling U.S. retail landlords. However, the Fund's overweight in real estate as a group offset the benefit of favorable stock selection in that strategy, as the asset class had a positive return in the period but underperformed.
2
COHEN & STEERS GLOBAL INCOME BUILDER, INC.
Impact of Leverage on Fund Performance
The Fund employs leverage as part of a yield-enhancement strategy. Leverage, which can increase total return in rising markets (just as it can have the opposite effect in declining markets), significantly contributed to the Fund's performance for the six-month period ended June 30, 2017.
Impact of Derivatives on Fund Performance
The Fund sold covered call options on an index with the intention of earning option premiums to generate income to pay dividends and to reduce the volatility of the Fund's investments. In the six-month period ended June 30, 2017, the use of these instruments significantly detracted from the Fund's performance.
Impact of Foreign Currency on Fund Performance
The currency impact of the Fund's investments in foreign securities contributed to absolute performance during the period. Although the Fund reports its NAV and pays dividends in U.S. dollars, the Fund's investments denominated in foreign currencies are subject to foreign currency risk. Most currencies appreciated against the U.S. dollar, including the euro, U.K. pound and Japanese yen. Consequently, changes in the exchange rates between foreign currencies and the U.S. dollar were a net tailwind for absolute returns.
3
COHEN & STEERS GLOBAL INCOME BUILDER, INC.
Sincerely,
|
| ||||||||||
RICHARD E. HELM | WILLIAM F. SCAPELL | ||||||||||
Portfolio Manager | Portfolio Manager | ||||||||||
|
| ||||||||||
YIGAL D. JHIRAD | DOUGLAS R. BOND | ||||||||||
Portfolio Manager | Portfolio Manager | ||||||||||
|
| ||||||||||
BEN MORTON | JON CHEIGH | ||||||||||
Portfolio Manager | Portfolio Manager | ||||||||||
|
| ||||||||||
ELAINE ZAHARIS-NIKAS | JASON A. YABLON | ||||||||||
Portfolio Manager | Portfolio Manager | ||||||||||


4
COHEN & STEERS GLOBAL INCOME BUILDER, INC.
The views and opinions in the preceding commentary are subject to change without notice and are as of the date of the report. There is no guarantee that any market forecast set forth in the commentary will be realized. This material represents an assessment of the market environment at a specific point in time, should not be relied upon as investment advice and is not intended to predict or depict performance of any investment.
Visit Cohen & Steers online at cohenandsteers.com
For more information about the Cohen & Steers family of mutual funds, visit cohenandsteers.com. Here you will find fund net asset values, fund fact sheets and portfolio highlights, as well as educational resources and timely market updates.
Our website also provides comprehensive information about Cohen & Steers, including our most recent press releases, profiles of our senior investment professionals and their investment approach to each asset class. The Cohen & Steers family of mutual funds invests in major real asset categories including real estate securities, listed infrastructure, commodities and natural resource equities, as well as preferred securities and other income solutions.
5
COHEN & STEERS GLOBAL INCOME BUILDER, INC.
Our Leverage Strategy
(Unaudited)
Our leverage strategy utilizes borrowings up to the maximum permitted by the Investment Company Act of 1940 to provide additional capital for the Fund, with an objective of increasing the net income available for shareholders. As of June 30, 2017, leverage represented 22% of the Fund's managed assets.
Leverage Factsa,b
Leverage (as a % of managed assets) | 22 | % | |||||
| Current Rate on Debt | 2.0 | % | |||||
The Fund intends to enhance its dividend yield through leverage. The use of leverage is a speculative technique and there are special risks and costs associated with leverage. The net asset value of the Fund's shares may be reduced by the issuance and ongoing costs of leverage. So long as the Fund is able to invest in securities that produce an investment yield that is greater than the total cost of leverage, the leverage strategy will produce higher current net investment income for shareholders. On the other hand, to the extent that the total cost of leverage exceeds the incremental income gained from employing such leverage, shareholders would realize lower net investment income. In addition to the impact on net income, the use of leverage will have an effect of magnifying capital appreciation or depreciation for shareholders. Specifically, in an up market, leverage will typically generate greater capital appreciation than if the Fund were not employing leverage. Conversely, in down markets, the use of leverage will generally result in greater capital depreciation than if the Fund had been unlevered. To the extent that the Fund is required or elects to reduce its leverage, the Fund may need to liquidate investments at times of adverse economic conditions which may result in capital losses potentially reducing returns to shareholders. There can be no assurance that a leveraging strategy will be successful during any period in which it is employed.
a Data as of June 30, 2017. Information is subject to change.
b See Note 7 in Notes to Financial Statements.
6
COHEN & STEERS GLOBAL INCOME BUILDER, INC.
June 30, 2017
Top Ten Holdingsa
(Unaudited)
| Security | Value | % of Managed Assets | |||||||||
Altria Group | $ | 7,354,136 | 2.4 | ||||||||
Nestle SA | 6,375,322 | 2.1 | |||||||||
Alphabet, Class A | 6,053,146 | 2.0 | |||||||||
Apple | 5,876,592 | 1.9 | |||||||||
Honeywell International | 5,240,163 | 1.7 | |||||||||
Aetna | 4,953,909 | 1.6 | |||||||||
Danone SA | 4,826,938 | 1.6 | |||||||||
Bank of America Corp. | 4,740,744 | 1.5 | |||||||||
FedEx Corp. | 4,487,430 | 1.5 | |||||||||
Chubb Ltd. (USD) | 4,051,159 | 1.3 | |||||||||
a Top ten holdings are determined on the basis of the value of individual securities held. The Fund may also hold positions in other types of securities issued by the companies listed above. See the Schedule of Investments for additional details on such other positions.
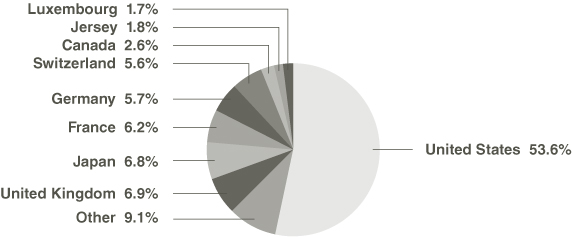
Country Breakdown
(Based on Managed Assets)
(Unaudited)
7
COHEN & STEERS GLOBAL INCOME BUILDER, INC.
SCHEDULE OF INVESTMENTS
June 30, 2017 (Unaudited)
| Number of Shares | Value | ||||||||||||||
COMMON STOCK | 118.0% | ||||||||||||||
AUSTRALIA | 0.8% | ||||||||||||||
ELECTRIC—REGULATED ELECTRIC | 0.3% | ||||||||||||||
Spark Infrastructure Group | 359,401 | $ | 723,737 | ||||||||||||
REAL ESTATE | 0.5% | ||||||||||||||
DIVERSIFIED | 0.3% | ||||||||||||||
Dexus Property Group | 104,144 | 758,827 | |||||||||||||
INDUSTRIALS | 0.2% | ||||||||||||||
Goodman Group | 87,258 | 527,814 | |||||||||||||
TOTAL REAL ESTATE | 1,286,641 | ||||||||||||||
TOTAL AUSTRALIA | 2,010,378 | ||||||||||||||
AUSTRIA | 0.2% | ||||||||||||||
REAL ESTATE—RESIDENTIAL | |||||||||||||||
BUWOG AG | 12,917 | 371,115 | |||||||||||||
BELGIUM | 0.1% | ||||||||||||||
REAL ESTATE—RESIDENTIAL | |||||||||||||||
Aedifica SA | 1,511 | 131,798 | |||||||||||||
BRAZIL | 0.1% | ||||||||||||||
REAL ESTATE—RETAIL | 0.0% | ||||||||||||||
BR Malls Participacoes SA | 36,561 | 131,880 | |||||||||||||
WATER | 0.1% | ||||||||||||||
Cia de Saneamento Basico do Estado de Sao Paulo | 17,692 | 169,075 | |||||||||||||
TOTAL BRAZIL | 300,955 | ||||||||||||||
CANADA | 3.3% | ||||||||||||||
ENERGY—OIL & GAS | 0.9% | ||||||||||||||
Suncor Energya | 76,800 | 2,243,948 | |||||||||||||
FINANCIAL—BANKS | 0.8% | ||||||||||||||
Royal Bank of Canada | 26,111 | 1,895,907 | |||||||||||||
PIPELINES—C-CORP | 1.4% | ||||||||||||||
Enbridge | 20,090 | 800,316 | |||||||||||||
Kinder Morgan Canada Ltd., 144Ab,c | 18,600 | 227,049 | |||||||||||||
Pembina Pipeline Corp. | 31,928 | 1,057,455 | |||||||||||||
TransCanada Corp. | 26,355 | 1,256,374 | |||||||||||||
3,341,194 | |||||||||||||||
See accompanying notes to financial statements.
8
COHEN & STEERS GLOBAL INCOME BUILDER, INC.
SCHEDULE OF INVESTMENTS—(Continued)
June 30, 2017 (Unaudited)
| Number of Shares | Value | ||||||||||||||
REAL ESTATE—OFFICE | 0.2% | ||||||||||||||
Allied Properties REIT | 12,802 | $ | 384,218 | ||||||||||||
TOTAL CANADA | 7,865,267 | ||||||||||||||
CHINA | 0.1% | ||||||||||||||
TOLL ROADS | |||||||||||||||
Jiangsu Expressway Co., Ltd., Class H (HKD) | 210,000 | 296,409 | |||||||||||||
FRANCE | 7.1% | ||||||||||||||
AIRPORTS | 0.3% | ||||||||||||||
Aeroports de Paris | 3,567 | 575,663 | |||||||||||||
CONSUMER STAPLES | 2.0% | ||||||||||||||
Danone SAa | 64,218 | 4,826,938 | |||||||||||||
ENERGY—OIL & GAS | 0.7% | ||||||||||||||
Total SAd | 34,502 | 1,705,708 | |||||||||||||
FINANCIAL—BANKS | 1.6% | ||||||||||||||
BNP Paribasa | 53,027 | 3,819,214 | |||||||||||||
HEALTH CARE—PHARMACEUTICALS | 1.0% | ||||||||||||||
Sanofia | 25,158 | 2,406,777 | |||||||||||||
INDUSTRIALS—AEROSPACE & DEFENSE | 0.5% | ||||||||||||||
Thales SAd | 11,662 | 1,255,253 | |||||||||||||
REAL ESTATE | 0.4% | ||||||||||||||
OFFICE | 0.2% | ||||||||||||||
Gecina SA | 2,838 | 445,209 | |||||||||||||
RETAIL | 0.2% | ||||||||||||||
Klepierre | 11,134 | 456,339 | |||||||||||||
TOTAL REAL ESTATE | 901,548 | ||||||||||||||
TOLL ROADS | 0.6% | ||||||||||||||
Vinci SA | 17,536 | 1,496,747 | |||||||||||||
TOTAL FRANCE | 16,987,848 | ||||||||||||||
GERMANY | 7.3% | ||||||||||||||
ELECTRIC—REGULATED ELECTRIC | 0.2% | ||||||||||||||
Innogy SE, 144Ab | 10,658 | 419,543 | |||||||||||||
See accompanying notes to financial statements.
9
COHEN & STEERS GLOBAL INCOME BUILDER, INC.
SCHEDULE OF INVESTMENTS—(Continued)
June 30, 2017 (Unaudited)
| Number of Shares | Value | ||||||||||||||
FINANCIAL | 2.4% | ||||||||||||||
BANKS | 1.4% | ||||||||||||||
Deutsche Bank AGa | 185,412 | $ | 3,287,702 | ||||||||||||
INSURANCE | 1.0% | ||||||||||||||
Allianz SEa | 12,714 | 2,503,471 | |||||||||||||
TOTAL FINANCIAL | 5,791,173 | ||||||||||||||
HEALTH CARE—PHARMACEUTICALS | 0.9% | ||||||||||||||
Bayer AGd | 16,951 | 2,191,617 | |||||||||||||
INDUSTRIALS—ELECTRICAL EQUIPMENT | 1.3% | ||||||||||||||
Siemens AGa | 22,694 | 3,119,465 | |||||||||||||
MATERIALS—CHEMICALS | 0.8% | ||||||||||||||
Linde AGd | 10,600 | 2,007,305 | |||||||||||||
REAL ESTATE | 0.5% | ||||||||||||||
OFFICE | 0.1% | ||||||||||||||
Alstria Office REIT AG | 20,103 | 271,739 | |||||||||||||
RESIDENTIAL | 0.4% | ||||||||||||||
ADO Properties SA, 144Ab | 4,156 | 175,797 | |||||||||||||
Deutsche Wohnen AG | 20,738 | 793,241 | |||||||||||||
969,038 | |||||||||||||||
TOTAL REAL ESTATE | 1,240,777 | ||||||||||||||
TECHNOLOGY—SOFTWARE | 1.2% | ||||||||||||||
SAP AGa | 26,252 | 2,742,011 | |||||||||||||
TOTAL GERMANY | 17,511,891 | ||||||||||||||
HONG KONG | 2.1% | ||||||||||||||
ELECTRIC—REGULATED ELECTRIC | 0.3% | ||||||||||||||
CLP Holdings Ltd. | 76,500 | 809,343 | |||||||||||||
INVESTMENT COMPANY—DIVERSIFIED FINANCIALS | 0.4% | ||||||||||||||
CK Hutchison Holdings Ltd. (Cayman Islands) | 83,005 | 1,041,888 | |||||||||||||
REAL ESTATE | 1.0% | ||||||||||||||
DIVERSIFIED | 0.9% | ||||||||||||||
Cheung Kong Property Holdings Ltd. | 104,500 | 818,471 | |||||||||||||
Hang Lung Properties Ltd. | 245,000 | 611,916 | |||||||||||||
Sun Hung Kai Properties Ltd. | 39,404 | 578,888 | |||||||||||||
2,009,275 | |||||||||||||||
See accompanying notes to financial statements.
10
COHEN & STEERS GLOBAL INCOME BUILDER, INC.
SCHEDULE OF INVESTMENTS—(Continued)
June 30, 2017 (Unaudited)
| Number of Shares | Value | ||||||||||||||
RETAIL | 0.1% | ||||||||||||||
Link REIT | 32,500 | $ | 247,264 | ||||||||||||
TOTAL REAL ESTATE | 2,256,539 | ||||||||||||||
TELECOMMUNICATION SERVICES | 0.4% | ||||||||||||||
China Mobile Ltd. | 96,500 | 1,024,025 | |||||||||||||
TOTAL HONG KONG | 5,131,795 | ||||||||||||||
IRELAND | 0.7% | ||||||||||||||
INFORMATION TECHNOLOGY—IT CONSULTING & SERVICES | |||||||||||||||
Accenture PLC, Class A (USD)d | 13,462 | 1,664,980 | |||||||||||||
ITALY | 0.5% | ||||||||||||||
COMMUNICATIONS—TOWERS | 0.2% | ||||||||||||||
Ei Towers S.p.A. | 4,500 | 260,325 | |||||||||||||
Infrastrutture Wireless Italiane S.p.A., 144Ab | 53,619 | 304,612 | |||||||||||||
564,937 | |||||||||||||||
PIPELINES—C-CORP | 0.3% | ||||||||||||||
Snam S.p.A. | 142,384 | 620,572 | |||||||||||||
TOTAL ITALY | 1,185,509 | ||||||||||||||
JAPAN | 8.7% | ||||||||||||||
AUTOMOTIVE | 0.6% | ||||||||||||||
Toyota Motor Corp.a | 29,200 | 1,529,901 | |||||||||||||
CONSUMER DISCRETIONARY—MEDIA | 0.6% | ||||||||||||||
CyberAgent | 48,200 | 1,493,461 | |||||||||||||
FINANCIAL | 2.1% | ||||||||||||||
DIVERSIFIED FINANCIAL SERVICES | 1.4% | ||||||||||||||
Mitsubishi UFJ Financial Groupa | 156,200 | 1,048,231 | |||||||||||||
ORIX Corp.a | 146,500 | 2,266,370 | |||||||||||||
3,314,601 | |||||||||||||||
INSURANCE | 0.7% | ||||||||||||||
| NKSJ Holdingsa | 46,250 | 1,784,208 | |||||||||||||
TOTAL FINANCIAL | 5,098,809 | ||||||||||||||
INDUSTRIALS | 1.6% | ||||||||||||||
COMMERCIAL SERVICES & SUPPLIES | 0.5% | ||||||||||||||
Secom Co., Ltd. | 15,500 | 1,174,817 | |||||||||||||
See accompanying notes to financial statements.
11
COHEN & STEERS GLOBAL INCOME BUILDER, INC.
SCHEDULE OF INVESTMENTS—(Continued)
June 30, 2017 (Unaudited)
| Number of Shares | Value | ||||||||||||||
ELECTRICAL EQUIPMENT | 1.1% | ||||||||||||||
Fanuc Ltd.a | 6,500 | $ | 1,251,456 | ||||||||||||
Nidec Corp.a | 13,900 | 1,422,440 | |||||||||||||
2,673,896 | |||||||||||||||
TOTAL INDUSTRIALS | 3,848,713 | ||||||||||||||
RAILWAYS | 0.4% | ||||||||||||||
Central Japan Railway Co. | 2,100 | 341,862 | |||||||||||||
West Japan Railway Co. | 7,600 | 536,240 | |||||||||||||
878,102 | |||||||||||||||
REAL ESTATE | 1.7% | ||||||||||||||
DIVERSIFIED | 1.3% | ||||||||||||||
Activia Properties | 96 | 410,118 | |||||||||||||
Mitsui Fudosan Co., Ltd.a | 26,391 | 628,949 | |||||||||||||
Sekisui House Ltd.a | 60,600 | 1,066,527 | |||||||||||||
Sumitomo Realty & Development Co., Ltd. | 21,000 | 646,944 | |||||||||||||
Tokyo Tatemono Co., Ltd. | 33,139 | 433,702 | |||||||||||||
3,186,240 | |||||||||||||||
OFFICE | 0.2% | ||||||||||||||
Hulic REIT | 95 | 148,233 | |||||||||||||
Kenedix Office Investment Corp. | 39 | 208,046 | |||||||||||||
Nippon Building Fund | 41 | 209,238 | |||||||||||||
565,517 | |||||||||||||||
RETAIL | 0.2% | ||||||||||||||
Japan Retail Fund Investment Corp. | 197 | 363,436 | |||||||||||||
TOTAL REAL ESTATE | 4,115,193 | ||||||||||||||
TECHNOLOGY—ELECTRONIC EQUIPMENT & INSTRUMENTS | 1.1% | ||||||||||||||
Kyocera Corp.a | 17,000 | 983,347 | |||||||||||||
Sony Corp.a | 39,800 | 1,516,629 | |||||||||||||
2,499,976 | |||||||||||||||
TELECOMMUNICATION SERVICES | 0.6% | ||||||||||||||
KDDI Corp.d | 52,400 | 1,385,997 | |||||||||||||
TOTAL JAPAN | 20,850,152 | ||||||||||||||
See accompanying notes to financial statements.
12
COHEN & STEERS GLOBAL INCOME BUILDER, INC.
SCHEDULE OF INVESTMENTS—(Continued)
June 30, 2017 (Unaudited)
| Number of Shares | Value | ||||||||||||||
JERSEY | 2.4% | �� | |||||||||||||
CONSUMER DISCRETIONARY | 2.0% | ||||||||||||||
AUTO COMPONENTS | 1.1% | ||||||||||||||
Delphi Automotive PLC (USD)a | 30,383 | $ | 2,663,070 | ||||||||||||
MEDIA | 0.9% | ||||||||||||||
WPP PLC (GBP)a | 96,500 | 2,028,578 | |||||||||||||
TOTAL CONSUMER DISCRETIONARY | 4,691,648 | ||||||||||||||
MATERIALS—METALS & MINING | 0.4% | ||||||||||||||
Glencore PLC (GBP)c | 251,306 | 940,044 | |||||||||||||
TOTAL JERSEY | 5,631,692 | ||||||||||||||
LUXEMBOURG | 2.2% | ||||||||||||||
MATERIALS | |||||||||||||||
CHEMICALS | 1.0% | ||||||||||||||
Trinseo SA (USD)a | 34,602 | 2,377,157 | |||||||||||||
METALS & MINING | 1.2% | ||||||||||||||
ArcelorMittala,c | 124,977 | 2,834,865 | |||||||||||||
TOTAL LUXEMBOURG | 5,212,022 | ||||||||||||||
MEXICO | 0.1% | ||||||||||||||
TOLL ROADS | |||||||||||||||
OHL Mexico SAB de CV | 210,189 | 303,203 | |||||||||||||
NETHERLANDS | 0.7% | ||||||||||||||
FINANCIAL—BANKS | |||||||||||||||
ABN AMRO Group NV, 144Ab | 59,877 | 1,587,297 | |||||||||||||
NEW ZEALAND | 0.2% | ||||||||||||||
AIRPORTS | |||||||||||||||
Auckland International Airport Ltd. | 78,478 | 410,037 | |||||||||||||
NORWAY | 0.1% | ||||||||||||||
REAL ESTATE—OFFICE | |||||||||||||||
Entra ASA, 144Ab | 15,426 | 192,161 | |||||||||||||
SINGAPORE | 0.5% | ||||||||||||||
REAL ESTATE—INDUSTRIALS | 0.1% | ||||||||||||||
Global Logistic Properties Ltd. | 43,000 | 89,327 | |||||||||||||
TECHNOLOGY—SEMICONDUCTORS | 0.4% | ||||||||||||||
Broadcom Ltd. (USD) | 4,284 | 998,386 | |||||||||||||
TOTAL SINGAPORE | 1,087,713 | ||||||||||||||
See accompanying notes to financial statements.
13
COHEN & STEERS GLOBAL INCOME BUILDER, INC.
SCHEDULE OF INVESTMENTS—(Continued)
June 30, 2017 (Unaudited)
| Number of Shares | Value | ||||||||||||||
SPAIN | 1.1% | ||||||||||||||
ELECTRIC—REGULATED ELECTRIC | 0.1% | ||||||||||||||
Red Electrica Corp. SA | 17,550 | $ | 366,718 | ||||||||||||
FINANCIAL—BANKS | 0.3% | ||||||||||||||
Banco Bilbao Vizcaya Argentaria SA | 79,797 | 662,133 | |||||||||||||
REAL ESTATE—DIVERSIFIED | 0.3% | ||||||||||||||
Hispania Activos Inmobiliarios SA | 10,954 | 181,099 | |||||||||||||
Merlin Properties Socimi SA | 41,324 | 522,012 | |||||||||||||
703,111 | |||||||||||||||
TOLL ROADS | 0.4% | ||||||||||||||
Ferrovial SA | 46,080 | 1,022,869 | |||||||||||||
TOTAL SPAIN | 2,754,831 | ||||||||||||||
SWEDEN | 1.8% | ||||||||||||||
COMMUNICATIONS—TELECOMMUNICATIONS | 0.3% | ||||||||||||||
TeliaSonera AB | 179,800 | 827,857 | |||||||||||||
INDUSTRIALS—AEROSPACE & DEFENSE | 1.3% | ||||||||||||||
Saab AB, Class Ba | 61,853 | 3,054,215 | |||||||||||||
REAL ESTATE—DIVERSIFIED | 0.2% | ||||||||||||||
Fastighets AB Balder, Class Bc | 8,657 | 209,625 | |||||||||||||
Hufvudstaden AB | 11,105 | 184,145 | |||||||||||||
393,770 | |||||||||||||||
TOTAL SWEDEN | 4,275,842 | ||||||||||||||
SWITZERLAND | 6.5% | ||||||||||||||
AIRPORTS | 0.1% | ||||||||||||||
Flughafen Zuerich AG | 1,588 | 389,838 | |||||||||||||
CONSUMER—NON-CYCLICAL—FOOD | 2.7% | ||||||||||||||
Nestle SAa | 73,257 | 6,375,322 | |||||||||||||
FINANCIAL—INSURANCE | 2.2% | ||||||||||||||
Chubb Ltd. (USD)a | 27,866 | 4,051,159 | |||||||||||||
Zurich Insurance Group AG | 4,500 | 1,309,782 | |||||||||||||
5,360,941 | |||||||||||||||
HEALTH CARE—PHARMACEUTICALS | 1.5% | ||||||||||||||
Novartis AGa | 42,300 | 3,520,221 | |||||||||||||
TOTAL SWITZERLAND | 15,646,322 | ||||||||||||||
See accompanying notes to financial statements.
14
COHEN & STEERS GLOBAL INCOME BUILDER, INC.
SCHEDULE OF INVESTMENTS—(Continued)
June 30, 2017 (Unaudited)
| Number of Shares | Value | ||||||||||||||
UNITED KINGDOM | 8.4% | ||||||||||||||
CONSUMER STAPLES—BEVERAGE | 1.5% | ||||||||||||||
Diageo PLCd | 121,123 | $ | 3,578,709 | ||||||||||||
CONSUMER—CYCLICAL—SPECIALTY RETAIL | 0.3% | ||||||||||||||
Kingfisher PLC | 212,592 | 832,609 | |||||||||||||
CONSUMER—NON-CYCLICAL—AGRICULTURE | 0.9% | ||||||||||||||
British American Tobacco PLCd | 31,433 | 2,142,794 | |||||||||||||
ELECTRIC—REGULATED ELECTRIC | 0.3% | ||||||||||||||
National Grid PLC | 53,413 | 662,146 | |||||||||||||
FINANCIAL | 2.4% | ||||||||||||||
BANKS | 1.8% | ||||||||||||||
Barclays PLCa | 797,124 | 2,104,979 | |||||||||||||
Lloyds Banking Group PLC | 2,558,417 | 2,204,256 | |||||||||||||
4,309,235 | |||||||||||||||
INSURANCE | 0.6% | ||||||||||||||
Beazley PLC | 208,471 | 1,325,304 | |||||||||||||
TOTAL FINANCIAL | 5,634,539 | ||||||||||||||
HEALTH CARE—PHARMACEUTICALS | 0.9% | ||||||||||||||
GlaxoSmithKline PLCa | 102,586 | 2,185,242 | |||||||||||||
MATERIALS—CONTAINERS & PACKAGING | 0.9% | ||||||||||||||
DS Smith PLCc | 365,000 | 2,251,467 | |||||||||||||
REAL ESTATE | 0.8% | ||||||||||||||
DIVERSIFIED | 0.1% | ||||||||||||||
LondonMetric Property PLC | 88,124 | 192,137 | |||||||||||||
HEALTH CARE | 0.1% | ||||||||||||||
Assura PLC | 285,307 | 237,079 | |||||||||||||
INDUSTRIALS | 0.3% | ||||||||||||||
Segro PLC | 81,885 | 521,737 | |||||||||||||
Tritax Big Box REIT PLC | 93,146 | 177,367 | |||||||||||||
699,104 | |||||||||||||||
OFFICE | 0.1% | ||||||||||||||
Workspace Group PLC | 10,458 | 121,295 | |||||||||||||
See accompanying notes to financial statements.
15
COHEN & STEERS GLOBAL INCOME BUILDER, INC.
SCHEDULE OF INVESTMENTS—(Continued)
June 30, 2017 (Unaudited)
| Number of Shares | Value | ||||||||||||||
RESIDENTIAL | 0.1% | ||||||||||||||
UNITE Group PLC/The | 36,087 | $ | 305,040 | ||||||||||||
SELF STORAGE | 0.1% | ||||||||||||||
Big Yellow Group PLC | 21,099 | 217,645 | |||||||||||||
Safestore Holdings PLC | 25,694 | 141,022 | |||||||||||||
358,667 | |||||||||||||||
TOTAL REAL ESTATE | 1,913,322 | ||||||||||||||
WATER | 0.4% | ||||||||||||||
United Utilities Group PLC | 79,025 | 892,884 | |||||||||||||
TOTAL UNITED KINGDOM | 20,093,712 | ||||||||||||||
UNITED STATES | 63.0% | ||||||||||||||
COMMUNICATIONS—TOWERS | 1.5% | ||||||||||||||
American Tower Corp. | 15,939 | 2,109,048 | |||||||||||||
Crown Castle International Corp. | 12,359 | 1,238,125 | |||||||||||||
SBA Communications Corp.c | 2,028 | 273,577 | |||||||||||||
3,620,750 | |||||||||||||||
CONSUMER—CYCLICAL | 5.7% | ||||||||||||||
AIRLINES | 0.7% | ||||||||||||||
Alaska Air Group | 17,169 | 1,541,089 | |||||||||||||
MEDIA | 2.6% | ||||||||||||||
The Walt Disney Co.a | 25,661 | 2,726,481 | |||||||||||||
Twenty-First Century Fox, Class Aa | 85,207 | 2,414,767 | |||||||||||||
Viacom, Class Bd | 32,000 | 1,074,240 | |||||||||||||
6,215,488 | |||||||||||||||
RESTAURANT | 0.9% | ||||||||||||||
Starbucks Corp.a | 35,545 | 2,072,629 | |||||||||||||
RETAIL | 0.6% | ||||||||||||||
Ross Storesd | 25,956 | 1,498,440 | |||||||||||||
SPECIALTY RETAIL | 0.9% | ||||||||||||||
Home Depot/Thed | 14,598 | 2,239,333 | |||||||||||||
TOTAL CONSUMER—CYCLICAL | 13,566,979 | ||||||||||||||
See accompanying notes to financial statements.
16
COHEN & STEERS GLOBAL INCOME BUILDER, INC.
SCHEDULE OF INVESTMENTS—(Continued)
June 30, 2017 (Unaudited)
| Number of Shares | Value | ||||||||||||||
CONSUMER—NON-CYCLICAL | 5.9% | ||||||||||||||
AGRICULTURE | 3.1% | ||||||||||||||
Altria Groupa | 98,753 | $ | 7,354,136 | ||||||||||||
FOOD PRODUCTS | 1.9% | ||||||||||||||
Kraft Heinz Co/Thea | 25,838 | 2,212,766 | |||||||||||||
Tyson Foods, Class Aa | 39,128 | 2,450,587 | |||||||||||||
4,663,353 | |||||||||||||||
RETAIL | 0.9% | ||||||||||||||
CVS Caremark Corp. | 25,690 | 2,067,017 | |||||||||||||
TOTAL CONSUMER—NON-CYCLICAL | 14,084,506 | ||||||||||||||
DIVERSIFIED | 0.1% | ||||||||||||||
Macquarie Infrastructure Co. LLC | 3,102 | 243,197 | |||||||||||||
ELECTRIC | 1.4% | ||||||||||||||
INTEGRATED ELECTRIC | 0.3% | ||||||||||||||
NextEra Energy | 3,433 | 481,066 | |||||||||||||
Pattern Energy Group | 10,394 | 247,793 | |||||||||||||
728,859 | |||||||||||||||
REGULATED ELECTRIC | 1.1% | ||||||||||||||
CMS Energy Corp. | 5,532 | 255,855 | |||||||||||||
Edison International | 11,358 | 888,082 | |||||||||||||
Great Plains Energy | 9,129 | 267,297 | |||||||||||||
WEC Energy Group | 3,292 | 202,063 | |||||||||||||
Xcel Energyd | 24,285 | 1,114,196 | |||||||||||||
2,727,493 | |||||||||||||||
TOTAL ELECTRIC | 3,456,352 | ||||||||||||||
ENERGY | 3.8% | ||||||||||||||
OIL & GAS | 3.2% | ||||||||||||||
EOG Resources | 25,778 | 2,333,424 | |||||||||||||
Exxon Mobil Corp. | 46,609 | 3,762,745 | |||||||||||||
Pioneer Natural Resources Co. | 9,726 | 1,552,075 | |||||||||||||
7,648,244 | |||||||||||||||
OIL & GAS SERVICES | 0.6% | ||||||||||||||
Schlumberger Ltd.d | 21,900 | 1,441,896 | |||||||||||||
TOTAL ENERGY | 9,090,140 | ||||||||||||||
See accompanying notes to financial statements.
17
COHEN & STEERS GLOBAL INCOME BUILDER, INC.
SCHEDULE OF INVESTMENTS—(Continued)
June 30, 2017 (Unaudited)
| Number of Shares | Value | ||||||||||||||
FINANCIAL | 9.2% | ||||||||||||||
BANKS | 3.3% | ||||||||||||||
Bank of America Corp.a | 195,414 | $ | 4,740,744 | ||||||||||||
Huntington Bancshares | 116,253 | 1,571,740 | |||||||||||||
PNC Financial Services Groupa | 12,891 | 1,609,699 | |||||||||||||
7,922,183 | |||||||||||||||
CREDIT CARD | 0.4% | ||||||||||||||
Discover Financial Services | 16,500 | 1,026,135 | |||||||||||||
DIVERSIFIED FINANCIAL SERVICES | 3.9% | ||||||||||||||
Ameriprise Financial | 11,833 | 1,506,222 | |||||||||||||
BlackRock | 4,498 | 1,900,000 | |||||||||||||
JPMorgan Chase & Co.a | 39,144 | 3,577,762 | |||||||||||||
Morgan Stanleyd | 52,260 | 2,328,706 | |||||||||||||
9,312,690 | |||||||||||||||
INSURANCE | 1.6% | ||||||||||||||
Assurant | 13,101 | 1,358,443 | |||||||||||||
Prudential Financiala | 21,581 | 2,333,769 | |||||||||||||
3,692,212 | |||||||||||||||
TOTAL FINANCIAL | 21,953,220 | ||||||||||||||
GAS DISTRIBUTION | 0.5% | ||||||||||||||
Atmos Energy Corp.d | 5,603 | 464,769 | |||||||||||||
Sempra Energyd | 7,505 | 846,189 | |||||||||||||
1,310,958 | |||||||||||||||
HEALTH CARE | 10.2% | ||||||||||||||
BIOTECHNOLOGY | 1.0% | ||||||||||||||
Gilead Sciences | 32,767 | 2,319,248 | |||||||||||||
HEALTH CARE EQUIPMENT & SUPPLIES | 2.8% | ||||||||||||||
Abbott Laboratories | 38,162 | 1,855,055 | |||||||||||||
Teleflexd | 11,323 | 2,352,466 | |||||||||||||
Zimmer Holdingsa | 19,079 | 2,449,744 | |||||||||||||
6,657,265 | |||||||||||||||
HEALTH CARE PROVIDERS & SERVICES | 3.1% | ||||||||||||||
Aetnaa | 32,628 | 4,953,909 | |||||||||||||
Cigna Corp.a | 14,989 | 2,509,009 | |||||||||||||
7,462,918 | |||||||||||||||
See accompanying notes to financial statements.
18
COHEN & STEERS GLOBAL INCOME BUILDER, INC.
SCHEDULE OF INVESTMENTS—(Continued)
June 30, 2017 (Unaudited)
| Number of Shares | Value | ||||||||||||||
HEALTHCARE PRODUCTS | 0.8% | ||||||||||||||
Johnson & Johnsona | 15,000 | $ | 1,984,350 | ||||||||||||
PHARMACEUTICALS | 2.5% | ||||||||||||||
Bristol-Myers Squibb Co.a | 58,922 | 3,283,134 | |||||||||||||
Pfizera | 83,000 | 2,787,970 | |||||||||||||
6,071,104 | |||||||||||||||
TOTAL HEALTH CARE | 24,494,885 | ||||||||||||||
INDUSTRIALS | 6.0% | ||||||||||||||
AEROSPACE & DEFENSE | 1.3% | ||||||||||||||
General Dynamics Corp.a | 15,461 | 3,062,824 | |||||||||||||
AIR FREIGHT & COURIERS | 1.9% | ||||||||||||||
FedEx Corp.a | 20,648 | 4,487,430 | |||||||||||||
DIVERSIFIED MANUFACTURING | 2.8% | ||||||||||||||
Caterpillar | 14,584 | 1,567,197 | |||||||||||||
Honeywell Internationala | 39,314 | 5,240,163 | |||||||||||||
6,807,360 | |||||||||||||||
TOTAL INDUSTRIALS | 14,357,614 | ||||||||||||||
INFORMATION TECHNOLOGY—IT CONSULTING & SERVICES | 0.5% | ||||||||||||||
PayPal Holdingsc | 22,288 | 1,196,197 | |||||||||||||
MATERIALS—CHEMICALS | 0.5% | ||||||||||||||
PPG Industriesd | 10,465 | 1,150,731 | |||||||||||||
PIPELINES | 1.5% | ||||||||||||||
PIPELINES—C-CORP | 1.3% | ||||||||||||||
Antero Midstream GP LPc | 11,466 | 252,023 | |||||||||||||
Cheniere Energyc,d | 17,422 | 848,626 | |||||||||||||
Kinder Morgand | 58,672 | 1,124,155 | |||||||||||||
ONEOK | 13,935 | 726,850 | |||||||||||||
SemGroup Corp., Class Ad | 6,828 | 184,356 | |||||||||||||
3,136,010 | |||||||||||||||
See accompanying notes to financial statements.
19
COHEN & STEERS GLOBAL INCOME BUILDER, INC.
SCHEDULE OF INVESTMENTS—(Continued)
June 30, 2017 (Unaudited)
| Number of Shares | Value | ||||||||||||||
PIPELINES—MLP | 0.2% | ||||||||||||||
Hess Midstream Partners LPc | 10,322 | $ | 210,259 | ||||||||||||
Noble Midstream Partners LP | 4,647 | 210,974 | |||||||||||||
Rice Midstream Partners LP | 4,431 | 88,354 | |||||||||||||
509,587 | |||||||||||||||
TOTAL PIPELINES | 3,645,597 | ||||||||||||||
RAILWAYS | 0.1% | ||||||||||||||
CSX Corp. | 3,911 | 213,384 | |||||||||||||
REAL ESTATE | 6.1% | ||||||||||||||
HEALTH CARE | 0.4% | ||||||||||||||
HCPd | 31,640 | 1,011,214 | |||||||||||||
HOTEL | 0.4% | ||||||||||||||
Hilton Worldwide Holdings | 2,944 | 182,086 | |||||||||||||
Host Hotels & Resorts | 13,895 | 253,862 | |||||||||||||
Red Rock Resorts, Class A | 5,563 | 131,009 | |||||||||||||
Sunstone Hotel Investorsd | 18,298 | 294,964 | |||||||||||||
861,921 | |||||||||||||||
INDUSTRIALS | 0.2% | ||||||||||||||
Prologis | 9,082 | 532,569 | |||||||||||||
OFFICE | 1.3% | ||||||||||||||
Corporate Office Properties Trust | 12,292 | 430,589 | |||||||||||||
Cousins Properties | 54,257 | 476,919 | |||||||||||||
Douglas Emmett | 10,372 | 396,314 | |||||||||||||
Empire State Realty Trust, Class A | 14,555 | 302,307 | |||||||||||||
Kilroy Realty Corp. | 3,982 | 299,247 | |||||||||||||
Parkway | 8,414 | 192,597 | |||||||||||||
SL Green Realty Corp.d | 4,144 | 438,435 | |||||||||||||
Vornado Realty Trustd | 6,030 | 566,217 | |||||||||||||
3,102,625 | |||||||||||||||
RESIDENTIAL | 2.0% | ||||||||||||||
APARTMENT | 1.2% | ||||||||||||||
AvalonBay Communitiesd | 5,838 | 1,121,889 | |||||||||||||
Essex Property Trustd | 3,836 | 986,888 | |||||||||||||
UDR | 19,090 | 743,937 | |||||||||||||
2,852,714 | |||||||||||||||
See accompanying notes to financial statements.
20
COHEN & STEERS GLOBAL INCOME BUILDER, INC.
SCHEDULE OF INVESTMENTS—(Continued)
June 30, 2017 (Unaudited)
| Number of Shares | Value | ||||||||||||||
MANUFACTURED HOME | 0.5% | ||||||||||||||
Equity Lifestyle Properties | 5,038 | $ | 434,981 | ||||||||||||
Sun Communities | 8,234 | 722,039 | |||||||||||||
1,157,020 | |||||||||||||||
SINGLE FAMILY | 0.2% | ||||||||||||||
American Homes 4 Rent, Class A | 22,047 | 497,601 | |||||||||||||
STUDENT HOUSING | 0.1% | ||||||||||||||
Education Realty Trustd | 7,659 | 296,786 | |||||||||||||
TOTAL RESIDENTIAL | 4,804,121 | ||||||||||||||
SELF STORAGE | 0.3% | ||||||||||||||
Extra Space Storage | 8,439 | 658,242 | |||||||||||||
SHOPPING CENTERS | 0.9% | ||||||||||||||
COMMUNITY CENTER | 0.3% | ||||||||||||||
Brixmor Property Group | 6,982 | 124,838 | |||||||||||||
Kimco Realty Corp. | 5,475 | 100,466 | |||||||||||||
Weingarten Realty Investors | 15,025 | 452,253 | |||||||||||||
677,557 | |||||||||||||||
FREE STANDING | 0.2% | ||||||||||||||
Realty Income Corp. | 11,072 | 610,953 | |||||||||||||
REGIONAL MALL | 0.4% | ||||||||||||||
GGP | 20,839 | 490,967 | |||||||||||||
Simon Property Groupd | 2,764 | 447,104 | |||||||||||||
938,071 | |||||||||||||||
TOTAL SHOPPING CENTERS | 2,226,581 | ||||||||||||||
SPECIALTY | 0.6% | ||||||||||||||
CyrusOne | 5,365 | 299,099 | |||||||||||||
Digital Realty Trust | 3,361 | 379,625 | |||||||||||||
DuPont Fabros Technology | 7,473 | 457,048 | |||||||||||||
Equinix | 499 | 214,151 | |||||||||||||
GEO Group/The | 3,896 | 115,205 | |||||||||||||
1,465,128 | |||||||||||||||
TOTAL REAL ESTATE | 14,662,401 | ||||||||||||||
See accompanying notes to financial statements.
21
COHEN & STEERS GLOBAL INCOME BUILDER, INC.
SCHEDULE OF INVESTMENTS—(Continued)
June 30, 2017 (Unaudited)
| Number of Shares | Value | ||||||||||||||
TECHNOLOGY | 9.6% | ||||||||||||||
COMPUTERS | 3.3% | ||||||||||||||
Applea,d | 40,804 | $ | 5,876,592 | ||||||||||||
Cadence Design Systemsa,c | 62,338 | 2,087,700 | |||||||||||||
7,964,292 | |||||||||||||||
INFORMATION SERVICES | 0.6% | ||||||||||||||
Expediad | 8,962 | 1,334,890 | |||||||||||||
INTERNET SERVICE PROVIDER | 2.5% | ||||||||||||||
Alphabet, Class Aa,c | 6,511 | 6,053,146 | |||||||||||||
SEMICONDUCTORS | 1.3% | ||||||||||||||
Intel Corp.a | 92,515 | 3,121,456 | |||||||||||||
SOFTWARE | 0.9% | ||||||||||||||
Microsoft Corp.a | 30,432 | 2,097,678 | |||||||||||||
TELECOMMUNICATION EQUIPMENT | 1.0% | ||||||||||||||
Cisco Systemsa | 75,634 | 2,367,344 | |||||||||||||
TOTAL TECHNOLOGY | 22,938,806 | ||||||||||||||
WATER | 0.4% | ||||||||||||||
American Water Works Co.d | 11,549 | 900,245 | |||||||||||||
TOTAL UNITED STATES | 150,885,962 | ||||||||||||||
| TOTAL COMMON STOCK (Identified cost—$234,104,076) | 282,388,891 | ||||||||||||||
CLOSED-END FUNDS | 1.3% | ||||||||||||||
CANADA | 0.0% | ||||||||||||||
COMMODITIES | |||||||||||||||
Central Fund of Canada Ltd., Class A (USD) | 6,100 | 75,213 | |||||||||||||
UNITED STATES | 1.3% | ||||||||||||||
COVERED CALL | 0.2% | ||||||||||||||
| Eaton Vance Tax-Managed Buy-Write Opportunities Fundd | 9,349 | 142,572 | |||||||||||||
| Eaton Vance Tax-Managed Diversified Equity Income Fund | 13,213 | 149,043 | |||||||||||||
| Eaton Vance Tax-Managed Global Buy-Write Opportunities Fund | 7,483 | 85,157 | |||||||||||||
| Eaton Vance Tax-Managed Global Diversified Equity Income Fund | 17,855 | 163,730 | |||||||||||||
540,502 | |||||||||||||||
See accompanying notes to financial statements.
22
COHEN & STEERS GLOBAL INCOME BUILDER, INC.
SCHEDULE OF INVESTMENTS—(Continued)
June 30, 2017 (Unaudited)
| Number of Shares | Value | ||||||||||||||
EMERGING MARKETS EQUITY | 0.0% | ||||||||||||||
Templeton Emerging Markets Fund | 3,200 | $ | 47,712 | ||||||||||||
EQUITY TAX—ADVANTAGED | 0.2% | ||||||||||||||
| Eaton Vance Tax-Advantaged Dividend Income Fundd | 6,984 | 152,810 | |||||||||||||
| Eaton Vance Tax-Advantaged Global Dividend Income Fund | 4,443 | 75,842 | |||||||||||||
Gabelli Dividend & Income Trust | 7,218 | 157,496 | |||||||||||||
| John Hancock Tax-Advantaged Dividend Income Fundd | 5,979 | 152,943 | |||||||||||||
539,091 | |||||||||||||||
FINANCIAL | 0.1% | ||||||||||||||
Financial Select Sector SPDR Fund | 4,362 | 107,610 | |||||||||||||
SPDR S&P Bank ETF | 1,000 | 43,520 | |||||||||||||
151,130 | |||||||||||||||
INVESTMENT GRADE | 0.0% | ||||||||||||||
PIMCO Corporate and Income Opportunity Fund | 3,400 | 55,998 | |||||||||||||
MASTER LIMITED PARTNERSHIPS | 0.2% | ||||||||||||||
First Trust Energy Income and Growth Fund | 6,844 | 173,975 | |||||||||||||
Kayne Anderson MLP Investment Company | 4,286 | 80,791 | |||||||||||||
Neuberger Berman MLP Income Fund | 4,300 | 41,366 | |||||||||||||
Tortoise Energy Infrastructure Corp. | 1,400 | 42,546 | |||||||||||||
338,678 | |||||||||||||||
MULTI-SECTOR | 0.3% | ||||||||||||||
AllianzGI Convertible & Income Fund II | 7,900 | 49,138 | |||||||||||||
PIMCO Dynamic Credit Income Fund | 7,535 | 168,181 | |||||||||||||
PIMCO Dynamic Income Fund | 4,450 | 134,301 | |||||||||||||
PIMCO Income Opportunity Fund | 4,424 | 118,785 | |||||||||||||
PIMCO Income Strategy Fund II | 13,925 | 145,377 | |||||||||||||
615,782 | |||||||||||||||
MUNICIPAL | 0.1% | ||||||||||||||
BlackRock MuniHoldings Investment Quality Fund | 3,824 | 56,251 | |||||||||||||
Eaton Vance Municipal Bond Fund | 4,339 | 55,062 | |||||||||||||
Nuveen Municipal Credit Income Fund | 4,600 | 68,632 | |||||||||||||
179,945 | |||||||||||||||
See accompanying notes to financial statements.
23
COHEN & STEERS GLOBAL INCOME BUILDER, INC.
SCHEDULE OF INVESTMENTS—(Continued)
June 30, 2017 (Unaudited)
| Number of Shares | Value | ||||||||||||||
PREFERRED | 0.0% | ||||||||||||||
Nuveen Preferred Income Opportunities Fund | 8,414 | $ | 87,506 | ||||||||||||
REAL ESTATE | 0.0% | ||||||||||||||
Nuveen Real Estate Income Fund | 7,965 | 90,164 | |||||||||||||
SENIOR LOAN | 0.1% | ||||||||||||||
Nuveen Credit Strategies Income Fund | 15,903 | 136,925 | |||||||||||||
U.S. GENERAL EQUITY | 0.1% | ||||||||||||||
Consumer Discretionary Select Sector SPDR Fund | 500 | 44,815 | |||||||||||||
Gabelli Equity Trust | 13,857 | 85,636 | |||||||||||||
SPDR S&P 500 ETF Trust | 440 | 106,392 | |||||||||||||
236,843 | |||||||||||||||
TOTAL UNITED STATES | 3,020,276 | ||||||||||||||
| TOTAL CLOSED-END FUNDS (Identified cost—$2,862,059) | 3,095,489 | ||||||||||||||
PREFERRED SECURITIES—$25 PAR VALUE | 2.6% | ||||||||||||||
BERMUDA | 0.8% | ||||||||||||||
INSURANCE—REINSURANCE—FOREIGN | |||||||||||||||
Arch Capital Group Ltd., 5.25%, Series E (USD)e | 40,000 | 974,800 | |||||||||||||
Axis Capital Holdings Ltd., 5.50%, Series E (USD)e | 40,000 | 996,400 | |||||||||||||
TOTAL BERMUDA | 1,971,200 | ||||||||||||||
UNITED STATES | 1.8% | ||||||||||||||
BANKS | 1.0% | ||||||||||||||
Bank of America Corp., 6.50%, Series Ye | 40,000 | 1,076,800 | |||||||||||||
Citigroup, 6.875%, Series Ke | 20,039 | 592,954 | |||||||||||||
New York Community Bancorp, 6.375%, Series Ae | 4,500 | 128,700 | |||||||||||||
Wells Fargo & Co., 5.70%, Series We | 20,000 | 518,000 | |||||||||||||
2,316,454 | |||||||||||||||
ELECTRIC—INTEGRATED ELECTRIC | 0.4% | ||||||||||||||
Integrys Holdings, 6.00%, due 8/1/73 | 35,750 | 965,697 | |||||||||||||
REAL ESTATE—DIVERSIFIED | 0.4% | ||||||||||||||
VEREIT, 6.70%, Series Fe | 31,734 | 843,807 | |||||||||||||
TOTAL UNITED STATES | 4,125,958 | ||||||||||||||
| TOTAL PREFERRED SECURITIES—$25 PAR VALUE (Identified cost—$5,652,081) | 6,097,158 | ||||||||||||||
See accompanying notes to financial statements.
24
COHEN & STEERS GLOBAL INCOME BUILDER, INC.
SCHEDULE OF INVESTMENTS—(Continued)
June 30, 2017 (Unaudited)
| Principal Amount | Value | ||||||||||||||
PREFERRED SECURITIES—CAPITAL SECURITIES | 5.7% | ||||||||||||||
AUSTRALIA | 0.8% | ||||||||||||||
INSURANCE-FOREIGN | |||||||||||||||
| QBE Insurance Group Ltd., 6.75%, due 12/2/44 (USD) | $ | 1,755,000 | $ | 1,959,896 | |||||||||||
FRANCE | 0.9% | ||||||||||||||
BANKS—FOREIGN | |||||||||||||||
Credit Agricole SA, 8.125%, 144A (USD)b,e | 600,000 | 699,135 | |||||||||||||
BNP Paribas SA, 7.625%, 144A (USD)b,e | 800,000 | 882,000 | |||||||||||||
Societe Generale SA, 7.875%, 144A (USD)b,e | 600,000 | 661,500 | |||||||||||||
TOTAL FRANCE | 2,242,635 | ||||||||||||||
SWITZERLAND | 0.7% | ||||||||||||||
BANKS—FOREIGN | 0.3% | ||||||||||||||
UBS Group AG, 7.125% (USD)e | 600,000 | 649,350 | |||||||||||||
INSURANCE—REINSURANCE—FOREIGN | 0.4% | ||||||||||||||
Aquarius + Investments PLC, 8.25% (USD)e | 910,000 | 967,309 | |||||||||||||
TOTAL SWITZERLAND | 1,616,659 | ||||||||||||||
UNITED KINGDOM | 0.4% | ||||||||||||||
BANKS—FOREIGN | |||||||||||||||
Barclays PLC, 7.875% (USD)e | 400,000 | 431,356 | |||||||||||||
HSBC Holdings PLC, 6.875% (USD)e | 600,000 | 649,500 | |||||||||||||
1,080,856 | |||||||||||||||
UNITED STATES | 2.9% | ||||||||||||||
BANKS | 2.4% | ||||||||||||||
Bank of America Corp., 6.50%, Series Ze | 2,037,000 | 2,267,548 | |||||||||||||
Citigroup, 6.125%, Series Re | 500,000 | 538,125 | |||||||||||||
Citigroup, 6.25%, Series Te | 1,070,000 | 1,188,369 | |||||||||||||
Goldman Sachs Group/The, 5.70%, Series Le | 500,000 | 521,000 | |||||||||||||
Wells Fargo & Co., 5.875%, Series Ue | 1,100,000 | 1,213,542 | |||||||||||||
5,728,584 | |||||||||||||||
See accompanying notes to financial statements.
25
COHEN & STEERS GLOBAL INCOME BUILDER, INC.
SCHEDULE OF INVESTMENTS—(Continued)
June 30, 2017 (Unaudited)
| Principal Amount | Value | ||||||||||||||
INSURANCE—LIFE/HEALTH INSURANCE | 0.5% | ||||||||||||||
Prudential Financial, 5.625%, due 6/15/43 | $ | 1,000,000 | $ | 1,100,000 | |||||||||||
TOTAL UNITED STATES | 6,828,584 | ||||||||||||||
| TOTAL PREFERRED SECURITIES—CAPITAL SECURITIES (Identified cost—$12,837,886) | 13,728,630 | ||||||||||||||
| Number of Shares | |||||||||||||||
SHORT-TERM INVESTMENTS | 0.5% | ||||||||||||||
MONEY MARKET FUNDS | |||||||||||||||
| State Street Institutional Treasury Money Market Fund, Premier Class, 0.83%f | 1,300,000 | $ | 1,300,000 | ||||||||||||
| TOTAL SHORT-TERM INVESTMENTS (Identified cost—$1,300,000) | 1,300,000 | ||||||||||||||
TOTAL INVESTMENTS (Identified cost—$256,756,102) | 128.1 | % | 306,610,168 | ||||||||||||
WRITTEN OPTION CONTRACTS | (0.5 | ) | (1,224,720 | ) | |||||||||||
LIABILITIES IN EXCESS OF OTHER ASSETS | (27.6 | ) | (66,086,620 | ) | |||||||||||
| NET ASSETS (Equivalent to $10.34 per share based on 23,142,068 shares of common stock outstanding) | 100.0 | % | $ | 239,298,828 | |||||||||||
| Number of Contracts | |||||||||||||||
WRITTEN OPTION CONTRACTS—UNITED STATES | (0.5)% | ||||||||||||||
WRITTEN CALL OPTION CONTRACTS | |||||||||||||||
| S&P 500 Index, Call, USD Strike Price 2,425, expires 7/21/17 | 648 | $ | (1,224,720 | ) | |||||||||||
| TOTAL WRITTEN OPTION CONTRACTS (Premiums received—$1,797,568) | $ | (1,224,720 | ) | ||||||||||||
See accompanying notes to financial statements.
26
COHEN & STEERS GLOBAL INCOME BUILDER, INC.
SCHEDULE OF INVESTMENTS—(Continued)
June 30, 2017 (Unaudited)
Glossary of Portfolio Abbreviations
ETF Exchange-Traded Fund
GBP Great British Pound
HKD Hong Kong Dollar
MLP Master Limited Partnership
REIT Real Estate Investment Trust
SPDR Standard & Poor's Depositary Receipt
USD United States Dollar
Note: Percentages indicated are based on the net assets of the Fund.
a All or a portion of the security is pledged as collateral in connection with the Fund's revolving credit agreement. $136,711,247 in aggregate has been pledged as collateral.
b Resale is restricted to qualified institutional investors. Aggregate holdings amounting to $5,149,094 or 2.2% of the net assets of the Fund, of which 0.0% are illiquid.
c Non-income producing security.
d All or a portion of the security is pledged in connection with written option contracts. $33,376,365 in aggregate has been pledged as collateral.
e Perpetual security. Perpetual securities pay an indefinite stream of interest, but they may be called earlier by the issuer.
f Rate quoted represents the annualized seven-day yield of the fund.
See accompanying notes to financial statements.
27
COHEN & STEERS GLOBAL INCOME BUILDER, INC.
SCHEDULE OF INVESTMENTS—(Continued)
June 30, 2017 (Unaudited)
Sector Summary | % of Managed Assets | ||||||
Financial (Common) | 16.8 | ||||||
Health Care (Common) | 11.3 | ||||||
Technology (Common) | 9.5 | ||||||
Real Estate (Common) | 9.4 | ||||||
Industrials (Common) | 8.3 | ||||||
Consumer — Non-Cyclical (Common) | 7.4 | ||||||
Consumer — Cyclical (Common) | 4.7 | ||||||
Energy (Common) | 4.2 | ||||||
Materials (Common) | 3.8 | ||||||
Consumer Staples (Common) | 2.7 | ||||||
Banks (Preferred) | 2.6 | ||||||
Other | 2.6 | ||||||
Pipelines (Common) | 2.5 | ||||||
Electric (Common) | 2.1 | ||||||
Consumer Discretionary (Common) | 2.0 | ||||||
Communications (Common) | 1.6 | ||||||
Insurance (Preferred) | 1.3 | ||||||
Banks — Foreign (Preferred) | 1.3 | ||||||
Toll Roads (Common) | 1.0 | ||||||
Closed-End Funds | 1.0 | ||||||
Information Technology (Common) | 0.9 | ||||||
Telecommunication Services (Common) | 0.8 | ||||||
Water (Common) | 0.6 | ||||||
Insurance-Foreign (Preferred) | 0.6 | ||||||
Automotive (Common) | 0.5 | ||||||
Airports (Common) | 0.5 | ||||||
100.0 | |||||||
See accompanying notes to financial statements.
28
COHEN & STEERS GLOBAL INCOME BUILDER, INC.
STATEMENT OF ASSETS AND LIABILITIES
June 30, 2017 (Unaudited)
ASSETS: | |||||||
Investments in securities, at value (Identified cost—$256,756,102) | $ | 306,610,168 | |||||
Cash | 526,339 | ||||||
Foreign currency, at value (Identified cost—$92,065) | 91,874 | ||||||
Receivable for: | |||||||
Investment securities sold | 2,976,068 | ||||||
Dividends and interest | 937,178 | ||||||
Other assets | 14,472 | ||||||
Total Assets | 311,156,099 | ||||||
LIABILITIES: | |||||||
Written option contracts, at value (Premiums received—$1,797,568) | 1,224,720 | ||||||
Payable for: | |||||||
Revolving credit agreement | 68,300,000 | ||||||
Investment securities purchased | 1,711,362 | ||||||
Investment management fees | 253,754 | ||||||
Interest expense | 106,495 | ||||||
Dividends declared | 89,244 | ||||||
Administration fees | 20,300 | ||||||
Directors' fees | 368 | ||||||
Other liabilities | 151,028 | ||||||
Total Liabilities | 71,857,271 | ||||||
NET ASSETS | $ | 239,298,828 | |||||
NET ASSETS consist of: | |||||||
Paid-in capital | $ | 255,356,622 | |||||
Dividends in excess of net investment income | (7,989,011 | ) | |||||
Accumulated net realized loss | (58,498,638 | ) | |||||
Net unrealized appreciation | 50,429,855 | ||||||
$ | 239,298,828 | ||||||
NET ASSET VALUE PER SHARE: | |||||||
($239,298,828 ÷ 23,142,068 shares outstanding) | $ | 10.34 | |||||
MARKET PRICE PER SHARE | $ | 9.52 | |||||
MARKET PRICE PREMIUM (DISCOUNT) TO NET ASSET VALUE PER SHARE | (7.93 | )% | |||||
See accompanying notes to financial statements.
29
COHEN & STEERS GLOBAL INCOME BUILDER, INC.
STATEMENT OF OPERATIONS
For the Six Months Ended June 30, 2017 (Unaudited)
Investment Income: | |||||||
Dividend income (net of $254,755 of foreign withholding tax) | $ | 4,075,566 | |||||
Interest income | 396,628 | ||||||
Total Investment Income | 4,472,194 | ||||||
Expenses: | |||||||
Investment management fees | 1,506,692 | ||||||
Interest expense | 568,915 | ||||||
Administration fees | 153,227 | ||||||
Professional fees | 61,159 | ||||||
Custodian fees and expenses | 52,545 | ||||||
Shareholder reporting expenses | 30,210 | ||||||
Directors' fees and expenses | 10,146 | ||||||
Transfer agent fees and expenses | 9,990 | ||||||
Line of credit fees | 1,292 | ||||||
Miscellaneous | 30,634 | ||||||
Total Expenses | 2,424,810 | ||||||
Net Investment Income (Loss) | 2,047,384 | ||||||
Net Realized and Unrealized Gain (Loss): | |||||||
Net realized gain (loss) on: | |||||||
Investments | 11,160,307 | ||||||
Written option contracts | (2,949,285 | ) | |||||
Foreign currency transactions | 10,747 | ||||||
Net realized gain (loss) | 8,221,769 | ||||||
Net change in unrealized appreciation (depreciation) on: | |||||||
Investments | 12,357,990 | ||||||
Written option contracts | (351,635 | ) | |||||
Foreign currency translations | 18,724 | ||||||
Net change in unrealized appreciation (depreciation) | 12,025,079 | ||||||
Net Realized and Unrealized Gain (Loss) | 20,246,848 | ||||||
Net Increase (Decrease) in Net Assets Resulting from Operations | $ | 22,294,232 | |||||
See accompanying notes to financial statements.
30
COHEN & STEERS GLOBAL INCOME BUILDER, INC.
STATEMENT OF CHANGES IN NET ASSETS (Unaudited)
| For the Six Months Ended June 30, 2017 | For the Year Ended December 31, 2016 | ||||||||||
Change in Net Assets: | |||||||||||
From Operations: | |||||||||||
Net investment income (loss) | $ | 2,047,384 | $ | 4,143,674 | |||||||
Net realized gain (loss) | 8,221,769 | (6,769,914 | ) | ||||||||
| Net change in unrealized appreciation (depreciation) | 12,025,079 | 11,735,388 | |||||||||
| Net increase (decrease) in net assets resulting from operations | 22,294,232 | 9,109,148 | |||||||||
Dividends and Distributions to Shareholders from: | |||||||||||
Net investment income | (9,580,816 | ) | (4,761,229 | ) | |||||||
Return of capital | — | (16,552,616 | ) | ||||||||
| Total dividends and distributions to shareholders | (9,580,816 | ) | (21,313,845 | ) | |||||||
Total increase (decrease) in net assets | 12,713,416 | (12,204,697 | ) | ||||||||
Net Assets: | |||||||||||
Beginning of period | 226,585,412 | 238,790,109 | |||||||||
End of perioda | $ | 239,298,828 | $ | 226,585,412 | |||||||
a Includes dividends in excess of net investment income of $7,989,011 and $455,579, respectively.
See accompanying notes to financial statements.
31
COHEN & STEERS GLOBAL INCOME BUILDER, INC.
STATEMENT OF CASH FLOWS
For the Six Months Ended June 30, 2017 (Unaudited)
Increase (Decrease) in Cash: | |||||||
Cash Flows from Operating Activities: | |||||||
Net increase (decrease) in net assets resulting from operations | $ | 22,294,232 | |||||
| Adjustments to reconcile net increase (decrease) in net assets resulting from operations to net cash provided by operating activities: | |||||||
| Purchases of long-term investments | (88,725,466 | ) | |||||
| Proceeds from sales and maturities of long-term investments | 97,066,140 | ||||||
| Net purchases, sales and maturities of short-term investments | 601,424 | ||||||
Net amortization of premium on investments | 27,152 | ||||||
Net increase in dividends and interest receivable and other assets | (173,529 | ) | |||||
| Net decrease in interest expense payable, accrued expenses and other liabilities | (10,703 | ) | |||||
Increase in premiums received from written option contracts | 149,485 | ||||||
Net change in unrealized depreciation on written option contracts | 351,635 | ||||||
Net change in unrealized appreciation on investments | (12,357,990 | ) | |||||
Net realized gain on investments | (11,160,307 | ) | |||||
Cash provided by operating activities | 8,062,073 | ||||||
Cash Flows from Financing Activities: | |||||||
Dividends and distributions paid | (9,592,310 | ) | |||||
Increase (decrease) in cash | (1,530,237 | ) | |||||
Cash at beginning of period (including foreign currency) | 2,148,450 | ||||||
Cash at end of period (including foreign currency) | $ | 618,213 | |||||
Supplemental Disclosure of Cash Flow Information:
During the six months ended June 30, 2017, interest paid was $544,308. | |||
See accompanying notes to financial statements.
32
COHEN & STEERS GLOBAL INCOME BUILDER, INC.
FINANCIAL HIGHLIGHTS (Unaudited)
The following table includes selected data for a share outstanding throughout each period and other performance information derived from the financial statements. It should be read in conjunction with the financial statements and notes thereto.
For the Six | For the Year Ended December 31, | ||||||||||||||||||||||||||
Months Ended | |||||||||||||||||||||||||||
Per Share Operating Performance: | June 30, 2017 | 2016 | 2015 | 2014 | 2013 | 2012 | |||||||||||||||||||||
| Net asset value, beginning of period | $ | 9.79 | $ | 10.32 | $ | 11.67 | $ | 12.31 | $ | 11.33 | $ | 10.67 | |||||||||||||||
| Income (loss) from investment operations: | |||||||||||||||||||||||||||
Net investment income (loss) | 0.09 | a | 0.18 | a | 0.17 | a | 0.22 | a | 0.21 | a | 0.26 | ||||||||||||||||
| Net realized and unrealized gain (loss) | 0.87 | 0.21 | (0.40 | ) | 0.26 | 1.89 | b | 1.52 | |||||||||||||||||||
| Total from investment operations | 0.96 | 0.39 | (0.23 | ) | 0.48 | 2.10 | 1.78 | ||||||||||||||||||||
| Less dividends and distributions to shareholders from: | |||||||||||||||||||||||||||
Net investment income | (0.41 | ) | (0.21 | ) | (0.97 | ) | (0.94 | ) | (0.70 | ) | (0.28 | ) | |||||||||||||||
Return of capital | — | (0.71 | ) | (0.15 | ) | (0.18 | ) | (0.42 | ) | (0.84 | ) | ||||||||||||||||
| Total dividends and distributions to shareholders | (0.41 | ) | (0.92 | ) | (1.12 | ) | (1.12 | ) | (1.12 | ) | (1.12 | ) | |||||||||||||||
| Anti-dilutive effect from the issuance of reinvested shares | — | — | 0.00 | c | 0.00 | c | — | — | |||||||||||||||||||
| Net increase (decrease) in net asset value | 0.55 | (0.53 | ) | (1.35 | ) | (0.64 | ) | 0.98 | 0.66 | ||||||||||||||||||
Net asset value, end of period | $ | 10.34 | $ | 9.79 | $ | 10.32 | $ | 11.67 | $ | 12.31 | $ | 11.33 | |||||||||||||||
Market value, end of period | $ | 9.52 | $ | 8.53 | $ | 9.46 | $ | 11.74 | $ | 11.34 | $ | 10.32 | |||||||||||||||
Total net asset value returnd | 10.40 | %e | 5.26 | % | –1.70 | % | 3.81 | % | 20.09 | % | 17.80 | % | |||||||||||||||
Total market value returnd | 16.66 | %e | 0.05 | % | –10.43 | % | 13.36 | % | 21.46 | % | 23.10 | % | |||||||||||||||
See accompanying notes to financial statements.
33
COHEN & STEERS GLOBAL INCOME BUILDER, INC.
FINANCIAL HIGHLIGHTS (Unaudited)—(Continued)
For the Six | For the Year Ended December 31, | ||||||||||||||||||||||||||
Months Ended | |||||||||||||||||||||||||||
Ratios/Supplemental Data: | June 30, 2017 | 2016 | 2015 | 2014 | 2013 | 2012 | |||||||||||||||||||||
| Net assets, end of period (in millions) | $ | 239.3 | $ | 226.6 | $ | 238.8 | $ | 269.6 | $ | 283.5 | $ | 260.9 | |||||||||||||||
| Ratio of expenses to average daily net assetsf | 2.08 | %g | 1.98 | % | 1.79 | % | 1.72 | % | 1.81 | % | 1.91 | % | |||||||||||||||
| Ratio of expenses to average daily net assets (excluding interest expense)f | 1.59 | %g | 1.60 | % | 1.54 | % | 1.50 | % | 1.57 | % | 1.61 | % | |||||||||||||||
| Ratio of net investment income (loss) to average daily net assetsf | 1.75 | %g | 1.82 | % | 1.48 | % | 1.75 | % | 1.78 | % | 2.26 | % | |||||||||||||||
| Ratio of expenses to average daily managed assetsf,h | 1.61 | %g | 1.51 | % | 1.42 | % | 1.38 | % | 1.44 | % | 1.50 | % | |||||||||||||||
Portfolio turnover rate | 30 | %e | 78 | % | 77 | % | 77 | % | 81 | % | 44 | % | |||||||||||||||
Revolving Credit Agreement | |||||||||||||||||||||||||||
| Asset coverage ratio for revolving credit agreement | 450 | % | 432 | % | 442 | % | 486 | % | 506 | % | 474 | % | |||||||||||||||
| Asset coverage per $1,000 for revolving credit agreement | $ | 4,504 | $ | 4,318 | $ | 4,421 | $ | 4,862 | $ | 5,062 | $ | 4,737 | |||||||||||||||
a Calculation based on average shares outstanding.
b Includes gains resulting from class action litigation payments on securities owned in prior years. Without these gains, the net realized and unrealized gains (losses) on investments per share would have been $1.88 and the total return on an NAV basis would have been 20.05%.
c Amount is less than $0.005.
d Total net asset value return measures the change in net asset value per share over the period indicated. Total market value return is computed based upon the Fund's market price per share and excludes the effects of brokerage commissions. Dividends and distributions are assumed, for purposes of these calculations, to be reinvested at prices obtained under the Fund's dividend reinvestment plan.
e Not annualized.
f Does not include expenses incurred by the closed-end funds in which the Fund invests.
g Annualized.
h Average daily managed assets represent net assets plus the outstanding balance of the revolving credit agreement.
See accompanying notes to financial statements.
34
COHEN & STEERS GLOBAL INCOME BUILDER, INC.
NOTES TO FINANCIAL STATEMENTS (Unaudited)
Note 1. Organization and Significant Accounting Policies
Cohen & Steers Global Income Builder, Inc. (the Fund) was incorporated under the laws of the State of Maryland on April 10, 2007 and is registered under the Investment Company Act of 1940 (the 1940 Act) as a diversified closed-end management investment company. The Fund's investment objective is total return with an emphasis on high current income.
The following is a summary of significant accounting policies consistently followed by the Fund in the preparation of its financial statements. The Fund is an investment company and, accordingly, follows the investment company accounting and reporting guidance of the Financial Accounting Standards Board Accounting Standards Codification (ASC) Topic 946—Investment Companies. The accounting policies of the Fund are in conformity with accounting principles generally accepted in the United States of America (GAAP). The preparation of the financial statements in accordance with GAAP requires management to make estimates and assumptions that affect the reported amounts of assets and liabilities at the date of the financial statements and the reported amounts of income and expenses during the reporting period. Actual results could differ from those estimates.
Portfolio Valuation: Investments in securities that are listed on the NYSE are valued, except as indicated below, at the last sale price reflected at the close of the NYSE on the business day as of which such value is being determined. If there has been no sale on such day, the securities are valued at the mean of the closing bid and ask prices on such day or, if no ask price is available, at the bid price. Exchange traded options are valued at their last sale price as of the close of options trading on applicable exchanges on the valuation date. In the absence of a last sale price on such day, options are valued at the average of the quoted bid and ask prices as of the close of business. Over-the-counter (OTC) options are valued based upon prices provided by a third-party pricing service or counterparty.
Securities not listed on the NYSE but listed on other domestic or foreign securities exchanges (including NASDAQ) are valued in a similar manner. Securities traded on more than one securities exchange are valued at the last sale price reflected at the close of the exchange representing the principal market for such securities on the business day as of which such value is being determined. If after the close of a foreign market, but prior to the close of business on the day the securities are being valued, market conditions change significantly, certain non-U.S. equity holdings may be fair valued pursuant to procedures established by the Board of Directors.
Readily marketable securities traded in the OTC market, including listed securities whose primary market is believed by Cohen & Steers Capital Management, Inc. (the investment manager) to be OTC, are valued on the basis of prices provided by a third-party pricing service or third-party broker-dealers when such prices are believed by the investment manager, pursuant to delegation by the Board of Directors, to reflect the fair value of such securities.
Fixed-income securities are valued on the basis of prices provided by a third-party pricing service or third-party broker-dealers when such prices are believed by the investment manager, pursuant to delegation by the Board of Directors, to reflect the fair value of such securities. The pricing services or broker-dealers use multiple valuation techniques to determine fair value. In instances where sufficient market activity exists, the pricing services or broker-dealers may utilize a market-based approach through which quotes from market makers are used to determine fair value. In instances where sufficient
35
COHEN & STEERS GLOBAL INCOME BUILDER, INC.
NOTES TO FINANCIAL STATEMENTS (Unaudited)—(Continued)
market activity may not exist or is limited, the pricing services or broker-dealers also utilize proprietary valuation models which may consider market transactions in comparable securities and the various relationships between securities in determining fair value and/or characteristics such as benchmark yield curves, option-adjusted spreads, credit spreads, estimated default rates, coupon rates, anticipated timing of principal repayments, underlying collateral, and other unique security features which are then used to calculate the fair values.
Short-term debt securities with a maturity date of 60 days or less are valued at amortized cost, which approximates fair value. Investments in open-end mutual funds are valued at their closing net asset value.
The policies and procedures approved by the Fund's Board of Directors delegate authority to make fair value determinations to the investment manager, subject to the oversight of the Board of Directors. The investment manager has established a valuation committee (Valuation Committee) to administer, implement and oversee the fair valuation process according to the policies and procedures approved annually by the Board of Directors. Among other things, these procedures allow the Fund to utilize independent pricing services, quotations from securities and financial instrument dealers and other market sources to determine fair value.
Securities for which market prices are unavailable, or securities for which the investment manager determines that the bid and/or ask price or a counterparty valuation does not reflect market value, will be valued at fair value, as determined in good faith by the Valuation Committee, pursuant to procedures approved by the Fund's Board of Directors. Circumstances in which market prices may be unavailable include, but are not limited to, when trading in a security is suspended, the exchange on which the security is traded is subject to an unscheduled close or disruption or material events occur after the close of the exchange on which the security is principally traded. In these circumstances, the Fund determines fair value in a manner that fairly reflects the market value of the security on the valuation date based on consideration of any information or factors it deems appropriate. These may include, but are not limited to, recent transactions in comparable securities, information relating to the specific security and developments in the markets.
Foreign equity fair value pricing procedures utilized by the Fund may cause certain non-U.S. equity holdings to be fair valued on the basis of fair value factors provided by a pricing service to reflect any significant market movements between the time the Fund values such securities and the earlier closing of foreign markets.
The Fund's use of fair value pricing may cause the net asset value of Fund shares to differ from the net asset value that would be calculated using market quotations. Fair value pricing involves subjective judgments and it is possible that the fair value determined for a security may be materially different than the value that could be realized upon the sale of that security.
Fair value is defined as the price that the Fund would expect to receive upon the sale of an investment or expect to pay to transfer a liability in an orderly transaction with an independent buyer in the principal market or, in the absence of a principal market, the most advantageous market for the
36
COHEN & STEERS GLOBAL INCOME BUILDER, INC.
NOTES TO FINANCIAL STATEMENTS (Unaudited)—(Continued)
investment or liability. The hierarchy of inputs that are used in determining the fair value of the Fund's investments is summarized below.
• Level 1—quoted prices in active markets for identical investments
• Level 2—other significant observable inputs (including quoted prices for similar investments, interest rates, credit risk, etc.)
• Level 3—significant unobservable inputs (including the Fund's own assumptions in determining the fair value of investments)
The inputs or methodology used for valuing securities may or may not be an indication of the risk associated with investing in those securities.
For movements between the levels within the fair value hierarchy, the Fund has adopted a policy of recognizing the transfer at the end of the period in which the underlying event causing the movement occurred. Changes in valuation techniques may result in transfers into or out of an assigned level within the disclosure hierarchy. There were no transfers between Level 1 and Level 2 investments as of June 30, 2017.
The following is a summary of the inputs used as of June 30, 2017 in valuing the Fund's investments carried at value:
Total | Quoted Prices in Active Markets for Identical Investments (Level 1) | Other Significant Observable Inputs (Level 2) | Significant Unobservable Inputs (Level 3) | ||||||||||||||||
Common Stock | $ | 282,388,891 | $ | 282,388,891 | $ | — | $ | — | |||||||||||
Closed End Funds | 3,095,489 | 3,095,489 | — | — | |||||||||||||||
| Preferred Securities— $25 Par Value: | |||||||||||||||||||
| United States | 4,125,958 | 3,160,261 | 965,697 | — | |||||||||||||||
Other Countries | 1,971,200 | 1,971,200 | — | — | |||||||||||||||
| Preferred Securities— Capital Securities | 13,728,630 | — | 13,728,630 | — | |||||||||||||||
Short-Term Investments | 1,300,000 | — | 1,300,000 | — | |||||||||||||||
Total Investmentsa | $ | 306,610,168 | $ | 290,615,841 | $ | 15,994,327 | $ | — | |||||||||||
Written option contracts | $ | (1,224,720 | ) | $ | (1,224,720 | ) | $ | — | — | ||||||||||
| Total Written Option Contractsa | $ | (1,224,720 | ) | $ | (1,224,720 | ) | $ | — | $ | — | |||||||||
a Portfolio holdings are disclosed individually on the Schedule of Investments.
37
COHEN & STEERS GLOBAL INCOME BUILDER, INC.
NOTES TO FINANCIAL STATEMENTS (Unaudited)—(Continued)
The following is a reconciliation of investments for which significant unobservable inputs (Level 3) were used in determining fair value:
| Common Stock— United States | |||||||
Balance as of December 31, 2016 | $ | 2,070,055 | |||||
Change in unrealized appreciation (depreciation) | 29,918 | ||||||
| Sales | (2,099,973 | ) | |||||
Balance as of June 30, 2017 | $ | — | |||||
Security Transactions and Investment Income: Security transactions are recorded on trade date. Realized gains and losses on investments sold are recorded on the basis of identified cost. Interest income is recorded on the accrual basis. Discounts are accreted and premiums are amortized over the life of the respective securities. Dividend income is recorded on the ex-dividend date, except for certain dividends on foreign securities, which are recorded as soon as the Fund is informed after the ex-dividend date. Distributions from U.S. Real Estate Investment Trusts (REITs) and Closed-End Funds (CEFs) are recorded as ordinary income, net realized capital gain or return of capital based on information reported by the REITs, CEFs and management's estimates of such amounts based on historical information. These estimates are adjusted when the actual source of distributions is disclosed by the REITs and CEFs and actual amounts may differ from the estimated amounts. Distributions from Master Limited Partnerships (MLPs) are recorded as income and return of capital based on information reported by the MLPs and management's estimates of such amounts based on historical information. These estimates are adjusted when the actual source of distributions is disclosed by the MLPs and actual amounts may differ from the estimated amounts.
Options: The Fund may purchase and write exchange-listed and OTC put or call options on securities, stock indices and other financial instruments to enhance portfolio returns and reduce overall volatility.
When the Fund writes (sells) an option, an amount equal to the premium received by the Fund is recorded on the Statement of Assets and Liabilities as a liability. The amount of the liability is subsequently marked-to-market to reflect the current market value of the option written. When an option expires, the Fund realizes a gain on the option to the extent of the premium received. Premiums received from writing options which are exercised or closed are added to or offset against the proceeds or amount paid on the transaction to determine the realized gain or loss. If a put option on a security is exercised, the premium reduces the cost basis of the security purchased by the Fund. If a call option is exercised, the premium is added to the proceeds of the security sold to determine the realized gain or loss. The Fund, as writer of an option, bears the market risk of an unfavorable change in the price of the underlying investment. Other risks include the possibility of an illiquid options market or the inability of the counterparties to fulfill their obligations under the contracts.
38
COHEN & STEERS GLOBAL INCOME BUILDER, INC.
NOTES TO FINANCIAL STATEMENTS (Unaudited)—(Continued)
Put and call options purchased are accounted for in the same manner as portfolio securities. Premiums paid for purchasing options which expire are treated as realized losses. Premiums paid for purchasing options which are exercised or closed are added to the amounts paid or offset against the proceeds on the underlying investment transaction to determine the realized gain or loss when the underlying transaction is executed. The risk associated with purchasing an option is that the Fund pays a premium whether or not the option is exercised. Additionally, the Fund bears the risk of loss of the premium and change in market value should the counterparty not perform under the contract.
Foreign Currency Translation: The books and records of the Fund are maintained in U.S. dollars. Investment securities and other assets and liabilities denominated in foreign currencies are translated into U.S. dollars based upon prevailing exchange rates on the date of valuation. Purchases and sales of investment securities and income and expense items denominated in foreign currencies are translated into U.S. dollars based upon prevailing exchange rates on the respective dates of such transactions. The Fund does not isolate that portion of the results of operations resulting from fluctuations in foreign exchange rates on investments from the fluctuations arising from changes in market prices of securities held. Such fluctuations are included with the net realized and unrealized gain or loss on investments.
Net realized foreign exchange gains or losses arise from sales of foreign currencies, including gains and losses on forward foreign currency exchange contracts, currency gains or losses realized between the trade and settlement dates on securities transactions, and the difference between the amounts of dividends, interest, and foreign withholding taxes recorded on the Fund's books and the U.S. dollar equivalent of the amounts actually received or paid. Net unrealized foreign exchange gains and losses arise from changes in the values of assets and liabilities, other than investments in securities, on the date of valuation, resulting from changes in exchange rates. Pursuant to U.S. federal income tax regulations, certain foreign currency gains/losses included in realized and unrealized gains/losses are included in or are a reduction of ordinary income for federal income tax purposes.
Forward Foreign Currency Exchange Contracts: The Fund may enter into forward foreign currency exchange contracts to hedge the currency exposure associated with certain of its non-U.S. dollar denominated securities. A forward foreign currency exchange contract is a commitment between two parties to purchase or sell foreign currency at a set price on a future date. The market value of a forward foreign currency exchange contract fluctuates with changes in foreign currency exchange rates. These contracts are marked-to-market daily and the change in value is recorded by the Fund as unrealized appreciation and/or depreciation on foreign currency translations. Realized gains or losses equal to the difference between the value of the contract at the time it was opened and the value at the time it was closed are included in net realized gain or loss on foreign currency transactions. For federal income tax purposes, the Fund has made an election to treat gains and losses from forward foreign currency exchange contracts as capital gains and losses.
Forward foreign currency exchange contracts involve elements of market risk in excess of the amounts reflected on the Statement of Assets and Liabilities. The Fund bears the risk of an unfavorable change in the foreign exchange rate underlying the contract. Risks may also arise upon entering these contracts from the potential inability of the counterparties to meet the terms of their contracts. In
39
COHEN & STEERS GLOBAL INCOME BUILDER, INC.
NOTES TO FINANCIAL STATEMENTS (Unaudited)—(Continued)
connection with these contracts, securities may be identified as collateral in accordance with the terms of the respective contracts. At June 30, 2017, the Fund did not have any forward foreign currency exchange contracts outstanding.
Dividends and Distributions to Shareholders: The Fund makes regular distributions pursuant to the Policy. Dividends from net investment income and capital gain distributions are determined in accordance with U.S. federal income tax regulations, which may differ from GAAP. Dividends from net investment income, if any, are declared quarterly and paid monthly. Net realized capital gains, unless offset by any available capital loss carryforward, are typically distributed to shareholders at least annually. Dividends and distributions to shareholders are recorded on the ex-dividend date and are automatically reinvested in full and fractional shares of the Fund in accordance with the Fund's Reinvestment Plan, unless the shareholder has elected to have them paid in cash.
Dividends from net investment income are subject to recharacterization for tax purposes. Based upon the results of operations for the six months ended June 30, 2017, the investment manager considers it likely that a portion of the dividends will be reclassified to distributions from return of capital upon the final determination of the Fund's taxable income after December 31, 2017, the Fund's fiscal year end.
Income Taxes: It is the policy of the Fund to continue to qualify as a regulated investment company (RIC), if such qualification is in the best interest of the shareholders, by complying with the requirements of Subchapter M of the Internal Revenue Code applicable to regulated investment companies, and by distributing substantially all of its taxable earnings to its shareholders. Also, in order to avoid the payment of any federal excise taxes, the Fund will distribute substantially all of its net investment income and net realized gains on a calendar year basis. Accordingly, no provision for federal income or excise tax is necessary. Dividend and interest income from holdings in non-U.S. securities is recorded net of non-U.S. taxes paid. Management has analyzed the Fund's tax positions taken on federal and applicable state income tax returns as well as its tax positions in non-U.S. jurisdictions in which it trades for all open tax years and has concluded that as of June 30, 2017, no additional provisions for income tax are required in the Fund's financial statements. The Fund's tax positions for the tax years for which the applicable statutes of limitations have not expired are subject to examination by the Internal Revenue Service, state departments of revenue and by foreign tax authorities.
Note 2. Investment Management Fees, Administration Fees and Other Transactions with Affiliates
Investment Management Fees: The investment manager serves as the Fund's investment manager pursuant to an investment management agreement (the investment management agreement). Under the terms of the investment management agreement, the investment manager provides the Fund with day-to-day investment decisions and generally manages the Fund's investments in accordance with the stated policies of the Fund, subject to the supervision of the Board of Directors.
40
COHEN & STEERS GLOBAL INCOME BUILDER, INC.
NOTES TO FINANCIAL STATEMENTS (Unaudited)—(Continued)
For the services provided to the Fund, the investment manager receives a fee, accrued daily and paid monthly, at the annual rate of 1.00% of the average daily managed assets of the Fund. Managed assets are equal to the net assets plus the amount of any borrowings, used for leverage, outstanding.
Under subadvisory agreements between the investment manager and each of Cohen & Steers Asia Limited and Cohen & Steers UK Limited (collectively, the subadvisors), affiliates of the investment manager, the subadvisors are responsible for managing the Fund's investments in certain non-U.S. real estate securities. For their services provided under the subadvisory agreements, the investment manager (not the Fund) pays the subadvisors. The investment manager allocates 50% of the investment management fee received from the Fund among itself and each subadvisor based on the portion of the Fund's average daily managed assets managed by the investment manager and each subadvisor.
Administration Fees: The Fund has entered into an administration agreement with the investment manager under which the investment manager performs certain administrative functions for the Fund and receives a fee, accrued daily and paid monthly, at the annual rate of 0.08% of the average daily managed assets of the Fund. For the six months ended June 30, 2017, the Fund incurred $120,535 in fees under this administration agreement. Additionally, the Fund pays State Street Bank and Trust Company as co-administrator under a fund accounting and administration agreement.
Directors' and Officers' Fees: Certain directors and officers of the Fund are also directors, officers and/or employees of the investment manager. The Fund does not pay compensation to directors and officers affiliated with the investment manager except for the Chief Compliance Officer, who received compensation from the investment manager, which was reimbursed by the Fund, in the amount of $1,792 for the six months ended June 30, 2017.
Note 3. Purchases and Sales of Securities
Purchases and sales of securities, excluding short-term investments, for the six months ended June 30, 2017, totaled $90,234,989 and $99,812,864, respectively.
Transactions in written option contracts during the six months ended June 30, 2017, were as follows:
| Number of Contracts | Premiums | ||||||||||
| Written option contracts outstanding at December 31, 2016 | 720 | $ | 1,648,083 | ||||||||
| Option contracts written | 6,197 | 13,171,615 | |||||||||
Option contracts expired | (958 | ) | (1,551,784 | ) | |||||||
Option contracts terminated in closing transactions | (3,020 | ) | (6,528,909 | ) | |||||||
Option contracts exercised | (2,291 | ) | (4,941,437 | ) | |||||||
| Written option contracts outstanding at June 30, 2017 | 648 | $ | 1,797,568 | ||||||||
41
COHEN & STEERS GLOBAL INCOME BUILDER, INC.
NOTES TO FINANCIAL STATEMENTS (Unaudited)—(Continued)
Note 4. Derivative Investments
The following tables present the value of derivatives held at June 30, 2017 and the effect of derivatives held during the six months ended June 30, 2017, along with the respective location in the financial statements. The volume of activity for written option contracts for the six months ended June 30, 2017 is summarized in Note 3.
Statement of Assets and Liabilities | |||||||||||||||||||
Assets | Liabilities | ||||||||||||||||||
Derivatives | Location | Fair Value | Location | Fair Value | |||||||||||||||
Equity Risk: | |||||||||||||||||||
| Written option contracts | — | $ | — | Written option contracts | $ | 1,224,720 | |||||||||||||
Statement of Operations | |||||||||||||||||||
Derivatives | Location | Realized Gain (Loss) | Change in Unrealized Appreciation (Depreciation) | ||||||||||||
Equity Risk: | |||||||||||||||
| Written option contracts | Net Realized and Unrealized Gain (Loss) | $ | (2,949,285 | ) | $ | (351,635 | ) | ||||||||
At June 30, 2017, the Fund's derivative assets and liabilities (by type), which are subject to a master netting agreement, are as follows:
Derivative Financial Instruments | Assets | Liabilities | |||||||||
Equity Risk: | |||||||||||
Written option contracts | $ | — | $ | 1,224,720 | |||||||
The following table presents the Fund's derivative liabilities by counterparty net of amounts available for offset under a master netting agreement and net of the related collateral pledged by the Fund, if any, as of June 30, 2017:
Counterparty | Gross Amount of Liabilities Presented in the Statement of Assets and Liabilities | Financial Instruments and Derivatives Available for Offset | Collateral Pledgeda | Net Amount of Derivative Liabilitiesb | |||||||||||||||
Morgan Stanley & Co., Inc. | $ | 1,224,720 | $ | — | $ | (1,224,720 | ) | $ | — | ||||||||||
a In some instances, the actual collateral pledged may be more than amount shown.
b Net amount represents the net payable due to the counterparty in the event of default.
42
COHEN & STEERS GLOBAL INCOME BUILDER, INC.
NOTES TO FINANCIAL STATEMENTS (Unaudited)—(Continued)
Note 5. Income Tax Information
As of June 30, 2017, the federal tax cost and net unrealized appreciation (depreciation) in value of securities held were as follows:
Cost for federal income tax purposes | $ | 256,756,102 | |||||
Gross unrealized appreciation | $ | 54,779,573 | |||||
Gross unrealized depreciation | (4,925,507 | ) | |||||
Net unrealized appreciation (depreciation) | $ | 49,854,066 | |||||
As of December 31, 2016, the Fund had a net capital loss carryforward of $64,836,540, which may be used to offset future capital gains. These losses are comprised of short-term capital loss carryovers, of which $50,457,769 will expire on December 31, 2017 and $6,560,637 will expire on December 31, 2018 and has $6,655,660 of short-term capital loss carryover and $1,162,474 of long-term capital loss carryover, which under current federal income tax rules, may offset capital gains recognized in any future period.
Note 6. Capital Stock
The Fund is authorized to issue 250 million shares of common stock at a par value of $0.001 per share.
During the six months ended June 30, 2017 and the year ended December 31, 2016, the Fund did not issue shares of common stock for the reinvestment of dividends.
On December 6, 2016, the Board of Directors approved the continuation of the delegation of its authority to management to effect repurchases, pursuant to management's discretion and subject to market conditions and investment considerations, of up to 10% of the Fund's common shares outstanding (Shares Repurchase Program) from January 1, 2017, through the fiscal year ended December 31, 2017.
During the six months ended June 30, 2017 and the year ended December 31, 2016, the Fund did not effect any repurchases.
Note 7. Borrowings
The Fund entered into an $70,000,000 secured, committed revolving credit agreement (credit agreement) with State Street Bank and Trust Company (State Street). The credit agreement has a 360 day rolling term that resets daily. The Fund pays a monthly financing charge which is calculated based on a LIBOR based or Federal Funds based rate. The Fund also pays a 0.15% per annum fee based on the unused portion of the credit agreement. The Fund is required to segregate portfolio securities as collateral in an amount up to two times the loan balance outstanding (or more depending on the terms of the credit agreement) and has granted a security interest in the securities segregated to, and in favor of, State Street as security for the loan balance outstanding. If the Fund fails to meet certain requirements, or maintain other financial covenants required under the credit agreement, the Fund may be required to
43
COHEN & STEERS GLOBAL INCOME BUILDER, INC.
NOTES TO FINANCIAL STATEMENTS (Unaudited)—(Continued)
repay immediately, in part or in full, the loan balance outstanding under the credit agreement, necessitating the sale of portfolio securities at potentially inopportune times.
As of June 30, 2017, the Fund had outstanding borrowings of $68,300,000 at a current rate of 2.0%. During the six months ended June 30, 2017, the Fund borrowed an average daily balance of $68,300,000 at a weighted average borrowing cost of 1.7%.
Note 8. Other Risks
Common Stock Risk: While common stock has historically generated higher average returns than fixed income securities over the long-term, common stock has also experienced significantly more volatility in those returns, although under certain market conditions, fixed-income investments may have comparable or greater price volatility. The value of common stocks and other equity securities will fluctuate in response to developments concerning the company, political and regulatory circumstances, the stock market, and the economy. In the short term, stock prices can fluctuate dramatically in response to these developments. Different parts of the market and different types of equity securities can react differently to these developments. For example, stocks of large companies can react differently than stocks of smaller companies, and value stocks, that is stocks of companies that are undervalued by various measures and have potential for long-term capital appreciation, can react differently from growth stocks. These developments can affect a single company, all companies within the same industry, economic sector or geographic region, or the stock market as a whole.
Foreign (Non-U.S.) Securities Risk: The Fund directly purchases securities of foreign issuers. Risks of investing in foreign securities, which can be expected to be greater for investments in emerging markets, include currency risks, future political and economic developments and possible imposition of foreign withholding taxes on income or proceeds payable on the securities. In addition, there may be less publicly available information about a foreign issuer than about a domestic issuer, and foreign issuers may not be subject to the same accounting, auditing and financial recordkeeping standards and requirements as domestic issuers. Moreover, securities of many foreign issuers and their markets may be less liquid and their prices more volatile than securities of comparable U.S. issuers.
Foreign Currency and Currency Hedging Risk: Although the Fund will report its NAV and pay dividends in U.S. dollars, foreign securities often are purchased with and make any dividend and interest payments in foreign currencies. Therefore, the Fund's investments in foreign securities will be subject to foreign currency risk, which means that the Fund's NAV could decline as a result of changes in the exchange rates between foreign currencies and the U.S. dollar. Certain foreign countries may impose restrictions on the ability of issuers of foreign securities to make payment of principal, dividends and interest to investors located outside the country, due to blockage of foreign currency exchanges or otherwise. The Fund may, but is not required to, engage in various instruments that are designed to hedge the Fund's foreign currency risks.
If the Fund were to utilize derivatives for the purpose of hedging foreign currency risks, it would be subject to risks different from, and possibly greater than, the risks associated with investing directly in traditional securities. Among the risks presented are counterparty risk, financial leverage risk, liquidity risk, OTC trading risk and tracking risk. The use of derivatives can lead to losses because of adverse
44
COHEN & STEERS GLOBAL INCOME BUILDER, INC.
NOTES TO FINANCIAL STATEMENTS (Unaudited)—(Continued)
movements in the price or value of the underlying asset, index or rate, which may be magnified by certain features of the derivatives.
Preferred Securities Risk: Preferred securities are subject to credit risk, which is the risk that a security will decline in price, or the issuer of the security will fail to make dividend, interest or principal payments when due, because the issuer experiences a decline in its financial status. Preferred securities are also subject to interest rate risk and may decline in value because of changes in market interest rates. The Fund may be subject to a greater risk of rising interest rates than would normally be the case in an environment of low interest rates and the effect of potential government fiscal policy initiatives and resulting market reaction to those initiatives. In addition, an issuer may be permitted to defer or omit distributions. Preferred securities are also generally subordinated to bonds and other debt instruments in a company's capital structure. During periods of declining interest rates, an issuer may be able to exercise an option to redeem (call) its issue at par earlier than scheduled, and the Fund may be forced to reinvest in lower yielding securities. Certain preferred securities may be substantially less liquid than many other securities, such as common stocks. Generally, preferred security holders have no voting rights with respect to the issuing company unless certain events occur. Certain preferred securities may give the issuers special redemption rights allowing the securities to be redeemed prior to a specified date if certain events occur, such as changes to tax or securities laws.
Real Estate Market Risk: The Fund may invest significantly in companies engaged in the real estate industry and may be susceptible to adverse economic or regulatory occurrences affecting that sector. Risks of investing in real estate securities include falling property values due to increasing vacancies, declining rents resulting from economic, legal, tax, political or technological developments, lack of liquidity, limited diversification, and sensitivity to certain economic factors such as interest-rate changes and market recessions. Real estate company prices also may drop because of the failure of borrowers to pay their loans and poor management, and residential developers, in particular, could be negatively impacted by falling home prices, slower mortgage origination and rising construction costs. The risks of investing in REITs are similar to those associated with direct investments in real estate securities.
Infrastructure Companies Risk: Securities and instruments of infrastructure companies are more susceptible to adverse economic or regulatory occurrences affecting their industries. Infrastructure companies may be subject to a variety of factors that may adversely affect their business or operations, including high interest costs in connection with capital construction and improvement programs, high leverage, costs associated with environmental and other regulations, the effects of economic slowdown, surplus capacity, increased competition from other providers of services, uncertainties concerning the availability of fuel at reasonable prices, the effects of energy conservation policies and other factors. Infrastructure companies may also be affected by or subject to high interest costs in connection with capital construction and improvement programs; difficulty in raising capital in adequate amounts on reasonable terms in periods of high inflation and unsettled capital markets; inexperience with and potential losses resulting from a developing deregulatory environment; costs associated with compliance with and changes in environmental and other regulations; regulation by various government authorities; government regulation of rates charged to customers; service interruption due to environmental, operational or other mishaps; the imposition of special tariffs and changes in tax laws, regulatory policies and accounting standards; technological innovations that may render existing plants, equipment or products obsolete; and general changes in market sentiment towards infrastructure and utilities assets.
45
COHEN & STEERS GLOBAL INCOME BUILDER, INC.
NOTES TO FINANCIAL STATEMENTS (Unaudited)—(Continued)
Options Risk: Gains on options transactions depend on the investment manager's ability to predict correctly the direction of stock prices, indexes, interest rates, and other economic factors, and unanticipated changes may cause poorer overall performance for the Fund than if it had not engaged in such transactions. A rise in the value of the security or index underlying a call option written by the Fund exposes the Fund to possible loss or loss of opportunity to realize appreciation in the value of any portfolio securities underlying or otherwise related to the call option. By writing a put option, the Fund assumes the risk of a decline in the underlying security or index. There can be no assurance that a liquid market will exist when the Fund seeks to close out an option position, and for certain options not traded on an exchange no market usually exists. Trading could be interrupted, for example, because of supply and demand imbalances arising from a lack of either buyers or sellers, or an options exchange could suspend trading after the price has risen or fallen more than the maximum specified by the exchange.
Although the Fund may be able to offset to some extent any adverse effects of being unable to liquidate an option position, that Fund may experience losses in some cases as a result of such inability, may not be able to close its position and, in such an event would be unable to control its losses.
Leverage Risk: The use of leverage is a speculative technique and there are special risks and costs associated with leverage. The net asset value of the Fund's shares may be reduced by the issuance and ongoing costs of leverage. So long as the Fund is able to invest in securities that produce an investment yield that is greater than the total cost of leverage, the leverage strategy will produce higher current net investment income for the shareholders. On the other hand, to the extent that the total cost of leverage exceeds the incremental income gained from employing such leverage, shareholders would realize lower net investment income. In addition to the impact on net income, the use of leverage will have an effect of magnifying capital appreciation or depreciation for shareholders. Specifically, in an up market, leverage will typically generate greater capital appreciation than if the Fund were not employing leverage. Conversely, in down markets, the use of leverage will generally result in greater capital depreciation than if the Fund had been unlevered. To the extent that the Fund is required or elects to reduce its leverage, the Fund may need to liquidate investments, including under adverse economic conditions which may result in capital losses potentially reducing returns to shareholders. There can be no assurance that a leveraging strategy will be successful during any period in which it is employed.
Geopolitical Risk: Occurrence of global events similar to those in recent years, such as war, terrorist attacks, natural disasters, country instability, infectious disease epidemics, market instability, debt crises and downgrades, embargoes, tariffs, sanctions and other trade barriers and other governmental trade or market control programs, the potential exit of a country from its respective union and related geopolitical events, may result in market volatility and may have long-lasting impacts on both the U.S. and global financial markets. Additionally, those events, as well as other changes in foreign and domestic political and economic conditions, could adversely affect individual issuers or related groups of issuers, securities markets, interest rates, secondary trading, credit ratings, inflation, investor sentiment and other factors affecting the value of the Fund's investments. The decision of the United Kingdom (UK) to exit from the European Union following the June 2016 vote on the matter (referred to as Brexit) may cause uncertainty and thus adversely impact financial results of the Fund and the global financial markets. Growing tensions between the United States and other foreign powers, or among foreign powers, and possible diplomatic, trade or other sanctions could adversely impact the markets and the
46
COHEN & STEERS GLOBAL INCOME BUILDER, INC.
NOTES TO FINANCIAL STATEMENTS (Unaudited)—(Continued)
Fund. The strengthening of the U.S. dollar relative to other currencies may, among other things, adversely affect the Fund's investments denominated in non-U.S. dollar currencies. It is difficult to predict when similar events affecting the U.S. or global financial markets may occur, the effects that such events may have, and the duration of those effects.
Regulatory Risk: The U.S. government has proposed and adopted multiple regulations that could have a long-lasting impact on the Fund and on the mutual fund industry in general. The SEC proposed rules governing the use of derivatives by registered investment companies, the Department of Labor's (DOL) final rule on conflicts of interest on fiduciary investment advice, as well as the SEC's final rules and amendments to modernize the reporting and disclosure (Modernization) could, among other things, restrict and/or increase the cost of the Fund's ability to engage in transactions and/or increase overall expenses of the Fund. In addition, Congress, various exchanges and regulatory and self-regulatory authorities, both domestic and foreign, have undertaken reviews of options and futures trading in light of market volatility. Among the actions that have been taken or proposed to be taken are new limits and reporting requirements for speculative positions, new or more stringent daily price fluctuation limits for futures and options transactions, and increased margin requirements for various types of futures transactions. While the full extent of all of these regulations is still unclear, these regulations and actions may adversely affect the instruments in which the Fund invests and its ability to execute its investment strategy.
Note 9. Other
In the normal course of business, the Fund enters into contracts that provide general indemnifications. The Fund's maximum exposure under these arrangements is dependent on claims that may be made against the Fund in the future and, therefore, cannot be estimated; however, based on experience, the risk of material loss from such claims is considered remote.
Note 10. New Accounting Guidance
In August 2016, the Financial Accounting Standards Board (FASB) issued a new Accounting Standards Update No. 2016-15, "Statement of Cash Flows (Topic 230), a consensus of the FASB's Emerging Issues Task Force" (ASU 2016-15). ASU 2016-15 is intended to reduce diversity in practice in how certain transactions are classified in the statement of cash flows. The issues addressed in ASU 2016-15 are: debt prepayment or debt extinguishment costs, settlement of zero-coupon debt instruments, contingent consideration payments made after a business combination, proceeds from the settlement of insurance claims, proceeds from the settlement of corporate-owned life insurance policies, including bank-owned life insurance policies, distributions received from equity method investments, beneficial interests in securitization transactions; and, separately identifiable cash flows and application of the predominance principle. ASU 2016-15 is effective for interim and annual reporting periods beginning after December 15, 2017. The Fund does not expect the adoption of the new standard to have a material effect on its financial statements and related disclosures.
In November 2016, the FASB issued a new Accounting Standards Update No. 2016-18, "Statement of Cash Flows (Topic 230), Restricted Cash, a consensus of the FASB's Emerging Issues Task Force"
47
COHEN & STEERS GLOBAL INCOME BUILDER, INC.
NOTES TO FINANCIAL STATEMENTS (Unaudited)—(Continued)
(ASU 2016-18). ASU 2016-18 requires that a statement of cash flows explain the change during the period in the total of cash, cash equivalents, and amounts generally described as restricted cash or restricted cash equivalents. Therefore, amounts generally described as restricted cash and restricted cash equivalents should be included with cash and cash equivalents when reconciling the beginning-of-period and end-of-period total amounts shown on the statement of cash flows. The amendments in ASU 2016-18 do not provide a definition of restricted cash or restricted cash equivalents. ASU 2016-18 is effective for interim and annual reporting periods beginning after December 15, 2017. The Fund does not expect the adoption of the new standard to have a material effect on its financial statements and related disclosures.
In October 2016, the SEC adopted new rules and amended existing rules (together, the "final rules") intended to modernize the reporting and disclosure of information by registered investment companies. In part, the final rules amend Regulation S-X and require standardized, enhanced disclosure about derivatives in investment company financial statements, as well as other amendments. The compliance date for the amendments to Regulation S-X is for periods ending after August 1, 2017. The adoption will have no effect on the Fund's net assets or results of operations.
Note 11. Subsequent Events
Management has evaluated events and transactions occurring after June 30, 2017 through the date that the financial statements were issued, and has determined that no additional disclosure in the financial statements is required.
48
COHEN & STEERS GLOBAL INCOME BUILDER, INC.
PROXY RESULTS (Unaudited)
Cohen & Steers Global Income Builder, Inc. shareholders voted on the following proposals at the annual meeting held on April 27, 2017. The description of each proposal and number of shares voted are as follows:
| Common Shares | Shares Voted For | Authority Withheld | |||||||||
To elect Directors: | |||||||||||
Michael G. Clark | 20,037,436.284 | 892,837.644 | |||||||||
Bonnie Cohen | 19,945,349.205 | 984,924.723 | |||||||||
Dean Junkans | 20,017,541.398 | 912,732.530 | |||||||||
Richard E. Kroon | 19,982,051.221 | 948,222.707 | |||||||||
49
COHEN & STEERS GLOBAL INCOME BUILDER, INC.
AVERAGE ANNUAL TOTAL RETURNS
(Periods ended June 30, 2017) (Unaudited)
Based on Net Asset Value | Based on Market Value | ||||||||||||||||||||||
| One Year | Five Years | Since Inception (7/27/07) | One Year | Five Years | Since Inception (7/27/07) | ||||||||||||||||||
| 16.21 | % | 9.27 | % | 4.90 | % | 20.24 | % | 9.26 | % | 3.55 | % | ||||||||||||
The performance data quoted represent past performance. Past performance is no guarantee of future results. The investment return will vary and the principal value of an investment will fluctuate and shares, if sold, may be worth more or less than their original cost. Current performance may be lower or higher than the performance data quoted. Performance results reflect the effect of leverage from utilization of borrowings under a credit agreement and/or from the issuance of preferred shares. Current total returns of the Fund can be obtained by visiting our website at cohenandsteers.com. The Fund's returns assume the reinvestment of all dividends and distributions at prices obtained under the Fund's dividend reinvestment plan.
REINVESTMENT PLAN
We urge shareholders who want to take advantage of this plan and whose shares are held in 'Street Name' to consult your broker as soon as possible to determine if you must change registration into your own name to participate.
OTHER INFORMATION
A description of the policies and procedures that the Fund uses to determine how to vote proxies relating to portfolio securities is available (i) without charge, upon request, by calling 800-330-7348, (ii) on our website at cohenandsteers.com or (iii) on the Securities and Exchange Commission's (the SEC) website at http://www.sec.gov. In addition, the Fund's proxy voting record for the most recent 12-month period ended June 30 is available by August 31 of each year (i) without charge, upon request, by calling 800-330-7348 or (ii) on the SEC's website at http://www.sec.gov.
The Fund files its complete schedule of portfolio holdings with the SEC for the first and third quarters of each fiscal year on Form N-Q. The Fund's Forms N-Q are available (i) without charge, upon request, by calling 800-330-7348 or (ii) on the SEC's website at http://www.sec.gov. In addition, the Forms N-Q may be reviewed and copied at the SEC's Public Reference Room in Washington, DC. Information on the operation of the Public Reference Room may be obtained by calling 800-SEC-0330.
Please note that distributions paid by the Fund to shareholders are subject to recharacterization for tax purposes and are taxable up to the amount of the Fund's investment company taxable income and net realized gains. Distributions in excess of the Fund's net investment company taxable income and realized gains are a return of capital distributed from the Fund's assets. To the extent this occurs, the Fund's shareholders of record will be notified of the estimated amount of capital returned to shareholders for each such distribution and this information will also be available at cohenandsteers.com. The final tax treatment of all distributions is reported to shareholders on their 1099-DIV forms, which are mailed after the close of each calendar year. Distributions of capital decrease the Fund's total assets
50
COHEN & STEERS GLOBAL INCOME BUILDER, INC.
and, therefore, could have the effect of increasing the Fund's expense ratio. In addition, in order to make these distributions, the Fund may have to sell portfolio securities at a less than opportune time.
Notice is hereby given in accordance with Rule 23c-1 under the 1940 Act that the Fund may purchase, from time to time, shares of its common stock in the open market.
Implementation of Asset Allocation Strategy Group
The Fund's team of portfolio managers is responsible for the day-to-day management of the Fund. The Asset Allocation Strategy Group (ASG) aggregates economic outlook, risk and relative value to develop views across asset classes and assists the portfolio managers by providing suggestions on allocations among the asset classes. Yigal Jhirad, lead portfolio manager and member of the ASG, determines the Fund's asset allocation ranges by conducting quantitative and qualitative analysis and evaluating the views of the ASG, and oversees the implementation of allocation decisions across the Fund's asset classes. Each portfolio manager on the team then directs and supervises allocation decisions for their respective asset class, and leads and guides the other members of their investment team.
Change to Portfolio Managers
Richard E. Helm has announced his intention to retire from Cohen & Steers Capital Management, Inc. on December 31, 2017. Effective September 30, 2017, Richard E. Helm will no longer serve as a portfolio manager to the Fund and Christopher Rhine will assume Richard E. Helm's portfolio manager responsibilities.
Christopher Rhine—Mr. Rhine is a portfolio manager of the Fund and Senior Vice President of the Advisor. He joined the Advisor in 2012 as an analyst specializing in natural resource equities and large cap value stocks. He has 12 years of investment experience. From 2002 to 2012, Mr. Rhine was an equity analyst with Blackrock, where he primarily covered the global industrials and materials sectors. He also has research experience in the global energy and information technology sectors. Mr. Rhine has an MBA from New York University and a BS from Drexel University.
APPROVAL OF INVESTMENT MANAGEMENT AND SUBADVISORY AGREEMENTS
The Board of Directors of the Fund, including a majority of the directors who are not parties to the Fund's investment management and subadvisory agreements (the Management Agreements), or interested persons of any such party (Independent Directors), has the responsibility under the 1940 Act to approve the Fund's Management Agreements for their initial two year term and their continuation annually thereafter at a meeting of the Board of Directors called for the purpose of voting on the approval or continuation. At a meeting of the Independent Directors held on June 6, 2017 and at a meeting of the full Board of Directors held in person on June 13, 2017, the Management Agreements were discussed and were unanimously continued for a term ending June 30, 2018 by the Fund's Board of Directors, including the Independent Directors. The Independent Directors were represented by independent counsel who assisted them in their deliberations during the meetings and executive sessions.
In considering whether to continue the Management Agreements, the Board of Directors reviewed materials provided by an independent data provider, which included, among other things, fee, expense and performance information compared to peer funds (Peer Funds) and performance comparisons to a larger category universe; summary information prepared by the Fund's investment manager (the
51
COHEN & STEERS GLOBAL INCOME BUILDER, INC.
Investment Manager); and a memorandum from Fund counsel outlining the legal duties of the Board of Directors. The Board of Directors also spoke directly with representatives of the independent data provider and met with investment management personnel. In addition, the Board of Directors considered information provided from time to time by the Investment Manager throughout the year at meetings of the Board of Directors, including presentations by portfolio managers relating to the investment performance of the Fund and the investment strategies used in pursuing the Fund's objective. In particular, the Board of Directors considered the following:
(i) The nature, extent and quality of services to be provided by the Investment Manager and the Subadvisors: The Board of Directors reviewed the services that the Investment Manager and the sub-investment advisors (the Subadvisors), provide to the Fund, including, but not limited to, making the day-to-day investment decisions for the Fund, and, for the Investment Manager, generally managing the Fund's investments in accordance with the stated policies of the Fund. The Board of Directors also discussed with officers and portfolio managers of the Fund the types of transactions that were being done on behalf of the Fund. Additionally, the Board of Directors took into account the services provided by the Investment Manager and the Subadvisors to other funds and accounts, including those that have investment objectives and strategies similar to the Fund. The Board of Directors also considered the education, background and experience of the Investment Manager's and Subadvisors' personnel, particularly noting the potential benefit that the portfolio managers' work experience and favorable reputation can have on the Fund. The Board of Directors further noted the Investment Manager's and Subadvisors' ability to attract qualified and experienced personnel. The Board of Directors also considered the administrative services provided by the Investment Manager, including compliance and accounting services. After consideration of the above factors, among others, the Board of Directors concluded that the nature, extent and quality of services provided by the Investment Manager and the Subadvisors are satisfactory and appropriate.
(ii) Investment performance of the Fund and the Investment Manager and Subadvisors: The Board of Directors considered the investment performance of the Fund compared to Peer Funds and compared to relevant blended and broad-based benchmarks. The Board of Directors considered that the Fund outperformed the Peer Funds' medians for the one- and five-year periods ended March 31, 2017, ranking two out of four peers during each period. The Fund underperformed the Peer Funds' median for the three-year period ended March 31, 2017, ranking three out of four peers. The Board of Directors also considered that the Fund outperformed the blended benchmark for the one-year period and underperformed the blended benchmark for the three- and five-year periods ended March 31, 2017. The Board of Directors also considered that the Fund underperformed the broad-based benchmark for the one-, three- and five-year periods ended March 31, 2017. The Board of Directors engaged in discussions with the Investment Manager regarding the contributors to and detractors from the Fund's performance during the periods, as well as the impact of leverage on the Fund's performance. The Board of Directors also considered supplemental information provided by the Investment Manager, including a narrative summary of various factors affecting performance, the upcoming changes to the large cap value investment team effective September 30, 2017 and the Investment Manager's and the Subadvisors' performance in managing other global funds. The Board of Directors then determined that the Fund's performance, in light of all considerations noted above, supported the continuation of
52
COHEN & STEERS GLOBAL INCOME BUILDER, INC.
the Management Agreements, but determined to continue to closely monitor the Fund's performance and requested that the Investment Manager provide detailed quarterly updates for this purpose.
(iii) Cost of the services to be provided and profits to be realized by the Investment Manager from the relationship with the Fund: The Board of Directors considered the actual management fees paid by the Fund, as well as the total expense ratios. As part of its analysis, the Board of Directors gave consideration to the fee and expense analyses provided by the independent data provider. The Board of Directors also considered the Fund's actual management fee and total expense ratios including and excluding investment-related expenses at common asset levels compared to the Peer Funds' medians, noting that the Fund's expenses were the highest in the group in all three expense categories. As the Fund is the only leveraged Fund in the peer group, no comparisons could be made for the actual management fee and total expense ratios at managed asset levels. The Board of Directors noted that as the only leveraged fund of the Peer Funds, the Fund will not fare as well in the expense comparison at common asset levels, as a greater amount of leverage will result in higher common asset expense levels. The Board of Directors considered the impact of leverage levels on the Fund's fees and expenses at managed and common asset levels. In light of the considerations above, the Board of Directors concluded that the Fund's current expense structure was satisfactory.
The Board of Directors also reviewed information regarding the profitability to the Investment Manager of its relationship with the Fund. The Board of Directors considered the level of the Investment Manager's profits and whether the profits were reasonable for the Investment Manager. Since the Subadvisors are paid by the Investment Manager for investment services provided to the Fund and not by the Fund and are affiliates of the Investment Manager, the Board of Directors considered the profitability of the Investment Manager as a whole and did not consider the Subadvisors' separate profitability to be particularly relevant to their determination. The Board of Directors took into consideration other benefits to be derived by the Investment Manager in connection with the Management Agreements, noting particularly the research and related services, within the meaning of Section 28(e) of the Securities Exchange Act of 1934, as amended, that the Investment Manager receives by allocating the Fund's brokerage transactions. The Board of Directors further considered that the Investment Manager continues to reinvest profits back in the business, including upgrading and/or implementing new trading, compliance and accounting systems, and by adding investment personnel to the portfolio management teams. The Board of Directors also considered the administrative services provided by the Investment Manager and the associated administration fee paid to the Investment Manager for such services under the Administration Agreement. The Board of Directors determined that the services received under the Administration Agreement are beneficial to the Fund. Some of these services include compliance, accounting and operational services, oversight of third party service providers, supervising compliance by the Fund with regulatory requirements, furnishing office space and facilities for the Fund, and providing persons satisfactory to the Board of Directors to serve as officers of the Fund. The Board of Directors concluded that the profits realized by the Investment Manager from its relationship with the Fund were reasonable and consistent with the Investment Manager's fiduciary duties.
(iv) The extent to which economies of scale would be realized as the Fund grows and whether fee levels would reflect such economies of scale: The Board of Directors considered that, as a closed-end fund, the Fund would not be expected to have inflows of capital that might produce increasing economies of scale. The Board of Directors determined that, given the Fund's closed-end structure, there were no
53
COHEN & STEERS GLOBAL INCOME BUILDER, INC.
significant economies of scale that were not being shared with shareholders. In considering economies of scale, the Board of Directors also noted, as discussed above in (iii), that the Investment Manager continues to reinvest profits back in the business.
(v) Comparison of services to be rendered and fees to be paid to those under other investment management contracts, such as contracts of the same and other investment advisors or other clients: As discussed above in (iii), the Board of Directors compared the fees paid under the Management Agreements to those under other investment management contracts of other investment advisors managing Peer Funds. The Board of Directors also compared the services rendered, fees paid and profitability under the Management Agreements to those under the Investment Manager's other management agreements and advisory contracts with institutional and other clients with similar investment mandates. The Board of Directors also considered the entrepreneurial risk and financial exposure assumed by the Investment Manager in developing and managing the Fund that the Investment Manager does not have with institutional and other clients and other differences in the management of registered investment companies and institutional accounts. The Board of Directors determined that on a comparative basis the fees under the Management Agreements were reasonable in relation to the services provided.
No single factor was cited as determinative to the decision of the Board of Directors. Rather, after weighing all of the considerations and conclusions discussed above, the Board of Directors, including the Independent Directors, unanimously approved the continuation of the Management Agreements.
54
COHEN & STEERS GLOBAL INCOME BUILDER, INC.
Cohen & Steers Privacy Policy
Facts | What Does Cohen & Steers Do With Your Personal Information? | ||||||
Why? | Financial companies choose how they share your personal information. Federal law gives consumers the right to limit some but not all sharing. Federal law also requires us to tell you how we collect, share, and protect your personal information. Please read this notice carefully to understand what we do. | ||||||
What? | The types of personal information we collect and share depend on the product or service you have with us. This information can include: • Social Security number and account balances • Transaction history and account transactions • Purchase history and wire transfer instructions | ||||||
How? | All financial companies need to share customers' personal information to run their everyday business. In the section below, we list the reasons financial companies can share their customers' personal information; the reasons Cohen & Steers chooses to share; and whether you can limit this sharing. | ||||||
Reasons we can share your personal information | Does Cohen & Steers share? | Can you limit this sharing? | |||||||||
| For our everyday business purposes— such as to process your transactions, maintain your account(s), respond to court orders and legal investigations, or reports to credit bureaus | Yes | No | |||||||||
| For our marketing purposes— to offer our products and services to you | Yes | No | |||||||||
For joint marketing with other financial companies— | No | We don't share | |||||||||
| For our affiliates' everyday business purposes— information about your transactions and experiences | No | We don't share | |||||||||
| For our affiliates' everyday business purposes— information about your creditworthiness | No | We don't share | |||||||||
For our affiliates to market to you— | No | We don't share | |||||||||
For non-affiliates to market to you— | No | We don't share | |||||||||
Questions? Call 800.330.7348
55
COHEN & STEERS GLOBAL INCOME BUILDER, INC.
Cohen & Steers Privacy Policy—(Continued)
Who we are | |||||||
Who is providing this notice? | Cohen & Steers Capital Management, Inc., Cohen & Steers Asia Limited, Cohen & Steers Japan, LLC, Cohen & Steers UK Limited, Cohen & Steers Securities, LLC, Cohen & Steers Private Funds and Cohen & Steers Open and Closed-End Funds (collectively, Cohen & Steers). | ||||||
What we do | |||||||
How does Cohen & Steers protect my personal information? | To protect your personal information from unauthorized access and use, we use security measures that comply with federal law. These measures include computer safeguards and secured files and buildings. We restrict access to your information to those employees who need it to perform their jobs, and also require companies that provide services on our behalf to protect your information. | ||||||
How does Cohen & Steers collect my personal information? | We collect your personal information, for example, when you: • Open an account or buy securities from us • Provide account information or give us your contact information • Make deposits or withdrawals from your account We also collect your personal information from other companies. | ||||||
Why can't I limit all sharing? | Federal law gives you the right to limit only: • sharing for affiliates' everyday business purposes—information about your creditworthiness • affiliates from using your information to market to you • sharing for non-affiliates to market to you State law and individual companies may give you additional rights to limit sharing. | ||||||
Definitions | |||||||
Affiliates | Companies related by common ownership or control. They can be financial and nonfinancial companies. • Cohen & Steers does not share with affiliates. | ||||||
Non-affiliates | Companies not related by common ownership or control. They can be financial and nonfinancial companies. • Cohen & Steers does not share with non-affiliates. | ||||||
Joint marketing | A formal agreement between non-affiliated financial companies that together market financial products or services to you. • Cohen & Steers does not jointly market. | ||||||
56
COHEN & STEERS GLOBAL INCOME BUILDER, INC.
Cohen & Steers Investment Solutions
COHEN & STEERS REAL ASSETS FUND
• Designed for investors seeking total return and the maximization of real returns during inflationary environments by investing primarily in real assets
• Symbols: RAPAX, RAPCX, RAPIX, RAPRX, RAPZX
COHEN & STEERS
INSTITUTIONAL GLOBAL REALTY SHARES
• Designed for institutional investors seeking total return, investing primarily in global real estate securities
• Symbol: GRSIX
COHEN & STEERS GLOBAL REALTY SHARES
• Designed for investors seeking total return, investing primarily in global real estate equity securities
• Symbols: CSFAX, CSFCX, CSSPX, GRSRX, CSFZX
COHEN & STEERS REALTY SHARES
• Designed for investors seeking total return, investing primarily in U.S. real estate securities
• Symbol: CSRSX
COHEN & STEERS REAL ESTATE SECURITIES FUND
• Designed for investors seeking total return, investing primarily in U.S. real estate securities
• Symbols: CSEIX, CSCIX, CREFX, CSDIX, CIRRX, CSZIX
COHEN & STEERS INSTITUTIONAL REALTY SHARES
• Designed for institutional investors seeking total return, investing primarily in U.S. real estate securities
• Symbol: CSRIX
COHEN & STEERS INTERNATIONAL REALTY FUND
• Designed for investors seeking total return, investing primarily in international (non-U.S.) real estate securities
• Symbols: IRFAX, IRFCX, IRFIX, IRFRX, IRFZX
COHEN & STEERS
ACTIVE COMMODITIES STRATEGY FUND
• Designed for investors seeking total return, investing primarily in a diversified portfolio of exchange-traded commodity future contracts and other commodity-related derivative instruments
• Symbols: CDFAX, CDFCX, CDFIX, CDFRX, CDFZX
COHEN & STEERS GLOBAL INFRASTRUCTURE FUND
• Designed for investors seeking total return, investing primarily in global infrastructure securities
• Symbols: CSUAX, CSUCX, CSUIX, CSURX, CSUZX
COHEN & STEERS
MLP & ENERGY OPPORTUNITY FUND
• Designed for investors seeking total return, investing primarily in midstream energy master limited partnership (MLP) units and related stocks
• Symbols: MLOAX, MLOCX, MLOIX, MLORX, MLOZX
COHEN & STEERS
LOW DURATION PREFERRED AND INCOME FUND
• Designed for investors seeking high current income and capital preservation by investing in low-duration preferred and other income securities issued by U.S. and non-U.S. companies
• Symbols: LPXAX, LPXCX, LPXIX, LPXRX, LPXZX
COHEN & STEERS
PREFERRED SECURITIES AND INCOME FUND
• Designed for investors seeking total return (high current income and capital appreciation), investing primarily in preferred and debt securities issued by U.S. and non-U.S. companies
• Symbols: CPXAX, CPXCX, CPXFX, CPXIX, CPRRX, CPXZX
COHEN & STEERS DIVIDEND VALUE FUND
• Designed for investors seeking long-term growth of income and capital appreciation, investing primarily in dividend paying common stocks and preferred stocks
• Symbols: DVFAX, DVFCX, DVFIX, DVFRX, DVFZX
Distributed by Cohen & Steers Securities, LLC.
COHEN & STEERS GLOBAL REALTY MAJORS ETF
• Designed for investors who seek a relatively low-cost passive approach for investing in a portfolio of global real estate equity securities of companies in a specified index
• Symbol: GRI
Distributed by ALPS Distributors, Inc.
ISHARES COHEN & STEERS
REALTY MAJORS INDEX FUND
• Designed for investors who seek a relatively low-cost passive approach for investing in a portfolio of U.S. real estate equity securities of companies in a specified index
• Symbol: ICF
Distributed by SEI Investments Distribution Co.
Please consider the investment objectives, risks, charges and expenses of any Cohen & Steers U.S. registered open-end fund carefully before investing. A summary prospectus and prospectus containing this and other information can be obtained by calling 800-330-7348 or by visiting cohenandsteers.com. Please read the summary prospectus and prospectus carefully before investing.
57
COHEN & STEERS GLOBAL INCOME BUILDER, INC.
OFFICERS AND DIRECTORS
Robert H. Steers
Director and Chairman
Joseph M. Harvey
Director and Vice President
Michael G. Clark
Director
Bonnie Cohen
Director
George Grossman
Director
Dean Junkans
Director
Richard E. Kroon
Director
Gerald J. Maginnis
Director
Jane F. Magpiong
Director
Richard J. Norman
Director
Frank K. Ross
Director
C. Edward Ward, Jr.
Director
Adam M. Derechin
President and Chief Executive Officer
Yigal D. Jhirad
Vice President
Richard E. Helm
Vice President
William F. Scapell
Vice President
Francis C. Poli
Assistant Secretary
James Giallanza
Chief Financial Officer
Albert Laskaj
Treasurer
Lisa D. Phelan
Chief Compliance Officer
KEY INFORMATION
Investment Manager
Cohen & Steers Capital Management, Inc.
280 Park Avenue
New York, NY 10017
(212) 832-3232
Co-administrator and Custodian
State Street Bank and Trust Company
One Lincoln Street
Boston, MA 02111
Transfer Agent
Computershare
480 Washington Boulevard
Jersey City, NJ 07310
(866) 227-0757
Legal Counsel
Ropes & Gray LLP
1211 Avenue of the Americas
New York, NY 10036
New York Stock Exchange Symbol: INB
Website: cohenandsteers.com
This report is for shareholder information. This is not a prospectus intended for use in the purchase or sale of Fund shares. Performance data quoted represent past performance. Past performance is no guarantee of future results and your investment may be worth more or less at the time you sell your shares.
58
COHEN & STEERS
GLOBAL INCOME BUILDER
280 PARK AVENUE
NEW YORK, NY 10017
eDelivery NOW AVAILABLE
Stop traditional mail delivery; receive your shareholder reports and prospectus online.
Sign up at cohenandsteers.com
INBSAR

Semiannual Report June 30, 2017
Cohen & Steers Global Income Builder
Item 2. Code of Ethics.
Not applicable.
Item 3. Audit Committee Financial Expert.
Not applicable.
Item 4. Principal Accountant Fees and Services.
Not applicable.
Item 5. Audit Committee of Listed Registrants.
Not applicable.
Item 6. Schedule of Investments.
Included in Item 1 above.
Item 7. Disclosure of Proxy Voting Policies and Procedures for Closed-End Management Investment Companies.
Not applicable.
Item 8. Portfolio Managers of Closed-End Investment Companies.
Not applicable.
Item 9. Purchases of Equity Securities by Closed-End Management Investment Company and Affiliated Purchasers.
Not applicable.
Item 10. Submission of Matters to a Vote of Security Holders.
None.
Item 11. Controls and Procedures.
(a) The registrant’s principal executive officer and principal financial officer have concluded, based upon their evaluation of the registrant’s disclosure controls and procedures as conducted within 90 days of the filing date of this report, that these disclosure controls and procedures provide reasonable assurance that material information required to be disclosed by the registrant in the report it files or submits on Form N-CSR is recorded, processed, summarized and reported within the time periods specified in the Securities and Exchange Commission’s rules and forms
and that such material information is accumulated and communicated to the registrant’s management, including its principal executive officer and principal financial officer, as appropriate, in order to allow timely decisions regarding required disclosure.
(b) There were no changes in the registrant’s internal control over financial reporting that occurred during the second fiscal quarter of the period covered by this report that have materially affected, or are reasonably likely to materially affect, the registrant’s internal control over financial reporting.
Item 12. Exhibits.
(a)(1) Not applicable.
(a)(2) Certifications of principal executive officer and principal financial officer as required by Rule 30a-2(a) under the Investment Company Act of 1940.
(a)(3) Not applicable.
(b) Certifications of chief executive officer and chief financial officer as required by Rule 30a- 2(b) under the Investment Company Act of 1940.
SIGNATURES
Pursuant to the requirements of the Securities Exchange Act of 1934 and the Investment Company Act of 1940, the registrant has duly caused this report to be signed on its behalf by the undersigned, thereunto duly authorized.
COHEN & STEERS GLOBAL INCOME BUILDER, INC.
By: | /s/ Adam M. Derechin |
|
| Name: Adam M. Derechin | |
| Title: President and Chief Executive Officer | |
| ||
Date: September 7, 2017 | ||
Pursuant to the requirements of the Securities Exchange Act of 1934 and the Investment Company Act of 1940, this report has been signed below by the following persons on behalf of the registrant and in the capacities and on the dates indicated.
By: | /s/ Adam M. Derechin |
| |
| Name: | Adam M. Derechin |
|
| Title: | President and Chief Executive Officer |
|
|
| (Principal Executive Officer) |
|
|
|
|
|
By: | /s/ James Giallanza |
| |
| Name: | James Giallanza |
|
| Title: | Chief Financial Officer |
|
|
| (Principal Financial Officer) |
|
|
|
|
|
Date: September 7, 2017 | |||