Table of Contents
FORM 6-K
U.S. SECURITIES AND EXCHANGE COMMISSION
Washington, D.C. 20549
Report of Foreign Private Issuer
Pursuant toRule 13a-16 or 15d-16 of
the Securities Exchange Act of 1934
Commission FileNumber: 001-38757
For the month of February 2019
TAKEDA PHARMACEUTICAL COMPANY LIMITED
(Translation of registrant’s name into English)
1-1, Nihonbashi-Honcho2-Chome
Chuo-ku,Tokyo 103-8668
Japan
(Address of principal executive offices)
Indicate by check mark whether the registrant files or will file annual reports under coverForm 20-F orForm 40-F.
Form 20-F ☒ Form 40-F ☐
Indicate by check mark if the registrant is submitting theForm 6-K in paper as permitted byRegulation S-T Rule 101(b)(1): ☐
Indicate by check mark if the registrant is submitting theForm 6-K in paper as permitted byRegulation S-T Rule 101(b)(7): ☐
Table of Contents
Information furnished on this form:
Table of Contents
SIGNATURES
Pursuant to the requirements of the Securities Exchange Act of 1934, the registrant has duly caused this report to be signed on its behalf by the undersigned, thereunto duly authorized.
| TAKEDA PHARMACEUTICAL COMPANY LIMITED | ||||||
| Date: February 1, 2019 | By: | /s/ Takashi Okubo | ||||
| Takashi Okubo | ||||||
| Global Head of Investor Relations | ||||||
Table of Contents
 | Better Health, Brighter Future |
News Release
February 1, 2019
Takeda Reports Third Quarter FY2018 Results
| • | Strong underlying growth year-to-date driven by business momentum and execution of the Global Opex Initiative; Underlying Core Earnings +32.3% with margin expansion of 530 basis points |
| • | Reported results impacted by large one-time gains in FY2017 and Shire related costs in FY2018 |
Underlying Revenue +4.8% year-to-date with growth of prescription drug portfolio in all regions
| • | Solid Underlying Revenue growth of +4.8%, with continued strong momentum from Takeda’s Growth Drivers (Gastroenterology, Oncology, Neuroscience and Emerging Markets), which grew +10.5%. |
| • | Key growth products Entyvio (+35.1%), Ninlaro (+36.6%) and Trintellix (+19.5%) were important drivers of revenue growth, as were the products obtained through the Ariad acquisition in 2017, Iclusig (+26.0%) and Alunbrig (+151.4%). |
| • | Every region grew their prescription drug portfolio versus prior year (U.S. +8.5%, Japan +4.9%*, Europe & Canada +4.9%, Emerging Markets +5.1%). |
| * | Japan +3.0% excluding upfront payment received for productout-licensing |
| • | Reported revenue grew +0.8% year-to-date to 1,380 billion yen, despite the negative impact from foreign exchange rates (-1.1pp) and divestitures (-3.0pp). The divestiture impact included the sale of additional products to the Teva JV in FY2017, and Multilab and Techpool in FY2018. |
Underlying Core Earnings +32.3% year-to-date, with margin +530 basis points driven by business momentum and execution of the Global Opex Initiative
| • | Underlying Core Earnings grew +32.3%, with margin expansion of 530 basis points. 70% of this margin improvement was driven by OPEX discipline, indicative of how the Global Opex Initiative has become fully integrated into ways of working at Takeda. The remaining margin expansion was driven by favorable product mix. |
| • | Reported operating profit declined -11.7% year-to-date to 284.4 billion yen. This was impacted by two large one-time gains booked in FY2017: the sale of Wako shares for 106.3 billion yen, and the sale of additional products to the Teva JV. Furthermore, Takeda booked one-time expenses in FY2018 related to the proposed acquisition of Shire. Excluding these major one-time items, Operating Profit grew +55.5%. |
| • | Underlying Core EPS was up +34.2% year-to-date. Reported EPS declined -32.0% to 210 yen per share, impacted by divestitures, Shire related costs, and loss of associates accounted for using the equity method due to an impairment charge recognized by Teva Takeda Pharma Ltd. |
R&D milestones in Q3
| • | Global Ph-3 trial of dengue vaccine candidate TAK-003 met primary efficacy endpoint. |
| • | Ninlaro post-transplant Multiple Myeloma maintenance data was submitted to the FDA in November 2018, and after further discussion with them, Takeda made the decision to withdraw the filing and to resubmit when more mature survival data are available. |
| • | Alunbrig approved in EU for post-crizotinib ALK+ Non-Small Cell Lung Cancer. |
1
Table of Contents
| • | Adcetris positive CHMP opinion in EU for front line CD30+ stage IV Hodgkin Lymphoma. |
| • | Advanced multiple collaborations in our novel immuno-oncology portfolio. |
Unlocking cash by improving business focus and streamlining the balance sheet
| • | Year-to-date Operating Free Cash Flow decreased -20.2% mainly due to the impact of the sale of additional products to the Teva JV in FY2017. |
| • | Sale of real estate and marketable securities generated an additional 45.4 billion yen of cash, and sale of non-core businesses Techpool and Multilab generated a further 27.5 billion yen. |
| • | Rating agencies confirm investment grade credit ratings. |
Costa Saroukos, Chief Financial Officer, commented:
“Takeda’s strategic focus and superior execution continue to drive robust performance through the first three quarters of FY2018. In addition to strong commercial execution, we have continued to deliver on our commitment to margin expansion, with the Underlying Core Earnings margin increasing by 530 basis points driven by our Global Opex Initiative.
In addition to delivering compelling financial results, we also closed the Shire acquisition on January 8th. We completed the deal financing at highly competitive interest rates, and also listed Takeda American Depository Shares on the New York Stock Exchange on December 24th. Integration of the two companies is now progressing as planned, and this is an exciting time for Takeda as we become a truly global, values-based, R&D driven biopharmaceutical leader.”
Reported Results for Q3 year-to-date (April - December) FY2018
| FY2017 | FY2018 | % Growth vs Prior Year | ||||||||||||||
(billion yen) | Q3 YTD | Q3 YTD | Reported | Underlying 2 | ||||||||||||
Revenue | 1,369.6 | 1,380.0 | +0.8 | % | +4.8 | % | ||||||||||
Core Earnings 1 | 292.7 | 344.6 | +17.7 | % | +32.3 | % | ||||||||||
Operating Profit | 322.3 | 284.4 | -11.7 | % | — | |||||||||||
Net Profit3 | 240.9 | 164.4 | -31.7 | % | — | |||||||||||
EPS | 309 yen | 210 yen | -32.0 | % | +34.2 | % | ||||||||||
| 1 | Core Earnings represents net profit adjusted to exclude income tax expenses, our share of profit or loss of investments accounted for using the equity method, finance expenses and income, other operating expenses and income, amortization and impairment losses on intangible assets associated with products and other items that management believes are unrelated to our core operations, such as purchase accounting effects and transaction related costs. |
| 2 | Underlying Growth compares two periods (quarters or years) of financial results under a common basis and is used by management to assess the business. These financial results are calculated on a constant currency basis and excluding the impacts of divestitures and other amounts that are unusual, non-recurring items or unrelated to our ongoing operations. |
| 3 | Attributable to the owners of the company. |
FY2018 revised full year guidance including Shire impact to be announced in April
For more details on Takeda’s FY2018 third quarter results and other financial information, please visithttps://www.takeda.com/investors/reports/
2
Table of Contents
About Takeda Pharmaceutical Company Limited
Takeda Pharmaceutical Company Limited (TSE:4502/NYSE:TAK) is a global, values-based, R&D-driven biopharmaceutical leader headquartered in Japan, committed to bringing Better Health and a Brighter Future to patients by translating science into highly-innovative medicines. Takeda focuses its R&D efforts on four therapeutic areas: Oncology, Gastroenterology (GI), Neuroscience and Rare Diseases. We also make targeted R&D investments in Plasma-Derived Therapies and Vaccines. We are focusing on developing highly innovative medicines that contribute to making a difference in people’s lives by advancing the frontier of new treatment options and leveraging our enhanced collaborative R&D engine and capabilities to create a robust, modality-diverse pipeline. Our employees are committed to improving quality of life for patients and to working with our partners in health care in approximately 80 countries and regions.
For more information, visithttps://www.takeda.com
Contacts
Investor Relations | Media Relations | |
Takashi Okubo, +81-(0)3-3278-2306 | Kazumi Kobayashi, +81 (0)3-3278-2095 | |
takeda.ir.contact@takeda.com | kazumi.kobayashi@takeda.com |
3
Table of Contents
Important Notice
For the purposes of this notice, “press release” means this document, any oral presentation, any question and answer session and any written or oral material discussed or distributed by Takeda Pharmaceutical Company Limited (“Takeda”) regarding this release. This press release (including any oral briefing and any question-and-answer in connection with it) is not intended to, and does not constitute, represent or form part of any offer, invitation or solicitation of any offer to purchase, otherwise acquire, subscribe for, exchange, sell or otherwise dispose of, any securities or the solicitation of any vote or approval in any jurisdiction. No shares or other securities are being offered to the public by means of this press release. No offering of securities shall be made in the United States except pursuant to registration under the U.S. Securities Act of 1933, as amended, or an exemption therefrom. This press release is being given (together with any further information which may be provided to the recipient) on the condition that it is for use by the recipient for information purposes only (and not for the evaluation of any investment, acquisition, disposal or any other transaction). Any failure to comply with these restrictions may constitute a violation of applicable securities laws.
Unless specified otherwise, no statement in this press release (including any statement of estimated synergies) is intended as a profit forecast or estimate for any period and no statement in this press release should be interpreted to mean that earnings or earnings per share for Takeda for the current or future financial years would necessarily match or exceed the historical published earnings per share for Takeda.
The companies in which Takeda directly and indirectly owns investments are separate entities. In this press release, “Takeda” is sometimes used for convenience where references are made to Takeda and its subsidiaries in general. Likewise, the words “we”, “us” and “our” are also used to refer to subsidiaries in general or to those who work for them. These expressions are also used where no useful purpose is served by identifying the particular company or companies.
Forward-Looking Statements
This press release and any materials distributed in connection with this press release may contain forward-looking statements, beliefs or opinions regarding Takeda’s future business, future position and results of operations, including estimates, forecasts, targets and plans for Takeda. Without limitation, forward looking statements often include the words such as “targets”, “plans”, “believes”, “hopes”, “continues”, “expects”, “aims”, “intends”, “will”, “may”, “should”, “would”, “could” “anticipates”, “estimates”, “projects” or words or terms of similar substance or the negative thereof. Any forward-looking statements in this document are based on the current assumptions and beliefs of Takeda in light of the information currently available to it. Such forward-looking statements do not represent any guarantee by Takeda or its management of future performance and involve known and unknown risks, uncertainties and other factors, including but not limited to: the economic circumstances surrounding Takeda’s business, including general economic conditions in Japan, the United States and worldwide; competitive pressures and developments; applicable laws and regulations; the success of or failure of product development programs; decisions of regulatory authorities and the timing thereof; changes in exchange rates; claims or concerns regarding the safety or efficacy of marketed products or products candidates; and post-merger integration with acquired companies, any of which may cause Takeda’s actual results, performance, achievements or financial position to be materially different from any future results, performance, achievements or financial position expressed or implied by such forward-looking statements. For more information on these and other factors which may affect Takeda’s results, performance, achievements, or financial position, see “Item 3. Key Information – D. Risk Factors” in Takeda’s Registration Statement on Form 20-F filed with the U.S. Securities and Exchange Commission, available on Takeda’s website at:https://www.takeda.com/investors/reports/sec-filings/ or atwww.sec.gov. Neither Takeda nor its management gives any assurances that the expectations expressed in these forward-looking statements will turn out to be correct, and actual results, performance or achievements could materially differ from expectations. Persons receiving this press release should not place undue reliance on forward looking statements. Takeda undertakes no obligation to update any of the forward-looking statements contained in this press release or any other forward-looking statements it may make. Past performance is not an indicator of future results and the results of Takeda in this press release may not be indicative of, and are not an estimate, forecast or projection of Takeda’s future results.
4
Table of Contents
While Takeda plans to announce an earnings forecast which includes an estimated financial impact of the Shire acquisition once a reasonable financial estimate is determined, the consideration of the asset valuation as well as purchase price allocation, schedule and manner of amortization and depreciation for the business combination accounting will require more time. It is also difficult to estimate the effect on profit and loss since the completion of the acquisition to the end of the consolidated accounting period, nor the acquisition related costs for the full fiscal year with a reasonable level of accuracy at this time. Considering the sizable effect on the business results due to the acquisition, Takeda is not furnishing a new consolidated forecast in a provisional or partial way at this time. It is our objective to disclose a Shire acquisition post-close consolidated business forecast for the fiscal year once a holistic and reasonable earnings forecast can be determined.
Certain Non-IFRS Financial Measures
This press release includes certain IFRS financial measures not presented in accordance with International Financial Reporting Standards (“IFRS”), including Underlying Revenue, Core Earnings, Underlying Core Earnings, Core Net Profit, Underlying Core Net Profit, Underlying Core EPS, Net Debt, EBITDA, Adjusted EBITDA and Operating Free Cash Flow. Takeda’s management evaluates results and makes operating and investment decisions using both IFRS and non-IFRS measures included in this press release. These non-IFRS measures exclude certain income, cost and cash flow items which are included in, or are calculated differently from, the most closely comparable measures presented in accordance with IFRS. By including these non-IFRS measures, management intends to provide investors with additional information to further analyze Takeda’s performance, core results and underlying trends. Takeda’s non-IFRS measures are not prepared in accordance with IFRS and such non-IFRS measures should be considered a supplement to, and not a substitute for, measures prepared in accordance with IFRS (which we sometimes refer to as “reported” measures). Investors are encouraged to review the reconciliation of non-IFRS financial measures to their most directly comparable IFRS measures.
Further information on certain of Takeda’s Non-IFRS measures is posted on Takeda’s investor relations website at
https://www.takeda.com/investors/reports/quarterly-announcements/quarterly-announcements-2018/
Medical information
This press release contains information about products that may not be available in all countries, or may be available under different trademarks, for different indications, in different dosages, or in different strengths. Nothing contained herein should be considered a solicitation, promotion or advertisement for any prescription drugs including the ones under development.
###
5
Table of Contents
Summary of Financial Statements for the Nine Months Period Ended December 31, 2018 (IFRS, Consolidated)
February 1, 2019
| Takeda Pharmaceutical Company Limited | Stock exchange listings: | Tokyo, Nagoya, Fukuoka, Sapporo | ||||
| TSE Code: | 4502 | URL:http://www.takeda.com | ||||
| Representative: | Christophe Weber, President & CEO | |||||
| Contact: | Takashi Okubo | Telephone:+81-3-3278-2306 | ||||
| Global Head of IR, Global Finance | ||||||
Scheduled date of securities report submission: February 14, 2019
Scheduled date of dividend payment commencement: –
Supplementary materials for the financial statements: Yes
Presentation to explain for the financial statements: Yes
(Million JPY, rounded to the nearest million)
| 1. | Consolidated Financial Results for the Nine Months Period Ended December 31, 2018 (April 1 to December 31, 2018) |
| (1) | Consolidated Operating Results (year to date) |
| (Percentage figures represent changes over the same period of the previous year) | ||||||||||||||||||||||||||||||||
| Revenue | Operating profit | Profit before tax | Net profit for the period | |||||||||||||||||||||||||||||
| (Million JPY) | (%) | (Million JPY) | (%) | (Million JPY) | (%) | (Million JPY) | (%) | |||||||||||||||||||||||||
Nine months period ended December 31, 2018 | 1,380,013 | 0.8 | 284,420 | (11.7 | ) | 208,379 | (27.6 | ) | 164,353 | (31.7 | ) | |||||||||||||||||||||
Nine months period ended December 31, 2017 | 1,369,568 | 4.1 | 322,287 | 48.2 | 287,891 | 37.9 | 240,688 | 43.2 | ||||||||||||||||||||||||
Net profit attributable to owners of the Company | Total comprehensive income for the period | Basic earnings per share | Diluted earnings per share | |||||||||||||||||||||||||||||
| (Million JPY) | (%) | (Million JPY) | (%) | (JPY) | (JPY) | |||||||||||||||||||||||||||
Nine months period ended December 31, 2018 | 164,434 | (31.7 | ) | 143,970 | (60.5 | ) | 209.87 | 208.64 | ||||||||||||||||||||||||
Nine months period ended December 31, 2017 | 240,906 | 45.4 | 364,140 | 93.0 | 308.59 | 306.51 | ||||||||||||||||||||||||||
| (2) | Consolidated Financial Position |
| Total assets (Million JPY) | Total equity (Million JPY) | Equity attributable to owners of the Company (Million JPY) | Ratio of equity attributable to owners of the Company to total assets (%) | Equity attributable to owners of the Company per share (JPY) | ||||||||||||||||
As of December 31, 2018 | 5,767,223 | 2,042,578 | 2,038,682 | 35.3 | 2,598.78 | |||||||||||||||
As of March 31, 2018 | 4,106,463 | 2,017,409 | 1,997,424 | 48.6 | 2,556.51 | |||||||||||||||
2. Dividends
|
| |||||||||||||||||||
| Annual dividends per share (JPY) | ||||||||||||||||||||
| 1st quarter end | 2nd quarter end | 3rd quarter end | Year-end | Total | ||||||||||||||||
Fiscal 2017 | — | 90.00 | — | 90.00 | 180.00 | |||||||||||||||
Fiscal 2018 | — | 90.00 | — | |||||||||||||||||
Fiscal 2018 (Projection) | 90.00 | 180.00 | ||||||||||||||||||
(Note) Modifications in the dividend projection from the latest announcement: None
| 3. | Forecasts for Consolidated Operating Results for Fiscal 2018 (April 1, 2018 to March 31, 2019) |
| (Percentage figures represent changes from previous fiscal year) | ||||||||||||||||||||||||||||||||||||||||||||
| Revenue | Core Earnings | Operating profit | Profit before income taxes | Net profit attributable to owners of the Company | Basic earnings per share | |||||||||||||||||||||||||||||||||||||||
| (Million JPY) | (%) | (Million JPY) | (%) | (Million JPY) | (%) | (Million JPY) | (%) | (Million JPY) | (%) | (JPY) | ||||||||||||||||||||||||||||||||||
Fiscal 2018 | 1,750,000 | (1.2 | ) | 330,000 | 2.3 | 268,900 | 11.2 | 245,200 | 12.9 | 189,500 | 1.4 | 241.82 | ||||||||||||||||||||||||||||||||
(Note) Modifications in forecasts of consolidated operating results from the latest announcement: None
The fiscal 2018 full year forecast for consolidated reported results remains unchanged from the previously announced forecast above (announced on October 31, 2018 with the second quarter FY 2018 results). While Takeda plans to announce an earnings forecast which includes an estimated financial impact of the Shire acquisition once a reasonable financial estimate is determined, the consideration of the asset valuation as well as purchase price allocation, schedule and manner of amortization and depreciation for the business combination accounting will require more time. It is also difficult to estimate the effect on profit and loss since the completion of the acquisition to the end of the consolidated accounting period, nor the acquisition related costs for the full fiscal year with a reasonable level of accuracy at this time. Considering the sizable effect on the business results due to the acquisition, Takeda will not revise the consolidated forecast in a provisional or partial way. It is our objective to disclose a Shire acquisition post-close consolidated business forecast for the fiscal year once a holistic and reasonable earnings forecast can be determined. We plan to announce this revised forecast, a Shire acquisition post-close consolidated business forecast for the year ending March 2019, in April of this year.
Table of Contents
Additional Information
(1) Changes in significant subsidiaries during the period | : No | |||||
(changes in specified subsidiaries resulting in the change in consolidation scope) |
| |||||
(2) Changes in accounting policies and changes in accounting estimates | ||||||
1) Changes in accounting policies required by IFRS | : Yes | |||||
2) Changes in accounting policies other than 1) | : No | |||||
3) Changes in accounting estimates | : No | |||||
(Note) For details, refer to “2. Condensed Interim Consolidated Financial Statements and Major Notes (5) Notes to Condensed Interim Consolidated Financial Statements (Significant Accounting Policies)” on page 13. | ||||||
(3) Number of shares outstanding (common stock) | ||||||
1) Number of shares outstanding (including treasury stock) at term end: |
| |||||
December 31, 2018 | 794,701,895 shares | |||||
March 31, 2018 | 794,688,295 shares | |||||
2) Number of shares of treasury stock at term end: | ||||||
December 31, 2018 | 10,224,786 shares | |||||
March 31, 2018 | 13,379,133 shares | |||||
3) Average number of outstanding shares (for the nine months period ended December 31): |
| |||||
December 31, 2018 | 783,486,186 shares | |||||
December 31, 2017 | 780,671,614 shares | |||||
* This summary of quarterly financial statements is exempt from quarterly review procedures
* Note to ensure appropriate use of forecasts, and other noteworthy items
| • | Takeda has adopted International Financial Reporting Standards (IFRS), and the disclosure information in this document is based on IFRS. |
| • | All forecasts in this document are based on information currently available to management, and do not represent a promise or guarantee to achieve these forecasts. Various uncertain factors could cause actual results to differ, such as changes in the business environment and fluctuations in foreign exchange rates. Should any significant event occur which requires the forecast to be revised, Takeda will disclose it in a timely manner. |
| • | For details of the financial forecast, please refer to “1. Financial Highlights for the Nine Months Period Ended December 31, 2018 (3) Outlook for Fiscal 2018” on page 8. |
| • | Supplementary materials for the financial statements (Data Book and Earnings Presentation of February 1, 2019) and the audio of the conference will be promptly posted on Takeda’s website. |
(Takeda Website):
http://www.takeda.com/investors/reports/
Table of Contents
Takeda Pharmaceutical Company Limited (4502)
Summary of Financial Statements for the Nine Months
Period Ended December 31, 2018 (Consolidated)
Attachment Index
1. Financial Highlights for the Nine Months Period Ended December 31, 2018 | 2 | |||
(1) Business Performance | 2 | |||
(2) Consolidated Financial Position | 7 | |||
(3) Outlook for Fiscal 2018 | 8 | |||
2. Condensed Interim Consolidated Financial Statements and Major Notes | 9 | |||
(1) Condensed Interim Consolidated Statement of Operations | 9 | |||
(2) Condensed Interim Consolidated Statement of Operations and Other Comprehensive Income | 9 | |||
(3) Condensed Interim Consolidated Statement of Financial Position | 10 | |||
(4) Condensed Interim Consolidated Statement of Changes in Equity | 11 | |||
(5) Notes to Condensed Interim Consolidated Financial Statements | 13 | |||
(Going Concern Assumption) | 13 | |||
(Significant Accounting Policies) | 13 | |||
(Significant Changes in Equity Attributable to Owners of the Company) | 16 | |||
(Business Combinations) | 16 | |||
(Significant Subsequent Events) | 17 | |||
- 1 -
Table of Contents
Takeda Pharmaceutical Company Limited (4502)
Summary of Financial Statements for the Nine Months
Period Ended December 31, 2018 (Consolidated)
1. Financial Highlights for the Nine Months Period Ended December 31, 2018
(1) Business Performance
(i) Consolidated Financial Results (April 1 to December 31, 2018)
Billion JPY
| Amount | Change versus the same period of the previous year | |||||||||||
Revenue | 1,380.0 | +10.4 | +0.8 | % | ||||||||
Core Earnings | 344.6 | +51.9 | +17.7 | % | ||||||||
Operating Profit | 284.4 | -37.9 | -11.7 | % | ||||||||
Profit Before Tax | 208.4 | -79.5 | -27.6 | % | ||||||||
Net Profit for the Period | 164.4 | -76.5 | -31.7 | % | ||||||||
EPS(JPY) | 209.87 | -98.71 | -32.0 | % | ||||||||
[Revenue]
Revenue of 1,380.0 billion JPY for the nine months period ending December 31, 2018 remained consistent compared to the same period of the previous year. Revenue growth driven by the continued expansion of Takeda’s Growth Drivers (Gastroenterology, Oncology, Neuroscience, and Emerging Markets)(Note) was offset by the adverse impact of divestitures(-37.9 billion JPY) and unfavorable foreign exchange rates, mainly due to the strengthening of the yen against currencies of emerging markets.
| (Note) | Oncology, Gastroenterology, Neuroscience, Rare Diseases, and Plasma Derived Therapies are Takeda’s current key business areas after the acquisition of Shire plc. |
Underlying Revenue, which excludes the impact of divestitures and foreign exchange rates, grew by +4.8% compared to the same period of the previous year, driven by a strong increase (+10.5%) in Takeda’s Growth Drivers.
Takeda’s Growth Drivers
| • | In the therapeutic area of Gastroenterology, revenue growth was +17.5% (Underlying +18.6%). This was driven by Takeda’stop-selling product ENTYVIO (for ulcerative colitis and Crohn’s disease) with sales of 201.0 billion JPY, a year-over-year increase of 51.5 billion JPY (+34.4%, Underlying +35.1%). This increase was mainly attributable to ENTYVIO’s steady expansion of patient share in thebio-naïve segment. Takeda obtained a New Drug Application Approval in July 2018 in Japan for the treatment of patients with moderately to severely active ulcerative colitis and launched the product in November 2018. |
Sales of TAKECAB (for acid-related diseases) were 44.4 billion JPY, an increase of 6.9 billion JPY (+18.5%, Underlying +18.5%) versus the same period of the previous year. The increase continued driven by the expansion of new prescriptions in the Japanese market due to TAKECAB’s efficacy in reflux esophagitis and the prevention of recurrence of gastric ulcers duringlow-dose aspirin administration.
| • | In the therapeutic area of Oncology, revenue growth was +5.8% (Underlying +7.0%). Sales of NINLARO (for multiple myeloma) were 46.5 billion JPY, a year-over-year increase of 11.9 billion JPY (+34.5%, Underlying +36.6%). Strong performance in several regions, particularly in the U.S continued to contribute to the growth. NINLARO is a once-weekly oral proteasome inhibitor with a profile of efficacy, safety and convenience. Sales of VELCADE (for multiple myeloma), which lost market exclusivity in the U.S. last year, decreased by 7.6 billion JPY(-7.0%, Underlying-6.3%). Sales of ICLUSIG (for leukemia) and ALUNBRIG (for lung cancer), obtained through the acquisition of ARIAD Pharmaceuticals, Inc. in February 2017, grew by 4.3 billion JPY (+25.0%, Underlying +26.0%) and 2.3 billion JPY (+149.7%, Underlying +151.4%) respectively, contributing over 30% to Oncology Underlying revenue growth. |
- 2 -
Table of Contents
Takeda Pharmaceutical Company Limited (4502)
Summary of Financial Statements for the Nine Months
Period Ended December 31, 2018 (Consolidated)
| • | In the therapeutic area of Neuroscience, revenue growth was +14.8% (Underlying +15.2%). Sales of TRINTELLIX (for major depressive disorder (MDD), generic name: vortioxetine) were 44.6 billion JPY, an increase of 7.1 billion JPY (+18.8%, Underlying +19.5%) versus the same period of the previous year. Prescribers and patients increasingly made TRINTELLIX part of their comprehensive approach to treat MDD. In May 2018, data showing improvement in processing speed, an important aspect of cognitive function, was included in the U.S. prescribing information of TRINTELLIX. |
| • | In Emerging Markets, revenue was 195.7 billion JPY, a decrease of 13.9 billion JPY(-6.6%, Underlying +5.1%) versus the same period of the previous year. Underlying revenue growth was +5.1%, boosted by the expansion of Oncology products such as ADCETRIS (for malignant lymphoma), and Gastroenterology products including ENTYVIO (for ulcerative colitis and Crohn’s disease). This growth was more than offset by the impact of divestitures (9.2 billion JPY) in Brazil and China as well as the negative impact of the strengthening of the yen (14.3 billion JPY). Underlying revenue growth was solid in the important Emerging Markets countries of Brazil and China, increasing by +26.9% and +19.5%, respectively. |
| (Note) | For more details of revenue by product, please refer to the “Data Book” and “Earnings Presentation” which are the supplementary materials for the financial statements. Effective from FY2018, sales of certain products in Japan are now disclosed on a net basis, deducting items such as discounts and rebates, in alignment with the global managerial approach applied to individual product sales. Including in this document, the change in disclosure of individual product sales has been revised retrospectively, with prior year figures reclassified on a net basis to enableyear-on-year comparisons. This reclassification has no impact on Takeda’s financial statements and does not represent a correction of the numbers in prior years. |
Takeda’sweb-site
https://www.takeda.com/investors/reports/
- 3 -
Table of Contents
Takeda Pharmaceutical Company Limited (4502)
Summary of Financial Statements for the Nine Months
Period Ended December 31, 2018 (Consolidated)
| • | Breakdown of Consolidated Revenue: |
| Billion JPY | ||||||||||||||||||||||||
| Amount | Change versus the same period of the previous year | Underlying Revenue (Note) | ||||||||||||||||||||||
| Amount | Underlying Growth | |||||||||||||||||||||||
Prescription Drug | 1,330.4 | +24.5 | +1.9 | % | 1,307.8 | +76.5 | +6.2 | % | ||||||||||||||||
U.S. | 495.3 | +32.3 | +7.0 | % | 470.1 | +37.0 | +8.5 | % | ||||||||||||||||
Japan | 394.5 | -5.0 | -1.3 | % | 394.1 | +18.4 | +4.9 | % | ||||||||||||||||
Europe and Canada | 244.9 | +11.1 | +4.8 | % | 245.6 | +11.5 | +4.9 | % | ||||||||||||||||
Emerging Markets | 195.7 | -13.9 | -6.6 | % | 197.9 | +9.6 | +5.1 | % | ||||||||||||||||
Consumer Healthcare and Other | 49.6 | -14.1 | -22.1 | % | 49.6 | -14.1 | -22.1 | % | ||||||||||||||||
Consolidation total | 1,380.0 | +10.4 | +0.8 | % | 1,357.5 | +62.4 | +4.8 | % | ||||||||||||||||
| (Note) | Underlying Revenue excludes the impact of foreign exchange movements and divestitures. |
Impact of Divestitures
| • | Total revenue for the period ending December 31, 2018 was negatively impacted by-37.9 billion JPY due to divestitures. The largest item was the-18.6 billion JPY impact from the sale of 7 long-listed products in Japan to Teva Takeda Yakuhin Ltd., a subsidiary of Teva Takeda Pharma Ltd., in May 2017. The impact of other divestitures totaled-19.2 billion JPY. |
[Operating Profit]
Consolidated Operating Profit was 284.4 billion JPY, a decrease of 37.9 billion JPY(-11.7%) compared to the same period of the previous year.
| • | Cost of Sales was 369.9 billion JPY, a decrease of 15.2 billion JPY(-3.9%) and the Cost of Sales Ratio was 26.8%(-1.3pp) compared to the same period of the previous year. This decrease was mainly driven by a more favorable sales products mix. Cost of Sales, excluding the impact of divestitures and foreign exchange, decreased by 1.0% leading to a decrease in the Cost of Sales Ratio by 1.6pp. |
| • | Selling, General and Administrative (SG&A) Expenses were 447.7 billion JPY, a decrease of 8.7 billion JPY(-1.9%) compared to the same period of the previous year primarily due to favorable impact of the Global Opex Initiative as well as lower LTIP expenses. The decrease was partially offset by acquisition related costs of 11.0 billion JPY for the acquisition of Shire plc. SG&A expenses, excluding acquisition related costs, the impact of divestitures and foreign exchange, decreased by 2.6%. |
| • | R&D expenses decreased by 7.8 billion JPY(-3.3%) compared to the same period of the previous year primarily due to the favorable impact of the strengthening of yen. R&D expenses, excluding the impact of divestitures and foreign exchange rates, decreased by 2.8%. |
| • | Amortization and Impairment Losses on Intangible Assets Associated with Products was 79.4 billion JPY, a decrease of 7.0 billion JPY(-8.1%) compared to the same period of the previous year. The decrease was primarily due to the net impact of the following factors: (1) the intangible asset attributable to the VELCADE US patent was fully amortized within fiscal year 2017 which resulted in a lower amortization cost(-35.7 billion JPY) for the current period as compared to the same period of previous year; (2) during the same period of previous year, we recorded a 16.1 billion JPY impairment reversal related to COLCRYS based on a revised more favorable sales forecast. We did not record such a reversal in the current period. Furthermore, we recorded a 7.2 billion JPY impairment in the current period related to the termination of an R&D collaboration with Mersana. |
| • | Other Operating Income was 61.7 billion JPY, a decrease of 102.3 billion JPY(-62.4%) compared to the same period of the previous year. This decrease was mainly due to a 106.3 billion JPY gain on the sale of Wako Pure Chemical Industries, Ltd. recorded in the same period of the previous year. |
- 4 -
Table of Contents
Takeda Pharmaceutical Company Limited (4502)
Summary of Financial Statements for the Nine Months
Period Ended December 31, 2018 (Consolidated)
| • | Other Operating Expense was 31.4 billion JPY, a decrease of 15.4 billion JPY(-32.9%) compared to the same period of the previous year. This decrease was primarily attributed to a 7.1 billion JPY valuation reserve forpre-launch inventory recorded in the same period of the previous year, as well as a-5.3 billion JPY reversal of valuation reserve forpre-launch inventories recorded in the current period as a result of a New Drug Application Approval. Other operating expenses for the same period of the previous year included 8.1 billion JPY from changes in the COLCRYS contingent consideration liability(Note). These decreases were partially offset by a 5.4 billion JPY increase in restructuring expenses. Integration expenses of 14.1 billion JPY related to the acquisition Shire plc were recorded in restructuring expenses in the current period. |
| (Note) | The contingent consideration liability, arising from business combination, recognizes the fair value of a part of the purchase price which may arise if specified future events occur. |
[Net Profit for the Period (Attributable to Owners of the Company)]
Consolidated Net Profit for the Period was 164.4 billion JPY, a decrease of 76.5 billion JPY(-31.7%) compared to the same period of the previous year, mainly due to a decrease in Operating Profit, an increase in Net Financial Expenses, and an increase in Shares of Loss of Associates Accounted for Using the Equity Method partially offset with lower Income Tax Expenses.
| • | Net Financial Income / (Expense) was a (32.1) billion JPY for the current period, an increase of (31.0) billion JPY compared to the same period of the previous year. This increase was mainly due to a 16.1 billion JPY gain on the sale of certain securities in the same period of the previous year that did not reoccur for the current period. Sales of securities are no longer recorded as financial income due to the adoption of a new IFRS standard. Furthermore, a (23.5) billion JPY financial cost related to the Shire acquisition was recorded in the current period. |
| • | Shares of Loss of Associates Accounted for Using the Equity Method was 44.0 billion JPY, with losses 10.6 billion JPY higher than the same period of the previous year. The losses were recorded mainly due to Takeda’s share of impairment charge recognized by Teva Takeda Pharma Ltd. (including its subsidiary, Teva Takeda Yakuhin Ltd.). Teva Takeda Pharma Ltd. operates a business of long-listed products and generics, and conducted a revaluation of its assets in response to changes in the business environment. |
| • | Income Tax Expenses decreased by 3.2 billion JPY(-6.7%) compared to the same period of the previous year. This decrease was mainly due to a decline in Profit Before Tax, as well as lower tax expenses as a result of changes in uncertain tax positions. These factors were partially offset by the impacts from the enactment of the Tax Cuts and Jobs Act (Tax Reform) in the U.S. in the same period of the previous year and decreased tax credits and tax impact of highernon-deductible expenses in the current period compared to the same period of the previous year. |
| • | Basic Earnings Per Share were 209.87 JPY, a decrease of 98.71 JPY(-32.0%) compared to the same period of the previous year. |
- 5 -
Table of Contents
Takeda Pharmaceutical Company Limited (4502)
Summary of Financial Statements for the Nine Months
Period Ended December 31, 2018 (Consolidated)
(ii) Underlying Growth (April 1 to December 31, 2018)
Takeda uses the concept of “Underlying Growth” for internal planning and performance evaluation purposes.
Underlying Growth compares two periods (quarters or years) of financial results under a common basis and is used by management to assess the business. These financial results are calculated on a constant currency basis and excluding the impacts of divestitures and other amounts that are unusual,non-recurring items or unrelated to our ongoing operations. Although these are not measures defined by IFRS, Takeda believes Underlying Growth is useful to investors as it provides a consistent measure of our performance.
Takeda uses “Underlying Revenue(Note1) Growth”, “Underlying Core Earnings(Note2) Growth”, and “Underlying Core EPS(Note3) Growth” as key financial metrics.
| Change versus the same period of the previous year | ||||||||
| % | Billion JPY | |||||||
Underlying Revenue (Note1) | +4.8 | % | +62.4 | |||||
Underlying Core Earnings (Note2) | +32.3 | % | +83.9 | |||||
Underlying Core EPS (Note3) | +34.2 | % | +86.97 JPY | |||||
| (Note 1) | Underlying Revenue represents revenue on a constant currency basis and excludingnon-recurring items and the impact of divestitures occurred during the reporting periods presented. |
In this period, the underlying revenue excludes the impact of the sale of 7 long-listed products in Japan to Teva Takeda Yakuhin Ltd. which is a subsidiary of Teva Takeda Pharma Ltd. and the impact of the divestitures of Multilab Indústria e Comércio de Produtos Farmacêuticos Ltda. and Guangdong TechpoolBio-Pharma Co., Ltd.
| (Note 2) | Core Earnings represents net profit adjusted to exclude income tax expenses, our share of profit or loss of investments accounted for using the equity method, finance expenses and income, other operating expenses and income, amortization and impairment losses on intangible assets associated with products and other items that management believes are unrelated to our core operations, such as purchase accounting effects and transaction related costs. |
In this period, the other significant items that are excluded in calculating Core Earnings include the acquisition related costs for the acquisition of Shire plc.
Underlying Core Earnings represents Core Earnings based on a constant currency basis and further adjusted to exclude the impacts of divestitures occurred during the reporting periods presented.
In this period, divestitures include the impact of the sale of 7 long-listed products in Japan to Teva Takeda Yakuhin Ltd., a subsidiary of Teva Takeda Pharma Ltd. and the impact of the divestitures of Multilab Indústria e Comércio de Produtos Farmacêuticos Ltda. and Guangdong TechpoolBio-Pharma Co., Ltd.
| (Note 3) | Underlying Core EPS represents net income based on a constant currency basis, adjusted to exclude the impact of divestitures, items excluded in the calculation of Core Earnings and othernon-operating items (e.g. amongst other items, fair value adjustments and the imputed financial charge related to contingent consideration) that are unusual,non-recurring in nature or unrelated to its ongoing operations and the tax effect of each of the adjustments, divided by the outstanding shares (excluding treasury shares) as of the end of the comparative period. |
In this period, the othernon-operating significant items that are excluded in calculating Underlying Core EPS include the financial costs related to the Shire acquisition in addition to fair value adjustments and the imputed financial charge related to contingent consideration.
| • | Underlying Revenue growth was +4.8% compared to the same period of the previous year, driven by the strong performance of Takeda’s Growth Drivers and more specifically products such as ENTYVIO (for ulcerative colitis and Crohn’s disease), NINLARO (for multiple myeloma), ICLUSIG (for leukemia), TRINTELLIX (for major depressive disorder) and TAKECAB (for acid-related diseases). The Underlying Revenue of Takeda’s Growth Drivers grew by +10.5%. |
- 6 -
Table of Contents
Takeda Pharmaceutical Company Limited (4502)
Summary of Financial Statements for the Nine Months
Period Ended December 31, 2018 (Consolidated)
| • | Underlying Core Earnings growth was +32.3%, reflecting strong Underlying Revenue growth and the positive impact of the Global Opex Initiative(Note). Underlying Cost of Sales as a percentage of sales improved by +1.6pp reflecting a more favorable sales mix. Underlying Operating Expenses as a percentage of sales improved by +3.7pp reflecting the impact of the Global Opex Initiative. The combination of the above factors led to an improvement in the Core Earnings Margin by 5.3pp to 25.3%. |
| (Note) | Takeda’s global operating expense reduction initiative with the aim of delivering annual margin improvements of100-200 base points driven by reduced consumption, procurement initiatives and organizational optimization. |
| • | Underlying Core EPS growth was +34.2% compared to the same period of the previous year reflecting strong Underlying Core Earnings growth of +32.3%. |
(2) Consolidated Financial Position
[Assets]
Total Assets as of December 31, 2018 were 5,767.2 billion JPY, an increase of 1,660.8 billion JPY compared to the previous fiscalyear-end. Other Financial Assets increased by 1,477.6 billion JPY mainly due to recognition of restricted deposits related to the acquisition of Shire plc. In addition, Trade and Other Receivables increased by 89.3 billion JPY.
[Liabilities]
Total Liabilities as of December 31, 2018 were 3,724.6 billion JPY, an increase of 1,635.6 billion JPY compared to the previous fiscalyear-end. Bonds and Loans increased by 1,563.1 billion JPY to 2,548.8 billion JPY(Note) mainly due to an issuance of bonds. In addition, Other Financial Liabilities increased by 79.9 billion JPY.
| (Note) | The carrying amount of Bonds and Loans as of December 31, 2018 was 1,728.4 billion JPY and 820.4 billion JPY, respectively. Breakdown of bonds is as follows. |
| Billion JPY | ||||||||||||
Name of Bond | Issuance | Maturity | Carrying Amount | |||||||||
14th Unsecured straight bonds | July, 2013 | July, 2019 | 60.0 | |||||||||
15th Unsecured straight bonds | July, 2013 | July, 2020 | 60.0 | |||||||||
Unsecured US dollar dominated senior notes (500 million USD) | July, 2017 | January, 2022 | 55.3 | |||||||||
Unsecured Euro dominated senior notes (7,500 million EUR) | November, 2018 | | November 2020 ~ November 2030 |
| 946.0 | |||||||
Unsecured US dollar dominated senior notes (5,500 million USD) | November, 2018 | | November 2020 ~ November 2028 | | 607.2 | |||||||
|
| |||||||||||
Total | ¥ | 1,728.4 | ||||||||||
|
| |||||||||||
[Equity]
Total Equity as of December 31, 2018 was 2,042.6 billion JPY, an increase of 25.2 billion JPY compared to the previous fiscalyear-end. This was mainly due to an increase of 57.6 billion JPY in Retained Earnings resulting from the recognition of Net Profit for the Period, an increase of the opening balance due to the adoption of new accounting standards, and a transfer from Other Comprehensive Income due to the sale of securities, partially offset by the payment of dividends.
The ratio of Equity Attributable to Owners of the Company(Note) to total assets decreased by 13.3pp from the previous fiscalyear-end to 35.3%.
| (Note) | Equivalent to Shareholders’ Equity ratio byJ-GAAP. |
- 7 -
Table of Contents
Takeda Pharmaceutical Company Limited (4502)
Summary of Financial Statements for the Nine Months
Period Ended December 31, 2018 (Consolidated)
(3) Outlook for Fiscal 2018
The fiscal 2018 full year forecast for consolidated reported results remains unchanged from the previously announced forecast below (announced on October 31, 2018 with the second quarter FY 2018 results). While Takeda plans to announce an earnings forecast which includes an estimated financial impact of the Shire acquisition once a reasonable financial estimate is determined, the consideration of the asset valuation as well as purchase price allocation, schedule and manner of amortization and depreciation for the business combination accounting will require more time. It is also difficult to estimate the effect on profit and loss since the completion of the acquisition to the end of the consolidated accounting period, nor the acquisition related costs for the full fiscal year with a reasonable level of accuracy at this time. Considering the sizable effect on the business results due to the acquisition, Takeda will not revise the consolidated forecast in a provisional or partial way. It is our objective to disclose a Shire acquisition post-close consolidated business forecast for the fiscal year once a holistic and reasonable earnings forecast can be determined. We plan to announce this revised forecast, a Shire acquisition post-close consolidated business forecast for the year ending March 2019, in April of this year.
Additionally, although there is no direct effect on Takeda’s full year forecast for consolidated reported results for fiscal 2018, we plan to disclose Shire’s full year results for the period ending December 2018 inmid-February of this year.
| Full year reported forecast for Fiscal 2018 (announced on October 31, 2018) | Billion JPY | |||||||||||
Amount | Change versus the | |||||||||||
Revenue | 1,750.0 | -20.5 | -1.2 | % | ||||||||
Core Earnings | 330.0 | +7.5 | +2.3 | % | ||||||||
Operating profit | 268.9 | +27.1 | +11.2 | % | ||||||||
Profit before tax | 245.2 | +28.0 | +12.9 | % | ||||||||
Net profit for the period (attributable to owners of the Company) | 189.5 | +2.6 | +1.4 | % | ||||||||
EPS(JPY) | 241.82 | +2.47 | +1.0 | % | ||||||||
The fiscal 2018 management guidance remains unchanged for the same reason described above.
Management Guidance – Underlying growth (announced on October 31, 2018)
Fiscal 2018 Management Guidance (growth %) | ||
Underlying Revenue | Low single digit | |
Underlying Core Earnings | High teen | |
Underlying Core EPS | Mid twenties |
[Forward looking statement]
All forecasts in this document are based on information currently available to management, and do not represent a promise or guarantee to achieve these forecasts. Various uncertain factors could cause actual results to differ, such as changes in the business environment and fluctuations in foreign exchange rates. Should any significant event occur which requires the forecast to be revised, the Company will disclose it in a timely manner.
- 8 -
Table of Contents
Takeda Pharmaceutical Company Limited (4502)
Summary of Financial Statements for the Nine Months
Period Ended December 31, 2018 (Consolidated)
2. Condensed Interim Consolidated Financial Statements and Major Notes
(1) Condensed Interim Consolidated Statement of Income
| JPY (millions) | ||||||||
| Nine months period ended December 31, 2017 | Nine months period ended December 31, 2018 | |||||||
Revenue | 1,369,568 | 1,380,013 | ||||||
Cost of sales | (385,029 | ) | (369,855 | ) | ||||
Selling, general and administrative expenses | (456,340 | ) | (447,677 | ) | ||||
Research and development expenses | (236,659 | ) | (228,893 | ) | ||||
Amortization and impairment losses on intangible assets associated with products | (86,345 | ) | (79,390 | ) | ||||
Other operating income | 163,923 | 61,667 | ||||||
Other operating expenses | (46,831 | ) | (31,445 | ) | ||||
|
|
|
| |||||
Operating profit | 322,287 | 284,420 | ||||||
Finance income | 21,706 | 9,437 | ||||||
Finance expenses | (22,761 | ) | (41,518 | ) | ||||
Share of profit (loss) of investments accounted for using the equity method | (33,341 | ) | (43,960 | ) | ||||
|
|
|
| |||||
Profit before tax | 287,891 | 208,379 | ||||||
Income tax expenses | (47,203 | ) | (44,026 | ) | ||||
|
|
|
| |||||
Net profit for the period | 240,688 | 164,353 | ||||||
|
|
|
| |||||
Attributable to: | ||||||||
Owners of the Company | 240,906 | 164,434 | ||||||
Non-controlling interests | (218 | ) | (81 | ) | ||||
|
|
|
| |||||
Net profit for the period | 240,688 | 164,353 | ||||||
|
|
|
| |||||
Earnings per share (JPY) | ||||||||
Basic earnings per share | 308.59 | 209.87 | ||||||
Diluted earnings per share | 306.51 | 208.64 | ||||||
(2) Condensed Interim Consolidated Statement of Income and Other Comprehensive Income
| JPY (millions) | ||||||||
| Nine months period ended December 31, 2017 | Nine months period ended December 31, 2018 | |||||||
Net profit for the period | 240,688 | 164,353 | ||||||
Other comprehensive income (loss) | ||||||||
Items that will not be reclassified to profit or loss | ||||||||
Changes in fair value of financial assets measured at fair value through other comprehensive income | — | (6,478 | ) | |||||
Re-measurement (loss) gain on defined benefit plans | (762 | ) | 461 | |||||
|
|
|
| |||||
| (762 | ) | (6,017 | ) | |||||
Items that may be reclassified subsequently to profit or loss | ||||||||
Exchange differences on translation of foreign operations | 105,263 | 3,203 | ||||||
Net changes on revaluation ofavailable-for-sale financial assets | 16,102 | — | ||||||
Cash flow hedges | 1,729 | (15,666 | ) | |||||
Hedging cost | 989 | (1,796 | ) | |||||
Share of other comprehensive income (loss) of investments accounted for using the equity method | 131 | (107 | ) | |||||
|
|
|
| |||||
| 124,214 | (14,366 | ) | ||||||
|
|
|
| |||||
Other comprehensive income (loss) for the period, net of tax | 123,452 | (20,383 | ) | |||||
|
|
|
| |||||
Total comprehensive income (loss) for the period | 364,140 | 143,970 | ||||||
|
|
|
| |||||
Attributable to: | ||||||||
Owners of the Company | 363,706 | 144,224 | ||||||
Non-controlling interests | 434 | (254 | ) | |||||
|
|
|
| |||||
Total comprehensive income for the period | 364,140 | 143,970 | ||||||
|
|
|
| |||||
- 9 -
Table of Contents
Takeda Pharmaceutical Company Limited (4502)
Summary of Financial Statements for the Nine Months
Period Ended December 31, 2018 (Consolidated)
(3) Condensed Interim Consolidated Statement of Financial Position
| JPY (millions) | ||||||||
| As of March 31, 2018 | As of December 31, 2018 | |||||||
ASSETS | ||||||||
NON-CURRENT ASSETS | ||||||||
Property, plant and equipment | 536,801 | 601,774 | ||||||
Goodwill | 1,029,248 | 1,053,506 | ||||||
Intangible assets | 1,014,264 | 1,020,216 | ||||||
Investments accounted for using the equity method | 107,949 | 94,524 | ||||||
Other financial assets | 196,436 | 188,331 | ||||||
Othernon-current assets | 77,977 | 89,248 | ||||||
Deferred tax assets | 64,980 | 49,552 | ||||||
|
|
|
| |||||
Totalnon-current assets | 3,027,655 | 3,097,151 | ||||||
|
|
|
| |||||
CURRENT ASSETS | ||||||||
Inventories | 212,944 | 223,398 | ||||||
Trade and other receivables | 420,247 | 509,502 | ||||||
Other financial assets | 80,646 | 1,566,330 | ||||||
Income taxes recoverable | 8,545 | 6,289 | ||||||
Other current assets | 57,912 | 64,503 | ||||||
Cash and cash equivalents | 294,522 | 297,873 | ||||||
Assets held for sale | 3,992 | 2,177 | ||||||
|
|
|
| |||||
Total current assets | 1,078,808 | 2,670,072 | ||||||
|
|
|
| |||||
Total assets | 4,106,463 | 5,767,223 | ||||||
|
|
|
| |||||
| JPY (millions) | ||||||||
| As of March 31, 2017 | As of December 31, 2018 | |||||||
LIABILITIES AND EQUITY | ||||||||
LIABILITIES | ||||||||
NON-CURRENT LIABILITIES | ||||||||
Bonds and loans | 985,644 | 2,428,040 | ||||||
Other financial liabilities | 91,223 | 155,833 | ||||||
Net defined benefit liabilities | 87,611 | 85,361 | ||||||
Provisions | 28,042 | 17,889 | ||||||
Othernon-current liabilities | 68,300 | 60,131 | ||||||
Deferred tax liabilities | 90,725 | 105,684 | ||||||
|
|
|
| |||||
Totalnon-current liabilities | 1,351,545 | 2,852,938 | ||||||
|
|
|
| |||||
CURRENT LIABILITIES | ||||||||
Bonds and loans | 18 | 120,743 | ||||||
Trade and other payables | 240,259 | 248,616 | ||||||
Other financial liabilities | 29,613 | 44,933 | ||||||
Income taxes payable | 67,694 | 60,446 | ||||||
Provisions | 132,781 | 138,393 | ||||||
Other current liabilities | 263,930 | 258,143 | ||||||
Liabilities held for sale | 3,214 | 433 | ||||||
|
|
|
| |||||
Total current liabilities | 737,509 | 871,707 | ||||||
|
|
|
| |||||
Total liabilities | 2,089,054 | 3,724,645 | ||||||
|
|
|
| |||||
EQUITY | ||||||||
Share capital | 77,914 | 77,942 | ||||||
Share premium | 90,740 | 87,098 | ||||||
Treasury shares | (74,373 | ) | (57,137 | ) | ||||
Retained earnings | 1,557,307 | 1,614,904 | ||||||
Other components of equity | 350,631 | 315,875 | ||||||
Other comprehensive income related to assets held for sale | (4,795 | ) | — | |||||
|
|
|
| |||||
Equity attributable to owners of the Company | 1,997,424 | 2,038,682 | ||||||
|
|
|
| |||||
Non-controlling interests | 19,985 | 3,896 | ||||||
|
|
|
| |||||
Total equity | 2,017,409 | 2,042,578 | ||||||
|
|
|
| |||||
Total liabilities and equity | 4,106,463 | 5,767,223 | ||||||
|
|
|
| |||||
- 10 -
Table of Contents
Takeda Pharmaceutical Company Limited (4502)
Summary of Financial Statements for the Nine Months
Period Ended December 31, 2018 (Consolidated)
(4) Condensed Interim Consolidated Statement of Changes in Equity
Nine months period ended December 31, 2017 (From April 1 to December 31, 2017)
| JPY (millions) |
| |||||||||||||||||||||||||||||
| Equity attributable to owners of the Company | ||||||||||||||||||||||||||||||
| Share capital | Share premium | Treasury shares | Retained earnings | Other components of equity | ||||||||||||||||||||||||||
| Exchange differences on translation of foreign operations | Changes in fair value of financial assets measured at fair value through other comprehensive income | Net changes on revaluation of available-for- sale financial assets | ||||||||||||||||||||||||||||
As of April 1, 2017 | 65,203 | 74,973 | (48,734 | ) | 1,511,817 | 221,550 | — | 67,980 | ||||||||||||||||||||||
|
|
|
|
|
|
|
|
|
|
|
|
|
| |||||||||||||||||
Net profit for the period | 240,906 | |||||||||||||||||||||||||||||
Other comprehensive income | 104,758 | 16,086 | ||||||||||||||||||||||||||||
|
|
|
|
|
|
|
|
|
|
|
|
|
| |||||||||||||||||
Comprehensive income for the period | — | — | — | 240,906 | 104,758 | — | 16,086 | |||||||||||||||||||||||
|
|
|
|
|
|
|
|
|
|
|
|
|
| |||||||||||||||||
Issuances of new shares | 1,030 | 1,030 | ||||||||||||||||||||||||||||
Acquisitions of treasury shares | (18,760 | ) | ||||||||||||||||||||||||||||
Disposals of treasury shares | 0 | 1 | ||||||||||||||||||||||||||||
Dividends | (142,120 | ) | ||||||||||||||||||||||||||||
Changes in ownership | ||||||||||||||||||||||||||||||
Transfers from other components of equity | (762 | ) | ||||||||||||||||||||||||||||
Share-based compensation | 13,688 | |||||||||||||||||||||||||||||
Exercise of share-based awards | (14,856 | ) | 15,905 | |||||||||||||||||||||||||||
Transfers tonon-financial assets | ||||||||||||||||||||||||||||||
|
|
|
|
|
|
|
|
|
|
|
|
|
| |||||||||||||||||
Total transactions with owners | 1,030 | (138 | ) | (2,854 | ) | (142,882 | ) | — | — | — | ||||||||||||||||||||
|
|
|
|
|
|
|
|
|
|
|
|
|
| |||||||||||||||||
As of December 31, 2017 | 66,233 | 74,835 | (51,588 | ) | 1,609,841 | 326,308 | — | 84,066 | ||||||||||||||||||||||
|
|
|
|
|
|
|
|
|
|
|
|
|
| |||||||||||||||||
| Equity attributable to owners of the Company | ||||||||||||||||||||||||||||||||
| Other components of equity | ||||||||||||||||||||||||||||||||
| Cash flow hedges | Hedging cost | Re-measurement gain or loss on defined benefit plans | Total | Other comprehensive income related to assets held for sale | Total | Non-controlling interests | Total equity | |||||||||||||||||||||||||
As of April 1, 2017 | 1,472 | — | — | 291,002 | — | 1,894,261 | 54,704 | 1,948,965 | ||||||||||||||||||||||||
|
|
|
|
|
|
|
|
|
|
|
|
|
|
|
| |||||||||||||||||
Net profit for the period | — | 240,906 | (218 | ) | 240,688 | |||||||||||||||||||||||||||
Other comprehensive income | 1,729 | 989 | (762 | ) | 122,800 | 122,800 | 652 | 123,452 | ||||||||||||||||||||||||
|
|
|
|
|
|
|
|
|
|
|
|
|
|
|
| |||||||||||||||||
Comprehensive income for the period | 1,729 | 989 | (762 | ) | 122,800 | — | 363,706 | 434 | 364,140 | |||||||||||||||||||||||
|
|
|
|
|
|
|
|
|
|
|
|
|
|
|
| |||||||||||||||||
Issuances of new shares | — | 2,060 | 2,060 | |||||||||||||||||||||||||||||
Acquisitions of treasury shares | — | (18,760 | ) | (18,760 | ) | |||||||||||||||||||||||||||
Disposals of treasury shares | — | 1 | 1 | |||||||||||||||||||||||||||||
Dividends | — | (142,120 | ) | (2,189 | ) | (144,309 | ) | |||||||||||||||||||||||||
Changes in ownership | — | — | (32,750 | ) | (32,750 | ) | ||||||||||||||||||||||||||
Transfers from other components of equity | 762 | 762 | — | — | ||||||||||||||||||||||||||||
Share-based compensation | — | 13,688 | 13,688 | |||||||||||||||||||||||||||||
Exercise of share-based awards | — | 1,049 | 1,049 | |||||||||||||||||||||||||||||
Transfers tonon-financial assets | — | — | — | |||||||||||||||||||||||||||||
|
|
|
|
|
|
|
|
|
|
|
|
|
|
|
| |||||||||||||||||
Total transactions with owners | — | — | 762 | 762 | — | (144,082 | ) | (34,939 | ) | (179,021 | ) | |||||||||||||||||||||
|
|
|
|
|
|
|
|
|
|
|
|
|
|
|
| |||||||||||||||||
As of December 31, 2017 | 3,201 | 989 | — | 414,564 | — | 2,113,885 | 20,199 | 2,134,084 | ||||||||||||||||||||||||
|
|
|
|
|
|
|
|
|
|
|
|
|
|
|
| |||||||||||||||||
- 11 -
Table of Contents
Takeda Pharmaceutical Company Limited (4502)
Summary of Financial Statements for the Nine Months
Period Ended December 31, 2018 (Consolidated)
Nine months period ended December 31, 2018 (From April 1 to December 31, 2018)
| JPY (millions) |
| |||||||||||||||||||||||||||||
| Equity attributable to owners of the Company | ||||||||||||||||||||||||||||||
| Other components of equity | ||||||||||||||||||||||||||||||
| Share capital | Share premium | Treasury shares | Retained earnings | Exchange differences on translation of foreign operations | Changes in fair value of financial assets measured at fair value through other comprehensive income | Net changes on revaluation of available-for- sale financial assets | ||||||||||||||||||||||||
As of April 1, 2018 | 77,914 | 90,740 | (74,373 | ) | 1,557,307 | 272,597 | — | 73,037 | ||||||||||||||||||||||
Cumulative effects of changes in accounting policies | 15,401 | 84,672 | (73,037 | ) | ||||||||||||||||||||||||||
|
|
|
|
|
|
|
|
|
|
|
|
|
| |||||||||||||||||
Restated balance | 77,914 | 90,740 | (74,373 | ) | 1,572,708 | 272,597 | 84,672 | — | ||||||||||||||||||||||
|
|
|
|
|
|
|
|
|
|
|
|
|
| |||||||||||||||||
Net profit for the period | 164,434 | |||||||||||||||||||||||||||||
Other comprehensive income | (1,478 | ) | (6,526 | ) | ||||||||||||||||||||||||||
|
|
|
|
|
|
|
|
|
|
|
|
|
| |||||||||||||||||
Comprehensive income for the period | — | — | — | 164,434 | (1,478 | ) | (6,526 | ) | — | |||||||||||||||||||||
|
|
|
|
|
|
|
|
|
|
|
|
|
| |||||||||||||||||
Issuances of new shares | 28 | 28 | ||||||||||||||||||||||||||||
Acquisitions of treasury shares | (1,164 | ) | ||||||||||||||||||||||||||||
Disposals of treasury shares | (0 | ) | 3 | |||||||||||||||||||||||||||
Dividends | (142,697 | ) | ||||||||||||||||||||||||||||
Changes in ownership | (2,126 | ) | 230 | |||||||||||||||||||||||||||
Transfers from other components of equity | 22,585 | (22,124 | ) | |||||||||||||||||||||||||||
Share-based compensation | 14,887 | |||||||||||||||||||||||||||||
Exercise of share-based awards | (18,557 | ) | 18,397 | |||||||||||||||||||||||||||
Transfers tonon-financial assets | ||||||||||||||||||||||||||||||
Total transactions with owners | 28 | (3,642 | ) | 17,236 | (122,238 | ) | 230 | (22,124 | ) | — | ||||||||||||||||||||
|
|
|
|
|
|
|
|
|
|
|
|
|
| |||||||||||||||||
As of December 31, 2018 | 77,942 | 87,098 | (57,137 | ) | 1,614,904 | 271,349 | 56,022 | — | ||||||||||||||||||||||
|
|
|
|
|
|
|
|
|
|
|
|
|
| |||||||||||||||||
| Equity attributable to owners of the Company | ||||||||||||||||||||||||||||||||
| Other components of equity | ||||||||||||||||||||||||||||||||
| Cash flow hedges | Hedging cost | Re-measurement gain or loss on defined benefit plans | Tota1 | Other comprehensive income related to assets held for sale | Total | Non-controlling interests | Total equity | |||||||||||||||||||||||||
As of April 1, 2018 | 3,391 | 1,606 | — | 350,631 | (4,795 | ) | 1,997,424 | 19,985 | 2,017,409 | |||||||||||||||||||||||
Cumulative effects of changes in accounting policies | (1,378 | ) | 10,257 | 25,658 | (10 | ) | 25,648 | |||||||||||||||||||||||||
|
|
|
|
|
|
|
|
|
|
|
|
|
|
|
| |||||||||||||||||
Restated balance | 2,013 | 1,606 | — | 360,888 | (4,795 | ) | 2,023,082 | 19,975 | 2,043,057 | |||||||||||||||||||||||
|
|
|
|
|
|
|
|
|
|
|
|
|
|
|
| |||||||||||||||||
Net profit for the period | — | 164,434 | (81 | ) | 164,353 | |||||||||||||||||||||||||||
Other comprehensive income | (15,666 | ) | (1,796 | ) | 461 | (25,005 | ) | 4,795 | (20,210 | ) | (173 | ) | (20,383 | ) | ||||||||||||||||||
|
|
|
|
|
|
|
|
|
|
|
|
|
|
|
| |||||||||||||||||
Comprehensive income for the period | (15,666 | ) | (1,796 | ) | 461 | (25,005 | ) | 4,795 | 144,224 | (254 | ) | 143,970 | ||||||||||||||||||||
|
|
|
|
|
|
|
|
|
|
|
|
|
|
|
| |||||||||||||||||
Issuances of new shares | — | 56 | 56 | |||||||||||||||||||||||||||||
Acquisitions of treasury shares | — | (1,164 | ) | (1,164 | ) | |||||||||||||||||||||||||||
Disposals of treasury shares | — | 3 | 3 | |||||||||||||||||||||||||||||
Dividends | — | (142,697 | ) | (168 | ) | (142,865 | ) | |||||||||||||||||||||||||
Changes in ownership | 230 | (1,896 | ) | (15,657 | ) | (17,553 | ) | |||||||||||||||||||||||||
Transfers from other components of equity | (461 | ) | (22,585 | ) | — | — | ||||||||||||||||||||||||||
Share-based compensation | — | 14,887 | 14,887 | |||||||||||||||||||||||||||||
Exercise of share-based awards | — | (160 | ) | (160 | ) | |||||||||||||||||||||||||||
Transfers tonon-financial assets | 2,347 | 2,347 | 2,347 | 2,347 | ||||||||||||||||||||||||||||
|
|
|
|
|
|
|
|
|
|
|
|
|
|
|
| |||||||||||||||||
Total transactions with owners | 2,347 | — | (461 | ) | (20,008 | ) | — | (128,624 | ) | (15,825 | ) | (144,449 | ) | |||||||||||||||||||
|
|
|
|
|
|
|
|
|
|
|
|
|
|
|
| |||||||||||||||||
As of December 31, 2018 | (11,306 | ) | (190 | ) | — | 315,875 | — | 2,038,682 | 3,896 | 2,042,578 | ||||||||||||||||||||||
|
|
|
|
|
|
|
|
|
|
|
|
|
|
|
| |||||||||||||||||
- 12 -
Table of Contents
Takeda Pharmaceutical Company Limited (4502)
Summary of Financial Statements for the Nine Months
Period Ended December 31, 2018 (Consolidated)
(5) Notes to Condensed Interim Consolidated Financial Statements
(Going Concern Assumption)
Nine months period ended December 31, 2018 (April 1 to December 31, 2018)
Not applicable.
(Significant Accounting Policies)
Significant accounting policies adopted for these condensed interim consolidated financial statements are the same as those adopted for the consolidated financial statements of the previous fiscal year except for the policies required by IFRS 9 ‘Financial instruments’ (“IFRS 9”) and IFRS 15 ‘Revenue from Contracts with Customers’ (“IFRS 15”).
Takeda calculated income tax expenses for the nine months period ended December 31, 2018, based on the estimated average annual effective tax rate.
IFRS 9 ‘Financial instruments’
IFRS 9 was adopted by Takeda as of April 1, 2018. IFRS 9 replaces the majority of the requirements of IAS 39 ‘Financial Instruments: Recognition and Measurement’ and covers the classification, recognition, measurement, and de-recognition of financial assets and financial liabilities, introduces a new impairment model for financial assets based on expected losses rather than incurred losses and provides a new hedge accounting model.
The principal impact of the adoption of IFRS 9 for Takeda was the re-measurement of certain available-for-sale financial instruments to fair value as of April 1, 2018. In addition, as a result of adoption, Takeda elected to designate equity instruments as financial assets measured at fair value through other comprehensive income (FVTOCI). This designation has been made on the basis of the facts and circumstances that existed at the date of initial application. Changes in the fair value of financial assets at FVTOCI are recognized in other comprehensive income, and the cumulative amount of other comprehensive income is transferred to retained earnings when the instruments are derecognized due to liquidation or sale.
The classification of financial assets under IFRS 9 is generally based on the business model in which a financial asset is managed and its contractual cash flow characteristics. The determination of the business model within which a financial asset is held has been made on the basis of the facts and circumstances that existed at the date of initial application.
The impairment of financial assets measured at amortized cost is assessed using an expected credit loss (ECL) model where previously the incurred loss model was used. Given the nature of Takeda’s financial assets, there was no significant impact on the provisions for doubtful accounts or impairments upon adoption of the new standard.
The adoption of IFRS 9 has not had material impact on Takeda’s financial liabilities and derivatives.
The new hedge accounting model introduced by the standard requires hedge accounting relationships to be based upon Takeda’s own risk management objectives and strategy, and to apply a more qualitative and forward-looking approach to assessing hedge effectiveness. The model is to be discontinued only when the relationships no longer qualify for hedge accounting. All hedging relationships designated under IAS39 at March 31, 2018 met the criteria for hedge accounting under IFRS 9 at April 1, 2018 and are therefore regarded as continuing hedging relationships.
Takeda applied IFRS 9 retrospectively with respect to classification and measurement (including impairment) without restating previous years. These cumulative effects of initially applying IFRS 9 were recognized in equity as of the date of initial application of IFRS 9 (April 1, 2018). As a result of the adoption on the date of initial application, the opening balance of retained earnings and other components of equity increased by 14,073 million JPY and 10,257 million JPY, respectively, while other financial assets (non-current), other financial assets (current), deferred tax liabilities increased by 32,809 million JPY, 856 million JPY and 9,345 million JPY respectively, with non-controlling interests decreasing by 10 million JPY.
In addition, under IAS 39, the currency basis spread was included in “Cash Flow Hedges” under other components of equity. Under IFRS 9, this basis spread is separately accounted for and presented as “Hedging Cost” under other components of equity. Takeda retrospectively applied the accounting treatment of hedging cost and adjusted the comparative information. As of December 31, 2017 and March 31, 2018, the amounts retrospectively recorded as “Hedging Cost” and deducted from “Cash Flow Hedges” were 989 million JPY and 1,606 million JPY, respectively.
- 13 -
Table of Contents
Takeda Pharmaceutical Company Limited (4502)
Summary of Financial Statements for the Nine Months
Period Ended December 31, 2018 (Consolidated)
Classifications and carrying amounts of financial assets under IAS 39 and IFRS 9 as of the date of adoption were changed as presented in the table below. For investments in equity instruments, Takeda made an irrevocable election at the time of initial recognition to account for the equity instruments at FVTOCI. There were no changes to the classifications and carrying amounts of the financial liabilities.
| JPY (millions) | ||||||||||
IAS 39 | Carrying amount | IFRS 9 | Carrying | |||||||
Cash and cash equivalents | Loans and receivables | 294,522 | Financial assets measured at amortized cost | 294,522 | ||||||
Derivative assets | Financial assets measured at fair value through profit or loss | 762 | Financial assets measured at fair value through profit or loss | 762 | ||||||
Derivative assets to which hedge accounting is applied | Derivative assets to which hedge accounting is applied | 2,527 | Derivative assets to which hedge accounting is applied | 2,527 | ||||||
Trade and other receivables, other financial assets | Loans and receivables | 516,853 | Financial assets measured at amortized cost | 516,853 | ||||||
Equity instruments | Available-for-sale financial assets | 169,814 | Financial assets measured at fair value through other comprehensive income | 203,276 | ||||||
| Loans and receivables | 5,303 | |||||||||
Convertible notes | Financial assets measured at fair value through profit or loss | 2,070 | Financial assets measured at fair value through profit or loss | 7,576 | ||||||
|
|
| ||||||||
Total | 991,851 | 1,025,516 | ||||||||
|
|
| ||||||||
The following changes were made to the carrying amount of the financial assets as of the application date.
| JPY (millions) | ||||||||||||||||||
IAS 39 | Carrying amount | Change of classification | Re-measurement | IFRS 9 | Carrying amount | |||||||||||||
Loans and receivables | 816,678 | (5,303 | ) | — | Financial assets measured at amortized cost | 811,375 | ||||||||||||
Financial assets measured at fair value through profit or loss | 2,832 | 5,303 | 203 | Financial assets measured at fair value through profit or loss | 8,338 | |||||||||||||
Derivative assets to which hedge accounting is applied | 2,527 | — | — | Derivative assets to which hedge accounting is applied | 2,527 | |||||||||||||
Available-for-sale financial assets | 169,814 | — | 33,462 | Financial assets measured at fair value through other comprehensive income | 203,276 | |||||||||||||
|
|
|
|
|
|
|
| |||||||||||
Total | 991,851 | — | 33,665 | 1,025,516 | ||||||||||||||
|
|
|
|
|
|
|
| |||||||||||
Measurement of Financial Instruments
Debt Instruments:
| • | Amortized cost: Assets such as trade and other receivables that are held within a business model whose objective is to hold financial assets in order to collect contractual cash flows and whose contractual terms give rise on specified dates to cash flows that are solely payments of principal and interest on the principal amount outstanding are measured at amortized cost. Trade receivables are initially recognized at their invoiced amounts, including any related sales taxes less adjustments for estimated revenue deductions such as rebates, and cash discounts. Provisions for doubtful trade receivables are established using an ECL model. The provisions are based on a forward- looking ECL, which includes possible default events on the trade receivables over the entire holding period of the trade receivables. Takeda has elected to measure provisions for trade receivables and lease receivables at an amount equal to lifetime ECL. Takeda uses provision matrix to calculate ECL. These provisions represent the difference between the carrying amount of the trade receivables and the lease receivables in the consolidated statements of financial position and the estimated net collectible amount. |
| • | FVTOCI: Assets that are held within a business model whose objective is achieved by both collecting contractual cash flows and selling financial assets and whose contractual terms give rise on specified dates to cash flows that are solely payments of principal and interest on the principal amount outstanding are measured at FVTOCI. When the financial asset is derecognized, the cumulative gain or loss previously recognized in other comprehensive income is reclassified from equity to net profit or loss. |
| • | Fair value through net profit or loss (FVTPL): Assets that do not meet the criteria for amortized cost or FVTOCI are measured at FVTPL. A gain or loss on debt instruments that is subsequently measured at FVTPL is recognized in net profit or loss. |
- 14 -
Table of Contents
Takeda Pharmaceutical Company Limited (4502)
Summary of Financial Statements for the Nine Months
Period Ended December 31, 2018 (Consolidated)
Equity Instruments:
| • | Equity instruments are measured at FVTPL. However, on initial recognition, Takeda made an irrevocable FVTOCI election (on an instrument-by-instrument basis) to present the subsequent changes in the fair value of equity instruments in other comprehensive income. As at the reporting date, Takeda designated all its equity instruments as financial assets at FVTOCI. |
Derivatives and Hedge Accounting:
| • | Derivatives are measured at FVTPL unless the derivative contracts are designated as hedging instruments. Gains or losses on derivatives are recognized in net profit or loss. When the derivative contracts are designated as hedging instruments in cash flow hedging relationships, the effective portion of changes in fair value of derivatives is accumulated in other comprehensive income. The currency basis spread is accounted for and presented as “Hedging Cost” under other components of equity separately from “Cash Flow Hedges”. |
IFRS 15 ‘Revenue from Contracts with Customers’
Takeda adopted IFRS 15 on April 1, 2018. The new standard provides a single, principles-based approach to the recognition of revenue from all contracts with customers. The standard focuses on the identification of performance obligations in a contract and requires revenue to be recognized when or as those performance obligations are satisfied. The standard also has more detailed disclosure requirements.
The impacts of adoption of the new standard are summarized below:
| • | Takeda derives revenue from sales of pharmaceutical products as well as other services where control transfers to customers and performance obligations are satisfied either at the point in time of shipment, receipt of the products by the customer or when the services are performed. |
| • | Takeda also recognizes royalty revenue relating to the out-licensing of intellectual property (IP), which is recognized when the underlying sales have occurred, and revenue from other services such as research and development of compounds out-licensed, which is recognized over the service period. |
| • | Takeda’s revenue also includes revenue from out-licensing and granting of IP rights and Takeda usually receives upfront payments or milestone payments for these arrangements. Revenue from the upfront payments is generally recognized when Takeda provides a right to use the IP. Revenue from the milestone payment is generally recognized at the point in time when it is highly probable that the respective milestone event criteria are met, and a significant reversal in the amount of revenue |
These impacts of adoption of the new standard were immaterial. Takeda elected the modified retrospective method upon adoption of IFRS 15. This method requires the recognition of the cumulative effect of initially applying IFRS 15 in equity at the date of initial application of IFRS 15 (April 1, 2018) and Takeda did not restate the result of prior years. As a result of the adoption of IFRS 15, due to the difference in allocation of revenue to performance obligations, other non-current liabilities, other current liabilities, deferred tax assets decreased by 1,247 million JPY, 495 million JPY and 414 million JPY respectively, and opening retained earnings increased by 1,328 million JPY.
For the nine months period ended December 31, 2018, the impact from adoption of IFRS 15 on the condensed interim consolidated financial statements, compared to IAS18, was immaterial.
As the results of the adoption of IFRS 15, Takeda updated and revised the related accounting policy as follows:
Revenue on sales of Takeda products and services is recognized when a contractual promise to a customer (performance obligation) has been fulfilled by transferring control over the promised goods and services to the customer, generally at the point in time of shipment to or receipt of the products by the customer, or when the services are performed. The amount of revenue to be recognized is based on the consideration Takeda expects to receive in exchange for its goods and services. If a contract contains more than one performance obligation, the consideration is allocated based on the standalone selling price of each performance obligation.
The consideration Takeda receives in exchange for its goods or services may be fixed or variable. Variable consideration is only recognized when it is highly probable that a significant reversal will not occur. The most common elements of variable consideration are listed below:
| • | Rebates and discounts granted to government agencies, wholesalers, retail pharmacies, managed healthcare organizations and other customers are estimated and recorded as a deduction from revenue at the time the related revenues are recorded. They are calculated on the basis of historical experience and the specific terms in the individual agreements. |
| • | Cash discounts are offered to customers and are provisioned and recorded as revenue deductions at the time the related sales are recorded. |
| • | Sales return provisions are recognized and recorded as revenue deductions when there is historical experience of Takeda agreeing to customer returns and Takeda can reasonably estimate expected future returns. In doing so, the estimated rate of return is applied, determined based on historical experience of customer returns and considering any other relevant factors. The rate is multiplied by the amounts invoiced in order to estimate expected future returns. |
Takeda also generates revenue in the form of royalty payments, upfront payments, and milestone payments from theout-licensing of intellectual property (IP). Royalty revenue earned through a license is recognized when the underlying sales have occurred. Revenue from upfront payment is generally recognized when Takeda provides a right to use IP. Revenue from milestone payments is recognized at the point in time when it is highly probable that the respective milestone event criteria is met, and a significant reversal in the amount of revenue recognized will not occur. Revenue from other services such as research and development of compounds that are out-licensed is recognized over the service period.
- 15 -
Table of Contents
Takeda Pharmaceutical Company Limited (4502)
Summary of Financial Statements for the Nine Months
Period Ended December 31, 2018 (Consolidated)
(Significant Changes in Equity Attributable to Owners of the Company)
Nine months period ended December 31, 2018 (April 1 to December 31, 2018)
Not applicable.
(Business Combinations)
TiGenix NV (“TiGenix”)
On April 30, 2018, Takeda made an all cash voluntary public takeover bid for the entire issued ordinary shares (“Ordinary Shares”), warrants (“Warrants”) and American Depositary Shares (“ADSs” and together with the Ordinary Shares and the Warrants, the “Securities”) of TiGenix not already owned by Takeda. On June 8, 2018, the Company acquired the Securities tendered in the first acceptance period for 470.2 million EUR. In response to the takeover bid with the Securities already owned by Takeda, Takeda acquired 90.8% of the voting rights.
TiGenix is a biopharmaceutical company developing novel stem cell therapies for serious medical conditions. This acquisition will expand Takeda’s late stage gastroenterology (GI) pipeline with the U.S. rights to Cx601 (darvadstrocel), a suspension of allogeneic expanded adipose-derived stem cells (eASC) under investigation for the treatment of complex perianal fistulas in patients with non-active/mildly active luminal Crohn’s disease (CD). Following the 2nd Takeover bid and a squeeze-out ended in July 2018, TiGenix became a wholly owned subsidiary of Takeda.
The following represents provisional fair value of assets acquired, liabilities assumed:
| JPY (millions) | ||||
| Amount | ||||
Intangible assets | 63,421 | |||
Other assets | 5,541 | |||
Deferred tax liabilities | (8,043 | ) | ||
Other liabilities | (5,678 | ) | ||
|
| |||
Basis adjustments | (3,381 | ) | ||
|
| |||
Goodwill | 18,143 | |||
|
| |||
Total | 70,003 | |||
|
| |||
The purchase consideration was comprised of the following:
| JPY (millions) | ||||
| Amount | ||||
Cash | 67,319 | |||
The ordinary shares of TiGenix already owned by Takeda immediately prior to the acquisition date | 2,684 | |||
|
| |||
Total | 70,003 | |||
|
| |||
Goodwill comprises excess earning power expected from the future business development. Goodwill is not deductible for tax purposes.
The fair value primarily consisting of intangible assets, deferred tax liabilities and goodwill assumed as of the acquisition date have been recorded provisionally based on the information available as of December 31, 2018. These amounts are subject to change as the Company is in the process of reviewing further details of the basis for the fair value measurement. For the nine months period ended December 31, 2018, goodwill at the acquisition date decreased by 1,831 million JPY as a result of the adjustment to the provisional fair value, while other assets and deferred tax liabilities decreased by 253 million JPY and 2,084 million JPY, respectively.
Takeda entered into a forward exchange contract to hedge foreign currency risks and applied the hedge accounting to the contract. Basis adjustment represents a fair value of the hedging instrument of 3,381 million JPY that was added to the amount of goodwill at the acquisition date.
No gains or losses were recognized as a result of remeasurement of fair value of the ordinary shares of TiGenix already owned by Takeda immediately prior to the acquisition date.
Acquisition-related costs of 767 million JPY which included agent fee and due diligence costs arising from the acquisition were recorded in “Selling, general and administrative expenses”.
The revenue and the net profit of TiGenix for the post-acquisition period, which were recognized in the condensed interim consolidated statements of income for the nine months period ended December 31, 2018, were immaterial.
The impact on Takeda’s revenue and net profit of TiGenix for the nine months period ended December 31, 2018 assuming the acquisition date had been as of the beginning of the reporting period was immaterial.
- 16 -
Table of Contents
Takeda Pharmaceutical Company Limited (4502)
Summary of Financial Statements for the Nine Months
Period Ended December 31, 2018 (Consolidated)
(Significant Subsequent Events)
Acquisition of Shire plc
On January 8, 2019, Takeda acquired the entire issued ordinary shares of Shire plc (“Shire”) and acquired 100% of the voting rights.
Shire is a leading global biotechnology company focused on serving patients with rare diseases and other highly specialised conditions.
Takeda believes that the Acquisition will deliver the following benefits:
| • | Creates a global, values-based, R&D driven biopharmaceutical leader incorporated and headquartered in Japan, with an attractive geographic footprint and provides the scale to drive future development. |
| • | Strengthens Takeda’s presence across two of its three core therapeutic areas (i.e., gastroenterology (GI) and neuroscience), and provides leading positions in rare diseases and plasma-derived therapies. |
| • | Creates a highly complementary, robust, modality-diverse pipeline and a strengthened R&D engine focused on breakthrough innovation. |
| • | Delivers compelling financial benefits for the Combined Group – enhancing Takeda’s cash flow profile, with management committed to delivering substantial synergies and generating attractive returns for shareholders. |
Under the terms of the acquisition, ex-shareholders of Shire received 30.33 USD in cash and either 0.839 shares of the Company or 1.678 ADSs (American Depository Shares) of the Company per Shire share. The aggregate consideration was 6,160,712 million JPY, of which consideration in cash was 3,029,430 million JPY and consideration in shares was 3,131,282 million JPY.
Due to the timing of the acquisition, Takeda has not completed the initial accounting for the business combination at the time the summary of financial statements are issued and, accordingly, the fair value of assets acquired, liabilities assumed as well as the impact on Takeda’s revenue and net profit of Shire for the nine months period ended December 31, 2018 assuming the acquisition date had been as of the beginning of the reporting period are not disclosed.
On January 8, 2019, the Company issued 770,303,013 ordinary shares (including 200,527,229 ordinary shares deposited as underlying shares of ADSs) which were allocated to the ex-shareholders of Shire. Issue price was 4,065 JPY per share (The aggregate issue price was 3,131,282 million JPY) and capital incorporation was 2,032.50 JPY per share (The aggregate capital incorporation was 1,565,641 million JPY).
On January 11, 2019, in order to finance funds necessary for the acquisition, the Company drew down 1,715,526 million JPY by exercising the Term Loan Credit Agreement executed on June 8, 2018, Short Term Loan Facility Agreement executed on October 26, 2018, and Loan Agreement with the Japan Bank for International Cooperation executed on December 3, 2018.
Disposal of a Part of the Real Estate Businesses of Takeda through Company Splits and Share Transfers
The Company has decided to newly establish a wholly owned company (“Subject Company”) of Takeda Pharmaceutical Real Estate Co., Ltd. (“TPRE”), a wholly owned company of the Company; to have the Subject Company succeed a part of the respective real estate businesses of the Company and TPRE through company splits as of March 11, 2019; and to transfer all of the issued shares in the Subject Company respectively held by Takeda and TPRE, which will be allocated as considerations of the company splits, to transferee as of March 22, 2019. On January 28, 2019, Takeda entered into an agreement on the share transfer.
After the transaction, the transferee will hold 21 properties, including the Takeda Osaka Headquarters (Takeda Mido-suji building). Takeda will record a gain on sale of shares arising as a result of the transfer of about 38 billion yen (before taxes) for the year ended March 31, 2019. Business activities of the Company at the Osaka Headquarters (Takeda Mido-suji building) and other places will continue after the completion of the transaction.
- 17 -
Table of Contents
Takeda Pharmaceutical Company Limited (4502)
Summary of Financial Statements for the Nine Months
Period Ended December 31, 2018 (Consolidated)
Important Notice
For the purposes of this notice, “document” means this document, any oral presentation, any question and answer session and any written or oral material discussed or distributed by Takeda Pharmaceutical Company Limited (“Takeda”) regarding this document. This document (including any oral briefing and anyquestion-and-answer in connection with it) is not intended to, and does not constitute, represent or form part of any offer, invitation or solicitation of any offer to purchase, otherwise acquire, subscribe for, exchange, sell or otherwise dispose of, any securities or the solicitation of any vote or approval in any jurisdiction. No shares or other securities are being offered to the public by means of this document. No offering of securities shall be made in the United States except pursuant to registration under the U.S. Securities Act of 1933, as amended, or an exemption therefrom. This document is being given (together with any further information which may be provided to the recipient) on the condition that it is for use by the recipient for information purposes only (and not for the evaluation of any investment, acquisition, disposal or any other transaction). Any failure to comply with these restrictions may constitute a violation of applicable securities laws.
Unless specified otherwise, no statement in this document (including any statement of estimated synergies) is intended as a profit forecast or estimate for any period and no statement in this document should be interpreted to mean that earnings or earnings per share for Takeda for the current or future financial years would necessarily match or exceed the historical published earnings per share for Takeda.
The companies in which Takeda directly and indirectly owns investments are separate entities. In this document, “Takeda” is sometimes used for convenience where references are made to Takeda and its subsidiaries in general. Likewise, the words “we”, “us” and “our” are also used to refer to subsidiaries in general or to those who work for them. These expressions are also used where no useful purpose is served by identifying the particular company or companies.
Forward-Looking Statements
This document and any materials distributed in connection with this document may contain forward-looking statements, beliefs or opinions regarding Takeda’s future business, future position and results of operations, including estimates, forecasts, targets and plans for Takeda. Without limitation, forward looking statements often include the words such as “targets”, “plans”, “believes”, “hopes”, “continues”, “expects”, “aims”, “intends”, “will”, “may”, “should”, “would”, “could” “anticipates”, “estimates”, “projects” or words or terms of similar substance or the negative thereof. Anyforward-looking statements in this document are based on the current assumptions and beliefs of Takeda in light of the information currently available to it. Such forward-looking statements do not represent any guarantee by Takeda or its management of future performance and involve known and unknown risks, uncertainties and other factors, including but not limited to: the economic circumstances surrounding Takeda’s business, including general economic conditions in Japan, the United States and worldwide; competitive pressures and developments; applicable laws and regulations; the success of or failure of product development programs; decisions of regulatory authorities and the timing thereof; changes in exchange rates; claims or concerns regarding the safety or efficacy of marketed products or products candidates; and post-merger integration with acquired companies, any of which may cause Takeda’s actual results, performance, achievements or financial position to be materially different from any future results, performance, achievements or financial position expressed or implied by suchforward-looking statements. For more information on these and other factors which may affect Takeda’s results, performance, achievements, or financial position, see “Item 3. Key Information – D. Risk Factors” in Takeda’s Registration Statement on Form20-F filed with the U.S. Securities and Exchange Commission, available on Takeda’s website at:https://www.takeda.com/investors/reports/sec-filings/ or atwww.sec.gov. Neither Takeda nor its management gives any assurances that the expectations expressed in these forward-looking statements will turn out to be correct, and actual results, performance or achievements could materially differ from expectations. Persons receiving this document should not place undue reliance on forward looking statements. Takeda undertakes no obligation to update any of the forward-looking statements contained in this document or any other forward-looking statements it may make. Past performance is not an indicator of future results and the results of Takeda in this document may not be indicative of, and are not an estimate, forecast or projection of Takeda’s future results.
Table of Contents
Takeda Pharmaceutical Company Limited (4502)
Summary of Financial Statements for the Nine Months
Period Ended December 31, 2018 (Consolidated)
CertainNon-IFRS Financial Measures
This document includes certain IFRS financial measures not presented in accordance with International Financial Reporting Standards (“IFRS”), including Underlying Revenue, Core Earnings, Underlying Core Earnings, Core Net Profit, Underlying Core Net Profit, Underlying Core EPS, Net Debt, EBITDA, Adjusted EBITDA and Operating Free Cash Flow. Takeda’s management evaluates results and makes operating and investment decisions using both IFRS andnon-IFRS measures included in this document. Thesenon-IFRS measures exclude certain income, cost and cash flow items which are included in, or are calculated differently from, the most closely comparable measures presented in accordance with IFRS. By including these non-IFRS measures, management intends to provide investors with additional information to further analyze Takeda’s performance, core results and underlying trends. Takeda’snon-IFRS measures are not prepared in accordance with IFRS and such non-IFRS measures should be considered a supplement to, and not a substitute for, measures prepared in accordance with IFRS (which we sometimes refer to as “reported” measures). Investors are encouraged to review the reconciliation ofnon-IFRS financial measures to their most directly comparable IFRS measures.
Further information on certain of Takeda’sNon-IFRS measures is posted on Takeda’s investor relations website at
https://www.takeda.com/investors/reports/quarterly-announcements/quarterly-announcements-2018/
Medical information
This document contains information about products that may not be available in all countries, or may be available under different trademarks, for different indications, in different dosages, or in different strengths. Nothing contained herein should be considered a solicitation, promotion or advertisement for any prescription drugs including the ones under development.
Table of Contents
Consolidated financial results for FY2018 Q3
February 1, 2019
Costa Saroukos
Chief Financial Officer
Better Health, Brighter Future
Table of Contents
Important Notice For the purposes of this notice, “presentation” means this document, any oral presentation, any question and answer session and any written or oral material discussed or distributed by Takeda Pharmaceutical Company Limited (“Takeda”) during the presentation. This presentation (including any oral briefing and any question-and-answer in connection with it) is not intended to, and does not constitute, represent or form part of any offer, invitation or solicitation of any offer to purchase, otherwise acquire, subscribe for, exchange, sell or otherwise dispose of, any securities or the solicitation of any vote or approval in any jurisdiction. No shares or other securities are being offered to the public by means of this presentation. No offering of securities shall be made in the United States except pursuant to registration under the U.S. Securities Act of 1933, as amended, or an exemption therefrom. This presentation is being given (together with any further information which may be provided to the recipient) on the condition that it is for use by the recipient for information purposes only (and not for the evaluation of any investment, acquisition, disposal or any other transaction). Any failure to comply with these restrictions may constitute a violation of applicable securities laws. Unless specified otherwise, no statement in this presentation (including any statement of estimated synergies) is intended as a profit forecast or estimate for any period and no statement in this presentation should be interpreted to mean that earnings or earnings per share for Takeda for the current or future financial years would necessarily match or exceed the historical published earnings per share for Takeda. The companies in which Takeda directly and indirectly owns investments are separate entities. In this presentation, “Takeda” is sometimes used for convenience where references are made to Takeda and its subsidiaries in general. Likewise, the words “we”, “us” and “our” are also used to refer to subsidiaries in general or to those who work for them. These expressions are also used where no useful purpose is served by identifying the particular company or companies. Forward-Looking Statements This presentation and any materials distributed in connection with this presentation may contain forward-looking statements, beliefs or opinions regarding Takeda’s future business, future position and results of operations, including estimates, forecasts, targets and plans for Takeda. Without limitation, forward looking statements often include the words such as “targets”, “plans”, “believes”, “hopes”, “continues”, “expects”, “aims”, “intends”, “will”, “may”, “should”, “would”, “could” “anticipates”, “estimates”, “projects” or words or terms of similar substance or the negative thereof. Any forward-looking statements in this document are based on the current assumptions and beliefs of Takeda in light of the information currently available to it. Such forward-looking statements do not represent any guarantee by Takeda or its management of future performance and involve known and unknown risks, uncertainties and other factors, including but not limited to: the economic circumstances surrounding Takeda’s business, including general economic conditions in Japan, the United States and worldwide; competitive pressures and developments; applicable laws and regulations; the success of or failure of product development programs; decisions of regulatory authorities and the timing thereof; changes in exchange rates; claims or concerns regarding the safety or efficacy of marketed products or products candidates; and post-merger integration with acquired companies, any of which may cause Takeda’s actual results, performance, achievements or financial position to be materially different from any future results, performance, achievements or financial position expressed or implied by such forward-looking statements. For more information on these and other factors which may affect Takeda’s results, performance, achievements, or financial position, see “Item 3. Key Information—D. Risk Factors” in Takeda’s Registration Statement on Form 20-F filed with the U.S. Securities and Exchange Commission, available on Takeda’s website at: https://www.takeda.com/investors/reports/sec-filings/ or at www.sec.gov. Neither Takeda nor its management gives any assurances that the expectations expressed in these forward-looking statements will turn out to be correct, and actual results, performance or achievements could materially differ from expectations. Persons receiving this presentation should not place undue reliance on forward looking statements. Takeda undertakes no obligation to update any of the forward-looking statements contained in this presentation or any other forward-looking statements it may make. Past performance is not an indicator of future results and the results of Takeda in this presentation may not be indicative of, and are not an estimate, forecast or projection of Takeda’s future results. 1 Important Notice For the purposes of this notice, “presentation” means this document, any oral presentation, any question and answer session and any written or oral material discussed or distributed by Takeda Pharmaceutical Company Limited (“Takeda”) during the presentation. This presentation (including any oral briefing and any question-and-answer in connection with it) is not intended to, and does not constitute, represent or form part of any offer, invitation or solicitation of any offer to purchase, otherwise acquire, subscribe for, exchange, sell or otherwise dispose of, any securities or the solicitation of any vote or approval in any jurisdiction. No shares or other securities are being offered to the public by means of this presentation. No offering of securities shall be made in the United States except pursuant to registration under the U.S. Securities Act of 1933, as amended, or an exemption therefrom. This presentation is being given (together with any further information which may be provided to the recipient) on the condition that it is for use by the recipient for information purposes only (and not for the evaluation of any investment, acquisition, disposal or any other transaction). Any failure to comply with these restrictions may constitute a violation of applicable securities laws. Unless specified otherwise, no statement in this presentation (including any statement of estimated synergies) is intended as a profit forecast or estimate for any period and no statement in this presentation should be interpreted to mean that earnings or earnings per share for Takeda for the current or future financial years would necessarily match or exceed the historical published earnings per share for Takeda. The companies in which Takeda directly and indirectly owns investments are separate entities. In this presentation, “Takeda” is sometimes used for convenience where references are made to Takeda and its subsidiaries in general. Likewise, the words “we”, “us” and “our” are also used to refer to subsidiaries in general or to those who work for them. These expressions are also used where no useful purpose is served by identifying the particular company or companies. Forward-Looking Statements This presentation and any materials distributed in connection with this presentation may contain forward-looking statements, beliefs or opinions regarding Takeda’s future business, future position and results of operations, including estimates, forecasts, targets and plans for Takeda. Without limitation, forward looking statements often include the words such as “targets”, “plans”, “believes”, “hopes”, “continues”, “expects”, “aims”, “intends”, “will”, “may”, “should”, “would”, “could” “anticipates”, “estimates”, “projects” or words or terms of similar substance or the negative thereof. Any forward-looking statements in this document are based on the current assumptions and beliefs of Takeda in light of the information currently available to it. Such forward-looking statements do not represent any guarantee by Takeda or its management of future performance and involve known and unknown risks, uncertainties and other factors, including but not limited to: the economic circumstances surrounding Takeda’s business, including general economic conditions in Japan, the United States and worldwide; competitive pressures and developments; applicable laws and regulations; the success of or failure of product development programs; decisions of regulatory authorities and the timing thereof; changes in exchange rates; claims or concerns regarding the safety or efficacy of marketed products or products candidates; and post-merger integration with acquired companies, any of which may cause Takeda’s actual results, performance, achievements or financial position to be materially different from any future results, performance, achievements or financial position expressed or implied by such forward-looking statements. For more information on these and other factors which may affect Takeda’s results, performance, achievements, or financial position, see “Item 3. Key Information—D. Risk Factors” in Takeda’s Registration Statement on Form 20-F filed with the U.S. Securities and Exchange Commission, available on Takeda’s website at: https://www.takeda.com/investors/reports/sec-filings/ or at www.sec.gov. Neither Takeda nor its management gives any assurances that the expectations expressed in these forward-looking statements will turn out to be correct, and actual results, performance or achievements could materially differ from expectations. Persons receiving this presentation should not place undue reliance on forward looking statements. Takeda undertakes no obligation to update any of the forward-looking statements contained in this presentation or any other forward-looking statements it may make. Past performance is not an indicator of future results and the results of Takeda in this presentation may not be indicative of, and are not an estimate, forecast or projection of Takeda’s future results. 1
Table of Contents
Important Notice While Takeda plans to announce an earnings forecast which includes an estimated financial impact of the Shire acquisition once a reasonable financial estimate is determined, the consideration of the asset valuation as well as purchase price allocation, schedule and manner of amortization and depreciation for the business combination accounting will require more time. It is also difficult to estimate the effect on profit and loss since the completion of the acquisition to the end of the consolidated accounting period, nor the acquisition related costs for the full fiscal year with a reasonable level of accuracy at this time. Considering the sizable effect on the business results due to the acquisition, Takeda is not furnishing a new consolidated forecast in a provisional or partial way at this time. It is our objective to disclose a Shire acquisition post-close consolidated business forecast for the fiscal year once a holistic and reasonable earnings forecast can be determined. Certain Non-IFRS Financial Measures This presentation includes certain IFRS financial measures not presented in accordance with International Financial Reporting Standards (“IFRS”), including Underlying Revenue, Core Earnings, Underlying Core Earnings, Core Net Profit, Underlying Core Net Profit, Underlying Core EPS, Net Debt, EBITDA, Adjusted EBITDA and Operating Free Cash Flow. Takeda’s management evaluates results and makes operating and investment decisions using both IFRS and non-IFRS measures included in this presentation. These non-IFRS measures exclude certain income, cost and cash flow items which are included in, or are calculated differently from, the most closely comparable measures presented in accordance with IFRS. By including these non-IFRS measures, management intends to provide investors with additional information to further analyze Takeda’s performance, core results and underlying trends. Takeda’s non-IFRS measures are not prepared in accordance with IFRS and such non-IFRS measures should be considered a supplement to, and not a substitute for, measures prepared in accordance with IFRS (which we sometimes refer to as “reported” measures). Investors are encouraged to review the reconciliation of non-IFRS financial measures to their most directly comparable IFRS measures. Reconciliations of the following non-IFRS measures to the respective most closely comparable measures presented in accordance with IFRS can be found as follows: • Underlying Revenue to Revenue on page 29 of this presentation; • Core Earnings and Underlying Core Earnings to Operating Profit on page 30 of this presentation; • Core Net Profit, Underlying Core Net Profit, and Underlying Core EPS to Net Profit and EPS on page 31 of this presentation; • EBITDA and Adjusted EBITDA to Net Profit on page 25 of this presentation • Operating Free Cash Flow to Net Cash from Operating Activities and Net Profit on page 13 of this presentation; and • Net Debt to Gross Debt (which is the sum of the current and non-current portions of Bonds and Loans) on page 34 of this presentation. Further information on certain of Takeda’s Non-IFRS measures is posted on Takeda’s investor relations website at https://www.takeda.com/investors/reports/quarterly-announcements/quarterly- announcements-2018/ Medical information This presentation contains information about products that may not be available in all countries, or may be available under different trademarks, for different indications, in different dosages, or in different strengths. Nothing contained herein should be considered a solicitation, promotion or advertisement for any prescription drugs including the ones under development. 2 Important Notice While Takeda plans to announce an earnings forecast which includes an estimated financial impact of the Shire acquisition once a reasonable financial estimate is determined, the consideration of the asset valuation as well as purchase price allocation, schedule and manner of amortization and depreciation for the business combination accounting will require more time. It is also difficult to estimate the effect on profit and loss since the completion of the acquisition to the end of the consolidated accounting period, nor the acquisition related costs for the full fiscal year with a reasonable level of accuracy at this time. Considering the sizable effect on the business results due to the acquisition, Takeda is not furnishing a new consolidated forecast in a provisional or partial way at this time. It is our objective to disclose a Shire acquisition post-close consolidated business forecast for the fiscal year once a holistic and reasonable earnings forecast can be determined. Certain Non-IFRS Financial Measures This presentation includes certain IFRS financial measures not presented in accordance with International Financial Reporting Standards (“IFRS”), including Underlying Revenue, Core Earnings, Underlying Core Earnings, Core Net Profit, Underlying Core Net Profit, Underlying Core EPS, Net Debt, EBITDA, Adjusted EBITDA and Operating Free Cash Flow. Takeda’s management evaluates results and makes operating and investment decisions using both IFRS and non-IFRS measures included in this presentation. These non-IFRS measures exclude certain income, cost and cash flow items which are included in, or are calculated differently from, the most closely comparable measures presented in accordance with IFRS. By including these non-IFRS measures, management intends to provide investors with additional information to further analyze Takeda’s performance, core results and underlying trends. Takeda’s non-IFRS measures are not prepared in accordance with IFRS and such non-IFRS measures should be considered a supplement to, and not a substitute for, measures prepared in accordance with IFRS (which we sometimes refer to as “reported” measures). Investors are encouraged to review the reconciliation of non-IFRS financial measures to their most directly comparable IFRS measures. Reconciliations of the following non-IFRS measures to the respective most closely comparable measures presented in accordance with IFRS can be found as follows: • Underlying Revenue to Revenue on page 29 of this presentation; • Core Earnings and Underlying Core Earnings to Operating Profit on page 30 of this presentation; • Core Net Profit, Underlying Core Net Profit, and Underlying Core EPS to Net Profit and EPS on page 31 of this presentation; • EBITDA and Adjusted EBITDA to Net Profit on page 25 of this presentation • Operating Free Cash Flow to Net Cash from Operating Activities and Net Profit on page 13 of this presentation; and • Net Debt to Gross Debt (which is the sum of the current and non-current portions of Bonds and Loans) on page 34 of this presentation. Further information on certain of Takeda’s Non-IFRS measures is posted on Takeda’s investor relations website at https://www.takeda.com/investors/reports/quarterly-announcements/quarterly- announcements-2018/ Medical information This presentation contains information about products that may not be available in all countries, or may be available under different trademarks, for different indications, in different dosages, or in different strengths. Nothing contained herein should be considered a solicitation, promotion or advertisement for any prescription drugs including the ones under development. 2
Table of Contents
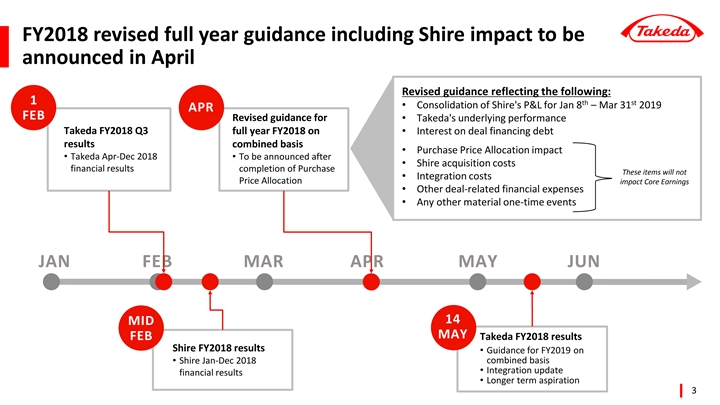
FY2018 revised full year guidance including Shire impact to be announced in April Revised guidance reflecting the following: 1 th st • Consolidation of Shire's P&L for Jan 8 – Mar 31 2019 APR FEB Revised guidance for • Takeda's underlying performance Takeda FY2018 Q3 full year FY2018 on • Interest on deal financing debt results combined basis • Purchase Price Allocation impact • Takeda Apr-Dec 2018 • To be announced after • Shire acquisition costs financial results completion of Purchase These items will not • Integration costs Price Allocation impact Core Earnings • Other deal-related financial expenses • Any other material one-time events JAN FEB MAR APR MAY JUN 14 MID MAY FEB Takeda FY2018 results Shire FY2018 results • Guidance for FY2019 on combined basis • Shire Jan-Dec 2018 • Integration update financial results • Longer term aspiration 3 FY2018 revised full year guidance including Shire impact to be announced in April Revised guidance reflecting the following: 1 th st • Consolidation of Shire's P&L for Jan 8 – Mar 31 2019 APR FEB Revised guidance for • Takeda's underlying performance Takeda FY2018 Q3 full year FY2018 on • Interest on deal financing debt results combined basis • Purchase Price Allocation impact • Takeda Apr-Dec 2018 • To be announced after • Shire acquisition costs financial results completion of Purchase These items will not • Integration costs Price Allocation impact Core Earnings • Other deal-related financial expenses • Any other material one-time events JAN FEB MAR APR MAY JUN 14 MID MAY FEB Takeda FY2018 results Shire FY2018 results • Guidance for FY2019 on combined basis • Shire Jan-Dec 2018 • Integration update financial results • Longer term aspiration 3
Table of Contents

Strategic Focus & Superior Execution driving robust Q3 YTD performance • Continued to deliver against our key strategic priorities to: Grow Strengthen Boost Portfolio Pipeline Profitability • Strong underlying growth YTD driven by business momentum and strict OPEX discipline Revenue +4.8%; Core Earnings +32.3%; Core EPS +34.2% Underlying Core Earnings margin expansion +530bps • Reported results YTD impacted by divestitures and Shire related costs Revenue +0.8%; Operating Profit -11.7%; EPS -32.0% Operating Profit excl. FY17 Wako & Teva JV gains and FY18 Shire related costs +55.5% YTD: Year-to-date 4 Strategic Focus & Superior Execution driving robust Q3 YTD performance • Continued to deliver against our key strategic priorities to: Grow Strengthen Boost Portfolio Pipeline Profitability • Strong underlying growth YTD driven by business momentum and strict OPEX discipline Revenue +4.8%; Core Earnings +32.3%; Core EPS +34.2% Underlying Core Earnings margin expansion +530bps • Reported results YTD impacted by divestitures and Shire related costs Revenue +0.8%; Operating Profit -11.7%; EPS -32.0% Operating Profit excl. FY17 Wako & Teva JV gains and FY18 Shire related costs +55.5% YTD: Year-to-date 4
Table of Contents
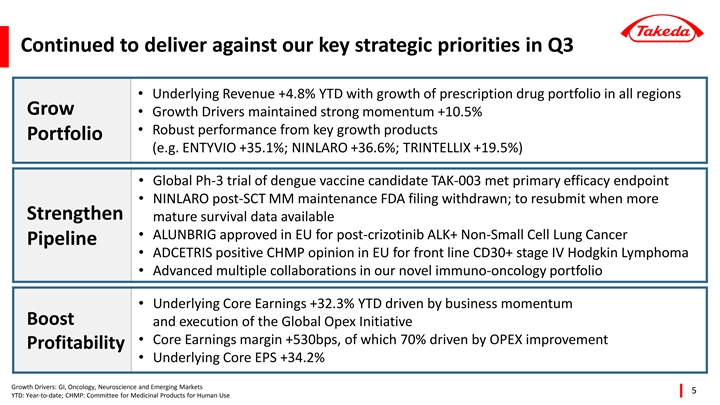
Continued to deliver against our key strategic priorities in Q3 • Underlying Revenue +4.8% YTD with growth of prescription drug portfolio in all regions Grow • Growth Drivers maintained strong momentum +10.5% • Robust performance from key growth products Portfolio (e.g. ENTYVIO +35.1%; NINLARO +36.6%; TRINTELLIX +19.5%) • Global Ph-3 trial of dengue vaccine candidate TAK-003 met primary efficacy endpoint • NINLARO post-SCT MM maintenance FDA filing withdrawn; to resubmit when more Strengthen mature survival data available • ALUNBRIG approved in EU for post-crizotinib ALK+ Non-Small Cell Lung Cancer Pipeline • ADCETRIS positive CHMP opinion in EU for front line CD30+ stage IV Hodgkin Lymphoma • Advanced multiple collaborations in our novel immuno-oncology portfolio • Underlying Core Earnings +32.3% YTD driven by business momentum Boost and execution of the Global Opex Initiative • Core Earnings margin +530bps, of which 70% driven by OPEX improvement Profitability • Underlying Core EPS +34.2% Growth Drivers: GI, Oncology, Neuroscience and Emerging Markets 5 YTD: Year-to-date; CHMP: Committee for Medicinal Products for Human Use Continued to deliver against our key strategic priorities in Q3 • Underlying Revenue +4.8% YTD with growth of prescription drug portfolio in all regions Grow • Growth Drivers maintained strong momentum +10.5% • Robust performance from key growth products Portfolio (e.g. ENTYVIO +35.1%; NINLARO +36.6%; TRINTELLIX +19.5%) • Global Ph-3 trial of dengue vaccine candidate TAK-003 met primary efficacy endpoint • NINLARO post-SCT MM maintenance FDA filing withdrawn; to resubmit when more Strengthen mature survival data available • ALUNBRIG approved in EU for post-crizotinib ALK+ Non-Small Cell Lung Cancer Pipeline • ADCETRIS positive CHMP opinion in EU for front line CD30+ stage IV Hodgkin Lymphoma • Advanced multiple collaborations in our novel immuno-oncology portfolio • Underlying Core Earnings +32.3% YTD driven by business momentum Boost and execution of the Global Opex Initiative • Core Earnings margin +530bps, of which 70% driven by OPEX improvement Profitability • Underlying Core EPS +34.2% Growth Drivers: GI, Oncology, Neuroscience and Emerging Markets 5 YTD: Year-to-date; CHMP: Committee for Medicinal Products for Human Use
Table of Contents
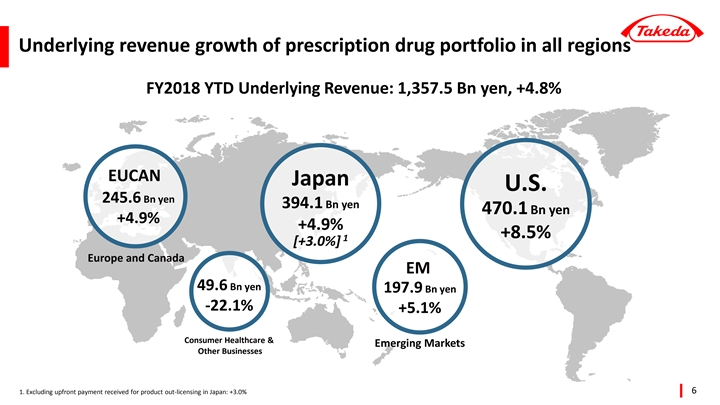
Underlying revenue growth of prescription drug portfolio in all regions FY2018 YTD Underlying Revenue: 1,357.5 Bn yen, +4.8% EUCAN Japan U.S. 245.6 Bn yen 394.1 Bn yen 470.1 Bn yen +4.9% +4.9% +8.5% 1 [+3.0%] Europe and Canada EM 49.6 Bn yen 197.9 Bn yen -22.1% +5.1% Consumer Healthcare & Emerging Markets Other Businesses 1. Excluding upfront payment received for product out-licensing in Japan: +3.0% 6 Underlying revenue growth of prescription drug portfolio in all regions FY2018 YTD Underlying Revenue: 1,357.5 Bn yen, +4.8% EUCAN Japan U.S. 245.6 Bn yen 394.1 Bn yen 470.1 Bn yen +4.9% +4.9% +8.5% 1 [+3.0%] Europe and Canada EM 49.6 Bn yen 197.9 Bn yen -22.1% +5.1% Consumer Healthcare & Emerging Markets Other Businesses 1. Excluding upfront payment received for product out-licensing in Japan: +3.0% 6
Table of Contents
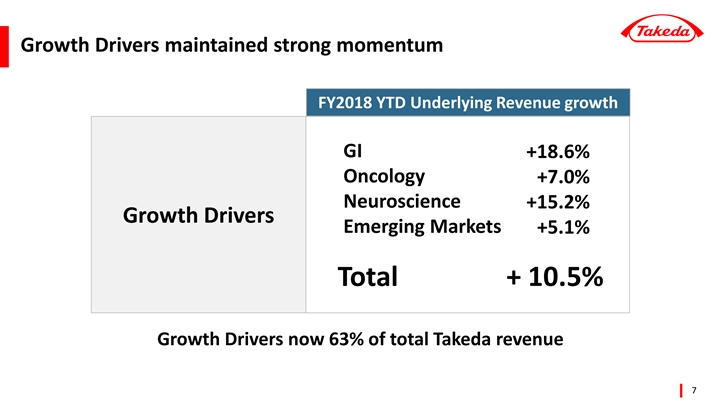
Growth Drivers maintained strong momentum FY2018 YTD Underlying Revenue growth GI +18.6% Oncology +7.0% Neuroscience +15.2% Growth Drivers Emerging Markets +5.1% Total + 10.5% Growth Drivers now 63% of total Takeda revenue 7 Growth Drivers maintained strong momentum FY2018 YTD Underlying Revenue growth GI +18.6% Oncology +7.0% Neuroscience +15.2% Growth Drivers Emerging Markets +5.1% Total + 10.5% Growth Drivers now 63% of total Takeda revenue 7
Table of Contents
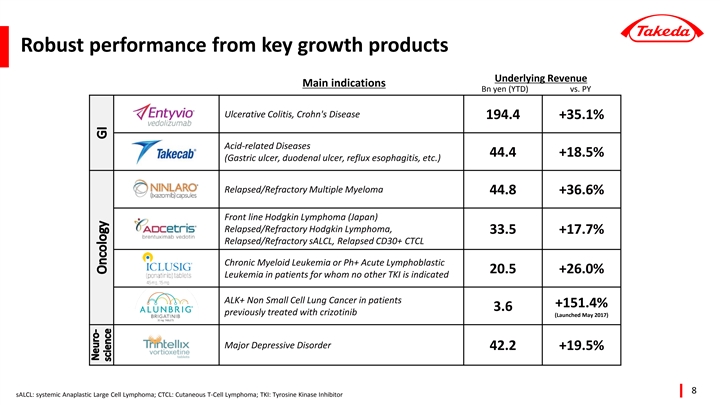
Robust performance from key growth products Underlying Revenue Main indications Bn yen (YTD) vs. PY Ulcerative Colitis, Crohn's Disease 194.4 +35.1% Acid-related Diseases 44.4 +18.5% (Gastric ulcer, duodenal ulcer, reflux esophagitis, etc.) Relapsed/Refractory Multiple Myeloma 44.8 +36.6% Front line Hodgkin Lymphoma (Japan) Relapsed/Refractory Hodgkin Lymphoma, 33.5 +17.7% Relapsed/Refractory sALCL, Relapsed CD30+ CTCL Chronic Myeloid Leukemia or Ph+ Acute Lymphoblastic 20.5 +26.0% Leukemia in patients for whom no other TKI is indicated ALK+ Non Small Cell Lung Cancer in patients +151.4% 3.6 previously treated with crizotinib (Launched May 2017) Major Depressive Disorder 42.2 +19.5% 8 sALCL: systemic Anaplastic Large Cell Lymphoma; CTCL: Cutaneous T-Cell Lymphoma; TKI: Tyrosine Kinase Inhibitor Robust performance from key growth products Underlying Revenue Main indications Bn yen (YTD) vs. PY Ulcerative Colitis, Crohn's Disease 194.4 +35.1% Acid-related Diseases 44.4 +18.5% (Gastric ulcer, duodenal ulcer, reflux esophagitis, etc.) Relapsed/Refractory Multiple Myeloma 44.8 +36.6% Front line Hodgkin Lymphoma (Japan) Relapsed/Refractory Hodgkin Lymphoma, 33.5 +17.7% Relapsed/Refractory sALCL, Relapsed CD30+ CTCL Chronic Myeloid Leukemia or Ph+ Acute Lymphoblastic 20.5 +26.0% Leukemia in patients for whom no other TKI is indicated ALK+ Non Small Cell Lung Cancer in patients +151.4% 3.6 previously treated with crizotinib (Launched May 2017) Major Depressive Disorder 42.2 +19.5% 8 sALCL: systemic Anaplastic Large Cell Lymphoma; CTCL: Cutaneous T-Cell Lymphoma; TKI: Tyrosine Kinase Inhibitor
Table of Contents
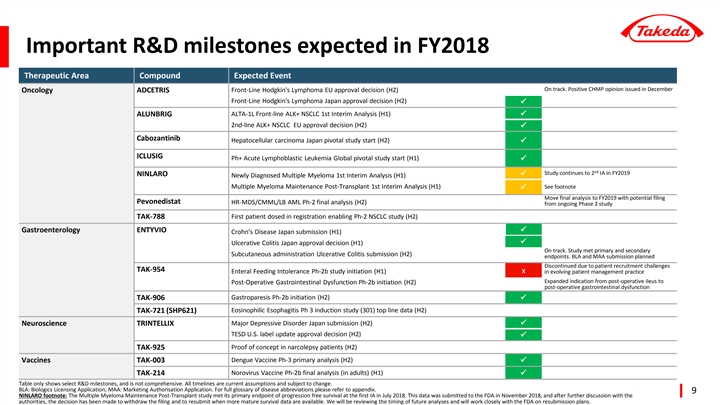
Important R&D milestones expected in FY2018 Therapeutic Area Compound Expected Event On track. Positive CHMP opinion issued in December Front-Line Hodgkin's Lymphoma EU approval decision (H2) Oncology ADCETRIS Front-Line Hodgkin's Lymphoma Japan approval decision (H2) ü ALTA-1L Front-line ALK+ NSCLC 1st Interim Analysis (H1) ALUNBRIG ü 2nd-line ALK+ NSCLC EU approval decision (H2) ü Cabozantinib Hepatocellular carcinoma Japan pivotal study start (H2) ü ICLUSIG Ph+ Acute Lymphoblastic Leukemia Global pivotal study start (H1) ü nd Study continues to 2 IA in FY2019 NINLARO ü Newly Diagnosed Multiple Myeloma 1st Interim Analysis (H1) Multiple Myeloma Maintenance Post-Transplant 1st Interim Analysis (H1) See footnote ü Move final analysis to FY2019 with potential filing Pevonedistat HR-MDS/CMML/LB AML Ph-2 final analysis (H2) from ongoing Phase 2 study TAK-788 First patient dosed in registration enabling Ph-2 NSCLC study (H2) Gastroenterology ENTYVIO ü Crohn’s Disease Japan submission (H1) ü Ulcerative Colitis Japan approval decision (H1) On track. Study met primary and secondary Subcutaneous administration Ulcerative Colitis submission (H2) endpoints. BLA and MAA submission planned Discontinued due to patient recruitment challenges TAK-954 x Enteral Feeding Intolerance Ph-2b study initiation (H1) in evolving patient management practice Expanded indication from post-operative ileus to Post-Operative Gastrointestinal Dysfunction Ph-2b initiation (H2) post-operative gastrointestinal dysfunction TAK-906 Gastroparesis Ph-2b initiation (H2) ü Eosinophilic Esophagitis Ph 3 induction study (301) top line data (H2) TAK-721 (SHP621) Major Depressive Disorder Japan submission (H2) Neuroscience TRINTELLIX ü TESD U.S. label update approval decision (H2) ü Proof of concept in narcolepsy patients (H2) TAK-925 ü Dengue Vaccine Ph-3 primary analysis (H2) Vaccines TAK-003 ü Norovirus Vaccine Ph-2b final analysis (in adults) (H1) TAK-214 ü Table only shows select R&D milestones, and is not comprehensive. All timelines are current assumptions and subject to change. BLA: Biologics Licensing Application; MAA: Marketing Authorisation Application. For full glossary of disease abbreviations please refer to appendix. 9 NINLARO footnote: The Multiple Myeloma Maintenance Post-Transplant study met its primary endpoint of progression free survival at the first IA in July 2018. This data was submitted to the FDA in November 2018, and after further discussion with the authorities, the decision has been made to withdraw the filing and to resubmit when more mature survival data are available. We will be reviewing the timing of future analyses and will work closely with the FDA on resubmission plans. Important R&D milestones expected in FY2018 Therapeutic Area Compound Expected Event On track. Positive CHMP opinion issued in December Front-Line Hodgkin's Lymphoma EU approval decision (H2) Oncology ADCETRIS Front-Line Hodgkin's Lymphoma Japan approval decision (H2) ü ALTA-1L Front-line ALK+ NSCLC 1st Interim Analysis (H1) ALUNBRIG ü 2nd-line ALK+ NSCLC EU approval decision (H2) ü Cabozantinib Hepatocellular carcinoma Japan pivotal study start (H2) ü ICLUSIG Ph+ Acute Lymphoblastic Leukemia Global pivotal study start (H1) ü nd Study continues to 2 IA in FY2019 NINLARO ü Newly Diagnosed Multiple Myeloma 1st Interim Analysis (H1) Multiple Myeloma Maintenance Post-Transplant 1st Interim Analysis (H1) See footnote ü Move final analysis to FY2019 with potential filing Pevonedistat HR-MDS/CMML/LB AML Ph-2 final analysis (H2) from ongoing Phase 2 study TAK-788 First patient dosed in registration enabling Ph-2 NSCLC study (H2) Gastroenterology ENTYVIO ü Crohn’s Disease Japan submission (H1) ü Ulcerative Colitis Japan approval decision (H1) On track. Study met primary and secondary Subcutaneous administration Ulcerative Colitis submission (H2) endpoints. BLA and MAA submission planned Discontinued due to patient recruitment challenges TAK-954 x Enteral Feeding Intolerance Ph-2b study initiation (H1) in evolving patient management practice Expanded indication from post-operative ileus to Post-Operative Gastrointestinal Dysfunction Ph-2b initiation (H2) post-operative gastrointestinal dysfunction TAK-906 Gastroparesis Ph-2b initiation (H2) ü Eosinophilic Esophagitis Ph 3 induction study (301) top line data (H2) TAK-721 (SHP621) Major Depressive Disorder Japan submission (H2) Neuroscience TRINTELLIX ü TESD U.S. label update approval decision (H2) ü Proof of concept in narcolepsy patients (H2) TAK-925 ü Dengue Vaccine Ph-3 primary analysis (H2) Vaccines TAK-003 ü Norovirus Vaccine Ph-2b final analysis (in adults) (H1) TAK-214 ü Table only shows select R&D milestones, and is not comprehensive. All timelines are current assumptions and subject to change. BLA: Biologics Licensing Application; MAA: Marketing Authorisation Application. For full glossary of disease abbreviations please refer to appendix. 9 NINLARO footnote: The Multiple Myeloma Maintenance Post-Transplant study met its primary endpoint of progression free survival at the first IA in July 2018. This data was submitted to the FDA in November 2018, and after further discussion with the authorities, the decision has been made to withdraw the filing and to resubmit when more mature survival data are available. We will be reviewing the timing of future analyses and will work closely with the FDA on resubmission plans.
Table of Contents
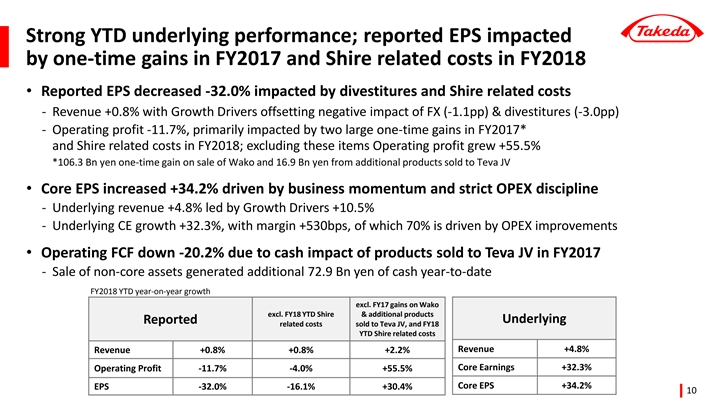
Strong YTD underlying performance; reported EPS impacted by one-time gains in FY2017 and Shire related costs in FY2018 • Reported EPS decreased -32.0% impacted by divestitures and Shire related costs - Revenue +0.8% with Growth Drivers offsetting negative impact of FX (-1.1pp) & divestitures (-3.0pp) - Operating profit -11.7%, primarily impacted by two large one-time gains in FY2017* and Shire related costs in FY2018; excluding these items Operating profit grew +55.5% *106.3 Bn yen one-time gain on sale of Wako and 16.9 Bn yen from additional products sold to Teva JV • Core EPS increased +34.2% driven by business momentum and strict OPEX discipline - Underlying revenue +4.8% led by Growth Drivers +10.5% - Underlying CE growth +32.3%, with margin +530bps, of which 70% is driven by OPEX improvements • Operating FCF down -20.2% due to cash impact of products sold to Teva JV in FY2017 - Sale of non-core assets generated additional 72.9 Bn yen of cash year-to-date FY2018 YTD year-on-year growth excl. FY17 gains on Wako excl. FY18 YTD Shire & additional products Underlying Reported related costs sold to Teva JV, and FY18 YTD Shire related costs Revenue +4.8% Revenue +0.8% +0.8% +2.2% Core Earnings +32.3% Operating Profit -11.7% -4.0% +55.5% Core EPS +34.2% EPS -32.0% -16.1% +30.4% 10 Strong YTD underlying performance; reported EPS impacted by one-time gains in FY2017 and Shire related costs in FY2018 • Reported EPS decreased -32.0% impacted by divestitures and Shire related costs - Revenue +0.8% with Growth Drivers offsetting negative impact of FX (-1.1pp) & divestitures (-3.0pp) - Operating profit -11.7%, primarily impacted by two large one-time gains in FY2017* and Shire related costs in FY2018; excluding these items Operating profit grew +55.5% *106.3 Bn yen one-time gain on sale of Wako and 16.9 Bn yen from additional products sold to Teva JV • Core EPS increased +34.2% driven by business momentum and strict OPEX discipline - Underlying revenue +4.8% led by Growth Drivers +10.5% - Underlying CE growth +32.3%, with margin +530bps, of which 70% is driven by OPEX improvements • Operating FCF down -20.2% due to cash impact of products sold to Teva JV in FY2017 - Sale of non-core assets generated additional 72.9 Bn yen of cash year-to-date FY2018 YTD year-on-year growth excl. FY17 gains on Wako excl. FY18 YTD Shire & additional products Underlying Reported related costs sold to Teva JV, and FY18 YTD Shire related costs Revenue +4.8% Revenue +0.8% +0.8% +2.2% Core Earnings +32.3% Operating Profit -11.7% -4.0% +55.5% Core EPS +34.2% EPS -32.0% -16.1% +30.4% 10
Table of Contents
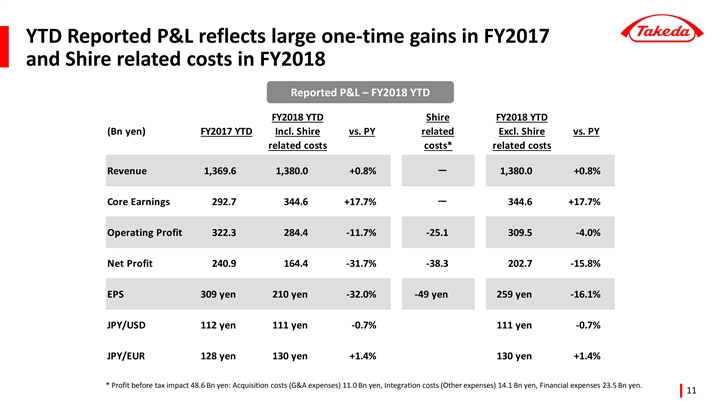
YTD Reported P&L reflects large one-time gains in FY2017 and Shire related costs in FY2018 Reported P&L – FY2018 YTD FY2018 YTD Shire FY2018 YTD (Bn yen) FY2017 YTD Incl. Shire vs. PY related Excl. Shire vs. PY related costs costs* related costs Revenue 1,369.6 1,380.0 +0.8%- 1,380.0 +0.8% Core Earnings 292.7 344.6 +17.7%- 344.6 +17.7% Operating Profit 322.3 284.4 -11.7% -25.1 309.5 -4.0% Net Profit 240.9 164.4 -31.7% -38.3 202.7 -15.8% EPS 309 yen 210 yen -32.0% -49 yen 259 yen -16.1% JPY/USD 112 yen 111 yen -0.7% 111 yen -0.7% JPY/EUR 128 yen 130 yen +1.4% 130 yen +1.4% * Profit before tax impact 48.6 Bn yen: Acquisition costs (G&A expenses) 11.0 Bn yen, Integration costs (Other expenses) 14.1 Bn yen, Financial expenses 23.5 Bn yen. 11 YTD Reported P&L reflects large one-time gains in FY2017 and Shire related costs in FY2018 Reported P&L – FY2018 YTD FY2018 YTD Shire FY2018 YTD (Bn yen) FY2017 YTD Incl. Shire vs. PY related Excl. Shire vs. PY related costs costs* related costs Revenue 1,369.6 1,380.0 +0.8%- 1,380.0 +0.8% Core Earnings 292.7 344.6 +17.7%- 344.6 +17.7% Operating Profit 322.3 284.4 -11.7% -25.1 309.5 -4.0% Net Profit 240.9 164.4 -31.7% -38.3 202.7 -15.8% EPS 309 yen 210 yen -32.0% -49 yen 259 yen -16.1% JPY/USD 112 yen 111 yen -0.7% 111 yen -0.7% JPY/EUR 128 yen 130 yen +1.4% 130 yen +1.4% * Profit before tax impact 48.6 Bn yen: Acquisition costs (G&A expenses) 11.0 Bn yen, Integration costs (Other expenses) 14.1 Bn yen, Financial expenses 23.5 Bn yen. 11
Table of Contents
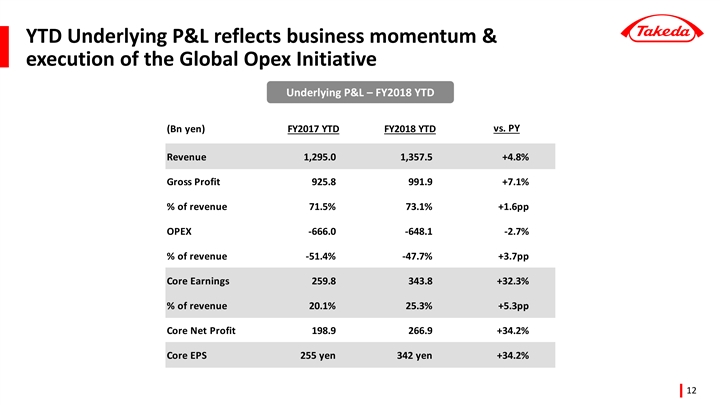
YTD Underlying P&L reflects business momentum & execution of the Global Opex Initiative Underlying P&L – FY2018 YTD (Bn yen) FY2017 YTD FY2018 YTD vs. PY Revenue 1,295.0 1,357.5 +4.8% Gross Profit 925.8 991.9 +7.1% % of revenue 71.5% 73.1% +1.6pp OPEX -666.0 -648.1 -2.7% % of revenue -51.4% -47.7% +3.7pp Core Earnings 259.8 343.8 +32.3% % of revenue 20.1% 25.3% +5.3pp Core Net Profit 198.9 266.9 +34.2% Core EPS 255 yen 342 yen +34.2% 12 YTD Underlying P&L reflects business momentum & execution of the Global Opex Initiative Underlying P&L – FY2018 YTD (Bn yen) FY2017 YTD FY2018 YTD vs. PY Revenue 1,295.0 1,357.5 +4.8% Gross Profit 925.8 991.9 +7.1% % of revenue 71.5% 73.1% +1.6pp OPEX -666.0 -648.1 -2.7% % of revenue -51.4% -47.7% +3.7pp Core Earnings 259.8 343.8 +32.3% % of revenue 20.1% 25.3% +5.3pp Core Net Profit 198.9 266.9 +34.2% Core EPS 255 yen 342 yen +34.2% 12
Table of Contents
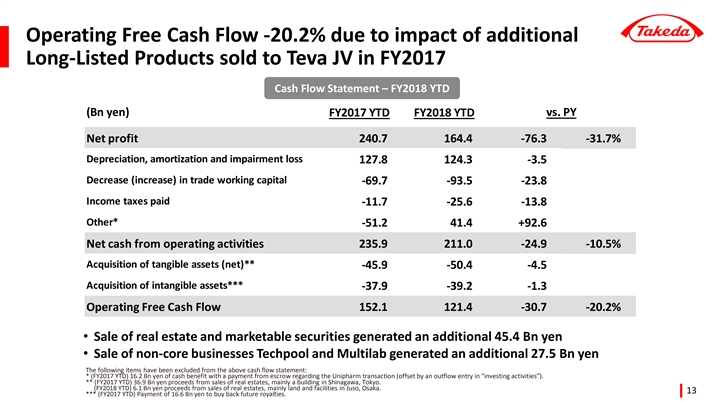
Operating Free Cash Flow -20.2% due to impact of additional Long-Listed Products sold to Teva JV in FY2017 Cash Flow Statement – FY2018 YTD (Bn yen) vs. PY FY2017 YTD FY2018 YTD Net profit 240.7 164.4 -76.3 -31.7% Depreciation, amortization and impairment loss 127.8 124.3 -3.5 Decrease (increase) in trade working capital -69.7 -93.5 -23.8 Income taxes paid -11.7 -25.6 -13.8 Other* -51.2 41.4 +92.6 Net cash from operating activities 235.9 211.0 -24.9 -10.5% Acquisition of tangible assets (net)** -45.9 -50.4 -4.5 Acquisition of intangible assets*** -37.9 -39.2 -1.3 Operating Free Cash Flow 152.1 121.4 -30.7 -20.2% • Sale of real estate and marketable securities generated an additional 45.4 Bn yen • Sale of non-core businesses Techpool and Multilab generated an additional 27.5 Bn yen The following items have been excluded from the above cash flow statement: * (FY2017 YTD) 16.2 Bn yen of cash benefit with a payment from escrow regarding the Unipharm transaction (offset by an outflow entry in “investing activities”). ** (FY2017 YTD) 36.9 Bn yen proceeds from sales of real estates, mainly a building in Shinagawa, Tokyo. (FY2018 YTD) 6.1 Bn yen proceeds from sales of real estates, mainly land and facilities in Juso, Osaka. 13 *** (FY2017 YTD) Payment of 16.6 Bn yen to buy back future royalties. Operating Free Cash Flow -20.2% due to impact of additional Long-Listed Products sold to Teva JV in FY2017 Cash Flow Statement – FY2018 YTD (Bn yen) vs. PY FY2017 YTD FY2018 YTD Net profit 240.7 164.4 -76.3 -31.7% Depreciation, amortization and impairment loss 127.8 124.3 -3.5 Decrease (increase) in trade working capital -69.7 -93.5 -23.8 Income taxes paid -11.7 -25.6 -13.8 Other* -51.2 41.4 +92.6 Net cash from operating activities 235.9 211.0 -24.9 -10.5% Acquisition of tangible assets (net)** -45.9 -50.4 -4.5 Acquisition of intangible assets*** -37.9 -39.2 -1.3 Operating Free Cash Flow 152.1 121.4 -30.7 -20.2% • Sale of real estate and marketable securities generated an additional 45.4 Bn yen • Sale of non-core businesses Techpool and Multilab generated an additional 27.5 Bn yen The following items have been excluded from the above cash flow statement: * (FY2017 YTD) 16.2 Bn yen of cash benefit with a payment from escrow regarding the Unipharm transaction (offset by an outflow entry in “investing activities”). ** (FY2017 YTD) 36.9 Bn yen proceeds from sales of real estates, mainly a building in Shinagawa, Tokyo. (FY2018 YTD) 6.1 Bn yen proceeds from sales of real estates, mainly land and facilities in Juso, Osaka. 13 *** (FY2017 YTD) Payment of 16.6 Bn yen to buy back future royalties.
Table of Contents
Global Opex Initiative fully integrated into how we work and delivering stellar results • Total underlying OPEX spend reduced by 2.7% vs. prior year, trending ahead of plan • OPEX savings contributed 70% of underlying Core Earnings margin improvement (370bps of the 530bps) • Zero Based Budgeting ( ZBB ) for cost packages ahead of plan by 3.7% • Embedded OPEX targets into KPIs and incentives of all management 14 Global Opex Initiative fully integrated into how we work and delivering stellar results • Total underlying OPEX spend reduced by 2.7% vs. prior year, trending ahead of plan • OPEX savings contributed 70% of underlying Core Earnings margin improvement (370bps of the 530bps) • Zero Based Budgeting ( ZBB ) for cost packages ahead of plan by 3.7% • Embedded OPEX targets into KPIs and incentives of all management 14
Table of Contents
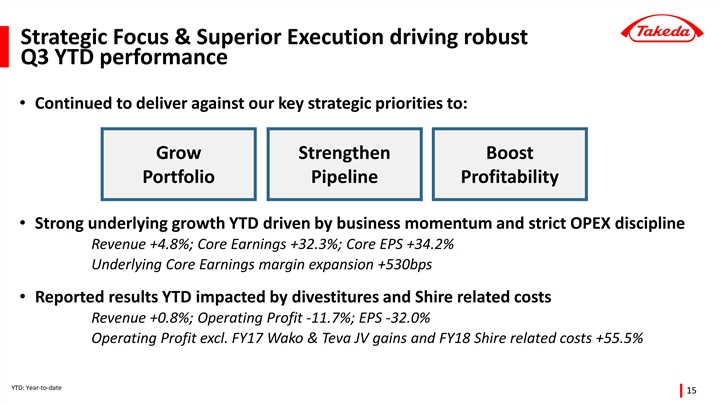
Strategic Focus & Superior Execution driving robust Q3 YTD performance • Continued to deliver against our key strategic priorities to: Grow Strengthen Boost Portfolio Pipeline Profitability • Strong underlying growth YTD driven by business momentum and strict OPEX discipline Revenue +4.8%; Core Earnings +32.3%; Core EPS +34.2% Underlying Core Earnings margin expansion +530bps • Reported results YTD impacted by divestitures and Shire related costs Revenue +0.8%; Operating Profit -11.7%; EPS -32.0% Operating Profit excl. FY17 Wako & Teva JV gains and FY18 Shire related costs +55.5% YTD: Year-to-date 15 Strategic Focus & Superior Execution driving robust Q3 YTD performance • Continued to deliver against our key strategic priorities to: Grow Strengthen Boost Portfolio Pipeline Profitability • Strong underlying growth YTD driven by business momentum and strict OPEX discipline Revenue +4.8%; Core Earnings +32.3%; Core EPS +34.2% Underlying Core Earnings margin expansion +530bps • Reported results YTD impacted by divestitures and Shire related costs Revenue +0.8%; Operating Profit -11.7%; EPS -32.0% Operating Profit excl. FY17 Wako & Teva JV gains and FY18 Shire related costs +55.5% YTD: Year-to-date 15
Table of Contents
Shire acquisition completed, integration progressing as planned th • Acquisition completed on January 8 , 2019 - 8 months from deal announcement to deal close, including shareholder and regulatory approvals - Takeda American Depository Shares listed on the New York Stock Exchange on December 24 - Deal financing completed at highly competitive interest rates against a challenging market backdrop • Confirming investment grade credit rating - Rating agency updates confirm investment grade rating (JCR A+ ; S&P BBB+ ; Moody's Baa2 ; R&I A ) - Proceeding with non-core asset divestiture negotiations to accelerate deleveraging and focus portfolio - Unlocking cash from idle assets on the balance sheet through sale of real estate and marketable securities • Integration progressing as planned - A new operating model to leverage Takeda and Shire know-how - First leadership meeting held on January 10 for new Takeda Executive Team and top 200 leaders 16 Shire acquisition completed, integration progressing as planned th • Acquisition completed on January 8 , 2019 - 8 months from deal announcement to deal close, including shareholder and regulatory approvals - Takeda American Depository Shares listed on the New York Stock Exchange on December 24 - Deal financing completed at highly competitive interest rates against a challenging market backdrop • Confirming investment grade credit rating - Rating agency updates confirm investment grade rating (JCR A+ ; S&P BBB+ ; Moody's Baa2 ; R&I A ) - Proceeding with non-core asset divestiture negotiations to accelerate deleveraging and focus portfolio - Unlocking cash from idle assets on the balance sheet through sale of real estate and marketable securities • Integration progressing as planned - A new operating model to leverage Takeda and Shire know-how - First leadership meeting held on January 10 for new Takeda Executive Team and top 200 leaders 16
Table of Contents
A global, values-based, R&D-driven biopharmaceutical leader with significant financial strength • Substantial cash flow generation to support capital allocation priorities - Internal investment in R&D and product launches - Well established dividend policy (180 yen per share annually) - Committed to solid investment grade credit rating - Disciplined and focused partnerships / acquisitions • Continued focus on boosting profitability - Realize top-tier margins in the medium term, delivering on synergies and improving OPEX discipline • Rapid deleveraging to 2.0x Net Debt/Adjusted EBITDA in the medium term - Potential to further accelerate with divestitures 17 A global, values-based, R&D-driven biopharmaceutical leader with significant financial strength • Substantial cash flow generation to support capital allocation priorities - Internal investment in R&D and product launches - Well established dividend policy (180 yen per share annually) - Committed to solid investment grade credit rating - Disciplined and focused partnerships / acquisitions • Continued focus on boosting profitability - Realize top-tier margins in the medium term, delivering on synergies and improving OPEX discipline • Rapid deleveraging to 2.0x Net Debt/Adjusted EBITDA in the medium term - Potential to further accelerate with divestitures 17
Table of Contents

Appendix Appendix
Table of Contents
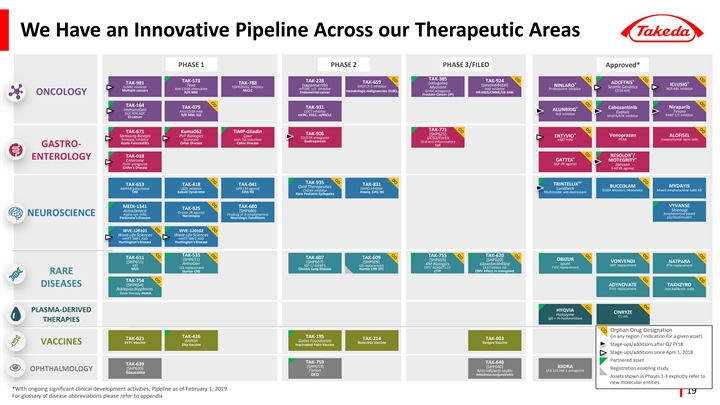
We Have an Innovative Pipeline Across our Therapeutic Areas PHASE 1 PHASE 2 PHASE 3/FILED Approved* TAK-385 TAK-573 TAK-228 TAK-924 ® TAK-659 ADCETRIS TAK-981 TAK-788 (relugolix) ® ® ICLUSIG Teva (sapanisertib) (pevonedistat) NINLARO SUMO inhibitor EGFR/HER2 inhibitor SYK/FLT-3 inhibitor Seattle Genetics Myovant Anti-CD38-attenukine mTORC 1/2 inhibitor NAE inhibitor Proteasome inhibitor BCR-ABL inhibitor Multiple cancers NSCLC Hematologic malignancies, DLBCL GnRH antagonist CD30 ADC R/R MM Endometrial cancer HR-MDS/CMML/LB AML ONCOLOGY Prostate Cancer (JP) TAK-164 TAK-079 TAK-931 Cabozantinib Niraparib ® ImmunoGen ALUNBRIG Anti-CD38 mAb CDC7 inhibitor Tesaro Exelixis GCC IGN ADC ALK inhibitor R/R MM, SLE mCRC, ESCC, sqNSCLC PARP 1/2 inhibitor VEGFR/RTK inhibitor GI cancer TAK-721 TAK-671 Kuma062 TIMP-Gliadin TAK-906 (SHP621) ® Samsung Bioepis PvP Biologics Cour Vonoprazan ALOFISEL ENTYVIO D2/D3R antagonist UCSD/Fortis Protease inhibitor Glutenase Imm Tol Induction α4β7 mAb PCAB mesenchymal stem cells Gastroparesis Oral anti-inflammatory Acute Pancreatitis Celiac Disease Celiac Disease EoE GASTRO- ® RESOLOR / TAK-018 ENTEROLOGY ® ® GATTEX Enterome MOTEGRITY FimH antagonist GLP-2R agonist Janssen Crohn’s Disease 5-HT4R agonist TM TAK-935 TAK-653 TAK-418 TAK-041 TAK-831 TRINTELLIX Ovid Therapeutics BUCCOLAM MYDAYIS AMPAR potentiator LSD1 inhibitor GPR139 agonist DAAO inhibitor Lundbeck GABA Allosteric Modulator Mixed Amphetamine salts XR CH24H inhibitor TRD Kabuki Syndrome CIAS NS Ataxia, CIAS NS Multimodal anti-depressant Rare Pediatric Epilepsies VYVANSE MEDI-1341 TAK-680 TAK-925 AstraZeneca (SHP680) Shionogi Orexin 2R agonist Amphetamine-based NEUROSCIENCE Alpha-syn mAb Prodrug of d-amphetamine Narcolepsy psychostimulant Parkinson’s Disease Neurologic Conditions WVE-120101 WVE-120102 Wave Life Sciences Wave Life Sciences mHTT SNP1 ASO mHTT SNP2 ASO Huntington’s Disease Huntington’s Disease TAK-531 TAK-755 TAK-620 TAK-611 TAK-607 TAK-609 (SHP631) (SHP655) (SHP620) OBIZUR (SHP611) (SHP607) (SHP609) VONVENDI NATPARA ArmaGen KM Biologics GlaxoSmithKline Ipsen ERT IGF-1/ IGFBP3 I2S replacement vWF replacement PTH replacement I2S replacement ERT/ ADAMTS-13 UL97 kinase inh FVIII replacement MLD Chronic Lung Disease Hunter CNS (IT) cTTP CMV infect. in transplant Hunter CNS RARE TAK-754 (SHP654) ADYNOVATE TAKHZYRO DISEASES Asklepios Biopharm. FVIII replacement Anti-kallikrein mAb Gene therapy HemA PLASMA-DERIVED HYQVIA CINRYZE Halozyme C1-inh IgG + rh-hyaluronidase THERAPIES Orphan Drug Designation TAK-426 TAK-195 (in any region / indication for a given asset) TAK-021 TAK-214 TAK-003 BARDA Gates Foundation EV71 Vaccine Norovirus Vaccine Dengue Vaccine VACCINES Zika Vaccine Inactivated Polio Vaccine Stage-ups/additions after Q2 FY18 Stage-ups/additions since April 1, 2018 Partnered asset TAK-759 TAK-640 TAK-639 (SHP659) (SHP640) XIIDRA (SHP639) Registration enabling study OPHTHALMOLOGY Parion Anti-infl/anti-septic LFA-1/ICAM-1 antagonist Glaucoma DED Infectious conjunctivitis Assets shown in Phases 1-3 explicitly refer to new molecular entities *With ongoing significant clinical development activities; Pipeline as of February 1, 2019 19 For glossary of disease abbreviations please refer to appendix We Have an Innovative Pipeline Across our Therapeutic Areas PHASE 1 PHASE 2 PHASE 3/FILED Approved* TAK-385 TAK-573 TAK-228 TAK-924 ® TAK-659 ADCETRIS TAK-981 TAK-788 (relugolix) ® ® ICLUSIG Teva (sapanisertib) (pevonedistat) NINLARO SUMO inhibitor EGFR/HER2 inhibitor SYK/FLT-3 inhibitor Seattle Genetics Myovant Anti-CD38-attenukine mTORC 1/2 inhibitor NAE inhibitor Proteasome inhibitor BCR-ABL inhibitor Multiple cancers NSCLC Hematologic malignancies, DLBCL GnRH antagonist CD30 ADC R/R MM Endometrial cancer HR-MDS/CMML/LB AML ONCOLOGY Prostate Cancer (JP) TAK-164 TAK-079 TAK-931 Cabozantinib Niraparib ® ImmunoGen ALUNBRIG Anti-CD38 mAb CDC7 inhibitor Tesaro Exelixis GCC IGN ADC ALK inhibitor R/R MM, SLE mCRC, ESCC, sqNSCLC PARP 1/2 inhibitor VEGFR/RTK inhibitor GI cancer TAK-721 TAK-671 Kuma062 TIMP-Gliadin TAK-906 (SHP621) ® Samsung Bioepis PvP Biologics Cour Vonoprazan ALOFISEL ENTYVIO D2/D3R antagonist UCSD/Fortis Protease inhibitor Glutenase Imm Tol Induction α4β7 mAb PCAB mesenchymal stem cells Gastroparesis Oral anti-inflammatory Acute Pancreatitis Celiac Disease Celiac Disease EoE GASTRO- ® RESOLOR / TAK-018 ENTEROLOGY ® ® GATTEX Enterome MOTEGRITY FimH antagonist GLP-2R agonist Janssen Crohn’s Disease 5-HT4R agonist TM TAK-935 TAK-653 TAK-418 TAK-041 TAK-831 TRINTELLIX Ovid Therapeutics BUCCOLAM MYDAYIS AMPAR potentiator LSD1 inhibitor GPR139 agonist DAAO inhibitor Lundbeck GABA Allosteric Modulator Mixed Amphetamine salts XR CH24H inhibitor TRD Kabuki Syndrome CIAS NS Ataxia, CIAS NS Multimodal anti-depressant Rare Pediatric Epilepsies VYVANSE MEDI-1341 TAK-680 TAK-925 AstraZeneca (SHP680) Shionogi Orexin 2R agonist Amphetamine-based NEUROSCIENCE Alpha-syn mAb Prodrug of d-amphetamine Narcolepsy psychostimulant Parkinson’s Disease Neurologic Conditions WVE-120101 WVE-120102 Wave Life Sciences Wave Life Sciences mHTT SNP1 ASO mHTT SNP2 ASO Huntington’s Disease Huntington’s Disease TAK-531 TAK-755 TAK-620 TAK-611 TAK-607 TAK-609 (SHP631) (SHP655) (SHP620) OBIZUR (SHP611) (SHP607) (SHP609) VONVENDI NATPARA ArmaGen KM Biologics GlaxoSmithKline Ipsen ERT IGF-1/ IGFBP3 I2S replacement vWF replacement PTH replacement I2S replacement ERT/ ADAMTS-13 UL97 kinase inh FVIII replacement MLD Chronic Lung Disease Hunter CNS (IT) cTTP CMV infect. in transplant Hunter CNS RARE TAK-754 (SHP654) ADYNOVATE TAKHZYRO DISEASES Asklepios Biopharm. FVIII replacement Anti-kallikrein mAb Gene therapy HemA PLASMA-DERIVED HYQVIA CINRYZE Halozyme C1-inh IgG + rh-hyaluronidase THERAPIES Orphan Drug Designation TAK-426 TAK-195 (in any region / indication for a given asset) TAK-021 TAK-214 TAK-003 BARDA Gates Foundation EV71 Vaccine Norovirus Vaccine Dengue Vaccine VACCINES Zika Vaccine Inactivated Polio Vaccine Stage-ups/additions after Q2 FY18 Stage-ups/additions since April 1, 2018 Partnered asset TAK-759 TAK-640 TAK-639 (SHP659) (SHP640) XIIDRA (SHP639) Registration enabling study OPHTHALMOLOGY Parion Anti-infl/anti-septic LFA-1/ICAM-1 antagonist Glaucoma DED Infectious conjunctivitis Assets shown in Phases 1-3 explicitly refer to new molecular entities *With ongoing significant clinical development activities; Pipeline as of February 1, 2019 19 For glossary of disease abbreviations please refer to appendix
Table of Contents
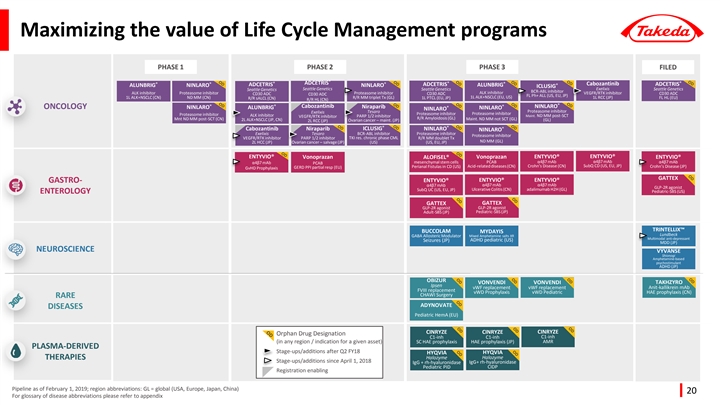
Maximizing the value of Life Cycle Management programs PHASE 1 PHASE 2 PHASE 3 FILED ® ® ® ® ® ® ADCETRIS ® ® ADCETRIS ADCETRIS ® Cabozantinib ADCETRIS ALUNBRIG NINLARO NINLARO ALUNBRIG ICLUSIG Seattle Genetics Exelixis Seattle Genetics Seattle Genetics Seattle Genetics BCR-ABL inhibitor ALK inhibitor ALK inhibitor Proteasome inhibitor CD30 ADC Proteasome inhibitor CD30 ADC VEGFR/RTK inhibitor CD30 ADC CD30 ADC FL Ph+ ALL (US, EU, JP) 1L ALK+NSCLC (CN) ND MM (CN) R/R MM triplet Tx (GL) 1L PTCL (EU, JP) 1L ALK+NSCLC (EU, US) 1L RCC (JP) FL HL (EU) R/R sALCL (CN) R/R HL (CN) ® ® ® Cabozantinib Niraparib ® NINLARO ONCOLOGY NINLARO ALUNBRIG ® NINLARO NINLARO Tesaro Proteasome inhibitor Exelixis Proteasome inhibitor Proteasome inhibitor Proteasome inhibitor ALK inhibitor PARP 1/2 inhibitor Maint. ND MM post-SCT VEGFR/RTK inhibitor Mnt ND MM post-SCT (CN) R/R Amyloidosis (GL) Maint. ND MM not SCT (GL) 2L ALK+NSCLC (JP, CN) (GL) 2L RCC (JP) Ovarian cancer – maint. (JP) ® ® Niraparib ICLUSIG NINLARO ® Cabozantinib NINLARO Exelixis Tesaro BCR-ABL inhibitor Proteasome inhibitor Proteasome inhibitor VEGFR/RTK inhibitor PARP 1/2 inhibitor TKI res. chronic phase CML R/R MM doublet Tx ND MM (GL) 2L HCC (JP) Ovarian cancer – salvage (JP) (US) (US, EU, JP) ENTYVIO® ENTYVIO® Vonoprazan ALOFISEL® Vonoprazan ENTYVIO® ENTYVIO® PCAB α4β7 mAb α4β7 mAb α4β7 mAb α4β7 mAb mesenchymal stem cells PCAB SubQ CD (US, EU, JP) Perianal Fistulas in CD (US) Acid-related diseases (CN) Crohn’s Disease (CN) Crohn’s Disease (JP) GERD PPI partial resp (EU) GvHD Prophylaxis GATTEX ENTYVIO® ENTYVIO® ENTYVIO® GASTRO- α4β7 mAb α4β7 mAb α4β7 mAb GLP-2R agonist SubQ UC (US, EU, JP) Ulcerative Colitis (CN) adalimumab H2H (GL) Pediatric-SBS (US) ENTEROLOGY GATTEX GATTEX GLP-2R agonist GLP-2R agonist Pediatric-SBS (JP) Adult-SBS (JP) TRINTELLIX™ BUCCOLAM MYDAYIS Lundbeck GABA Allosteric Modulator Mixed Amphetamine salts XR Multimodal anti-depressant Seizures (JP) ADHD pediatric (US) MDD (JP) NEUROSCIENCE VYVANSE Shionogi Amphetamine-based psychostimulant ADHD (JP) OBIZUR VONVENDI VONVENDI TAKHZYRO Ipsen vWF replacement vWF replacement Anit-kallikrein mAb FVIII replacement vWD Prophylaxis vWD Pediatric HAE prophylaxis (CN) CHAWI Surgery RARE ADYNOVATE DISEASES Pediatric HemA (EU) CINRYZE CINRYZE CINRYZE Orphan Drug Designation C1-inh C1-inh C1-inh (in any region / indication for a given asset) SC HAE prophylaxis HAE prophylaxis (JP) AMR PLASMA-DERIVED Stage-ups/additions after Q2 FY18 HYQVIA HYQVIA Halozyme Halozyme THERAPIES Stage-ups/additions since April 1, 2018 IgG + rh-hyaluronidase IgG+ rh-hyaluronidase Pediatric PID CIDP Registration enabling Pipeline as of February 1, 2019; region abbreviations: GL = global (USA, Europe, Japan, China) 20 For glossary of disease abbreviations please refer to appendix Maximizing the value of Life Cycle Management programs PHASE 1 PHASE 2 PHASE 3 FILED ® ® ® ® ® ® ADCETRIS ® ® ADCETRIS ADCETRIS ® Cabozantinib ADCETRIS ALUNBRIG NINLARO NINLARO ALUNBRIG ICLUSIG Seattle Genetics Exelixis Seattle Genetics Seattle Genetics Seattle Genetics BCR-ABL inhibitor ALK inhibitor ALK inhibitor Proteasome inhibitor CD30 ADC Proteasome inhibitor CD30 ADC VEGFR/RTK inhibitor CD30 ADC CD30 ADC FL Ph+ ALL (US, EU, JP) 1L ALK+NSCLC (CN) ND MM (CN) R/R MM triplet Tx (GL) 1L PTCL (EU, JP) 1L ALK+NSCLC (EU, US) 1L RCC (JP) FL HL (EU) R/R sALCL (CN) R/R HL (CN) ® ® ® Cabozantinib Niraparib ® NINLARO ONCOLOGY NINLARO ALUNBRIG ® NINLARO NINLARO Tesaro Proteasome inhibitor Exelixis Proteasome inhibitor Proteasome inhibitor Proteasome inhibitor ALK inhibitor PARP 1/2 inhibitor Maint. ND MM post-SCT VEGFR/RTK inhibitor Mnt ND MM post-SCT (CN) R/R Amyloidosis (GL) Maint. ND MM not SCT (GL) 2L ALK+NSCLC (JP, CN) (GL) 2L RCC (JP) Ovarian cancer – maint. (JP) ® ® Niraparib ICLUSIG NINLARO ® Cabozantinib NINLARO Exelixis Tesaro BCR-ABL inhibitor Proteasome inhibitor Proteasome inhibitor VEGFR/RTK inhibitor PARP 1/2 inhibitor TKI res. chronic phase CML R/R MM doublet Tx ND MM (GL) 2L HCC (JP) Ovarian cancer – salvage (JP) (US) (US, EU, JP) ENTYVIO® ENTYVIO® Vonoprazan ALOFISEL® Vonoprazan ENTYVIO® ENTYVIO® PCAB α4β7 mAb α4β7 mAb α4β7 mAb α4β7 mAb mesenchymal stem cells PCAB SubQ CD (US, EU, JP) Perianal Fistulas in CD (US) Acid-related diseases (CN) Crohn’s Disease (CN) Crohn’s Disease (JP) GERD PPI partial resp (EU) GvHD Prophylaxis GATTEX ENTYVIO® ENTYVIO® ENTYVIO® GASTRO- α4β7 mAb α4β7 mAb α4β7 mAb GLP-2R agonist SubQ UC (US, EU, JP) Ulcerative Colitis (CN) adalimumab H2H (GL) Pediatric-SBS (US) ENTEROLOGY GATTEX GATTEX GLP-2R agonist GLP-2R agonist Pediatric-SBS (JP) Adult-SBS (JP) TRINTELLIX™ BUCCOLAM MYDAYIS Lundbeck GABA Allosteric Modulator Mixed Amphetamine salts XR Multimodal anti-depressant Seizures (JP) ADHD pediatric (US) MDD (JP) NEUROSCIENCE VYVANSE Shionogi Amphetamine-based psychostimulant ADHD (JP) OBIZUR VONVENDI VONVENDI TAKHZYRO Ipsen vWF replacement vWF replacement Anit-kallikrein mAb FVIII replacement vWD Prophylaxis vWD Pediatric HAE prophylaxis (CN) CHAWI Surgery RARE ADYNOVATE DISEASES Pediatric HemA (EU) CINRYZE CINRYZE CINRYZE Orphan Drug Designation C1-inh C1-inh C1-inh (in any region / indication for a given asset) SC HAE prophylaxis HAE prophylaxis (JP) AMR PLASMA-DERIVED Stage-ups/additions after Q2 FY18 HYQVIA HYQVIA Halozyme Halozyme THERAPIES Stage-ups/additions since April 1, 2018 IgG + rh-hyaluronidase IgG+ rh-hyaluronidase Pediatric PID CIDP Registration enabling Pipeline as of February 1, 2019; region abbreviations: GL = global (USA, Europe, Japan, China) 20 For glossary of disease abbreviations please refer to appendix
Table of Contents
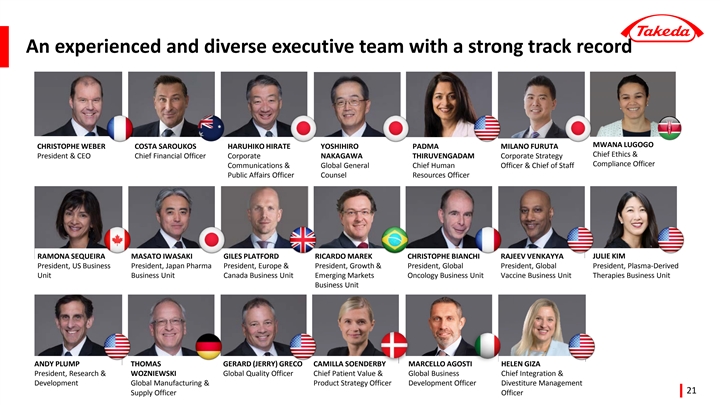
An experienced and diverse executive team with a strong track record MWANA LUGOGO CHRISTOPHE WEBER COSTA SAROUKOS HARUHIKO HIRATE YOSHIHIRO PADMA MILANO FURUTA Chief Ethics & President & CEO Chief Financial Officer Corporate NAKAGAWA THIRUVENGADAM Corporate Strategy Compliance Officer Communications & Global General Chief Human Officer & Chief of Staff Public Affairs Officer Counsel Resources Officer RAMONA SEQUEIRA MASATO IWASAKI GILES PLATFORD RICARDO MAREK CHRISTOPHE BIANCHI RAJEEV VENKAYYA JULIE KIM President, US Business President, Japan Pharma President, Europe & President, Growth & President, Global President, Global President, Plasma-Derived Unit Business Unit Canada Business Unit Emerging Markets Oncology Business Unit Vaccine Business Unit Therapies Business Unit Business Unit ANDY PLUMP THOMAS GERARD (JERRY) GRECO CAMILLA SOENDERBY MARCELLO AGOSTI HELEN GIZA President, Research & WOZNIEWSKI Global Quality Officer Chief Patient Value & Global Business Chief Integration & Development Global Manufacturing & Product Strategy Officer Development Officer Divestiture Management 21 Supply Officer Officer An experienced and diverse executive team with a strong track record MWANA LUGOGO CHRISTOPHE WEBER COSTA SAROUKOS HARUHIKO HIRATE YOSHIHIRO PADMA MILANO FURUTA Chief Ethics & President & CEO Chief Financial Officer Corporate NAKAGAWA THIRUVENGADAM Corporate Strategy Compliance Officer Communications & Global General Chief Human Officer & Chief of Staff Public Affairs Officer Counsel Resources Officer RAMONA SEQUEIRA MASATO IWASAKI GILES PLATFORD RICARDO MAREK CHRISTOPHE BIANCHI RAJEEV VENKAYYA JULIE KIM President, US Business President, Japan Pharma President, Europe & President, Growth & President, Global President, Global President, Plasma-Derived Unit Business Unit Canada Business Unit Emerging Markets Oncology Business Unit Vaccine Business Unit Therapies Business Unit Business Unit ANDY PLUMP THOMAS GERARD (JERRY) GRECO CAMILLA SOENDERBY MARCELLO AGOSTI HELEN GIZA President, Research & WOZNIEWSKI Global Quality Officer Chief Patient Value & Global Business Chief Integration & Development Global Manufacturing & Product Strategy Officer Development Officer Divestiture Management 21 Supply Officer Officer
Table of Contents
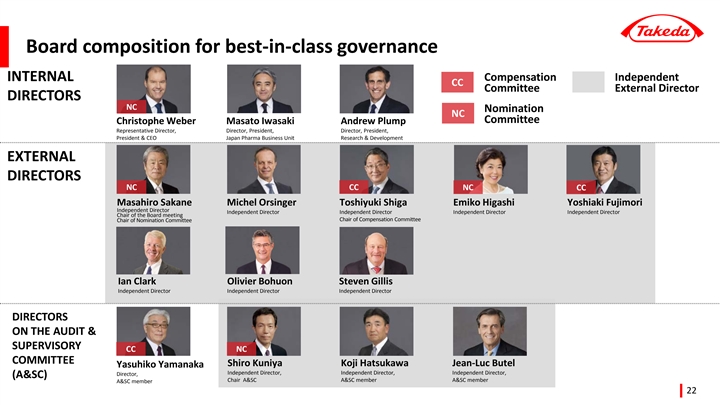
Board composition for best-in-class governance INTERNAL Compensation Independent CC Committee External Director DIRECTORS NC Nomination NC Committee Christophe Weber Masato Iwasaki Andrew Plump Representative Director, Director, President, Director, President, President & CEO Japan Pharma Business Unit Research & Development EXTERNAL DIRECTORS NC CC NC CC Masahiro Sakane Michel Orsinger Toshiyuki Shiga Emiko Higashi Yoshiaki Fujimori Independent Director Independent Director Independent Director Independent Director Independent Director Chair of the Board meeting Chair of Compensation Committee Chair of Nomination Committee Ian Clark Olivier Bohuon Steven Gillis Independent Director Independent Director Independent Director DIRECTORS ON THE AUDIT & SUPERVISORY CC NC COMMITTEE Shiro Kuniya Koji Hatsukawa Jean-Luc Butel Yasuhiko Yamanaka Independent Director, Independent Director, Independent Director, Director, (A&SC) Chair A&SC A&SC member A&SC member A&SC member 22 Board composition for best-in-class governance INTERNAL Compensation Independent CC Committee External Director DIRECTORS NC Nomination NC Committee Christophe Weber Masato Iwasaki Andrew Plump Representative Director, Director, President, Director, President, President & CEO Japan Pharma Business Unit Research & Development EXTERNAL DIRECTORS NC CC NC CC Masahiro Sakane Michel Orsinger Toshiyuki Shiga Emiko Higashi Yoshiaki Fujimori Independent Director Independent Director Independent Director Independent Director Independent Director Chair of the Board meeting Chair of Compensation Committee Chair of Nomination Committee Ian Clark Olivier Bohuon Steven Gillis Independent Director Independent Director Independent Director DIRECTORS ON THE AUDIT & SUPERVISORY CC NC COMMITTEE Shiro Kuniya Koji Hatsukawa Jean-Luc Butel Yasuhiko Yamanaka Independent Director, Independent Director, Independent Director, Director, (A&SC) Chair A&SC A&SC member A&SC member A&SC member 22
Table of Contents
Definition of Core and Underlying Growth Takeda uses the concept of “Underlying Growth” for internal planning and performance evaluation purposes. Underlying Growth compares two periods (quarters or years) of financial results under a common basis and is used by management to assess the business. These financial results are calculated on a constant currency basis and excluding the impacts of divestitures and other amounts that are unusual, non-recurring items or unrelated to our ongoing operations. Although these are not measures defined by IFRS, Takeda believes Underlying Growth is useful to investors as it provides a consistent measure of our performance. Takeda uses “Underlying Revenue Growth”, “Underlying Core Earnings Growth”, and “Underlying Core EPS Growth” as key financial metrics. Underlying Revenue represents revenue on a constant currency basis and excluding non-recurring items and the impact of divestitures occurred during the reporting periods presented. Core Earnings represents net profit adjusted to exclude income tax expenses, our share of profit or loss of investments accounted for using the equity method, finance expenses and income, other operating expenses and income, amortization and impairment losses on intangible assets associated with products and other items that management believes are unrelated to our core operations, such as purchase accounting effects and transaction related costs. Underlying Core Earnings represents Core Earnings based on a constant currency basis and further adjusted to exclude the impacts of divestitures occurred during the reporting periods presented. Underlying Core EPS represents net income based on a constant currency basis, adjusted to exclude the impact of divestitures, items excluded in the calculation of Core Earnings and other non-operating items (e.g. amongst other items, fair value adjustments and the imputed financial charge related to contingent consideration) that are unusual, non-recurring in nature or unrelated to its ongoing operations and the tax effect of each of the adjustments, divided by the outstanding shares (excluding treasury shares) as of the end of the comparative period. 23 Definition of Core and Underlying Growth Takeda uses the concept of “Underlying Growth” for internal planning and performance evaluation purposes. Underlying Growth compares two periods (quarters or years) of financial results under a common basis and is used by management to assess the business. These financial results are calculated on a constant currency basis and excluding the impacts of divestitures and other amounts that are unusual, non-recurring items or unrelated to our ongoing operations. Although these are not measures defined by IFRS, Takeda believes Underlying Growth is useful to investors as it provides a consistent measure of our performance. Takeda uses “Underlying Revenue Growth”, “Underlying Core Earnings Growth”, and “Underlying Core EPS Growth” as key financial metrics. Underlying Revenue represents revenue on a constant currency basis and excluding non-recurring items and the impact of divestitures occurred during the reporting periods presented. Core Earnings represents net profit adjusted to exclude income tax expenses, our share of profit or loss of investments accounted for using the equity method, finance expenses and income, other operating expenses and income, amortization and impairment losses on intangible assets associated with products and other items that management believes are unrelated to our core operations, such as purchase accounting effects and transaction related costs. Underlying Core Earnings represents Core Earnings based on a constant currency basis and further adjusted to exclude the impacts of divestitures occurred during the reporting periods presented. Underlying Core EPS represents net income based on a constant currency basis, adjusted to exclude the impact of divestitures, items excluded in the calculation of Core Earnings and other non-operating items (e.g. amongst other items, fair value adjustments and the imputed financial charge related to contingent consideration) that are unusual, non-recurring in nature or unrelated to its ongoing operations and the tax effect of each of the adjustments, divided by the outstanding shares (excluding treasury shares) as of the end of the comparative period. 23
Table of Contents
Definition of EBITDA / Adjusted EBITDA We present EBITDA and Adjusted EBITDA because we believe that these measures are useful to investors as they are frequently used by securities analysts, investors and other interested parties in the evaluation of companies in our industry. We further believe that Adjusted EBITDA is helpful to investors in identifying trends in its business that could otherwise be obscured by certain items unrelated to ongoing operations because they are highly variable, difficult to predict, may substantially impact our results of operations and may limit the ability to evaluate our performance from one period to another on a consistent basis. EBITDA and Adjusted EBITDA should not be considered in isolation or construed as alternatives to operating income, net profit for the year or any other measure of performance presented in accordance with IFRS. These non-IFRS measures may not be comparable to similarly-titled measures presented by other companies. The usefulness of EBITDA and Adjusted EBITDA to investors has limitations including, but not limited to, (i) they may not be comparable to similarly titled measures used by other companies, including those in our industry, (ii) they exclude financial information and events, such as the effects of an acquisition or amortization of intangible assets, that some may consider important in evaluating our performance, value or prospects for the future, (iii) they exclude items or types of items that may continue to occur from period to period in the future and (iv) they may not exclude all items which investors may consider to be unrelated to our long-term operations, such as the results of businesses divested during a periods. These non-IFRS measures are not, and should not be viewed as, substitutes for IFRS reported net income (loss). We encourage investors to review our historical financial statements in their entirety and caution investors to use IFRS measures as the primary means of evaluating our performance, value and prospects for the future, and EBITDA and Adjusted EBITDA as supplemental measures. EBITDA and Adjusted EBITDA We define EBITDA as net profit before income tax expenses, depreciation and amortization and net interest expense. We define Adjusted EBITDA as EBITDA further adjusted to exclude impairment losses, other operating expenses and income (excluding depreciation and amortization), finance expenses and income (excluding net interest expense), our share of loss from investments accounted for under the equity method and other items that management believes are unrelated to our core operations such as purchase accounting effects and transaction related costs. The most closely comparable measure presented in accordance with IFRS is net profit for the year. Please see slides 25 for a reconciliation to the respective most closely comparable measures presented in accordance with IFRS. 24 Definition of EBITDA / Adjusted EBITDA We present EBITDA and Adjusted EBITDA because we believe that these measures are useful to investors as they are frequently used by securities analysts, investors and other interested parties in the evaluation of companies in our industry. We further believe that Adjusted EBITDA is helpful to investors in identifying trends in its business that could otherwise be obscured by certain items unrelated to ongoing operations because they are highly variable, difficult to predict, may substantially impact our results of operations and may limit the ability to evaluate our performance from one period to another on a consistent basis. EBITDA and Adjusted EBITDA should not be considered in isolation or construed as alternatives to operating income, net profit for the year or any other measure of performance presented in accordance with IFRS. These non-IFRS measures may not be comparable to similarly-titled measures presented by other companies. The usefulness of EBITDA and Adjusted EBITDA to investors has limitations including, but not limited to, (i) they may not be comparable to similarly titled measures used by other companies, including those in our industry, (ii) they exclude financial information and events, such as the effects of an acquisition or amortization of intangible assets, that some may consider important in evaluating our performance, value or prospects for the future, (iii) they exclude items or types of items that may continue to occur from period to period in the future and (iv) they may not exclude all items which investors may consider to be unrelated to our long-term operations, such as the results of businesses divested during a periods. These non-IFRS measures are not, and should not be viewed as, substitutes for IFRS reported net income (loss). We encourage investors to review our historical financial statements in their entirety and caution investors to use IFRS measures as the primary means of evaluating our performance, value and prospects for the future, and EBITDA and Adjusted EBITDA as supplemental measures. EBITDA and Adjusted EBITDA We define EBITDA as net profit before income tax expenses, depreciation and amortization and net interest expense. We define Adjusted EBITDA as EBITDA further adjusted to exclude impairment losses, other operating expenses and income (excluding depreciation and amortization), finance expenses and income (excluding net interest expense), our share of loss from investments accounted for under the equity method and other items that management believes are unrelated to our core operations such as purchase accounting effects and transaction related costs. The most closely comparable measure presented in accordance with IFRS is net profit for the year. Please see slides 25 for a reconciliation to the respective most closely comparable measures presented in accordance with IFRS. 24
Table of Contents
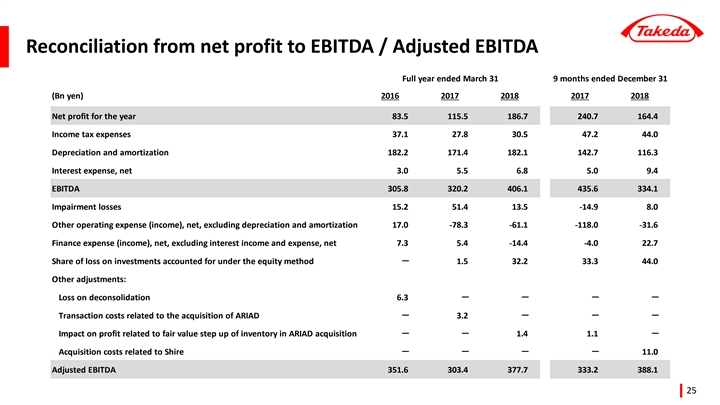
Reconciliation from net profit to EBITDA / Adjusted EBITDA Full year ended March 31 9 months ended December 31 (Bn yen) 2016 2017 2018 2017 2018 Net profit for the year 83.5 115.5 186.7 240.7 164.4 Income tax expenses 37.1 27.8 30.5 47.2 44.0 Depreciation and amortization 182.2 171.4 182.1 142.7 116.3 Interest expense, net 3.0 5.5 6.8 5.0 9.4 EBITDA 305.8 320.2 406.1 435.6 334.1 Impairment losses 15.2 51.4 13.5 -14.9 8.0 Other operating expense (income), net, excluding depreciation and amortization 17.0 -78.3 -61.1 -118.0 -31.6 Finance expense (income), net, excluding interest income and expense, net 7.3 5.4 -14.4 -4.0 22.7 Share of loss on investments accounted for under the equity method- 1.5 32.2 33.3 44.0 Other adjustments: Loss on deconsolidation 6.3---- Transaction costs related to the acquisition of ARIAD- 3.2--- Impact on profit related to fair value step up of inventory in ARIAD acquisition-- 1.4 1.1- Acquisition costs related to Shire---- 11.0 Adjusted EBITDA 351.6 303.4 377.7 333.2 388.1 25 Reconciliation from net profit to EBITDA / Adjusted EBITDA Full year ended March 31 9 months ended December 31 (Bn yen) 2016 2017 2018 2017 2018 Net profit for the year 83.5 115.5 186.7 240.7 164.4 Income tax expenses 37.1 27.8 30.5 47.2 44.0 Depreciation and amortization 182.2 171.4 182.1 142.7 116.3 Interest expense, net 3.0 5.5 6.8 5.0 9.4 EBITDA 305.8 320.2 406.1 435.6 334.1 Impairment losses 15.2 51.4 13.5 -14.9 8.0 Other operating expense (income), net, excluding depreciation and amortization 17.0 -78.3 -61.1 -118.0 -31.6 Finance expense (income), net, excluding interest income and expense, net 7.3 5.4 -14.4 -4.0 22.7 Share of loss on investments accounted for under the equity method- 1.5 32.2 33.3 44.0 Other adjustments: Loss on deconsolidation 6.3---- Transaction costs related to the acquisition of ARIAD- 3.2--- Impact on profit related to fair value step up of inventory in ARIAD acquisition-- 1.4 1.1- Acquisition costs related to Shire---- 11.0 Adjusted EBITDA 351.6 303.4 377.7 333.2 388.1 25
Table of Contents
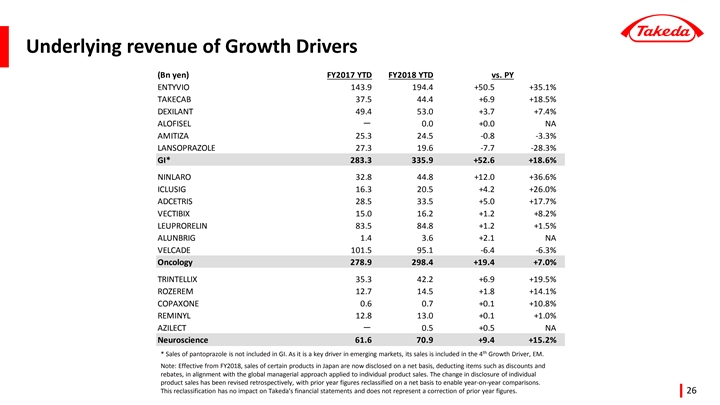
Underlying revenue of Growth Drivers (Bn yen) FY2017 YTD FY2018 YTD vs. PY ENTYVIO 143.9 194.4 +50.5 +35.1% TAKECAB 37.5 44.4 +6.9 +18.5% DEXILANT 49.4 53.0 +3.7 +7.4% ALOFISEL- 0.0 +0.0 NA AMITIZA 25.3 24.5 -0.8 -3.3% LANSOPRAZOLE 27.3 19.6 -7.7 -28.3% GI* 283.3 335.9 +52.6 +18.6% NINLARO 32.8 44.8 +12.0 +36.6% ICLUSIG 16.3 20.5 +4.2 +26.0% ADCETRIS 28.5 33.5 +5.0 +17.7% VECTIBIX 15.0 16.2 +1.2 +8.2% LEUPRORELIN 83.5 84.8 +1.2 +1.5% ALUNBRIG 1.4 3.6 +2.1 NA VELCADE 101.5 95.1 -6.4 -6.3% Oncology 278.9 298.4 +19.4 +7.0% TRINTELLIX 35.3 42.2 +6.9 +19.5% ROZEREM 12.7 14.5 +1.8 +14.1% COPAXONE 0.6 0.7 +0.1 +10.8% REMINYL 12.8 13.0 +0.1 +1.0% AZILECT- 0.5 +0.5 NA Neuroscience 61.6 70.9 +9.4 +15.2% th * Sales of pantoprazole is not included in GI. As it is a key driver in emerging markets, its sales is included in the 4 Growth Driver, EM. Note: Effective from FY2018, sales of certain products in Japan are now disclosed on a net basis, deducting items such as discounts and rebates, in alignment with the global managerial approach applied to individual product sales. The change in disclosure of individual product sales has been revised retrospectively, with prior year figures reclassified on a net basis to enable year-on-year comparisons. This reclassification has no impact on Takeda's financial statements and does not represent a correction of prior year figures. 26 Underlying revenue of Growth Drivers (Bn yen) FY2017 YTD FY2018 YTD vs. PY ENTYVIO 143.9 194.4 +50.5 +35.1% TAKECAB 37.5 44.4 +6.9 +18.5% DEXILANT 49.4 53.0 +3.7 +7.4% ALOFISEL- 0.0 +0.0 NA AMITIZA 25.3 24.5 -0.8 -3.3% LANSOPRAZOLE 27.3 19.6 -7.7 -28.3% GI* 283.3 335.9 +52.6 +18.6% NINLARO 32.8 44.8 +12.0 +36.6% ICLUSIG 16.3 20.5 +4.2 +26.0% ADCETRIS 28.5 33.5 +5.0 +17.7% VECTIBIX 15.0 16.2 +1.2 +8.2% LEUPRORELIN 83.5 84.8 +1.2 +1.5% ALUNBRIG 1.4 3.6 +2.1 NA VELCADE 101.5 95.1 -6.4 -6.3% Oncology 278.9 298.4 +19.4 +7.0% TRINTELLIX 35.3 42.2 +6.9 +19.5% ROZEREM 12.7 14.5 +1.8 +14.1% COPAXONE 0.6 0.7 +0.1 +10.8% REMINYL 12.8 13.0 +0.1 +1.0% AZILECT- 0.5 +0.5 NA Neuroscience 61.6 70.9 +9.4 +15.2% th * Sales of pantoprazole is not included in GI. As it is a key driver in emerging markets, its sales is included in the 4 Growth Driver, EM. Note: Effective from FY2018, sales of certain products in Japan are now disclosed on a net basis, deducting items such as discounts and rebates, in alignment with the global managerial approach applied to individual product sales. The change in disclosure of individual product sales has been revised retrospectively, with prior year figures reclassified on a net basis to enable year-on-year comparisons. This reclassification has no impact on Takeda's financial statements and does not represent a correction of prior year figures. 26
Table of Contents
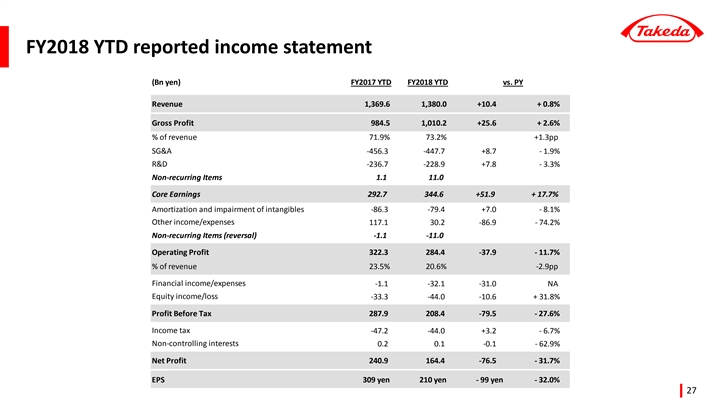
FY2018 YTD reported income statement (Bn yen) FY2017 YTD FY2018 YTD vs. PY Revenue 1,369.6 1,380.0 +10.4 + 0.8% Gross Profit 984.5 1,010.2 +25.6 + 2.6% % of revenue 71.9% 73.2% +1.3pp SG&A -456.3 -447.7 +8.7 - 1.9% R&D -236.7 -228.9 +7.8 - 3.3% Non-recurring Items 1.1 11.0 Core Earnings 292.7 344.6 +51.9 + 17.7% Amortization and impairment of intangibles -86.3 -79.4 +7.0 - 8.1% Other income/expenses 117.1 30.2 -86.9 - 74.2% Non-recurring Items (reversal) -1.1 -11.0 Operating Profit 322.3 284.4 -37.9 - 11.7% % of revenue 23.5% 20.6% -2.9pp Financial income/expenses -1.1 -32.1 -31.0 NA Equity income/loss -33.3 -44.0 -10.6 + 31.8% Profit Before Tax 287.9 208.4 -79.5 - 27.6% Income tax -47.2 -44.0 +3.2 - 6.7% Non-controlling interests 0.2 0.1 -0.1 - 62.9% Net Profit 240.9 164.4 -76.5 - 31.7% EPS 309 yen 210 yen - 99 yen - 32.0% 27 FY2018 YTD reported income statement (Bn yen) FY2017 YTD FY2018 YTD vs. PY Revenue 1,369.6 1,380.0 +10.4 + 0.8% Gross Profit 984.5 1,010.2 +25.6 + 2.6% % of revenue 71.9% 73.2% +1.3pp SG&A -456.3 -447.7 +8.7 - 1.9% R&D -236.7 -228.9 +7.8 - 3.3% Non-recurring Items 1.1 11.0 Core Earnings 292.7 344.6 +51.9 + 17.7% Amortization and impairment of intangibles -86.3 -79.4 +7.0 - 8.1% Other income/expenses 117.1 30.2 -86.9 - 74.2% Non-recurring Items (reversal) -1.1 -11.0 Operating Profit 322.3 284.4 -37.9 - 11.7% % of revenue 23.5% 20.6% -2.9pp Financial income/expenses -1.1 -32.1 -31.0 NA Equity income/loss -33.3 -44.0 -10.6 + 31.8% Profit Before Tax 287.9 208.4 -79.5 - 27.6% Income tax -47.2 -44.0 +3.2 - 6.7% Non-controlling interests 0.2 0.1 -0.1 - 62.9% Net Profit 240.9 164.4 -76.5 - 31.7% EPS 309 yen 210 yen - 99 yen - 32.0% 27
Table of Contents
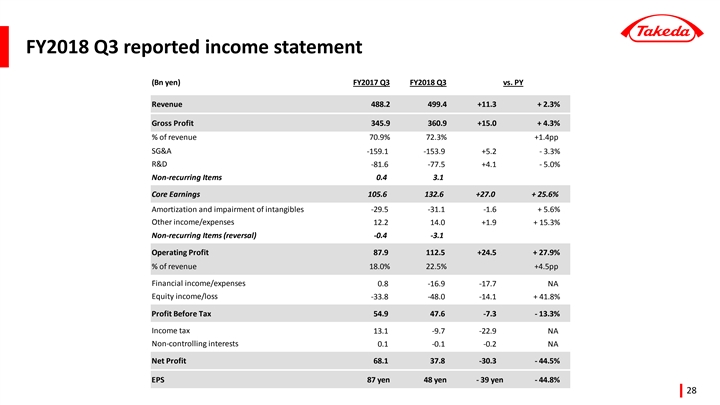
FY2018 Q3 reported income statement (Bn yen) FY2017 Q3 FY2018 Q3 vs. PY Revenue 488.2 499.4 +11.3 + 2.3% Gross Profit 345.9 360.9 +15.0 + 4.3% % of revenue 70.9% 72.3% +1.4pp SG&A -159.1 -153.9 +5.2 - 3.3% R&D -81.6 -77.5 +4.1 - 5.0% Non-recurring Items 0.4 3.1 Core Earnings 105.6 132.6 +27.0 + 25.6% Amortization and impairment of intangibles -29.5 -31.1 -1.6 + 5.6% Other income/expenses 12.2 14.0 +1.9 + 15.3% Non-recurring Items (reversal) -0.4 -3.1 Operating Profit 87.9 112.5 +24.5 + 27.9% % of revenue 18.0% 22.5% +4.5pp Financial income/expenses 0.8 -16.9 -17.7 NA Equity income/loss -33.8 -48.0 -14.1 + 41.8% Profit Before Tax 54.9 47.6 -7.3 - 13.3% Income tax 13.1 -9.7 -22.9 NA Non-controlling interests 0.1 -0.1 -0.2 NA Net Profit 68.1 37.8 -30.3 - 44.5% EPS 87 yen 48 yen - 39 yen - 44.8% 28 FY2018 Q3 reported income statement (Bn yen) FY2017 Q3 FY2018 Q3 vs. PY Revenue 488.2 499.4 +11.3 + 2.3% Gross Profit 345.9 360.9 +15.0 + 4.3% % of revenue 70.9% 72.3% +1.4pp SG&A -159.1 -153.9 +5.2 - 3.3% R&D -81.6 -77.5 +4.1 - 5.0% Non-recurring Items 0.4 3.1 Core Earnings 105.6 132.6 +27.0 + 25.6% Amortization and impairment of intangibles -29.5 -31.1 -1.6 + 5.6% Other income/expenses 12.2 14.0 +1.9 + 15.3% Non-recurring Items (reversal) -0.4 -3.1 Operating Profit 87.9 112.5 +24.5 + 27.9% % of revenue 18.0% 22.5% +4.5pp Financial income/expenses 0.8 -16.9 -17.7 NA Equity income/loss -33.8 -48.0 -14.1 + 41.8% Profit Before Tax 54.9 47.6 -7.3 - 13.3% Income tax 13.1 -9.7 -22.9 NA Non-controlling interests 0.1 -0.1 -0.2 NA Net Profit 68.1 37.8 -30.3 - 44.5% EPS 87 yen 48 yen - 39 yen - 44.8% 28
Table of Contents
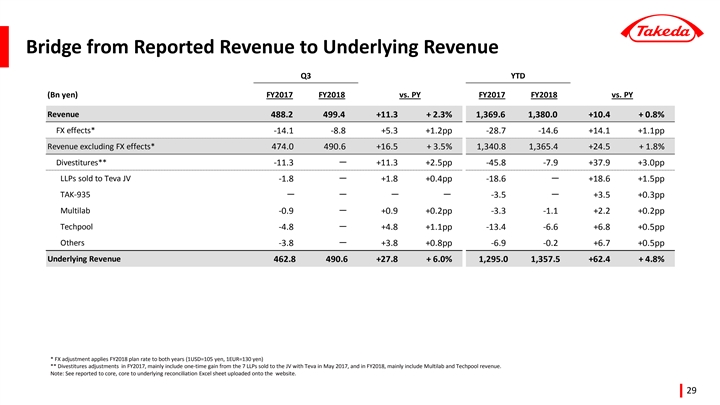
Bridge from Reported Revenue to Underlying Revenue Q3 YTD (Bn yen) FY2017 FY2018 vs. PY FY2017 FY2018 vs. PY Revenue 488.2 499.4 +11.3 + 2.3% 1,369.6 1,380.0 +10.4 + 0.8% FX effects* -14.1 -8.8 +5.3 +1.2pp -28.7 -14.6 +14.1 +1.1pp Revenue excluding FX effects* 474.0 490.6 +16.5 + 3.5% 1,340.8 1,365.4 +24.5 + 1.8% Divestitures** -11.3- +11.3 +2.5pp -45.8 -7.9 +37.9 +3.0pp LLPs sold to Teva JV -1.8- +1.8 +0.4pp -18.6- +18.6 +1.5pp TAK-935 ---- -3.5- +3.5 +0.3pp Multilab -0.9- +0.9 +0.2pp -3.3 -1.1 +2.2 +0.2pp Techpool -4.8- +4.8 +1.1pp -13.4 -6.6 +6.8 +0.5pp Others -3.8- +3.8 +0.8pp -6.9 -0.2 +6.7 +0.5pp Underlying Revenue 462.8 490.6 +27.8 + 6.0% 1,295.0 1,357.5 +62.4 + 4.8% * FX adjustment applies FY2018 plan rate to both years (1USD=105 yen, 1EUR=130 yen) ** Divestitures adjustments in FY2017, mainly include one-time gain from the 7 LLPs sold to the JV with Teva in May 2017, and in FY2018, mainly include Multilab and Techpool revenue. Note: See reported to core, core to underlying reconciliation Excel sheet uploaded onto the website. 29 Bridge from Reported Revenue to Underlying Revenue Q3 YTD (Bn yen) FY2017 FY2018 vs. PY FY2017 FY2018 vs. PY Revenue 488.2 499.4 +11.3 + 2.3% 1,369.6 1,380.0 +10.4 + 0.8% FX effects* -14.1 -8.8 +5.3 +1.2pp -28.7 -14.6 +14.1 +1.1pp Revenue excluding FX effects* 474.0 490.6 +16.5 + 3.5% 1,340.8 1,365.4 +24.5 + 1.8% Divestitures** -11.3- +11.3 +2.5pp -45.8 -7.9 +37.9 +3.0pp LLPs sold to Teva JV -1.8- +1.8 +0.4pp -18.6- +18.6 +1.5pp TAK-935 ---- -3.5- +3.5 +0.3pp Multilab -0.9- +0.9 +0.2pp -3.3 -1.1 +2.2 +0.2pp Techpool -4.8- +4.8 +1.1pp -13.4 -6.6 +6.8 +0.5pp Others -3.8- +3.8 +0.8pp -6.9 -0.2 +6.7 +0.5pp Underlying Revenue 462.8 490.6 +27.8 + 6.0% 1,295.0 1,357.5 +62.4 + 4.8% * FX adjustment applies FY2018 plan rate to both years (1USD=105 yen, 1EUR=130 yen) ** Divestitures adjustments in FY2017, mainly include one-time gain from the 7 LLPs sold to the JV with Teva in May 2017, and in FY2018, mainly include Multilab and Techpool revenue. Note: See reported to core, core to underlying reconciliation Excel sheet uploaded onto the website. 29
Table of Contents
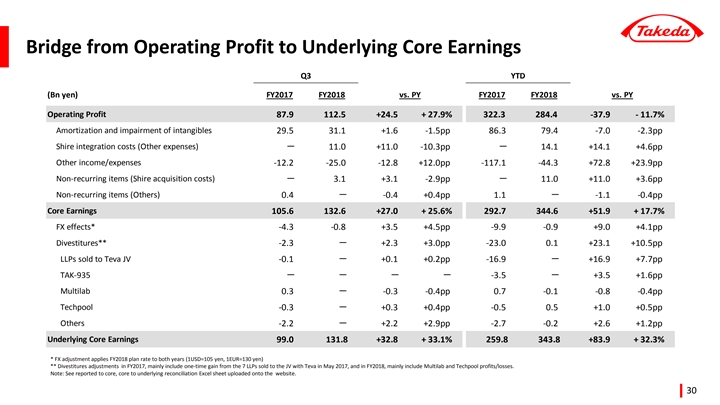
Bridge from Operating Profit to Underlying Core Earnings Q3 YTD (Bn yen) FY2017 FY2018 vs. PY FY2017 FY2018 vs. PY Operating Profit 87.9 112.5 +24.5 + 27.9% 322.3 284.4 -37.9 - 11.7% Amortization and impairment of intangibles 29.5 31.1 +1.6 -1.5pp 86.3 79.4 -7.0 -2.3pp Shire integration costs (Other expenses) - 11.0 +11.0 -10.3pp- 14.1 +14.1 +4.6pp Other income/expenses -12.2 -25.0 -12.8 +12.0pp -117.1 -44.3 +72.8 +23.9pp Non-recurring items (Shire acquisition costs) - 3.1 +3.1 -2.9pp- 11.0 +11.0 +3.6pp Non-recurring items (Others) 0.4- -0.4 +0.4pp 1.1 - -1.1 -0.4pp Core Earnings 105.6 132.6 +27.0 + 25.6% 292.7 344.6 +51.9 + 17.7% FX effects* -4.3 -0.8 +3.5 +4.5pp -9.9 -0.9 +9.0 +4.1pp Divestitures** -2.3- +2.3 +3.0pp -23.0 0.1 +23.1 +10.5pp LLPs sold to Teva JV -0.1- +0.1 +0.2pp -16.9 - +16.9 +7.7pp TAK-935---- -3.5 - +3.5 +1.6pp Multilab 0.3- -0.3 -0.4pp 0.7 -0.1 -0.8 -0.4pp Techpool -0.3- +0.3 +0.4pp -0.5 0.5 +1.0 +0.5pp Others -2.2- +2.2 +2.9pp -2.7 -0.2 +2.6 +1.2pp Underlying Core Earnings 99.0 131.8 +32.8 + 33.1% 259.8 343.8 +83.9 + 32.3% * FX adjustment applies FY2018 plan rate to both years (1USD=105 yen, 1EUR=130 yen) ** Divestitures adjustments in FY2017, mainly include one-time gain from the 7 LLPs sold to the JV with Teva in May 2017, and in FY2018, mainly include Multilab and Techpool profits/losses. Note: See reported to core, core to underlying reconciliation Excel sheet uploaded onto the website. 30 Bridge from Operating Profit to Underlying Core Earnings Q3 YTD (Bn yen) FY2017 FY2018 vs. PY FY2017 FY2018 vs. PY Operating Profit 87.9 112.5 +24.5 + 27.9% 322.3 284.4 -37.9 - 11.7% Amortization and impairment of intangibles 29.5 31.1 +1.6 -1.5pp 86.3 79.4 -7.0 -2.3pp Shire integration costs (Other expenses) - 11.0 +11.0 -10.3pp- 14.1 +14.1 +4.6pp Other income/expenses -12.2 -25.0 -12.8 +12.0pp -117.1 -44.3 +72.8 +23.9pp Non-recurring items (Shire acquisition costs) - 3.1 +3.1 -2.9pp- 11.0 +11.0 +3.6pp Non-recurring items (Others) 0.4- -0.4 +0.4pp 1.1 - -1.1 -0.4pp Core Earnings 105.6 132.6 +27.0 + 25.6% 292.7 344.6 +51.9 + 17.7% FX effects* -4.3 -0.8 +3.5 +4.5pp -9.9 -0.9 +9.0 +4.1pp Divestitures** -2.3- +2.3 +3.0pp -23.0 0.1 +23.1 +10.5pp LLPs sold to Teva JV -0.1- +0.1 +0.2pp -16.9 - +16.9 +7.7pp TAK-935---- -3.5 - +3.5 +1.6pp Multilab 0.3- -0.3 -0.4pp 0.7 -0.1 -0.8 -0.4pp Techpool -0.3- +0.3 +0.4pp -0.5 0.5 +1.0 +0.5pp Others -2.2- +2.2 +2.9pp -2.7 -0.2 +2.6 +1.2pp Underlying Core Earnings 99.0 131.8 +32.8 + 33.1% 259.8 343.8 +83.9 + 32.3% * FX adjustment applies FY2018 plan rate to both years (1USD=105 yen, 1EUR=130 yen) ** Divestitures adjustments in FY2017, mainly include one-time gain from the 7 LLPs sold to the JV with Teva in May 2017, and in FY2018, mainly include Multilab and Techpool profits/losses. Note: See reported to core, core to underlying reconciliation Excel sheet uploaded onto the website. 30
Table of Contents
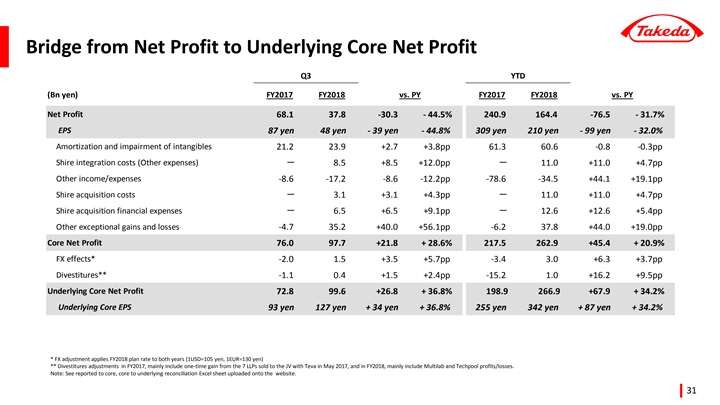
Bridge from Net Profit to Underlying Core Net Profit Q3 YTD (Bn yen) FY2017 FY2018 vs. PY FY2017 FY2018 vs. PY Net Profit 68.1 37.8 -30.3 - 44.5% 240.9 164.4 -76.5 - 31.7% EPS 87 yen 48 yen - 39 yen - 44.8% 309 yen 210 yen - 99 yen - 32.0% Amortization and impairment of intangibles 21.2 23.9 +2.7 +3.8pp 61.3 60.6 -0.8 -0.3pp Shire integration costs (Other expenses) - 8.5 +8.5 +12.0pp- 11.0 +11.0 +4.7pp Other income/expenses -8.6 -17.2 -8.6 -12.2pp -78.6 -34.5 +44.1 +19.1pp Shire acquisition costs - 3.1 +3.1 +4.3pp- 11.0 +11.0 +4.7pp Shire acquisition financial expenses- 6.5 +6.5 +9.1pp- 12.6 +12.6 +5.4pp Other exceptional gains and losses -4.7 35.2 +40.0 +56.1pp -6.2 37.8 +44.0 +19.0pp Core Net Profit 76.0 97.7 +21.8 + 28.6% 217.5 262.9 +45.4 + 20.9% FX effects* -2.0 1.5 +3.5 +5.7pp -3.4 3.0 +6.3 +3.7pp Divestitures** -1.1 0.4 +1.5 +2.4pp -15.2 1.0 +16.2 +9.5pp Underlying Core Net Profit 72.8 99.6 +26.8 + 36.8% 198.9 266.9 +67.9 + 34.2% Underlying Core EPS 93 yen 127 yen + 34 yen + 36.8% 255 yen 342 yen + 87 yen + 34.2% * FX adjustment applies FY2018 plan rate to both years (1USD=105 yen, 1EUR=130 yen) ** Divestitures adjustments in FY2017, mainly include one-time gain from the 7 LLPs sold to the JV with Teva in May 2017, and in FY2018, mainly include Multilab and Techpool profits/losses. Note: See reported to core, core to underlying reconciliation Excel sheet uploaded onto the website. 31 Bridge from Net Profit to Underlying Core Net Profit Q3 YTD (Bn yen) FY2017 FY2018 vs. PY FY2017 FY2018 vs. PY Net Profit 68.1 37.8 -30.3 - 44.5% 240.9 164.4 -76.5 - 31.7% EPS 87 yen 48 yen - 39 yen - 44.8% 309 yen 210 yen - 99 yen - 32.0% Amortization and impairment of intangibles 21.2 23.9 +2.7 +3.8pp 61.3 60.6 -0.8 -0.3pp Shire integration costs (Other expenses) - 8.5 +8.5 +12.0pp- 11.0 +11.0 +4.7pp Other income/expenses -8.6 -17.2 -8.6 -12.2pp -78.6 -34.5 +44.1 +19.1pp Shire acquisition costs - 3.1 +3.1 +4.3pp- 11.0 +11.0 +4.7pp Shire acquisition financial expenses- 6.5 +6.5 +9.1pp- 12.6 +12.6 +5.4pp Other exceptional gains and losses -4.7 35.2 +40.0 +56.1pp -6.2 37.8 +44.0 +19.0pp Core Net Profit 76.0 97.7 +21.8 + 28.6% 217.5 262.9 +45.4 + 20.9% FX effects* -2.0 1.5 +3.5 +5.7pp -3.4 3.0 +6.3 +3.7pp Divestitures** -1.1 0.4 +1.5 +2.4pp -15.2 1.0 +16.2 +9.5pp Underlying Core Net Profit 72.8 99.6 +26.8 + 36.8% 198.9 266.9 +67.9 + 34.2% Underlying Core EPS 93 yen 127 yen + 34 yen + 36.8% 255 yen 342 yen + 87 yen + 34.2% * FX adjustment applies FY2018 plan rate to both years (1USD=105 yen, 1EUR=130 yen) ** Divestitures adjustments in FY2017, mainly include one-time gain from the 7 LLPs sold to the JV with Teva in May 2017, and in FY2018, mainly include Multilab and Techpool profits/losses. Note: See reported to core, core to underlying reconciliation Excel sheet uploaded onto the website. 31
Table of Contents
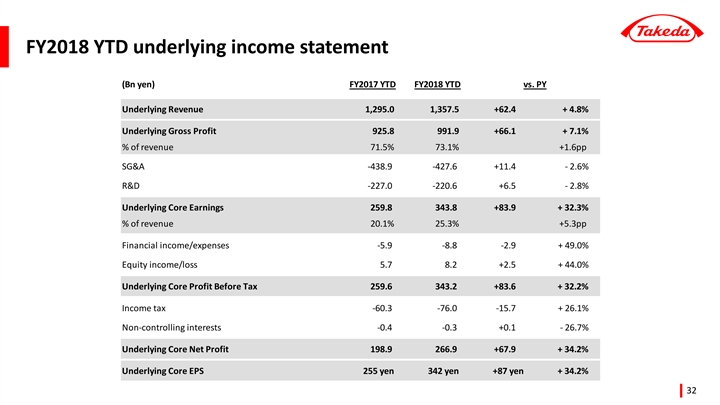
FY2018 YTD underlying income statement (Bn yen) FY2017 YTD FY2018 YTD vs. PY Underlying Revenue 1,295.0 1,357.5 +62.4 + 4.8% Underlying Gross Profit 925.8 991.9 +66.1 + 7.1% % of revenue 71.5% 73.1% +1.6pp SG&A -438.9 -427.6 +11.4 - 2.6% R&D -227.0 -220.6 +6.5 - 2.8% Underlying Core Earnings 259.8 343.8 +83.9 + 32.3% % of revenue 20.1% 25.3% +5.3pp Financial income/expenses -5.9 -8.8 -2.9 + 49.0% Equity income/loss 5.7 8.2 +2.5 + 44.0% Underlying Core Profit Before Tax 259.6 343.2 +83.6 + 32.2% Income tax -60.3 -76.0 -15.7 + 26.1% Non-controlling interests -0.4 -0.3 +0.1 - 26.7% Underlying Core Net Profit 198.9 266.9 +67.9 + 34.2% Underlying Core EPS 255 yen 342 yen +87 yen + 34.2% 32 FY2018 YTD underlying income statement (Bn yen) FY2017 YTD FY2018 YTD vs. PY Underlying Revenue 1,295.0 1,357.5 +62.4 + 4.8% Underlying Gross Profit 925.8 991.9 +66.1 + 7.1% % of revenue 71.5% 73.1% +1.6pp SG&A -438.9 -427.6 +11.4 - 2.6% R&D -227.0 -220.6 +6.5 - 2.8% Underlying Core Earnings 259.8 343.8 +83.9 + 32.3% % of revenue 20.1% 25.3% +5.3pp Financial income/expenses -5.9 -8.8 -2.9 + 49.0% Equity income/loss 5.7 8.2 +2.5 + 44.0% Underlying Core Profit Before Tax 259.6 343.2 +83.6 + 32.2% Income tax -60.3 -76.0 -15.7 + 26.1% Non-controlling interests -0.4 -0.3 +0.1 - 26.7% Underlying Core Net Profit 198.9 266.9 +67.9 + 34.2% Underlying Core EPS 255 yen 342 yen +87 yen + 34.2% 32
Table of Contents
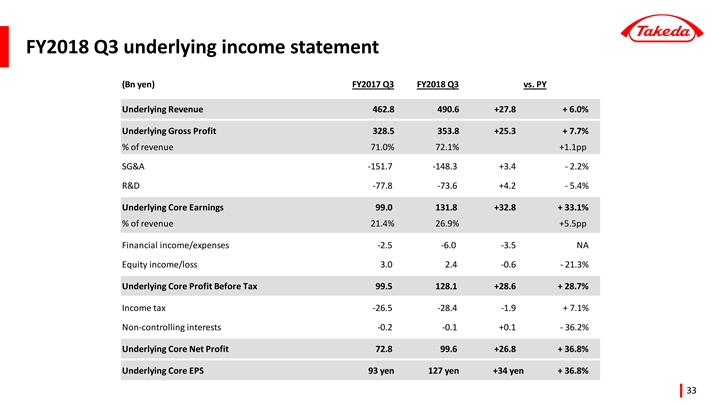
FY2018 Q3 underlying income statement (Bn yen) FY2017 Q3 FY2018 Q3 vs. PY Underlying Revenue 462.8 490.6 +27.8 + 6.0% Underlying Gross Profit 328.5 353.8 +25.3 + 7.7% % of revenue 71.0% 72.1% +1.1pp SG&A -151.7 -148.3 +3.4 - 2.2% R&D -77.8 -73.6 +4.2 - 5.4% Underlying Core Earnings 99.0 131.8 +32.8 + 33.1% % of revenue 21.4% 26.9% +5.5pp Financial income/expenses -2.5 -6.0 -3.5 NA Equity income/loss 3.0 2.4 -0.6 - 21.3% Underlying Core Profit Before Tax 99.5 128.1 +28.6 + 28.7% Income tax -26.5 -28.4 -1.9 + 7.1% Non-controlling interests -0.2 -0.1 +0.1 - 36.2% Underlying Core Net Profit 72.8 99.6 +26.8 + 36.8% Underlying Core EPS 93 yen 127 yen +34 yen + 36.8% 33 FY2018 Q3 underlying income statement (Bn yen) FY2017 Q3 FY2018 Q3 vs. PY Underlying Revenue 462.8 490.6 +27.8 + 6.0% Underlying Gross Profit 328.5 353.8 +25.3 + 7.7% % of revenue 71.0% 72.1% +1.1pp SG&A -151.7 -148.3 +3.4 - 2.2% R&D -77.8 -73.6 +4.2 - 5.4% Underlying Core Earnings 99.0 131.8 +32.8 + 33.1% % of revenue 21.4% 26.9% +5.5pp Financial income/expenses -2.5 -6.0 -3.5 NA Equity income/loss 3.0 2.4 -0.6 - 21.3% Underlying Core Profit Before Tax 99.5 128.1 +28.6 + 28.7% Income tax -26.5 -28.4 -1.9 + 7.1% Non-controlling interests -0.2 -0.1 +0.1 - 36.2% Underlying Core Net Profit 72.8 99.6 +26.8 + 36.8% Underlying Core EPS 93 yen 127 yen +34 yen + 36.8% 33
Table of Contents
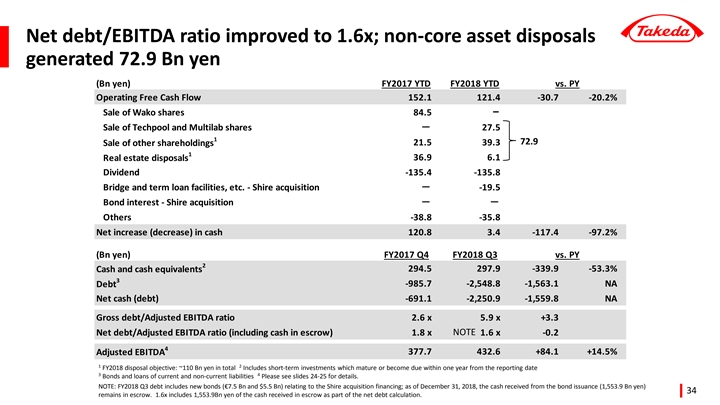
Net debt/EBITDA ratio improved to 1.6x; non-core asset disposals generated 72.9 Bn yen (Bn yen) FY2017 YTD FY2018 YTD vs. PY Operating Free Cash Flow 152.1 121.4 -30.7 -20.2% - Sale of Wako shares 84.5 Sale of Techpool and Multilab shares- 27.5 1 72.9 Sale of other shareholdings 21.5 39.3 1 36.9 6.1 Real estate disposals Dividend -135.4 -135.8 Bridge and term loan facilities, etc. - Shire acquisition- -19.5 Bond interest - Shire acquisition-- Others -38.8 -35.8 Net increase (decrease) in cash 120.8 3.4 -117.4 -97.2% (Bn yen) FY2017 Q4 FY2018 Q3 vs. PY 2 Cash and cash equivalents 294.5 297.9 -339.9 -53.3% 3 Debt -985.7 -2,548.8 -1,563.1 NA Net cash (debt) -691.1 -2,250.9 -1,559.8 NA Gross debt/Adjusted EBITDA ratio 2.6 x 5.9 x +3.3 NOTE Net debt/Adjusted EBITDA ratio (including cash in escrow) 1.8 x 1.6 x -0.2 4 Adjusted EBITDA 377.7 432.6 +84.1 +14.5% 1 2 FY2018 disposal objective: ~110 Bn yen in total Includes short-term investments which mature or become due within one year from the reporting date 3 4 Bonds and loans of current and non-current liabilities Please see slides 24-25 for details. NOTE: FY2018 Q3 debt includes new bonds (€7.5 Bn and $5.5 Bn) relating to the Shire acquisition financing; as of December 31, 2018, the cash received from the bond issuance (1,553.9 Bn yen) 34 remains in escrow. 1.6x includes 1,553.9Bn yen of the cash received in escrow as part of the net debt calculation. Net debt/EBITDA ratio improved to 1.6x; non-core asset disposals generated 72.9 Bn yen (Bn yen) FY2017 YTD FY2018 YTD vs. PY Operating Free Cash Flow 152.1 121.4 -30.7 -20.2% - Sale of Wako shares 84.5 Sale of Techpool and Multilab shares- 27.5 1 72.9 Sale of other shareholdings 21.5 39.3 1 36.9 6.1 Real estate disposals Dividend -135.4 -135.8 Bridge and term loan facilities, etc. - Shire acquisition- -19.5 Bond interest - Shire acquisition-- Others -38.8 -35.8 Net increase (decrease) in cash 120.8 3.4 -117.4 -97.2% (Bn yen) FY2017 Q4 FY2018 Q3 vs. PY 2 Cash and cash equivalents 294.5 297.9 -339.9 -53.3% 3 Debt -985.7 -2,548.8 -1,563.1 NA Net cash (debt) -691.1 -2,250.9 -1,559.8 NA Gross debt/Adjusted EBITDA ratio 2.6 x 5.9 x +3.3 NOTE Net debt/Adjusted EBITDA ratio (including cash in escrow) 1.8 x 1.6 x -0.2 4 Adjusted EBITDA 377.7 432.6 +84.1 +14.5% 1 2 FY2018 disposal objective: ~110 Bn yen in total Includes short-term investments which mature or become due within one year from the reporting date 3 4 Bonds and loans of current and non-current liabilities Please see slides 24-25 for details. NOTE: FY2018 Q3 debt includes new bonds (€7.5 Bn and $5.5 Bn) relating to the Shire acquisition financing; as of December 31, 2018, the cash received from the bond issuance (1,553.9 Bn yen) 34 remains in escrow. 1.6x includes 1,553.9Bn yen of the cash received in escrow as part of the net debt calculation.
Table of Contents
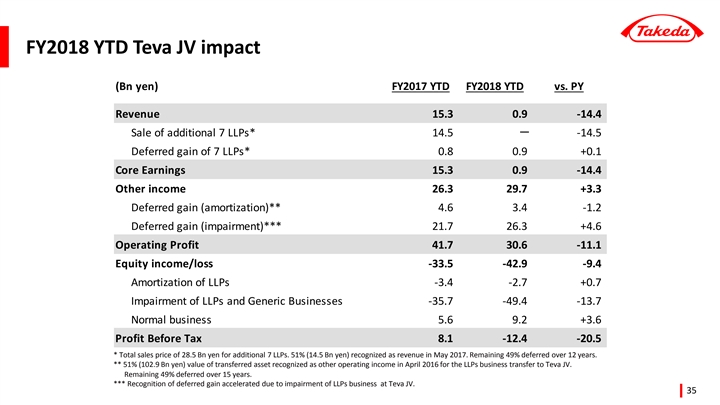
FY2018 YTD Teva JV impact (Bn yen) FY2017 YTD FY2018 YTD vs. PY Revenue 15.3 0.9 -14.4 Sale of additional 7 LLPs* 14.5- -14.5 Deferred gain of 7 LLPs* 0.8 0.9 +0.1 Core Earnings 15.3 0.9 -14.4 Other income 26.3 29.7 +3.3 Deferred gain (amortization)** 4.6 3.4 -1.2 Deferred gain (impairment)*** 21.7 26.3 +4.6 Operating Profit 41.7 30.6 -11.1 Equity income/loss -33.5 -42.9 -9.4 Amortization of LLPs -3.4 -2.7 +0.7 Impairment of LLPs and Generic Businesses -35.7 -49.4 -13.7 Normal business 5.6 9.2 +3.6 Profit Before Tax 8.1 -12.4 -20.5 * Total sales price of 28.5 Bn yen for additional 7 LLPs. 51% (14.5 Bn yen) recognized as revenue in May 2017. Remaining 49% deferred over 12 years. ** 51% (102.9 Bn yen) value of transferred asset recognized as other operating income in April 2016 for the LLPs business transfer to Teva JV. Remaining 49% deferred over 15 years. *** Recognition of deferred gain accelerated due to impairment of LLPs business at Teva JV. 35 FY2018 YTD Teva JV impact (Bn yen) FY2017 YTD FY2018 YTD vs. PY Revenue 15.3 0.9 -14.4 Sale of additional 7 LLPs* 14.5- -14.5 Deferred gain of 7 LLPs* 0.8 0.9 +0.1 Core Earnings 15.3 0.9 -14.4 Other income 26.3 29.7 +3.3 Deferred gain (amortization)** 4.6 3.4 -1.2 Deferred gain (impairment)*** 21.7 26.3 +4.6 Operating Profit 41.7 30.6 -11.1 Equity income/loss -33.5 -42.9 -9.4 Amortization of LLPs -3.4 -2.7 +0.7 Impairment of LLPs and Generic Businesses -35.7 -49.4 -13.7 Normal business 5.6 9.2 +3.6 Profit Before Tax 8.1 -12.4 -20.5 * Total sales price of 28.5 Bn yen for additional 7 LLPs. 51% (14.5 Bn yen) recognized as revenue in May 2017. Remaining 49% deferred over 12 years. ** 51% (102.9 Bn yen) value of transferred asset recognized as other operating income in April 2016 for the LLPs business transfer to Teva JV. Remaining 49% deferred over 15 years. *** Recognition of deferred gain accelerated due to impairment of LLPs business at Teva JV. 35
Table of Contents
Glossary of Abbreviations AD Alzheimer’s disease EE H erosive esophagitis healing LCM lifecycle management RCC renal cell cancer ADC antibody drug conjugate EE M erosive esophagitis maintenance mAb monoclonal antibody RTK receptor tyrosine kinase ADHD attention deficit hyperactivity disorder EFI enteral feeding intolerance MAOB monoamine oxidase B sALCL systemic anaplastic large cell lymphoma ALK anaplastic lymphoma kinase EGFR epidermal growth factor receptor MLD metachromatic leukodystrophy SBS short bowel syndrome ALS amyotrophic lateral sclerosis EOE eosinophilic esophagitis NAE NEDD8 activating enzyme SC subcutaneous formulation AML acute myeloid leukemia ESCC esophageal squamous-cell carcinoma NASH non-alcoholic steatohepatitis SCT stem cell transplant AMR antibody mediated rejection FL front line ND newly diagnosed SCZ schizophrenia ASCT autologous stem cell transplant FLT-3 FMS-like tyrosine kinase 3 NDA new drug application SLE systemic lupus erythematosus ARD acid-related diseases FSI first subject in Neg negative sq squamous BTK Bruton's tyrosine kinase GCC guanylyl cyclase C NERD non-erosive reflux disease SR steroid refractory BBB blood brain barrier GERD gastroesophageal reflux disease NF new formulation SR-GvHD steroid refractory acute graft vs host disease BOS budesonide oral suspension GI gastrointestinal NK natural killer STING stimulator of interferon genes CAR-T Chimeric antigen receptor-T GnRH gonadotropin-releasing hormone NME new molecular entity SUMO small ubiquitin-related modifier CD Crohn's disease GU gastric ulcer NSCLC non-small cell lung cancer SYK spleen tyrosine kinase CHAWI congenital hemophilia A with inhibitors GvHD graft versus host disease NSCT non stem cell transplant TESD treatment emergent sexual dysfunction CIAS cognitive impairment associated with schizophrenia HAE hereditary angioedema NS negative symptoms CIC chronic idiopathic constipation H2H head to head OIC opioid induced constipation CIDP chronic inflammatory demyelinating polyradiculoneuropathy HCC hepatocellular carcinoma ORR overall response rate CML chronic myeloid leukemia HemA hemophilia A PARP poly (ADP-ribose) polymerase CMML chronic myelomonocytic leukemia HER2 human epidermal growth factor receptor 2 PBS phosphate buffered saline CSF cerebrospinal fluid HL Hodgkin's lymphoma PCAB potassium competitive acid blocker CNS central nervous system HR MDS high-risk myelodysplastic syndromes PFIC progressive familial intrahepatic cholestasis Philadelphia chromosome-positive acute CRL complete response letter IBD inflammatory bowel disease Ph+ ALL lymphoblastic leukemia CTCL cutaneous T-cell lymphoma IBS-C irritable bowel syndrome with constipation PID primary immunodeficiency CTTP congenital thrombotic thrombocytopenic purpura IND investigational new drug PPI proton pump inhibitor DAAO D-amino acid oxidase I/O immuno-oncology PK pharmacokinetics DED dry eye disease IV intravenous POC proof of concept DLBCL diffuse large B-cell lymphoma iPSC induced pluripotent stem cells POI post-operative ileus DM diabetes mellitus LBD Lewy body dementia PTCL peripheral T-cell lymphoma DU duodenal ulcer LB AML low-blast acute myeloid leukemia R/R relapsed/refractory Dx diagnosis LSD1 Lysine specific demethylase 1 RA rheumatoid arthritis 36 Glossary of Abbreviations AD Alzheimer’s disease EE H erosive esophagitis healing LCM lifecycle management RCC renal cell cancer ADC antibody drug conjugate EE M erosive esophagitis maintenance mAb monoclonal antibody RTK receptor tyrosine kinase ADHD attention deficit hyperactivity disorder EFI enteral feeding intolerance MAOB monoamine oxidase B sALCL systemic anaplastic large cell lymphoma ALK anaplastic lymphoma kinase EGFR epidermal growth factor receptor MLD metachromatic leukodystrophy SBS short bowel syndrome ALS amyotrophic lateral sclerosis EOE eosinophilic esophagitis NAE NEDD8 activating enzyme SC subcutaneous formulation AML acute myeloid leukemia ESCC esophageal squamous-cell carcinoma NASH non-alcoholic steatohepatitis SCT stem cell transplant AMR antibody mediated rejection FL front line ND newly diagnosed SCZ schizophrenia ASCT autologous stem cell transplant FLT-3 FMS-like tyrosine kinase 3 NDA new drug application SLE systemic lupus erythematosus ARD acid-related diseases FSI first subject in Neg negative sq squamous BTK Bruton's tyrosine kinase GCC guanylyl cyclase C NERD non-erosive reflux disease SR steroid refractory BBB blood brain barrier GERD gastroesophageal reflux disease NF new formulation SR-GvHD steroid refractory acute graft vs host disease BOS budesonide oral suspension GI gastrointestinal NK natural killer STING stimulator of interferon genes CAR-T Chimeric antigen receptor-T GnRH gonadotropin-releasing hormone NME new molecular entity SUMO small ubiquitin-related modifier CD Crohn's disease GU gastric ulcer NSCLC non-small cell lung cancer SYK spleen tyrosine kinase CHAWI congenital hemophilia A with inhibitors GvHD graft versus host disease NSCT non stem cell transplant TESD treatment emergent sexual dysfunction CIAS cognitive impairment associated with schizophrenia HAE hereditary angioedema NS negative symptoms CIC chronic idiopathic constipation H2H head to head OIC opioid induced constipation CIDP chronic inflammatory demyelinating polyradiculoneuropathy HCC hepatocellular carcinoma ORR overall response rate CML chronic myeloid leukemia HemA hemophilia A PARP poly (ADP-ribose) polymerase CMML chronic myelomonocytic leukemia HER2 human epidermal growth factor receptor 2 PBS phosphate buffered saline CSF cerebrospinal fluid HL Hodgkin's lymphoma PCAB potassium competitive acid blocker CNS central nervous system HR MDS high-risk myelodysplastic syndromes PFIC progressive familial intrahepatic cholestasis Philadelphia chromosome-positive acute CRL complete response letter IBD inflammatory bowel disease Ph+ ALL lymphoblastic leukemia CTCL cutaneous T-cell lymphoma IBS-C irritable bowel syndrome with constipation PID primary immunodeficiency CTTP congenital thrombotic thrombocytopenic purpura IND investigational new drug PPI proton pump inhibitor DAAO D-amino acid oxidase I/O immuno-oncology PK pharmacokinetics DED dry eye disease IV intravenous POC proof of concept DLBCL diffuse large B-cell lymphoma iPSC induced pluripotent stem cells POI post-operative ileus DM diabetes mellitus LBD Lewy body dementia PTCL peripheral T-cell lymphoma DU duodenal ulcer LB AML low-blast acute myeloid leukemia R/R relapsed/refractory Dx diagnosis LSD1 Lysine specific demethylase 1 RA rheumatoid arthritis 36
Table of Contents
Table of Contents
| Better Health, Brighter Future |


Takeda Pharmaceutical Company Limited (TSE code 4502)
Contact: Global Finance, IR
TEL:+81-3-3278-2306
https://www.takeda.com/
Quarterly Announcements / Presentations
https://www.takeda.com/investors/reports/
Table of Contents
Important Notice
For the purposes of this notice, “Databook” means this document, any oral presentation, any question and answer session and any written or oral material discussed or distributed by Takeda Pharmaceutical Company Limited (“Takeda”) regarding Databook. This Databook (including any oral briefing and anyquestion-and-answer in connection with it) is not intended to, and does not constitute, represent or form part of any offer, invitation or solicitation of any offer to purchase, otherwise acquire, subscribe for, exchange, sell or otherwise dispose of, any securities or the solicitation of any vote or approval in any jurisdiction. No shares or other securities are being offered to the public by means of this Databook. No offering of securities shall be made in the United States except pursuant to registration under the U.S. Securities Act of 1933, as amended, or an exemption therefrom. This Databook is being given (together with any further information which may be provided to the recipient) on the condition that it is for use by the recipient for information purposes only (and not for the evaluation of any investment, acquisition, disposal or any other transaction). Any failure to comply with these restrictions may constitute a violation of applicable securities laws.
Unless specified otherwise, no statement in this Databook (including any statement of estimated synergies) is intended as a profit forecast or estimate for any period and no statement in this Databook should be interpreted to mean that earnings or earnings per share for Takeda for the current or future financial years would necessarily match or exceed the historical published earnings per share for Takeda.
The companies in which Takeda directly and indirectly owns investments are separate entities. In this Databook, “Takeda” is sometimes used for convenience where references are made to Takeda and its subsidiaries in general. Likewise, the words “we”, “us” and “our” are also used to refer to subsidiaries in general or to those who work for them. These expressions are also used where no useful purpose is served by identifying the particular company or companies.
Forward-Looking Statements
This Databook and any materials distributed in connection with this Databook may contain forward-looking statements, beliefs or opinions regarding Takeda’s future business, future position and results of operations, including estimates, forecasts, targets and plans for Takeda. Without limitation, forward looking statements often include the words such as “targets”, “plans”, “believes”, “hopes”, “continues”, “expects”, “aims”, “intends”, “will”, “may”, “should”, “would”, “could” “anticipates”, “estimates”, “projects” or words or terms of similar substance or the negative thereof. Any forward-looking statements in this document are based on the current assumptions and beliefs of Takeda in light of the information currently available to it. Such forward-looking statements do not represent any guarantee by Takeda or its management of future performance and involve known and unknown risks, uncertainties and other factors, including but not limited to: the economic circumstances surrounding Takeda’s business, including general economic conditions in Japan, the United States and worldwide; competitive pressures and developments; applicable laws and regulations; the success of or failure of product development programs; decisions of regulatory authorities and the timing thereof; changes in exchange rates; claims or concerns regarding the safety or efficacy of marketed products or products candidates; and post-merger integration with acquired companies, any of which may cause Takeda’s actual results, performance, achievements or financial position to be materially different from any future results, performance, achievements or financial position expressed or implied by such forward-looking statements. For more information on these and other factors which may affect Takeda’s results, performance, achievements, or financial position, see “Item 3. Key Information – D. Risk Factors” in Takeda’s Registration Statement on Form20-F filed with the U.S. Securities and Exchange Commission, available on Takeda’s website at:https://www.takeda.com/investors/reports/sec-filings/ or atwww.sec.gov. Neither Takeda nor its management gives any assurances that the expectations expressed in these forward-looking statements will turn out to be correct, and actual results, performance or achievements could materially differ from expectations. Persons receiving this Databook should not place undue reliance on forward looking statements. Takeda undertakes no obligation to update any of the forward-looking statements contained in this Databook or any other forward-looking statements it may make. Past performance is not an indicator of future results and the results of Takeda in this Databook may not be indicative of, and are not an estimate, forecast or projection of Takeda’s future results.
While Takeda plans to announce an earnings forecast which includes an estimated financial impact of the Shire acquisition once a reasonable financial estimate is determined, the consideration of the asset valuation as well as purchase price allocation, schedule and manner of amortization and depreciation for the business combination accounting will require more time. It is also difficult to estimate the effect on profit and loss since the completion of the acquisition to the end of the consolidated accounting period, nor the acquisition related costs for the full fiscal year with a reasonable level of accuracy at this time. Considering the sizable effect on the business results due to the acquisition, Takeda is not furnishing a new consolidated forecast in a provisional or partial way at this time. It is our objective to disclose a Shire acquisition post-close consolidated business forecast for the fiscal year once a holistic and reasonable earnings forecast can be determined.
CertainNon-IFRS Financial Measures
This Databook includes certain IFRS financial measures not presented in accordance with International Financial Reporting Standards (“IFRS”), including Underlying Revenue, Core Earnings, Underlying Core Earnings, Core Net Profit, Underlying Core Net Profit, Underlying Core EPS, Net Debt, EBITDA, Adjusted EBITDA and Operating Free Cash Flow. Takeda’s management evaluates results and makes operating and investment decisions using both IFRS andnon-IFRS measures included in this Databook. Thesenon-IFRS measures exclude certain income, cost and cash flow items which are included in, or are calculated differently from, the most closely comparable measures presented in accordance with IFRS. By including thesenon-IFRS measures, management intends to provide investors with additional information to further analyze Takeda’s performance, core results and underlying trends. Takeda’snon-IFRS measures are not prepared in accordance with IFRS and suchnon-IFRS measures should be considered a supplement to, and not a substitute for, measures prepared in accordance with IFRS (which we sometimes refer to as “reported” measures). Investors are encouraged to review the reconciliation ofnon-IFRS financial measures to their most directly comparable IFRS measures.
Further information on certain of Takeda’sNon-IFRS measures is posted on Takeda’s investor relations website athttps://www.takeda.com/investors/reports/quarterly-announcements/quarterly-announcements-2018/
Medical information
This Databook contains information about products that may not be available in all countries, or may be available under different trademarks, for different indications, in different dosages, or in different strengths. Nothing contained herein should be considered a solicitation, promotion or advertisement for any prescription drugs including the ones under development.
Table of Contents
Contents
I. Financial Results | 1 | |||
1. Revenue by Region | 1 | |||
◆ Consolidated Revenue | 1 | |||
◆ Consolidated Prescription Drugs Revenue | 1 | |||
◆ Prescription Drugs: Global major products’ sales | 3 | |||
2. Exchange Rate | 6 | |||
II. Pipeline | 7 | |||
1. Development Activities | 7-11 | |||
⬛ Oncology | 7 | |||
⬛ Gastroenterology | 8 | |||
⬛ Neuroscience | 9 | |||
⬛ Rare Diseases | 10 | |||
⬛ Plasma-Derived Therapies | 11 | |||
⬛ Vaccines | 11 | |||
⬛ Ophthalmology | 11 | |||
2. Recent progress in stage | 12 | |||
3. Discontinued projects | 12 | |||
4. Exploring Alternative Value Creation | 13 | |||
5. Main Research & Development collaborations | 14-17 | |||
⬛ Oncology | 14 | |||
⬛ Gastroenterology | 14 | |||
⬛ Neuroscience | 15 | |||
⬛ Rare Diseases | 15 | |||
⬛ Plasma-Derived Therapies | 16 | |||
⬛ Vaccines | 16 | |||
⬛ Other / Multiple Therapeutic Area | 17 | |||
⬛ Completed Partnerships | 18 | |||
⬛ Clinical study protocol summaries | 18 | |||
Appendix | 19 | |||
◆ Prescription Drugs: US major products’ sales (in US$) | 19 | |||
◆ Prescription Drugs: Japan major products’ sales | 21 | |||
◆ Consumer Healthcare: Japan major products’ sales | 23 | |||
◆ Underlying Core Reconciliation – FY2018 YTD & FY2017 YTD | 25 | |||
◆ Underlying Core Reconciliation – FY2018 Q3 & FY2017 Q3 | 26 | |||
◆ Reconciliation from net profit to EBITDA / Adjusted EBITDA | 27 | |||
Table of Contents
| (Billion JPY) | ||||||||||||||||||||||||||||
| FY15 | FY16 | FY17 | FY17 Q3 YTD | FY18 Q3 YTD | YOY | |||||||||||||||||||||||
Total revenue | 1,807.4 | 1,732.1 | 1,770.5 | 1,369.6 | 1,380.0 | 10.4 | 0.8 | % | ||||||||||||||||||||
|
|
|
|
|
|
|
|
|
|
|
|
|
| |||||||||||||||
Japan | 688.1 | 655.3 | 580.3 | 463.2 | 444.0 | -19.2 | -4.1 | % | ||||||||||||||||||||
<% of revenue> | <38.1 | %> | <37.8 | %> | <32.8 | %> | <33.8 | %> | <32.2 | %> | <-1.6pt | > | ||||||||||||||||
|
|
|
|
|
|
|
|
|
|
|
|
|
| |||||||||||||||
United States | 514.4 | 520.2 | 598.3 | 463.0 | 495.3 | 32.3 | 7.0 | % | ||||||||||||||||||||
<% of revenue> | <28.5 | %> | <30.0 | %> | <33.8 | %> | <33.8 | %> | <35.9 | %> | <2.1pt | > | ||||||||||||||||
|
|
|
|
|
|
|
|
|
|
|
|
|
| |||||||||||||||
Europe and Canada | 309.3 | 279.7 | 313.7 | 233.7 | 244.9 | 11.1 | 4.8 | % | ||||||||||||||||||||
<% of revenue> | <17.1 | %> | <16.1 | %> | <17.7 | %> | <17.1 | %> | <17.7 | %> | <0.7pt | > | ||||||||||||||||
|
|
|
|
|
|
|
|
|
|
|
|
|
| |||||||||||||||
Emerging Markets | 295.6 | 276.9 | 278.1 | 209.6 | 195.7 | -13.8 | -6.6 | % | ||||||||||||||||||||
<% of revenue> | <16.4 | %> | <16.0 | %> | <15.7 | %> | <15.3 | %> | <14.2 | %> | <-1.1pt | > | ||||||||||||||||
|
|
|
|
|
|
|
|
|
|
|
|
|
| |||||||||||||||
Russia/CIS | 61.8 | 57.5 | 68.2 | 56.0 | 44.3 | -11.7 | -20.9 | % | ||||||||||||||||||||
<% of revenue> | <3.4 | %> | <3.3 | %> | <3.9 | %> | <4.1 | %> | <3.2 | %> | <-0.9pt | > | ||||||||||||||||
Latin America | 68.4 | 72.5 | 75.7 | 56.1 | 54.5 | -1.5 | -2.8 | % | ||||||||||||||||||||
<% of revenue> | <3.8 | %> | <4.2 | %> | <4.3 | %> | <4.1 | %> | <4.0 | %> | <-0.1pt | > | ||||||||||||||||
Asia | 126.0 | 112.8 | 104.0 | 77.3 | 75.9 | -1.5 | -1.9 | % | ||||||||||||||||||||
<% of revenue> | <7.0 | %> | <6.5 | %> | <5.9 | %> | <5.6 | %> | <5.5 | %> | <-0.1pt | > | ||||||||||||||||
Other | 39.4 | 34.0 | 30.2 | 20.2 | 21.1 | 0.9 | 4.3 | % | ||||||||||||||||||||
<% of revenue> | <2.2 | %> | <2.0 | %> | <1.7 | %> | <1.5 | %> | <1.5 | %> | <0.1pt | > | ||||||||||||||||
|
|
|
|
|
|
|
|
|
|
|
|
|
| |||||||||||||||
Of which royalty / service income | 56.5 | 60.1 | 76.7 | 61.0 | 46.6 | -14.4 | -23.6 | % | ||||||||||||||||||||
|
|
|
|
|
|
|
|
|
|
|
|
|
| |||||||||||||||
| *1 | Revenue amount is classified into countries or regions based on the customer location. |
| *2 | Other region includes Middle East, Oceania and Africa. |
◆ Consolidated Prescription Drugs Revenue
| (Billion JPY) | ||||||||||||||||||||||||||||||||
| FY15 | FY16 | FY17 | FY17 Q3 YTD | FY18 Q3 YTD | YOY | Underlying Growth | ||||||||||||||||||||||||||
Total prescription drugs revenue | 1,648.7 | 1,568.9 | 1,691.5 | 1,305.9 | 1,330.4 | 24.5 | 1.9 | % | 6.2 | % | ||||||||||||||||||||||
|
|
|
|
|
|
|
|
|
|
|
|
|
|
|
| |||||||||||||||||
Japan | 541.7 | 504.7 | 501.4 | 399.5 | 394.5 | -5.0 | -1.3 | % | 4.9 | % | ||||||||||||||||||||||
United States | 511.0 | 516.7 | 598.3 | 463.0 | 495.3 | 32.3 | 7.0 | % | 8.5 | % | ||||||||||||||||||||||
Europe and Canada | 305.6 | 276.0 | 313.7 | 233.7 | 244.9 | 11.1 | 4.8 | % | 4.9 | % | ||||||||||||||||||||||
Emerging Markets | 290.4 | 271.5 | 278.1 | 209.6 | 195.7 | -13.9 | -6.6 | % | 5.1 | % | ||||||||||||||||||||||
|
|
|
|
|
|
|
|
|
|
|
|
|
|
|
| |||||||||||||||||
Russia/CIS | 61.8 | 57.5 | 68.2 | 56.0 | 44.3 | -11.7 | -20.9 | % | -13.7 | % | ||||||||||||||||||||||
Russia | 43.5 | 41.9 | 51.3 | 42.5 | 33.9 | -8.6 | -20.3 | % | -11.7 | % | ||||||||||||||||||||||
Latin America | 68.2 | 72.5 | 75.7 | 56.1 | 54.5 | -1.6 | -2.9 | % | 19.6 | % | ||||||||||||||||||||||
Brazil | 38.1 | 39.0 | 46.2 | 34.0 | 34.0 | -0.0 | -0.1 | % | 26.9 | % | ||||||||||||||||||||||
Asia | 121.2 | 107.8 | 104.0 | 77.3 | 75.9 | -1.5 | -1.9 | % | 8.2 | % | ||||||||||||||||||||||
China | 66.0 | 57.6 | 49.6 | 36.9 | 34.9 | -2.0 | -5.4 | % | 19.5 | % | ||||||||||||||||||||||
Other | 39.2 | 33.7 | 30.2 | 20.2 | 21.1 | 0.9 | 4.3 | % | 11.9 | % | ||||||||||||||||||||||
|
|
|
|
|
|
|
|
|
|
|
|
|
|
|
| |||||||||||||||||
Of which royalty / service income | 55.8 | 59.5 | 76.2 | 60.6 | 46.2 | -14.4 | -23.8 | % | 14.2 | % | ||||||||||||||||||||||
|
|
|
|
|
|
|
|
|
|
|
|
|
|
|
| |||||||||||||||||
Japan | 6.6 | 18.7 | 31.3 | 24.3 | 16.5 | -7.8 | -32.2 | % | 68.2 | % | ||||||||||||||||||||||
Overseas | 49.3 | 40.9 | 44.9 | 36.3 | 29.7 | -6.6 | -18.2 | % | -3.5 | % | ||||||||||||||||||||||
|
|
|
|
|
|
|
|
|
|
|
|
|
|
|
| |||||||||||||||||
Ratio of overseas prescription drugs revenue | 67.1 | % | 67.8 | % | 70.4 | % | 69.4 | % | 70.3 | % | 0.9pt | |||||||||||||||||||||
|
|
|
|
|
|
|
|
|
|
|
|
|
|
|
| |||||||||||||||||
| *1 | Revenue amount is classified into countries or regions based on the customer location. |
| *2 | Other region includes Middle East, Oceania and Africa. |
1
Table of Contents
◆ Consolidated Revenue (Quarterly)
| �� | ||||||||||||||||||||||||||||||||||||||||||||||||
| (Billion JPY) | ||||||||||||||||||||||||||||||||||||||||||||||||
| FY17 | FY18 | |||||||||||||||||||||||||||||||||||||||||||||||
| Q1 | Q2 | Q3 | Q4 | Q1 | YOY | Q2 | YOY | Q3 | YOY | Q4 | YOY | |||||||||||||||||||||||||||||||||||||
Total revenue | 448.2 | 433.2 | 488.2 | 401.0 | 449.8 | 0.4 | % | 430.8 | -0.6 | % | 499.4 | 2.3 | % | |||||||||||||||||||||||||||||||||||
|
|
|
|
|
|
|
|
|
|
|
|
|
|
|
|
|
|
|
|
|
|
|
| |||||||||||||||||||||||||
Japan | 160.3 | 134.7 | 168.2 | 117.1 | 144.3 | -10.0 | % | 130.0 | -3.5 | % | 169.8 | 0.9 | % | |||||||||||||||||||||||||||||||||||
<% of revenue> | <35.8 | %> | <31.1 | %> | <34.5 | %> | <29.2 | %> | <32.1 | %> | <30.2 | %> | <34.0 | %> | ||||||||||||||||||||||||||||||||||
United States | 148.6 | 153.2 | 161.3 | 135.3 | 161.1 | 8.4 | % | 160.0 | 4.4 | % | 174.3 | 8.1 | % | |||||||||||||||||||||||||||||||||||
<% of revenue> | <33.1 | %> | <35.4 | %> | <33.0 | %> | <33.7 | %> | <35.8 | %> | <37.1 | %> | <34.9 | %> | ||||||||||||||||||||||||||||||||||
Europe and Canada | 73.6 | 75.4 | 84.8 | 80.0 | 79.1 | 7.5 | % | 79.5 | 5.5 | % | 86.3 | 1.7 | % | |||||||||||||||||||||||||||||||||||
<% of revenue> | <16.4 | %> | <17.4 | %> | <17.4 | %> | <19.9 | %> | <17.6 | %> | <18.5 | %> | <17.3 | %> | ||||||||||||||||||||||||||||||||||
Emerging Markets | 65.8 | 69.9 | 73.9 | 68.5 | 65.4 | -0.7 | % | 61.3 | -12.3 | % | 69.1 | -6.5 | % | |||||||||||||||||||||||||||||||||||
<% of revenue> | <14.7 | %> | <16.1 | %> | <15.1 | %> | <17.1 | %> | <14.5 | %> | <14.2 | %> | <13.8 | %> | ||||||||||||||||||||||||||||||||||
Russia/CIS | 17.0 | 18.1 | 20.9 | 12.3 | 14.1 | -17.1 | % | 13.4 | -26.1 | % | 16.8 | -19.5 | % | |||||||||||||||||||||||||||||||||||
<% of revenue> | <3.8 | %> | <4.2 | %> | <4.3 | %> | <3.1 | %> | <3.1 | %> | <3.1 | %> | <3.4 | %> | ||||||||||||||||||||||||||||||||||
Latin America | 17.0 | 19.1 | 20.0 | 19.6 | 18.5 | 9.2 | % | 16.2 | -15.3 | % | 19.8 | -0.8 | % | |||||||||||||||||||||||||||||||||||
<% of revenue> | <3.8 | %> | <4.4 | %> | <4.1 | %> | <4.9 | %> | <4.1 | %> | <3.8 | %> | <4.0 | %> | ||||||||||||||||||||||||||||||||||
Asia | 25.2 | 24.0 | 28.1 | 26.7 | 26.9 | 6.9 | % | 25.0 | 4.1 | % | 24.0 | -14.9 | % | |||||||||||||||||||||||||||||||||||
<% of revenue> | <5.6 | %> | <5.5 | %> | <5.8 | %> | <6.7 | %> | <6.0 | %> | <5.8 | %> | <4.8 | %> | ||||||||||||||||||||||||||||||||||
Other | 6.6 | 8.7 | 4.9 | 10.0 | 5.8 | -12.1 | % | 6.8 | -22.2 | % | 8.5 | 74.1 | % | |||||||||||||||||||||||||||||||||||
<% of revenue> | <1.5 | %> | <2.0 | %> | <1.0 | %> | <2.5 | %> | <1.3 | %> | <1.6 | %> | <1.7 | %> | ||||||||||||||||||||||||||||||||||
|
|
|
|
|
|
|
|
|
|
|
|
|
|
|
|
|
|
|
|
|
|
|
| |||||||||||||||||||||||||
Of which royalty income and service income | 30.3 | 12.8 | 17.9 | 15.7 | 13.0 | -57.1 | % | 11.9 | -7.4 | % | 21.7 | 21.6 | % | |||||||||||||||||||||||||||||||||||
|
|
|
|
|
|
|
|
|
|
|
|
|
|
|
|
|
|
|
|
|
|
|
| |||||||||||||||||||||||||
*1 Revenue amount is classified into countries or regions based on the customer location. *2 Other region includes Middle East, Oceania and Africa.
◆ Consolidated Prescription Drugs Revenue (Quarterly) |
| |||||||||||||||||||||||||||||||||||||||||||||||
| (Billion JPY) | ||||||||||||||||||||||||||||||||||||||||||||||||
| FY17 | FY18 | |||||||||||||||||||||||||||||||||||||||||||||||
| Q1 | Q2 | Q3 | Q4 | Q1 | YOY | Q2 | YOY | Q3 | YOY | Q4 | YOY | |||||||||||||||||||||||||||||||||||||
Total prescription drugs revenue | 427.2 | 411.2 | 467.4 | 385.7 | 434.5 | 1.7 | % | 413.6 | 0.6 | % | 482.3 | 3.2 | % | |||||||||||||||||||||||||||||||||||
|
|
|
|
|
|
|
|
|
|
|
|
|
|
|
|
|
|
|
|
|
|
|
| |||||||||||||||||||||||||
Japan | 139.3 | 112.7 | 147.5 | 101.9 | 129.0 | -7.4 | % | 112.8 | 0.1 | % | 152.7 | 3.5 | % | |||||||||||||||||||||||||||||||||||
United States | 148.6 | 153.2 | 161.3 | 135.3 | 161.1 | 8.4 | % | 160.0 | 4.4 | % | 174.3 | 8.1 | % | |||||||||||||||||||||||||||||||||||
Europe and Canada | 73.6 | 75.4 | 84.8 | 80.0 | 79.1 | 7.5 | % | 79.5 | 5.5 | % | 86.3 | 1.7 | % | |||||||||||||||||||||||||||||||||||
Emerging Markets | 65.8 | 69.9 | 73.9 | 68.5 | 65.4 | -0.7 | % | 61.3 | -12.3 | % | 69.0 | -6.6 | % | |||||||||||||||||||||||||||||||||||
|
|
|
|
|
|
|
|
|
|
|
|
|
|
|
|
|
|
|
|
|
|
|
| |||||||||||||||||||||||||
Russia/CIS | 17.0 | 18.1 | 20.9 | 12.3 | 14.1 | -17.1 | % | 13.4 | -26.1 | % | 16.8 | -19.5 | % | |||||||||||||||||||||||||||||||||||
Russia | 12.5 | 13.8 | 16.3 | 8.8 | 10.5 | -16.3 | % | 10.3 | -25.5 | % | 13.2 | -18.9 | % | |||||||||||||||||||||||||||||||||||
Latin America | 17.0 | 19.1 | 20.0 | 19.6 | 18.5 | 9.2 | % | 16.1 | -15.5 | % | 19.8 | -1.0 | % | |||||||||||||||||||||||||||||||||||
Brazil | 10.0 | 12.0 | 12.1 | 12.2 | 11.8 | 18.5 | % | 10.1 | -15.6 | % | 12.1 | 0.0 | % | |||||||||||||||||||||||||||||||||||
Asia | 25.2 | 24.0 | 28.1 | 26.7 | 26.9 | 6.9 | % | 25.0 | 4.1 | % | 24.0 | -14.9 | % | |||||||||||||||||||||||||||||||||||
China | 12.3 | 10.3 | 14.2 | 12.7 | 14.0 | 13.4 | % | 12.0 | 16.4 | % | 8.9 | -37.4 | % | |||||||||||||||||||||||||||||||||||
Other | 6.6 | 8.7 | 4.9 | 10.0 | 5.8 | -12.0 | % | 6.8 | -22.2 | % | 8.5 | 74.1 | % | |||||||||||||||||||||||||||||||||||
|
|
|
|
|
|
|
|
|
|
|
|
|
|
|
|
|
|
|
|
|
|
|
| |||||||||||||||||||||||||
Of which royalty income and service income | 30.2 | 12.7 | 17.7 | 15.6 | 12.9 | -57.3 | % | 11.7 | -7.6 | % | 21.5 | 21.5 | % | |||||||||||||||||||||||||||||||||||
|
|
|
|
|
|
|
|
|
|
|
|
|
|
|
|
|
|
|
|
|
|
|
| |||||||||||||||||||||||||
Japan | 18.1 | 2.5 | 3.7 | 7.0 | 3.2 | -82.3 | % | 2.9 | 16.7 | % | 10.4 | 180.4 | % | |||||||||||||||||||||||||||||||||||
Overseas | 12.1 | 10.2 | 14.0 | 8.6 | 9.7 | -19.8 | % | 8.9 | -13.4 | % | 11.2 | -20.4 | % | |||||||||||||||||||||||||||||||||||
|
|
|
|
|
|
|
|
|
|
|
|
|
|
|
|
|
|
|
|
|
|
|
| |||||||||||||||||||||||||
Ratio of overseas prescription drugs revenue | 67.4 | % | 72.6 | % | 68.4 | % | 73.6 | % | 70.3 | % | 72.7 | % | 68.3 | % | ||||||||||||||||||||||||||||||||||
|
|
|
|
|
|
|
|
|
|
|
|
|
|
|
|
|
|
|
|
|
|
|
| |||||||||||||||||||||||||
*1 Revenue amount is classified into countries or regions based on the customer location. *2 Other region includes Middle East, Oceania and Africa. |
| |||||||||||||||||||||||||||||||||||||||||||||||
2
Table of Contents
◆ Prescription Drugs: Global major products’ sales *1
| (Billion JPY) | ||||||||||||||||||||||||||||||||||||||
| Gross basis | Net basis | |||||||||||||||||||||||||||||||||||||
| FY15 | FY16 | FY17 | FY17 Q3 YTD | FY18 Q3 YTD | YOY | FY18 Forecasts *3 | FY18Q3 YTD Underlying Growth | |||||||||||||||||||||||||||||||
Entyvio | Japan | — | — | — | — | 0.5 | 0.5 | — | — | |||||||||||||||||||||||||||||
| U.S. | 63.1 | 99.6 | 133.6 | 100.6 | 136.9 | 36.4 | 36.2 | % | 37.0 | % | ||||||||||||||||||||||||||||
| EUCAN | 21.9 | 39.5 | 60.2 | 43.6 | 56.2 | 12.6 | 29.0 | % | 28.5 | % | ||||||||||||||||||||||||||||
| EM | 1.3 | 4.0 | 7.5 | 5.4 | 7.4 | 2.0 | 37.4 | % | 48.4 | % | ||||||||||||||||||||||||||||
|
|
|
|
|
|
|
|
|
|
|
|
|
|
|
|
|
| |||||||||||||||||||||
| Total | 86.2 | 143.2 | 201.4 | 149.5 | 201.0 | 51.5 | 34.4 | % |
| 
|
| 35.1 | % | |||||||||||||||||||||||||
|
|
|
|
|
|
|
|
|
|
|
|
|
|
|
|
|
| |||||||||||||||||||||
Velcade | U.S. | 131.6 | 112.9 | 113.7 | 88.9 | 82.0 | -6.9 | -7.8 | % | -7.1 | % | |||||||||||||||||||||||||||
| Other than U.S. | 30.4 | 24.7 | 23.6 | 19.0 | 18.4 | -0.7 | -3.5 | % | -2.9 | % | ||||||||||||||||||||||||||||
|
|
|
|
|
|
|
|
|
|
|
|
|
|
|
|
|
| |||||||||||||||||||||
| Total | 162.0 | 137.6 | 137.3 | 107.9 | 100.3 | -7.6 | -7.0 | % |
| 
|
| -6.3 | % | |||||||||||||||||||||||||
|
|
|
|
|
|
|
|
|
|
|
|
|
|
|
|
|
| |||||||||||||||||||||
Leuprorelin | Japan | 53.8 | 48.6 | 41.2 | 33.0 | 31.7 | -1.3 | -4.1 | % | -4.1 | % | |||||||||||||||||||||||||||
| U.S. | 17.3 | 18.3 | 19.7 | 15.1 | 16.9 | 1.8 | 11.9 | % | 12.0 | % | ||||||||||||||||||||||||||||
| EUCAN | 35.3 | 31.1 | 34.5 | 25.5 | 25.3 | -0.2 | -0.7 | % | -1.8 | % | ||||||||||||||||||||||||||||
| EM | 18.0 | 16.3 | 12.7 | 9.5 | 10.7 | 1.2 | 12.6 | % | 12.8 | % | ||||||||||||||||||||||||||||
|
|
|
|
|
|
|
|
|
|
|
|
|
|
|
|
|
| |||||||||||||||||||||
| Total | 124.4 | 114.2 | 108.1 | 83.2 | 84.6 | 1.5 | 1.8 | % |
| 
|
| 1.5 | % | |||||||||||||||||||||||||
|
|
|
|
|
|
|
|
|
|
|
|
|
|
|
|
|
| |||||||||||||||||||||
Azilva | Japan | 59.0 | 66.9 | 64.0 | 50.5 | 55.7 | 5.2 | 10.4 | % | 10.4 | % | |||||||||||||||||||||||||||
|
|
|
|
|
|
|
|
|
|
|
|
|
|
|
|
|
| |||||||||||||||||||||
| Total | 59.0 | 66.9 | 64.0 | 50.5 | 55.7 | 5.2 | 10.4 | % |
| 
|
| 10.4 | % | |||||||||||||||||||||||||
|
|
|
|
|
|
|
|
|
|
|
|
|
|
|
|
|
| |||||||||||||||||||||
Pantoprazole | U.S. | 13.6 | 10.1 | 7.2 | 6.1 | 4.1 | -2.0 | -33.4 | % | -32.6 | % | |||||||||||||||||||||||||||
| EUCAN | 43.4 | 30.5 | 30.6 | 23.2 | 21.1 | -2.1 | -8.9 | % | -9.9 | % | ||||||||||||||||||||||||||||
| EM | 43.7 | 33.7 | 28.0 | 20.3 | 21.7 | 1.5 | 7.3 | % | 10.7 | % | ||||||||||||||||||||||||||||
|
|
|
|
|
|
|
|
|
|
|
|
|
|
|
|
|
| |||||||||||||||||||||
| Total | 100.8 | 74.2 | 65.8 | 49.5 | 46.9 | -2.6 | -5.3 | % |
|
|
| -4.2 | % | |||||||||||||||||||||||||
|
|
|
|
|
|
|
|
|
|
|
|
|
|
|
|
|
| |||||||||||||||||||||
Dexilant | U.S. | 64.0 | 49.7 | 49.5 | 40.2 | 40.3 | 0.1 | 0.3 | % | 0.9 | % | |||||||||||||||||||||||||||
| EUCAN | 5.4 | 5.7 | 6.4 | 4.7 | 5.5 | 0.8 | 16.6 | % | 18.2 | % | ||||||||||||||||||||||||||||
| EM | 5.7 | 7.3 | 9.9 | 7.2 | 9.1 | 1.9 | 26.5 | % | 35.9 | % | ||||||||||||||||||||||||||||
|
|
|
|
|
|
|
|
|
|
|
|
|
|
|
|
|
| |||||||||||||||||||||
| Total | 75.1 | 62.6 | 65.7 | 52.1 | 54.9 | 2.8 | 5.4 | % |
| 
|
| 7.4 | % | |||||||||||||||||||||||||
|
|
|
|
|
|
|
|
|
|
|
|
|
|
|
|
|
| |||||||||||||||||||||
Takecab | Japan | 8.4 | 34.1 | 48.5 | 37.5 | 44.3 | 6.8 | 18.2 | % | 18.2 | % | |||||||||||||||||||||||||||
|
|
|
|
|
|
|
|
|
|
|
|
|
|
|
|
|
| |||||||||||||||||||||
| Total | 8.4 | 34.1 | 48.5 | 37.5 | 44.4 | 6.9 | 18.5 | % |
| 
|
| 18.5 | % | |||||||||||||||||||||||||
|
|
|
|
|
|
|
|
|
|
|
|
|
|
|
|
|
| |||||||||||||||||||||
Nesina | Japan | 36.9 | 32.9 | 26.6 | 21.5 | 22.2 | 0.7 | 3.4 | % | 3.4 | % | |||||||||||||||||||||||||||
| U.S. | 5.3 | 5.2 | 6.0 | 4.8 | 4.6 | -0.2 | -3.7 | % | -3.1 | % | ||||||||||||||||||||||||||||
| EUCAN | 3.5 | 6.1 | 9.0 | 6.5 | 8.1 | 1.7 | 25.9 | % | 24.5 | % | ||||||||||||||||||||||||||||
| EM | 3.3 | 4.9 | 8.6 | 5.8 | 7.5 | 1.8 | 30.7 | % | 38.6 | % | ||||||||||||||||||||||||||||
|
|
|
|
|
|
|
|
|
|
|
|
|
|
|
|
|
| |||||||||||||||||||||
| Total | 48.9 | 49.1 | 50.2 | 38.4 | 42.4 | 4.0 | 10.4 | % |
|
|
| 11.5 | % | |||||||||||||||||||||||||
|
|
|
|
|
|
|
|
|
|
|
|
|
|
|
|
|
| |||||||||||||||||||||
Trintellix | U.S. | 24.5 | 31.9 | 48.4 | 37.6 | 44.6 | 7.1 | 18.8 | % | 19.5 | % | |||||||||||||||||||||||||||
|
|
|
|
|
|
|
|
|
|
|
|
|
|
|
|
|
| |||||||||||||||||||||
| Total | 24.5 | 31.9 | 48.4 | 37.6 | 44.6 | 7.1 | 18.8 | % |
| 
|
| 19.5 | % | |||||||||||||||||||||||||
|
|
|
|
|
|
|
|
|
|
|
|
|
|
|
|
|
| |||||||||||||||||||||
Uloric | U.S. | 41.8 | 41.4 | 45.8 | 34.2 | 39.7 | 5.5 | 16.0 | % | 17.0 | % | |||||||||||||||||||||||||||
| EUCAN | 0.7 | 0.7 | 0.8 | 0.6 | 0.6 | -0.0 | -0.1 | % | 1.4 | % | ||||||||||||||||||||||||||||
| EM | — | 0.1 | 0.3 | 0.2 | 0.2 | 0.0 | 7.9 | % | 13.1 | % | ||||||||||||||||||||||||||||
|
|
|
|
|
|
|
|
|
|
|
|
|
|
|
|
|
| |||||||||||||||||||||
| Total | 42.5 | 42.2 | 46.8 | 35.0 | 40.5 | 5.5 | 15.7 | % |
|
|
| 16.7 | % | |||||||||||||||||||||||||
|
|
|
|
|
|
|
|
|
|
|
|
|
|
|
|
|
| |||||||||||||||||||||
Ninlaro | Japan | — | — | 2.5 | 1.8 | 3.2 | 1.4 | 79.1 | % | 79.1 | % | |||||||||||||||||||||||||||
| U.S. | 4.0 | 29.1 | 39.4 | 29.8 | 35.6 | 5.8 | 19.4 | % | 20.3 | % | ||||||||||||||||||||||||||||
| EUCAN | — | 0.2 | 4.0 | 2.7 | 6.0 | 3.3 | 124.8 | % | 125.3 | % | ||||||||||||||||||||||||||||
| EM | 0.0 | 0.1 | 0.6 | 0.3 | 1.6 | 1.4 | — | — | ||||||||||||||||||||||||||||||
|
|
|
|
|
|
|
|
|
|
|
|
|
|
|
|
|
| |||||||||||||||||||||
| Total | 4.1 | 29.4 | 46.4 | 34.5 | 46.5 | 11.9 | 34.5 | % |
|
|
| 36.6 | % | |||||||||||||||||||||||||
|
| �� |
|
|
|
|
|
|
|
|
|
|
|
|
|
|
| |||||||||||||||||||||
Colcrys | U.S. | 46.5 | 38.9 | 40.3 | 32.1 | 23.6 | -8.5 | -26.5 | % | -25.7 | % | |||||||||||||||||||||||||||
|
|
|
|
|
|
|
|
|
|
|
|
|
|
|
|
|
| |||||||||||||||||||||
| Total | 46.5 | 38.9 | 40.3 | 32.1 | 23.6 | -8.5 | -26.5 | % |
| 
|
| -25.7 | % | |||||||||||||||||||||||||
|
|
|
|
|
|
|
|
|
|
|
|
|
|
|
|
|
| |||||||||||||||||||||
Adcetris | Japan | 3.1 | 3.3 | 3.8 | 2.9 | 3.7 | 0.8 | 27.9 | % | 27.9 | % | |||||||||||||||||||||||||||
| Europe | 17.4 | 17.5 | 20.1 | 15.3 | 16.2 | 1.0 | 6.3 | % | 5.4 | % | ||||||||||||||||||||||||||||
| EM | 7.2 | 9.3 | 14.3 | 10.6 | 12.1 | 1.6 | 14.8 | % | 36.2 | % | ||||||||||||||||||||||||||||
|
|
|
|
|
|
|
|
|
|
|
|
|
|
|
|
|
| |||||||||||||||||||||
| Total | 27.6 | 30.1 | 38.5 | 28.9 | 32.0 | 3.1 | 10.9 | % |
|
|
| 17.7 | % | |||||||||||||||||||||||||
|
|
|
|
|
|
|
|
|
|
|
|
|
|
|
|
|
| |||||||||||||||||||||
Lansoprazole | Japan *2 | 41.3 | 8.1 | 4.6 | 3.6 | 2.5 | -1.1 | -31.5 | % | -18.9 | % | |||||||||||||||||||||||||||
| U.S. | 27.5 | 20.0 | 15.2 | 12.1 | 5.4 | -6.7 | -55.6 | % | -54.9 | % | ||||||||||||||||||||||||||||
| EUCAN | 10.5 | 7.1 | 7.2 | 5.5 | 4.9 | -0.6 | -11.2 | % | -12.4 | % | ||||||||||||||||||||||||||||
| EM | 10.2 | 9.2 | 9.7 | 7.2 | 7.0 | -0.2 | -2.7 | % | -2.6 | % | ||||||||||||||||||||||||||||
|
|
|
|
|
|
|
|
|
|
|
|
|
|
|
|
|
| |||||||||||||||||||||
| Total | 89.5 | 44.4 | 36.8 | 28.5 | 19.8 | -8.7 | -30.5 | % |
|
|
| -28.3 | % | |||||||||||||||||||||||||
|
|
|
|
|
|
|
|
|
|
|
|
|
|
|
|
|
| |||||||||||||||||||||
Amitiza | U.S. | 37.2 | 33.7 | 33.7 | 26.9 | 25.8 | -1.1 | -3.9 | % | -3.3 | % | |||||||||||||||||||||||||||
| EUCAN | 0.1 | 0.1 | 0.1 | 0.1 | 0.1 | -0.0 | -8.4 | % | -8.1 | % | ||||||||||||||||||||||||||||
| EM | — | 0.0 | 0.0 | 0.0 | 0.0 | 0.0 | 57.7 | % | 61.7 | % | ||||||||||||||||||||||||||||
|
|
|
|
|
|
|
|
|
|
|
|
|
|
|
|
|
| |||||||||||||||||||||
| Total | 37.3 | 33.8 | 33.8 | 26.9 | 25.9 | -1.1 | -3.9 | % |
|
|
| -3.3 | % | |||||||||||||||||||||||||
|
|
|
|
|
|
|
|
|
|
|
|
|
|
|
|
|
| |||||||||||||||||||||
Iclusig | U.S. | — | 2.7 | 20.4 | 15.4 | 19.2 | 3.8 | 24.7 | % | 25.8 | % | |||||||||||||||||||||||||||
| Other than U.S. | — | 0.2 | 2.7 | 1.9 | 2.4 | 0.5 | 27.4 | % | 28.1 | % | ||||||||||||||||||||||||||||
|
|
|
|
|
|
|
|
|
|
|
|
|
|
|
|
|
| |||||||||||||||||||||
| Total | — | 2.9 | 23.1 | 17.3 | 21.6 | 4.3 | 25.0 | % |
|
|
| 26.0 | % | |||||||||||||||||||||||||
|
|
|
|
|
|
|
|
|
|
|
|
|
|
|
|
|
| |||||||||||||||||||||
Alunbrig | U.S. | — | — | 2.8 | 1.5 | 3.7 | 2.2 | 144.5 | % | 145.8 | % | |||||||||||||||||||||||||||
| EUCAN | — | — | — | — | 0.0 | 0.0 | �� | — | ||||||||||||||||||||||||||||||
|
|
|
|
|
|
|
|
|
|
|
|
|
|
|
|
|
| |||||||||||||||||||||
| Total | — | — | 2.8 | 1.5 | 3.8 | 2.3 | 149.7 | % |
|
|
| 151.4 | % | |||||||||||||||||||||||||
|
|
|
|
|
|
|
|
|
|
|
|
|
|
|
|
|
| |||||||||||||||||||||
U.S.: United States, EUCAN: Europe and Canada, EM: Emerging Markets
| *1 | Sales amount includes royalty income and service income. |
| *2 | Products were transferred to the Joint Venture with Teva in Japan (monotherapy in April 2016 and fixed dose combinations in May 2017). Supply sales of these products to the JV is currently recognized. |
| *3 | See page 6 for the profit forecast disclaimer. |
 ± <10%
  +10%~20%
  +20%~30%
  +>30%
+>30%  -10%~20%
  -20%~30%
  - >30%
| *4 | Effective from FY2018, sales of certain products in Japan are now disclosed on a net basis, deducting items such as discounts and rebates, in alignment with the global managerial approach applied to individual product sales. The change in disclosure of individual product sales has been revised retrospectively, with prior year figures reclassified on a net basis to enableyear-on-year comparisons. This reclassification has no impact on Takeda’s financial statements and does not represent a correction of prior year figures. |
Gross basis: discounts and rebates are not deducted (except FY2016 Oncology products in Japan are on net basis)
Net basis: discounts and rebates are deducted
3
Table of Contents
◆ Prescription Drugs: Global major products’ sales*1(Quarterly)
| (Billion JPY) | ||||||||||||||||||
| FY17 (Net basis) | ||||||||||||||||||
| Q1 | Q2 | Q3 | Q4 | |||||||||||||||
Entyvio | Japan | — | — | — | — | |||||||||||||
| U.S. | 31.0 | 34.8 | 34.8 | 33.1 | ||||||||||||||
| EUCAN | 13.5 | 14.4 | 15.7 | 16.6 | ||||||||||||||
| EM | 1.4 | 1.9 | 2.0 | 2.2 | ||||||||||||||
|
|
|
|
|
|
|
| |||||||||||
| Total | 45.9 | 51.1 | 52.6 | 51.8 | ||||||||||||||
|
|
|
|
|
|
|
| |||||||||||
Velcade | U.S. | 30.7 | 29.5 | 28.7 | 24.8 | |||||||||||||
| Other than U.S. | 5.5 | 6.3 | 7.2 | 4.6 | ||||||||||||||
|
|
|
|
|
|
|
| |||||||||||
| Total | 36.2 | 35.8 | 35.8 | 29.4 | ||||||||||||||
|
|
|
|
|
|
|
| |||||||||||
Leuprorelin | Japan | 11.0 | 9.7 | 12.3 | 8.2 | |||||||||||||
| U.S. | 5.2 | 4.1 | 5.8 | 4.6 | ||||||||||||||
| EUCAN | 8.1 | 8.6 | 8.8 | 8.9 | ||||||||||||||
| EM | 3.0 | 3.2 | 3.3 | 3.2 | ||||||||||||||
|
|
|
|
|
|
|
| |||||||||||
| Total | 27.3 | 25.6 | 30.2 | 24.9 | ||||||||||||||
|
|
|
|
|
|
|
| |||||||||||
Azilva | Japan | 16.8 | 14.6 | 19.0 | 13.5 | |||||||||||||
|
|
|
|
|
|
|
| |||||||||||
| Total | 16.8 | 14.6 | 19.0 | 13.5 | ||||||||||||||
|
|
|
|
|
|
|
| |||||||||||
Pantoprazole | U.S. | 1.9 | 2.2 | 2.1 | 1.2 | |||||||||||||
| EUCAN | 7.9 | 7.2 | 8.1 | 7.3 | ||||||||||||||
| EM | 7.0 | 8.4 | 4.8 | 7.8 | ||||||||||||||
|
|
|
|
|
|
|
| |||||||||||
| Total | 16.7 | 17.8 | 15.0 | 16.3 | ||||||||||||||
|
|
|
|
|
|
|
| |||||||||||
Dexilant | U.S. | 12.8 | 13.3 | 14.1 | 9.3 | |||||||||||||
| EUCAN | 1.4 | 1.6 | 1.8 | 1.6 | ||||||||||||||
| EM | 2.1 | 2.3 | 2.8 | 2.7 | ||||||||||||||
|
|
|
|
|
|
|
| |||||||||||
| Total | 16.3 | 17.1 | 18.7 | 13.7 | ||||||||||||||
|
|
|
|
|
|
|
| |||||||||||
Takecab | Japan | 11.3 | 11.0 | 15.1 | 11.0 | |||||||||||||
|
|
|
|
|
|
|
| |||||||||||
| Total | 11.3 | 11.0 | 15.1 | 11.0 | ||||||||||||||
|
|
|
|
|
|
|
| |||||||||||
Nesina | Japan | 7.3 | 6.2 | 8.0 | 5.1 | |||||||||||||
| U.S. | 1.2 | 1.6 | 1.9 | 1.2 | ||||||||||||||
| EUCAN | 2.0 | 2.0 | 2.5 | 2.6 | ||||||||||||||
| EM | 1.4 | 2.1 | 2.2 | 2.9 | ||||||||||||||
|
|
|
|
|
|
|
| |||||||||||
| Total | 11.9 | 11.9 | 14.6 | 11.8 | ||||||||||||||
|
|
|
|
|
|
|
| |||||||||||
Trintellix | U.S. | 11.2 | 12.2 | 14.1 | 10.8 | |||||||||||||
|
|
|
|
|
|
|
| |||||||||||
| Total | 11.2 | 12.2 | 14.1 | 10.8 | ||||||||||||||
|
|
|
|
|
|
|
| |||||||||||
Uloric | U.S. | 11.2 | 11.3 | 11.7 | 11.6 | |||||||||||||
| EUCAN | 0.2 | 0.2 | 0.2 | 0.2 | ||||||||||||||
| EM | 0.1 | 0.1 | 0.1 | 0.1 | ||||||||||||||
|
|
|
|
|
|
|
| |||||||||||
| Total | 11.4 | 11.6 | 12.0 | 11.8 | ||||||||||||||
|
|
|
|
|
|
|
| |||||||||||
Ninlaro | Japan | 0.2 | 0.6 | 0.9 | 0.7 | |||||||||||||
| U.S. | 9.0 | 10.1 | 10.7 | 9.6 | ||||||||||||||
| EUCAN | 0.6 | 0.9 | 1.1 | 1.3 | ||||||||||||||
| EM | 0.1 | 0.1 | 0.1 | 0.3 | ||||||||||||||
|
|
|
|
|
|
|
| |||||||||||
| Total | 10.0 | 11.7 | 12.8 | 11.9 | ||||||||||||||
|
|
|
|
|
|
|
| |||||||||||
Colcrys | U.S. | 9.6 | 10.3 | 12.2 | 8.2 | |||||||||||||
|
|
|
|
|
|
|
| |||||||||||
| Total | 9.6 | 10.3 | 12.2 | 8.2 | ||||||||||||||
|
|
|
|
|
|
|
| |||||||||||
Adcetris | Japan | 1.0 | 0.9 | 1.0 | 0.9 | |||||||||||||
| Europe | 4.7 | 5.2 | 5.4 | 4.8 | ||||||||||||||
| EM | 3.6 | 3.4 | 3.5 | 3.7 | ||||||||||||||
|
|
|
|
|
|
|
| |||||||||||
| Total | 9.3 | 9.7 | 9.9 | 9.6 | ||||||||||||||
|
|
|
|
|
|
|
| |||||||||||
Lansoprazole | Japan*2 | 1.5 | 1.0 | 1.1 | 1.0 | |||||||||||||
| U.S. | 3.8 | 3.7 | 4.7 | 3.1 | ||||||||||||||
| EUCAN | 1.9 | 1.8 | 1.8 | 1.7 | ||||||||||||||
| EM | 2.5 | 2.4 | 2.4 | 2.5 | ||||||||||||||
|
|
|
|
|
|
|
| |||||||||||
| Total | 9.7 | 8.8 | 9.9 | 8.3 | ||||||||||||||
|
|
|
|
|
|
|
| |||||||||||
Amitiza | U.S. | 8.6 | 8.8 | 9.4 | 6.9 | |||||||||||||
| EUCAN | 0.0 | 0.0 | 0.0 | 0.0 | ||||||||||||||
| EM | 0.0 | 0.0 | 0.0 | 0.0 | ||||||||||||||
|
|
|
|
|
|
|
| |||||||||||
| Total | 8.6 | 8.8 | 9.5 | 6.9 | ||||||||||||||
|
|
|
|
|
|
|
| |||||||||||
Iclusig | U.S. | 4.7 | 5.0 | 5.8 | 5.0 | |||||||||||||
| Other than U.S. | 0.5 | 0.7 | 0.7 | 0.8 | ||||||||||||||
|
|
|
|
|
|
|
| |||||||||||
| Total | 5.2 | 5.7 | 6.4 | 5.8 | ||||||||||||||
|
|
|
|
|
|
|
| |||||||||||
Alunbrig | U.S. | 0.2 | 0.6 | 0.7 | 1.3 | |||||||||||||
| EUCAN | — | — | — | — | ||||||||||||||
|
|
|
|
|
|
|
| |||||||||||
| Total | 0.2 | 0.6 | 0.7 | 1.3 | ||||||||||||||
|
|
|
|
|
|
|
| |||||||||||
U.S.: United States, EUCAN: Europe and Canada, EM: Emerging Markets
| *1 | Sales amount includes royalty income and service income. |
| *2 | Products were transferred to the Joint Venture with Teva in Japan (monotherapy in April 2016 and fixed dose combinations in May 2017). Supply sales of these products to the JV is currently recognized. |
| *3 | Effective from FY2018, sales of certain products in Japan are now disclosed on a net basis, deducting items such as discounts and rebates, in alignment with the global managerial approach applied to individual product sales. The change in disclosure of individual product sales has been revised retrospectively, with prior year figures reclassified on a net basis to enableyear-on-year comparisons. This reclassification has no impact on Takeda’s financial statements and does not represent a correction of prior year figures. |
Net basis: discounts and rebates are deducted
4
Table of Contents
| (Billion JPY) | ||||||||||||||||||||||||||||||||||
| FY18 (Net basis) | ||||||||||||||||||||||||||||||||||
| Q1 | YOY | Q2 | YOY | Q3 | YOY | Q4 | YOY | |||||||||||||||||||||||||||
Entyvio | Japan | — | — | — | — | 0.5 | — | |||||||||||||||||||||||||||
| U.S. | 41.9 | 35.5 | % | 45.4 | 30.4 | % | 49.6 | 42.5 | % | |||||||||||||||||||||||||
| EUCAN | 17.2 | 27.5 | % | 19.1 | 32.7 | % | 19.9 | 26.9 | % | |||||||||||||||||||||||||
| EM | 2.2 | 50.4 | % | 2.6 | 36.1 | % | 2.6 | 29.5 | % | |||||||||||||||||||||||||
|
|
|
|
|
|
|
|
|
|
|
|
|
|
|
| |||||||||||||||||||
| Total | 61.3 | 33.6 | % | 67.1 | 31.3 | % | 72.6 | 38.2 | % | |||||||||||||||||||||||||
|
|
|
|
|
|
|
|
|
|
|
|
|
|
|
| |||||||||||||||||||
Velcade | U.S. | 26.2 | -14.7 | % | 27.1 | -8.2 | % | 28.7 | 0.1 | % | ||||||||||||||||||||||||
| Other than U.S. | 5.2 | -6.1 | % | 6.4 | 1.5 | % | 6.8 | -5.8 | % | |||||||||||||||||||||||||
|
|
|
|
|
|
|
|
|
|
|
|
|
|
|
| |||||||||||||||||||
| Total | 31.4 | -13.4 | % | 33.5 | -6.5 | % | 35.4 | -1.1 | % | |||||||||||||||||||||||||
|
|
|
|
|
|
|
|
|
|
|
|
|
|
|
| |||||||||||||||||||
Leuprorelin | Japan | 10.5 | -4.7 | % | 9.6 | -1.1 | % | 11.5 | -5.9 | % | ||||||||||||||||||||||||
| U.S. | 6.2 | 19.3 | % | 4.9 | 19.6 | % | 5.8 | -0.4 | % | |||||||||||||||||||||||||
| EUCAN | 8.4 | 4.7 | % | 8.3 | -3.2 | % | 8.6 | -3.1 | % | |||||||||||||||||||||||||
| EM | 3.5 | 14.2 | % | 3.6 | 14.7 | % | 3.7 | 9.3 | % | |||||||||||||||||||||||||
|
|
|
|
|
|
|
|
|
|
|
|
|
|
|
| |||||||||||||||||||
| Total | 28.6 | 4.7 | % | 26.5 | 3.5 | % | 29.5 | -2.3 | % | |||||||||||||||||||||||||
|
|
|
|
|
|
|
|
|
|
|
|
|
|
|
| |||||||||||||||||||
Azilva | Japan | 19.4 | 15.5 | % | 15.8 | 8.0 | % | 20.5 | 7.7 | % | ||||||||||||||||||||||||
|
|
|
|
|
|
|
|
|
|
|
|
|
|
|
| |||||||||||||||||||
| Total | 19.4 | 15.5 | % | 15.8 | 8.0 | % | 20.5 | 7.7 | % | |||||||||||||||||||||||||
|
|
|
|
|
|
|
|
|
|
|
|
|
|
|
| |||||||||||||||||||
Pantoprazole | U.S. | 2.0 | 6.8 | % | 1.4 | -35.4 | % | 0.7 | -67.4 | % | ||||||||||||||||||||||||
| EUCAN | 7.2 | -8.0 | % | 6.5 | -10.2 | % | 7.4 | -8.6 | % | |||||||||||||||||||||||||
| EM | 7.0 | -0.1 | % | 6.6 | -21.7 | % | 8.1 | 68.9 | % | |||||||||||||||||||||||||
|
|
|
|
|
|
|
|
|
|
|
|
|
|
|
| |||||||||||||||||||
| Total | 16.2 | -3.1 | % | 14.5 | -18.7 | % | 16.2 | 8.1 | % | |||||||||||||||||||||||||
|
|
|
|
|
|
|
|
|
|
|
|
|
|
|
| |||||||||||||||||||
Dexilant | U.S. | 13.0 | 1.4 | % | 12.6 | -5.0 | % | 14.7 | 4.3 | % | ||||||||||||||||||||||||
| EUCAN | 1.7 | 18.7 | % | 1.8 | 14.7 | % | 2.0 | 16.4 | % | |||||||||||||||||||||||||
| EM | 2.7 | 30.4 | % | 3.1 | 37.4 | % | 3.2 | 14.5 | % | |||||||||||||||||||||||||
|
|
|
|
|
|
|
|
|
|
|
|
|
|
|
| |||||||||||||||||||
| Total | 17.4 | 6.6 | % | 17.5 | 2.4 | % | 20.0 | 7.0 | % | |||||||||||||||||||||||||
|
|
|
|
|
|
|
|
|
|
|
|
|
|
|
| |||||||||||||||||||
Takecab | Japan | 14.2 | 26.4 | % | 12.9 | 17.1 | % | 17.1 | 12.9 | % | ||||||||||||||||||||||||
|
|
|
|
|
|
|
|
|
|
|
|
|
|
|
| |||||||||||||||||||
| Total | 14.3 | 26.5 | % | 13.0 | 17.6 | % | 17.1 | 13.1 | % | |||||||||||||||||||||||||
|
|
|
|
|
|
|
|
|
|
|
|
|
|
|
| |||||||||||||||||||
Nesina | Japan | 7.8 | 6.8 | % | 6.5 | 5.4 | % | 7.9 | -1.1 | % | ||||||||||||||||||||||||
| U.S. | 1.2 | -6.9 | % | 1.6 | -0.1 | % | 1.8 | -4.6 | % | |||||||||||||||||||||||||
| EUCAN | 2.6 | 28.7 | % | 2.5 | 26.1 | % | 3.0 | 23.4 | % | |||||||||||||||||||||||||
| EM | 2.6 | 84.3 | % | 2.1 | -2.1 | % | 2.8 | 28.2 | % | |||||||||||||||||||||||||
|
|
|
|
|
|
|
|
|
|
|
|
|
|
|
| |||||||||||||||||||
| Total | 14.1 | 18.2 | % | 12.7 | 6.8 | % | 15.6 | 7.0 | % | |||||||||||||||||||||||||
|
|
|
|
|
|
|
|
|
|
|
|
|
|
|
| |||||||||||||||||||
Trintellix | U.S. | 14.1 | 25.8 | % | 13.0 | 6.6 | % | 17.5 | 23.8 | % | ||||||||||||||||||||||||
|
|
|
|
|
|
|
|
|
|
|
|
|
|
|
| |||||||||||||||||||
| Total | 14.1 | 25.8 | % | 13.0 | 6.6 | % | 17.5 | 23.8 | % | |||||||||||||||||||||||||
|
|
|
|
|
|
|
|
|
|
|
|
|
|
|
| |||||||||||||||||||
Uloric | U.S. | 13.8 | 23.4 | % | 12.1 | 7.2 | % | 13.7 | 17.5 | % | ||||||||||||||||||||||||
| EUCAN | 0.2 | 4.2 | % | 0.2 | 1.9 | % | 0.2 | -5.5 | % | |||||||||||||||||||||||||
| EM | 0.1 | 17.1 | % | 0.1 | 28.9 | % | 0.1 | -19.7 | % | |||||||||||||||||||||||||
|
|
|
|
|
|
|
|
|
|
|
|
|
|
|
| |||||||||||||||||||
| Total | 14.1 | 23.1 | % | 12.4 | 7.2 | % | 14.0 | 16.8 | % | |||||||||||||||||||||||||
|
|
|
|
|
|
|
|
|
|
|
|
|
|
|
| |||||||||||||||||||
Ninlaro | Japan | 1.2 | — | 0.9 | 42.5 | % | 1.2 | 27.0 | % | |||||||||||||||||||||||||
| U.S. | 11.1 | 23.1 | % | 11.7 | 15.8 | % | 12.7 | 19.6 | % | |||||||||||||||||||||||||
| EUCAN | 1.6 | 147.5 | % | 1.9 | 111.9 | % | 2.5 | 122.4 | % | |||||||||||||||||||||||||
| EM | 0.1 | 39.7 | % | 0.9 | — | 0.6 | — | |||||||||||||||||||||||||||
|
|
|
|
|
|
|
|
|
|
|
|
|
|
|
| |||||||||||||||||||
| Total | 14.0 | 39.6 | % | 15.4 | 31.7 | % | 17.1 | 33.2 | % | |||||||||||||||||||||||||
|
|
|
|
|
|
|
|
|
|
|
|
|
|
|
| |||||||||||||||||||
Colcrys | U.S. | 9.2 | -4.3 | % | 7.1 | -31.2 | % | 7.3 | -40.0 | % | ||||||||||||||||||||||||
|
|
|
|
|
|
|
|
|
|
|
|
|
|
|
| |||||||||||||||||||
| Total | 9.2 | -4.3 | % | 7.1 | -31.2 | % | 7.3 | -40.0 | % | |||||||||||||||||||||||||
|
|
|
|
|
|
|
|
|
|
|
|
|
|
|
| |||||||||||||||||||
Adcetris | Japan | 1.1 | 10.8 | % | 1.1 | 19.8 | % | 1.5 | 53.1 | % | ||||||||||||||||||||||||
| Europe | 5.5 | 17.7 | % | 5.2 | -0.1 | % | 5.5 | 2.5 | % | |||||||||||||||||||||||||
| EM | 4.3 | 20.0 | % | 3.9 | 12.1 | % | 4.0 | 12.2 | % | |||||||||||||||||||||||||
|
|
|
|
|
|
|
|
|
|
|
|
|
|
|
| |||||||||||||||||||
| Total | 11.0 | 17.8 | % | 10.1 | 4.1 | % | 10.9 | 11.0 | % | |||||||||||||||||||||||||
|
|
|
|
|
|
|
|
|
|
|
|
|
|
|
| |||||||||||||||||||
Lansoprazole | Japan *2 | 0.9 | -42.2 | % | 0.7 | -25.6 | % | 0.8 | -21.6 | % | ||||||||||||||||||||||||
| U.S. | 2.0 | -46.1 | % | 2.9 | -20.2 | % | 0.4 | -91.1 | % | |||||||||||||||||||||||||
| EUCAN | 1.7 | -10.5 | % | 1.6 | -13.2 | % | 1.6 | -9.9 | % | |||||||||||||||||||||||||
| EM | 2.4 | -4.5 | % | 2.4 | -0.1 | % | 2.3 | -3.3 | % | |||||||||||||||||||||||||
|
|
|
|
|
|
|
|
|
|
|
|
|
|
|
| |||||||||||||||||||
| Total | 7.0 | -27.7 | % | 7.6 | -14.0 | % | 5.2 | -47.8 | % | |||||||||||||||||||||||||
|
|
|
|
|
|
|
|
|
|
|
|
|
|
|
| |||||||||||||||||||
Amitiza | U.S. | 7.8 | -8.9 | % | 8.4 | -4.8 | % | 9.6 | 1.4 | % | ||||||||||||||||||||||||
| EUCAN | 0.0 | 5.7 | % | 0.0 | 3.0 | % | 0.0 | -26.0 | % | |||||||||||||||||||||||||
| EM | 0.0 | -38.8 | % | 0.0 | — | 0.0 | 42.3 | % | ||||||||||||||||||||||||||
|
|
|
|
|
|
|
|
|
|
|
|
|
|
|
| |||||||||||||||||||
| Total | 7.9 | -8.9 | % | 8.4 | -4.7 | % | 9.6 | 1.3 | % | |||||||||||||||||||||||||
|
|
|
|
|
|
|
|
|
|
|
|
|
|
|
| |||||||||||||||||||
Iclusig | U.S. | 6.3 | 34.2 | % | 6.4 | 29.0 | % | 6.5 | 13.4 | % | ||||||||||||||||||||||||
| Other than U.S. | 0.7 | 43.9 | % | 0.8 | 6.4 | % | 0.9 | 37.2 | % | |||||||||||||||||||||||||
|
|
|
|
|
|
|
|
|
|
|
|
|
|
|
| |||||||||||||||||||
| Total | 7.0 | 35.1 | % | 7.2 | 26.2 | % | 7.4 | 15.9 | % | |||||||||||||||||||||||||
|
|
|
|
|
|
|
|
|
|
|
|
|
|
|
| |||||||||||||||||||
Alunbrig | U.S. | 1.1 | — | 1.2 | 102.3 | % | 1.5 | 112.2 | % | |||||||||||||||||||||||||
| EUCAN | 0.0 | — | -0.0 | — | 0.0 | — | ||||||||||||||||||||||||||||
|
|
|
|
|
|
|
|
|
|
|
|
|
|
|
| |||||||||||||||||||
| Total | 1.1 | — | 1.2 | 105.1 | % | 1.5 | 118.8 | % | ||||||||||||||||||||||||||
|
|
|
|
|
|
|
|
|
|
|
|
|
|
|
| |||||||||||||||||||
U.S.: United States, EUCAN: Europe and Canada, EM: Emerging Markets
| *1 | Sales amount includes royalty income and service income. |
| *2 | Products were transferred to the Joint Venture with Teva in Japan (monotherapy in April 2016 and fixed dose combinations in May 2017). Supply sales of these products to the JV is currently recognized. |
| *3 | Effective from FY2018, sales of certain products in Japan are now disclosed on a net basis, deducting items such as discounts and rebates, in alignment with the global managerial approach applied to individual product sales. The change in disclosure of individual product sales has been revised retrospectively, with prior year figures reclassified on a net basis to enableyear-on-year comparisons. This reclassification has no impact on Takeda’s financial statements and does not represent a correction of prior year figures. |
Net basis: discounts and rebates are deducted
5
Table of Contents
Average Exchange Rate
| (yen) | ||||||||
USD | EUR | RUB | BRL | |||||
FY15 | 121 | 132 | 1.9 | 34.1 | ||||
FY16 | 109 | 120 | 1.7 | 32.9 | ||||
FY17 | 111 | 129 | 1.9 | 34.5 | ||||
FY17Q3 (April-December) | 112 | 128 | 1.9 | 34.8 | ||||
FY18Q3 (April-December) | 111 | 130 | 1.7 | 29.6 | ||||
FY18 Assumption (Disclosed on October 31, 2018) | 110 | 130 | 1.7 | 28.2 | ||||
Impact of 1% depreciation of yen yen from Oct 18 to Mar 19 (Disclosed on October 31, 2018)
| (100 million yen) | ||||||||
USD | EUR | RUB | BRL | |||||
Revenue | +31.6 | +10.4 | +2.3 | +1.7 | ||||
Core Earnings | +6.3 | -1.2 | +1.2 | +0.4 | ||||
Operating Profit | +1.3 | -3.5 | +0.9 | +0.3 | ||||
Net Profit | -0.8 | -2.4 | +0.6 | +0.2 | ||||
6
Table of Contents
| II. | Pipeline |
| 1. | Development activities |
| • | This table primarily shows the indications for which we will actively pursue approval. We are also conducting additional studies of certain assets to examine their potential for use in further indications and in additional formulations. |
| • | The listings in this table are limited to the US, EU and Japan and China, but we are also actively conducting development activities in other regions, including in Emerging Markets. Country/region is shown in the “Stage” column to denote where a clinical study is ongoing or a filing has been made with our specific intention to pursue approval in any of the US, EU, Japan or China. |
| • | ‘Global’ refers to US, EU, Japan and China |
| • | Brand name is shown to indicate the brand name for which the specific asset has already been approved for any indication in any of the US, EU, Japan or China and Takeda has commercialization rights for such asset. |
| • | Stage-ups are recognized in the table upon achievement of First Subject In. |
Development code <generic name> BRAND NAME | Drug Class (administration route) | Indications / additional formulations | Stage | |||||
SGN-35 <brentuximab vedotin> ADCETRIS® | CD30 monoclonal antibody-drug conjugate (injection) | Front line Hodgkin Lymphoma | EU | Filed (Nov ‘17) | ||||
| Front line PeripheralT-cell Lymphoma (PTCL) | EU | P-III | ||||||
| Jpn | P-III | |||||||
| Relapsed/refractory Hodgkin Lymphoma | CN | P-II | ||||||
| Relapsed/refractory systemic Anaplastic large-cell lymphoma (sALCL) | CN | P-II | ||||||
<brigatinib> ALUNBRIG® | ALK inhibitor (oral) | 1LALK-positiveNon-Small Cell Lung Cancer | US | P-III | ||||
| EU | P-III | |||||||
| CN | P-I | |||||||
| 2LALK-positiveNon-Small Cell Lung Cancer in patients previously treated with ALK inhibitors | Jpn CN | P-II(a) P-II(a) | ||||||
MLN9708 <ixazomib> NINLARO® | Proteasome inhibitor (oral) | Newly diagnosed Multiple Myeloma | Global | P-III | ||||
| Maintenance therapy in patients with newly diagnosed Multiple Myeloma following autologous stem cell transplant | Global | P-III | ||||||
| Maintenance therapy in patients with newly diagnosed Multiple Myeloma not treated with stem cell transplant | Global | P-III | ||||||
| Relapsed/refractory primary amyloidosis | Global | P-III | ||||||
Relapsed/refractory Multiple Myeloma (doublet regimen with dexamethasone) | US EU Jpn | P-III P-III P-III | ||||||
| Relapsed/refractory Multiple Myeloma (triplet regimen with daratumumab and dexamethasone) | Global | P-II | ||||||
<ponatinib> ICLUSIG® | BCR-ABL inhibitor (oral) | Front line Philadelphia chromosome-positive Acute Lymphoblastic Leukemia | US | P-III | ||||
| Dose ranging study for TKI resistant patients with chronic-phase Chronic Myeloid Leukemia | US | P-II(b) | ||||||
TAK-924 <pevonedistat> | NEDD 8 activating enzyme inhibitor (injection) | High-Risk Myelodysplastic Syndromes, Chronic Myelomonocytic Leukemia, Low-blast Acute Myelogenous Leukemia | US EU Jpn | P-III P-III P-III | ||||
TAK-385 <relugolix> | LH-RH antagonist (oral) | Prostate cancer | Jpn CN | P-III P-I | ||||
<cabozantinib> | Multi-targeted kinase inhibitor (oral) | 1L Renal cell carcinoma in combination with nivolumab 2L Renal cell carcinoma | Jpn
Jpn | P-III
P-II(a) | ||||
| 2L Hepatocellular carcinoma | Jpn | P-II(a) | ||||||
<niraparib> | PARP1/2 inhibitor (oral) | Ovarian Cancer – maintenance Ovarian Cancer – salvage | Jpn Jpn | P-II P-II | ||||
TAK-228 <sapanisertib> | mTORC1/2 inhibitor (oral) | Endometrial cancer | US | P-II(b) | ||||
TAK-659 < – > | SYK/FLT3 kinase inhibitor (oral) | Diffuse LargeB-cell Lymphoma Hematologic malignancies | — — | P-II(a) P-I | ||||
TAK-931 < – > | CDC7 inhibitor (oral) | Metastatic colorectal cancer, Esophageal squamous cancer, SquamousNon-Small Cell Lung Cancer | — | P-II(a) | ||||
TAK-079 < – > | Anti-CD38 monoclonal antibody (injection) | Relapsed/refractory Multiple Myeloma Systemic lupus erythematosus | — — | P-I P-I | ||||
TAK-164 < – > | Anti-guanylyl cyclase C antibody drug conjugate (injection) | GI Malignancies | — | P-I | ||||
TAK-573 < – > | CD38-targeted IgG4 genetically fused with an attenuated IFNα (injection) | Relapsed/refractory Multiple Myeloma | — | P-I | ||||
TAK-788 < – > | EGFR/HER2 exon 20 inhibitor (oral) | Non-Small Cell Lung Cancer | — | P-I | ||||
TAK-981 < – > | SUMO inhibitor (injection) | Multiple cancers | — | P-I | ||||
7
Table of Contents
Additionssince FY2018 Q2: | cabozantinib – 1L RCC in combination with nivolumab (JpnP-III) | |
| niraparib – ovarian cancer maintenance & salvage studies(P-II in Jpn) | ||
| pevonedistat – High-Risk Myelodysplastic Syndromes, Chronic Myelomonocytic Leukemia,Low-blast Acute Myelogenous Leukemia (JpnP-III) | ||
Removalssince FY2018 Q2: | brigatinib – 2LALK-positive metastaticNon-Small Cell Lung Cancer in patients previously treated with crizotinib (EU, Approved Nov 2018) | |
| TAK-522/XMT-1522 – HER2 positive solid tumors(P-I) (discontinued) | ||
| TAK-659 – removed “solid tumors” indication | ||
Development code <generic name> BRAND NAME | Drug Class (administration route) | Indications / additional formulations | Stage | |||||
| SHP555 *1<prucalopride>MOTEGRITY® / RESOLOR® | Selective,5-HT4 receptor agonist (oral) | Chronic idiopathic constipation | US | Approved (Dec ’18) | ||||
| MLN0002 <vedolizumab> ENTYVIO® | Humanized monoclonal antibody against α4ß7 integrin (injection) | Crohn’s disease | Jpn | Filed (Jul ‘18) | ||||
| CN | P-III | |||||||
| Ulcerative colitis | CN | P-III | ||||||
| US | P-III | |||||||
| Subcutaneous formulation for ulcerative colitis | EU | P-III | ||||||
| Jpn | P-III | |||||||
| US | P-III | |||||||
| Subcutaneous formulation for Crohn’s disease) | EU | P-III | ||||||
| Jpn | P-III | |||||||
| Adalimumabhead-to-head in patients with ulcerative colitis | Global | P-III | ||||||
| Graft-versus-Host Disease prophylaxis in patients undergoing allogeneic hematopoietic stem cell transplantation | — | P-II | ||||||
| TAK-438 <vonoprazan> TAKECAB® | Potassium-competitive acid blocker (oral) | Acid-related diseases | CN | Filed (Feb ‘18) | ||||
| Gastro-esophageal Reflux Disease in patients who have a partial response following treatment with a proton pump inhibitor | EU | P-II(b) | ||||||
SHP633 <teduglutide> GATTEX® / REVESTIVE® | GLP-2 analogue (injection) | Short bowel syndrome (SBS), pediatric indication | US | Filed (Sep ’18) | ||||
| Jpn | P-III | |||||||
| Short bowel syndrome (SBS), adult | Jpn | P-III | ||||||
| Cx601 <darvadstrocel>ALOFISEL® | A suspension of allogeneic expanded a dipose-derived stem cells (injection) | Refractory complex perianal fistulas in patients with Crohn’s disease | US | P-III | ||||
| TAK-721/SHP621 *2<Budesonide> | Glucocorticosteroid (oral) | Eosinophilic Esophagitis (EoE) | US | P-III | ||||
TAK-906 < – > | Dopamine D2/D3 receptor antagonist (oral) | Gastroparesis | — | P-II(b) | ||||
TAK-671 < – > | Protease inhibitor (injection) | Acute pancreatitis | — | P-I | ||||
| TAK-018/EB8018 *3< – > | FimH antagonist (oral) | Crohn’s disease | — | P-I | ||||
TIMP-GLIA *4 < – > | Tolerizing Immune Modifying nanoParticle (TIMP) (injection) | Celiac Disease | — | P-I | ||||
Kuma062 *5 < – > | Glutenase (oral) | Celiac Disease | — | P-I | ||||
| *1 | Partnership with Janssen |
| *2 | Partnership with UCSD and Fortis Advisors |
| *3 | Partnership with Enterome |
| *4 | Partnership with Cour Pharmaceuticals; Cour lead Phase 1 development. |
| *5 | Partnership with PvP Biologics; PvP lead Phase 1 development. |
Additionssince FY2018 Q2: | prucalopride – chronic idiopathic constipation (CIC) (US filed) | |
| teduglutide – Short bowel syndrome (SBS) (US, Japan) | ||
| TAK-721 – Eosinophilic Esophagitis (EoE) (USP-III) | ||
Removalssince FY2018 Q2: | TAK-954 – Enteral feeding intolerance (P-IIb) (discontinued); explore Post-Operative Gastrointestinal Dysfunction | |
| TAK-438 –Non-Erosive Reflux Disease in patients with Gastro-esophageal Reflux Disease (Japan,P-III) (discontinued) | ||
8
Table of Contents
Development code <generic name> BRAND NAME | Drug Class (administration route) | Indications / additional formulations | Stage | |||||
Lu AA21004 <vortioxetine> TRINTELLIX® | Multimodal anti-depressant (oral) | Major depressive disorder | Jpn | Filed (Sep ‘18) | ||||
SHP489 *6 <lisdexamfetamine dimesylate> VYVANSE® | Amphetamine-based psychostimulant (oral) | Attention-Deficit/Hyperactivity Disorder (ADHD) | Jpn | Filed (Apr ‘17) | ||||
SHP465 MYDAYIS® | Mixed salts of a single-entity amphetamine product (oral) | Attention-Deficit/Hyperactivity Disorder (ADHD)(4-12 year olds) | US | P-III | ||||
SHP615 <midazolam> BUCCOLAM® | GABA Allosteric Modulator (oral) | Status Epilepticus (Seizures) | Jpn | P-III | ||||
TAK-831 < – > | D-amino acid oxidase (DAAO) inhibitor (oral) | Friedreich’s ataxia
Negative symptoms and/or cognitive impairment associated with schizophrenia | —
— | P-II(a)
P-II(a) | ||||
TAK-935*7 < – > | CH24H inhibitor (oral) | Rare pediatric epilepsies | — | P-II(a) | ||||
WVE-120101 *8 < – > | mHTT SNP1 antisense oligonucleotide (injection) | Huntington’s disease | — | P-I/II | ||||
WVE-120102 *8 < – > | mHTT SNP2 antisense oligonucleotide (injection) | Huntington’s disease | — | P-I/II | ||||
TAK-041 < – > | GPR139 agonist (oral) | Negative symptoms and/or cognitive impairment associated with schizophrenia | — | P-I | ||||
TAK-341/MEDI-1341 *9 | Alpha-synuclein antibody (injection) | Parkinson’s Disease | — | P-I | ||||
TAK-418 < – > | LSD1 inhibitor (oral) | Kabuki syndrome | — | P-I | ||||
TAK-653 < – > | AMPA receptor potentiator (oral) | Treatment resistant depression | — | P-I | ||||
TAK-925 < – > | Orexin 2R agonist (injection) | Narcolepsy | — | P-I | ||||
TAK-680/SHP680 < – > | Prodrug ofd-amphetamine (oral) | Neurological Conditions | — | P-I | ||||
| *6 | Co-development with Shionogi in Japan |
| *7 | Co-development with Ovid Therapeutics |
| *8 | 50:50co-development andco-commercialization option with Wave Life Sciences |
| *9 | Partnership with AstraZeneca; AstraZeneca lead Phase 1 development |
Additions since FY2018 Q2: | lisdexamfetamine dimesylate – Attention-Deficit/Hyperactivity Disorder (ADHD) (filed, Jpn) SHP465 – Attention-Deficit/Hyperactivity Disorder (ADHD) Peds(P-III, US) midazolam – Status epilepticus(P-III, Jpn) TAK-680/SHP680 – Neurological Conditions(P-I) | |
Removals since FY2018 Q2: | None | |
9
Table of Contents
Development code <generic name> BRAND NAME | Drug Class (administration route) | Indications / additional formulations | Stage | |||||
SHP643 <lanadelumab> TAKHZYRO® | Plasma kallikrein inhibitor (injection) | Hereditary Angioedema (HAE) | CN | Filed (Dec ’18) | ||||
SHP672 *10 <antihemophilic factor [recombinant], porcine sequence> OBIZUR® | Antihemophilic Factor (recombinant) (injection) | Congenital Hemophilia A with Inhibitors (CHAWI) | US EU | P-III P-III | ||||
SHP677 <von Willebrand factor (recombinant)> | von Willebrand factor (recombinant) (injection) | Prophylactic Treatment of VWF | Global | P-III | ||||
VONVENDI®/ VEYVONDI® | PediatricOn-Demand | Global | P-III | |||||
SHP660 <Antihemophilic Factor(Recombinant),PEGylated> ADYNOVATE® | Antihemophilic Factor (recombinant), PEGylated (injection) | Pediatric Hemophilia A | EU | P-III | ||||
TAK-755/SHP655 *11 < – > | Replacement of the deficient-ADAMTS13 enzyme (injection) | congenital Thrombotic Thrombocytopenic Purpura (cTTP) | US, EU | P-III | ||||
TAK-620/SHP620 *12 <maribavir> | Benzimidazole riboside inhibitor (oral) | Cytomegalovirus (CMV) | US, EU | P-III | ||||
TAK-607/SHP607 < – > | Insulin-like Growth Factor / IGF Binding Protein (injection) | Chronic Lung Disease | — | P-II | ||||
TAK-609/SHP609 < – > | Recombinant humaniduronate-2-sulfatase for intrathecal administration (injection) | Hunter Syndrome CNS | — | P-II | ||||
SHP634 <parathyroid hormone> NATPARA® | Parathyroid hormone (injection) | Hypoparathyroidism | Jpn | P-I | ||||
TAK-611/SHP611 < – > | Recombinant human arylsulfatase A (injection) | Metachromatic Leukodystrophy (MLD) | — | P-I | ||||
TAK-531/SHP631 *13 < – > | Fusion protein ofiduronate-2-sulfatase+antibody (injection) | Hunter Syndrome CNS | — | P-I | ||||
TAK-754/SHP654 *14 < – > | Gene therapy to restore endogenous FVIII expression | FVIII Gene Therapy for Hemophilia A | — | P-I | ||||
| *10 | Partnership with Ipsen |
| *11 | Partnership with KM Biologics |
| *12 | Partnership with GlaxoSmithKline |
| *13 | Partnerships with ArmaGen |
| *14 | Partnership with Asklepios Biopharmaceuticals |
Additions since FY2018 Q2: New table for Rare Diseases has been added
10
Table of Contents
11
Table of Contents
| 2. | Recent progress in stage [Progress in stage disclosed since release of FY2017 results (May 14th, 2018)] |
Development code <generic name> | Indications / additional formulations | Country/Region | Progress in stage | |||
| MLN0002 <vedolizumab> | Ulcerative colitis | Jpn | Approved (Jul ‘18) | |||
| SGN-35 <brentuximab vedotin> | Front line Hodgkin Lymphoma | Jpn | Approved (Sep ‘18) | |||
| Lu AA21004 <vortioxetine> | Data added to labeling that demonstrated superiority over escitalopram in improving SSRI-induced sexual dysfunction in patients with Major Depressive Disorder | US | Approved (Oct ‘18) | |||
| MLN0002 <vedolizumab> | Crohn’s disease | Jpn | Filed (Jul ‘18) | |||
| Lu AA21004 <vortioxetine> | Major depressive disorder | Jpn | Filed (Sep ‘18) | |||
| <ponatinib> | Front line Philadelphia chromosome-positive Acute Lymphoblastic Leukemia | US | P-III | |||
| MLN0002 <vedolizumab> | Graft-versus-Host Disease prophylaxis in patients undergoing allogeneic hematopoietic stem cell transplantation | — | P-II(a) | |||
| <cabozantinib> | 2L hepatocellular carcinoma | Jpn | P-II(a) | |||
| MLN9708 <ixazomib> | Relapsed/refractory Multiple Myeloma (triplet regimen with daratumumab and dexamethasone) | Global | P-II | |||
| WVE-120101 < – > | Huntington’s disease | — | P-I/II | |||
| WVE-120102 < – > | Huntington’s disease | — | P-I/II | |||
| Kuma062 < – > | Celiac Disease | — | P-I | |||
| TAK-164 < – > | GI Malignancies | — | P-I | |||
| TAK-671 < – > | Acute pancreatitis | — | P-I | |||
| TAK-981 < – > | Multiple cancers | — | P-I | |||
| TAK-018 / EB8018 < – > | Crohn’s disease | — | P-I | |||
| <brigatinib> | 2LALK-positive metastaticNon-Small Cell Lung Cancer in patients previously treated with crizotinib | EU | Approved (Nov ‘18) | |||
| <cabozantinib> | 1L Renal cell carcinoma in combination with nivolumab | Jpn | P-III | |||
| TAK-906 < – > | Gastroparesis | US | P-II(b) | |||
<niraparib> | Ovarian Cancer – maintenance | Jpn | P-II | |||
<niraparib> | Ovarian Cancer – salvage | Jpn | P-II | |||
<brigatinib> | 2LALK-positiveNon-Small Cell Lung Cancer in patients previously treated with ALK inhibitors | CN | P-II | |||
Progress in stage disclosed since the announcement of FY2018 Q2 results (October 31, 2018) are listed under the bold dividing line
| 3. | Discontinued projects [Update disclosed since release of FY2017 results (May 14th, 2018)] |
Development code <generic name> | Indications (Stage) | Reason | ||
| MLN0002 <vedolizumab> | Graft-versus-Host Disease steroid refractory(P-II(a)) | Co-morbidities in steroid-refractory acute Graft-versus-Host Disease patients impair ability to demonstrate efficacy to justify continued development. | ||
| SPI 0211 <lubiprostone> | New formulation (US,P-III) | TheP-III study to evaluate the bioequivalence of sprinkle and capsule formulations of lubiprostone compared to placebo in adult subjects with chronic idiopathic constipation (CIC) did not achieve bioequivalence. | ||
| TAK-522 /XMT-1522 < – > | HER2 positive solid tumors(P-I) | The decision to terminate the further development ofXMT-1522 was made due to the competitive environment for HER2-targeted therapies. | ||
| TAK-438 <vonoprazan> | Non-Erosive Reflux Disease in patients with Gastro-esophageal Reflux Disease(P-III) | Data from theP-III study did not justify pursuing a regulatory submission in this indication. There were no new safety findings | ||
| TAK-954 < – > | Enteral feeding intolerance(P-IIb) | The EFI study was terminated because of patient recruitment challenges due to evolving practices in patient management. The program is pursuing the new indication post-operative gastrointestinal dysfunction (POGD); anticipate dosing first-patient by or before Q1 FY19. | ||
Discontinuations disclosed since the announcement of FY2018 Q2 results (October 31, 2018) are listed under the bold dividing line
12
Table of Contents
| 4. | Exploring Alternative Value Creation [Update disclosed since release of FY2017 results (May 14th, 2018)] |
Development code <generic name> | Indications (Stage) | Reason | ||
TAK-385 <relugolix> | Uterine fibroids (Japan Approved) Endometriosis (JapanP-II(b)) | Out-licensed to ASKA Pharmaceutical Co., Ltd., which has a strong presence in the gynecology therapeutic area in Japan, to maximize product value and to deliver relugolix to as many patients as possible. | ||
SHP647 < – > | Inflammatory bowel disease | As announced on October 27, 2018, Takeda has proposed a remedy to the European Commission of a potential divestment of SHP647 and certain associated rights. | ||
Externalized assets in which Takeda retains a financial interest
Partner | Nature of Partnership | |||
ASKA Pharmaceutical Co., Ltd | Takeda granted exclusive commercialization rights for uterine fibroids and exclusive development and commercialization rights for endometriosis for Japan to maximize the product value of relugolix(TAK-385). | |||
| Biological E. Limited | Takeda agreed to transfer existing measles and acellular pertussis vaccine bulk production technology to developlow-cost combination vaccines for India, China andlow- and middle-income countries. | |||
| Cardurion Pharmaceuticals | Takeda provided a12-person cardiovascular research team from its Shonan (Japan) site, including fully equipped laboratory space, development resources and licenses to a portfolio of preclinical-stage cardiovascular drug programs. | |||
| Cerevance | Takeda provided a25-person neuroscience research team from its Cambridge (UK) site, fully equipped laboratory space, and licenses to a portfolio of undisclosed preclinical and clinical stage drug programs. | |||
| Izana Biosciences | Takeda granted Izana Biosciences an exclusive, worldwide license to develop, manufacture and commercialize namilumab in all indications. As part of the license agreement, Takeda has taken a strategic equity stake in Izana. | |||
| Mirum Pharmaceuticals | Takeda granted exclusive global rights to develop and market maralixibat and volixibat, oral inhibitors of the apical sodium-dependent bile acid transporter (ASBT). Maralixibat is being developed in Phase II for Alagille syndrome (ALGS) and progressive familial intrahepatic cholestasis (PFIC), both debilitating liver diseases that tend to strike pediatric patients. | |||
| Myovant Sciences | Takeda granted Myovant an exclusive, worldwide license (excluding Japan and certain other Asian countries) to relugolix(TAK-385) and an exclusive, worldwide license toMVT-602(TAK-448). | |||
| Rhythm | Exclusive, worldwide rights from Takeda to develop and commercializeT-3525770 (nowRM-853).RM-853 is a potent, orally available ghrelino-acyltransferase (GOAT) inhibitor currently in preclinical development for Prader-Willi Syndrome. | |||
| Scohia Pharma | Takeda granted Scohia Pharma exclusive rights for the research, development, manufacture, marketing, etc. of eight of Takeda’s R&D projects, includingTAK-272,TAK-792 andTAK-094. | |||
| Samsung Bioepis | Strategic collaboration agreement to jointly fund andco-develop multiple novel biologic therapies in unmet disease areas. The program’s first therapeutic candidate isTAK-671, which is intended to treat severe acute pancreatitis. | |||
| Stargazer‡ | Takeda out licensed own asset to Stargazer Pharmaceuticals. | |||
Entrepreneurial Venture Programs (EVPs) | Aikomi | Developing a new digital therapy for persons with dementia. | ||
| ChromaJean | Established unique chromatography algorithm/software platform. | |||
| Chordia Therapeutics | Takeda provided a6-person oncology research team from its Shonan (Japan) site, fully equipped laboratory space, development resources and licenses to a portfolio of preclinical-stage oncology drug programs including CDC like kinase inhibitors. | |||
| Fimecs | A drug discovery biotech creating a new class of drugs based on protein degradation. | |||
| GenAhead Bio | Through providing two technologies; nucleic acid delivery on specific cell types as well as efficient genome editing, fee for service and/or collaboration in cell/gene therapies are delivered. | |||
| GEXVal | Drug discovery for orphan disease (e.g. PAH etc.) using Takeda’s late research & early clinical assets. | |||
| Reborna Biosciences | Developing small molecules that modulate RNA degeneration associated with genetic disease. | |||
| Seedsupply | Provides HTS FFS using novel binder selection technology and Takeda’s compound library. Provides target identification FFS using novel binder selection technology and own protein library. | |||
| ARTham‡ | Focus on clinical and preclinical development of high quality assets identified via drug repurposing approach. | |||
| ‡ | Executed since April 1, 2018 |
13
Table of Contents
| 5. | Main Research & Development collaborations |
Partner | Country | Subject | ||
Adimab‡ | US | The discovery, development and commercialization of three mAbs and three CD3Bi-Specific antibodies for oncology indications. | ||
Centre d’Immunologie de Marseille-Luminy | France | The collaboration will bring together expertise and knowledge in innate biology with Takeda’s BacTrap capabilities to identify novel targets and pathways in myeloid cells. | ||
Crescendo Biologics | UK | The discovery, development and commercialization of Humabody®-based therapeutics for cancer indications. | ||
Exelixis, Inc. | US | Exclusive licensing agreement to commercialize and develop novel cancer therapy cabozantinib and all potential future cabozantinib indications in Japan, including advanced renal cell carcinoma and hepatocellular carcinoma. | ||
GammaDelta Therapeutics | UK | Novel T cell platform, based on the unique properties of gamma delta (gd) T cells derived from human tissues, to discover and develop new immunotherapies in oncology. | ||
Haemalogix‡ | Australia | A research collaboration and licensing agreement for the development of new therapeutics to novel antigens in multiple myeloma. | ||
Heidelberg Pharma | Germany | ADC Research Collaboration on 2 Targets and Licensing Agreement (α-amanitin payload and proprietary linker). | ||
ImmunoGen, Inc. | US | Use ImmunoGen’s Inc. ADC technology to develop and commercialize targeted anticancer therapeutics(TAK-164). | ||
Maverick Therapeutics | US | T-cell engagement platform created specifically to improve the utility ofT-cell redirection therapy for the treatment of cancer. | ||
Memorial Sloan Kettering Cancer Center‡ | US | Discover and develop novelCAR-T cell products for the potential treatment of hematological malignancies and solid tumors. | ||
Molecular Templates | US | Initial collaboration applied MTEM’s engineered toxin bodies (ETB) technology platform to potential therapeutic targets. The second collaboration is for the joint development of CD38-targeted engineered toxin bodies (ETBs) for the treatment of patients with diseases such as multiple myeloma.‡ | ||
Nektar Therapeutics | US | Research collaboration to explore combination cancer therapy with five Takeda oncology compounds and Nektar’s lead immuno-oncology candidate, the CD122-biased agonistNKTR-214. | ||
Noile-Immune Biotech | Japan | The development of next generation chimeric antigen receptor T cell therapy(CAR-T), developed by Professor Koji Tamada at Yamaguchi University. | ||
Seattle Genetics | US | Joint development of ADCETRIS, an Antibody-Drug Conjugate technology which targets CD30 for the treatment of HL. Approved in 67 countries with ongoing clinical trials for additional indications. | ||
Shattuck Labs | US | Explore and develop checkpoint fusion proteins utilizing Shattuck’s unique Agonist Redirected Checkpoint (ARC)™ platform which enables combination immunotherapy with a single product. | ||
Tesaro | US | Exclusive licensing agreement to develop and commercialize novel cancer therapy niraparib for the treatment of all tumor types in Japan, and all tumor types excluding prostate cancer in South Korea, Taiwan, Russia and Australia. | ||
Teva | Israel | Worldwide License toTEV-48573(TAK-573) (CD38-Attenukine) and multi-target discovery collaboration accessing Teva’s attenukine platform. | ||
| ‡ | Executed since April 1, 2018 |
Partner | Country | Subject | ||
Ambys Medicines | US | The application of novel modalities, including cell and gene therapy andgain-of-function drug therapy, to meet the urgent need for treatments that restore liver function and prevent the progression to liver failure across multiple liver diseases. | ||
Arcturus | US | Collaboration to developRNA-based therapeutics for the treatment ofnon-alcoholic steatohepatitis (NASH) and other gastrointestinal (GI) related disorders using Arcturus’s wholly-owned LUNAR™ lipid-mediated delivery systems and UNA Oligomer chemistry. | ||
Beacon Discovery | US | G-protein coupled receptor drug discovery and development program to identify drug candidates for a range of gastrointestinal disorders. | ||
Cour Pharmaceutical Development Company | US | Immune modulating therapies for the potential treatment of celiac disease and other gastrointestinal diseases, utilizing Cour’s Tolerizing Immune Modifying nanoParticle (TIMP) platform toco-develop TIMP-Gliadin | ||
Emulate Bio | US | Drug discovery in inflammatory bowel disease usingorgan-on-chip micro engineered cell models. | ||
enGene | Canada | Discover, develop and commercialize novel therapies for specialty gastrointestinal (GI) diseases using enGene’s “Gene Pill” gene delivery platform. | ||
Enterome | France | Research and develop microbiome targets thought to play crucial roles in gastrointestinal disorders, including inflammatory bowel diseases (e.g. ulcerative colitis) and motility disorders (e.g. irritable bowel syndrome). Global license andco-development ofEB8018/TAK-018 in Crohn’s disease. | ||
Finch Therapeutics | US | Global agreement to developFIN-524, a live biotherapeutic product composed of cultured bacterial strains linked to favorable clinical outcomes in studies of microbiota transplantations in inflammatory bowel disease. | ||
Hemoshear Therapeutics | US | Novel target and therapeutic development for liver diseases, including nonalcoholic steatohepatitis (NASH) using Hemoshear’s proprietaryREVEAL-Tx drug discovery platform. | ||
Janssen | Belgium | Exclusive license, with the right to develop and market prucalopride as a treatment for chronic constipation in the US. Motegrity approved in US Dec 2018. | ||
Karolinska Institutet & Structural Genomics Consortium | Sweden | Proprietary collaboration to discover and validate new potential intervention points for the treatment of inflammatory bowel disease. | ||
NuBiyota | Canada | Development of Microbial Ecosystem Therapeutic products for gastroenterology indications. | ||
PvP Biologics | US | Global agreement to develop Kuma062, a novel enzyme designed to break down the immune-reactive parts of gluten in the stomach. | ||
Theravance Biopharma | US | Global agreement forTAK-954, a selective5-HT4 receptor agonist for motility disorders. | ||
UCSD/Fortis Advisors | US | Development of oral budesonide formulation(TAK-721) for treatment of Eosinophilic Esophagitis, using technology licensed from UCSD. | ||
14
Table of Contents
Partner | Country | Subject | ||
Affilogic | France | Research collaboration to explore Affilogic’s proprietary Nanofitins®platform in therapies targeting the central nervous system. | ||
AstraZeneca | UK | Joint development and commercialization of MEDI1341(TAK-341), an alpha-synuclein antibody currently in development as a potential treatment for Parkinson’s disease. | ||
Denali Therapeutics | US | A strategic option and collaboration agreement to develop and commercialize up to three specified therapeutic product candidates for neurodegenerative diseases, incorporating Denali’s ATV platform for increased exposure of biotherapeutic products in the brain. | ||
Lundbeck | Denmark | Collaboration to develop and commercialize vortioxetine. | ||
Mindstrong Health | US | Explore development of digital biomarkers for selected mental health conditions, in particular schizophrenia and treatment-resistant depression. | ||
Ovid Therapeutics | US | Development ofTAK-935, an oral CH24H inhibitor for rare pediatric epilepsies. Takeda and Ovid Therapeutics will share in the development and commercialization costs ofTAK-935 on a 50/50 basis and, if successful, share in the profits on a 50/50 basis. | ||
Shionogi | Japan | Co-development andco-commercialization agreement for geographic expansion of ADHD (Vyvanse & Intuniv) to Japan | ||
Teva | Israel | Collaboration to develop and commercialize Rasagiline. | ||
Verily | Japan | Research collaboration that will use Verily’s investigational Study Watch to measure motor symptoms of patients with Parkinson’s disease. | ||
Wave Life Sciences | US | Research, development and commercial collaboration and multi-program option agreement to develop antisense oligonucleotides for a range of neurological diseases. | ||
Partner | Country | Subject | ||
AB Biosciences | US | Research collaboration to potentially develop assets for rare disease withpan-receptor interacting molecules targeted for specific immunological conditions with a focus on autoimmune modulated inflammatory diseases | ||
ArmaGen | US | Worldwide licensing and collaboration agreement to developAGT-182(TAK-531/SHP631), an investigational enzyme replacement therapy (ERT) for potential treatment of both the central nervous system (CNS) and somatic (body-related) manifestations of Hunter syndrome | ||
Asklepios Biopharmaceuticals | US | Multiple research and development collaborations using FVIII Gene Therapy for the treatment of Hemophilia A and B. | ||
BioMarin | US | In-license of enabling technology for the exogenous replacement ofiduronate-2-sulfatase withIdursulfase-IT in patients via direct delivery to the CNS for the long-term treatment of Hunter Syndrome in patients with cognitive impairment in order to slow progression of cognitive impairment(TAK-609/SHP609). | ||
IPSEN | France | Development of Obizur for the treatment of Acquired Hemophilia A (AHA) including for patients with Congenital Hemophilia A with inhibitors (CHAWI) indication in elective or emergency surgery. | ||
KM Biologics | Japan | Development collaboration ofTAK-755 to overcome the ADAMTS13 deficiency, induce clinical remission thus reducing cTTP and aTTP related morbidity and mortality | ||
Max Planck Institute | Germany | Exclusive worldwide license under certain intellectual property to develop and commercialize the licensed products in the field | ||
NanoMedSyn | France | Pre-clinical research collaboration to evaluate a potential enzyme replacement therapy using NanoMedSyn’s proprietary synthetic derivatives named AMFA | ||
Novimmune | Switzerland | Exclusive worldwide rights to develop and commercialize an innovative,bi-specific antibody inpre-clinical development for the treatment of hemophilia A | ||
Rani Therapeutics | US | Research collaboration to evaluate a micro tablet pill technology for oral delivery of FVIII therapy in hemophilia | ||
Xenetic Biosciences | US | Exclusive R & D license agreement for PolyXen (PSA) delivery technology for hemophilia factors VII, VIII, IX, X. | ||
15
Table of Contents
Partner | Country | Subject | ||
Halozyme | US | In-license of Halozyme’s proprietary ENHANZE™ platform technology to increase dispersion and absorption of HyQvia. Ongoing development work for a US pediatric indication to treat primary and secondary immunodeficiencies and a Phase 3 indication in Chronic Inflammatory Demyelinating Polyradiculoneuropathy (CIDP). | ||
Kamada | Israel | In-license agreement to develop and commercializeAlpha-1 proteinase inhibitor (Glassia) ; Exclusive supply and distribution of Glassia in the US, Canada, Australia and New Zealand; Development of protocol for post market commitment trial ongoing. | ||
Partner | Country | Subject | ||
U.S. Government – The Biomedical Advanced Research and Development Authority (BARDA) | US | Partnership to developTAK-426, a Zika vaccine candidate, to support the Zika response in the US and affected regions around the world. | ||
Bill & Melinda Gates Foundation | US | Partnership to developTAK-195, a Sabin-strain Inactivated Polio vaccine (sIPV) candidate, to support polio eradication in developing countries. | ||
| Zydus Cadila | India | Partnership to developTAK-507, a Chikungunya vaccine candidate, to tackle an emerging and neglected infectious disease in the world. | ||
16
Table of Contents
Partner | Country | Subject | ||
| AMED | Japan | Development of a novel drug for hypertrophic cardiomyopathy using iPS cells-derived cardiomyocytes with disease-causing mutations induced by gene-editing technology (CiCLE: Cyclic Innovation for Clinical Empowerment by AEMD). | ||
| Arix Bioscience | UK | Value creation through venture and biotech partnerships with focus on oncology and gastroenterology. | ||
| Arcellx | US | Investment to develop format for T cell-mediated anti-tumor therapy. | ||
| ArmaGen | US | Investment in ArmaGen whose proprietary technology platform takes advantage of the body’s natural system tonon-invasively deliver therapeutics to the brain. | ||
| Atlas Ventures | US | Fund XI Limited Partner to drive venture investments. | ||
| BioMotiv | US | Strategic investment in therapeutic accelerator to identify and develop pioneering medical innovations specifically in the therapeutic areas of immunology & inflammation and cardio-metabolic diseases. | ||
| BiomX | Israel | Investment in BiomX who discovered and validated proprietary bacterial targets, and develop rationally designed phage therapies that seek and destroy harmful bacteria in microbiome-related diseases such as inflammatory bowel disease (IBD) and cancer. | ||
| BioSurfaces, Inc. | US | Research program designed to develop innovative medical devices to treat patients with GI diseases using BioSurfaces’ proprietary nanomaterial technology. | ||
| Bridge Medicines | US | Building uponTri-I TDI, Bridge Medicines will give financial, operational and managerial support to move projects seamlessly from a validating,proof-of-concept study to anin-human clinical trial. | ||
Center for iPS Cell Research Application, Kyoto University | Japan | Clinical applications of iPS cells in Takeda strategic areas including applications in neurosciences, oncology and GI as well as discovery efforts in additional areas of compelling iPSC translational science. | ||
| Cortexyme | US | Investment in Cortexyme who is developing therapeutics based on data supporting a new theory of the cause of Alzheimer’s and other degenerative disorders. | ||
Dementia Discovery Fund (DDF) | UK | New global investment fund to support discovery and development of novel dementia treatments. | ||
| Emendo | Israel | Investment in Emendo who is at the forefront of cutting-edge genetic medicine, developing genome editing technology that can repair and eliminate genetic mutations in living cells that cause serious diseases or disorders. | ||
| Encyle Therapeutics | Canada | Investment in company developing macrocyclic peptide derivatives for orally bioavailable inhibitors of GI targets | ||
Endosome Therapeutics | US | Seed investment in newCo exploring new therapeutic approaches for pain, including visceral GI pain | ||
| Fujifilm | Japan | Collaboration to develop regenerative medicine therapies using cardiomyocytes derived from iPSC for the treatment of heart failure. | ||
| FutuRx | Israel | Investment in Israel seed stage venture fund/biotech accelerator to access innovation in Israel;de-risked throughpre-formed syndication. | ||
| GlaxoSmithKline | UK | In-license agreement between GSK and University of Michigan for marabivir in the treatment of human cytomegalovirus. | ||
Harrington Discovery Institute at University Hospitals in Cleveland, Ohio | US | Collaboration for the advancement of medicines for rare diseases. | ||
| HITGen | China | HitGen will apply its advanced technology platform, based onDNA-encoded library design, synthesis and screening, to discover novel leads which will be licensed exclusively to Takeda. | ||
HiFiBio | US | Functional therapeutics high-throughput antibody discovery platform that enables identification of antibodies for rare events for discovery of therapeutic antibodies for GI & Oncology therapeutic areas. | ||
Hookipa Biotech | Austria | Value creation through venture and biotech partnership investments. | ||
Isogenica | UK | Access to a sdAb platform to generate a toolbox of VHH to various immune cells and targets for pathway validation and pipeline development across Oncology and GI portfolio. | ||
National Cancer Center of Japan | Japan | A partnership to develop basic research to clinical development by promoting exchanges among researchers, physicians, and others engaged in anti-cancer drug discovery and cancer biology research. | ||
Numerate | US | Joint-discovery programs aimed at identifying clinical candidates for use in Takeda’s core therapeutic areas: oncology, gastroenterology, and central nervous system disorders, which is using itsAI-driven platform, from hit finding and expansion through lead design/optimization and ADME toxicity modeling. | ||
OrphoMed | US | Investment in OrphoMed, a clinical-stage biotechnology company with a proprietary dimer therapeutics platform. The company is focused on developingbest-in class treatments for patients with gastrointestinal disorders. | ||
Obsidian Therapeutics | US | Investment in Obsidian, who is developing next-generation cell and gene therapies with pharmacologic operating systems. | ||
Palleon | US | Investment in Palleon, developing therapeutics to alleviate glyco-immune checkpoints in oncology. | ||
Parion | US | Exclusive worldwide license granted for the development and commercialization ofTAK-759/SHP659 for Dry Eye Disease (DED). | ||
Presage | US | Investment in Presage, who uses CIVO®, a platform that enables assessment of multiple early stage agents simultaneously and directly in the context in which they were meant to be used – the human patient. | ||
Portal Instruments | US | The development and commercialization of Portal’s needle-free drug delivery device for potential use with Takeda’s investigational or approved biologic medicines. | ||
Recursion Pharmaceuticals | US | Providepre-clinical candidates for Takeda’sTAK-celerator™ development pipeline. | ||
Ribon Therapeutics | US | Investment in Ribon Therapeutics, who is pioneering the discovery and development of monoPARP (monoADP-ribose polymerase) inhibitors to block cancer cells’ fundamental ability to survive under stress. | ||
Schrödinger | US | Multi-target research collaboration combining Schrödinger’s in silico platform-driven drug discovery capabilities with Takeda’s deep therapeutic area knowledge and expertise in structural biology. | ||
Seattle Collaboration | US | SPRInT (Seattle Partnership for Research on Innovative Therapies): accelerate the translation of Fred Hutchinson Cancer Research Center’s and University of Washington’s cutting-edge discoveries into treatments for human disease (focusing on Oncology, GI and Neuroscience). | ||
Stanford University | US | Collaboration with Stanford University to form the Stanford Alliance for Innovative Medicines (Stanford AIM) to more effectively develop innovative treatments and therapies. | ||
Stride Bio | US | Investment in StrideBio, who develops engineered viral vectors for gene therapy for the treatment of rare diseases. StrideBio’s technology engine utilizes structure-inspired design to engineer AAV vectors which can escapepre-existing neutralizing antibodies (NAbs). | ||
Tri-Institutional Therapeutics Discovery Institute(Tri-I TDI) | US | Collaboration of academic institutions and industry to more effectively develop innovative treatments and therapies. | ||
Ultragenyx | US | Collaboration to develop and commercialize therapies for rare genetic diseases. | ||
Univercells | Belgium | Univercells is a technology company delivering novel biomanufacturing platforms, aiming at making biologics available & affordable to all. | ||
VelosBio | US | Investment in VelosBio, a preclinical stage company developing antibody drug conjugates (ADCs). | ||
VHsquared | UK | VHsquared is a clinical stage company developing transformational therapies – VorabodiesTM– for inflammatory bowel disease. (Note: A Vorabody is an oral domain antibody). | ||
Whiz Partners‡ | Japan | Joint investment fund aimed at promoting a drug discovery ecosystem in Japan. | ||
| ‡ | Executed since April 1, 2018; |
List is not inclusive of all Takeda R&D collaborations
17
Table of Contents
Partner | Country | Subject | ||
Gencia LLC | US | Mitochondrial Associated Glucocorticoid Receptors (MAGR) agonists for potential use primarily in hematological and inflammatory diseases. | ||
Mersana | US | The decision to terminate the further development ofTAK-522/XMT-1522 was made due to the competitive environment for HER2-targeted therapies. | ||
Prana Biotechnology Ltd. | Australia | Collaboration with Takeda to study ability of Prana’s pbt434, to slow or prevent neurodegeneration of gastrointestinal system. | ||
TiGenix | Belgium | Takeda acquired TiGenix | ||
Keio University, Niigata University, Kyoto University | Japan | The search for and functional analysis of disease-relatedRNA-binding proteins, that may lead to treatments in the areas such as neuroscience and oncology. | ||
Astellas, Daiichi Sankyo | Japan | Fundamental biomarker data on healthy adult volunteers in order to optimize and accelerate the development of innovative medicines. | ||
∎ Clinical study protocol summaries
Clinical study protocol summaries are disclosed on the English-languageweb-site (https://takedaclinicaltrials.com/) and clinical study
protocol information in the Japanese-language is disclosed on the Japanese-languageweb-site (https://www.takeda.com/jp/what-we-do/research-and-development/takeda-clinical-trial-transparency/).
We anticipate that this disclosure will assure transparency of information on Takeda’s clinical trials for the benefit of healthcare professionals, their patients and other stakeholders, which we believe will contribute to the appropriate use of Takeda’s products worldwide.
18
Table of Contents
◆Prescription Drugs: US major products’ sales (in US$)*1
| (Million US$) | ||||||||||||||||||||||||||||
| Net basis | ||||||||||||||||||||||||||||
| FY15 | FY16 | FY17 | FY17 Q3 YTD | FY18 Q3 YTD | YOY | |||||||||||||||||||||||
Entyvio | 524 | 913 | 1,202 | 901 | 1,235 | 334 | 37.0 | % | ||||||||||||||||||||
Velcade | 1,059 | 1,000 | 995 | 776 | 717 | -59 | -7.5 | % | ||||||||||||||||||||
Trintellix | 203 | 294 | 435 | 337 | 402 | 66 | 19.5 | % | ||||||||||||||||||||
Dexilant | 530 | 457 | 445 | 360 | 363 | 3 | 0.9 | % | ||||||||||||||||||||
Uloric | 347 | 380 | 411 | 306 | 358 | 52 | 17.0 | % | ||||||||||||||||||||
Ninlaro | 34 | 267 | 354 | 267 | 321 | 54 | 20.3 | % | ||||||||||||||||||||
Amitiza | 308 | 310 | 303 | 241 | 233 | -8 | -3.3 | % | ||||||||||||||||||||
Colcrys | 386 | 358 | 362 | 288 | 214 | -74 | -25.7 | % | ||||||||||||||||||||
Iclusig | — | 22 | 171 | 130 | 157 | 27 | 20.5 | % | ||||||||||||||||||||
Prevacid (lansoprazole) | 222 | 179 | 132 | 104 | 46 | -58 | -55.9 | % | ||||||||||||||||||||
Alunbrig | — | — | 25 | 13 | 33 | 20 | 145.8 | % | ||||||||||||||||||||
| *1 | Product sales (royalty income and service income are excluded). |
Net basis: discounts and rebates are deducted
19
Table of Contents
◆Prescription Drugs: US major products’ sales (in US$) *1(Quarterly)
(Million US$)
| FY17 (Net basis) | FY18 (Net basis) | |||||||||||||||||||||||||||||||||||||||||||||||
| Q1 | Q2 | Q3 | Q4 | Q1 | YOY | Q2 | YOY | Q3 | YOY | Q4 | YOY | |||||||||||||||||||||||||||||||||||||
Entyvio | 278 | 314 | 309 | 301 | 387 | 39.3 | % | 410 | 30.6 | % | 438 | 41.5 | % | |||||||||||||||||||||||||||||||||||
Velcade | 268 | 259 | 249 | 219 | 235 | -12.1 | % | 235 | -9.1 | % | 247 | -1.0 | % | |||||||||||||||||||||||||||||||||||
Trintellix | 101 | 110 | 126 | 98 | 130 | 29.4 | % | 117 | 6.7 | % | 154 | 22.9 | % | |||||||||||||||||||||||||||||||||||
Dexilant | 115 | 120 | 126 | 85 | 120 | 4.2 | % | 114 | -5.0 | % | 130 | 3.5 | % | |||||||||||||||||||||||||||||||||||
Uloric | 101 | 102 | 104 | 105 | 128 | 27.1 | % | 109 | 7.3 | % | 121 | 16.7 | % | |||||||||||||||||||||||||||||||||||
Ninlaro | 81 | 91 | 95 | 87 | 103 | 26.8 | % | 106 | 16.2 | % | 112 | 18.7 | % | |||||||||||||||||||||||||||||||||||
Amitiza | 77 | 80 | 84 | 63 | 72 | -6.2 | % | 76 | -4.7 | % | 84 | 0.6 | % | |||||||||||||||||||||||||||||||||||
Colcrys | 87 | 93 | 109 | 74 | 85 | -1.6 | % | 64 | -31.0 | % | 65 | -40.5 | % | |||||||||||||||||||||||||||||||||||
Iclusig | 40 | 42 | 49 | 41 | 55 | 37.8 | % | 51 | 22.5 | % | 51 | 4.5 | % | |||||||||||||||||||||||||||||||||||
Prevacid (lansoprazole) | 33 | 31 | 40 | 28 | 18 | -46.0 | % | 25 | -20.1 | % | 3 | -91.7 | % | |||||||||||||||||||||||||||||||||||
Alunbrig | 2 | 5 | 6 | 12 | 10 | — | 10 | 102.4 | % | 13 | 110.7 | % | ||||||||||||||||||||||||||||||||||||
| *1 | Product sales (royalty income and service income are excluded). |
Net basis: discounts and rebates are deducted
20
Table of Contents
◆ Prescription Drugs: Japan major products’ sales
| (Billion JPY) | ||||||||||||||||||||||||||||||||||
| Gross basis | Net basis | |||||||||||||||||||||||||||||||||
| Launched | Therapeutic Class | FY15 | FY16 | FY17 | FY17 Q3 YTD | FY18 Q3 YTD | YOY | |||||||||||||||||||||||||||
Azilva *1 | (12. 5 | ) | Hypertension | 59.0 | 66.9 | 64.0 | 50.5 | 55.7 | 5.2 | 10.4 | % | |||||||||||||||||||||||
Takecab *1 | (15. 2 | ) | Acid-related Diseases | 8.4 | 34.1 | 48.5 | 37.5 | 44.3 | 6.8 | 18.2 | % | |||||||||||||||||||||||
Leuplin (leuprorelin) | (92. 9 | ) | Prostate cancer, breast cancer and endometriosis | 53.8 | 48.6 | 41.2 | 33.0 | 31.7 | -1.3 | -4.1 | % | |||||||||||||||||||||||
Enbrel | (05. 3 | ) | Rheumatoid arthritis | 40.8 | 40.4 | 37.1 | 29.5 | 27.9 | -1.6 | -5.4 | % | |||||||||||||||||||||||
Lotriga | (13. 1 | ) | Hyperlipidemia | 22.3 | 27.5 | 28.5 | 22.4 | 24.3 | 1.9 | 8.3 | % | |||||||||||||||||||||||
Nesina *1 | (10. 6 | ) | Diabetes | 36.9 | 32.9 | 26.6 | 21.5 | 22.2 | 0.7 | 3.4 | % | |||||||||||||||||||||||
Vectibix | (10. 6 | ) | Colorectal cancer | 18.4 | 18.8 | 18.9 | 15.0 | 16.2 | 1.2 | 8.2 | % | |||||||||||||||||||||||
Reminyl | (11. 3 | ) | Alzheimer-type dementia | 16.0 | 17.4 | 16.1 | 12.8 | 13.0 | 0.1 | 1.0 | % | |||||||||||||||||||||||
Rozerem | (10. 7 | ) | Insomnia | 7.4 | 8.1 | 8.0 | 6.3 | 7.4 | 1.1 | 18.0 | % | |||||||||||||||||||||||
Benet | (02. 5 | ) | Osteoporosis | 9.7 | 8.3 | 6.8 | 5.5 | 4.8 | -0.7 | -12.4 | % | |||||||||||||||||||||||
Adcetris | (14. 4 | ) | Malignant Lymphoma | 3.1 | 3.3 | 3.8 | 2.9 | 3.7 | 0.8 | 27.9 | % | |||||||||||||||||||||||
Ninlaro | (17. 5 | ) | Multiple Myeloma | — | — | 2.5 | 1.8 | 3.2 | 1.4 | 79.1 | % | |||||||||||||||||||||||
Azilect | (18. 6 | ) | Parkinson’s disease | — | — | — | — | 0.5 | 0.5 | — | ||||||||||||||||||||||||
Entyvio | (18. 11 | ) | Ulcerlative colitis | — | — | — | — | 0.5 | 0.5 | — | ||||||||||||||||||||||||
| *1 | The figures include the amounts of fixed dose combinations and blister packs. |
| *2 | Effective from FY2018, sales of certain products in Japan are now disclosed on a net basis, deducting items such as discounts and rebates, in alignment with the global managerial approach applied to individual product sales. The change in disclosure of individual product sales has been revised retrospectively, with prior year figures reclassified on a net basis to enableyear-on-year comparisons. This reclassification has no impact on Takeda’s financial statements and does not represent a correction of prior year figures. |
Gross basis: discounts and rebates are not deducted (except FY2016 Oncology products in Japan are on net basis)
Net basis: discounts and rebates are deducted
21
Table of Contents
◆ Prescription Drugs: Japan major products’ sales (Quarterly)
| (Billion JPY) | ||||||||||||||||||||||||||||||||||||||||||||||||||||
| FY17 (Net basis) | FY18 (Net basis) | |||||||||||||||||||||||||||||||||||||||||||||||||||
| Launched | Therapeutic Class | Q1 | Q2 | Q3 | Q4 | Q1 | YOY | Q2 | YOY | Q3 | YOY | Q4 | YOY | |||||||||||||||||||||||||||||||||||||||
Azilva * | (12. 5) | Hypertension | 16.8 | 14.6 | 19.0 | 13.5 | 19.4 | 15.5 | % | 15.8 | 8.0 | % | 20.5 | 7.7 | % | |||||||||||||||||||||||||||||||||||||
Takecab * | (15. 2) | Acid-related Diseases | 11.3 | 11.0 | 15.1 | 11.0 | 14.2 | 26.4 | % | 12.9 | 17.1 | % | 17.1 | 12.9 | % | |||||||||||||||||||||||||||||||||||||
Leuplin (leuprorelin) | (92. 9) | Prostate cancer, breast cancer and endometriosis | 11.0 | 9.7 | 12.3 | 8.2 | 10.5 | -4.7 | % | 9.6 | -1.1 | % | 11.5 | -5.9 | % | |||||||||||||||||||||||||||||||||||||
Enbrel | (05. 3) | Rheumatoid arthritis | 9.9 | 9.1 | 10.5 | 7.6 | 9.9 | -0.0 | % | 8.2 | -10.1 | % | 9.8 | -6.3 | % | |||||||||||||||||||||||||||||||||||||
Lotriga | (13. 1) | Hyperlipidemia | 7.2 | 6.7 | 8.5 | 6.1 | 8.1 | 13.2 | % | 7.1 | 6.1 | % | 9.0 | 5.9 | % | |||||||||||||||||||||||||||||||||||||
Nesina * | (10. 6) | Diabetes | 7.3 | 6.2 | 8.0 | 5.1 | 7.8 | 6.8 | % | 6.5 | 5.4 | % | 7.9 | -1.1 | % | |||||||||||||||||||||||||||||||||||||
Vectibix | (10. 6) | Colorectal cancer | 5.0 | 4.7 | 5.3 | 4.0 | 5.4 | 8.0 | % | 5.1 | 9.0 | % | 5.7 | 7.6 | % | |||||||||||||||||||||||||||||||||||||
Reminyl | (11. 3) | Alzheimer-type dementia | 4.3 | 3.9 | 4.7 | 3.3 | 4.5 | 4.7 | % | 3.9 | 0.5 | % | 4.6 | -2.1 | % | |||||||||||||||||||||||||||||||||||||
Rozerem | (10. 7) | Insomnia | 2.1 | 1.9 | 2.3 | 1.7 | 2.5 | 19.4 | % | 2.2 | 17.9 | % | 2.7 | 16.9 | % | |||||||||||||||||||||||||||||||||||||
Benet | (02. 5) | Osteoporosis | 1.9 | 1.6 | 1.9 | 1.3 | 1.7 | -10.2 | % | 1.5 | -11.3 | % | 1.6 | -15.5 | % | |||||||||||||||||||||||||||||||||||||
Adcetris | (14. 4) | Malignant Lymphoma | 1.0 | 0.9 | 1.0 | 0.9 | 1.1 | 10.8 | % | 1.1 | 19.8 | % | 1.5 | 53.1 | % | |||||||||||||||||||||||||||||||||||||
Ninlaro | (17. 5) | Multiple Myeloma | 0.2 | 0.6 | 0.9 | 0.7 | 1.2 | — | 0.9 | 42.5 | % | 1.2 | 27.0 | % | ||||||||||||||||||||||||||||||||||||||
Azilect | (18. 6) | Parkinson’s disease | — | — | — | — | 0.3 | — | 0.1 | — | 0.2 | — | ||||||||||||||||||||||||||||||||||||||||
Entyvio | (18. 11) | Ulcerlative colitis | — | — | — | — | — | — | — | — | 0.5 | — | ||||||||||||||||||||||||||||||||||||||||
| *1 | The figures include the amounts of fixed dose combinations and blister packs. |
| *2 | Effective from FY2018, sales of certain products in Japan are now disclosed on a net basis, deducting items such as discounts and rebates, in alignment with the global managerial approach applied to individual product sales. The change in disclosure of individual product sales has been revised retrospectively, with prior year figures reclassified on a net basis to enableyear-on-year comparisons. This reclassification has no impact on Takeda’s financial statements and does not represent a correction of Net basis: discounts and rebates are deducted |
22
Table of Contents
◆ Consumer Healthcare: Japan major products’ sales
| (Billion JPY) | ||||||||||||||||||||||||||||
| Gross basis | Net basis | |||||||||||||||||||||||||||
| FY15 | FY16 | FY17 | FY17 Q3 YTD | FY18 Q3 YTD | YOY | |||||||||||||||||||||||
Alinamin tablet | 25.2 | 24.1 | 23.5 | 19.0 | 17.1 | -1.9 | -9.9 | % | ||||||||||||||||||||
Alinamin drink | 14.9 | 16.1 | 11.5 | 9.4 | 9.2 | -0.2 | -2.3 | % | ||||||||||||||||||||
Benza | 9.8 | 10.0 | 7.1 | 6.2 | 6.0 | -0.3 | -4.1 | % | ||||||||||||||||||||
Borraginol | 4.5 | 4.5 | 4.4 | 3.4 | 3.4 | 0.0 | 0.6 | % | ||||||||||||||||||||
Mytear | 4.2 | 3.9 | 3.7 | 2.3 | 2.7 | 0.3 | 14.6 | % | ||||||||||||||||||||
Midori-no-Shukan | 1.1 | 2.7 | 3.2 | 2.4 | 2.1 | -0.3 | -12.0 | % | ||||||||||||||||||||
| *1 | This table shows sales amount of Takeda Consumer Healthcare Company Limited (TCHC) in Japan. |
TCHC succeeded the business of Takeda’s Japan Consumer Healthcare Business Unit (JCHBU), and started its business on April 1, 2017 as the new company.
| *2 | Effective from FY2018, sales of certain products in Japan are now disclosed on a net basis, deducting items such as discounts and rebates, in alignment with the global managerial approach applied to individual product sales. The change in disclosure of individual product sales has been revised retrospectively, with prior year figures reclassified on a net basis to enableyear-on-year comparisons. Regarding the products shown on this page, the sales figures of FY2017 and FY2018Q1 disclosed at the FY2018Q1 earnings anouncement have been reclassified again, due to the change in deduction method implemented in FY2018Q2. This reclassification has no impact on Takeda’s financial statements and does not represent a correction of prior year figures. |
Gross basis: discounts and rebates are not deducted
Net basis: discounts and rebates are deducted
23
Table of Contents
◆ Consumer Healthcare: Japan major products’ sales (Quarterly)
| (Billion JPY) | ||||||||||||||||||||||||||||||||||||||||||||||||
| FY17 (Net basis) | FY18 (Net basis) | |||||||||||||||||||||||||||||||||||||||||||||||
| Q1 | Q2 | Q3 | Q4 | Q1 | YOY | Q2 | YOY | Q3 | YOY | Q4 | YOY | |||||||||||||||||||||||||||||||||||||
Alinamin tablet | 6.9 | 5.7 | 6.4 | 4.5 | 5.7 | -17.5 | % | 5.4 | -5.6 | % | 6.1 | -5.4 | % | |||||||||||||||||||||||||||||||||||
Alinamin drink | 3.1 | 3.1 | 3.2 | 2.1 | 3.1 | 2.3 | % | 3.1 | -2.0 | % | 3.0 | -7.0 | % | |||||||||||||||||||||||||||||||||||
Benza | 1.0 | 3.1 | 2.1 | 0.9 | 1.0 | -3.8 | % | 3.2 | 3.3 | % | 1.8 | -15.3 | % | |||||||||||||||||||||||||||||||||||
Borraginol | 1.0 | 1.0 | 1.3 | 1.0 | 1.0 | 0.5 | % | 1.0 | 1.5 | % | 1.3 | 0.0 | % | |||||||||||||||||||||||||||||||||||
Mytear | 0.8 | 0.8 | 0.8 | 1.4 | 0.9 | 16.2 | % | 0.9 | 14.4 | % | 0.9 | 13.4 | % | |||||||||||||||||||||||||||||||||||
Midori-no-Shukan | 0.8 | 0.8 | 0.8 | 0.8 | 0.7 | -6.9 | % | 0.7 | -10.7 | % | 0.7 | -17.8 | % | |||||||||||||||||||||||||||||||||||
| *1 | This table shows sales amount of Takeda Consumer Healthcare Company Limited (TCHC) in Japan. |
TCHC succeeded the business of Takeda’s Japan Consumer Healthcare Business Unit (JCHBU), and started its business on April 1, 2017 as the new company.
| *2 | Effective from FY2018, sales of certain products in Japan are now disclosed on a net basis, deducting items such as discounts and rebates, in alignment with the global managerial approach applied to individual product sales. The change in disclosure of individual product sales has been revised retrospectively, with prior year figures reclassified on a net basis to enableyear-on-year comparisons. Regarding the products shown on this page, the sales figures of FY2017 and FY2018Q1 disclosed at the FY2018Q1 earnings anouncement have been reclassified again, due to the change in deduction method implemented in FY2018Q2. This reclassification has no impact on Takeda’s financial statements and does not represent a correction of prior year figures. |
Net basis: discounts and rebates are deducted
24
Table of Contents
| Underlying Core Reconciliation – FY2018 YTD & FY2017 YTD |  |
| FY2018 YTD Reconciliation | (Bn yen) | |||||||||||||||||||||||||||||||||||||||||||||||||||||||||||||||||||||||||||||||
| Reported to Core Adjustments | Core to Underlying Core Adj. | |||||||||||||||||||||||||||||||||||||||||||||||||||||||||||||||||||||||||||||||
| Non-recurring items | ||||||||||||||||||||||||||||||||||||||||||||||||||||||||||||||||||||||||||||||||
| Reported | YoY % | Account line adj. between CE and OP | Contingent consideration fair value adj. | Gains on sales of securities | Teva JV purchase accounting adj. | Other purchase accounting adj. | Shire acquisition related costs | US tax reform | Others | Core | YoY % | FX | *1 Impact of LLPs sold to Teva JV | *2 Impact of Multilab divestiture | *3 Impact of Techpool divestiture | Others | Divestitures | Underlying Core | YoY % | |||||||||||||||||||||||||||||||||||||||||||||||||||||||||||||
Revenue | 1,380.0 | +0.8 | % | 1,380.0 | +0.8 | % | -14.6 | -1.1 | -6.6 | -0.2 | -7.9 | 1,357.5 | +4.8 | % | ||||||||||||||||||||||||||||||||||||||||||||||||||||||||||||||||||
COGS | -369.9 | -3.9 | % | -369.9 | -3.7 | % | 2.0 | 0.7 | 1.5 | 2.3 | -365.5 | -1.0 | % | |||||||||||||||||||||||||||||||||||||||||||||||||||||||||||||||||||
Gross profit | 1,010.2 | +2.6 | % | 1,010.2 | +2.5 | % | -12.6 | -0.4 | -5.1 | -0.2 | -5.6 | 991.9 | +7.1 | % | ||||||||||||||||||||||||||||||||||||||||||||||||||||||||||||||||||
SG&A | -447.7 | -1.9 | % | 11.0 | -436.7 | -4.3 | % | 3.7 | 0.2 | 5.2 | 5.4 | -427.6 | -2.6 | % | ||||||||||||||||||||||||||||||||||||||||||||||||||||||||||||||||||
R&D | -228.9 | -3.3 | % | -228.9 | -3.3 | % | 8.0 | 0.0 | 0.3 | 0.4 | -220.6 | -2.8 | % | |||||||||||||||||||||||||||||||||||||||||||||||||||||||||||||||||||
Core Earnings | 11.0 | 344.6 | +17.7 | % | -0.9 | -0.1 | 0.5 | -0.2 | 0.1 | 343.8 | +32.3 | % | ||||||||||||||||||||||||||||||||||||||||||||||||||||||||||||||||||||
| Core Earnings | Underlying Core Earnings | |||||||||||||||||||||||||||||||||||||||||||||||||||||||||||||||||||||||||||||||
Amortization and impairment losses on intangible assets | -79.4 | 79.4 | — | — | ||||||||||||||||||||||||||||||||||||||||||||||||||||||||||||||||||||||||||||
Amortization | -71.9 | 71.9 | — | — | ||||||||||||||||||||||||||||||||||||||||||||||||||||||||||||||||||||||||||||
Impairment | -7.5 | 7.5 | — | — | ||||||||||||||||||||||||||||||||||||||||||||||||||||||||||||||||||||||||||||
Other operating income | 61.7 | -61.7 | — | — | ||||||||||||||||||||||||||||||||||||||||||||||||||||||||||||||||||||||||||||
Other operating expenses | -31.4 | 17.3 | 14.1 | — | — | |||||||||||||||||||||||||||||||||||||||||||||||||||||||||||||||||||||||||||
Operating profit | 284.4 | -11.7 | % | 35.1 | 25.1 | 344.6 | +17.7 | % | -0.9 | -0.1 | 0.5 | -0.2 | 0.1 | 343.8 | +32.3 | % | ||||||||||||||||||||||||||||||||||||||||||||||||||||||||||||||||
Financial income/expenses | -32.1 | 1.7 | 18.1 | -12.3 | 3.2 | -0.0 | 0.4 | 0.3 | -8.8 | |||||||||||||||||||||||||||||||||||||||||||||||||||||||||||||||||||||||
Equity income/loss | -44.0 | 52.1 | 8.1 | 0.1 | 8.2 | |||||||||||||||||||||||||||||||||||||||||||||||||||||||||||||||||||||||||||
Profit before tax | 208.4 | -27.6 | % | 35.1 | 1.7 | 52.1 | 43.2 | 340.4 | +18.8 | % | 2.3 | -0.2 | 0.8 | -0.2 | 0.5 | 343.2 | +32.2 | % | ||||||||||||||||||||||||||||||||||||||||||||||||||||||||||||||
Tax expense | -44.0 | -8.9 | -0.0 | -15.9 | -8.7 | -77.6 | 1.0 | 0.2 | 0.3 | 0.1 | 0.5 | -76.0 | ||||||||||||||||||||||||||||||||||||||||||||||||||||||||||||||||||||
Non-controlling interests | 0.1 | 0.1 | -0.4 | -0.3 | ||||||||||||||||||||||||||||||||||||||||||||||||||||||||||||||||||||||||||||
Net Profit | 164.4 | -31.7 | % | 26.1 | 1.6 | 36.2 | 34.5 | 262.9 | +20.9 | % | 3.0 | -0.0 | 1.2 | -0.1 | 1.0 | 266.9 | +34.2 | % | ||||||||||||||||||||||||||||||||||||||||||||||||||||||||||||||
| Core Net Profit | Underlying Core Net Profit | |||||||||||||||||||||||||||||||||||||||||||||||||||||||||||||||||||||||||||||||
EPS | 210 | 336 | 342 | |||||||||||||||||||||||||||||||||||||||||||||||||||||||||||||||||||||||||||||
| Core EPS | Underlying Core EPS | |||||||||||||||||||||||||||||||||||||||||||||||||||||||||||||||||||||||||||||||
Number of shares ** | 783,486,186 | 783,486,186 | 781,309,162 | |||||||||||||||||||||||||||||||||||||||||||||||||||||||||||||||||||||||||||||
| FY2017 YTD Reconciliation |
| |||||||||||||||||||||||||||||||||||||||||||||||||||||||||||||||||||||||||||||||
Revenue | 1,369.6 | 1,369.6 | -28.7 | -18.6 | -3.3 | -13.4 | -10.4 | -45.8 | 1,295.0 | |||||||||||||||||||||||||||||||||||||||||||||||||||||||||||||||||||||||
COGS | -385.0 | 1.1 | -383.9 | 2.5 | 1.8 | 3.0 | 3.2 | 4.2 | 12.1 | -369.3 | ||||||||||||||||||||||||||||||||||||||||||||||||||||||||||||||||||||||
Gross profit | 984.5 | 1.1 | 985.7 | -26.2 | -16.9 | -0.4 | -10.2 | -6.2 | -33.7 | 925.8 | ||||||||||||||||||||||||||||||||||||||||||||||||||||||||||||||||||||||
SG&A | -456.3 | -456.3 | 7.5 | 0.9 | 8.9 | 9.9 | -438.9 | |||||||||||||||||||||||||||||||||||||||||||||||||||||||||||||||||||||||||
R&D | -236.7 | -236.7 | 8.8 | 0.1 | 0.8 | 0.9 | -227.0 | |||||||||||||||||||||||||||||||||||||||||||||||||||||||||||||||||||||||||
Core Earnings | 1.1 | 292.7 | -9.9 | -16.9 | 0.7 | -0.5 | -6.2 | -23.0 | 259.8 | |||||||||||||||||||||||||||||||||||||||||||||||||||||||||||||||||||||||
| Core Earnings | Underlying Core Earnings | |||||||||||||||||||||||||||||||||||||||||||||||||||||||||||||||||||||||||||||||
Amortization and impairment losses on intangible assets | -86.3 | 86.3 | — | — | ||||||||||||||||||||||||||||||||||||||||||||||||||||||||||||||||||||||||||||
Amortization | -101.4 | 101.4 | — | — | ||||||||||||||||||||||||||||||||||||||||||||||||||||||||||||||||||||||||||||
Impairment | 15.0 | -15.0 | — | — | ||||||||||||||||||||||||||||||||||||||||||||||||||||||||||||||||||||||||||||
Other operating income | 163.9 | -163.9 | — | — | ||||||||||||||||||||||||||||||||||||||||||||||||||||||||||||||||||||||||||||
Other operating expenses | -46.8 | 46.8 | — | — | ||||||||||||||||||||||||||||||||||||||||||||||||||||||||||||||||||||||||||||
Operating profit | 322.3 | -30.7 | 1.1 | 292.7 | -9.9 | -16.9 | 0.7 | -0.5 | -6.2 | -23.0 | 259.8 | |||||||||||||||||||||||||||||||||||||||||||||||||||||||||||||||||||||
Financial income/expenses | -1.1 | 2.0 | -16.0 | 3.3 | -11.8 | 6.0 | -0.1 | -0.1 | -0.1 | -5.9 | ||||||||||||||||||||||||||||||||||||||||||||||||||||||||||||||||||||||
Equity income/loss | -33.3 | 39.1 | 5.7 | -0.0 | 5.7 | |||||||||||||||||||||||||||||||||||||||||||||||||||||||||||||||||||||||||||
Profit before tax | 287.9 | -30.7 | 2.0 | -16.0 | 39.1 | 1.1 | 3.3 | 286.6 | -3.9 | -16.9 | 0.6 | -0.6 | -6.2 | -23.1 | 259.6 | |||||||||||||||||||||||||||||||||||||||||||||||||||||||||||||||||
Tax expense | -47.2 | 13.5 | -0.0 | 4.9 | -12.0 | -0.4 | -25.1 | -3.1 | -69.4 | 1.2 | 5.2 | 0.6 | 0.2 | 1.9 | 7.9 | -60.3 | ||||||||||||||||||||||||||||||||||||||||||||||||||||||||||||||||
Non-controlling interests | 0.2 | 0.2 | -0.6 | -0.4 | ||||||||||||||||||||||||||||||||||||||||||||||||||||||||||||||||||||||||||||
Net Profit | 240.9 | -17.3 | 2.0 | -11.1 | 27.1 | 0.8 | -25.1 | 0.2 | 217.5 | -3.4 | -11.7 | 1.2 | -0.4 | -4.3 | -15.2 | 198.9 | ||||||||||||||||||||||||||||||||||||||||||||||||||||||||||||||||
| Core Net Profit | Underlying Core Net Profit | |||||||||||||||||||||||||||||||||||||||||||||||||||||||||||||||||||||||||||||||
EPS | 309 | 279 | 255 | |||||||||||||||||||||||||||||||||||||||||||||||||||||||||||||||||||||||||||||
| Core EPS | Underlying Core EPS | |||||||||||||||||||||||||||||||||||||||||||||||||||||||||||||||||||||||||||||||
Number of shares ** | 780,671,614 | 780,671,614 | 781,309,162 | |||||||||||||||||||||||||||||||||||||||||||||||||||||||||||||||||||||||||||||
*1 The impact associated with the sales of 7long-listed products in Japan to Teva JV in May 2017 is adjusted (FY2017). *2 Given the sales of Takeda’s subsidiary in Brazil, Multilab (in July 2018), Multilab’s profit/loss is adjusted in FY2017 and FY2018. | ||
*3 Given the sales of Takeda’s subsidiary in China, Techpool (in August 2018), Techpool’s profit/loss is adjusted in FY2017 and FY2018. | Takeda Pharmaceutical Company Limited | |
** Average number of outstanding shares (excluding treasury shares) for the reporting period is used for EPS and Core EPS calculations. Number of shares outstanding (excluding treasury shares) as of the end of the comparative period (i.e. the end of March 2018) is used for Underlying Core EPS calculation. |
25
Table of Contents
| Underlying Core Reconciliation – FY2018 Q3 & FY2017 Q3 | |
| FY2018 Q3 Reconciliation | (Bn yen) | |||||||||||||||||||||||||||||||||||||||||||||||||||||||||||||||||||||||||||||||
| Reported to Core Adjustments | Core to Underlying Core Adj. | |||||||||||||||||||||||||||||||||||||||||||||||||||||||||||||||||||||||||||||||
| Non-recurring items | ||||||||||||||||||||||||||||||||||||||||||||||||||||||||||||||||||||||||||||||||
| Reported | YoY % | Account line adj. between CE and OP | Contingent consideration fair value adj. | Gains on sales of securities | Teva JV purchase accounting adj. | Other purchase accounting adj. | Shire acquisition related costs | US tax reform | Others | Core | YoY % | FX | *1 Impact of LLPs sold to Teva JV | *2 Impact of Multilab divestiture | *3 Impact of Techpool divestiture | Others | Divestitures | Underlying Core | YoY % | |||||||||||||||||||||||||||||||||||||||||||||||||||||||||||||
Revenue | 499.4 | +2.3 | % | 499.4 | +2.3 | % | -8.8 | 490.6 | +6.0 | % | ||||||||||||||||||||||||||||||||||||||||||||||||||||||||||||||||||||||
COGS | -138.5 | -2.7 | % | -138.5 | -2.4 | % | 1.7 | -136.8 | +1.9 | % | ||||||||||||||||||||||||||||||||||||||||||||||||||||||||||||||||||||||
Gross profit | 360.9 | +4.3 | % | 360.9 | +4.2 | % | -7.1 | 353.8 | +7.7 | % | ||||||||||||||||||||||||||||||||||||||||||||||||||||||||||||||||||||||
SG&A | -153.9 | -3.3 | % | 3.1 | -150.8 | -5.2 | % | 2.5 | -148.3 | -2.2 | % | |||||||||||||||||||||||||||||||||||||||||||||||||||||||||||||||||||||
R&D | -77.5 | -5.0 | % | -77.5 | -5.0 | % | 3.9 | -73.6 | -5.4 | % | ||||||||||||||||||||||||||||||||||||||||||||||||||||||||||||||||||||||
Core Earnings | 3.1 | 132.6 | +25.6 | % | -0.8 | 131.8 | +33.1 | % | ||||||||||||||||||||||||||||||||||||||||||||||||||||||||||||||||||||||||
| Core Earnings | Underlying Core Earnings | |||||||||||||||||||||||||||||||||||||||||||||||||||||||||||||||||||||||||||||||
Amortization and impairment losses on intangible assets | -31.1 | 31.1 | — | — | ||||||||||||||||||||||||||||||||||||||||||||||||||||||||||||||||||||||||||||
Amortization | -24.2 | 24.2 | — | — | ||||||||||||||||||||||||||||||||||||||||||||||||||||||||||||||||||||||||||||
Impairment | -6.9 | 6.9 | — | — | ||||||||||||||||||||||||||||||||||||||||||||||||||||||||||||||||||||||||||||
Other operating income | 29.3 | -29.3 | — | — | ||||||||||||||||||||||||||||||||||||||||||||||||||||||||||||||||||||||||||||
Other operating expenses | -15.3 | 4.4 | 11.0 | — | — | |||||||||||||||||||||||||||||||||||||||||||||||||||||||||||||||||||||||||||
Operating profit | 112.5 | +27.9 | % | 6.1 | 14.0 | 132.6 | +25.6 | % | -0.8 | 131.8 | +33.1 | % | ||||||||||||||||||||||||||||||||||||||||||||||||||||||||||||||||||||
Financial income/expenses | -16.9 | 0.3 | 9.3 | -7.2 | 1.2 | -6.0 | ||||||||||||||||||||||||||||||||||||||||||||||||||||||||||||||||||||||||||
Equity income/loss | -48.0 | 50.3 | 2.3 | 0.1 | 2.4 | |||||||||||||||||||||||||||||||||||||||||||||||||||||||||||||||||||||||||||
Profit before tax | 47.6 | -13.3 | % | 6.1 | 0.3 | 50.3 | 23.4 | 127.7 | +22.4 | % | 0.4 | 128.1 | +28.7 | % | ||||||||||||||||||||||||||||||||||||||||||||||||||||||||||||||||||
Tax expense | -9.7 | 0.5 | -0.0 | -15.4 | -5.3 | -29.9 | 1.5 | -28.4 | ||||||||||||||||||||||||||||||||||||||||||||||||||||||||||||||||||||||||
Non-controlling interests | -0.1 | -0.1 | -0.4 | 0.4 | 0.4 | -0.1 | ||||||||||||||||||||||||||||||||||||||||||||||||||||||||||||||||||||||||||
Net Profit | 37.8 | -44.5 | % | 6.6 | 0.3 | 34.9 | 18.1 | 97.7 | +28.6 | % | 1.5 | 0.4 | 0.4 | 99.6 | +36.8 | % | ||||||||||||||||||||||||||||||||||||||||||||||||||||||||||||||||
| Core Net Profit | Underlying Core Net Profit | |||||||||||||||||||||||||||||||||||||||||||||||||||||||||||||||||||||||||||||||
EPS | 48 | 125 | 127 | |||||||||||||||||||||||||||||||||||||||||||||||||||||||||||||||||||||||||||||
| Core EPS | Underlying Core EPS | |||||||||||||||||||||||||||||||||||||||||||||||||||||||||||||||||||||||||||||||
Number of shares | 784,477,033 | 784,477,033 | 781,309,162 | |||||||||||||||||||||||||||||||||||||||||||||||||||||||||||||||||||||||||||||
FY2017 Q3 Reconciliation
|
| |||||||||||||||||||||||||||||||||||||||||||||||||||||||||||||||||||||||||||||||
Revenue | 488.2 | 488.2 | -14.1 | -1.8 | -0.9 | -4.8 | -3.8 | -11.3 | 462.8 | |||||||||||||||||||||||||||||||||||||||||||||||||||||||||||||||||||||||
COGS | -142.3 | 0.4 | -141.9 | 2.3 | 1.7 | 0.9 | 1.2 | 1.6 | 5.4 | -134.3 | ||||||||||||||||||||||||||||||||||||||||||||||||||||||||||||||||||||||
Gross profit | 345.9 | 0.4 | 346.2 | -11.8 | -0.1 | -0.0 | -3.5 | -2.2 | -5.9 | 328.5 | ||||||||||||||||||||||||||||||||||||||||||||||||||||||||||||||||||||||
SG&A | -159.1 | -159.1 | 4.0 | 0.3 | 3.0 | 3.3 | -151.7 | |||||||||||||||||||||||||||||||||||||||||||||||||||||||||||||||||||||||||
R&D | -81.6 | -81.6 | 3.5 | 0.0 | 0.2 | 0.3 | -77.8 | |||||||||||||||||||||||||||||||||||||||||||||||||||||||||||||||||||||||||
Core Earnings | 0.4 | 105.6 | -4.3 | -0.1 | 0.3 | -0.3 | -2.2 | -2.3 | 99.0 | |||||||||||||||||||||||||||||||||||||||||||||||||||||||||||||||||||||||
| Core Earnings | Underlying Core Earnings | |||||||||||||||||||||||||||||||||||||||||||||||||||||||||||||||||||||||||||||||
Amortization and impairment losses on intangible assets | -29.5 | 29.5 | — | — | ||||||||||||||||||||||||||||||||||||||||||||||||||||||||||||||||||||||||||||
Amortization | -35.2 | 35.2 | — | — | ||||||||||||||||||||||||||||||||||||||||||||||||||||||||||||||||||||||||||||
Impairment | 5.7 | -5.7 | — | — | ||||||||||||||||||||||||||||||||||||||||||||||||||||||||||||||||||||||||||||
Other operating income | 27.0 | -27.0 | — | — | ||||||||||||||||||||||||||||||||||||||||||||||||||||||||||||||||||||||||||||
Other operating expenses | -14.8 | 14.8 | — | — | ||||||||||||||||||||||||||||||||||||||||||||||||||||||||||||||||||||||||||||
Operating profit | 87.9 | 17.3 | 0.4 | 105.6 | -4.3 | -0.1 | 0.3 | -0.3 | -2.2 | -2.3 | 99.0 | |||||||||||||||||||||||||||||||||||||||||||||||||||||||||||||||||||||
Financial income/expenses | 0.8 | 0.6 | -6.2 | 0.5 | -4.3 | 1.8 | -0.0 | -0.0 | -0.0 | -2.5 | ||||||||||||||||||||||||||||||||||||||||||||||||||||||||||||||||||||||
Equity income/loss | -33.8 | 36.8 | 3.0 | 0.0 | 3.0 | |||||||||||||||||||||||||||||||||||||||||||||||||||||||||||||||||||||||||||
Profit before tax | 54.9 | 17.3 | 0.6 | -6.2 | 36.8 | 0.4 | 0.5 | 104.3 | -2.4 | -0.1 | 0.3 | -0.3 | -2.2 | -2.4 | 99.5 | |||||||||||||||||||||||||||||||||||||||||||||||||||||||||||||||||
Tax expense | 13.1 | -4.7 | 0.0 | 1.9 | -11.3 | -0.1 | -25.1 | -2.2 | -28.4 | 0.7 | 0.0 | 0.3 | 0.2 | 0.6 | 1.2 | -26.5 | ||||||||||||||||||||||||||||||||||||||||||||||||||||||||||||||||
Non-controlling interests | 0.1 | 0.1 | -0.3 | 0.4 | -0.3 | 0.0 | -0.2 | |||||||||||||||||||||||||||||||||||||||||||||||||||||||||||||||||||||||||
Net Profit | 68.1 | 12.6 | 0.6 | -4.3 | 25.6 | 0.3 | -25.1 | -1.7 | 76.0 | -2.0 | -0.1 | 0.6 | 0.3 | -1.9 | -1.1 | 72.8 | ||||||||||||||||||||||||||||||||||||||||||||||||||||||||||||||||
| Core Net Profit | Underlying Core Net Profit | |||||||||||||||||||||||||||||||||||||||||||||||||||||||||||||||||||||||||||||||
EPS | 87 | 97 | 93 | |||||||||||||||||||||||||||||||||||||||||||||||||||||||||||||||||||||||||||||
| Core EPS | Underlying Core EPS | |||||||||||||||||||||||||||||||||||||||||||||||||||||||||||||||||||||||||||||||
Number of shares | 781,122,699 | 781,122,699 | 781,309,162 | |||||||||||||||||||||||||||||||||||||||||||||||||||||||||||||||||||||||||||||
*1 The impact associated with the sales of 7long-listed products in Japan to Teva JV in May 2017 is adjusted (FY2017). *2 Given the sales of Takeda’s subsidiary in Brazil, Multilab (in July 2018), Multilab’s profit/loss is adjusted in FY2017. | ||
*3 Given the sales of Takeda’s subsidiary in China, Techpool (in August 2018), Techpool’s profit/loss is adjusted in FY2017. | Takeda Pharmaceutical Company Limited | |
** Average number of outstanding shares (excluding treasury shares) for the reporting period is used for EPS and Core EPS calculations. Number of shares outstanding (excluding treasury shares) as of the end of the comparative period (i.e. the end of March 2018) is used for Underlying Core EPS calculation. |
26
Table of Contents

Reconciliation from net profit to EBITDA / Adjusted EBITDA
| Full year ended March 31 | 9 months ended December 31 | |||||||||||||||||||
| (Bn yen) | 2016 | 2017 | 2018 | 2017 | 2018 | |||||||||||||||
Net profit for the year | 83.5 | 115.5 | 186.7 | 240.7 | 164.4 | |||||||||||||||
Income tax expenses | 37.1 | 27.8 | 30.5 | 47.2 | 44.0 | |||||||||||||||
Depreciation and amortization | 182.2 | 171.4 | 182.1 | 142.7 | 116.3 | |||||||||||||||
Interest expense, net | 3.0 | 5.5 | 6.8 | 5.0 | 9.4 | |||||||||||||||
EBITDA | 305.8 | 320.2 | 406.1 | 435.6 | 334.1 | |||||||||||||||
Impairment losses | 15.2 | 51.4 | 13.5 | -14.9 | 8.0 | |||||||||||||||
Other operating expense (income), net, excluding depreciation and amortization | 17.0 | -78.3 | -61.1 | -118.0 | -31.6 | |||||||||||||||
Finance expense (income), net, excluding interest income and expense, net | 7.3 | 5.4 | -14.4 | -4.0 | 22.7 | |||||||||||||||
Share of loss on investments accounted for under the equity method | — | 1.5 | 32.2 | 33.3 | 44.0 | |||||||||||||||
Other adjustments: | ||||||||||||||||||||
Loss on deconsolidation | 6.3 | — | — | — | — | |||||||||||||||
Transaction costs related to the acquisition of ARIAD | — | 3.2 | — | — | — | |||||||||||||||
Impact on profit related to fair value step up of inventory in ARIAD acquisition | — | — | 1.4 | 1.1 | — | |||||||||||||||
Acquisition costs related to Shire | — | — | — | — | 11.0 | |||||||||||||||
Adjusted EBITDA | 351.6 | 303.4 | 377.7 | 333.2 | 388.1 | |||||||||||||||
Takeda Pharmaceutical Company Limited
27
Table of Contents
Takeda Pharmaceutical Company Limited